This report contains forward-looking statements within the meaning of Section 27A of the Securities Act of 1933, as amended (the “Securities Act”), and Section 21E of the Securities Exchange Act of 1934, as amended (the “Exchange Act”), which reflect our current views with respect to, among other things, future events, operations and financial performance. You can identify these forward-looking statements by the use of forward-looking words such as “outlook,” “believes,” “expects,” “potential,” “continues,” “may,” “will,” “should,” “seeks,” “predicts,” “intends,” “plans,” “estimates,” “anticipates”“anticipates,” “foresees” or the negative versionversions of those words, other comparable words or other statements that do not relate to historical or factual matters. The forward-looking statements are based on our beliefs, assumptions and expectations of our future performance, taking into account all information currently available to us. Such forward-looking statements are subject to various risks and uncertainties and assumptions relating to our operations, financial results, financial condition, business prospects, growth strategy and liquidity. Some of these factors are described in this Annual Report on Form 10-K for the year ended December 31, 2020,2023, under the headings “Item 7. Management’s Discussion and Analysis of Financial Condition and Results of Operations” and “ Item“Item 1A. Risk Factors”.Factors.” These factors should not be construed as exhaustive and should be read in conjunction with the risk factors and other cautionary statements that are included in this report and in our other periodic filings. If one or more of these or other risks or uncertainties materialize, or if our underlying assumptions prove to be incorrect, our actual results may vary materially from those indicated in these forward-looking statements. New risks and uncertainties arise over time, and it is not possible for us to predict those events or how they may affect us. Therefore, you should not place undue reliance on these forward-looking statements. Any forward-looking statement speaks only as of the date on which it is made. We do not undertake any obligation to publicly update or review any forward-looking statement, whether as a result of new information, future developments or otherwise, except as required by law.
References in this Annual Report on Form 10-K to the “Ares Operating Group” refer to collectively, Ares Holdings L.P. (“Ares Holdings”), Ares Offshore Holdings L.P. (“Ares Offshore”) and Ares Investments L.P. (“Ares Investments”). References in this Annual Report on Form 10-K to an “Ares Operating Group Unit” or an “AOG Unit” referrefers to collectively, a partnership unit in each of the Ares Operating Group entities. entity.
The use of any defined term in this report to mean more than one entities, persons, securities or other items collectively is solely for convenience of reference and in no way implies that such entities, persons, securities or other items are one indistinguishable group. For example, notwithstanding the use of the defined terms “Ares,” “we” and “our” in this report to refer to Ares Management Corporation and its subsidiaries, each subsidiary of Ares Management Corporation is a standalone legal entity that is separate and distinct from Ares Management Corporation and any of its other subsidiaries.
In this Annual Report on Form 10-K, in addition to presenting our results on a consolidated basis in accordance with GAAP, we present revenues, expenses and other results on aa: (i) “segment basis,” which deconsolidates the consolidated funds and removes the proportional results attributable to third-party investors in the consolidated joint ventures, and therefore shows the results of our reportableoperating segments without giving effect to the consolidation of these entitiesentities; and (ii) “unconsolidated reporting basis,” which shows the results of our reportableoperating segments on a combined segment basis together with our Operations Management Group. In addition to our reportableoperating segments, we have an Operations Management Group (the “OMG”). The OMG consists of shared resource groups to support our reportableoperating segments by providing infrastructure and administrative support in the areas of accounting/finance, operations, information technology, legal, compliance, human resources, strategy and relationship management legal, compliance and human resources.distribution. The OMG includes Ares Wealth Management Solutions, LLC (“AWMS”) that facilitates the product development, distribution, marketing and client management activities for investment offerings in the
•“2024 Senior Notes” refers to senior notes issued by a wholly owned subsidiary of Ares Holdings in October 2014 with a maturity in October 2024; and
•“2028 Senior Notes” refers to senior notes issued by the Company in November 2023 with a maturity in November 2028;
•“2030 Senior Notes” refers to senior notes issued by a wholly owned subsidiary of Ares Holdings in June 2020 with a maturity in June 2030.2030;
•“2051 Subordinated Notes” refers to subordinated notes issued by a wholly owned subsidiary of Ares Holdings in June 2021 with a maturity in June 2051; and
•“2052 Senior Notes” refers to senior notes issued by a wholly owned subsidiary of Ares Holdings in January 2022 with a maturity in February 2052.
Many of the terms used in this report, including AUM, FPAUM, FRE and RI, may not be comparable to similarly titled measures used by other companies. In addition, our definitions of AUM and FPAUM are not based on any definition of AUM or FPAUM that is set forth in the agreements governing the investment funds that we manage and may differ from definitions of AUM or FPAUM set forth in other agreements to which we are a party or definitions used by the SEC or other regulatory bodies. Further, FRE and RI are not measures of performance calculated in accordance with GAAP. We use FRE and RI as measures of operating performance, not as measures of liquidity. FRE and RI should not be considered in isolation or as substitutes for operating income, net income, operating cash flows, or other income or cash flow statement data prepared in accordance with GAAP. The use of FRE and RI without consideration of related GAAP measures is not adequate due to the adjustments described above. Our management compensates for these limitations by using FRE and RI as supplemental measures to our GAAP results. We present these measures to provide a more complete understanding of our performance as our management measures it.
Amounts and percentages throughout this report may reflect rounding adjustments and consequently totals may not appear to sum.
PART I
Item 1. Business
BUSINESS
Overview
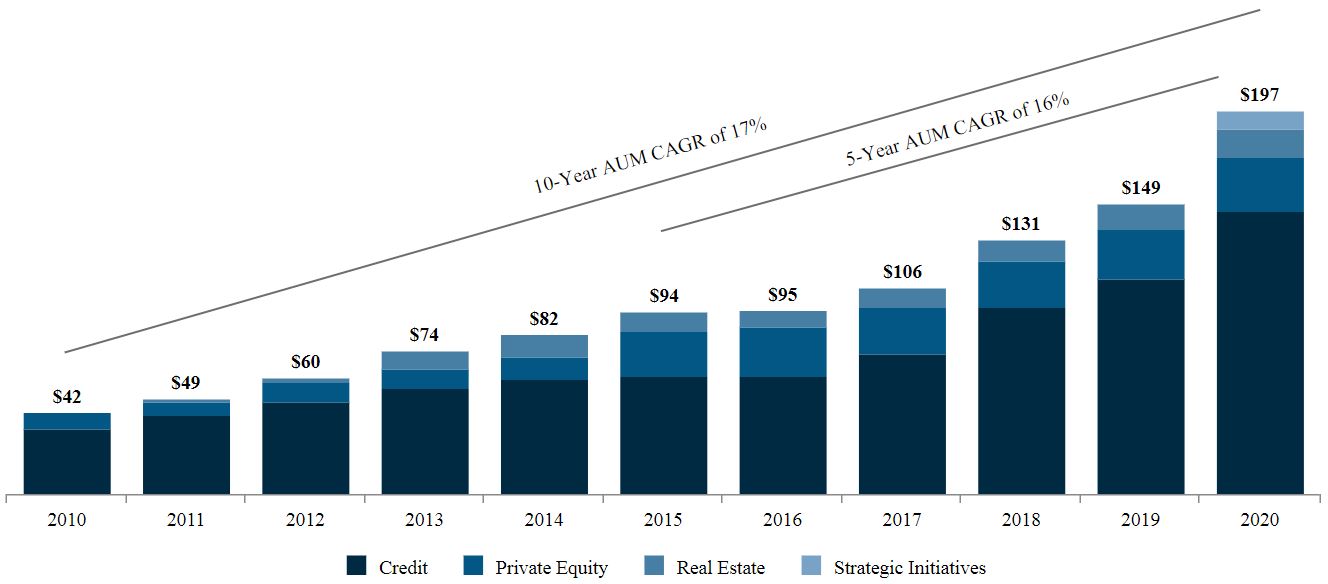
Ares is a leading global alternative investment manager with $197.0$418.8 billion of assets under management and over 2,8501,450 employees in over 2535 offices in more than 1015 countries. We offer our investors a range of investment strategies and seek to deliver attractive performance to an investor base that includes over 1,0902,300 direct institutional relationships and a significant retail investor base across our publicly tradedpublicly-traded funds, sub-advised accounts and sub-advised funds.non-traded vehicles. Since our inception in 1997, we have adhered to a disciplined investment philosophy that focuses on delivering strong risk-adjusted investment returns through market cycles. Ares believes each of its distinct but complementary investment groups in Credit, Private Equity, Real EstateAssets and Strategic InitiativesSecondaries is a market leader based on assets under management and investment performance. We believe we create value for our stakeholders not only through our investment performance, but also by expanding our product offering, enhancing our distribution channels, increasing our global presence, investing in our non-investment functions, securing strategic partnerships and completing strategic acquisitions and portfolio purchases.
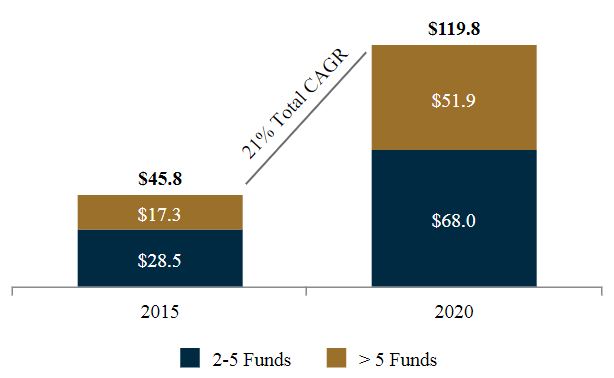
Our AUM has grown to $197.0418.8 billion as of December 31, 20202023 from $42.0$74.0 billion a decade earlier. As shown in the chart below, over the past five and ten10 years, our assets under management have achieved a compound annual growth rate (“CAGR”) of 16%26% and 17%19%, respectively ($ in billions):
We have an established track record of delivering strong risk-adjusted returns through market cycles. We believe our consistent and strong performance in a broad range of alternative investments has been shaped by several distinguishing features of our platform:
•Comprehensive Multi-Asset Class Expertise and Flexible Capital: Our proficiency at evaluating every level of the capital structure, from senior debt to common equity, across companies, structured assets, real estate projects, and infrastructure power and energy assets and real estate projects enables us to effectively assess relative value. This proficiency is complemented by our flexibility in deploying capital in a range of structures and different market environments to maximize risk-adjusted returns.
•Differentiated Market Intelligence: Our proprietary research on over 55 industries and insights from a broad, global investment portfolio enable us to more effectively diligence and structure our products and investments.
•Consistent Investment Approach: We believe our rigorous, credit-oriented investment approach across each of our investment groups is a key contributor to our strong investment performance and ability to expand our product offering.
•Robust Sourcing Model: Our investment professionals’ local market presence and ability to effectively cross-source for other investment groups generates a robust pipeline of high-quality investment opportunities across our platform.
•Talented and Committed Professionals: We attract, develop and retain highly accomplished investment professionals who not only demonstrate deep and broad investment and non-investment expertise but also have a strong sense of commitment to our firm.
•Collaborative Culture: We share ideas, relationships and information across our investment groups, which enables us to more effectively source, evaluate and manage investments. We also leverage the OMG to help drive the efficiencies across the platforms and support our investment process.
Integrated Investment Platform and Process
We operate our firm as an integrated investment platform with a collaborative culture that emphasizes sharing of knowledge and expertise. We believe the exchange of information enhances our ability to analyze investments, deploy capital and improve the performance of our funds and portfolio companies. We have established deep and sophisticated independent research capabilities in over 55 industries and insights from active investments in over 2,0251,800 companies, over 7601,400 alternative credit investments, over 505 properties, over 65 infrastructure assets and over 210 properties. In order to better collaborate on the information insights we possess across our investment platform, we formed a Global Markets Committee that meets monthly to share investing activities and market insights across our investment groups and the impact these market trends are having on our global investment strategies. Our extensive network of investment professionals includes local and geographically positioned individuals with the knowledge, experience and relationships that enable them to identify and take advantage of a wide range of investment opportunities.900 limited partnership interests.
Our investment process leverages the power of the Ares platform and an extensive network of professionals across our investment areas to identify and source attractive risk adjusted return opportunities while emphasizing capital preservation. We utilize our collective market and company knowledge, proprietary internal industry and company research, third partythird-party information and financial modeling to drive fundamental credit analysis and investment selection. We are able to invest up and down a company’s capital structure, which we believe helps us capitalize on out-performance opportunities and assess relative value for a particular investment. The investment committees of our investment groups review and evaluate investment opportunities in a framework that includes a qualitative and quantitative assessment of the key risks of each investment. We do not have a centralized investment committee and instead our investment committees are structured with overlapping membership from different investment groups to ensure consistency of approach, and shared investment experience.experience and collaboration across our platform. Our extensive network of investment professionals includes local and other individuals based in our markets with the knowledge, experience and relationships that enable them to identify and take advantage of a wide range of investment opportunities. In addition, our investment vehicles have investment policies and procedures that generally contain requirements and limitations, such as concentrations of securities, industries, and geographies in which such investment vehiclevehicles will invest, as well as other limitations required by law.
•Credit: Our experienced team takes a value-oriented approach which, among other factors, considers industry and market analysis, technical analysis, fundamental credit analysis and in-house research to identify investments that offer attractive value in comparison to the perceived credit risk profile. We use our longstanding relationships, considerable scale, research, industry knowledge, structuring expertise and often our self-origination capabilities to invest actively across capital structures with a focus on selecting the best risk adjustedrisk-adjusted returns for our investors, while also seeking to provide our borrowers a valued capital solution. Each investment decision involves an intensive due diligence process that is generally focused on evaluating the target company and its current and future prospects, its management team and industry, its ability to withstand adverse conditions and its capital structure, sponsorship and structural protection, among others. Credit now includes the APAC credit platform. In connection with a merger agreement, we rebranded Ares SSG Capital Holdings Limited and its operating subsidiaries (“SSG” and subsequently rebranded as “Ares SSG”) as Ares Asia and the Ares SSG credit business as Asia credit, which was subsequently rebranded as APAC credit. APAC credit makes credit and special situations investments through its local originating presence across Asia-Pacific (“APAC”) on behalf of its institutional client base.
•Private Equity: Our private equity professionals have a demonstrated the ability to deploy flexible capital which allows them to stay both active and disciplined inacross various market environments.environments at attractive rates of return through control and non-control transactions. At the center of our investment process is a systematic approach that emphasizes rigorous due diligence at the company and market levellevels in addition to assessing attractive relative value. We seek to be a risk-adjusted return value assessment. Ourprivate equity partner of choice and believe our partnership
mentality well-positions our investments for long-term success, whereby management teams gain access to our expertise and extensive internal and external networks from diligence to exit. In addition to focusing on generating strong returns for our investors, we are simultaneously focused on driving positive change by helping to promote diversity, inclusivity and social responsibility in the companies in which we invest, which we believe benefits the businesses as a whole in addition to its employees, communities and stakeholders. In addition, we completed the acquisition of the investment processmanagement business and related operating entities collectively doing business as Crescent Point Capital on October 2, 2023 (the “Crescent Point Acquisition”), a leading Asia-focused private equity firm. The acquired business is comprised of a five-part process: (1) generate robust pipeline, (2) perform initial screening, (3) conduct due diligence, (4) seek investment approval, and (5) use a systematic approach to value creation. Ourpresented within the Private Equity Group employs a “pull model” with portfolio management whereby a team can access the Ares network for any number of value-creating levers that have been identified.as APAC private equity.
•Real EstateAssets: With our experienced team, along with our expansive network of relationships, our Real EstateAssets Group invests in opportunities across both real estatemanages equity and debt investing.strategies across real estate and infrastructure investments. Across our real estate equity and debt investment strategies, our Real Estate Groupteam differentiates itself through its cycle-tested leadership, demonstrated performance across market cycles, access to real-time property market and corporate trends, and proven ability to create value through a disciplined investment process. TheOur real estate activities of our Real Estate Group are managed by dedicated equity and debt teams in the U.S. and Europe.Europe, along with our vertically-integrated operating platform. These individuals collaborate frequently within and across
strategies to enhance sourcing, exchange information to inform underwriting and leverage relationships to drive pricing power. Our Real Estate Group'sreal estate equity and debt teams have the flexibility to invest across the risk-return spectrum through core/core-plus, value-add and opportunistic investment strategies.
The infrastructure strategy focuses on debt and equity in essential infrastructure assets and companies with stable cash flow profiles through long-term contracts and high barriers to entry, and may demonstrate a lower correlation to public markets and potential for inflation projection. Across our infrastructure opportunities and debt investment strategies, we have a long-tenured global team utilizing deep local sourcing capabilities and extensive sector experience to originate and manage diverse, high-quality investments in private infrastructure assets across the globe. We have dedicated direct infrastructure opportunities and debt teams that collaborate to share market insights, support underwriting and enhance origination. Our infrastructure opportunities strategy focuses on value-add equity with a flexible mandate in climate infrastructure. Our infrastructure debt strategy targets global assets and opportunistic investing, while our Real Estate Group’s debt team focuses on directly originated commercial mortgage investmentsbusinesses with defensive characteristics across the risk spectrum.digital, transport, energy and utility sectors. Leveraging the established long-standing relationships, the strategy seeks to generate exclusive deal flow and high-quality investment opportunities.
•Strategic Initiatives:Secondaries: Our strategic initiatives team executes investmentinvests in secondary markets across a range of alternative asset class strategies, that expand our reachincluding private equity, real estate, infrastructure and scale in newcredit. Our secondary funds acquire interests across a range of partnership vehicles, including funds, multi-asset portfolios and existing global markets. Strategic Initiatives includes the Ares SSG platform subsequent to the completion ofsingle asset joint ventures. These strategies involve the acquisition on July 1, 2020. Ares SSG makes creditof interests from investors in existing funds as well as recapitalizing and special situations investments through its local originating presence across Asia-Pacific on behalf of its institutional client base. Strategic Initiatives also includesrestructuring the funds, including transactions that can address pending fund maturity, strategy change or the need for additional equity capital.
•Our other businesses include: (i) Ares Insurance Solutions (“AIS”),; and (ii) activities from our dedicated in-house teamcompany sponsored special purpose vehicles that provides solutions to insurance clients includingare formed for the purpose of effecting a merger, share exchange, asset management, capital solutions and corporate development.acquisition, share purchase, reorganization or similar business combination.
We also recognize the importance of considering environmental, social and governance (“ESG”) factors in our investment process and have adopted an ESG policya Responsible Investment Program for the conduct of our business. We work collaboratively with our various underwriting, asset management, legal and compliance teams to appropriately integrate relevant ESG considerations into our investment process.
In addition, as part of our growth strategy, we may from time to time engage in discussions with counterparties with respect to various potential strategic transactions, including potential investments in, and acquisitions of, other companies or assets. In connection with evaluating potential strategic transactions and assets, weWe may incur significant expenses for the evaluation, and due diligence investigation and negotiation of any potential transaction.strategic transactions.
Breadth, Depth and Tenure of our Senior Management
Ares was built upon the fundamental principle that each of our distinct but complementary investment groups benefits from being part of our broader platform. We believe that our strong performance, consistent growth and high talent retention through economic cycles is due largely to the effective application of this principle across our broad organization of over 1,4502,850 employees. The management of our operating businesses is currently overseen by our Executive Management Committee which typically meets weeklyfrequently to discuss strategy and operational matters, and includes as representatives our Holdco Members and other senior leadership from our investment groups and business operations team. We also have a Partners Committee comprised of senior leadership from across the firm that meets periodically to discuss our business, including investment and operating performance, fundraising, market conditions, strategic initiatives and other firm matters. Each of our investment
groups is led by its own deep leadership team of highly accomplished investment professionals, who average approximately 25 years of investment experience in managing, investments in, advising, underwriting and restructuring companies. While primarily focused on managing strategies within their own investment group, these senior professionals are integrated within our platform through economic, cultural and structural measures. Our senior professionals have the opportunity to participate in the incentive programs of multiple investment groups to reward collaboration across our investment activities. This collaboration takes place on a daily basis and is formally promoted through internal systems and widely attended weekly or monthly meetings.
Human Capital
We believe that our people and our culture are the most critical strategic drivers of our success as a firm. Creating a welcoming and inclusive work environment with opportunities for growth and development is essential to attracting and retaining a high-performance team, which is in turn is necessary to drive differentiated outcomes. We believe that our unique culture, which centers upon values of collaboration, responsibility, entrepreneurialism, self-awareness and trustworthiness makes Ares a preferred place for top talent at all levels to build a long-term career within the alternative asset management industry. WeTo foster this culture, we invest heavily in our human capital efforts, including:
Talent Management: As of December 31, 2020,2023, we had over 1,4502,850 full-time employees, comprised of over 525approximately 1,000 professionals in our investment groups and over 9251,850 operations management professionals, located in over 2535 offices in more than 1015 countries. We provide a comprehensive set of programs, policies and benefits to enable team members to thrive, grow and contribute to their highest potential.
•Governance and Policies: Ares is committed to providing a work environment in which all individuals are treated with respect and dignity. While our culture is the foundation of our work environment, our equal opportunity employment, diversity, anti-harassment and anti-harassment/anti-discrimination policies reinforce a professional atmosphere.
•Recruiting and Onboarding: We pursue several strategic paths to hire top talent, including campus and lateral recruiting efforts, and focus on diversity. We prioritize making all new team members feel welcome and seek to set
them up for success through onboarding training, peer advisor programs, ongoing touchpoints, and connecting them with our employee resource groups (“ERGs”), which are grassroots, employee-led, executive-sponsored groups and open to all team members.
•Internship Training Program: Ares offers a formal internship program for students between their junior and senior years of college with the possibility of conversion to a full-time position in our analyst program upon graduation. Available roles span our investment and operations management teams.
•Mentoring, Training and Employee Engagement: We provide formal and informal mentoring, learning and development, and employee engagement opportunities. We conduct periodic pulse surveys,host frequent townhall meetings hosted by senior leadership and events to foster belonging. We also conduct anonymous firmwide surveys at least annually to evaluate employee morale, productivity and overall well-being.
•Education Sponsorship Program: Employees are encouraged to participate in degree programs, business-related seminars, workshops, ad-hoc academic courses, continued education seminars to maintain job-related licenses and other outside training courses to facilitate professional development, the cost of which is reimbursed to the employee by Ares.
•Internal Training and Development Programs: We continue to foster an environment that cultivates company and employee growth through educational programs focused on professional development, mandated training and other learning opportunities that are offered in person or online. Our team is focused on the training and development of our employees and has invested in a learning management system to facilitate this initiative.
•Performance Management: We take an ongoinga continuous feedback approach to performance management, encouraging leaders and team members to participate in goal setting and ongoing feedback discussions throughout the year, inyear. Our formal, firm-wide annual review process includes a self-assessment, a 360-degree feedback component, calibration and round table discussions, and year-end evaluations provided by managers to employees. In addition to our firm-wide 360the annual review, we also conduct mid-year performance reviews that are less formal and serve to evaluate progress against goals and as an opportunity to discuss specific career development objectives that were identified in the annual assessment. Training is provided for each phase of our performance assessment process.
•Retention, Rewards and Recognition: We provide competitive compensation and benefits toto: (i) attract and retain andtalent; (ii) align the incentives of our employees with our investors and stakeholders.stakeholders; and (iii) support our employees across many aspects of their lives. We also have programs that seek to recognize significant team member contributions at the firm level.
Environmental, Social and Governance: We believe that ESG is integral to driving long-term success for our business. We pursue a strategy that is designed to address ESG issues most relevant to our business, starting with a corporate sustainability program focused on our corporate operations and then scaling through a responsible investment program that focuses on our investment platform.
•In order to continuously improve our ESG integration processes, we have defined three tiers of roles and responsibilities for oversight and implementation: (i) Oversight Responsibility; (ii) Defining Implementation; and (iii) Driving Implementation. The Oversight Responsibility tier is led by our Global Head of ESG and consists of our most-senior managers and decision-making bodies, including our Executive Management Committee and board of directors. Next, our ESG team is responsible for Defining Implementation steps and processes in partnership with ESG champions embedded within each business line to adapt the Ares firm-wide approach to strategy-specific implementation steps. We focus on Driving Implementation through all levels of investment professionals and management to promote the integration and scalability of our approach.
•Where appropriate, we aim to engage with industry organizations to help shape emerging areas of ESG practice. For example, Ares is the Chair of the UN Principles for Responsible Investing (“UNPRI”) Private Debt Advisory Committee, which aims to define and promote best practices for ESG integration within the direct lending market. Ares is also a public supporter of the Financial Stability Board Taskforce on Climate-related Financial Disclosures (“TCFD”). We believe the TCFD recommendations provide a useful framework to increase transparency on climate-related risks and opportunities within financial markets. In addition, we engage with the ESG Data Convergence Initiative, Partnership for Carbon Accounting Financials and Initiative Climat International to improve consistency and transparency in our ESG and climate disclosures.
•As part of our efforts to manage the risks and opportunities associated with the energy transition, we seek to engage our portfolio companies on greenhouse gas emissions measurement and support them in their emissions reduction strategies. We are committed to measuring and reporting on our greenhouse gas emissions. We aim to minimize our own corporate footprint through initiatives to reduce operational emissions and by addressing residual, harder-to-abate emissions with tools such as renewable energy certificates and the purchase of carbon credits we believe to be high-quality.
Diversity, Equity and Inclusion: We invest heavily in diversity, equity and inclusion (“DEI”) as a strategic pillar that integrates with all talent processes and global business practices. In partnership with our Human ResourcesOur human resources function, our global DEI Council implementsand team led by our Chief Diversity, Equity, and Inclusion Officer and business leaders across the Ares platform work in partnership to implement a strategic framework to attract, engage, develop engage and advance diverse talent within an inclusive and welcoming environment.environment, as well as to support DEI best practices across our investment portfolios and through our broader involvement in our communities.
•Recruiting:People and Culture: We prioritize growing diversityAs part of our ongoing effort to foster an inclusive culture built on apprenticeship, we support the growth and advancement of talent through various mentorship and professional development programs. In line with our campus recruiting efforts,continued commitment to seek to provide an environment where all team members experience a genuine sense of belonging, we hold educational trainings and employee engagement events, often in partnership with our eight ERGs that help to drive our DEI strategy and enhance the employee experience for underrepresented groups, allies and diverse talent more broadly. To create more transparency, we also aim to conduct periodic reviews with business leadership to assess our people, progress, metrics and strategies to enable the long-term success of diverse talent at Ares. In addition, as well aspart of our early pipeline programscommitment to educate womenequitable pay for all employees, we monitor and minorities on the industry. We are focused on building relationshipsassess total compensation to help ensure we have alignment with diversity-focused recruiting agenciesrole responsibilities and deepening diversity partnerships.contributions.
•Education, CelebrationBusiness Processes and Belonging:Investment Platform: We focusseek to embed DEI best practices into our business and investment diligence processes as both a reflection of our values and to drive innovation and returns. We have identified DEI champions within each investment group to develop bespoke strategies focused on holding educationalrepresentation, DEI governance, equitable access, and employee engagement events, including many in partnership withand equity ownership, which we intend to integrate into our six ERGs, which are grassroots, employee-led, executive-sponsored groups that seek to enhance DEI and support minority team members.business plans each year. In addition, we conduct regular mandatory anti-harassmentare focused on supporting vendor and unconscious bias training.supplier diversity in our procurement practices. In 2022, we also introduced sustainability-linked pricing to our Credit Facility, tying a portion of our borrowing costs
to certain ESG and DEI-related targets. Due to the achievement of the ESG-related targets in 2023, our base rate and unused commitment fee on our Credit Facility have been reduced from July 2023 through June 2024. We also partner with select Ares private equity portfolio companies to understand the current state of their DEI efforts, as well as to share best practices and establish mutually agreed strategies for driving DEI improvements in parallel with our internal efforts.
•Equity:Communities: We strivepartner with organizations to ensure pay equity, regardlessfoster diversity within our communities and promote corporate citizenship through charity and volunteerism, much of gender or race/ethnicity,which targets historically underrepresented and have undertaken pay equity studies foreconomically disadvantaged populations. We also participate in DEI-focused industry groups in an effort to identify and advance best practices more broadly within alternative asset management. In partnership with our employees in the U.S. and the U.K.ERGs, we donated to various community organizations that support diverse communities.
Health and Wellness: Wellness: We believe that healthy team members are more productive, and we invest heavily in benefits and initiatives to support our working families. In addition to medical, dental, vision, life insurance, disability insurance and retirement benefits, we provide generous primary and non-primary caregiver leave, domestic partner health and life insurance, adoption and reproductive assistance, family care resources (including back-up care benefits and baby baskets for new parents) and mental health benefits. We also provide employees with access to a medical advisory team and concierge service at no cost to help them navigate complex health situations and concerns. We also host several wellness-related events throughout the year on topics such as nutrition and stress management.
During the COVID-19 pandemic, we have invested further inFlexibility: We believe that our employees’ health and well-being. We pivoted to remote work early in the pandemic and have utilized technology to enable remote productivity. We implemented safety policies and controlsculture benefits from people collaborating in-person in our offices, for team members who wishwhile also recognizing the value of flexibility. We are committed to come onsite. We communicate frequentlyproviding flexibility to our employees, and have made available no-cost home fitness and mental health resources,in 2023, we continued to offer business group flexibility frameworks as well as webinarsour summer “Work From Anywhere” program, which allows people to work virtually for up to a maximum of three weeks. We will continue to offer a flexible working structure in 2024, while evaluating the ongoing effectiveness and expert speakers to keepdetermining what works best for our employees engaged and inspired.organization.
Philanthropy: AcrossWe strive to be a force for good and to be a leader in our global locations,approach to giving and engagement. Our core values are to be collaborative, responsible, entrepreneurial, self-aware and trustworthy. These core values motivate us to seek innovative yet practical solutions to some of society’s most pressing concerns. Empathy and compassion guide our approach to “doing good” such that our charitable efforts aim to help improve people’s quality of life. Philanthropy at Ares In Motion program reflects our commitment to corporate citizenship and supporting our local communities through a wide range of philanthropic and volunteerism efforts, including corporate sponsorships and partnerships, a global volunteer program and employee donation matching program.includes:
Ares’ directed charitable giving•Ares Charitable Foundation (the “Ares Foundation”):A 501(c)(3) qualifying organization sponsored by the firm, the Ares Foundation envisions a world in 2020 centered upon COVID-19 relief, including significant donationswhich people benefit from equitable access to hospitalsknowledge, resources and opportunities so that they can achieve their full potential. Launched in Los Angeles, New York, and London,2021, the Ares Foundation’s mission is to help accelerate equality of economic opportunity by supporting nonprofit organizations focused on health equity and disproportionately impacted groups,initiatives that provide career preparation and reskilling, encourage entrepreneurship and deepen individuals’ understanding of personal finance.
We fund and work alongside high-quality nonprofit organizations to devise inspired solutions to critical societal issues. Our employee-directed grants support initiatives that, for example, help low-income women in Singapore transition out of poverty, examine barriers to young people’s workforce entry in the U.K. and catalyze intergenerational entrepreneurship in the U.S. Our signature initiatives seek to address pervasive challenges through large-scale funding commitments that reflect our desire to improve the lives of current and future generations. Our commitments include Climate-Resilient Employees for a Sustainable Tomorrow (“CREST”), a five-year $25.0 million commitment that aims to close the gap between the demand for a skilled workforce for green jobs and the number of people ready for these opportunities in the U.S. and India, and AltFinance, a 10-year $30.0 million commitment to help equip Historically Black College and University students for careers in alternative investment management.
Ares is committed to donating a portion of our annualized carried interest allocations and incentive fees from certain funds supporting portfolio companies’to the Ares Foundation, which helps further align the firms’ investment and charitable activities. Moreover, the Ares Foundation benefits from the generosity of Ares employees who have been affectedare able to donate cash, equity or a portion of the realized proceeds from carried interest in certain funds.
•Pathfinder and Other Funds:In addition, Ares has committed to donate a minimum of 10% of the carried interest generated from Ares Pathfinder Fund, L.P. (“Pathfinder I”) and Ares Pathfinder Fund II, L.P. (“Pathfinder II”) and 5% of the incentive fees generated from an open-ended core alternative credit fund to global health and education charities, contributed by the crisis.firm and our team members. We believe that Pathfinder I is the first institutional private investment fund to utilize a predefined structure to make a substantial commitment to charitable activities.
2020•Ares in Motion (“AIM”): Our signature platform for employee engagement has empowered our team members to support local communities and nonprofit organizations since 2012. AIM engages employees in grassroots volunteerism, encourages their service with nonprofit boards and other pro bono opportunities, and amplifies their personal donations with charitable matches. Furthermore, employees who volunteer as AIM Champions enjoy opportunities to organize and lead volunteer activities in the U.S., Europe and Asia-Pacific to benefit the communities in which they live and work.
Our annual Summer of Service engages Ares employees around the world in both service-and skills-based “give back” opportunities. In addition, our nonprofit board training and placement program provides a way for team members to make a difference in their communities beyond firm-sponsored volunteer activities. AIM also helps bring our team members into thoughtful dialogue with nonprofit leaders through virtual fireside chat events so that employees can learn more about their organizations, understand the purpose and significance of their work, and glean valuable insights to apply professionally and personally.
Furthermore, we leverage AIM to sponsor and match team members’ support of charitable causes like crisis relief, social justice, mental health and DEI. In addition, we offer matching funds to augment team members’ sponsorship of nonprofits’ mission-driven events. The firm also sponsors these kinds of events through our business lines, and offers opportunities for employees to participate in these funded activities.
2023 Highlights
Fundraising
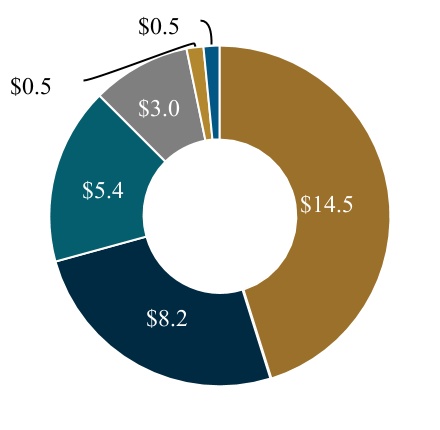
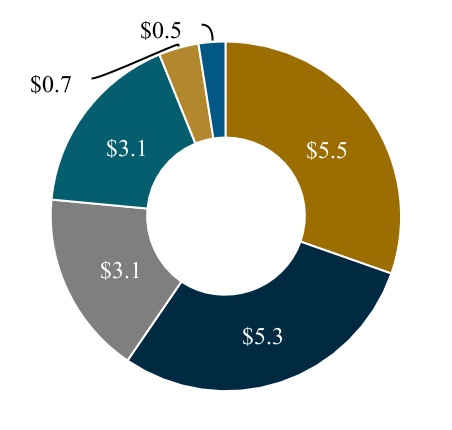
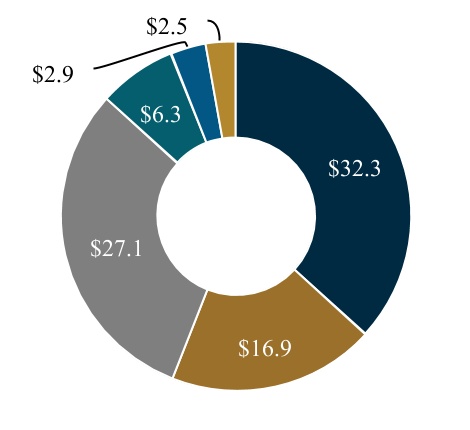
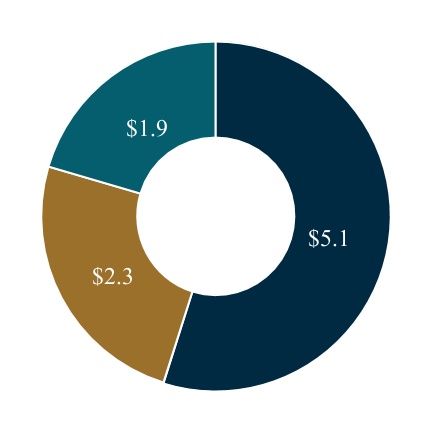
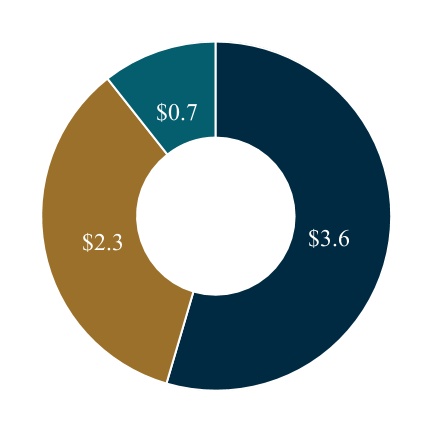
In 2020,2023, we raised $41.2$74.5 billion in gross new capital commitments for more than 85125 different investment vehicles. Of the $41.2$74.5 billion, $34.7$65.9 billion was raised directly from 358over 625 institutional investors (203(over 325 existing and 155approximately 300 new to Ares) and $6.5$8.6 billion was raised through intermediaries. The charts below summarize our gross new capital commitments by investment group and strategy ($ in billions):
| | | | | | | | | | | | | | | | | | | | |
| | Credit: $32.1$55.4 | | | Private Equity: $6.2$1.6 | |
| | | | | | | | | | | | | | | | | | | | | | | | | | | | | | | | | | | | | | | | | | |
| | U.S. Direct Lending | | European Direct Lending | | U.S. Direct Lending | | Alternative Credit | | | | | | Corporate Private Equity | | Special OpportunitiesOther | | Infrastructure & Power | |
| | | | | | | | | | | | | | |
| | Syndicated Loans | | Multi-AssetLiquid Credit | | High YieldAPAC Credit | | Other | | | | | | | | |
| | | | | | | | | | | | | | | | | |
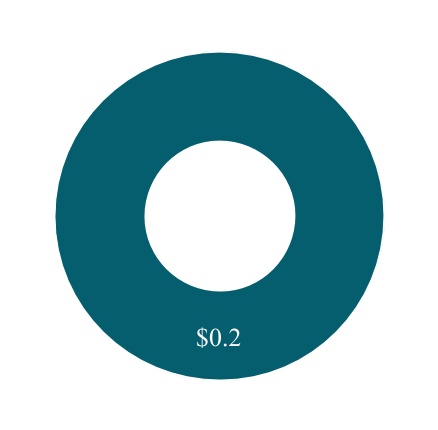
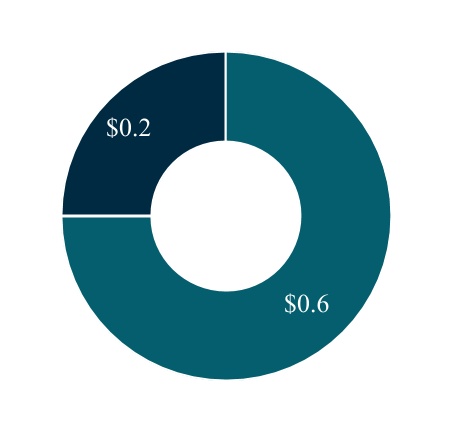
| Real Estate: $2.7Assets: $6.9 | | | Strategic Initiatives: $0.2Secondaries: $3.6 | |
| | | | | | | | | | | | | | | | | | | | | | | | | | | | | | | | | | | | | | | | | | | | | | | |
| | Real Estate Debt | | U.S. Real Estate Equity | | Infrastructure Opportunities | | European Real Estate Equity | | | | | Asian Secured LendingCredit
Secondaries | | Real Estate Secondaries | | Infrastructure Secondaries |
| | | | | | | | | | | | | | | |
| | Real Estate Debt | | Infrastructure Debt | | | | | | | Private Equity Secondaries | | Other | | |
The chart below summarizes gross new capital raised from existing and new direct institutional investors for the year endedDecember 31, 2023:
| | | | | | | | | | | | | | | | | | | | |
| | Existing -
Re-Up | | Existing - New Product | | New |
In 2023, 88% of our fundraising from direct institutional investors was from existing investors that either committed to a new product or re-upped their commitment to a subsequent fund vintage within the same product. We believe the fundraising from existing investors demonstrates our investors’ satisfaction with our performance, disciplined management of their capital and diverse product offering.
Capital Deployment
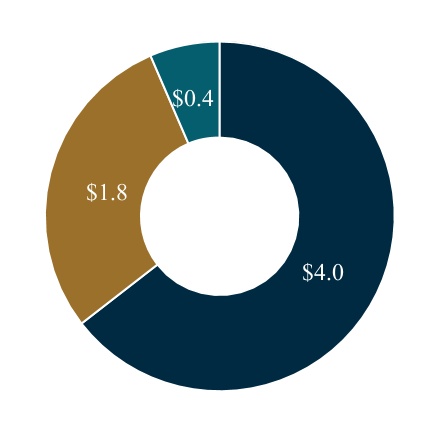
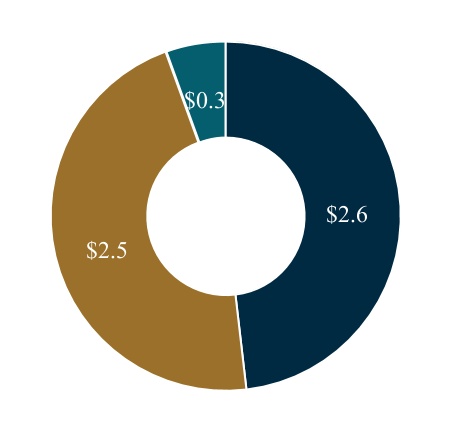
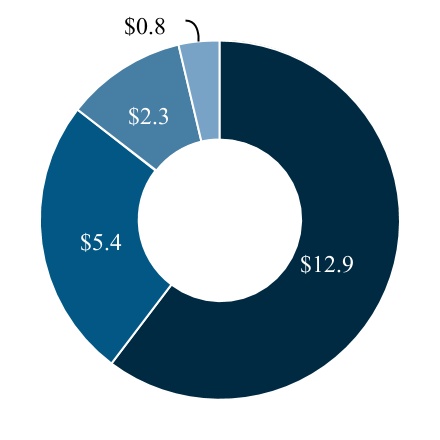
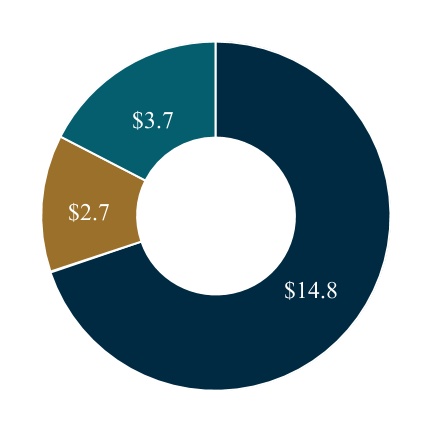
WIn 2023, we took advantage ofinvested $68.1 billion across our diverse global platform to invest more than $26.7 billion (excluding permanent capital) globally in 2020 as shown in the following charts ($ in billions):
| | | | | | | | | | | | | | |
| Credit $18.2$53.2 | | Private Equity: $5.4$4.3 | |
| | | | | | | | | | | | | | | | | | | | | | | | | | | | | | | | | | | | | | | | | | | | |
| U.S. Direct Lending | | Alternative Credit | | European Direct Lending | | | U.S. Direct LendingSpecial Opportunities | | Alternative Credit | | | Corporate Private Equity | | Special Opportunities | | Infrastructure and Power | |
| | | | | | | | | | |
| Syndicated Loans | | Multi-AssetLiquid Credit | | High YieldAPAC Credit | | | | | | | | |
| | | | | | | | | | | | | | |
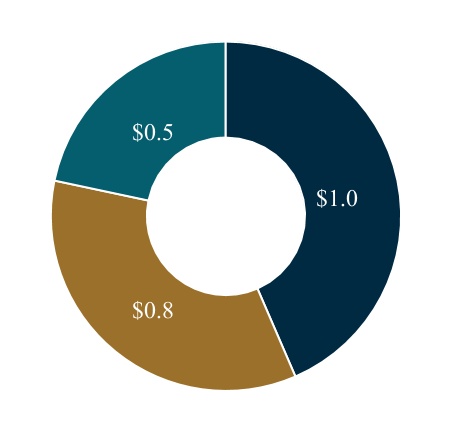
| Real Estate:Assets: $7.6 |
| Secondaries: $2.3 | | Strategic Initiatives: $0.8
| |
| | | | | | | | | | | | | | | | | | | | | | | | | | | | | | | | | | | | | | | | | | | |
| | U.S. Real Estate DebtEquity | | European Real Estate Equity | | Infrastructure Debt | | | | | U.S. Private Equity Secondaries | | Real Estate EquitySecondaries |
| | | | | | | | | | | | |
| Infrastructure Opportunities | | | | | | Asian Secured LendingReal Estate Debt | | | | | | | Asian Special SituationsInfrastructure Secondaries | | Credit
Secondaries |
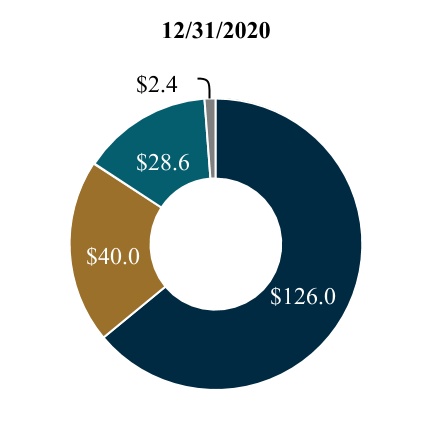
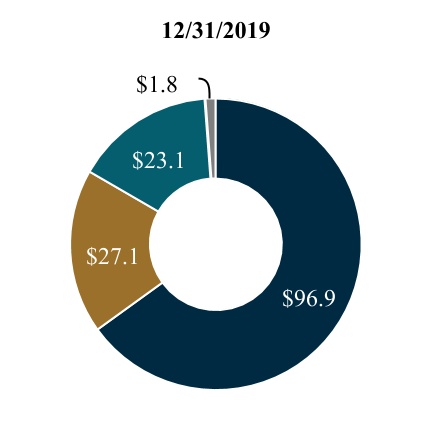
Of the $26.7$68.1 billion invested, $21.4$42.5 billion was tied to our drawdown funds. Our capital deployment in drawdown funds was comprised of the following ($ in billions):
| | | | | | | | | | | | | | | | | | | | | | | | | |
| Credit | | Private Equity | | Real EstateAssets | | Secondaries | | Strategic Initiatives |
Investment Groups
Each of our investment groups employs a disciplined, credit-oriented investment philosophy and is managed by a seasoned leadership team of senior professionals with extensive experience investing in, advising and underwriting and restructuring companies, power and energy assets and real estate properties.held by our funds.
(1)As of December 31, 2023, AUM amounts include vehicles managed by Ivy Hill Asset Management, L.P., a wholly owned portfolio company of ARCC and an SEC-registered investment adviser (“IHAM”).
(2)$56.9 billion in AUM represents investments by insurance companies in various Ares’ funds, SMAs and co-investments versus one discrete insurance platform.
Credit Group
Our Credit Group is one of the largest managers of credit strategies across the non-investment grade credit universe, with $145.5$284.8 billion of AUM and over 200270 funds as of December 31, 20202023. The Credit Group provides solutions for investors seeking to access a wide range of credit assets, including liquid credit, alternative credit products and direct lending products. The Credit Group capitalizes on opportunities across traded and non-traded corporate and consumer debt across the U.S. and European markets, providing investors access to directly originated fixed and floating rate credit assets along with the ability to capitalize on illiquidity premiums across the credit spectrum. Our U.S. and European direct lending strategies are among the largest in their respective markets. We are also a leading global manager of syndicated bank loans.
The Credit Group offers the following credit strategies across the liquid and illiquid spectrum:
Liquid Credit: Our liquid credit investment solutions help traditional fixed income investors access the syndicated loan and high yield bond markets among other asset categories. We focus on capitalizingin North America and Europe and capitalize on opportunities across traded corporatemulti-asset credit. As of December 31, 2020, our liquid credit team managed $33.8 billion of AUM in over 85 funds and separately managed accounts (“SMAs”).
•Syndicated Loans: OurThe syndicated loans strategy delivers a diversified portfolio of liquid, traded non-investment grade secured loans to corporate issuers. We focusfocuses on evaluating individual credit opportunities related primarily to non-investment grade senior secured loans and primarily targettargets first lien senior secured debt,loans, with a secondary focus on second lien senior secured loans and subordinated and other unsecured loans. These capabilities have supported our long history as leading manager and issuer of CLOs which hold syndicated loans.
•High Yield Bonds: OurThe high yield bondsbond strategy employs a value-driven philosophy, utilizing fundamental researchseeks to identify non-investment grade corporate issuers. We primarily seekdeliver a diversified portfolio of liquid, traded non-investment grade corporate bonds. This approach incorporatesbonds, including secured, unsecured and subordinated debt instruments of issuers in both North America and Europe.
•Multi-Asset Credit: Our multi-assetinstruments. Multi-asset credit strategy combines both syndicated loans and high yield bonds, as well as other asset categories including structured credit, special situations and related credit instruments intois a single portfolio. These portfolios are“go anywhere” strategy designed to offer investors a flexible solution to global credit investing by allowing us to tactically allocate between multiple asset classes in various market conditions. This strategy invests globally, can be highly customized,conditions. As of December 31, 2023, our liquid credit team managed $47.3 billion of AUM in over 110 funds and is designed to “go anywhere” within the liquid, non-investment grade credit universe.separately managed accounts (“SMAs”).
Alternative Credit: Our alternative credit strategy seeks to capitalize on asset-focused investment opportunities that fall outside of traditional, well-defined markets such as corporate debt, real estate and private equity. As of December 31, 2020,2023, our dedicated team of over 3065 professionals managed $12.9$33.9 billion inof AUM in over 2025 private funds and SMAs for a global investor base. Our alternative credit strategy emphasizes downside protection and capital preservation through a focus on investments that tend to share the following key attributes: asset security, covenants, structural protections and cash flow velocity.velocity and other features designed to capture value and minimize risk to principal. Our investment approach is designed to capture and create value by leveraging our firm'sfirm’s platform insights to assess risk and relative value.
Direct Lending: Our direct lending strategy is one of the largest self-originating direct lenders to the U.S. and European markets, with $98.8$191.4 billion of AUM in over 8590 funds and investment vehicles as of December 31, 20202023. We manage various types of direct lending vehicles within our U.S. and European direct lending teams including commingled funds, SMAs for large institutional investors seeking tailored investment solutions and joint venture lending programs. As of December 31, 2023, we managed over 55 SMAs across our direct lending strategy.
Our direct lending team has a multi-channel origination strategy designed to address a broad set of investment opportunities in the middle market. We focus on being the lead or sole lender to our portfolio companies which we believe allows us to exert greater influence over deal terms, capital structure, documentation, fees and pricing, while securing our position as a preferred source of financing for our transaction partners. The team maintains a flexible investment strategy with the capability to invest in first lien senior secured loans (including “unitranche” loans which are loans that combine senior and subordinated debt, generally in a first lien position), second lien senior secured loans, subordinated debt, preferred equity and non-control equity co-investments in private middle market companies.
U.S. Direct Lending: Our leading U.S. team is comprised of over 145180 investment professionals that cover more than 525650 financial sponsors and provide a wide range of financing solutions to middle market companies that typically range from
$10 $10 million to $250over $500 million in earnings before interest, tax, depreciation and amortization (“EBITDA”). As of December 31, 20202023, our U.S. direct lending team and its affiliates managed $56.5$123.1 billion inof AUM in over 60approximately 55 funds and investment vehicles. Our U.S. team manages corporate lending activities primarily through our inaugural vehicle and publicly tradedpublicly-traded business development company (“BDC”), ARCC, our non-traded BDC, ASIF, as well as private commingled funds and SMAs. Primary areas of focus for our U.S. Direct Lendingdirect lending teams include:
•Ares Capital Corporation: ARCC is a leading specialty finance company focused on providing direct loans to and making other investments toin private middle market companies in the U.S. ARCC has elected to be regulated as a BDC and iswas the largest publicly-traded BDC by market capitalization in the U.S. as of December 31, 2020.2023.
•Ares Strategic Income Fund: ASIF is a closed-end investment company focused primarily on providing direct loans to private middle market companies in the U.S., and to a lesser extent, broadly syndicated loans and
other more liquid credit opportunities, including in publicly-traded debt instruments. ASIF has elected to be regulated as a BDC.
•U.S. Commingled Funds and SMAs: Outside of ARCC, U.S. direct lending also generates fees from other funds, including:including the following fund families: Ares Private Credit Solutions, which focusesfocus on junior debt investments in upper middle market companies; Ares Senior Direct Lending Fund, which focusesfocus on first lien senior secured loans to North American middle market companies; and Ares Commercial Finance, which focuses on asset-based and cash flow loans to middle market and specialty finance companies; as well asand SMAs for large institutional investors.
European Direct Lending: Our leading European direct lending team is comprised of over 6590 investment professionals thatwith the ability to invest across the capital structure and across several geographies in Europe. The team cover approximately 300covers over 395 financial sponsors, offers self-originated, flexible and is one ofscaled debt capital to predominantly the most active participants in the European middle market. The team offers a wide range of financing opportunities to middle market and large capitalization companies with EBITDA typically ranging from €10 million to €100over €300 million. As of December 31, 2020,2023, our European direct lending team managed $42.368.3 billion inof AUM in over 2535 funds, including our flagship European direct lending commingled funds, other various funds and SMAs.
APAC Credit: Our APAC credit team manages credit, private equity and special situations investments in the APAC region. Our APAC special situations strategy focuses on primary and secondary special situations, primarily targeting restructuring-related situations, deep value acquisitions and distressed financing. Our APAC private credit strategy targets privately sourced loans in high quality businesses across the region. The team consists of approximately 70 investment professionals. APAC credit benefits from having an on-the-ground presence in offices across the APAC region and a comprehensive range of local market licenses and entities to provide our clients with an extensive regional investment platform. APAC credit primarily employs a direct origination model and aims to provide flexible capital solutions to its investee companies and compelling risk-reward investment opportunities to our investors. As of December 31, 2023, APAC credit had $11.9 billion of AUM in over 15 funds and related co-investment vehicles.
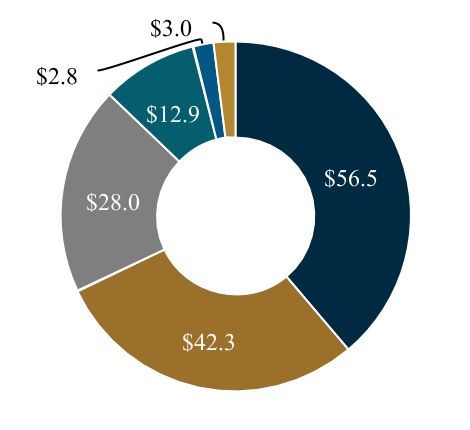
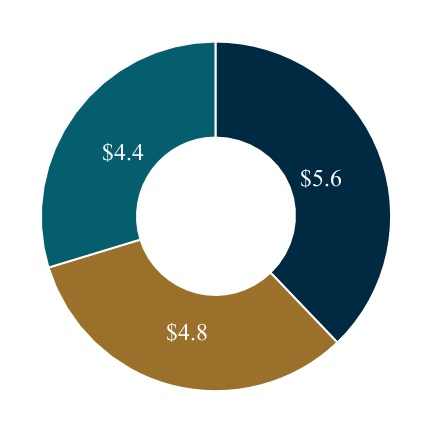
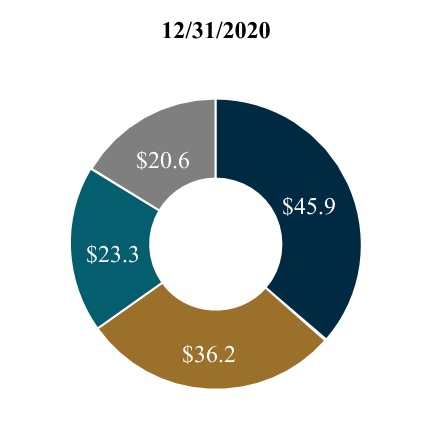
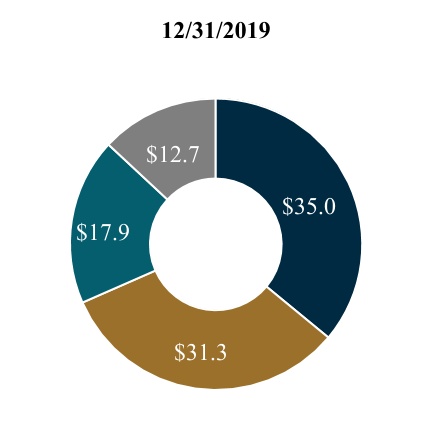
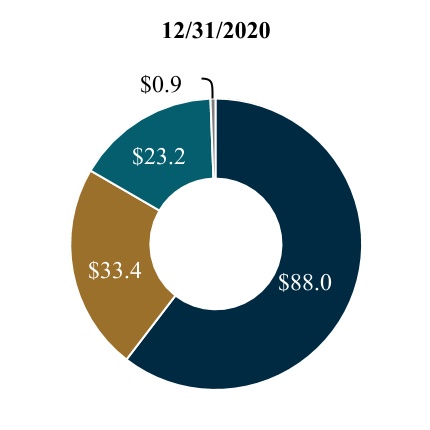
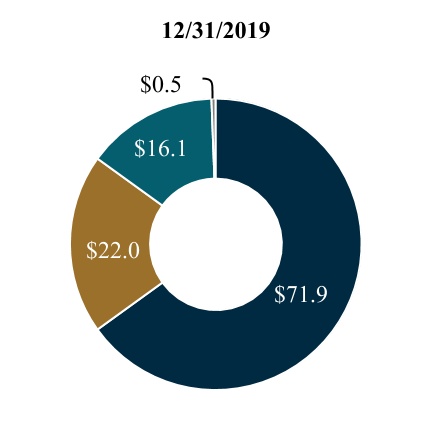
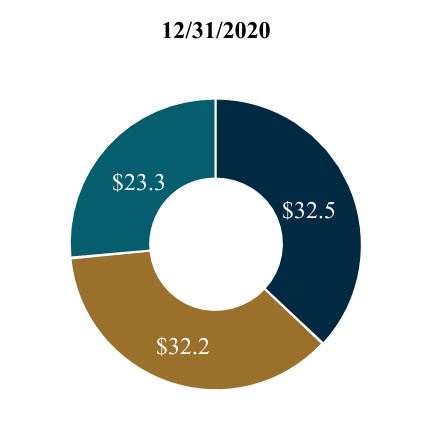
The following charts present the Credit Group’s AUM and FPAUM as of December 31, 20202023 by investment strategy ($ in billions):
| | | | | | | | | | | | | | |
| AUM: $145.5$284.8 | | FPAUM: $88.0$176.8 | |
| | | | | | | | | | | | | | | | | | | | | | | | | | | | | | | | | | | |
| U.S. Direct Lending | | European Direct Lending | | Syndicated LoansLiquid Credit | | Alternative Credit | | High YieldAPAC Credit | | Multi-Asset CreditOther |
| | |
Private Equity Group
Our Private Equity Group has achieved compelling investment returns for a loyal and growing group of high profileits limited partners and, as of December 31, 20202023, had $27.4managed $39.1 billion of AUM. Our Private Equity GroupAUM in over 65 funds. The group broadly categorizes its investment activitiesstrategies into three strategies: Corporate Private Equity, Special Opportunitiescorporate private equity, special opportunities and Infrastructure and Power.APAC private equity. Our private equity professionals have a demonstrated ability to deploy flexible capital across market environments, which allows them to stay both active and disciplined in various market environments.their assessment of the best relative value opportunities. The group manages funds focused primarily on investing in North America, and, to a lesser extent, Europe and China.Asia-Pacific.
Corporate Private Equity: Certain of our senior private equity professionals have been working together since 1990 and raised our first corporate private equity fund in 2003. Our team has grown to consists of overover 75 55 investment professionals based primarily in Los
Angeles, Chicago, London, Shanghai,market volatility and Hong Kong. Indislocation. We seek to invest in high-quality middle market companies in the U.S.core industries of healthcare, services, industrials and London,consumer across North America and Europe, where we pursue four principal transactions types: prudently leveraged control buyouts, growth equity, rescue/deleveraging capitalcan utilize the team’s extensive growth-oriented investing experience, dedicated value creation system and ability to flex into distressed buyouts/discounted debt accumulation.to target attractive returns across market environments. This flexible capital approach,differentiated strategy, together with the broad resources of the Ares platform, widens our universe of potential investment opportunities and allows us to remain active in different marketsacross various market environments and to be highly selective in making investments across various market environments.by identifying the most attractive relative value opportunities.
Special Opportunities: Our special opportunities team hasconsists of more than 15over 25 investment professionals and employs aan “all weather” flexible capital strategy to targetfinance debt and non-control positions across a broad spectrum ofequity solutions in healthy, stressed and distressed middle market companies undergoing transformational change. Our team partners with companies in North America and opportunistic situations. We target businesses undergoing stress or transformational change that we believe present asymmetric risk/reward opportunities that offer strong downside protectionEurope to enhance enterprise values, filling the void between for-control private equity and the potential for significant upside participation. We employ our deep credit expertise, proprietary research and robust sourcing modeltraditional private debt. The strategy seeks to capitalize on current market trends. This opportunistic approach allows us toconsistently invest in both private and public transaction types across a broad range of industries, asset classesprivate, special-situation opportunities and geographies.flex into distressed public market debt when attractive. We believe the special opportunities team benefits from: (i) advantaged sourcing; (ii) private equity integration, with an ability to leverage the deep industry experience of the corporate private equity professionals; (iii) an extensive network and information edge; and (iv) an experienced team utilizing a consistent and repeatable investment process.
InfrastructureIn February 2024, we announced that our special opportunities strategy, historically reported as a component of our Private Equity Group, will be integrated into the Credit Group to align management of this strategy and Power:Our infrastructure and power team has more than 15will form the foundation for a new opportunistic credit strategy. The change will be presented in our results beginning in 2024. Adjusted for this change, as of December 31, 2023, the Credit Group managed $299.4 billion in AUM with approximately 490 investment professionals and takes a value-added approach that seeksthe Private Equity Group managed $24.5 billion in AUM with approximately 85 investment professionals, with both groups continuing to source and structure essential infrastructure assets with strong downside protection and potential for capital appreciation throughout the climate infrastructure, natural gas generation, and energy transportation sectors. We utilize a broad origination strategy, flexible investment approach, and leverage industry relationships and the Ares platform to seek attractive risk-adjusted returnsmanage investments across the infrastructureU.S., Europe and power industry. WeAsia-Pacific.
APAC Private Equity:The APAC private equity strategy was established in connection with the Crescent Point Acquisition, investing in industry leading consumer companies in seven core sectors that we believe benefit disproportionately from higher disposable income levels. The strategy focuses on primarily pursuing structured growth equity investments in control, joint control and minority ownership formats. Our APAC private equity team consists of over 25 investment professionals and focuses on investing in companies that give us exposure to increasing consumer spending and urbanization in our experience acrosstarget markets. In times of economic dislocation, we also seek to invest opportunistically where the asset life cycle, flexible capitalfocus is on dislocations and catalysts that lead to high-quality assets becoming available for purchase at deeply discounted prices. While we look for deep value opportunities in consumer-driven companies, our deep value approach and broad infrastructure expertise positions us well to take advantage of the transitioning infrastructure industry.often includes asset-oriented opportunities.
The following charts present the Private Equity Group’s AUM and FPAUM as of December 31, 20202023 by investment strategy ($ in billions):
| | | | | | | | | | | | | | | | | | | | | | | |
| Corporate
Private Equity | | Special Opportunities | | APAC Private Equity | | Infrastructure and PowerOther |
Real EstateAssets Group
Our Real EstateAssets Group manages comprehensive public and private equity and debt strategies with $14.8$65.4 billion of assetsAUM in over 65 under managementinvestment vehicles as of December 31, 2020.2023. With our experienced team, along with our expansive network of relationships, our Real EstateAssets Group capitalizes on opportunities across both real estatein equity and debt investing. investing across real estate and infrastructure investment strategies.
Real Estate: Our real estate equity investments focus on implementing hands-on value creation initiatives to mismanaged and capital-starved assets, platform-level investments, as well as new development,developments, ultimately selling stabilized assets back into the market. Our real estate debt strategies leverage the Real Estate Group’sutilize diverse sources of capital to directly originate and manage commercial mortgage investmentsloans on properties that range from stabilized to those requiring hands-on value creation. The Real Estate GroupOur real estate platform has achieved significant scale in a short period ofover time through both organic fundraising efforts as well as various acquisitions and successful fundraising efforts.acquisitions. Today, the group provideswe provide investors access to itsour real estate investment capabilities through several vehicles: closed-end U.S. and European real estatediversified equity commingled funds, an open-end U.S. real estateindustrial-focused equity fund, open-end U.S. and European debt commingled funds, real estate
equity and real estate debt SMAs, our non-traded REITs, Ares Real Estate Income Trust, Inc. (“AREIT”) and a publicly tradedAres Industrial Real Estate Income Trust, Inc. (“AIREIT”), and our publicly-traded commercial mortgage REIT, ACRE. The group’s activities are managed by dedicated equity and debt teams in the U.S. and Europe.
Real Estate Equity: Our real estate equity team, with over 55220 investment professionals, has extensive real estate private equity experience in the United StatesU.S. and Europe. Our team primarily acquires standing assets and improves assetsthem through renovations,renovating, repositioning and retenanting as well as selective developmentsand selectively developing assets in the United States and Europe.supply-constrained markets. As of December 31, 2020,2023, our real estate equity team managed $9.2$38.6 billion inof AUM in over 3540 investment vehicles. Primary areas of focus for our Real Estate Groupreal estate equity teams include:
•Real Estate Equity Value-AddCore/Core-Plus: Our U.S. core/core-plus real estate strategy focuses on the acquisition of assets with strong long-term cash flow potential and durable tenancy diversified across end-user industries and
geographies. We deploy capital across all major property types, with a strong focus on industrial and multifamily assets located in top-tier primary and regional distribution markets across the U.S.
•Real Estate Value-Add: Our U.S. and European value-add investment activities focusreal estate strategy focuses on the acquisition of underperforming,undermanaged and underfunded income-producing institutional-quality assets that our team believes can be improved through select value-creation initiatives. We target the majoracross various property sectors including residential, industrial, office and select other property types acrossin the U.S. and Europe. The strategy seeks to create value and generate stable and growing distributions to investors by buying properties at attractive valuations, implementing asset management initiatives to increase income and identifying multiple exit strategies upfront.
•Real Estate Equity OpportunisticOpportunistic:: Our U.S. and European opportunistic real estate investment activities focusstrategy capitalizes on capitalizingincreased investor demand for developed and stabilized assets by focusing on the repositioning of assets, capitalization of distressed and special situations, repositioning underperformingand development of core-quality assets and undertaking select development and redevelopment projects. We target theacross all major property sectors, including residential, industrial and officetypes, as well as select retail, hospitality and other niche asset classes acrossadjacent sectors, throughout the U.S. and Europe.
Real Estate Debt: Our real estate debt team, with over 2535 professionals, primarily focuses on directly originating and investing in a wide range of financing opportunities in the U.S. and Europe. As of December 31, 2020,2023, our real estate debt team managed $5.6$11.1 billion inof AUM in five investment vehicles. In addition to managing private commingledglobally through open-end funds, SMAs and SMAs, our real estate debt team also invests through a specialty finance company, ACRE, which invests in a diversified portfolio of real estate debt investments.ACRE. By investing through multiple investment vehicles, our real estate debt team has the ability to provide flexible financing across the capital structure. While our real estate debt strategies focus predominantly on directly originated transactions, we also selectively pursue secondary market acquisitions and syndicated transactions.
Infrastructure: Our long-tenured global infrastructure team utilizes deep local sourcing capabilities and extensive sector experience to seek to originate and manage diverse, high-quality investments in private infrastructure assets across the globe and, as of December 31, 2023, managed $15.7 billion of AUM in over 15 investment vehicles.
•Infrastructure Opportunities: Our infrastructure opportunities team consists of over 30 investment professionals and managed $6.3 billion of AUM in more than ten investment vehicles as of December 31, 2023. We utilize a broad origination strategy, flexible investment approach, and leverage industry relationships and the Ares platform to seek attractive risk-adjusted returns across the climate infrastructure market. We believe our experience as value-add investors, flexible approach, and broad infrastructure experience positions us well to take advantage of the transitioning infrastructure industry.
•Infrastructure Debt: Our global infrastructure debt team consists of over 20 investment professionals and sources assets and businesses across regions with defensive characteristics across the digital, transport, energy and utility sectors. As of December 31, 2023, our global infrastructure debt team managed $9.4 billion of AUM in more than five investment vehicles. We employ a direct origination and tailored structuring approach to provide borrowers with flexible financing solutions. We aim to deliver attractive risk adjusted returns focused on cash yield by targeting infrastructure debt investments with defensive characteristics that have the potential to perform across different market cycles. Our structuring experience helps enhance cash yield and reduce downside risks in a core asset class.
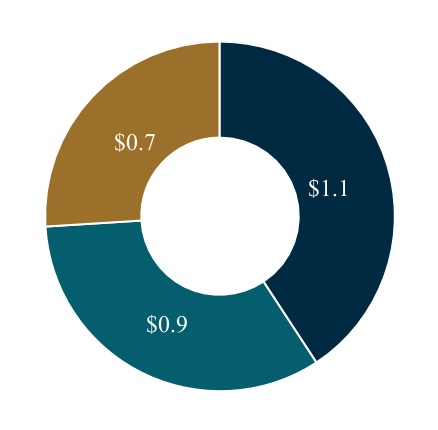
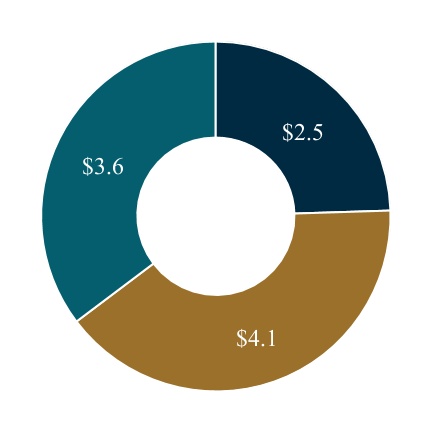
The following charts present the Real EstateAssets Group’s AUM and FPAUM as of December 31, 20202023by investment strategy ($ in billions):
| | | | | | | | | | | | | | | | | | | | | | | | | | | | | |
| U.S. Real Estate Equity | | Real Estate Debt | | European Real Estate Equity | | Infrastructure Debt | | Infrastructure Opportunities |
Secondaries Group
Our Secondaries Group invests in secondary markets across a range of alternative asset class strategies, including private equity, real estate, infrastructure and credit, with $24.7 billion of AUM in over 75 funds as of December 31, 2023. The team has extensive experience investing across the secondaries market primarily in North America. We have established ourselves among the most active secondary investors engaged in recapitalizing and restructuring existing limited partnership interests in funds with a focus on transactions that can address pending fund maturity, strategy change or the need for additional equity capital.
Private Equity Secondaries: Our private equity secondaries teamhas an established track record of providing customized private equity transaction solutions to institutional limited partners and general partners. As of December 31, 2023, our private equity secondaries team of more than 35 investment professionals managed $13.1 billion of AUM in approximately 35 funds and open-end accounts. Our private equity secondaries team acquires interests across a range of partnership vehicles, including private equity funds, multi-asset portfolios, as well as single asset joint ventures. The private equity secondaries strategy seeks to achieve attractive secondary cash flow and diversification characteristics by investing across the spectrum of private equity secondaries transactions, including through APMF, a closed-end interval fund. We continue to maintain a differentiated investment strategy that utilizes our skills in fundamental manager and portfolio analysis, our quantitative research capabilities and the support and insights from the wider Ares platform with the aim to generate strong risk-adjusted returns.
Real Estate Secondaries: Our real estate secondaries team has a track record of innovation through customized transaction solutions tailored to meet the needs of limited partners and general partners. As of December 31, 2023, our real estate secondaries team of more than 25 investment professionals managed $7.8 billion of AUM in approximately 30 funds and related co-investment vehicles. Our real estate secondaries team acquires interests across a range of partnership vehicles, including private real estate funds, multi-asset portfolios and single property joint ventures. Our team seeks broad diversification by property sector and geography and to drive investment results through underwriting, transaction structuring and portfolio construction.
Infrastructure Secondaries: Our infrastructure secondaries team has a strong track record of providing customized infrastructure transaction solutions tailored to meet the needs of limited partners and general partners. As of December 31, 2023, our infrastructure secondaries team of more than ten investment professionals managed $2.4 billion of AUM in ten funds and related co-investment vehicles. The infrastructure secondaries strategy seeks to accelerate the benefits of traditional infrastructure by providing diversified low risk exposure through preferred structure, traditional limited partnership and general partner led continuation vehicle transactions. Our team focuses on achieving diversification through building a portfolio that provides inflation protection and exposure to uncorrelated assets.
Credit Secondaries: Our credit secondaries strategy seeks to create a highly diversified portfolio of primarily senior secured private credit interests across North America and Europe, acquired directly or indirectly through secondary market
transactions. As of December 31, 2023, our credit secondaries team of ten investment professionals managed $1.4 billion of AUM in four funds and related co-investment vehicles.
The following charts present the Secondaries Group’s AUM and FPAUM as of December 31, 2023 by investment strategy ($ in billions):
| | | | | | | | | | | | | | |
| AUM: $14.8$24.7 | | FPAUM: $10.2$19.1 | |
| | | | | | | | | | | | | | | | | |
| Real Estate Debt | | European Real Estate Equity | | U.S. Real Estate Equity |
| | |


Strategic Initiatives | | | | | | | | | | | | | | | | | | | | | | | | | | | | |
| | Private Equity Secondaries | | Real Estate Secondaries | | Infrastructure Secondaries | | Credit
Secondaries | | |
Other Businesses
Strategic Initiatives representsCertain operating segments and strategic investments thatgrowth opportunities have not reached the scale and magnitude to be presented individually; therefore, we present the results for these businesses collectively. These strategies seek to expand the Company’sour reach and its scale in new and existing global markets including Ares SSG as well as Ares Insurance Solutions (“AIS”).
Ares SSG: Ares SSG is a highly differentiated investment manager making credit, special situations and private equity investments in the Asia-Pacific region. The team of over 30 investment professionals has an extensive history of investing in Asian markets. Ares SSG benefits from having an on-the-ground presence in offices across Asia Pacificinclude AIS and a comprehensive
range of local market licenses and entities to provide our clients with an extensive regional investment platform. Ares SSG has $7.0 billion in AUM across over 10 funds as of December 31, 2020 and primarily employs a direct origination model and aims to provide flexible capital solutions to its investee companies and compelling risk-reward investment opportunities to our investors.
•Asian Special Situations: Our Asian special situations strategy focuses on primary and secondary special situation across the Asia Pacific region. Our team primarily targets restructuring-related situations, deep value acquisitions and last-mile financing.
•Asian Secured Lending: Our Asian secured lending strategy targets high quality, privately sourced direct lending loans that do not exhibit financial strain. Our team primarily targets investments in secured loans, growth capital financing and acquisition financing, leveraging our deep set of relationships and coverage to enable direct origination across the Asia Pacific region.SPACs.
Ares Insurance Solutions: AIS is Ares Management'sAres’ dedicated, in-house team that provides solutions to insurance clients including asset management, capital solutions and corporate development. AIS strives to provide insurers with attractive risk and capital adjusted return profiles that fit within regulatory, rating agency and other counterparty guidelines. Leveraging over 525approximately 1,000 investment professionals across the firm’s investment groups, AIS creates tailored investment solutions that meet the unique objectives of our insurance clients. AIS strives to provide insurers with differentiated investment solutions with attractive risk and capital adjusted return profiles that fit within regulatory, rating agency and other counterparty guidelines. AIS is overseen by an experienced management team with direct insurance industry experience in many areas directly applicable to AIS and our insurance company clients. Members of the Ares team have previously held senior positions at leading insurers. AIS acts as the dedicated investment manager, capital solutions and corporate development partner to Aspida Life Insurance Company (“Aspida Life”) and Aspida Life Re Ltd. (“Aspida”Aspida Re”), an. Aspida Life and Aspida Re are insurance companycompanies that focusesfocus on the U.S. life and annuity insurance and reinsurance markets. In addition, AIS provides key strategic advantages to Aspida, including insurance investment experience, differentiated asset origination, asset-liabilitymanages $12.5 billion of AUM as of December 31, 2023, of which $8.2 billion is sub-advised by Ares vehicles and capital solutions and access to capital.included within other strategies.
Ares Acquisition Corporation: Ares Acquisition Corporation (formerly NYSE: AAC) (“AAC I”) was a SPAC sponsored by Ares and formed in 2020 for the purpose of effecting a merger, share exchange, asset acquisition, share purchase, reorganization or similar business combination. AAC I did not complete a business combination within the time period required by its amended and restated memorandum and articles of association, and in the fourth quarter of 2023, the remaining outstanding Class A ordinary shares of AAC I were redeemed in full and AAC I ceased all operations other than legal dissolution.
Ares Acquisition Corporation II: Ares Acquisition Corporation II (NYSE: AACT) (“AAC II”) is a SPAC sponsored by Ares and formed in 2021 for the purpose of effecting a merger, share exchange, asset acquisition, share purchase, reorganization or similar business combination. AAC II is seeking to pursue an initial business combination target in any industry or sector in North America, Europe or Asia.
The following charts present Strategic Initiatives’Other Businesses AUM and FPAUM as of December 31, 20202023 by investment strategy ($ in billions):
| | | | | | | | | | | | | | |
| AUM: $9.3$4.8 | | FPAUM: $6.6$3.6 | |
| | | | | | | | | | | | | | | | | |
| Asian Special Situations | | Insurance | | Asian Secured LendingSPACs |
| | |
Product Offering
To meet investors’ growing demand for alternative investments, we manage investments in an increasingly comprehensive range of funds across a spectrum of compelling and complementary strategies. We have demonstrated an ability to consistently generate attractive and differentiated investment returns across these investment strategies and through various market environments. We believe the breadth of our product offering, our expertise in various investment strategies and our proficiency in attracting and satisfying our growing institutional and retail client base has enabled and will continue to enable us to increase our AUM across each of our investment groups.
Investor Base and Fundraising
Our diverse investor base includes direct institutional relationships and a significant number of retail investors. Our high-quality institutional investor base includes corporate and public pension funds, insurance companies, sovereign wealth funds, banks, investment managers, endowments and foundations. We have grown the number of these relationships from approximately 650over 900 in 20152018 to over 1,0902,300 in 20202023.
As of December 31, 2020, $143.12023, $328.5 billion, or 73%78% of our $197.0418.8 billion of AUM, was attributable to our direct institutional relationships. As of December 31, 2020,2023, our total AUM was divided by channel, and further our institutional direct AUM by client type and geographic origin as follows ($ in billions):
| | | | | | | | | | | | | | | | | | | | | | | | | | | | | | | | | | | | | | | | | | | | | | | | | | | | | | | | | | | |
| Institutional Direct | | Public Entities and RelatedRetail | | Institutional Intermediaries | | | Pension | | Bank/ Private Bank | | Insurance | | Bank | | | North America | | Europe | | AsiaAPAC |
| | | | | | | | Sovereign Wealth Fund | | High Net Worth and Private Bank | | Investment Manager | | | Middle East & Africa | | Other | | |
| Middle East | | Australia | | | | | Other |
| | | | | | | | | Endowment | | | | | | | | | | |
The following chart presents the AUM of investors committed to more than one of our funds as of December 31, 20202023 compared to December 31, 20152018 ($ in billions):
We believe that the AUM of multi-fund investors demonstrates our investors’ satisfaction with our performance, disciplined management of their capital and diverse product offering. Their loyalty has facilitated the growth of our existing businesses and we believe improves our ability to raise new funds and successor funds in existing strategies in the future.
Institutional investors are demonstrating a growingcontinue to demonstrate interest in SMAs, which include contractual arrangements and single investor vehicles and funds, because these accounts can provide investors with greater levels of transparency, liquidity and control over their investments as compared to more traditional commingled funds. As of December 31, 20202023, $45.0$91.1 billion, or 31%28%, of our direct institutional AUM was managed through SMAs. Our publicly traded entitiesretail vehicles and their affiliates, including ARCC, ACRE, ARDC, ASIF, APMF, CADC, AREIT and AIREIT account for $53.8 billion, or 13%, of our AUM. We have over 945 institutional investors and hundreds of thousands of retail investor accounts across our retail vehicles.
ARCC, ACRE and ARDC, account for $21.9 billion of our AUM. We have over 610 institutional investors and over 200,000 retail investor accounts across our three publicly traded vehicles.
We believe that client relationships are fundamental to our business and that our performance across our investment groups coupled with our focus on client service has resulted in strong relationships with our investors. Our dedicated and extensive in-house strategy and relationship management teams,team, comprised of approximately 140over 135 professionals located in North America, Europe, AsiaAPAC and the Middle East, is dedicated to raising capital globally across all of our funds, servicing existing fund investors and tailoring offerings to meet their needs, developing products to complement our existing offerings, and deepening existing relationships to expand them across our platform. We also have a strategic joint venture with Fidante Partnersinitiatives focused on expanding our presence in Latin America and Australia. Our senior relationship management team maintains an active and transparent dialogue with an expansive list of investors. This team is supported by product managers and investor relations professionals with deep experience in each of our complementary investment groups whothat are dedicated to servicing our existing and prospective investors.
In addition to our expansive relationships with institutional investors, we have further diversified our investor base with our retail distribution channel. AWMS, our wholly owned subsidiary, facilitates the product development, distribution, marketing and client management activities for investment offerings in the global wealth management channel with over 125 professionals.
Operations Management Group
The OMG consists of shared resource groups to support our reportableoperating segments by providing infrastructure and administrative support in the areas of accounting/finance, operations, information technology, legal, compliance, human resources, strategy and relationship management legal, compliance and human resources.distribution. Our clients seek to partner with investment management firms that not only have compelling investment track records across multiple investment products but also possess seasoned infrastructure support functions. As such, significant investments have been made to develop the OMG. The OMG also includes AWMS. We have successfully launched new business lines, integrated acquired businesses into the operations and created scale within the OMG to support a much larger platform in the future.
Organizational Structure
The simplified diagram below (which omits certain intermediate holding companies) depicts our legal organizational structure. Ownership information in the diagram below is presented as of December 31, 2020.2023. Ares Management Corporation (“AMC”) is a holding company and through subsidiaries is the general partner of each of the Ares Operating Group entitiesentity and operates and controls the business and affairs of the Ares Operating Group. Ares Management CorporationAMC consolidates the financial results of the Ares Operating Group, entities, theirits consolidated subsidiaries and certain consolidated funds.
(1)Assuming the full exchange of Ares Operating GroupAOG Units for shares of our Class A common stock, as of December 31, 2020,2023, Ares Owners Holdings L.P. would hold 51.19%42.36%, Sumitomo Mitsui Banking Corporation (“SMBC”) would hold 5.48% and the public would hold 48.81%52.16% of AMC. Inclusive of Class A common stock held directly by Ares Management Corporation.
(2)On February 17, 2021,employees and assuming the full exchange of AOG Units for shares of our boardClass A common stock, Ares employee ownership would represent 45.90% of directors adopted resolutions authorizing a Second Amended and Restated Certificate of Incorporation in connection with an internal reorganization that is expected to occur on or about April 1, 2021. The internal reorganization will consist of, among other matters, a merger of each of Ares Investments and Ares Offshore Holdings, with and into Ares Holdings.
Holding Company Structure
The Company elected to be treated as a corporation for U.S. federal and state income tax purposes (the “Tax Election”) effective March 1, 2018. In addition, the Company completed its state law conversion from a Delaware limited partnership to a Delaware corporation (the “Conversion”) effective on November 26, 2018 (the “Effective Date”). At the Effective Date, (i) each common share of the Company outstanding immediately prior to the Effective Date converted into one issued and outstanding, fully paid and nonassessable share of Class A common stock, $0.01 par value per share, of the Company, (ii) the general partner share of the Company outstanding immediately prior to the Effective Date converted into 1,000 issued and outstanding, fully paid and nonassessable shares of Class B common stock, $0.01 par value per share of the Company, (iii) the special voting share of the Company outstanding immediately prior to the Effective Date converted into one issued and outstanding, fully paid and nonassessable share of Class C common stock, $0.01 par value per share, of the Company, and (iv) each preferred share of the Company outstanding immediately prior to the Effective Date converted into one issued and outstanding, fully paid and nonassessable share of the Series A Preferred Stock.
As a result of the Conversion, except as otherwise expressly provided in the Certificate of Incorporation, ourOur common stockholders are entitled to vote on all matters on which stockholders of a corporation are generally entitled to vote under the Delaware General Corporation Law (the “DGCL”), including the election of our board of directors. Holders of shares of our Class A common stock becameare entitled to one vote per share of our Class A common stock. On any date on which the Ares Ownership Condition (as defined in the Certificate of Incorporation) is satisfied, holders of shares of our Class B common stock are, in the aggregate, entitled to a number of votes equal to (x) four times the aggregate number of votes attributable to our Class A common stock minus (y) the aggregate number of votes attributable to our Class C common stock. On any date on which the Ares Ownership Condition is not satisfied, holders of shares of our Class B common stock are not entitled to vote on any matter submitted to a vote of our stockholders. The holder of shares of our Class C common stock is generally entitled to a number of votes equal to the number of Ares Operating GroupAOG Units (as defined in the Certificate of Incorporation) held of record by each Ares Operating Group Limited Partner (as defined in the Certificate of Incorporation) other than the Company and its subsidiaries. Ares Management GP LLC is the sole holder of shares of our Class B common stock and Ares Voting LLC is the sole holder of shares of our Class C common stock. Our Class B common stock and our Class C common stock are non-economic and holders thereof shall not be entitled toto: (i) dividends from the Company or (ii) receive any assets of the Company in the event of any dissolution, liquidation or winding up of the Company.Ares Management GP LLC and Ares Voting LLC are both wholly owned by Ares Partners Holdco LLC. As a result, the Company is a “controlled company” within the meaning of the corporate governance standards of the New York Stock Exchange (“NYSE”) and qualifies for exceptions from certain corporate governance rules of the NYSE. ExceptThe Company also has non-voting common stock solely held by SMBC, which has the same economic rights as provided in the Certificate of Incorporation and the Company’s Bylaws and under the DGCL and the rules of the NYSE, shares of the SeriesClass A Preferred Stock are generally non-voting.common stock.
Accordingly, Ares Management CorporationAMC and any direct subsidiaries of Ares Management CorporationAMC that are treated as corporations for U.S. federal income tax purposes and that are the holders of Ares Operating GroupAOG Units are (and, in the case of Ares Offshore Holdings, Ltd., may be) subject to U.S. federal, state and local income taxes in respect of their interests in the Ares Operating Group entities.Group. The Ares Operating Group entities areentity is treated as partnershipsa partnership for U.S. federal income tax purposes. An entity that is treated as a partnership for U.S. federal income tax purposes generally incurs no U.S. federal income tax liability at the entity level. Instead, each partner is required to take into account its allocable share of items of income, gain, loss, deduction and credit of the partnership in computing its U.S. federal, state and local income tax liability each taxable year, whether or not cash distributions are made.
Each of the Ares Operating Group entities has an identical number of partnership units outstanding. Ares Management CorporationAMC holds through subsidiaries a number of Ares Operating GroupAOG Units equal to the number of shares of Class A common stock that Ares Management CorporationAMC has issued. The Ares Operating GroupAOG Units held by Ares Management CorporationAMC and its subsidiaries are economically identical in all respects to the Ares Operating GroupAOG Units that are not held by Ares Management CorporationAMC and its subsidiaries. Accordingly, Ares Management CorporationAMC receives the distributive share of income of the Ares Operating Group from its equity interest in the Ares Operating Group.
Structure and Operation of our Funds
We conduct the management of our funds and other similar private vehicles primarily through organizing a limited partnership or other limited liability structure in which entities organized by us accept commitments and/or funds for investment from institutional investors and other investors. Such commitments are generally drawn down from investors on an as needed basis to fund investments over a specified term. Our Credit Group funds also include structured funds in which the investor’s capital is fully funded into the fund upon or soon after the subscription for interests in the fund. The CLOs that we manage are structured investment vehicles that are generally private limited liability companies. Our drawdown funds are generally organized as limited partnerships or limited liability companies. However, there are non-U.S. funds that are structured as corporate or non-
partnershipnon-partnership entities under applicable law. We also advise a number of investors through SMA relationships structured as contractual arrangements or single investor vehicles. In the case of our SMAs that are not structured as single investor vehicles, the investor, rather than us, generally controls custody of the investments with respect to which we advise. We also manage a closed-end interval fundfunds (APMF and CADC) that allowsallow for periodic redemptions of the various share classes. Three of the vehicles that we manage are publicly traded corporations. The publicly tradedclasses, four publicly-traded corporations (AAC II, ACRE, ARCC and ARDC), two non-traded REITs (AIREIT and AREIT) and a non-traded BDC (ASIF). ACRE, ARDC and ARCC do not have redemption provisions or a requirement to return capital to investors upon exiting the investments made with such capital, except as required by applicable law (including distribution requirements that must be met to maintain RICregulated investment company (“RIC”) or REIT status). However, ACRE’s charter includes certain limitations relating to the ownership or purported transfer of its common stock in violation of the REIT ownership requirements. In addition, Class A ordinary shares issued by AAC II are redeemable for cash by the public shareholders in the event that AAC II does not complete a business combination or tender offer associated with stockholder approval provisions.
Our funds are generally advised by Ares Management LLC, which is registered under the Investment Advisers Act of 1940, as amended (the “Investment Advisers Act”) or, a wholly owned subsidiary thereof.thereof or subsidiary controlled by AMC. Responsibility for the day-to-day operations of each investment vehicle is typically delegated to the Ares entity serving as investment adviser pursuant to an investment advisory, management or similar agreement. Generally, the material terms of our
investment advisory agreements relate to the scope of services to be rendered by the investment adviser to the applicable vehicle, the calculation of management fees to be borne by investors in our investment vehicles and certain rights of termination with respect to our investment advisory agreements. With the exception of certain of the publicly tradedpublicly-traded investment vehicles, the investment vehicles themselves do not generally register as investment companies under the Investment Company Act of 1940, as amended (the “Investment Company Act”), in reliance on applicable exemptions thereunder.
The governing agreements of many of our funds provide that, subject to certain conditions, third-party investors in those funds have the right to terminate the investment period or the fund without cause. The governing agreements of some of our funds provide that, subject to certain conditions, third-party investors have the right to remove the general partner. In addition, the governing agreements of certain of our funds provide that upon the occurrence of certain events, including in the event that certain “key persons” in our funds depart the firm, do not meet specified time commitments or engage in bad acts, the investment period will be suspended or the investors have the right to vote to terminate the investment period in accordance with specified procedures. Such events may include certain “key persons” in our funds that engage in bad acts or depart the firm.
Fee Structure
Management Fees
The investment adviser of our funds generally receive an annual management fee based on a percentage of the fund’s capital commitments, contributed capital, net asset value or invested capital during the investment period and based on invested capital after the investment period, and for certain of our SMAs, we receive an annual management fee based on a percentage of invested capital, contributed capital or net asset value throughout the term of the SMA. We also may receive special fees, including commitment, arrangement, underwriting, agency, portfolio management, monitoring and other similar fees, some of which may be accelerated upon a sale of the underlying portfolio investment. In certain circumstances we are contractually required to offset certain amounts of such special fees against future management fees relating to the applicable fund. In addition, we may receive transaction fees from certain affiliated funds for activities related to fund transactions, such as loan originations.
The investment adviser of each of our CLOs typically receives annual management fees based on the gross aggregate collateral balance for CLOs, at par, adjusted for defaulted or discounted collateral. The management fees of CLOs accounted for approximately 3% of our total management fees on a consolidated basis and 7% on an unconsolidated basis for the year ended December 31, 2020.
The management fees we receive from our drawdown style funds are typically payable on a quarterly basis over the life of the fund and do not fluctuate with the changes in investment performance of the fund. The investment management agreements we enter into with clients in connection with contractual SMAs may generally be terminated by such clients with reasonably short prior written notice. The management fees we receive from our SMAs are generally paid on a periodic basis (typically quarterly, subject to the termination rights described above) and are based on either invested capital or on the net asset value of the separately managed account.
We receive management fees in accordance with the investment advisory and management agreements we have with the publicly traded vehicles we manage. Base management fees we receive from ARCC are paid quarterly and proportionately increase or decrease based on ARCC’s total assets (reduced by cash and cash equivalents). ARCC Part I Fees are also generally paid quarterly and proportionately increase or decrease based on ARCC’s net investment income (before ARCC Part I Fees and ARCC Part II Fees (as defined inSee “Item 7. Management’s Discussion and Analysis of Financial Condition and Results of
Operations—Components of Consolidated Results of Operations—Revenues”)), subject to a fixed hurdle rate. We classify ARCC Part I Fees as management fees as they are predictable and recurring in nature, and not subject to contingent repayment. Management fees we receive from ARDC are generally paid monthly and proportionately increase or decrease based on the closed-end fund's total assets minus liabilities (other than liabilities relating to indebtedness). Management fees we receive from ACRE are generally paid quarterly based on ACRE’s stockholders’ equity. Our investment management agreementsOperations” for an overview of our permanent capital vehicles must be reviewed or approved annually by their boards of directors (including a majority of its independent directors).
Performance Income
We may receive performance income from our funds that may be either anfee structure, including management fee, incentive fee or a special allocation of income, which we refer to as carried interest. Performance income is recorded by us when specified investment returns are achieved by the fund. We typically award certain of our professionals with participation in such performance income.
Incentive Fees
The general partners, managers or similar entities of certain of our funds receive performance-based fees. These fees are generally based on the net appreciation per annum of the applicable fund, subject to certain net loss carry-forward provisions, high-watermarks and/or preferred returns. Such performance based fees may also be based on a fund’s cumulative net appreciation to date, in some cases subject to a high-watermark or a preferred return. Incentive fees are realized at the end of a measurement period, typically quarterly or annually. Realized incentive fees are generally higher during the second half of the year due to the nature of certain Credit Group funds that typically realize incentive fees at the end of the calendar year. Once realized, such performance based fees are generally not subject to repayment. Cash from the realizations is typically received in the period subsequent to the measurement period.
Incentive Fees from Publicly TradedVehicles
We are entitled to receive incentive fees in accordance with the investment advisory and management agreements we have with ARCC and ACRE. We may receive ARCC Part II Fees, which are not paid unless ARCC achieves cumulative aggregate realized capital gains (net of cumulative aggregate realized capital losses and aggregate unrealized capital depreciation). Incentive fees we receive from ACRE are based on a percentage of the difference between ACRE’s core earnings (as defined in ACRE’s management agreement) and an amount derived from the weighted average issue price per share of ACRE’s common stock in its public offerings multiplied by the weighted average number of shares of ACRE's common stock outstanding.
Carried Interest
The general partner or an affiliate of certain of our funds may be entitled to receive carried interest from a fund. Carried interest entitles the general partner (or an affiliate) to a special allocation of income and gains from a fund, and is typically structured as a net profits interest in the applicable fund. Carried interest is generally calculated on a “realized gain” basis, and the general partner of a fund is generally entitled to a carried interest between 10% and 20% of the net realized income and gains (generally taking into account unrealized losses) generated by such fund. Net realized income or loss is not netted between or amongarrangements with our funds.
Funds generally follow either an American-style waterfall or European-style waterfall. For American-style waterfalls, the general partner is entitled to receive carried interest after a fund investment is realized if the investors in the fund have received distributions in excess of the capital contributed for such investment and all prior realized investments (plus allocable expenses), as well as the preferred return. For European-style waterfalls, the general partner is entitled to receive carried interest if the investors in the fund have received distributions in an amount equal to all prior capital contributions plus a preferred return.
For most funds, the carried interest is subject to a preferred return ranging from 5% to 8%, subject in most cases to a catch-up allocation to the general partner. Generally, if at the termination of a fund (and in some cases at interim points in the life of a fund), the fund has not achieved investment returns that exceed the preferred return threshold or the general partner receives net profits over the life of the fund in excess of its allocable share under the applicable partnership agreement, the general partner will be obligated to repay an amount equal to the extent the previously distributed carried interest exceeds the amounts to which the general partner is entitled. These repayment obligations may be related to amounts previously distributed to us and our senior professionals and are generally referred to as contingent repayment obligations.
Although a portion of any dividends paid by us may include carried interest received by us, we do not intend to seek fulfillment of any contingent repayment obligation by seeking to have holders of our Class A common stock return any portion of such dividends attributable to carried interest associated with any contingent repayment obligation. Contingent repayment obligations operate with respect to only a given fund’s net investment performance and carried interest of other funds are not netted for determining this contingent obligation. Although a contingent repayment obligation is several to each person who received a distribution, and not a joint obligation, and our professionals who receive carried interest have guaranteed repayment of such contingent obligation, the governing agreements of our funds generally provide that, if a recipient does not fund his or her respective share, we may have to fund such additional amounts beyond the amount of carried interest we retained, although we generally will retain the right to pursue remedies against those carried interest recipients who fail to fund their obligations.
Certain funds may make distributions to their partners to provide them with cash sufficient to pay applicable federal, state and local tax liabilities attributable to the fund's income that is allocated to them. These distributions are referred to as tax distributions and are not subject to contingent repayment obligations.
For additional information concerning the contingent repayment obligations we could face, see “Item 1A. Risk Factors— We may need to pay “clawback” or “contingent repayment” obligations if and when they are triggered under the governing agreements with our funds.”
Capital Invested In and Through Our Funds
To further align our interests with those of investors in our funds, we have invested the firm’s capital and that of our professionals in the funds we sponsor and manage. General partner capital commitments to our funds are determined separately with respect to our funds and, generally, are less than 5% of the total commitments of any particular fund. We determine the general partner capital commitments based on a variety of factors, including regulatory requirements, investor requirements, estimates regarding liquidity over the estimated time period during which commitments will be funded, estimates regarding the amounts of capital that may be appropriate for other opportunities or other funds we may be in the process of raising or are considering raising, prevailing industry standards with respect to sponsor commitments and our general working capital requirements. Our general partner capital commitments are typically funded with cash and not with carried interest or deferral of management fees. We generally offer a portion of the general partner commitments to our eligible professionals in accordance with the Investment Company Act. Our general partnerAres employees had capital commitments are typically funded with cash and not with carried interest or deferral of management fees.$2.4 billion in Ares-managed funds as of December 31, 2023. For more information, see “Item 7. Management’s Discussion and Analysis of Financial Condition and Results of Operations—Liquidity and Capital Resources—Sources and Uses of Liquidity.”
Regulatory and Compliance Matters
Our businesses, as well as the financial services industry, generally are subject to extensive regulation, including periodic examinations, by governmental agencies and self-regulatory organizations or exchanges in the U.S. and foreign jurisdictions in which we operate relating to, among other things, antitrust laws, anti-money laundering laws, anti-bribery laws relating to foreign officials, tax laws and data privacy laws with respect to client and other information, and some of our funds invest in businesses that operate in highly regulated industries. Each of the regulatory bodies with jurisdiction over us has regulatory powers dealing with many aspects of financial services, including the authority to grant, and in specific circumstances to cancel, permissions to carry on particular activities. Any failure to comply with these rules and regulations could expose us to liability and/or reputational damage. Additional legislation, increasing global regulatory oversight of fundraising activities, changes in rules promulgated by self-regulatory organizations or exchanges or changes in the laws or rules, or interpretation or enforcement of existing laws and rules, either in the United StatesU.S. or elsewhere, may directly affect our mode of operation and profitability. See “Item 1A. Risk Factors-RisksFactors—Risks Related to Regulation-Extensive regulation affects our activities, increases the cost of doing business and creates the potential for significant liabilities and penalties that could adversely affect our businesses and results of operations,Regulation.” “-Failure to comply with “pay to play” regulations implemented by the SEC and certain states, and changes to the “pay to play” regulatory regimes, could adversely affect our businesses,” and “-Regulatory changes in jurisdictions outside the United States could adversely affect our businesses,” “-Adverse incidents with respect to ESG activities could impact our or our portfolio companies’ reputation, the cost of our or their operations, or result in investors ceasing to allocate their capital to us, all of which could adversely affect our business and results of operations,” and “-Regulations governing ARCC’s operation as a business development company affects its ability to raise, and the way in which it raises, additional capital.”
Rigorous legal and compliance analysis of our businesses and investments is important to our culture. We strive to maintain a culture of compliance through the use of policies and procedures such as oversight compliance, codes of ethics, compliance systems, communication of compliance guidance and employee education and training. All employees must annually certify their understanding of, and compliance with and adherence to key global Ares policies, procedures and code of ethics. We havemaintain a compliance group, supervised by our Chief Compliance Officer, that monitorsis responsible for monitoring our compliance with the regulatory and legal requirements to which we are subject and managesmanaging our compliance policies and procedures. Our Chief Compliance Officer supervises our compliance group, which is responsible for
monitoring all regulatory and compliance matters that affect our activities. Our compliance policies and procedures seek to address a variety of regulatory and compliance risks such as the handling of material non-public information, position reporting, personal securities trading, valuation of investments on a fund-specific basis, document retention, potential conflicts of interest and the allocation of investment opportunities.
Many jurisdictions in which we operate have laws and regulations relating to data privacy, cybersecurity and protection of personal information, including the General Data Protection Regulation which expands data protection rules for(“GDPR”), a European Union (“EU”) regulation designed to protect privacy rights of individuals withinresiding in the European Economic Area (the “EEA”), the GDPR as it forms part of the laws of England and Wales, Scotland and Northern Ireland by virtue of Section 3 of the European Union Withdrawal Act 2018 (as amended) and the Data Protection Act 2018 (collectively, “U.K. GDPR”) with respect to individuals residing in the United Kingdom (the “EU”“U.K.”), and for personal data exported outsidevarious state and federal privacy laws applicable to individuals residing in the EU, andU.S., including the California Consumer Privacy Act which creates new rights(the “CCPA”), as amended by the California Privacy Rights Act. Other comprehensive privacy laws have been enacted or passed in numerous U.S. states, including Colorado, Connecticut, Delaware, Indiana, Iowa, Montana, New Jersey, Oregon, Tennessee, Texas, Utah and obligations relatedVirginia. Various global privacy laws also apply to personal data of residents (and households)our business, including those in California.Australia, the Cayman Islands, Hong Kong, India, Korea, Japan, Dubai and Singapore. These privacy laws are quickly evolving and may conflict with one another. Any determination of a failure to comply with any such laws or regulations could result in substantial fines, penalties and/or sanctions, litigation, as well as reputational harm. Moreover, to the extent that these laws and regulations or the enforcement of the same become more stringent, or if new laws or regulations or enacted, our financial performance or plans for growth may be adversely impacted.
United StatesU.S.
The SEC oversees the activities of our subsidiaries that are registered investment advisers under the Investment Advisers Act. The Financial Industry Regulatory Authority (“FINRA”) and the SEC oversee the activities of our wholly owned subsidiarysubsidiaries, AWMS and Ares Management Capital Markets LLC (formerly known as Ares Investor Services LLCLLC) (“AIS LLC”AMCM”), as a registered broker-dealer. In connection with certain investments made by funds in our Private Equity Group, certain of our subsidiaries and funds are subject to audits by the Defense Security Service to determine whether we are under foreign ownership, control or influence.broker-dealers. In addition, we regularly rely on exemptions from various requirements of the Securities Act, of 1933, as amended (the “Securities Act”), the Securities Exchange Act, of 1934, as amended (the “Exchange Act”), the Investment Company Act, the Commodity Exchange Act and the U.S. Employee Retirement Income Security Act of 1974, as amended (“ERISA”). These exemptions are sometimes highly complex and may in certain circumstances depend on compliance by third parties who we do not control.
Additionally, the SEC and various self-regulatory organizations have in recent years increased their regulatory activities in respect of investment management firms. See “Item 1A. Risk Factors-RisksFactors—Risks Related to Regulation- Regulation—Extensive regulation affects our activities, increases the cost of doing business and creates the potential for significant liabilities and penalties that could adversely affect our businesses and results of operations.” EffectiveSince September 2019, the SEC adopted a rule that requires a broker-dealer,has required broker-dealers, or a natural personpersons who is anare associated personpersons of a broker-dealer,broker-dealers, to act in the best interest of a retail customer when making a recommendation of any securities transaction or investment strategy involving securities, without placing the financial or other interest of the broker, dealer or natural person who is an associated person of a broker-dealer making the recommendation ahead of the interest of the retail customer.customer (“Regulation Best Interest”). Regulation Best Interest requires broker-dealers to evaluate available alternatives, including those that may have lower expenses and/or lower investment risk than our investment funds. The term “retail customer” is defined as a natural person who uses such a recommendation primarily for personal, family or household purposes, without reference to investor sophistication or net worth. The “best interest” standard would beis satisfied through compliance with certain disclosure, duty of care, conflict of interest mitigation and compliance obligations. WhileUnder Regulation Best Interest, high cost, high risk and complex products may be subject to greater scrutiny by broker-dealers and their salespersons. The full impact of Regulation Best Interest and state fiduciary standards on broker-dealers cannot be determined at this time. However, it may negatively impact whether broker-dealers and their associated persons are willing to recommend investment products, including our funds, to retail customers, which may adversely impact our ability to distribute our products to certain investors. As such, Regulation Best Interest may reduce the rule has been challenged by litigation, full implementation beganability of our funds to raise capital, which would adversely affect our business and results of operations. In addition, the U.S. Department of Labor as well as several states have proposed regulations or taken other actions pertaining to conduct standards for investment advisers and broker-dealers that may result in June 2020, and compliance with the rule will likely impose additional costs to us, in particular with respectregulatory requirements related to our product offerings and investment platforms that include retail investors.business.
Funds and Portfolio Companies of our Funds
All of our funds are advised by SEC registered investment advisers (or wholly owned subsidiaries thereof). Registered investment advisers are subject to more stringent requirements and regulations under the Investment Advisers Act than unregistered investment advisers. Such requirements relate to, among other things, fiduciary duties to clients, maintaining an effective compliance program, managing conflicts of interest and general anti-fraud prohibitions. In addition, the SEC requires investment advisers registered or required to register with the SEC under the Investment Advisers Act that advise one or more private funds and have at least $150 million in private fund assets under management to periodically file reports on Form PF. We have filed, and will continue to file, quarterly reports on Form PF, which has resulted in increased administrative costs and a significant amount of attention and time to be spent by our personnel.
Further, The SEC adopted changes to Form PF in 2023, which, among other requirements, requires current reporting upon the occurrence of certain fund-level events. In 2024, the SEC has highlighted valuation practicesand the Commodity Futures Trading Commission (the “CFTC”) adopted joint amendments to Form PF that will require additional basic information about advisers and the private funds they advise, including identifying information, assets under management,
withdrawal and redemption rights, gross asset value and net asset value, inflows and outflows, base currency, borrowings and types of creditors, fair value hierarchy, beneficial ownership and fund performance, as one of its areas of focus in investment adviser examinationswell as additional specific information regarding funds that must report as hedge funds on the form. These amendments will likely increase related administrative costs and has instituted enforcement actions against advisers for misleading investors about valuation. If the SEC were to investigate and find errors in our methodologies or procedures, we and/or members of our management could be subject to penalties and fines, which could harm our reputation and our business, financial condition and results of operations could be materially and adversely affected.
ARCC is aand ASIF are registered investment companycompanies that hashave each elected to be treated as a business development company under the Investment Company Act. APMF, ARDC and certain other fundsCADC are registered investment companies under the Investment Company Act. Each of the registered investment companies has elected, for U.S. federal tax purposes, to be treated as a regulated
investment company (“RIC”)RIC under Subchapter M of the U.S. Internal Revenue Code of 1986, as amended (the “Code”). To maintain its RIC status under the Code, a RIC must timely distribute an amount equal to at least 90% of its investment company taxable income (as defined by the Code, which generally includes net ordinary income and net short term capital gains) to its stockholders. In addition, a RIC generally will be required to pay an excise tax equal to 4% on certain undistributed taxable income unless it distributes in a timely manner an amount at least equal to the sum ofof: (i) 98% of its ordinary income recognized during a calendar year andyear; (ii) 98.2% of its capital gain net income, as defined by the Code, recognized during the one-year period ending on October 31 of the calendar yearyear; and (iii) any income recognized, but not distributed, in preceding years. The taxable income on which a RIC pays excise tax is generally distributed to its stockholders in the next tax year. Depending on the level of taxable income earned in a tax year, a RIC may choose to carry forward such taxable income for distribution in the following year, and pay any applicable excise tax. In addition, as a business development company,companies, ARCC and ASIF must not acquire any assets other than “qualifying assets” specified in the Investment Company Act unless, at the time the acquisition is made, at least 70% of ARCC’sARCC and ASIF’s respective total assets are qualifying assets (with certain limited exceptions). Qualifying assets include investments in “eligible portfolio companies.” ARCC isand ASIF are also generally prohibited from issuing and selling its common stock at a price below net asset value per share and from incurring indebtedness (including for this purpose, preferred stock), if ARCC’sARCC and ASIF’s respective asset coverage, as calculated pursuant to the Investment Company Act, equals less than 150% after such incurrence.
ACRE, hasAREIT and AIREIT have each elected and qualified to be taxed as a real estate investment trust, or REIT, under the Code. To maintain its qualification as a REIT, ACREeach must distribute at least 90% of its taxable income to its stockholders and meet, on a continuing basis, certain other complex requirements under the Code.
AIS LLC,AWMS and AMCM, our wholly owned subsidiary, issubsidiaries, are registered as a broker-dealerbroker-dealers with the SEC, which maintainsmaintain licenses in many states, and is a memberare members of FINRA. As a broker-dealer, thiseach subsidiary is subject to regulation and oversight by the SEC and state securities regulators. In addition, FINRA a self-regulatory organization that is subject to oversight by the SEC, promulgates and enforces rules governing the conduct of, and examines the activities of, its member firms. Due to the limited authority granted to each of our subsidiarysubsidiaries in its capacity as a broker-dealer, it isbroker-dealers, they are not required to comply with certain regulations covering trade practices among broker-dealers and the use and safekeeping of customers’ funds and securities. As a registered broker-dealerbroker-dealers and membermembers of a self-regulatory organization, AIS LLC is,AWMS and AMCM are, however, subject to the SEC’s uniform net capital rule. Rule 15c3-1 of the Exchange Act, which specifies the minimum level of net capital a broker-dealer must maintain and also requires that a significant part of a broker-dealer’s assets be kept in relatively liquid form. See “Item 1A. Risk Factors-RisksFactors—Risks Related to Our Businesses-PoliticalBusinesses—Political and regulatory conditions, including the effects of negative publicity surrounding the financial industry in general and proposed legislation, could adversely affect our businesses.”
Other Jurisdictions
Certain of our subsidiaries operate outside the United States.U.S. In Luxembourg, Ares Management Luxembourg (“AM Lux”) is subject to authorization and regulation by the Commission de Surveillance du Secteur Financier (“CSSF”). In the United Kingdom (the “U.K.”)U.K., Ares Management Limited (“AML”) and Ares Management UKU.K. Limited (“AMUKL”) are subject to regulation and authorization by the U.K. Financial Conduct Authority (“the FCA”(the “FCA”). Ares European Loan Management LLP (“AELM”), which is not a subsidiary, but in which we are indirectly invested and which procures certain services from AML, is also subject to regulation by the FCA. In some circumstances, AML, AMUKL, AELM (the “U.K. Regulated Entities”) and other Ares entities are or may become subject to U.K. or EU laws, for instance in relation to marketing our funds to investors in the European Economic Area (the “EEA”).EEA.
The U.K. exited the EU on January 31, 2020. The withdrawal agreement between the U.K. and the EUwhich provided for a transitional period to allow for the terms of the U.K.'s’s future relationship with the EU to be negotiated, which ended on December 31, 2020. EEA passporting rights are no longer available to the relevant U.K. entities following the end of the transitional period. Various EU laws have beenwere “on-shored” into domestic U.K. legislation and certain transitional regimes and deficiency-correction powers exist to ease the transition. The U.K. and the EU announced, on December 24, 2020, that they have reached agreement on a new Trade and Cooperation Agreement (the “TCA”), which addresses the future relationship between the parties.U.K. and the EU formally came into force on May 1, 2021 and since its effectiveness, the TCA has governed certain matters between the U.K. and the EU. In addition, the Temporary Marketing Permission Regime (the “TMPR”) allows our alternative investment fund managers (“AIFMs”) to continue to market those funds in the U.K. that were in existence on December 31, 2020, on broadly the same terms as previously applied. Unless extended, the TMPR lasts until December 31, 2025. Any marketing of a new fund coming into
existence after December 31, 2020 must comply with the U.K.’s national private placement regime. Notwithstanding the TCA and the TMPR, there remains considerable uncertainty as to the nature of the U.K.’s future relationship with the EU, (particularly in the sphere of financial services), creating continuing uncertainty as to the full extent to which the businesses of the U.K. Regulated Entities and our businesses generally could be adversely affected by Brexit. See “Item 1A. Risk Factors-RisksFactors—Risks Related to Our Businesses-TheRegulation—The U.K.’s exit from the EU (“Brexit”) could adversely affect our business and our operations.” Despite the U.K.’s departure from the EU, new and existing EU legislation is expected to continue to impact our business in the U.K. (whether because its effect is preserved in the U.K. as a matter of domestic policy or because compliance with such legislation (whether in whole or part) is a necessary condition for market access into the EEA) and other EEA member states where we have operations. The U.K.'s’s departure has the potential to change the U.K. legislative and regulatory frameworks within which AML, AMUKL and AELMthe U.K. Regulated Entities operate, which could adversely affect our businesses or cause a material increase in our tax liability.
AMUKL, AM Lux AML and AELM (the “European Entities”) all operate withinoperates under the EU legislative frameworks, which include legislation that is both directly applicable to the European Entities and legislation that must be implemented by EEA member states at a national level.frameworks. Notwithstanding the U.K.'s’s withdrawal from the EU, AML, AMUKL and AELM as UK-based firmsthe U.K. Regulated Entities generally continue to be regulated under European legislativethese frameworks as such frameworks have beento the extent they were preserved in UK law as a matter of policy (subject to amendments to operate properly in a post-Brexit context). When implementing EU measures at a national level, member states often have some degree of discretion as to the manner of implementation, and as a result the rules in some areas are not harmonized across the EEA. In addition, member states may have their own national laws and rules governing the operation of firms in the financial sector which are unrelated to any European legislative initiative.U.K. law. In some circumstances other Ares entities are or may become subject to EU laws or the law of EEA member states, including with respect to marketing our funds to investors in the EEA.
AM Lux and AMUKL are both alternative investment fund managers (“AIFMs”).AIFMs. Their operations are primarily governed by Directive 2011/61/EU on Alternative Investment Fund Managers and other associated legislation, rules and guidance (“AIFMD” or the “Directive”). The U.K. implemented AIFMD while it was still a member of the EU and similar requirements therefore continue to apply in the U.K. notwithstanding Brexit. The AIFMD imposes significant regulatory requirements on AIFMs established in the EEA. AIFMD regulates fund managers by, amongst other things, prescribing authorization conditions for an AIFM, restricting the activities that can be undertaken by an AIFM and prescribing the organizational requirements, operating conditions, and regulatory standards relating to such things as initial capital, remuneration, conflicts, risk management, leverage, liquidity management, delegation of duties, transparency and reporting requirement, etc. The European Commission is currently reviewingrequirements.
In the EU (but not the U.K.), AIFMD and launched a public consultation in October 2020 on potential improvements to the regulatory framework. This is expected to resultbe amended in new legislation, possibly in 2021 (commonly2024. On November 10, 2023, the European Commission published a near-final amending directive, commonly referred to as “AIFMD II”). Assuming AIFMD II is adopted promptly and published in the Official Journal without delay in 2024, most of the changes will become effective in 2026, subject to the grandfathering period for certain of the loan origination provisions and certain Annex IV disclosure requirements which will become effective a year later. It is unclear at this stage whether and hownot yet clear to what extent (if any) the U.K. will seek to reflect AIFMD II will affect us or our subsidiaries.
AML and AELM are both investment firms within the meaning of Directive 2014/65/EU on Markets in Financial Instruments (“MiFID II”). The operations of AML and AELM are primarily governed by UK laws and regulatoryNotwithstanding Brexit, the U.K.’s rules implementing MiFID II continue to have effect and the accompanying Markets in Financial Instruments Regulation 600/2014/EU (“MiFIR”) has been on-shored into U.K. law in connection with this withdrawal. The operations of AML and AELM are primarily governed by U.K. laws and regulatory rules implementing MiFID II, MiFIR and other associated legislation, rules and guidance. AMUKL is subject to certain provisions of U.K.-retained MiFID II because it has top-up permissions to provide certain U.K.-retained MiFID investment services. AM Lux is subject to certain provisions of EU MiFID II because it has top-up permissions to provide certain MIFID investment services. The main business of AM Lux and the EuropeanU.K. Regulated Entities is to provide asset management services to clients from within the EEA. The European Entities operate primarily within different regulatory frameworks in part because they provide different services to different types of clients.
MiFID II and MiFIR extended the Markets and Financial Instruments Directive (“MiFID”) requirements in a number of areas and require investment firms to comply with more prescriptive and onerous obligations in relationwith respect to such things as: costs and charges disclosure, product design and governance, the receipt and payment of inducements, the receipt of and payment for investment research, suitability and appropriateness assessments, conflicts of interest, record-keeping, best execution, transaction and trade reporting, remuneration, training and competence and corporate governance. Although the UK has now withdrawn fromCertain aspects of MIFID II and MiFIR are subject to review and change in both the EU its rules implementing MiFID II continue to have effect and MiFIR has been on-shored into UK law (subject to certain amendments to ensure it operates properly inthe U.K.
Effective January 1, 2022, the U.K. introduced a UK-specific context) in connection with this withdrawal.
The UK is introducing a new prudential regulatory framework for UKU.K. investment firms (the “Investment Firm Prudential Regime” or “IFPR”), which will be closely based on an equivalent regulatory framework being introduced at EU level through the EU Investment Firm Regulation. IFPR applies to AML and Investment Firm Directive. IFPR is expected to take effect from January 1, 2022 and will apply to Ares Management Limited and Ares European Loan Management LLPAELM as U.K. MiFID investment firms. The extentfirms as well as to which the IFPR will apply to Ares Management UK Limited,AMUKL, as a U.K. AIFM with a MiFID “top-up” permission, is as yet unclearpermissions. Under IFPR, among other requirements, AML, AMUKL and further clarity on this point is expectedAELM are required to emerge in future FCA consultationsmaintain more onerous policies regarding remuneration of staff, to set an appropriate ratio between the variable and fixed components of total remuneration and to meet requirements on the structure of variable remuneration. AML and AMUKL are considered to be part of the same “prudential consolidation group”, and many of the requirements of IFPR (including but not limited to capital, liquidity and remuneration) apply at the consolidated group level. Under IFPR, each of AML, AMUKL and AELM have made public disclosures on their websites in relation to their: (i) own funds, own funds requirements and governance structures; (ii) risk management; and (iii) remuneration. The new regime. This new prudential public disclosure requirements mandate more detail, including quantitative information on remuneration paid to staff, split in between classes of employees, and confirmation of the highest severance payment awarded to an individual material risk taker. The requirements of this
regime is expectedmay lead to resultadditional operational and compliance complexity in the short to medium term and possibly higher regulatory capital requirements for somethe affected firmsfirms.
The U.K. has introduced an important and new, more onerous remuneration rules, as well as re-cut and extended internal governance, disclosure, reporting, liquidity, and group “prudential” consolidation requirements (among other things).
Our operations and our investment activities worldwide are subject to a variety of regulatory regimes that vary by country. These include operating subsidiaries of Ares SSG Capital Management Asia (Holdings) Limited, which isare subject to regulation by various regulatory authorities, including the Securities and Futures Commission of Hong Kong and Monetary Authority of Singapore. In addition, as the ultimate parent of the controlling entity of Aspida Life Re, Ltd, a Bermuda Class E insurance company, we are considered its “shareholder controller” (as defined in the Bermuda Insurance Act) by the Bermuda Monetary Authority.Authority (the “BMA”).
Competition
The investment management industry is intensely competitive, and we expect it to remain so. We compete globally and on a regional, industry and asset basis.
We face competition both in the pursuit of fund investors and investment opportunities. Generally, our competition varies across business lines, geographies and financial markets. We compete for outside investors based on a variety of factors, including investment performance, investor perception of investment managers’ drive, focus and alignment of interest, quality of service provided to and duration of relationship with investors, breadth of our product offering, business reputation and the level of fees and expenses charged for services. We compete for investment opportunities both at our funds and for strategic acquisitions by us based on a variety of factors, including breadth of market coverage and relationships, access to capital, transaction execution skills, the range of products and services offered, innovation and price, and we expect that competition will continue to increase.price.
We expect to face competition in our direct lending, trading, acquisitions and other investment activities primarily from traditional asset managers, business development companies, credit and real estate funds, specialized funds, hedge fund sponsors,investment managers and other financial institutions, private equity funds, corporate buyers and other parties.we expect that competition will continue to increase. Many of these competitors in some of our businesses are substantially larger and have considerably greater financial, technical and marketing resources than are available to us. Many of these competitors have similar investment objectives to us, which may create additional competition for investment opportunities. Some of these competitors may also have a lower cost of capital and access to funding sources that are not available to us, which may create competitive disadvantages for us with respect to investment opportunities. In addition, some of these competitors may have higher risk tolerances, different risk assessments or lower return thresholds, which could allow them to consider a wider variety of investments and to bid more aggressively than us for investments that we want to make. Corporate buyers may be able to achieve synergistic cost savings with regard to an investment that may provide them with a competitive advantage in bidding for an investment. Lastly, institutional and individual investors are allocating increasing amounts of capital to alternative investment strategies. Several large institutional investors have announced a desire to consolidate their investments in a more limited number of managers. We expect that this will cause competition in our industry to intensify and could lead to a reduction in the size and duration of pricing inefficiencies that many of our funds seek to exploit.
Competition is also intense for the attraction and retention of qualified employees. Our ability to continue to compete effectively in our businesses will depend upon our ability to attract new employees and retain and motivate our existing employees.
For additional information concerning the competitive risks that we face, see “Item 1A. Risk Factors—Risks Related to Our Businesses—The investment management business is intensely competitive.”
Available Information
Ares Management Corporation is a Delaware corporation. Our principal executive offices are located at 2000 Avenue of the Stars, 12th Floor, Los Angeles, California 90067, and our telephone number is (310) 201-4100.
Our201-4100 and our website address is http://www.aresmgmt.com. Information on our website is not a part of this report and is not incorporated by reference herein. We make available free of charge on our website or provide a link on our website to our Annual Report on Form 10-K, Quarterly Reports on Form 10-Q, Current Reports on Form 8-K, proxy statements and any amendments to those reports filed or furnished pursuant to Section 13(a) or 15(d) of the Exchange Act, as soon as reasonably practicable after those reports are electronically filed with, or furnished to, the SEC. To access these filings, go to the “Investor Resources” section of our website and then click on “SEC Filings.” In addition, these reports and the other documents we file with the SEC are available at a website maintained by the SEC at http://www.sec.gov.
Item 1A. Risk Factors
Risk Factor Summary
Our businesses are subject to a number of inherent risks. We believe that the primary risks affecting our businesses and an investment in shares of our Class A common stock:stock are:
•we are subject to risks related to COVID-19 and measures taken to mitigate its impact and spread, which have affected and may continue to affect various aspects of our and our funds’ businesses;
•challengingdifficult market and political conditions may adversely affect our businesses in the United States and globally may reducemany ways, including by reducing the value or hamperhampering the performance of the investments made by us and our funds or impairreducing the ability of our funds to raise or deploy capital;
•we operate in a complex regulatory and tax environment involving rules and regulations (both domestic and foreign), some of which are outdated relative to today’s global financial activities and some of which are subject to political influence, which could restrict or require us to adjust our operations or the operations of our funds or portfolio companies and subject us to increased compliance costs and administrative burdens, as well as restrictions on our business activities;
•if we are unable to raise capital from investors or deploy capital into investments, or if any of our management fees are waived or reduced, or if we fail to realize investments and generate performance income,carried interest or incentive fees, our revenues and cash flows would be materially reduced;
•we are subject to risks related to our dependencydependence on our members of the Executive Management Committee, senior professionals and other key personnel as well as attracting, and retaining and developing human capital in a highly competitive talent market;
•we may experience reputational harm if we fail to appropriately address conflicts of interest or if we, our employees, our funds or ourtheir portfolio companies fail (or are alleged to have failed) to comply with applicable regulations in an increasingly complex political and regulatory environment;
•we face intense competition in the investment management business;
•our growth strategy contemplates acquisitions and entering new lines of business and expanding into new investment strategies, geographic markets and businesses, which subject us to numerous risks, expenses and uncertainties, including related to the integration of development opportunities, acquisitions or joint ventures;
•we derive a significant portion of our management fees from ARCC;
•economic U.S. and foreign sanction laws may prohibit us and our affiliates from transacting with certain countries, individuals and companies;
•our international operations subject us to numerous regulatory, operational and operationalreputational risks and expenses;
•we are subject to operational risks and risks in using prime brokers, custodians, counterparties, administrators and other agents;
•the increasing demands of fund investors, including the potential for fee compression and changes to other terms, could materially adversely affect our future revenues;
•we and our third-party service providers may be subject to cybersecurity risks and our business could be adversely affected by changes to data protection regulation;laws and regulations;
•we may be subject to litigation and reputational risks and related liabilities or risks related to employee misconduct, fraud and other deceptive practices;
•the use of leverage by us and our funds exposes us to substantial risks, including related to changes to the method of determining LIBOR or the selection of a replacement for LIBOR;London Interbank Offered Rate (“LIBOR”);
•asset valuation methodologies can be highly subjective and the value of assets may not be realized;
•our funds may perform poorly due to market conditions, political actions or environments, monetary and fiscal policy or other conditions beyond our control;
•third-party investors in our funds may not satisfy their contractual obligation to fund capital calls;
•we are subject to risks relating to our contractual rights and obligations under our funds’ governing documents and investment management agreements;
•a downturn in the global credit markets could adversely affect our CLO investments;
•due to our and our funds’ investments in certain market sectors, such as power, infrastructure and energy, real estate and insurance, we are subject to risks and regulations inherent to those industries;
•if we were deemed to be an “investment company” under the Investment Company Act, applicable restrictions could make it impractical for us to continue our businesses as contemplated;
•due to the Holdco Members ownership and control of our shares of common stock, holders of our Class A common stock will generally have no influence over matters on which holders of our common stock vote and limited ability to influence decisions regarding our business;
•we are subject to risks related to our categorization as a “controlled company” within the meaning of the NYSE listing standards;
•potential conflicts of interest may arise among the holders of Class B and Class C common stock and the holders of our Class A common stock and preferred stock;
•our holding company structure, Delaware law and contractual restrictions may limit our ability to pay dividenddividends to the holders of our Class A and non-voting common stock and our dividends are non-cumulative;
•other anti-takeover provisions in our charter documents could delay or prevent a change in control;
•we are subject to risks related to our tax receivable agreement; andagreement (the “TRA”).
•limitations on the amount of interest expense that we may deduct could materially increase our tax liability and negatively affect an investment in shares of our Class A common stock.
Risks Related to Our Businesses
The COVID-19 pandemic has caused severe disruptions in the U.S. and global economy, has disrupted, and may continue to disrupt, industries in which we, our funds and our funds’ portfolio companies operate and could potentially negatively impact us, our funds or our funds’ portfolio companies.
Over the past year, the COVID-19 pandemic has resulted in a global and national health crisis, adversely impacted global commercial activity and contributed to significant volatility in equity and debt markets. Many countries and states in the United States, including those in which we, our funds’ and our funds’ portfolio companies operate, issued (and continue to re-issue) orders requiring the closure of, or certain restrictions on the operation of, nonessential businesses and/or requiring residents to stay at home. The COVID-19 pandemic and preventative measures taken to contain or mitigate its spread have caused, and are continuing to cause, business shutdowns or the re-introduction of business shutdowns, cancellations of events and restrictions on travel, significant reductions in demand for certain goods and services, reductions in business activity and financial transactions, supply chain interruptions and overall economic and financial market instability both globally and in the United States. Such measures, as well as the general uncertainty surrounding the dangers and impact of the COVID-19 pandemic, have created significant disruption in supply chains and economic activity and have had a particularly adverse impact on the energy, hospitality, travel, retail and restaurant industries, as well as other industries, including industries in which certain of our funds’ portfolio companies operate. Such effects will likely continue for the duration of the pandemic, which is uncertain, and for some period thereafter. While several countries, as well as certain states, counties and cities in the United States, relaxed the early public health restrictions with a view to partially or fully reopening their economies, many cities, both globally and in the United States, have since experienced a surge in the reported number of cases and hospitalizations related to the COVID-19 pandemic. This increase in cases has led to the re-introduction of such restrictions and business shutdowns in certain states, counties and cities in the United States and globally and could lead to the re-introduction of such restrictions elsewhere. In December 2020, the Federal Food and Drug Administration authorized COVID‑19 vaccines and the distribution of such vaccines has commenced. However, it remains unclear how quickly the vaccines will be distributed nationwide and globally or when “herd immunity” will be achieved and whether the restrictions that were imposed to slow the spread of the virus will be lifted entirely. Ongoing restrictions and any delay in distributing the vaccines could lead people to continue to self-isolate and not participate in the economy at pre-pandemic levels for a prolonged period of time. Even after the COVID-19 pandemic subsides, the U.S. economy and most other major global economies may continue to experience a recession, and we anticipate our and our funds’ business and operations, as well as the business and operations of our funds’ portfolio companies, could be materially adversely affected by a prolonged recession in the U.S. and other major markets.
The extent of the impact of the COVID-19 pandemic (including the restrictive measure taken in response thereto) on our and our funds’ operational and financial performance will depend on many factors, including the duration, severity and scope of the public health emergency, the actions taken by governmental authorities to contain its financial and economic impact, the continued implementation of travel advisories and restrictions, the impact of such public health emergency on overall supply and demand, goods and services, investor liquidity, consumer confidence and levels of economic activity and the extent of its disruption to global, regional and local supply chains and economic markets, all of which are uncertain and difficult to assess. The COVID-19 pandemic is continuing as of the filing date of this Annual Report and its extended duration may have further adverse impacts on our business, financial performance, operating results, cash flows and financial condition, including the market price of shares of our securities, including for the reasons described below.
The effects of a public health crisis such as the COVID-19 pandemic may materially and adversely impact our value and performance and the value and performance of our funds and our funds’ portfolio companies. Further, the impact of the COVID-19 pandemic may not be fully reflected in the valuation of our or our funds’ investments, which may differ materially from the values that we may ultimately realize with respect to such investments. Our valuations, and particularly valuations of our interests in our funds and our funds’ investments, reflect a moment in time, are inherently uncertain, may fluctuate over short periods of time and are often based on subjective estimates, comparisons and qualitative evaluations of private information. Valuations, on an unrealized basis, can also be significantly affected by a variety of external factors including, but not limited to, public equity market volatility, industry trading multiples and interest rates, all of which have been impacted and continue to be impacted by the COVID-19 pandemic. Further, the extreme volatility in the broader market and particularly in the energy markets has led to a broad decrease in valuations and such valuations may continue to decline and become increasingly difficult to ascertain. As a result, our valuations and the valuations of our interests in our funds and our funds’ investments, may not show the complete or continuing impact of the COVID-19 pandemic and the resulting measures taken in response thereto. Accordingly, we and our funds may continue to incur additional net unrealized losses or may incur realized losses in the future, which could have a material adverse effect on our business, financial condition and results of operations. Any public health emergency, including the COVID-19 pandemic or any outbreak of other existing or new epidemic diseases, or the threat thereof, and the resulting financial and economic market uncertainty could have a significant adverse impact on us,
the fair value of our and our funds’ investments and could adversely impact our funds’ ability to fulfill our investment objectives.
Our ability to market and raise new or successor funds in the future may be impacted by the continuation and reintroduction of shelter-in-place orders, travel restrictions and social distancing requirements implemented in response to the COVID-19 pandemic. This may reduce or delay anticipated fee revenues. In addition, the significant volatility and declines in valuations in the global markets as well as liquidity concerns may impact our ability to raise funds or deter fund investors from investing in new or successor funds that we are marketing.
Our funds may experience a slowdown in the pace of their investment activity and capital deployment, which could also adversely affect the timing of raising capital for new or successor funds and could also impact the management fees we earn on funds that generate fees based on invested (and not committed) capital. While the increased volatility in the financial markets caused by the COVID-19 pandemic may present attractive investment opportunities, we or our funds may not be able to complete those investments due to, among other factors, increased competition or operational challenges such as our ability to obtain attractive financing, conduct due diligence and consummate the acquisition and disposition of investments for our funds because of continued and re-introduced shelter-in-place orders, travel restrictions and social distancing requirements.
If the impact of the COVID-19 pandemic and current market conditions continue, we and our funds may have fewer opportunities to successfully exit investments, due to, among other reasons, lower valuations, decreased revenues and earnings, lack of potential buyers with financial resources or access to financing to pursue an acquisition, lack of refinancing markets, resulting in a reduced ability to realize value from such investments at attractive valuations or at all, and thereby negatively impacting our realized income.
Adverse market conditions resulting from the COVID-19 pandemicmay impact our liquidity. Our cash flows from management fees may be impacted by, among other things, a slowdown in fundraising or delayed deployment. Cash payment of adverse market conditions may make it difficult for us to refinance our existing indebtedness or obtain new indebtedness with similar terms and any failure to do so could have a material adverse effect on our business. The capital that will be available to us in the future, if at all, may be at a higher cost and on less favorable terms and conditions than we currently experience. While our senior professionals have historically made co-investments in our funds alongside our limited partners, thereby reducing our obligation to make such investments, due to financial uncertainty or liquidity concerns, our employees may be less likely to make co-investments, which would result in such general partner commitments remaining our obligation to fund and reducing our liquidity. In addition, our funds may be impacted due to failure by our fund investors to meet capital calls, which would negatively impact our funds’ ability to make investments or pay us management fees.
The COVID-19 pandemic is having a particularly severe impact on certain industries, including but not limited to the energy, hospitality, travel, retail and restaurant industries, which are industries in which some of our funds have made investments. Many of our funds’ portfolio companies in these industries have faced and are continuing to face operational and financial challenges resulting from the spread of COVID-19 and related governmental measures, such as the closure of stores, hotels, restaurants and other locations, restrictions on travel, quarantines or continued and re-introduced stay-at-home orders. As a result of these disruptions, the businesses, financial results and prospects of certain of these portfolio companies have already been severely affected and could continue to be so affected. This has caused and may in the future result in impairment and decrease in value of our funds’ investments, which may be material.
Our funds’ portfolio companies are also facing or may face in the future increased credit and liquidity risk due to volatility in financial markets, reduced or eliminated revenue streams, and limited or higher cost of access to preferred sources of funding. Changes in the debt financing markets are impacting, and, if the volatility in financial markets continues, may in the future impact, the ability of our funds’ portfolio companies to meet their respective financial obligations and continue as going concerns. This could lead to the insolvency and/or bankruptcy of these companies which would cause our funds to realize losses in respect of those investments. Any of the foregoing would adversely affect our results of operations, perhaps materially, and could harm our reputation.
Our funds may experience similar credit and liquidity risk. Failure of our funds to meet their financial obligations could result in our funds being required to repay indebtedness or other financial obligations immediately in whole or in part, together with any attendant costs, and our funds could be forced to sell some of their assets to fund such costs. Our funds could lose both invested capital in, and anticipated profits from, the affected investment.
Borrowers of loans and other credit instruments made by our funds may be unable to make their loan payments on a timely basis and meet their loan covenants, and tenants leasing real estate properties owned by our funds may not be able to pay rents in a timely manner or at all, resulting in a decrease in value of our funds’ credit and real estate investments and lower than
expected returns. In addition, for variable interest instruments, lower reference rates resulting from government stimulus programs in response to the COVID-19 pandemic could lead to lower interest income for funds making loans.
The COVID-19 pandemic may adversely impact our business and operations since an extended period of remote working by our employees could strain our technology resources and introduce operational risks, including heightened cybersecurity risk. While we have taken steps to secure our networks and systems, remote working environments may be less secure and more susceptible to hacking attacks, including phishing and social engineering attempts that seek to exploit the COVID-19 pandemic. In addition, our data security, data privacy, investor reporting and business continuity processes could be impacted by a third party’s inability to perform due to the COVID-19 pandemic or by failures of, or attacks on, their information systems and technology. Also, our accounting and financial reporting systems, processes, and controls could be impacted as a result of these risks. In addition, COVID-19 presents a significant threat to our employees’ well-being and morale, and we may experience potential loss of productivity. If our senior management or other key personnel become ill or are otherwise unable to perform their duties for an extended period of time, we may experience a loss of productivity or a delay in the implementation of certain strategic plans. In addition to any potential impact of such extended illness on our operations, we may be exposed to the risk of litigation by our employees against us for, among other things, failure to take adequate steps to protect their well-being, particularly in the event they become sick after a return to the office. Further, local COVID-19-related laws can be subject to rapid change depending on public health developments, which can lead to confusion and make compliance with laws uncertain and subject us, our funds or our funds’ portfolio companies to increased risk of litigation for non-compliance.
Additionally, due to stay-at-home orders, travel restrictions, and other COVID-19 related responses, many of our staff cannot travel for in-person meetings and/or have been working remotely outside of their usual work location. This could create taxable presence or residency risks for our corporate entities, professionals, funds and portfolio companies, which risks could lead to increased tax liability and additional compliance complexities.
Regulatory oversight and enforcement may become more rigorous for the financial services industry and other regulated industries as a result of the impact of the COVID-19 pandemic on the financial markets, especially in the wake of the array of governmental financial assistance programs provided by state and national governments around the world. In addition, new laws or regulations that are passed in response to the COVID-19 pandemic could adversely impact investment management firms. This may result in a more complex regulatory, tax and political environment, which could subject us to increased compliance costs and administrative burdens.
Difficult market and political conditions may adversely affect our businesses in many ways, including by reducing the value or hampering the performance of the investments made by our funds or reducing the ability of our funds to raise or deploy capital, each of which could materially reduce our revenue, earnings and cash flow and adversely affect our financial prospects and condition.
Our businesses are materially affected by conditions in the global financial markets and economic and political conditions throughout the world, such as interest rates, the availability and cost of credit, persistent inflation, rates, economic uncertainty, changes in laws (including laws relating to our taxation, taxation of our investors and the possibility of changes to regulations applicable to alternative asset managers), trade policies, commodity prices, tariffs, currency exchange rates and controls and national and international political circumstances (including wars and other forms of conflict, civil unrest, terrorist acts, and security operations), general economic uncertainty and catastrophic events such as fires, floods, earthquakes, tornadoes, hurricanes, other adverse weather and climate conditions and pandemics. These factors are outside of our control and may affect the level and volatility of securities prices and the liquidity and value of investments, and we may not be able to or may choose not to manage our exposure to these conditions.
Global financial markets have experienced heightened volatility in recent periods, including as a result of economic and political events in or affecting the world’s major economies. For example,economies, such as the withdrawal of the U.K. from the EU in January 2020conflict between Russia and subsequent ongoing uncertainty regarding the future relationshipUkraine and more recently between the U.K.Israel and Hamas and the EU following the end of the Brexit transition period on December 31, 2020, hostilitiesongoing instability in the Middle East region, recentregion. Sanctions imposed by the U.S. and other countries in connection with hostilities between Russia and Ukraine and the tensions between China and Taiwan have caused additional financial market volatility and affected the global economy. Concerns over increasing inflation, economic recession, as well as interest rate volatility and fluctuations in oil and gas prices resulting from global production and demand levels,as well as geopolitical tension, have exacerbated market volatility. Market uncertainty and volatility have also been magnified as a result of the upcoming 2024 U.S. presidential and congressional elections and resulting uncertainties regarding actual and potential shifts in U.S. and foreign, trade, economic and other policies, and concerns over increasing inflation and deflation, as well as interest rate volatility and fluctuations in oil and gas prices resulting from global production and demand levels, have precipitated market volatility.policies.
In addition, numerous structural dynamics and persistent market trends have exacerbated volatility generally.and market uncertainty. Concerns over significant declinesvolatility in the commodities markets, sluggish economic expansion in non-U.S.foreign economies, including continued concerns over growth prospects in China and emerging markets, growing debt loads for certain countries, and uncertainty about the consequences of the U.S. and other governments withdrawing monetary stimulus measures and speculation about a possible recession all highlight the fact that economic conditions remain unpredictable and volatile. U.S. debt ceiling and budget deficit concerns have increased the possibility of additional credit-rating downgrades and economic slowdowns or a recession in the U.S. In recent periods, tradegeopolitical tensions, including between the U.S. and China, have
escalated. Further escalation of such tensions and the related imposition of sanctions or other trade tensions between the U.S. and China, or the countries’ inability to reach a timely trade agreement,barriers may negatively impact the rate of global growth, particularly in China, whichwhere growth has and continues to exhibit signs of slowing growth.slowed. Moreover, there is a risk of both sector-specific and broad-based volatility, corrections and/or downturns in the commodities, equity and credit markets. Any of the foregoing could have a significant impact on the markets in which we operate and a material adverse impact on our business prospects and financial condition.
A number of factors have had and may continue to have an adverse impact on credit markets in particular. The weakness and the uncertainty regarding the stability of the oil and gas markets resulted in a tightening of credit across multiple sectors. In addition, althoughin an effort to combat inflation the Federal Reserve has recently loweredincreased the federal funds rate following a periodin 2023. Although the Federal Reserve left its benchmark rates steady in the fourth quarter of numerous2023, it has indicated that additional rate increases changesin the future may be necessary to mitigate inflationary pressures. Changes in and uncertainty surrounding interest rates may have a material effect on our business, particularly with respect to the cost and availability of financing for significant acquisition and disposition transactions. Moreover, while conditions in the U.S. economy have generally improved since the credit crisis, many other economies continue to experience weakness, tighter credit conditions and a decreased availability of foreign capital. Since credit represents a significant portion of our business and ongoing strategy, any of the foregoing could have a material adverse impact on our business prospects and financial condition.
These and other conditions in the global financial markets and the global economy may result in adverse consequences for us and many of our funds, each of which could adversely affect the business of such funds, restrict such funds’ investment activities, impede such funds’ ability to effectively achieve their investment objectives and result in lower returns than we anticipated at the time certain of our investments were made. More specifically, these economic conditions could adversely affect our operating results by causing:
•decreases in the market value of securities, debt instruments or investments held by some of our funds;
•illiquidity in the market, which could adversely affect transaction volumes and the pace of realization of our funds’ investments or otherwise restrict the ability of our funds to realize value from their investments, thereby adversely affecting our ability to generate performance or other income;
•our assets under management to decrease, thereby lowering a portion of our management fees payable by our funds to the extent they are based on market values; and
•increases in costs or reduced availability of financial instruments that finance our funds.
During periods of difficult market conditions or slowdowns (which may be across one or more industries, sectors or geographies), companies in which we and our funds invest may experience decreased revenues, financial losses, credit rating downgrades, difficulty in obtaining access to financing and increased funding costs. During such periods, these companies may also have difficulty in expanding their businesses and operations and be unable to meet their debt service obligations or other expenses as they become due, including expenses payable to us.us and our funds. Negative financial results in our funds’ portfolio companies may reduce the value of ourtheir portfolio companies, the net asset value of our funds and the investment returns for our funds, which could have a material adverse effect on our operating results and cash flow. In addition, such conditions would increase the risk of default with respect to credit-oriented or debt investments. Our funds may be adversely affected by reduced opportunities to exit and realize value from their investments, by lower than expected returns on investments made prior to the deterioration of the credit markets and by our inability to find suitable investments for the funds to effectively deploy capital, which could adversely affect our ability to raise new funds and thus adversely impact our prospects for future growth.
Inflation has adversely affected and may continue to adversely affect our business, results of operations and financial condition of our funds and their portfolio companies.
Certain of our funds and their portfolio companies are in industries that have been impacted by inflation. Although the U.S. inflation rate has decreased in the fourth quarter, it remains well above the historic levels over the past several decades. Such inflationary pressures have increased the costs of labor, energy and raw materials and have adversely affected consumer spending, economic growth and our funds’ portfolio companies’ operations. If such portfolio companies are unable to pass any increases in their costs of operations along to their customers, it could adversely affect their operating results. In addition, any
projected future decreases in the operating results of our funds’ portfolio companies due to inflation could adversely impact the fair value of those investments. Any decreases in the fair value of our fund investments could result in future realized or unrealized losses.
Political and regulatory conditions, including the effects of negative publicity surrounding the financial industry in general and proposed legislation, could adversely affect our businesses.
As a result of market disruptions and highly publicized financial scandals in recent years, regulators and investors have exhibited concerns over the integrity of the U.S. financial markets. The businesses that we operate both in and outside the United StatesU.S. will be subject to new or additional regulations. We may be adversely affected as a result of new or revised legislation or regulations imposed by the SEC, the CFTC, FINRA or other U.S. or non-U.S.foreign governmental regulatory authorities or self-regulatory organizations that supervise the financial markets. We may also be adversely affected by changes in the interpretation or enforcement of existing laws and rules by these governmental authorities and self-regulatory organizations.
Throughout 2020 and continuing into 2021In recent periods there has been an increasing level of public discourse, debate and media coverage regarding the appropriate extent of regulation and oversight of the financial industry, including investment firms, as well as the tax treatment of certain investments and income generated from such investments. For further discussion regarding recent legislation affecting the taxation of carried interest, see “-We“—We depend on the members of the Executive Management Committee, senior professionals and other key personnel, and our ability to retain them and attract additional qualified personnel is critical to our success and our growth prospects.” In connection with the 2020 U.S. presidential and Congressional
elections and the transition to a Democratic Presidential administration and majority in the U.S. Congress,There is ongoing uncertainty has arisen regarding prospective changes in law and regulation affecting the U.S. private equity industry, including the possibility of significant revision to the Code and U.S. securities and financial laws, rules and regulations. The likelihood of occurrenceSee “—Risks Related to Taxation—Applicable U.S. and the effect of anyforeign tax law, regulations, or treaties, and changes in such change is highly uncertain and could havetax laws, regulations or treaties or an adverse impact on us,interpretation of these items by tax authorities could adversely affect our portfolio companieseffective tax rate, tax liability, financial condition and results, ability to raise funds from certain foreign investors, increase our fund investors. See “Riskcompliance or withholding tax costs and conflict with our contractual obligations” and “—Risks Related to Regulation-ExtensiveRegulation—Extensive regulation affects our activities, increases the cost of doing business and creates the potential for significant liabilities and penalties that could adversely affect our businesses and results of operations.” The likelihood of occurrence and the effect of any such change is highly uncertain and could have an adverse impact on us, our funds and their portfolio companies.
Changes in relevant tax laws, regulations or treaties or an adverse interpretation of these items by tax authorities may adversely affect our effective tax rate, tax liability and financial condition and results.
Any substantial changes in domestic or international corporate tax policies, regulations or guidance, enforcement activities or legislative initiatives may adversely affect our business, the amount of taxes we are required to pay and our financial condition and results of operations generally. Our effective tax rate and tax liability is based on the application of current income tax laws, regulations and treaties. These laws, regulations and treaties are complex, and the manner in which they apply to us and our funds is sometimes open to interpretation. Significant management judgment is required in determining our provision for income taxes, our deferred tax assets and liabilities and any valuation allowance recorded against our net deferred tax assets. Although management believes its application of current laws, regulations and treaties to be correct and sustainable upon examination by the tax authorities, the tax authorities could challenge our interpretation resulting in additional tax liability or adjustment to our income tax provision that could increase our effective tax rate. For an overview of certain relevant U.S. tax laws and relevant foreign tax laws, (and FATCA), see “-Risks“—Risks Related to Taxation-ApplicableTaxation—Applicable U.S. and foreign tax law, regulations, or treaties, and changes in such tax laws, regulations or treaties or an adverse interpretation of these items by tax authorities could adversely affect our effective tax rate, tax liability, financial condition and results, ability to raise funds from certain foreign investors, increase our compliance or withholding tax costs and conflict with our contractual obligations.”
Our business depends in large part on our ability to raise capital from investors. If we were unable to raise such capital, we would be unable to collect management fees or deploy such capital into investments, which would materially reduce our revenues and cash flow and adversely affect our financial condition.
Our ability to raise capital from investors depends on a number of factors, including many that are outside our control. Investors may downsize their investment allocations to alternative asset managers to rebalance a disproportionate weighting of their overall investment portfolio among asset classes. If the value of an investor’s portfolio decreases as a whole, the amount available to allocate to alternative investments could decline. Further, investors often evaluate the amount of distributions they have received from existing funds when considering commitments to new funds. Poor performance of our funds, or regulatory or tax constraints, could also make it more difficult for us to raise new capital. Our investors and potential investors continually assess our funds’ performance independently and relative to market benchmarks and our competitors, which affects our ability to raise capital for existing and future funds. If economic and market conditions deteriorate or continue to be volatile, investors may delay making new commitments to investment funds and/or we may be unable to raise sufficient amounts of capital to support the
investment activities of future funds. We may not be able to find suitable investments for the funds to effectively deploy capital, which could reduce our revenues and cash flow and adversely affect our financial condition as well as our ability to raise new funds and our prospects for future growth. This may be particularly impactful for our larger flagship funds. In addition, certain investors have implemented or may implement restrictions against investing in certain types of asset classes, such as fossil fuels, which would affect our ability to raise new funds focused on those asset classes. If we were unable to successfully raise capital, our revenue and cash flow would be reduced, and our financial condition would be adversely affected. Furthermore, while our senior professionals have committed substantial capital to our funds, commitments from new investors may depend on the commitments made by our senior professionals to new funds and there can be no assurance that there will be further commitments to our funds by these individuals, and any future investments by them in our funds or other alternative investment categories will likely depend on the performance of our funds, the performance of their overall investment portfolios and other investment opportunities available to them.
The financial projections of our portfolio companies could prove inaccurate.
Our funds generally establish the capital structure of portfolio companies on the basis of financial projections prepared by the management of such portfolio companies. These projected operating results will normally be based primarily on judgments of the management of the portfolio companies. In all cases, projections are only estimates of future results that are based upon assumptions made at the time that the projections are developed. General economic conditions, which are not predictable, along with other factors may cause actual performance to fall short of the financial projections that were used to establish a given portfolio company’s capital structure. Because of the leverage that we typically employ in our investments, this could cause a substantial decrease in the value of our equity holdings in the portfolio company. The inaccuracy of financial projections could result in actual performance differing from expectations.
We depend on the members of the Executive Management Committee, senior professionals and other key personnel, and our ability to retain them and attract additional qualified personnel is critical to our success and our growth prospects.
We depend on the diligence, skill, judgment, business contacts and personal reputations of the members of the Executive Management Committee, senior professionals and other key personnel. Our future success will depend upon our ability to retain our senior professionals and other key personnel and our ability to recruit additional qualified personnel. These individuals possess substantial experience and expertise in investing, are responsible for locating and executing our funds’ investments, have significant relationships with the institutions that are the source of many of our funds’ investment opportunities and, in certain cases, have strong relationships with our investors. Therefore, if any of our senior professionals or other key personnel join competitors or form competing companies, it could result in the loss of significant investment opportunities, limit our ability to raise capital from certain existing investors or result in the loss of certain existing investors. There is no guarantee that the non-competition and non-solicitation agreements to which certain of our senior professionals and other key personnel are subject, together with our other arrangements with them, will prevent them from leaving, joining our competitors or otherwise competing with us. Such agreements also expire after a certain period of time, at which point such senior personnel would be free to compete against us and solicit our clients and employees. In addition, there is no assurance that such agreements will be enforceable in all cases, particularly as U.S. states and/or federal agencies enact legislation or adopt rules aimed at effectively prohibiting non-competition agreements. In this respect, in January 2023, the U.S. Federal Trade Commission (“FTC”) published a proposed rule that, if finally issued, would generally prohibit post-employment non-compete clauses (or other clauses with comparable effect) in agreements between employers and their employees. If issued, the proposed rule could adversely affect our ability to recruit and retain our professionals.
The departure or bad acts of any of our senior professionals, or a significant number of our other investment professionals, could have a material adverse effect on our ability to achieve our investment objectives, cause certain of our investors to withdraw capital they invest with us or elect not to commit additional capital to our funds or otherwise have a material adverse effect on our business and our prospects. Turnover and associated costs of rehiring, the loss of human capital through attrition and the reduced ability to attract talent could impair our ability to implement our growth strategy and maintain our standards of excellence. Further the departure of some or all of those individuals could also trigger certain “key person” provisions in the documentation governing certain of our funds, which would permit the investors in those funds to suspend or terminate such funds’ investment periods or, in the case of certain funds, permit investors to withdraw their capital prior to expiration of the applicable lock-up date. We do not carry any “key person” insurance that would provide us with proceeds in the event of the death or disability of any of our senior professionals, and we do not have a policy that prohibits our senior professionals from traveling together. See “-Employee“—Risks Related to Regulation—Employee misconduct could harm us by impairing our ability to attract and retain investors and subjecting us to significant legal liability, regulatory scrutiny and reputational harm.”
We anticipate that it will be necessary for us to add investment professionals both to grow our businesses and to replace those who depart. Competition for qualified, motivated, and highly-skilled executives, professionals and other key personnel in investment management firms is significant, both in the United StatesU.S. and internationally, and we may not succeed in
recruiting additional personnel or we may fail to effectively replace current personnel who depart with qualified or effective successors. We seek to offer our personnel meaningful professional development opportunities and programs such as employee engagement, training and development opportunities and periodic review processes. We also seek to provide our personnel with competitive benefits and compensation packages. However, these efforts may not be sufficient to enable us to attract, retain and motivate qualified individuals to support our business and growth.
Furthermore, under the Tax Cuts and Jobs Act, investments must be held for more than three years, rather than the prior requirement of more than one year, for carried interest to be treated for U.S. federal income tax purposes as capital gain. The longer holding period requirement may result in some or all of our carried interest being treated as ordinary income, which would materially increase the amount of taxes that our employees and other key personnel would be required to pay. In January 2021, the IRS released final regulations (which generally retain the basic approach and structure of the proposed regulations published in August 2020, with certain significant revisions) implementing the carried interest provisions that were enacted as part of the Tax Cuts and Jobs Act. We are currently evaluating the potential tax impacts of such regulations, and the ultimate tax consequences of such regulations are uncertain. Although most proposals regarding the taxation of carried interest still require gain realization before applying ordinary income rates, legislation has been introduced that would assume a deemed annual return on carried interest and tax that amount annually, with a true-up once the assets are sold. In addition, following the Tax Cuts and Jobs Act, the tax treatment of carried interest has continued to be an area of focus for policymakers and government officials, which could result in a further regulatory action by federal or state governments. For example, certain states, including New YorkCongress and California, have proposedthe current Presidential administration may consider legislation to levy additional state taxfurther extend the holding period for carried interest to qualify for long-term capital gains treatment, have carried interest taxed as ordinary income rather than as capital gain, impose surcharges on carried interest.interest or increase the capital gains tax rate. Tax authorities and legislators in other jurisdictions thatin which Ares has investments or employees in could clarify, modify or challenge their treatment of carried interest. For example, the UKU.K. government has suggested, following a report by the Office of Tax Simplification is currently reviewingon the UKU.K. Capital Gains Tax Regime, and therethat it is a risk that suchkeeping the regime under review. Such review could result in a change to the taxation of carried interest with respect to our UKU.K. investment professionals. Additionally, the COVID-19 pandemic may increase these risks as international authorities consider methods to increase tax revenues due to increasing fiscal deficits. In addition, there have been proposed laws and regulations that sought to regulate the compensation of certain of our employees. AllIf any of these potential changes may materially increasewere effectuated, the amount of taxes that our employees and other key personnel would be required to pay could increase materially and as a result maycould impact our ability to recruit, retain and motivate employees and key personnel in the relevant jurisdictions or maycould require us in certain circumstances to consider alternative or modified incentive arrangements for such employees or key personnel. Our efforts to retain and attract investment professionals may also result in significant additional expenses, which could adversely affect our profitability or result in an increase in the portion of our performance incomecarried interest and incentive fees that we grant to our investment professionals. In the year ended December 31, 2020, we incurred equity compensation expenses of $123.0 million, andAdditionally, we expect these costsexpenses related to continueequity-based compensation to increase in the future as we increase the use of equity compensationgrant equity-based awards to attract, retain and compensate employees.
Our failure to appropriately address conflicts of interest could damage our reputation and adversely affect our businesses.
As we have expanded and as we continue to expand the number and scope of our businesses, we increasingly confront potential conflicts of interest relating to our and our funds’ investment activities. These conflicts are most likely to arise between or among our funds or between one or more funds across our Credit, Private Equity, Real EstateAssets and Strategic InitiativesSecondaries Groups, and other businesses including any special purpose acquisition companies (“SPACs”)SPACs and similar investment vehicles that we sponsor. WeThese conflicts of interest include:
•we and certain of our funds may have overlapping investment objectives, including funds that have different fee structures, and potential conflicts may arise with respect to our decisions regarding how to allocate investment opportunities. For example, a decision to receive material non-public information about a company while pursuing an investment opportunity may give rise to a potential conflict of interest if it results in our having to restrict any fund or other part of our business from
trading in the securities of such company. Further, company;
•we may allocate an investment opportunity that is appropriate for Ares and/or multiple funds in a manner that excludes one or more funds or results in a disproportionate allocation based on factors or criteria that we determine, such as differences with respect to available capital, the size of a fund, minimum investment amounts and remaining life of a fund, differences in investment objectives or current investment strategies, such as objectives or strategies, differences in risk profile at the time an opportunity becomes available, the potential transaction and other costs of allocating an opportunity among various funds, potential conflicts of interest, including whether multiple funds have an existing investment in the security in question or the issuer of such security, the nature of the security or the transaction including the size of investment opportunity, minimum investment amounts and the source of the opportunity, current and anticipated market and general economic conditions, existing positions in an issuer/security, prior positions in an issuer/security and other considerations deemed relevant to us. Weus;
•our funds may also cause one or more funds to investacquire positions in a single portfolio company, for example, where the fund that made an initial investment no longer has capital available to invest. Weinvest;
•our funds may also causeinvest in different parts of the capital structure of a company in which one or more of our other funds that we advise to purchase different classes of securities in the same portfolio company.invests. For example, one or more funds may invest in the normal course of business our Credit Group funds acquire debt positions in companiesa controlling or other equity interest issued by a portfolio company in which a different fund holds debt securities. Additionally, in connection with an investment we may create multiple tranches of a capital structure and our Private Equity Group funds own common equity securities. Amay be allocated investments in these tranches on terms established by us. The interests of our funds may not always be aligned, which may give rise to actual or potential conflicts of interest, or the appearance of conflicts of interest. Further, a direct conflict of interest could arise between the debt holders and the equitysecurity holders if such a company were to become distressed or develop insolvency concerns. Actions taken for one or more of our funds may be adverse to us or other of our funds;
•our affiliates or portfolio companies may be service providers or counterparties to our funds or portfolio companies and receive fees or other compensation for services that are not shared with our fund investors. In addition, such instances, we
may be incentivized to cause our funds or portfolio companies to purchase such services from our affiliates or portfolio companies rather than an unaffiliated service provider despite the fact that a third-party service provider could potentially provide higher quality services or offer them at a lower cost;
•funds in one group could be restricted from selling their positions in such companies for extended periods because investment professionals in another group sit on the boards of such companies or because another part of the firm has received private information. Certaininformation;
•certain funds in different groups may invest alongside each other in the same security. ARCC, ASIF and other business development companies and registered closed-end management investment companies managed by a subsidiary of us are permitted to co-invest in portfolio companies with each other and with affiliated investment funds pursuant to an SEC order (the “Co-investment“Co-Investment Exemptive Order”). The different investment objectives or terms of such funds may result in a potential conflict of interest, including in connection with the allocation of investments between the funds made pursuant to the Co-investmentCo-Investment Exemptive Order. In addition, Order;
•conflicts of interest may exist in the valuation of our investments (which can affect fees and carried interest) and regarding decisions about the allocation of specific investment opportunities among us and our funds and the allocation of fees and costs among us, our funds and their portfolio companies.companies; and
•fund investors may perceive conflicts of interest regarding investment decisions for funds in which our investment professionals, who have made and may continue to make significant personal investments, are personally invested.
Though we believe we have appropriate means and oversight to resolve these conflicts, our judgment on any particular allocation could be challenged. While we have developed general guidelines regarding when two or more funds can invest in different parts of the same company’s capital structure and created a process that we employ to handle such conflicts if they arise, our decision to permit the investments to occur in the first instance or our judgment on how to minimize the conflict could be challenged. If we fail to appropriately address any such conflicts, it could negatively impact our reputation and ability to raise additional funds and the willingness of counterparties to do business with us or result in potential litigation or regulatory action against us.us, which may adversely impact our business.
Conflicts of interest may arise in our allocation of co-investment opportunities.
As a general matter, our allocation of co-investment opportunities is entirely within our discretion and there can be no assurance that co-investments of any particular type or amount will be allocated to any of our funds or investors. There can be no assurance that co-investments will become available and we will take into account a variety of factors and considerations we deem relevant in our sole discretion in allocating co-investment opportunities, including, without limitation, whether a potential co-investor has expressed an interest in evaluating co-investment opportunities, our assessment of a potential co-investor’s ability to invest an amount of capital that fits the needs of the co-investment and its history of participating in Ares co-investments, the size of the potential co-investor’s commitmentsstrategic value to the co-investment, our funds or future funds, the length and nature of our relationship with the potential co-investor, including whether the potential co-investor has demonstrated a long-term and/or continuing commitment to the potential success of Ares or any of its funds, whether the co-investor is considered strategic to the co-investment, our assessment of a potential co-investor’s ability to commit to a co-investment opportunity within the required timeframe of the particular transaction, the economic and other terms of such co-investment (e.g., whether management fees and/or carried interest would be payable to us and the extent thereof), and such other factors and considerations that we deem relevant in our sole discretion under the circumstances.
Certain funds in different groups may invest alongside each other in the same security. ARCC, ASIF and other business development companies and registered closed-end management investment companies managed by a subsidiary of us are permitted to co-invest in portfolio companies with each other and with affiliated investment funds pursuant to the Co-investmentCo-Investment Exemptive Order. The different investment objectives or terms of such funds may result in a potential conflict of interest, including in connection with the allocation of investments between the funds made pursuant to the Co-investmentCo-Investment Exemptive Order. In addition, conflicts of interest may exist in the valuation of our investments and regarding decisions about the allocation of specific investment opportunities among us and our funds and the allocation of fees and costs among us, our funds and their portfolio companies. We, from time to time, incur fees, costs, and expenses on behalf of more than one fund. To the extent such fees, costs, and expenses are incurred for the account or benefit of more than one fund, each such fund will typically bear an allocable portion of any such fees, costs, and expenses in proportion to the size of its investment in the activity or entity to which such expense relates (subject to the terms of each fund’s governing documents) or in such other manner as we considersconsider fair and equitable under the circumstances such as the relative fund size or capital available to be invested by such
funds. Where a fund’s governing documents do not permit the payment of a particular expense, we will generally pay such fund’s allocable portion of such expense.
Potential conflicts will arise with respect to our decisions regarding how to allocate co-investment opportunities among our funds and investors and the terms of any such co-investments. Our fund documents typically do not mandate specific
allocations with respect to co-investments. The investment advisers of our funds may have an incentive to provide co-investment opportunities to certain investors in lieu of others. Co-investment arrangements may be structured through one or more of our investment vehicles, and in such circumstances, co-investors will generally bear the costs and expenses thereof (which may lead to conflicts of interest regarding the allocation of costs and expenses between such co-investors and investors in our other investment funds). The terms of any such existing and future co-investment vehicles may differ materially, and in some instances may be more favorable to us, than the terms of certain of our funds or prior co-investment vehicles, and such different terms may create an incentive for us to allocate a greater or lesser percentage of an investment opportunity to such funds or such co-investment vehicles, as the case may be. Such incentives will from time to time give rise to conflicts of interest. There can be no assurance that any conflicts of interest will be resolved in favor of any particular investment funds or investors (including any applicable co-investors) and there is a risk that such investment fund or investor (or the SEC) may challenge our treatment of such conflict, which could impose costs on our business and expose us to potential liability.
We may also decide to provide a co-investment opportunity to certain investors in lieu of allocating more of that investment to our funds, which may adversely impact our fundraising activity.
The investment management business is intensely competitive.
The investment management business is intensely competitive, with competition based on a variety of factors, including investment performance, business relationships, quality of service provided to investors, investor liquidity and willingness to invest, fund terms (including fees), brand recognition and business reputation. We compete with a number of private equity funds, specialized funds, hedge funds, corporate buyers, traditional asset managers, real estate development companies, commercial banks, investment banks, other investment managers and other financial institutions, as well as domestic and international pension funds and sovereign wealth funds, and we expect that competition will continue to increase.
Numerous factors increase our competitive risks, including, but not limited to:
•a number of our competitors in some of our businesses have greater financial, technical, marketing and other resources and more personnel than we do;
•some of our funds may not perform as well as competitors’ funds or other available investment products;
•several of our competitors have raised significant amounts of capital, and many of them have similar investment objectives to ours, which may create additional competition for investment opportunities;
•some of our competitors may have a lower cost of capital and access to funding sources that are not available to us, which may create competitive disadvantages for us with respect to our funds, particularly our funds that directly use leverage or rely on debt financing of their portfolio investments to generate superior investment returns;
•some of our competitors may have higher risk tolerances, different risk assessments or lower return thresholds than us, which could allow them to consider a wider variety of investments and to bid more aggressively than us for investments that we want to make;
•some of our competitors may be subject to less regulation and, accordingly, may have more flexibility to undertake and execute certain businesses or investments than we do and/or bear less compliance expense than we do;
•some of our competitors may not have the same types of conflicts of interest as we do;
•some of our competitors may have more flexibility than us in raising certain types of funds under the investment management contracts they have negotiated with their investors;
•some of our competitors may have better expertise or be regarded by investors as having better expertise or reputation in a specific asset class or geographic region than we do;
•our competitors that are corporate buyers may be able to achieve synergistic cost savings in respect of an investment, which may provide them with a competitive advantage in bidding for an investment;
•our competitors have instituted or may institute low cost high speed financial applications and services based on artificial intelligence and new competitors may enter the asset management space using new investment platforms based on artificial intelligence; and
•other industry participants may, from time to time, seek to recruit our investment professionals and other employees away from us.
Developments in financial technology, such as a distributed ledger technology (or blockchain), have the potential to disrupt the financial industry and change the way financial institutions, including investment managers, do business, and could exacerbate these competitive pressures.
We may lose investment opportunities in the future if we do not match pricing, structures and terms offered by our competitors. Alternatively, we may experience decreased profitability, rates of return and increased risks of loss if we match pricing, structures and terms offered by our competitors.
In addition, the attractiveness of investments in our funds relative to other investment products could decrease depending on economic conditions. This competitive pressure could adversely affect our ability to make successful investments and limit our ability to raise future funds, either of which would adversely impact our businesses, revenues, results of operations and cash flow.
Lastly, institutional and individual investors are allocating increasing amounts of capital to alternative investment strategies. Several large institutional investors have announced a desire to consolidate their investments in a more limited number of managers. We expect that this will cause competition in our industry to intensify and could lead to a reduction in the size and duration of pricing inefficiencies that many of our funds seek to exploit. Increased competition may adversely impact our ability to deploy capital, which could reduce our revenues and cash flow and adversely affect our financial condition.
Poor performance of our funds would cause a decline in our revenue and results of operations, may obligate us to repay performance incomecarried interest previously paid to us and could adversely affect our ability to raise capital for future funds.
We derive revenues primarily from:
•management fees, which are based generally on the amount of capital committed to or invested by our funds;
•performance income,carried interest and incentive fees, which are based on the performance of our funds; and
•returns on investments of our own capital in the funds and other investment vehicles, including SPACs, that we sponsor and manage.
When any of our funds perform poorly, either by incurring losses or underperforming benchmarks, as compared to our competitors or otherwise, our investment record suffers. As a result, our performance incomecarried interest and incentive fees may be adversely affected and, all else being equal, the value of our assets under management could decrease, which may, in turn, reduce our management fees. Moreover, we may experience losses on investments of our own capital as a result of poor investment performance. If a fund performs poorly, we will receive little or no performance incomecarried interest and incentive fees with regard to the fund and little income or possibly losses from our own principal investment in such fund. Furthermore, if, as a result of poor performance or otherwise, a fund does not achieve total investment returns that exceed a specified investment return threshold over the life of the fund or other measurement period, we may be obligated to repay the amount by which performance incomecarried interest that werewas previously distributed or paid to us exceeds amounts to which we were entitled. Poor performance of our funds and other vehicles could also make it more difficult for us to raise new capital. Investors in our closed-end funds may decline to invest in future closed-end funds we raise as a result of poor performance. Investors in our open-ended funds may redeem their investment as a result of poor performance. Poor performance of our publicly tradedpublicly-traded funds may result in stockholders selling their stock in such vehicles, thereby causing a decline in the stock price and limiting our ability to access capital. For further information on the impact of poor fund performance, see “We“—We may not be able to maintain our current fee structure as a result of industry pressure from fund investors to reduce fees, which could have an adverse effect on our profit margins and results of operations.”
In addition, if any of our subsidiaries become the sponsor of any SPACs that are unable to successfully complete a business combination within the time limitation provided for such SPAC, we may lose the entirety of our investment. See “We“—Risks Related to Regulation—Our investments in subsidiaries that have made a significant investmentsponsored SPACs and invested in a subsidiary that is the sponsor of a SPAC,their business combination targets may expose us to increased liabilities, and willwe may suffer the loss of all or a portion of our investmentinvestments if the SPAC does not complete a business combination within two years.by the applicable deadline or the target is unsuccessful.”
ARCC’s management fee comprises a significant portion of our management fees and a reduction in fees from ARCC could have an adverse effect on our revenues and results of operations.
The management fees we receive from ARCC (including fees attributable to ARCC Part I Fees) comprise a significant percentage of our management fees. The investment advisory and management agreement we have with ARCC categorizes the
fees we receive as: (a)(i) base management fees, which are paid quarterly and generally increase or decrease based on ARCC’s total assets (excluding cash and cash equivalents), (b); (ii) fees based on ARCC’s net investment income (before ARCC Part I Fees and ARCC Part II Fees), which are paid quarterly (“ARCC Part I Fees”); and (c)(iii) fees based on ARCC’s net capital gains, which are paid annually (“ARCC Part II Fees”). We classify the ARCC Part I Fees as management fees because they are predictable and recurring in nature, not subject to contingent repayment and generally cash-settled each quarter. If ARCC’s total assets or its net investment income (before ARCC Part I Fees and ARCC Part II Fees) were to decline significantly for any reason, including, without limitation, due to fair value accounting requirements, the poor performance of its investments or the failure to successfully access or invest capital, the amount of the fees we receive from ARCC, including the base management fee and the ARCC Part I Fees, would also decline significantly, which could have an adverse effect on our revenues and results of operations. In addition, because the ARCC Part II Fees are not paid unless ARCC achieves cumulative aggregate realized capital gains (net of cumulative aggregate realized capital losses and aggregate unrealized capital depreciation), ARCC’s Part II Fees payable to us are variable and not predictable. In addition, ARCC Part I Fees and ARCC Part II Fees may be subject to cash payment deferral if certain return hurdles in accordance with the contractual terms are not met, which could have an adverse effect on our cash flows.flows if such deferral is sustained for an extended period. In such cases, the contractual payments to employees as compensation related to such ARCC Part I Fees wereand ARCC Part II Fees are also deferred, forwhich would limit the second and third quarters of 2020 and as of December 31, 2020, these fees are now payable under the terms of the investment advisory and management agreement.associated impact to our liquidity. We may also, from time to time, waive or voluntarily defer any fees payable by ARCC in connection with strategic transactions.
Our investment advisory and management agreement with ARCC renews for successive annual periods subject to the approval of ARCC’s board of directors or by the affirmative vote of the holders of a majority of ARCC’s outstanding voting securities. In addition, as required by the Investment Company Act, both ARCC and its investment adviser have the right to terminate the agreement without penalty upon 60 days’ written notice to the other party. Termination or non-renewal of this agreement would reduce our revenues significantly and could have a material adverse effect on our financial condition.
We may not be able to maintain our current fee structure as a result of industry pressure from fund investors to reduce fees, which could have an adverse effect on our profit margins and results of operations.
We may not be able to maintain our current fee structure as a result of industry pressure from fund investors to reduce fees. Although our investment management fees vary among and within asset classes, historically we have competed primarily on the basis of our performance and not on the level of our investment management fees relative to those of our competitors. In recent years, however, there has been a general trend toward lower fees in the investment management industry. The Institutional Limited Partners Association (“ILPA”) published a set of Private Equity Principles (the “Principles”) which called for enhanced “alignment of interests” between general partners and limited partners through modifications of some of the terms of fund arrangements, including proposed guidelines for fees and performance incomefee structures. We promptly provided ILPA with our endorsement of the Principles, representing an indication of our general support for the efforts of ILPA. Although we have no obligation to modify any of our fees with respect to our existing funds, we may experience pressure to do so. More recently, institutional investors have been increasing pressure to reduce management and investment fees charged by external managers, whether through direct reductions, deferrals, rebates or other means. In addition, we may be asked by investors to waive or defer fees for various reasons, including during economic downturns or as a result of poor performance of our funds. We may not be successful in providing investment returns and service that will allow us to maintain our current fee structure. Fee reductions on existing or future new businesses could have an adverse effect on our profit margins and results of operations. For more information about our fees, see “Item 7. Management’s Discussion and Analysis of Financial Condition and Results of Operations.”
In addition, we may not be able to maintain our current fee structure if we fail to grow the assets of our funds. This would limit our ability to earn additional management fees, carried interest and performance income,incentive fees, and ultimately affect our operating results. Our fund investors and potential fund investors continually assess our funds’ performance independently and relative to market benchmarks and our competitors, and our ability to raise capital for existing and future funds and avoid excessive redemption levels depends on our funds’ performance. Accordingly, poor fund performance may deter future investment in our funds and thereby decrease the capital invested in our funds and, ultimately, our management fee income. In the face of poor fund performance, investors could demand lower fees or fee concessions for existing or future funds which would likewise decrease our revenue.
A major public health crisis, like the COVID-19 pandemic, could disrupt the U.S. and global economy and industries in which we, our funds and our funds’ portfolio companies operate and negatively impact us, our funds or our funds’ portfolio companies.
A major public health crisis could impact the U.S. and global economy. Disruptions to commercial activity (such as the imposition of quarantines or travel restrictions) or, more generally, a failure to contain or effectively manage a public health crisis, has, and may in the future, adversely impact our and our funds’ business and operations, as well as the business and
operations of our funds’ portfolio companies. For example, such disruptions have adversely affected, and in the future could again, impair our ability to raise funds or deter fund investors from investing in new or successor funds that we are marketing particularly in certain industries in which certain of our funds’ portfolio companies operate, including energy, hospitality, travel, retail and restaurant industries. Additionally, while restrictions have generally been lifted globally, and the World Health Organization has declared the end of the COVID-19 global health emergency, the COVID-19 pandemic contributed, and any future public health crisis could contribute, to adverse impacts on global commercial activity and supply chain operations and significant volatility in the equity and debt markets. Such volatility could increase credit and liquidity risk and hamper our and our funds’ ability to deploy capital, all of which could negatively impact our and our funds’ performance, as well as the business and operations of our funds’ portfolio companies.
Rapid growth of our businesses, particularly outside the United States,U.S., may be difficult to sustain and may place significant demands on our administrative, operational and financial resources.
Our assets under management have grown significantly in the past, and we are pursuing further growth in the near future, both organic and through acquisitions. Our rapid growth has placed, and planned growth, if successful, will continue to place significant demands on our legal, accounting, compliance and operational infrastructure and has increased expenses. The complexity of these demands, and the expense required to address them, is a function not simply of the amount by which our assets under management has grown, but of the growth in the variety and complexity of, as well as the differences in strategy between, our
different funds. In addition, we are required to continuously develop our systems and infrastructure in response to the increasing sophistication of the investment management market and legal, accounting, regulatory and tax developments.
Our future growth will depend in part on our ability to maintain an operating platform and management system sufficient to address our growth and will require us to incur significant additional expenses and to commit additional senior management and operational resources. As a result, we face significant challenges in:
•maintaining adequate financial, regulatory (legal, tax and compliance) and business controls;
•providing current and future investors with accurate and consistent reporting;
•implementing new or updated information and financial systems and procedures;
•monitoring and enhancing our cybersecurity and data privacy risk management; and
•training, managing and appropriately sizing our work force and other components of our businesses on a timely and cost-effective basis.
We may not be able to manage our expanding operations effectively or be able to continue to grow, and any failure to do so could adversely affect our ability to generate revenue and control our expenses.
In addition, pursuing investment opportunities outside the United StatesU.S. presents challenges not faced by U.S. investments, such as different legal and tax regimes and currency fluctuations, which require additional resources to address. To accommodate the needs of global investors and strategies we must structure investment products in a manner that addresses tax, regulatory and legislative provisions in different, and sometimes multiple, jurisdictions. These laws may not always be consistent with each other. Further, in conducting business in foreign jurisdictions, we are often faced with the challenge of ensuring that our activities and those of our funds and, in some cases, our funds’ portfolio companies, are consistent with U.S. or other laws with extraterritorial application, such as the USA PATRIOT Act and the U.S. Foreign Corrupt Practices Act (the “FCPA”). Moreover, actively pursuing international investment opportunities may require that we increase the size or number of our international offices. Pursuing non-U.S.foreign fund investors means that we must comply with international laws governing the sale of interests in our funds, different investor reporting, investor “know your customer” requirements and information processes and other requirements.requirements, which may impact our ability to service such investors. As a result, we are required to continuously develop our systems and infrastructure, including employing and contracting with foreign businesses and entities, in response to the increasing complexity and sophistication of the investment management market and legal, accounting and regulatory situations. This growth has required, and will continue to require, us to incur significant additional expenses and to commit additional senior management and operational resources. There can be no assurance that we will be able to manage or maintain appropriate oversight over our expanding international operations effectively or that we will be able to continue to grow this part of our businesses, and any failure to do so could adversely affect our ability to generate revenues and control our expenses. See “-Regulatory“—Risks Related to Regulation—Regulatory changes in jurisdictions outside the United StatesU.S. could adversely affect our businesses.”
We may enter into new lines of business and expand into new investment strategies, geographic markets, strategic partnerships and businesses, each of which may result in additional risks, expenses and uncertainties in our businesses.
We intend, if market conditions warrant, to grow our businesses by increasing assets under management in existing businesses and expanding into new investment strategies, geographic markets, strategic partnerships and businesses. We may pursue growth through acquisitions of other investment management companies, acquisitions of critical business partners, acquisition of companies, or other strategic initiatives (including through our Strategic Initiatives Group)other businesses), which may include entering into new lines of business. In addition, consistent with our past experience, we expect opportunities will arise to acquire other alternative or traditional asset managers.
Attempts to expand our businesses involve a number of special risks, including some or all of the following:
•the required investment of capital and other resources;
•the diversion of management’s attention from our core businesses;
•the assumption of liabilities in any acquired business;
•the disruption of our ongoing businesses;
•entry into markets or lines of business in which we may have limited or no experience;
•increasing demands on our operational and management systems and controls;
•our assumption of the imposition on us of known or unknown claims or liabilities in an acquisition, including claims by government agencies or authorities, current or former employees or customers, former stockholders or other third parties;
•compliance with or applicability to our business or our funds’ portfolio companies of regulations and laws, including, in particular, local regulations and laws (for example, consumer protection related laws) and customs in the numerous jurisdictions in which we operate and the impact that noncompliance or even perceived noncompliance could have on us and our funds’ portfolio companies;
•our inability to realize the anticipated operation and financial benefits from an acquisition for a number of reasons, including if we are unable to effectively integrate acquired businesses;
•potential increase in investor concentration; and
•the broadening of our geographic footprint, increasing the risks associated with conducting operations in certain foreign jurisdictions where we currently have little or no presence.
Entry into certain lines of business may subject us to new laws and regulations with which we are not familiar, or from which we are currently exempt, and may lead to increased litigation and regulatory risk. If a new business does not generate sufficient revenues or if we are unable to efficiently manage our expanded operations, our results of operations will be adversely affected. Our strategic initiatives may include joint ventures and business combinations through subsidiary sponsored SPACs, in which case we will be subject to additional risks and uncertainties in that we may be dependent upon, and subject to liability, losses or reputational damage relating to systems, controls and personnel that are not under our control.control or disputes with our joint venture partners. Because we have not yet identified these potential new investment strategies, geographic markets or lines of business, we cannot identify all of the specific risks we may face and the potential adverse consequences on us and their investment that may result from any attempted expansion.
If we are unable to consummate or successfully integrate development opportunities, acquisitions or joint ventures, we may not be able to implement our growth strategy successfully.
Our growth strategy is based, in part, on the selective development or acquisition of asset management businesses, advisory businesses or other businesses complementary to our business where we think we can add substantial value or generate substantial returns. The success of this strategy will depend on, among other things, (a)(i) the availability of suitable opportunities, (b)(ii) the level of competition from other companies that may have greater financial resources, (c)(iii) our ability to value potential development or acquisition opportunities accurately and negotiate acceptable terms for those opportunities, (d)(iv) our ability to obtain requisite approvals and licenses from the relevant governmental authorities and to comply with applicable laws and regulations without incurring undue costs and delays, (e)(v) our ability to identify and enter into mutually beneficial relationships with venture partners, and (f)(vi) our ability to properly manage conflicts of interest. In addition, our ability to integrate personnel at acquired businesses into our operations and culture may be impacted by the structure of acquisitions we make, such as contingent consideration and continuing governance rights retained by the sellers.
This strategy also contemplates the use of shares of our publicly tradedpublicly-traded Class A common stock as acquisition consideration. Volatility or declines in the trading price of shares of our Class A common stock may make shares of our Class
A common stock less attractive to acquisition targets. Moreover, even if we are able to identify and successfully complete an acquisition, we may encounter unexpected difficulties or incur unexpected costs associated with integrating and overseeing the operations of the new businesses. If we are not successful in implementing our growth strategy, our business, financial results and the market price for shares of our Class A common stock may be adversely affected.
RiskRisks Related to Regulation
Extensive regulation affects our activities, increases the cost of doing business and creates the potential for significant liabilities and penalties that could adversely affect our businesses and results of operations.
Overview of our regulatory environment and exemptions from certain laws. Our businesses are subject to extensive regulation, including periodic examinations, by governmental agencies and self-regulatory organizations in the jurisdictions in which we operate. The SEC oversees the activities of our subsidiaries that are registered investment advisers under the Investment Advisers Act. Since the first quarter of 2014, FINRA and the SEC have overseenoversee the activities of our wholly owned subsidiary AIS LLCsubsidiaries AMCM and AWMS as a registered broker-dealer,broker-dealers, which also maintainsmaintain licenses in many states. We are subject to audits by the Defense Security Service to determine whether we are under foreign ownership, control or influence. In addition,We are also increasingly subject to various data privacy and protection laws. If we are unable or fail to comply with such laws, we could be subject to fines, penalties, litigation or reputational harm.
Regulators are also increasing scrutiny and considering regulation of the use of artificial intelligence technologies. We cannot predict what, if any, actions may be taken, but such regulation could have a material adverse effect on our business and results of operations.
We regularly rely on exemptions from various requirements of the Securities Act, the Exchange Act, the Investment Company Act, the Commodity Exchange Act and the U.S. Employee Retirement Income Security Act of 1974, as amended (“ERISA”).ERISA. These
exemptions are sometimes highly complex and may in certain circumstances depend on compliance by third parties who we do not control. If for any reason these exemptions were to be revoked or challenged or otherwise become unavailable to us, such action could increase our cost of doing business or subject us to regulatory action or third-party claims, which could have a material adverse effect on our businesses. For example, in 2013 the SEC amended“bad actor” disqualification provisions of Rule 506 of Regulation D under the Securities Act to impose “bad actor” disqualification provisions that ban an issuer from offering or selling securities pursuant to the safe harbor in Rule 506 if the issuer, or any other “covered person,” is the subject of a criminal, regulatory or court order or other “disqualifying event” under the rule which has not been waived by the SEC. The definition of a “covered person” under the rule includes an issuer’s directors, general partners, managing members and executive officers and promoters and persons compensated for soliciting investors in the offering. Accordingly, our ability to rely on Rule 506 to offer or sell securities would be impaired if we or any “covered person” is the subject of a disqualifying event under the rule and we are unable to obtain a waiver or, in certain circumstances, terminate our involvement with such “covered person”.
We expect a greater level of SEC enforcement activity has increased under the new Administration, and whilecurrent Presidential administration. While we have a robust compliance program in place, it is possible this enforcement activity will target practices at which we believe we are compliant, and which were not targeted by the prior Administration.Presidential administration. For example, the Biden administration and the current leadership of the SEC have signaled that they intend to seek to enact changes to numerous areas of law and regulations currently in effect. In particular, the SEC has signaled an increased emphasis on investment adviser and private fund regulation and has enacted rules that will meaningfully affect investment advisers and their management of private funds. These include rules with respect to fund audits, adviser-led secondary transactions, fee and expense allocation and reporting, beneficial ownership reporting under Exchange Act Sections 13(d) and 13(g), reporting on Form PF, borrowings, preferential investment terms, cybersecurity risk management, ESG disclosure, annual compliance reviews and outsourcing by investment advisers. The SEC is expected to propose additional changes in the future. Such current and future rulemaking is expected to materially impact private funds and private fund advisers and their operations, including increasing compliance burdens and regulatory costs, and heightened risk of regulatory enforcement action such as public sanctions, restrictions on activities, fines and reputational damage. For example, significant time and resources are expected to be required to comply with the private fund adviser rules that the SEC adopted on August 23, 2023, including costs related to reporting and disclosures to investors. Further, implementation of the private fund advisor rules may result in us evaluating certain of our fundraising practices, which could adversely impact fundraising. Any of the foregoing could lead to further regulatory uncertainty, particularly regarding those rules that are currently (or in the future may become) subject to legal challenge from private fund industry groups and others, result in changes to our operations and could materially impact our funds and/or their investments and/or the Company, including by causing us to incur additional expenses.
Federal regulation. Under the Dodd-Frank Act, a ten10 voting-member Financial Stability Oversight Council (the “Council”(“FSOC”) has the authority to review the activities of certain nonbank financial firms engaged in financial activities that are designatedand designate them as “systemicallysystemically important” meaning, financial institutions (“SIFI”), evaluating, among other things, evaluating the impact of the distress of the financial firm on the stability of the U.S. economy. Currently, there are no non-bank financial companies with a non-bank SIFI
designation. The FSOC has, however, designated certain non-bank financial companies as SIFIs in the past, and additional non-bank financial companies, which may include large asset management companies such as us, may be designated as SIFIs in the future. In November 2023, FSOC adopted amendments to its guidance regarding procedures for designating non-bank financial companies as SIFIs which eliminated the prior guidance’s prioritization of an “activities-based” approach for identifying, assessing and addressing potential risks to financial stability. Under the previous guidance’s “activities-based” approach, FSOC indicated that it would primarily focus on regulating activities that pose systemic risk rather than focusing on individual firm-specific determinations. The elimination of an “activities-based” approach over designation of an individual firm as a non-bank SIFI may increase the likelihood of FSOC designating one or more firms as a non-bank SIFI. If we were designated as such, it would result in increased regulation of our businesses, including the imposition of capital, leverage, liquidity and risk management standards, credit exposure reporting and concentration limits, enhanced public disclosures, restrictions on acquisitions and annual stress tests by the Federal Reserve. Requirements such as these, which were designed to regulate banking institutions, would likely need to be modified to be applicable to an asset manager, although no proposals have been made indicating how such measures would be adapted for asset managers.
A section of the Dodd-Frank Act known as the Volcker Rule generally prohibits insured banks or thrifts, any bank holding company or savings and loan holding company, any non-U.S. bank with a U.S. branch, agency or commercial lending company and any subsidiaries and affiliates of such entities, regardless of geographic location, from investing in or sponsoring “covered funds,” which include private equity funds or hedge funds and certain other proprietary activities.
In October of 2020, revisions to the Volcker Rule became effective providing an exemption for activities of qualifying foreign excluded funds, revising the exclusions from the definition of a “covered fund,” creating new exclusions from the definition of a covered fund and modify the definition of an ownership interest. Although we do not currently anticipate that these changes to the Volcker Rule will adversely affect our fundraising to any significant extent, there could be adverse implications on our ability to raise funds from the types of entities mentioned above if these regulations become stricter.
Pursuant to the Dodd-Frank Act, regulation of the U.S. derivatives market is bifurcated between the CFTC and the SEC. Under the Dodd-Frank Act, the CFTC has jurisdiction over swaps and the SEC has jurisdiction over security-based swaps. Under CFTC rules, all swaps (other than security-based swaps) included in the definition of commodity interests. As a result, funds that utilize swaps (whether or not related to a physical commodity) may fall within the statutory definition of a commodity pool. If a fund qualifies as a commodity pool, then, absent an available exemption, the operator of such fund is required to register with the CFTC as a CPO. Registration with the CFTC renders such CPO subject to regulation, including with respect to disclosure, reporting, recordkeeping and business conduct, which could significantly increase operating costs by requiring additional resources.
Certain classes of interest rate swaps and certain classes of credit default swaps are subject to mandatory clearing, unless an exemption applies. Many of these swaps are also subject to mandatory trading on designated contract markets or swap execution facilities. The CFTC may propose rules designating other classes of swaps for mandatory clearing. Mandatory clearing and trade execution requirements may change the cost and availability of the swaps that we use, and exposesexpose our funds to the credit risk of the clearing house through which any cleared swap is cleared. In addition, federal bank regulatory authorities and the CFTC have adopted initial and variation margin requirements for swap dealers, security-based swap dealers and swap entities, including permissible forms of margin, custodial arrangements and documentation requirements for uncleared swaps and security-based swaps. The new rules regarding variation margin requirements are now in effect, and as a result some of our funds are required to post collateral to satisfy the variation margin requirements which has made transacting in uncleared swaps more expensive.
Position limits imposed by various regulators, self-regulatory organizations or trading facilities on derivatives may also limit our ability to effect desired trades. Position limits represent the maximum amounts of net long or net short positions that any one person or entity may own or control in a particular financial instrument. For example, theThe CFTC on January 20, 2020, voted to re-propose rulesadopted a final rule that would establishapplies specific limits on speculative positions in 25 physical commodity futures contracts, futures and options directly or indirectly linked to such contracts as well as economically equivalent swaps. The
January 1, 2022 and became effective for economically equivalent swaps on January 1, 2023. The Dodd-Frank Act also authorizes the SEC to establish position limits on security-based swaps, which rules could have a similar impact on our business. The CFTC could propose to expand such requirements to other types of contracts in the future. IfThese rules and any were enacted, the proposaladditional proposals could affect our ability and the ability for our funds to enter into derivatives transactions.
In January, 2019, rules enacted by the Board of Governors of the Federal Reserve System, FDIC and the OCC came into effect and placed limitations on the exercise of certain specified insolvency-related default and cross-default rights against a counterparty that has been designated as a global systemically important banking organization (the “Stay Regulations”). These rules are intended to mitigate the risk of destabilizing close-outs of certain qualifying financial contracts (“QFCs”) (including but not limited to, derivatives, securities lending, and short-term funding transactions, such as repurchase agreements) entered into by U.S. global systemically important banking organizations. The ultimate impact of the Stay Regulations on our business will not be known unless one or more counterparties with whom we have QFCs experiences a covered insolvency event, but it could be material.
The Dodd-Frank Act authorizes federal regulatory agencies to review and, in certain cases, prohibit compensation arrangements at financial institutions that give employees incentives to engage in conduct deemed to encourage inappropriate risk-taking by covered financial institutions. In 2016, federal bank regulatory authorities and the SEC revised and re-proposed a rule that generally (1)generally: (i) prohibits incentive-based payment arrangements that are determined to encourage inappropriate risks by certain financial institutions by providing excessive compensation or that could lead to material financial lossloss; and (2)(ii) requires those financial institutions to disclose information concerning incentive-based compensation arrangements to the appropriate federal regulator. For more information on certain incentive compensation paid to our senior executive officers, see ““—Risks Related to Shares of Our Common Stock—The market price of shares of our Class A common stock may decline due to the large number of shares of Class A common stock eligible for exchange and future sale.” The Dodd-Frank Act also directs the SEC to adopt a rule that requires public companies to adopt and disclose policies requiring, in the event the company is required to issue an accounting restatement, the contingent repayment obligations of related incentive compensation from current and former executive officers. The SEC has proposed but not yet adopted such rule. To the extent the aforementioned rules are adopted, our ability to recruit and retain investment professionals and senior management executives could be limited.
It is difficult to determine the full extent of the impact on us of new laws, regulations or initiatives that may be proposed or whether any of the proposals will become law. In addition, as a result of proposed legislation, shifting areas of
focus of regulatory enforcement bodies or otherwise, regulatory compliance practices may shift such that formerly accepted industry practices become disfavored or less common. Any changes or other developments in the regulatory framework applicable to our businesses, including the changes described above and changes to formerly accepted industry practices, may impose additional costs on us, require the attention of our senior management or result in limitations on the manner in which we conduct our businesses. Moreover, as calls for additional regulation have increased, there may be a related increase in regulatory investigations of the trading and other investment activities of alternative asset management funds, including our funds. In addition, we may be adversely affected by changes in the interpretation or enforcement of existing laws and rules by these governmental authorities and self-regulatory organizations. Compliance with any new laws or regulations could make compliance more difficult and expensive, affect the manner in which we conduct our businesses and adversely affect our profitability.
State regulation. Since 2010,A number of states and other regulatory authorities have begun to require investment managers to register as lobbyists. We have registered as such in a number of jurisdictions, including California, Illinois, New York, Pennsylvania, Louisiana, Texas and Kentucky. Other states or municipalities may consider similar legislation or adopt regulations or procedures with similar effect. These registration requirements impose significant compliance obligations on registered lobbyists and their employers, which may include annual registration fees, periodic disclosure reports and internal recordkeeping, and may also prohibit the payment of contingent fees.
Regulatory environment of our funds and portfolio companies of our funds. Each of the regulatory bodies with jurisdiction over us has regulatory powers dealing with many aspects of financial services, including the authority to grant, and in specific circumstances to cancel, permissions to carry on particular activities. A failure to comply with the obligations imposed by the Investment Advisers Act, including recordkeeping, advertisingmarketing and operating requirements, disclosure obligations and prohibitions on fraudulent activities, could result in investigations, sanctions, restrictions on the activities of us or our personnel and reputational damage. We are involved regularly in trading activities that implicate a broad number of U.S. and foreign securities and tax law regimes, including laws governing trading on inside information, market manipulation and a broad number of technical trading requirements that implicate fundamental market regulation policies. Violation of these laws could result in severe restrictions on our activities and damage to our reputation.
Compliance with existing and new or changing laws and regulations subjects us to significant costs. Moreover, our failure to comply with applicable laws or regulations, including labor and employment laws, could result in fines, censure, suspensions of personnel or other sanctions, including revocation of the registration of our relevant subsidiaries as investment advisers or registered broker-dealers. For example, the SEC requires investment advisers registered or required to register with the SEC under the Investment
Advisers Act that advise one or more private funds and have at least $150.0 million in private fund assets under management to periodically file reports on Form PF. We have filed, and will continue to file, quarterly reports on Form PF, which has resulted in increased administrative costs and requires a significant amount of attention and time to be spent by our personnel. The SEC recently adopted changes to Form PF which, among other requirements, require current reporting upon the occurrence of certain fund-level events, which will likely further increase related administrative costs and burdens. Most of the regulations to which our businesses are subject are designed primarily to protect investors in our funds and portfolio companies and to ensure the integrity of the financial markets. They are not designed to protect our stockholders. Even if a sanction is imposed against us, one of our subsidiaries or our personnel by a regulator for a small monetary amount, the costs incurred in responding to such matters could be material, the adverse publicity related to the sanction could harm our reputation, which in turn could have a material adverse effect on our businesses in a number of ways, making it harder for us to raise new funds and discouraging others from doing business with us.
In the past several years, the financial services industry, and private equity and alternative asset managers in particular, has been the subject of heightened scrutiny by regulators around the globe. In particular, the SEC and its staff have focused more narrowly on issues relevant to alternative asset management firms, including by adopting a number of new rules that will likely impose significant changes on investment advisers and their management of private funds and by forming specialized units devoted to examining such firms and, in certain cases, bringing enforcement actions against the firms, their principals and employees. In recent periods there have been a number of enforcement actions within the industry, and it is expected that the SEC will continue to pursue enforcement actions against private fund managers. This increased enforcement activity may cause us to reevaluate certain practices and adjust our compliance control function as necessary and appropriate.
A number of our investing activities, such as our direct lending business, are also subject to regulation by various U.S. and foreign regulators.regulators, and may become subject to new laws, regulations or initiatives. It is impossible to determine the full extent of the impact on us of existing regulation or any other new laws, regulations or initiatives that may be proposed or whether any of the proposals will become law. Any changes in the regulatory framework applicable to our businesses, including the changes described above, may impose additional costs on us, require the attention of our senior management or result in limitations on the manner in which we conduct our business. Complying with any new laws or regulations could be more
difficult and expensive, affect the manner in which we conduct our businesses and adversely affect our profitability. As of December 31, 2020,2023, our direct lending AUM represented 50.2%46% of our total AUM.
In May 2020, our subsidiary Ares Management LLC consented to the entry of an administrative and cease-and-desist order (the “Order”) instituted by the SEC relating to the insufficient implementation and enforcement of Ares’ written policies and procedures regarding the prevention of misuse of potentially material nonpublic information (“MNPI”) in 2016 when Ares had an employee serving on the board of directors of a public company in which one of its clients was invested. The Order did not find any misuse of MNPI by Ares or its employees; however, the Order included cease and desist provisions and a censure, and payment of a civil penalty in the amount of $1.0 million.
While the SEC’s recent lists of examination priorities include suchincludes numerous items as cybersecurity compliance and controls and conducting risk-based examinations of investment advisory firms, it is generally expected thatrelated to the SEC’s oversight of alternative asset managers will continue to focus substantially on concerns related to fiduciary duty transparencyprivate funds, such as: (i) conflicts of interest; (ii) calculation and investor disclosure practices. Although the SEC has cited improvements in disclosures and industry practices in this area, it has also indicated that there is room for improvement in particular areas, includingallocation of fees and expenses (andexpenses; (iii) compliance with certain rules under the allocationInvestment Advisers Act relating to marketing and custody; and (iv) policies and procedures regarding the use of such fees and expenses) and co-investment practices. To this end,alternative data. In addition, many firms have received inquiries during examinations or directly from the SEC’s Division of Enforcement regarding various transparency-related topics,private funds, including the acceleration of monitoring fees, the allocation of broken-deal expenses, the disclosure of operating partner or operating executive compensation, outside business activities of firm principals and employees, group purchasing arrangements and general conflicts of interest disclosures. In addition, our Private Equity Group funds have engagedFurther, the SEC has recently adopted new rules and amendments to existing rules under the Investment Advisers Act that include: (i) a requirement for detailed quarterly disclosure to private fund investors regarding performance, fees and expenses (including disclosure of the compensation paid to the investment adviser and its affiliates by the private fund) and additional portfolio investment-level disclosure regarding compensation paid to the investment adviser and its affiliates by the portfolio investment; (ii) restrictions on a private fund adviser’s ability to engage in certain activities and practices, such as charging certain fees or expenses, unless the adviser provides certain disclosures to investors, and in some cases, receive investor consent; (iii) limitations on an adviser’s ability to grant certain types of preferential terms regarding redemption or information about portfolio holdings or exposures to only certain private fund investors (e.g., through side letters); (iv) a requirement to provide written notice to investors of preferential terms granted to certain investors in the pastsame private fund; (v) a requirement to obtain an annual audit for each private fund advised by the adviser; (vi) a requirement to obtain a fairness opinion or valuation opinion in connection with an adviser-led secondary transaction; and may engage from time(vii) a requirement for the adviser to time advisors who often work with our investment teams during due diligence, provide board-level governance and support and advise portfolio company leadership. Advisors generally are third parties and typically retained by us pursuant to consulting agreements. In some cases,document an operating executive may be retained by a portfolio company directly andannual compliance review in such instances the portfolio company may compensate the operating executive directly (meaning that investors in our Private Equity Group funds may indirectly bear the operating executive’s compensation). While we believe we have made appropriate and timely disclosures regarding the engagement and compensation of these advisors, the SEC staff may disagree.writing.
Further, the SEC has highlighted valuation practices as one of its areas of focus in investment adviser examinations and has instituted enforcement actions against advisers for misleading investors about valuation. If the SEC were to investigate and find errors in our methodologies or procedures, we and/or members of our management could be subject to penalties and fines, which could harm our reputation and our business, financial condition and results of operations could be materially and adversely affected.
Regulations impacting the insurance industry could adversely affect our business and our operations.operations, and our provision of products and services to insurance companies, including through Aspida, subjects us to a variety of risks and uncertainties.
The insurance industry is subject to significant regulatory oversight, both in the U.S. and abroad. Regulatory authorities in many relevant jurisdictions have broad administrative, and in some cases discretionary, authority with respect to insurance companies and/or their investment advisors, which may include, among other things, the investments insurance companies may acquire and hold, marketing practices, affiliate transactions, reserve requirements, capital adequacy including insurance company licensing and examination, agent licensing, establishment of reserve requirements and solvency standards, premium rate regulation, admissibility of assets, policy form approval, unfair trade and claims practices, advertising, maintaining policyholder privacy, payment of dividends and distributions to shareholders, investments, review and/or approval of transactions with affiliates, reinsurance, acquisitions, mergers and other matters. Insurance regulatory authorities regularly review and update these and other requirements. Currently, there are proposals to increase the scope of regulation of insurance holding companies in the U.S., Bermuda and other jurisdictions. Current proposals in Bermuda (intended to become effective by the BMA in March 2024, subject to certain transitional and grandfathering arrangements) relate to changes to the calculation of the technical provisions framework of insurers and insurance groups, amendments to the computation and flexibility of the Bermuda Solvency Capital Requirement, updates to the prudential rules and reporting forms to modify capital requirements and revisions to the fees charged to life insurers regulated by the BMA. Changes in rules and regulations impacting the insurance industry could adversely impact our expansion into the insurance industry, the prospects of our Bermuda insurance company subsidiary Aspida Life Re Ltd. (formerly known as F&G Reinsurance Ltd) and other investments we make in the insurance industry, both in the U.S. and abroad and limit our ability to raise capital for our funds from insurance companies, which could limit our ability to grow.
The U.S. and foreign insurance industries are subject to significant regulation. Regulatory authorities in the U.S. and many relevant jurisdictions have broad regulatory (including through any regulatory support organization), administrative, and in some cases discretionary, authority with respect to insurance companies and/or their investment advisors, which may include, among other things, the investments insurance companies may acquire and hold, marketing practices, affiliate transactions, reserve requirements and capital adequacy. Because these requirements are primarily designed to protect policyholders, regulatory authorities often have wide discretion in applying restrictions and regulations, which may indirectly affect Aspida, Aspida Life, Aspida Re and other parts of our business that operate within or offer products or services to insurance industry.
We may be the target or subject of, or may have indemnification obligations related to, litigation, enforcement investigations or regulatory scrutiny. Regulators and other authorities generally have the power to bring administrative or judicial proceedings against insurance companies, which could result in, among other things, suspension or revocation of
licenses, cease and desist orders, fines, civil penalties, criminal penalties or other disciplinary action. To the extent AIS or another Ares business that offers products to insurance companies, or our subsidiary Aspida Life or Aspida Re Ltd., is directly or indirectly involved in such regulatory actions, our reputation could be harmed, we may become liable for indemnification obligations and we could potentially be subject to enforcement actions, fines and penalties.penalties from both U.S. and foreign regulators.
Insurance company investment portfolios are often subject to internal and regulatory requirements governing the categories and ratings of investment products they may acquire and hold. Many of the investment products we develop for, or other assets or investments we include in, insurance company portfolios will be rated and a ratings downgrade or any other negative action by a rating agency with respect to such products, assets or investments could make them less attractive and limit our ability to offer such products to, or invest or deploy capital on behalf of, insurers.
As the ultimate parent of the controlling entity of Aspida Life Re, Ltd, a Bermuda Class E insurance company, we are considered its “shareholder controller” (as defined in the Bermuda Insurance Act) by the Bermuda Monetary Authority, or BMA. Aspida Life Re Ltd. is subject to regulation and supervision by the BMA, and compliance with all applicable Bermuda law and Bermuda insurance statutes and regulations, including but not limited to the Bermuda Insurance Act. Under the Bermuda Insurance Act, the BMA maintains supervision over the “controllers” of all registered insurers in Bermuda. For these purposes, a “controller” includes a shareholder controller (as defined in the Bermuda Insurance Act). The Bermuda Insurance Act imposes certain notice requirements upon any person that has become, or as a result of a disposition ceased to be, a shareholder controller, and failure to comply with such requirements is punishable by a fine or imprisonment or both. In addition, the BMA may file a notice of objection to any person or entity who has become a controller of any description where it appears that such person or entity is not, or is no longer, fit and proper to be a controller of the registered insurer, and such person or entity can be subject to fines or imprisonment or both. These laws may discourage potential acquisition proposals for us and could delay, deter or prevent an acquisition of controllers of Bermuda insurers.
Employee misconduct could harm us by impairing our ability to attract and retain investors and subjecting us to significant legal liability, regulatory scrutiny and reputational harm.
Our ability to attract and retain investors and to pursue investment opportunities for our funds depends heavily upon the reputation of our professionals, especially our senior professionals. We are subject to a number of laws, obligations and standards arising from our investment management business and our authority over the assets managed by our investment management business. Further, our employees are subject to various internal policies including a Compliance Manual, a Code of Ethics and our Employee Handbook. The violation of these laws, obligations, standards or policies by any of our employees could adversely affect investors in our funds and us. Our businesses often require that we deal with confidential matters of great significance to companies in which our funds may invest. If our employees or former employees were to use or disclose confidential information improperly, we could suffer serious harm to our reputation, financial position and current and future business relationships. Employee misconduct could also include, among other things, binding us to transactions that exceed authorized limits or present unacceptable risks and other unauthorized activities or concealing unsuccessful investments (which, in either case, may result in unknown and unmanaged risks or losses), concealing or failing to disclose conflicts of interest with our funds or portfolio companies or otherwise charging (or seeking to charge) inappropriate expenses or inappropriate or unlawful behavior or actions directed towards other employees, or misappropriation of confidential or proprietary information relating to us or our funds’ portfolio companies. Such misconduct could subject us to whistleblower claims, regulatory action and monetary or other penalties. Any claims of retaliation against whistleblowers would exacerbate the consequences of any wrongdoing. The growth of our employee base and increasing operational footprint in new jurisdictions as a result of our expanding global presence may heighten the risk of any of the foregoing, particularly in the context of employees who may not have a close familiarity with industries that are regulated in the same way as ours.
It is not always possible to detect or deter employee misconduct, and the extensive precautions we take to detect and prevent this activity may not be effective in all cases. If one or more of our employees or former employees were to engage in misconduct or were to be accused of such misconduct, our businesses and our reputation could be adversely affected and a loss of investor confidence could result, which would adversely impact our ability to raise future funds. Our current and former employees and those of our funds’ portfolio companies may also become subject to allegations of sexual harassment, racial and gender discrimination or other similar misconduct, which, regardless of the ultimate outcome, may result in adverse publicity that could harm our and such portfolio company’s brand and reputation. The pervasiveness of social media, coupled with increased public focus on the externalities of activities unrelated to the business, could further magnify the reputational risks associated with negative publicity.
Changes to the method of determining the London Interbank Offered Rate (“LIBOR”)LIBOR or the selection of a replacementSOFR or SONIA as replacements for LIBOR may affect the value of investments held by us or our funds and could affect our results of operations and financial results.
In March 2013, the predecessor regulator to the FCA published final rules for the FCA’s regulation and supervision of the London Interbank Offered Rate (“LIBOR”). In particular, the FCA’s LIBOR rules include requirements that (1) an independent LIBOR administrator monitor and survey LIBOR submissions to identify breaches of practice standards and/or potentially manipulative behavior, and (2) firms submitting data to LIBOR establish and maintain a clear conflicts of interest policy and appropriate systems and controls. These requirements may cause LIBOR to be more volatile than it has been in the past, which may adversely affect the value of investments made by our funds. On February 3, 2014, ICE Benchmark Administration Limited took responsibility for administering LIBOR, following regulatory authorization by the FCA. In July 2017, the FCA, as supervisor of ICE Benchmark Administrator (“IBA”), the administrator of LIBOR, announced that it would phase out LIBOR by the end of 2021.2021 (later extended to the end of June 2023 for USD LIBOR only). IBA ceased publishing GBP, EUR, CHF and JPY LIBOR rates on January 1, 2022 and ceased publishing overnight and 12-month USD LIBOR on June, 30 2023.
In order to avoid disruption for users of LIBOR who were unable to transition to risk-free rates (“RFRs”) prior to relevant deadlines, the FCA required the continued publication of certain LIBOR settings on a changed or “synthetic” methodology (“Synthetic LIBOR”). Synthetic LIBOR settings have been largely transitioned out, and at the date of writing only 3-month GBP Synthetic LIBOR and 1-month, 3-month, and 6-month USD Synthetic LIBOR are being published. Supervised users of all financial contracts other than cleared derivatives are permitted to use these settings in respect of legacy contracts only. The currentFCA has announced that it intends to compel the publication of these Synthetic LIBOR settings permanently from the following dates: in respect of the GBP Synthetic LIBOR settings, on March 31, 2024, and in respect of the USD Synthetic LIBOR settings, on September 30, 2024.
The nominated replacement for United States Dollar-LIBORUSD LIBOR is the Secured Overnight Financing Rate (“SOFR”) and the nominated replacement for GDP-LIBORGBP-LIBOR is the Sterling Overnight Interbank Average Rate (“SONIA”). In March 2020, the Federal Reserve began publishing 30-, 90-30-day, 90-day and 180-day tenor SOFR Averages and a SOFR Index and in July 2020, Bloomberg began publishing fall-backs that the International Swaps and Derivatives Association (“ISDA”) intends to implementimplemented in lieu of LIBOR with respect to swaps and derivatives. In many cases,July 2021, the nominated replacements, as well asCME Group’s forward-looking SOFR term rates were formally recommended by the Alternative Reference Rates Committee.
SOFR and SONIA have a limited history. The future performance of SOFR and SONIA, and SOFR- and SONIA-based reference rates, is uncertain. Future levels of SOFR and SONIA may bear little or no relation to historical levels of SOFR, LIBOR or other potential replacements,rates. SOFR and SONIA are not completetransaction-based rates, and each has been more volatile than other benchmark or ready to
implement and require margin adjustments. On November 30, 2020, the ICE Benchmark Administration (“IBA”), the FCA-regulated LIBOR administrator, announced its intention to (i) consult on LIBOR cessationSOFR or SONIA may result in December 2020 and, (ii) to the extent confirmed during such consultation, to cease the one-week and two-month United States Dollar (“USD”)-LIBOR tenors by December 31, 2021, and to cease all other USD-LIBOR tenors by June 30, 2023. Further, as of December 31, 2020,market inefficiencies. For these reasons, among others, there is no forward-looking term-rateassurance that SOFR availableor SONIA, or rates derived from SOFR or SONIA, will perform in the same or similar way as USD LIBOR would have performed at any time, and there is no guaranteeassurance that one will become available prior to the full discontinuation of LIBOR.
It is unclear what methods of calculating a replacement benchmarkSOFR- or SONIA-based rates will be established or adopted generally, and whether different industry bodies, such as the loan market and the derivatives market will adopt the same methodologies. Changes in the method of calculating LIBOR, or the replacement of LIBOR with an alternative rate or benchmark, may adversely affect interest rates and result in higher borrowing costs. If LIBOR ceases to exist, we, our investments funds and our portfolio companies may need to amend or restructure our existing LIBOR-based debt instruments and any related hedging arrangements that extend beyond 2021, which may be difficult, costly and time consuming and may result in adverse tax consequences. In addition, from time to time our funds invest in floating rate loans and investment securities whose interest rates are indexed toa suitable substitute for USD LIBOR. Uncertainty as to the nature of alternative reference rates and as to potential changes or other reforms to LIBOR, or any changes announced with respect to such reforms, may result in a sudden or prolonged increase or decrease in the reported LIBOR rates and the value of LIBOR-based loans and securities, including those of other issuers we or our funds currently own or may in the future own, and may impact the availability and cost of hedging instruments and borrowings, including potentially, an increase to our and our funds' interest expense and cost of capital. Any increased costs or reduced profits as a result of the foregoing may adversely affect our liquidity, results of operations and financial condition.
Regulatory changes in jurisdictions outside the United StatesU.S. could adversely affect our businesses.
Certain of our subsidiaries operate outside the United States.U.S. In Luxembourg, Ares Management LuxembourgAM Lux is subject to regulation by the CSSF. In the U.K., AML and AMUKLthe U.K. Regulated Entities are subject to regulation by the FCA. AELM, which is not a subsidiary, but in which we are indirectly invested and which procures certain services from AML, is also subject to regulation by the FCA. In some circumstances, AML, AMUKL, AELMthe U.K. Regulated Entities and other Ares entities are or become subject to U.K. or EU laws, for instance in relation to marketing our funds to investors in the EEA.
TheDespite the U.K. exited’s departure from the EU on January 31, 2020. The withdrawal agreement between the U.K. and the EU provided for a transitional period to allow for the terms of the U.K.’s future relationship with the EU to be negotiated, which ended on December 31, 2020. EEA passporting rights are no longer available to the relevant U.K. entities following the end of the transitional period. Various EU laws have been “on-shored” into domestic U.K. legislation and certain transitional regimes and deficiency-correction powers exist to ease the transition.
The U.K. and the EU announced, on December 24, 2020 that they have reached agreement on a new Trade and Cooperation Agreement (the “TCA”), which addresses the future relationship between the parties. Notwithstanding the TCA, there remains considerable uncertainty as to the nature of the U.K.’s future relationship with the EU (particularly in the sphere of financial services), creating continuing uncertainty as to the full extent to which the businesses of the U.K. Regulated Entities could be adversely affected by Brexit. See “-The(see “—The U.K.’s exit from the EU (“Brexit”) could adversely affect our business and our operations.”
Despite the U.K.’s departure from the EU,operations” for further detail), new and existing EU legislation is expected to continue to impact our business in the U.K. (whether because its effect is preserved in the U.K. as a matter of domestic policy or because compliance with such legislation (whether in whole or part) is a necessary condition for market access into the EEA) and other EEA member states where we have operations. The following EU measures are of particular relevance to our business.
On January 1, 2019, the newThe EU Securitisation Regulation (the “Securitisation Regulation”) came into effect and applies to securitizations issued after that date. Among other things, the Securitisation Regulation includes requirements in relation to transparency and risk retention and restricts AIFMs from investing in securitizations which do not comply with its provisions (“non-compliant securitizations”). The Securitisation Regulation also imposes an obligation on AIFMs to divest where they hold anany interest in a non-compliant securitization. It is currently unclear if the Regulation applies to AIFMs domiciled outside the EEA butnon-EU marketing one or more alternative investment funds in the EEA under a national private placement regime. This lack of clarity may hamper our ability to raise capital for some of our non-EEA funds from investors in the EEA or subject such fund raising to additional risks, including, if application of the Securitisation Regulation to non-EEA AIFMs is confirmed, that their funds that market in the EEA could be required to divest of interests in non-compliant securitizations at sub-optimal prices. The
Following the U.K. has on-shored’s exit from the EU, the U.K. intends to repeal the U.K.’s current implementation of the Securitisation Regulation and therefore similar requirements continue to applyhas published draft legislation (the “Securitisation Regulations 2023”) as part of a policy statement, identifying several areas for revision in the U.K. notwithstanding Brexit.
and divergence from the EU’s Securitisation Regulation. The policy statement and the draft Securitisation Regulations 2023 are still under review and the final rules are still unclear. The EU Regulation on over-the-counter (“OTC”) derivative transactions, central counterparties and trade repositories (the “European Market Infrastructure Regulation” or “EMIR”) requires the mandatory clearing of certain OTC derivatives through central counterparties,counterparties. This creates additional risk mitigation requirements (including, in particular, margining requirements) in respect of certain OTC derivative transactions that are not cleared by a central counterparty and imposes reporting and record keeping requirements in respect of most derivative transactions. The requirements are similar to, but not the same as, those in Title VII of the Dodd-Frank Act. The U.K. has on-shored EMIR, andwith the effect that a similar but not identical set of rules therefore now apply in the U.K. notwithstanding Brexit.(“U.K. EMIR”). Certain cross-border arrangements (such as those(e.g., where an Ares European fund
enters into derivatives transactions with a U.K. counterparty, transacts on a U.K. trading venue or clears its derivatives transactions through a U.K. clearing house)house, and vice versa) may be impacted. ComplianceAlthough EMIR and U.K. EMIR are substantively similar, there are some areas of regulatory divergence (including differences in the way in which derivatives are reported and a lack of equivalence declarations between the U.K. and the EU with respect to trade repositories) and there can be no guarantee that the U.K. will move in lockstep with the relevant requirementsfuture changes proposed by the EU.
The EU regulation on transparency of securities financing transactions (“SFTR”) requires the mandatory reporting of certain securities financing transactions (“SFTs”), disclosure obligations to counterparties regarding the re-use of collateral, and certain transparency and disclosure obligations for managers of UCITS and AIFs in the EUrespect of SFTs and the U.K. (as applicable) is likely to continue to increase the burdens and coststotal return swaps. The new SFTR validation rules, which were updated in March 2023, are effective as of doing business.
A new EU Regulation on the prudential requirements of investment firms (Regulation (EU) 2019/2033) and its accompanying Directive (Directive (EU) 2019/2034) (together, “IFR/IFD”) have now been finalized and are expected to take effect on June 26, 2021. IFR/IFD will introduce a bespoke prudential regime for most MiFID investment firms to replace the one that currently applies under the fourth Capital Requirements Directive and the Capital Requirements Regulation. IFR/IFD represents a complete overhaul of “prudential” regulation in the EU. Depending on how EU member states implement IFR/IFD, certain aspects of these rules may also apply AIFMs that have been authorized to provide investment services via a MiFID “top-up” permission, such as Ares Management Luxembourg.September 2023. The U.K. has confirmedon-shored SFTR, with the effect that it will be implementing its own versiona similar but not identical set of IFR/IFD,rules apply in the Investment Firm Prudential Regulation (the “IFPR”U.K. (“U.K. SFTR”), which was initially expected to take effect from June 2021 in line with IFR/IFD but is now expected to take effect from January 1, 2022. The IFPR will apply to Ares Management Limited and. Certain cross-border arrangements (such as those where an Ares European Loan Management LLP as U.K. MiFID investment firms. The extent to which the IFPR will apply to Ares Management UK Limited, asfund enters into SFT with a U.K. AIFMcounterparty) may be impacted. Although SFTR and U.K. SFTR are substantively similar, there are some areas of regulatory divergence (including with a MiFID “top-up” permission, is as yet unclear and further clarity on this point is expectedrespect to emerge in future FCA consultations on the new regime. The new prudential regimes are expected to resultvalidation rules) and there can be no guarantee that the U.K. will move in higher regulatory capital requirements for some affected firms and new, more onerous remuneration rules, as well as re-cut and extended internal governance, disclosure, reporting, liquidity, and group “prudential” consolidation requirements (among other things), each of which could have a material impact on Ares’ European operations, although there are transitional provisions allowing firms to increase their capital during an initial period followinglockstep with the new regimes coming into force.future changes proposed by the EU.
Our U.K., other European and Asian operations and our investment activities worldwide are subject to a variety of regulatory regimes that vary by country. In the EU, examples of further legislation may include proposals for further changes to or reviews of the extent and interpretation of pay regulation, including under IFR/IFDthe EU Regulation on the prudential requirements of investment firms (Regulation (EU) 2019/2033) and its accompanying Directive (Directive (EU) 2019/2034) or the U.K. version, the Investment Firms Prudential Regime (which may have an impact on the retention and recruitment of key personnel), proposals for enhanced regulation of loan origination (see “—Alternative Investment Fund Managers Directive”), credit servicing (see “—Credit Servicers and Purchasers Directive”) and new reporting requirements in relation to securities financing transactions. In the U.K., thereadditional rule changes have been additional changes (effective since December 2019) to the rules concerningaffected the approval of certain Ares professionals in the U.K. to work in the regulated financial services sector. Assessing the impact and implementingImplementation of these new rules may create additionalincrease our compliance burden and cost for us.costs. In addition, we regularly rely on exemptions from various requirements of the regulations of certain foreign countries in conducting our asset management activities.
Each of the regulatory bodies with jurisdiction over us has regulatory powers dealing with many aspects of financial services, including the authority to grant, and in specific circumstances to cancel, permissions to carry on particular activities. We are involved regularly in trading activities that implicate a broad number of foreign (as well as U.S.) securities law regimes, including laws governing trading on inside information and market manipulation and a broad number of technical trading requirements that implicate fundamental market regulation policies. Violation of these laws could result in severe restrictions or prohibitions on our activities and damage to our reputation, which in turn could have a material adverse effect on our businesses in a number of ways, making it harder for us to raise new funds and discouraging others from doing business with us. In addition, increasing global regulatory oversight of fundraising activities, including local registration requirements in various jurisdictions and the addition of new compliance regimes, could make it more difficult for us to raise new funds or could increase the cost of raising such funds.
Alternative Investment Fund Managers Directive
The Directive took effect on July 22, 2013 andAIFMD applies to (1)to: (i) AIFMs established in the EEA that manage EEA or non-EEA AIFs, (2)AIFs; (ii) non-EEA AIFMs that manage EEA AIFsAIFs; and (3)(iii) non-EEA AIFMs that market their AIFs to professional investors within the EEA. Non-EEA AIFMs do not currently benefit from marketing passport rights and may only market AIFs to investors in some EEA jurisdictions in accordance with national private placement regimes. The U.K. implemented AIFMD while it was still a member of the EU and “on-shored” it as part of U.K. law, such that similar requirements therefore continue to apply in the U.K. notwithstanding Brexit.
In 2017On November 10, 2023, the European Commission started a review of AIFMD. The European Commission published a report on the operation of AIFMD in January 2019, which identified certain areas requiring further analysis. A subsequent report on the application and scope of AIFMD was published in June 2020. Following these reports, the European Commission launched a
public consultation relating to its review of the AIFMD in October 2020 (which closes on 29 January 2021). This is expected to result in a legislative proposal (commonlynear-final amending directive, commonly referred to as “AIFMD II”). AIFMD imposes a range of requirements on AIFMs and “leveling up” of these requirements underAssuming AIFMD II seems likely, which may increase the cost of doing business for Ares Management Luxembourgis adopted promptly and Ares’ non-EEA AIFMs (including Ares Management UK Limited) wishing to market fundspublished in the EEA and potentially disadvantages our funds as investorsOfficial Journal without delay, most of the changes will come into effect in private companies located in EEA member states when compared to non-AIF/AIFM competitors that may not be2026, subject to such requirements. Although the reports and public consultation gives some indicationgrandfathering period for certain of the direction of travel, the substance of any legislative proposal remains uncertainloan origination provisions and it is unclear whether and how any such legislationcertain Annex IV disclosure requirements which will affect us or our subsidiaries. Compliance with AIFMD II has the potential to increase the cost and complexity of raising capital and consequently may slow the pace of fundraising.come into effect a year later. It is not yet clear to what extent (if any) the U.K. will seek to reflect AIFMD II in its domestic rules implementing AIFMD.
CertainThe draft contains a number of amendments to AIFMD, including more onerous delegation requirements which may require a review of AM Lux’s existing arrangements, enhanced substance requirements, additional liquidity management provisions for AIFMs to the extent that they manage open-ended AIFs, and revised regulatory reporting and investor disclosures requirements. The draft also proposed significant new requirements relating to the activities of funds managed by AM Lux which originate loans including new restrictions on the structure which such funds may take.
AIFMD II may result in new restrictions on the ability of certain of our affiliates other than AM Lux to register funds for marketing to investors in certain EEA states.
AIFMD II imposes a range of requirements on AIFMs which may increase the cost of doing business for AM Lux and Ares’ non-EEA AIFMs (including AMUKL) to the extent they market funds in the EEA and potentially disadvantages our funds as investors in private companies located in EEA member states compared to non-AIF/AIFM competitors that may not be subject to such requirements. It is not yet clear to what extent (if any) the U.K. will seek to reflect AIFMD II in its domestic rules implementing AIFMD.
While there is no current indication that the non-EEA AIFM passport provisions of AIFMD will become effective or available, certain of the jurisdiction specific private placement regimes may cease to exist ifin the non-EEA AIFM passport becomes available.case that it does. This development could have a negative impact on our ability to raise capital from EEA investors if, for example, a jurisdiction specific private placement regime ceases to operate and the non-EEA AIFM passport is not made available to United StatesU.S. or U.K. AIFMs.
In addition to the further changes to the AIFMD, a wider review is ongoing which may lead to further changes both under the AIFMD and potentially in other areas of EU regulation, possibly leading to increased costs and/or burdens and more limit operational flexibility within the EEA and access to EEA investors.
EU measures on the cross-border distribution of investment funds
A new package of measures which will amend the existing regimes governing the cross-border distribution of collective investment funds in the EU (the “CBD Directive” and the “CBD Regulation”) came into force on August 1, 2019. The changes are largely expected to take effect from August 2, 2021. The CBD Directive and CBD Regulation amend the existing rules on the distribution of investment funds under AIFMD and The Undertakings for Collective Investment in Transferable Securities Directive (2009/65/EC). The CBD Directive amends the existing regimes for the cross-border marketing of funds and the CBD Regulation introduces new standardized requirements for cross-border fund distribution in the EU. The key changes include a new harmonized “pre-marketing” regime under AIFMD, more transparency and principles for calculating supervisory fees, new procedures for the de-notification of marketing including restrictions on pre-marketing successor funds, regulation of marketing communication as well as additional regulation in relation to reverse solicitation, with further changes expected to follow. The new regulations have the potential to hamper our ability to raise capital from EEA investors and increase the cost of doing so.
Solvency II
Solvency II sets out stronger capital adequacyThe European solvency framework and risk management requirements for European insurers and reinsurers and, in particular, dictates how much capital such firms must hold against their liabilities and introduces a risk-based assessment of those liabilities. Solvency II imposes, among other things, substantially greater quantitative and qualitative capital requirementsprudential regime for insurers and reinsurers, under the Solvency II Directive 2009/138/EC (“Solvency II”) imposes economic risk-based solvency requirements across all EU member states. Solvency II is supplemented by European Commission Delegated Regulation (EU) 2015/35 (the “Delegated Regulation”), other European Commission “delegated acts” and binding technical standards, and guidelines issued by the European Insurance and Occupational Pensions Authority. The Delegated Regulation sets out detailed requirements for individual insurance and reinsurance undertakings, as well as other supervisoryfor groups, based on the overarching provisions of Solvency II, which together make up the core of the single prudential rulebook for insurance and disclosure requirements. reinsurance undertakings in the EU.
We are not subject to Solvency II; however, many of our European insurer or reinsurer fund investors are subject to this directive, as applied under applicable domestic law. Solvency II may impact insurers’ and reinsurers’ investment decisions and their asset allocations. In addition, insurers and reinsurers will beare subject to more onerous data collation and reporting requirements. As a result, there is the potential for Solvency II couldto have an adverse indirect effect on our businesses by, among other things, restricting the ability of European insurers and reinsurers to invest in our funds and imposing on us extensive disclosure and reporting obligations for those insurers and reinsurers that do invest in our funds. A broad reviewOn September 22, 2021, the European Commission published proposed legislation to amend the Solvency II Directive. The European Parliament and the Council of the EU are still considering the legislation.
Post Brexit, Solvency II was on-shored in the U.K. In November 2022, His Majesty’s Treasury (“HM Treasury”) issued its response to its consultation on a Review of Solvency II, was carried out byoutlining the European Commissionareas of reform that would be delivered through changes to the U.K.’s Prudential Regulation Authority’s (“PRA”) rules and legislation. Two consultation papers have since followed, the first published on June 29, 2023 and the second on September 28, 2023. The first consultation paper focused on simplifying the existing framework with the intent of reducing the administrative and reporting requirements (and in 2020 (the “Solvency II 2020 review”),turn, costs) for U.K. insurance firms. The second consultation paper included proposals to reform insurers’ matching adjustment mechanism, with inputthe intention of widening the categories of assets which insurers can hold in their portfolios. The intended implementation date for the majority of the changes proposed in the consultation papers is December 31, 2024, with the reforms to the matching adjustment reforms taking effect from June 30, 2024. It is unclear at this stage the European Insurance and Occupational Pensions Authority (“EIOPA”). This included a related public consultation launched byextent to which the European Commission in July 2020. On December 17, 2020, EIOPA submitted its opinion on theproposed amendments to Solvency II 2020 review to the European Commission. The Solvency II 2020 review is expected to result in amendments to various aspects of Solvency II, although the extent of such amendments is as yet unknown.will have an indirect effect on our businesses.
MiFID II
The recast MarketsAlthough the U.K. has now withdrawn from the EU, its rules implementing MiFID II continue to have effect and MiFIR has been on-shored into U.K. law (subject to certain amendments to ensure it operates properly in Financial Instruments Directive and Markets in Financial Instruments Regulation (collectively referred to as “MiFID II”) came into effect on January 3, 2018.a U.K.-specific context). MiFID II amended the existing MiFID regime and, among other requirements, introduced new organizational and conduct of business requirements for investment firms in the EEA. MiFID II requirements apply to Ares Management LimitedAML and Ares European Loan Management LLPAELM as MiFID investment firms. Certain requirements of MiFID II also apply to AIFMs with a MiFID “top-up” permission, such as Ares Management UK LimitedAMUKL and Ares Management Luxembourg.AM Lux.
MiFID II extended MiFID requirements in a number of areas such as the receipt and payment of inducements (including investment research), suitability and appropriateness assessments, conflicts of interest, record-keeping, costs and charges disclosures, best execution, product design and governance, and transaction and trade reporting. Under MiFID II, national competent authorities are also required to establish position limits in relation to the maximum size of positions which a relevant person can hold in certain commodity derivatives. The limits apply to contracts traded on trading venues and their economically equivalent OTC contracts. The position limits established, as amended from time to time, and our ability to rely on any exemption thereunder may affect the size and types of investments we may make. Failure to comply with MiFID II and
its associated legislative acts could result in sanctions from national regulators, the loss of market access and a number of other adverse consequences which would have a detrimental impact on our business.
Although Certain aspects of MIFID II and MiFIR are subject to review and change in both the EU and the U.K. has now withdrawn fromIn August 2022, the EU its rules implementing the recast Markets in Financial Instruments Directive continue to have effect and the Markets in Financial Instruments Regulation has been on-shored into U.K. law (subject to certainintroduced amendments to ensure it operates properlyMiFID II. The key requirement is that EU MiFID firms, who are providing financial advice and portfolio management, need to carry out a mandatory assessment of the sustainability preferences of their clients. Broadly, sustainability preferences address taxonomy alignment, Sustainable Finance Disclosure Regulation (“SFDR”) sustainable investment alignment and consideration of principal adverse impacts. EU MiFID firms then need to take these into account in a U.K.-specific context) in connection with such withdrawal.the selection process of financial products.
CSPDCredit Servicers and Purchasers Directive
In March 2018, theDecember 2021, a new European Commission published a proposal for a new directive governing credit servicers, credit purchasers and the recovery of collateral in connection with loans (the “Credit Servicers and Purchasers Directive” or “CSPD”). became effective. The policy aim behind CSPD is the development of a well-functioning secondary market for non-performing loans. The original European Commission legislative proposal contemplated most national law provisions transposingMember States were required to adopt and apply measures implementing CSPD coming into effectby December 30, 2023 and entities carrying on credit servicing activities from January 1, 2021. However, this original proposal is still working its way through the legislative process and it is therefore currently unclear when CSPD will be published, let alone scheduled for implementation.
As proposed by the European Commission,December 30, 2023 were required to obtain authorization under the CSPD would applyby June 29, 2024.
The CSPD applies to, among others, “credit servicers” and “credit purchasers” and would impose a number of new requirements relating to licensing, conduct of business and provision of information.
The definition of “credit servicer” in the European Commission proposal is sufficiently broad that it could be construed to include asset managers. However, the proposal limits the scope of the requirements for credit servicers and credit purchasers to the servicing or purchasing of credit agreements originally issued by a credit institution
Ares funds which are established in the EU or its subsidiaries establishedwill be in the EU. This means that the servicingscope of CSPD where they purchase non-performing loans originally advanced(or purchases loans issued by credit funds (rather than, for example, an EU bank)credit institution that subsequently become non-performing loans) and will fallbe required to appoint a credit servicer for non-performing loans concluded with consumers. Ares funds which are established outside of the scopeEU will be required to designate an EU established representative when purchasing in-scope non-performing loans who will be responsible for compliance with the obligations imposed on the credit purchased under CSPD. The impact of the CSPD, as currently proposed. Asset managerstogether with other regulatory initiatives in the leveraged and non-performing loans markets, continues to be under review. Such requirements are unlikelylikely to act as principal credit purchasers. However, they may purchase in-scope credit agreements as agent on behalf of the funds or segregatedresult in additional compliance and operational costs for Ares managed accounts for whom they are acting and therefore may in practice be required to discharge the associated obligations on behalf of underlying clients. Compliance with these rules could involve a material cost to our business.funds.
Hong Kong Security Law.Law
On June 30, 2020, the National People’s Congress of China passed a national security law (the “National Security Law”), which criminalizes certain offenses including secession, subversion of the Chinese government, terrorism and collusion with foreign entities. The National Security Law also applies to non-permanent residents. Although the extra-territorial reach of the National Security Law remains unclear, there is a risk that the application of the National Security Law to conduct outside Hong Kong by non-permanent residents of Hong Kong could limit the activities of or negatively affect the Company, our investment funds and/or portfolio companies. The National Security Law has been condemned by the United States,U.S., the United KingdomU.K. and several EU countries. The United Statescountries and other countries may take action against China, its leadershas created additional tensions between the U.S. and leaders of Hong Kong, which may include the imposition of sanctions.China. Escalation of tensions resulting from the National Security Law, including conflict between China and other countries, protests and other government measures, as well as other economic, social or political unrest in the future, could adversely impact the security and stability of the region and may have a material adverse effect on countries in which the Company, our investment funds and portfolio companies or any of their respective personnel or assets are located. In addition, any downturn in Hong Kong’s economy could adversely affect the financial performance of the Company and our investments, or could have a significant impact on the industries in which the Company participates, and may adversely affect the operations of the Company, its investment funds and portfolio companies, including the retention of investment and other key professionals located in Hong Kong.
Regulations governing ARCC’s and ASIF’s operation as a business development companycompanies affect itstheir ability to raise, and the way in which it raises,they raise, additional capital.
As a business development company,companies, ARCC operatesand ASIF operate as a highly regulated businessbusinesses within the provisions of the Investment Company Act. Many of the regulations governing business development companies restrict, among other things, leverage incurrence, co-investments and other transactions with other entities within the Ares Operating Group. Certain of our funds may be restricted from engaging in transactions with ARCC or ASIF and itstheir respective subsidiaries. As a business development company
companies registered under the Investment Company Act, ARCC and ASIF may issue debt securities or preferred stock and borrow money from banks or other financial institutions, which we refer to collectively as “senior securities,” up to the maximum amount permitted by the Investment Company Act. Under the provisions of the Investment Company Act, ARCC isand ASIF are currently permitted, as a business development company,companies, to incur indebtedness or issue senior securities only in amounts such that itstheir respective asset coverage ratio, as calculated pursuant to the Investment Company Act, equals at least 150% after giving effect toeach such incurrence or issuance. On March 23, 2018, the Small Business Credit Availability Act (“SBCAA”) was signed into law. The SBCAA, among other things, modified the applicable provisionsARCC and ASIF are also generally prohibited from issuing and selling their respective common
stock at a price below net asset coverage ratio applicable to business development companiesvalue per share without first obtaining approval from 200% to 150% subject to certain approval, timetheir respective stockholders and disclosure requirements (including either stockholder approval or approval of a “required majority” of its board of directors). On June 21, 2018, ARCC’s board of directors, including a “required majority” of its board of directors, approved the application of the modified asset coverage requirements set forth in Section 61(a)(2) of the Investment Company Act, as amended by the SBCAA. As a result, effective on June 21, 2019, ARCC’s asset coverage requirement applicable to senior securities was reduced from 200% to 150%.independent directors.
Business development companies may issue and sell common stock at a price below net asset value per share only in limited circumstances, one of which is after obtaining stockholder approval for such issuance in accordance with the Investment Company Act. ARCC’s stockholders have, in the past, approved such issuances so that during the subsequent 12-month period, ARCC may, in one or more public or private offerings of its common stock, sell or otherwise issue shares of its common stock at a price below the then-current net asset value per share, subject to certain conditions including parameters on the amount of shares sold, approval of the sale by the directors and a requirement that the sale price be not less than approximately the market price of the shares of its common stock at specified times, less the expenses of the sale. ARCC may ask its stockholders for additional approvals from year to year. There can be no assurance that such approvals will be obtained. The extent to which ARCC is negatively affected by these regulations may affect our overall profitability.
The publicly tradedpublicly-traded investment vehicles that we manage are subject to regulatory complexities that limit the way in which they do business and may subject them to a higher level of regulatory scrutiny.
The publicly tradedpublicly-traded investment vehicles that we manage operate under a complex regulatory environment. Such companies require the application of complex tax and securities regulations and may entail a higher level of regulatory scrutiny. In addition, regulations affecting our publicly tradedpublicly-traded investment vehicles generally affect their ability to take certain actions. For example, certainCertain of our publicly traded vehicles have elected to be treated as a RIC or a REIT for U.S. federal income tax purposes. To maintain their status as a RIC or a REIT, such vehicles must meet, among other things, certain source of income, asset diversification and annual distribution requirements. ARCC isand ASIF are required to generally distribute to itstheir respective stockholders at least 90% of itstheir respective investment company taxable income to maintain itstheir RIC status. ARCC, ASIF and our publicly tradedpublicly-traded closed-end fund are subject to complex rules under the Investment Company Act, including rules that restrict certain of our funds from engaging in transactions with ARCC, ASIF or the closed-end fund. In addition, subject to certain exceptions, ARCC isand ASIF are generally prohibited from issuing and selling itstheir common stock at a price below net asset value per share and from incurring indebtedness (including for this purpose, preferred stock), if ARCC’s or ASIF’s respective asset coverage ratio, as calculated pursuant to the Investment Company Act, equals less than 150% after giving effect to such incurrence. The extent to which the publicly-traded investment vehicles that we manage are negatively affected by these regulations may affect our overall profitability.
Failure to comply with “pay to play” regulations implemented by the SEC and certain states, and changes to the “pay to play” regulatory regimes, could adversely affect our businesses.
In recent years, the SEC and several states have initiated investigations alleging that certain private equity firms and hedge funds or agents acting on their behalf have paid money to current or former government officials or their associates in exchange for improperly soliciting contracts with state pension funds. Under SEC rules addressing “pay to play” practices, investment advisers are prohibited from providing advisory services for compensation to a government entity for two years, subject to very limited exceptions, after the investment adviser, its senior executives or its personnel involved in soliciting investments from government entities make contributions to certain candidates and officials in a position to influence the hiring of an investment adviser by such government entity. Advisers are required to implement compliance policies designed, among other matters, to track contributions by certain of the adviser’s employees and engagements of third parties that solicit government entities and to keep certain records to enable the SEC to determine compliance with the rule. In addition, there have been similar rules on a state level regarding “pay to play” practices by investment advisers. FINRA adoptedalso has its own set of “pay to play” regulations which went into effect on August 20, 2017, that are similar to the SEC’s regulations.
As we have a significant number of public pension plans that are investors in our funds, these rules could impose significant economic sanctions on our businesses if we or one of the other persons covered by the rules make any such contribution or payment, whether or not material or with an intent to secure an investment from a public pension plan. We may also acquire other investment managers or hire additional personnel who are not subject to the same restrictions as us, but whose activity, and the activity of their principals, prior to our ownership or employment of such person could affect our fundraising. In addition, such investigations may require the attention of senior management and may result in fines if any of
our funds are deemed to have violated any regulations, thereby imposing additional expenses on us. Any failure on our part to comply with these rules could cause us to lose compensation for our advisory services or expose us to significant penalties and reputational damage.
Adverse incidentsIncreasing scrutiny from stakeholders and regulators with respect to ESG activitiesmatters could impact our or our funds’ portfolio companies’ reputation, the cost of our or their operations, or result in investors ceasing to allocate their capital to us, all of which could adversely affect our business and results of operations.
We, our funds and their portfolio companies face increasing public scrutiny related to ESG activities. WeA variety of organizations measure the performance of companies on ESG topics, and the results of these assessments are widely publicized. Investment in funds that specialize in companies that perform well in such assessments are increasingly popular, and major institutional investors have publicly emphasized the importance of such ESG ratings and measures to their investment decisions. If our ESG ratings or practices do not meet the standards set by such investors or our stockholders, or if we fail, or are perceived to fail, to demonstrate progress toward our ESG goals and initiatives, they may choose not to invest in our funds or exclude our common stock from their investments. Relatedly, we, our funds and their portfolio companies risk damage to our brandbrands and reputation,reputations, if we or they faildo not or are perceived to not act responsibly in a number of areas, such as diversity, equityDEI, human rights, climate change and inclusion, environmental stewardship, support for local communities, corporate governance and transparency, and consideringor consideration of ESG factors in our investment processes. Adverse incidents with respect to ESG activities could impact the value of our brand, or the brand of our funds or their portfolio companies, or the cost of our or their operations and relationships with investors, all of which could adversely affect our business and results of operations.
Conversely, anti-ESG sentiment has gained momentum across the U.S., with several states having enacted or proposed “anti-ESG” policies, legislation or issued related legal opinions. For example: (i) boycott bills target financial institutions that “boycott” or “discriminate against” companies in certain industries (e.g., energy and mining) and prohibit state entities from doing business with such institutions and/or investing the state’s assets (including pension plan assets) through such institutions; and (ii) ESG investment prohibitions require that state entities or managers/administrators of state investments make investments based solely on pecuniary factors without consideration of ESG factors. If investors subject to such legislation viewed our funds or ESG practices, including our climate-related goals and commitments, as being in contradiction of such “anti-ESG” policies, legislation or legal opinions, such investors may not invest in our funds, our ability to maintain the size of our funds could be impaired, and it could negatively affect the price of our common stock. Further, asset managers have been subject to recent scrutiny related to ESG-focused industry working groups, initiatives and associations, including organizations advancing action to address climate change or climate-related risk. Such scrutiny could expose us to the risk of antitrust investigations or challenges by federal authorities, result in reputational harm and discourage certain investors from investing in our funds. In addition, some state attorneys general have asserted that the Supreme Court’s decision striking down race-based affirmative action in higher education in June 2023 should be analogized to private employment matters and private contract matters. Several new cases alleging discrimination based on similar arguments have been filed since the decision, with scrutiny of certain corporate DEI practices increasing.
If we do not successfully manage expectations across these varied stakeholder interests, it could erode stakeholder trust, impact our reputation and constrain our investment opportunities. In addition, clients and investors may decide not to commit capital to future fundraises as a result of their assessment of our approach to and consideration of ESG. To the extent our access to capital from clients or investors focused on ESG ratings or matters is impaired, we may not be able to maintain or increase the size of our specialized funds or raise sufficient capital for new specialized funds, which may adversely affect our revenues.
In addition, our ESG initiatives, goals, targets, intentions and expectations are subject to change, and no assurance or guarantee can be given that such goals, targets, intentions or expectations (some of which are aspirational in nature) will be met. Statistics and metrics that we report relating to ESG matters are estimates and may be based on assumptions or developing standards (including our internal standards and policies). There can be no assurance that our ESG policies and procedures, including policies and procedures related to responsible investment or the application of ESG-related criteria or reviews to the investment process, including certain metrics or frameworks, will continue. Such policies and procedures may change, even materially, or may not be applied to certain investments. In addition, the act of selecting and evaluating material ESG factors is subjective by nature, and there is no guarantee that the criteria utilized, or judgement exercised by Ares, will reflect the beliefs or values, internal policies or preferred practices of investors or other managers, or align with market trends. Further, Ares may determine at any point that it is not feasible or practical to implement or complete certain of its ESG initiatives, policies and procedures based on cost, timing or other considerations.
Additionally, new regulatory initiativescertain regulations related to ESG that are applicable to us, our funds and their portfolio companies could adversely affect our business. In May 2018, theThe European Commission adopted anCommission’s “action plan on financing sustainable growth.” The action plangrowth” is designed to, among other things, designed to define and reorient investment toward sustainability. The action plan contemplates: establishing EU labels for green financial products; clarifying asset managers'managers’ and institutional investors'investors’ duties regarding sustainability in their investment decision-making processes; increasing disclosure requirements in the financial services sector around ESG and strengthening the transparency of companies on their ESG policiespolicies; and introducing a ‘green supporting factor’ in the EU prudential rules for banks and insurance companies to incorporate climate risks into banks’ and insurance companies’ risk management policies.
A numberAs part of these initiatives are underway and on December 9, 2019, Regulation (EU) 2019/2088 on sustainability-related disclosures in the financial sector was published in the Official Journal of the European Union (the “Sustainable Finance Disclosure Regulation” or “SFDR”).regulations, SFDR introducesintroduced mandatory sustainability-related transparency requirements for MiFID investment firms providing portfolio management or investment advisory services, and AIFMs. Broadly, SFDR will require such firms to makeFor Ares, this primarily impacts
our AIFMs by requiring certain firm-level website disclosures on their website and pre-contractual disclosures including (but not limited to) information onregarding how sustainability risks are integrated into our investment process and remuneration practices. Fund-level disclosures are also required in relation to the firm’sintegration of sustainability risks into investment decisions (or advice). Firmsand potential impacts on fund returns. From January 1, 2022, further disclosures in periodic reports have been required and, since January 1, 2023 certain template pre-contractual and periodic disclosures must be provided in a uniform template.
Further, firms that offer financial products (such as AIFs) that promote environmental or social characteristics, or which have a sustainable investment objective, will also need to comply with additional disclosure and periodic reporting requirements that are broadly designed to prevent firms from “greenwashing” (i.e., the holding out of a product as having green or sustainable characteristics where this is not, in fact, the case). ThereThis reporting is a risk that amainly focused on the clear and concise articulation of their ESG features and the creation of bespoke key performance indicators to support annual reporting. A significant reorientation in the market following the implementation of these and further measures could be adverse to our funds’ portfolio companies if they are perceived to be less valuable as a consequence of, among other things, their carbon footprint or “greenwashing.” The majorityThere is also a risk that market expectations in relation to SFDR categorization of financial products could adversely affect our ability to raise capital from EEA investors. In September 2023, the European Commission announced a consultation on refinement versus a wholesale re-write of product categorization criteria under SFDR, but the consultation did not contain much in the way of policy suggestions. Ares cannot guarantee that its current approach will meet future regulatory requirements, reporting frameworks or best practices, increasing the risk of SFDR will apply from March 10, 2021.related enforcement. Compliance with new requirements may lead to increased management burdens and costs.
In addition, on June 22, 2020, Regulation (EU) 2020/852 on the establishment of a framework to facilitate sustainable investment was published in the Official Journal of the European UnionEU (the “Taxonomy Regulation”). The Taxonomy Regulation sets out a framework for classifying economic activities as “environmentally sustainable” and also introduces certain mandatory disclosure and reporting requirements, (whichwhich supplement those set out in SFDR) for financial products which have an environmental sustainable investment objective or which promote environmental characteristics.SFDR. The Taxonomy Regulation is due to taketook effect in part (for climate change mitigation and adaptation) from January 1, 2022 and in part (for remaining environmental objectives) from January 1, 2023.
Much of the detail surrounding these EU sustainableSustainable finance initiatives is yetcontinue to be revealed and has been further delayed by the COVID-19 pandemicevolve rapidly so it is not possible at this stage to fully assess how our business will be affected. We are monitoring developments in relation to EU corporate sustainability reporting and proposals for laws requiring due diligence of supply chains. Guidance from EU policymakers and supervisors moves the goalposts frequently, for example a recent consultation paper on the use of ESG-related words in fund names, which, if implemented, may require changes to either the names of certain Ares funds or changes to their portfolio composition. We, our funds and their portfolio companies are subject to the risk that similar measures might be introduced in other jurisdictions in which we or they currently have investments or plan to invest in the future. Additionally, compliance with any new laws or regulations (including recent heightened SEC scrutiny regarding advisor compliance with advisors’ own internal policies) increases our regulatory burden and could make compliance more difficult and expensive, affect the manner in which we, our funds or their portfolio companies conduct our businesses and adversely affect our profitability.
WhileMoreover, on January 5, 2023, the U.K. is not expectedCorporate Sustainability Reporting Directive (“CSRD”) came into effect. Broadly, CSRD amends and strengthens the rules introduced on sustainability reporting for companies, banks and insurance companies under the Non-Financial Reporting Directive (2014/95/EU) (“NFRD”). CSRD requires a much broader range of companies to implement equivalent legislative initiatives, it has signaled an intentionproduce detailed and prescriptive reports on sustainability-related matters within their financial statements – including large EU companies (including EU subsidiaries of non-EU parent companies), EU and non-EU-companies (including small and medium sized enterprises) with listed securities on EU-regulated markets (except micro-undertakings) and non-EU companies with significant turnover and a legal presence on EU markets.
The reporting requirements will be phased in from 2024, with the first reports including audited information on sustainability-related matters being published in 2025 to introduce a new legislative framework focused on implementingcover the recommendations2024 financial year. The reporting standards under CSRD within delegated legislation have been adopted by the European Commission and are still due to be published in the Official Journal of the EU. There can be no assurance that adverse developments with respect to such risks will not adversely affect assets held by Ares managed funds that are held in certain countries or the returns from these assets. One or more of our businesses may fall within scope of CSRD and this may lead to increased management burdens and costs.
Finally, starting in 2025 AML and AMUKL will have to disclose certain climate-related financial information in line with the four overarching pillars of the TCFD recommendations (Governance, Strategy, Risk Management, Metrics & Targets) on a mandatory basis under new FCA rules. Collating the relevant data and preparing the relevant report under these new rules could impose additional compliance and administrative burden which could in turn increase costs.
In addition to the above EU regulations, Sustainability Labelling and Disclosure of Sustainability-Related Financial Stability Board Taskforce on Climate-related Financial DisclosuresInformation Instrument 2023 (“TCFD”SDR”), in particular by introducing mandatory TCFD-aligned introduces sustainability disclosure requirements, for U.K. firms. This framework is stillinvestment product labels and an ‘anti-greenwashing’ rule. The anti-greenwashing rule applies to all U.K.-authorized firms in development and will be subject to a phased implementation, meaning it is not expected to begin to apply totheir communications with clients in the asset management sector until 2022 at the earliest. It is unclear at this stage what impact this new regime will have on our business.
U.K., but the balance of the new regime is directed at U.K. investment funds and U.K. regulated asset managers, that manage or distribute such funds. The FCA has indicated it will consult in early 2024 on alternative approaches to applying the labelling regime to portfolio managers and continues to work with His Majesty’s Treasury to consider its approach in respect of overseas funds. As a result, it is not yet clear to what extent this new legislation will affect Ares. If these rules become applicable to our funds or products, then additional regulatory costs may be incurred and they may also have an impact on our ability to deliver on our fund’s investment strategies and financial returns could be adversely impacted as a result.
In Asia, regulators in Singapore and Hong Kong have introduced requirements for asset managers to integrate climate risk considerations in investment and risk management processes, together with enhanced disclosure and reporting and have also issued enhanced rules for certain ESG funds on general ESG risk management and disclosure. Meanwhile, Australia’s securities regulator issued information on “greenwashing”, and the Australian government is seeking input on the design and implementation of a climate-related financial disclosure regime.
There is also a growing regulatory interest across jurisdictions in improving transparency regarding the definition, measurement and disclosure of ESG factors in order to allow investors to validate and better understand sustainability claims. For example, on May 25, 2022, the SEC proposed amendments to rules and reporting forms concerning ESG factors. On August 23, 2023, the SEC adopted its final rule enhancing the regulation of private fund advisers, which includes requirements with respect to the disclosure of certain information to investors that could affect the way certain ESG-related information is shared. In addition, in 2021 the SEC established an enforcement task force to look into ESG practices and disclosures by public companies and investment managers and has started to bring enforcement actions based on ESG disclosures not matching actual investment processes. Growing interest on the part of investors and regulators in ESG factors and increased demand for, and scrutiny of, ESG-related disclosure by asset managers, have also increased the risk that asset managers could be perceived as, or accused of, making inaccurate or misleading statements regarding the ESG-related investment strategies or their and their funds’ ESG efforts or initiatives, or “greenwashing.” Such perception or accusation could damage our reputation, result in litigation or regulatory actions and adversely impact our ability to raise capital.
On March 21, 2022, the SEC issued a proposed rule regarding the enhancement and standardization of mandatory climate-related disclosures for investors. The proposed rule would mandate extensive disclosure of climate-related data, risks, and opportunities, including financial impacts, physical and transition risks, related governance and strategy and greenhouse gas emissions, for certain public companies.Although the ultimate date of effectiveness and the final form and substance of the requirements for the proposed rule are not yet known and the ultimate scope and impact on our business is uncertain, compliance with the proposed rule, if finalized, may result in increased legal, accounting and financial compliance costs, make some activities more difficult, time-consuming and costly, and place strain on our personnel, systems and resources. In October 2023, California enacted legislation that will ultimately require certain companies that do business in California to publicly disclose their Scopes 1, 2, and 3 greenhouse gas emissions, with third party assurance of such data, and issue public reports on their climate-related financial risk and related mitigation measures.
The SEC has also announced that it is working on proposals for mandatory disclosure of certain ESG-related matters, including with respect to board diversity and human capital management. At this time, there is uncertainty regarding the scope of such proposals or when they would become effective. Compliance with any new laws or regulations increases our regulatory burden and could make compliance more difficult and expensive, affect the manner in which we or our funds’ portfolio companies conduct our businesses and adversely affect our profitability.
Economic sanction laws in the United StatesU.S. and other jurisdictions may prohibit us and our affiliates from transacting with certain countries, individuals and companies, which could negatively impact our business, financial condition and operating results.
Economic sanction laws in the United StatesU.S. and other jurisdictions may restrict or prohibit us or our affiliates from transacting with certain countries, territories, individuals and entities. In the United States,U.S., the U.S. Department of the Treasury’s Office of Foreign Assets Control (“OFAC”) administers and enforces laws, executive orders and regulations establishing U.S. economic and trade sanctions, which restrict or prohibit, among other things, direct and indirect transactions with, and the provision of services to, certain non-U.S.foreign countries, territories, individuals and entities. These types of sanctions may significantly restrict or completely prohibit lending activities in certain jurisdictions, and if we were to violate any such laws or regulations, we may face significant legal and monetary penalties, as well as reputational damage. OFAC sanctions programs change frequently, which may make it more difficult for us or our affiliates to ensure compliance. Moreover, OFAC enforcement is increasing, which may increase the risk that an issuer or we become subject of such actual or threatened enforcement.
For instance, the Iran Threat Reduction and Syria Human Rights Act of 2012 (the “ITRA”) expanded the scope of U.S. sanctions against Iran. Additionally, Section 219 of the ITRA amended the Exchange Act to require companies subject to SEC reporting obligations under Section 13 of the Exchange Act to disclose in their periodic reports specified dealings or
transactions involving Iran or other individuals and entities targeted by certain Office of Foreign Assets Control of the TreasuryOFAC sanctions engaged in by the reporting company or any of its affiliates during the period covered by the relevant periodic report. In some cases, the ITRA requires companies to disclose these types of transactions even if they were permissible under U.S. law. Companies that currently may be or may have been at the time considered our affiliates have from time to time publicly filed and/or provided to us the disclosures reproduced on Exhibit 99.1 ofin our Quarterly Reports. We do not independently verify or participate in the preparation of these disclosures. We are required to separately file and have separately filed with the SEC a notice when such activities have been disclosed in this report or in our quarterly reports, and the SEC is required to post such notice of disclosure on its website and send the report to the President and certain U.S. Congressional committees. The President thereafter is required to initiate an investigation and, within 180 days of initiating such an investigation, determine whether sanctions should be imposed. As of December 31, 2020,2023, no sanctions have been imposed on us as a result of our disclosures of these activities. Disclosure of such activity, even if such activity is not subject to sanctions under applicable law, and any sanctions actually imposed on us or our affiliates as a result of these activities, could harm our reputation and have a negative impact on our business, financial condition and results of operations, and any failure to disclose any such activities as required could additionally result in fines or penalties. In addition, any sanctions imposed by the U.S. and other countries in connection with hostilities between Russia and Ukraine and more recently between Israel and Hamas may impact us, our funds and their portfolio companies.
The U.K.'s’s exit from the EU (“Brexit”) could adversely affect our business and our operations.
TheFollowing the U.K. exited’s exit from the European UnionEU on January 31, 2020 and a transitional period, of 11 months commenced on this date to allow for the U.K.’s future relationship with the EU to be negotiated. This transitional period ended on December 31, 2020. Following the end of this transitional period, so-called EEA “passporting rights” facilitating market access into the EEA by U.K. firms, and into the U.K. by EEA firms, are no longer available. Various EU laws have been “on-shored” into domestic U.K. legislation and certain transitional regimes and deficiency-correction powers exist to ease the transition.
The U.K. and the EU announced, in December 2020, that they have reached agreement on a new Trade and Cooperation Agreement (the “TCA”), which addresses the future relationship governs certain matters between the parties. The TCA was approved by the U.K. Parliament on December 30, 2020. Due to the TCA only being agreed shortly before the end of the transition period, it will apply on a provisional basis in the EU until it is formally ratified by the European Parliament. The TCA covers, for example, measures to preserve tariff-free trade in goods and the ability of U.K. nationals to travel to the EU on business but defers other issues.EU. While the TCA includes a commitment by the U.K. and the EU to keep their markets open for persons wishing to provide financial services through a permanent establishment, it does not substantively address future cooperation in the financial services sector or reciprocal market access into the EU by U.K. firms under equivalence arrangements. The European Commission has indicated that its assessment ofarrangements or otherwise.
A similar temporary regime, the U.K.’s repliesTMPR, allows AIFMs to its equivalence enquiries remains ongoing and, at this stage, there is no certainty ascontinue to when such assessments will be concluded or whethermarket those funds in the U.K. will be deemed equivalentthat were in some or all ofexistence on December 31, 2020, on broadly the individual assessments.same terms as previously applied. Unless extended, the TMPR lasts until December 31, 2025.
While the TCA providesand the TMPR provide clarity in some areas, there remains considerable uncertainty as to the future position of the U.K. and the arrangements which will apply to its relationships with the EU and other countries followingcountries. The implications and the endoperation of the transitional period. Ares Management Luxembourg wasTCA and the TMPR may also be subject to change and/or develop at short notice. AM Lux and its EU branches were established to enable Ares to continue certain regulated activities in the EU post Brexit.Brexit, such as the management and marketing of funds (including funds managed by affiliates of AM Lux) to European investors. Applicable regulatory requirements may increase effective tax rates within Ares’ structure or on its investments, including by way of higher levels of tax being imposed on Ares Management LuxembourgAM Lux and EU branches of Ares Management Luxembourg. As yet,AM Lux.
Further, the full impactdevelopment of Brexit on our business operations in the U.K. and the EU, and on the private investment funds industry more broadly, remains uncertain. This is driven in part by the ongoing uncertainty relating to
equivalence’s future legislative approach and the extent to which the U.K. diverges from EU legislation remains uncertain. The U.K. introduced the Financial Services and Markets Act 2023 (“FSMA 2023”) on June 29, 2023 as a significant piece of legislation that the U.K. government intends to use to bring about changes to the U.K.’s financial services and markets regime. FSMA 2023 contains a number of substantial measures that will overhaul the existing financial services regime, including the implementation of the U.K.’s post-Brexit framework through the repeal of retained EU legislation relating to financial services and markets, as well as the migration of much of that law into regulator’s rulebooks. It is likely that, with the exception of regulations which are no longer needed and which can be repealed without replacement, individual pieces of retained EU will grant reciprocal market accessonly be revoked once the relevant regulator’s final rules has been established. It is expected that the legislative reform process will be slow, with the U.K. Treasury confirming that it expects it will take a number of years to complete the process of revoking retained EU law. To the extent that U.K. firmsmaterially diverges from the EU regime, compliance with two diverging regulatory regimes in the financial sector. It is possible that certain ofEU and U.K. requirements may to continue to increase the operational burden and cost to our funds’ investments may need to be restructured to enable their objectives fully to be pursued (e.g. because of a loss of passporting rights for U.K. financial institutions or the failure to put equally effective arrangementsoperations in place). This may increase costs or make it more difficult for us to pursue our objectives. As a new agreement, the implications and the operation of the TCA may also be subject to change and/or develop at short notice.these jurisdictions.
These complex issues and other by-products of Brexit such as the tightening of credit in the U.K. commercial real estate market, may also increase the costs of having operations, conducting business and making investments in the U.K. and Europe. As a result, the performance of our funds which are focused on investing in the U.K. and to a lesser extent across Europe, such as certain funds in our Credit and Real EstateAssets Groups may be disproportionately affected compared to those funds that invest more broadly across global geographies or are focused on different regions.
The uncertainty surrounding the precise nature of the U.K.’s future legal relationship with the EU may continue to be a source of significant exchange rate fluctuations and/or other adverse effects on international markets. Unhedged currency
fluctuations have the ability to adversely affect our funds and their underlying business investments, as well as the relative value of management fees earned and impact of operational expenses on profitability.
Further, the development of the U.K.’s future legislative approach remains uncertain. The U.K. may elect in the future to repeal, amend or replace EU laws, which could exacerbate the uncertainty and result in divergent U.K. national laws and regulations. Changes to the regulatory regimes in the U.K. or the EU and its member states could materially affect our business prospects and opportunities and increase our costs. In addition, Brexit could potentially disrupt the tax jurisdictions in which we operate and affect the tax benefits or liabilities in these or other jurisdictions in a manner that is adverse to us and/or our funds. Post-Brexit regulations could potentially impact the ability of regulated entities operating, providing services and marketing on a cross-border basis in other EEA countries in reliance on passporting rights and without the need for a separate license or authorization which may impact our ability to raise new funds. Any of the foregoing could materially and adversely affect our business, results of operations and financial condition.
We are subject to risks in using prime brokers, custodians, counterparties, administrators and other agents.
Many of our funds depend on the services of prime brokers, custodians, counterparties, administrators and other agents to carry out certain securities and derivatives transactions and other administrative services. We are subject to risks of errors and mistakes made by these third parties, which may be attributed to us and subject us or our fund investors to reputational damage, penalties or losses. We may be unsuccessful in seeking reimbursement or indemnification from these third-party service providers.
The terms of the contracts with these third-party service providers are often customized and complex, and many of these arrangements occur in markets or relate to products that are not subject to regulatory oversight, although the Dodd-Frank Act provides for new regulation of the derivatives market. In particular, some of our funds utilize prime brokerage arrangements with a relatively limited number of counterparties, which has the effect of concentrating the transaction volume (and related counterparty default risk) of these funds with these counterparties.
Our funds are subject to the risk that the counterparty to one or more of these contracts defaults, either voluntarily or involuntarily, on its performance under the contract. Any such default may occur suddenly and without notice to us. Moreover, if a counterparty defaults, we may be unable to take action to cover our exposure, either because we lack contractual recourse or because market conditions make it difficult to take effective action. This inability could occur in times of market stress, which is when defaults are most likely to occur.
In addition, our risk-management models may not accurately anticipate the impact of market stress or counterparty financial condition, and as a result, we may not have taken sufficient action to reduce our risks effectively. Default risk may arise from events or circumstances that are difficult to detect, foresee or evaluate. In addition, concerns about, or a default by, one large participant could lead to significant liquidity problems for other participants, which may in turn expose us to significant losses.
Although we have risk-management models and processes to ensure that we are not exposed to a single counterparty for significant periods of time, given the large number and size of our funds, we often have large positions with a single counterparty. For example, most of our funds have credit lines. If the lender under one or more of those credit lines were to become insolvent, we may have difficulty replacing the credit line and one or more of our funds may face liquidity problems.
In the event of a counterparty default, particularly a default by a major investment bank or a default by a counterparty to a significant number of our contracts, one or more of our funds may have outstanding trades that they cannot settle or are
delayed in settling. As a result, these funds could incur material losses and the resulting market impact of a major counterparty default could harm our businesses, results of operation and financial condition.
In the event of the insolvency of a prime broker, custodian, counterparty or any other party that is holding assets of our funds as collateral, our funds might not be able to recover equivalent assets in full as they will rank among the prime broker’s, custodian’s or counterparty’s unsecured creditors in relation to the assets held as collateral. In addition, our funds’ cash held with a prime broker, custodian or counterparty generally will not be segregated from the prime broker’s, custodian’s or counterparty’s own cash, and our funds may therefore rank as unsecured creditors in relation thereto.
The counterparty risks that we face have increased in complexity and magnitude as a result of disruption in the financial markets in recent years. For example, the consolidation and elimination of counterparties has increased our concentration of counterparty risk and decreased the universe of potential counterparties, and our funds are generally not restricted from dealing with any particular counterparty or from concentrating any or all of their transactions with one counterparty. In addition, counterparties have generally reacted to recent market volatility by tightening their underwriting standards and increasing their margin requirements for all categories of financing, which has the result of decreasing the overall amount of leverage available and increasing the costs of borrowing.
A portion of our revenue, earnings and cash flow is variable, which may make it difficult for us to achieve steady earnings growth on a quarterly basis and may cause the price of shares of our Class A common stock to decline.
A portion of our revenue, earnings and cash flow is variable, primarily due to the fact that the performance incomecarried interest and incentive fees that we receive from certain of our funds can vary from quarter to quarter and year to year. In addition, the investment returns of most of our funds are volatile. We may also experience fluctuations in our results from quarter to quarter and year to year due to a number of other factors, including changes in the values of our funds’ investments, changes in the amount of distributions, dividends or interest paid in respect of investments, changes in our operating expenses, the degree to
which we encounter competition and general economic and market conditions. Such variability may lead to volatility in the trading price of shares of our Class A common stock and cause our results for a particular period not to be indicative of our performance in a future period. It may be difficult for us to achieve steady growth in earnings and cash flow on a quarterly basis, which could in turn lead to large adverse movements in the price of shares of our Class A common stock or increased volatility in the price of shares of our Class A common stock generally.
The timing and amount of performance incomecarried interest and incentive fees generated by our funds is uncertain and contributes to the volatility of our results. It takes a substantial period of time to identify attractive investment opportunities, to diligence and finance an investment and then to realize the cash value or other proceeds of an investment through a sale, public offering, recapitalization or other exit. Even if an investment proves to be profitable, it may be several years before any profits can be realized in cash or other proceeds. We cannot predict when, or if, any realization of investments will occur. If we were to have a realization event in a particular quarter or year, it may have a significant impact on our results for that particular quarter or year that may not be replicated in subsequent periods. We recognize revenue on investments in our funds based on our allocable share of realized and unrealized gains (or losses) reported by such funds, and a decline in realized or unrealized gains, or an increase in realized or unrealized losses, would adversely affect our revenue, which could increase the volatility of our results.
With respect to our funds that generate carried interest, the timing and receipt of such carried interest varies with the life cycle of our funds. During periods in which a relatively large portion of our assets under management is attributable to funds and investments in their “harvesting” period, our funds would make larger distributions than in the fund-raising or investment periods that precede harvesting. During periods in which a significant portion of our assets under management is attributable to funds that are not in their harvesting periods, we may receive substantially lower carried interest distributions. Moreover in some cases, we receive carried interest payments only upon realization of investments by the relevant fund, which contributes to the volatility of our cash flow and in other funds we are only entitled to carried interest payments after a return of all contributions and a preferred return to investors.
With respect to our funds that pay an incentive fee, the incentive fee is generally paid annually. In many cases, we earn this incentive fee only if the net asset value of a fund has increased or, in the case of certain funds, increased beyond a particular threshold. Some of our funds also have “high water marks”.marks.” If the high water mark for a particular fund is not surpassed, we would not earn an incentive fee with respect to that fund during a particular period even if the fund had positive returns in such period as a result of losses in prior periods. If the fund were to experience losses, we would not be able to earn an incentive fee from such fund until it surpassed the previous high water mark. The incentive fees we earn are, therefore, dependent on the net asset value of our fund investments, which could lead to significant volatility in our results. Finally, the timing and amount of incentive fees generated by our closed-end funds are uncertain and will contribute to the volatility of our earnings. Incentive fees depend on our closed-end funds’ investment performance and opportunities for realizing gains, which may be limited.
Because a portion of our revenue, earnings and cash flow can be variable from quarter to quarter and year to year, we do not plan to provide any guidance regarding our expected quarterly and annual operating results. The lack of guidance may affect the expectations of public market analysts and could cause increased volatility in the price of shares of our Class A common stock.
Employee misconduct could harm us by impairing our ability to attract and retain investors and subjecting us to significant legal liability, regulatory scrutiny and reputational harm.
Our ability to attract and retain investors and to pursue investment opportunities for our funds depends heavily upon the reputation of our professionals, especially our senior professionals. We are subject to a number of obligations and standards arising from our investment management business and our authority over the assets managed by our investment management business. Further, our employees are subject to various internal policies including a Code of Ethics and policies covering information systems, business continuity and information security. The violation of these obligations, standards and policies by any of our employees could adversely affect investors in our funds and us. Our businesses often require that we deal with confidential matters of great significance to companies in which our funds may invest. If our employees or former employees were to use or disclose confidential information improperly, we could suffer serious harm to our reputation, financial position and current and future business relationships. Employee misconduct could also include, among other things, binding us to transactions that exceed authorized limits or present unacceptable risks and other unauthorized activities or concealing unsuccessful investments (which, in either case, may result in unknown and unmanaged risks or losses), concealing or failing to disclose conflicts of interest with our funds or portfolio companies or otherwise charging (or seeking to charge) inappropriate expenses or inappropriate or unlawful behavior or actions directed towards other employees.
It is not always possible to detect or deter employee misconduct, and the extensive precautions we take to detect and prevent this activity may not be effective in all cases. If one or more of our employees or former employees were to engage in misconduct or were to be accused of such misconduct, our businesses and our reputation could be adversely affected and a loss of investor confidence could result, which would adversely impact our ability to raise future funds. Our current and former employees and those of our portfolio companies may also become subject to allegations of sexual harassment, racial and gender discrimination or other similar misconduct, which, regardless of the ultimate outcome, may result in adverse publicity that could harm our and such portfolio company’s brand and reputation.
Fraud and other deceptive practices or other misconduct at our funds’ portfolio companies, properties or projects could similarly subject us to liability and reputational damage and also harm our businesses.
In recent years, the U.S. Department of Justice and the SEC have devoted greater resources to enforcement of the FCPA. In addition, the U.K. significantly expanded, the reach of its anti-bribery law with the creation of the U.K. Bribery Act of 2010 (the “U.K. Bribery Act”). The U.K. Bribery Act prohibits companies that conduct business in the U.K. and their employees and representatives from giving, offering or promising bribes to any person, including non-U.K. government officials, as well as requesting, agreeing to receive or accepting bribes from any person. Under the U.K. Bribery Act, companies may be held liable for failing to prevent their employees and associated persons from violating the Act. While we have developed and implemented policies and procedures designed to ensure strict compliance by us and our personnel with the FCPA and U.K. Bribery Act, such policies and procedures may not be effective in all instances to prevent violations. Any determination that we have violated the FCPA, the U.K. Bribery Act or other applicable anti-corruption laws could subject us to, among other things, civil and criminal penalties, material fines, profit disgorgement, injunctions on future conduct, securities litigation and a general loss of investor confidence, any one of which could adversely affect our business prospects, financial position or the market value of shares of our Class A common stock.
In addition, we could be adversely affected as a result of actual or alleged misconduct by personnel of portfolio companies, properties or projects in which our funds invest. For example,invest, if there are failures by personnel at our portfolio companies, properties or projects to comply with anti-bribery, trade sanctions, Federal Energy Regulatory Commission or Environmental Protection Agency regulations or other legal and regulatory requirements that could expose us to litigation or regulatory action and otherwise adversely affect our businesses and reputation. Such misconduct could negatively affect the valuation of a fund’s investments and consequently affect our funds’ performance and negatively impact our businesses. In addition, we may face an increased risk of such misconduct to the extent
our investment in non-U.S.foreign markets, particularly emerging markets, increase. Such markets may not have established laws and regulations that are as stringent as in more developed nations, or existing laws and regulations may not be consistently enforced. For example, we may invest throughout jurisdictions that have material perceptions of corruption according to international rating standards (such as Transparency International’s Corruption Perceptions Index) such as China and India. Due diligence on investment opportunities in these jurisdictions is frequently more complicated because consistent and uniform commercial practices in such locations may not have developed. Misconduct may be especially difficult to detect in such locations, and compliance with applicable laws may be difficult to maintain and monitor.
Our use of leverage to finance our businesses exposes us to substantial risks.
As of December 31, 2020,2023, we had no$895.0 million in borrowings outstanding under our credit facility (the “Credit Facility”), and $650.0 million aggregate principal amount of senior notes and subordinated notes of $1,650.0 million and $450.0 million, respectively, are outstanding. We may choose to finance our businesses operations through further borrowings under the Credit Facility or by issuing additional debt. Our existing and future indebtedness exposes us to the typical risks associated with the use of leverage, including the same risks that are applicable to our funds that use leverage as discussed below under “-Risks“—Risks Related to Our Funds-DependenceFunds—Dependence on significant leverage in investments by our funds subjects us to volatility and contractions in the debt financing markets and could adversely affect our ability to achieve attractive rates of return on those investments.” The occurrence or continuation of any of these events or trends could cause us to suffer a decline in the credit ratings assigned to our debt by rating agencies, which would cause the interest rate applicable to borrowings under the Credit Facility to increase and could result in other material adverse effects on our businesses. We depend on financial institutions extending credit to us on terms that are reasonable to us. There is no guarantee that such institutions will continue to extend credit to us or renew any existing credit agreements we may have with them, or that we will be able to refinance outstanding facilities when they mature. In addition, the incurrence of additional debt in the future could result in potential downgrades of our existing corporate credit ratings, which could limit the availability of future financing and/or increase our cost of borrowing. Furthermore, ourthe Credit Facility and the indenture governing our senior notes contain certain covenants with which we need to comply. Non-compliance with any of the covenants without cure or waiver would constitute an event of default, and an event of default resulting from a breach of certain covenants could result, at the option of the lenders, in an acceleration of the principal and interest outstanding. In addition, if we incur additional debt, our credit rating could be adversely impacted.
Borrowings under the Credit Facility will mature in March 2025 and2027, our tranches of senior notes mature in October 2024, andNovember 2028, June 2030 respectively.and February 2052, respectively, and our subordinated notes mature in June 2051. As these borrowings and other indebtedness mature (or are otherwise repaid prior to their scheduled maturities), we may be required to either refinance them by entering into new facilities or issuing additional debt, which could result in higher borrowing costs, or issuing equity, which would dilute existing stockholders. We could also repay these borrowings by using cash on hand, cash provided by our continuing operations or cash from the sale of our assets, which could reduce distributions to holders of our Class A or non-voting common stock. We may be unable to enter into new facilities or issue debt or equity in the future on attractive terms, or at all. Borrowings under the Credit Facility are LIBOR-basedSOFR-based obligations. As a result, an increase in short-term interest rates will increase our interest costs if such borrowings have not been hedged into fixed rates.
The risks related to our use of leverage may be exacerbated by our funds’ use of leverage to finance investments. See “-Risks“—Risks Related to Our Funds-DependenceFunds—Dependence on significant leverage in investments by our funds subjects us to volatility and contractions in the debt financing markets and could adversely affect our ability to achieve attractive rates of returnsreturn on those investments.”
We are exposed to risks associated with changes in interest rates.
General interest rate fluctuations may have a substantial negative impact on our investments and investment opportunities and, accordingly, may have a material adverse effect on our investment objective and our net investment income. Because we borrow money and may issue debt securities or preferred stock to make investments, our net investment income is dependent upon the difference between the rate at which we borrow funds or pay interest or dividends on such debt securities or preferred stock and the rate at which we invest these funds. If market rates decrease we may earn less interest income from investments made during such lower rate environment. From time to time, we may also enter into certain hedging transactions to mitigate our exposure to changes in interest rates. In the past, we have entered into certain hedging transactions, such as interest rate swap agreements, to mitigate our exposure to adverse fluctuations in interest rates, and we may do so again in the future. In addition, we may increase our floating rate investmentsinstruments to position the portfolio for rate increases. On a market value basis, approximately 87% of the debt assets within our Credit Group were floating rate instruments as of December 31, 2023, which we believe helps mitigate volatility associated with changes in interest rates. However, we cannot assure you that such transactions will be successful in mitigating our exposure to interest rate risk. There can be no assurance that a significant change in market interest rates will not have a material adverse effect on our net investment income.
Trading prices tend to fluctuate more for fixed-ratefixed rate securities that have longer maturities. Although we have no policy governing the maturities of our investments, under current market conditions we expect that we will invest in a portfolio of debt generally having maturities of up to 10 years. Trading prices for debt that pays a fixed rate of return tend to fall as interest rates
rise. This means that we are subject to greater risk (other things being equal) than a fund invested solely in shorter-term securities. A decline in the prices of the debt we own could adversely affect the trading price of our common stock. Also, an increase in interest rates available to investors could make an investment in our common stock less attractive if we are not able to increase our dividend rate, which could reduce the value of our common stock.
Operational risks may disrupt our businesses, result in losses or limit our growth.
We face operational risk from errors made in the execution, confirmation or settlement of transactions. We also face operational risk from transactions and key data not being properly recorded, evaluated or accounted for in our funds. In particular, our Credit Group, and to a lesser extent our Private Equity Group, are highly dependent on our ability to process and evaluate, on a daily basis, transactions across markets and geographies in a time-sensitive, efficient and accurate manner. Consequently, we rely heavily on our financial, accounting and other data processing systems. New investment products we may introduce could create a significant risk that our existing systems may not be adequate to identify or control the relevant risks in the investment strategies employed by such new investment products.
In addition, we operate in a business that is highly dependent on information systems and technology. Our information systems and technology may not continue to be able to accommodate our growth, particularly our growth internationally, and the cost of maintaining the information systems technology may increase from its current level. Such a failure to accommodate growth, or an increase in costs related to the information systems technology, could have a material adverse effect on our business and results of operations.
Furthermore, our headquarters and a substantial portion of our personnel are located in Los Angeles. An earthquake or other disaster or a disruption in the infrastructure that supports our businesses, including a disruption involving electronic communications, our internal human resources systems or other services used by us or third parties with whom we conduct business, or directly affecting our headquarters, could have a material adverse effect on our ability to continue to operate our businesses without interruption. Although we have disaster recovery programs in place, these may not be sufficient to mitigate the harm that may result from such a disaster or disruption. In addition, insurance and other safeguards might only partially reimburse us for our losses, if at all.
Finally, weWe also rely on third-party service providers for certain aspects of our businesses, including for certain information systems, technology and administration of our funds and compliance matters. Operational risks could increase as vendorsthird-party service providers increasingly offer mobile and cloud-based software services rather than software services that can be operated within our own data centers, as certain aspects of the security of such technologies may be complex, unpredictable or beyond our control, and any failure by mobile technology andor cloud service providers to adequately safeguard their systems and prevent cyber-attacks could disrupt our operations and result in misappropriation, corruption or loss of confidential, proprietary or proprietarypersonal information. In addition, our counterparties’ information systems, technology andor accounts may be the target of cyber attacks and identity theft.cyber-attacks. Any interruption or deterioration in the performance of these third parties or the service providers of our counterparties or failures or vulnerabilities of their respective information systems andor technology could impair the quality of our funds’ operations and could impact our reputation, adversely affect our businesses and limit our ability to grow.
Finally, there has been significant evolution and developments in the use of artificial intelligence technologies, including large language models, such as ChatGPT. We cannot fully determine the impact of such evolving technology to our business at this time.
Our investments in subsidiaries that have made a significant investmentsponsored SPACs and invested in a subsidiary that is the sponsor of a SPAC,their business combination targets may expose us to increased liabilities, and willwe may suffer the loss of all or a portion of our investmentinvestments if the SPAC does not complete an acquisition within two years.a business combination by the applicable deadline or the target is unsuccessful.
In February 2021, we invested $23.0 million into a subsidiary that is the sponsor of Ares Acquisition Corp (NYSE: AAC),AAC I, a blank check company. On December 5, 2022, AAC I entered into a business combination agreement among AAC I, X-Energy Reactor Company, LLC (“X-energy”), a Delaware limited liability company and additional parties thereto. On October 31, 2023, AAC I announced that it mutually agreed to terminate its previously announced business combination with X-energy, given challenging market conditions, peer-company trading performance and a balancing of the benefits and drawbacks of becoming a publicly-traded company under current circumstances. Because AAC I did not complete a business combination within the time period required by its amended and restated memorandum and articles of association, AAC I has redeemed all outstanding Class A ordinary shares and ceased all operations other than legal dissolution. In December 2023, we invested $50.0 million into X-energy to support X-energy’s continued growth as a private company. We may lose all or a portion of our investment if X-energy is unsuccessful as a private company.
In April 2023, we invested $14.3 million into a subsidiary that is the sponsor of AAC II, a blank check company. AAC II has until April 25, 2025 to complete a business combination. Prior to a business combination, the Sponsorsponsor of AAC II (and its
permitted transferees) holds 100% of the Class B ordinary shares outstanding of AAC.AAC II. The Class B ordinary shares equal 20% of the outstanding Class A ordinary shares of AAC.AAC II. Upon the successful completion of an acquisition the pro forma ownership of the new company will vary depending on the business combination terms. There can be no assurances that this scenario and the resulting ownership will manifest, as changes may be made depending upon business combination terms. There is no assurance that the SPACAAC II will be successful in completing a business combination or that any business combination will be successful.
Adverse legal and regulatory developments relating to SPACs and their sponsors could adversely affect our business and reputation and result in significant losses and expenses.
We have sponsored AAC I, AAC II and may in the future continue to sponsor or otherwise utilize SPACs or other blank check companies in connection with the operation of our business. Regulatory and legal scrutiny of SPACs and other blank check companies increased significantly in recent years. For example, in 2021, the SEC’s staff issued statements relating to certain accounting classifications applicable to the financial statements prepared by SPACs, leading to many SPACs, including AAC I, having to restate their financial statements and, in January 2024, the SEC adopted final rules that, among other items, impose additional disclosure requirements in business combination transactions involving SPACs and private operating companies; amend the financial statement requirements applicable to business combination transactions involving such companies; update and expand guidance regarding the general use of projections in SEC filings, including requiring disclosure of all material bases of the projections and all material assumptions underlying the projections; increase the potential liability of certain participants in proposed business combination transactions; and could impact the extent to which SPACs could become subject to regulation under the Investment Company Act. The Company canSEC has also recently brought enforcement actions against a SPAC and its sponsor for misleading claims in advance of a proposed business combination. In addition, litigation challenging completed and pending acquisitions by SPACs has increased, and in such litigation, it is possible that sponsors and/or their director designees may be held liable either for breaches of fiduciary duties owed to the SPAC’s public stockholders or for certain actions or omissions by the SPAC, including the failure by the SPAC to comply with applicable securities laws. Litigation has also arisen asserting that SPACs are violating federal securities laws by operating as unregistered investment companies. Any liabilities arising from these developments could adversely impact our business as well as harm our professional reputation. Moreover, we may lose its entireall or a portion of our investment in theany SPAC that we sponsor or become affiliated with if a business combination is not completed within 24 monthsas contemplated or if the business combination is not successful,unsuccessful, which may adversely impact our stockholder value.also result in significant regulatory scrutiny, litigation costs and other expenses. AAC I did not complete a business combination within the time period required by its amended and restated memorandum and articles of association, and is going through the dissolution and liquidation process.
Risks Related to Our Funds
The historical returns attributable to our funds should not be considered as indicative of the future results of our funds or of our future results or of any returns expected on an investment in shares of our Class A common stock.
The historical performance of our funds is relevant to us primarily insofar as it is indicative of performance incomecarried interest and incentive fees we have earned in the past and may earn in the future and our reputation and ability to raise new funds and therefore earn management fees on such new funds. The historical and potential returns of the funds we advise are not, however, directly linked to returns on shares of our Class A common stock. Therefore, holders of our Class A common stock should not conclude that positive performance of the funds we advise will necessarily result in positive returns on an investment in shares of our Class A common stock. An investment in shares of our Class A common stock is not an investment in any of our funds. Also, there is no assurance that projections in respect of our funds or unrealized valuations will be realized.
Moreover, the historical returns of our funds should not be considered indicative of the future returns of these or from any future funds we may raise, in part because:
•market conditions during previous periods may have been significantly more favorable for generating positive performance than the market conditions we may experience in the future;
•our funds’ rates of returns, which are calculated on the basis of net asset value of the funds’ investments, reflect unrealized gains, which may never be realized;
•our funds’ returns have previously benefited from investment opportunities and general market conditions that may not recur, including the availability of debt capital on attractive terms and the availability of distressed debt opportunities, and we may not be able to achieve the same returns or profitable investment opportunities or deploy capital as quickly;
•the historical returns that we present in this Annual Report on Form 10-K derive largely from the performance of our earlier funds, whereas future fund returns will depend increasingly on the performance of our newer funds or funds not yet formed, which may have little or no realized investment track record;
•our funds’ historical investments were made over a long period of time and over the course of various market and macroeconomic cycles, and the circumstances under which our current or future funds may make future investments may differ significantly from those conditions prevailing in the past;
•the attractive returns of certain of our funds have been driven by the rapid return of invested capital, which has not occurred with respect to all of our funds and we believe is less likely to occur in the future;
•in recent years, there has been increased competition for investment opportunities resulting from the increased amount of capital invested in alternative funds and high liquidity in debt markets, and the increased competition for investments may reduce our returns in the future; and
•our newly established funds may generate lower returns during the period that they take to deploy their capital.
The future internal rate of return for any current or future fund may vary considerably from the historical internal rate of return generated by any particular fund, or for our funds as a whole. Future returns will also be affected by the risks described elsewhere in this Annual Report on Form 10-K, including risks of the industries and businesses in which a particular fund invests.
Valuation methodologies for certain assets can be subject to significant subjectivity, and the values of assets may never be realized.
Many of the investments of our funds are illiquid and thus have no readily ascertainable market prices. We value these investments based on our estimate, or an independent third party’s estimate, of their fair value as of the date of determination, which often involves significant subjectivity. There is no single standard for determining fair value in good faith and in many cases fair value is best expressed as a range of fair values from which a single estimate may be derived. We estimate the fair value of our investments based on third-party models, or models developed by us, which include discounted cash flow analyses and other techniques and may be based, at least in part, on independently sourced market parameters. The material estimates and assumptions used in these models include the timing and expected amount of cash flows, the appropriateness of discount rates used, and, in some cases, the ability to execute, the timing of and the estimated proceeds from expected financings, some or all of which factors may be ascribed more or less weight in light of the particular circumstances. The actual results related to any particular investment often vary materially as a result of the inaccuracy of these estimates and assumptions. In addition, because many of the illiquid investments held by our funds are in industries or sectors which are unstable, in distress or undergoing some uncertainty, such investments are subject to rapid changes in value caused by sudden company-specific or industry-wide developments.
We include the fair value of illiquid assets in the calculations of net asset values, returns of our funds and our assets under management. Furthermore, we recognize performance incomecarried interest and incentive fees from affiliates based in part on these estimated fair values. Because these valuations are inherently uncertain, they may fluctuate greatly from period to period. Also, they may vary greatly from the prices that would be obtained if the assets were to be liquidated on the date of the valuation and often do vary greatly from the prices we eventually realize; as a result, there can be no assurance that such unrealized valuations will be fully or timely realized.
In addition, the values of our investments in publicly tradedpublicly-traded assets are subject to significant volatility, including due to a number of factors beyond our control. These include actual or anticipated fluctuations in the quarterly and annual results of
these companies or other companies in their industries, market perceptions concerning the availability of additional securities for sale, general economic, social or political developments, changes in industry conditions or government regulations, changes in management or capital structure and significant acquisitions and dispositions. Because the market prices of these securities can be volatile, the valuations of these assets change from period to period, and the valuation for any particular period may not be realized at the time of disposition. In addition, market values may be based on indicative rather than actual trading prices, and may therefore lack precision. Further, because our funds often hold large positions in their portfolio companies, the disposition of these securities often is delayed for, or takes place over, long periods of time, which can further expose us to volatility risk. Even if we hold a quantity of public securities that may be difficult to sell in a single transaction, we do not discount the market price of the security for purposes of our valuations.
Although we frequently engage independent third parties to perform the foregoing valuations, the valuation process remains inherently subjective for the reasons described above.
If we realize value on an investment that is significantly lower than the value at which it was reflected in a fund’s net asset values, we would suffer losses in the applicable fund. This could in turn lead to a decline in asset management fees and a loss equal to the portion of the performance incomecarried interest and incentive fees from affiliates reported in prior periods that was not realized upon disposition. These effects could become applicable to a large number of our investments if our estimates and assumptions used in estimating their fair values differ from future valuations due to market developments. See “Item 7. Management’s Discussion and Analysis of Financial Condition and Results of Operations-SegmentOperations—Segment Analysis” for information related to fund activity that is no longer consolidated. If asset values turn out to be materially different than values reflected in fund net asset values, fund investors could lose confidence which could, in turn, result in difficulties in raising additional investments.
The valuation process for the portfolio holdings of our registered funds and business development companies that we manage may create a conflict of interest.
Effective September 2022, Rule 2a-5 under the Investment Company Act establishes requirements for good faith determinations of fair value, and addresses both the board’s and the “valuation designee’s” roles and responsibilities relating to determinations of the fair value of securities without readily available market quotations. Each of the boards of the investment companies registered under the Investment Company Act (collectively, the “registered funds”) and the business development companies that we manage have designated their respective investment advisers to serve as valuation designee. These investment advisers are subsidiaries of the Company.
A substantial majority of our registered funds’ and business development companies’ portfolio holdings are comprised of investments that are not publicly-traded and do not otherwise have readily available market quotations. As a result, as required by the Investment Company Act and pursuant to Rule 2a-5 under the Investment Company Act, each of our registered funds’ and business development companies’ valuation designees will determine the fair value of these securities in good faith. The participation of employees of the Company’s subsidiaries in our business development companies’ valuation processes could result in a conflict of interest since certain of our funds pay base management fees that may fluctuate with changes in value.
Market values of debt instruments and publicly tradedpublicly-traded securities that our funds hold as investments may be volatile.
The market prices of debt instruments and publicly tradedpublicly-traded securities held by some of our funds may be volatile and are likely to fluctuate due to a number of factors beyond our control, including actual or anticipated changes in the profitability of the issuers of such securities, general economic, social or political developments, changes in industry conditions, changes in government regulation, shortfalls in operating results from levels forecast by securities analysts, inflation and rapid fluctuations in inflation rates and the general state of the securities markets as described above under “Risks“—Risks Related to Our Business-DifficultBusinesses—Difficult market and political conditions may adversely affect our businesses in many ways, including by reducing the value or hampering the performance of the investments made by our funds or reducing the ability of our funds to raise or deploy capital, each of which could materially reduce our revenue, earnings and cash flow and adversely affect our financial prospects and condition,” and other material events, such as significant management changes, financings, re-financings, securities issuances, acquisitions and dispositions. The value of publicly tradedpublicly-traded securities in which our funds invest may be particularly volatile as a result of these factors. In addition, debt instruments that are held by our funds to maturity or for long terms must be “marked-to-market” periodically, and their values are therefore vulnerable to interest rate fluctuations and the changes in the general state of the credit environment, notwithstanding their underlying performance. Changes in the values of these investments may adversely affect our investment performance and our results of operations.
Our funds may be unable to deploy capital at a steady and consistent pace, which could have an adverse effect on our results of operations and future fundraising.
The pace and consistency of our funds’ capital deployment has been, and may in the future continue to be, affected by a range of factors, including market conditions, regulatory developments and increased competition, which are beyond our control. In particular, the private equity and real estate markets have recently experienced a slowdown in deal activity. In addition, the private markets have continued to experience challenges with downward pressure on valuations and muted opportunities for realizations. To the extent these market dynamics continue, it may continue to impact the pace and consistency of our funds’ capital deployment. During the same period, our AUM not yet paying fees increasedmay increase due to ongoing fundraising. While this AUM not yet paying fees represents significant future fee-earning potential, our inability to deploy this capital on the timeframe we expect, or at all, and on terms that we believe are attractive, would reduce or delay the management fees, carried interest and performance incomeincentive fees that we would otherwise expect to earn on this capital. Any such reduction or delay would impair our ability to offset investments in additional resources that we often make to manage new capital, including hiring additional professionals. Moreover, we could be delayed in raising successor funds. The impact of any such reduction or delay would be particularly adverse with respect to funds where management fees are paid on invested capital. Any of the foregoing could have a material adverse effect on our results of operations and growth.
Our funds depend on investment cycles, and any change in such cycles could have an adverse effect on our investment prospects.
Cyclicality is important to our businesses. Weak economic environments have often provided attractive investment opportunities and strong relative investment performance. Conversely, we tend to realize value from our investments in times of economic expansion, when opportunities to sell investments may be greater. Thus, we depend on the cyclicality of the market to sustain our businesses and generate attractive risk-adjusted returns over extended periods. Any significant ongoing volatility or
prolonged economic expansion or recession could have an adverse impact on certain of our funds and materially affect our ability to deliver attractive investment returns or generate incentive or other income.
Dependence on significant leverage by our funds subjects us to volatility and contractions in the debt financing markets could adversely affect our ability to achieve attractive rates of return on those investments.
Some of our funds and their investments rely on the use of leverage, and our ability to achieve attractive rates of return on investments will depend on our ability to access sufficient sources of indebtedness at attractive rates. If our funds or the companies in which our funds invest raise capital in the structured credit, leveraged loan, high yield bond or investment grade bond markets, the results of their operations may suffer if such markets experience dislocations, contractions or volatility. Any such events could adversely impact the availability of credit to businesses generally and could lead to an overall weakening of the U.S. and global economies.
Recently, the credit markets have experienced heightened volatility. Significant ongoing volatility or a protracted economic downturn could adversely affect the financial resources of our funds and their investments (in particular those investments that depend on credit from third parties or that otherwise participate in the credit markets) and their ability to make principal and interest payments on outstanding debt, or refinance outstanding debt when due. Moreover, these events could affect the terms of available debt financing with, for example, higher rates, higher equity requirements and/or more restrictive covenants, particularly in the area of acquisition financings for leveraged buyout and real estate assets transactions.
The absence of available sources of sufficient debt financing for extended periods of time or an increase in either the general levels of interest rates or in the risk spread demanded by sources of indebtedness would make it more expensive to finance those investments. Future increases in interest rates could also make it more difficult to locate and consummate investments because other potential buyers, including operating companies acting as strategic buyers, may be able to bid for an asset at a higher price due to a lower overall cost of capital or their ability to benefit from a higher amount of cost savings following the acquisition of the asset. In addition, a portion of the indebtedness used to finance investments often includes high yield debt securities issued in the capital markets. Availability of capital from the high yield debt markets is subject to significant volatility, and there may be times when our funds are unable to access those markets at attractive rates, or at all, when completing an investment. Certain investments may also be financed through borrowings on fund-level debt facilities, which may or may not be available for a refinancing at the end of their respective terms.
In the event that our funds are unable to obtain committed debt financing for potential acquisitions or can only obtain debt at an increased interest rate or on unfavorable terms, our funds may have difficulty completing otherwise profitable acquisitions or may generate profits that are lower than would otherwise be the case, either of which could reduce the performance and investment income earned by us. Similarly, our funds’ portfolio companies regularly utilize the corporate debt markets to obtain financing for their operations. If the credit markets render such financing difficult to obtain or more expensive, this may negatively impact the operating performance of those portfolio companies and, therefore, the investment returns of our funds. In addition, if the markets make it difficult or impossible to refinance debt that is maturing in the near term, some of our funds’ portfolio companies may be unable to repay such debt at maturity and may be forced to sell assets, undergo a recapitalization or seek bankruptcy protection. Any of the foregoing circumstances could have a material adverse effect on our financial condition, results of operations and cash flow.
When our funds’ existing portfolio investments reach the point when debt incurred to finance those investments matures in significant amounts and must be either repaid or refinanced, those investments may materially suffer if they have not generated sufficient cash flow to repay maturing debt and there is insufficient capacity and availability in the financing markets to permit them to refinance maturing debt on satisfactory terms, or at all. A persistence of the limited availability of financing for such purposes for an extended period of time when significant amounts of the debt incurred to finance our funds’ existing portfolio investments becomes due could have a material adverse effect on these funds.
Our funds may choose to use leverage as part of their respective investment programs and certain funds, particularly in our Credit Group, regularly borrow a substantial amount of their capital. The use of leverage poses a significant degree of risk and enhances the possibility of a significant loss in the value of the investment portfolio. A fund may borrow money from time to time to purchase or carry securities or may enter into derivative transactions with counterparties that have embedded leverage. The interest expense and other costs incurred in connection with such borrowing may not be recovered by
appreciation in the securities purchased or carried and will be lost, and the timing and magnitude of such losses may be accelerated or exacerbated, in the event of a decline in the market value of such securities. Gains realized with borrowed funds may cause the fund’s net asset value to increase at a faster rate than would be the case without borrowings. However, if investment results fail to cover the cost of borrowings, the fund’s net asset value could also decrease faster than if there had been no borrowings. In addition, as a business development companycompanies registered under the Investment Company Act, ARCC isand ASIF are currently permitted to incur indebtedness or issue senior securities only in amounts such that its asset coverage ratio equals at
least 150% after each such issuance. ARCC’sARCC and ASIF’s ability to pay dividends will be restricted if itstheir respective asset coverage ratio falls below 150% and any amounts that it usesthey use to service itstheir respective indebtedness are not available for dividends to its common stockholders. Any of the foregoing circumstances could have a material adverse effect on our financial condition, results of operations and cash flow.
Some of our funds may invest in companies that are highly leveraged, which may increase the risk of loss associated with those investments.
Some of our funds may invest in companies whose capital structures involve significant leverage. For example, in many non-distressed private equity investments, indebtedness may be as much as 75% or more of a portfolio company’s or real estate asset’s total debt and equity capitalization, including debt that may be incurred in connection with the investment, whether incurred at or above the investment-level entity. In distressed situations, indebtedness may exceed 100% or more of a portfolio company’s capitalization. Investments in highly leveraged entities are inherently more sensitive to declines in revenues, increases in expenses and interest rates and volatile or adverse economic, market and industry developments. Additionally, the debt positions acquired by our funds may be the most junior in what could be a complex capital structure, and thus subject us to the greatest risk of loss in the event of insolvency, liquidation, dissolution, reorganization or bankruptcy of one of these companies. Furthermore, the incurrence of a significant amount of indebtedness by an entity could, among other things:
•subject the entity to a number of restrictive covenants, terms and conditions, any violation of which could be viewed by creditors as an event of default and could materially impact our ability to realize value from the investment;
•allow even moderate reductions in operating cash flow to render the entity unable to service its indebtedness, leading to a bankruptcy or other reorganization of the entity and a loss of part or all of our fund’s equity investment in it; and
•give rise to an obligation to make mandatory prepayments of debt using excess cash flow, which might limit the entity’s ability to respond to changing industry conditions if additional cash is needed for the response, to make unplanned but necessary capital expenditures or to take advantage of growth opportunities;
As a result, the risk of loss associated with a leveraged entity is generally greater than for companies with comparatively less debt.
Many of our funds invest in assets that are high risk, illiquid or subject to restrictions on transfer and we may fail to realize any profits from these activities ever or for a considerable period of time.time or lose some or all of the capital invested.
Many of our funds invest in securities that are not publicly traded.publicly-traded. In many cases, our funds may be prohibited by contract or by applicable securities laws from selling such securities for a period of time. Our funds generally cannot sell these securities publicly unless either their sale is registered under applicable securities laws or an exemption from such registration is available.available, and then only at such times when we do not possess material nonpublic information. Accordingly, our funds may be forced, under certain conditions, to sell securities at a loss. The ability of many of our funds, particularly our Private Equity Group funds, to dispose of these investments is heavily dependent on the capital markets and in particular the public equity markets. For example, the ability to realize any value from an investment may depend upon the ability of the portfolio company in which such investment is held to complete an initial public offering. Even if the securities are publicly traded,publicly-traded, large holdings of securities can often be disposed of only over a substantial period of time. Moreover, because the investment strategy of many of our funds, particularly our Private Equity Group funds, often entails our having representation on our funds’ public portfolio company boards, our funds can affect such sales only during limited trading windows, exposing thewindows. Each of these exposes investment returns to risks of downward movement in market prices during the intended disposition period. In addition, market conditions and the regulatory environment can also delay our funds' ability to exit and realize value from their investments. For example, rising interest rates and challenging credit markets may make it difficult for potential buyers to raise sufficient capital to purchase our funds’ investments. Government policies regarding certain regulations, such as antitrust law, or restrictions on foreign investment in certain of our funds’ portfolio companies or assets can also limit our funds’ exit opportunities. The recently enacted Foreign Investment Risk Review Modernization Act (“FIRRMA”) and related regulations significantly expanded the types of transactions that are subject to the jurisdiction of the Committee on Foreign Investment in the United States (“CFIUS”). Under FIRRMA, CFIUS has the authority to review and potentially block or impose conditions on certain foreign investments in U.S. companies or real estate, which may reduce the number of potential buyers and limit the ability of our funds to exit from certain investments. In addition, our Credit Group funds may hold investments in portfolio companies of such Private Equity Group funds on which we have board representation and be restricted for extended periods of time from selling their investments. As such,a result, we may fail to realize any profits from our investments in the funds that hold these securities for a considerable period of time or at all, and we may lose some or all of the principal amount of our investments. In addition, market conditions can also delay our funds’ ability to exit and realize value from their investments. For example, rising interest rates and challenging credit markets may make it difficult for potential buyers to raise sufficient capital to purchase our funds’ investments. Although the equity markets are not the only means by which we exit investments from our funds, the strength and liquidity of the U.S. and relevant global equity markets generally, and the initial public offering market specifically, affect the valuation of, and our ability to successfully exit, our
equity positions in the portfolio companies of our funds in a timely manner. We may also realize investments through strategic sales. When financing is not available or becomes too costly, it may be more difficult to find a buyer that can successfully raise sufficient capital to purchase our investments. In addition, volatile debt and equity markets may also make the exit of our investments more difficult to execute.
Certain investments may trade on an “over-the-counter” market, which may be any location where the buyer and seller can settle a price. A significant portion of our funds’ investments are not expected to trade in any market. Due to the lack of centralized information and trading, the valuation of such instruments may carry more risk than publicly-traded common stock. Uncertainties in the conditions of the financial market, unreliable reference data, lack of transparency and inconsistency of valuation models and processes may lead to inaccurate asset pricing (or valuation). In addition, other market participants may value a fund’s investments differently than us.
As many of our funds have a finite term, we could also be forced to dispose of investments sooner than otherwise desirable. Accordingly, under certain conditions, our funds may be forced to either sell their investments at lower prices than they had expected to realize or defer sales that they had planned to make, potentially for a considerable period of time. We have made and expect to continue to make significant capital investments in our current and future funds and other strategies. Contributing capital to these funds and new strategies is risky, and we may lose some or all of the principal amount of our investments.
Government policies regarding certain regulations, such as antitrust law, or restrictions on foreign investment in certain of our funds’ portfolio companies or assets can also make it more difficult for us to deploy capital in certain jurisdictions and limit our funds’ exit opportunities.
The U.S. and many non-U.S. jurisdictions have laws designed to protect national security or to restrict foreign direct investment. For example, under the U.S. Foreign Investment Risk Review Modernization Act (“FIRRMA”), the Committee on Foreign Investment in the United States (“CFIUS”) has the authority to review, block or impose conditions on investments by non-U.S. persons in U.S. companies or real assets deemed critical or sensitive to the United States. Many non-U.S. jurisdictions restrict foreign investment in assets important to national security by taking steps including, but not limited to, placing limitations, restrictions or conditions on foreign equity investment, implementing investment screening or approval mechanisms and restricting the employment of foreigners as key personnel. These U.S. and foreign laws could limit our funds’ ability to invest in certain businesses or entities or impose burdensome notification requirements, operational restrictions or delays in pursuing and consummating transactions.
Certain of our investments may be subject to review and approval by CFIUS or any non-U.S. equivalents thereof, which may have outsized impacts on transaction certainty, timing, feasibility and cost, and may prevent us from maintaining or pursuing investment opportunities that we otherwise would have maintained or pursued. CFIUS or any non-U.S. equivalents thereof may seek to impose limitations, conditions or restrictions on or prohibit one or more of our investments, which may adversely affect the ability of our funds to execute on their investment strategy with respect to such transaction as well as limit our flexibility in structuring or financing certain transactions. In addition, CFIUS is actively pursuing transactions that were not notified to it and may ask questions regarding, or impose restrictions, conditions or limitations on, transactions post-closing. Our funds may also invest in companies that are, or may become, subject to CFIUS requirements based on pre-existing foreign ownership and control; in such cases, CFIUS requirements may adversely impact a portfolio company’s ability to obtain or retain business or otherwise make it more difficult for us to realize a profit from an investment.
The foregoing laws could limit our ability to find suitable investments and could also negatively impact our fundraising and syndication activities by causing us to exclude or limit certain investors in our funds or co-investors for our transactions. Moreover, these laws may make it difficult for us to identify suitable buyers for our investments that we want to exit and could constrain the universe of exit opportunities generally. Complying with these laws imposes potentially significant costs and complex additional burdens, and any failure by us or our portfolio companies to comply with them could expose us to significant penalties, sanctions, loss of future investment opportunities, additional regulatory scrutiny and reputational harm. See “—Risks Related to Regulation—Extensive regulation affects our activities, increases the cost of doing business and creates the potential for significant liabilities and penalties that could adversely affect our businesses and results of operations.”
In addition to undertaking active ongoing investigative agendas, the U.S. Department of Justice Antitrust Division and the FTC, the two agencies responsible for enforcing federal antitrust and competition laws, issued new Merger Guidelines in December 2023, designed to invigorate enforcement of the antitrust and competition laws. Antitrust and competition law enforcers and regulators in foreign jurisdictions have been similarly active. These initiatives are expected to increase scrutiny of mergers and acquisitions and to result in the adoption of more stringent guidelines for pre-approval of mergers, and potentially for review of previously consummated transactions as well. As a result, the process of obtaining pre-approval from U.S. antitrust agencies and other non-U.S. antitrust authorities for mergers and acquisitions undertaken by the investment funds we
manage is expected to become more challenging, more time consuming and more expensive. We may even be required to undergo investigations concerning previously closed transactions. If certain proposed acquisitions or dispositions of portfolio companies by our managed investment funds are delayed or rejected by antitrust enforcers, or if previously closed transactions are investigated, it could have an adverse impact on our ability to generate future performance revenues and to fully invest the available capital in our funds, as well as reduce opportunities to exit and realize value from our fund investments.
In August 2023, the President issued an executive order establishing an outbound investment screening regime that is intended to regulate or prohibit certain investments by U.S. persons in advanced technology sectors in China and other jurisdictions that may be designated as a “country of concern.” While the U.S. Department of the Treasury proposed rules in August 2023 contemplating the imposition of notification requirements for, and the potential prohibition of, outbound investment involving semiconductors and microelectronics, quantum information technologies and artificial intelligence by U.S. persons into certain entities with a nexus to China, the exact scope and application of the outbound investment program has yet to be determined. Moreover, there is a high likelihood that the number of targeted sectors will expand over the life of our funds. When restrictions on U.S. outbound investment become effective, these could limit the universe of prospective investments available to us, making it more difficult to deploy capital or identify buyers for investments, and/or adversely affect the governance and operations of our investments and thus our overall performance.
State regulatory agencies may also impose restrictions on private funds’ investments in certain types of assets, which could affect our funds’ ability to find attractive and diversified investments and to complete such investments in a timely manner. For example, more than two dozen U.S. states have enacted or are considering legislation that would prohibit, restrict, or regulate foreign investment in real property in such states. We cannot exclude that some or all of these states may prohibit, restrict or regulate (including requiring disclosure of) our funds’ transactions, including based on the composition of our investor base. Collectively, these laws also elevate the likelihood that we will be required or requested to disclose to U.S. federal and/or state regulators information about us, our funds, our investors, our structure, and our beneficial ownership and control and may impact the ability of non-U.S. limited partners to participate in certain of our investment strategies.
Many of the power, infrastructure and energy companies in which certain of our funds invest are subject to regulation by the Federal Energy Regulatory Commission (“FERC”), which oversees acquisition and disposition of electric generation, transmission and other electric facilities in most of the U.S., along with transmission of electricity in interstate commerce in the U.S., and wholesale purchases and sales of electric energy in interstate commerce in the U.S., among other things. In some U.S. states, public utility commissions can also (or alternatively) regulate investments in, or transfers of, certain electric sector holdings and infrastructure. Under existing regulations, FERC and public utility commissions may, in some circumstances, slow, or impose restrictions on, investments in or transfers of regulated assets. Changes to regulations, or changes to interpretations thereof, by FERC or public utility commissions may similarly make regulated investments, acquisitions or dispositions more challenging or time-consuming, and may subject previously-exempt classes of transactions to new authorization requirements. While our investments are exposed to FERC and public utility commission regulation in a manner that is consistent with other participants in the power, infrastructure and energy sector, such regulations could nonetheless result in delays in making investments, delays in exiting investments or limitations or conditions that may adversely affect the ability of our funds to execute on their investment strategy with respect to such transactions as well as limit our flexibility in structuring or financing certain transactions.
Certain of our funds make preferred and common equity investments that rank junior to preferred equity and debt in a company’s capital structure.
In most cases, the companies in which our investment funds invest have, or are permitted to have, outstanding indebtedness or equity securities that rank senior to our fund’s investment. By their terms, such instruments may provide that their holders are entitled to receive payments of dividends, interest or principal on or before the dates on which payments are to be made in respect of our investment. In addition, in the event of insolvency, liquidation, dissolution, reorganization or bankruptcy of a company in which an investment is made, holders of securities ranking senior to our investment would typically be entitled to receive payment in full before distributions could be made in respect of our investment. After repaying senior security holders, the company may not have any remaining assets to use for repaying amounts owed in respect of our investment. To the extent that any assets remain, holders of claims that rank equally with our investment would be entitled to share on an equal and ratable basis in distributions that are made out of those assets. Moreover, during periods of financial distress or following an insolvency, the ability of our funds to influence a company’s affairs and to take actions to protect their
investments may be substantially less than that of the senior creditors.
Certain of our funds utilize special situation and distressed debt investment strategies that involve significant risks.
Certain of the funds in our Credit and Private Equity Groups invest in obligors and issuers with weak financial conditions, poor operating results, substantial financing needs, negative net worth and/or special competitive problems. These funds also invest in obligors and issuers that are involved in bankruptcy or reorganization proceedings. In such situations, it may be difficult to obtain full information as to the exact financial and operating conditions of these obligors and issuers. Additionally, the fair values of such investments are subject to abrupt and erratic market movements and significant price volatility if they are publicly tradedpublicly-traded securities, and are subject to significant uncertainty in general if they are not publicly tradedpublicly-traded securities. Furthermore, some of our funds’ distressed investments may not be widely traded or may have no recognized market. A fund’s exposure to such investments may be substantial in relation to the market for those investments, and the assets are likely to be illiquid and difficult to sell or transfer. As a result, it may take a number of years for the market value of such investments to ultimately reflect their intrinsic value as perceived by us.
A central feature of our distressed investment strategy is our ability to effectively anticipate the occurrence of certain corporate events, such as debt and/or equity offerings, restructurings, reorganizations, mergers, takeover offers and other transactions, that we believe will improve the condition of the business. Similarly, we perform significant analysis of the company’s capital structure, operations, industry and ability to generate income, as well as market valuation of the company and its debt, and develop a strategy with respect to a particular distressed investment based on such analysis. In furtherance of that strategy our funds seek to identify the best position in the capital structure in which to invest. If the relevant corporate event that we anticipate is delayed, changed or never completed, or if our analysis or investment strategy is inaccurate, the market price and value of the applicable fund’s investment could decline sharply.
In addition, these investments could subject a fund to certain potential additional liabilities that may exceed the value of its original investment. Under certain circumstances, payments or distributions on certain investments may be reclaimed if any such payment or distribution is later determined to have been a fraudulent conveyance, a preferential payment or similar transaction under applicable bankruptcy and insolvency laws. In addition, under certain circumstances, a lender that has inappropriately exercised control of the management and policies of a debtor may have its claims subordinated or disallowed, or may be found liable for damages suffered by parties as a result of such actions. In the case where the investment in securities of troubled companies is made in connection with an attempt to influence a restructuring proposal or plan of reorganization in bankruptcy, our funds may become involved in substantial litigation.
Certain of the funds or accounts we advise or manage are subject to the fiduciary responsibility and prohibited transaction provisions of ERISA and Section 4975 of the Code, and our businesses could be adversely affected if certain of our other funds or accounts fail to satisfy an exception under the U.S. Department of Labor’s “plan assets” regulation under ERISA.regulation.
Certain of the funds and accounts we advise or manage are subject to the fiduciary responsibility and prohibited transaction provisions of ERISA and Section 4975 of the Code. For example, we currently manage some of our funds or accounts as “plan assets” under ERISA. With respect to these funds or accounts, this results in the application of the fiduciary responsibility standards of ERISA to investments made by such funds or accounts, including the requirement of investment prudence and diversification, and the possibility that certain transactions that we enter into, or may have entered into, on behalf of these funds or accounts, in the normal course of business, might constitute or result in, or have constituted or resulted in, non-exempt prohibited transactions under Section 406 of ERISA or Section 4975 of the Code. A non-exempt prohibited transaction, in addition to imposing potential liability upon fiduciaries of an ERISA plan, may also result in the imposition of an excise tax under the Code upon a “party in interest” (as defined in ERISA) or “disqualified person” (as defined in the Code) with whom we engaged in the transaction. Some of our other funds or accounts currentlyare intended to qualify as venture“venture capital operating companies (“VCOCs”)companies” or rely on another exception under the “plan assets” regulation under ERISA and therefore are not be subject to the fiduciary requirementsor prohibited transaction provisions of ERISA or Section 4975 of the Code with respect to their assets. However, if these funds or accounts fail to satisfy an exception to holding “plan assets” under relevant regulations by the VCOC requirementsU.S. Department of Labor for any reason, including as a result of an amendment of the relevant regulations by the U.S. Department of Labor, or another exception under the “plan assets” regulation under ERISA, such failure could materially interfere with our activities in relation to these funds or accounts or expose us to risks related to our failure to comply with the applicable requirements.
Contingent liabilities could harm fund performance.
We may cause our funds to acquire an investment that is subject to contingent liabilities. Such contingent liabilities could be unknown to us at the time of acquisition or, if they are known to us, we may not accurately assess or protect against the risks that they present. Acquired contingent liabilities could therefore result in unforeseen losses for our funds. In addition, in connection with the disposition of an investment in a portfolio company, a fund may be required to make representations about the business and financial affairs of such portfolio company typical of those made in connection with the sale of a business. A fund may also be required to indemnify the purchasers of such investment to the extent that any such representations are inaccurate. These arrangements may result in the incurrence of contingent liabilities by a fund, even after the
disposition of an investment. Accordingly, the inaccuracy of representations and warranties made by a fund could harm such fund’s performance.
Our funds may be held liable for the underfunded pension liabilities of their portfolio companies.
A court decision found that, in certain circumstances, an investment fund could be treated as a “trade or business” for purposes of determining pension liability under ERISA. Therefore, where an investment fund owns 80% or more (or possibly, under certain circumstances, less than 80%) of a portfolio company, such investment fund (and any other 80%-owned portfolio companies of such fund) might be found liable for certain pension liabilities of such a portfolio company to the extent the portfolio company is unable to satisfy such liabilities. Our funds may, from time to time, invest in a portfolio company that has unfunded pension fund liabilities, including structuring the investment in a manner where a fund may own an 80% or greater
interest in such a portfolio company. If a fund (or other 80%-owned portfolio companies of such fund) were deemed to be liable for such pension liabilities, this could have a material adverse effect on the operations of such fund and the companies in which such fund invests. This discussion is based on current court decisions, statute and regulations regarding control group liability under ERISA, as in effect as of the date hereof, which may change in the future as the case law and guidance develops.
Our funds’ performance, and our performance, may be adversely affected by the financial performance of our funds’ portfolio companies and the industries in which our funds invest.
Our performance and the performance of our funds are significantly impacted by the value of the companies in which our funds have invested. Our funds invest in companies in many different industries, each of which is subject to volatility based upon economic and market factors. The credit crisis between mid-2007 and the end of 2009 caused significant fluctuations in the value of securities held by our funds and the recent global economic downturn induced by the COVID-19 pandemic had a significant impact in overall performance activity and the demands for many of the goods and services provided by portfolio companies of the funds we advise. Although we believe the U.S. economy has registered ten consecutive years of growth in real GDP,largely recovered from the economic crisis induced by the COVID-19 pandemic, there remain many obstacles to continued growth in the economy such as global geopolitical events, (including the current COVID-19 pandemic), risks ofpersistent inflation or deflation, rising interest rates and high debt levels, both public and private. These factors and other general economic trends are likely to affect the performance of portfolio companies in a range of industries and, in particular, industries that have been adversely affected by the COVID-19 pandemic.industries. The performance of our funds, and our performance, may be adversely affected if our fund portfolio companies in these industries experience adverse performance or additional pressure due to downward trends.
The performance of our investments with underlying exposure to the commodities markets is also subject to a high degree of business and market risk, as it is dependent upon prevailing prices of commodities such as oil, natural gas and coal. Prices for oil and natural gas, for example,coal, which are subject to wide fluctuation in response to relatively minor changes in the supply and demand for oil and natural gas, market uncertainty and a variety of additional factors that are beyond our control, such as level of consumer product demand,geopolitical developments like hostilities in the refining capacity of oil purchasers, weather conditions, government regulations, the priceMiddle East region and availability of alternative fuels, political conditions, foreign supply of such commoditiesbetween Russia and overall economic conditions.Ukraine. It is common in making investments with underlying exposure to the commodities markets to deploy hedging strategies to protect against pricing fluctuations but such strategies may or may not protect our investments. Declining global commodity prices have impacted the value of securities held by our funds. Continued volatility could result in lower returns than we anticipated at the time certain of our investments were made. As of December 31, 2020, approximately 2%2023, 1% of our total AUM was invested in debt and equity investments in the energy (includingsector (of which less than 1% of our total AUM was invested in midstream investments and also includes oil and gas explorationexploration) and midstream investments) sector and approximately 2%less than 1% of our total AUM was invested in the retail sectorrenewable energy investments that were challenged from the market disruption and volatility seenexperienced in the recent past as a result of the COVID-19 pandemic.past.
In respect of real estate, various factors could have an adverse effect on investment performance, including, but not limited to, rising mortgage interest rates, a low level of confidence in the economic recovery or the residential real estate market.
Our failure to comply with investment guidelines set by our clients and/or investors could result in damage awards against us or a reduction in AUM, either of which would cause our earnings to decline and adversely affect our business.
When clients retain us to manage assets on their behalf, they specify certain guidelines regarding investment allocation and strategy that we are required to observe in the management of their portfolios. Similarly, investors in our funds often require certain investment restrictions or limitations be included in their side letters that we are contractually obligated to observe in the management of such investors’ interests in the applicable fund. Similarly, investors in our funds often require certain investment restrictions or limitations be included in their side letters that we are contractually obligated to observe in the management of such investors’ interests in the applicable fund. Our failure to comply with these guidelines, restrictions and other limitations could result in clients terminating their investment management agreement with us or investors seeking to withdraw from our funds. Clients or investors could also sue us for breach of contract and seek to recover damages from us. In addition, such guidelines may restrict our ability to pursue certain investments and strategies on behalf of our clients or limit an investor’s exposure to such investments and strategies that we believe are economically desirable, which could similarly result in losses to a client account or investor capital account or termination or potential withdrawal of the account or investor and a
corresponding reduction in AUM. Even if we comply with all applicable investment guidelines, restrictions and limitations, a client or investor may be dissatisfied with its investment performance or our services or fees, and may terminate their customized separate accounts or advisory accounts, seek to withdraw from our funds or be unwilling to commit new capital to our specialized funds, customized separate accounts or advisory accounts. Any of these events could cause our earnings to decline and materially and adversely affect our business, financial condition and results of operations.
Third-party investors in certain of our funds with commitment-based structures may not satisfy their contractual obligation to fund capital calls when requested by us, which could adversely affect a fund’s operations and performance.
Investors in certain of our funds make capital commitments to those funds that we are entitled to call from those investors at any time during prescribed periods. We depend on investors fulfilling and honoring their commitments when we call capital from them for those funds to consummate investments and otherwise pay their obligations when due. Any investor that did not fund a capital call would be subject to several possible penalties, including possibly having a meaningful amount of its existing investment forfeited in that fund. However, the impact of the penalty is directly correlated to the amount of capital previously invested by the investor in the fund and if an investor has invested little or no capital, for instance early in the life of the fund, then the forfeiture penalty may not be as meaningful. Investors may also negotiate for lesser or reduced penalties at the outset of the fund, thereby limiting our ability to enforce the funding of a capital call. In cases where valuations of existing investments fall and the pace of distributions slows, investors may be unable to make new commitments to third-party managed investment funds such as those advised by us using distributions they received from prior fund investments. A failure of investors to honor a significant amount of capital calls for any particular fund or funds could have a material adverse effect on the operation and performance of those funds. The risk is more prevalent with retail investors, which is an area where we are seeking to expand our distribution capabilities.
Certain of our investment funds may utilize subscription lines of credit to fund investments prior to the receipt of capital contributions from the fund’s investors. As capital calls made to a fund’s investors are delayed when using a subscription line of credit, the investment period of such investor capital is shortened, which may increase the net internal rate of return of an investment fund. However, since interest expense and other costs of borrowings under subscription lines of
credit are an expense of the investment fund, the investment fund’s net multiple of invested capital will be reduced, as will the amount of carried interest generated by the fund. Any material reduction in the amount of carried interest generated by a fund will adversely affect our revenues.
Our funds make investments in companies that are based outside of the United States,U.S., which may expose us to additional risks not typically associated with investing in companies that are based in the United States.U.S.
Some of our funds invest a portion of their assets in the equity, debt, loans or other securities of issuers located outside the United States,U.S., including Europe and Asia,APAC, while certain of our funds invest substantially all of their assets in these types of securities, and we expect that international investments will increase as a proportion of certain of our funds’ portfolios in the future. Investments in non-U.S.foreign securities involve certain factors not typically associated with investing in U.S. securities, including risks relating to:
•our funds’ abilities to exchange local currencies for U.S. dollars and other currency exchange matters, including fluctuations in currency exchange rates and costs associated with conversion of investment principal and income from one currency into another;
•controls on, and changes in controls on, foreign investment and limitations on repatriation of invested capital;
•less developed or less efficient financial markets than exist in the United States,U.S., which may lead to price volatility and relative illiquidity;
•the absence of uniform accounting, auditing and financial reporting standards, practices and disclosure requirements and less government supervision and regulation;
•changes in laws or clarifications to existing laws (and changes in administrative practices) that could impact our tax treaty positions, which could adversely impact the returns on our investments;
•differences in legal and regulatory environments, particularly with respect to bankruptcy and reorganization, labor and employment laws, less developed corporate laws regarding fiduciary duties and the protection of investors and less reliable judicial systems to enforce contracts and applicable law;
•political hostility to investments by foreign or private equity investors;
•less publicly available information in respect of companies in non-U.S.foreign markets;
•reliance on a more limited number of commodity inputs, service providers and/or distribution mechanisms;
•higher rates of inflation;
•higher transaction costs;
•difficulty in enforcing contractual obligations;
•fewer investor protections;
•limitations on the deductibility of interest and other financing costs and expenses for income tax purposes in certain jurisdictions;
•certain economic and political risks, including potential exchange control regulations and restrictions on our non-U.S.foreign investments and repatriation of capital, potential political, economic or social instability, the possibility of nationalization or expropriation or confiscatory taxation and adverse economic and political developments; and
•the imposition of non-U.S.foreign taxes or withholding taxes on income and gains recognized with respect to such securities.
While our funds will take these factors into consideration in making investment decisions, including when hedging positions, there can be no assurance that adverse developments with respect to these risks will not adversely affect our funds that invest in securities of non-U.S.foreign issuers. In addition, certain of these funds are managed outside the United States,U.S., which may increase the foregoing risks.
Many of our funds make investments in companies that we do not control.
Investments by many of our funds will include debt instruments and equity securities of companies that we do not control. Such instruments and securities may be acquired by our funds through trading activities or through purchases of
securities from the issuer. In addition, our funds may seek to acquire minority equity interests more frequently and may also dispose of a portion of their majority equity investments in portfolio companies over time in a manner that results in the funds retaining a minority investment. Furthermore, while certain of our funds may make “toe-hold” distressed debt investments in a company with the intention of obtaining control, there is no assurance that a control position may be obtained and such fund may retain a minority investment. Those investments will be subject to the risk that the company in which the investment is made may make business, financial or management decisions with which we do not agree or that the majority stakeholders or the management of the company may take risks or otherwise act in a manner that does not serve our interests. If any of the foregoing were to occur, the values of the investments held by our funds could decrease and our financial condition, results of operations and cash flow could suffer as a result.
Increased regulatory scrutiny and uncertainty with regard to expense allocation may increase risk of harm.
While we historically have and will continue to allocate the expenses of our funds in good faith and in accordance with the terms of the relevant fund agreements and our expense allocation policy in effect from time to time, due to increased regulatory scrutiny of expense allocation policies in the private investment funds realm, there is no guarantee that our policies and practices will not be challenged by our supervising regulatory bodies. If we or our supervising regulators were to determine that we have improperly allocated such expenses, we could be required to refund amounts to the funds and could be subject to regulatory censure, litigation from our fund investors and/or reputational harm, each of which could have a material adverse effect on our financial condition.
We may need to pay “clawback” or “contingent repayment” obligations if and when they are triggered under the governing agreements with our funds.
Generally, if at the termination of a fund and in certain cases at interim points in the life of a fund, the fund has not achieved investment returns that exceed the preferred return threshold or the general partner receives net profits over the life of the fund in excess of its allocable share under the applicable partnership agreement, we will be obligated to repay an amount equal to the excess of amounts previously distributed to us over the amounts to which we are ultimately entitled. This obligation is known as a “clawback” or contingent repayment obligation. Due to the fact that our carried interest is generally determined on a liquidation basis, as of December 31, 2020, 2019 and 2018,2023, if the funds were liquidated at their fair values at that date, there would have been no contingent repayment obligation or liability. There can be no assurance that we will not incur a contingent repayment obligation in the future. AtAs of December 31, 2020, 2019 and 2018,2023, had we assumed all existing investments were worthless, the amount of carried interest, net of tax distributions, subject to contingent repayment would have been approximately $326.4$78.5 million $233.4 million and $469.0 million, respectively, of which approximately $252.4$54.5 million $175.1 million and $364.4 million, respectively, is reimbursable to the Company by certain professionals. In addition, the SEC has recently adopted rules that will require a written notice to private fund investors in order to reduce the amount of any adviser clawback by actual,
potential, or hypothetical taxes within 45 days after the end of any fiscal quarter in which a clawback occurs. See “—Risks Related to Regulation—Extensive regulation affects our activities, increases the cost of doing business and creates the potential for significant liabilities and penalties that could adversely affect our businesses and results of operations.” To the extent that we fail to provide such written notice, we would be limited in our ability to reduce the clawback amount in connection with those taxes, potentially leading to a larger contingent repayment obligation. Although a contingent repayment obligation is several to each person who received a distribution, and not a joint obligation, if a recipient does not fund his or her respective share of a contingent repayment obligation, we may have to fund such additional amounts beyond the amount of carried interest we retained, although we generally will retain the right to pursue remedies against those carried interest recipients who fail to fund their obligations. We may need to use or reserve cash to repay such contingent repayment obligations instead of using the cash for other purposes. See “Item 7. Management’s Discussion and Analysis of Financial Condition and Results of Operations-Contingent Obligations”,Operations—Contractual Obligations, Commitments and Contingencies and Other Arrangements,” “Note 2. Summary of Significant Accounting Policies”Policies,” and “Note 9.8. Commitments and Contingencies” to thewithin our consolidated financial statements appearing elsewhere in this Annual Report on Form 10-K.
We derive a substantial portion of our revenues from funds managed pursuant to management agreements that may be terminated or fund partnership agreements that permit fund investors to request liquidation of investments in our funds on short notice.
The terms of our funds generally give either the manager of the fund or the fund itself the right to terminate our investment management agreement with the fund. However, insofar as we control the general partners of our funds that are limited partnerships, the risk of termination of investment management agreement for such funds is limited, subject to our fiduciary or contractual duties as general partner. This risk is more significant for certain of our funds that have independent boards of directors.
With respect to our funds that are not exempt from registration under the Investment Company Act, each fund’s investment management agreement must be approved annually by (a)(i) such fund’s board of directors or by the vote of a majority of such fund’s stockholders, and (b)(ii) the majority of the independent members of such fund’s board of directors and, in certain cases, by its stockholders, as required by law. The funds’ investment management agreements can also be terminated by the majority of such fund’s stockholders. Termination of these agreements would reduce the fees we earn from the relevant funds, which could have a material adverse effect on our results of operations. Currently, ARDC, aARCC and ASIF, registered investment company
under the Investment Company Act, and ARCC, a registered investment companycompanies that hashave elected to be treated as a business development companycompanies under the Investment Company Act, are subject to these provisions of the Investment Company Act.
Investors in certain of our funds, including our open-ended funds, may redeem their investments in these funds. Third-party investors in many of our funds have the right to remove the general partner of the fund and to terminate the investment period under certain circumstances. In addition, the investment management agreements related to our separately managed accounts may permit the investor to terminate our management of such accounts on short notice. These events would lead to a decrease in our revenues, which could be substantial.
Investors in certain of our funds, including our open-ended funds and non-traded REITs may generally redeem their investments on a periodic basis subject to the expiration of a specified period of time during which capital may not be withdrawn. Such redemptions would result in a reduction of our AUM and decrease in our management fees. The governing agreements of many of our funds provide that, subject to certain conditions, third-party investors in those funds have the right to remove the general partner of the fund or terminate the fund, including in certain cases without cause by a simple majority vote. Any such removal or dissolution could result in a cessation in management fees we would earn from such funds and/or a significant reduction in the expected amounts of performance incomecarried interest and incentive fees from those funds. Performance incomeCarried interest could be significantly reduced as a result of our inability to maximize the value of investments by a fund during the liquidation process or in the event of the triggering of a “contingent repayment” obligation. Finally, the applicable funds would cease to exist after completion of liquidation and winding-up.
In addition, the governing agreements of many of our funds provide that, subject to certain conditions, third-party investors in those funds have the right to terminate the investment period of the fund, including in certain cases without cause. Such an event could have a significant negative impact on our revenue, earnings and cash flow of such fund. The governing agreements of our funds may also provide that upon the occurrence of events, including in the event that certain “key persons” in our funds do not meet specified time commitments with regard to managing the fund (including due to death, disability or departure), investors in those funds have the right to vote to suspend or terminate the investment period, including in certain cases by a simple majority vote in accordance with specified procedures. In addition to having a significant negative impact on our revenue, earnings and cash flow, the occurrence of such an event with respect to any of our funds would likely result in significant reputational damage to us and could negatively impact our future fundraising efforts.
We currently manage a portion of investor assets through separately managed accounts, whereby we earn management fees and performance income,carried interest or incentive fees, and we intend to continue to seek additional separately managed account mandates. The investment management agreements we enter into in connection with managing separately managed accounts on behalf of certain clients may in certain cases be terminated by such clients on as little as 30 days’ prior written notice. In addition, the boards of directors of the investment management companies we manage could terminate our advisory engagement of those companies on as little as 30 days’ prior written notice. ARCC’sARCC and ASIF’s respective investment management agreementagreements can be terminated by the majority of itstheir respective stockholders upon 60 days’ prior written notice. InWe serve as the sub-adviser for the existing manager of certain funds. Although in some cases there can be economic payments made by the manager for termination of such sub-advisory contracts, such as in connection with our sub-advisory arrangement of AMP Capital’s Infrastructure Debt platform, in the case of any such terminations, the management fees and performance incomecarried interest or incentive fees we earn in connection with managing such account or company would immediately cease, which could result in a significant adverse impact on our revenues.
In addition, if we were to experience a change of control (as defined under the Investment Advisers Act or as otherwise set forth in the partnership agreements of our funds), continuation of the investment management agreements of our funds would be subject to investor consent. There can be no assurance that required consents will be obtained if a change of control occurs. In addition, with respect to our funds that are subject to the Investment Company Act, each fund’s investment management agreement must be approved annually (a)(i) by such fund’s board of directors or by a vote of the majority of such fund’s stockholders, and (b)(ii) by the independent members of such fund’s board of directors and, in certain cases, by its stockholders, as required by law. Termination of these agreements would cause us to lose the management fees and performance incomecarried interest or incentive fees we earn from such funds, which could have a material adverse effect on our results of operations.
Customized separate account and advisory account fee revenue is not a long-term contracted source of revenue and is subject to intense competition.
Our revenue in any given period is dependent on the number of fee-paying clients and corresponding level of AUM in such period. Our customized separate account and advisory account business operates in a highly competitive environment where typically there are no long-term contracts. While clients of our customized separate account and advisory account businesses may have multi-year contracts, many of these contracts are terminable upon 30 to 90 days’ advance notice to us. We may lose clients as a result of a change in ownership, control or senior management, a client’s decision to transition to in-house asset management rather than partner with a third-party provider such as us, competition from other financial advisors and financial institutions, changes to their investment policies and other causes. Isolated departures have occurred in the past but have not had a material impact on our business. Moreover, a number of our contracts with state government-sponsored clients are secured through such government’s mandated procurement process, and are subject to periodic renewal. If multiple clients were to exercise their termination rights or fail to renew their existing contracts and we were unable to secure new clients or maintain our levels of AUM, our customized separate account and advisory account fees would decline materially. A significant reduction in the number of fee-paying clients and/or AUM levels in any given period could reduce our revenue and materially and adversely affect our business, financial condition and results of operations.
We are vulnerable to an increased number of investors seeking to participate in share redemption programs or tender offers of our non-traded vehicles.
We manage non-traded REITs, BDCs and other non-traded vehicles. Non-traded vehicles often conduct share redemption programs or tender offers to provide liquidity to investors in such vehicles, subject to certain limitations. For example, with respect to our non-traded REITs, the total amount of aggregate redemptions is limited by a certain percentage of each of the non-traded REIT’s NAV for each calendar month and quarter, which percentage is generally based on the excess of share redemptions (capital outflows) over the proceeds from the sale of shares (capital inflows), not including proceeds related to sales of beneficial interests in specific Delaware statutory trusts holding real properties, or the exchange program for the applicable period. While such share redemption programs and tender offers may contain restrictions that limit the amount of shares or other equity, as applicable, that may be redeemed or purchased in particular periods, an increased number of investors requesting redemptions in excess of capital inflows or participating in tender offers of our non-traded vehicles could lead to a decline in the management fees and incentive fees we receive. Economic events affecting the economy or market in general, such as volatility in the financial markets related to changes in markets, inflation, changes in interest rates or global or national events that are beyond our control, could cause investors to request redemption of an increased number of shares pursuant to the share redemption programs of our non-traded vehicles, potentially in excess of established limits. Such prolonged economic disruptions have caused a number of similar vehicles to deny redemption requests or to suspend or partially suspend their share redemption programs and tender offers. Our non-traded vehicles may redeem or purchase fewer shares than investors request due to a lack of readily available funds because of such adverse market conditions beyond our control or the need to maintain liquidity for operations. Certain of our non-traded vehicles may amend or suspend share repurchase programs during periods of
market dislocation where selling assets to fund a repurchase could have a materially negative impact on remaining investors. With respect to our non-traded vehicles, the vast majority of their assets will consist of investments that cannot generally be readily liquidated on short notice without impacting the vehicle’s ability to realize full value upon their disposition. This may further limit the amount of cash available to immediately satisfy redemption requests. Any redemptions or purchases of less than amounts requested could undermine investor confidence in our non-traded vehicles and adversely impact our reputation.
A downturn in the global credit markets could adversely affect our CLO investments.
CLOs are subject to credit, liquidity, interest rate and other risks. From time to time, liquidity in the credit markets is reduced sometimes significantly, resulting in an increase in credit spreads and a decline in ratings, performance and market values for leveraged loans. We have significant exposure to these markets through our investments in our CLO funds. CLOs invest on a leveraged basis in loans or securities that are themselves highly leveraged investments in the underlying collateral, which increases both the opportunity for higher returns as well as the magnitude of losses when compared to unlevered investments. As a result of such funds’ leveraged position, CLOs and their investors are at greater risk of suffering losses. CLOs have failed in the past and may in the future fail one or more of their “overcollateralization” tests. The failure of one or more of these tests will result in reduced cash flows that may have been otherwise available for distribution to us. This could reduce the value of our investment. There can be no assurance that market conditions giving rise to these types of consequences will not once again occur, subsist or become more acute in the future.
Our funds may face risks relating to undiversified investments.
While diversification is generally an objective of our funds, there can be no assurance as to the degree of diversification, if any, that will be achieved in any fund investments. Difficult market conditions or volatility or slowdowns affecting a particular asset class, geographic region, industry or other category of investment could have a significant adverse impact on a fund if its investments are concentrated in that area, which would result in lower investment returns. This lack of diversification may expose a fund to losses disproportionate to market declines in general if there are disproportionately greater adverse price movements in the particular investments. If a fund holds investments concentrated in a particular issuer, security, asset class or geographic region, such fund may be more susceptible than a more widely diversified investment partnership to the negative consequences of a single corporate, economic, political or regulatory event. Accordingly, a lack of diversification on the part of a fund could adversely affect a fund’s performance and, as a result, our financial condition and results of operations.
Our funds may be forced to dispose of investments at a disadvantageous time. Furthermore, we may have to waive management fees for certain of our funds in certain circumstances.
Our funds may make investments that they do not advantageously dispose of prior to the date the applicable fund is dissolved, either by expiration of such fund’s term or otherwise. Although we generally expect that investments will be disposed of prior to dissolution or be suitable for in-kind distribution at dissolution, and the general partners of the funds have only a limited ability to extend the term of the fund with the consent of fund investors or the advisory board of the fund, as applicable, our funds may have to sell, distribute or otherwise dispose of investments at a disadvantageous time as a result of dissolution. This would result in a lower than expected return on the investments and, perhaps, on the fund itself. In addition, our limited partners may require that we waive management fees during periods after the contractual term of a fund, which would reduce the amount of management fees we earn and therefore could negatively impact our revenues and results of operations.
Our real estate funds are subject to the risks inherent in the ownership and operation of real estate and the construction and development of real estate.
Investments in our real estate funds will be subject to the risks inherent in the ownership and operation of real estate and real estate-related businesses and assets. These risks include the following:
•those associated with the burdens of ownership of real property;
•general and local economic conditions;
•changes in supply of and demand for competing properties in an area (as a result, for example, of overbuilding);
•fluctuations in the average occupancy and room rates for hotel properties;
•the financial resources of tenants;
•changes in building, environmental and other laws;
•energy and supply shortages;
•various uninsured or uninsurable risks;
•liability for “slip-and-fall” and other accidents on properties held by our funds;
•natural disasters;disasters, extreme weather events and other physical risks related to climate change;
•changes in government regulations (such as rent control and tax laws);
•changes in real property tax and transfer tax rates;
•changes in interest rates;
•the reduced availability of mortgage funds which may render the sale or refinancing of properties difficult or impracticable;
•negative developments in the economy that depress travel activity;
•environmental liabilities;
•contingent liabilities on disposition of assets;
•unexpected cost overruns in connection with development projects;
•terrorist attacks, war and other factors that are beyond our control; and
•dependence on local operating partners.
If our real estate funds acquire direct or indirect interests in undeveloped land or underdeveloped real property, which may often be non-income producing, they will be subject to the risks normally associated with such assets and development activities, including risks relating to the availability and timely receipt of zoning and other regulatory or environmental approvals, the cost and timely completion of construction (including risks beyond the control of our fund, such as weather or labor conditions or material shortages) and the availability of both construction and permanent financing on favorable terms. Additionally, our funds’ properties may be managed by a third party, which makes us dependent upon such third parties and
subjects us to risks associated with the actions of such third parties. Any of these factors may cause the value of the investments in our real estate funds to decline, which may have a material impact on our results of operations.
Certain of our funds invest in the power, infrastructure and energy sector which is subject to significant market volatility. As such, the performance of investments in the energy sector is subject to a high degree of business and market risk.
The power, infrastructure and energy companies in which certain of our funds invest have been and willmay be negatively impacted by material declines in power and energy related commodity prices and are subject to other risks, including among others, supply and demand risk, operational risk, regulatory risk, depletion risk, reserve risk, reputational risk, severe weather, climate change and catastrophic event risk.risk (including of cyber-attacks). Commodity prices fluctuate for several reasons, including changes in market and economic conditions, the impact of weather on demand, climate initiatives of government entities, levels of domestic production and international production, policies implemented by the Organization of Petroleum Exporting Countries, power and energy conservation, domestic and foreign governmental regulation and taxation and the availability of local, intrastate and interstate transportation systems.
Climate change, climate change-related regulation and other efforts to reduce climate change and address sustainability concerns could adversely affect our business.
Climate change is widely considered to be a significant threat to the global economy. Our business operations, our funds’ portfolio companies, and the companies in which our funds invest may face risks associated with climate change, including “transition risks” such as risks related to the impact of climate-related legislation and regulation (both domestically and internationally), risks related to climate-related business trends (such as the process of transitioning to a lower-carbon economy)and risks stemming from the physical impacts of climate change, such as the increasing frequency or severity of extreme weather events and rising sea levels and temperatures.
Significant chronic or acute physical effects of climate change including extreme weather events such as hurricanes or floods, may have an adverse impact on certain of our funds’ portfolio companies and investments, especially our real asset investments and portfolio companies that rely on physical factories, plants or stores located in the affected areas, or that focus
on tourism or recreational travel. For some of our products and our products’ portfolio companies, physical risks of climate change may also pose systemic risks for their businesses. For example, to the extent weather conditions are affected by climate change, energy use by us, our products or our products’ portfolio companies could increase or decrease depending on the duration and magnitude of any changes. As the effects of climate change increase, we expect the frequency and impact of weather and climate related events and conditions to increase as well. See “—Risks Related to Our Funds—Our real estate funds are subject to the risks inherent in the ownership and operation of real estate and the construction and development of real estate.”
In addition, the current Presidential administration has focused on climate change policies and has re-joined the Paris Agreement, which includes commitments from countries to reduce their greenhouse gas emissions, among other commitments. The Paris Agreement and other regulatory and voluntary initiatives launched by international, federal, state, and regional policymakers and regulatory authorities as well as private actors seeking to reduce greenhouse gas emissions may expose our business operations, portfolio companies, funds and the companies in which they invest to transition risks related to climate change in addition to physical risks, such as: (i) political and policy risks, (including changing regulatory incentives, and legal requirements, including with respect to greenhouse gas emissions, that could result in increased costs or changes in business operations); (ii) regulatory and litigation risks, (including changing legal requirements that could result in increased permitting, tax and compliance costs, enhanced disclosure obligations, changes in business operations, or the discontinuance of certain operations, and litigation seeking monetary or injunctive relief related to impacts related to climate change); (iii) technology and market risks, (including declining market for investments in industries seen as greenhouse gas intensive, like fossil fuels, or less effective than alternatives in reducing greenhouse gas emissions, and increased cost of insurance for assets in high risk sectors); (iv) business trend risks, (including capital expenditures, product or service redesigns, and changes to operations and supply chains to meet changing customer expectations and the increased attention to ESG considerations by our investors, including in connection with their determination of whether to invest in our funds or portfolio companies); and (v) potential harm to our reputation if certain stakeholders, such as our limited partners or shareholders, believe that we are not adequately or appropriately responding to climate change, including through the way in which we operate our business, the composition of our funds’ existing portfolios, the new investments made by our funds, or the decisions we make to continue to conduct or change our activities in response to climate change considerations. See “—Risks Related to Regulation—Increasing scrutiny from stakeholders and regulators with respect to ESG matters could impact our or our funds’ portfolio companies’ reputation, the cost of our or their operations, or result in investors ceasing to allocate their capital to us, all of which could adversely affect our business and results of operations.”
Investments in energy, manufacturing, infrastructure and certain other assets may expose us to increased environmental risks and liabilities that are inherent in the ownership of real assets.
Ownership of real assets in our funds or vehicles may increase our risk of liability under environmental laws that impose, regardless of fault, joint and several liability for the cost of remediating contamination and compensation for damages. In addition, changes in environmental laws or regulations or the environmental condition of an investment may create liabilities that did not exist at the time of acquisition. Even in cases where we are indemnified by a seller against liabilities arising out of violations of environmental laws and regulations, there can be no assurance as to the financial viability of the seller to satisfy such indemnities or our ability to achieve enforcement of such indemnities.
Our investments in infrastructure assets may expose us to increased risks and liabilities.
Investments in infrastructure assets may expose us to increased risks and liabilities that are inherent in the ownership of real assets. For example,
•Ownership of infrastructure assets may also present additional risk of liability for personal and property injury or impose significant operating challenges and costs with respect to, for example, compliance with zoning, environmental or other applicable laws.
•Infrastructure asset investments may face construction risks including, without limitation: (a)(i) labor disputes, shortages of material and skilled labor, or work stoppages, (b)stoppages; (ii) slower than projected construction progress and the unavailability or late delivery of necessary equipment, (c)equipment; (iii) less than optimal coordination with public utilities in the relocation of their facilities, (d)facilities; (iv) adverse weather conditions and unexpected construction conditions, (e)conditions; (v) accidents or the breakdown or failure of construction equipment or processes; and (f)(vi) catastrophic events such as explosions, fires, terrorist activities and other similar events. These risks could result in substantial unanticipated delays or expenses (which may exceed expected or forecasted budgets) and, under certain circumstances, could prevent completion of construction activities once undertaken. Certain infrastructure asset investments may remain in construction phases for a prolonged period and, accordingly, may not be cash generative for a prolonged period. Recourse against the contractor may be subject to liability caps or may be subject to default or insolvency on the part of the contractor.
•The operation of infrastructure assets is exposed to potential unplanned interruptions caused by significant catastrophic or force majeure events.events, including cyber-attacks. These risks could, among other effects, adversely impact the cash flows available from investments in infrastructure assets, cause personal injury or loss of life, damage property, or instigate disruptions of service. In addition, the cost of repairing or replacing damaged assets could be considerable. Repeated or prolonged service interruptions may result in permanent loss of customers, litigation, or penalties for regulatory or contractual noncompliance. Force majeure events that are incapable of, or too costly to, cure may also have a permanent adverse effect on an investment.
•The management of the business or operations of an infrastructure asset may be contracted to a third-party management company unaffiliated with us. Although it would be possible to replace any such operator, the failure of such an operator to adequately perform its duties or to act in ways that are in our best interest, or the breach by an operator of applicable agreements or laws, rules and regulations, could have an adverse effect on the investment’s financial condition or results of operations. Infrastructure investments may involve the subcontracting of design and construction activities in respect of projects, and as a result our investments are subject to the risks that contractual provisions passing liabilities to a subcontractor could be ineffective, the subcontractor fails to perform services which it has agreed to perform and the subcontractor becomes insolvent.
Infrastructure investments often involve an ongoing commitment to a municipal, state, federal or foreign government or regulatory agencies. The nature of these obligations exposes us to a higher level of regulatory control than typically imposed on other businesses and may require us to rely on complex government licenses, concessions, leases or contracts, which may be difficult to obtain or maintain. Infrastructure investments may require operators to manage such investments and such operators’ failure to comply with laws, including prohibitions against bribing of government officials, may adversely affect the value of such investments and cause us serious reputational and legal harm. Revenues for such investments may rely on contractual agreements for the provision of services with a limited number of counterparties, and are consequently subject to counterparty default risk. The operations and cash flow of infrastructure investments are also more sensitive to inflation and, in certain cases, commodity price risk. Furthermore, services provided by infrastructure investments may be subject to rate regulations by government entities that determine or limit prices that may be charged. Similarly, users of applicable services or government entities in response to such users may react negatively to any adjustments in rates and thus reduce the profitability of such infrastructure investments.
Hedging strategies may adversely affect the returns on our funds’ investments.
When managing our exposure to market risks, we may (on our own behalf or on behalf of our funds) from time to time use forward contracts, options, swaps, caps, collars, floors, foreign currency forward contracts, currency swap agreements, currency option contracts, oramong other strategies. Currency fluctuations in particular can have a substantial effect on our cash flow and financial condition. The success of any hedging or other derivative transactions generally will depend on our ability to correctly predict market or foreign exchange changes, the degree of correlation between price movements of a derivative instrument and the position being hedged, the creditworthiness of the counterparty and other factors. As a result, while we may enter into a transaction to reduce our exposure to market or foreign exchange risks, the transaction may result in poorer overall investment performance than if it had not been executed. Such transactions may also limit the opportunity for gain if the value of a hedged position increases.
While such hedging arrangements may reduce certain risks, such arrangements themselves may entail certain other risks. These arrangements may require the posting of cash collateral at a time when a fund has insufficient cash or illiquid assets such that the posting of the cash is either impossible or requires the sale of assets at prices that do not reflect their underlying value. Moreover, these hedging arrangements may generate significant transaction costs, including potential tax costs, that reduce the returns generated by a fund.
Our risk management strategies and procedures may leave us exposed to unidentified or unanticipated risks.
Risk management applies to our investment management operations as well as to the investments we make for our specialized funds and customized separate accounts. We have developed and continue to update strategies and procedures specific to our business for managing risks, which include market risk, liquidity risk, operational risk and reputational risk. Management of these risks can be very complex. These strategies and procedures may fail under some circumstances, particularly if we are confronted with risks that we have underestimated or not identified, including those related to difficult market or geopolitical conditions. Given the large number and size of our funds, we often have large positions with a single counterparty. For example, we and most of our funds have credit lines. If the lender under one or more of those credit lines were to freeze the account in response to sanctions or become insolvent, we may have difficulty replacing the credit line and the affected fund(s) or we may face liquidity challenges, which may adversely affect our business operations or the fund’s ability to close on an investment. If that counterparty is unable to perform its obligations or performs below our standards, we, our
specialized funds, customized separate accounts and other investments may be adversely affected. In addition, some of our methods for managing the risks related to our clients’ investments are based upon our analysis of historical private markets behavior. Statistical techniques are applied to these observations in order to arrive at quantifications of some of our risk exposures. Historical analysis of private markets returns requires reliance on valuations performed by fund managers, which may not be reliable measures of current valuations. These statistical methods may not accurately quantify our risk exposure if circumstances arise that were not observed in our historical data. In particular, as we introduce new types of investment structures, products or services, our historical data may be incomplete. Failure of our risk management techniques could materially and adversely affect our business, financial condition and results of operations, including our right to receive incentive fees.
Restrictions on our ability to collect and analyze data regarding our clients’ investments could adversely affect our business.
Our database of private markets investments includes funds and direct investments that we monitor and report on for our specialized funds, customized separate accounts and advisory accounts. We rely on our database to provide regular reports to our clients, to research developments and trends in private markets and to support our investment processes. We depend on the continuation of our relationships with the general partners and sponsors of the underlying funds and investments in order to maintain current data on these investments and private markets activity. The termination of such relationships or the imposition of restrictions on our ability to use the data we obtain for our reporting and monitoring services could adversely affect our business, financial condition and results of operations. We are also highly dependent upon the technology platforms within which our data is stored and analyzed, and any disruption in the services provided by such platforms, whether temporary or permanent, could have a material adverse effect on our ability to effectively continue to operate our business without interruption.
Risks Related to Our Organization and Structure
If we were deemed to be an “investment company” under the Investment Company Act, applicable restrictions could make it impractical for us to continue our businesses as contemplated and could have a material adverse effect on our businesses.
An entity will generally be deemed to be an “investment company” for purposes of the Investment Company Act if:
•it is or holds itself out as being engaged primarily, or proposes to engage primarily, in the business of investing, reinvesting or trading in securities; or
•absent an applicable exemption, it owns or proposes to acquire investment securities having a value exceeding 40% of the value of its total assets (exclusive of U.S. government securities and cash items) on an unconsolidated basis.
We believe that we are engaged primarily in the business of providing investment management services and not primarily in the business of investing, reinvesting or trading in securities. We hold ourselves out as an asset management firm and do not propose to engage primarily in the business of investing, reinvesting or trading in securities. Accordingly, we do not believe that we are an “orthodox” investment company as defined in Section 3(a)(1)(A) of the Investment Company Act and described in the first bullet point above. Furthermore, we have no material assets other than interests in certain direct and indirect wholly owned subsidiaries (within the meaning of the Investment Company Act), which in turn have no material assets other than partnership units in the Ares Operating GroupAOG entities. These wholly owned subsidiaries are the general partners of certain of the Ares Operating GroupAOG entities and are vested with all management and control over such Ares Operating GroupAOG entities. We do not believe that the equity interests of Ares Management CorporationAMC in its wholly owned subsidiaries or the partnership units of these wholly owned subsidiaries in the Ares Operating GroupAOG entities are investment securities. Moreover, because we believe that the capital interests of the general partners of our funds in their respective funds are neither securities nor investment securities, we believe that less than 40% of Ares Management Corporation’s total assets (exclusive of U.S. government securities and cash items) on an unconsolidated basis are composed of assets that could be considered investment securities. Accordingly, we do not believe that Ares Management CorporationAMC is an inadvertent investment company by virtue of the 40% test in Section 3(a)(1)(C) of the Investment Company Act as described in the second bullet point above.
The Investment Company Act and the rules thereunder contain detailed parameters for the organization and operation of investment companies. Among other things, the Investment Company Act and the rules thereunder limit or prohibit transactions with affiliates, impose limitations on the issuance of debt and equity securities, generally prohibit the issuance of options and impose certain governance requirements. We intend to conduct our operations so that we will not be deemed to be an investment company under the Investment Company Act. If anything were to happen that would cause us to be deemed to be an investment company under the Investment Company Act, requirements imposed by the Investment Company Act, including limitations on capital structure, the ability to transact business with affiliates and the ability to compensate senior employees, could make it impractical for us to continue our businesses as currently conducted, impair the agreements and arrangements
between and among the Ares Operating Group, us, our funds and our senior management, or any combination thereof, and have a material adverse effect on our businesses, financial condition and results of operations. In addition, we may be required to limit the amount of investments that we make as a principal or otherwise conduct our businesses in a manner that does not subject us to the registration and other requirements of the Investment Company Act.
Due to the disparity in voting power among the classes of our common stock, holders of our Class A common stock will generally have no influence over matters on which holders of our common stock vote and limited ability to influence decisions regarding our business.
Unless otherwise provided in our certificate of incorporation and bylaws or required by the Delaware General Corporation Law (the “DGCL”)DGCL or the rules of the New York Stock Exchange (the “NYSE”),NYSE, holders of our common stock vote together as a single class on all matters on which stockholders generally are entitled to vote under the DGCL. On any date on which the Ares Ownership Condition is satisfied, the shares of our Class B common stock held by the Class B Stockholder entitles it to a number of votes, in the aggregate, equal to (x) four times the aggregate number of votes attributable to the shares of our Class A common stock minus (y) the aggregate number of votes attributable to the shares of our Class C common stock. On any date on which the Ares Ownership Condition is not satisfied, the shares of our Class B common stock held by the Class B Stockholder will not be entitled to vote on any matter submitted to a vote of our stockholders. Ares Voting LLC, as the initial holder of the shares of our Class C common stock (in such capacity, the “Class C Stockholder”), is generally entitled to a number of votes equal to the number of Ares Operating GroupAOG Units held of record by each limited partner of the Ares Operating GroupAOG entities (other than us and our subsidiaries). When Ares Operating GroupAOG Units are exchanged for shares of our Class A common stock, the number of votes to which the shares of our Class C common stock are entitled shall be reduced by the number of Ares Operating GroupAOG Units so exchanged. However, so long as the Ares Ownership Condition is satisfied, the issuance of shares of our Class A common stock would increase the number of votes to which holders of our Class B common stock are entitled. As a result, so long as the Ares Ownership Condition is satisfied, practically all matters submitted to our stockholders will be decided by the vote of the holder of our Class B common stock, Ares Management GP LLC (in such capacity, the “Class B Stockholder”), and Class C Stockholder. Our certificate of incorporation also provides that the number of authorized shares of our Class A common stock may be increased solely by the holders of a majority of the voting power of our outstanding capital stock entitled to vote thereon, voting together as a single class, and no other vote of the holders of any class or series of our stock, voting together or separately as a class, shall be required therefor. As a result, holders of our Class A common stock will have very limited or no ability to influence stockholder decisions, including decisions regarding our business.
The voting rights of holders of our Class A common stock are further restricted by provisions in our certificate of incorporation stating that any of our shares of stock held by a person or group that beneficially owns 20% or more of any class of stock then outstanding (other than the holders of our Class B common stock, Ares Owners Holdings L.P. (“Ares Owners”), any Holdco Member or any of their respective affiliates, or a direct or subsequently approved transferee of the foregoing) cannot be voted on any matter. The Class B Stockholder and Class C Stockholder are both exempt from this limitation.
These limits on the ability of the holders of our Class A common stock to exercise voting rights restrict the ability of the holders of our Class A common stock to influence matters subject to a vote of our stockholders.
The Holdco Members are able to significantly influence the outcome of any matter that may be submitted for a vote of holders of our common stock.
The Class B Stockholder and Class C Stockholder, entities wholly owned by Ares Partners Holdco LLC, which is in turn owned and controlled by the Holdco Members, hold the shares of our Class B common stock and the shares of our Class C common stock, respectively. On any date on which the Ares Ownership Condition is satisfied, the shares of our Class B common stock held by the Class B Stockholder entitles it to a number of votes, in the aggregate, equal to (x) four times the aggregate number of votes attributable to the shares of our Class A common stock minus (y) the aggregate number of votes attributable to the shares of our Class C common stock. On any date on which the Ares Ownership Condition is not satisfied, the shares of our Class B common stock held by the Class B Stockholder will not be entitled to vote on any matter submitted to a vote of our stockholders. The Class C Stockholder, as the holder of our Class C common stock, is entitled to a number of
votes equal to the number of Ares Operating GroupAOG Units held of record by each limited partner of the Ares Operating GroupAOG entities (other than us and our subsidiaries). In addition, Ares Partners Holdco LLC, in its capacity as general partner of Ares Owners, is entitled to direct the vote of all the shares of our Class A common stock held by Ares Owners. Accordingly, the Holdco Members have sufficient voting power to determine the outcome of matters submitted for a vote of our common stockholders.
Furthermore, our certificate of incorporation provides that special meetings of our stockholders may be called at any time only by or at the direction of our board of directors, a record holder of our Class B common stock or stockholders representing 50% or more of the voting power of the outstanding stock of the class or classes of stock which are entitled to vote at such meeting. Our Class A common stock and our Class C common stock are considered the same class of common stock for this purpose.
Each year, our board of directors determines whether, as of January 31, the total voting power held byby: (i) holders of our Class C common stock,stock; (ii) then-current or former Ares personnel (including indirectly through related entities); and (iii) Ares Owners, without duplication, is at least 10% of the voting power of the shares of our Class A common stock and the shares of our Class C common stock, voting together as a single class (the “Designated Stock”) (the “Ares Ownership Condition”). For purposes of determining whether the Ares Ownership Condition is satisfied, our board of directors will treat as outstanding, and as held by the foregoing persons, all shares of our common stock deliverable to such persons pursuant to equity awards granted to such persons. The Ares Ownership Condition is currently satisfied because Ares Owners owns a number of shares of our Class A common stock and Ares Operating GroupAOG Units such that the Class C Stockholder and Ares Owners control over 70% of the voting power of the Designated Stock. In addition, certain Ares personnel (including the Holdco Members) also hold shares of our Class A common stock and are entitled to shares of our Class A common stock pursuant to equity awards. All such additional shares of our Class A common stock would be considered in determining whether the Ares Ownership Condition is satisfied.
If the Ares Ownership Condition is satisfied, our certificate of incorporation provides that our board of directors will be divided into two classes: Class I directors and Class II directors. Mr. Antony P. Ressler, a Holdco Member, is the only Class I director and will continue to be a Class I director until his ownership of our common stock decreases below certain specified thresholds. All other directors are Class II directors. Furthermore, so long as the Ares Ownership Condition is satisfied, (x) a quorum for the transaction of business at any meeting of our board of directors and (y) any act of our board of directors, requires a majority of the board of directors, which majority must include the Class I director. This effectively provides Mr. Ressler a veto right over all actions taken by our board of directors.
As a result of these matters and the provisions referred to under “-Due“—Due to the disparity in voting power among the classes of our common stock, holders of our Class A common stock will generally have no influence over matters on which holders of our common stock vote and limited ability to influence decisions regarding our business,” holders of our Class A common stock may be deprived of an opportunity to receive a premium for their shares of our Class A common stock in the future through a sale of Ares Management Corporation,AMC, and the trading prices of shares of our Class A common stock may be adversely affected by the absence or reduction of a takeover premium in the trading price.
Potential conflicts of interest may arise among the Class B Stockholder and the Class C Stockholder, on the one hand, and the holders of our Class A common stock and/or preferred stock, on the other hand.
The Class B Stockholder and the Class C Stockholder are controlled by the Holdco Members, certain of whom also serve on our board of directors and all of whom serve as executive officers. As a result, conflicts of interest may arise among the Class B Stockholder and the Class C Stockholder, and their respective controlling persons, on the one hand, and us and the holders of our Class A common stock and/or preferred stock, on the other hand.
The Class B Stockholder and the Class C Stockholder, and thereby the Holdco Members, have the ability to influence our business and affairs through their ownership of the shares of our Class B common stock and the shares of our Class C common stock, respectively, and provisions under our certificate of incorporation requiring the approval of the holders of our Class B common stock for certain corporate actions. Due to the disparity in voting power among the classes of our common stock, the Class B Stockholder and the Class C Stockholder will effectively control the election of directors while the Ares Ownership Condition is satisfied, and holders of our Class A common stock will generally have limited ability to elect directors and no ability to remove any of our directors, with or without cause.
As such, the Class B Stockholder and Class C Stockholder, and thereby the Holdco Members, have the ability to indirectly, and in some cases directly, influence the determination of the amount and timing of the Ares Operating Group’s investments and dispositions, cash expenditures, including those relating to compensation, indebtedness, issuances of additional partner interests, tax liabilities and amounts of reserves, each of which can affect the amount of cash that is available for distribution to holders of Ares Operating GroupAOG Units.
In addition, conflicts may arise relating to the selection and structuring of investments or transactions, declaring dividends and other distributions. For example, certain of our principals and senior professional owners indirectly hold their Ares Operating GroupAOG Units through Ares Owners, which, unlike us, is not subject to corporate income taxation. See “-Tax“—Tax consequences to the direct and indirect holders of Ares Operating GroupAOG Units or to general partners in our funds may give rise to conflicts of interests.”
Certain actions by our board of directors require the approval of the Class B Stockholder, which is controlled by the Holdco Members.
Although the affirmative vote of a majority of our directors (which, so long as the Ares Ownership Condition is satisfied, must include the Class I director) is required for any action to be taken by our board of directors, certain specified
actions will also require the approval of the Class B Stockholder, which is controlled by the Holdco Members. These actions consist of the following:
•certain amendments to our certificate of incorporation (including amendments to the definition of “Ares Ownership Condition” therein), or the amendment or repeal, in whole or in part, of certain provisions of our bylaws relating to our board of directors and officers (including the adoption of any provision inconsistent therewith);
•the sale or exchange of all or substantially all of our and our subsidiaries’ assets, taken as a whole, in a single transaction or a series of related transactions; and
•the merger, consolidation or other combination of our company with or into any other person.
As a “controlled company,” we qualify for some exemptions from the corporate governance and other requirements of the NYSE.
We are a “controlled company” within the meaning of the corporate governance standards of the NYSE. Under the NYSE rules, a company of which more than 50% of the voting power for the election of directors is held by an individual, group or another company is a “controlled company” and may elect, and we have elected, and expect to continue to elect, not to comply with certain corporate governance requirements of the NYSE, including the requirements: (i)requirement that the listed company have a nominating and corporate governance committee that is composed entirely of independent directors, (ii) that the listed company have a compensation committee that is composed entirely of independent directors, and (iii) that the compensation committee be required to consider certain independence factors when engaging compensation consultants, legal counsel and other committee advisers.directors. Accordingly, holders of our Class A common stock do not have the same protections afforded to stockholders of companies that are subject to all of the corporate governance requirements of the NYSE.
Our certificate of incorporation states that the Class B Stockholder is under no obligation to consider the separate interests of our other stockholders and contains provisions limiting the liability of the Class B Stockholder.
Due to the disparity in the voting power of the classes of our common stock, holders of our Class A common stock will generally have no influence over matters on which holders of our common stock vote. As a result, on any date on which the Ares Ownership Condition is satisfied, nearly all matters submitted to a vote of the holders of our common stock will be determined by the vote of the Class B Stockholder. Although controlling stockholders may owe duties to minority stockholders, our certificate of incorporation contains provisions limiting the duties owed by the Class B Stockholder and contains provisions allowing the Class B Stockholder to favor its own interests and the interests of its controlling persons over us and the holders of our Class A common stock. Our certificate of incorporation contains provisions stating that the Class B Stockholder is under no obligation to consider the separate interests of our other stockholders (including the tax consequences to such stockholders) in deciding whether or not to cause us to take (or decline to take) any action as well as provisions stating that the Class B Stockholder shall not be liable to our other stockholders for monetary damages or equitable relief for losses sustained, liabilities incurred or benefits not derived by such stockholders in connection with such decisions. See “-Potential“—Potential conflicts of interest may arise among the Class B Stockholder and the Class C Stockholder, on the one hand, and the holders of our Class A common stock and/or preferred stock, on the other hand.”
The Class B Stockholder will not be liable to us or holders of our Class A common stock for any acts or omissions unless there has been a final and non-appealable judgment determining that the Class B Stockholder acted in bad faith or with criminal intent, and we have also agreed to indemnify other designated persons to a similar extent.
Even if there is deemed to be a breach of the obligations set forth in our certificate of incorporation, our certificate of incorporation provides that the Class B Stockholder will not be liable to us or the holders of our Class A common stock for any acts or omissions unless there has been a final and non-appealable judgment entered by a court of competent jurisdiction determining that, in respect of the matter in question, the Class B Stockholder acted in bad faith or with criminal intent. These
provisions are detrimental to the holders of our Class A common stock because they restrict the remedies available to our stockholders for actions of the Class B Stockholder.
In addition, we have agreed to indemnify and hold harmless (a)(i) each member of our board of directors and each of our officers, (b)(ii) each holder of record of our Class B common stock, (c)(iii) Ares Management GP LLC, in its capacity as the former general partner of our company when we were a Delaware limited partnership, and any successor or permitted assign, (d)(iv) any person who is or was a “tax matters partner” (as defined in the Section 6231 of the Code prior to amendment by P.L. 114-74) or “partnership representative” (as defined in Section 6223 of the Code after amendment by P.L. 114-74), member, manager, officer or director of any holder of record of our Class B common stock or Ares Management GP LLC, (e)and (v) any member, manager, officer or director of any holder of record of our Class B common stock or Ares Management GP LLC who is or was serving at the request of any holder of record of our Class B common stock or Ares Management GP LLC as a director, officer, manager, employee, trustee, fiduciary, partner, tax matters partner, partnership representative, member, representative, agent or advisor of another person (collectively, the “Indemnitees”), in each case, to the fullest extent permitted by law, on an after tax
basis from and against any and all losses, claims, damages, liabilities, joint or several, expenses (including legal fees and expenses), judgments, fines, penalties, interests, settlements or other amounts arising from any and all threatened, pending or completed claim, demand, action, suit or proceeding, whether civil, criminal, administrative or investigative, and whether formal or informal, and including appeals, in which any Indemnitee may be involved, or is threatened to be involved, as a party or otherwise, by reason of its status as an Indemnitee, whether arising from acts or omissions to act occurring on, before or after the date of our certificate of incorporation. We have agreed to provide this indemnification unless there has been a final and non-appealable judgment entered by a court of competent jurisdiction determining that, in respect of the matter in question, the Indemnitee acted in bad faith or with criminal intent.
The provision of our certificate of incorporation requiring exclusive venue in the Court of Chancery in the State of Delaware for certain types of lawsuits may have the effect of discouraging lawsuits against us and our directors, officers and stockholders.
Our certificate of incorporation requires, to the fullest extent permitted by law, that any claim, demand, action, suit or proceeding, whether civil, criminal, administrative or investigative, and whether formal or informal, and including appeals, arising out of or relating in any way to our certificate of incorporation or any of our stock may only be brought in the Court of Chancery of the State of Delaware or, if such court does not have subject matter jurisdiction thereof, any other court in the State of Delaware with subject matter jurisdiction. This provision may have the effect of discouraging lawsuits against us and our directors, officers and stockholders.
Our ability to pay dividends to the holders of our Class A and non-voting common stock may be limited by our holding company structure, applicable provisions of Delaware law and contractual restrictions or obligations.
As a holding company, our ability to pay dividends will be subject to the ability of our subsidiaries to provide cash to us. Ares Management CorporationAMC has no material assets other than investments in the Ares Operating GroupAOG entities, either directly or through subsidiaries. We have no independent means of generating revenues. Accordingly, we intend to cause the Ares Operating GroupAOG entities to fund any dividends we may declare on shares of our Class A and non-voting common stock. If the Ares Operating GroupAOG entities make distributions to fund such dividends, all holders of Ares Operating GroupAOG Units will be entitled to receive equivalent distributions pro rata based on their partnership interests in the Ares Operating Group.
Because as a U.S. corporation we will be subject to entity-level corporate income taxes and may be obligated to make payments under the tax receivable agreement,TRA, the amount of dividends ultimately paid by us to holders of our Class A and non-voting common stock are generally expected to be less, on a per share basis, than the amounts distributed by the Ares Operating Group to the holders of Ares Operating GroupAOG Units (including us) in respect of their or our Ares Operating GroupAOG Units. For a further discussion of related tax consequences and risks, see “-Risks“—Risks Related to Taxation-WeTaxation—We are a corporation, and applicable taxes will reduce the amount available for dividends to holders of our Class A and non-voting common stock in respect of such investments and could adversely affect the value of our Class A and non-voting common stockholders’ investment.”
Our dividend policy contemplates a steady quarterly dividend for each calendar year that will be based on our after-tax fee related earnings.earnings after an allocation of current taxes paid. The declaration, payment and determination of the amount of quarterly dividends, if any, will be at the sole discretion of our board of directors, and reassessed each year based on the level and growth of our after-tax fee related earnings.earnings after an allocation of current taxes paid. We may change our dividend policy at any time. There can be no assurance that any dividends, whether quarterly or otherwise, can or will be paid. Our ability to make cash dividends to holders of our Class A and non-voting common stock depends on a number of factors, including among other things, general economic and business conditions, our strategic plans and prospects, our businesses and investment opportunities, our financial condition and operating results, working capital requirements and other anticipated cash needs, contractual restrictions and obligations, including fulfilling our current and future capital commitments, legal, tax and regulatory restrictions, restrictions and other implications on the payment of dividends by us to our common
stockholders or by our subsidiaries to us, payments required to be made pursuant to the tax receivable agreementTRA and such other factors as our board of directors may deem relevant.
Under the DGCL, we may only pay dividends to our stockholders out ofof: (i) our surplus, as defined and computed under the provisions of the DGCL or (ii) our net profits for the fiscal year in which the dividend is declared and/or the preceding fiscal year. If we do not have sufficient surplus or net profits, we will be prohibited by law from paying any such dividend. In addition, the terms of the Credit Facility or other financing arrangements may from time to time include covenants or other restrictions that could constrain our ability to make dividends. Furthermore, the Ares Operating Group’s cash flow may be insufficient to enable them to make required minimum tax distributions to their members and partners, in which case the Ares Operating Group may have to borrow funds or sell assets, which could have a material adverse effect on our liquidity and financial condition. Our certificate of incorporation contains provisions authorizing us, subject to the approval of our stockholders, to issue additional classes or series of stock that have designations, preferences, rights, powers and duties that are different from, and may be senior to, those applicable to shares of our Class A common stock.
Furthermore, by making cash dividends to our stockholders rather than investing that cash in our businesses, we risk slowing the pace of our growth, or not having a sufficient amount of cash to fund our operations, new investments or unanticipated capital expenditures, should the need arise.
The Class B Stockholder or the Class C Stockholder may transfer their interests in the shares of our Class B common stock or the shares of our Class C common stock, respectively, which could materially alter our operations.
Subject to certain restrictions outlined in our certificate of incorporation, our stock is freely transferable and the Class B Stockholder or the Class C Stockholder may transfer their shares of our Class B common stock and our Class C common stock, respectively, to a third party without the consent of the holders of any other class or series of our stock. Further, the members of the Class B Stockholder or the Class C Stockholder may sell or transfer all or part of their limited liability company interests in the Class B Stockholder or the Class C Stockholder, respectively, at any time without restriction. Any such transfer could constitute or cause a change of control under the Investment Advisers Act, the Credit Facility or other debt instruments and/or governing documents of our funds and other vehicles, which could require consents or waivers or cause defaults under any such documents. In addition, a new holder of shares of our Class B common stock or shares of our Class C common stock, or new controlling members of the Class B Stockholder or Class C Stockholder, may choose to vote for the election of directors to our board of directors who may not be willing or able to cause us to form new funds and could cause us to form funds that have investment objectives and governing terms that differ materially from those of our current funds. A new holder of our Class B common stock or our Class C Common Stock, new controlling members of the Class B Stockholder or Class C Stockholder and/or the directors they each respectively may appoint to our board of directors could also have a different investment philosophy, cause us or our affiliates to employ investment professionals who are less experienced, be unsuccessful in identifying investment opportunities or have a track record that is not as successful as our track record. If any of the foregoing were to occur, we could experience difficulty in making new investments, and the value of our existing investments, our business, our results of operations and our financial condition could materially suffer.
Our certificate of incorporation also provides us with a right to acquire shares of our Class A common stock under specified circumstances, which may adversely affect the price of shares of our Class A common stock.
Our certificate of incorporation provides that, if at any time, eithereither: (i) less than 10% of the total shares of any class of our stock then outstanding (other than our Class B common stock, and our Class C common stock and our preferred stock) is held by persons other than a record holder of our Class B common stock, any person who is, was or will be a member of Ares Partners Holdco LLC or their respective affiliates or (ii) we are required to register as an investment company under the U.S. Investment Company Act, of 1940, we may exercise our right to purchase shares of our Class A common stock or assign this right to a record holder of our Class B common stock or any of its affiliates. As a result, a stockholder may have his or her shares of our Class A common stock purchased from him or her at an undesirable time or price.
Other anti-takeover provisions in our charter documents could delay or prevent a change in control.
In addition to the provisions described elsewhere relating to the relative voting power of our classes of common stock, other provisions in our certificate of incorporation and bylaws may discourage, delay or prevent a merger or acquisition that a holder of our Class A common stock may consider favorable by, for example:
•permitting our board of directors to issue one or more series of preferred stock;
•providing for the loss of voting rights for certain series or classes of our capital stock;
•imposing supermajority voting requirements for certain amendments to our certificate of incorporation;
•requiring advance notice for stockholder proposals and nominations at annual and special meetings of our stockholders; and
•placing limitations on convening stockholder meetings.
These provisions may also discourage acquisition proposals or delay or prevent a change in control.
We will be required to pay the TRA Recipients for most of the benefits relating to our use of attributes we receive from prior and future exchanges of Ares Operating GroupAOG Units and related transactions. In certain circumstances, payments to the TRA Recipients may be accelerated and/or could significantly exceed the actual tax benefits we realize.
The holders of Ares Operating GroupAOG Units, subject to any applicable transfer restrictions and other provisions, may, on a quarterly basis, exchange their Ares Operating GroupAOG Units for shares of our Class A common stock on a one-for-one basis or, at our option, for cash. A holder of Ares Operating GroupAOG Units must exchange one AOG Unit in the Ares Operating Group Unit in each of the three Ares Operating Group entitiesentity to effect an exchange for a share of
Class A common stock of Ares Management Corporation.AMC. These exchanges are expected to result in increases (for U.S. federal income tax purposes) in the tax basis of the tangible and intangible assets of the relevant Ares Operating Group entity. These increases in tax basis generally will increase (for U.S. federal income tax purposes) depreciation and amortization deductions and potentially reduce gain on sales of assets and, therefore, reduce the amount of tax that we would otherwise be required to pay in the future, although the IRS may challenge all or part of these deductions and tax basis increases, and a court could sustain such a challenge.
We have entered into a tax receivable agreementTRA with certain direct and indirect holders of Ares Operating GroupAOG Units (the “TRA Recipients”) that provides for the payment (“Tax Receivable Payment”) by us to the TRA Recipients of 85% of the amount of cash tax savings, if any, in U.S. federal, state, local and foreign income tax or franchise tax that we actually realize (or are deemed to realize in the case of an early termination payment by us or a change of control, as discussed below) as a result of increases in tax basis and certain other tax benefits related to our entering into the tax receivable agreement,TRA, including tax benefits attributable to payments under the tax receivable agreement.TRA. Pursuant to an amendment to the TRA, dated May 1, 2023, to the extent Ares Owners Holdings L.P. would have been a TRA Recipient of a Tax Receivable Payment under the TRA prior to the amendment, Ares Owners Holdings L.P. will no longer be entitled to any Tax Receivable Payment for taxable exchanges on or after May 1, 2023. The payments we may make to the TRA Recipients could be material in amount and we may need to incur debt to finance payments under the tax receivable agreementTRA if our cash resources are insufficient to meet our obligations under the tax receivable agreementTRA as a result of timing discrepancies or otherwise. The actual increase in tax basis (and our ability to achieve the corresponding tax benefits), as well as the amount and timing of any payments under the tax receivable agreement,TRA, will vary depending upon a number of factors, including the timing of exchanges, the price of a share of our Class A common stock at the time of the exchange, the extent to which such changes are taxable and the amount and timing of our income. As a result, inIn certain circumstances, payments to the TRA Recipients under the tax receivable agreementTRA could be in excess of our cash tax savings. If the IRS were to challenge a tax basis increase (or the ability to amortize such increase), the TRA Recipients will not reimburse us for any payments previously made to them under the tax receivable agreement.TRA.
In addition, the tax receivable agreementTRA provides that, upon a change of control, or if, at any time, we elect an early termination of the tax receivable agreement,TRA, our obligations under the tax receivable agreementTRA with respect to exchanged or acquired shares of our Class A common stock (whether exchanged or acquired before or after such change of control) would be based on certain assumptions, including that we would have sufficient taxable income to fully utilize the deductions arising from the increased tax deductions and tax basis and other benefits related to entering into the tax receivable agreementTRA and, in the case of an early termination election, that any Ares Operating GroupAOG Units that have not been exchanged are deemed exchanged for the market value of shares of our Class A common stock at the time of termination. Assuming that the market value of a share of our Class A common stock were to be equal to $47.05,$118.92, which is the closing price per share of our Class A common stock as of December 31, 2020,2023, and that LIBORSOFR were to be 1.34%5.38% and a blended federal and state corporate tax rate of 23.7%24.0%, we estimate that the aggregate amount of these termination payments would be approximately $983.2 million$1.7 billion on the 112117 million Ares Operating GroupAOG Units that have not been exchanged for Class A common stock. The foregoing amount is merely an estimate and the actual payments could differ materially.
Tax consequences to the direct and indirect holders of Ares Operating GroupAOG Units or to general partners in our funds may give rise to conflicts of interests.
As a result of the tax gain inherent in our assets held by the Ares Operating Group, upon a realization event, certain direct and indirect holders of Ares Operating GroupAOG Units may incur different and potentially significantly greater tax liabilities as a result of the disproportionately greater allocations of items of taxable income and gain to such holders. As these direct and indirect holders will not receive a correspondingly greater distribution of cash proceeds, they may, subject to applicable fiduciary or contractual duties, have different objectives regarding the appropriate pricing, timing and other material terms of any sale, refinancing, or disposition, or whether to sell such assets at all. Decisions made with respect to an acceleration or deferral of income or the sale or disposition of assets with unrealized built-in tax gains may also influence the timing and amount of payments that are received by the TRA Recipients (including, among others, the Holdco Members and other
executive officers) under the tax receivable agreement.TRA. In general, we anticipate that disposition of assets with unrealized built-in tax gains following an exchange will tend to accelerate such payments and increase the present value of payments under the tax receivable agreement,TRA, and disposition of assets with unrealized built-in tax gains in a tax year before an exchange generally will increase an exchanging holder’s tax liability without giving rise to any rights to any payments under the tax receivable agreement.TRA. Decisions made regarding a change of control also could have a material influence on the timing and amount of payments received by the TRA Recipients pursuant to the tax receivable agreement.TRA.
Moreover, we may receive performance incomecarried interest or incentive fees from our funds if specified returns are achieved by those funds. In certain circumstances, we may prefer to structure the performance incomefees as a special allocation of income, which we refer to as a carried interest, rather than as an incentive fee.
The general partner of our funds may be entitled to receive carried interest from our funds and a significant portion of that carried interest may consist of long-term capital gains. As a U.S. corporation, we will not receive preferential treatment for long-term capital gains and we may be limited in deducting capital losses. As a result, the general partners of our funds may
have interests that are not entirely aligned with our stockholders and thus, subject to their fiduciary duties to fund investors, may be incentivized to seek investment opportunities that maximize favorable tax treatment to the general partners.
Risks Related to Shares of Our Common Stock and Shares of Our Preferred Stock
The market price and trading volume of shares of our Class A common stock may be volatile, which could result in rapid and substantial losses for holders of our Class A common stock.
The market price of shares of our Class A common stock may be highly volatile and could be subject to wide fluctuations. In addition, the trading volume in shares of our Class A common stock may fluctuate and cause significant price variations to occur. If the market price of shares of our Class A common stock declines significantly, holders of our Class A common stock may be unable to resell their shares of our Class A common stock at or above their purchase price, if at all. The market price of shares of our Class A common stock may fluctuate or decline significantly in the future. Some of the factors that could negatively affect the price of shares of our Class A common stock or result in fluctuations in the price or trading volume of shares of our Class A common stock include:
•variations in our quarterly operating results or dividends, which variations we expect will be substantial;
•our policy of taking a long-term perspective on making investment, operational and strategic decisions, which is expected to result in significant and unpredictable variations in our quarterly returns;
•our creditworthiness, results of operations and financial condition;
•the prevailing interest rates or rates of return being paid by other companies similar to us and the market for similar securities;
•failure to meet analysts’ earnings estimates;
•publication of research reports about us or the investment management industry or the failure of securities analysts to cover shares of our Class A common stock;
•additions or departures of our senior professionals and other key management personnel;
•adverse market reaction to any indebtedness we may incur or securities we may issue in the future;
•changes in market valuations of similar companies;
•speculation in the press or investment community;
•changes or proposed changes in laws or regulations or differing interpretations thereof affecting our businesses or enforcement of these laws and regulations, or announcements relating to these matters;
•a lack of liquidity in the trading of shares of our Class A common stock;
•announcements by our competitors of significant contracts, acquisitions, dispositions, strategic partnerships, joint ventures or capital commitments;
•adverse publicity about the asset management industry generally or, more specifically, private equity fund practices or individual scandals; and
•general market and economic, financial, geopolitical, regulatory or judicial events or conditions that affect us or the financial markets.
In the past few years, stock markets have experienced extreme price and volume fluctuations. In the past, following periods of volatility in the overall market and the market price of a company’s securities, securities class action litigation has often been instituted against public companies. This type of litigation, if instituted against us, could result in substantial costs and a diversion of our management’s attention and resources.
The market price of shares of our Class A common stock may decline due to the large number of shares of Class A common stock eligible for exchange and future sale.
The market price of shares of our Class A common stock could decline as a result of sales of a large number of shares of our Class A common stock in the market and non-voting common stock, to the extent that sales happen in the future or the perception that such sales could occur, including pursuant to Rule 10b5-1 trading plans. These sales, or the possibility that these
sales may occur, also might make it more difficult for us to sell shares of our Class A common stock in the future at a time and at a price that we deem appropriate. We may freely issue and sell in the future additional shares of our Class A common stock. In addition, some of our directors and executive officers have entered into, or may enter into, Rule 10b5-1 trading plans pursuant to which they may sell shares of our Class A common stock from time to time in the future.
As of December 31, 2020,2023, our professionals owned, indirectly, an aggregate of 112,447,618 Ares Operating Group117,024,758 AOG Units. We have entered into an exchange agreement with the holders of Ares Operating GroupAOG Units so that such holders may, up to four times each year (subject to the terms of the exchange agreement)agreement and any contractual lock-up arrangements), exchange their Ares Operating GroupAOG Units for shares of our Class A common stock on a one-for-one basis, subject to customary conversion rate adjustments for splits, stock dividends and reclassifications, or, at our option, for cash. A holder of Ares Operating GroupAOG Units must exchange one AOG Unit in the Ares Operating Group Unit in each of the three Ares Operating Group entitiesentity to effect an exchange for a share of Class A common stock of Ares Management Corporation.AMC.
Ares Owners Holdings L.P. has the right, under certain circumstances and subject to certain restrictions, to require us to register under the Securities Act shares of Class A common stock delivered in exchange for Ares Operating GroupAOG Units or shares of Class A common stock of Ares Management CorporationAMC otherwise held by them. In addition, we may be required to make available shelf registration statements permitting sales of shares of our Class A common stock into the market from time to time over an extended period. Lastly, Ares Owners Holdings L.P. will have the ability to exercise certain piggyback registration rights in respect of shares of our Class A common stock held by them in connection with registered offerings requested by other registration rights holders or initiated by us.
As of December 31, 2020,2023, there were options outstanding to purchase 8,312,20379,524 shares of our Class A common stock and 16,299,66417,359,829 restricted units outstanding to be settled in shares of our Class A common stock, both of which are subject to specified vesting requirements, and were granted to certain of our senior professionals under the 20142023 Ares Management Corporation Equity Incentive Plan as amended and restated on March 1, 2018 and as further amended and restated effective November 26, 2018 (the “Equity Incentive Plan”). As of December 31, 2020, 33,861,1172023, 69,150,100 shares of our Class A common stock were available to be issued under ourthe Equity Incentive Plan. We have filed a registration statement on Form S-8 with the SEC covering the shares of our Class A common stock issuable under ourthe Equity Incentive Plan. Subject to vesting arrangements such shares of our Class A common stock are freely tradable. Vesting of those shares of restricted units would dilute the ownership interest of existing stockholders.
In addition, the governing agreements of the Ares Operating GroupAOG entities authorize the direct subsidiaries of Ares Management CorporationAMC which are the general partners of those entities to issue an unlimited number of additional units of the Ares Operating Group entity with such designations, preferences, rights, powers and duties that are different from, and may be senior to, those applicable to the Ares Operating GroupAOG Units, and which may be exchangeable for shares of our Class A common stock.
Dividends on shares of the Series A Preferred Stock are discretionary and non-cumulative.
Dividends on shares of the Series A Preferred Stock are discretionary and non-cumulative. Holders of the Series A Preferred Stock will only receive dividends when, as and if declared by our board of directors. Consequently, if our board of directors does not authorize and declare a dividend for a dividend period, holders of the Series A Preferred Stock would not be entitled to receive any dividend for such dividend period, and such unpaid dividend will not be payable in such dividend period or in later dividend periods. We will have no obligation to pay dividends for a dividend period if our board of directors does not declare such dividend before the scheduled record date for such period, whether or not dividends are declared or paid for any subsequent dividend period with respect to shares of the Series A Preferred Stock or the shares of any other class of preferred stock we may issue. This may result in holders of the Series A Preferred Stock not receiving the full amount of dividends that they expect to receive, or any dividends, and may make it more difficult to resell shares of the Series A Preferred Stock or to do
so at a price that the holder finds attractive. Our board of directors may, in its sole discretion, determine to suspend dividends on shares of the Series A Preferred Stock, which may have a material adverse effect on the market price of shares of the Series A Preferred Stock. There can be no assurances that our operations will generate sufficient cash flows to enable us to pay dividends on shares of the Series A Preferred Stock. Our financial and operating performance is subject to prevailing economic and industry conditions and to financial, business and other factors, some of which are beyond our control.
Risks Related to Taxation
We are a corporation, and applicable taxes will reduce the amount available for dividends to holders of our Class A and non-voting common stock in respect of such investments and could adversely affect the value of our Class A and non-voting common stockholders’ investment.
Because we are taxed as a corporation for U.S. federal income tax purposes, we could be liable for significantentity-level U.S. federal income taxes and applicable state and local income taxes that would not otherwise be incurred if we were treated as a partnership for U.S. federal income tax purposes, which could reduce the amount of cash available for dividends to holders of our Class A and non-voting common stock and adversely affect the value of their investment.
In addition, the GP Mirror Units pay the same 7.00% rate per annum to us that we pay on shares of the Series A Preferred Stock. Although income allocated in respect of distributions on the GP Mirror Units made to us is subject to tax, cash dividends to holders of the Series A Preferred Stock will not be reduced on account of any income taxes owed by us.
Applicable U.S. and foreign tax law, regulations, or treaties, and changes in such tax laws, regulations or treaties or an adverse interpretation of these items by tax authorities could adversely affect our effective tax rate, tax liability, financial condition and results, ability to raise funds from certain foreign investors, increase our compliance or withholding tax costs and conflict with our contractual obligations.
Overview of certain relevant U.S. tax laws. In addition, taxTax laws, regulations or treaties newly enacted or enacted in the future may cause us to revalue our net deferred tax assets and have a material change to our effective tax rate and tax liabilities. Moreover, significant management judgment is involved applying tax laws, regulations and treaties to us and our funds such that tax authorities could challenge our interpretation, resulting in additional tax liability or adjustment to our income tax provision that could increase our effective tax rate. For example, on March 11, 2021, the United States, Public LawAmerican Rescue Plan Act of 2021 (Pub. L. No. 115-97117-2) (the “Tax Cuts and Jobs Act”“ARPA”), which was enacted in December 2017 and amended various aspects of U.S. federal income tax legislation, has resulted in various changesenacted. The ARPA added a new subsection to U.S. tax laws, including meaningful reduction to the U.S. federal corporate income tax rate, changes to the rules for the carryback and carryforward of net operating losses, changes to U.S. taxation on earnings from international business operations, certain modifications to the Section 162(m) of the Code and a partial limitation onto expand the deductibilitydisallowance for deduction of business interest expense,certain compensation paid by publicly held corporations to cover the next five most highly compensated employees for the taxable year, which could have a material effect on our business operations, our funds’ investment activities and the business of our portfolio companies. More recently, in March 2020, the Families First Coronavirus Response Act (the “FFCR Act”) and the Coronavirus Aid, Relief, and Economic Security Act (the “CARES Act”) were enacted in response to the COVID-19 pandemic. The FFCR Act and the CARES Act contain numerous incomeexpansion will be effective for tax provisions, such as relaxing limitations on the deductibility of interest and the use of net operating losses arising in taxable years beginning after December 31, 2017. In December 2020, the Consolidated Appropriations Act, 2021 was enacted, which expands upon the relief provided in the CARES Act and FFCR Act and includes additional tax-related provisions. We are currently evaluating the potential tax impact of the CARES Act. FFCR and Consolidated Appropriations Acts (and related legislation) on us or our business or the business of our portfolio companies. In December 2020, the U.S. Internal Revenue Service (the “IRS”) released final regulations under Section 162(m) (which are generally consistent with the proposed regulations released in December 2019), which addressed changes made by the Tax Cuts and Jobs Act and, among other things, extended the coverage2026. The expansion of Section 162(m) is expected to include compensation paid by a partnership for services performed for it by a covered employee of a corporation that is a partner in the partnership. The regulations maygenerally reduce the amount of tax deductions available to us. Additionally, foreignIn addition, on August 16, 2022, the Inflation Reduction Act (Pub. L. No. 117-169) (the “IRA”) was signed into law. The IRA introduces a 15% minimum tax for corporations whose average annual adjusted financial statement income for any consecutive
three-tax-year period preceding the tax year exceeds $1 billion and state and local governments may continue to enacta 1% excise tax laws in response toon the Tax Cuts and Jobs Actfair market value of stock repurchased by certain corporations after December 31, 2022. We do not currently expect that could result in further changes to foreign and state and local taxation and materially affectthe IRA will have a material impact on our financial position and results of operations. We cannot predict how changes in law (like a change in corporate income tax rate), regulations, technical corrections or other guidance issued under it or conforming or non-conforming state tax rules might affect us or our business orliability for 2024. The impact on taxable years thereafter will depend on the businessfacts and circumstances of our portfolio companies. Furthermore, the IRS has recently finalized proposed regulations implementing the anti-hybrid provisions (and issued new proposed regulations providing additional guidance on such anti-hybrid provisions) and recently finalized proposed regulations (and revised certain final regulations) under the “base erosion and anti-abuse tax” (“BEAT”) provisions that were enacted as part of the Tax Cuts and Jobs Act. Whether any of the proposed regulations will be enacted by the United States or any foreign jurisdiction and in what form is unknown, as are the ultimate consequences of any such proposed regulations.years.
Under Sections 1471 to 1474 of the Code (such Sections, along with the Treasury Regulations promulgated thereunder, “FATCA”), a broadly defined class of foreign financial institutions are required to comply with a U.S. tax reporting regime or be subject to certain U.S. withholding taxes. The reporting obligations imposed under FATCA require foreign financial institutions to enter into agreements with the IRS to obtain and disclose information about certain account holders and investors to the IRS (or in the case of certain foreign financial institutions that are resident in a jurisdiction that has entered into
an intergovernmental agreement (the “IGA”) to implement this legislation, to comply with comparable non-U.S.foreign laws implementing the IGA). Additionally, certain non-U.S.foreign entities that are not foreign financial institutions are required to provide certain certifications or other information regarding their U.S. beneficial ownership or be subject to certain U.S. withholding taxes under FATCA. Failure to comply with these requirements could expose us and/or our investors to a 30% withholding tax on certain U.S. payments, and possibly limit our ability to open bank accounts and secure funding in the global capital markets. There are uncertainties regarding the implementation of FATCA and it is difficult to determine at this time what impact any future administrative guidance may have. The administrative and economic costs of compliance with FATCA may discourage some foreign investors from investing in U.S. funds, which could adversely affect our ability to raise funds from these investors or reduce the demand for shares of our Class A common stock. Moreover, we expect to incur additional expenses related to our compliance with FATCA, which could increase our tax compliance costs generally. As discussed below, other countries, such as the U.K., Luxembourg, and the Cayman Islands, have implemented regimes similar to that of FATCA, and a growing number of countries have adopted (or are in process of introducing) similar legislation designed to provide increased transparency about our investors and their tax planning and profile. One or more of these information exchange regimes are likely to apply to our funds, and we may be obligated to collect and share with applicable taxing authorities information concerning investors in our funds (including identifying information and amounts of certain income allocable or distributable to them).
Overview of certain relevant foreign tax laws. Her Majesty’sHM Treasury, (“HM Treasury”), the Organization for Economic Co-operation and Development (the “OECD”) and other government agencies in jurisdictions where we and our affiliates invest or conduct business have maintained a focus on issues related to the taxation of businesses, including multinational entities.
The U.K. has implemented two corporate criminal offenses: failure to prevent facilitation of U.K. tax evasion and failure to prevent facilitation of overseas tax evasion. Liability under these offences can be mitigated where the relevant business has in place reasonable prevention procedures. The scope of these offences is extremely wide and could have an impact on Ares’ global businesses. The U.K. has also implemented transparency legislation that requires many large businesses to publish their U.K. tax strategies and their approach to dealing with the U.K. tax authority on their websites. Our U.K. tax policy statement is published on our website. These developments show that the U.K. is seeking to bring tax matters further into the public domain. As a result, tax matters may pose an increased reputational risk to our business.
The EU, the U.K. and many other countries have implemented the OECD’s Common Reporting Standard for the automatic exchange of financial account information in tax matters (the “CRS”). EU Council Directive 2018/822 (“DAC 6”)2011/16/EU requires a mandatory automatic exchange of information regime on administrative co-operation in the field of taxation (as amended) (the “Directive on Administrative Co-Operation” or the “DAC”). The DAC, which effectively incorporates (among other items) the CRS into European law, like the CRS, requires governments to obtain detailed account information from financial institutions and exchange that information automatically with other jurisdictions annually. Neither the CRS nor the DAC imposes withholding taxes. EU Council Directive 2018/822 (“DAC 6”) amended the DAC to require ‘intermediaries’ (as defined in relation to reportable cross-border arrangements. As July 1, 2020 (or January 1, 2021 for jurisdictions which deferred implementation),DAC 6) and, in some cases, taxpayers and their advisers may be required under DAC 6 to disclose information to tax authorities whenabout cross-border arrangements bearing specific hallmarks involveinvolving one or more EU member states. Certain cross-border arrangements put into place beginning June 25, 2018 will also beare reportable to relevant taxing authorities beginning August 31, 2020 (or February 28, 2021 forauthorities. Similar reporting rules may apply or be introduced in other jurisdictions which deferred implementation)implement the OECD mandatory disclosure rules (“OECD MDR”). OnWith effect from December 31, 2020, the U.K. narrowed the scope of DAC 6 and the corresponding arrangements that need to be reported in the UKU.K. pursuant to DAC 6 and, in due course,(as implemented under U.K. law by the International Tax Enforcement (Disclosable Arrangements) Regulations 2020 (the “U.K. Regulations”)). The U.K. intends to transition from and replace DAC 6the U.K. Regulations (as amended) with the OECD Mandatory Disclosure Rules.MDR during the first half of 2023. The EU has also signed separate automatic exchange of information agreements with certain non-EU countries, under which the EU and the relevant jurisdiction will automatically exchange information on the financial accounts of each other’s residents. Investors in our funds will be requiredrequired: (i) to consent to the taking of any action in connection with FATCA, the CRS, the DAC 6(including DAC 6), the OECD MDR and/or any local law relating to, implementing or having similar other tax reportingeffect to any of these regimes, including the disclosure of information to tax authorities which may in turn be exchanged between other tax authorities,authorities; and (ii) to agree to provide the AIFM and/or the general partner with the information they require to comply with FATCA, the CRS, the DAC 6(including DAC 6), the OECD MDR and/or any local law relating to, implementing or having similar other tax reportingeffect to any of
these regimes in any relevant jurisdiction. The breadth of the disclosure requirements under such tax reporting regimes will likely create costs and administrative burdens and penalties and withholding taxes could be imposed for non-compliance.
Pursuant to the OECD’s Base Erosion and Profit Shifting (“BEPS”) Project, many individual jurisdictions are beginning to introducehave now introduced domestic legislation implementing certain of the BEPS actions. Several of the areas of tax law (including double taxation treaties) on which the BEPS Project is focusingfocuses are relevant to the ability of our funds to efficiently realize income or capital gains and to efficiently repatriate income and capital gains from the jurisdictions in which they arise to partners and, depending on the extent to and manner in which relevant jurisdictions have implemented (or implement, as the case may be) changes in such areas of tax law (including double taxation treaties), the ability of our funds to do these things may be adversely impacted. Changes in tax laws as a result of the BEPS Project may, for example, result in: (a)(i) the restriction or loss of existing access by partners in our funds or their subsidiaries to tax relief under applicable double taxation treaties or EU directives, such as the EU Interest and Royalties Directive; (b)(ii) restrictions on permitted levels of deductibility of expenses (such as interest) for tax purposes; (c)(iii) rules affecting profit allocation and local nexus requirements, transfer pricing, or the treatment of hybrid entities/investmentsinvestments; or (d)(iv) an increased risk of activity undertaken in a jurisdiction constituting a permanent establishment of our funds and/or any of their subsidiaries.
Many of the jurisdictions in which our funds will make investments indicated in June 2017 that they would implementhave now ratified, accepted and approved the OECD’s draft Multilateral Instrument (“MLI”) which will bringbrings into force a number relevant changes to double tax treaties.treaties within scope. The MLI is intended to facilitate the speedy introduction by participating states of double tax treaty-related BEPS recommendations. ThereWhile these changes continue to be introduced, there remains significant uncertainty as to whether and, if so, to what extent our funds or their subsidiaries may benefit from the protections afforded by such treaties and whether our funds may look to their partners in order to derive tax treaty or other benefits. This position is likely to remain uncertain for a number of years.
In July 2016, the EU adopted the EU adopted the Anti-Tax Avoidance Directive 2016/1164 (commonly referred to as “ATAD I”), which directly implements some of the BEPS Project actions points within EU law. EU member states had until December 31, 2018 to transpose ATAD I into their domestic laws (except for the provisions on exit taxation, which had to be transposed by December 31, 2019). On May 29, 2017, the Council of the EU formally adopted the Council Directive amending Directive (EU) 2016/1164 as regards hybrid mismatches with third countries (commonly referred to as “ATAD II”), which came into force in member states on January 1, 2020 (subject to relevant derogations) and which contains a set of anti-hybrid rules.
ATAD II was implemented into Luxembourg domestic law by way of a law dated December 20, 2019. The anti-hybrid rules apply for fiscal years starting on or after January 1, 2020, except for the rules governing reverse hybrid mismatches which should be applicable only as of January 1, 2022. ATAD II covers inter alia hybrid mismatches and imported hybrid mismatches resulting from the different characterization of a financial instrument or an entity leading to situations of deduction without inclusion or double deduction. For hybrid mismatches resulting in a situation of deduction without inclusion, the primary rule is that the member state of the payor shall deny such deduction. For hybrid mismatches resulting in a situation of double deduction, a deduction shall only be given to the member state where the payment has its source. However, if, the jurisdiction of the payee does not deny the deduction, the secondary rule would oblige the jurisdiction of the payor to deny the deduction at the level of the payor.
If the ATAD II anti-hybrid rules apply, they can act to deny (to a greater or lesser extent) deductibility in Luxembourg corporate entities of interest/expenses. However, these anti-hybrid rules only apply to arrangementsarrangements: (i) between associated enterprises or (ii) that constitute “structured arrangements”.arrangements.” In the context of hybrid mismatches resulting from the different characterization of a financial instrument, an entity will need to hold a direct or indirect interest of 25% or more of the voting rights, capital interests or rights to share a profit to be considered an associated enterprise. The 25% requirement is replaced by a 50% requirement if the hybrid mismatch results from a different characterization of an entity (i.e., a hybrid entity). With respect to the computation of this 25% or 50% threshold requirement, ATAD II makes reference to the OECD concept of “persons acting together”, as it is specifically mentioned that for purposes of the anti-hybrid rules under ATAD II, “a person who acts together with another person in respect of the voting rights or capital ownership of an entity shall be treated as holding a participation in all of the voting rights or capital ownership of that entity that are held by the other person”.person.” However, the Luxembourg law implementing ATAD II which came into effect on January 1, 2020, provides that an investor in an investment fund who holds directly or indirectly less than 10% of the interest in the investment fund and who is entitled to receive less than 10% of the fund’s profits is presumed not to act together with the other investors in the same investment fund (since the investors have in principle no effective control over the investments realized by the fund), unless proved otherwise (the de minimis rule). As a consequence of this rebuttable presumption, any investor holding less than 10% in an investment fund should not be regarded as an “associated enterprise” of the fund and of any underlying Luxembourg entities. Any investor holding more than 10% will only be regarded as an “associated enterprise” if it meets the requisite threshold in its own right, or it can be demonstrated that it is acting together with other investors, which would cause it to be deemed to reach the requisite threshold. Our funds have sought their own tax advice in relation to these proposed new rules and their potential impact on future investments.
The impacts of ATAD II on interest and other finance costs in the context of European investments are jurisdiction specific and will be examined on an investment-by-investment basis.
Further to the BEPS Project, and in particular BEPS Action 1 (“Addressing the Tax Challenges of the Digital Economy”), the OECD published a Report on May 31, 2019 entitled “Programme of Work to Develop a Consensus Solution to the Tax Challenges Arising from the Digitalisation of the Economy” (as updated on January 31, 2020several occasions since and most recently on October 8, 2021 by the “Statement by the OECD/G20 Inclusive Framework on BEPS on thea Two-Pillar ApproachSolution to Address the Tax Challenges Arising from the Digitalisation of the Economy”), which proposes fundamental changes to the international tax system. The proposals (commonly now also referred to as “BEPS 2.0”) are based on two “pillars”, involving the reallocation of taxing rights (Pillar One)(“Amount A of Pillar One”), and a new global minimum corporate tax rate (“Pillar Two”). Under Amount A of Pillar One, multinational enterprises (“MNEs”) with total group revenues exceeding EUR 20 billion (or equivalent) in a given period and pre-tax profitability exceeding 10% calculated using an averaging mechanism will be subject to rules allocating 25% of profits in excess of a 10% profit margin to the jurisdictions within which they carry on business (subject to threshold rules). Certain entities are excluded, including certain investment funds and real estate investment vehicles (as respectively defined) which are the ultimate parent entity of the MNE group (and certain holding vehicles of such entities). There are also specific exclusions for MNEs carrying on specific low-risk activities, including “regulated financial services” (as defined). Pillar Two imposes a minimum effective tax rate of 15% on MNEs that have consolidated revenues of at least EUR 750 million in at least two out of the last four years (i.e., broadly those MNEs which are required to undertake country by country reporting). Pillar Two introduces two related tax measures (the “GloBE Rules”): the income inclusion rule (“IIR”) imposes a top up tax on a parent entity where a constituent member of the MNE group has low taxed income while the undertaxed payment rule (“UTPR”) applies as a backstop if the constituent member’s income is not taxed by an IIR. Specified classes of entities which are typically exempt from tax are outside the scope of the Pillar Two GloBE Rules, including investment funds and real estate investment vehicles (as respectively defined) which are the ultimate parent entity of the MNE group (and certain holding vehicles of such entities). Additionally, and part of Pillar Two but separate from the GloBE Rules, a subject to tax rule (“STTR”) will permit source jurisdictions to impose limited additional global anti-base erosion rules (Pillar Two). On October 12, 2020,taxation on certain cross-border related party payments where the recipient is subject to a nominal corporate income tax rate (subject, in some circumstances, to certain adjustments) below 9%, which will be creditable against the GloBE Rules tax liability. The GloBE Rules must be implemented through domestic legislation, and on December 20, 2021 the OECD publishedreleased Pillar Two model rules providing a report entitled “Tax Challenges Arising from Digitalisation – Economic Impact Assessment”template for this purpose. Many jurisdictions have begun that process, including EU member states pursuant to the EU minimum tax directive and the U.K., which among other items, included detailed reportswith a view to the IIR and the UTPR taking effect for fiscal years beginning on or after December 31, 2023 and December 31, 2024, respectively. Amount A of Pillar One will be implemented through a multilateral convention and the STTR will be implemented, where applicable, either through modifications to bilateral tax treaties or alternatively through a multilateral instrument. The timeline for implementation of both Amount A of Pillar One and the STTR remains uncertain. Subject to the development and implementation of both Amount A of Pillar One and Pillar Two (in addition to an “Economic Impact Assessment”(including the implementation of the Pillar OneEU minimum tax directive by EU member states) and Pillar Two proposals). Although the OECD originally aimeddetails of any domestic legislation, double taxation treaty amendments and multilateral agreements which are necessary to reach a consensual solution on the new international tax rules during 2020, with a final report by the end of 2020, the OECD’s October 12, 2020 report indicated that a consensus will likely not be reached
until mid-2021. BEPS 2.0 is still in its early stages, and there currently remains uncertainty as to how consensus will be reached and how and when its principles will be implemented by participating countries. Depending on the outcome of BEPS 2.0,implement them, effective tax rates could increase within Ares’the fund structure or on its investments, including by way of higher levels of tax being imposed than is currently the case, possible denial of deductions or increased withholding taxes and/or profits being allocated differently.differently and/or penalties could be due. This could adversely affect the returns of investors in our funds. The implementation of BEPS 2.0 in relevant jurisdictions is complex and likely to remain uncertain for a number of years.
The Netherlands continuedOn December 22, 2021, the European Commission issued a proposal for a Council Directive laying down rules to provide additional updatesprevent the misuse of shell entities for tax purposes within the EU (the “Unshell Proposal”). Whilst the European Commission initially expected the Unshell Proposal to its withholding tax on dividends. Followingbe adopted and published into EU case law, three safe harbor rules currently embedded in domestic anti-abuse rulesmember states’ national laws by June 30, 2023, and to come into effect as partof January 1, 2024, the proposal has not yet been adopted and there is considerable uncertainty surrounding the development of the Dividend Withholding Tax Actproposal and its implementation. If adopted in its current form, the Corporate Income Tax Act will no longer function as a safe harbor rule. In addition, the Dutch political party “GroenLinks” has indicated they will issue a legislative proposal to amend the Dividend Withholding Tax Act. Currently, there is no draft bill, nor is it indicated when the draft bill will be presented to parliament. If the bill is accepted, the date of entry into force would be subject to discussion. We are evaluating the impact of this change which could result in additional withholding on certain paymentsreporting and disclosure obligations for us andfunds and/or their subsidiaries (which may require the sharing with applicable taxing or other governmental authorities of information concerning investors) and/or additional tax being suffered by investors, funds or their subsidiaries.
Effective April 1, 2022, the U.K. implemented a domestic ‘Qualifying Asset Holding Company’ regime, with a view to broadly making the U.K. a more attractive holding company jurisdiction. The extent to which this regime may be applicable or beneficial to and/or utilized by our investment funds.funds (or their subsidiaries) remains under consideration.
Certain U.S. stockholders are subject to additional tax on “net investment income.”
U.S. stockholders that are individuals, estates or trusts are subject to a surtax of 3.8% on “net investment income” (or undistributed “net investment income,” in the case of estates and trusts) for each taxable year, with such tax applying to the lesser of such income or the excess of such person’s adjusted gross income (with certain adjustments) over a specified amount. Net investment income includes earnings from dividends and net gain attributable to the disposition of investment property. It is
anticipated that dividends and net gain attributable to an investment in shares of our Class A common stock will be included in a U.S. holder’s “net investment income” subject to this surtax.
Limitations on the amount of interest expense that we may deduct could materially increase our tax liability and negatively affect an investment in shares of our Class A common stock.
For taxable years beginning after December 31, 2017, ourOur deduction of net business interest expenses for each taxable year is limited generally to 30% (or, solely for the taxable years that begin in 2019 or 2020, 50%) of our “adjusted taxable income” for the relevant taxable year (with an election being available for taxable years beginning in 2020 to use adjusted taxable income from the last taxable year beginning in 2019), which is an amount that is similar to EBITDA for taxable years beginning before January 1, 2022, and similar to earnings before interest and taxes (“EBIT”) for taxable years beginning on or after January 1, 2022.year. Any excess business interest not allowed as a deduction in a taxable year as a result of the limitation generally will carry forward to the next year.
There is no grandfather provision for outstanding debt prior to the effective date of these rules. This is a significant change from prior law, which could increase our tax liability.
Any failure to properly manage or address the foregoing risks may have a material adverse effect on our business, results and financial condition.
General Risk Factors
Cybersecurity risksfailures and cyberdata security incidents could adversely affect our business by causing a disruption to our operations, a compromise or corruption of our confidential, personal or other sensitive information and confidential information in our possession and/or damage to our business relationships or reputation, any of which could negatively impact our business, financial condition and operating results.
ThereThe efficient operation of our business is dependent on computer hardware and software systems, as well as data processing systems and the secure processing, storage and transmission of information, all of which are potentially vulnerable to security breaches and cyber-attacks or other security breaches, which may include intentional attacks or accidental losses, either of which may result in unauthorized access to, or corruption of, our hardware, software, or data processing systems, or to our confidential, personal, or other sensitive information. In addition, we and our employees may be the target of fraudulent emails or other targeted attempts to gain unauthorized access to confidential, personal, or other sensitive information. The result of any cyber-attack or other security incidents may include disrupted operations, misstated or unreliable financial data, fraudulent transfers or requests for transfers of money, liability for stolen assets or information (including personal information), fines or penalties, investigations, increased cybersecurity protection and insurance costs, litigation, or damage to our business relationships and reputation, in each case, causing our business and results of operations to suffer. The rapid evolution and increasing prevalence of artificial intelligence technologies may also increase our cybersecurity risks.
Although we are not currently aware of any cyber-attacks or other incidents that, individually or in the aggregate, have materially affected, or would reasonably be expected to materially affect, our operations or financial condition, there has been an increase in the frequency and sophistication of the cyber and security threats that we face, with attacks ranging from those common to businesses generally to more advanced and persistent attacks. Cyber-attacks and other security threats could originate from a wide variety of sources, including cyber criminals, nation state hackers, hacktivists and other outside or inside parties. We, or our third-party providers, may face a heightened risk of a security breach or disruption with respect to confidential, personal or other sensitive information resulting from an attack by foreign governments or cyber terrorists. We may be a target for attacks because, as an alternative asset management firm, we hold confidential and other sensitive information, including price sensitive information about existing and potential investments. WeFurther, we are dependent on third-party vendorsservice providers for hosting solutionshardware, software and technologiesdata processing systems that we do not control. We also rely on third-party service providers for certain aspects of our businesses, including for certain information systems, technology and administration of our funds and compliance matters. WeWhile we perform risk assessments on our third-party providers, but our reliance on them and their potential reliance on other third-partiesthird-party service providers removes certain cybersecurity functions from outside of our immediate control, and cyber-attacks on our third-party service providers could adversely affect us. Cyber attacksus, our business and our reputation. The costs related to cyber-attacks or other security threats could originate from a wide variety of sources,or disruptions may not be fully insured or indemnified by others, including cyber criminals, nation state hackers, hacktivists and other outside parties. by our third-party service providers.
As a result, we may face a heightened risk of a security breach or disruption with respect to sensitive information resulting from an attack by computer hackers, foreign governments or cyber terrorists.
The efficient operation of our business is dependentreliance on computer hardware and software systems, as well as data processing systems, and the secure processing, storage and transmission of information, which are vulnerable to security breaches and cyber incidents. A cyber incident is considered to be any adverse event that threatens the confidentiality, integrity or availability of our information resources. These incidents may be an intentional attack or an unintentional event and could
involve gaining unauthorized access to our information systems for purposes of misappropriating assets, stealing confidential information, corrupting data or causing operational disruption. In addition, we and our employees may be the target of fraudulent emails or other targeted attempts to gain unauthorized access to proprietary or sensitive information. The result of these incidents may include disrupted operations, misstated or unreliable financial data, fraudulent transfers or requests for transfers of money, liability for stolen assets or information, increased cybersecurity protection and insurance costs, litigation and damage to our business relationships, causing our business and results of operations to suffer. As our reliance on technology has increased, so have the risks posed to our informationsuch systems, both internalthose we control and those provided by our third-party service providers. WeCyber-attacks may originate from a wide variety of sources, and while we have implemented processes, procedures and internal controls designed to mitigate cybersecurity risks and cyber intrusionscyber-attacks, these measures do not guarantee that a cyber-attack will not occur or that our financial results, operations or confidential information, personal or other sensitive information will not be negatively impacted by such an incident, especially because the techniques of threat actors change frequently and are often not recognized until launched. We rely on securitiesindustry accepted security measures and technology to securely maintain confidential and proprietary information maintained on our information systems; however, these measures,systems, as well as our increased awarenesspolicies and procedures to protect against the unauthorized or unlawful disclosure of the natureconfidential, personal or other sensitive information. Although we take protective measures and extentendeavors to strengthen our computer systems, software, technology assets and networks to prevent and address potential cyber-attacks, there can be no assurance that any of a riskthese measures prove effective. We expect to
be required to devote increasing levels of funding and resources to comply with evolving cybersecurity and privacy laws and regulations and to continually monitor and enhance our financial results, operations or confidential information will not be negatively impacted by such an incident, especially because the cyber-incident techniques change frequently or are not recognized until launchedcybersecurity procedures and because cyber-incidents can originate from a wide variety of sources.controls.
TheseCybersecurity risks are exacerbated by the rapidly increasing volume of highly sensitive data, including our proprietary business information and intellectual property, and personally identifiablepersonal information of our employees, our investors and others and other sensitive information that we collect, process and store in our data centers and on our networks.networks or those of our third-party service providers. The secure processing, maintenance and transmission of this information are critical to our operations. A significant actual or potential theft, loss, corruption, exposure, fraudulent use or misuse of investor, employee or other personally identifiable orpersonal information, proprietary business data or other sensitive information, whether by third parties or as a result of employee malfeasance or otherwise, non-compliance with our contractual or other legal obligations regarding such data or intellectual property or a violation of our privacy and security policies with respect to such data could result in significant investigation, remediation and other costs, fines, penalties, litigation or regulatory actions against us and significant reputational harm.harm, any of which could harm our business and results of operations.
Our funds’ portfolio companies also rely on similar systems and face similar risks. A disruption or compromise of these systems could have a material adverse effect on the value of these businesses. Our funds may invest in strategic assets having a national or regional profile or in infrastructure assets, the nature of which could expose them to a greater risk of being subject to a terrorist attack or security breachcyber-attack than other assets or businesses. Such an event may have material adverse consequences on our investment or assets of the same type or may require applicable portfolio companies to increase preventative security measures or expand insurance coverage.
In addition, we operate in businesses that are highly dependent on information systems and technology. The costs related to cyber or other security threats or disruptions may not be fully insured or indemnified by other means. Cybersecurity has become a priority for regulators in the U.S. and around the world. In the latter half of 2021, the SEC brought three charges, sanctioning eight companies, all of which were registered as broker dealers, investment advisory firms or both, for deficient cybersecurity policies and procedures, and settled charges in two separate actions against public companies for deficient disclosure controls and procedures violations related to a cybersecurity vulnerability that exposed sensitive customer information. In 2023, the SEC charged a broker-dealer for allegedly making materially false and misleading statements and omissions regarding its efforts for preventing misuse of sensitive customer information. The SEC has also proposed new rules related to cybersecurity risk management for registered investment advisers, and registered investment companies and business development companies (funds), as well as amendments to certain rules that govern investment adviser and fund disclosures. In July 2023, the SEC also adopted rules requiring public companies to disclose material cybersecurity incidents on Form 8-K and periodic disclosure of a registrant’s cybersecurity risk management, strategy, and governance in annual reports. The rules became effective beginning with annual reports for fiscal years ending on or after December 15, 2023 and beginning with Form 8-Ks on December 18, 2023. With the SEC particularly focused on cybersecurity, we expect increased scrutiny of our policies and systems designed to manage our cybersecurity risks and our related disclosures. We also expect to face increased costs to comply with the new SEC rules, including increased costs for cybersecurity training and management. Many jurisdictions in which we operate have laws and regulations relating to data privacy, cybersecurity and protection of personal information, including, the California Consumer Privacy Act that went into effect on January 1, 2020, andCCPA, the New York SHIELD Act, which became effective on March 1, 2020.the GDPR and the U.K. GDPR. In addition, the SEC announcedhas indicated in recent periods that one of the 2019its examination priorities for the Office of Compliance Inspections and Examinations wasis to continue to examine cybersecurity procedures and controls, including testing the implementation of these procedures and controls. Further, the European General Data Protection Regulation (the “GDPR”) came into effect in May 2018. Data protection requirements under the GDPR are more stringent than those imposed under prior European legislation.
There aremay be substantial financial penalties or fines for breach of privacy laws (which may include insufficient security for our personal or other sensitive information). For example, the maximum penalty for breach of the GDPR including up tois the highergreater of 20 million Euros orand 4% of group annual worldwide turnover. The U.K. has adopted GDPRturnover, and similar requirements therefore continue to apply infines for each violation of the U.K. notwithstanding Brexit (“UK GDPR”). However, as a result of Brexit, the U.K. is now a third countryCCPA are $2,500, or $7,500 per violation for the purposes of GDPR as it applies in the EU (“EU GDPR”). The TCA provides for a transitional period during which transfers of personal data from the EU to the U.K. will not be considered as transfers to a third country under EU GDPR. If this transitional period ends without the European Commission adopting an adequacy decision in relation to the U.K., transfers of personal data from the EU to the U.K. will be subject to additional requirements under the EU GDPR rules on exporting data outside the EU. Transfers of personal data from the U.K. to the EU will continue to be permitted under UK GDPR without the need for compliance with such additional data export requirements.intentional violations. Non-compliance with any of theseapplicable privacy or data security laws as well as others, represents a serious risk to our business. Some jurisdictions have also enacted laws requiring companies to notify individuals of data security breaches involving certain types of personal data.information. Breaches in security could potentially jeopardize our, our employees’ or our fund investors’ or counterparties’ confidential andor other information processed and stored in, andor transmitted through, our computer systems and networks (or those of our third-party service providers), or otherwise cause interruptions or malfunctions in our, our employees’, our fund investors’, our counterparties’ or third parties’ operations, which could result in significant losses, increased costs, disruption of our business, liability to our fund investors and other counterparties, fines or penalties, litigation, regulatory intervention or reputational damage. Furthermore, if we fail to comply with the relevant laws and regulations, it could result in regulatory investigations and penalties,damage, which could also lead to negative publicity and may cause our fundloss of investors and clients to lose confidence in the effectiveness of our security measures.
Although we are not currently aware of any cyber attacks or other incidents that, individually or in the aggregate, have materially affected, or would reasonably be expected to materially affect, our operations or financial condition, there can be no
assurance that the various procedures and controls we utilize to mitigate these threats will be sufficient to prevent disruptions to our systems, especially because the cyberattack techniques used change frequently and are not recognized until launched, the full scope of a cyberattack may not be realized until an investigation has been performed and cyber attacks can originate from a wide variety of sources. We rely on industry accepted security measures and technology to securely maintain confidential and proprietary information maintained on our information systems. Although we take protective measures and endeavors to strengthen our computer systems, software, technology assets and networks to prevent and address potential cyber attacks, there can be no assurance that any of these measures prove effective. We expect to be required to devote increasing levels of funding and resources to comply with evolving cybersecurity regulations and to continually monitor and enhance our cybersecurity procedures and controls.clients.
We may be subject to litigation risks and may face liabilities and damage to our professional reputation as a result.reputation.
In recent years, the volume of claims and amount of damages claimed in litigation and regulatory proceedings against investment managers have been increasing. We make investment decisions on behalf of investors in our funds that could result in substantial losses. This may subject us to the risk of legal liabilities or actions alleging negligent misconduct, breach of fiduciary duty or breach of contract. Further, we may be subject to third-party litigation arising from allegations that we improperly exercised
control or influence over portfolio investments. In addition, we and our affiliates that are the investment managers and general partners of our funds, our funds themselves and those of our employees who are our, our subsidiaries’ or the funds’ officers and directors are each exposed to the risks of litigation specific to the funds’ investment activities and portfolio companies and, in the case where our funds own controlling interests in public companies, to the risk of shareholder litigation by the public companies’ other shareholders. Moreover, we are exposed to risks of litigation or investigation by investors or regulators relating to our having engaged, or our funds having engaged, in transactions that presented conflicts of interest that were not properly addressed.
We and our funds and their investment advisers are more generally subject to extensive regulation, which, from time to time, results in requests for information from us or our funds and their investment advisers or regulatory proceedings or investigations against us or our funds and their investment advisers, respectively. We may incur significant costs and expenses in connection with any such information requests, proceedings or investigations. Such investigations have previously and may in the future result in penalties and other sanctions. Regulatory actions and initiatives, including by the SEC, can have an adverse effect on our financial results, including as a result of the imposition of a sanction, a limitation on our or our personnel’s activities, or changing our historic practices. Even if an investigation or proceeding did not result in a sanction, or the sanction imposed against us or our personnel by a regulator were small in monetary amount, the adverse publicity relating to the investigation, proceeding or imposition of these sanctions could harm our reputation.
Legal liability could have a material adverse effect on our businesses, financial condition or results of operations or cause reputational harm to us, which could harm our businesses. We depend, to a large extent, on our business relationships and our reputation for integrity and high-caliber professional servicesservice offerings to attract and retain investors and to pursue investment opportunities for our funds. As a result, allegations of improper conduct asserted by private litigants or regulators, regardless of whether the ultimate outcome is favorable or unfavorable to us, as well as negative publicity and press speculation about us, our investment activities or the investment industry in general, whether valid or not, valid, may harm our reputation, which may be damaging to our businesses.
In addition, the laws and regulations governing the limited liability of such issuers and portfolio companies vary from jurisdiction to jurisdiction, and in certain contexts, the laws of certain jurisdictions may provide not only for carve-outs from limited liability protection for the issuer or portfolio company that has incurred the liabilities, but also for recourse to assets of other entities under common control with, or that are part of the same economic group as such issuer. For example, if one of our portfolio companies is subject to bankruptcy or insolvency proceedings in a jurisdiction and is found to have liabilities under the local consumer protection, labor, tax or bankruptcy laws, the laws of that jurisdiction
We may permit authorities or creditors to file a lien on, or to otherwise have recourse to, assets held by other portfolio companies (including assets held by us) in that jurisdiction. There can be no assurance that we will not be adversely affected as a result of the foregoingable to maintain sufficient insurance to cover us for potential litigation or other risks.
In addition, weWe may not be able to obtain or maintain sufficient insurance on commercially reasonable terms or with adequate coverage levels against potential liabilities we may face in connection with potential claims, which could have a material adverse effect on our business. We may face a risk of loss from a variety of claims, including related to securities, antitrust, contracts, cybersecurity, fraud and various other potential claims, whether or not such claims are valid. Insurance and other safeguards might only partially reimburse us for our losses, if at all, and if a claim is successful and exceeds or is not covered by our insurance policies, we may be required to pay a substantial amount in respect of such successful claim. Certain losses of a catastrophic nature, such as losses arising as a result of wars, earthquakes, typhoons, terrorist attacks or other similar events, may be uninsurable or may only be insurable at rates that are so high that maintaining coverage would cause an adverse impact on our business, our investment funds and their portfolio companies. In general, losses related to terrorism are becoming harder and more expensive to insure against. Some insurers are excluding terrorism coverage from their all-risk policies. In some cases, insurers are offering significantly limited coverage against terrorist acts for additional premiums, which can greatly increase the total cost of casualty insurance for a property. As a result, we, our investment funds and their portfolio companies may not be insured against terrorism or certain other catastrophic losses.
Events which harm our reputation or brand may impact our ability to attract and retain investors and raise new capital.
As fiduciaries and stewards of our client’s capital, we value and depend on the trust they place in us. Reputation is a significant factor that increases our competitive risk. See “—Risks Related to Our Businesses—The investment management business is intensely competitive.” Increased regulatory scrutiny, actions or fines, litigation, employee misconduct, failures or perceived failures to appropriately mitigate and manage ESG incidents, conflicts of interest, data breaches and management of tax disputes, could among other events, harm our reputation and thus our ability to attract and retain investors and raise new capital for our funds, adversely affecting our business. While we have a robust compliance program in place and have successfully instituted a culture of compliance through our policies and procedures aimed to mitigate potential risks and enhanced regulatory action, we may be subject to new and heighted enforcement activity resulting in public sanctions or fines which could adversely impact our reputation. See “—Risks Related to Regulation.” Similarly, to the extent we experience material litigation, employee turnover or employee misconduct, our businesses and our reputation could be adversely affected, and a loss of investor confidence could result, which could adversely impact our ability to raise future funds. Our ability to
appropriately mitigate, manage and address conflicts of interests among our stakeholders could also result in increased reputational risk. Further, the impact of events which may harm our reputation and brand are heightened given media and public focus on the externalities of activities unrelated to our business, the pervasiveness of social media and public interest in the financial services and alternative investment management industry generally. The increasing prevalence of artificial intelligence may lead to faster and wider dissemination of any adverse publicity or inaccurate information about us, making effective remediation more difficult and further magnifying the reputational risks associated with negative publicity.
Item 1B. Unresolved Staff Comments
None.
Item 1C. Cybersecurity
Assessment, Identification and Management of Material Risks from Cybersecurity
Our cybersecurity strategy prioritizes the detection and analysis of, and response to, known, anticipated or unexpected threats, effective management of security risks and resilience against cyber incidents. Our enterprise-wide cybersecurity program is aligned to the National Institute of Standards and Technology Cybersecurity Framework. Our cybersecurity risk management processes include technical security controls, policy enforcement mechanisms, monitoring systems, tools and related services, which include tools and services from third-party providers, and management oversight to assess, identify and manage risks from cybersecurity threats. We have implemented and continue to implement risk-based controls designed to prevent, detect and respond to information security threats and protect our information, our information systems, and the information of our investors, employees and other third parties who entrust us with their sensitive information.
Our cybersecurity program includes physical, administrative and technical safeguards, and we maintain plans and procedures designed to help us prevent and timely and effectively respond to cybersecurity threats and incidents. Through our cybersecurity risk management process, we seek to monitor cybersecurity vulnerabilities and potential attack vectors, evaluate the potential operational and financial effects of any threat and mitigate such threats. The assessment of cybersecurity risks is integrated into our Enterprise Risk Management program, which is overseen by our Enterprise Risk Committee (the “ERC”), as discussed below. In addition, we periodically engage third-party consultants and engage with key vendors to assist us in assessing, enhancing, implementing, and monitoring our cybersecurity risk management programs and responding to incidents.
Our cybersecurity risk management and awareness programs include periodic identification and testing of vulnerabilities, regular phishing simulations and annual general cybersecurity awareness and data protection training. We also have annual certification requirements for employees with respect to certain policies supporting the cybersecurity program including information security and electronic communications, data protection and privacy. We undertake periodic internal security reviews of our information systems and related controls, including systems affecting personal data and the cybersecurity risks of our critical third-party service providers and other partners. We also complete periodic external reviews of our cybersecurity program and practices, which include assessments of our data protection practices and targeted attack simulations.
In the event of a cybersecurity incident, we have developed an incident response plan that provides guidelines for responding to an incident and facilitates coordination across multiple operational functions.The incident response plan includes notification to the applicable members of cybersecurity leadership, including the Chief Information Security Officer (“CISO”), and, as appropriate, escalation to the full ERC and/or an internal ad-hoc group of senior employees, tasked with helping to manage the cybersecurity incident. Depending on their nature, incidents may also be reported to our audit committee of the board of directors and to our full board of directors, if appropriate.
Material Impact of Cybersecurity Risks
In the last three fiscal years, we have not experienced a material information security breach incident and the expenses we have incurred from information security breach incidents have been immaterial, and we are not aware of any cybersecurity risks that are reasonably likely to materially affect our business. However, future incidents could have a material impact on our business strategy, results of operations, or financial condition. For additional discussion of the risks posed by cybersecurity threats, see “Item 1A. Risk Factors—General Risk Factors—Cybersecurity failures and data security incidents could adversely affect our business by causing a disruption to our operations, a compromise or corruption of our confidential, personal or other sensitive information and/or damage to our business relationships or reputation, any of which could negatively impact our business, financial condition and operating results.”
Oversight of Cybersecurity Risks
Our cybersecurity program is managed by a dedicated internal cybersecurity team, which is responsible for enterprise-wide cybersecurity strategy, policies, standards, engineering, architecture and processes. The team is led by our CISO who has a Master’s degree in Cybersecurity from Brown University and over 25 years of experience advising on, and managing risks from cybersecurity threats as well as developing and implementing cybersecurity policies and procedures. The CISO is also a member of the ERC. The ERC is a cross-functional committee that governs and oversees our Enterprise Risk Program, including cybersecurity. The ERC includes our Chief Executive Officer, Chief Financial Officer, General Counsel, Global Chief Compliance Officer, Chief Information Officer, CISO, and Head of Enterprise Risk, who acts as chairperson of the ERC. The ERC, through regular consultation with the internal cybersecurity team, assesses, discusses, and prioritizes our approach to high-level risks, mitigating controls, and ongoing cybersecurity efforts.
The audit committee has primary responsibility for oversight and review of guidelines and policies with respect to risk assessment and risk management, including cybersecurity. Certain members of the ERC periodically report to our audit committee as well as the full board of directors, as appropriate, on cybersecurity matters, primarily through presentations by the CISO and the Head of Enterprise Risk. Such reporting includes updates on our cybersecurity program, the external threat environment, and our programs to address and mitigate the risks associated with the evolving cybersecurity threat environment. These reports also include updates on our preparedness, prevention, detection, responsiveness, and recovery with respect to cyber incidents.
Item 2. Properties
Our principal executive offices are located in leased office space at 2000 Avenue of the Stars, 12th Floor, Los Angeles, California. We also lease office space in Culver City, New York, London and other cities around the world. We do not own any real property. We consider these facilities to be suitable and adequate for the management and operation of our businesses.
Item 3. Legal Proceedings
From time to time, we, our executive officers, directors and our funds and their investment advisers, and their respective affiliates and/or any of their respective principals and employees are involved in varioussubject to legal proceedings lawsuitsin the ordinary course of business, including those arising from our management of such funds, and claims incidentalmay, as a result, incur significant costs and expenses in connection with such legal proceedings. Legal proceedings may increase to the conduct of our business, some ofextent we find it necessary to foreclose or otherwise enforce remedies with respect to loans that are in default, which borrowers may be material.seek to resist by asserting counterclaims and defenses against us. As of December 31, 2020 and 2019,2023, we were not subject to any material pending legal proceedings. Our businesses
We and our funds and their investment advisers are also subject to extensive regulation, which, may resultfrom time to time, results in requests for information from us or our funds and their investment advisers or regulatory proceedings or investigations against us.us or our funds and their investment advisers, respectively. We may incur significant costs and expenses in connection with any such information requests, proceedings or investigations.
Item 4. Mine Safety Disclosures
Not applicable.
PART II.
Item 5. Market Forfor Registrant’s Common Equity, Related Stockholder Matters Andand Issuer Purchases Ofof Equity Securities
Market Information
Our Class A common stock is traded on the NYSE under the symbol “ARES".“ARES.” Our common shares began trading on the NYSE on May 2, 2014. We completed our Conversion from a Delaware limited partnership to a Delaware corporation effective on November 26, 2018. Our Class A common stock continued to trade on the NYSE under our existing symbol following the Conversion.
The number of holders of record of our Class A common stock as of February 18, 202120, 2024 was 15,19, which does not include the number of shareholders that hold shares in “street name” through banks or broker-dealers. Ares Management GP LLC is the sole holder of shares of our Class B Common Stockcommon stock and Ares Voting LLC is the sole holder of shares of our Class C Common Stock.common stock.
Stock Performance Graph
The following graph depicts the total return to holders of our Class A common stock from the closing price on December 31, 20152018 through December 31, 2020,2023, relative to the performance of the S&P 500 Index and the Dow Jones U.S. Asset Managers Index. The graph assumes $100 invested on December 31, 20152018 and dividends received reinvested in the security or index.
The performance graph is not intended to be indicative of future performance. The performance graph shall not be deemed “soliciting material” or to be “filed” with the SEC for purposes of Section 18 of the Exchange Act, or otherwise subject to the liabilities under that Section, and shall not be deemed to be incorporated by reference into any of the Company’s filings under the Securities Act or the Exchange Act.
Total Return Performance Table
Total Return Performance Table
Issuer Purchases of Equity Securities
The table below presents purchases made by or on behalf of Ares Management Corporation or any “affiliated purchaser” (as defined in Rule 10b-18(a)(3) under the Exchange Act) of shares of our Class A Common Stock during each of the indicated periods ($ in thousands; except share data):
| | | | | | | | | | | | | | |
Period | Total Number of Shares Purchased | Average Price Paid Per Share | Total Number of Shares Purchased as Part of Publicly Announced Plans or Programs | Approximate Dollar Value of Shares That May Yet be Purchased Under the Plans or Programs (1)
|
October 1, 2020 - October 31, 2020 | — | $ | — | | — | $ | 150,000 | |
November 1, 2020 - November 30, 2020 | — | — | | — | 150,000 | |
December 1, 2020 - December 31, 2020 | — | — | | — | 150,000 | |
Total | — | | — | |
(1)In February 2020, our board of directors approved the renewal of our stock repurchase program that authorizes the repurchase of up to $150 million of shares of our Class A common stock. Under this stock repurchase program, shares may be repurchased from time to time in open market purchases, privately negotiated transactions or otherwise, including in reliance on Rule 10b5-1 of the Securities Act. In February 2021, our board of directors approved the renewal of the program and it is scheduled to expire in February 2022. Repurchases under the program depend on the prevailing market conditions and other factors.
Dividend Policy for the Series A Preferred Stock
As of December 31, 2020 and 2019, the Company had 12,400,000 shares of Series A Preferred Stock outstanding. When, as and if declared by the Company’s board of directors, dividends on the Series A Preferred Stock are paid quarterly at a rate per annum equal to 7.00%. During 2020 and 2019, we paid quarterly dividends totaling approximately $21.7 million in each year to holders of record of shares of the Series A Preferred Stockholders, and in February 2021, the Company's board of directors declared a quarterly dividend of $5.4 million payable on March 31, 2021 to holders of record of shares of the Series A Preferred Stock at the close of business on March 15, 2021.
Dividend Policy for Class A and Non-Voting Common Stock
During 2019,2022, we declared a dividend each quarter of $0.32$0.61 (totaling $1.28$2.44 annually) per share to Class A common stockholders and non-voting common stockholders, or approximately $138.6429.1 million. During 2020,2023, we declared a dividend each quarter of $0.40$0.77 (totaling $1.60$3.08 annually) per share to Class A and non-voting common stockholders at the close of business on March 17, 2020,2023, June 16, 2020,2023, September 16, 2020,15, 2023, and December 17, 2020,15, 2023, respectively, or approximately $217.7$571.9 million.
In February 20212024, the Company'sCompany’s board of directors declared a quarterly dividend of $0.47$0.93 per share of Class A and non-voting common stockor approximately $70.3 million, with respect to the first quarter of 20212024 payable on March 31, 202129, 2024 to common stockholders of record at the close of business on March 17, 2021.15, 2024.
Our dividend policy for our Class A and non-voting common stock is more closely aligned with our core management fee business. We intend to provide a steadyfixed quarterly dividend for each calendar year that will be based on our expected after-tax fee related earnings after an allocation of current taxes paid, with future potential changes based on the level and growth of our after-tax fee related earnings.the metric. Subject to the approval of our board of directors, we intend to pay a dividend of $0.47$0.93 per share of our Class A and non-voting common stock per quarter in 2021.2024.
Our fixed dividend will be reassessed each year based upon the level and growth of our after-tax fee related earnings. earnings after an allocation of current taxes paid. As fee related earnings reflect the core earnings of our business and consistsconsist of management feesfee and fee related performance revenues less compensation and general and administrative expenses, having our recurring dividend based on this amount removes volatility from our dividend and enablesprovides more predictability to investors to receive what we believe ison an attractive after-tax, qualifying dividend yield.annual basis
Our dividend policy reflects our intention to retain net performance income.income, which excludes our fee related performance revenues. We expect to use such retained earnings for potential stock repurchases and to fund future growth with the objective of accelerating our fee related earnings growth per share.share, as well as for potential stock repurchases. However, the declaration, payment and determination of the amount of future dividends, if any, is at the sole discretion of our board of directors, which may change our dividend policy at any time.
The payment of cash dividends on shares of our Class A common stock is subject to compliance with DGCL. In addition, under the Credit Facility, certain subsidiaries of the Ares Operating Group are prohibited from paying dividends in certain circumstances, including if an Event of Default (as defined in the Credit Facility) has occurred and is continuing.
Because Ares Management CorporationAMC is a holding company and has no material assets other than its indirect ownership of Ares Operating GroupAOG Units, we fund dividends by Ares Management CorporationAMC on shares of our Class A and non-voting common stock, if any, in three steps:
•first, we cause the Ares Operating GroupAOG entities to make distributions to their partners, including Ares Management CorporationAMC and its direct subsidiaries. If the Ares Operating GroupAOG entities make such distributions, the partners of the Ares Operating GroupAOG entities will be entitled to receive equivalent distributions based on their partnership units in the Ares Operating Group (except as set forth in the following paragraph);
•second, we cause Ares Management Corporation’sAMC’s direct subsidiaries to distribute to Ares Management CorporationAMC their share of such distributions, net of any taxes and amounts payable under the tax receivable agreement by such direct subsidiaries; and
•third, Ares Management CorporationAMC pays such distributions to our holders of our Class A and non-voting common stock, net of any taxes and amounts payable under the tax receivable agreement, on a pro rata basis.
Because we and our direct subsidiaries that are corporations for U.S. federal income tax purposes may be required to pay corporate income and franchise taxes and make payments under the tax receivable agreement, the dividend amounts ultimately paid by us to holders of our Class A and non-voting common stock are expected to be generally less, on a per share basis, than the amounts distributed by the Ares Operating GroupAOG entities to their respective partners in respect of their Ares Operating GroupAOG Units.
In addition, governing agreements of the Ares Operating GroupAOG entities provide for cash distributions, which we refer to as “tax distributions,” to the partners of such entities if the general partners of the Ares Operating GroupAOG entities determine that the taxable income of the relevant Ares Operating Group entityAOG entities gives rise to taxable income for its partners. Generally, these tax distributions are computed based on our
estimate of the net taxable income of the relevant entity multiplied by an assumed tax rate equal to the highest effective marginal combined U.S. federal, state and local income tax rate prescribed for an
individual or corporate resident in Los Angeles, California or New York, New York, whichever is higher (taking into account the non-deductibility of certain expenses and the character of our income). The Ares Operating Group makes tax distributions only if and to the extent distributions from such entities for the relevant year were otherwise insufficient to cover such tax liabilities.
In addition, the cash flow from operations of the Ares Operating Group entities may be insufficient to enable them to make required minimum tax distributions to their partners, in which case the Ares Operating Group may have to borrow funds or sell assets, which could have a material adverse effect on our liquidity and financial condition. Furthermore, by paying cash dividends rather than investing that cash in our businesses, we might risk slowing the pace of our growth, or not having a sufficient amount of cash to fund our operations, new investments or unanticipated capital expenditures, should the need arise.
Although a portion of any dividends paid by us to holders of our Class A common stock may include carried interest received by us, we do not intend to seek fulfillment of any contingent repayment obligation by seeking to have holders of our Class A common stock return any portion of such dividends attributable to carried interest associated with any contingent repayment obligation.
We expect any dividends paid out of current or accumulated earnings and profits to U.S. individuals and certain other qualifying holders of our Class A and non-voting common stock to constitute “qualified dividend” income that is generally taxed at a more favorable tax rate than the ordinary income tax rate, if the requisite holding periods have been met. If the dividend exceeds current and accumulated earnings and profits, the excess is treated as a nontaxable return of capital, reducing the stockholder’s tax basis in its shares to the extent of such shareholder’s tax basis in such shares. Any remaining excess is treated as capital gain. Because U.S. corporations are taxed on their own taxable income, and because owners of such entities are taxed on any dividends paid from such entities, there are two levels of potential tax upon income earned by such entities.
Unregistered Sales of Equity Securities and Purchases of Equity Securities
None.
Item 6. Selected Financial Data[Reserved]
Consolidated financial data of the Company as of December 31, 2020 and 2019 and for the years ended December 31, 2020, 2019, and 2018 can be derived from the audited consolidated financial statements included in this Annual Report on Form 10-K. Consolidated financial data of the Company as of December 31, 2018, 2017 and 2016 and for the years ended December 31, 2017 and 2016 can be derived from Part II, “Item 6. Selected Financial Data” in our Annual Report on Form 10-K for the year ended December 31, 2019. Management believes that no material trends have been omitted by removing the tabular disclosure.
Item 7. Management’s Discussion and Analysis ofof Financial Condition and Results of Operations
Ares Management CorporationAMC is a Delaware corporation. Unless the context otherwise requires, references to “Ares,” “we,” “us,” “our,” and the “Company” are intended to mean the business and operations of Ares Management CorporationAMC and its consolidated subsidiaries. The following discussion analyzes the financial condition and results of operations of the Company. “Consolidated Funds” refers collectively to certain Ares funds, co-investment entitiesvehicles, CLOs and CLOsSPACs that are required under generally accepted accounting principles in the United States (“GAAP”) to be consolidated inwithin our consolidated financial statements included in this Annual Report on Form 10-K. Additional terms used by the Company are defined in the Glossary and throughout the Management'sManagement’s Discussion and Analysis in this Annual Report on Form 10-K.
The following discussion and analysis should be read in conjunction with the audited consolidated financial statements of Ares Management CorporationAMC and the related notes included in this Annual Report on Form 10-K.
This section of the Annual Report on Form 10-K discusses activity as of and for the years ended December 31, 20202023 and 2019.2022. For discussion on activity for the year ended December 31, 20182021 and period-over-period analysis on results for the year ended December 31, 20192022 to 2018,2021, refer to Part II, “Item 7. Management'sManagement’s Discussion and Analysis of Financial Condition and Results of Operations"Operations” in our Annual Report on Form 10-K for the year ended December 31, 2019.2022. Amounts and percentages presented throughout our discussion and analysis of financial condition and results of operations may reflect rounded results in thousands (unless otherwise indicated) and consequently, totals may not appear to sum. In addition, illustrative charts may not be presented at scale.
“NM” refers to not meaningful. Period-over-period analysis for current year compared to prior year may be deemed to be not meaningful and are designated as “NM” within the discussion and analysis of financial condition and results of operations.
Trends Affecting Our Business
We believe that our disciplined investment philosophy across our distinct but complementary investment groups contributes to the stability of our performance throughout market cycles. As ofFor the year ended December 31, 2020,2023, approximately 67% of our AUM were in funds with a remaining contractual life of three years or more, approximately 74% of our AUM were in funds with an initial duration greater than seven years at time of closing and 90%95% of our management fees were derived from permanentperpetual capital vehicles CLOs and closed endlong-dated funds. Our funds have a stable base of committed capital enabling us to invest in assets with a long-term focus over different points in a market cycle and to take advantage of market volatility. However, our results offrom operations, including the fair value of our AUM, are affected by a variety of factors, particularly in the United States and Western Europe, including conditions in the global financial markets and the economic and political environments.
Global capital markets performance was dominated by the onset of the COVID-19 pandemic and the associated uncertainty and significant market declines in the first half of 2020. The markets experienced a rebound in the second half of 2020, primarily driven by additional fiscal stimulus, accommodative global monetary policy and positive vaccine developments to combat COVID-19.Investor concerns over rising infection rates and newly implemented lockdown measures subsided relative to optimism in connection with the announced approval and initial distribution of vaccines in the U.S. and more broadly. In the U.S., corporate credit spreads narrowed into year-end and lower quality paper, along with more cyclical segments, drove returns for the quarter. Specifically, the Credit Suisse Leveraged Loan Index (“CSLLI”), a leveraged loan index, returned 2.8% for 2020 compared to a return of 8.2% for the prior year. The ICE BAML High Yield Master II Index, a high yield bond index, returned 6.2% for 2020 compared to a return of 14.4% for the prior year.
European credit markets experienced similar results, as European high yield and leveraged loan markets recovered alongside the global capital markets primarily driven by positive vaccine developments. Continued investor confidence in a Brexit trade deal ahead of a formal agreement at year-end, coupled with the European Central Bank’s plan to increase the size and extend the time horizon of their asset purchasing programs contributed to positive returns. The Credit Suisse Western European Leveraged Loan Index returned 2.4% for 2020 compared to a return of 5.0% for the prior year. The ICE BAML European Currency High Yield Index returned 2.9% for 2020 compared to a return of 11.4% for the prior year.
The equity market experienced similar performance, rebounding in the second half of the year. In the U.S., the S&P 500 returned 18.4% for 2020 compared to a return of 31.5% for the prior year. Outside the U.S., the MSCI All Country World ex USA Index returned 10.7% for 2020 compared to a return of 21.5% for the prior year.
Despite the ongoing pandemic and uncertainty surrounding the timing of recovery, private equity transaction volume rose during the fourth quarter. We continue to believe careful target selection, a focus on high-quality assets and a differentiated view to drive value creation are keys to our funds’ performance in the current market environment.
Re-introductionvariety of social distancing measuresfactors. Conditions in the global financial markets and economic and political environments may impact our business, particularly in the U.S., Western Europe and Asia.
The following table presents returns of selected market indices:
| | | | | | | | | | | | | | | | | | | | | | | | | | | | |
| | | | | | | | Returns (%) |
| Type of Index | | Name of Index | | Region | | | | Year ended December 31, 2023 | | Year ended December 31, 2022 |
| High yield bonds | | ICE BAML High Yield Master II Index | | U.S. | | | | 13.5 | | (11.2) |
| High yield bonds | | ICE BAML European Currency High Yield Index | | Europe | | | | 12.2 | | (11.5) |
| | | | | | | | | | |
| Leveraged loans | | Credit Suisse Leveraged Loan Index (“CSLLI”) | | U.S. | | | | 13.0 | | (1.1) |
| Leveraged loans | | Credit Suisse Western European Leveraged Loan Index | | Europe | | | | 12.5 | | (3.3) |
| Equities | | S&P 500 Index | | U.S. | | | | 26.3 | | (18.1) |
| Equities | | MSCI All Country World Ex-U.S. Index | | Non-U.S. | | | | 15.6 | | (16.0) |
| Real estate equities | | FTSE NAREIT All Equity REITs Index | | U.S. | | | | 11.4 | | (24.9) |
| Real estate equities | | FTSE EPRA/NAREIT Developed Europe Index | | Europe | | | | 17.4 | | (36.5) |
During 2023, global markets endured heightened volatility but finished the year positively with improving investor sentiment amid the possibility of monetary easing in 2024. Despite the macroeconomic headwinds and escalated conflicts in the Middle East and Ukraine, U.S. contributedand European high yield bonds and leveraged loans returned positive performance. The Asian markets experienced mixed performance as the region overall continued to real estate fundamentals remaining depressed.show growth primarily driven by resilient demand in Southeast Asia and India. India, in particular, demonstrated healthy economic growth driven by its manufacturing and services sectors. On the other hand, China’s weaker than expected economic recovery led Chinese policymakers to continue taking measures to support economic growth. Overall, reduced lending activity by banks and limited capital accessibility continued to fuel private credit growth.
Global equity markets similarly rallied during the fourth quarter to finish the year on a positive note. While the public markets ended the year positively, the private markets continued to experience challenges with downward pressure on valuations and muted the opportunities for realizations. The impactprivate equity markets also experienced a prolonged slowdown in deal activity, and we believe potential liquidity constraints from investors have increased the need for flexible capital solutions. In addition, businesses have struggled to navigate this challenging growth and inflationary environment, which we believe has heightened the need for partnerships with value-add managers. This environment underscores the importance of investing in resilient industries with long-term secular tailwinds where we have expertise. Our focus continues to be on investment opportunities in the pandemic uponhealthcare and services sectors, with limited exposure to energy, and we continue to invest opportunistically in consumer and industrials. Asset selectivity, deliberate portfolio construction, a flexible investment mandate and a differentiated view to drive value creation through earnings growth will be instrumental in delivering attractive returns to investors.
The commercial real estate has varied significantlymarkets continued to be impacted by property sectorthe macroeconomic environment throughout 2023. European and geography. Incidences of asset-level distress are elevated, especially for retail and hospitality properties, which have borne much of the impact from COVID-19 restrictions. With many countries beginning vaccination programs, the overall trajectory of economies andU.S. real estate markets is positive.deal activity remained subdued with limited transactional liquidity. Given the higher interest rate environment, property valuations remain soft, with capitalization rate yields widening further over the year. However, we believe certain of these market trends will be offset by continued strong fundamentals, such as occupancy and rental rates, in property types that include multifamily and industrial.
EuropeanThe current market environment has had a more pronounced negative impact on certain industries, including energy, which is an industry in which few of our funds have made investments. As of December 31, 2023, 1% of our total AUM was invested in debt and U.S. publicly-traded real estate investment trusts (“REITs”) rose overequity investments in the fourth quarter, boosted by news surrounding the vaccine. In the U.S., the FTSE NAREIT All Equity REITs Index returned a negative 8.4% for 2020 compared to a returnenergy sector (of which less than 1% of 24.0% for the prior year. In Europe, the FTSE EPRA/NAREIT Developed Europe Index returned a negative 13.1% for 2020 compared to a returnour total AUM was invested in midstream investments and also includes oil and gas exploration) and less than 1% of 24.7% for the prior year.our total AUM was invested in renewable energy investments.
We believe our portfolios across all strategies are well positioned for a fluctuating interest rate environment. On a market value basis, approximately 85% of our debt assets and 57% of our total assets were floating rate instruments as of December 31, 2023.
In 2020,2023, some of the considerations pertaining to our strategic decisions included:
• Our ability to fundraise and increase AUM and fee paying AUM. During the year ended December 31, 2020,2023, we raised $41.2$74.5 billion of gross AUM, both innew capital across our commingled funds, SMAs and SMAs,other vehicles, and continued to expand our investor base, raising capital from over 85125 different investment vehicles and 358over 625 institutional investors, including 155
approximately 300 direct institutional investors that were new to Ares. Our fundraising efforts helped drive AUM growth of approximately 32%19% for 2020.2023. During 2021,2024, we expect that our fundraising will come from a combination of our existing and new strategies in the U.S., Europe and Europe.APAC. As of December 31, 2020, we also had $40.0 billion of2023, AUM not yet paying fees which represents approximately $428.3 million in annual potential management fee revenue. Of the $428.3 million, $400.9 million relates to $37.1includes $62.9 billion of AUM available for future deployment.deployment which could generate approximately $621.6 million in potential incremental annual management fees. Our pipeline of potential fees,future deployment, coupled with our future fundraising opportunities,prospects, gives us the potentialopportunity to increase our management fees in 2021.2024.
• Our ability to attract new capital and investors with our broad multi assetmulti-asset class product offering. Our ability to attract new capital and investors in our funds is driven, in part, by the extent to which they continue to see the alternative asset management industry generally, and our investment products specifically, as an attractive vehicle for capital appreciation and income generation. We continually seek to create avenues to meet our investors’ evolving needs by offering an expansive range of investment funds, developing new products and creating managed accounts and other investment vehicles tailored to our investors’ goals. We continue to expand our distribution channels, seeking to meetexpanding into the needs of insurance companies,retail channel through our global wealth management offerings, as well as the needs of traditional institutional investors, such as pension funds, sovereign wealth funds, and endowments. If market volatility persists or increases, investors may seek absolute return strategies that seek to mitigate volatility. We offer a variety of investment strategies depending upon investors’ risk tolerance and expected returns.
• Our disciplined investment approach and successful deployment of capital. Our ability to maintain and grow our revenue base is dependent upon our ability to successfully deploy the capital that our investors have committed to our investment funds. Greater competition, high valuations, cost of credit and other general market conditions have affected and may continue to affect our ability to identify and execute attractive investments. Under our disciplined investment approach, we deploy capital only when we have sourced a suitable investment opportunity at an attractive price. During the year ended December 31, 2020,2023, we deployed $26.7$68.1 billion of gross capital across our investment groups compared to $27.4$79.8 billion deployed in 2019.2022. We believe we continue to be well-positioned to invest our assets opportunistically. As of December 31, 2020,2023, we had $56.3$111.4 billion of capital available for investment and we remain well-positioned to invest our assets opportunistically, compared to $34.6$84.6 billion as of December 31, 2019.2022.
• Our ability to invest capital and generate returns through market cycles. The strength of our investment performance affects investors’ willingness to commit capital to our funds. The flexibility of the capital we are able to attract is one of the main drivers of the growth of our AUM and the management fees we earn. Current market conditions and a changing regulatory environment have created opportunities for Ares’ businesses, particularly in the Credit Group’s direct lending funds, and in the Private Equity's special opportunities funds, which utilize flexible investment mandates to manage portfolios through market cycles.
• Our ability to continue to achieve stable dividend payments to investors. Our dividend policy for our Class A common stock is closely aligned with our core management fee business. We intend to provide a steady quarterly dividend for each calendar year that will be pegged to our after-tax fee related earnings, with future potential changes based on the level and growth of our after-tax fee related earnings. Our fixed dividend is reassessed each year based upon our expected level and growth of after-tax fee related earnings. As fee related earnings reflect the core earnings of our business and consists of management fees less compensation and general and administrative expenses, having our recurring dividend pegged to this amount removes volatility from our dividend and enables investors to receive what we believe is an attractive after-tax, qualifying dividend yield.
See “Item 1A. Risk Factors” included in this Annual Report on Form 10-K for a discussion of the risks to which our businesses are subject.subject to.
106
Recent Transactions
On December 18, 2020, a subsidiary of Ares completed an acquisition of all outstanding common shares of F&G Reinsurance Ltd (“F&G Re”), a reinsurance company. F&G Re was renamed as Aspida Life Re Ltd and its AUM and financial results are presented within Strategic Initiatives.
On February 4, 2021, Ares Acquisition Corporation (NYSE: AAC), Ares’ first sponsored SPAC, consummated its initial public offering. The initial public offering generated gross proceeds of $1.0 billion, which includes the partial exercise of the underwriters’ option to purchase additional shares at the initial public offering price to cover over-allotments.
On February 17, 2021, Ares adopted resolutions authorizing a Second Amended and Restated Certificate of Incorporation in connection with an internal reorganization that is expected to occur on or about April 1, 2021. The internal reorganization will consist of, among other matters, a merger of each of Ares Investments and Ares Offshore Holdings, with and into Ares Holdings.
Managing Business Performance
Operating Metrics
We measure our business performance using certain operating metrics that are common to the alternative asset management industry, which are discussed below.
Assets Under Management
AUM refers to the assets we manage and is viewed as a metric to measure our investment and fundraising performance as it reflects assets generally at fair value plus available uncalled capital.
The tables below present rollforwards of our total AUM by segment:segment ($ in millions):
| | | | | | | | | | | | | | | | | | | | | | | | | | | | | | | | |
| | | | | | | | | | |
| | | | | | | | | | |
| | | | | | | | | | |
| | | | | | | | | | |
| | | | | | | | | | |
| | | | | | | | | | |
| | | | | | | | | | |
| | | | | | | | | | |
| | | | | | | | | | |
| | | | | | | | | | |
| | | | | | | | | | |
| | | | | | | | | | |
| | | | | | | | | | |
| | | | | | | | | | |
| | | | | | | | | | |
| | | | | | | | | | |
| | | | | | | | | | |
| | | | | | | | | | |
| | | | | | | | | | |
| | | | | | | | | | |
| | | | | | | | | | |
| | | | | | | | | | |
| | | | | | | | | | |
|
| | | | | | | | | | |
| ($ in millions) | | Credit Group | | Private Equity Group | | Real Estate Group | | Strategic Initiatives | | Total AUM |
| Balance at 12/31/2019 | | $ | 110,543 | | | $ | 25,166 | | | $ | 13,207 | | | $ | — | | | $ | 148,916 | |
| Acquisitions | | 2,693 | | | — | | | — | | | 9,114 | | | 11,807 | |
| Net new par/equity commitments | | 24,233 | | | 6,189 | | | 2,263 | | | 205 | | | 32,890 | |
| Net new debt commitments | | 7,527 | | | — | | | 437 | | | — | | | 7,964 | |
| Capital reductions | | (431) | | | (136) | | | (372) | | | — | | | (939) | |
| Distributions | | (2,485) | | | (4,410) | | | (1,212) | | | (207) | | | (8,314) | |
| Redemptions | | (2,176) | | | (5) | | | — | | | — | | | (2,181) | |
| Change in fund value | | 5,568 | | | 635 | | | 485 | | | 149 | | | 6,837 | |
| Balance at 12/31/2020 | | $ | 145,472 | | | $ | 27,439 | | | $ | 14,808 | | | $ | 9,261 | | | $ | 196,980 | |
Average AUM(1) | | $ | 123,434 | | | $ | 25,582 | | | $ | 14,180 | | | $ | 9,186 | | | $ | 172,382 | |
| | | | | | | | | | |
| | Credit Group | | Private Equity Group | | Real Estate Group | | Strategic Initiatives | | Total AUM |
| Balance at 12/31/2018 | | $ | 95,836 | | | $ | 23,487 | | | $ | 11,340 | | | $ | — | | | $ | 130,663 | |
| Net new par/equity commitments | | 6,591 | | | 3,151 | | | 2,361 | | | — | | | 12,103 | |
| Net new debt commitments | | 10,684 | | | 25 | | | 633 | | | — | | | 11,342 | |
| Capital reductions | | (1,765) | | | (8) | | | (89) | | | — | | | (1,862) | |
| Distributions | | (2,186) | | | (3,803) | | | (1,600) | | | — | | | (7,589) | |
| Redemptions | | (2,317) | | | (2) | | | — | | | — | | | (2,319) | |
| Change in fund value | | 3,700 | | | 2,316 | | | 562 | | | — | | | 6,578 | |
| Balance at 12/31/2019 | | $ | 110,543 | | | $ | 25,166 | | | $ | 13,207 | | | $ | — | | | $ | 148,916 | |
Average AUM(1) | | $ | 103,853 | | | $ | 24,537 | | | $ | 12,142 | | | $ | — | | | $ | 140,532 | |
| | | | | | | | | | |
| (1) Represents a five-point average of quarter-end balances for each period; except for Strategic Initiatives, which calculates the average using Ares SSG’s AUM on the date of the SSG Acquisition, September 30, 2020 and December 31, 2020, and the average using Ares Insurance Solutions’ AUM on the date of the acquisition of F&G Re and December 31, 2020. |
| | | | | | | | | | |
| | | | | | | | | | | | | | | | | | | | | | | | | | | | | | | | | | | | | | |
| | | | | | | | | | | | |
| | | | | | | | | | | | |
| | | | | | | | | | | | |
| | | | | | | | | | | | |
| | | | | | | | | | | | |
| | | | | | | | | | | | |
| | | | | | | | | | | | |
| | | | | | | | | | | | |
| | | | | | | | | | | | |
| | | | | | | | | | | | |
| | | | | | | | | | | | |
| | | | | | | | | | | | |
| | | | | | | | | | | | |
| | | | | | | | | | | | |
| | | | | | | | | | | | |
| | | | | | | | | | | | |
| | | | | | | | | | | | |
| | | | | | | | | | | | |
| | | | | | | | | | | | |
| | | | | | | | | | | | |
| | | | | | | | | | | | |
| | | | | | | | | | | | |
| | | | | | | | | | | | |
| | | | | | | | | | | | |
| | Credit
Group | | Private Equity
Group | | Real Assets
Group | | Secondaries
Group | | Other Businesses | | Total AUM |
| Balance at 12/31/2022 | | $ | 225,579 | | | $ | 34,749 | | | $ | 66,061 | | | $ | 21,961 | | | $ | 3,647 | | | $ | 351,997 | |
| Acquisitions | | — | | | 3,697 | | | — | | | — | | | — | | | 3,697 | |
| Net new par/equity commitments | | 40,393 | | | 1,621 | | | 6,076 | | | 3,648 | | | 7,008 | | | 58,746 | |
| Net new debt commitments | | 14,897 | | | — | | | 726 | | | — | | | — | | | 15,623 | |
| Capital reductions | | (3,858) | | | (9) | | | (480) | | | — | | | — | | | (4,347) | |
| Distributions | | (7,185) | | | (2,309) | | | (4,796) | | | (1,116) | | | (423) | | | (15,829) | |
| Redemptions | | (3,345) | | | — | | | (1,759) | | | (1) | | | (1,046) | | | (6,151) | |
| Net allocations among investment strategies | | 4,258 | | | — | | | — | | | 5 | | | (4,263) | | | — | |
| Change in fund value | | 14,057 | | | 1,356 | | | (415) | | | 263 | | | (151) | | | 15,110 | |
| Balance at 12/31/2023 | | $ | 284,796 | | | $ | 39,105 | | | $ | 65,413 | | | $ | 24,760 | | | $ | 4,772 | | | $ | 418,846 | |
| | | | | | | | | | | | |
| | Credit
Group | | Private Equity
Group | | Real Assets
Group | | Secondaries
Group | | Other Businesses | | Total AUM |
| Balance at 12/31/2021 | | $ | 201,405 | | | $ | 33,404 | | | $ | 45,919 | | | $ | 22,119 | | | $ | 2,928 | | | $ | 305,775 | |
| Acquisitions | | — | | | — | | | 8,184 | | | 199 | | | — | | | 8,383 | |
| Net new par/equity commitments | | 18,149 | | | 2,202 | | | 10,638 | | | 2,510 | | | 4,848 | | | 38,347 | |
| Net new debt commitments | | 14,462 | | | — | | | 3,253 | | | — | | | — | | | 17,715 | |
| Capital reductions | | (1,280) | | | (208) | | | (516) | | | — | | | — | | | (2,004) | |
| Distributions | | (6,057) | | | (1,333) | | | (3,183) | | | (2,787) | | | (1,788) | | | (15,148) | |
| Redemptions | | (2,415) | | | — | | | (951) | | | — | | | — | | | (3,366) | |
| Net allocations among investment strategies | | 1,975 | | | — | | | — | | | — | | | (1,975) | | | — | |
| Change in fund value | | (660) | | | 684 | | | 2,717 | | | (80) | | | (366) | | | 2,295 | |
| Balance at 12/31/2022 | | $ | 225,579 | | | $ | 34,749 | | | $ | 66,061 | | | $ | 21,961 | | | $ | 3,647 | | | $ | 351,997 | |
| | | | | | | | | | | | |
|
The components of our AUM are presented below as of ($ in billions):
| | | | | | | | | | | | | | |
| AUM: $197.0$418.8 | | AUM: $148.9$352.0 | |
| | | | | | | | | | | | | | | | | | | | | | | |
| FPAUM | | Non-fee paying(1) | | AUM not yet paying fees | | Non-fee paying(1)
| | General partner and affiliates |
(1) Includes $9.0$15.1 billion and $7.9$14.4 billion of AUM of funds from which we indirectly earn management fees as of December 31, 20202023 and 2019,2022, respectively and includes $4.3 billion and $3.4 billion of non-fee paying AUM based on our general partner commitment as of December 31, 2023 and 2022, respectively.
Please refer to “— Results of Operations by Segment” for a more detailed presentation of AUM by segment for each of the periods presentedpresented.
Fee Paying Assets Under Management
FPAUM refers to AUM from which we directly earn management fees and is equal to the sum of all the individual fee bases of our funds that directly contribute to our management fees.
The tables below present rollforwards of our total FPAUM by segment:segment ($ in millions):
| | | | | | | | | | | | | | | | | | | | | | | | | | | | | | | | | | | | | | |
| | | | | | | | | | | | |
| | | | | | | | | | | | |
| | | | | | | | | | | | |
| | | | | | | | | | | | |
| | | | | | | | | | | |
| | | | | | | | | | | | |
| | | | | | | | | | | | |
| | | | | | | | | | | | |
| | | | | | | | | | | | |
| | | | | | | | | | | | |
| | | | | | | | | | | | |
| | | | | | | | | | | | |
| | | | | | | | | | | | |
| | | | | | | | | | | | |
| | | | | | | | | | | | |
| | | | | | | | | | | | |
| | | | | | | | | | | | |
| | | | | | | | | | | |
| | | | | | | | | | | | |
| | | | | | | | | | | | |
| | | | | | | | | | | | |
| | | | | | | | | | | | |
| | | | | | | | | | | | |
| | | | | | | | | | | | |
| | | | | | | | | | | | |
| | | | | | | | | | | | |
| | Credit
Group | | Private Equity
Group | | Real Assets
Group | | Secondaries
Group | | Other Businesses | | Total |
| Balance at 12/31/2022 | | $ | 151,275 | | | $ | 18,447 | | | $ | 41,607 | | | $ | 17,668 | | | $ | 2,064 | | | $ | 231,061 | |
| Acquisitions | | — | | | 1,692 | | | — | | | — | | | — | | | 1,692 | |
| Commitments | | 8,333 | | | — | | | 3,674 | | | 1,645 | | | 6,181 | | | 19,833 | |
| Deployment/subscriptions/increase in leverage | 23,701 | | | 2,752 | | | 2,968 | | | 473 | | | 150 | | | 30,044 | |
| Capital reductions | | (3,657) | | | — | | | (455) | | | — | | | — | | | (4,112) | |
| Distributions | | (7,927) | | | (1,232) | | | (3,862) | | | (613) | | | (415) | | | (14,049) | |
| Redemptions | | (4,474) | | | — | | | (1,775) | | | (1) | | | — | | | (6,250) | |
| Net allocations among investment strategies | | 4,363 | | | — | | | — | | | 30 | | | (4,393) | | | — | |
| Change in fund value | | 5,176 | | | — | | | (917) | | | (164) | | | 317 | | | 4,412 | |
| Change in fee basis | | — | | | (45) | | | 98 | | | 2 | | | (329) | | | (274) | |
| Balance at 12/31/2023 | | $ | 176,790 | | | $ | 21,614 | | | $ | 41,338 | | | $ | 19,040 | | | $ | 3,575 | | | $ | 262,357 | |
| | | | | | | | | | | | |
| | Credit
Group | | Private Equity
Group | | Real Assets
Group | | Secondaries
Group | | Other Businesses | | Total |
| Balance at 12/31/2021 | | $ | 122,110 | | | $ | 16,689 | | | $ | 28,615 | | | $ | 18,364 | | | $ | 2,067 | | | $ | 187,845 | |
| Acquisitions | | — | | | — | | | 4,855 | | | 131 | | | — | | | 4,986 | |
| Commitments | | 11,327 | | | — | | | 6,680 | | | 2,042 | | | 3,607 | | | 23,656 | |
| Deployment/subscriptions/increase in leverage | 32,780 | | | 4,489 | | | 4,002 | | | 560 | | | (38) | | | 41,793 | |
| Capital reductions | | (3,913) | | | — | | | (200) | | | — | | | — | | | (4,113) | |
| Distributions | | (7,365) | | | (1,902) | | | (2,101) | | | (1,319) | | | (734) | | | (13,421) | |
| Redemptions | | (2,684) | | | — | | | (965) | | | — | | | — | | | (3,649) | |
| Net allocations among investment strategies | | 1,935 | | | — | | | — | | | — | | | (1,935) | | | — | |
| Change in fund value | | (2,071) | | | (4) | | | 1,572 | | | 772 | | | (665) | | | (396) | |
| Change in fee basis | | (844) | | | (825) | | | (851) | | | (2,882) | | | (238) | | | (5,640) | |
| Balance at 12/31/2022 | | $ | 151,275 | | | $ | 18,447 | | | $ | 41,607 | | | $ | 17,668 | | | $ | 2,064 | | | $ | 231,061 | |
|
| | | | | | | | | | | | | | | | | | | | | | | | | | | | | | | | |
| | | | | | | | | | |
| | | | | | | | | | |
| | | | | | | | | | |
| | | | | | | | | | |
| | | | | | | | | |
| | | | | | | | | | |
| | | | | | | | | | |
| | | | | | | | | | |
| | | | | | | | | | |
| | | | | | | | | | |
| | | | | | | | | | |
| | | | | | | | | | |
| | | | | | | | | | |
| | | | | | | | | | |
| | | | | | | | | | |
| | | | | | | | | | |
| | | | | | | | | |
| | | | | | | | | | |
| | | | | | | | | | |
| | | | | | | | | | |
| | | | | | | | | | |
| | | | | | | | | | |
| | | | | | | | | | |
| | | | | | | | | | |
| | | | | | | | | | |
|
| | | | | | | | | | |
| ($ in millions) | | Credit Group | | Private Equity Group | | Real Estate Group | | Strategic Initiatives | | Total |
| FPAUM Balance at 12/31/2019 | | $ | 71,880 | | | $ | 17,040 | | | $ | 7,963 | | | $ | — | | | $ | 96,883 | |
| Acquisitions | | 2,596 | | | — | | | — | | | 6,426 | | | 9,022 | |
| Commitments | | 5,230 | | | 4,238 | | | 1,735 | | | — | | | 11,203 | |
| Subscriptions/deployment/increase in leverage | 13,609 | | | 1,585 | | | 1,222 | | | 716 | | | 17,132 | |
| Capital reductions | | (1,660) | | | — | | | (51) | | | (25) | | | (1,736) | |
| Distributions | | (3,657) | | | (1,196) | | | (520) | | | (472) | | | (5,845) | |
| Redemptions | | (2,128) | | | — | | | — | | | — | | | (2,128) | |
| Change in fund value | | 2,187 | | | (36) | | | 327 | | | — | | | 2,478 | |
| Change in fee basis | | (40) | | | (459) | | | (424) | | | (49) | | | (972) | |
| FPAUM Balance at 12/31/2020 | | $ | 88,017 | | | $ | 21,172 | | | $ | 10,252 | | | $ | 6,596 | | | $ | 126,037 | |
Average FPAUM(1) | | $ | 79,140 | | | $ | 18,085 | | | $ | 9,239 | | | $ | 6,518 | | | $ | 112,982 | |
| | | | | | | | | | |
| | Credit Group | | Private Equity Group | | Real Estate Group | | Strategic Initiatives | | Total |
| FPAUM Balance at 12/31/2018 | | $ | 57,847 | | | $ | 17,071 | | | $ | 6,952 | | | $ | — | | | $ | 81,870 | |
| Commitments | | 4,997 | | | 362 | | | 1,080 | | | — | | | 6,439 | |
| Subscriptions/deployment/increase in leverage | 13,674 | | | 2,019 | | | 1,269 | | | — | | | 16,962 | |
| Capital reductions | | (1,557) | | | (202) | | | (217) | | | — | | | (1,976) | |
| Distributions | | (2,285) | | | (1,364) | | | (650) | | | — | | | (4,299) | |
| Redemptions | | (2,604) | | | (1) | | | — | | | — | | | (2,605) | |
| Change in fund value | | 2,181 | | | 3 | | | (16) | | | — | | | 2,168 | |
| Change in fee basis | | (373) | | | (848) | | | (455) | | | — | | | (1,676) | |
| FPAUM Balance at 12/31/2019 | | $ | 71,880 | | | $ | 17,040 | | | $ | 7,963 | | | $ | — | | | $ | 96,883 | |
Average FPAUM(1) | | $ | 65,278 | | | $ | 17,108 | | | $ | 7,353 | | | $ | — | | | $ | 89,739 | |
| | | | | | | | | | |
| (1) Represents a five-point average of quarter-end balances for each period; except for Strategic Initiatives, which calculates the average using Ares SSG’s FPAUM on the date of the SSG Acquisition, September 30, 2020 and December 31, 2020, and the average using Ares Insurance Solutions’ FPAUM on the date of the acquisition of F&G Re and December 31, 2020. |
The charts below present FPAUM by its fee bases ($ in billions):
| | | | | | | | | | | | | | |
| FPAUM: $262.4 | | FPAUM: $231.1 | |
| | | | | | | | | | | | | | | | | | | | | | | |
| Invested capital/other(1) | | Market value(2) | | Collateral balances (at par) | | Capital commitments |
(1)Other consists of ACRE’s FPAUM, which is based on ACRE’s stockholders’ equity.
(2)Includes $58.8 billion and $56.0 billion from funds that primarily invest in illiquid strategies as of December 31, 2023 and 2022, respectively. The underlying investments held in these funds are generally subject to less market volatility than investments held in liquid strategies.
Please refer to “— Results of Operations by Segment” for detailed information by segment of the activity affecting total FPAUM for each of the periods presented.
96Perpetual Capital Assets Under Management
The chartschart below present FPAUMpresents our perpetual capital AUM by its fee basissegment and type ($ in billions):
| | | | | | | | | | | | | | |
| FPAUM: $126.0 | | FPAUM: $96.9 | |
| | | | | | | | | | | | | | | | | | | | | | | |
| Invested capital/other(1)
| | Market value(2)
| | Collateral balances (at par) | | Capital commitments |
(1)Other consists of ACRE's FPAUM, which is based on ACRE’s stockholders’ equity.
(2)Includes $24.5 billion and $19.0 billion from funds that primarily invest in illiquid strategies as of December 31, 2020 and 2019, respectively. The underlying investments held in these funds are generally subject to less market volatility than investments held in liquid strategies.
Incentive Eligible Assets Under Management, Incentive Generating Assets Under Management and Available Capital
IEAUM generally represents the NAV plus uncalled equity or total assets plus uncalled debt, as applicable, of our funds from which we are entitled to receive performance income, excluding capital committed by us and our professionals (from which we do not earn performance income). With respect to ARCC's AUM, only ARCC Part II Fees may be generated from IEAUM.
IGAUM generally represents the AUM of our funds that are currently generating performance income on a realized or unrealized basis. It represents the basis on which we are entitled to receive performance income. The basis is typically the NAV or total assets of the fund. We exclude from the basis amounts on which we do not earn performance income, such as capital committed by us and our professionals. ARCC is only included in IGAUM when ARCC Part II Fees are being generated.
The charts below present our IEAUM and IGAUM by segment ($ in billions):
| | | | | | | | | | | | | | | | | | | | | | | |
| Credit | | Private Equity | | Real Estate | | Strategic Initiatives |
The charts below present our available capital and AUM not yet paying fees by segment ($ in billions):
| | | | | | | | | | | | | | | | | | | | | | | |
| Credit | | Private Equity | | Real Estate | | Strategic Initiatives |

Management Fees Fund DurationBy Type
We view the duration of funds we manage as a metric to measure the stability of our future management fees. For both the years ended December 31, 20202023 and 2019, 77% and 81%, respectively,2022, 95% of our segment management fees were attributable to funds with threeearned from perpetual capital or more years in duration.long-dated funds. The charts below present the composition of our segment management fees by the initial fund duration:
| | | | | | | | | | | | | | | | | | | | | | | | | | | | | | | | | | | | | | | | | |
| PermanentPerpetual Capital - Publicly-Traded
Vehicles | | 10 or more yearsPerpetual Capital - Non-Traded
Vehicles | | 7 to 9 yearsPerpetual Capital - Managed Accounts | | 3 to 6 yearsPerpetual Capital - Private Commingled Vehicles | | Fewer than 3 years | | Differentiated Managed AccountsLong-Dated Funds(1)
| | Managed AccountsOther |
(1) Differentiated managed accountsLong-dated funds generally have been managed by the Company for longer than threea contractual life of five years are investing in illiquid strategies or are co-investments structured to pay management fees.
Available Capital and Assets Under Management Not Yet Paying Fees
The charts below present our available capital and AUM not yet paying fees by segment ($ in billions):
| | | | | | | | | | | | | | | | | | | | | | | | | | | | | |
| Credit | | Private Equity | | Real Assets | | Secondaries | | Other Businesses |
As of December 31, 2023, AUM Not Yet Paying Fees includes $62.9 billion of AUM available for future deployment that could generate approximately $621.6 million in potential incremental annual management fees. As of December 31, 2022, AUM Not Yet Paying Fees included $41.8 billion of AUM available for future deployment that could generate approximately $410.9 million in potential incremental annual management fees.
Incentive Eligible Assets Under Management and Incentive Generating Assets Under Management
The charts below present our IEAUM and IGAUM by segment ($ in billions):
| | | | | | | | | | | | | | | | | | | | | | | | | | | | | |
| Credit | | Private Equity | | Real Assets | | Secondaries | | Other Businesses |
The charts below present our IGAUM by strategy for funds generating fee related performance revenues and net fee related performance revenues by strategy as of and for the years ended:
| | | | | | | | | | | | | | | | | | | | | | | | | | | | | | | | | | | |
| U.S. Direct Lending | | European Direct Lending | | Alternative Credit | | Private Equity Secondaries | | U.S. Real Estate Equity | | Real Estate Debt |
(1)Fee related performance revenues by strategy is presented net of the associated fee related performance compensation.
Fund Performance Metrics
Fund performance information for our investment funds considered to be “significant funds” is included throughout this discussion with analysis to facilitate an understanding of our results of operations for the periods presented. Our significant funds are commingled funds that either contributed at least 1% of our total management fees or represented at least 1% of the Company’s total FPAUM for the past two consecutive quarterly periods.quarters. In addition to management fees, each of our significant funds may generate performance incomecarried interest or incentive fees upon the achievement of performance hurdles. The fund performance information reflected in this discussion and analysis is not indicative of our overall performance. An investment in Ares is not an investment in any of our funds. Past performance is not indicative of future results. As with any investment, there is always the potential for gains as well as the possibility of losses. There can be no assurance that any of these funds or our other existing and future funds will achieve similar returns.
We do not present fundFund performance metrics for significant funds with less than two yearsmay be marked as “NM” as they may not be considered meaningful due to the limited time since the initial investment and/or early stage of investment performance from the date of the fund's first investment, except for those significant funds that pay management fees on invested capital in which case investment performance will be presented on the earlier of (i) the one-year anniversary of the fund's first investment or (ii) such time that the fund has invested at least 50% of its capital.deployment.
To further facilitate an understanding of the impact a significant fund may have on our results, we present our drawdown funds as either funds harvesting investments or funds deploying capital to indicate the fund'sfund’s stage in its life cycle. A fund harvesting investments indicates a fund is generally not seeking to deploy capital into new investment opportunities, while a fund deploying capital is generally seeking new investment opportunities.
Components of Consolidated Results of Operations
Revenues
Management Fees. Management fees are outlined in each fund’sThe investment adviser of our funds generally receives an annual management agreement. Management fees are generallyfee based on a defined percentage of a fee base, typically average fairthe fund’s capital commitments, contributed capital, net asset value of assets, total commitments,or invested capital NAV,during the investment period, which may then change at the end of the investment period. For certain of our SMAs, we receive an annual management fee based on a percentage of invested capital, contributed capital or net asset value throughout the term of the SMA. We also may receive special fees, including agency and arrangement fees. In certain circumstances, we are contractually required to offset certain amounts of such special fees against management fees relating to the applicable fund.
The investment incomeadviser of each of our CLOs typically receives annual management fees based on the gross aggregate collateral balance for CLOs, at par, adjusted for cash and defaulted or pardiscounted collateral. The management fees of CLOs accounted for approximately 2% of our total management fees on a consolidated basis and 4% on an unconsolidated basis for the year ended December 31, 2023.
The management fees we receive from our drawdown style funds are typically payable on a quarterly basis over the life of the fund and do not fluctuate with the changes in investment performance of the fund. The investment management agreements we enter into with clients in connection with contractual SMAs may generally be terminated by such clients with reasonably short prior written notice. Typically, terminations do not require liquidation of the SMAs and such SMAs will continue to exist until the underlying investments are liquidated. The management fees we receive from our SMAs are generally paid on a periodic basis (typically quarterly, subject to the termination rights described above) and are based on either invested capital or on the net asset value of the separately managed account.
We receive management fees in accordance with the investment portfolios managedadvisory and management agreements of our retail vehicles, including both our publicly-traded and non-traded vehicles, that must be reviewed or approved annually by us. Thetheir independent boards of directors.
Details regarding our management fees from our retail vehicles are generally based on a quarterly measurement period and can be paid in advance or in arrears. Management fees are recognized as revenue in the period advisory services are rendered, subject to our assessmentpresented below:
| | | | | | | | | | | | | | |
| | Annual Fee Rate | | Fee Base |
| ACRE | | 1.50% | | Stockholders’ equity |
| AIREIT | | 1.25% | | NAV |
| APMF | | 1.40% | | Total assets (including any assets relating to indebtedness or preferred shares that may be issued) minus liabilities (other than liabilities relating to indebtedness) |
| ARCC | | 1.50% | | Total assets (other than cash and cash equivalents) |
| ARCC Part I Fees | | 20.00% | | Net investment income (before ARCC Part I Fees and ARCC Part II Fees), subject to a fixed hurdle rate of 1.75% per quarter, or 7.00% per annum. No fees are recognized until ARCC’s net investment income exceeds a 1.75% hurdle rate, with a catch-up provision to ensure that the Company receives 20.00% of the net investment income from the first dollar earned |
| ARDC | | 1.00% | | Total assets minus liabilities (other than liabilities relating to indebtedness) |
| AREIT | | 1.10% | | NAV |
| ASIF | | 1.25% | | NAV |
| ASIF Part I Fees | | 12.50% | | Net investment income (before ASIF Part I Fees and ASIF Part II Fees), subject to a fixed hurdle rate of 1.25% per quarter, or 5.00% per annum. No fees are recognized until ASIF’s net investment income exceeds a 1.25% hurdle rate, with a catch-up provision to ensure that the Company receives 12.50% of the net investment income from the first dollar earned |
| CADC | | 1.25% | | Total assets minus liabilities (other than liabilities relating to indebtedness) |
| CADC Part I Fees | | 15.00% | | Net investment income (before CADC Part I Fees), subject to a fixed hurdle rate of 1.50% per quarter, or 6.00% per annum. No fees are recognized until CADC’s net investment income exceeds the hurdle rate, with a catch-up provision to ensure that the Company receives 15.00% of the net investment income from the first dollar earned |
Details regarding our management fees by strategy are presented below:
| | | | | | | | | | | | | | | | | | | | |
| | Fee Rate | | Fee Base | | Average Remaining Contract Term(1) |
| | | | | | |
| Credit Group | | | | | | |
Liquid Credit(2) | | 0.25% - 1.00% | | Par plus cash or NAV | | 9.0 years(2) |
| Alternative Credit | | 0.50% - 1.50% | | NAV, gross asset value, capital commitments or invested capital | | 4.4 years |
U.S. and European Direct Lending(3) | | 0.75% - 1.50% | | Invested capital, NAV or total assets (in certain cases, excluding cash and cash equivalents) | | 4.4 years |
APAC Credit(4) | | 1.15% - 2.00% | | Capital commitments, aggregate cost basis of unrealized portfolio investments or a combination thereof | | 3.7 years |
| | | | | | |
| Private Equity Group | | | | | | |
Corporate Private Equity(5) | | 1.50% | | Capital commitments | | 5.2 years |
Special Opportunities(6) | | 1.50% | | Invested capital or aggregate cost basis of unrealized portfolio investments | | 7.8 years |
APAC Private Equity(7) | | 1.00% - 2.00% | | Invested capital, capital commitments or a combination thereof | | 3.9 years |
| | | | | | |
| Real Assets Group |
Real Estate Equity(8) | | 0.50% - 1.50% | | Invested capital, NAV, capital commitments or a combination thereof | | 3.1 years |
| Real Estate Debt | | 0.50% - 1.00% | | Invested capital or NAV | | N/A(9) |
Infrastructure Opportunities(10) | | 1.00% - 1.50% | | Capital commitments | | 6.0 years |
| Infrastructure Debt | | 1.00% | | Invested capital | | 5.1 years |
| | | | | | |
| Secondaries Group |
Private Equity, Real Estate, Infrastructure Secondaries and Credit Secondaries(11) | | 0.50% - 1.25% | | Capital commitments, invested capital, reported value (largely represents NAV of each fund’s underlying limited partnership interests), called capital plus unfunded commitments or reported value plus unfunded commitments | | 7.2 years |
| | | | | | |
| Other Businesses |
Ares Insurance Solutions(12) | | 0.30% | | Monthly weighted average market value of the assets | | N/A(12) |
•Syndicated Loans and High Yield Bonds: Typical management fees range from 0.35% to 0.50% of par plus cash or of NAV. The syndicated loan funds have an(1) Represents the average managementremaining contract term frompursuant to the closing date of 12.6 yearsfunds’ governing documents within each strategy, excluding perpetual capital vehicles, as of December 31, 20202023.
(2) Liquid credit includes the syndicated loan, high yield bond and the feemulti-asset credit strategies. Fee ranges for syndicated loans generally remain unchanged at the close of the re-investment period. In certain cases, CLOs may be called upon demand by subordinated noteholders prior to the management contract term expiration date. The funds in the high-yield strategy generally represent open-ended managed accounts, which typically do not include investment period termination or management contract expiration dates.
•Multi-Asset Credit: Typical management fees range from 0.50% to 1.50% of NAV. The funds in this strategyhigh yield bond and multi-asset credit strategies are generally open-ended or managed account structures, which typically do not have investment period termination or management contract expiration dates. The funds in this strategy include ARDC, a publicly-traded closed-end fund, which does not have an investment period termination date. The funds in this strategy, (excluding ARDC, which is a permanent capital vehicle), had an average management contract term from the closing date of 11.0 years as of December 31, 2020.
•Alternative Credit: Typical management fees range from 0.50% to 1.50% of NAV, gross asset value, committed capital or invested capital. The funds in this strategy had an average management contract term from the closing date of 7.4 years as of December 31, 2020.
•U.S and European Direct Lending: Typical management fees range from 0.75% to 1.50% of invested capital, NAV or total assets (in certain cases, excluding cash and cash equivalents).(3) Following the expiration or termination of the investment period, the fee basis for certain closed-end funds and managed accounts in this strategy generally change either to the aggregate cost or to market value of the portfolio investments. In addition,
(4) Certain funds pay a lower management fees include the ARCC Part I Fees.fee rate on committed capital which increases when such capital is invested. The funds in this strategy (excluding ARCC, which is a permanent capital vehicle) had an averageare comprised of closed-end funds, with investment period termination or management contract termtermination dates. The funds also include co-investment accounts with fees ranging from the closing date of 8.5 years as of December 31, 2020.0.50% to 1.50%, which generally do not include investment period termination or management contract termination dates.
Private Equity Group:
•Corporate Private Equity and Infrastructure and Power: Typical management fees(5) Fee range from 1.50% to 2.00% of total capital commitmentsrepresents typical range during the investment period. The managementManagement fees for corporate private equity funds generally step down to between 0.75% and 1.25% of the aggregate adjusted cost of unrealized portfolio investments following the earlier to occur of: (i) the expiration or termination of the investment periodperiod; and (ii) the activation of a successor fund. The infrastructure and power
(6) Fee range represents typical range during the investment period. Management fees for special opportunities funds generally step down to between 1.00% to 1.25% of the fee baseinvested capital or the aggregate cost basis of unrealized portfolio investments following the expiration or termination of the investment period.
(7) Fee range represents typical range during the investment period. Management fees for APAC private equity funds generally step down to 2.00% of the aggregatedaggregate adjusted cost of unrealized portfolio investments while retaining the same fee rate, following the expiration or termination of the investment period. The funds in this strategy had an averagealso include co-investment vehicles with fees rates of 2.00%, which generally do not include investment period termination or management contract term from the closing date of 11.0 years as of December 31, 2020.termination dates.
•Special Opportunities: Typical management fees range from 1.00% to 1.50% of the aggregate cost basis of unrealized portfolio investments. The funds in this strategy had an average management contract term from the closing date of 9.9 years as of December 31, 2020.
Real Estate Group:
•Real Estate Equity and Debt: Typical management fees range from 0.50% to 1.50% of invested capital, stockholders’ equity, total capital commitments or a combination thereof.(8) Certain funds pay a lower management fee rate on committed capital which increases when such capital is invested. Following the expiration or termination of the investment period the basis on which management fees are earned for certain closed-end funds, managed accounts and co-investment vehicles in this strategy changes from committed capital to invested capital with no change in the management fee rate. AIREIT and AREIT pay management fees based on NAV plus net capital raised and outstanding from our 1031 exchange programs.
(9) The funds in these strategies (excluding ACRE,this strategy are generally open-ended or managed account structures, which is a permanent capital vehicle) had an averagetypically do not have investment period termination or management contract term fromexpiration dates.
(10) Fee range represents typical range during the closing date of 11.2 years as of December 31, 2020.
Strategic Initiatives:
•Asian Special Situations: Typicalinvestment period. Certain funds pay a lower management fees range from 1.90%fee rate on committed capital which increases when such capital is invested. The infrastructure opportunities funds generally step down the fee base to 2.00% of the aggregateaggregated adjusted cost basis of unrealized portfolio investments, plus 1.15% to 1.25% of the excess of commitment over current cost basis of unrealized portfolio investments, while retaining the fund is stillsame fee rate, following the expiration or termination of the investment period.
(11) Funds in its commitment period. The funds in thiseach strategy are comprised of closed-end funds with either investment period termination or management contract termination dates. The funds also include co-investmentdates and certain open-end accounts with fees range from 0.50% to 1.50%, whichthat generally do not includehave termination dates.
(12) Ares Insurance Solutions earns a tiered management fee that starts at 0.30% and steps down to 0.15% of the monthly weighted average market value. Ares Insurance Solutions generally includes open-ended or managed account structures, which typically do not have investment period termination or management contract terminationexpiration dates. The funds in this strategy had an average management contract term from the closing date of 6.7years as of December 31, 2020.
•Asian Secured Lending: Typical management fees range from 1.40% to 1.50% of the aggregate cost basis of unrealized portfolio investments. The funds in this strategy are comprised of closed-end funds with investment period termination or management contract termination dates. The funds also include co-investment accounts which generally do not include investment period termination or management contract termination dates. The funds in this strategy had an average management contract term from the closing date of 5.4years as of December 31, 2020.
Carried Interest Allocation. In certain fund structures, carried interest is allocated to us based on cumulative fund performance to date, subject to the achievement of minimum return levels in accordance with the respective terms in each fund’s governing documents. Additional details regarding our carried interest are presented below:
Credit Group:
•Multi-Asset Credit and Alternative Credit: Typical carried interest represents 15% to 20% of each carried interest eligible fund’s profits, subject to a preferred return of approximately 6% to 8% per annum.
•U.S. and European Direct Lending: Typical carried interest represents 10% to 20% of each carried interest eligible fund’s profits and are subject to a preferred return rate of approximately 5% to 8% per annum.
Private Equity Group:
•Private Equity funds: Carried interest represents 20% of each carried interest eligible fund’s profits, subject to a preferred return of approximately 8% per annum.
Real Estate Group:
•Real Estate funds: Typical carried interest represents 10% to 20% of each carried interest eligible fund’s profits, subject to a preferred return of approximately 8% to 10% per annum.
Strategic Initiatives:
•Asian Secured Lending: Carried interest represents 20% of each carried interest eligible fund’s profits, subject to a preferred return of approximately 7% per annum.
We may be liable to certain funds for previously realized carried interest allocation if the fund’s investment values decline below certain return hurdles, which vary from fund to fund. For detailed discussion of contingencies on performance income, see “Note 9. Commitments and Contingencies,” to our audited consolidated financial statements included in this Annual Report on Form 10-K.
Incentive Fees. Incentive fees earned on the performanceThe general partners, managers or similar entities of certain fund structuresof our funds receive performance-based fees. These fees are recognizedgenerally based on the fund’s performance duringannual investment returns of the period,applicable fund, subject to certain net loss carry-forward provisions, high-watermarks and/or preferred returns. Such performance-based fees may also be based on a fund’s cumulative net investment returns for the achievement of minimum return levelsmeasurement period, in accordance with the respective terms set out in each fund’s investment management agreement.some cases subject to a high-watermark or a preferred return. Incentive fees are realized at the end of a measurement period, typically quarterly or annually. Realized incentive fees are generally higher during the second half of the year due to the nature of certain funds that typically realize incentive fees at the end of the calendar year. Once realized, such incentive fees are no longernot subject to reversal. Additional detailsrepayment. Cash from the realizations is typically received in the period subsequent to the measurement period. Incentive fees are composed of both fee related performance revenues, which are based on perpetual capital, and those incentive fees earned from funds with stated investment periods:
Details regarding our fee related performance revenues are presented below:
| | | | | | | | | | | | | | | | | | | | |
| | Fee Rate | | Fee Base | | Annual Hurdle Rate |
| | | | | | |
| Credit Group | | | | | | |
| Open-ended core alternative credit fund | | 15.0% | | Incentive eligible fund’s profits | | 6.0% |
| U.S. and European Direct Lending | | 10.0% - 15.0% | | Incentive eligible fund’s profits | | 5.0% to 8.0% |
| | | | | | |
| | | | | | |
| Real Assets Group | | |
| AIREIT and AREIT | | 12.5% | | Annual investment returns, subject to certain net loss carry-forward provisions | | 5.0% |
| ACRE | | 20.0% | | The difference between ACRE’s core earnings (as defined in ACRE’s management agreement) and its shareholders' return on equity | | 8.0% |
| | | | | | |
| Secondaries Group | | |
| APMF | | 12.5% | | Annual investment returns, subject to certain net loss carry-forward provisions | | N/A |
Details regarding our incentive fees earned from funds with stated investment periods, which are generally based on a fund’s eligible profits, are presented below:
Credit Group: | | | | | | | | | | | | | | | | |
| | Fee Rate | | | | Annual Hurdle Rate |
| | | | | | |
| Credit Group | | | | | | |
| | | | | | |
| Liquid Credit | | 10.0% - 20.0% | | | | 3.0% to 12.0% |
| Alternative Credit | | 12.5% - 20.0% | | | | 5.0% to 7.0% |
U.S. and European Direct Lending(1) | | 10.0% - 15.0% | | | | 5.0% to 8.0% |
| | | | | | |
| Real Assets Group | | |
| Real Estate Equity | | 15.0% - 18.0% | | | | 6.0% to 8.0% |
•(1) Syndicated LoansWe may receive Part II Fees, which are not paid unless ARCC and High Yield Bonds: TypicalASIF achieve cumulative aggregate realized capital gains (net of cumulative aggregate realized capital losses and aggregate unrealized capital depreciation). For ARCC and ASIF, incentive fees represent 10% to 20% of each incentive eligible fund’s profits, subject to hurdle rates of approximately 3% to 12% per annum.
•Multi-Asset Credit20.0% and Alternative Credit: Typical incentive fees represent 12.5% to 20% of each incentive eligible fund’s profits, subject to a preferred return of approximately 5% to 7% per annum.
•U.S. and European Direct Lending: Typical incentive fees represent 10% to 20% of each incentive eligible fund’s profits and are subject to a preferred return rate of approximately 5% to 8% per annum. For ARCC, incentive fees represent 20%, respectively, of the cumulative aggregate realized capital gains (net of cumulative aggregate realized losses and aggregate unrealized aggregate capital depreciation). and such fees are presented as incentive fees earned from funds with stated investment periods.
Real Estate Group:
•Real Estate Debt:Performance Income. IncentiveWe may receive performance income from our funds that may be either incentive fees earned from funds with stated investment periods as described above, or a special allocation of income, which we refer to as carried interest. Performance income is recognized when specified investment returns are achieved by the fund.
Carried Interest Allocation. Carried interest allocation is recognized based on changes in valuation of our funds’ investments that exceed certain preferred returns as set forth in each respective partnership agreement. Carried interest allocation is based on the amount that would be due to us pursuant to the fund partnership agreement at each period end as if the funds were liquidated at such date. Accordingly, the amount recognized as carried interest allocation reflects our share of the fair value gains and losses of the associated funds’ underlying investments measured at their then-current fair values relative to the fair values as of the end of the prior period. Investment returns of one fund are not offset between or among funds.
Funds generally follow either an American-style waterfall or a European-style waterfall. For American-style waterfalls, the general partner is entitled to receive carried interest after a fund investment is realized if the investors in the fund have received distributions in excess of the capital contributed for such investment and all prior realized investments (plus allocable expenses), as well as the preferred return. For European-style waterfalls, the general partner is entitled to receive carried interest if the investors in the fund have received distributions in an amount equal to all prior capital contributions plus a preferred return.
For most funds, the carried interest is subject to a preferred return ranging from ACRE5.0% to 10.0%, after which there is typically a catch-up allocation to the general partner. Generally, if at the termination of a fund (and in some cases at interim points in the life of a fund), the fund has not achieved investment returns that exceed the preferred return threshold or the general partner receives net profits over the life of the fund in excess of its allocable share under the applicable partnership agreement, the general partner will be obligated to repay an amount equal to the extent the previously distributed carried interest exceeds the amounts to which the general partner is entitled. These repayment obligations may be related to amounts previously distributed to us and our senior professionals and are generally referred to as contingent repayment obligations.
Contingent repayment obligations operate with respect to only a given fund’s net investment performance and carried interest of other funds are not netted for determining this contingent obligation. Although a contingent repayment obligation is several to each person who received a distribution, and not a joint obligation, and our professionals who receive carried interest have guaranteed repayment of such contingent obligation, the governing agreements of our funds generally provide that, if a recipient does not fund his or her respective share, we may have to fund such additional amounts beyond the amount of carried interest we retained, although we generally will retain the right to pursue remedies against those carried interest recipients who fail to fund their obligations.
Certain funds may make distributions to their partners to provide them with cash sufficient to pay applicable federal, state and local tax liabilities attributable to the fund’s income that is allocated to them. These distributions are referred to as tax distributions and are not subject to contingent repayment obligations. Tax distributions from European-style waterfall funds generally precede investors in the fund receiving the preferred return.
Details regarding our carried interest, which is generally based on a percentagefund’s eligible profits, are presented below:
| | | | | | | | | | | | | | | | |
| | Fee Rate | | | | Annual Hurdle Rate |
| | | | | | |
| | | | | | |
| | | | | | |
| Credit Group | | | | | | |
| Liquid Credit and Alternative Credit | | 15.0% - 20.0% | | | | 6.0% to 8.0% |
| U.S. and European Direct Lending | | 10.0% - 20.0% | | | | 5.0% to 8.0% |
| APAC Credit | | 15.0% - 20.0% | | | | 7.0% to 8.0% |
| | | | | | |
| Private Equity Group | | | | | | |
| Corporate Private Equity, Special Opportunities and APAC Private Equity | | 20.0% | | | | 8.0% |
| | | | | | |
| Real Assets Group | | |
| Real Estate | | 10.0% - 20.0% | | | | 6.0% to 10.0% |
| Infrastructure | | 15.0% - 20.0% | | | | 5.0% to 8.0% |
| | | | | | |
| Secondaries Group | | |
| Private Equity, Real Estate, Infrastructure and Credit Secondaries | | 10.0% - 12.5% | | | | 8.0% |
| | | | | | |
| Other Businesses | | |
| Ares Insurance Solutions | | 20.0% | | | | 8.0% |
For detailed discussion of contingencies on carried interest, see “Note 8. Commitments and Contingencies,” within our consolidated financial statements and “Item 1A. Risk Factors—Risks Related to Our Funds—We may need to pay “clawback” or “contingent repayment” obligations if and when they are triggered under the difference between ACRE’s core earnings (as definedgoverning agreements with our funds” included in ACRE’s management agreement) and an amount derived from the weighted average issue price per share of ACRE’s common stock in its public offerings multiplied by the weighted average number of shares of common stock outstanding.this Annual Report on Form 10-K.
Principal Investment Income (Loss). Principal investment income (loss) consists of interest and dividend income and net realized and unrealized gains (losses) on equity method investments thatwhere we manage.serve as general partner. Interest and dividend income are recognized on an accrual basis to the extent that such amounts are expected to be collected. A realized gain (loss) may be recognized when we redeem all or a portion of our investment or when we receive a distribution of capital.is returned to us. Unrealized gains (losses) on investments result from appreciation (depreciation) in the fair value of our investments, as well as reversals of previously recorded unrealized appreciation (depreciation) at the time the gain (loss) on an investment becomes realized.
Administrative, Transaction and Other Fees. OtherDetails regarding our administrative, transaction and other fees primarily include revenue from administrative services provided to certain of our affiliated funds. In addition, we may receive fees from certain affiliated funds based on income to those funds from loan originations that we refer to as transaction-based fees.are presented below:
| | | | | | | | |
| Administrative fees | | Represent fees that we earn for providing administrative services to certain funds and may reflect either an expense reimbursements for costs incurred by certain professionals in performing services for a fund or may be based on fixed percentage of a fund’s invested capital |
| Transaction fees | | Typically represent fees earned from the arrangement and origination of loans and are generated primarily from funds within our direct lending and infrastructure debt strategies |
| Other fees: | | |
| Property-related fees represent fees earned within funds in our real estate equity strategies and include the following: |
| Acquisition fees | | Based on a percentage of a property’s cost at the time of property acquisition |
| Development fees | | Based on a percentage of development costs over the development period |
| Property management fees | | Based on tenancy of properties over the time associated property management services are provided |
| Sale and distribution fees represent fees earned through AWMS for the sale and distribution of fund shares in our non-traded vehicles and include the following: |
| Sales-based fees | | Based on a percentage of shares sold to retail investors in our non-traded vehicles. Sales-based fees are reported net of amounts re-allowed to participating broker-dealers for their ongoing shareholder services |
| Asset-based fees | | Based on the NAV of the applicable asset class. Asset-based fees are reported net of amounts re-allowed to participating broker-dealers for their ongoing shareholder services |
| Exchange program fees | | Based on a percentage of the value associated with the properties transacted through our 1031 exchange programs. Exchange program fees are recognized when investors contribute real property through like-kind 1031 exchanges for fund shares and through other private placements and are composed of a program administration fee and a facilitation fee for advisory services and sales-based efforts, respectively |
Expenses
Compensation and Benefits. Compensation generally includes salaries, bonuses, health and welfare benefits, payroll related taxes, equity-basedequity compensation, and ARCC Part I Fee incentive compensation expenses. Compensation cost relating to the issuance of restricted units and options is measured at fair value at the grant date, reduced for actual forfeitures, and expensed over the vesting period on a straight-line basis. Bonuses are accrued over the service period to which they relate.fee related performance compensation expenses. Compensation and benefits expenses are typically correlated to the operating performance of our segments, which is used to
determine incentive-based compensation for each segment. Incentive-based compensation is accrued over the service period to which it relates. Our discretionary incentive-based compensation generally represents our annual bonus pool, is based on our operating performance and may fluctuate throughout the year until payments are made. The majority of our incentive-based compensation is paid during the fourth quarter. Certain of our senior partners are not paid an annual salary or bonus, instead they only receive distributions based on their ownership interest when declared by our board of directors. We use changes in headcount, which represents the full-time equivalency of active employees during each period, to analyze changes in compensation and benefits. Part I Fee incentive compensation and fee related performance compensation represent approximately 60% of Part I Fees and of fee related performance revenues, respectively, before giving effect to payroll related taxes. Compensation expense also includes employee commissions that are generated in connection with our like-kind 1031 exchange program and other private placement transactions conducted through AWMS. Incremental changes in fair value of certain contingent liabilities established in connection with our various acquisitions are recognized ratably over the service period and are also presented within compensation and benefits.
Equity compensation represents a form of non-cash compensation that we use to align our employees with the long-term interests of our shareholders. Equity-based awards are typically granted in the form of restricted units that generally vest over a service period between three and five years. We issue equity awards with a long-term focus of limiting the average dilutive impact on our Class A common stockholders to no more than 1.5% annually. Because we withhold shares equal to the fair value of our employee tax withholding liabilities and pay the taxes on their behalf in cash, fewer net shares are issued upon vesting. This result has reduced the average annual dilutive impact of these awards to less than 1.0% annually. We expect the expenses recognized in connection with these awards to fluctuate with changes in the price of our Class A common stock.
Performance Related Compensation. Performance related compensation includes compensation directly related to carried interest allocation and incentive fees earned from funds with stated investment periods, generally consisting of percentage interests that we grant to our professionals. Depending on the nature of each fund, the performance incomerelated compensation generally represents 60-80%60% to 80% of the performance incomecarried interest allocation and aforementioned incentive fees recognized by us.us before giving effect to payroll related taxes. We have an obligation to pay our professionals a portion of the carried interest allocation or incentive fees earned from certain funds. The performance related compensation payable is calculated based upon the recognition of carried interest allocation and incentive fees and is not payablepaid to recipients until the carried interest allocation or incentive fee is realized.received. Performance related compensation may include allocations to charitable organizations as part of our philanthropic initiatives.
Although changes in performance related compensation are directly correlated with changes in performance incomecarried interest allocation and incentive fees reported within our segment results, this correlation does not always exist when our results are reported on a fully consolidated basis in accordance with GAAP. This discrepancy is caused when performance incomecarried interest allocation
and incentive fees earned from our Consolidated Funds is eliminated upon consolidation and performance related compensation is not.
General, Administrative and Other Expenses. General and administrative expenses include costs primarily related to occupancy, professional services, travel, communicationinformation services and information services,technology costs, placement fees, depreciation, amortization of intangibles, supplemental distribution fees and other general operating items. Placement fees are paid to placement agents and include: (i) upfront fees based on commitments to a fund; and (ii) service fees for periodic investor services that are recognized as services are provided. Supplemental distribution fees are paid to brokerage firms, banks or other financial intermediaries for the distribution of shares in our non-traded vehicles and may be calculated on either sales volumes or levels of assets under management.
Expenses of Consolidated Funds. Consolidated Funds’ expenses consist primarily of costs incurred by our Consolidated Funds, including professional services fees, research expenses, trustee fees, travel expenses and other costs associated with organizing and offering these funds.
Other Income (Expense)
Net Realized and Unrealized Gains (Losses) on Investments. A realized gain (loss) may be recognized when we redeem all or a portion of our investment or when we receive a distribution of capital.is returned to us. Unrealized gains (losses) on investments result from the change in appreciation (depreciation) in the fair value of our investments.
Interest and Dividend Income. Interest and dividend income is primarily generated from investments in products that we manageCLOs and other strategic investments.investments where we do not serve as general partner. Interest and dividend income are both recognized on an accrual basis to the extent that such amounts are expected to be collected.
Interest Expense. Interest expense includes interest related to our Credit Facility, which has a variable interest rate based upon SOFR plus a credit spread that is adjusted with changes to corporate credit ratings and with the achievement of certain ESG-related targets, and to our senior and subordinated notes, each of which have a fixed coupon rate.rates.
Other Income (Expense), Net. Other income (expense), net consists of transaction gains (losses) on the revaluation of assets and liabilities denominated in non-functional currencies and of other non-operating and non-investment related activity,activities, such as bargain purchase gain, changes in fair value of contingent obligations, loss on disposal of assets, among other items.
Net Realized and Unrealized Gains (Losses) on Investments of Consolidated Funds. Realized gains (losses) may arise from dispositions of investments held by our Consolidated Funds. Unrealized gains (losses) are recorded to reflect the change in appreciation (depreciation) of investments held by the Consolidated Funds due to changes in fair value of the investments.
Interest and Other Income of Consolidated Funds. Interest and other income of Consolidated Funds primarily includes interest and dividend income generated from the underlying investments of our Consolidated Funds.
Interest Expense of Consolidated Funds. Interest expense primarily consists of interest related to our Consolidated CLOs’ loans payable and, to a lesser extent, revolving credit lines, term loans and notes of other Consolidated Funds. The interest expense of the Consolidated CLOs is solely the responsibility of such CLOs and there is no recourse to us if the CLO is unable to make interest payments.
Income Taxes. Ares Management Corporation (“AMC”)Taxes
AMC is a corporation for U.S. federal income tax purposes and is subject to U.S. federal, state and local corporate income taxes at the entity level on its share of net taxable income. In addition, the AOG entities and certain of AMC'sAMC’s subsidiaries operate in the United StatesU.S. as partnerships or disregarded entities for U.S. federal income tax purposes and as corporate entities in certain non-U.S.foreign jurisdictions. These entities, in some cases, are subject to U.S. state or local income taxes or non-U.S.foreign income taxes. Our effective tax rate is impacted bythe result of AMC’s net taxable income and the applicable U.S. federal, state and local income taxes as well as, in some cases, non-U.S.foreign income taxes. Net taxable
income is based on AMC’s ownership of the AOG entities and special allocations for preferred units corresponding to the Preferred Stock.entities. As such, our effective tax rate will be directly impacted by changes in AMC’s ownership of the AOG entities and changes to statutory rates in the United StatesU.S. and other non-U.S.foreign jurisdictions and, to a lesser extent, income taxes that are recorded for certain affiliated funds and co-investment entitiesvehicles that are consolidated in our financial results.
The majority of our Consolidated Funds are not subject to income tax as the funds’ investors are responsible for reporting their share of income or loss. To the extent required by federal, state and foreign income tax laws and regulations, certain funds may incur income tax liabilities.
Redeemable and Non-Controlling Interests.Interests
Net income (loss) attributable to redeemable and non-controlling interests in Consolidated Funds represents the income (loss) relatedattributable to ownership interests that third parties hold in entities that are consolidated intowithin our consolidated financial statements.
Net income (loss) attributable to redeemable and non-controlling interests in AOG entities represents income (loss)results attributable to the owners of AOG Units and other ownership interests that are not held by AMC.
In connection with theour acquisition of SSG Acquisition,in July 2020, the former owners of SSG retained ana 20% ownership interest in certaina subsidiary of an AOG entitiesentity that is reflected as redeemable interestsinterest in AOG entities. Net lossincome (loss) attributable to redeemable interest in AOG entities is allocated based on the ownership percentageattributable to the redeemable interest. On March 31, 2023, we acquired a portion of the remaining ownership interest in SSG that was retained by the former owners of SSG (the “SSG Buyout”), and we now own 100% of Ares SSG’s fee-generating business. Following the SSG Buyout, legacy owners of SSG retained an ownership interest in certain non-controlled investments that will continue to be reflected as redeemable interests, and the income generated by these investments will continue to be allocated ratably based on ownership.
For additional discussion on components of our consolidated results of operations, see “Note 2. Summary of Significant Accounting Policies,” towithin our audited consolidated financial statements included in this Annual Report on Form 10-K.
Consolidation and Deconsolidation of Ares Funds
Consolidated Funds represented approximately 4% of our AUM as of December 31, 2023, 2% of our management fees and 2% of our carried interest and incentive fees for the year ended December 31, 2023. As of December 31, 2023, we consolidated 28 CLOs, 10 private funds and one SPAC, and as of December 31, 2022, we consolidated 25 CLOs, 10 private funds and one SPAC.
The activity of the Consolidated Funds is reflected within the consolidated financial statement line items indicated by reference thereto. The impact of consolidation also typically will decrease management fees, carried interest allocation and incentive fees reported under GAAP to the extent these amounts are eliminated upon consolidation.
The assets and liabilities of our Consolidated Funds are held within separate legal entities and, as a result, the liabilities of our Consolidated Funds are typically non-recourse to us. Generally, the consolidation of our Consolidated Funds has a significant gross-up effect on our assets, liabilities and cash flows but has no net effect on the net income attributable to us or our stockholders’ equity, except where accounting for a redemption or liquidation preference requires the reallocation of ownership based on specific terms of a profit sharing agreement. The net economic ownership interests of our Consolidated Funds, to which we have no economic rights, are reflected as redeemable and non-controlling interests in the Consolidated Funds within our consolidated financial statements. Redeemable interest in Consolidated Funds represent the shares issued by our SPACs that are redeemable for cash by the public shareholders in the event that the SPAC does not complete a business combination or tender offer associated with shareholder approval provisions.
We generally deconsolidate funds and CLOs when we are no longer deemed to have a controlling interest in the entity. During the year ended December 31, 2023, we deconsolidated one SPAC as a result of liquidation and one private fund as a result of a significant change in ownership. During the year ended December 31, 2022, we did not deconsolidate any entities.
The performance of our Consolidated Funds is not necessarily consistent with, or representative of, the combined performance trends of all of our funds.
For the actual impact that consolidation had on our results and further discussion on consolidation and deconsolidation of funds, see “Note 15. Consolidation” within our consolidated financial statements included herein.
Results of Operations
Consolidated Results of Operations
We consolidate funds where we are deemed to hold a controlling financial interest. The Consolidated Funds are not necessarilyAlthough the same entities in each yearconsolidated results presented due to changes in ownership, changes in limited partners' rights, andbelow include the creation and terminationresults of funds. The consolidation of these funds had no effect on net income attributable to us for the periods presented. As such, we separate the analysisour operations together with those of the Consolidated Funds and evaluate that activity in total. The following table and discussion sets forth information regardingother joint ventures, we separate our consolidated resultsanalysis of operations:those items primarily impacting the Company from those of the Consolidated Funds.
| | | | | | | | | | | | | | | | | | | | | | | | | | | | | | | |
| | | | | | | |
| | | | | Year ended December 31, | | Favorable (Unfavorable) |
| ($ in thousands) | | | | | | | | | 2020 | | 2019 | | $ Change | | % Change |
| Revenues | | | | | | | | | | | | | | | |
| Management fees (includes ARCC Part I Fees of $184,141 and $164,396 for the years ended December 31, 2020 and 2019, respectively) | | | | | | | | | $ | 1,150,608 | | | $ | 979,417 | | | $ | 171,191 | | | 17 | % |
| Carried interest allocation | | | | | | | | | 505,608 | | | 621,872 | | | (116,264) | | | (19) |
| Incentive fees | | | | | | | | | 37,902 | | | 69,197 | | | (31,295) | | | (45) |
| Principal investment income | | | | | | | | | 28,552 | | | 56,555 | | | (28,003) | | | (50) |
| Administrative, transaction and other fees | | | | | | | | | 41,376 | | | 38,397 | | | 2,979 | | | 8 |
| Total revenues | | | | | | | | | 1,764,046 | | | 1,765,438 | | | (1,392) | | | 0 |
| Expenses | | | | | | | | | | | | | | | |
| Compensation and benefits | | | | | | | | | 767,252 | | | 653,352 | | | (113,900) | | | (17) |
| Performance related compensation | | | | | | | | | 404,116 | | | 497,181 | | | 93,065 | | | 19 |
| General, administrative and other expenses | | | | | | | | | 258,999 | | | 270,219 | | | 11,220 | | | 4 |
| | | | | | | | | | | | | | | |
| Expenses of Consolidated Funds | | | | | | | | | 20,119 | | | 42,045 | | | 21,926 | | | 52 |
| Total expenses | | | | | | | | | 1,450,486 | | | 1,462,797 | | | 12,311 | | | 1 |
| Other income (expense) | | | | | | | | | | | | | | | |
| Net realized and unrealized gains (losses) on investments | | | | | | | | | (9,008) | | | 9,554 | | | (18,562) | | | NM |
| Interest and dividend income | | | | | | | | | 8,071 | | | 7,506 | | | 565 | | | 8 |
| Interest expense | | | | | | | | | (24,908) | | | (19,671) | | | (5,237) | | | (27) |
| Other income (expense), net | | | | | | | | | 11,291 | | | (7,840) | | | 19,131 | | | NM |
| Net realized and unrealized gains (losses) on investments of Consolidated Funds | | | | | | | | | (96,864) | | | 15,136 | | | (112,000) | | | NM |
| Interest and other income of Consolidated Funds | | | | | | | | | 463,652 | | | 395,599 | | | 68,053 | | | 17 |
| Interest expense of Consolidated Funds | | | | | | | | | (286,316) | | | (277,745) | | | (8,571) | | | (3) |
| Total other income | | | | | | | | | 65,918 | | | 122,539 | | | (56,621) | | | (46) |
| Income before taxes | | | | | | | | | 379,478 | | | 425,180 | | | (45,702) | | | (11) |
| Income tax expense | | | | | | | | | 54,993 | | | 52,376 | | | (2,617) | | | (5) |
| Net income | | | | | | | | | 324,485 | | | 372,804 | | | (48,319) | | | (13) |
| Less: Net income attributable to non-controlling interests in Consolidated Funds | | | | | | | | | 28,085 | | | 39,704 | | | (11,619) | | | (29) |
| Net income attributable to Ares Operating Group entities | | | | | | | | | 296,400 | | | 333,100 | | | (36,700) | | | (11) |
| Less: Net loss attributable to redeemable interest in Ares Operating Group entities | | | | | | | | | (976) | | | — | | | (976) | | | NM |
| Less: Net income attributable to non-controlling interests in Ares Operating Group entities | | | | | | | | | 145,234 | | | 184,216 | | | (38,982) | | | (21) |
| Net income attributable to Ares Management Corporation | | | | | | | | | 152,142 | | | 148,884 | | | 3,258 | | | 2 |
| Less: Series A Preferred Stock dividends paid | | | | | | | | | 21,700 | | | 21,700 | | | — | | | — |
| Net income attributable to Ares Management Corporation Class A common stockholders | | | | | | | | | $ | 130,442 | | | $ | 127,184 | | | 3,258 | | | 3 |
| | | | | | | | | | | | | | | | | | | | | | | | | | | | | | | |
| | | | | | | |
| | | | | Year ended December 31, | | Favorable (Unfavorable) |
| | | | | | | | | 2023 | | 2022 | | $ Change | | % Change |
| Total revenues | | | | | | | | | $ | 3,631,884 | | | $ | 3,055,443 | | | $ | 576,441 | | | 19% |
| Total expenses | | | | | | | | | (2,797,858) | | | (2,749,085) | | | (48,773) | | | (2) |
| Total other income, net | | | | | | | | | 499,037 | | | 204,448 | | | 294,589 | | | 144 |
| | | | | | | | | | | | | | | |
| Less: Income tax expense | | | | | | | | | 172,971 | | | 71,891 | | | (101,080) | | | (141) |
| Net income | | | | | | | | | 1,160,092 | | | 438,915 | | | 721,177 | | | 164 |
| Less: Net income attributable to non-controlling interests in Consolidated Funds | | | | | | | | | 274,296 | | | 119,333 | | | 154,963 | | | 130 |
| Net income attributable to Ares Operating Group entities | | | | | | | | | 885,796 | | | 319,582 | | | 566,214 | | | 177 |
| Less: Net income (loss) attributable to redeemable interest in Ares Operating Group entities | | | | | | | | | 226 | | | (851) | | | 1,077 | | | NM |
| Less: Net income attributable to non-controlling interests in Ares Operating Group entities | | | | | | | | | 411,244 | | | 152,892 | | | 258,352 | | | 169 |
| | | | | | | | | | | | | | | |
| | | | | | | | | | | | | | | |
| | | | | | | | | | | | | | | |
| Net income attributable to Ares Management Corporation Class A and non-voting common stockholders | | | | | | | | | $ | 474,326 | | | $ | 167,541 | | | 306,785 | | | 183 |
NM - Not Meaningful
Year Ended December 31, 20202023 Compared to Year Ended December 31, 20192022
Consolidation and Deconsolidation of Ares Funds
Consolidated ResultsFunds represented approximately 4% of Operationsour AUM as of the Company
Management Fees. TotalDecember 31, 2023, 2% of our management fees increased by $171.2 million, or 17%,and 2% of our carried interest and incentive fees for the year ended December 31, 2020 compared2023. As of December 31, 2023, we consolidated 28 CLOs, 10 private funds and one SPAC, and as of December 31, 2022, we consolidated 25 CLOs, 10 private funds and one SPAC.
The activity of the Consolidated Funds is reflected within the consolidated financial statement line items indicated by reference thereto. The impact of consolidation also typically will decrease management fees, carried interest allocation and incentive fees reported under GAAP to the extent these amounts are eliminated upon consolidation.
The assets and liabilities of our Consolidated Funds are held within separate legal entities and, as a result, the liabilities of our Consolidated Funds are typically non-recourse to us. Generally, the consolidation of our Consolidated Funds has a significant gross-up effect on our assets, liabilities and cash flows but has no net effect on the net income attributable to us or our stockholders’ equity, except where accounting for a redemption or liquidation preference requires the reallocation of ownership based on specific terms of a profit sharing agreement. The net economic ownership interests of our Consolidated Funds, to which we have no economic rights, are reflected as redeemable and non-controlling interests in the Consolidated Funds within our consolidated financial statements. Redeemable interest in Consolidated Funds represent the shares issued by our SPACs that are redeemable for cash by the public shareholders in the event that the SPAC does not complete a business combination or tender offer associated with shareholder approval provisions.
We generally deconsolidate funds and CLOs when we are no longer deemed to have a controlling interest in the entity. During the year ended December 31, 2019. The increases were primarily due to the Credit Group, driven by an increase2023, we deconsolidated one SPAC as a result of liquidation and one private fund as a result of a significant change in ARCC Part I Fees and by higher FPAUM fromcapital deployments in direct lending funds. Management fees increased by $33.2 million in connection with the SSG Acquisition. For detail regarding the fluctuations of management fees within each of our segments see “—Results of Operations by Segment.”
Carried Interest Allocation. Carried interest allocation decreased by $116.3 million, or 19%, forownership. During the year ended December 31, 2020 compared to the year ended December 31, 2019. 2022, we did not deconsolidate any entities.
The activity was principally composedperformance of our Consolidated Funds is not necessarily consistent with, or representative of, the following:combined performance trends of all of our funds.
| | | | | | | | | | | | | | | | | |
| | | | | |
| | | | | |
| | | | | |
| | | | | |
| | | | | |
| | | | | |
| | | | | |
| ($ in millions) | Year ended December 31, 2020 | Primary Drivers | | Year ended December 31, 2019 | Primary Drivers |
| Credit funds | $ | 146.3 | | Four direct lending funds and one alternative credit fund with $12.0 billion of IGAUM generating returns in excess of their hurdle rates, primarily from: Ares Private Credit Solutions, L.P. ("PCS") and Ares Capital Europe IV, L.P. ("ACE IV") generated carried interest allocation of $48.9 million and $51.5 million, respectively, driven by net investment income on an increasing invested capital base. Net investment income for the year was muted by net unrealized losses on investments that were primarily incurred during the first quarter of 2020 due to the market volatility driven by the COVID-19 pandemic. In addition, an alternative credit fund generated carried interest allocation of $16.0 million primarily driven by net investment income during the period. | | $ | 129.5 | | 10 direct lending funds with $11.2 billion of IGAUM generating returns in excess of their hurdle rates, primarily from PCS, ACE IV and Ares Capital Europe III, L.P. ("ACE III") that generated $30.6 million, $48.6 million and $30.1 million of carried interest allocation during the period, respectively. PCS and ACE IV generated carried interest allocation primarily due to increasing deployment, while ACE III is now past its investment period and the carried interest allocation it generated was primarily driven by a performing portfolio. |
| Private equity funds | 304.7 | | Ares Corporate Opportunities Fund IV, L.P. ("ACOF IV") generated carried interest allocation of $285.7 million primarily due to market appreciation of its investment in The AZEK Company (“AZEK”) following its initial public offering. In addition, market appreciation across several investments generated carried interest allocation of $102.6 million for Ares Special Opportunities Fund, L.P. (“ASOF”). Market depreciation across several energy sector investments led to the reversal of unrealized carried interest allocation of $75.1 million for Ares Corporate Opportunities Fund V, L.P. (“ACOF V”). | | 416.5 | | Market appreciation of Ares Corporate Opportunities Fund III, L.P.'s (“ACOF III”) investments in Floor & Decor (“FND”) and a professional services company; increased fair value of ACOF IV’s investment in National Veterinary Associates (“NVA”) in connection with the pending sale of the company which closed in the first quarter of 2020; and market appreciation across several ACOF IV and ACOF V portfolio companies. |
| Real estate funds | 54.6 | | Market appreciation from properties within real estate equity funds primarily driven by gains generated across several industrial and multi-family assets of US Real Estate Fund IX, L.P. ("US IX") in the amount of $19.9 million. In addition, there were gains generated in multiple funds from the sale of a pan-European logistics portfolio at a higher price than the December 31, 2019 valuation. | | 75.9 | | Market appreciation from multiple properties within six of our U.S. real estate equity funds, EF IV and five European real estate equity funds. |
| | | | | |
| Carried interest allocation | $ | 505.6 | | | | $ | 621.9 | | |
Incentive Fees. Incentive fees decreased by $31.3 million, or 45%, for the year ended December 31, 2020 compared to the year ended December 31, 2019. The activity was principally composed of the following:
| | | | | | | | | | | | | | | | | |
| | | | | |
| | | | | |
| | | | | |
| | | | | |
| | | | | |
| ($ in millions) | Year ended December 31, 2020 | Primary Drivers | | Year ended December 31, 2019 | Primary Drivers |
| Credit funds | $ | 37.1 | | Seven direct lending funds and two alternative credit funds with incentive fees that crystallized during the period. The number of funds was affected by the overall economic environment during the year. | | $ | 67.6 | | 16 direct lending funds with incentive fees that crystallized during the period. |
| Real estate funds | 0.8 | | Incentive fees generated from ACRE. | | 1.6 | | Incentive fees generated from ACRE. |
| Incentive fees | $ | 37.9 | | | | $ | 69.2 | | |
Principal Investment Income. Principal investment income decreased by $28.0 million, or 50%, for the year ended December 31, 2020 compared to the year ended December 31, 2019. The COVID-19 pandemic caused extreme market volatility during 2020. The global equity and credit markets experienced significant downturns in the first quarter of 2020 due to the COVID-19 pandemic that were largely, but not fully, offset by a recovery in the remainder of the year. The year ended December 31, 2020 also included gains from a higher fair value of our investments in ACOF IV, primarily driven by higher asset appreciation of AZEK recognized in connection with the partial sale, and in an infrastructure and power fund, primarily from higher asset appreciation and subsequent sale of an investment in a wind project. The year ended December 31, 2019 included gains from a higher fair value of our investment in ACOF IV largely driven by higher asset appreciation of NVA recognized in connection with the pending sale of the company that closed in the first quarter of 2020. The year ended December 31, 2019 also included gains from a higher fair value of our investment in ACOF III predominantly from the market appreciation of FND.
Administrative, Transaction and Other Fees. Administrative, transaction and other fees increased by $3.0 million, or 8%, for the year ended December 31, 2020 compared to the year ended December 31, 2019. The increase during the current year was primarily driven by higher administrative fees for certain funds in our Credit Group that increased with invested capital.
Compensation and Benefits. Compensation and benefits increased by $113.9 million, or 17%, for the year ended December 31, 2020 compared to the year ended December 31, 2019. The increase was primarily driven by headcount growth, merit increases and equity compensation increases for the comparative period. Average headcount for the 2020 increased by 19% to 1,364 professionals from 1,145 professionals in 2019.
Equity compensation expense increased by $25.3 million for the year ended December 31, 2020 compared to the year ended December 31, 2019 primarily due to an increase from discretionary merit-based awards of $17.0 million for the year ended December 31, 2020. Restricted units awarded as part of the annual bonus program increased expense by $11.4 million for the year ended December 31, 2020, driven by headcount growth and a reduction in service period from four years to three years for awards granted beginning in 2019. The change in service period resulted in the current year reflecting two years of higher expenses associated with the reduced vesting period compared to one year in 2019. The year ended December 31, 2020 also included $6.1 million of accelerated expense from the vesting of restricted units granted to our Chief Executive Officer as a result of achieving both of the applicable performance conditions. Finally, the final vesting of awards issued in connection with our initial public offering occurred during the second quarter of 2019, reducing equity compensation expense by $8.2 million.
For detail regarding the fluctuations of compensation and benefits within each of our segments see “—Results of Operations by Segment."
Performance Related Compensation. Performance related compensation decreased by $93.1 million, or 19%, for the year ended December 31, 2020 compared to the year ended December 31, 2019. Changes in performance related compensation are directly associated with the changes in carried interest allocation and incentive fees described above.
General, Administrative and Other Expenses. General, administrative and other expenses decreased by $11.2 million, or 4%, for the year ended December 31, 2020 compared to the year ended December 31, 2019. The year ended December 31, 2020 was impacted by the COVID-19 pandemic and resulted in a decrease in certain operating expenses. During the last nine months of 2020, our operating expenses were impacted by limitations in certain business activities, most notably travel, entertainment and marketing sponsorships, and by certain office services and fringe benefits from the modified remote working
environment. Collectively, these expenses decreased by $19.9 million for the nine months ended December 31, 2020, when compared to the same period in 2019. While the timing of recovery is uncertain, we expect that future periods will continue to be impacted similarly until we return to pre-pandemic working conditions.
Expense decreased by $5.5 million pertaining to an SEC matter related to certain of our compliance policies and procedures. During the fourth quarter of 2019, we recorded $6.5 million of costs pertaining to this matter. During the first half of 2020, we recorded another $1.0 million of net expenses that included costs associated with professional fees and a civil penalty of $1.0 million, offset by insurance proceeds we received of $2.5 million.
Certain expenses have also increased during the current period, including occupancy costs to support our growing headcount, information services and information technology to support the expansion of our business and our modified remote working environment. Collectively, these expenses increased by $11.4 million for the year ended December 31, 2020 when compared to the same period in 2019. In addition, there was an increase of $6.5 million in one-time expenses that were recorded in 2020 that primarily related to expense concessions made to a limited number of funds.
The increase was further driven by a net increase of $1.3 million in amortization expense incurred in 2020 when compared to 2019. In 2020, we recorded amortization expense of $22.8 million related to the intangible assets acquired as part of the purchase of CLO collateral management agreements from Crestline Denali Capital LLC during the first quarter of 2020 and the SSG Acquisition during the second half of 2020. During the third quarter of 2019, a non-cash impairment charge of $20.0 million was recognized related to certain intangible assets that were recorded as part of our acquisition of the Energy Investors Funds.
Net Realized and Unrealized Gains (Losses) on Investments. Net realized and unrealized gains (losses) on investments decreased by $18.6 million to a $9.0 million loss for the year ended December 31, 2020 compared to the year ended December 31, 2019. The activity for the year ended December 31, 2020 was primarily attributable to unrealized losses recognized on certain strategic initiative related investments and an unrealized loss from market depreciation of properties held by AREA Sponsor Holdings LLC. The activity in the prior year was primarily attributable to net gains from CLO securities that rebounded from the market dislocation at the end of 2018 and from our foreign currency forward contracts to hedge against foreign currency exchange rate risk on certain non-U.S. dollar denominated cash flows.
Interest Expense. Interest expense increased by $5.2 million, or 27%, for the year ended December 31, 2020 compared to the year ended December 31, 2019. The issuance of the 2030 Senior Notes late in the second quarter of 2020 increased interest expense by $7.3 million for the year ended December 31, 2020. The increase was partially offset by a lower average outstanding balance of the Credit Facility during 2020 when compared to 2019.
Other Income (Expense), Net. Other income (expense), net is principally composed of transaction gains (losses) associated with currency fluctuations for our businesses domiciled outside of the U.S. and is based on the fluctuations in currency rates primarily between the U.S. dollar against the British pound and the Euro.
Income Tax Expense Income tax expense increased by $2.6 million, or 5%, for the year ended December 31, 2020 compared to the year ended December 31, 2019.The change in the comparative period is primarily a result of an increase in taxable net income allocable to AMC. The weighted average daily ownership for AMC common stockholders increased from 48.0% for the year ended December 31, 2019 to 54.0% for the year ended December 31, 2020. The increases were primarily driven by the issuance of Class A common stock in connection with stock option exercises, vesting of restricted stock awards, issuance of stock in connection with the SSG Acquisition and by our Offering that occurred after December 31, 2019.
Redeemable and Non-Controlling Interests. Net income (loss) attributable to redeemable and non-controlling interests in AOG entities represents results attributable to the owners of AOG Units that are not held by AMC. In connection with the SSG Acquisition, the former owners of SSG retained an ownership interest in certain AOG entities that is reflected as redeemable interest in AOG entities. Net loss attributable to redeemable interest in AOG entities is allocated based on the ownership percentage for periods presented.
Net income (loss) attributable to non-controlling interests in AOG entities is generally allocated based on the weighted average daily ownership of the other AOG unitholders, except for income (loss) generated from certain joint venture partnerships. Net income (loss) is allocated to other strategic distribution partners with whom we have established joint ventures based on the respective ownership percentages and to Crestline Denali Class B membership interests based on the activity of those financial interests. For the year ended December 31, 2020, net income of $0.5 million was allocated to the Crestline Denali Class B membership interests related to the gains from those CLO securities held.
Net income attributable to non-controlling interests in Ares Operating Group entities decreased by $39.0 million, or 21%, for the year ended December 31, 2020 compared to the year ended December 31, 2019. The change in the comparative period is a result of the respective changes in income before taxes and weighted average daily ownership. The weighted average daily ownership for the non-controlling AOG unitholders decreased from 52.0% for the year ended December 31, 2019 to 46.0% for the year ended December 31, 2020.
Consolidated Results of Operations
Although the consolidated results presented below include the results of our operations together with those of the Consolidated Funds and other joint ventures, we separate our analysis of those items primarily impacting the Company from those of the Consolidated Funds.
The following table presents theour summarized consolidated results of operations of the Consolidated Funds:($ in thousands):
| | | | | | | | | | | | | | | | | | | | | | | | | | | | | | | |
| | | | | | | |
| | | | | Year ended December 31, | | Favorable (Unfavorable) |
| | | | | | | | | 2023 | | 2022 | | $ Change | | % Change |
| Total revenues | | | | | | | | | $ | 3,631,884 | | | $ | 3,055,443 | | | $ | 576,441 | | | 19% |
| Total expenses | | | | | | | | | (2,797,858) | | | (2,749,085) | | | (48,773) | | | (2) |
| Total other income, net | | | | | | | | | 499,037 | | | 204,448 | | | 294,589 | | | 144 |
| | | | | | | | | | | | | | | |
| Less: Income tax expense | | | | | | | | | 172,971 | | | 71,891 | | | (101,080) | | | (141) |
| Net income | | | | | | | | | 1,160,092 | | | 438,915 | | | 721,177 | | | 164 |
| Less: Net income attributable to non-controlling interests in Consolidated Funds | | | | | | | | | 274,296 | | | 119,333 | | | 154,963 | | | 130 |
| Net income attributable to Ares Operating Group entities | | | | | | | | | 885,796 | | | 319,582 | | | 566,214 | | | 177 |
| Less: Net income (loss) attributable to redeemable interest in Ares Operating Group entities | | | | | | | | | 226 | | | (851) | | | 1,077 | | | NM |
| Less: Net income attributable to non-controlling interests in Ares Operating Group entities | | | | | | | | | 411,244 | | | 152,892 | | | 258,352 | | | 169 |
| | | | | | | | | | | | | | | |
| | | | | | | | | | | | | | | |
| | | | | | | | | | | | | | | |
| Net income attributable to Ares Management Corporation Class A and non-voting common stockholders | | | | | | | | | $ | 474,326 | | | $ | 167,541 | | | 306,785 | | | 183 |
| | | | | | | | | | | | | | | | | | | | | | | | | | | | | | | | | | | | | | |
| | | | | | | | | | | | | | | |
| | | | | | Year ended December 31, | | | | Favorable (Unfavorable) | | |
| ($ in thousands) | | | | | | | | | | 2020 | | 2019 | | | | $ Change | | % Change | | | | |
| Expenses of the Consolidated Funds | | | | | | | | | | $ | (20,119) | | | $ | (42,045) | | | | | $ | 10,746 | | | 35 | % | | | | |
| Net realized and unrealized gains (losses) on investments of Consolidated Funds | | | | | | | | | | (96,864) | | | 15,136 | | | | | (112,000) | | | NM | | | | |
| Interest and other income of Consolidated Funds | | | | | | | | | | 463,652 | | | 395,599 | | | | | 68,053 | | | 17 | | | | |
| Interest expense of Consolidated Funds | | | | | | | | | | (286,316) | | | (277,745) | | | | | (8,571) | | | (3) | | | | |
| Income before taxes | | | | | | | | | | 60,353 | | | 90,945 | | | | | (30,592) | | | (34) | | | | |
| Income tax benefit (expense) of Consolidated Funds | | | | | | | | | | (118) | | | 530 | | | | | (648) | | | NM | | | | |
| Net income | | | | | | | | | | 60,235 | | | 91,475 | | | | | (31,240) | | | (34) | | | | |
| Less: Revenues attributable to Ares Management Corporation eliminated upon consolidation | | | | | | | | | | 36,725 | | | 49,177 | | | | | (12,452) | | | (25) | | | | |
| Less: Other income (expense), net attributable to Ares Management Corporation eliminated upon consolidation | | | | | | | | | | (4,575) | | | 2,594 | | | | | (7,169) | | | NM | | | | |
| Net income attributable to non-controlling interests in Consolidated Funds | | | | | | | | | | $ | 28,085 | | | $ | 39,704 | | | | | (11,619) | | | (29) | | | | |
NM - Not Meaningful
The results of operations of the Consolidated Funds primarily represents activity from certain CLOs that we are deemed to control. Expenses primarily reflect professional fees that were incurred as a result of debt issuance costs related to the issuance of new CLOs. These fees were expensed in the period incurred, as CLO debt is recorded at fair value on our Consolidated Statements of Financial Condition. For the year endedYear Ended December 31, 2020, the expenses were primarily driven by the issuance of two new European CLOs. For the year ended2023Compared to Year Ended December 31, 2019, the expenses were primarily driven by the issuance of two European CLOs and three U.S. CLOs. Net realized and unrealized gains fluctuated for the comparative period, primarily due to a significant change in the value of loans held by the CLOs. The CSLLI returned 2.8% for the year-to-date period for 2020 when compared to 8.2% for the year-to-date period for 2019. The increase in interest and other income and in interest expense was attributable to the net increase of five CLOs that we began consolidating subsequent to December 31, 2019 and to the increased size of the assets and liabilities of recent CLOs launched, resulting in additional interest paying loans and interest expense from debt issued.
2022
Revenues and other income (expense) attributable to AMC represents management fees, incentive fees, principal investment income and administrative, transaction and other fees that are eliminated from the respective components of AMC's results upon consolidation. The decrease for the comparative period for other income (expense), principal investment income and incentive fees was primarily due to the price fluctuations associated with the COVID-19 pandemic previously mentioned. The decrease was partially offset by management fees that increased due to the net increase of six consolidated CLOs and private funds and to administrative fees that increased due to the renegotiation of an administrative fee agreement with ACF during the third quarter of 2019. The renegotiated administration fee allowed for more operating expenses to be reimbursed to us by the fund but eliminated the management fee paid by the fund.
Consolidation and Deconsolidation of Ares Funds
Consolidated Funds represented approximately 7%4% of our AUM as of December 31, 2020, 4%2023, 2% of our management fees and less than 1%2% of our carried interest and incentive fees for the year ended December 31, 2020.2023. As of December 31, 2020,2023, we consolidated 2128 CLOs, and nine10 private funds and one SPAC, and as of December 31, 2019,2022, we consolidated 1625 CLOs, 10 private funds and eight private funds.one SPAC.
The activity of the Consolidated Funds is reflected within the consolidated financial statement line items indicated by reference thereto. The impact of the Consolidated Fundsconsolidation also typically will decrease management fees, carried interest allocation and incentive fees reported under GAAP to the extent these amounts are eliminated upon consolidation.
The assets and liabilities of our Consolidated Funds are held within separate legal entities and, as a result, the liabilities of our Consolidated Funds are typically non-recourse to us. Generally, the consolidation of our Consolidated Funds has a significant gross-up effect on our assets, liabilities and cash flows but has no net effect on the net income attributable to us or our stockholders' equity.stockholders’ equity, except where accounting for a redemption or liquidation preference requires the reallocation of ownership based on specific terms of a profit sharing agreement. The net economic ownership interests of our Consolidated Funds, to which we have no economic rights, are reflected as redeemable and non-controlling interests in the Consolidated Funds inwithin our consolidated financial statements. Redeemable interest in Consolidated Funds represent the shares issued by our SPACs that are redeemable for cash by the public shareholders in the event that the SPAC does not complete a business combination or tender offer associated with shareholder approval provisions.
We generally deconsolidate funds and CLOs when we are no longer deemed to have a controlling interest in the entity. During the year ended December 31, 2020,2023, we deconsolidated one entity was liquidated/dissolvedSPAC as a result of liquidation and one CLO experiencedprivate fund as a result of a significant change in ownership that resulted in deconsolidation of the entity during the period.ownership. During the year ended December 31, 2019, two entities were liquidated/dissolved and two entities experienced a significant change in ownership that resulted in deconsolidation of the fund or CLO during the period.2022, we did not deconsolidate any entities.
The performance of our Consolidated Funds is not necessarily consistent with, or representative of, the combined performance trends of all of our funds.
For the actual impact that consolidation had on our results and further discussion on consolidation and deconsolidation of funds, see “Note 16.15. Consolidation” towithin our consolidated financial statements included herein.
Results of Operations
Consolidated Results of Operations
Although the consolidated results presented below include the results of our operations together with those of the Consolidated Funds and other joint ventures, we separate our analysis of those items primarily impacting the Company from those of the Consolidated Funds.
The following table presents our summarized consolidated results of operations ($ in thousands):
| | | | | | | | | | | | | | | | | | | | | | | | | | | | | | | |
| | | | | | | |
| | | | | Year ended December 31, | | Favorable (Unfavorable) |
| | | | | | | | | 2023 | | 2022 | | $ Change | | % Change |
| Total revenues | | | | | | | | | $ | 3,631,884 | | | $ | 3,055,443 | | | $ | 576,441 | | | 19% |
| Total expenses | | | | | | | | | (2,797,858) | | | (2,749,085) | | | (48,773) | | | (2) |
| Total other income, net | | | | | | | | | 499,037 | | | 204,448 | | | 294,589 | | | 144 |
| | | | | | | | | | | | | | | |
| Less: Income tax expense | | | | | | | | | 172,971 | | | 71,891 | | | (101,080) | | | (141) |
| Net income | | | | | | | | | 1,160,092 | | | 438,915 | | | 721,177 | | | 164 |
| Less: Net income attributable to non-controlling interests in Consolidated Funds | | | | | | | | | 274,296 | | | 119,333 | | | 154,963 | | | 130 |
| Net income attributable to Ares Operating Group entities | | | | | | | | | 885,796 | | | 319,582 | | | 566,214 | | | 177 |
| Less: Net income (loss) attributable to redeemable interest in Ares Operating Group entities | | | | | | | | | 226 | | | (851) | | | 1,077 | | | NM |
| Less: Net income attributable to non-controlling interests in Ares Operating Group entities | | | | | | | | | 411,244 | | | 152,892 | | | 258,352 | | | 169 |
| | | | | | | | | | | | | | | |
| | | | | | | | | | | | | | | |
| | | | | | | | | | | | | | | |
| Net income attributable to Ares Management Corporation Class A and non-voting common stockholders | | | | | | | | | $ | 474,326 | | | $ | 167,541 | | | 306,785 | | | 183 |
Year Ended December 31, 2023Compared to Year Ended December 31, 2022
Consolidated Results of Operations of the Company
The following discussion sets forth information regarding our consolidated results of operations:
Revenues
| | | | | | | | | | | | | | | | | | | | | | | | | | | | | | | |
| | | | | Year ended December 31, | | Favorable (Unfavorable) |
| | | | | | | | | 2023 | | 2022 | | $ Change | | % Change |
| Revenues | | | | | | | | | | | | | | | |
| Management fees | | | | | | | | | $ | 2,551,150 | | | $ | 2,136,433 | | | $ | 414,717 | | | 19% |
| Carried interest allocation | | | | | | | | | 618,579 | | | 458,012 | | | 160,567 | | | 35 |
| Incentive fees | | | | | | | | | 276,627 | | | 301,187 | | | (24,560) | | | (8) |
| Principal investment income | | | | | | | | | 36,516 | | | 12,279 | | | 24,237 | | | 197 |
| Administrative, transaction and other fees | | | | | | | | | 149,012 | | | 147,532 | | | 1,480 | | | 1 |
| Total revenues | | | | | | | | | $ | 3,631,884 | | | $ | 3,055,443 | | | 576,441 | | | 19 |
Management Fees. Capital deployment in direct lending funds within the Credit Group led to a rise in FPAUM and additional management fees of $166.1 million for the year ended December 31, 2023 compared to the prior year. Part I Fees contributed $109.6 million to the increase for the year ended December 31, 2023 compared to the prior year. The increase in Part I Fees was primarily due to the increase in pre-incentive fee net investment income generated by ARCC and CADC, driven by an increase in the average size of their portfolios and the impact of rising interest rates, given their primarily floating-rate loan portfolios. Of the total increase in Part I Fees, ASIF contributed $5.1 million as it began generating fees during the third quarter of 2023. Within the Real Assets Group, AIREIT and AREIT contributed additional management fees of $11.4 million for theyear ended December 31, 2023compared to the year ended December 31, 2022 driven by increases in the average capital base of AIREIT and AREIT. Also, management fees from Ares Infrastructure Debt Fund V L.P. (“IDF V”) increased by $9.3 million for theyear ended December 31, 2023 compared to the prior year, primarily driven by deployment of capital. Within the Private Equity Group, the Crescent Point Acquisition contributed $7.4 million to the increase in management fees for the year ended December 31, 2023. For detail regarding the fluctuations of management fees within each of our segments see “—Results of Operations by Segment.”
Carried Interest Allocation. The activity was principally composed of the following ($ in millions):
| | | | | | | | | | | | | | |
| | | | |
| | | | |
| | | | |
| | | | |
| | | | |
| | | | |
| | | | |
| | | | |
| Year ended December 31, 2023 | Primary Drivers | Year ended December 31, 2022 | Primary Drivers |
| Credit funds | $ | 498.7 | | Primarily from six direct lending funds and one alternative credit fund with $28.2 billion of IGAUM generating returns in excess of their hurdle rates. Ares Capital Europe V, L.P. (“ACE V”), Ares Private Credit Solutions II, L.P. (“PCS II”), Ares Sports Media and Entertainment Finance, L.P. and our sixth European direct lending fund generated carried interest allocation of $181.1 million, $37.6 million, $22.0 million and $16.6 million, respectively, driven by net investment income on an increasing invested capital base. Pathfinder I generated carried interest allocation of $66.3 million driven by market appreciation of certain investments and net investment income during the period. Ares Capital Europe IV, L.P. (“ACE IV”) and Ares Private Credit Solutions, L.P. (“PCS I”) generated carried interest allocation of $58.4 million and $45.3 million, respectively, primarily driven by net investment income during the period. Our credit funds have benefited from rising interest rates on predominately floating-rate loans. | $ | 200.0 | | Primarily from four direct lending funds and one alternative credit fund with $22.4 billion of IGAUM generating returns in excess of their hurdle rates. ACE V generated carried interest allocation of $80.9 million driven by net investment income on an increasing invested capital base. ACE IV, Pathfinder I, Ares Capital Europe III, L.P. (“ACE III”) and PCS I generated carried interest allocation of $60.0 million, $25.7 million, $18.7 million and $6.5 million, respectively, primarily driven by net investment income during the period. |
| Private equity funds | 124.6 | | Ares Corporate Opportunities Fund VI, L.P. (“ACOF VI”) generated carried interest allocation of $190.0 million, driven by improving operating performance of portfolio companies that primarily operate in the retail and healthcare industries and market appreciation of an investment in a services company. In addition, appreciation of Ares Special Opportunities Fund, L.P. (“ASOF I”) and Ares Special Situations Fund IV, L.P. (“SSF IV”) generated carried interest allocation of $82.7 million and $79.8 million, respectively, predominately driven by market appreciation and improved operating performance of portfolio companies that operate in the services industry. Ares Special Opportunities Fund II, L.P. (“ASOF II”) generated carried interest allocation of $80.9 million, driven by improving operating performance of portfolio companies that operate in the healthcare industry. The appreciation was partially offset by the reversal of unrealized carried interest allocation of $268.1 million from Ares Corporate Opportunities Fund V, L.P. (“ACOF V”), primarily driven by a lower stock price for Savers Value Village, Inc. (“SVV”), and $35.8 million from Ares Corporate Opportunities Fund IV, L.P. (“ACOF IV”), primarily driven by lower operating performance metrics of a portfolio company that operates in the healthcare industry. | 187.4 | | Appreciation across several portfolio company investments, driven by improving operating performance metrics from portfolio companies that primarily operate in industries such as services, technology, retail, healthcare and energy, generated carried interest allocation of $76.9 million from ACOF V, $73.9 million from ACOF VI, $68.5 million from ASOF I and $42.6 million from SSF IV. The appreciation was partially offset by the reversal of unrealized carried interest allocation of $62.4 million and $27.0 million from ACOF IV and Ares Corporate Opportunities Fund III, L.P. (“ACOF III”), respectively, primarily driven by lower stock prices for certain publicly-traded investments. |
| Real assets funds | 8.5 | | IDF V generated carried interest allocation of $37.9 million driven by net investment income during the period. Ares Climate Infrastructure Partners, L.P. (“ACIP I”) generated carried interest allocation of $13.8 million due to market appreciation of certain investments. Appreciation from properties, driven by increasing operating income primarily from industrial and multifamily investments, generated carried interest allocation of $3.1 million from U.S. Real Estate Fund IX, L.P. (“US IX”). The appreciation was partially offset by the reversal of unrealized carried interest allocation of $12.6 million from Ares European Real Estate Fund IV SCSp. (“EF IV”), $5.7 million from Ares Real Estate Opportunity Fund III, L.P. (“AREOF III”), $5.5 million from Ares European Real Estate Fund V SCSp. (“EF V”) and $19.1 million from two European real estate equity funds, primarily driven by lower valuations of certain properties, which were impacted by the market environment. | 49.6 | | ACIP I and Ares Energy Investors Fund V, L.P. (“EIF V”) generated carried interest allocation of $38.1 million and $31.8 million, respectively, due to market appreciation of certain investments. Appreciation from properties within real estate equity funds, driven by increasing operating income primarily from industrial and multifamily investments, generated carried interest allocation of $15.0 million from U.S. Real Estate Fund VIII, L.P. (“US VIII”), $7.4 million from US IX and $4.2 million from Ares U.S. Real Estate Fund X, L.P. (“US X”). In addition, realized gains from the sale of properties generated carried interest allocation of $17.3 million from AREOF III. The activity was partially offset by the reversal of unrealized carried interest of $64.4 million from EF V, driven by a lower stock price for one of its publicly-traded investments. |
| Secondaries funds | (13.2) | | Depreciation across several investments in Landmark Equity Partners XVI, L.P. (“LEP XVI”), led to the reversal of unrealized carried interest of $12.5 million. | 21.0 | | Market appreciation of certain investments held in Landmark Real Estate Fund VIII, L.P. (“LREF VIII”) generated carried interest allocation of $32.8 million. The activity was partially offset by the reversal of unrealized carried interest of $18.4 million from LEP XVI, driven primarily by losses from the revaluation of limited partnership interests denominated in foreign currencies. |
| | | | |
| Carried interest allocation | $ | 618.6 | | | $ | 458.0 | | |
Incentive Fees. The activity was principally composed of the following ($ in millions):
| | | | | | | | | | | | | | |
| | | | |
| | | | |
| | | | |
| | | | |
| | | | |
| | | | |
| Year ended December 31, 2023 | Primary Drivers | Year ended December 31, 2022 | Primary Drivers |
| Credit funds | $ | 248.4 | | Incentive fees generated from 24 U.S. direct lending funds, ten European direct lending funds and seven alternative credit funds. | $ | 101.2 | | Incentive fees generated from 15 European direct lending funds, 12 U.S. direct lending funds and two alternative credit funds. |
| Real assets funds | 15.4 | | Incentive fees generated from an open-ended industrial real estate fund. | 199.4 | | Incentive fees generated from U.S. real estate equity funds, including $140.5 million from AIREIT, $31.6 million from an open-ended industrial real estate fund and $23.7 million from AREIT. |
Secondaries funds | 12.8 | | Incentive fees generated from APMF. | 0.6 | | Incentive fees generated from a private equity secondaries fund and APMF. |
| Incentive fees | $ | 276.6 | | | $ | 301.2 | | |
Principal Investment Income. The activity for the year ended December 31, 2023 was primarily composed of: (i) appreciation of our investments in certain funds in our European and U.S. direct lending, special opportunities, infrastructure debt and alternative credit strategies; (ii) dividend income from SSF IV and a European real estate fund; (iii) interest income from an open-ended core alternative credit fund; partially offset by (iv) unrealized losses of our investments in certain funds in our corporate private equity and real estate secondaries strategies.
The activity for the year ended December 31, 2022 was primarily composed of appreciation of our investments in certain funds in our infrastructure opportunities strategy, dividend income from various investments in funds within our U.S. direct lending strategy and realized gains from the sale of underlying properties held by funds in our U.S. real estate equity strategy.
Administrative, Transaction and Other Fees. The increase in administrative, transaction and other fees for the year ended December 31, 2023 compared to the prior year was primarily driven by: (i) higher administrative fees of $13.6 million as a result of the deconsolidation of a commercial finance fund during the second quarter of 2023; (ii) an increase of $8.7 million in administrative service fees based on invested capital primarily from certain private funds within our Credit Group, driven by deployment; (iii) higher credit transaction fees of $2.4 million primarily from the infrastructure debt strategy that are generated periodically and relate to the arrangement and origination of loans; partially offset by (iv) lower acquisition and development fees of $11.4 million, resulting from a reduction in property-related activities within certain industrial U.S. real estate equity funds; (v) a decrease of $10.8 million in facilitation fees and program administration fees from reduced sales activity within the 1031 exchange programs associated with our non-traded REITs.
Expenses
| | | | | | | | | | | | | | | | | | | | | | | | | | | | | | | |
| | | | | Year ended December 31, | | Favorable (Unfavorable) |
| | | | | | | | | 2023 | | 2022 | | $ Change | | % Change |
| Expenses | | | | | | | | | | | | | | | |
| Compensation and benefits | | | | | | | | | $ | 1,486,698 | | | $ | 1,498,590 | | | $ | 11,892 | | | 1% |
| Performance related compensation | | | | | | | | | 607,522 | | | 518,829 | | | (88,693) | | | (17) |
| General, administrative and other expenses | | | | | | | | | 660,146 | | | 695,256 | | | 35,110 | | | 5 |
| | | | | | | | | | | | | | | |
| Expenses of Consolidated Funds | | | | | | | | | 43,492 | | | 36,410 | | | (7,082) | | | (19) |
| Total expenses | | | | | | | | | $ | 2,797,858 | | | $ | 2,749,085 | | | 48,773 | | | 2 |
Compensation and Benefits. The decrease in compensation and benefits was primarily driven by the performance-based, acquisition-related compensation arrangements (“earnouts”) that were established in connection with the acquisition of Black Creek Group’s real estate investment advisory and distribution business (the “Black Creek Acquisition”). The maximum contingent payment associated with the Black Creek Acquisition earnout was achieved and the incremental expense of $218.1 million was recorded during the year ended December 31, 2022. Conversely, the earnout associated with a Landmark private equity secondaries fund was not achieved because revenue targets associated with fundraising did not meet certain thresholds. As a result, the associated compensation expense of $21.0 million was reversed during the year ended December 31, 2022.
Excluding the impact of earnouts as described above, compensation and benefits increased by 14% for the year ended December 31, 2023 compared to the prior year, primarily driven by: (i) an increase in salary expense of $74.4 million, primarily attributable to headcount growth to support the expansion of our business; (ii) higher Part I Fees compensation of $58.3 million; and (iii) higher equity-based compensation expense of $55.6 million as the number of unvested restricted units being amortized
has increased as has the value of these units with our rising stock price. Average headcount increased by 16% to 2,674 professionals for the year-to-date period in 2023 from 2,305 professionals in 2022.
For detail regarding the fluctuations of compensation and benefits within each of our segments see “—Results of Operations by Segment.”
Performance Related Compensation. Changes in performance related compensation are directly associated with the changes in carried interest allocation and incentive fees described above and include associated payroll related taxes as well as carried interest and incentive fees allocated to charitable organizations as part of our philanthropic initiatives.
General, Administrative and Other Expenses. For each year presented, we recognized impairment charges and recorded accelerated amortization expense in connection with acquired intangible assets (as discussed further below). Before giving effect to these costs, general, administrative and other expenses increased by 13% for the year ended December 31, 2023 compared to the prior year. However, due to the recognition of higher impairment charges in the prior year, general, administrative and other expenses over the comparative period has actually decreased by $35.1 million, or 5%, but this trend is not expected to continue.
Travel, marketing and certain fringe benefits collectively increased by $26.8 million for the year ended December 31, 2023 compared to the prior year as we: (i) continued to increase our marketing efforts driven by more investor meetings and events; and (ii) conducted more in-person company meetings and events with a focus on promoting collaboration and integration of acquired businesses. Occupancy costs, information services and information technology costs also increased during the comparative period, to support our growing headcount, the expansion of our business and the build out of our new corporate headquarters. Collectively, these expenses increased by $25.9 million for the year ended December 31, 2023 compared to the prior year. Additionally, professional service fees increased by $9.8 million for the year ended December 31, 2023 compared to 2022 primarily due to the reorganization of our income tax compliance function and to higher consulting fees to support various ongoing initiatives to enhance our operations.
Separately, we expect to incur higher supplemental distribution fees in future periods as we continue to develop our distribution relationships and expand our retail product offerings. These expenses were $20.2 million and increased by $7.3 million for the year ended December 31, 2023 when compared to prior year and will fluctuate with sales volumes and assets under management of our non-traded products.
During the year ended December 31, 2023, we recognized non-cash impairment charges of $78.7 million related to certain intangible assets comprised of: (i) $65.7 million to the fair value of certain client relationships from Landmark in connection with lower expected FPAUM in a private equity secondaries fund from existing investors; (ii) $7.8 million to the carrying value of SSG’s trade name as we rebranded Ares SSG as APAC credit and discontinued the use of the SSG trade name; and (iii) $5.2 million to the fair value of management contracts of certain funds in connection with lower than expected future fee revenue generated from these funds, of which $4.6 million was due to the shortened investment period of an infrastructure debt fund as we directed existing limited partner commitments to other investment vehicles within the strategy. During the year ended December 31, 2022, we recognized non-cash impairment charges of $181.6 million, in connection with intangible assets associated with Landmark’s trade name, management contracts of certain Landmark funds, Black Creek funds and SSG funds and resulted in the amortization expense associated with these intangible assets to decrease in subsequent periods. Excluding the non-cash impairment charges described above, amortization expense decreased by $7.6 million for the year ended December 31, 2023 compared to the prior year, as we no longer recognize amortization expense for the aforementioned intangible assets.
Other Income (Expense)
| | | | | | | | | | | | | | | | | | | | | | | | | | | | | | | |
| | | | | Year ended December 31, | | Favorable (Unfavorable) |
| | | | | | | | | 2023 | | 2022 | | $ Change | | % Change |
| Other income (expense) | | | | | | | | | | | | | | | |
| Net realized and unrealized gains on investments | | | | | | | | | $ | 77,573 | | | $ | 4,732 | | | $ | 72,841 | | | NM |
| Interest and dividend income | | | | | | | | | 19,276 | | | 9,399 | | | 9,877 | | | 105 |
| Interest expense | | | | | | | | | (106,276) | | | (71,356) | | | (34,920) | | | (49) |
| Other income, net | | | | | | | | | 4,819 | | | 13,119 | | | (8,300) | | | (63) |
| Net realized and unrealized gains on investments of Consolidated Funds | | | | | | | | | 262,700 | | | 73,386 | | | 189,314 | | | 258 |
| Interest and other income of Consolidated Funds | | | | | | | | | 995,545 | | | 586,529 | | | 409,016 | | | 70 |
| Interest expense of Consolidated Funds | | | | | | | | | (754,600) | | | (411,361) | | | (343,239) | | | (83) |
| Total other income, net | | | | | | | | | $ | 499,037 | | | $ | 204,448 | | | 294,589 | | | 144 |
Net Realized and Unrealized Gains on Investments. The activity for the year ended December 31, 2023 primarily includes a net gain of $70.9 million from our investment in X-energy. AAC I entered into a contract to merge with X-energy that ultimately did not occur as the shareholders of AAC I elected to redeem the investments held in trust in lieu of completing the merger. As the merger was not completed, we directly invested in X-energy. The net gain is primarily a result of the increase in value of various common and preferred equity securities in X-energy. The fair value of these investments are sensitive to changes in underlying assumptions and may demonstrate significant volatility over the short term.
The year ended December 31, 2023 also included: (i) unrealized gains from the appreciation of certain strategic investments in companies that manage portfolios of non-performing loans and real estate owned properties; (ii) unrealized gains and dividend income from our investment in APMF; and partially offset by (iii) unrealized losses from our strategic investment in a U.S. financial technology company.
The activity for the year ended December 31, 2022 reflects unrealized gains from the same strategic investments that manage portfolios of non-performing loans and real estate owned properties and was partially offset by unrealized losses from our investments in the subordinated notes of U.S. CLOs.
Interest Expense. Higher average interest rates driven by rising SOFR rates and a higher average outstanding balance of the Credit Facility contributed to an increase in interest expense for the year ended December 31, 2023 compared to 2022. The issuance of the 2028 Senior Notes in November 2023 also increased interest expense by $4.6 million for the year ended December 31, 2023 compared to the same period in 2022 and will result in interest expense of $8.2 million for the full quarter prospectively.
Other Income, Net. The activity for the years ended December 31, 2023 and 2022 primarily included transaction gains (losses) associated with currency fluctuations impacting the revaluation of assets and liabilities denominated in foreign currencies other than an entity’s functional currency. We recognized transaction losses for the year ended December 31, 2023 primarily due to the Euro weakening against the British pound for the year-to-date period. Transaction gains for the year ended December 31, 2022 were primarily attributable to the British pound weakening against the Euro.
Income Tax Expense
| | | | | | | | | | | | | | | | | | | | | | | | | | | | | | | |
| | | | | Year ended December 31, | | Favorable (Unfavorable) |
| | | | | | | | | 2023 | | 2022 | | $ Change | | % Change |
| Income before taxes | | | | | | | | | $ | 1,333,063 | | | $ | 510,806 | | | $ | 822,257 | | | 161% |
| Less: Income tax expense | | | | | | | | | 172,971 | | | 71,891 | | | (101,080) | | | (141) |
| Net income | | | | | | | | | $ | 1,160,092 | | | $ | 438,915 | | | 721,177 | | | 164 |
The increase in income tax expense was attributable to higher pre-tax income allocable to AMC for the year ended December 31, 2023 compared to the prior yearas the income attributed to redeemable and non-controlling interests is generally passed through to partners and not subject to corporate income taxes. The calculation of income taxes is also sensitive to any changes in weighted average daily ownership.
The following table summarizes weighted average daily ownership:
| | | | | | | | | | | | | | | | | | |
| | | | Year ended December 31, |
| | | | | | 2023 | | 2022 |
| AMC common stockholders | | | | | | 60.83 | % | | 59.76 | % |
| Non-controlling AOG unitholders | | | | | | 39.17 | % | | 40.24 | % |
The change in ownership was primarily driven by the issuance of Class A common stock in connection with stock option exercises, vesting of restricted stock awards, the completion of the SSG Buyout and the Crescent Point Acquisition. The increase in the weighted average daily ownership for AMC common stockholders was partially offset by the issuance of AOG Units in connection with the settlement of the Black Creek earnout that increased the ownership of AOG Units not held by AMC.
Redeemable and Non-Controlling Interests
| | | | | | | | | | | | | | | | | | | | | | | | | | | | | | | |
| | | | | Year ended December 31, | | Favorable (Unfavorable) |
| | | | | | | | | 2023 | | 2022 | | $ Change | | % Change |
| Net income | | | | | | | | | $ | 1,160,092 | | | $ | 438,915 | | | $ | 721,177 | | | 164% |
| | | | | | | | | | | | | | | |
| Less: Net income attributable to non-controlling interests in Consolidated Funds | | | | | | | | | 274,296 | | | 119,333 | | | 154,963 | | | 130 |
| Net income attributable to Ares Operating Group entities | | | | | | | | | 885,796 | | | 319,582 | | | 566,214 | | | 177 |
| Less: Net income (loss) attributable to redeemable interest in Ares Operating Group entities | | | | | | | | | 226 | | | (851) | | | 1,077 | | | NM |
| Less: Net income attributable to non-controlling interests in Ares Operating Group entities | | | | | | | | | 411,244 | | | 152,892 | | | 258,352 | | | 169 |
| | | | | | | | | | | | | | | |
| | | | | | | | | | | | | | | |
| | | | | | | | | | | | | | | |
| Net income attributable to Ares Management Corporation Class A and non-voting common stockholders | | | | | | | | | $ | 474,326 | | | $ | 167,541 | | | 306,785 | | | 183 |
The change in net income attributable to non-controlling interests in AOG entities over the comparative periods was a result of the respective changes in income before taxes and weighted average daily ownership, as presented above.
Consolidated Results of Operations of the Consolidated Funds
The following table presents the results of operations of the Consolidated Funds ($ in thousands):
| | | | | | | | | | | | | | | | | | | | | | | | | | | | | | | | | | | | | | | | |
| | | | | | | | | | | | | | | |
| | | | | | Year ended December 31, | | | | | | Favorable (Unfavorable) |
| | | | | | | | | | 2023 | | 2022 | | | | | | | | $ Change | | % Change |
| Expenses of the Consolidated Funds | | | | | | | | | | $ | (43,492) | | | $ | (36,410) | | | | | | | | | $ | (7,082) | | | (19)% |
| Net realized and unrealized gains on investments of Consolidated Funds | | | | | | | | | | 262,700 | | | 73,386 | | | | | | | | | 189,314 | | | 258 |
| Interest and other income of Consolidated Funds | | | | | | | | | | 995,545 | | | 586,529 | | | | | | | | | 409,016 | | | 70 |
| Interest expense of Consolidated Funds | | | | | | | | | | (754,600) | | | (411,361) | | | | | | | | | (343,239) | | | (83) |
| Income before taxes | | | | | | | | | | 460,153 | | | 212,144 | | | | | | | | | 248,009 | | | 117 |
| Less: Income tax expense of Consolidated Funds | | | | | | | | | | 3,823 | | | 331 | | | | | | | | | (3,492) | | | NM |
| Net income | | | | | | | | | | 456,330 | | | 211,813 | | | | | | | | | 244,517 | | | 115 |
| Less: Revenues attributable to Ares Management Corporation eliminated upon consolidation | | | | | | | | | | 188,155 | | | 110,809 | | | | | | | | | 77,346 | | | 70 |
| Other expense, net attributable to Ares Management Corporation eliminated upon consolidation | | | | | | | | | | 5,688 | | | 18,074 | | | | | | | | | 12,386 | | | 69 |
| General, administrative and other expense attributable to Ares Management Corporation eliminated upon consolidation | | | | | | | | | | 433 | | | 255 | | | | | | | | | (178) | | | (70) |
| Net income attributable to non-controlling interests in Consolidated Funds | | | | | | | | | | $ | 274,296 | | | $ | 119,333 | | | | | | | | | 154,963 | | | 130 |
The results of operations of the Consolidated Funds primarily represent activities from certain funds that we are deemed to control. When a fund is consolidated, we reflect the revenues and expenses of the entity on a gross basis, subject to eliminations from consolidation. Substantially all of our results of operations related to the Consolidated Funds are attributable to ownership interests that third parties hold in those funds. The Consolidated Funds are not necessarily the same funds in each year presented due to changes in ownership, changes in limited partners’ or investor rights, and the creation or termination of funds and entities. Accordingly, such amounts may not be comparable for the periods presented, and in any event have no material impact on net income attributable to Ares Management Corporation.
Segment Analysis
For segment reporting purposes, revenues and expenses are presented before giving effect to the results of our Consolidated Funds and the results attributable to non-controlling interests of joint ventures that we consolidate. As a result, segment revenues from management fees, fee related performance revenues, performance income and investment income are different than those presented on a consolidated basis in accordance with GAAP because revenuesGAAP. Revenues recognized from Consolidated Funds are eliminated in consolidation and resultsthose attributable to the non-controlling interests of joint ventures are excluded.have been excluded by us. Furthermore, expenses and the effects of other income (expense) are different than related amounts presented on a consolidated basis in accordance with GAAP due to the exclusion of the results of Consolidated Funds and the non-controlling interests of joint ventures.
Non-GAAP Financial Measures
We use the following non-GAAP measures to makingmake operating decisions, assess performance and allocate resources:
•Fee Related Earnings ("FRE"(“FRE”)
•Realized Income ("RI"(“RI”)
These non-GAAP financial measures supplement and should be considered in addition to and not in lieu of, the results of operations, which are discussed further under “—Components of Consolidated Results of Operations” and are prepared in accordance with GAAP. We operate through our distinct operating segments. On March 31, 2023, we completed the SSG Buyout. We rebranded Ares SSG as Ares Asia and the Ares SSG credit business, including the Asian special situations, Asian secured lending and APAC direct lending strategies, as APAC credit. APAC credit has been reclassified effective January 1, 2023 and is now presented within the Credit Group. In connection with this reclassification, we will no longer use Strategic Initiatives to describe all other operating segments, instead reporting the collective results as Other. Separately, the Private Equity Group includes APAC private equity following the Crescent Point Acquisition. Historical periods have been modified to conform to the current period presentation.
In February 2024, we announced that our special opportunities strategy, historically reported as a component of our Private Equity Group, will be integrated into the Credit Group to align management of this strategy and will form the foundation for a new opportunistic credit strategy. For segment reporting purposes, the change will require the reclassification of the special opportunities strategy from the Private Equity Group to the Credit Group and will be presented in our results beginning in 2024. Adjusted for this change, as of December 31, 2023, the Credit Group managed $299.4 billion in AUM with approximately 490 investment professionals and the Private Equity Group managed $24.5 billion in AUM with approximately 85 investment professionals, with both groups continuing to manage investments across the U.S., Europe and Asia-Pacific.
The following table sets forth FRE and RI by reportable segment and OMG:the OMG ($ in thousands):
| | | | | | Year ended December 31, | | Favorable (Unfavorable) |
| ($ in thousands) | | 2020 | | 2019 | | $ Change | | % Change |
| | | |
| | | | | | | | | Year ended December 31, | | Favorable (Unfavorable) |
| | | | | | | | | | 2023 | | | | | | | | | | | | 2023 | | 2022 | | $ Change | | % Change |
| Fee Related Earnings: | Fee Related Earnings: | | | | | | | | |
| Credit Group | Credit Group | | $ | 501,373 | | | $ | 414,212 | | | $ | 87,161 | | | 21 | % |
| Credit Group | |
| Credit Group | | | | | | | | | | | $ | 1,257,528 | | | $ | 977,892 | | | $ | 279,636 | | | 29% |
| Private Equity Group | Private Equity Group | | 109,064 | | | 114,419 | | | (5,355) | | | (5) | | Private Equity Group | | | | | | | | | | 112,541 | | | 84,467 | | 84,467 | | | 28,074 | | 28,074 | | | 33 | | 33 |
| Real Estate Group | | 33,399 | | | 25,482 | | | 7,917 | | | 31 | |
| Strategic Initiatives | | 17,371 | | | — | | | 17,371 | | | NM |
| Real Assets Group | | Real Assets Group | | | | | | | | | | 218,807 | | | 271,626 | | | (52,819) | | | (19) |
| Secondaries Group | | Secondaries Group | | | | | | | | | | 104,387 | | | 110,501 | | | (6,114) | | | (6) |
| Other | | Other | | | | | | | | | | 8,530 | | | (2,252) | | | 10,782 | | | NM |
| Operations Management Group | Operations Management Group | | (236,757) | | | (230,454) | | | (6,303) | | | (3) | | Operations Management Group | | | | | | | | | | (538,052) | | | (447,884) | | (447,884) | | | (90,168) | | (90,168) | | | (20) | | (20) |
| Fee Related Earnings | Fee Related Earnings | | $ | 424,450 | | | $ | 323,659 | | | 100,791 | | | 31 | | Fee Related Earnings | | | | | | | | | | $ | 1,163,741 | | | $ | | $ | 994,350 | | | 169,391 | | 169,391 | | | 17 | | 17 |
| Realized Income: | Realized Income: | | | | | |
| Credit Group | Credit Group | | $ | 538,683 | | | $ | 471,643 | | | $ | 67,040 | | | 14 | % |
| Credit Group | |
| Credit Group | | | | | | | | | | | $ | 1,368,671 | | | $ | 1,055,634 | | | $ | 313,037 | | | 30% |
| Private Equity Group | Private Equity Group | | 212,695 | | | 212,564 | | | 131 | | | 0 | | Private Equity Group | | | | | | | | | | 122,769 | | | 107,998 | | 107,998 | | | 14,771 | | 14,771 | | | 14 | | 14 |
| Real Estate Group | | 58,192 | | | 51,757 | | | 6,435 | | | 12 | |
| Strategic Initiatives | | 16,915 | | | — | | | 16,915 | | | NM |
| Real Assets Group | | Real Assets Group | | | | | | | | | | 217,195 | | | 322,465 | | | (105,270) | | | (33) |
| Secondaries Group | | Secondaries Group | | | | | | | | | | 101,056 | | | 109,165 | | | (8,109) | | | (7) |
| Other | | Other | | | | | | | | | | (6,703) | | | (14,042) | | | 7,339 | | | 52 |
| Operations Management Group | Operations Management Group | | (244,529) | | | (232,478) | | | (12,051) | | | (5) | | Operations Management Group | | | | | | | | | | (537,460) | | | (450,193) | | (450,193) | | | (87,267) | | (87,267) | | | (19) | | (19) |
| Realized Income | Realized Income | | $ | 581,956 | | | $ | 503,486 | | | 78,470 | | | 16 | | Realized Income | | | | | | | | | | $ | 1,265,528 | | | $ | | $ | 1,131,027 | | | 134,501 | | 134,501 | | | 12 | | 12 |
NM - Not Meaningful
Income before provision for income taxes is the GAAP financial measure most comparable to RI and FRE. The following table presents the reconciliation of income before taxes as reported inwithin the Consolidated Statements of Operations to RI and FRE of the reportable segments and OMG:the OMG ($ in thousands):
| | | | | | | | | | | | | | | |
| | | Year ended December 31, |
| ($ in thousands) | | | | | 2020 | | 2019 |
| Income before taxes | | | | | $ | 379,478 | | | $ | 425,180 | |
| Adjustments: | | | | | | | |
| Depreciation and amortization expense | | | | | 40,662 | | | 40,602 | |
| Equity compensation expense | | | | | 122,986 | | | 97,691 | |
| Acquisition and merger-related expense | | | | | 11,194 | | | 16,266 | |
| Deferred placement fees | | | | | 19,329 | | | 24,306 | |
| Other (income) expense, net | | | | | 10,207 | | | (460) | |
| Net expense of non-controlling interests in consolidated subsidiaries | | | | | 3,817 | | | 2,951 | |
| Income before taxes of non-controlling interests in Consolidated Funds, net of eliminations | | | | | (28,203) | | | (39,174) | |
| Unconsolidated performance (income) loss-unrealized | | | | | 7,554 | | | (303,142) | |
| Unconsolidated performance related compensation - unrealized | | | | | (11,552) | | | 206,799 | |
| Unconsolidated net investment loss-realized | | | | | 26,484 | | | 32,467 | |
| Realized Income | | | | | 581,956 | | | 503,486 | |
| Unconsolidated performance income-realized | | | | | (547,216) | | | (402,518) | |
| Unconsolidated performance related compensation - realized | | | | | 415,668 | | | 290,382 | |
| Unconsolidated investment income-realized | | | | | (25,958) | | | (67,691) | |
| Fee Related Earnings | | | | | $ | 424,450 | | | $ | 323,659 | |
| | | | | | | | | | | | | | | |
| | | Year ended December 31, |
| | | | | 2023 | | 2022 |
| Income before taxes | | | | | $ | 1,333,063 | | | $ | 510,806 | |
| Adjustments: | | | | | | | |
| Depreciation and amortization expense | | | | | 233,185 | | | 335,083 | |
| Equity compensation expense | | | | | 255,419 | | | 198,948 | |
Acquisition-related compensation expense(1) | | | | | 7,334 | | | 206,252 | |
| | | | | | | |
| Acquisition and merger-related expense | | | | | 12,000 | | | 15,197 | |
| Placement fee adjustment | | | | | (5,819) | | | 2,088 | |
| Other expense, net | | | | | 976 | | | 1,874 | |
| Income before taxes of non-controlling interests in consolidated subsidiaries | | | | | (17,249) | | | (357) | |
| Income before taxes of non-controlling interests in Consolidated Funds, net of eliminations | | | | | (278,119) | | | (119,664) | |
| Total performance income—unrealized | | | | | (305,370) | | | (106,978) | |
| Total performance related compensation—unrealized | | | | | 206,923 | | | 88,502 | |
| Total net investment income—unrealized | | | | | (176,815) | | | (724) | |
| Realized Income | | | | | 1,265,528 | | | 1,131,027 | |
| Total performance income—realized | | | | | (415,899) | | | (418,021) | |
| Total performance related compensation—realized | | | | | 282,406 | | | 274,541 | |
| Total investment loss—realized | | | | | 31,706 | | | 6,803 | |
| Fee Related Earnings | | | | | $ | 1,163,741 | | | $ | 994,350 | |
(1)Represents earnouts in connection with the acquisition of Landmark Partners, LLC (the “Landmark Acquisition”), the acquisition of AMP Capital’s infrastructure debt platform (“Infrastructure Debt Acquisition”), the Black Creek Acquisition and the Crescent Point Acquisition that are recorded as compensation expense and are presented within compensation and benefits within the Company’s Consolidated Statements of Operations.
For the specific components and calculations of these non-GAAP measures, as well as a reconciliation of the reportable segmentsadditional reconciliations to the most comparable measures in accordance with GAAP, see “Note 15.14. Segment Reporting”, to within our audited consolidated financial statements included in this Annual Report on Form 10-K. Discussed below are our results of operations for our reportable segments and the OMG.
Results of Operations by Segment
Credit Group—Year Ended December 31, 20202023 Compared to Year Ended December 31, 20192022
Fee Related Earnings:Earnings
The following table presents the components of the Credit Group's FRE:Group’s FRE ($ in thousands):
| | | | | Year ended December 31, | Favorable (Unfavorable) |
| ($ in thousands) | | 2020 | | 2019 | | $ Change | | % Change |
| Management fees (includes ARCC Part I Fees of $184,141 and $164,396 for the years ended December 31, 2020 and 2019, respectively) | | $ | 841,138 | | | $ | 713,853 | | | $ | 127,285 | | | 18 | % |
| | |
| | | | | | Year ended December 31, | | Favorable (Unfavorable) |
| | | | | | | | | 2023 | | | | | | | | | | | 2023 | | 2022 | | $ Change | | % Change |
| Management fees | | Management fees | | | | | | | | | $ | 1,749,796 | | | $ | 1,416,518 | | | $ | 333,278 | | | 24% |
| Fee related performance revenues | | Fee related performance revenues | | | | | | | | | 167,333 | | | 71,497 | | | 95,836 | | | 134 |
| Other fees | Other fees | | 18,644 | | | 17,124 | | | 1,520 | | | 9 | | Other fees | | | | | | | | | 35,257 | | | 31,992 | | 31,992 | | | 3,265 | | 3,265 | | | 10 | | 10 |
| Compensation and benefits | Compensation and benefits | | (304,412) | | | (261,662) | | | (42,750) | | | (16) | | Compensation and benefits | | | | | | | | | (598,125) | | | (462,681) | | (462,681) | | | (135,444) | | (135,444) | | | (29) | | (29) |
| General, administrative and other expenses | General, administrative and other expenses | | (53,997) | | | (55,103) | | | 1,106 | | | 2 | | General, administrative and other expenses | | | | | | | | | (96,733) | | | (79,434) | | (79,434) | | | (17,299) | | (17,299) | | | (22) | | (22) |
| Fee Related Earnings | Fee Related Earnings | | $ | 501,373 | | | $ | 414,212 | | | 87,161 | | | 21 | | Fee Related Earnings | | | | | | | | | $ | 1,257,528 | | | $ | | $ | 977,892 | | | 279,636 | | 279,636 | | | 29 | | 29 |
Management Fees. The chart below presents Credit Group management fees and effective management fee rates:rates ($ in millions):
Management fees on existing direct lending funds increased primarily from deployment of capital with Pathfinder I, an open-ended core alternative credit fund, ACE IV,V, PCS II and Ares Senior Direct Lending Fund II, L.P. (“SDL”SDL II”) collectively generating additional management fees of $49.6$97.0 million for the year ended December 31, 20202023 compared to the prior year. Management fees from ARCC, excluding Part I Fees described below, increased by $19.3 million for the year ended December 31, 2019. Management fees from ARCC increased $11.7 million from2023 compared to the prior year primarily due to an increase in the average size of ARCC's portfolio, drivenARCC’s portfolio.
Excluding catch-up fees, management fees from Ares SSG Capital Partners VI, L.P. (“SSG Fund VI”) increased by an increase in leverage.$13.7 million for the year ended December 31, 2023 compared to the year ended December 31, 2022 primarily due to new capital commitments. The remaining increase in management fees onfrom funds in existence in both periods was primarily driven by deployment of capital in other direct lending funds and SMAs. Management fees from CLOs also increased fromfor the prior year primarily due to the net
addition of five CLOs that pay fees andended December 31, 2023 compared to $7.9 million of fees associated with managing the seven collateral management contracts acquired from Crestline Denali. In addition, ARCC Part I Fees increasedprior year primarily due to the expirationnet addition of the $10 million quarterly fee waiver at the end of the third quarter of 2019 that was partially offset by a reduction in ARCC's pre-incentive fee net investment income. Despite ARCC’s record deployment in the fourth quarter of 2020, pre-incentive fee net investment income was muted by the decrease in new commitments for the full year due to the volatility and disruption to the global economy and capital markets from the COVID-19 pandemic. As a result, the pace of investment activity was slowed during much of 2020 with a rebound of activity during the fourth quarter.
The decrease in effective management fee ratesfour CLOs for the year ended December 31, 20202023.
Part I Fees increased for the year ended December 31, 2023 compared to the year ended December 31, 20192022 primarily due to an increase in pre-incentive fee net investment income generated by ARCC and CADC, driven by an increase in the average size of their portfolios and by the impact of rising interest rates, given their primarily floating-rate loan portfolios. The increase in Part I Fees included fees from ASIF of $5.1 million beginning in the third quarter of 2023.
The increase in effective management fee rate for the year ended December 31, 2023 compared to the year ended December 31, 2022 was primarily driven by the increase in fee paying AUM U.S. CLOs that have fee rates below 0.50% and to deployment in certain alternative credit funds that have fee rates below 1.00%. The decrease was also driven by the decrease in ARCC Part I Fees'Fees’ contribution to the effective management fee rate duerate.
Fee Related Performance Revenues. The increase for the year ended December 31, 2023 compared to the proportionalyear ended December 31, 2022 was primarily attributable to higher returns from certain perpetual capital funds that have benefited from rising interest rates on predominately floating-rate loans. Incentive fees from perpetual capital were mostly generated from 14 U.S. direct lending funds, ten European direct lending funds and one alternative credit fund for the year ended December 31, 2023 compared to ten European direct lending and eight U.S. direct lending funds for the year ended December 31, 2022.
Other Fees. The increase in other fees for the year ended December 31, 2023 compared to the year ended December 31, 2022 was primarily driven by higher administrative service fees of $8.1 million mostly earned from certain private funds that pay on invested capital. The increase in other fees is partially offset by a decrease of $5.1 million in transaction fees, primarily from lower loan origination income generated from certain credit funds.
Compensation and Benefits. CompensationThe increase in compensation and benefits increased by $42.8 million, or 16%, for the year ended December 31, 20202023 compared to the year ended December 31, 2019. The activity2022 was primarily driven byby: (i) higher fee related performance compensation and Part I Fees compensation of $59.4 million and $58.3 million, respectively, corresponding to the increases in revenues; and (ii) an increase in salary expense of $14.1 million, primarily attributable to headcount growth as we hired investment professionals to support the expansion of our growing U.S.business. Separately, compensation and European direct lending and alternative credit platforms. benefits increased by $4.7 million for the nine months ended December 31, 2023 following the SSG Buyout on March 31, 2023, reflecting the costs associated with the 20% change in ownership that were previously not part of our cost structure.
Average headcount increased by 8%12% to 409566 investment and investment support professionals for 2020the year-to-date period in 2023 from 379504 professionals in 2019. The increase was further driven by ARCC Part I Fees compensation increasing by $11.7 million for the comparative period.2022 as we continued to add professionals primarily to support our growing direct lending and APAC credit platforms.
General, Administrative and Other Expenses. General, administrativeCertain expenses increased during the current period, including: (i) occupancy costs, which support our growing headcount that are based in higher cost locations; (ii) information services such as research and othermarket data; and (iii) information technology costs. These expenses decreasedcollectively increased by $1.1$9.4 million or 2%, for the year ended December 31, 20202023 compared to the prior year. Additionally, supplemental distribution fees which fluctuate with sales volumes and managed assets of our non-traded products, contributed $5.1 million of the increase for the year ended December 31, 2023 when compared to prior year. We expect to incur higher supplemental distribution fees in future periods as we continue to develop our distribution relationships and expand our retail product offerings. For the year ended December 31, 2023, travel and marketing expenses have also increased by $4.1 million when compared to the year ended December 31, 2019. The year ended December 31, 2020 was impacted2022, as marketing efforts continued to increase driven by the COVID-19 pandemicmore in-person investor meetings and resulted in a decrease in certain operating expenses. During the last nine months of 2020, our operating expenses were impacted by limitations in certain business activities, most notably travel, entertainment and marketing sponsorships, and by certain office services and fringe benefits from the modified remote working environment. Collectively, these expenses decreased by $7.3 million for the nine months ended December 31, 2020, when compared to the same period in 2019.events.
There were also certain expenses that increased during the current period, including occupancy costs to support the headcount growth, information services and information technology to support the expansion
Realized Income:Income
The following table presents the components of the Credit Group's RI:Group’s RI ($ in thousands):
| | | Year ended December 31, | | Favorable (Unfavorable) |
| ($ in thousands) | | 2020 | | 2019 | | $ Change | | % Change |
| | | | Year ended December 31, | |
| | | | Year ended December 31, | |
| | | | Year ended December 31, | | | Favorable (Unfavorable) |
| | | | | | | | | 2023 | | | | | | | | | | | 2023 | | 2022 | | $ Change | | % Change |
| Fee Related Earnings | Fee Related Earnings | | $ | 501,373 | | | $ | 414,212 | | | $ | 87,161 | | | 21 | % | Fee Related Earnings | | | | | | | | | $ | 1,257,528 | | | $ | | $ | 977,892 | | | $ | | $ | 279,636 | | | 29% | | 29% |
| Performance income-realized | | 92,308 | | | 104,442 | | | (12,134) | | | (12) |
| Performance related compensation-realized | | (60,281) | | | (61,641) | | | 1,360 | | | 2 |
| Performance income—realized | | Performance income—realized | | | | | | | | | 271,550 | | | 156,929 | | | 114,621 | | | 73 |
| Performance related compensation—realized | | Performance related compensation—realized | | | | | | | | | (175,193) | | | (97,621) | | | (77,572) | | | (79) |
| Realized net performance income | Realized net performance income | | 32,027 | | | 42,801 | | | (10,774) | | | (25) | Realized net performance income | | | | | | | | | 96,357 | | | 59,308 | | 59,308 | | | 37,049 | | 37,049 | | | 62 | | 62 |
| Investment income (loss)-realized | | (2,309) | | | 2,457 | | | (4,766) | | | NM |
| Interest and other investment income-realized | | 16,314 | | | 18,670 | | | (2,356) | | | (13) |
| Investment income—realized | | Investment income—realized | | | | | | | | | 20,111 | | | 7,078 | | | 13,033 | | | 184 |
| Interest and other investment income—realized | | Interest and other investment income—realized | | | | | | | | | 21,975 | | | 27,288 | | | (5,313) | | | (19) |
| Interest expense | Interest expense | | (8,722) | | | (6,497) | | | (2,225) | | | (34) | Interest expense | | | | | | | | | (27,300) | | | (15,932) | | (15,932) | | | (11,368) | | (11,368) | | | (71) | | (71) |
| Realized net investment income | Realized net investment income | | 5,283 | | | 14,630 | | | (9,347) | | | (64) | Realized net investment income | | | | | | | | | 14,786 | | | 18,434 | | 18,434 | | | (3,648) | | (3,648) | | | (20) | | (20) |
| Realized Income | Realized Income | | $ | 538,683 | | | $ | 471,643 | | | 67,040 | | | 14 | Realized Income | | | | | | | | | $ | 1,368,671 | | | $ | | $ | 1,055,634 | | | 313,037 | | 313,037 | | | 30 | | 30 |
NM - Not Meaningful
Realized net performance income for the years ended December 31, 2023 and 2022 included aggregate tax distributions of $54.7 million and $48.1 million, respectively, from ACE IV, ACE V and PCS I, among other European direct lending funds. Realized net performance income for the year ended December 31, 2020 was primarily attributable to2023 also included incentive fees for sevenprimarily from ten direct lending funds and twosix alternative credit funds that crystallized during the period and to tax distributions from ACE III and ACE IV.funds. Realized net performance income for the year ended December 31, 20192022 also included incentive fees primarily from nine direct lending funds and two alternative credit funds.
Realized net investment income for the years ended December 31, 2023 and 2022 was primarily attributable to 16 direct lending funds with incentive fees that crystallizedinterest income generated from our CLO investments. In addition, the year ended December 31, 2023 included realized gains from the sale of our investment in a commercial finance fund during the period and to tax distributions received from ACE III and certain other direct lending funds.second quarter of 2023.
Realized net investment income for the year ended December 31, 20202022 was also attributable to: (i) realizations from the settlement of forward contracts entered into to hedge our exposure to foreign currency fluctuations, primarily attributable to interest income generated from our CLO investments and from a term loan investment that was made in the third quarter of 2019 and to investment income related to a distributionEuro; (ii) distributions from a U.S. direct lending fund. Realized net investmentfund and a European direct lending fund; and (iii) income for the year ended December 31, 2019 was primarily attributable to interest income generated from our CLO investments and investment income related torecognized in connection with distributions from a commercial finance fund.
Interest expense, which is allocated among our direct lending funds. Interest income generated from our CLOsegments based on the cost basis of balance sheet investments, was lower forincreased over the year ended December 31, 2020 compared to 2019comparative periods primarily due to lower cash distributions received in the current year. Our CLO investments are primarily in subordinated notes that do not have contractual interestrising SOFR rates and instead receive distributions based on the excess cash flowsa higher average outstanding balance of the CLOs. The COVID-19 pandemic caused market volatilityCredit Facility and lower interest rates, resultingto the issuance of the 2028 Senior Notes in lower cash flows for distribution to subordinated note holders.November 2023.
Credit Group— Carried Interest and Incentive FeesPerformance Income
The following table presents the accrued carried interest, and incentive fee receivables, also referred to as accrued performance income, and related performance compensation for the Credit Group:Group. Accrued net performance income excludes net performance income that has been realized but not yet received as of the reporting date ($ in thousands):
| | | | | | | | | | | | | | | | | | | | | | | | | | | | | | | | | | | |
| | | |
| As of December 31, |
| 2020 | | 2019 |
| ($ in thousands) | Accrued Performance Income | | Accrued Performance Compensation | | Accrued Net Performance Income | | Accrued Performance Income | | Accrued Performance Compensation | | Accrued Net Performance Income |
| Accrued Carried Interest | | | | | | | | | | | |
| ACE III | $ | 77,959 | | | $ | 46,776 | | | $ | 31,183 | | | $ | 76,628 | | | $ | 45,977 | | | $ | 30,651 | |
| ACE IV | 93,462 | | | 57,946 | | | 35,516 | | | 57,388 | | | 35,581 | | | 21,807 | |
| | | | | | | | | | | |
| PCS | 101,656 | | | 60,084 | | | 41,572 | | | 52,029 | | | 30,751 | | | 21,278 | |
| Other credit funds | 100,238 | | | 61,898 | | | 38,340 | | | 84,297 | | | 48,305 | | | 35,992 | |
| Total accrued carried interest | 373,315 | | | 226,704 | | | 146,611 | | | 270,342 | | | 160,614 | | | 109,728 | |
| Incentive fees | 31,653 | | | 18,601 | | | 13,052 | | | 42,653 | | | 25,424 | | | 17,229 | |
| Total Credit Group | $ | 404,968 | | | $ | 245,305 | | | $ | 159,663 | | | $ | 312,995 | | | $ | 186,038 | | | $ | 126,957 | |
| | | | | | | | | | | | | | | | | | | | | | | | | | | | | | | | | | | |
| | | |
| As of December 31, |
| 2023 | | 2022 |
| Accrued Performance Income | | Accrued Performance Compensation | | Accrued Net Performance Income | | Accrued Performance Income | | Accrued Performance Compensation | | Accrued Net Performance Income |
| ACE III | $ | 92,546 | | | $ | 57,948 | | | $ | 34,598 | | | $ | 100,774 | | | $ | 60,465 | | | $ | 40,309 | |
| ACE IV | 149,584 | | | 97,123 | | | 52,461 | | | 168,204 | | | 104,286 | | | 63,918 | |
| ACE V | 232,201 | | | 146,219 | | | 85,982 | | | 115,969 | | | 69,581 | | | 46,388 | |
| PCS I | 123,979 | | | 73,258 | | | 50,721 | | | 98,143 | | | 57,994 | | | 40,149 | |
| PCS II | 38,128 | | | 22,573 | | | 15,555 | | | — | | | — | | | — | |
| Pathfinder I | 155,136 | | | 131,866 | | | 23,270 | | | 88,879 | | | 75,547 | | | 13,332 | |
| Other credit funds | 184,783 | | | 106,447 | | | 78,336 | | | 93,640 | | | 52,482 | | | 41,158 | |
| Total Credit Group | $ | 976,357 | | | $ | 635,434 | | | $ | 340,923 | | | $ | 665,609 | | | $ | 420,355 | | | $ | 245,254 | |
The following table presents the change in accrued carried interest from the prior year end to the current year endperformance income for the Credit Group:Group ($ in thousands):
| | | | | | | | | | | | | | | | | | | | | | | | | | | | | | | | | | | | | | |
| | | | | | | | | | |
| | | | | | | | | | | | |
| | | | | | | | | | | | |
| | | | | | | | | | | | |
| | | | | | | | | | | | |
| | | | | | | | | | | | |
| | | | | | | | | | | | |
| | | | | | | | | | | | |
| | | | | | | | | | | | |
| | | | | | | | | | | | |
| | | | | As of December 31, 2019 | | Activity during 2020 | | As of December 31, 2020 |
| ($ in thousands) | | Fee Type | | Accrued Carried Interest | | Change in Unrealized | | Realized | | Foreign Exchange and Other Adjustments | | Accrued Carried Interest |
| ACE III | | European | | $ | 76,628 | | | $ | 9,147 | | | $ | (11,868) | | | $ | 4,052 | | | $ | 77,959 | |
| ACE IV | | European | | 57,388 | | | 51,471 | | | (21,064) | | | 5,667 | | | 93,462 | |
| PCS | | European | | 52,029 | | | 48,888 | | | — | | | 739 | | | 101,656 | |
| Other credit funds | | European | | 84,034 | | | 36,809 | | | (22,424) | | | 1,561 | | | 99,980 | |
| Other credit funds | | American | | 263 | | | (5) | | | — | | | — | | | 258 | |
| Total Credit Group | | | | $ | 270,342 | | | $ | 146,310 | | | $ | (55,356) | | | $ | 12,019 | | | $ | 373,315 | |
| | | | | | | | | | | | | | | | | | | | | | | | | | | | | | | | | | | | | | | |
| | | | | | | | | | | |
| | | | | | | | | | | | | |
| | | | | | | | | | | | | |
| | | | | | | | | | | | | |
| | | | | | | | | | | | | |
| | | | | | | | | | | | | |
| | | | | | | | | | | | | |
| | | | | | | | | | | | | |
| | | | | | | | | | | | | |
| | | | | | | | | | | | | |
| | | | | As of December 31, 2022 | | Activity during the period | | As of December 31, 2023 | |
| | Waterfall Type | | Accrued Performance Income | | Change in Unrealized | | Realized | | Other Adjustments | | Accrued Performance Income | |
| Accrued Carried Interest | | | | | | | | | | | | | |
| ACE III | | European | | $ | 100,774 | | | $ | (1,931) | | | $ | (6,237) | | | $ | (60) | | | $ | 92,546 | | |
| ACE IV | | European | | 168,204 | | | 58,421 | | | (77,097) | | | 56 | | | 149,584 | | |
| ACE V | | European | | 115,969 | | | 181,054 | | | (64,079) | | | (743) | | | 232,201 | | |
| PCS I | | European | | 98,143 | | | 45,308 | | | (19,867) | | | 395 | | | 123,979 | | |
| PCS II | | European | | — | | | 37,621 | | | — | | | 507 | | | 38,128 | | |
| Pathfinder I | | European | | 88,879 | | | 66,257 | | | — | | | — | | | 155,136 | | |
| Other credit funds | | European | | 85,463 | | | 92,590 | | | (19,078) | | | 1,377 | | | 160,352 | | |
| Other credit funds | | American | | 8,177 | | | 19,394 | | | (3,083) | | | (57) | | | 24,431 | | |
| Total accrued carried interest | | | | 665,609 | | | 498,714 | | | (189,441) | | | 1,475 | | | 976,357 | | |
| | | | | | | | | | | | | |
| Other credit funds | | Incentive | | — | | | 82,109 | | | (82,109) | | | — | | | — | | |
| Total Credit Group | | | | $ | 665,609 | | | $ | 580,823 | | | $ | (271,550) | | | $ | 1,475 | | | $ | 976,357 | | |
Credit Group—Assets Under Management
The tables below present rollforwards of AUM for the Credit Group:Group ($ in millions):
| | | | | | | | | | | | | | | | | | | | | | | | | | | | | | | | | | | | | | | | | | | | | | | |
| | | | | | | | | | | | | | | |
| | | | | | | | | | | | | | |
| | | | | | | | | | | | | | |
| | | | | | | | | | | | | | |
| | | | | | | | | | | | | | |
| | | | | | | | | | | | | | |
| | | | | | | | | | | | | | |
| | | | | | | | | | | | | | |
| | | | | | | | | | | | | | |
| | | | | | | | | | | | | | |
| | | | | | | | | | | | | | |
| | | | | | | | | | | | | | | |
| | | | | | | | | | | | | | | |
| | | | | | | | | | | | | | |
| | | | | | | | | | | | | | |
| | | | | | | | | | | | | | |
| | | | | | | | | | | | | | |
| | | | | | | | | | | | | | |
| | | | | | | | | | | | | | |
| | | | | | | | | | | | | | |
| | | | | | | | | | | | | | |
| | | | | | | | | | | | | | |
| | | | | | | | | | | | | | | |
|
| | | | | | | | | | | | | | | |
| ($ in millions) | | | Syndicated Loans | | High Yield | | Multi-Asset Credit | | Alternative Credit | | U.S. Direct Lending | | European Direct Lending | | Total Credit Group |
| Balance at 12/31/2019 | | $ | 22,320 | | | $ | 3,492 | | | $ | 2,611 | | | $ | 7,571 | | | $ | 48,431 | | | $ | 26,118 | | | $ | 110,543 | |
| Acquisitions | | 2,693 | | | — | | | — | | | — | | | — | | | — | | | 2,693 | |
| Net new par/equity commitments | | 551 | | | 451 | | | 470 | | | 5,516 | | | 4,036 | | | 13,209 | | | 24,233 | |
| Net new debt commitments | | 2,406 | | | — | | | — | | | — | | | 4,002 | | | 1,119 | | | 7,527 | |
| Capital reductions | | (121) | | | — | | | — | | | — | | | (144) | | | (166) | | | (431) | |
| Distributions | | (69) | | | — | | | (16) | | | (376) | | | (1,181) | | | (843) | | | (2,485) | |
| Redemptions | | (282) | | | (1,163) | | | (276) | | | (354) | | | (101) | | | — | | | (2,176) | |
| Change in fund value | | 469 | | | 83 | | | 164 | | | 540 | | | 1,473 | | | 2,839 | | | 5,568 | |
| Balance at 12/31/2020 | | $ | 27,967 | | | $ | 2,863 | | | $ | 2,953 | | | $ | 12,897 | | | $ | 56,516 | | | $ | 42,276 | | | $ | 145,472 | |
Average AUM(1) | | $ | 25,312 | | | $ | 2,911 | | | $ | 2,703 | | | $ | 9,375 | | | $ | 51,548 | | | $ | 31,585 | | | $ | 123,434 | |
| | | | | | | | | | | | | | | |
| | | Syndicated Loans | | High Yield | | Multi-Asset Credit | | Alternative Credit | | U.S. Direct Lending | | European Direct Lending | | Total Credit Group |
| Balance at 12/31/2018 | | $ | 18,880 | | | $ | 4,024 | | | $ | 2,761 | | | $ | 5,448 | | | $ | 40,668 | | | $ | 24,055 | | | $ | 95,836 | |
| Net new par/equity commitments | | 1,124 | | | 165 | | | (13) | | | 2,298 | | | 2,253 | | | 764 | | | 6,591 | |
| Net new debt commitments | | 3,360 | | | — | | | — | | | 75 | | | 6,060 | | | 1,189 | | | 10,684 | |
| Capital reductions | | (805) | | | — | | | — | | | — | | | (908) | | | (52) | | | (1,765) | |
| Distributions | | (103) | | | (22) | | | (74) | | | (233) | | | (1,143) | | | (611) | | | (2,186) | |
| Redemptions | | (438) | | | (1,208) | | | (322) | | | (290) | | | (59) | | | — | | | (2,317) | |
| Change in fund value | | 302 | | | 533 | | | 259 | | | 273 | | | 1,560 | | | 773 | | | 3,700 | |
| Balance at 12/31/2019 | | $ | 22,320 | | | $ | 3,492 | | | $ | 2,611 | | | $ | 7,571 | | | $ | 48,431 | | | $ | 26,118 | | | $ | 110,543 | |
Average AUM(1) | | $ | 20,928 | | | $ | 3,734 | | | $ | 2,569 | | | $ | 6,841 | | | $ | 44,958 | | | $ | 24,823 | | | $ | 103,853 | |
| | | | | | | | | | | | | | | |
| (1) Represents a five-point average of quarter-end balances for each period. |
| | | | | | | | | | | | | | | | | | | | | | | | | | | | | | | | | | | | | | | | | | | | | | | |
| | | | | | | | | | | | | | | |
| | | | | | | | | | | | | | |
| | | | | | | | | | | | | | |
| | | | | | | | | | | | | | |
| | | | | | | | | | | | | | |
| | | | | | | | | | | | | | |
| | | | | | | | | | | | | | |
| | | | | | | | | | | | | | |
| | | | | | | | | | | | | | |
| | | | | | | | | | | | | | |
| | | | | | | | | | | | | | |
| | | | | | | | | | | | | | | |
| | | | | | | | | | | | | | | |
| | | | | | | | | | | | | | |
| | | | | | | | | | | | | | |
| | | | | | | | | | | | | | |
| | | | | | | | | | | | | | |
| | | | | | | | | | | | | | |
| | | | | | | | | | | | | | |
| | | | | | | | | | | | | | |
| | | | | | | | | | | | | | |
| | | | | | | | | | | | | | |
| | | | | | | | | | | | | | |
| | | | | | | | | | | | | | | |
| | Liquid
Credit | | Alternative
Credit | | U.S. Direct
Lending | | European
Direct Lending | | APAC
Credit | | Other(1) | | Total Credit
Group |
| Balance at 12/31/2022 | | $ | 43,864 | | | $ | 21,363 | | | $ | 98,327 | | | $ | 50,642 | | | $ | 11,383 | | | $ | — | | | $ | 225,579 | |
| | | | | | | | | | | | | | |
| Net new par/equity commitments | | 2,808 | | | 8,351 | | | 15,960 | | | 12,508 | | | 387 | | | 379 | | | 40,393 | |
| Net new debt commitments | | 1,978 | | | 400 | | | 8,492 | | | 3,826 | | | 201 | | | — | | | 14,897 | |
| Capital reductions | | (858) | | | — | | | (1,935) | | | (1,065) | | | — | | | — | | | (3,858) | |
| Distributions | | (319) | | | (1,484) | | | (2,976) | | | (1,977) | | | (429) | | | — | | | (7,185) | |
| Redemptions | | (2,069) | | | (984) | | | (290) | | | (2) | | | — | | | — | | | (3,345) | |
| Net allocations among investment strategies | | (33) | | | 4,291 | | | — | | | — | | | 25 | | | (25) | | | 4,258 | |
| Change in fund value | | 1,928 | | | 1,949 | | | 5,495 | | | 4,332 | | | 353 | | | — | | | 14,057 | |
| Balance at 12/31/2023 | | $ | 47,299 | | | $ | 33,886 | | | $ | 123,073 | | | $ | 68,264 | | | $ | 11,920 | | | $ | 354 | | | $ | 284,796 | |
| | | | | | | | | | | | | | |
| | Liquid
Credit | | Alternative
Credit | | U.S. Direct
Lending | | European
Direct Lending | | APAC
Credit | | Other | | Total Credit
Group |
| Balance at 12/31/2021 | | $ | 40,335 | | | $ | 17,424 | | | $ | 85,849 | | | $ | 49,102 | | | $ | 8,695 | | | $ | — | | | $ | 201,405 | |
| | | | | | | | | | | | | | |
| Net new par/equity commitments | | 3,126 | | | 4,628 | | | 7,137 | | | 1,476 | | | 1,782 | | | — | | | 18,149 | |
| Net new debt commitments | | 3,777 | | | — | | | 7,310 | | | 1,901 | | | 1,474 | | | — | | | 14,462 | |
| Capital reductions | | (237) | | | (45) | | | (991) | | | (2) | | | (5) | | | — | | | (1,280) | |
| Distributions | | (117) | | | (1,752) | | | (2,269) | | | (1,182) | | | (737) | | | — | | | (6,057) | |
| Redemptions | | (1,699) | | | (456) | | | (260) | | | — | | | — | | | — | | | (2,415) | |
| Net allocations among investment strategies | | (8) | | | 1,983 | | | — | | | — | | | — | | | — | | | 1,975 | |
| Change in fund value | | (1,313) | | | (419) | | | 1,551 | | | (653) | | | 174 | | | — | | | (660) | |
| Balance at 12/31/2022 | | $ | 43,864 | | | $ | 21,363 | | | $ | 98,327 | | | $ | 50,642 | | | $ | 11,383 | | | $ | — | | | $ | 225,579 | |
| | | | | | | | | | | | | | | |
| (1) Activity within Other represents equity commitments to the platform that have not yet been allocated to an investment strategy. |
The components of our AUM for the Credit Group are presented below ($ in billions):
| | | | | | | | | | | | | | | | | | | | |
| | FPAUM | | AUM not yet paying fees | | Non-fee paying(1) | | General partner and affiliates |
(1) Includes $9.0$15.1 billion and $7.9$14.4 billion of AUM of funds from which we indirectly earn management fees as of December 31, 20202023 and 2019,2022, respectively, and includes $1.5 billion and $1.2 billion of non-fee paying AUM based on our general partner commitment as of December 31, 2023 and 2022, respectively.
Credit Group—Fee Paying AUM
The tables below present rollforwards of fee paying AUM for the Credit Group:Group ($ in millions):
| | | | | | | | | ($ in millions) | | Syndicated Loans | | High Yield | | Multi-Asset Credit | | Alternative Credit | | U.S. Direct Lending | | European Direct Lending | | Total Credit Group |
| FPAUM Balance at 12/31/2019 | $ | 21,458 | | | $ | 3,495 | | | $ | 2,144 | | | $ | 4,340 | | | $ | 27,876 | | | $ | 12,567 | | | $ | 71,880 | |
| Acquisitions | 2,596 | | | — | | | — | | | — | | | — | | | — | | | 2,596 | |
| Liquid
Credit | |
| | Liquid
Credit | |
| | Liquid
Credit | | | Alternative
Credit | | U.S. Direct
Lending | | European
Direct Lending | | APAC
Credit | | | | Total Credit
Group |
| Balance at 12/31/2022 | |
| | Commitments | Commitments | 3,364 | | | 438 | | | 468 | | | 469 | | | 491 | | | — | | | 5,230 | |
| Subscriptions/deployment/increase in leverage | 15 | | | 13 | | | 91 | | | 2,282 | | | 6,892 | | | 4,316 | | | 13,609 | |
| Commitments | |
| Commitments | |
| Deployment/subscriptions/increase in leverage | |
| Capital reductions | Capital reductions | (139) | | | — | | | (59) | | | (227) | | | (934) | | | (301) | | | (1,660) | |
| Distributions | Distributions | (49) | | | — | | | (41) | | | (481) | | | (2,371) | | | (715) | | | (3,657) | |
| Redemptions | Redemptions | (283) | | | (1,127) | | | (278) | | | (306) | | | (93) | | | (41) | | | (2,128) | |
| Net allocations among investment strategies | |
| Change in fund value | Change in fund value | 209 | | | 82 | | | 132 | | | 254 | | | 476 | | | 1,034 | | | 2,187 | |
| Change in fee basis | — | | | (40) | | | — | | | — | | | — | | | — | | | (40) | |
| FPAUM Balance at 12/31/2020 | $ | 27,171 | | | $ | 2,861 | | | $ | 2,457 | | | $ | 6,331 | | | $ | 32,337 | | | $ | 16,860 | | | $ | 88,017 | |
Average FPAUM(1) | $ | 24,510 | | | $ | 2,901 | | | $ | 2,193 | | | $ | 5,110 | | | $ | 29,653 | | | $ | 14,773 | | | $ | 79,140 | |
| | Balance at 12/31/2023 | |
| Balance at 12/31/2023 | |
| Balance at 12/31/2023 | |
| | Syndicated Loans | | High Yield | | Multi-Asset Credit | | Alternative Credit | | U.S. Direct Lending | | European Direct Lending | | Total Credit Group |
| FPAUM Balance at 12/31/2018 | $ | 18,328 | | | $ | 4,025 | | | $ | 2,196 | | | $ | 2,826 | | | $ | 21,657 | | | $ | 8,815 | | | $ | 57,847 | |
| Liquid
Credit | |
| Liquid
Credit | |
| Liquid
Credit | | | Alternative
Credit | | U.S. Direct
Lending | | European
Direct Lending | | APAC
Credit | | | | Total Credit
Group |
| Balance at 12/31/2021 | |
| | Commitments | Commitments | 3,811 | | | 162 | | | 112 | | | 681 | | | 231 | | | — | | | 4,997 | |
| Subscriptions/deployment/increase in leverage | 354 | | | 4 | | | 38 | | | 1,230 | | | 7,451 | | | 4,597 | | | 13,674 | |
| Commitments | |
| Commitments | |
| Deployment/subscriptions/increase in leverage | |
| Capital reductions | Capital reductions | (683) | | | — | | | (10) | | | — | | | (596) | | | (268) | | | (1,557) | |
| Distributions | Distributions | (55) | | | (22) | | | (101) | | | (276) | | | (1,435) | | | (396) | | | (2,285) | |
| Redemptions | Redemptions | (438) | | | (1,115) | | | (340) | | | (290) | | | (51) | | | (370) | | | (2,604) | |
| Net allocations among investment strategies | |
| Change in fund value | Change in fund value | 141 | | | 441 | | | 249 | | | 169 | | | 858 | | | 323 | | | 2,181 | |
| Change in fee basis | Change in fee basis | — | | | — | | | — | | | — | | | (239) | | | (134) | | | (373) | |
| FPAUM Balance at 12/31/2019 | $ | 21,458 | | | $ | 3,495 | | | $ | 2,144 | | | $ | 4,340 | | | $ | 27,876 | | | $ | 12,567 | | | $ | 71,880 | |
Average FPAUM(1) | $ | 20,099 | | | $ | 3,735 | | | $ | 2,118 | | | $ | 3,631 | | | $ | 24,880 | | | $ | 10,815 | | | $ | 65,278 | |
| Balance at 12/31/2022 | |
| (1) Represents a five-point average of quarter-end balances for each period. | |