UNITED STATES
SECURITIES AND EXCHANGE COMMISSION
Washington, D.C.DC 20549

FORM 10-K
10-K/A
(Amendment No. 1)
(Mark One)
ANNUAL REPORT PURSUANT TO SECTION 13 OR 15(d) OF THE SECURITIES EXCHANGE ACT OF 1934
For the fiscal year ended December 31, 2023
FOR THE FISCAL YEAR ENDEDDecember 31, 2021
OR
TRANSITION REPORT PURSUANT TO SECTION 13 OR 15(d) OF THE SECURITIES EXCHANGE ACT OF 1934
For the transition period from ___________ to ____________    
Commission file number:File Number:
1-7933

Aon plc
(Exact name of registrant as specified in its charter)
Ireland
98-1539969
IRELAND98-1539969
(State or other jurisdiction of
(I.R.S. Employer
incorporation or organization)
(I.R.S. Employer
Identification No.)
Metropolitan Building, James Joyce Street, Dublin 1, Ireland D01 K0Y8
     (Address
(Address of principal executive offices)Principal Executive Offices) (Zip Code)
+353 1 266 6000
(Registrant’s Telephone Number,telephone number, including area code)

Securities registered pursuant to Section 12(b) of the Act:
Title of Each Class
Trading Symbol
Name of Each Exchange on Which Registered 
Title of each classTrading Symbol(s)Name of each exchange
on which registered
Class A Ordinary Shares $0.01 nominal valueAONNew York Stock Exchange
Guarantees of Aon plc’s 4.00% Senior Notes due 2023AON23New York Stock Exchange
Guarantees of Aon plc’s 3.50% Senior Notes due 2024AON24New York Stock Exchange
Guarantees of Aon plc’s 3.875% Senior Notes due 2025AON25New York Stock Exchange
Guarantees of Aon plc’s 2.875% Senior Notes due 2026AON26New York Stock Exchange
Guarantees of Aon Corporation and Aon Global Holdings plc’s 2.85% Senior Notes due 2027AON27New York Stock Exchange
Guarantees of Aon Corporation and Aon Global Holdings plc’s 2.05% Senior Notes due 2031AON31New York Stock Exchange
Guarantees of Aon Corporation and Aon Global Holdings plc’s 2.60% Senior Notes due 2031AON31ANew York Stock Exchange
Guarantees of Aon Corporation and Aon Global Holdings plc’s 5.00% Senior Notes due 2032AON32New York Stock Exchange
Guarantees of Aon Corporation and Aon Global Holdings plc’s 5.35% Senior Notes due 2033AON33New York Stock Exchange
Guarantees of Aon plc’s 4.25% Senior Notes due 2042AON42New York Stock Exchange
Guarantees of Aon plc’s 4.45% Senior Notes due 2043AON43New York Stock Exchange
Guarantees of Aon plc’s 4.60% Senior Notes due 2044AON44New York Stock Exchange
Guarantees of Aon plc’s 4.75% Senior Notes due 2045AON45New York Stock Exchange
Guarantees of Aon Corporation and Aon Global Holdings plc’s 2.90% Senior Notes due 2051AON51New York Stock Exchange
Guarantees of Aon Corporation and Aon Global Holdings plc’s 3.90% Senior Notes due 2052AON52New York Stock Exchange
Guarantees of Aon North America, Inc.’s 5.125% Senior Notes due 2027AON27BNew York Stock Exchange
Guarantees of Aon North America, Inc.’s 5.150% Senior Notes due 2029AON29New York Stock Exchange
Guarantees of Aon North America, Inc.’s 5.300% Senior Notes due 2031AON31BNew York Stock Exchange
Guarantees of Aon North America, Inc.’s 5.450% Senior Notes due 2034AON34New York Stock Exchange
Guarantees of Aon North America, Inc.’s 5.750% Senior Notes due 2054AON54New York Stock Exchange
Securities
Securities registered pursuant to Section 12(g)12 (g) of the Act: NONENone.

Indicate by check mark if the registrant is a well-known seasoned issuer, as defined in Rule 405 of the Securities Act.
Yes  No
Indicate by check mark if the registrant is not required to file reports pursuant to Section 13 or Section 15(d) of the Exchange Act.
Yes  No 
Indicate by check mark whether the registrant (1) has filed all reports required to be filed by Section 13 or 15(d) of the Securities Exchange Act of 1934 during the preceding 12 months (or for such shorter period that the registrant was required to file such reports), and (2) has been subject to such filing requirements for the past 90 days. 
Yes ☒ No
Indicate by check mark whether the registrant has submitted electronically every Interactive Data File required to be submitted pursuant to Rule 405 of Regulation
S-T
232.405 of this chapter) during the preceding 12 months (or for such shorter period that the registrant was required to submit such files). 
Yes ☒ No
Indicate by check mark whether the registrant is a large accelerated filer, an accelerated filer, a
non-accelerated
filer, a smaller reporting company or an emerging growth company. See the definitions of “large accelerated filer,”filer”, “accelerated filer,”filer”, “smaller reporting company,”company” and “emerging growth company” in Rule
12b-2
of the Exchange Act.
Large Accelerated FilerAccelerated filer
Large accelerated
Non-accelerated
filer
Accelerated filerNon-accelerated filerSmaller reporting company
Emerging growth company
If an emerging growth company, indicate by check mark if the registrant has elected not to use the extended transition period for complying with any new or revised financial accounting standards provided pursuant to Section 13(a) of the Exchange Act.
Indicate by check mark whether the registrant has filed a report on and attestation to its management’s assessment of the effectiveness of its internal control over financial reporting under Section 404(b) of the Sarbanes-Oxley Act (15 U.S.C. 7262(b)) by the registered public accounting firm that prepared or issued its audit report.
If securities are registered pursuant to Section 12(b) of the Act, indicate by check mark whether the financial statements of the registrant included in the filing reflect the correction of an error to previously issued financial statements. ☐
Indicate by check mark whether any of those error corrections are restatements that required a recovery analysis of incentive-based compensation received by any of the registrant’s executive officers during the relevant recovery period pursuant to
§240.10D-1(b). 
Indicate by check mark whether the registrant is a shell company (as defined in Rule
12b-2
of the Exchange Act).
Yes  No
As of June 30, 2021,2023, the aggregate market value of the registrant’s Class A Ordinary Shares held by
non-affiliates
of the registrant was $53,867,751,208$70,135,237,097 based on the closing sales price as reported on the New York Stock Exchange — Composite Transaction Listing.
Number of the registrant’s Class A Ordinary Shares of Aon plc, $0.01 nominal value, outstanding as of February 17, 2022: 213,944,460.o
f April 12, 202
4: 198,506,718.
DOCUMENTS INCORPORATED BY REFERENCE
PortionsNone.

EXPLANATORY NOTE
This Amendment No. 1 on Form
10-K/A
(this “Amendment”) amends our Annual Report on Form
10-K
for the registrant’s proxy statement for its 2022 Annualfiscal year ended December 31, 2023, originally filed with the Securities and Exchange Commission (the “SEC”) on February 16, 2024 (the “Original Filing”). The Original Filing omitted Part III, Items 10 (Directors, Executive Officers and Corporate Governance), 11 (Executive Compensation), 12 (Security Ownership of Certain Beneficial Owners and Management and Related Stockholder Matters), 13 (Certain Relationships and Related Transactions, and Director Independence) and 14 (Principal Accountant Fees and Services) in reliance on General Meeting of Shareholders areInstruction G(3) to Form
10-K,
which provides that such information may be either incorporated by reference from the registrant’s definitive proxy statement or included in an amendment to Form 10-K, in either case filed with the Securities and Exchange Commission (the “SEC”) not later than 120 days after the end of the fiscal year. We are filing this report in responseAmendment solely to amend Part III, Items 10, 11, 12, 13 and 14.14 of the Original Filing to include the information required by such Items.


In addition, in connection with the filing of this Amendment and pursuant to the rules of the SEC, we are including with this Amendment new certifications of our principal executive officer and principal financial officer pursuant to Section 302 of the Sarbanes-Oxley Act of 2002. Item 15 of Part IV has also been amended to reflect the filing of these new certifications.
Except as described above, no other changes have been made to the Original Filing. The Original Filing continues to speak as of the date of the Original Filing, and we have not updated the disclosures contained therein to reflect any events which occurred at a date subsequent to the filing of the Original Filing.
Unless otherwise indicated or unless the context requires otherwise, all references in this Amendment to “we,” “us,” “our,” “our Company” or “the Company” refer to Aon plc, an Irish public limited company, together with its consolidated subsidiaries.
As previously announced, on December 19, 2023, Aon entered into a definitive agreement with Randolph Acquisition Corp., a Delaware corporation and an indirect, wholly owned subsidiary of Aon (the “Acquirer”), Randolph Merger Sub LLC, a Delaware limited liability company and a direct, wholly owned subsidiary of the Acquirer, NFP Intermediate Holdings A Corp., a Delaware corporation (“NFP”), and NFP Parent Co, LLC, a Delaware limited liability company, pursuant to which the Acquirer will acquire NFP.
i


Information Concerning Forward-Looking Statements
This reportAmendment contains certain statements related to future results, or states our intentions, beliefs, and expectations or predictions for the future, all of which are forward-looking statements as that term is defined in the Private Securities Litigation Reform Act of 1995.1995, Section 27A of the Securities Act of 1933, as amended, (the “Securities Act”) and Section 21E of the Securities Exchange Act of 1934, as amended (the “Exchange Act”). Forward-looking statements represent management’s expectations or forecasts of future events. These statements include statements about our plans, objectives, strategies, financial performance and outlook, trends, prospects or other future events and involve known and unknown risks that are difficult to predict. Forward-looking statements are typically identified by words such as “anticipate,” “believe,” “estimate,” “expect,” “forecast,” “project,” “intend,” “plan,” “probably,” “potential,” “looking forward,” “continue,” and other similar terms, and future or conditional tense verbs like “could,” “may,” “might,” “should,” “will,” and “would.” You can also identify forward-looking statements by the fact that they do not relate strictly to historical or current facts. For example, we may use forward-looking statements when addressing topics such as: market and industry conditions, including competitive and pricing trends; changes in our business strategies and methods of generating revenue; the development and performance of our services and products; changes in the composition or level of our revenues; our cost structure and the outcome of cost-saving or restructuring initiatives;initiatives, including the impacts of the Accelerating Aon United Program; the pending acquisition of NFP; the outcome of contingencies; dividend policy; the expected impact of acquisitions, dispositions, and other significant transactions or the termination thereof; litigation and regulatory matters; pension obligations; cash flow and liquidity; expected effective tax rate; expected foreign currency translation impacts; potential changes in laws or future actions by regulators; and the impact of changes in accounting rules. These forward-looking statements are subject to certain risks and uncertainties that could cause actual results to differ materially from either historical or anticipated results depending on a variety of factors. Potential factors, which may be revised or supplemented in subsequent reports filed or furnished with the Securities and Exchange Commission (the “SEC”),SEC, that could impact results include:
changes in the competitive environment, due to macroeconomic conditions (including impacts from instability in the banking or commercial real estate sectors) or otherwise, or damage to our reputation;
fluctuations in currency exchange, and interest, or inflation rates that could impact our financial condition or results;
changes in global equity and fixed income markets that could affect the return on invested assets;
changes in the funded status of our various defined benefit pension plans and the impact of any increased pension funding resulting from those changes;
the level of our debt and the terms thereof reducing our flexibility or increasing borrowing costs;
rating agency actions that could limit our access to capital and our competitive position;
our global tax rate being subject to a variety of different factors, including the adoption and implementation in the European Union, the United States, the United Kingdom, or other countries of the Organization for Economic
Co-operation
and Development tax proposals or other pending proposals in those and other countries, which could create volatility in that tax rate;
changes in our accounting estimates and assumptions on our financial statements;
limits on our subsidiaries’ ability to pay dividends or otherwise make payments to us;their respective parent entities;
the impact of legal proceedings and other contingencies, including those arising from acquisition or disposition transactions, errors and omissions and other claims against us;us (including proceedings and contingencies relating to transactions for which capital was arranged by Vesttoo Ltd.);
ii

Table of Contents
the impact of, and potential challenges in complying with, laws and regulations of the jurisdictions in which we operate, particularly given the global nature of operations and the possibility of differing or conflicting laws and regulations, or the application or interpretation thereof, across such jurisdictions;
the impact of any regulatory investigations brought in Ireland, the United Kingdom, (the “U.K.”), the United States, (the “U.S.”). and other countries;
failure to protect intellectual property rights or allegations that we have infringed on the intellectual property rights of others;
general economic and political conditions in the countries in which we do business around the world, including the withdrawal of the U.K. from the European Union (the “E.U.”);world;
the failure to retain, attract and develop experienced and qualified personnel;personnel, whether as a result of the pending acquisition of NFP or otherwise;
international risks associated with our global operations;operations, including impacts from military conflicts or political instability, such as the ongoing Russian war in Ukraine and the Israel-Hamas conflict;
the effects of natural or
man-made
disasters, including the effects of the COVID-19 and other health pandemics and the impacts of climate change;

3


climate-related events;
the potential for a
any system or network disruption or breach to resultresulting in operational interruption or improper disclosure of confidential, personal, or proprietary data, and resulting liabilities or damage to our reputation;
our ability to develop, implement, update, and implementenhance new technology;
the actions taken by third parties that perform aspects of our business operations and client services;
the extent to which we are exposed to certain risks, including lawsuits, related to our actions we may take in being responsible for making decisions on behalf of clients in our investment consulting businessbusinesses or in other advisory services that we currently provide, or will provide in the future;
our ability to continue, and the costs and risks associated with growing, developing and integrating acquired business, and entering into new lines of business or products;
our ability to secure regulatory approval and complete transactions, including the pending acquisition of NFP, and the costs and risks associated with the failure to consummate proposed transactions;
changes in commercial property and casualty markets, commercial premium rates or methods of compensation;
our ability to develop and implement innovative growth strategies and initiatives intended to yield cost savings (including the Accelerating Aon United Program) and the ability to achieve thosesuch growth or cost savings; and
the effects of Irish law on our operating flexibility and the enforcement of judgments against us.us;
adverse effects on the market price of Aon’s securities and/or operating results for any reason, including, without limitation, because of a failure to consummate the pending acquisition of NFP or the failure to realize the expected benefits of the pending acquisition of NFP (including anticipated revenue and growth synergies) in the expected timeframe, or at all;
significant transaction and integration costs or difficulties in connection with the pending acquisition of NFP or unknown or inestimable liabilities; and
iii

potentia
l impact of the consummation of the pending acquisition of NFP on relationships, including with suppliers, customers, employees and regulators.
Any or all of our forward-looking statements may turn out to be inaccurate, and there are no guarantees about our performance. The factors identified above are not exhaustive. Aon and its subsidiaries operate in a dynamic business environment in which new risks may emerge frequently. Accordingly, readers should not place undue reliance on forward-looking statements, which speak only as of the dates on which they are made. We are under no (and expressly disclaim any) obligation to update or alter any forward-looking statement that we may make from time to time, whether as a result of new information, future events, or otherwise. Further information about factors that could materially affect Aon, including our results of operations and financial condition, is contained in the “Risk Factors” section in Part I, Item 1A of this report.the Original Filing.
4iv


Aon plc
INDEX TO FORM
10-K/A
For the Year Ended December 31, 2023
Aon plc Consolidated Statements of Shareholders' Equity
1
9
53
56
57
58
59
A-1

5v


The below definitions apply throughout this report unless the context requires otherwise:
TermDefinition
ABOAccumulated Benefit Obligation
AGIAllianz Global Investors U.S. LLC
ASCAccounting Standards Codification
BPSBasis Points
CCCChristchurch City Council
CODMChief Operating Decision Maker
CPIConsumer Price Index
DCFDiscounted Cash Flow
DOJDepartment of Justice
E&OErrors and Omissions
EBITDAEarnings before Interest, Taxes, Depreciation, and Amortization
ERISAEmployee Retirement Income Security Act of 1974
ESGEnvironmental, Social, Corporate Governance
E.U.European Union
FASBFinancial Accounting Standards Board
FCAFinancial Conduct Authority
FINRAFinancial Industry Regulatory Authority
FitchFitch, Inc.
GAAPGenerally Accepted Accounting Principles
GILTIGlobal Intangible Low-Tax Income
HSR ActHart-Scott-Rodino Antitrust Improvements Act
I&DInclusion and Diversity
LOCLetter of Credit
LPPLeadership Performance Plan
MDIMarket Derived Income
NEBCNational Employee Benefits Committee
NYSENew York Stock Exchange
OECDOrganization for Economic Co-operation and Development
PBOProjected Benefit Obligation
PCAOBPublic Company Accounting Oversight Board
PSAPerformance Share Awards
REITReal Estate Investment Trusts
ROURight-of-use
RPGICRetirement Plan Governance and Investment Committee
RSURestricted Share Units
S&PStandard & Poor’s
SECSecurities and Exchange Commission
U.K.United Kingdom
U.S.United States
VIEVariable Interest Entity
WTWWillis Towers Watson Public Limited Company
6


PART I

Item 1.    Business
OVERVIEW
Aon plc (which may be referredIII

ITEM 10. Directors, Executive Officers and Corporate Governance.

Executive Officers

Information relating to as “Aon,” the “Company,” “we,” “us,” or “our”)Aon’s executive officers is a leading global professional services firm providing a broad range of risk, health, and wealth solutions. Through our experience, global reach, and comprehensive analytics, we are better able to help clients meet rapidly changing, increasingly complex, and interconnected challenges. We are committed to accelerating innovation to address unmet and evolving client needs, so that our clients are better informed, better advised, and able to make better decisions to protect and grow their business. Management is focused on strengthening Aon and uniting the firm with one portfolio of capability enabled by data and analytics and one operating model to deliver additional insight, connectivity, and efficiency.

Our clients are in over 120 countries and include all market segments and almost every industry. This diversification of our customer base helps provide us stability in different economic scenarios that could affect specific industries, customer segments, or geographies.
We have continued to focus our portfolio on higher-margin, capital-light professional services businesses that have high recurring revenue streams and strong cash flow generation. We endeavor to make capital allocation decisions based upon return on invested capital.
BUSINESS SEGMENT
The Company operates as one segment that includes all of Aon’s continuing operations, which, as a global professional services firm, provides advice and solutions to clients focused on risk, health and wealth through four principal products and services: Commercial Risk Solutions, Reinsurance Solutions, Health Solutions, and Wealth Solutions. Collectively, these products and service lines make up our one segment: Aon United. In addition, the Company is continuing to expand on Aon United growth initiatives through its New Ventures Group.
In 2021, our consolidated total revenue was $12,193 million. This includes $6,635 million in Commercial Risk Solutions, $1,997 million in Reinsurance Solutions, $2,154 million in Health Solutions, and $1,426 million in Wealth Solutions, before intercompany eliminations.
Principal Products and Services
Commercial Risk Solutions includes retail brokerage, specialty solutions, global risk consulting and captives management, and Affinity programs. In retail brokerage, our dedicated teams of risk professionals utilize comprehensive analytics capabilities and insights providing clients with risk advice for their organizations. We utilize Aon’s differentiated capabilities in industry sector- and segment-specific approaches to risk transfer options and deliver them through a variety of channels including bespoke solutions for complex needs, structured solutions for mid-market and small and medium-sized enterprises, and digital distribution including CoverWallet. Our specialty-focused organizational structure includes financial and professional lines, cyber, surety and trade credit, crisis management, transaction liability, and intellectual property. We develop market leading insights on the most efficient risk transfer vehicles for clients in today’s complex and integrated risk environment to enable clients to make better decisions. Global risk consulting and captive management is a global leader in supporting better management of companies’ risk profiles by identifying and quantifying the risks they face, mapping out optimal risk mitigation, retention and transfer solutions and thus enabling them to be more informed to make better decisions for their businesses. Affinity programs include development, marketing, and administration of customized and targeted insurance programs, facilities, and other structured solutions, including Aon Client Treaty. We collaborate with sponsors and other privileged distribution channels through which Aon can deliver differentiated, highly targeted, and highly valuable solutions for unique risk solutions.
Reinsurance Solutions includes treaty reinsurance, facultative reinsurance, and capital markets. Treaty reinsurance addresses underwriting and capital objectives on a portfolio level, allowing our clients to more effectively manage the combination of premium growth, return on capital, and rating agency interests on an integrated basis. This includes the development of more competitive, innovative, and efficient risk transfer options. Facultative reinsurance empowers clients to better understand, manage, and transfer risk through innovative facultative solutions and provides the most efficient access to the global facultative reinsurance markets. Capital markets is a global investment bank with expertise in insurance-linked securities, capital raising, strategic advice, restructuring, and mergers and acquisitions. We partner with insurers, reinsurers, investment firms, and corporations in executing innovative risk management products, capital market solutions and corporate finance advisory services.
7


Health Solutions includes consulting and brokerage, voluntary benefits and enrollment solutions, and human capital solutions. Consulting and brokerage develops and implements innovative, customized health and benefits strategies for clients of all sizes across industries and geographies to manage risk, drive engagement, and strengthen the workforce through improved health and well-being. We partner with insurers and other strategic partners to develop and implement new and innovative solutions and leverage world-class analytics and technology to help clients make informed decisions and manage healthcare outcomes. Consulting and brokerage also advises multinational companies on global benefits, including insurance placement across more than 120 countries, program design and management, financing optimization, and enhanced employee experience, as well as assists in navigating global regulatory and compliance requirements in countries in which they operate. Voluntary benefits and enrollment solutions designs and delivers innovative voluntary consumer benefits that improve an employer’s total rewards strategy and positively impacts their employees’ financial and overall well-being. We leverage our proprietary digital platform to provide efficient enrollment strategies through an effective combination of data, analytics, and tailored products. Multi-channel and targeted communications solutions increase consumer benefit knowledge and enhance engagement. Our human capital team delivers data, analytics, and advice to business leaders so they can make better workforce decisions and align their business and people strategies. We support clients across the full employee lifecycle, including talent assessment and selection, compensation benchmarking, total rewards strategy optimization, workforce analytics and benchmarking, workforce resilience planning, human capital integration in transaction situations, Corporate Governance, ESG consulting and strategic employee communication.
Wealth Solutions includes retirement consulting, pension administration, and investments consulting. Retirement consulting specializes in providing clients across the globe with strategic design consulting on their retirement programs, actuarial services, and risk management, including pension de-risking, governance, integrated pension administration and legal and compliance consulting. We also help organizations manage their balance sheet volatility. Retirement consulting and pension administration leverage Aon’s pension expertise to deliver high-quality integrated retirement services. Our customized services include outsourcing, co-sourcing and in-sourcing options. Our partnership-driven model is powered by deep pension experience and enabled with smart technology. Our investments consulting team provides public and private companies and other institutions with advice on developing and maintaining investment programs across a broad range of plan types, including defined benefit plans, defined contribution plans, endowments and foundations. Our delegated investment solutions offer ongoing management of investment programs and fiduciary responsibilities either in a partial or full discretionary model for multiple asset owners. We partner with clients to deliver our scale and experience to help them effectively manage their investments, risk, and governance and potentially lower costs. We believe in the power of connecting participants to experts to make better informed and smarter decisions about their wealth.
Revenue and Compensation
Our business generates revenues primarily through commissions, compensation from insurance and reinsurance companies for services we provide to them, and fees from customers. Commissions and fees for brokerage services vary depending upon several factors, which may include the amount of premium, the type of insurance or reinsurance coverage provided, the particular services provided to a client, insurer, or reinsurer, and the capacity in which we act. Compensation from insurance and reinsurance companies includes: (1) fees for consulting and analytics services, and (2) fees and commissions for administrative and other services provided to or on behalf of insurers and reinsurers. Fees from clients for advice and consulting services are dependent on the extent and value of the services we provide. Payment terms are consistent with current industry practices.
Funds Held on Behalf of Clients
We typically hold funds on behalf of clients, including premiums received from clients and claims due to clients that are in transit to and from insurers. Certain funds held on behalf of clients are invested in interest-bearing premium trust accounts and can fluctuate significantly depending on when we collect and remit cash. The principal is segregated and not available for general operating purposes, although we may earn interest on these accounts.
Competition
Our business operates in a highly competitive and fragmented environment. We compete with numerous other global insurance brokers and consulting companies, including Marsh & McLennan Companies, Inc., WTW, Arthur J Gallagher & Company, and Lockton Companies, Inc., as well as numerous other global specialist, regional, and local firms in almost every area of our business. We also compete with insurance and reinsurance companies that directly market and service their insurance products without the assistance of brokers or agents. Additionally, we compete with other businesses that do not fall into the categories above, including large financial institutions and independent consulting firms and consulting organizations affiliated with accounting, information systems, technology, and financial services firms.
8


Seasonality
Due to buying patterns and delivery of certain products and services in the markets we serve, revenues recognized tend to be higher in the first and fourth quarters of each fiscal year.
Licensing and Regulation
Our business activities are subject to licensing requirements and extensive regulation under the laws of countries in which we operate, including U.S. federal and state laws. See the “Risk Factors” sectionset forth in Part I Item 1A of this report for information regarding how actions by regulatory authorities or changes in legislation and regulation in the jurisdictions in which we operate may have an adverse effect on our business.
Regulatory authorities in the U.S. and most other countries in which our operating subsidiaries conduct business may require individuals, entities and related service providers to obtain a license from a government agency, including (but not limited to) licenses to operate as insurance producers, brokers, agents, and consultants, reinsurance brokers or managing general agents.
Certain jurisdictions issue licenses only to resident entities or individuals. In such jurisdictions, if the Company has no licensed subsidiary, we may maintain arrangements with residents or business entities licensed to act in such jurisdiction. Such arrangements are subject to an internal review and approval process.
Our subsidiaries must comply with laws and regulations of the jurisdictions in which they do business. These lawsOriginal Filing and regulations are enforced by the FCA in the U.K., by federal and state agencies in the U.S., and by various regulatory agencies and other supervisory authorities in other countries through the granting and revoking of licenses to do business, the licensing of agents, the monitoring of trade practices, policy form approval, limits on commission rates, and mandatory remuneration disclosure requirements.
Insurance authorities in the U.K., U.S., and certain other jurisdictions in which our subsidiaries operate have enacted laws and regulations governing the investment of funds, such as premiums and claims proceeds, held in a fiduciary capacity for others. These laws and regulations generally require the segregation of these fiduciary funds and limit the types of investments that may be made with them.
Investment, securities, and futures licensing authorities also govern certain business activities. For example, in the U.S., we use Aon Securities LLC, an indirect, wholly owned subsidiary of Aon, and a U.S.-registered broker-dealer and investment advisor, member of FINRA and Securities Investor Protection Corporation, for investment banking, capital advisory services and other broker-dealer activities. Similar operations exist in other jurisdictions outside of the U.S.
Further, pension and financial laws and regulations, including oversight and supervision by the FCA in the U.K., the SEC in the U.S., and regulators in other countries govern certain of the retirement-related consulting services provided by Aon and its subsidiaries and affiliates. This includes Aon subsidiaries that provide investment advisory services regulated by various U.S. federal authorities including the SEC and FINRA, as well as authorities on the state level. In addition, other services provided by Aon and its subsidiaries and affiliates, such as trustee services and retirement and employee benefit program administrative services, are subject in various jurisdictions to pension, investment, securities, and insurance laws and regulations, and supervision.
Clientele
Our clients operate in many businesses and industries throughout the world. No one client accounted for more than 2% of our consolidated total revenues in 2021. Additionally, we place insurance with many insurance carriers, none of which individually accounted for more than 10% of the total premiums we placed on behalf of our clients in 2021.
Human Capital Management
Our Culture
Our culture is driven by our values – committed as one firm to our purpose, united through trust as one inclusive, diverse team, and passionate about making our colleagues and clients successful. Our colleagues are the cornerstone of Aon's success. Collaboration and innovation drive our culture, bringing the best of Aon to clients in a holistic and seamless manner. Our Delivering Aon United strategy defines how Aon colleagues work together to deliver value to clients, setting a new standard for client leadership. Delivering Aon United is brought to life through our common client value creation model which scales strategies from across the firm to bring the best of Aon to clients.
9


Colleagues
As of December 31, 2021, we employed approximately 50,000 employees and conducted our operations in more than 120 countries and territories. Our colleagues’ diverse talents, expertise, and insights contribute to the success of both our firm and our clients, and we seek to attract, grow, and retain the best talent in the industry. Our Inclusive People Leadership strategy is a central part of our Aon United Blueprint and is a key enabler to realizing our aspirations and purpose as a firm. At Aon, all colleagues are called upon to be leaders in embracing and modelling our Aon United values and behaviors. Inclusive People Leadership at Aon ensures that all colleagues – at every stage of their career journey – are equipped and motivated to deliver on our purpose and able to achieve their full potential.
Training and Development
We invest significant resources to develop the talent needed to remain at the forefront of innovation and make Aon an attractive employer. Colleagues are invited to complete a variety of curricula to meet their career stage goals and developmental needs. We provide our colleagues what they need to learn, grow, and become the leaders our clients seek. From self-guided Aon University courses to advanced learning programs, the curriculum is aligned to the Aon United Blueprint and Inclusive People Leader strategy. While the COVID-19 pandemic changed how our colleagues work and collaborate, it did not slow us down. Aon’s investment in technology and use of virtual based learning and development programs during the pandemic has allowed us to continue these efforts despite much of our workforce remaining virtual during 2021.
Colleague Engagement and Retention
Providing an engaging and rewarding colleague experience is a top priority for our firm and understanding colleagues’ feedback helps us reach that goal. We use a variety of channels to facilitate open, on-going, and direct communication with colleagues. These channels include open forums and town halls with executives, surveys, and engagement through our Business Resource Groups. Business Resource Groups are our independent, voluntary, non-profit associations that provide input, take action, and help identify opportunities for our firm to further its diversity and inclusion commitments.
In response to the challenging events of 2020, we updated our engagement survey process by offering more frequent pulse surveys to understand how colleagues are engaging with their teams, the firm, and clients. This outreach effort allows us to gather insights more rapidly and take timely action to address feedback. Our current practice is to conduct pulse surveys with subsets of the overall colleague population approximately six to eight times per year on timely or targeted issues, as well as an annual all-colleague engagement survey. The pulse surveys for 2021 were focused on topics such as manager and leadership support, especially in how we serve clients, colleague well-being, inclusion and diversity, and performance & rewards. Aon’s workforce feedback provides management a better understanding of evolving colleague viewpoints, and ensures we are taking appropriate steps to drive colleague engagement and retention. For discussion of the risks related to the attraction and retention of senior management and other professional personnel, see the “Risk Factors” section in Part I, Item 1A of this report.
Rewards
In addition to an inspired purpose and culture, we are proud to offer our colleagues a total rewards program that combines competitive pay, incentive opportunities, and benefits. Our compensation programs, including salary, recognition, cash and equity incentives, connect to our formal performance management and career development approach. These programs serve to reward colleagues for their impact both in what they accomplish for clients, colleagues, and shareholders and how they achieve those results. We maintain a global commitment to colleague well-being and play a key role in supporting colleagues across the physical, emotional, financial, and social spectrum. Our comprehensive benefit programs are competitive for the markets in which we operate and aligned with our values and culture.
In recognition of our colleagues’ role in growing the firm, we introduced the Aon United Growth Ownership Plan in 2021. Through the plan, all eligible colleagues that were active on September 24, 2021, received a one-time, stock-based award, enabling Aon colleagues to share in the future success of our Aon United mission.
Our compensation philosophy aligns with our Aon United strategy and delivering long-term shareholder value creation. Our executive incentives are based on driving results, delivery of strategic initiatives, and leadership. Beginning in 2021, 20% of the short-term incentives for senior executives are based on quantifiable performance against firm-wide Inclusion and Diversity initiatives.
Inclusion and Diversity
We believe that diverse, inclusive teams produce better insight, better solutions, and ultimately the best outcomes for clients and Aon’s long-term success.
10


We are focused on being a firm that is representative of the communities in which we operate. We achieve this by aligning I&D actions to the following pillars: Recruitment, Education, Promotion, and Representation. We strongly believe that only when colleagues can be their authentic selves will they reach their full potential.
Our commitment to I&D starts from the top with our Board of Directors, including its I&D Sub-Committee. Our Global Inclusive Leadership Council is sponsored by our Chief Executive Officer and Chief People Officer. Regional Inclusive Leadership Councils and our Executive Leadership Teams drive actions to increase the diversity of our teams, and colleague-led Business Resource Groups support execution and provide additional opportunities for colleagues to enhance our inclusive environment.
As of December 31, 2021, Aon’s global workforce was 54% women and 46% men, and the Aon Executive Committee which leads the firm was 45% women and 55% men. At the manager level, 26% of senior leaders and 42% of managers with one or more direct report were women. New colleague hires for the year were 52% women and 48% men. Aon’s U.S. workforce was 24% racially or ethnically diverse, calculated as a percentage of colleagues that have voluntarily disclosed their race or ethnicity to Aon. At the manager level, 13% of U.S. senior leaders and 17% of U.S. managers with one or more direct report were racially or ethnically diverse. New colleague hires for the year in the U.S. were 34% racially or ethnically diverse.
Our Apprenticeship Program
Apprenticeship programs help build a talent pipeline of highly skilled and diverse professionals while providing apprentices with advanced education and work experience. By removing some of the traditional barriers to entry-level employment, Aon can contribute to local workforce development and cultivate talent while improving retention rates in these entry-level roles. As a founding member of six apprentice networks within the U.S., we partner with companies and organizations to assist them in building their own programs through sharing best practices and learnings. Across these networks, we have over 100 organizations committed as of December 31, 2021.
Aon's two-year Apprenticeship Program, which was implemented in the U.K. and U.S. in 2012 and 2017, respectively, serves as an alternate route into a permanent role that normally requires a specific degree or professional experience. Aon provides motivated, high-potential individuals with the required training (on the job and in the classroom), professional skills development, mentorship, and experiential learning to bridge the gap. Over 440 Aon apprentices have been hired since the inception of the program across the U.S. and U.K. Both programs are certified apprenticeship programs, by the Department of Labor in the U.S. and the Department of Education in the U.K. In 2021, we expanded our U.S. program to include additional U.S. cities outside of Chicago's metropolitan area to the following six metropolitan areas hiring over 100 apprentices and partnering with seven additional community colleges: Houston, Minneapolis, New York, Philadelphia, San Francisco, and Washington, DC.
Website Access to Reports and Other Information
Our Annual Report on Form 10-K, Quarterly Reports on Form 10-Q, Current Reports on Form 8-K, and all amendments to those reports are made available free of charge through our website (http://www.aon.com) as soon as reasonably practicable after such material is electronically filed with or furnished to the SEC. Also posted on our website are the charters for our Audit, Organization and Compensation, Governance/Nominating, and Finance Committees, and Compliance and Inclusion & Diversity Sub-Committees, our Governance Guidelines, and our Code of Business Conduct. Within the time period required by the SEC and the NYSE, we will post on our website any amendment to or waiver of the Code of Business Conduct applicable to any executive officer or director. In addition, we may announce material information to investors and the marketplace using our investor relations website. While not all of the information that we post to such website is of a material nature, some information could be deemed to be material. Accordingly, we encourage investors, the media, and others interested in our company to review the information that we share at our investor relations link located at the bottom of the page on www.aon.com. The information provided on our website is not part of this report and is therefore not incorporated herein by reference.
Item 1A.    Risk Factors
On April 1, 2024, Ms. Davies notified the Company of her intention to retire from the position of Chief Financial Officer. Ms. Davies is expected to serve as Chief Financial Officer into the third quarter of 2024 and is thereafter expected to serve as a senior advisor for a transition period into 2025.

Directors

The risk factors set forth below reflect risks associatedterm of each director expires at the next annual general meeting of shareholders (the “Annual Meeting”), and each director will continue in office until the election of his or her respective successor or until his or her earlier resignation or removal in accordance with our existing and potential businessesthe Company’s articles of association (the “Articles”) or the Irish Companies Act 2014, as amended. Consistent with the terms of the Articles, the Company’s board of directors (the “Board”) currently is authorized to have up to 21 directors, and the industries in which we operate generally and contain “forward-looking statements” as discussed in the “Business” Sectionnumber of Part I, Item 1 of this report. Readers should consider these risks in addition to the other information contained in this report because our business, financial condition, or results of operations could be materially adversely affected if any of these risks were to actually occur and the occurrence of such risks could cause our actual results to differ materially from those stated in or implieddirectors was most recently set by the forward-looking statements in this document and elsewhere.

11


Risks RelatedBoard at 13. Carolyn Y. Woo has decided to Our Business
An overall decline in economic and business activity could have a material adverse effect onretire from the financial condition and results of operations of our business.
The results of our operations are generally affected by the level of business activity of our clients, which in turn is affected by the economy of the industries and markets these clients serve. Economic downturns, volatility, or uncertainty in the broader economy or in specific markets (including as a result of endemics or pandemics, climate change, political unrest, or otherwise) may cause reductions in technology and discretionary spending by our clients, which may result in reductions in the growth of new business or reductions in existing business. If our clients become financially less stable, enter bankruptcy, liquidate their operations or consolidate, our revenues and collectability of receivables could be adversely affected.
The demand for property and casualty insurance generally rises as the overall level of economic activity increases and generally falls as such activity decreases, affecting both the commissions and fees generated by our Commercial Risk Solutions, Reinsurance Solutions, and Wealth Solutions lines. The economic activity that impacts property and casualty insurance is most closely correlated with employment levels, corporate revenues, and asset values. Downward fluctuations in the year-over-year insurance premiums charged by insurers to protect against the same risk, referred to in the industry as softening of the insurance market, could adversely affect these businesses as a significant portion of the earnings are determined as a percentage of premiums charged to our clients. In addition, certain discretionary services within our business, such as Human Capital, project-related work within Commercial Risk Solutions and Health Solutions, and transaction liability, may see a decrease in activity if the overall level of economic activity results in a reduction to our clients’ discretionary spending. Insolvencies and consolidations associated with an economic downturn, especially insolvencies in the insurance industry, could adversely affect our brokerage business through the loss of clients by hampering our ability to place insurance and reinsurance business. Also, error and omission claims against us, which we refer to as E&O claims, may increase in economic downturns, also adversely affecting our business.
We face significant competitive pressures from traditional and non-traditional competitors that could affect our business.
As a global professional services firm, we compete with global, national, regional, and local insurance companies that market and service their own products, other financial services providers, brokers, and investment managers, independent firms, and consulting organizations affiliated with accounting, information systems, technology, and financial services firms. We compete with respect to service, delivery of insights, product features, price, commission structure, technology, financial strength, ability to access certain insurance markets, and name recognition. Our competitors may have better financial, technical and marketing resources, broader customer bases, greater name recognition, more comprehensive products, stronger presence in certain geographies, or more established relationships with their customers and suppliers than we have.
In addition, alliances among competitors or mergers of competitors could affect our business, and some of our competitors may have or may develop a lower cost structure, adopt more aggressive pricing policies, or provide services that gain greater market acceptance than the services that we offer or develop.
Our competitors may be more successful in innovating and delivering services to meet new and existing client needs. Competitors may be able to respond to the need for technological changes, innovate faster, respond better to evolving client demand and industry conditions, or price their services more aggressively than we do. They may also compete for skilled professionals, finance acquisitions, fund internal growth, and compete for business more effectively than we do. Further, new and non- traditional competitors, our clients’ increasing ability and determination to self-insure, and capital market alternatives to traditional insurance and reinsurance markets cause additional forms of competition and innovation that could affect our business. This competition is further intensified by an industry trend where clients elect to engage multiple brokers to service different portions of their accounts. If we fail to respond successfully to the to the evolving competition we face, our financial condition or results of operations might be adversely affected.
If our clients are not satisfied with our services, we may face additional cost, loss of profit opportunities, damage to our reputation, or legal liability.
We depend, to a large extent, on our relationships with our clients and our reputation for high-quality advice and solutions. If a client is not satisfied with our services, it could cause us to incur additional costs and impair profitability, or lose the client relationship altogether. Moreover, if we fail to meet our contractual obligations, we could be subject to legal liability or loss of client relationships.
The nature of much of our work involves assumptions and estimates concerning future events, the actual outcome of which we cannot know with certainty in advance. For example, in our investment consulting business, we may be measured based on our track record regarding judgments and advice on investments that are susceptible to influences unknownBoard effective at the timenext Annual Meeting. Following Dr. Woo’s retirement, the advice was given. In addition, we could make computational, software programming, or data entry or management errors. A
12


client may claim it suffered losses dueBoard expects to reliance on our consulting advice, which poses risks of liability exposure and costs of defense and increased insurance premiums. Many of our clients are businesses that actively share information among themselves about the quality of service they receive from their vendors. Accordingly, poor service to one client may negatively impact our relationships with multiple other clients.
Damage to our reputation could have a material adverse effect on our business.
We advise our clients on and provide services related to a wide range of subjects and our ability to attract and retain clients is highly dependent upon the external perceptions of our level of service, trustworthiness, business practices, financial condition, and other subjective qualities. Negative perceptions or publicity regarding these matters or others could erode trust and confidence and damage our reputation among existing and potential clients and existing and future employees, which could make it difficult for us to attract new clients and employees and retain existing ones. Negative public opinion could also result from actual or alleged conduct by us or those currently or formerly associated with us. Damage to our reputation, including as a result of negative perceptions or publicity regarding environmental matters, climate change, workforce diversity, pay equity, harassment, social justice, cyber security or data privacy, or our inability to meet commitments or client and stakeholder expectations with respect to such matters, could affect the confidence of our clients, rating agencies, regulators, stockholders, employees and third parties in transactions that are important to our business adversely affecting our business, financial condition, and operating results.
Revenues from commission arrangements may fluctuate due to many factors, including cyclical or permanent changes in the insurance and reinsurance markets outside of our control.
Revenues from commission arrangements have historically been affected by significant fluctuations arising from uncertainties and changes in the industries in which we operate. A significant portion of our revenue consists of commissions paid to us out of the premiums that insurers and reinsurers charge our clients for coverage. We have no control over premium rates, and our revenues and profitability are subject to change to the extent that premium rates fluctuate or trend in a particular direction. The potential for changes in premium rates is significant, due to pricing cyclicality in the commercial insurance and reinsurance markets.
In addition to movements in premium rates, our ability to generate premium-based commission revenue may be challenged by:
the growing availability of alternative methods for clients to meet their risk-protection needs, including a greater willingness on the part of corporations to “self-insure,” the use of so-called “captive” insurers, and the development of capital markets-based solutions and other alternative capital sources for traditional insurance and reinsurance needs that increase market capacity, increase competition, and put pressure on pricing;
fluctuation in the need for, or relevancy of, insurance;
the level of compensation, as a percentage of premium, that insurance carriers are willing to compensate brokers for placement activity;
the growing desire of clients to move away from variable commission rates and instead compensate brokers based upon flat fees, which can negatively impact us as fees are not generally indexed for inflation and may not rise as much as commission-based compensation;
competition from insurers seeking to sell their products directly to consumers, including online sales, without the involvement of an insurance broker; and
growing number of technology-enabled competitors offering new risk-transfer solutions that eliminate the traditional broker-client relationship in both commercial insurance and reinsurance markets.
The profitability of our operations may not meet our expectations due to unexpected costs, cost overruns, inflation, early contract terminations, unrealized assumptions used in our contract bidding process or the inability to maintain our prices.
Our profitability is highly dependent upon our ability to control our costs and improve our efficiency. As we adapt to changes in our business and the market, adapt to the regulatory environment, enter into new engagements, acquire additional businesses, and take on new employees in new locations, we may not be able to manage our large, diverse and changing workforce, control our costs, or improve our efficiency.
Our profit margin, and therefore our profitability, is largely a function of the revenue generated from our services and the staffing costs for our personnel. Accordingly, if we are not able to maintain the rates we charge for our services or appropriately manage the staffing costs of our personnel, we may not be able to sustain our profit margin and our profitability will suffer. The
13


prices we are able to charge for our services are affected by a number of factors, including competitive factors, the extent of ongoing clients’ perception of our ability to add value through our services, and general economic conditions. If we cannot drive suitable cost efficiencies, our profit margins will suffer. Our cost efficiencies may also be impacted by factors such as our ability to transition consultants from completed projects to new assignments, our ability to secure new business, our ability to forecast demand for our services (and, consequently, appropriately manage the size and location of our workforce), employee attrition, inflation (including wage inflation) and the need to devote time and resources to training and professional and business development.
In our investment consulting business, we advise or act on behalf of clients regarding their investments. The results of these investments are uncertain and subject to numerous factors, some of which are within our control and some which are not. Clients that experience losses or lower than expected investment returns may leave us for competitors and/or assert claims against us.
Our investment consulting business provides advice to clients on: investment strategy, which can include advice on setting investment objectives, asset allocation, and hedging strategies; selection (or removal) of investment managers; the investment in different investment instruments and products; and the selection of other investment service providers such as custodians and transition managers. For some clients, we are responsible for making decisions on these matters and we may implement such decisions in a fiduciary or agency capacity without assuming title over the underlying funds or assets invested. Asset classes may experience poor absolute performance and third parties we recommend or select, such as investment managers, may underperform their benchmarks due to poor market performance, negligence, or other reasons, resulting in poor investment returns or losses. These losses may be attributable in whole or in part to failures on our part or to events entirely outside of our control, including but not limited to uncertainty or volatility in financial markets due to economic, political, and regulatory conditions or pandemics. Plaintiffs have, and may continue to, file individual and class action lawsuits alleging investment consultants have charged excessive fees, given improper advice due to conflicts of interest, or recommended investments that underperformed other investments available at the time. Defending against these claims can involve potentially significant costs, including legal defense costs, as well as cause substantial distraction and diversion of other resources. If any lawsuit – against the Company or any other investment consultant – results in a large adverse verdict,reduce the size of the verdict or resultant negative adverse publicity may prompt the filing of additional lawsuits. Furthermore, our abilityBoard to limit our potential liability is restricted in certain jurisdictions and in connection with claims involving breaches of fiduciary or agency duties or other alleged errors or omissions.
The anticipated benefits of the redomiciliation from the U.K. to Ireland may not be realized.
In April 2020, we changed the jurisdiction of incorporation for our parent company from the U.K. to Ireland by means of a scheme of arrangement under English law (the “Reorganization”). At the time of the Reorganization we expected, and we continue to expect, that the Reorganization will, among other things, provide greater certainty around ongoing access to existing U.S. treaties with other EU member countries from which we derive benefit. However, we may not realize the benefits we anticipate from the Reorganization, which could have an adverse effect on our business.
Financial Risks
We are exposed to fluctuations in currency exchange rates that could negatively impact our financial results and cash flows.
We face exposure to adverse movements in exchange rates of currencies other than our reporting currency, the U.S. dollar, as a significant portion of our business is located outside of the U.S. These exposures may change over time, and they could have a material adverse impact on our financial results and cash flows. Approximately 55% of our consolidated revenue is non-U.S., attributed on the basis of where the services are performed, and where products are sold, and the exposures created can have significant currency volatility. These currency exchange fluctuations create risk in both the translation of the financial results of our global subsidiaries into U.S. dollars for our consolidated financial statements, as well as in those of our operations that receive revenue and incur expenses other than in their respective local currencies, which can reduce the profitability of our operations based on the direction the respective currencies’ exchange rates move. A decrease in the value of certain currencies relative to other currencies could place us at a relative disadvantage compared to our competitors that benefit to a greater degree from a specific exchange rate move and can, as a result, deliver services at a lower cost or receive greater revenues from such a transaction. Although we use various derivative financial instruments to help protect against certain adverse foreign exchange rate fluctuations, we cannot eliminate such risks, and, as a result, changes in exchange rates may adversely affect our results. For example, the strengthening of the value of the U.S. dollar versus other currencies might adversely affect the value of our products and services when translated to U.S. dollar, even if the value of such products and services has not changed in their original currency.
1412.

  Name Age Director
Since
 Current Committee Membership Other
Boards


LOGO

 Lester B. Knight, Chair* 65 1999 

Executive Committee - Chair

Governance/Nominating Committee - Chair

Inclusion & Wellbeing Sub-Committee


LOGO

 Gregory C. Case, CEO 61 2005 

Executive Committee

Inclusion & Wellbeing Sub-Committee

 1


LOGO

 Jose Antonio Álvarez* 63 2024 

Audit Committee

 2


LOGO

 Jin-Yong Cai* 64 2016 

Finance Committee

Organization and Compensation Committee

 2


LOGO

 Jeffrey C. Campbell* 63 2018 

Audit Committee - Chair

Executive Committee

Organization and Compensation Committee

 1


LOGO

 Fulvio Conti* 76 2008 

Audit Committee

Executive Committee

Finance Committee - Chair

Governance/Nominating Committee

 1


LOGO

 Cheryl A. Francis* 70 2010 

Finance Committee

Governance/Nominating Committee

Inclusion & Wellbeing Sub-Committee - Chair

Organization and Compensation Committee

 2


LOGO

 Adriana Karaboutis* 61 2022 

Audit Committee

 2


LOGO

 Richard C. Notebaert* 76 1998 

Executive Committee

Finance Committee

Governance/Nominating Committee

Inclusion & Wellbeing Sub-Committee

Organization and Compensation Committee - Chair


1


  Name Age Director
Since
 Current Committee Membership Other
Boards


LOGO

 Gloria Santona* 73 2004 

Audit Committee

Governance/Nominating Committee

Inclusion & Wellbeing Sub-Committee


LOGO

 Sarah E. Smith* 65 2023 Finance Committee 1


LOGO

 Byron O. Spruell* 59 2020 

Audit Committee

Inclusion & Wellbeing Sub-Committee

Organization and Compensation Committee


LOGO

 Carolyn Y. Woo*†† 68 1998 

Audit Committee

Organization and Compensation Committee


*   Independent Director


Changes in interest rates and deterioration of credit quality could reduce the value of our cash balances and investment portfolios and adversely affect our financial condition or results.
Operating funds available for corporate use were $836 million at December 31, 2021 and are reported in Cash and cash equivalents and Short-term investments. Of the total balance, $160 million was restricted to its use as of December 31, 2021. Funds held on behalf of clients and insurers were $6.1 billion at December 31, 2021 and are reported in Fiduciary assets. We also carry an investment portfolio   Number of other long-term investments. As of December 31, 2021, these long-term investments had a carrying value of $64 million. Adverse changes in interest rates, performance, and counterparty credit quality, including default, could reduce the value of these funds and investments, thereby adversely affecting our financial conditionpublic company directorships or results. We may experience reduced investment earnings on our cash and short-term investments of fiduciary and operating funds if the yields on investments deemed to be low risk remain at or near their current low levels or fall below their current levels, or if negative yields on deposits or investments are experienced, as we have experienced in Japan and certain jurisdictions in the E.U. On the other hand, higher interest rates could result in a higher discount rate used by investors to value our future cash flows thereby resulting in a lower valuation of the Company. In addition, during times of stress in the banking industry, counterparty risk can quickly escalate, potentially resulting in substantial losses for us as a result of our cash or other investments with such counterparties, as well as substantial losses for our clients and the insurance companies with which we work.
Our pension obligations and value of our pension assets could adversely affect our shareholders’ equity, net income, cash flow, and liquidity.
To the extent that the pension obligations associated with our pension plans continue to exceed the fair value of the assets supporting those obligations, our financial position and results of operations may be adversely affected. In particular, lower interest rates and investment returns could result in the present value of plan liabilities increasing at a greater rate than the value of plan assets, resulting in higher unfunded positions in our pension plans. In addition, the periodic revision of pension assumptions or variances of actual results from our assumptions can materially change the present value of expected future benefits, and therefore the funded status of the plans and resulting net periodic pension expense. As a result, we may experience future changes in the funded status of our plans that could require us to make additional cash contributions beyond those that have been estimated and which could adversely affect shareholders’ equity, net income, cash flow and liquidity.
Our worldwide pension plans are significant, and therefore our pension contributions and expense are sensitive to various market, demographic, and other factors. These factors include equity and bond market returns, fair value of pension assets, the assumed interest rates we use to discount our pension liabilities, foreign exchange rates, rates of inflation, mortality assumptions, potential regulatory and legal changes or developments, and counterparty exposure from various investments and derivative contracts, including annuities. Variations or developments in connection with any of these factors could cause significant changes to our financial position and results of operations from year to year. In addition, contributions are generally based on statutory requirements and local funding practices, which may differ from measurements under U.S. GAAP.
We have debt outstanding that could adversely affect our financial flexibility.
As of December 31, 2021, we had total consolidated debt outstanding of approximately $9.4 billion. The level of debt outstanding could adversely affect our financial flexibility by reducing our ability to use cash from operations for other purposes, including working capital, dividends to shareholders, share repurchases, acquisitions, capital expenditures and general corporate purposes. We also are subject to risks that,listed business development company trusteeships

†† Dr. Woo is retiring effective at the time any of our outstanding debt matures, we will not be able to retire or refinance the debt on terms that are acceptable to us, or at all.

As of December 31, 2021, we had two committed credit facilities outstanding. Each of these facilities is intended to support our commercial paper obligations and our general working capital needs. In addition, each of these facilities included customary representations, warranties, and covenants, including financial covenants that require us to maintain specified ratios of adjusted consolidated EBITDA to consolidated interest expense and consolidated debt to adjusted consolidated EBITDA, tested quarterly.
A substantial portion of our outstanding debt, including certain intercompany debt obligations, contains financial and other covenants. The terms of these covenants may limit our ability to obtain, or increase the costs of obtaining, additional financing to fund working capital, capital expenditures, acquisitions, or general corporate requirements. This in turn may have the impact of reducing our flexibility to respond to changing business and economic conditions, thereby placing us at a relative disadvantage compared to competitors that have less indebtedness, or fewer or less onerous covenants associated with such indebtedness, and making us more vulnerable to general adverse economic and industry conditions.
If we cannot service our indebtedness, we may have to take actions such as selling assets, seeking additional equity, or reducing or delaying capital expenditures, strategic acquisitions, investments, and alliances, any of which could impede the implementation of our business strategy or prevent us from entering into transactions that would otherwise benefit our business.
15


Additionally, we may not be able to take such actions or refinance any of our debt, if necessary, on commercially reasonable terms, or at all.
A decline in the credit ratings of our senior debt and commercial paper may adversely affect our borrowing costs, access to capital, and financial flexibility.
A downgrade in the credit ratings of our senior debt and commercial paper could increase our borrowing costs, reduce or eliminate our access to capital, reduce our financial flexibility, and limit our ability to implement on corporate strategy. Our senior debt ratings at December 31, 2021 were A- with a stable outlook S&P, BBB+ with a stable outlook (Fitch), and Baa2 with a stable outlook (Moody’s). Our commercial paper ratings were A-2 (S&P), F-2 (Fitch) and P-2 (Moody’s).
Real or anticipated changes in our credit ratings will generally affect any trading market for, or trading value of, our securities. Such changes could result from any number of factors, including the modification by a credit rating agency of the criteria or methodology it applies to particular issuers, a change in the agency’s view of us or our industry, or as a consequence of actions we take to implement our corporate strategies. A change in our credit rating could adversely limit our access to capital and our competitive position.
Our global effective tax rate is subject to a variety of different factors, which could create volatility in that tax rate, expose us to greater than anticipated tax liabilities or cause us to adjust previously recognized tax assets and liabilities.
We are, and anticipate we will be, subject to income taxes in Ireland, the U.K., the U.S. and many other jurisdictions. As a result, our global effective tax rate from period to period can be affected by many factors, including changes in tax legislation or regulations, the continuing development of regulations and other governmental action that affect the application of such legislation, our global mix of earnings, the use of global funding structures, the tax characteristics of our income, the effect of complying with transfer pricing requirements under laws of many different countries on our revenues and costs, the consequences of acquisitions and dispositions of businesses and business segments. In addition, we could be subject to increased taxation as a result of changes in eligibility for the benefits of current income tax treaties between and among Ireland, the U.K., the U.S and other countries, including any future amendments to the current income tax treaties between and among such countries, or any new statutory or regulatory provisions that might limit our ability to take advantage of any such treaties. Significant judgment is required in determining our worldwide provision for income taxes, and our determination of the amount of our tax liability is always subject to review by applicable tax authorities. Our actual global tax rate may vary from our expectation and that variance may be material.
The overall tax environment in the jurisdictions in which we are or may be subject to taxes is highly uncertain and increasingly complex. Countries around the world are considering changes in their tax laws and regulations. In the U.S., various proposals to raise corporate income taxes are under active consideration, which could have a material adverse effect on our effective tax rate, results of operations, cash flows and financial condition. The OECD, a global coalition of member countries, proposed a plan to reform international taxation which includes the introduction of a global minimum tax. There remains significant uncertainty as to if, when and how the various OECD proposals will ultimately be enacted in the various countries in which Annual Meeting

Aon is or may be subject to taxes, including the E.U. member states, and, if enacted, the extent of their impact. Some of the proposals, if enacted, could have a material adverse effect on our effective tax rate, results of operations, cash flows and financial condition.

We are, and anticipate we will be, subject to tax audits conducted by Ireland, the U.K., the U.S., and other tax authorities, and the resolution of such audits could impact our tax rate in future periods, as would any reclassification or other changes (such as those in applicable accounting rules) that increases the amounts we have provided for income taxes in our consolidated financial statements. The tax laws and regulations in Ireland, the U.K., the U.S., and the other tax jurisdictions in which the we operate are inherently complex, and we will be obligated to make judgments and interpretations about the application of these laws and regulations to our operations and businesses. The interpretation and application of these laws and regulations could be challenged by the relevant governmental authorities, which could result in administrative or judicial procedures, actions or sanctions, which could be material.
There can be no assurance that we would be successful in attempting to mitigate the adverse impacts resulting from any changes in tax laws and regulations, including any changes in the interpretation of such tax authorities, or from audits and other matters. Our inability to mitigate the negative consequences of such actions could cause our global effective tax rate to increase, our use of cash to increase and our financial condition and results of operations to suffer.
Changes in our accounting estimates and assumptions could negatively affect our financial position and results of operations.
We prepare our consolidated financial statements in accordance with U.S. GAAP. These accounting principles require us to make estimates and assumptions that affect the reported amounts of assets and liabilities, and the disclosure of contingent assets
16


and liabilities at the date of our consolidated financial statements. We are also required to make certain judgments that affect the reported amounts of revenues and expenses during each reporting period. We periodically evaluate our estimates and assumptions including, but not limited to, those relating to revenue recognition, pensions, recoverability of assets including customer receivables, valuation of goodwill and intangibles, contingencies, share-based payments, and income taxes. We base our estimates on historical experience and various assumptions that we believe to be reasonable based on specific circumstances. These assumptions and estimates involve the exercise of judgment and discretion, which may evolve over time in light of operational experience, regulatory direction, developments or changes in accounting principles or standards, and other factors. Actual results could differ from these estimates, or changes in assumptions, estimates, policies, or developments in the business may change our initial estimates, which could materially affect the Consolidated Statements of Income, Comprehensive Income, Financial Position, Shareholders’ Equity, and Cash Flows.
We may be required to record goodwill or other long-lived asset impairment charges, which could result in a significant charge to earnings.
Under U.S. GAAP, we review our long-lived assets for impairment when events or changes in circumstances indicate the carrying value may not be recoverable. Goodwill is assessed for impairment at least annually. Factors that may be considered in assessing whether goodwill or other long-lived assets may not be recoverable include a decline in our share price or market capitalization, reduced estimates of future cash flows and slower growth rates in our industry. We may experience unforeseen circumstances that adversely affect the value of our goodwill or other long- lived assets and trigger an evaluation of the recoverability of the recorded goodwill and other long-lived assets. Future goodwill or other long-lived asset impairment charges could materially impact our consolidated financial statements.
We are a holding company and, therefore, may not be able to receive dividends or other payments in needed amounts from our subsidiaries.
The Company is organized as a holding company, a legal entity separate and distinct from our operating entities. As a holding company without significant operations of its own, our principal assets are the shares of capital stock of our subsidiaries. We rely on dividends, interest, and other payments from these subsidiaries to meet our obligations for paying principal and interest on outstanding debt, paying dividends to shareholders, repurchasing ordinary shares, and corporate expenses. Certain of our subsidiaries are subject to regulatory requirements of the jurisdictions in which they operate or other restrictions that may limit the amounts that subsidiaries can pay in dividends or other payments to us. No assurance can be given that there will not be further changes in law, regulatory actions, or other circumstances that could restrict the ability of our subsidiaries to pay dividends or otherwise make payments to us. Furthermore, no assurance can be given that our subsidiaries may be able to make timely payments to us in order for us to meet our obligations.
Legal and Regulatory Risks
We are subject to E&O claims against us as well as other contingencies and legal proceedings, some of which, if determined unfavorably to us, could have a material adverse effect on our financial condition or results of operations.
We assist our clients with various matters, including advising on and placing insurance and reinsurance coverage and handling related claims, consulting on various human resources matters, and providing actuarial, investment consulting, and asset management services. E&O claims against us may allege our potential liability for damages arising from these services. E&O claims could include, for example, the failure of our employees or sub-agents, whether negligently or intentionally, to place coverage correctly or notify carriers of claims on behalf of clients, to provide insurance carriers with complete and accurate information relating to the risks being insured, or the failure to give error-free consulting or investment advice. It is not always possible to prevent and detect E&O, and the precautions we take may not be effective in all cases. In addition, we are subject to other types of claims, litigation, and proceedings in the ordinary course of business, which along with E&O claims, may seek damages, including punitive damages, in amounts that could, if awarded, have a material adverse impact on the Company’s financial position, earnings, and cash flows. In addition to potential liability for monetary damages, such claims or outcomes could harm our reputation or divert management resources away from operating our business.
We have historically purchased, and intend to continue to purchase, insurance to cover E&O claims and other insurance to provide protection against certain losses that arise in such matters. However, we have exhausted or materially depleted our coverage under some of the policies that protect us for certain years and, consequently, are self-insured or materially self-insured for some historical claims. Additionally, parts or all of an E&O claim could fall within insurance deductibles, self-insured retentions, or policy exclusions. Accruals for these exposures, and related insurance receivables, when applicable, have been provided to the extent that losses are deemed probable and are reasonably estimable. These accruals and receivables are adjusted from time to time as developments warrant and may also be adversely affected by disputes we may have with our insurers over coverage. Amounts related to settlement provisions are recorded in Other general expenses in the Consolidated
17


Statements of Income. Discussion of some of these claims, lawsuits, and proceedings are contained in the Notes to Consolidated Financial Statements.
In addition, we provide a variety of guarantees and indemnifications to our customers and others. In the event of a default, our potential exposure is equal to the amount of the guarantee or indemnification.
The ultimate outcome of claims, lawsuits, proceedings, guarantees and indemnifications cannot be ascertained, and liabilities in indeterminate amounts may be imposed on us. It is possible that future results of operations or cash flows for any particular quarterly or annual period could be materially affected by an unfavorable resolution of these matters.
Our businesses are subject to extensive governmental regulation, which could reduce our profitability, limit our growth, or subject us to legal and regulatory actions.
Our businesses are subject to extensive legal and regulatory oversight throughout the world, including the Irish Companies Act, the U.S. securities laws, rules, and regulations, the rules and regulations promulgated by the FCA and a variety of other laws, rules, and regulations addressing, among other things, licensing, data privacy and protection, trade sanctions laws, restrictions and export controls, anti-money laundering, wage-and-hour standards, employment and labor relations, anti-competition, anti-corruption, currency, reserves, government contracting, and the amount of local investment with respect to our operations in certain countries. This legal and regulatory oversight could reduce our profitability or limit our growth by: increasing the costs of legal and regulatory compliance; limiting or restricting the products or services we sell, the markets we serve or enter, the methods by which we sell our products and services, the overall structure of our business units, the type of services and prices we can charge for our services, or the form of compensation we can accept from our clients, carriers, and third parties; or by subjecting our businesses to the possibility of legal and regulatory actions, proceedings, or fines.
The global nature of our operations increases the complexity and cost of compliance with laws and regulations adding to our cost of doing business. In addition, many of these laws and regulations may have differing or conflicting legal standards across jurisdictions, increasing the complexity and cost of compliance. In emerging markets and other jurisdictions with less developed legal systems, local laws and regulations may not be established with sufficiently clear and reliable guidance to provide us adequate assurance that we are operating our business in a compliant manner with all required licenses or that our rights are otherwise protected. In addition, certain laws and regulations, such as the Foreign Corrupt Practices Act and the Foreign Account Tax Compliance provisions of the Hiring Incentives to Restore Employment Act in the U.S., and the Bribery Act of 2010 in the U.K., impact our operations outside of the legislating country by imposing requirements for the conduct of overseas operations, and in several cases, requiring compliance by foreign subsidiaries.
In addition to the complexity of the laws and regulations themselves, the development of new laws and regulations or changes in application or interpretation of current laws and regulations or conflict between them also increases our legal and regulatory compliance complexity. Additionally, our acquisitions of new businesses and our continued operational changes and entry into new jurisdictions and new service offerings increases our legal and regulatory compliance complexity, as well as the type of governmental oversight to which we may be subject. Changes in laws and regulations could mandate significant and costly changes to the way we implement our services and solutions, impose additional licensure requirements or costs to our operations and services, or cause us to cease offering certain services or solutions. Furthermore, as we enter new jurisdictions or businesses and further develop and expand our services, including through acquisitions, we may become subject to additional types of laws and governmental oversight and supervision, such as those applicable to the financial lending or other service institutions. Regulatory developments that could result in changes that adversely affect us or cause us to change our business or operations include: additional requirements respecting data privacy, data security, and data usage in jurisdictions in which we operate that may increase our costs of compliance and potentially reduce the manner in which we can use data; changes in tax regulations in the jurisdictions in which we operate; regulatory actions or changes that require us to change our compensation model; or additional regulations promulgated by , regulatory bodies in jurisdictions in which we operate.
Governmental and public attention to climate change and environmental matters, including new or enhanced reporting, diligence or disclosure rules and regulations, could expand the nature, scope, and complexity of matters that we are required to control, assess, and report. These and other rapidly changing laws, rules and regulations, may increase the cost of our compliance and risk management and otherwise impact our business, which could have a material adverse effect on our business, results of operations, and financial condition. In addition, the shift toward a lower-carbon economy, driven by changes in laws, rules and regulations, low-carbon technology advancement, consumer sentiment, and/or liability risks, may negatively impact our business model and/or the business models of our clients.In addition, as governments, investors and other stakeholders face additional pressures to accelerate actions to address climate change and other ESG topics, governments and other stakeholders may impose new rules or expectations causing a shift in disclosure and other behaviors that may negatively impact our business.
18


In all jurisdictions, the applicable laws and regulations are subject to amendment or interpretation by regulatory authorities. Generally, such authorities are vested with relatively broad discretion to grant, renew, and revoke licenses and approvals and to implement regulations. Accordingly, we may have a license revoked or be unable to obtain new licenses and therefore be precluded or suspended from carrying on or developing some or all of our activities or otherwise fined or penalized in a given jurisdiction. No assurances can be given that our business can further develop or continue to be conducted in any given jurisdiction in the future as it has been conducted in the past. Changes in the regulatory scheme, or even changes in how existing regulations are interpreted, could have an adverse impact on our results of operations by limiting revenue streams or increasing costs of compliance.
Our business’ regulatory oversight also includes licensing of insurance brokers and agents, managing general agency or general underwriting operations, and the regulation of the handling and investment of client funds held in a fiduciary capacity. Our continuing ability to provide insurance broking in the jurisdictions in which we operate depends on our compliance with the rules and regulations promulgated by the regulatory authorities in each of these jurisdictions, and our failure to adhere to these rules and regulations can expose us to fines or other sanctions. Also, we can be affected indirectly by the governmental regulation and supervision of insurance companies. For instance, if we are providing or managing general underwriting services for an insurer, we may have to contend with regulations affecting our client.
Services provided in our Health Solutions and Wealth Solutions businesses are also the subject of ever-evolving government regulation, either because the services provided to our clients are regulated directly or because third parties upon whom we rely to provide services to clients are regulated, thereby indirectly affecting the manner in which we provide services to those clients. In particular, our health care exchange business depends upon the private sector of the U.S. insurance system and its role in financing health care delivery, and insurance carriers’ use and payment of commissions to agents, brokers, and other organizations to market and sell individual and family health insurance products and plans. Uncertainty regarding, or any changes to, state or federal law, or the interpretation of such law by applicable regulatory agencies could delay client adoption of our health care exchanges, impair our ability to retain clients who have adopted our health care exchanges, or cause insurance carriers to alter or eliminate the products and plans that they offer or attempt to move members into new products or plans for which we receive lower commissions. In addition, changes in laws, government regulations, or the way those regulations are interpreted in the jurisdictions in which we operate could affect the viability, value, use, or delivery of benefits and human resources programs, including changes in regulations relating to health and welfare plans (such as medical), defined contribution plans (such as 401(k)), or defined benefit plans (such as pension), may adversely affect the demand for, or profitability of, our services.
If we violate the laws and regulations to which we are subject, we could be subject to fines, penalties, or criminal sanctions and could be prohibited from conducting business in one or more countries. There can be no assurance that our employees, contractors, or agents will not violate these laws and regulations, causing an adverse effect on our operations and financial condition.
Heightened regulatory oversight and scrutiny may lead to additional regulatory investigations, increased government involvement, or enforcement actions, which could consume significant management time and resources and could have adverse effects on our business and operations. For instance, increased scrutiny by competition authorities may increase our costs of doing business or force us to change the way we conduct business or refrain from or otherwise alter the way we engage in certain activities. Additionally,we could suffer significant financial or reputational harm if we fail to properly identify and manage potential conflicts of interest, which exist or could exist any time we or any of our employees have or may have an interest in a transaction or engagement that is inconsistent with our clients’ interests. This could occur, for example, when we are providing services to multiple parties in connection with a transaction. We also provide services to advise and assist in satisfying all our clients’ needs from all our businesses, creating a greater potential for conflicts with advisory services.
Due to the broad scope of our businesses and our client base, we regularly address potential conflicts of interest, including, without limitation, situations where our services to a particular client or our own investments or other interests conflict, or are perceived to conflict, with the interests of another client. If these are not adequately identified and managed, this could then lead to failure or perceived failure to protect the client’s interests, with consequential regulatory and reputational risks, including litigation or enforcement actions that could adversely affect us and our operations. Identifying conflicts of interest may also prove particularly difficult as we continue to bring systems and information together and integrate newly acquired businesses. In addition, we may not be able to adequately address such conflicts of interest.
Insurance intermediaries have traditionally been remunerated by base commissions paid by insurance carriers in respect of insurance placements for clients, or by fees paid by clients. Intermediaries also obtain other revenue from insurance carriers. This revenue, when derived from carriers in their capacity as insurance markets (as opposed to as corporate clients of the intermediaries where they may be purchasing insurance or reinsurance or other non-market related services), is commonly known as MDI. MDI is another example of an area in which potential conflicts of interest may arise. This revenue may be subject to scrutiny by various regulators under conflict of interest, anti-trust, unfair competition, conduct and anti-bribery laws
19


and regulations. MDI takes a variety of forms, including volume- or profit-based contingent commissions, facilities administration charges, business development agreements, and fees for providing consulting services to carriers. While accepting MDI is a lawful and acceptable business practice, we cannot predict whether our position will result in regulatory or other scrutiny and our controls may not be fully effective.
Failure to protect our intellectual property rights, or allegations that we have infringed on the intellectual property rights of others, could harm our reputation, ability to compete effectively, and financial condition.
To protect our intellectual property rights, we rely on a combination of trademark laws, copyright laws, patent laws, trade secret protection, confidentiality agreements, and other contractual arrangements with our affiliates, employees, clients, strategic partners, and others, as well as internal policies and procedures regarding our management of intellectual property. However, the protective steps that we take may be inadequate to deter misappropriation of our proprietary information. In addition, we may be unable to detect the unauthorized use of, or take appropriate steps to enforce, our intellectual property rights. Further, we operate in many jurisdictions and effective trademark, copyright, patent, and trade secret protection may not be available or adequate in every country or jurisdiction in which we offer our services or employ our colleagues. Additionally, our competitors may develop products similar to our products that do not conflict with our related intellectual property rights. Failure to protect our intellectual property adequately could harm our reputation and affect our ability to compete effectively.
In addition, to protect or enforce our intellectual property rights, we may initiate litigation against third parties, such as infringement suits or interference proceedings. Third parties may assert intellectual property rights claims against us, which may be costly to defend, could require the payment of damages, and could limit our ability to use or offer certain technologies, products, or other intellectual property. Any intellectual property claims, with or without merit, could be expensive, take significant time and divert management’s attention from other business concerns. Successful challenges against us could require us to modify or discontinue our use of technology or business processes where such use is found to infringe or violate the rights of others, or require us to purchase licenses from third parties, any of which could adversely affect our business, financial condition, and operating results.
Operational Risks
Our results of operations have been adversely affected and could be materially adversely affected in the future by the COVID-19 global pandemic.
The COVID-19 global pandemic and the emergence of COVID-19 variants has created significant public health concerns and significant volatility, uncertainty, and economic disruption in every region where we operate.
A number of evolving factors related to the global pandemic and the post-pandemic recovery period may influence the duration, nature and extent of the impact on our business and financial results. Such factors include worldwide macroeconomic conditions, including interest rates, employment rates, consumer confidence and spending, gross domestic product, property values and changes in client behavior, and foreign exchange rates in each of the markets in which we operate; business closures; changes in laws, regulations (including those changes that may provide for extended premium payment terms), and guidance; court decisions and litigation trends; a decline in business and the ability of counterparties to pay for our services on time or at all; an increased number of E&O claims in those areas impacted by the pandemic, as well as an increase in the incidence or severity of E&O claims against us and our market partners; our ability to sell and provide our services, including due to the impact of travel restrictions, lockdowns, quarantines, social distancing, and alternative work arrangements; the health of, and the effect of the pandemic on, our employees; political disruption; potential effects on our internal controls and risk mitigation processes, including those over financial reporting, as a result of changes in working environments for our employees and business partners; resurgences of spread; identification of new, more contagious variants of the virus; resulting “lockdowns,” government restrictions, mandates, requirements or recommendations; and uncertainties in vaccine adoption.
In addition, the continuing COVID-19 pandemic may again create significant disruptions or volatility in the credit or financial markets, or impact our credit ratings, which could adversely affect our ability to access capital on favorable terms or at all.
Finally, the impact of the COVID-19 pandemic may heighten other risks discussed in this Annual Report on Form 10-K, which could adversely affect our business, financial condition, results of operations, cash flows, and stock price.
The economic and political conditions of the countries and regions in which we operate could have an adverse impact on our business, financial condition, operating results, liquidity, and prospects for growth.
Our operations in countries undergoing political change or experiencing economic instability are subject to uncertainty and risks that could materially adversely affect our business. These risks include, particularly in emerging markets, the possibility
20


we would be subject to undeveloped or evolving legal systems, unstable governments and economies, and potential governmental actions affecting the flow of goods, services, and currency.
Furthermore, the U.K. formally withdrew from the E.U., commonly referred to as Brexit. The E.U. and U.K. ratified a trade cooperation agreement governing their future relationship in 2021 to address trade, economic arrangements, law enforcement, judicial cooperation and a governance framework including procedures for dispute resolution, among other things. Because the agreement merely sets forth a framework in many respects and requires ongoing complex additional bilateral negotiations between the U.K. and the E.U. as both parties continue to work on the rules for implementation, significant political and economic uncertainty remains. We have significant operations and a substantial workforce within the U.K., and we previously enjoyed certain benefits based on the U.K.’s membership in the E.U., and the lack of clarity around the future relationship between the U.K. and the E.U. creates uncertainty that may have a material impact on our business and operations. We may also be required to incur additional expense as we adapt to and create the ability to operate within the new political and regulatory environment.
Additionally, any development that has the effect of devaluing the euro or British pound could meaningfully reduce the value of our assets and reduce the usefulness of liquidity alternatives denominated in that currency such as our multicurrency U.S. credit facility. We also deposit some of our cash, including cash held in a fiduciary capacity, with certain European financial institutions. While we continuously monitor and manage exposures associated with those deposits, to the extent the uncertainty surrounding economic stability in Europe and the future viability of the euro suddenly and adversely impacts those financial institutions, some or all of those cash deposits could be at risk.
Our success depends on our ability to retain, attract and develop experienced and qualified personnel, including our senior management team and other personnel.
We depend, in material part, upon the members of our senior management team who possess extensive knowledge and a deep understanding of our business and our strategy, as well as the colleagues who are critical to developing and retaining client relationships. The unexpected loss of services of any of these senior leaders could have a disruptive effect adversely impacting our ability to manage our business effectively and execute our business strategy. Additionally, competition for experienced professional personnel is increasingly intense, and we are constantly working to retain, attract and develop these professionals. If we cannot successfully do so, our business, operating results, and financial condition could be adversely affected. We may also become involved in disputes and litigation in connection with our efforts to retain and hire personnel, which can be disruptive to our business. While we have plans for key management succession and long-term compensation plans designed to retain our senior management team and critical colleagues, if our succession plans and retention programs do not operate effectively, our business could be adversely affected.
We strive to maintain an equitable work environment that unlocks the full potential of all of our personnel - this includes our commitment to diversity and inclusion, focus on colleague wellness and mental health, and building a flexible work environment that meets colleague and client needs. If we are unsuccessful in maintaining such a work environment or adapting to colleague needs or expectations, we could experience difficulty attracting and retaining personnel, which could have a negative impact on our business.
Our global operations expose us to various international risks that could adversely affect our business.
Our operations are conducted globally. Accordingly, we are subject to regulatory, legal, economic, and market risks associated with global operations and sourcing, including:
difficulties in staffing and managing our offices, and overseeing joint venture operations and compliance in disparate jurisdictions, including due to unexpected inflation (including wage inflation) or job turnover, and the increased travel, infrastructure, and legal and compliance costs and risks associated with multiple international locations;
hyperinflation in certain countries;
conflicting regulations across the countries in which we do business;
imposition of investment requirements or other restrictions by governments in certain countries;
longer payment cycles;
greater difficulties in collecting accounts receivable;
insufficient demand for our services in certain jurisdictions;
our ability to execute effective and efficient cross-border sourcing of services on behalf of our clients;
21


the reliance on or use of third parties to perform services on behalf of the Company;
disparate tax regimes;
restrictions on the import and export of technologies; and
trade barriers.
The occurrence of natural or man-made disasters could result in declines in business and increases in claims that could adversely affect our financial condition and results of operations.
We are exposed to various risks arising out of natural disasters, including earthquakes, hurricanes, fires, floods, tornadoes, extreme weather, or other climate events; pandemic health events, and man-made disasters, including acts of terrorism, civil unrest, violence, military actions, and cyber-terrorism (including, but not limited to, ransomware). The continued threat of terrorism and other events or disasters may cause significant volatility in global financial markets, and a natural or man-made disaster could trigger energy shortages, public health issues, or an economic downturn or instability in the areas directly or indirectly affected by the disaster. These consequences could, among other things, result in a decline in business and increased claims from those areas. They could also result in reduced underwriting capacity, making it more difficult for our professionals to place business. Disasters also could disrupt public and private infrastructure, including communications and financial services, which could disrupt our normal business operations. If access to underwriting markets for certain lines of coverage becomes unavailable or difficult due to the impact of climate change on the claims environment, this may have a negative impact on our clients’ access to coverage, which could in turn reduce our ability to place certain lines of coverage and negatively impact our business.
A natural or man-made disaster also could disrupt the operations of our counterparties or result in increased prices for the products and services they provide to us. In addition, a disaster could adversely affect the value of the assets in our investment portfolio. Finally, a natural or man-made disaster could increase the incidence or severity of E&O claims against us. Climate change may increase the likelihood or severity of a natural or man-made disaster.
Our inability to successfully recover should we experience a disaster or other business continuity problem could cause material financial loss, loss of human capital, regulatory actions, reputational harm, or legal liability.
Our operations are dependent upon our ability to protect our personnel, offices, and technology infrastructure against damage from business continuity events that could have a significant disruptive effect on our operations. Should we experience a local or regional disaster or other business continuity problem, such as a security incident or attack, a natural disaster, climate event, terrorist attack, pandemic, power loss, telecommunications failure, or other natural or man-made disaster, our continued success will depend, in part, on the availability of our personnel and office facilities, and the proper functioning of computer systems, telecommunications, and other related systems and operations. In events like these, while our operational size, the multiple locations from which we operate, and our existing back-up systems provide us with some degree of flexibility, we still can experience near-term operational challenges in particular areas of our operations. We could potentially lose access to key executives, personnel, or client data or experience material adverse interruptions to our operations or delivery of services to our clients in a disaster recovery scenario. A disaster on a significant scale or affecting certain of our key operating areas within or across regions, or our inability to successfully recover should we experience a disaster or other business continuity problem, could materially interrupt our business operations and cause material financial loss, loss of human capital, regulatory actions, reputational harm, damaged client relationships, or legal liability.
We rely on third parties to perform key functions of our business operations enabling our provision of services to our clients. These third parties may act in ways that could harm our business.
We rely on third parties, and in some cases subcontractors, to provide services, data, and information such as technology, information security, funds transfers, data processing, support functions, and administration that are critical to the operations of our business. These third parties include correspondents, agents and other brokerage and intermediaries, insurance markets, data providers, plan trustees, payroll service providers, benefits administrators, software and system vendors, business process outsourcing providers, health plan providers, investment managers, and providers of human resources, among others. As we do not fully control the actions of these third parties, we are subject to the risk that their decisions, actions, or inactions may adversely impact us and replacing these service providers could create significant delay and expense. A failure by third parties to comply with service level agreements or regulatory or legal requirements in a high quality and timely manner, particularly during periods of our peak demand for their services, could result in economic and reputational harm to us. In addition, we face risks as we transition from in-house functions to third- party support functions and providers that there may be disruptions in service or other unintended results that may adversely affect our business operations. These third parties face their own technology, operating, business, and economic risks, and any significant failures by them, including the improper use or disclosure of our confidential client, employee, or company information, could cause harm to our business and reputation. An
22


interruption in or the cessation of service by any service provider as a result of systems failures, cybersecurity incidents (including, but not limited to, ransomware), capacity constraints, financial difficulties, or for any other reason could disrupt our operations, impact our ability to offer certain products and services, and result in contractual or regulatory penalties, liability claims from clients, or employees, damage to our reputation, and harm to our business.
Our business is exposed to risks associated with the handling of client funds.
Certain of our businesses collect premiums from insureds and remits the premiums to the respective insurers. We also collect claims or refunds from insurers on behalf of insureds, which are then remitted to the insureds. Consequently, at any given time, we may be holding and managing funds of our clients. This function creates a risk of loss arising from, among other things, fraud by employees or third parties, execution of unauthorized transactions, errors relating to transaction processing, or other cybersecurity events or security breaches. We are also potentially at risk in the event the financial institution in which we hold these funds suffers any kind of insolvency or liquidity event. The occurrence of any of these types of events in connection with this function could cause us financial loss and reputational harm.
In connection with the implementation of our corporate strategies and initiatives, we face risks associated with, among others, the acquisition or disposition of businesses, the integration and development of acquired businesses, and the entry into new lines of business or products.
In pursuing our corporate strategy, we often acquire other businesses or dispose of or exit businesses we currently own and we routinely are actively engaged in the process of identifying, analyzing, and negotiating possible transactions. The success of this strategy is dependent upon our ability to identify appropriate acquisition and disposition targets, negotiate transactions on favorable terms, secure regulatory approval of transactions where required, complete transactions and, in the case of acquisitions, successfully integrate them into our existing businesses and culture. If a proposed transaction is not consummated, the time and resources spent pursuing it could adversely impact employees, clients and shareholders and the failure to consummate a proposed transaction could result in payment of termination fees and reimbursement of expenses, reputational harm, disputes and litigation and missed opportunities to locate and acquire other businesses. If acquisitions are made, there can be no assurance that we will realize the anticipated benefits of such acquisitions, including, but not limited to, revenue growth, operational efficiencies, or expected synergies, and we could incur unexpected costs in connection with integration. If we dispose of or otherwise exit certain businesses, there can be no assurance that we will not incur certain disposition related charges, will not be subject to post-closing liabilities, obligations or restrictions, will be able to reduce overhead related to the divested assets, or will realize the intended benefits of the disposition.
We may enter new lines of business or offer new products and services within existing lines of business either through acquisitions or through initiatives to generate organic revenue growth. These new lines of business, products, and services present the Company with additional risks, particularly in instances where the markets are new or not fully developed. Such risks include the investment of significant time and resources; the possibility that these efforts will be not be successful; the possibility that the marketplace does not accept our products or services or that we are unable to retain clients that adopt our new products or services; and the risk of new or additional liabilities associated with these efforts. In addition, many of the businesses that we acquire and develop will likely have significantly smaller scales of operations prior to the implementation of our growth strategy. If we are not able to manage the growing complexity of these businesses, including improving, refining, or revising our systems and operational practices, and enlarging the scale and scope of the businesses, our business may be adversely affected. Other risks include developing knowledge of and experience in the new business, product or service, integrating the acquired business into our systems and culture, recruiting and retaining experienced professionals, and developing and capitalizing on new relationships with experienced market participants. External factors, such as compliance with new or revised regulations, competitive alternatives, and shifting market preferences may also impact the successful implementation of a new line of business, products, or services. Failure to manage these risks in the acquisition or development of new businesses could materially and adversely affect our business, results of operations, and financial condition.
We are subject to various risks and uncertainties in connection with the sale of the Divested Business.
On May 1, 2017, the Company completed the sale of the benefits administration and business process outsourcing business (the “Divested Business) to an entity controlled by affiliates of The Blackstone Group L.P. (the “Buyer”). This transaction carries inherent risks, including the risk that we will not earn the $500 million of additional consideration or otherwise realize the intended value of the transaction.
23


Risks Related to Technology, Cybersecurity, and Data Protection
We rely on complex information technology systems and networks to operate our business. Any significant system or network disruption due to a breach in the security of our information technology systems could have a negative impact on our reputation, operations, sales, and operating results.
We rely on the efficient, uninterrupted, and secure operation of complex information technology systems and networks, some of which are within the Company and some of which are outsourced to third parties. All information technology systems are potentially vulnerable to damage or interruption from a variety of sources, including but not limited to cyber-attacks, computer viruses, security breaches, and unauthorized access or improper actions by insiders or employees. We are at risk of attack by a growing list of adversaries through new and increasingly sophisticated methods of attack, including methods that take advantage of remote work scenarios due to COVID-19. Because the techniques used to obtain unauthorized access or sabotage systems change frequently, we may be unable to anticipate these techniques, implement adequate preventative measures, or detect and respond quickly enough in the event of an incident or attack. We regularly experience social engineering attempts, attacks to our systems and networks and have from time to time experienced cybersecurity incidents, such as computer viruses, unauthorized parties gaining access to our information technology systems, ransomware incidents, data loss via malicious and non-malicious methods, and similar incidents, which to date have not had a material impact on our business. If we are unable to efficiently and effectively maintain and upgrade our system safeguards, we may incur unexpected costs and certain of our systems may become more vulnerable to unauthorized access. Problems with the information technology systems of vendors, including breakdowns or other disruptions in communication services provided by a vendor, failure of a vendor to handle current or higher volumes, difficulties in the migration of services or data to third parties or the cloud hosted by third parties, cyber-attacks, and security breaches could adversely affect our ability to deliver products and services to customers and otherwise conduct business. Additionally, we are a global and acquisitive organization and we therefore might not adequately identify weaknesses in certain of our information systems, including those of targets we acquire, which could expose us to unexpected liabilities and fines or make our own systems more vulnerable to attack. These types of incidents affecting us, our clients, insurance carriers, vendors, or other third-parties could result in intellectual property or other confidential information being lost or stolen, including client or employee personal information or company data.
We have implemented various measures to manage our risks related to system and network security and disruptions, but a security breach or a significant or extended disruption in the functioning of our information technology systems could damage our reputation, cause us to lose clients, adversely impact our operations, sales, and operating results, and require us to incur significant expense and divert resources to address and remediate or otherwise resolve such issues. Additionally, in order to maintain the level of security, service, and reliability that our clients require, we may be required to make significant additional investments in our information technology system.
Improper disclosure of confidential, personal, or proprietary data could result in regulatory scrutiny, legal liability, or harm to our reputation.
One of our significant responsibilities is to maintain the security and privacy of our employees’ and clients’ confidential and proprietary information, including confidential information about our clients’ and employees’ compensation, medical information, and other personally identifiable information. We maintain policies, procedures, and technological safeguards designed to protect the security and privacy of this information. Nonetheless, we cannot eliminate the risk of human error, employee or vendor malfeasance, or cyber-attacks that could result in improper access to or disclosure of confidential, personal, or proprietary information. Such access or disclosure could harm our reputation and subject us to liability under our contracts and laws and regulations that protect personal data, resulting in increased costs, fines, loss of revenue, and loss of clients. The release of confidential information as a result of a security breach could also lead to litigation or other proceedings against us by affected individuals or business partners, or by regulators, and the outcome of such proceedings, which could include penalties or fines, could have a significant negative impact on our business.
In many jurisdictions, including in the E.U. and the U.S., we are subject to laws and regulations relating to the collection, use, retention, security, and transfer of this information. These laws and regulations are frequently changing and are becoming increasingly complex and sometimes conflict among the various jurisdictions and countries in which we provide services both in terms of substance and in terms of enforceability. This makes compliance challenging and expensive. Additionally, certain jurisdictions’ regulations include notice provisions that may require us to inform affected clients or employees in the event of a breach of confidential information before we fully understand or appreciate the extent of the breach. These notice provisions present operational challenges and related risk. In particular, in 2021 there have been a number of new privacy laws aroundattributes and criteria when identifying nominees to serve as a director, including professional background, expertise, reputation for integrity, business, financial and management experience, leadership capabilities, and diversity. We believe all of the globe including China, Brazilnominees are individuals with a reputation for integrity, demonstrate strong leadership capabilities, and significant privacy rulings in the E.U. relatingare able to work collaboratively to make contributions to the “Schrems II” case, which imposed significant changes toBoard and management. Biographical information about the way companies export personal data fromdirectors and the E.U. We have had to implement new requirements set outexperience, qualifications, attributes, and skills considered by our Governance/Nominating Committee and the Board in these laws within our business before the effective date causing distraction from other aspects of our business. This new guidance issued to firms by the European Regulators has and will continue to require significant time to implement and may require significant effort to review and effect applicable changes to IT systems and transfer methods. Non-compliance with new
24


and existing laws could result in proceedings against us by governmental entities or others and additional costs in connection therewith. We expect additional jurisdictions to continue to adopt new privacy regulations and there to be amendments to existing regulations as governments continue to legislate in respect of personal data. We have and will continue to incur expenses and devote resources to bring our practices into compliance with these regulations and future regulations. Our failure to comply with or successfully implement processes in response to changing regulatory requirements in this area could result in legal liability, result in proceedings or fines against us by governmental entities or others, or impair our reputation in the marketplace. Further, regulatory initiatives in the area of data protection are more frequently including provisions allowing authorities to impose substantial fines and penalties, and therefore, failure to comply could also have a significant financial impact.
Our business performance and growth plans could be negatively affected if we are not able to develop, implement, update, and enhance technology-based solutions to support our business operations or if we are not able to effectively drive value for our clients through innovation and technology-based solutions.
Our success depends, in part, on our ability to enhance and implement the technology systems necessary to operate our businesses and to achieve intended efficiencies and improvements. We may not be successful in anticipating or responding to rapid and continuing changes in technology, industry standards and client preferences. The effort to gain technological expertise, develop new technologies in our business, and achieve internal efficiencies through technology require us to incur significant expenses.
We also make investments in technology-based solutions, including data and analytics solutions, for our clients. If we cannot innovate as quickly as our competitors, if our competitors develop more cost-effective technologies, or if our ideas are not accepted in the marketplace, it could have a material adverse effect on our ability to obtain and complete client engagements. For example, we have invested significantly in the development of our proprietary data and analytics tools including repositories of global insurance and reinsurance placement information, which we use to drive results for our clients in the insurance and reinsurance placement process. Our competitors are developing competing data and analytics tools, and their success in this space may impact our ability to differentiate our services to our clients through the use of unique technological solutions. Innovations in software, cloud computing, data and analytics or other technologies that alter how our services are delivered could significantly undermine our investment in the business if we are slow to innovate or unable to take advantage of these developments.
Risks Related to Being an Irish-incorporated Company
We are incorporated in Ireland, and Irish law differs from the laws in effect in the U.S. and may afford less protection to holders of our securities.
It may not be possible to enforce court judgments obtained in the U.S. against us in Ireland, based on the civil liability provisions of the U.S. federal or state securities laws. In addition, there is some uncertainty as to whether the courts of Ireland would recognize or enforce judgments of U.S. courts obtained against us or our directors or officers based on the civil liabilities provisions of the U.S. federal or state securities laws or hear actions against us or those persons based on those laws. We have been adviseddetermining that the U.S. currently does not havedirectors should serve as a treaty with Ireland providing for the reciprocal recognition and enforcement of judgments in civil and commercial matters. Therefore, a final judgment for the payment of money rendered by any U.S. federal or state court based on civil liability, whether or not based solely on U.S. federal or state securities laws, would not automatically be enforceable in Ireland.
As an Irish company, we are governed by the Irish Companies Act, which differs in some material respects from laws generally applicable to U.S. corporations and shareholders, including, among others, differences relating to interested director and officer transactions and shareholder lawsuits. Likewise, the duties of directors and officers of an Irish company generally are owed to the company only. Shareholders of Irish companies generally do not have a personal right of action against directors or officers of the company and may exercise such rights of action on behalf of the company only in limited circumstances. Accordingly, holders of our securities may have more difficulty protecting their interests than would holders of securities of a corporation incorporated in a jurisdiction of the U.S.
In addition, depending on the circumstances, the acquisition, ownership and/or disposition of our ordinary shares may subject shareholders to different or additional tax consequences under Irish law including, but not limited to, Irish stamp duty, dividend withholding tax and capital acquisitions tax.
As an Irish public limited company, certain capital structure decisions regarding the Company will require the approval of shareholders, which may limit the Company’s flexibility to manage its capital structure.
Irish law generally provides that a board of directors may allot and issue shares (or rights to subscribe for or convert into shares) if authorized to do so by a company’s constitution or by an ordinary resolution of shareholders. Such authorization may
25


be granted in respect of up to the entirety of a company’s authorized but unissued share capital and for a maximum period of five years, at which point it must be renewed by another ordinary resolution. The Company’s constitution authorizes our directors to allot shares up to the maximum of the Company’s authorized but unissued share capital for a period of five years from March 31, 2020. This authorization will need to be renewed by ordinary resolution upon its expiration and at periodic intervals thereafter. Under Irish law, an allotment authority may be given for up to five years at each renewal, but governance considerations may result in renewals for shorter periods or in respect of less than the maximum permitted number of shares being sought or approved.
Irish law also generally provides shareholders with statutory pre-emption rights when new shares are issued for cash. However, it is possible for such statutory pre-emption rights to be dis-applied in a company’s constitution or by a special resolution of shareholders. Such dis-application of pre-emption rights may be given in respect of up to the entirety of a company’s authorized but unissued share capital and for a maximum period of five years, at which point it must be renewed by another special resolution. The Company’s constitution dis-applies statutory pre-emption rights up to the maximum of the Company’s authorized but unissued share capital for a period of five years from March 31, 2020. This dis-application will need to be renewed by special resolution upon its expiration and at periodic intervals thereafter. Under Irish law, a dis-application of statutory pre-emption rights may be given for up to five years at each renewal, but governance considerations may result in renewals for shorter periods or in respect of less than the maximum permitted number of unissued shares being sought or approved.
Irish law requires us to have available “distributable profits” to pay dividends to shareholder and generally to make share repurchases and redemptions.
Under Irish law, we may only pay dividends and, generally, make share repurchases and redemptions from distributable profits. Distributable profits may be created through the earnings of the Company or other methods (including certain intra-group reorganizations involving the capitalization of the Company’s un-distributable profits and their subsequent reduction). While it is our intention to maintain a sufficient level of distributable profits in order to pay dividends on our ordinary shares and make share repurchases, there is no assurance that the Company will maintain the necessary level of distributable profits to do so.
Item 1B.    Unresolved Staff Comments
None.
Item 2.    Properties
We have offices in various locations throughout the world. Substantially all of our offices are located in leased premises. We maintain our corporate headquarters at Metropolitan Building, James Joyce Street, Dublin 1, Ireland, where we occupy approximately 43,000 square feet of space under an operating lease agreement that expires in 2032. The following are additional significant leased properties, along with the occupied square footage and expiration.
Property:Occupied
Square Footage
Lease
Expiration Dates
200 E. Randolph Street, Chicago, Illinois312,0002028
165 Broadway, New York, New York217,0002028
122 Leadenhall Street, London, England178,0002034
4 Overlook Point, Lincolnshire, Illinois174,0002024
As leases expire, we do not anticipate difficulty in negotiating renewals or finding other satisfactory space if the premise becomes unavailable. We believe that the facilities we currently occupy are adequate for the purposes for which they are being used and are well maintained. In certain circumstances, we may have unused space and may seek to sublet such space to third parties, depending upon the demands for office space in the locations involved. Due to COVID-19, the vast majority of colleagues are working remotely. We continue to be fully operational and to reoccupy certain offices in phases, where deemed appropriate and in compliance with governmental restrictions considering the impact on health and safety of our colleagues, their families, and our clients, and we have restricted or minimized access to offices where appropriate to support the health and safety of our colleagues. See Note 8 “Lease Commitments” of the Notes to Consolidated Financial Statements in Part II, Item 8 of this report for information with respect to our lease commitments as of December 31, 2021.
Item 3.    Legal Proceedings
We hereby incorporate by reference Note 15 “Claims, Lawsuits, and Other Contingencies” of the Notes to Consolidated Financial Statements in Part II, Item 8 of this report.
26


Item 4.    Mine Safety Disclosure
Not applicable.
27


Information about our Executive Officers
The executive officers of Aon, as of February 18, 2022 unless otherwise noted, their business experience during a period of the last five years or longer, and their ages and positions held are set forthappears below.

LOGO

Lester B. Knight

NameDirector since 1999

Age: 65

Committees:

 Executive Committee (Chair)

 Governance/Nominating Committee (Chair)

 Inclusion & Wellbeing Sub-Committee

AgePosition
Eric Andersen57President.

Mr. Andersen joined Aon in 1997 uponKnight is a Founding Partner of RoundTable Healthcare Partners and the completionformer Vice Chairman and director of Cardinal Health, Inc., a diversified healthcare service company. Mr. Knight was Chairman of the acquisition of Minet. Mr. Andersen has served in a variety of roles during his more than 20 year career at Aon, including as Chief Executive Officer of Aon Risk Solutions Americas from 2011 to 2013,Board and Chief Executive Officer of Aon BenfieldAllegiance Corporation from September 2013 to May 2018.1996 until February 1999, and had been with Baxter International, Inc. from 1981 until 1996, where he served as Corporate Vice President from 1990, Executive Vice President from 1992 and as a director from 1995. Mr. Andersen was appointed Co-PresidentKnight became Chairman of the CompanyBoard of Directors of Aon in May 2018August 2008. He is a life director of NorthShore University Health System and became PresidentJunior Achievement of Chicago, a life Trustee of Northwestern University and a member of the Civic Committee of The Commercial Club of Chicago.

Skills & Qualifications: Mr. Knight’s experience as the founder of a private equity firm focused on investing in February 2020. He was named an Executive Officerthe healthcare industry, his executive background at several leading healthcare companies, and his financial and investment expertise provides the Board with executive leadership and oversight experience. In addition, his role in February 2017.chairing our Governance/Nominating Committee and his previous leadership and Board experience at other public companies position him to effectively lead the Board. Mr. Knight provides valuable perspectives with his broad experience in corporate governance, strategic transactions, business transformation and growth and oversight.

2


LOGO

Gregory C. Case

Director since 2005

Age: 61

Committees:

 Executive Committee

 Inclusion & Wellbeing Sub-Committee

59Chief Executive Officer.

Mr. Case becamehas served as Chief Executive Officer and a director of Aon insince April 2005. He alsoMr. Case served as Aon’s President from April 2005 to May 2018. Prior to joining Aon, Mr. Case was a partner with McKinsey & Company, athe global management consulting firm, for 17 years most recently servingwhere he served on the governing Shareholders’ Council and as head of the Global Insurance and Financial Services Practice. He previously was responsible for McKinsey’s Global Insurance Practice and was a member of McKinsey’s governing Shareholders’ Committee. Prior to joining McKinsey, Mr. Case worked forwas with the investment banking firm of Piper, Jaffray and Hopwood and the Federal Reserve Bank of Kansas City. Mr. Case is a director of Discover Financial Services.

Skills & Qualifications: As Chief Executive Officer of Aon, Mr. Case brings to the Board his day-to-day experiences leading Aon’s 50,000 colleagues serving clients across Commercial Risk, Reinsurance, Health, and Wealth solution lines, and his intimate knowledge of Aon’s business and operations. Mr. Case’s background as a management consultant, including in the global insurance and financial services areas, brings critical industry and business development knowledge to the Board. His extensive and specific knowledge of Aon and its businesses enables him to keep the Board apprised of the most significant developments impacting the Company and to guide the Board’s discussion and review of the Company’s strategy.

LOGO

Jose Antonio Álvarez

Christa DaviesDirector since 2024

Age: 64

Committees:

 Audit Committee

50

Mr. Álvarez is the former Chief Financial Officer. Ms. Davies becameExecutive Officer of Banco Santander, S.A., a Spanish multinational financial services company, and currently serves as Vice Chair and a non-executive director of Santander. Mr. Álvarez first joined Santander in 2002 and served as Executive Vice President - Global Finance in November 2007. In March 2008, Ms. Davies assumed the additional role ofand Chief Financial Officer.Officer from 2004 to 2014. In 2015, Mr. Álvarez was appointed Chief Executive Officer of Santander and served in that role until his retirement in 2022.

Mr. Álvarez previously served as a member of the supervisory boards of Santander Consumer Bank AG, Santander Consumer Holding GmbH and Santander Bank Polska, S.A., and as a director of SAM Investments Holdings Limited, Santander Consumer Finance, S.A. and Santander Holdings USA, Inc. In addition, Mr. Álvarez previously served as a board member of Bolsas y Mercados Españoles, S.A. Mr. Álvarez is currently Vice Chair and a non-executive director of Banco Santander (Brasil) S.A.

Skills & Qualifications: Mr. Álvarez’s experience as former Chief Executive Officer, and previously Chief Financial Officer, of a multinational financial services company provides the Board with deep knowledge and expertise in international finance, and unique insights into emerging and global markets and investments. In addition, as a member and prior member of the board of directors of several international companies that invest globally, Mr. Álvarez brings substantive expertise in business strategy in international markets, as well as business transformation and risk management, to the Board. Mr. Álvarez’s extensive financial background and experience has led the Board to determine that he is an “audit committee financial expert” as defined by the SEC.

3


LOGO

Jin-Yong Cai

Director since 2016

Age: 64

Committees:

 Finance Committee

 Organization and Compensation Committee

Mr. Cai is a Partner at Global Infrastructure Partners, a global private equity investment firm. Prior to his current position, Mr. Cai was a Partner at TPG Capital, L.P., a global private equity investment firm. From 2012 to 2016, Mr. Cai was the Chief Executive Officer of the International Finance Corporation, a member of the World Bank Group and the largest global development institution focused on private sector development. Before the International Finance Corporation, Mr. Cai worked in the financial services industry for nearly two decades, including 12 years with Goldman Sachs Group, as a Partner and its top executive in China. He began his career at the World Bank Group. Mr. Cai is a director of PetroChina Company Limited and Syngenta Group.

Skills & Qualifications: Mr. Cai’s experience in global finance and international business, particularly in the Asia-Pacific region, enhances the Board’s global perspectives. Mr. Cai’s increased level of financial literacy and extensive background with international finance and global management, including areas relating to investment banking and private equity, provide valuable perspective and knowledge relating to financial risk and risks related to the Company’s international activities and growth strategies.

LOGO

Jeffrey C. Campbell

Director since 2018

Age: 63

Committees:

 Audit Committee (Chair)

 Executive Committee

 Organization and
Compensation Committee

Mr. Campbell served as Chief Financial Officer of American Express Company, from July 2013 until August 2023, and as Vice Chairman from April 2021 to March 2024. From 2004 to 2013, Mr. Campbell served as Executive Vice President and Chief Financial Officer at McKesson Corporation, a leading healthcare services, information technology and distribution company. Prior to his time at McKesson, Mr. Campbell spent 13 years at AMR Corporation and its principal subsidiary, American Airlines, ultimately becoming its Chief Financial Officer in 2002. He serves as the Lead Director and Chair of the Audit Committee of Hexcel Corporation. Mr. Campbell is also a board member of The Julliard School and the Lincoln Center for the Performing Arts, and is the Chair of the Lincoln Center Corporate Fund.

Skills & Qualifications:Having served as chief financial officer of three multinational, publicly traded companies, Mr. Campbell adds financial expertise and risk management leadership to the Board. His significant business experience, deep financial acumen and leadership in the development of diverse talent provide the Board and its committees with valuable management perspective. He also brings to the Board substantial experience in the areas of compliance, risk oversight, corporate finance and strategy, as well as knowledge and experience relating to the financial services sector. This experience has also led the Board to determine that Mr. Campbell is an “audit committee financial expert” as defined by the SEC.

LOGO

Fulvio Conti

Director since 2008

Age: 76

Committees:

 Finance Committee (Chair)

 Audit Committee

 Executive Committee

 Governance/Nominating
Committee

Mr. Conti served as Chairman of TIM SpA, a leader in the telecommunications market in Italy, from May 2018 to September 2019. He served as Chief Executive Officer and General Manager of Enel SpA, Italy’s largest power company, from May 2005 to May 2014. From 1999 until 2005, he served as Chief Financial Officer of Enel. Mr. Conti has a financial and industrial career spanning over 40 years. Prior to joining Aon, Enel, SpA, he was the Chief Financial Officer and general manager of Ferrovie dello Stato SpA and Telecom Italia SpA. From 1970 to 1990, he held many roles at Mobil Oil Corporation in Italy and other countries, including as Chief Financial Officer of Mobil Oil Europe and Chief Operating Officer of Mobil Plastics Europe. From 1991 to 1995, Mr. Conti was Chief Financial Officer of Montedison-Compart, SpA. Mr. Conti currently serves as Chairman of Innova Italy Srl, Chairman of SGI SpA (Societa’ Gasdotti ltalia SpA), and chairman of Fondo Italiano Efficienza Energetica (FIEE SGR SpA). In addition, Mr. Conti serves as a director of Take Off SpA. Mr. Conti previously served as a non-executive director of Barclays plc, RCS Mediagroup and director of the Italian Institute of Technology as well as Unidad Editorial SA. In 2009, he was appointed “Cavaliere del Lavoro” of the Italian Republic and in December of that year he became “Officier de la Légion d’Honneur” of the French Republic.

Skills & Qualifications:Mr. Conti’s background as a chief executive officer and chief financial officer of a large international energy company, his familiarity with international business and finance activities, particularly in the European Union, and his global financial and management experience bring financial expertise and global leadership to the Board. In addition, Mr. Conti’s background as a chief financial officer of a multinational utility provides a knowledgeable resource on matters relating to financial reporting and treasury. His experience has also led the Board to determine that Mr. Conti is an “audit committee financial expert” as defined by the SEC.

4


LOGO

Cheryl A. Francis

Director since 2010

Age: 70

Committees:

 Inclusion & Wellbeing
Sub-Committee (Chair)

 Finance Committee

 Governance/Nominating
Committee

 Organization and
Compensation Committee

Ms. DaviesFrancis served for 5 years in various capacitiesas Executive Vice President and Chief Financial Officer of R.R. Donnelley & Sons Co., a publicly traded print media company, from 1995 until 2000. Since 2000, Ms. Francis has served as a business consultant and, since August 2008, as Co-Chair of the Corporate Leadership Center. From 2002 until 2008, she served as Vice Chairman of the Corporate Leadership Center. Prior to her role at MicrosoftR.R. Donnelley, Ms. Francis served on the management team of FMC Corporation an international software company, most recentlyand its subsidiary, FMC Gold, including serving as Chief Financial Officer of FMC Gold from 1987 through 1991, and Treasurer of FMC Corporation from 1993 through 1995. She was also an adjunct professor for the PlatformUniversity of Chicago Graduate School of Business from 1991 through 1993. Ms. Francis currently serves as a director of HNI Corporation and Services Division. Before joining MicrosoftMorningstar, Inc., and previously served as a director of Hewitt Associates, Inc. from 2002 until the Company’s acquisition of Hewitt Associates, Inc. in 2002, 2010.

Skills & Qualifications:Ms. Davies served at ninemsn,Francis’s background as a chief financial officer of a large publicly traded company provides the Board with an Australian joint venture with Microsoft.increased level of financial literacy. In addition, her role as a Board member of other public companies provides valuable perspective on matters of risk oversight, corporate governance and strategy. As Co-Founder of the Corporate Leadership Center’s CEO Perspectives and Leading Women Executives, Ms. Francis is a leading voice on inclusion and leadership development.

LOGO

Adriana Karaboutis

Michael NellerDirector since 2022

Age: 61

Committees:

 Audit Committee

43

From 2017 to August 2023, Ms. Karaboutis served as Chief AccountingInformation and Digital Officer of National Grid PLC, one of the world’s largest public utility companies focused on transmitting and Global Controller. Mr. Neller joined Aondistributing electricity and gas in August 2011the UK and northeast US. She previously served as itsExecutive Vice President, Technical AccountingTechnology, Business Solutions and Policy.Corporate Affairs at Biogen Inc., a global biotechnology company, from September 2014 to March 2017. In that role, she introduced leading digital and data science capabilities that unlocked value across the drug discovery, development, and delivery processes. From December 20112015, she also oversaw global public affairs, government affairs, public policy and patient advocacy. From March 2010 to February 2018, Mr. Neller served as Aon’s Deputy Global Controller. In this role, heSeptember 2014, Ms. Karaboutis was responsible for Aon’s Latin America and North America regions, as well as global accounting policy, corporate accounting, and external reporting. Before joining Aon, Mr. Neller served from July 2009 to August 2011 as a Senior Manager of KPMG LLP, an international public accounting firm, in its Department of Professional Practice (National Office). He was named Senior Vice President and Global ControllerChief Information Officer of Dell, Inc., a global technology company. Ms. Karaboutis previously spent more than 20 years at General Motors Company and Ford Motor Company in February 2018.various international leadership positions, including global production planning, computer-integrated manufacturing, supply chain operations and information technology. Ms. Karaboutis serves as a director of Perrigo Company plc, a global over-the-counter consumer goods and pharmaceutical company, and Savills plc, a British real estate services company. She previously served on the boards of directors of Aspen Technology, Advance Auto Parts and Blue Cross Blue Shield of Massachusetts.

Skills & Qualifications: Ms. Karaboutis’ background as a chief information officer for a public utility company and a global technology company provides the Board with valuable insight and experience in technology, cybersecurity, data privacy and data security matters. In addition, Ms. Karaboutis’ experience in developing and delivering digital solutions and data science capabilities enhances the Board’s perspective in innovative strategies. Ms. Karaboutis’ role as a current and former board member of multiple public companies provides valuable perspective on matters of risk oversight, corporate governance and executive management.

5


LOGO

Richard C. Notebaert

James PlattDirector since 1998

Age: 76

Committees:

 Organization and
Compensation Committee
(Chair)

 Executive Committee

 Finance Committee

 Governance/Nominating
Committee

 Inclusion & Wellbeing
Sub-Committee

50Chief Operating Officer.

From June 2002 until August 2007, Mr. Platt joined Aon in September 2014Notebaert served as theChairman and Chief Executive Officer of Aon InpointQwest Communications International Inc., a leading provider of broadband Internet-based data, voice and Headimage communications. He previously served as President and Chief Executive Officer of Data & Analytics for Aon Risk SolutionsTellabs, Inc., which designs and markets equipment to providers of telecommunications services worldwide, from August 2000 to June 2002, and as a director of Tellabs from April 2000 to June 2002. He served as Chairman of the Board and Chief Executive Officer of Ameritech Corporation, a full-service communications company, from 1994 until 1999. Mr. Notebaert first joined Ameritech Communications in 1983 and served in that role until December 2016. Fromsignificant positions within the Ameritech organization before his election as Vice Chairman in January 2017 through June 2019, Mr. Platt served as the1993, President and Chief Operating Officer in June 1993 and President and Chief Executive Officer in January 1994. Mr. Notebaert is a Trustee Emeritus of Aon Risk Solutions, and then from June 2019 through September 2020, as the Company’s Global Solution Lines Chief Operating Officer. From September 2020 to June 2021,Board of Trustees of the University of Notre Dame. Mr. PlattNotebaert previously served as Aon’s Business Chief Operating Officera director of American Electric Power and was appointed Chief Operating OfficerCardinal Health, Inc., and as Chairman of the CompanyBoard of Trustees of the University of Notre Dame.

Skills & Qualifications: Mr. Notebaert’s background as a chairman and chief executive officer of several large international communications companies provides the Board with substantial management expertise, including in June 2021.the areas of global operations, technology and innovation and strategic planning. In addition, Mr. Notebaert’s executive and board leadership experience provides valuable perspectives on matters of risk oversight, corporate governance and executive management.

LOGO

Gloria Santona

Jillian SlyfieldDirector since 2004

Age: 73

Committees:

 Audit Committee

 Governance/Nominating Committee

 Inclusion & Wellbeing
Sub-Committee

49
Chief Innovation Officer.

Ms. Slyfield joined Aon in November 2015 as an Account Executive and laterSantona served as the Resident Sales Director for San Francisco until her appointmentOf Counsel at Baker McKenzie, an international law firm, from 2018 to Managing Director, Digital Economy Practice Leader in 2018. Ms. Slyfield was appointed Chief Innovation Officer of Aon in December 2021.2022. Prior to joining Aon in 2015,Baker McKenzie, Ms. Slyfield held client executive and commercial insurance executive positions at Marsh and Wells Fargo Insurance Services.

Lisa Stevens52Chief People Officer and Head of Global Human Capital Solutions. Ms. Stevens joined Aon in December 2018 as Global Executive Vice President and was named as Chief People Officer in October 2019. Prior to joining Aon, Ms. Stevens held a variety of roles during her 29-year career at Wells Fargo, most recentlySantona served as Executive Vice President, whereGeneral Counsel and Secretary of McDonald’s Corporation from 2001 to 2017 when she ledretired. After joining McDonald’s in 1977, Ms. Santona held positions of increasing responsibility in the Western Region for the Community Bank.
Andy Weitz45Chief Marketing Officer. Mr. Weitz joined Aon in 2014legal department, serving as Senior Vice President for Global MarketingU.S. General Counsel from December 1999 to June 2001 and Communications. Before joining Aon, Mr. Weitz was President and CEOcorporate General Counsel from 2001 to 2017. She is a member of the U.S. regionBoard of Trustees of Rush University Medical Center and former member of the Board of Directors of the American Society of Corporate Secretaries, the Association of Corporate Counsel and the Minority Corporate Counsel Association. Ms. Santona is also a former member of the Board of Trustees of the Chicago Zoological Society and the Chicago Symphony Orchestra, and the Board of Directors of The Chicago Network, the Chicago Food Depository and the National Immigrant Justice Center.

Skills & Qualifications: Ms. Santona’s legal background, including her experience serving as a general counsel and secretary of a large international corporation, brings critical perspective to the Board and enhances the Board’s global risk oversight capabilities. Ms. Santona’s diverse legal background contributes corporate governance, legal, regulatory and compliance expertise and further brings valuable perspective on long-term growth strategy planning. Under Ms. Santona’s leadership, McDonald’s legal department won numerous awards for Hill + Knowlton Strategies,its commitment to inclusivity and pro bono, and Ms. Santona’s continuing service and leadership at non-profit organizations deepens the Board’s expertise on social and governance priorities.

6


LOGO

Sarah E. Smith

Director since 2023

Age: 65

Committees:

 Finance Committee

Ms. Smith is a global strategic communications consultancy. Prior to Hill + Knowlton, Mr. Weitz worked at Marsh,former member of the Management Committee of The Goldman Sachs Group, Inc., a global insurance brokerage,investment banking, securities and servedinvestment management firm. Ms. Smith joined Goldman Sachs in various roles at Trilogy, Inc. a software company.

Darren Zeidel50General Counsel1996 and Company Secretary. Mr. Zeidel was named General CounselManaging Director in 1998 and Company SecretaryPartner in July 2019. Prior to this Mr. Zeidel held several leadership roles with Aon, including2002. During her tenure, Ms. Smith served as Deputy General Counsel immediately prior to his appointment; Globalthe Controller and Chief Counsel - Corporate, Retirement & InvestmentAccounting Officer of the firm until 2017, and Health Exchangessubsequently as the Chief Compliance Officer from 2017 to 2019; and Global Chief Counsel of Aon Hewitt upon2020. Ms. Smith then served as Senior Advisor to Goldman Sachs from 2020 until her retirement in 2021. Prior to joining Aon in 2012 to 2017. Before this Mr. ZeidelGoldman Sachs, Ms. Smith worked for Honeywell, where he held business segment general counsel roles in the aerospace strategic business unitNational and Audit practices of KPMG in both London and New York and held several finance positions at Honeywell UOP LLC. Mr. Zeidel began his careerBristol-Myers Squibb. Ms. Smith is a member of the Board of Trustees of the Financial Accounting Foundation since September 2020. Ms. Smith attended City of London University (Dip. Acc), and is a Fellow of the Institute of Chartered Accountants in England and Wales. Ms. Smith serves as a Trustee of the Nuveen Churchill Private Capital Income Fund and as a board member for three private companies: Klarna Bank A.B., Via Transportation and 98point6.

Skills & Qualifications: Ms. Smith’s background as a chief accounting officer and chief compliance officer provides the Board with an Associateincreased level of financial literacy and enhances the Board’s expertise in the Mergersoversight of risk management and Acquisitions groupcompliance. In addition, Ms. Smith’s experience in the New York officeinvestment banking and asset management industries brings valuable insight to the Company’s business operations in professional and financial services.

LOGO

Byron O. Spruell

Director since 2020

Age: 59

Committees:

 Audit Committee

 Organization and Compensation Committee

 Inclusion & Wellbeing Sub-Committee

Mr. Spruell is the President of Skadden, Arps, Slate, MeagherLeague Operations at the National Basketball Association, a position he has held since August 2016. Prior to joining the National Basketball Association, Mr. Spruell spent 20 years at Deloitte LLP, most recently as its Vice Chairman, Central Region Marketplace Leader and Chicago Managing Principal. He serves on several non-profit boards, including the University of Notre Dame Board of Trustees, the Museum of Science and Industry, Metropolitan Family Services in Chicago and the Jackie Robinson Foundation.

Skills & Flom, LLP.Qualifications: Mr. Spruell’s background in a professional services firm and as a current executive at the National Basketball Association provides the Board with valuable experience in operations management, agility, talent development, application of analytics and innovation, business continuity and colleague health and wellness. Mr. Spruell’s experiences at Deloitte LLP and as Chair of the Audit Committee of the University of Notre Dame’s Board of Trustees further elevates the Board’s financial and accounting expertise. Additionally, Mr. Spruell’s service on non-profit boards enhances the Board’s perspectives around community engagement and social impact.

28

7


Audit Committee

PART II
Item 5.    Market for Registrant’s Common Equity, Related Stockholder Matters and Issuer Purchases of Equity Securities
Our class A ordinary shares, $0.01 nominal value per share, are traded on the NYSE under the trading symbol AON.
On February 17, 2022, the last reported sale price of our ordinary shares as reported by the NYSE was $281.04 per share. We have approximately 403 holders of record of our class A ordinary shares as of February 17, 2022.

The following information relates to the repurchases of equity securities by Aon or any affiliated purchaser during any month within the fourth quarter of the fiscal year covered by this report:

PeriodTotal Number of Shares Purchased
Average Price Paid per Share (1)
Total Number of Shares Purchased as Part of Publicly Announced Plans or Programs (2)
Maximum Dollar Value of Shares that May Yet Be Purchased Under the Plans or Programs (1) (2)
10/1/21 – 10/31/211,305,162 $305.71 1,305,162 $3,321,244,884 
11/1/21 – 11/30/214,004,487 $298.47 4,004,487 $2,126,024,122 
12/1/21 – 12/31/211,372,594 $295.62 1,372,594 $1,720,253,713 
6,682,243 $299.30 6,682,243 $1,720,253,713 
(1)Does not include commissions or other costs paid to repurchase shares.
(2)The Repurchase Program wasCompany has a separately-designated standing Audit Committee established in April 2012 with $5.0 billion in authorized repurchases and was increased by $5.0 billion in authorized repurchases in each of November 2014, June 2017, and November 2020, and by $7.5 billion in authorized repurchases in February 2022 for a total of $27.5 billion in repurchase authorizations.
Information relating to the compensation plans under which equity securities of Aon are authorized for issuance is set forth under Part III, Item 12 “Security Ownership of Certain Beneficial Owners and Management and Related Stockholder Matters” of this report and is incorporated herein by reference.
We did not make any unregistered sales of equity in 2021.
Item 6.    [Reserve]
29


Item 7.    Management’s Discussion and Analysis of Financial Condition and Results of Operations
EXECUTIVE SUMMARY OF 2021 FINANCIAL RESULTS
Aon plc is a leading global professional services firm providing a broad range of risk, health, and wealth solutions. Through our experience, global reach, and comprehensive analytics, we are better able to help clients meet rapidly changing, increasingly complex, and interconnected challenges. We are committed to accelerating innovation to address unmet and evolving client needs, so that our clients are better informed, better advised, and able to make better decisions to protect and grow their business. Management is focused on strengthening Aon and uniting the firm with one portfolio of capability enabled by data and analytics and one operating model to deliver additional insight, connectivity, and efficiency.
Financial Results
The following is a summary of our 2021 financial results:
Revenue increased $1.1 billion, or 10%, to $12.2 billion in 2021 compared to 2020, reflecting 9% organic revenue growth and a 2% favorable impact from foreign currency translation, partially offset by a 1% unfavorable impact from divestitures, net of acquisitions.
Operating expenses increased $1.8 billion, or 22%, to $10.1 billion in 2021 compared to 2020 due primarily to a $1.3 billion increase in charges related to terminating the combination with WTW and related costs, increased expenses associated with 9% organic revenue growth, and a $195 million unfavorable impact from translating prior year period results at current period foreign exchange rates (“foreign currency translation”), partially offset by a $72 million decrease in amortization related to certain tradenames that were fully amortized in the second quarter of 2020 and a $58 million decrease in expenses related to divestitures, net of acquisitions.
Operating margin decreased to 17.1% in 2021 from 25.1% in 2020. The decrease was driven by an increase in operating expenses as listed above, partially offset by organic revenue growth of 9%.
Due to the factors set forth above, Net income was $1.3 billion in 2021, a decrease of $0.7 billion, or 35%, from 2020.
Diluted earnings per share decreased 34% to $5.55 per share during the twelve months of 2021 compared to $8.45 per share for the prior year period.
Cash flows provided by operating activities was $2.2 billion in 2021, a decrease of $0.6 billion, or 22%, from $2.8 billion in 2020, primarily due to the $1 billion termination fee payment and additional payments related to terminating the combination with WTW, partially offset by strong revenue growth.
We focus on four key metrics not presented in accordance with U.S. GAAP that we communicateSection 3(a)(58)(A) of the Exchange Act. The primary purposes of the Audit Committee are to shareholders: organic revenue growth, adjusted operating margin, adjusted diluted earnings per share,assist the Board with the oversight of: (i) the integrity of Aon’s financial statements, financial reporting process and free cash flow. These non-GAAP metrics should be viewed in addition to, not insteadinternal controls; (ii) Aon’s compliance with legal and regulatory requirements and compliance and ethics programs, policies and procedures; (iii) the engagement of our Consolidated Financial Statements. The following is our measure of performance against these four metrics for 2021:
Organic revenue growth, a non-GAAP measure defined under the caption “Review of Consolidated Results — Organic Revenue Growth,” was 9% in 2021, compared to 1% organic growth in the prior year.
Adjusted operating margin, a non-GAAP measure defined under the caption “Review of Consolidated Results — Adjusted Operating Margin,” was 30.1% in 2021, compared to 28.5% in the prior year. The increase in adjusted operating margin primarily reflects 9% organic revenue growthAon’s independent auditor and a favorable impact from foreign currency translation of $63 million.
Adjusted diluted earnings per share, a non-GAAP measure defined under the caption “Review of Consolidated Results — Adjusted Diluted Earnings per Share,” was $12.00 per share in 2021, an increase of $2.19 per share, or 22%, from $9.81 per share in 2020. The increase in adjusted diluted earnings per share primarily reflects strong operational performanceits qualifications, independence and effective capital management, highlighted by $3.5 billion of share repurchase during 2021, and a favorable impact from foreign currency translation.
Free cash flow, a non-GAAP measure defined under the caption “Review of Consolidated Results — Free Cash Flow,” was $2.0 billion in 2021, a decrease of $597 million, or 23%, from $2.6 billion in 2020, reflecting a decrease in cash flows from operations, partially offset by a $4 million decrease in capital expenditures.
30


BUSINESS OVERVIEW
In the third quarter of 2021, we announced a realignment of our principal service linesperformance; (iv) subject to the following: Commercial Risk Solutions, Reinsurance Solutions, Health Solutions,provisions of Irish law, the appointment and Wealth Solutions. Realignmentperformance of Aon’s statutory auditor as required under Irish law; and (v) the performance of Aon’s internal audit function. The Audit Committee is authorized to these four solution lines resultsretain outside counsel or other experts as it deems appropriate to carry out its duties and responsibilities.

The Board has also delegated to the Audit Committee the primary responsibility for the oversight of the Company’s risk management. The Audit Committee reviews and discusses with management Aon’s guidelines and policies with respect to risk assessment and enterprise risk management, including the major financial risk exposures facing the Company and the steps management has taken to monitor and control such exposures. The Audit Committee also has primary responsibility for oversight of cybersecurity risk and engages in regular discussion with management regarding cybersecurity risk mitigation and incident management. The Audit Committee also has general oversight responsibility for the following changes inCompany’s legal, regulatory, and ethics policies and programs and annually reviews the presentationadequacy of our principal service line reporting:

Data & Analytic Services’ revenuethose policies and organic revenue results, which were previously reported as a separate principal service lineprograms, including Aon’s Code of Business Conduct. In addition, the Audit Committee periodically reviews with management any material correspondence with, or other action by, regulators or governmental agencies.

The current members of the Audit Committee are Jeffrey C. Campbell, Jose Antonio Álvarez, Fulvio Conti, Adriana Karaboutis, Gloria Santona, Byron O. Spruell and include Affinity, Aon Inpoint, CoverWallet, and ReView, are included within Commercial Risk Solutions.

Human Capital, which was previously reported within Retirement Solutions, is included within Health Solutions’ revenue and organic revenue results.
Wealth Solutions includes revenue and organic revenue results for all businesses previously reported within Retirement Solutions, excluding Human Capital.
Carolyn Y. Woo. In 2023, the Audit Committee met nine times. The changes in the solution line structure affects only the manner in which our revenue and organic revenue results for our principal service lines were previously reported and have no impact our previously reported Consolidated Financial Statements, results of operations, or total organic revenue growth. We continue to operate as one segmentBoard has determined that includes all of our operations. See the “Principal Products and Services” section in Part I, Item 1 of this report for information on each of the four principal service lines.
TERMINATION OF BUSINESS COMBINATION AGREEMENT
On March 9, 2020, wemembers of the Audit Committee is independent as defined by the rules of the New York Stock Exchange (“NYSE”) and WTW entered intounder the Company’s categorical independence standards, as well as Rule 10A-3 under the Exchange Act. In addition, as required by the rules of the NYSE, the Board has determined that all of the Audit Committee members are financially literate, and that Mr. Álvarez, Mr. Campbell, and Mr. Conti are “audit committee financial experts” within the meaning of rules promulgated by the SEC.

Shareholder Recommendations

The Governance/Nominating Committee will consider shareholder recommendations for director nominees. Recommendations, together with the name and address of the shareholder making the recommendation, relevant biographical information regarding the proposed nominee and a Business Combination Agreementdescription of any arrangement or understanding between the shareholder and the proposed nominee, should be sent to the Company Secretary. Shareholder recommendations for director candidates to stand for election at the 2025 annual general meeting must be submitted in writing to the Company Secretary, Aon plc, Metropolitan Building, James Joyce Street, Dublin 1, Ireland. Recommendations will be forwarded to the Chair of the Governance/Nominating Committee for review and consideration.

Hedging and Pledging Shares

The Board has adopted an insider trading policy which is available on the Company’s website and described in the Company’s code of ethics, which is also available on the website as disclosed in Part 1 of the Original Filing. The Company’s insider trading policy specifically prohibits all directors and employees from engaging in short sales, publicly traded options, puts and calls, forward sale contracts, and other swap, hedging and derivative transactions relating to our securities. The policy also specifically prohibits our executive officers and directors from holding our securities in margin accounts or pledging our securities as collateral for a loan.

Delinquent Section 16(a) Reports

Section 16(a) of the Exchange Act requires that each of our directors and executive officers, and any other person who owns more than ten percent (10%) of our Class A Ordinary Shares, file with the SEC initial reports of ownership and reports of changes in ownership of our Class A Ordinary Shares. To our knowledge, based solely on information furnished to us and written representations by such persons that no such other reports were required to be filed, Aon believes that all such SEC filing requirements were met in a timely manner during 2023 other than with respect to a combination of the parties (the “Combination”). The parties’ respective shareholders approved the Combination on August 26, 2020.

On June 16, 2021, the DOJForm 3 filed a civil antitrust lawsuit against the Company and WTW in the United States District Court for the District of Columbia seeking to enjoin the Combination. On July 26, 2021, the Company and WTW mutually agreed to terminate the Business Combination Agreement (the “Termination Agreement”). Pursuant to the Termination Agreement, the Business Combination Agreement was terminated and a termination fee of $1 billion (the “Termination Fee”) was paid to WTW. Following the termination, the lawsuit by the DOJ was dismissed.
Aon Corporation, a subsidiary of Aon plc, paid the Termination Fee to WTW on July 27, 2021, reflecting that U.S. business services provided by Aon Corporation and its subsidiaries were the primary focus of the DOJ’s challenge to our proposed combination. The Termination Fee was paid to defend the existing U.S. business of Aon Corporation and to avoid additional remedy divestitures of critical Aon Corporation business segments in the U.S. and the continuing delay and uncertainty in completing the combination.
COVID-19 PANDEMIC
The outbreak of the coronavirus, which causes COVID-19, was declared by the World Health Organization to be a pandemic and has impacted almost all countries, in varying degrees, creating significant public health concerns, and significant volatility, uncertainty, and economic disruption in every region in which we operate. The COVID-19 pandemic has resulted, and may continue to result, in significant economic disruption and volatility, although in recent months progress has been made in the development and distribution of vaccines, contributing to overall improved economic conditions globally, despite recent developments as a result of the Delta and Omicron variants. We continue to closely monitor the situation and its impacts on our business, liquidity, and capital planning initiatives. We continue to be fully operational and to reoccupy certain offices in phases, where deemed appropriate and in compliance with governmental restrictions considering the impact on health and safety of our colleagues, their families, and our clients, and we have restricted or minimized access to offices where appropriate to support the health and safety of our colleagues. We continue to deploy business continuity protocols to facilitate remote working capabilities to ensure the health and safety of our colleagues and to comply with public health and travel guidelines and restrictions.
As the situation continues to evolve, the scale and duration of disruption cannot be predicted, and it is not possible to quantify or estimate the full impact that COVID-19 will have on our business. While we continue to focus on managing our cash flow to meet liquidity needs, our results of operations, particularly with respect to our more discretionary revenues, may be adversely affected. However, for the year ended December 31, 2021, the impacts of COVID-19 on our business results have lessened and we have seen overall strength across the firm. We continue to monitor the situation closely.
The impacts of the pandemic on our business operations and results of operations for the year ended December 31, 2021 are further described in the sections entitled “Review of Consolidated Results” and “Liquidity and Financial Condition” contained in Part II, Item 7 of this report.
31


ENVIRONMENTAL, SOCIAL, AND GOVERNANCE
For many companies, the management of ESG risks and opportunities has become increasingly important. Aon offers a wide range of consulting and advisory solutions designed to address and manage ESG issues for clients. We view ESG risks as presenting an important opportunity to help clients and improve our impact on ESG matters.
REVIEW OF CONSOLIDATED RESULTS
Summary of Results
Our consolidated results are as follow (in millions, except per share data):
Years Ended December 31
202120202019
Revenue   
Total revenue$12,193 $11,066 $11,013 
Expenses   
Compensation and benefits6,738 5,905 6,054 
Information technology477 444 494 
Premises327 291 339 
Depreciation of fixed assets179 167 172 
Amortization and impairment of intangible assets147 246 392 
Other general expense2,235 1,232 1,393 
Total operating expenses10,103 8,285 8,844 
Operating income2,090 2,781 2,169 
Interest income11 
Interest expense(322)(334)(307)
Other income152 13 — 
Income before income taxes1,931 2,466 1,870 
Income tax expense623 448 297 
Net income1,308 2,018 1,573 
Less: Net income attributable to noncontrolling interests53 49 41 
Net income attributable to Aon shareholders$1,255 $1,969 $1,532 
Diluted net income per share attributable to Aon shareholders$5.55 $8.45 $6.37 
Weighted average ordinary shares outstanding - diluted226.1 233.1 240.6 
Consolidated Results for 2021 Compared to 2020
Revenue
Total revenue increased $1.1 billion, or 10%, to $12.2 billion in 2021, compared to $11.1 billion in 2020. The increase was driven by 9% organic revenue growth and a 2% favorable impact from foreign currency translation, partially offset by a 1% unfavorable impact from divestitures, net of acquisitions.
Commercial Risk Solutions revenue increased $774 million, or 13%, to $6.6 billion in 2021, compared to $5.9 billion in 2020. Organic revenue growth was 11% in 2021, reflecting growth across every major geography, driven by strong new business generation, retention, and management of the renewal book portfolio. Strength in retail brokerage was highlighted by double-digit growth in the U.S., Latin America, and Asia. Results also reflect growth in the more discretionary portions of the business, including double-digit growth in transaction solutions and project-related work. On average globally, exposures and pricing were both modestly positive, which resulted in a modestly positive market impact overall.
Reinsurance Solutions revenue increased $183 million, or 10%, to $2.0 billion in 2021, compared to $1.8 billion in 2020. Organic revenue growth was 8% in 2021 driven by strong net new business generation in treaty, as well as solid growth in facultative placements and double-digit growth in capital markets transactions. In addition, market impact was modestly positive on results.
32


Health Solutions revenue increased $87 million, or 4%, to $2.2 billion in 2021, compared to $2.1 billion in 2020. Organic revenue growth was 10% in 2021 driven by double-digit growth in human capital due to growth in both rewards and assessments solutions. In health and benefits brokerage, solid growth globally in the core was driven by strong retention and management of the renewal book portfolio, as well as growth in the more discretionary portions of the business, including double-digit growth in voluntary benefits and enrollment solutions and project-related work.
Wealth Solutions revenue increased $85 million, or 6%, to $1.4 billion in 2021, compared to $1.3 billion in 2020. Organic revenue growth was 2% in 2021 driven by growth in investments, including solid growth in delegated investment management, as well as growth in retirement, primarily from higher utilization rates and project-related work.
Compensation and Benefits
Compensation and benefits increased $833 million, or 14%, in 2021 compared to 2020. The increase was primarily driven by an increase in expense associated with 9% organic revenue growth, a $245 million increase in charges related to terminating the combination with WTW and related costs, and a $151 million unfavorable impact from foreign currency translation, partially offset by a $17 million decrease in expenses related to divestitures, net of acquisitions.
Information Technology
Information technology, which represents costs associated with supporting and maintaining our infrastructure, increased $33 million, or 7%, in 2021 compared to 2020. The increase was primarily driven by a $17 million increase in charges related to terminating the combination with WTW and related costs, an increase in expense associated with 9% organic revenue growth, investments in long-term growth, and a $5 million unfavorable impact from foreign currency translation.
Premises
Premises, which represents the cost of occupying offices in various locations throughout the world, increased $36 million, or 12%, in 2021 compared to 2020. The increase was primarily driven by a $22 million increase in charges related to terminating the combination with WTW and related costs and a $10 million unfavorable impact from foreign currency translation.
Depreciation of Fixed Assets
Depreciation of fixed assets primarily relates to software, leasehold improvements, furniture, fixtures and equipment, computer equipment, buildings, and automobiles. Depreciation of fixed assets increased $12 million, or 7%, in 2021 compared to 2020. The increase was primarily driven by a $16 million increase in charges related to terminating the combination with WTW and related costs.
Amortization and Impairment of Intangible Assets
Amortization and impairment of intangibles primarily relates to finite-lived tradenames and customer-related, contract-based, and technology assets. Amortization and impairment of intangibles decreased $99 million, or 40%, in 2021 compared to 2020. The decrease was primarily driven by a $72 million decrease from certain tradenames that were fully amortized in the second quarter of 2020.
Other General Expenses
Other general expenses increased $1.0 billion, or 81%, in 2021 compared to 2020. The increase was primarily driven by a $1.0 billion increase in charges related to terminating the combination with WTW and related costs, a $21 million unfavorable impact from foreign currency translation, and an increase in expense associated with 9% organic revenue growth, partially offset by a $37 million decrease in expenses related to divestitures, net of acquisitions.
Interest Income
Interest income represents income earned on operating cash balances and other income-producing investments. It does not include interest earned on Funds held on behalf of clients. Interest income was $11 million in 2021, an increase of $5 million, or 83%, from 2020.
Interest Expense
Interest expense, which represents the cost of our debt obligations, was $322 million in 2021, a decrease of $12 million, or 4%, from 2020. The decrease was primarily driven by lower average outstanding term debt.
33


Other Income
Other income was $152 million in 2021, compared to $13 million in 2020. Other income in 2021 primarily includes $142 million of gains from the disposal of business, compared to $25 million in 2020.
Income before Income Taxes
Due to factors described above, income before income taxes was $1.9 billion in 2021, a 22% decrease from $2.5 billion in 2020. The decrease was primarily driven by a $1.0 billion increase in charges related to terminating the combination with WTW and related costs, as previously described.
Income Taxes
The effective tax rate on net income was 32.3% in 2021 and 18.2% in 2020. The primary drivers of the 2021 tax rate were the impact of the Termination Fee, the U.K. statutory tax rate increase, and the tax benefit of share-based payments. The U.K. enacted legislation in the second quarter of 2021 which increases the corporate income tax rate from 19% to 25% with effect from April 1, 2023 and the Company remeasured its U.K. deferred tax assets and liabilities accordingly.
The 2020 tax rate was primarily driven by the geographical distribution of income, as well as certain discrete items, primarily the favorable impacts of share-based payments and the release of a valuation allowance.
Net Income Attributable to Aon Shareholders
Net income attributable to Aon shareholders decreased to $1.3 billion, or $5.55 per diluted share, in 2021, compared to $2.0 billion, or $8.45 per diluted share, in 2020.
Consolidated Results for 2020 Compared to 2019
We have elected not to include a discussion of our consolidated results for 2020 compared to 2019 in this report in reliance upon Instruction 1 to Item 303(b) of Regulation S-K. This discussion can be found in our Annual Report on Form 10-K for the year ended December 31, 2020,Ms. Smith, which was timely filed with the SEC on February 19, 2021.
Non-GAAP Metrics
In our discussion of consolidated results, we sometimes referbut subsequently amended to certain non-GAAP supplemental information derived from consolidated financial information specifically related to organic revenue growth (decline), adjusted operating margin, adjusted diluted earnings per share, free cash flow, and the impact of foreign exchange rate fluctuations on operating results. Management believes that these measures are important to make meaningful period-to-period comparisons and that this supplemental information is helpful to investors. Management also uses these measures to assess operating performance and performance for compensation. This non-GAAP supplemental information should be viewed in addition to, not instead of, our Consolidated Financial Statements.
34


Organic Revenue Growth (Decline)
We use supplemental information related to organic revenue growth (decline) to help us and our investors evaluate business growth from existing operations. Organic revenue growth (decline) is a non-GAAP measure that includes the impact of intercompany activity and excludes the impact of changes in foreign exchange rates, fiduciary investment income, acquisitions, divestitures, transfers between revenue lines, and gains or losses on derivatives accounted for as hedges. This supplemental information related to organic revenue growth (decline) represents a measure not in accordance with U.S. GAAP and should be viewed in addition to, not instead of, our Consolidated Financial Statements. Industry peers provide similar supplemental information about their revenue performance, although they may not make identical adjustments. A reconciliation of this non-GAAP measure to the reported Total revenue is as follows (in millions, except percentages):
 Years Ended
Dec 31, 2021Dec 31, 2020% Change
Less: Currency Impact (1)
Less: Fiduciary Investment Income (2)
Less: Acquisitions, Divestitures & Other
Organic Revenue Growth (3)
Commercial Risk Solutions$6,635 $5,861 13 %%— %— %11 %
Reinsurance Solutions1,997 1,814 10 — — 
Health Solutions2,154 2,067 — (8)10 
Wealth Solutions1,426 1,341 — 
Elimination(19)(17)N/AN/AN/AN/AN/A
Total revenue$12,193 $11,066 10 %%— %(1)%%
 Years Ended
Dec 31, 2020Dec 31, 2019% Change
Less: Currency Impact (1)
Less: Fiduciary Investment Income (2)
Less: Acquisitions, Divestitures & Other
Organic Revenue Growth (Decline) (3)
Commercial Risk Solutions$5,861 $5,857 — %— %— %(1)%%
Reinsurance Solutions1,814 1,686 — (1)(1)10 
Health Solutions2,067 2,104 (2)(1)— (2)
Wealth Solutions1,341 1,380 (3)— — (2)(1)
Elimination(17)(14)NANANANANA
Total revenue$11,066 $11,013 — %— %— %(1)%%
(1)Currency impact is determined by translating last year’s revenue at this year’s foreign exchange rates.
(2)Fiduciary investment income for the years ended December 31, 2021 and 2020 was $8 million and $27 million, respectively.
(3)Organic revenue growth (decline) includes the impact of intercompany activity,changes in foreign exchange rates, fiduciary investment income, acquisitions, divestitures, transfers between revenue lines, and gains or losses on derivatives accounted for as hedges.

35


Adjusted Operating Margin
We use adjusted operating margin as a non-GAAP measure of core operating performance of the Company. Adjusted operating margin excludes the impact of certain items, as listed below, because management does not believe these expenses reflect our core operating performance. This supplemental information related to adjusted operating margin represents a measure not in accordance with U.S. GAAP, and should be viewed in addition to, not instead of, our Consolidated Financial Statements.
A reconciliation of this non-GAAP measure to reported operating margins is as follows (in millions, except percentages):
Years Ended December 31
20212020
Revenue$12,193 $11,066 
Operating income - as reported$2,090 $2,781 
Amortization and impairment of intangible assets147 246 
Transaction costs and other charges related to the combination
and resulting termination (1)
1,436 123 
Operating income - as adjusted$3,673 $3,150 
Operating margin - as reported17.1 %25.1 %
Operating margin - as adjusted30.1 %28.5 %
(1)As part of the terminated combination with WTW, certain transaction costs have been incurred by us in 2021. These costs may include advisory, legal, accounting, valuation, and other professional or consulting fees related to the combination, including planned divestitures that have been terminated, as well as certain compensation expenses and expenses related to further steps on our Aon United operating model as a result of the termination. Additionally, this includes the $1 billion Termination Fee paid in connection with the termination of the combination.
Adjusted Diluted Earnings per Share
We use adjusted diluted earnings per share as a non-GAAP measure of our core operating performance. Adjusted diluted earnings per share excludes the items identified above, along with pension settlements and related income taxes, because management does not believe these expenses are representative of our core earnings. This supplemental information related to adjusted diluted earnings per share represents a measure not in accordance with U.S. GAAP and should be viewed in addition to, not instead of, our Consolidated Financial Statements. A reconciliation of this non-GAAP measure to reported diluted earnings per share is as follows (in millions, except per share data and percentages):
Year Ended December 31, 2021
U.S. GAAPAdjustmentsNon-GAAP Adjusted
Operating income$2,090 $1,583 $3,673 
Interest income11 — 11 
Interest expense(322)— (322)
Other income (1)
152 (124)28 
Income before income taxes1,931 1,459 3,390 
Income tax expense (2)
623 — 623 
Net income1,308 1,459 2,767 
Less: Net income attributable to noncontrolling interests53 — 53 
Net income attributable to Aon shareholders$1,255 $1,459 $2,714 
Diluted net income per share attributable to Aon shareholders$5.55 $6.45 $12.00 
Weighted average ordinary shares outstanding — diluted226.1 — 226.1 
Effective tax rates (2)
32.3 %18.4 %
36


Year Ended December 31, 2020
U.S. GAAPAdjustmentsNon-GAAP Adjusted
Operating income$2,781 $369 $3,150 
Interest income— 
Interest expense(334)— (334)
Other income (3)
13 — 13 
Income before income taxes2,466 369 2,835 
Income tax expense (2)
448 51 499 
Net income2,018 318 2,336 
Less: Net income attributable to noncontrolling interests49 — 49 
Net income attributable to Aon shareholders$1,969 $318 $2,287 
Diluted net income per share attributable to Aon shareholders$8.45 $1.36 $9.81 
Weighted average ordinary shares outstanding — diluted233.1 — 233.1 
Effective tax rates (2)
18.2 %17.6 %
(1)Adjusted Other income excludes gains from dispositions of $124 million, for the year ended December 31, 2021.
(2)Adjusted items are generally taxed at the estimated annual effective tax rate, except for the applicable tax impact associated with accelerated tradename amortization, impairment charges, certain gains from dispositions, and certain transaction costs and other charges related to the combination and resulting termination, which are adjusted at the related jurisdictional rate. In addition, income tax expense for the year ended December 30, 2021 excludes the impact of remeasuring the net deferred tax liabilities in the U.K. as a result of the corporate income tax rate increase enacted in the second quarter of 2021.
(3)There was $1 million of income for the year ended December 31, 2020, including the related tax effect, from discontinued operations recognized in Net Income from discontinued operations in the Consolidated Statement of Income.
Free Cash Flow
We use free cash flow, defined as cash flow provided by operations minus capital expenditures, as a non-GAAP measure of our core operating performance and cash generating capabilities of our business operations. This supplemental information related to free cash flow represents a measure not in accordance with U.S. GAAP and should be viewed in addition to, not instead of, the Consolidated Financial Statements. The use of this non-GAAP measure does not imply or represent the residual cash flow for discretionary expenditures. A reconciliation of this non-GAAP measure to cash flow provided by operations is as follows (in millions):
Years Ended December 31
20212020
Cash provided by operating activities$2,182 $2,783 
Capital expenditures(137)(141)
Free cash flow$2,045 $2,642 
Impact of Foreign Currency Exchange Rate Fluctuations
Because we conduct business in more than 120 countries, foreign currency exchange rate fluctuations have a significant impact on our business. Foreign currency exchange rate movements may be significant and may distort true period-to-period comparisons of changes in revenue or pretax income. Therefore, to give financial statement users meaningful information about our operations, we have provided an illustration of the impact of foreign currency exchange rate fluctuations on our financial results. The methodology used to calculate this impact isolates the impact of the change in currencies between periods by translating the prior year’s revenue, expenses, and net income using the current year’s foreign currency exchange rates.
Currency fluctuations had a favorable impact of $0.17 on earnings per diluted share during the year ended December 31, 2021 if prior year period results were translated at current period foreign exchange rates. Currency fluctuations had an unfavorable impact of $0.03 on earnings per diluted share during the year ended December 31, 2020, if 2019 results were translated at 2020 rates.
Currency fluctuations had a favorable impact of $0.23 on adjusted earnings per diluted share during the year ended December 31, 2021 if prior year period results were translated at current period foreign exchange rates. Currency fluctuations had an unfavorable impact of $0.04 on adjusted earnings per diluted share during the year ended December 31, 2020, if 2019
37


results were translated at 2020 rates. These translations are performed for comparative and illustrative purposes only and do not impact the accounting policies or practices for amounts included in our Financial Statements.
LIQUIDITY AND FINANCIAL CONDITION
Liquidity
Executive Summary
We believe that our balance sheet and strong cash flow provide us with adequate liquidity. Our primary sources of liquidity in the near-term include cash flows provided by operations and available cash reserves; primary sources of liquidity in the long-term include cash flows provided by operations, debt capacity available under our credit facilities and capital markets. Our primary uses of liquidity are operating expenses and investments, capital expenditures, acquisitions, share repurchases, pension obligations, and shareholder dividends. We believe that cash flows from operations, available credit facilities, available cash reserves, and the capital markets will be sufficient to meet our liquidity needs, including principal and interest payments on debt obligations, capital expenditures, pension contributions, and anticipated working capital requirements in the next twelve months and over the long-term. Although there continues to be uncertainties around future economic conditions due to COVID-19, we have largely returned to normal levels of liquidity and will continue to monitor our needs as economic conditions change.
In the third quarter of 2021, the Combination with WTW was terminated and on July 27, 2021, we paid the Termination Fee of $1 billion. Refer to “Termination of Business Combination Agreement” within Part II, Item 7, Management’s Discussion and Analysis of Financial Condition and Results of Operations for further information. The Termination Fee, along with other payments made in the third and fourth quarters related to terminating the combination with WTW, are reflected as an outflow to operating activities.
Cash on our balance sheet includes funds available for general corporate purposes, as well as amounts restricted as to their use. Funds held on behalf of clients in a fiduciary capacity are segregated and shown together with uncollected insurance premiums and claims in Fiduciary assets in the Consolidated Statements of Financial Position, with a corresponding amount in Fiduciary liabilities.
In our capacity as an insurance broker or agent, we collect premiums from insureds and, after deducting our commission, remit the premiums to the respective insurance underwriters. We also collect claims or refunds from underwriters on behalf of insureds, which are then returned to the insureds. Unremitted insurance premiums and claims are held by us in a fiduciary capacity. The levels of funds held on behalf of clients and liabilities can fluctuate significantly depending on when we collect the premiums, claims, and refunds, make payments to underwriters and insureds, and collect funds from clients and make payments on their behalf, and upon the impact of foreign currency movements. Funds held on behalf of clients, because of their nature, are generally invested in very liquid securities with highly rated, credit-worthy financial institutions. Fiduciary assets include funds held on behalf of clients comprised of cash and cash equivalents of $6.1 billion and $5.7 billion at December 31, 2021 and 2020, and fiduciary receivables of $8.3 billion and $8.1 billion at December 31, 2021 and 2020, respectively. While we earn investment income on the funds held in cash and money market funds, the funds cannot be used for general corporate purposes.
We maintain multi-currency cash pools with third-party banks in which various Aon entities participate. Individual Aon entities are permitted to overdraw on their individual accounts provided the overall global balance does not fall below zero. At December 31, 2021, non-U.S. cash balances of one or more entities may have been negative; however, the overall balance was positive.
The following table summarizes our Cash and cash equivalents, Short-term investments, and Fiduciary assets as of December 31, 2021 (in millions):
 Statement of Financial Position Classification 
Asset TypeCash and cash
equivalents
Short-term
investments
Fiduciary
assets
Total
Certificates of deposit, bank deposits, or time deposits$544 $— $3,475 $4,019 
Money market funds— 292 2,626 2,918 
Cash, Short-term investments, and Funds held on behalf of clients544 292 6,101 6,937 
Fiduciary receivables— — 8,285 8,285 
Total$544 $292 $14,386 $15,222 
38


Cash and cash equivalents and Funds held on behalf of clients increased $72 million in 2021 compared to 2020. A summary of our cash flows provided by and used for operating, investing, and financing activities is as follows (in millions):
 Years Ended December 31
2021
2020 (1)
(As Revised)
Cash provided by operating activities$2,182 $2,783 
Cash provided by (used for) investing activities$49 $(679)
Cash used for financing activities$(1,924)$(1,772)
Effect of exchange rates on cash and cash equivalents and funds held on behalf of clients$(235)$297 
(1) Certain amounts on the Consolidated Statements of Cash Flows as presented in our financial statements previously filed in the Company’s Annual Reports on Form 10-K have been restated. Refer to Note 1 “Basis of Presentation” of the Notes to Consolidated Financial Statements contained in Part II, Item 8 of this report.
Operating Activities
Net cash provided by operating activities during the year ended December 31, 2021 decreased $601 million, or 22%, from the prior year to $2,182 million. This amount represents net income reported, as adjusted for gains or losses on sales of businesses, share-based compensation expense, depreciation expense, amortization and impairments, and other non-cash income and expenses, as well as changes in working capital that relate primarily to the timing of payments of accounts payable and accrued liabilities and the collection of receivables.
Pension Contributions
Pension contributions were $87 million for the year ended December 31, 2021, as compared to $120 million for the year ended December 31, 2020. In 2022, we expect to contribute approximately $74 million in cash to our pension plans, including contributions to non-U.S. pension plans, which are subject to changes in foreign exchange rates.
Investing Activities
Cash flows provided by investing activities during the year ended December 31, 2021 were $49 million, an increase of $728 million compared to prior year. Generally, the primary drivers of cash flows provided by investing activities are sales of businesses, sales of short-term investments, and proceeds from investments. Generally, the primary drivers of cash flows used for investing activities are acquisition of businesses, purchases of short-term investments, capital expenditures, and payments for investments. The gains and losses corresponding to cash flows provided by proceeds from investments and used for payments for investments are primarily recognized in Other income in the Consolidated Statements of Income.
Short-term Investments
Short-term investments decreased $16 million at December 31, 2021 as compared to December 31, 2020. As disclosed in Note 14 “Fair Value Measurements and Financial Instruments” of the Notes to Consolidated Financial Statements contained in Part II, Item 8 of this report, the majority of our investments carried at fair value are money market funds. These money market funds are held throughout the world with various financial institutions. We are not aware of any market liquidity issues that would materially impact the fair value of these investments.
Acquisitions and Dispositions of Businesses
During 2021, the Company completed the acquisition of two businesses for consideration of $14 million, net of cash and funds held on behalf of clients, and the disposition of six businesses for a $218 million cash inflow, net of cash and funds held on behalf of clients.
During 2020, the Company completed the acquisition of six businesses for consideration of $368 million, net of cash and funds held on behalf of clients, and the disposition of one business for a $30 million cash inflow, net of cash and funds held on behalf of clients.
Capital Expenditures
The Company’s additions to fixed assets, including capitalized software, which amounted to $137 million in 2021 and $141 million in 2020, primarily related to the refurbishing and modernizing of office facilities, software development costs, and computer equipment purchases.
39


Financing Activities
Cash flows used for financing activities during the year ended December 31, 2021 was $1,924 million, an increase of $152 million compared to prior year. Generally, the primary drivers of cash flows used for financing activities are issuances of debt, net of repayments, share repurchases, change in net fiduciary liabilities, dividends paid to shareholders, issuances of shares for employee benefit plans, transactions with noncontrolling interests, and other financing activities, such as collection of or payments for deferred consideration in connection with prior-year business acquisitions and divestitures.
Share Repurchase Program
We have a share repurchase program authorized by our Board of Directors. The Repurchase Program was established in April 2012 with $5.0 billion in authorized repurchases, and was increased by $5.0 billion in authorized repurchases in each of November 2014, June 2017, and November 2020, and by $7.5 billion in authorized repurchases in February 2022 for a total of $27.5 billion in repurchase authorizations.
The following table summarizes the Company’s Share Repurchase activity (in millions, except per share data):
Years Ended December 31
20212020
Shares repurchased12.4 8.5 
Average price per share$286.82 $206.28 
Costs recorded to retained earnings
Total repurchase cost$3,543 $1,761 
Additional associated costs— 
Total costs recorded to retained earnings$3,543 $1,763 
At December 31, 2021, the remaining authorized amount for share repurchase under the Repurchase Program was approximately $1.7 billion. Under the Repurchase Program, we have repurchased a total of 149.6 million shares for an aggregate cost of approximately $18.3 billion.
Borrowings
Total debt at December 31, 2021 was $9.4 billion, an increase of $1.7 billion compared to December 31, 2020. Commercial paper activity during the years ended December 31, 2021 and 2020 is as follows (in millions):
Years Ended December 31
20212020
Total issuances (1)
$4,478 $3,162 
Total repayments(3,807)(3,275)
Net issuances (repayments)$671 $(113)
(1) The proceeds of the commercial paper issuances were used primarily for short-term working capital needs.
Commercial paper may be issued in aggregate principal amounts of up to $1 billion under the U.S. Program and €625 million under the European Program, not to exceed the amount of our committed credit facilities, which was $1.75 billion at December 31, 2021. The aggregate capacity of the U.S. Program was increased in the fourth quarter of 2021 from $900 million to $1 billion. The aggregate capacity of the Commercial Paper Program remains fully backed by our committed credit facilities.
Proceeds from commercial paper issued by Aon Corporation under the U.S. Program, where the aggregate principal was raised on July 26, 2021, were used to pay approximately $400 million of the Termination Fee on July 27, 2021.
On December 2, 2021, Aon Corporation, a Delaware corporation, and Aon Global Holdings plc, a public limited company incorporated under the laws of England and Wales, co-issued $500 million aggregate principal amount of 2.60% Senior Notes set to mature on December 2, 2031. We intend to use the net proceeds of the offering for general corporate purposes.
In November 2021, the Company’s $500 million 2.20% Senior Notes due November 2022 were classified as Short-term debt and current portion of long-term debt in the Consolidated Statements of Financial Position as the date of maturity is in less than one year as of December 31, 2021.
40


On August 23, 2021, Aon Corporation, a Delaware corporation, and Aon Global Holdings plc, a public limited company formed under the laws of England and Wales, both wholly owned subsidiaries of the Company, co-issued $400 million of 2.05% Senior Notes due August 2031 and $600 million of 2.90% Senior Notes due August 2051. We intend to use the net proceeds from the offering for general corporate purposes.
On January 13, 2021, Aon Global Limited, a limited company organized under the laws of England and Wales and a wholly owned subsidiary of Aon plc, issued an irrevocable notice of redemption to holders of its 2.80% Senior Notes for the redemption of all $400 million outstanding aggregate principal amount of the notes, which were set to mature in March 2021 and classified as Short-term debt and current portion of long-term debt as of December 31, 2020. The redemption date was on February 16, 2021 and resulted in an insignificant loss due to extinguishment.
On May 29, 2020, Aon Corporation, a Delaware corporation and a wholly owned subsidiary of the Company, issued an irrevocable notice of redemption to holders of its 5.00% Senior Notes, which were set to mature on September 30, 2020, for the redemption of all $600 million outstanding aggregate principal amount of the notes. The redemption date was on June 30, 2020 and resulted in a loss of $7 million due to extinguishment.
On May 12, 2020, Aon Corporation issued $1 billion 2.80% Senior Notes due May 2030. Aon Corporation used a portion of the net proceeds on June 30, 2020 to repay its outstanding 5.00% Senior Notes, which were set to mature on September 30, 2020. We used the remainder to repay other borrowings and for general corporate purposes.
Other Liquidity Matters
Distributable Profits
We are required under Irish law to have available “distributable profits” to make share repurchases or pay dividends to shareholders. Distributable profits are created through the earnings of the Irish parent company and, among other methods, through intercompany dividends or a reduction in share capital approved by the High Court of Ireland. Distributable profits are not linked to a U.S. GAAP reported amount (e.g. retained earnings). On July 16, 2021, we received approval from the High Court of Ireland to complete a reduction in share premium to create distributable profits of $34.0 billion to support the payment of possible future dividends or future share repurchases, if and to the extent declared by the directors in compliance with their duties under Irish law. As of December 31, 2021 and December 31, 2020, we had distributable profits in excess of $32.7 billion and $0.2 billion, respectively. We believe that we will have sufficient distributable profits for the foreseeable future.
Credit Facilities
We expect cash generated by operations for 2021 to be sufficient to service our debt and contractual obligations, finance capital expenditures, and continue to pay dividends to our shareholders. Although cash from operations is expected to be sufficient to service these activities, we have the ability to access the commercial paper markets or borrow under our credit facilities to accommodate any timing differences in cash flows. Additionally, under current market conditions, we believe that we could access capital markets to obtain debt financing for longer-term funding, if needed.
As of December 31, 2021, we had two primary committed credit facilities outstanding: our $1.0 billion multi-currency U.S. credit facility expiring in September 2026 and our $750 million multi-currency U.S. credit facility expiring in October 2023. In aggregate, these two facilities provide $1.75 billion in available credit. The $1.0 billion credit facility was entered into on September 28, 2021 and replaced the $900 million credit facility, which was scheduled to mature on February 2, 2022.
Each of these primary committed credit facilities includes customary representations, warranties, and covenants, including financial covenants that require us to maintain specified ratios of adjusted consolidated EBITDA to consolidated interest expense and consolidated debt to consolidated adjusted EBITDA, tested quarterly. At December 31, 2021, we did not have borrowings under either facility, and we were in compliance with the financial covenants and all other covenants contained therein during the rolling year ended December 31, 2021.
Shelf Registration Statement
On May 12, 2020, we filed a shelf registration statement with the SEC, registering the offer and sale from time to time of an indeterminate amount of, among other securities, debt securities, preference shares, Class A Ordinary Shares and convertible securities. Our ability to access the market as a source of liquidity is dependent on investor demand, market conditions, and other factors.
41


Rating Agency Ratings
The major rating agencies’ ratings of our debt at February 18, 2022 appear in the table below.
Ratings
Senior Long-term DebtCommercial PaperOutlook
Standard & Poor’sA-A-2Stable
Moody’s Investor ServicesBaa2P-2Stable
Fitch, Inc.BBB+F-2Stable
Guarantees in Connection with the Sale of the Divested Business
In connection with the sale of the Divested Business, we guaranteed future operating lease commitments related to certain facilities assumed by the Buyer. We are obligated to perform under the guarantees if the Divested Business defaults on the leases at any time during the remainder of the lease agreements, which expire on various dates through 2025. As of December 31, 2021, the undiscounted maximum potential future payments under the lease guarantee were $40 million, with an estimated fair value of $5 million. No cash payments were made in connection to the lease commitments during the year ended December 31, 2021.
Additionally, we are subject to performance guarantee requirements under certain client arrangements that were assumed by the Buyer. Should the Divested Business fail to perform as required by the terms of the arrangements, we would be required to fulfill the remaining contract terms, which expire on various dates through 2023. As of December 31, 2021, the undiscounted maximum potential future payments under the performance guarantees were $52 million, with an estimated fair value of less than $1 million. No cash payments were made in connection to the performance guarantees during the year ended December 31, 2021.
Letters of Credit and Other Guarantees
We have entered into a number of arrangements whereby our performance on certain obligations is guaranteed by a third party through the issuance of an LOC. We had total LOCs outstanding of approximately $75 million at December 31, 2021, compared to $79 million at December 31, 2020. These LOCs cover the beneficiaries related to certain of our U.S. and Canadian non-qualified pension plan schemes and secure deductible retentions for our own workers’ compensation program. We also have obtained LOCs to cover contingent payments for taxes and other business obligations to third parties, and other guarantees for miscellaneous purposes at our international subsidiaries.
We have certain contractual contingent guarantees for premium payments owed by clients to certain insurance companies. The maximum exposure with respect to such contractual contingent guarantees was approximately $153 million at December 31, 2021, compared to $113 million at December 31, 2020.
Contractual Obligations
Our contractual obligations and commitments as of December 31, 2021 are comprised of principal payments on debt, interest payments on debt, operating leases, pension and other postretirement benefit plans, and purchase obligations.
Operating leases are primarily comprised of leased office space throughout the world. As leases expire, we do not anticipate difficulty in negotiating renewals or finding other satisfactory space if the premise becomes unavailable. In certain circumstances, we may have unused space and may seek to sublet such space to third parties, depending upon the demands for office space in the locations involved. Refer to Note 8 “Lease Commitments” of the Notes to Consolidated Financial Statements contained in Part II, Item 8 of this report for further information.
Pension and other postretirement benefit plan obligations include estimates of our minimum funding requirements pursuant to the ERISA and other regulations, as well as minimum funding requirements agreed with the trustees of our U.K. pension plans. Additional amounts may be agreed to with, or required by, the U.K. pension plan trustees. Nonqualified pension and other postretirement benefit obligations are based on estimated future benefit payments. We may make additional discretionary contributions. Refer to Note 11 “Employee Benefits” of the Notes to Consolidated Financial Statements contained in Part II, Item 8 of this report for further information.
Purchase obligations are defined as agreements to purchase goods and services that are enforceable and legally binding on us, and that specifies all significant terms, including the goods to be purchased or services to be rendered, the price at which the goods or services are to be rendered, and the timing of the transactions. Most of our purchase obligations are related to purchases of information technology services or other service contracts.
42


We had no other cash requirements from known contractual obligations and commitments that have, or are reasonably likely to have, a current or future material effect on the Company’s financial condition, results of operations, or liquidity.
Guarantee of Registered Securities
In connection with the Reorganization, on April 1, 2020 Aon plc and Aon Global Holdings plc, a company incorporated under the laws of England and Wales, entered into various agreements pursuant to which they agreed to guarantee the obligations of Aon Corporation arising under issued and outstanding debt securities, which were previously guaranteed solely by Aon Global Limited and the obligations of Aon Global Limited arising under issued and outstanding debt securities, which were previously guaranteed solely by Aon Corporation. Those agreements include: (1) Second Amended and Restated Indenture, dated April 1, 2020, among Aon Corporation, Aon Global Limited, Aon plc, and Aon Global Holdings plc and The Bank of New York Mellon Trust Company, N.A., as trustee (the “Trustee”) (amending and restating the Amended and Restated Indenture, dated April 2, 2012, among Aon Corporation, Aon Global Limited and the Trustee); (2) Amended and Restated Indenture, dated April 1, 2020, among Aon Corporation, Aon Global Limited, Aon plc, Aon Global Holdings plc and the Trustee (amending and restating the Indenture, dated December 12, 2012, among Aon Corporation, Aon Global Limited plc and the Trustee); (3) Second Amended and Restated Indenture, dated April 1, 2020, among Aon Corporation, Aon Global Limited, Aon plc, Aon Global Holdings plc and the Trustee (amending and restating the Amended and Restated Indenture, dated May 20, 2015, among Aon Corporation, Aon Global Limited and the Trustee); (4) Amended and Restated Indenture, dated April 1, 2020, among Aon Corporation, Aon Global Limited, Aon plc, Aon Global Holdings plc and the Trustee (amending and restating the Indenture, dated November 13, 2015, among Aon Corporation, Aon Global Limited and the Trustee); and (5) Amended and Restated Indenture, dated April 1, 2020, among Aon Corporation, Aon Global Limited, Aon plc, Aon Global Holdings plc and the Trustee (amending and restating the Indenture, dated December 3, 2018, among Aon Corporation, Aon Global Limited and the Trustee).
After the Reorganization, newly issued and outstanding debt securities by Aon Corporation are guaranteed by Aon Global Limited, Aon plc, and Aon Global Holdings plc, and include the following (collectively, the “Aon Corporation Notes”):
Aon Corporation Notes
2.20% Senior Notes due November 2022
8.205% Junior Subordinated Notes due January 2027
4.50% Senior Notes due December 2028
3.75% Senior Notes due May 2029
2.80% Senior Notes due 2030
6.25% Senior Notes due September 2040

All guarantees of Aon plc, Aon Global Limited, and Aon Global Holdings plc of the Aon Corporation Notes are joint and several as well as full and unconditional. Senior Notes rank pari passu in right of payment with all other present and future unsecured debt which is not expressed to be subordinate or junior in rank to any other unsecured debt of the company. There are no subsidiaries other than those listed above that guarantee the Aon Corporation Notes.

After the Reorganization, newly issued and outstanding debt securities by Aon Global Limited are guaranteed by Aon plc, Aon Global Holdings plc, and Aon Corporation, and include the following (collectively, the “Aon Global Limited Notes”):
Aon Global Limited Notes
4.00% Senior Notes due November 2023
3.50% Senior Notes due June 2024
3.875% Senior Notes due December 2025
2.875% Senior Notes due May 2026
4.25% Senior Notes due December 2042
4.45% Senior Notes due May 2043
4.60% Senior Notes due June 2044
4.75% Senior Notes due May 2045
All guarantees of Aon plc, Aon Global Holdings plc, and Aon Corporation of the Aon Global Limited Notes are joint and several as well as full and unconditional. Senior Notes rank pari passu in right of payment with all other present and future
43


unsecured debt which is not expressed to be subordinate or junior in rank to any other unsecured debt of the company. There are no subsidiaries other than those listed above that guarantee the Aon Global Limited Notes.
Newly co-issued and outstanding debt securities by Aon Corporation and Aon Global Holdings plc (together, the “Co-Issuers”) are guaranteed by Aon plc and Aon Global Limited and include the following (collectively, the “Co-Issued Notes”):
Co-Issued Notes - Aon Corporation and Aon Global Holdings plc
2.05% Senior Notes due August 2031
2.60% Senior Notes due December 2031
2.90% Senior Notes due August 2051
All guarantees of Aon plc and Aon Global Limited of the Co-Issued Notes are joint and several as well as full and unconditional. Senior Notes rank pari passu in right of payment with all other present and future unsecured debt which is not expressed to be subordinate or junior in rank to any other unsecured debt of the Co-Issuers. There are no subsidiaries other than those listed above that guarantee the Co-Issued Notes.
Aon Corporation, Aon Global Limited, and Aon Global Holdings plc are indirect wholly owned subsidiaries of Aon plc. Aon plc, Aon Global Limited, Aon Global Holdings plc, and Aon Corporation together comprise the “Obligor group”. The following tables set forth summarized financial information for the Obligor group.
Adjustments are made to the tables to eliminate intercompany balances and transactions between the Obligor group. Intercompany balances and transactions between the Obligor group and non-guarantor subsidiaries are presented as separate line items within the summarized financial information. These balances are presented on a net presentation basis, rather than a gross basis, as this better reflects the nature of the intercompany positions and presents the funding or funded position that is to be received or owed. No balances or transactions of non-guarantor subsidiaries are presented in the summarized financial information, including investments of the Obligor group in non-guarantor subsidiaries. Summarized Statement of Income information for the Obligor group is as follows (in millions):
Obligor Group
Summarized Statement
of Income Information
Year Ended
December 31, 2021
Revenue$— 
Operating loss$(1,156)
Expense from non-guarantor subsidiaries before income taxes$(778)
Net loss$(2,120)
Net loss attributable to Aon shareholders$(2,120)
44


Summarized Statement of Financial Position information for the Obligor group is as follows (in millions):
Obligor Group
Summarized Statement of Financial Position Information
As of
December 31, 2021
Receivables due from non-guarantor subsidiaries$1,646 
Other current assets57 
Total current assets$1,703 
Non-current receivables due from non-guarantor subsidiaries$498 
Other non-current assets882 
Total non-current assets$1,380 
Payables to non-guarantor subsidiaries$13,509 
Other current liabilities2,013 
Total current liabilities$15,522 
Non-current payables to non-guarantor subsidiaries$7,139 
Other non-current liabilities9,512 
Total non-current liabilities$16,651 

CRITICAL ACCOUNTING POLICIES AND ESTIMATES
The Consolidated Financial Statements have been prepared in accordance with U.S. GAAP. To prepare these financial statements, we make estimates, assumptions, and judgments that affect what we report as our assets and liabilities, what we disclose as contingent assets and liabilities at the date of the Consolidated Financial Statements, and the reported amounts of revenues and expenses during the periods presented.
In accordance with our policies, we regularly evaluate our estimates, assumptions, and judgments, including, but not limited to, those concerning revenue recognition, pensions, goodwill and other intangible assets, contingencies, share-based payments, and income taxes, and base our estimates, assumptions, and judgments on our historical experience and on factors we believe reasonable under the circumstances. The results involve judgments about the carrying values of assets and liabilities not readily apparent from other sources. If our assumptions or conditions change, the actual results we report may differ from these estimates. We believe the following critical accounting policies affect the more significant estimates, assumptions, and judgments we use to prepare these Consolidated Financial Statements.
Revenue Recognition
The Company recognizes revenue when control of the promised services is transferred to the customer in the amount that best reflects the consideration to which the Company expects to be entitled in exchange for those services. For arrangements where control is transferred over time, an input or output method is applied that represents a faithful depiction of the progress towards completion of the performance obligation. For arrangements that include variable consideration, the Company assesses whether any amounts should be constrained. For arrangements that include multiple performance obligations, the Company allocates consideration based on their relative fair values.
Costs incurred by the Company in obtaining a contract are capitalized and amortized on a systematic basis that is consistent with the transfer of control of the services to which the asset relates, considering anticipated renewals when applicable. Certain contract related costs, including pre-placement brokerage costs, are capitalized as a cost to fulfill and are amortized on a systematic basis consistent with the transfer of control of the services to which the asset relates, which is generally less than one year.
Commercial Risk Solutions includes retail brokerage, specialty solutions, global risk consulting and captives management, and Affinity programs. Revenue primarily includes insurance commissions and fees for services rendered. Revenue is predominantly recognized at a point in time upon the effective date of the underlying policy (or policies), or for a limited number of arrangements, over the term of the arrangement using output measures to depict the transfer of control of the services
45


to customers in an amount that reflects the consideration to which the Company expects to be entitled in exchange for those services. For arrangements recognized over time, various output measures, including units transferred and time elapsed, are utilized to provide a faithful depiction of the progress towards completion of the performance obligation. Revenue is recorded net of allowances for estimated policy cancellations, which are determined based on an evaluation of historical and current cancellation data. Commissions and fees for brokerage services may be invoiced near the effective date of the underlying policy or over the term of the arrangement in installments during the policy period.
Reinsurance Solutions includes treaty reinsurance, facultative reinsurance, and capital markets. Revenue primarily includes reinsurance commissions and fees for services rendered. Revenue is predominantly recognized at a point in time upon the effective date of the underlying policy (or policies), or for a limited number of arrangements, over the term of the arrangement using output measures to depict the transfer of control of the services to customers in an amount that reflects the consideration to which the Company expects to be entitled in exchange for those services. For arrangements recognized over time, various output measures, including units delivered and time elapsed, are utilized to provide a faithful depiction of the progress towards completion of the performance obligation. Commissions and fees for brokerage services may be invoiced at the inception of the reinsurance period for certain reinsurance brokerage, or more commonly, over the term of the arrangement in installments based on deposit or minimum premiums for most treaty reinsurance arrangements.
Health Solutions includes consulting and brokerage, Human Capital, and voluntary benefits and enrollment solutions. Revenue primarily includes insurance commissions and fees for services rendered. For brokerage commissions, revenue is predominantly recognized at the effective date of the underlying policy (or policies), or for a limited number of arrangements, over the term of the arrangement to depict the transfer of control of the services to customers in an amount that reflects the consideration to which the Company expects to be entitled in exchange for those services using input or output measures, including units delivered or time elapsed, to provide a faithful depiction of the progress towards completion of the performance obligation. For Human Capital, revenue is recognized over time or at a point in time upon completion of the services. For arrangements recognized over time, revenue is based on a measure of progress that depicts the transfer of control of the services to the customer utilizing an appropriate input or output measure to provide a faithful depiction of the progress towards completion of the performance obligation, including units delivered or time elapsed. Input and output measures utilized vary based on the arrangement but typically include reports provided or days elapsed. Revenue from voluntary benefits and enrollment solutions arrangements are typically recognized upon successful enrollment of participants. Commissions and fees for brokerage services may be invoiced at the effective date of the underlying policy or over the term of the arrangement in installments during the policy period. Payment terms for other services vary but are typically over the contract term in installments.
Wealth Solutions includes retirement consulting, pension administration and investments. Revenue recognized for these arrangements is predominantly recognized over the term of the arrangement using input or output measures to depict the transfer of control of the services to customers in an amount that reflects the consideration to which the Company expects to be entitled in exchange for those services. For consulting arrangements recognized over time, revenue will be recognized based on a measure of progress that depicts the transfer of control of the services to the customer, utilizing an appropriate input or output measure to provide a reasonable assessment of the progress towards completion of the performance obligation including units delivered or time elapsed. Fees paid by customers for consulting services are typically charged on an hourly, project or fixed-fee basis, and revenue for these arrangements is typically recognized based on time incurred, days elapsed, or reports delivered. Revenue from time-and-materials or cost-plus arrangements are recognized as services are performed using input or output measures to provide a reasonable assessment of the progress towards completion of the performance obligation including hours worked, and revenue for these arrangements is typically recognized based on time and materials incurred. Reimbursements received for out-of-pocket expenses are generally recorded as a component of revenue. Payment terms vary but are typically over the contract term in installments.
Pensions
We sponsor defined benefit pension plans throughout the world. Our most significant plans are located in the U.S., the U.K., the Netherlands, and Canada, which are closed to new entrants. We have ceased crediting future benefits relating to salary and services for our U.S., U.K., Netherlands, and Canada plans to the extent statutorily permitted.
The service cost component of net periodic benefit cost is reported in Compensation and benefits and all other components are reported in Other income. We used a full-yield curve approach in the estimation of the service and interest cost components of net periodic pension and postretirement benefit cost for our major pension and other postretirement benefit plans; this was obtained by applying the specific spot rates along the yield curve used in the determination of the benefit obligation to the relevant projected cash flows.
46


Recognition of Gains and Losses and Prior Service
Certain changes in the value of the obligation and in the value of plan assets, which may occur due to various factors such as changes in the discount rate and actuarial assumptions, actual demographic experience, and/or plan asset performance are not immediately recognized in net income. Such changes are recognized in Other comprehensive income and are amortized into net income as part of the net periodic benefit cost.
Unrecognized gains and losses that have been deferred in Other comprehensive income, as previously described, are amortized into expense as a component of periodic pension expense based on the average life expectancy of the U.S., U.K., Netherlands, and Canada plan members. We amortize any prior service expense or credits that arise as a result of plan changes over a period consistent with the amortization of gains and losses.
As of December 31, 2021, our pension plans have deferred losses that have not yet been recognized through income in the Consolidated Financial Statements. We amortize unrecognized actuarial losses outside of a corridor, which is defined as 10% of the greater of market-related value of plan assets or PBO. To the extent not offset by future gains, incremental amortization as calculated above will continue to affect future pension expense similarly until fully amortized.
The following table discloses our accumulated other comprehensive loss,correct the number of years over which we are amortizing the loss, and the estimated 2022 amortization of loss by country (in millions, except amortization period):
U.K.U.S.Other
Accumulated other comprehensive loss$1,255 $1,551 $483 
Amortization period7 - 266 - 2311 - 35
Estimated 2022 amortization of loss$34 $67 $14 
The U.S. had no unrecognized prior service cost (credit) at December 31, 2021. The unrecognized prior service cost (credit) at December 31, 2021 was $40 million, and $(6) million for the U.K. and other plans, respectively.
For the U.S. pension plans, we use a market-related valuation of assets approach to determine the expected returnshares beneficially owned.

Corporate Governance Materials Available on assets, which is a component of net periodic benefit cost recognized in the Consolidated Statements of Income. This approach recognizes 20% of any gains or losses in the current year’s value of market-related assets, with the remaining 80% spread over the next four years. As this approach recognizes gains or losses over a five-year period, the future value of assets and therefore, our net periodic benefit cost will be impacted as previously deferred gains or losses are recorded. As of December 31, 2021, the market-related value of assets was $2.2 billion. We do not use the market-related valuation approach to determine the funded status of the U.S. plans recorded in the Consolidated Statements of Financial Position. Instead, we record and present the funded status in the Consolidated Statements of Financial Position based on the fair value of the plan assets. As of December 31, 2021, the fair value of plan assets was $2.4 billion. Our non-U.S. plans use fair value to determine expected return on assets.

Rate of Return on Plan Assets and Asset Allocation
The following table summarizes the expected long-term rate of return on plan assets for future pension expense as of December 31, 2021:
U.K.U.S.Other
Expected return on plan assets, net of administration expenses2.34%2.03 - 5.28%1.80 - 3.15%
In determining the expected rate of return for the plan assets, we analyze investment community forecasts and current market conditions to develop expected returns for each of the asset classes used by the plans. In particular, we surveyed multiple third-party financial institutions and consultants to obtain long-term expected returns on each asset class, considered historical performance data by asset class over long periods, and weighted the expected returns for each asset class by target asset allocations of the plans.
The U.S. pension plan asset allocation is based on approved allocations following adopted investment guidelines. The investment policy for U.K. and other non-U.S. pension plans is generally determined by the plans’ trustees. Because there are several pension plans maintained in the U.K. and other non-U.S. categories, our target allocation presents a range of the target allocation of each plan. Target allocations are subject to change.
47


Website
Impact of Changing Economic Assumptions
Changes in the discount rate and expected return on assets can have a material impact on pension obligations and pension expense.
Holding all other assumptions constant, the following table reflects what a 25 BPS increase and decrease in our discount rate would have on our PBO at December 31, 2021 (in millions):
Increase (decrease) in projected benefit obligation (1)
25 BPS Change in Discount Rate
IncreaseDecrease
U.K. plans$(201)$219 
U.S. plans$(89)$93 
Other plans$(64)$69 
(1)Increases to the PBO reflect increases to our pension obligations, while decreases in the PBO are recoveries toward fully-funded status. A change in the discount rate has an inverse relationship to the PBO.
Holding all other assumptions constant, the following table reflects what a 25 BPS increase and decrease in our discount rate would have on our estimated 2022 pension expense (in millions):
 25 BPS Change in Discount Rate
Increase (decrease) in expenseIncreaseDecrease
U.K. plans$(1)$
U.S. plans$$(2)
Other plans$$(1)
Holding all other assumptions constant, the following table reflects what a 25 BPS increase and decrease in our long-term rate of return on plan assets would have on our estimated 2022 pension expense (in millions):
 25 BPS Change in Long-Term Rate of Return on Plan Assets
Increase (decrease) in expenseIncreaseDecrease
U.K. plans$(15)$15 
U.S. plans$(5)$
Other plans$(4)$
The net unfunded pension balance has continued to improve in 2021, reflecting continued progress in reducing the funded status at risk. As a result, the potential impact of a hypothetical adverse change in discount rates and return seeking asset exposures would have a less significant impact as compared to prior years. A hypothetical discount rates decrease of 1% and return seeking assets decline of 10% would have resulted in expected balance sheet deterioration at 2021 of approximately $235 million, as compared to approximately $410 million in 2019, an improvement of approximately $175 million. This is largely due to greater amounts of liability matching assets and de-risking actions.
Estimated Future Contributions
We estimate cash contributions of approximately $74 million to our pension plans in 2022 as compared with cash contributions of $87 million in 2021.
Goodwill and Other Intangible Assets
Goodwill represents the excess of cost over the fair market value of the net assets acquired. We classify our intangible assets acquired as either tradenames, customer-related and contract-based, or technology and other.
Goodwill is not amortized, but rather tested for impairment at least annually in the fourth quarter. We test more frequently if there are indicators of impairment or whenever business circumstances suggest that the carrying value of goodwill may not be recoverable. These indicators may include a sustained significant decline in our share price and market capitalization, a decline in our expected future cash flows, or a significant adverse change in legal factors or in the business climate, among others.
We perform impairment reviews at the reporting unit level. A reporting unit is an operating segment or one level below an operating segment (referred to as a “component”). A component of an operating segment is a reporting unit if the component
48


constitutes a business for which discrete financial information is available and segment management regularly reviews the operating results of that component. An operating segment shall be deemed to be a reporting unit if all of its components are similar, if none of its components are a reporting unit, or if the segment comprises only a single component.
When evaluating these assets for impairment, we may first perform a qualitative assessment to determine whether it is more likely than not that a reporting unit is impaired. If we do not perform a qualitative assessment, or if we determine that it is not more likely than not that the fair value of the reporting unit exceeds its carrying amount, then the goodwill impairment test becomes a quantitative analysis. If the fair value of a reporting unit is determined to be greater than the carrying value of the reporting unit, goodwill is deemed not to be impaired and no further testing is necessary. If the fair value of a reporting unit is less than the carrying value, a goodwill impairment loss is recognized for the amount that the carrying amount of a reporting unit, including goodwill, exceeds its fair value limited to the total amount of the goodwill allocated to the reporting unit.
In determining the fair value of our reporting units, we use a DCF model based on our most current forecasts. We discount the related cash flow forecasts using the weighted average cost of capital method at the date of evaluation. Preparation of forecasts and selection of the discount rate for use in the DCF model involve significant judgments, and changes in these estimates could affect the estimated fair value of one or more of our reporting units and could result in a goodwill impairment charge in a future period. We also use market multiples which are obtained from quoted prices of comparable companies to corroborate our DCF model results. The combined estimated fair value of our reporting units from our DCF model often results in a premium over our market capitalization, commonly referred to as a control premium. We believe the implied control premium determined by our impairment analysis is reasonable based upon historic data of premiums paid on actual transactions within our industry.
We review intangible assets that are being amortized for impairment whenever events or changes in circumstance indicate that their carrying amount may not be recoverable. If we are required to record impairment charges in the future, they could materially impact our results of operations.
Contingencies
We define a contingency as an existing condition that involves a degree of uncertainty as to a possible gain or loss that will ultimately be resolved when one or more future events occur or fail to occur. Under U.S. GAAP, we are required to establish reserves for loss contingencies when the loss is probable and we can reasonably estimate its financial impact. We are required to assess the likelihood of material adverse judgments or outcomes, as well as potential ranges or probability of losses. We determine the amount of reserves required, if any, for contingencies after carefully analyzing each individual item. The required reserves may change due to new developments in each issue. We do not recognize gain contingencies until the contingency is resolved and amounts due are probable of collection.
Share-Based Payments
Share-based compensation expense is measured based on the grant date fair value and recognized over the requisite service period for awards that we ultimately expect to vest. For purposes of measuring share-based compensation expense, we consider whether an adjustment to the observable market price is necessary to reflect material nonpublic information that is known to us at the time the award is granted. No adjustments were necessary for the years ended December 31, 2021, 2020, or 2019. We also estimate forfeitures at the time of grant based on our actual experience to date and revise our estimates, if necessary, in subsequent periods if actual forfeitures differ from those estimates.
Restricted Share Units
RSUs are service-based awards for which we recognize the associated compensation cost on a straight-line basis over the requisite service period. We estimate the fair value of the awards based on the market price of the underlying share on the date of grant, reduced by the present value of estimated dividends foregone during the vesting period where applicable.
Performance Share Awards
PSAs are performance-based awards for which vesting is dependent on the achievement of certain objectives. Such objectives may be made on a personal, group or company level. We estimate the fair value of the awards based on the market price of the underlying share on the date of grant, reduced by the present value of estimated dividends foregone during the vesting period.
Compensation expense is recognized over the performance period. The number of shares issued on the vesting date will vary depending on the actual performance objectives achieved, which are based on a fixed number of potential outcomes. We make assessments of future performance using subjective estimates, such as long-term plans. As a result, changes in the underlying assumptions could have a material impact on the compensation expense recognized.
49


The largest plan is the LPP, which has a three-year performance period. As the percent of expected performance increases or decreases, the potential change in expense can go from 0% to 200% of the targeted total expense. The 2019 to 2021 performance period ended on December 31, 2021, the 2018 to 2020 performance period ended on December 31, 2020, and the 2017 to 2019 performance period ended on December 31, 2019. The LPP currently has two open performance periods: 2020 to 2022 and 2021 to 2023. A 10% upward adjustment in our estimated performance achievement percentage for both open performance periods would not have increased our 2021 expense, while a 10% downward adjustment would have decreased our expense by approximately $7.6 million.
Income Taxes
We earn income in numerous countries and this income is subject to the laws of taxing jurisdictions within those countries.
The carrying values of deferred income tax assets and liabilities reflect the application of our income tax accounting policies and are based on management’s assumptions and estimates about future operating results and levels of taxable income, and judgments regarding the interpretation of the provisions of current accounting principles.
Deferred tax assets are reduced by valuation allowances if, based on the consideration of all available evidence, it is more likely than not that some portion of the deferred tax asset will not be realized. Considerations with respect to the realizability of deferred tax assets include the period of expiration of the deferred tax asset, historical earnings and projected future taxable income by jurisdiction as well as tax liabilities for the tax jurisdiction to which the tax asset relates. Significant management judgment is required in determining the assumptions and estimates related to the amount and timing of future taxable income. Valuation allowances are evaluated periodically and will be subject to change in each future reporting period as a result of changes in various factors.
We assess carryforwards and tax credits for realization as a reduction of future taxable income by using a “more likely than not” determination.
We base the carrying values of liabilities and assets for income taxes currently payable and receivable on management’s interpretation of applicable tax laws and incorporate management’s assumptions and judgments about using tax planning strategies in various taxing jurisdictions. Using different estimates, assumptions, and judgments in accounting for income taxes, especially those that deploy tax planning strategies, may result in materially different carrying values of income tax assets and liabilities and changes in our results of operations.
NEW ACCOUNTING PRONOUNCEMENTS
Note 2 “Summary of Significant Accounting Principles and Practices” of the Notes to Consolidated Financial Statements in Part II, Item 8 of this report contains a summary of our significant accounting policies, including a discussion of recently issued accounting pronouncements and their impact or future potential impact on our financial results, if determinable.
Item 7A.    Quantitative and Qualitative Disclosures About Market Risk
We are exposed to potential fluctuations in earnings, cash flows, and the fair values of certain of our assets and liabilities due to changes in interest rates and foreign exchange rates. To manage the risk from these exposures, we enter into a variety of derivative instruments. We do not enter into derivatives or financial instruments for trading or speculative purposes.
The following discussion describes our specific exposures and the strategies we use to manage these risks. Refer to Note 2 “Summary of Significant Accounting Principles and Practices” of the Notes to Consolidated Financial Statements in Part II, Item 8 of this report for a discussion of our accounting policies for financial instruments and derivatives.
Foreign Exchange Risk
We are subject to foreign exchange rate risk. Our primary exposures include exchange rates between the U.S. dollar and the euro, the British pound, the Canadian dollar, the Australian dollar, the Indian rupee, and the Japanese yen. We use over-the-counter options and forward contracts to reduce the impact of foreign currency risk to our financial statements.
Additionally, some of our non-U.S. brokerage subsidiaries receive revenue in currencies that differ from their functional currencies. Our U.K. subsidiaries earn a portion of their revenue in U.S. dollars, euro, and Japanese yen, but most of their expenses are incurred in British pounds. At December 31, 2021, we have hedged approximately 45% of our U.K. subsidiaries’ expected exposures to the U.S. dollar, euro, and Japanese yen transactions for the years ending December 31, 2022 and 2023. We generally do not hedge exposures beyond three years.
We also use forward and option contracts to economically hedge foreign exchange risk associated with monetary balance sheet exposures, such as intercompany notes and current assets and liabilities that are denominated in a non-functional currency and are subject to remeasurement.
50


The potential loss in future earnings from foreign exchange derivative instruments resulting from a hypothetical 10% adverse change in year-end exchange rates would be $48 million and $10 million at December 31, 2022 and 2023, respectively.
The translated value of revenues and expenses from our international brokerage operations are subject to fluctuations in foreign exchange rates. If we were to translate prior year results at current year exchange rates, diluted earnings per share would have a favorable $0.17 impact during the year ended December 31, 2021. Further, adjusted diluted earnings per share, a non-GAAP measure as defined and reconciled under the caption “Review of Consolidated Results — Adjusted Diluted Earnings Per Share,” would have a favorable $0.23 impact during the year ended December 31, 2021 if we were to translate prior year results at current quarter exchange rates.
Interest Rate Risk
Our fiduciary investment income is affected by changes in international and domestic short-term interest rates. We monitor our net exposure to short-term interest rates and, as appropriate, hedge our exposure with various derivative financial instruments. This activity primarily relates to brokerage funds held on behalf of clients in the U.S. and in continental Europe. A hypothetical, instantaneous parallel decrease in the year-end yield curve of 100 BPS would cause a decrease, net of derivative positions, of $64 million to each of 2022 and 2023 pretax income. A corresponding increase in the year-end yield curve of 100 BPS would cause an increase, net of derivative positions, of $64 million to each of 2022 and 2023 pre-tax income.
We have long-term debt outstanding, excluding the current portion, with a fair market value of $9.2 billion and $8.8 billion as of December 31, 2021 and December 31, 2020, respectively. The fair value was greater than the carrying value by $0.9 billion at December 31, 2021, and $1.4 billion greater than the carrying value at December 31, 2020. A hypothetical 1% increase or decrease in interest rates would change the fair value by a decrease of 8% or an increase of 9%, respectively, at December 31, 2021.
We have selected hypothetical changes in foreign currency exchange rates, interest rates, and equity market prices to illustrate the possible impact of these changes; we are not predicting market events.

51


Item 8.    Financial Statements and Supplementary Data
Report of Independent Registered Public Accounting Firm
To the Shareholders and Board of Directors of Aon plc

Opinion on the Financial Statements

We have audited the accompanying consolidated statement of financial position of Aon plc (the Company) as of December 31, 2021 and 2020, the related consolidated statements of income, comprehensive income, shareholders’ equity and cash flows for each of the three years in the period ended December 31, 2021, and the related notes (collectively referred to as the “financial statements”). In our opinion, the consolidated financial statements present fairly, in all material respects, the financial position of the Company at December 31, 2021 and 2020, and the results of its operations and its cash flows for each of the three years in the period ended December 31, 2021, in conformity with U.S. generally accepted accounting principles.

We also have audited, in accordance with the standards of the Public Company Accounting Oversight Board (United States) (PCAOB), the Company's internal control over financial reporting as of December 31, 2021, based on criteria established in Internal Control-Integrated Framework issued by the Committee of Sponsoring Organizations of the Treadway Commission (2013 framework), and our report dated February 18, 2022, expressed an unqualified opinion thereon.

Basis for Opinion

These financial statements are the responsibility of the Company's management. Our responsibility is to express an opinion on the Company’s financial statements based on our audits. We are a public accounting firm registered with the PCAOB and are required to be independent with respect to the Company in accordance with the U.S. federal securities laws and the applicable rules and regulations of the Securities and Exchange Commission and the PCAOB.

We conducted our audits in accordance with the standards of the PCAOB. Those standards require that we plan and perform the audit to obtain reasonable assurance about whether the financial statements are free of material misstatement, whether due to error or fraud. Our audits included performing procedures to assess the risks of material misstatement of the financial statements, whether due to error or fraud, and performing procedures that respond to those risks. Such procedures included examining, on a test basis, evidence regarding the amounts and disclosures in the financial statements. Our audits also included evaluating the accounting principles used and significant estimates made by management, as well as evaluating the overall presentation of the financial statements. We believe that our audits provide a reasonable basis for our opinion.

Critical Audit Matter

The critical audit matter communicated below is a matter arising from the current period audit of the financial statements that was communicated or required to be communicated to the audit committee and that: (1) relates to accounts or disclosures that are material to the financial statements and (2) involved our especially challenging, subjective or complex judgments. The communication of the critical audit matter does not alter in any way our opinion on the consolidated financial statements, taken as a whole, and we are not, by communicating the critical audit matter below, providing a separate opinion on the critical audit matter or on the account or disclosure to which it relates.

52


Realizability of Deferred Tax Assets
Description of the Matter
As discussed in Note 10 “Income Taxes” of the Notes to Consolidated Financial Statements, the Company had net deferred tax assets of $365 million at December 31, 2021. Deferred tax assets are reduced by a valuation allowance if, based on the weight of all available evidence, in management’s judgment it is more likely than not that some portion, or all, of the deferred tax assets will not be realized.

Conclusions on the realizability of certain net deferred tax assets involve significant management judgement including assumptions and estimates related to the amount and timing of future taxable income. Auditing the deferred tax asset calculation and the related forecast of future taxable income was especially challenging as it involved a high degree of auditor judgement around management’s assumptions and estimates.
How We Addressed the Matter in Our Audit
We obtained an understanding, evaluated the design and operating effectiveness of internal controls that address the risks of material misstatement relating to the realizability of deferred tax assets, including controls over management’s projections of future taxable income and the related assumptions.

Among other audit procedures performed, we evaluated the assumptions used by the Company to develop projections of future taxable income by income tax jurisdiction and tested the completeness and accuracy of the underlying data used in the projections. For example, we inspected the growth rate used in the calculation, the estimates of the reversal of cumulative temporary differences by year and the capital and debt requirements by jurisdiction. We compared the projections of future taxable income with the actual results of prior periods, as well as management’s considerations of current industry and economic trends. Further, we involved tax subject matter professionals in the review of the information identified.

aon-20211231_g1.jpg

We have served as the Company’s auditor since 1986.

Chicago, Illinois
February 18, 2022
53


Aon plc
Consolidated Statements of Income
Years Ended December 31
(millions, except per share data)202120202019
Revenue    
Total revenue $12,193 $11,066 $11,013 
Expenses    
Compensation and benefits 6,738 5,905 6,054 
Information technology477 444 494 
Premises327 291 339 
Depreciation of fixed assets179 167 172 
Amortization and impairment of intangible assets147 246 392 
Other general expense 2,235 1,232 1,393 
Total operating expenses 10,103 8,285 8,844 
Operating income 2,090 2,781 2,169 
Interest income 11 
Interest expense (322)(334)(307)
Other income 152 13 — 
Income before income taxes 1,931 2,466 1,870 
Income tax expense 623 448 297 
Net income1,308 2,018 1,573 
Less: Net income attributable to noncontrolling interests 53 49 41 
Net income attributable to Aon shareholders $1,255 $1,969 $1,532 
Basic net income per share attributable to Aon shareholders$5.59 $8.49 $6.42 
Diluted net income per share attributable to Aon shareholders$5.55 $8.45 $6.37 
Weighted average ordinary shares outstanding - basic 224.7 231.9 238.6 
Weighted average ordinary shares outstanding - diluted226.1 233.1 240.6 
See accompanying Notes to Consolidated Financial Statements.
54


Aon plc
Consolidated Statements of Comprehensive Income
Years Ended December 31
(millions)202120202019
Net income$1,308 $2,018 $1,573 
Less: Net income attributable to noncontrolling interests53 49 41 
Net income attributable to Aon shareholders1,255 1,969 1,532 
Other comprehensive income (loss), net of tax:   
Change in fair value of financial instruments13 
Foreign currency translation adjustments(289)263 14 
Postretirement benefit obligation277 (101)(141)
Total other comprehensive income (loss)(11)175 (124)
Less: Other comprehensive income (loss) attributable to noncontrolling interests(1)— 
Total other comprehensive income (loss) attributable to Aon shareholders(10)172 (124)
Comprehensive income attributable to Aon shareholders$1,245 $2,141 $1,408 
See accompanying Notes to Consolidated Financial Statements.
55


Aon plc
Consolidated Statements of Shareholders’ Equity
(millions, except per share data)SharesOrdinary Shares and Additional Paid-in CapitalRetained Earnings (Accumulated Deficit)Accumulated Other
Comprehensive Loss, Net of Tax
Non-controlling
Interests
Total
Balance at December 31, 2018240.1 $5,967 $2,093 $(3,909)$68 $4,219 
Net income— — 1,532 — 41 1,573 
Shares issued — employee stock compensation plans2.5 (130)(1)— — (131)
Shares purchased(10.5) (1,960)— — (1,960)
Share-based compensation expense— 317 — — — 317 
Dividends to shareholders ($1.72 per share)— — (410)— — (410)
Net change in fair value of financial instruments— — — — 
Net foreign currency translation adjustments— — — 14 — 14 
Net postretirement benefit obligation— — — (141)— (141)
Dividends paid to noncontrolling interests on subsidiary common stock— — — — (35)(35)
Balance at December 31, 2019232.1 6,154 1,254 (4,033)74 3,449 
Adoption of new accounting guidance— — (6)— — (6)
Balance at January 1, 2020232.1 6,154 1,248 (4,033)74 3,443 
Net income— — 1,969 — 49 2,018 
Shares issued — employee stock compensation plans1.9 (154)— — — (154)
Shares purchased(8.5)— (1,763)— — (1,763)
Share-based compensation expense— 317 — — — 317 
Dividends to shareholders ($1.78 per share)— — (412)— — (412)
Net change in fair value of financial instruments— — — 13 — 13 
Net foreign currency translation adjustments— — — 260 263 
Net postretirement benefit obligation— — — (101)— (101)
Net purchases of shares from noncontrolling interests— (3)— — (6)(9)
Dividends paid to noncontrolling interests on subsidiary common stock— — — — (32)(32)
Balance at December 31, 2020225.5 6,314 1,042 (3,861)88 3,583 
Net income— — 1,255 — 53 1,308 
Shares issued — employee stock compensation plans1.7 (129)(1)— — (130)
Shares purchased(12.4)— (3,543)— — (3,543)
Share-based compensation expense— 449 — — — 449 
Dividends to shareholders ($1.99 per share)— — (447)— — (447)
Net change in fair value of financial instruments— — — — 
Net foreign currency translation adjustments— — — (288)(1)(289)
Net postretirement benefit obligation— — — 277 — 277 
Net purchases of shares from noncontrolling interests— (8)— — (5)(13)
Dividends paid to noncontrolling interests on subsidiary common stock— — — — (38)(38)
Balance at December 31, 2021214.8 $6,626 $(1,694)$(3,871)$97 $1,158 
See accompanying Notes to Consolidated Financial Statements.

56


Aon plc
Consolidated Statements of Financial Position
As of December 31
(millions, except nominal value)20212020
Assets  
Current assets  
Cash and cash equivalents$544 $884 
Short-term investments292 308 
Receivables, net3,094 3,070 
Fiduciary assets14,386 13,798 
Other current assets716 624 
Total current assets19,032 18,684 
Goodwill8,434 8,666 
Intangible assets, net492 640 
Fixed assets, net529 599 
Operating lease right-of-use assets786 911 
Deferred tax assets766 724 
Prepaid pension1,366 1,280 
Other non-current assets512 610 
Total assets$31,917 $32,114 
Liabilities and equity  
Liabilities  
Current liabilities  
Accounts payable and accrued liabilities$2,192 $2,016 
Short-term debt and current portion of long-term debt1,164 448 
Fiduciary liabilities14,386 13,798 
Other current liabilities1,331 1,171 
Total current liabilities19,073 17,433 
Long-term debt8,228 7,281 
Non-current operating lease liabilities772 897 
Deferred tax liabilities401 262 
Pension, other postretirement, and postemployment liabilities1,375 1,763 
Other non-current liabilities910 895 
Total liabilities30,759 28,531 
Equity  
Ordinary shares - $0.01 nominal value
    Authorized: 500.0 shares (issued: 2021 - 214.8; 2020 - 225.5)
Additional paid-in capital6,624 6,312 
Retained earnings (accumulated deficit)(1,694)1,042 
Accumulated other comprehensive loss(3,871)(3,861)
Total Aon shareholders' equity1,061 3,495 
Noncontrolling interests97 88 
Total equity1,158 3,583 
Total liabilities and equity$31,917 $32,114 
See accompanying Notes to Consolidated Financial Statements.
57


Aon plc
Consolidated Statements of Cash Flows
Years Ended December 31
(millions)20212020
(As Revised)
2019
(As Revised)
Cash flows from operating activities   
Net income$1,308 $2,018 $1,573 
Adjustments to reconcile net income to cash provided by operating activities:              
Gain from sales of businesses and investments(142)(25)(13)
Depreciation of fixed assets179 167 172 
Amortization and impairment of intangible assets147 246 392 
Share-based compensation expense449 312 317 
Deferred income taxes11 (36)
Change in assets and liabilities:   
Receivables, net(119)108 (371)
Accounts payable and accrued liabilities264 186 (28)
Current income taxes200 (17)(20)
Pension, other postretirement and postemployment liabilities(119)(141)(156)
Other assets and liabilities(80)
Cash provided by operating activities2,182 2,783 1,835 
Cash flows from investing activities   
Proceeds from investments58 64 61 
Payments for investments(91)(97)(113)
Net sales (purchases) of short-term investments - non fiduciary15 (167)35 
Acquisition of businesses, net of cash and funds held on behalf of clients(14)(368)(39)
Sale of businesses, net of cash and funds held on behalf of clients218 30 52 
Capital expenditures(137)(141)(225)
Cash provided by (used for) investing activities49 (679)(229)
Cash flows from financing activities   
Share repurchase(3,543)(1,763)(1,960)
Issuance of shares for employee benefit plans(130)(149)(131)
Issuance of debt5,973��4,153 6,052 
Repayment of debt(4,220)(3,882)(4,941)
Increase in fiduciary liabilities, net of fiduciary receivables568 316 1,246 
Cash dividends to shareholders(447)(412)(410)
Noncontrolling interests and other financing activities(125)(35)(103)
Cash used for financing activities(1,924)(1,772)(247)
Effect of exchange rates on cash and cash equivalents and funds held on behalf of clients(235)297 63 
Net increase in cash and cash equivalents and funds held on behalf of clients72 629 1,422 
Cash and cash equivalents and funds held on behalf of clients at beginning of year6,573 5,944 4,522 
Cash and cash equivalents and funds held on behalf of clients at end of year$6,645 $6,573 $5,944 
Reconciliation of cash and cash equivalents and funds held on behalf of clients:
Cash and cash equivalents$544 $884 $790 
Funds held on behalf of clients6,101 5,689 5,154 
Total cash and cash equivalents and funds held on behalf of clients$6,645 $6,573 $5,944 
Supplemental disclosures:   
Interest paid$328 $326 $289 
Income taxes paid, net of refunds$412 $455 $353 
See accompanying Notes to Consolidated Financial Statements.
58


Notes to Consolidated Financial Statements
1.    Basis of Presentation
The accompanying Consolidated Financial Statements have been prepared in accordance with U.S. GAAP. The Consolidated Financial Statements include the accounts of Aon plc and all of its controlled subsidiaries (“Aon” or the “Company”). Intercompany accounts and transactions have been eliminated. The Consolidated Financial Statements include, in the opinion of management, all adjustments (consisting of normal recurring adjustments and reclassifications) necessary to present fairly the Company’s consolidated financial position, results of operations and cash flows for all periods presented.
References in this report to “Aon,” the “Company,” “we,” “us,” or “our” for time periods prior to April 1, 2020 refer to Aon Global Limited. References in the Financial Statements to “Aon,” the “Company,” “we,” “us,” or “our” for time periods on or after April 1, 2020, refer to Aon plc.
Reclassification
Certain amounts in the prior year's Consolidated Financial Statements have been reclassified to conform to the current year’s presentation. For the years ended December 31, 2020 and December 31, 2019, there was $1 million of income and $1 million of loss, respectively, including the related tax effect, from discontinued operations recognized in Net Income from discontinued operations in the Consolidated Statements of Income and Consolidated Statements of Cash Flows. These amounts are now included in Other income in the Consolidated Statements of Income and Other assets and liabilities in the Consolidated Statements of Cash Flows for the years ended December 31, 2020 and December 31, 2019. There was no impact to the effective tax rate on Net income or earnings per share in either period.
Additionally, for the years ended December 31, 2020 and December 31, 2019, a cash outflow of $127 million and a cash inflow of $3 million, respectively, was classified as an adjustment to Net income from Restructuring reserves in the Consolidated Statements of Cash Flows. These amounts are now included in Other assets and liabilities in the Consolidated Statements of Cash Flows for the years ended December 31, 2020 and December 31, 2019. There was no impact on Cash provided by operating activities.
Disaggregation of Revenue
In 2021, the Company announced steps to further accelerate its Aon United strategy, which now includes 4 solution lines: Commercial Risk Solutions, Reinsurance Solutions, Health Solutions, and Wealth Solutions. Disaggregation of revenue by the new solution line’s structure is reflected in Note 3 “Revenue from Contracts with Customers”, where prior period amounts have been reclassified to conform to the current periods’ presentation. The changes in the solution line structure affect only the manner in which the Company's revenue results for the Company’s principal service lines were previously reported and have no impact on the Company's previously reported Consolidated Financial Statements, results of operations, or total organic revenue growth. Refer to Part II, Item 7, Management’s Discussion and Analysis of Financial Condition and Results of Operations for more information about the changes in the presentation of our principal service line reporting. The Company continues to operate as 1 segment that includes all of the Company’s operations, refer to Note 16 “Segment Information” for further information.
Use of Estimates
The preparation of the accompanying Consolidated Financial Statements in conformity with U.S. GAAP requires management to make estimates and assumptions that affect the reported amounts of assets and liabilities, the disclosures of contingent assets and liabilities at the date of the Consolidated Financial Statements, and the reported amounts of reserves and expenses. These estimates and assumptions are based on management’s best estimates and judgments. Management evaluates its estimates and assumptions on an ongoing basis using historical experience and other factors, including the current economic environment. Management believes its estimates to be reasonable given the current facts available. Aon adjusts such estimates and assumptions when facts and circumstances dictate. Illiquid credit markets, volatile equity markets, foreign currency exchange rate movements, and the COVID-19 pandemic increase the uncertainty inherent in such estimates and assumptions. As future events and their effects cannot be determined with precision, actual results could differ significantly from these estimates. Changes in estimates resulting from continuing changes in the economic environment would, if applicable, be reflected in the Consolidated Financial Statements in future periods.
Revision of Previously Issued Financial Statements
During the fourth quarter of 2021, the Company identified and corrected an immaterial presentation error related to funds held on behalf of clients in the Consolidated Statements of Cash Flows.
59


Based on an analysis of quantitative and qualitative factors in accordance with SEC Staff Accounting Bulletins 99 “Materiality” and 108 “Considering the Effects of Prior Year Misstatements when Quantifying Misstatements in Current Year Financial Statements”, the Company concluded that these errors were immaterial, individually and in the aggregate, to the Consolidated Statements of Cash Flows as presented in the Company’s quarterly and annual financial statements previously filed in the Company’s Quarterly Reports on Form 10-Q and Annual Reports on Form 10-K. There was no impact to the Consolidated Statements of Income, Statements of Comprehensive Income, Statements of Financial Position, or Statements of Shareholders’ Equity for any period presented.
In preparing the Company’s Consolidated Statement of Cash Flows for the year ended December 31, 2021, the Company made appropriate revisions to its Consolidated Statements of Cash Flows for historical periods. Such changes are reflected for the years ended December 31, 2020 and 2019, included in these financial statements, and will also be reflected in the historical periods included in the Company’s subsequent quarterly and annual consolidated financial statements.
The impact to the Consolidated Statements of Cash Flows previously filed in Annual Reports on Form 10-K is as follows (in millions):
Year Ended
December 31, 2020
Year Ended
December 31, 2019
As ReportedEffect of ChangeAs RevisedAs ReportedEffect of ChangeAs Revised
Cash provided by operating activities$2,783 $— $2,783 $1,835 $— $1,835 
Cash used for investing activities(679)— (679)(229)— (229)
Cash provided by (used for) financing activities(2,088)316 (1,772)(1,493)1,246 (247)
Effect of exchange rates on cash and cash equivalents and funds held on behalf of clients78 219 297 21 42 63 
Net increase in cash and cash equivalents and funds held on behalf of clients94 535 629 134 1,288 1,422 
Cash and cash equivalents and funds held on behalf of clients at beginning of year790 5,154 5,944 656 3,866 4,522 
Cash and cash equivalents and funds held on behalf of clients at end of year$884 $5,689 $6,573 $790 $5,154 $5,944 
The impact to the Consolidated Statements of Cash Flows previously filed in unaudited Quarterly Reports on Form 10-Q is as follows (in millions):
Three Months Ended
March 31, 2021
Six Months Ended
June 30, 2021
Nine Months Ended
September 30, 2021
As ReportedEffect of ChangeAs RevisedAs ReportedEffect of ChangeAs RevisedAs ReportedEffect of ChangeAs Revised
Cash provided by operating activities$561 $— $561 $1,345 $— $1,345 $1,251 $— $1,251 
Cash provided by (used for) investing activities102 — 102 (27)— (27)(116)— (116)
Cash provided by (used for) financing activities(709)28 (681)(1,122)386 (736)(1,380)786 (594)
Effect of exchange rates on cash and cash equivalents and funds held on behalf of clients(16)(18)(34)11 18 29 (30)(63)(93)
Net increase (decrease) in cash and cash equivalents and funds held on behalf of clients(62)10 (52)207 404 611 (275)723 448 
Cash and cash equivalents and funds held on behalf of clients at beginning of year884 5,689 6,573 884 5,689 6,573 884 5,689 6,573 
Cash and cash equivalents and funds held on behalf of clients at end of year$822 $5,699 $6,521 $1,091 $6,093 $7,184 $609 $6,412 $7,021 
2.    Summary of Significant Accounting Principles and Practices
Revenue Recognition
The Company generates revenues primarily through commissions, compensation from insurance and reinsurance companies for services provided to them, and fees from customers. Commissions and fees for brokerage services vary depending upon several
60


factors, which may include the amount of premium, the type of insurance or reinsurance coverage provided, the particular services provided to a client, insurer, or reinsurer, and the capacity in which the Company acts. Compensation from insurance and reinsurance companies includes: (1) fees for consulting and analytics services and (2) fees and commissions for administrative and other services provided to or on behalf of insurers. In Aon’s capacity as an insurance and reinsurance broker, the service promised to the customer is placement of an effective insurance or reinsurance policy, respectively. At the completion of the insurance or reinsurance policy placement process once coverage is effective, the customer has obtained control over the services promised by the Company. Judgment is not typically required when assessing whether the coverage is effective. Fees from clients for advice and consulting services are dependent on the extent and value of the services provided. Payment terms for the Company’s principal service lines are discussed below; the Company believes these terms are consistent with current industry practices. Significant financing components are typically not present in Aon’s arrangements.
The Company recognizes revenue when control of the promised services is transferred to the customer in the amount that best reflects the consideration to which the Company expects to be entitled in exchange for those services. For arrangements where control is transferred over time, an input or output method is applied that represents a faithful depiction of the progress towards completion of the performance obligation. For arrangements that include variable consideration, the Company assesses whether any amounts should be constrained. For arrangements that include multiple performance obligations, the Company allocates consideration based on their relative fair values.
Costs incurred by the Company in obtaining a contract are capitalized and amortized on a systematic basis that is consistent with the transfer of control of the services to which the asset relates, considering anticipated renewals when applicable. Certain contract related costs, including pre-placement brokerage costs, are capitalized as a cost to fulfill and are amortized on a systematic basis consistent with the transfer of control of the services to which the asset relates, which is generally less than one year.
The Company has elected to apply practical expedients to not disclose the revenue related to unsatisfied performance obligations if (1) the contract has an original duration of 1 year or less, (2) the Company has recognized revenue for the amount in which it has the right to bill, and (3) the variable consideration is allocated entirely to an unsatisfied performance obligation which is recognized as a seriesof distinct goods or services that form a single performance obligation.
Disaggregation of Revenue
The following is a description of principal service lines from which the Company generates its revenue:
Commercial Risk Solutions includes retail brokerage, specialty solutions, global risk consulting and captives management, and Affinity programs. Revenue primarily includes insurance commissions and fees for services rendered. Revenue is predominantly recognized at a point in time upon the effective date of the underlying policy (or policies), or for a limited number of arrangements, over the term of the arrangement using output measures to depict the transfer of control of the services to customers in an amount that reflects the consideration to which the Company expects to be entitled in exchange for those services. For arrangements recognized over time, various output measures, including units transferred and time elapsed, are utilized to provide a faithful depiction of the progress towards completion of the performance obligation. Revenue is recorded net of allowances for estimated policy cancellations, which are determined based on an evaluation of historical and current cancellation data. Commissions and fees for brokerage services may be invoiced near the effective date of the underlying policy or over the term of the arrangement in installments during the policy period.
Reinsurance Solutions includes treaty reinsurance, facultative reinsurance, and capital markets. Revenue primarily includes reinsurance commissions and fees for services rendered. Revenue is predominantly recognized at a point in time upon the effective date of the underlying policy (or policies), or for a limited number of arrangements, over the term of the arrangement using output measures to depict the transfer of control of the services to customers in an amount that reflects the consideration to which the Company expects to be entitled in exchange for those services. For arrangements recognized over time, various output measures, including units delivered and time elapsed, are utilized to provide a faithful depiction of the progress towards completion of the performance obligation. Commissions and fees for brokerage services may be invoiced at the inception of the reinsurance period for certain reinsurance brokerage, or more commonly, over the term of the arrangement in installments based on deposit or minimum premiums for most treaty reinsurance arrangements.
Health Solutions includes consulting and brokerage, Human Capital, and voluntary benefits and enrollment solutions. Revenue primarily includes insurance commissions and fees for services rendered. For brokerage commissions, revenue is predominantly recognized at a point in time upon the effective date of the underlying policy (or policies), or for a limited number of arrangements, over the term of the arrangement to depict the transfer of control of the services to customers in an amount that reflects the consideration to which the Company expects to be entitled in exchange for those services using input or output measures, including units delivered or time elapsed, to provide a faithful depiction of the progress towards completion of the performance obligation. Revenue from health care exchange arrangements is typically recognized upon successful enrollment
61


of participants. Commissions and fees for brokerage services may be invoiced at the effective date of the underlying policy or over the term of the arrangement in installments during the policy period. Payment terms for other services vary but are typically over the contract term in installments.
Wealth Solutions includes retirement consulting and pension administration, as well as investments. Revenue recognized for these arrangements is predominantly recognized over the term of the arrangement using input or output measures to depict the transfer of control of the services to customers in an amount that reflects the consideration to which the Company expects to be entitled in exchange for those services, or for certain arrangements, at a point in time upon completion of the services. For consulting arrangements recognized over time, revenue will be recognized based on a measure of progress that depicts the transfer of control of the services to the customer, utilizing an appropriate input or output measure to provide a reasonable assessment of the progress towards completion of the performance obligation including units delivered or time elapsed. Fees paid by customers for consulting services are typically charged on an hourly, project or fixed-fee basis, and revenue for these arrangements is typically recognized based on time incurred, days elapsed, or reports delivered. Revenue from time-and-materials or cost-plus arrangements are recognized as services are performed using input or output measures to provide a reasonable assessment of the progress towards completion of the performance obligation including hours worked, and revenue for these arrangements is typically recognized based on time and materials incurred. Reimbursements received for out-of-pocket expenses are generally recorded as a component of revenue. Payment terms vary but are typically over the contract term in installments.
Share-based Compensation Expense
Share-based payments to employees, including grants of RSUs and PSAs, are measured based on grant date fair value. For purposes of measuring share-based compensation expense, the Company considered whether an adjustment to the observable market price is necessary to reflect material nonpublic information that is known to us at the time the award is granted. No adjustments were necessary for the years ended December 31, 2021, 2020, or 2019. The Company recognizes compensation expense over the requisite service period for awards expected to ultimately vest. Forfeitures are estimated on the date of grant and revised if actual or expected forfeiture activity differs materially from original estimates.
Pension and Other Postretirement Benefits
The Company records net periodic cost relating to its pension and other postretirement benefit plans based on calculations that include various actuarial assumptions, including discount rates, assumed rates of return on plan assets, inflation rates, mortality rates, compensation increases, and turnover rates. The Company reviews its actuarial assumptions on an annual basis and modifies these assumptions based on current rates and trends. The effects of gains, losses, and prior service costs and credits are amortized over future service periods or future estimated lives if the plans are frozen as reflected in Other income within the Consolidated Statements of Income. The funded status of each plan, calculated as the fair value of plan assets less the benefit obligation, is reflected in the Company’s Consolidated Statements of Financial Position using a December 31 measurement date.
Earnings per Share
Basic earnings per share is computed by dividing net income available to ordinary shareholders by the weighted-average number of ordinary shares outstanding, including participating securities, which consist of unvested share awards with non-forfeitable rights to dividends. Diluted earnings per share is computed by dividing net income available to ordinary shareholders by the weighted average number of ordinary shares outstanding, which have been adjusted for the dilutive effect of potentially issuable ordinary shares, including certain contingently issuable shares. The diluted earnings per share calculation reflects the more dilutive effect of either (1) the two-class method that assumes that the participating securities have not been exercised, or (2) the treasury stock method.
Potentially issuable shares are not included in the computation of diluted earnings per share if their inclusion would be antidilutive.
Cash and Cash Equivalents and Short-term Investments
Cash and cash equivalents include cash balances and all highly liquid investments with initial maturities of three months or less. Short-term investments consist of money market funds. The estimated fair value of Cash and cash equivalents and Short-term investments approximates their carrying values.
At December 31, 2021, Cash and cash equivalents and Short-term investments totaled $836 million compared to $1,192 million at December 31, 2020, a decrease of $356 million. Of the total balance, $160 million and $102 million was restricted as to its use at December 31, 2021 and 2020, respectively. Included within Short-term investments as of December 31, 2021 and 2020 balances, respectively, were £84.3 million ($112.8 million at December 31, 2021 exchanges rates) and £44.4 million ($60.2
62


million at December 31, 2020 exchange rates) of operating funds required to be held by the Company in the U.K. by the FCA, a U.K.-based regulator. During 2021, following discussions with the FCA, and to take into consideration the potential future effects from market volatility due to COVID-19, the Company changed the basis of calculating its liquidity requirement and increased the amount of funds held by £34.3 million ($45.9 million at December 31, 2021 exchange rates).
Fiduciary Assets and Liabilities
In its capacity as an insurance agent and broker, Aon collects premiums from insureds and, after deducting its commission, remits the premiums to the respective insurers. Aon also collects claims or refunds from insurers on behalf of insureds. Uncollected premiums from insureds and uncollected claims or refunds from insurers are recorded as Fiduciary assets in the Company’s Consolidated Statements of Financial Position. Unremitted insurance premiums and claims are held in a fiduciary capacity and the obligation to remit these funds is recorded as Fiduciary liabilities in the Consolidated Statements of Financial Position.
Funds held on behalf of clients represent fiduciary assets held by Aon for premiums collected from insureds but not yet remitted to insurance companies and claims collected from insurance companies but not yet remitted to insureds of $6.1 billion and $5.7 billion at December 31, 2021 and 2020, respectively. Fiduciary receivables were $8.3 billion and $8.1 billion at December 31, 2021 and 2020, respectively. These funds and a corresponding liability are included in Fiduciary assets and Fiduciary liabilities, respectively, in the accompanying Consolidated Statements of Financial Position.
Allowance for Doubtful Accounts
The Company’s estimate for allowance for credit losses with respect to receivables is based on a combination of factors, including evaluation of forward-looking information, historical write-offs, aging of balances, and other qualitative and quantitative analyses. Receivables, net included an allowance for doubtful accounts of $90 million and $98 million at December 31, 2021 and 2020, respectively.
Fixed Assets
Fixed assets are stated at cost, less accumulated depreciation. Included in this category are certain capitalized costs incurred during the application development stage related to directly obtaining, developing, or enhancing internal use software. Depreciation and amortization are computed using the straight-line method over the estimated useful lives of the assets, which are generally as follows:
Asset DescriptionEstimated Useful Life
SoftwareLesser of the life of an associated license, or 4 to 7 years
Leasehold improvementsLesser of estimated useful life or lease term, not to exceed 10 years
Furniture, fixtures and equipment4 to 10 years
Computer equipment4 to 6 years
Buildings35 years
Automobiles6 years
Goodwill and Intangible Assets
Goodwill represents the excess of acquisition cost over the fair value of the net assets acquired in the acquisition of a business. Goodwill is allocated to applicable reporting units. Upon disposition of a business entity, goodwill is allocated to the disposed entity based on the fair value of that entity compared to the fair value of the reporting unit in which it was included. Goodwill is not amortized, but instead is tested for impairment at least annually. The goodwill impairment test is performed at the reporting unit level. The Company may initially perform a qualitative analysis to determine if it is more likely than not that the goodwill balance is impaired. If a qualitative assessment is not performed or if a determination is made that it is not more likely than not that their value of the reporting unit exceeds its carrying amount, then the Company will perform a quantitative analysis. If the fair value of a reporting unit is determined to be greater than the carrying value of the reporting unit, goodwill is deemed not to be impaired and no further testing is necessary. If the fair value of a reporting unit is less than the carrying value, a goodwill impairment loss is recognized for the amount that the carrying amount of a reporting unit, including goodwill, exceeds its fair value limited to the total amount of the goodwill allocated to the reporting unit. Any resulting difference will be a charge to Amortization and impairment of intangible assets in the Consolidated Statements of Income in the period in which the determination is made. Fair value is determined using a combination of present value techniques and market prices of comparable businesses.
63


We classify our intangible assets acquired as either tradenames, customer-related and contract-based, or technology and other. Amortization basis and estimated useful lives by intangible asset type are generally as follows:
Intangible Asset DescriptionAmortization BasisEstimated Useful Life
Customer-related and contract-basedIn line with underlying cash flows7 to 20 years
Technology and otherStraight-line5 to 7 years
TradenamesStraight-line1 to 3 years
Derivatives
Derivative instruments are recognized in the Consolidated Statements of Financial Position at fair value. Where the Company has entered into master netting agreements with counterparties, the derivative positions are netted by counterparties and are reported accordingly in other assets or other liabilities. Changes in the fair value of derivative instruments are recognized in earnings each period, unless the derivative is designated and qualifies as a cash flow or net investment hedge.
The Company has historically designated the following hedging relationships for certain transactions: (1) a hedge of the change in fair value of a recognized asset or liability or firm commitment (“fair value hedge”), (2) a hedge of the variability in cash flows from a recognized variable-rate asset or liability or forecasted transaction (“cash flow hedge”), and (3) a hedge of the net investment in a foreign operation (“net investment hedge”).
In order for a derivative to qualify for hedge accounting, the derivative must be formally designated as a fair value, cash flow, or a net investment hedge by documenting the relationship between the derivative and the hedged item. The documentation must include a description of the hedging instrument, the hedged item, the risk being hedged, Aon’s risk management objective and strategy for undertaking the hedge, and the method for assessing the effectiveness of the hedge. Additionally, the hedge relationship must be expected to be highly effective at offsetting changes in either the fair value or cash flows of the hedged item at both the inception of the hedge and on an ongoing basis. Aon assesses the ongoing effectiveness of its hedges quarterly or more frequently if facts and circumstances require.
For a derivative designated as a fair value hedging instrument, the gain or loss is recognized in earnings in the period of change together with the offsetting loss or gain on the hedged item attributable to the risk being hedged. The effect is to reflect in earnings the extent to which the hedge is not effective in achieving offsetting changes in fair value. For a cash flow hedge that qualifies for hedge accounting, the change in fair value of a hedging instrument is recognized in Accumulated Other Comprehensive Income and subsequently reclassified to earnings in the same period the hedged item impacts earnings. For a net investment hedge, the change in fair value of the hedging instrument is recognized in Accumulate Other Comprehensive Income as part of the cumulative translation adjustment.
Changes in the fair value of a derivative that is not designated as part of a hedging relationship (commonly referred to as an “economic hedge”) are recorded in Other income in the Consolidated Statements of Income in the period of change.
The Company discontinues hedge accounting prospectively when (1) the derivative expires or is sold, terminated, or exercised, (2) the qualifying criteria are no longer met, or (3) management removes the designation of the hedging relationship.
Foreign Currency
Certain of the Company’s non-U.S. operations use their respective local currency as their functional currency. These operations that do not have the U.S. dollar as their functional currency translate their financial statements at the current rates of exchange in effect at the balance sheet date and revenues and expenses using rates that approximate those in effect during the period. The resulting translation adjustments are included in Net foreign currency translation adjustments within the Consolidated Statements of Shareholders’ Equity. Further, gains and losses from the remeasurement of monetary assets and liabilities that are denominated in a non-functional currency of that entity are included in Other income within the Consolidated Statements of Income.
Income Taxes
Deferred income taxes are recognized for the effect of temporary differences between financial reporting and tax basis of assets and liabilities and are measured using the enacted marginal tax rates and laws that are currently in effect. The effect on deferred tax assets and liabilities from a change in tax rates is recognized in the period when the rate change is enacted.
Deferred tax assets are reduced by valuation allowances if, based on the consideration of all available evidence, it is more likely than not that some portion of the deferred tax asset will not be realized. Deferred tax assets are realized by having sufficient future taxable income to allow the related tax benefits to reduce taxes otherwise payable. The sources of taxable income that may be available to realize the benefit of deferred tax assets are future reversals of existing taxable temporary differences,
64


future taxable income exclusive of reversing temporary differences and carry-forwards, taxable income in carry-back years, and tax planning strategies that are both prudent and feasible.
The Company recognizes the effect of income tax positions only if sustaining those positions is more likely than not. Tax positions that meet the more likely than not recognition threshold but are not highly certain are initially and subsequently measured based on the largest amount of benefit that is greater than 50% likely of being realized upon settlement with the taxing authority. Only information that is available at the reporting date is considered in the Company’s recognition and measurement analysis, and events or changes in facts and circumstances are accounted for in the period in which the event or change in circumstance occurs.
The Company records penalties and interest related to unrecognized tax benefits in Income taxes in the Company’s Consolidated Statements of Income.
Leases
The Company leases office facilities, equipment, and automobiles under operating and finance leases. The Company’s lease obligations are primarily for the use of office facilities. The Company evaluates if a leasing arrangement exists upon inception of a contract. A contract contains a lease if the contract conveys the right to control the use of identified tangible assets for a period of time in exchange for consideration. Identified property, plant, or equipment may include a physically distinct portion of a larger asset, or a portion of an asset that represents substantially all of the capacity of the asset but is not physically distinct. The Company assesses whether a contract implicitly contains the right to control the use of a tangible asset that is not already owned. In addition, the Company subleases certain real estate properties to third parties, which are classified as operating leases.
The Company’s leases expire at various dates and may contain renewal, expansion or termination options. The exercise of lease renewal and expansion options are typically at the Company’s sole discretion and are only included in the determination of the lease term if the Company is reasonably certain to exercise the option. In addition, the Company’s lease agreements typically do not contain any material residual value guarantees or restrictive covenants.
ROU assets and lease liabilities are based on the present value of the minimum lease payments over the lease term. The Company has elected the practical expedient related to lease and non-lease components, as an accounting policy election for all asset classes, which allows a lessee to not separate non-lease components from lease components and instead account for consideration received in a contract as a single lease component.
The Company made a policy election to not recognize ROU assets and lease liabilities that arise from leases with an initial term of twelve months or less in the Consolidated Statements of Financial Position. However, the Company recognized these lease payments in the Consolidated Statements of Income on a straight-line basis over the lease term and variable lease payments in the period in which the expense was incurred. The Company chose to apply this accounting policy across all classes of underlying assets.
A portion of the Company’s lease agreements include variable lease payments that are not recorded in the initial measurement of the lease liability and ROU asset balances. For real estate arrangements, base rental payments may be escalated according to annual changes in the CPI or other indices. The escalated rental payments based on the estimated CPI at the lease commencement date are included within minimum rental payments; however, changes in CPI are considered variable in nature and are recognized as variable lease costs in the period in which the obligation is incurred. Additionally, real estate lease agreements may include other variable payments related to operating expenses charged by the landlord based on actual expenditures. Information technology equipment agreements may include variable payments based on usage of the equipment. These expenses are also recognized as variable lease costs in the period in which the expense is incurred.
The Company utilizes discount rates to determine the present value of the lease payments based on information available at the commencement date of the lease. As the rate implicit in each lease is not typically readily available, the Company uses an incremental borrowing rate based on factors such as the lease term and the economic environment where the lease exists to determine the appropriate present value of future lease payments. When determining the incremental borrowing rate, the Company considers the rate of interest it would pay on a secured borrowing in an amount equal to the lease payments for the underlying asset under similar terms.
Operating leases are included in Operating lease ROU assets, Other current liabilities, and Non-current operating lease liabilities in the Consolidated Statements of Financial Position. Finance leases are included in Other non-current assets, Other current liabilities, and Other non-current liabilities in the Consolidated Statements of Financial Position.
65


Principles of Consolidation
The accompanying Consolidated Financial Statements include the accounts of Aon plc and those entities in which the Company has a controlling financial interest. To determine if Aon holds a controlling financial interest in an entity, the Company first evaluates if it is required to apply the VIE model to the entity, otherwise, the entity is evaluated under the voting interest model. Where Aon holds rights that give it the power to direct the activities of a VIE that most significantly impact the VIE’s economic performance, combined with a variable interest that gives the right to receive potentially significant benefits or the obligation to absorb potentially significant losses, the Company has a controlling financial interest in that VIE. The Company does not consolidate the VIEs and Aon’s interest in VIEs as of December 31, 2021 was insignificant. Aon holds a controlling financial interest in entities that are not VIEs where it, directly or indirectly, holds more than 50% of the voting rights or where it exercises control through substantive participating rights or as a general partner.
New Accounting Pronouncements
Adoption of New Accounting Standards
Contract Assets and Contract Liabilities Acquired in a Business Combination
In October 2021, FASB issued new accounting guidance related to the accounting for contract assets and contract liabilities from contracts with customers acquired in a business combination. The new guidance improves the accounting for acquired revenue contracts with customers in a business combination by addressing diversity in practice and inconsistency. The new guidance requires an entity to recognize and measure contract assets and contract liabilities acquired in a business combination in accordance with the current accounting standard on revenue from contracts with customers, ASC 606. The new guidance is effective for Aon in the first quarter of 2023, with early adoption permitted. The Company elected to early adopt this guidance in the fourth quarter of 2021. The Company adopted the new guidance on a prospective basis while applying the amendments to all business combinations that occurred during 2021 as required by the new guidance. The early adoption of the new guidance did not have a material impact on the Consolidated Financial Statements.
3.    Revenue from Contracts with Customers
Disaggregation of Revenue
The following table summarizes revenue from contracts with customers by principal service line (in millions). Prior year amounts from the Consolidated Financial Statements have been reclassified to conform to the current year’s presentation. Refer to Note 1 “Basis of Presentation” for further information regarding the changes to the Company’s principal service lines.
Years Ended December 31
202120202019
Commercial Risk Solutions$6,635 $5,861 $5,857 
Reinsurance Solutions1,997 1,814 1,686 
Health Solutions2,154 2,067 2,104 
Wealth Solutions1,426 1,341 1,380 
Elimination(19)(17)(14)
Total revenue$12,193 $11,066 $11,013 
Consolidated revenue from contracts with customers by geographic area, which is attributed on the basis of where the services are performed, is as follows (in millions):
Years Ended December 31
202120202019
U.S.$5,459 $5,032 $5,016 
Americas other than U.S.1,027 911 919 
U.K.1,681 1,579 1,502 
Ireland127 84 75 
Europe, Middle East, & Africa other than U.K. and Ireland2,565 2,236 2,263 
Asia Pacific1,334 1,224 1,238 
Total revenue$12,193 $11,066 $11,013 
66


Contract Costs
Changes in the net carrying amount of costs to fulfill contracts with customers are as follows (in millions):
20212020
Balance at beginning of period$339 $335 
Additions1,504 1,360 
Amortization(1,478)(1,360)
Impairment— — 
Foreign currency translation and other(4)
Balance at end of period$361 $339 
Changes in the net carrying amount of costs to obtain contracts with customers are as follows (in millions):
20212020
Balance at beginning of period$184 $171 
Additions59 61 
Amortization(48)(47)
Impairment— — 
Foreign currency translation and other(16)(1)
Balance at end of period$179 $184 

4.    Other Financial Data
Consolidated Statements of Income Information
Other Income
The components of Other income are as follows (in millions):
Years Ended December 31
202120202019
Foreign currency remeasurement$26 $(12)$
Gain from disposals of business142 25 13 
Pension and other postretirement21 13 
Equity earnings
Extinguishment of debt— (7)— 
Financial instruments(45)(10)(35)
Total$152 $13 $— 
67


Consolidated Statements of Financial Position Information
Allowance for Doubtful Accounts
Changes in the net carrying amount of allowance for doubtful accounts are as follows (in millions):
202120202019
Balance at beginning of period$98 $70 $62 
Adoption of new accounting guidance (1)
— — 
Adjusted balance at beginning of period98 77 62 
Provision26 29 27 
Accounts written off, net of recoveries(37)(6)(19)
Foreign currency translation and other(2)— 
Balance at end of period$90 $98 $70 
(1) The adoption of the new accounting standard on the measurement of credit losses on January 1, 2020 resulted in addition to the Allowance for doubtful accounts of $7 million. After tax impacts, this resulted in a $6 million decrease to Retained earnings. Refer to Note 2 “Summary of Significant Accounting Principles and Practices” for further information.
Other Current Assets
The components of Other current assets are as follows (in millions):
As of December 3120212020
Costs to fulfill contracts with customers(1)
$361 $339 
Taxes receivable53 95 
Prepaid expenses137 111 
Other165 79 
Total$716 $624 
(1)Refer to Note 3 “Revenue from Contracts with Customers” for further information.
Fixed Assets, net
The components of Fixed assets, net are as follows (in millions):
As of December 3120212020
Software$797 $808 
Leasehold improvements425 375 
Computer equipment268 249 
Furniture, fixtures and equipment279 246 
Construction in progress45 155 
Other33 34 
Fixed assets, gross1,847 1,867 
Less: Accumulated depreciation1,318 1,268 
Fixed assets, net$529 $599 
Depreciation expense, which includes software amortization, was $179 million, $167 million, and $172 million for the years ended December 31, 2021, 2020, and 2019, respectively.
68


Other Non-current Assets
The components of Other non-current assets are as follows (in millions):
As of December 3120212020
Costs to obtain contracts with customers (1)
$179 $184 
Investments64 74 
Leases (2)
63 89 
Taxes receivable95 125 
Other111 138 
Total$512 $610 
(1)    Refer to Note 3 “Revenue from Contracts with Customers” for further information.
(2) Refer to Note 8 “Lease Commitments” for further information.
Other Current Liabilities
The components of Other current liabilities are as follows (in millions):
As of December 3120212020
Deferred revenue (1)
$321 $296 
Taxes payable149 80 
Leases (2)
213 234 
Other648 561 
Total$1,331 $1,171 
(1)$553 million and $454 million was recognized in the Consolidated Statements of Income during the years ended December 31, 2021 and December 31, 2020, respectively.
(2)Refer to Note 8 “Lease Commitments” for further information.
Other Non-current Liabilities
The components of Other non-current liabilities are as follows (in millions):
As of December 3120212020
Taxes payable (1)
$609 $561 
Leases (2)
46 65 
Compensation and benefits58 53 
Deferred revenue70 76 
Other127 140 
Total$910 $895 
(1)Includes $145 million for the non-current portion of the transition tax as of December 31, 2021 and December 31, 2020. Refer to Note 9 “Income Taxes” for further information on the transition tax.
(2)Refer to Note 8 “Lease Commitments” for further information.
69


5.    Acquisitions and Dispositions of Businesses
Completed Acquisitions
The Company completed 2 acquisitions during the year ended December 31, 2021 and 6 acquisitions during the year ended December 31, 2020. The following table includes the preliminary fair values of consideration transferred, assets acquired, and liabilities assumed as a result of the Company’s acquisitions (in millions):
Year Ended
December 31, 2021
Consideration transferred
Cash$27 
Deferred, contingent, and other consideration17 
Aggregate consideration transferred$44 
Assets acquired
Goodwill17 
Other intangible assets13 
Other assets (1)
26 
Total assets acquired56 
Liabilities assumed
Total liabilities assumed12 
Net assets acquired$44 
(1)     In the year ended December 31, 2021, cash and cash equivalents of $12 million and funds held on behalf of client of $1 million were acquired.
Intangible assets acquired include customer-related and contract-based assets. The intangible assets acquired as part of business acquisitions in 2021 had a weighted average useful economic life of 9 years. Acquisition related costs for completed acquisitions incurred and recognized within Other general expense for the year ended December 31, 2021 were insignificant.
The results of operations of these acquisitions are included in the Consolidated Financial Statements as of the respective acquisition dates. The Company’s results of operations would not have been materially different if these acquisitions had been reported from the beginning of the period in which they were acquired.
2021 Acquisitions
On December 22, 2021, the Company completed the transaction to acquire 100% share capital of For Welfare S.r.l, a company focused on bancassurance programs in Italy.
On September 1, 2021, the Company completed the transaction to acquire 51% of Aon India Insurance Brokers Limited (formerly known as Anviti Insurance Brokers Private Limited). Prior to the acquisition date, the Company accounted for its 49% interest in Anviti as an equity-method investment. The acquisition-date fair value of the previous equity interest was $15 million and is included in the measurement of consideration transferred. There was no significant impact as a result of remeasuring the carrying value of the Company’s prior equity interest in Anviti held before the business combination.
2020 Acquisitions
On April 6, 2020, the Company completed the acquisition of 100% share capital of Farmington Administrative Services LLC, a U.S.-based national provider of enrollment solutions and voluntary benefits, and certain assets of other Farmington companies.
On January 31, 2020, the Company completed the acquisition of 100% share capital of Cytelligence Inc., a Canadian-based cyber security firm that provides incident response advisory, digital forensic expertise, security consulting services, and cyber security training for employees to help organizations respond to cyber security threats and strengthen their security position.
On January 3, 2020, the Company completed the acquisition of 100% share capital of CoverWallet, Inc., a U.S.-based digital insurance platform for small- and medium-sized businesses.
On January 1, 2020, the Company completed the acquisition of 100% share capital of TRIUM GmbH Insurance Broker, an insurance broker based in Germany.
70


On January 1, 2020, the Company completed the acquisition of 100% share capital of Assimedia SA, an insurance broker based in Switzerland.
On January 1, 2020, the Company completed the acquisition of 100% share capital of Apollo Conseil et Courtage, an insurance broker based in France.
Completed Dispositions
The Company completed 6 dispositions during the year ended December 31, 2021, including the sale of Aon’s Retiree Health ExchangeTM business. The Company completed 1 disposition during the year ended December 31, 2020 and 8 dispositions during the year ended December 31, 2019.
The pretax gains recognized related to dispositions were $142 million, $25 million, and $13 million for the years ended December 31, 2021, December 31, 2020 and December 31, 2019, respectively. Gains recognized as a result of a disposition are included in Other income in the Consolidated Statements of Income. The pretax losses recognized in the Consolidated Statements of Income related to these dispositions were insignificant for the years ended December 31, 2021, December 31, 2020 and December 31, 2019, respectively.
Other Significant Activity
On March 9, 2020, Aon and WTW, an Irish public limited company, entered into a business combination agreement (the “Business Combination Agreement”) with respect to a combination of the parties (the “Combination”). On July 26, 2021, Aon and WTW mutually agreed to terminate the Business Combination Agreement, (the “Termination Agreement”). Aon Corporation paid a $1 billion termination fee pursuant to the Termination Agreement. Refer to “Termination of Business Combination Agreement” within Part II, Item 7, Management’s Discussion and Analysis of Financial Condition and Results of Operations for further information.
6.    Goodwill and Other Intangible Assets
The changes in the net carrying amount of goodwill for the years ended December 31, 2021 and 2020, respectively, are as follows (in millions):
Balance as of January 1, 2020$8,165 
Goodwill related to current year acquisitions314 
Goodwill related to disposals(3)
Foreign currency translation and other190 
Balance as of December 31, 2020$8,666 
Goodwill related to current year acquisitions17 
Goodwill related to disposals(37)
Foreign currency translation and other(212)
Balance as of December 31, 2021$8,434 
Other intangible assets by asset class are as follows (in millions):
As of December 3120212020
 Gross
Carrying
Amount
Accumulated Amortization and ImpairmentNet
Carrying
Amount
Gross
Carrying
Amount
Accumulated Amortization and ImpairmentNet
Carrying
Amount
Customer-related and contract-based$2,289 $1,848 $441 $2,337 $1,775 $562 
Technology and other407 357 50 435 358 77 
Tradenames (1)
14 13 14 13 
Total$2,710 $2,218 $492 $2,786 $2,146 $640 
(1)In 2020, Aon wrote off $1.0 billion of fully amortized tradenames, including the Hewitt and Benfield tradenames. The company no longer expects to receive economic benefits from these tradenames.
Amortization expense and impairment charges from finite lived intangible assets were $147 million, $246 million, and $392 million for the years ended December 31, 2021, 2020, and 2019, respectively.
71


The estimated future amortization for finite-lived intangible assets as of December 31, 2021 is as follows (in millions):
Estimated Future Amortization
For the years ended
2022$100 
202389 
202472 
202559 
202637 
Thereafter135 
Total$492 
7.    Debt
The following is a summary of outstanding debt (in millions):
As of December 3120212020
Commercial paper$665 $— 
2.80% Senior Notes due March 2021 (1)
— 400 
2.20% Senior Notes due November 2022 (2)
499 498 
4.00% Senior Notes due November 2023349 349 
3.50% Senior Notes due June 2024598 597 
3.875% Senior Notes due December 2025748 747 
2.875% Senior Notes due May 2026 (EUR 500M)563 606 
8.205% Junior Subordinated Notes due January 2027521 521 
4.50% Senior Notes due December 2028347 347 
3.75% Senior Notes due May 2029745 744 
2.80% Senior Notes due May 2030993 992 
2.05% Senior Notes due August 2031396 — 
2.60% Senior Notes due December 2031496 — 
6.25% Senior Notes due September 2040296 296 
4.25% Senior Notes due December 2042201 200 
4.45% Senior Notes due May 2043247 247 
4.60% Senior Notes due June 2044544 544 
4.75% Senior Notes due May 2045593 593 
2.90% Senior Notes due August 2051591 — 
Other— 48 
Total debt9,392 7,729 
Less: Short-term debt and current portion of long-term debt1,164 448 
Total long-term debt$8,228 $7,281 
(1)The 2.80% Senior Notes due March 2021 were repaid in full on February 16, 2021.
(2)The 2.20% Senior Notes due November 2021 were reclassified as Short-term debt and current portion of long-term debt in the Consolidated Statement of Financial Position as of December 31, 2021.
Notes
On December 2, 2021, Aon Corporation, a Delaware corporation, and Aon Global Holdings plc, a public limited company incorporated under the laws of England and Wales, both wholly owned subsidiaries of the company, co-issued $500 million aggregate principal amount of 2.60% Senior Notes set to mature on December 2, 2031. The Company intends to use the net proceeds of the offering for general corporate purposes.
72


On August 23, 2021, Aon Corporation, a Delaware corporation, and Aon Global Holdings plc, a public limited company formed under the laws of England and Wales, both wholly owned subsidiaries of the Company, co-issued $400 million 2.05% Senior Notes due August 2031 and $600 million of 2.90% Senior Notes due August 2051. The Company intends to use the net proceeds of the offering for general corporate purposes.
On January 13, 2021, Aon Global Limited, a limited company organized under the laws of England and Wales and a wholly owned subsidiary of Aon plc, issued an irrevocable notice of redemption to holders of its 2.80% Senior Notes for the redemption of all $400 million outstanding aggregate principal amount of the notes, which were set to mature in March 2021 and classified as Short-term debt and current portion of long-term debt as of December 31, 2020. The redemption date was on February 16, 2021 and resulted in an insignificant loss due to extinguishment.
On May 29, 2020, Aon Corporation, a Delaware corporation and a wholly owned subsidiary of Aon Corporation, issued an irrevocable notice of redemption to holders of its 5.00% Senior Notes, which were set to mature on September 30, 2020, for the redemption of all $600 million outstanding aggregate principal amount of the notes. The redemption date was on June 30, 2020 and resulted in a loss of $7 million due to extinguishment.
On May 12, 2020, Aon Corporation issued $1 billion 2.80% Senior Notes due May 2030. Aon Corporation used a portion of the net proceeds on June 30, 2020 to repay its outstanding 5.00% Senior Notes, which were set to mature on September 30, 2020. The Company used the remainder to repay other borrowings and for general corporate purposes.
Each of the notes issued by Aon Corporation is fully and unconditionally guaranteed by Aon Global Limited, Aon plc, and Aon Global Holding plc. Each of the notes issued by Aon Global Limited is fully and unconditionally guaranteed by Aon plc, Aon Global Holdings plc, and Aon Corporation. All guarantees of Aon plc and Aon Global Limited of the Co-Issued Notes are joint and several as well as full and unconditional. Senior Notes rank pari passu in right of payment with all other present and future unsecured debt which is not expressed to be subordinate or junior in rank to any other unsecured debt of the Co-Issuers. Refer to “Guarantee of Registered Securities” within Part II Item 7, Management’s Discussion and Analysis of Financial Condition and Results of Operations for further information regarding guarantees of outstanding debt securities. Each of the notes described and identified in the table above contains customary representations, warranties, and covenants, and the Company was in compliance with all such covenants as of December 31, 2021.
Repayments of total debt as of December 31, 2021 are as follows (in millions):
2022$1,165 
2023350 
2024600 
2025750 
2026566 
Thereafter6,077 
Total Repayments9,508 
Unamortized discounts, premiums, and debt issuance costs(116)
Total Debt$9,392 
Revolving Credit Facilities
As of December 31, 2021, Aon plc had 2 primary committed credit facilities outstanding: its $1.0 billion multi-currency U.S. credit facility expiring in September 2026 and its $750 million multi-currency U.S. credit facility expiring in October 2023. In aggregate, these 2 facilities provide $1.75 billion in available credit. The $1.0 billion credit facility was entered into on September 28, 2021 and replaced the $900 million credit facility, which was scheduled to mature on February 2, 2022.
Each of these primary committed credit facilities includes customary representations, warranties, and covenants, including financial covenants that require Aon to maintain specified ratios of adjusted consolidated EBITDA to consolidated interest expense and consolidated debt to adjusted consolidated EBITDA, in each case, tested quarterly. At December 31, 2021, Aon did not have borrowings under either of these primary committed credit facilities, and was in compliance with the financial covenants and all other covenants contained therein during the rolling year ended December 31, 2021.
Commercial Paper
Aon Corporation has established a U.S. commercial paper program (the “U.S. Program”) and Aon Global Holdings plc has established a European multi-currency commercial paper program (the “European Program” and, together with the U.S. Program, the “Commercial Paper Programs”). Commercial paper may be issued in aggregate principal amounts of up to
73


$1 billion under the U.S. Program and €625 million under the European Program, not to exceed the amount of the Company’s committed credit facilities, which was $1.75 billion at December 31, 2021. The aggregate capacity of the U.S. Program was increased in the fourth quarter of 2021 from $900 million to $1 billion. The aggregate capacity of the Commercial Paper Program remains fully backed by the Company’s committed credit facilities. The U.S. Program was fully and unconditionally guaranteed by Aon plc, Aon Global Limited, and Aon Global Holdings plc and the European Program was fully and unconditionally guaranteed by Aon plc, Aon Global Limited, and Aon Corporation.
Approximately $400 million of the Termination Fee (as defined in Part II, Item 7, Management’s Discussion and Analysis of Financial Condition and Results of Operations) was paid on July 27, 2021 using proceeds of commercial paper issued by Aon Corporation under the U.S. Program, where the aggregate principal was raised on July 26, 2021.
Commercial paper outstanding, which is included in Short-term debt and current portion of long-term debt in the Company’s Consolidated Statements of Financial Position, is as follows (in millions):
As of December 3120212020
Commercial paper outstanding$665 $— 
The weighted average commercial paper outstanding and its related interest rates are as follows (in millions, except percentages):
Years Ended December 31
20212020
Weighted average commercial paper outstanding$273 $343 
Weighted average interest rate of commercial paper outstanding0.01 %1.47 %
8.    Lease Commitments
The classification of operating and finance lease asset and liability balances within the Consolidated Statements of Financial Position are as follows (in millions):
As of December 3120212020
Assets
Operating lease assetsOperating lease right-of-use assets$786 $911 
Finance lease assetsOther non-current assets63 89 
Total lease assets$849 $1,000 
Liabilities
Current lease liabilities
   OperatingOther current liabilities$194 $204 
   FinanceOther current liabilities19 30 
Non-current lease liabilities
   OperatingNon-current operating lease liabilities772 897 
   FinanceOther non-current liabilities46 65 
Total lease liabilities$1,031 $1,196 
74


The components of lease costs are as follows (in millions):
Years Ended December 31
20212020
Operating lease cost$217 $221 
Finance lease costs
   Amortization of leased assets26 25 
   Interest on lease liabilities
Variable lease cost49 48 
Short-term lease cost (1)
11 10 
Sublease income(31)(32)
Net lease cost$273 $275 
(1) Short-term lease cost does not include expenses related to leases with a lease term of one month or less.
Weighted average remaining lease term and discount rate related to operating and finance leases are as follows:
As of December 3120212020
Weighted average remaining lease term (years)
   Operating leases6.97.4
   Finance leases3.64.2
Weighted average discount rate
   Operating leases2.8 %2.9 %
   Finance leases1.0 %1.0 %
Other cash and non-cash related activities are as follows (in millions):
Years Ended December 31
20212020
Cash paid for amounts included in the measurement of lease liabilities
   Operating cash flows for operating leases$244 $236 
   Financing cash flows for finance leases$23 $12 
Non-cash related activities
ROU assets obtained in exchange for new operating lease liabilities$44 $146 
ROU assets obtained in exchange for new finance lease liabilities$— $13 
Operating lease ROU asset expense (1)
$142 $178 
Changes in Non-current operating lease liabilities (1)
$(125)$(47)
(1)The Company has recorded non-cash changes in Operating lease ROU assets and Non-current operating lease liabilities through Other assets and liabilities in Cash flows from operations within the Consolidated Statements of Cash Flows.
Maturity analysis of operating and finance leases as of December 31, 2021 are as follows (in millions):
Operating LeasesFinance LeasesTotal
2022$207 $26 $233 
2023175 20 195 
2024144 18 162 
2025121 10 131 
2026110 — 110 
Thereafter299 — 299 
Total undiscounted future minimum lease payments1,056 74 1,130 
Less: Imputed interest(90)(9)(99)
Present value of lease liabilities$966 $65 $1,031 
75


9.    Income Taxes
Income before income tax and the provision for income tax consist of the following (in millions):
Years Ended December 31
202120202019
Income (loss) before income taxes:   
Ireland$15 $(86)$200 
U.K.549 634 228 
U.S.(818)(28)(220)
Other2,185 1,946 1,662 
Total$1,931 $2,466 $1,870 
Income tax expense:   
Current:   
Ireland$$$
U.K.50 30 20 
U.S. federal197 126 22 
U.S. state and local72 22 41 
Other291 259 249 
Total current tax expense$612 $439 $333 
Deferred tax expense (benefit):   
Ireland$(1)$(1)$(1)
U.K.131 39 35 
U.S. federal(83)(72)(20)
U.S. state and local(30)(4)(27)
Other(6)47 (23)
Total deferred tax expense (benefit)$11 $$(36)
Total income tax expense$623 $448 $297 
Income before income taxes shown above is based on the location of the business unit to which such earnings are attributable for tax purposes. In addition, because the earnings shown above may, in some cases, be subject to taxation in more than one country, the income tax provision shown above as Ireland, U.K., U.S. or Other may not correspond to the geographic attribution of the earnings.
76


The Company performs a reconciliation of the income tax provisions based on its domicile and statutory rate at each reporting period. Due to the Reorganization, the 2021 and 2020 reconciliations are based on the Irish statutory corporate tax rate of 25.0%, while the 2019 reconciliation is based on the U.K. statutory corporate tax rate of 19.0%. The reconciliation to the provisions reflected in the Consolidated Financial Statements is as follows:
Years Ended December 31
202120202019
Statutory tax rate25.0%25.0%19.0%
U.S. state income taxes, net of U.S. federal benefit1.51.00.5
Taxes on international operations (1) (4)
(15.4)(9.8)(6.0)
Nondeductible expenses3.32.11.6
Adjustments to prior year tax requirements(0.2)0.1
Deferred tax adjustments, including statutory rate changes3.20.7
Deferred tax adjustments, international earnings1.80.7
Adjustments to valuation allowances(0.2)1.8
Change in uncertain tax positions2.11.52.2
Excess tax benefits related to shared based compensation (2)
(2.4)(2.2)(2.8)
U.S. Tax Reform impact (3)
(0.3)
Capital Losses(1.8)
Non-deductible transaction costs1.11.3
Non-deductible termination fee12.9
Other — net(0.4)(0.3)(0.2)
Effective tax rate32.3%18.2%15.9%
(1)The Company determines the adjustment for taxes on international operations based on the difference between the statutory tax rate applicable to earnings in each foreign jurisdiction and the enacted rate of 25.0%, 25.0% and 19.0% at December 31, 2021, 2020, and 2019, respectively. The benefit to the Company’s effective income tax rate from taxes on international operations relates to benefits from lower-taxed global operations, primarily due to the use of global funding structures and the tax holiday in Singapore.
(2)Excess tax benefits and deficiencies from share-based payment transactions are recognized as income tax expense or benefit in the Company’s Consolidated Statements of Income.
(3)The impact of the Tax Cuts and Jobs Act including adjustments to the Transition Tax.
(4)In July 2020, final U.S. tax regulations were issued regarding the GILTI high tax election, allowing taxpayers to exclude from GILTI the income of a Controlled Foreign Corporation that incurs a foreign tax rate more than 90% of the top U.S. corporate tax rate. A GILTI high tax election may be made on an annual basis, and taxpayers may choose to apply the election to taxable years beginning after December 31, 2017. The Company expects to make the GILTI high-tax election for 2021 and therefore recorded the impact of making the election.
77


The Company has elected to account for GILTI in the period in which it is incurred, and therefore has not provided deferred tax impacts of GILTI in its Consolidated Financial Statements.
The components of the Company’s deferred tax assets and liabilities are as follows (in millions):
As of December 3120212020
Deferred tax assets:  
Net operating loss, capital loss, interest, and tax credit carryforwards$581 $653 
Lease liabilities207 248 
Employee benefit plans160 312 
Other accrued expenses132 103 
Accrued interest97 — 
Federal and state benefit of interest from uncertain tax positions (1)
45 37 
Deferred revenue36 36 
Investment basis differences25 28 
Lease and service guarantees
Other25 17 
Total1,309 1,436 
Valuation allowance on deferred tax assets(230)(205)
Total$1,079 $1,231 
Deferred tax liabilities: 
Intangibles and property, plant and equipment$(243)$(291)
Lease right-of-use asset(173)(211)
Deferred costs(159)(141)
Unremitted earnings(58)(37)
Other accrued expenses(27)(22)
Unrealized foreign exchange gains(22)(26)
Other(32)(41)
Total$(714)$(769)
Net deferred tax asset$365 $462 
(1)The $37 million of Federal and state benefit of interest from uncertain tax positions as of December 31, 2020 was previously classified as Other.
Deferred income taxes (assets and liabilities have been netted by jurisdiction) have been classified in the Consolidated Statements of Financial Position as follows (in millions):
As of December 3120212020
Deferred tax assets — non-current766 724 
Deferred tax liabilities — non-current(401)(262)
Net deferred tax asset$365 $462 
In assessing the realizability of deferred tax assets, the Company considers whether it is more likely than not that some portion or all of the deferred tax assets will not be realized and adjusts the valuation allowance accordingly. Considerations with respect to the realizability of deferred tax assets include the period of expiration of the deferred tax asset, historical earnings and projected future taxable income by jurisdiction as well as tax liabilities for the tax jurisdiction to which the tax asset relates. Significant management judgment is required in determining the assumptions and estimates related to the amount and timing of future taxable income. Valuation allowances have been established primarily with regard to the tax benefits of certain net operating loss, capital loss, and interest carryforwards. Valuation allowances increased by $25 million as of December 31, 2021, when compared to December 31, 2020. The change is primarily attributable to the increase in the UK tax rate offset by the release of valuation allowances related to certain net operating and capital loss carryforwards.

78


The Company generally intends to limit distributions from foreign subsidiaries in excess of U.S. tax earnings and profits (except where distributions would be limited by available cash) and to limit repatriations from certain other jurisdictions that would otherwise generate a U.S. tax liability. As of December 31, 2021, the Company has accrued $58 million for local country income taxes, withholding taxes and state income taxes on those undistributed earnings that are not indefinitely reinvested. The Company has not provided for deferred taxes on outside basis differences in our investments in our foreign subsidiaries that are unrelated to these accumulated undistributed earnings, as these outside basis differences are indefinitely reinvested. A determination of the unrecognized deferred taxes related to these other components of our outside basis differences is not practicable.
The Company had the following carryforwards (in millions):
As of December 3120212020
U.K.
Operating loss carryforwards$41 $266 
Capital loss carryforwards$573 $577 
Interest carryforwards$— $121 
U.S.
Federal operating loss carryforwards$25 $49 
Federal capital loss carryforwards$112 $112 
Federal interest carryforwards$1,140 $1,220 
State operating loss carryforwards$398 $378 
State capital loss carryforwards$123 $123 
State interest carryforwards$551 $573 
Other Non-U.S.
Operating loss carryforwards$301 $400 
Capital loss carryforwards$35 $42 
Interest carryforwards$26 $34 
Other carryforwards$$— 
The U.K. operating losses, capital losses, and interest carryforward each have an indefinite carryforward period. The federal operating loss carryforwards generated through December 31, 2017 expire at various dates between 2034 and 2036 while federal operating loss carryforwards generated after this date have indefinite carryforward periods. State net operating losses as of December 31, 2021 have various carryforward periods and will begin to expire in 2022. Federal and state capital losses can be carried forward until 2023. Federal and state interest carryforwards have indefinite carryforward periods. Operating, capital losses, and other carryforwards in other non-U.S. jurisdictions have various carryforward periods and will begin to expire in 2022. The interest carryforwards in other non-U.S. jurisdictions have an indefinite carryforward period.
During 2012, the Company was granted a tax holiday for the period from October 1, 2012 through September 30, 2022, with respect to withholding taxes and certain income derived from services in Singapore. This tax holiday and reduced withholding tax rate may be extended when certain conditions are met or may be terminated early if certain conditions are not met. The benefit realized was approximately $104 million, $97 million, and $90 million during the years ended December 31, 2021, 2020, and 2019, respectively. The impact of this tax holiday on diluted earnings per share was $0.46, $0.42, and $0.37 during the years ended December 31, 2021, 2020, and 2019, respectively.
79


Uncertain Tax Positions
The following is a reconciliation of the Company’s beginning and ending amount of uncertain tax positions (in millions):
20212020
Balance at January 1$321 $299 
Additions based on tax positions related to the current year33 25 
Additions for tax positions of prior years
Reductions for tax positions of prior years(4)(3)
Settlements— — 
Business combinations— — 
Lapse of statute of limitations(10)(7)
Foreign currency translation— — 
Balance at December 31$347 $321 
The Company’s liability for uncertain tax positions as of December 31, 2021, 2020, and 2019, includes $295 million, $270 million, and $248 million, respectively, related to amounts that would impact the effective tax rate if recognized. It is possible that the amount of unrecognized tax benefits may change in the next twelve months; however, the Company does not expect the change to have a significant impact on its consolidated statements of income or consolidated balance sheets. These changes may be the result of settlements of ongoing audits. At this time, an estimate of the range of the reasonably possible outcomes within the next twelve months cannot be made.
The Company recognizes interest and penalties related to uncertain tax positions in its provision for income taxes. The Company accrued potential interest and penalties of $22 million, $21 million, and $24 million in 2021, 2020, and 2019, respectively. The Company recorded a liability for interest and penalties of $142 million, $120 million, and $99 million as of December 31, 2021, 2020, and 2019, respectively.
The Company and its subsidiaries file income tax returns in their respective jurisdictions. The Company has substantially concluded all U.S. federal income tax matters for years through 2007. Material U.S. state and local income tax jurisdiction examinations have been concluded for years through 2012. The Company has concluded income tax examinations in its primary non-U.S. jurisdictions through 2008.
10.    Shareholders’ Equity
Distributable Profits
The Company is required under Irish law to have available “distributable profits” to make share repurchases or pay dividends to shareholders. Distributable profits are created through the earnings of the Irish parent company and, among other methods, through intercompany dividends or a reduction in share capital approved by the High Court of Ireland. Distributable profits are not linked to a U.S. GAAP reported amount (e.g., retained earnings). On July 26, 2021, we received approval from the High Court of Ireland to complete a reduction in share premium to create distributable profits of $34.0 billion to support the payment of possible future dividends or future share repurchases, if and to the extent declared by the directors in compliance with their duties under Irish law. As of December 31, 2021 and 2020, the Company had distributable profits in excess of $32.7 billion and $0.2 billion, respectively. We believe that we have the ability to create sufficient distributable profits for the foreseeable future.
Ordinary Shares
Aon has a share repurchase program authorized by the Company’s Board of Directors. The Repurchase Program was established in April 2012 with $5.0 billion in authorized repurchases and was increased by $5.0 billion in authorized repurchases in each of November 2014, June 2017, and November 2020, and by $7.5 billion in authorized repurchases in February 2022 for a total of $27.5 billion in repurchase authorizations.
Under the Repurchase Program, the Company’s class A ordinary shares may be repurchased through the open market or in privately negotiated transactions, from time to time, based on prevailing market conditions and will be funded from available capital.
80


The following table summarizes the Company’s share repurchase activity (in millions, except per share data):
Years Ended December 31
20212020
Shares repurchased12.4 8.5 
Average price per share$286.82 $206.28 
Costs recorded to retained earnings
Total repurchase cost$3,543 $1,761 
Additional associated costs— 
Total costs recorded to retained earnings$3,543 $1,763 
At December 31, 2021, the remaining authorized amount for share repurchases under the Repurchase Program was approximately $1.7 billion. Under the Repurchase Program, the Company has repurchased a total of 149.6 million shares for an aggregate cost of approximately $18.3 billion.
Weighted Average Ordinary Shares
Weighted average ordinary shares outstanding are as follows (in millions):
Years Ended December 31
202120202019
Basic weighted average ordinary shares outstanding224.7 231.9 238.6 
Dilutive effect of potentially issuable shares1.4 1.2 2.0 
  Diluted weighted average ordinary shares outstanding226.1 233.1 240.6 
Potentially issuable shares are not included in the computation of Diluted net income per share attributable to Aon shareholders if their inclusion would be antidilutive. There were 0.3 million shares excluded from the calculation in 2021 and no shares excluded from the calculation in 2020 and 2019.


81


Accumulated Other Comprehensive Loss
Changes in Accumulated other comprehensive loss by component, net of related tax, are as follows (in millions):
 
Change in Fair Value of Financial Instruments (1)
Foreign Currency Translation Adjustments
Postretirement Benefit Obligation (2)
Total
Balance at December 31, 2018(15)(1,319)(2,575)(3,909)
Other comprehensive income (loss) before reclassifications:
Other comprehensive income (loss) before reclassifications(10)15 (287)(282)
Tax benefit (expense)(1)58 58 
Other comprehensive income (loss) before reclassifications, net(9)14 (229)(224)
Amounts reclassified from accumulated other comprehensive income (loss):
Amounts reclassified from accumulated other comprehensive income14 — 109 123 
Tax expense(2)— (21)(23)
Amounts reclassified from accumulated other comprehensive income, net (3)
12 — 88 100 
Net current period other comprehensive income (loss)14 (141)(124)
Balance at December 31, 2019(12)(1,305)(2,716)(4,033)
Other comprehensive income (loss) before reclassifications:
Other comprehensive income (loss) before reclassifications258 (255)
Tax benefit— 60 62 
Other comprehensive income (loss) before reclassifications, net260 (195)66 
Amounts reclassified from accumulated other comprehensive income (loss):
Amounts reclassified from accumulated other comprehensive income15 — 125 140 
Tax expense(3)— (31)(34)
Amounts reclassified from accumulated other comprehensive income, net (3)
12 — 94 106 
Net current period other comprehensive income (loss)13 260 (101)172 
Balance at December 31, 2020$$(1,045)$(2,817)$(3,861)
Other comprehensive income (loss) before reclassifications:
Other comprehensive income (loss) before reclassifications— (290)227 (63)
Tax benefit (expense)— (58)(56)
Other comprehensive income (loss) before reclassifications, net— (288)169 (119)
Amounts reclassified from accumulated other comprehensive income (loss):
Amounts reclassified from accumulated other comprehensive income— 142 144 
Tax expense(1)— (34)(35)
Amounts reclassified from accumulated other comprehensive income, net (3)
— 108 109 
Net current period other comprehensive income (loss)(288)277 (10)
Balance at December 31, 2021$$(1,333)$(2,540)$(3,871)
(1)Reclassifications from this category included in Accumulated other comprehensive loss are recorded in Total revenue, Interest expense, and Compensation and benefits in the Consolidated Statements of Income. Refer to Note 13 “Derivatives and Hedging” for further information regarding the Company’s derivative and hedging activity.
(2)Reclassifications from this category included in Accumulated other comprehensive loss are recorded in Other income (expense) in the Consolidated Statements of Income.
(3)It is the Company’s policy to release income tax effects from Accumulated other comprehensive loss using the portfolio approach.
82


11.    Employee Benefits
Defined Contribution Savings Plans
Aon maintains defined contribution savings plans for the benefit of its employees. The expense recognized for these plans is included in Compensation and benefits in the Consolidated Statements of Income. The expense for the significant plans in the U.S., U.K., Netherlands, and Canada is as follows (in millions):
Years Ended December 31
202120202019
U.S.$103 $87 $98 
U.K.46 42 41 
Netherlands and Canada35 26 25 
Total$184 $155 $164 
Pension and Other Postretirement Benefits
The Company sponsors defined benefit pension and postretirement health and welfare plans that provide retirement, medical, and life insurance benefits. The postretirement health care plans are contributory, with retiree contributions adjusted annually, and the life insurance and pension plans are generally noncontributory. The significant U.S., U.K., Netherlands, and Canada pension plans are closed to new entrants.
83


Pension Plans
The following tables provide a reconciliation of the changes in the projected benefit obligations and fair value of assets for the years ended December 31, 2021 and 2020, and a statement of the funded status as of December 31, 2021 and 2020, for Aon’s significant U.K., U.S., and other major pension plans, which are located in the Netherlands and Canada. These plans represent approximately 90% of the Company’s projected benefit obligations.
 U.K.U.S.Other
(millions)202120202021202020212020
Change in projected benefit obligation    
At January 1$5,406 $4,779 $3,380 $3,192 $1,625 $1,425 
Service cost— — — — — 
Interest cost65 88 57 85 12 19 
Plan amendment— — — — — 
Settlements(14)(7)— — — — 
Actuarial (gain) loss(292)520 (103)274 24 112 
Benefit payments(189)(209)(170)(171)(47)(44)
Foreign currency impact(58)232 — — (83)113 
As of December 31$4,919 $5,406 $3,164 $3,380 $1,531 $1,625 
Accumulated benefit obligation at end of year$4,919 $5,406 $3,164 $3,380 $1,504 $1,592 
Change in fair value of plan assets   
At January 1$6,652 $5,959 $2,276 $2,066 $1,497 $1,303 
Actual return on plan assets(136)618 211 289 46 109 
Employer contributions61 92 17 20 
Settlements(14)(7)— — — — 
Benefit payments(189)(209)(170)(171)(47)(44)
Foreign currency impact(76)283 — — (83)109 
As of December 31$6,246 $6,652 $2,378 $2,276 $1,430 $1,497 
Market related value at end of year$6,246 $6,652 $2,174 $2,076 $1,430 $1,497 
Amount recognized in Statement of Financial Position as of December 31   
Funded status$1,327 $1,246 $(786)$(1,104)$(101)$(128)
Unrecognized prior-service cost40 43 — — (6)(7)
Unrecognized loss1,215 1,286 1,551 1,812 489 521 
Net amount recognized$2,582 $2,575 $765 $708 $382 $386 
Net actuarial gains decreased the benefit obligation in 2021 primarily due to the increase in the discount rates. During 2020, the net actuarial losses increased the benefit obligation primarily due to the decrease in discount rates.
In November 2020, the Company entered into an insurance contract that covers a portion of the assets within a select U.K. pension scheme. The transaction resulted in a decrease in Prepaid pension assets and Accumulated other comprehensive income of $94 million.
84


Amounts recognized in the Consolidated Statements of Financial Position consist of (in millions):
 U.K.U.S.Other
 202120202021202020212020
Prepaid benefit cost (1)
$1,344 $1,268 $— $— $— $— 
Accrued benefit liability - current (2)
(1)(1)(52)(52)(5)(5)
Accrued benefit liability - non-current (3)
(16)(21)(734)(1,052)(96)(123)
Accumulated other comprehensive loss1,255 1,329 1,551 1,812 483 514 
Net amount recognized$2,582 $2,575 $765 $708 $382 $386 
(1)Included in Prepaid pension.
(2)Included in Other current liabilities.
(3)Included in Pension, other postretirement, and postemployment liabilities.
Amounts recognized in Accumulated other comprehensive loss (income) that have not yet been recognized as components of net periodic benefit cost at December 31, 2021 and 2020 consist of (in millions):
 U.K.U.S.Other
 202120202021202020212020
Net loss$1,215 $1,286 $1,551 $1,812 $489 $521 
Prior service cost (income)40 43 — — (6)(7)
Total$1,255 $1,329 $1,551 $1,812 $483 $514 
In 2021, U.S. plans with a PBO and an ABO in excess of the fair value of plan assets had a PBO of $3.2 billion, an ABO of $3.2 billion, and plan assets with a fair value of $2.4 billion. U.K. plans with a PBO and an ABO in excess of the fair value of plan assets had a PBO of $17 million, an ABO of $17 million and no plan assets. Other plans with a PBO in excess of the fair value of plan assets had a PBO of $1.5 billion and plan assets with a fair value of $1.4 billion, and other plans with an ABO in excess of the fair value of plan assets had an ABO of $409 million and plan assets with a fair value of $326 million.
In 2020, U.S. plans with a PBO and an ABO in excess of the fair value of plan assets had a PBO of $3.3 billion, an ABO of $3.3 billion, and plan assets with a fair value of $2.2 billion. U.K. plans with a PBO and an ABO in excess of the fair value of plan assets had a PBO of $54 million, an ABO of $54 million and plan assets with a fair value of $32 million. Other plans with a PBO in excess of the fair value of plan assets had a PBO of $1.6 billion and plan assets with a fair value of $1.4 billion, and other plans with an ABO in excess of the fair value of plan assets had an ABO of $443 million and plan assets with a fair value of $342 million.
Service cost is reported in Compensation and benefits and all other components are reported in Other income (expense) as follows (in millions):
 U.K.U.S.Other
 202120202019202120202019202120202019
Service cost$$— $— $— $— $— $— $— $— 
Interest cost65 88 109 57 85 108 12 19 27 
Expected return on plan assets, net of administration expenses(137)(159)(191)(130)(134)(136)(32)(34)(40)
Amortization of prior-service cost— — — — 
Amortization of net actuarial loss32 30 29 78 68 53 15 12 12 
Net periodic benefit (income) cost(37)(39)(52)20 27 (5)(3)(1)
Settlement expense— — — — — — 
Total net periodic benefit cost (income)$(32)$(37)$(47)$$20 $27 $(5)$(3)$(1)
The Company uses a full-yield curve approach in the estimation of the service and interest cost components of net periodic pension and postretirement benefit cost for its major pension and other postretirement benefit plans. This estimation was obtained by applying the specific spot rates along the yield curve used in the determination of the benefit obligation to the relevant projected cash flows.
85


Transfer payments from certain U.K. pension plans exceeded the plan’s service and interest cost in 2021, 2020, and 2019. This triggered settlement accounting which required immediate recognition of a portion of the accumulated losses associated with the plan. Consequently, the Company recognized a non-cash settlement charge for approximately £3 million in 2021 ($5 million using December 31, 2021 exchange rates), approximately £2 million in 2020 ($2 million using December 31, 2020 exchange rates), and approximately £4 million in 2019 ($5 million using December 31, 2019 exchange rates).
The weighted-average assumptions used to determine benefit obligations are as follows:
 U.K.
U.S. (1)
Other
 202120202021202020212020
Discount rate1.96%1.45%2.23 - 2.80%1.74 - 2.45%1.00 - 2.97%0.38 - 2.47%
Rate of compensation increase3.62 - 4.12%3.22 - 3.72%N/AN/A1.00 - 3.00%1.00 - 3.00%
Underlying price inflation2.52%2.12%N/AN/A2.00%2.00%
(1)U.S. pension plans are frozen and therefore not impacted by compensation increases or price inflation.
The weighted-average assumptions used to determine the net periodic benefit cost are as follows:
 U.K.U.S.Other
 202120202019202120202019202120202019
Discount rate1.20%1.89%2.95%1.12 - 1.79%2.36 - 2.76%3.92 - 4.26%0.28 - 2.00%0.74 - 2.90%1.89 - 3.88%
Expected return on plan assets, net of administration expenses2.04%2.74%3.64%2.65 - 6.56%3.30- 7.04%7.05%1.70 - 2.65%2.10 - 3.10%2.50 - 4.10%
Rate of compensation increase3.22 - 3.72%3.24 - 3.74%3.73 - 4.23%N/AN/AN/A1.00 - 3.00%1.00 - 3.00%1.00 - 3.00%
Expected Return on Plan Assets
To determine the expected long-term rate of return on plan assets, the historical performance, investment community forecasts, and current market conditions are analyzed to develop expected returns for each asset class used by the plans. The expected returns for each asset class are weighted by the target allocations of the plans. The expected return of 6.56% on U.S. plan assets reflects a portfolio that is seeking asset growth through a higher equity allocation while maintaining prudent risk levels. The portfolio contains certain assets that have historically resulted in higher returns, as well as other financial instruments to minimize downside risk.
No plan assets are expected to be returned to the Company during 2022.
Fair value of plan assets
The Company determined the fair value of plan assets through numerous procedures based on the asset class and available information. Refer to Note 14 “Fair Value Measurements and Financial Instruments” for a description of the procedures performed to determine the fair value of the plan assets.
86


The fair values of the Company’s U.S. pension plan assets at December 31, 2021 and December 31, 2020, by asset category, are as follows (in millions):
  Fair Value Measurements Using
Asset CategoryBalance at December 31, 2021Quoted Prices in Active Markets for Identical Assets
(Level 1)
Significant Other Observable Inputs
(Level 2)
Significant Unobservable Inputs
(Level 3)
Cash and cash equivalents (1)
$93 $93 $— $— 
Equity investments: 
Equity securities86 86 — — 
Equity derivatives19 — 19 — 
Pooled funds (2)
548 — — — 
Fixed income investments: 
Corporate bonds249 — 249 — 
Government and agency bonds230 192 38 — 
Pooled funds (2)
838 — — — 
Other investments: 
Real estate (2) (3)
156 — — — 
Alternative investments (2) (4)
159 — — — 
Total$2,378 $371 $306 $— 
  Fair Value Measurements Using
Asset CategoryBalance at December 31, 2020Quoted Prices in Active Markets for Identical Assets
(Level 1)
Significant Other Observable Inputs
(Level 2)
Significant Unobservable Inputs
(Level 3)
Cash and cash equivalents (1)
$79 $79 $— $— 
Equity investments: 
Equity securities207 207 — — 
Equity derivatives62 — 62 — 
Pooled funds (2)
640 90 — — 
Fixed income investments: 
Corporate bonds167 — 167 — 
Government and agency bonds233 200 33 — 
Pooled funds (2)
543 212 — — 
Other investments: 
Real estate (2)(3)
163 — — — 
Alternative investments (2) (4)
182 — — — 
Total$2,276 $788 $262 $— 
(1)Consists of cash and institutional short-term investment funds.
(2)Certain investments measured at fair value using the net asset value per share practical expedient have not been classified in the fair value hierarchy. The fair value amounts presented in the above table are intended to permit reconciliation of the fair values to the amounts presented in the plan assets contained in this Note.
(3)Consists of property funds and trusts holding direct real estate investments.
(4)Consists of limited partnerships, private equity, and hedge funds.


87


The fair values of the Company’s major U.K. pension plan assets at December 31, 2021 and December 31, 2020, by asset category, are as follows (in millions):
  Fair Value Measurements Using
 Balance at December 31, 2021Quoted Prices in Active Markets for Identical Assets
(Level 1)
Significant Other Observable Inputs
(Level 2)
Significant Unobservable Inputs
(Level 3)
Cash and cash equivalents (1)
$872 $872 $— $— 
Equity investments: 
Pooled funds (2)
— — — — 
Fixed income investments: 
Derivatives (3)
(1,640)— (1,640)— 
Government and agency bonds2,969 2,969 — — 
Annuities2,305 — — 2,305 
Pooled funds (2)
463 — — — 
Other investments:
Real estate (2) (4)
130— — — 
Pooled funds (2) (5)
1,147 — — — 
Total$6,246 $3,841 $(1,640)$2,305 
  Fair Value Measurements Using
 Balance at December 31, 2020Quoted Prices in Active Markets for Identical Assets
(Level 1)
Significant Other Observable Inputs
(Level 2)
Significant Unobservable Inputs
(Level 3)
Cash and cash equivalents (1)
$182 $182 $— $— 
Equity investments:
Pooled funds (2)
— — — 
Fixed income investments:
Derivatives (3)
(1,424)— (1,424)— 
Corporate bonds— — 
Government and agency bonds2,872 2,872 — — 
Annuities2,625 — — 2,625 
Pooled funds (2)
875 — — — 
Other investments:
Real estate (2) (4)
117— — — 
Pooled funds (2) (5)
1,397 — — 
Total$6,652 $3,062 $(1,424)$2,625 
(1)Consists of cash and institutional short-term investment funds.
(2)Certain investments measured at fair value using the net asset value per share practical expedient have not been classified in the fair value hierarchy. The fair value amounts presented in the above table are intended to permit reconciliation of the fair values to the amounts presented in the plan assets contained in this Note.
(3)Consists of equity securities and equity derivatives, including repurchase agreements.
(4)Consists of property funds and trusts holding direct real estate investments.
(5)Consists of multi-strategy limited partnerships, private equity, hedge funds, and collective investment schemes with a diversified portfolio of cash, equities, equity related securities, derivatives, and/or fixed income securities.
88


The following table presents the changes in the Level 3 fair-value category in the Company’s U.K. pension plans for the years ended December 31, 2021 and December 31, 2020 (in millions):
Fair Value Measurements Using Level 3 InputsAnnuities
Balance at January 1, 2020$1,849 
Actual return on plan assets:
Relating to assets still held at December 31, 202013 
Purchase, sales and settlements-net682 
Foreign exchange81 
Balance at December 31, 20202,625 
Actual return on plan assets:
Relating to assets still held at December 31, 2021(286)
Purchases, sales and settlements-net— 
Foreign exchange(34)
Balance at December 31, 2021$2,305 
The fair values of the Company’s other major pension plan assets at December 31, 2021 and December 31, 2020, by asset category, are as follows (in millions):
  Fair Value Measurements Using
 Balance at December 31, 2021Quoted Prices in Active Markets for Identical Assets
(Level 1)
Significant Other Observable Inputs
(Level 2)
Significant Unobservable Inputs
(Level 3)
Cash and cash equivalents (1)
$29 $29 $— $— 
Equity investments: 
Equity securities72 72 — — 
Pooled funds (2)
316 — — — 
Fixed income investments: 
Government and agency bonds350 350 — — 
Pooled funds (2)
597 — — — 
Other investments: 
Alternative investments (2) (3)
55 — — — 
Real estate (2) (4)
11 — — — 
Total$1,430 $451 $— $— 
89


  Fair Value Measurements Using
 Balance at December 31, 2020Quoted Prices in Active Markets for Identical Assets
(Level 1)
Significant Other Observable Inputs
(Level 2)
Significant Unobservable Inputs
(Level 3)
Cash and cash equivalents (1)
$37 $37 $— $— 
Equity investments:
Equity securities75 75 — — 
Pooled funds (2)
290 — — — 
Fixed income investments:
Government and agency bonds395 395 — — 
Pooled funds (2)
627 — — — 
Other investments:
Alternative investments (2) (3)
63 — — — 
Real estate (2) (4)
10 — — — 
Total$1,497 $507 $— $— 
(1)Consists of cash and institutional short-term investment funds.
(2)Certain investments measured at fair value using the net asset value per share practical expedient have not been classified in the fair value hierarchy. The fair value amounts presented in the above table are intended to permit reconciliation of the fair values to the amounts presented in the plan assets contained in this Note.
(3)Consists of limited partnerships, private equity, and hedge funds.
(4)Consists of property funds and trusts holding direct real estate investments.
Investment Policy and Strategy
The U.S. investment policy, as established by the RPGIC, seeks reasonable asset growth at prudent risk levels within weighted average targetallocations. At December 31, 2021, the weighted average targeted allocation for the U.S. plans was 31% for equity investments, 54% for fixed income investments, and 15% for other investments. Aon believes that plan assets are well-diversified and are of appropriate quality. The investment portfolio asset allocation is reviewed quarterly and re-balanced to be within policy target allocations. The investment policy is reviewed at least annually and revised, as deemed appropriate by the RPGIC. The investment policies for international plans are generally established by the local pension plan trustees and seek to maintain the plans’ ability to meet liabilities and to comply with local minimum funding requirements. Plan assets are invested in diversified portfolios that provide adequate levels of return at an acceptable level of risk. The investment policies are reviewed at least annually and revised, as deemed appropriate to ensure that the objectives are being met. At December 31, 2021, the weighted average targeted allocation for the U.K. and non-U.S. plans was 6% for equity investments, 88% for fixed income investments, and 6% for other investments.
Cash Flows
Contributions
Based on current assumptions, in 2022, the Company expects to contribute approximately $7 million, $52 million, and $15 million to its significant U.K., U.S., and other major pension plans, respectively.
Estimated Future Benefit Payments
Estimated future benefit payments for plans, not including voluntary one-time lump sum payments, are as follows at December 31, 2021 (in millions):
U.K.U.S.Other
2022$164 $193 $47 
2023$171 $191 $48 
2024$177 $193 $49 
2025$183 $193 $50 
2026$188 $183 $52 
2027 - 2031$1,017 $882 $275 
90


U.S. and Canadian Other Postretirement Benefits
The following table provides an overview of the accumulated PBO, fair value of plan assets, funded status and net amount recognized as of December 31, 2021 and 2020 for the Company’s other significant postretirement benefit plans located in the U.S. and Canada (in millions):
20212020
Accumulated projected benefit obligation$109 $117 
Fair value of plan assets17 17 
Funded status(92)(100)
Unrecognized prior-service credit(1)(1)
Unrecognized loss13 
Net amount recognized$(91)$(88)
Other information related to the Company’s other postretirement benefit plans are as follows:
202120202019
Net periodic benefit cost recognized (millions)$5$4$3
Weighted-average discount rate used to determine future benefit obligations2.52 - 3.06%2.10 - 2.58%2.93 - 3.25%
Weighted-average discount rate used to determine net periodic benefit costs1.45 - 2.68%2.93 - 3.25%3.91 - 4.26%
Based on current assumptions, the Company expects:
The amount in Accumulated other comprehensive income expected to be recognized as a component of net periodic benefit cost during 2022 is $0.9 million net gain and $0.2 million of prior-service credit.
To contribute $5 million to fund significant other postretirement benefit plans during 2022.
Estimated future benefit payments will be approximately $5 million each year for 2022 through 2026, and $25 million in aggregate for 2027-2031.
12.    Share-Based Compensation Plans
The following table summarizes share-based compensation expense recognized in the Consolidated Statements of Income in Compensation and benefits (in millions):
Years Ended December 31
202120202019
Restricted share units$204 $186 $198 
Performance share awards189 116 110 
Employee share purchase plans and other (1)
56 10 
  Total share-based compensation expense449 312 317 
Tax benefit87 61 66 
  Share-based compensation expense, net of tax$362 $251 $251 
(1) Includes expenses related to the Aon United Growth Ownership Plan.
Restricted Share Units
RSUs generally vest between three and five years. The fair value of RSUs is based upon the market value of the Company’s class A ordinary shares at the date of grant. With certain limited exceptions, any break in continuous employment will cause the forfeiture of all non-vested awards. Compensation expense associated with RSUs is recognized on a straight-line basis over the requisite service period. Dividend equivalents are paid on certain RSUs, based on the initial grant amount.
91


The following table summarizes the status of the Company’s RSUs (shares in thousands, except fair value):
Years Ended December 31
202120202019
Shares
Fair Value at Date of Grant (1)
Shares
Fair Value at Date of Grant (1)
Shares
Fair Value at Date of Grant (1)
Non-vested at beginning of year3,309 $163 3,634 $143 4,208 $120 
Granted1,257 $253 1,329 $185 1,306 $175 
Vested(1,248)$151 (1,426)$133 (1,661)$113 
Forfeited(243)$184 (228)$157 (219)$131 
  Non-vested at end of year3,075 $203 3,309 $163 3,634 $143 
(1)Represents per share weighted average fair value of award at date of grant.
The fair value of RSUs that vested during 2021, 2020 and 2019 was $189 million, $190 million, and $187 million, respectively.
Unamortized deferred compensation expense amounted to $447 million as of December 31, 2021, with a remaining weighted average amortization period of approximately 2.1 years.
Performance Share Awards
The vesting of PSAs is contingent upon meeting a cumulative level of earnings per share related performance over a three-year period. The actual issuance of shares may range from 0-200% of the target number of PSAs granted, based on the terms of the plan and level of achievement of the related performance target. The grant date fair value of PSAs is based upon the market price of the Company’s class A ordinary shares at the date of grant. The performance conditions are not considered in the determination of the grant date fair value for these awards. Compensation expense is recognized over the performance period based on management’s estimate of the number of units expected to vest. Management evaluates its estimate of the actual number of shares expected to be issued at the end of the programs on a quarterly basis. The cumulative effect of the change in estimate is recognized in the period of change as an adjustment to Compensation and benefits in the Consolidated Statements of Income, if necessary. Dividend equivalents are not paid on PSAs.
The following table summarizes the Company’s target PSAs granted and shares that would be issued at current performance levels for PSAs granted during the years ended December 31, 2021, 2020, and 2019, respectively (shares in thousands and dollars in millions, except fair value):
202120202019
Target PSAs granted during period382 500 467 
Weighted average fair value per share at date of grant$225 $163 $165 
Number of shares that would be issued based on current performance levels737 970 888 
Unamortized expense, based on current performance levels$122 $51 $— 
During 2021, the Company issued approximately 0.5 million shares in connection with performance achievements related to the 2018-2020 LPP. During 2020, the Company issued approximately 0.6 million shares in connection with performance achievements related to the 2017-2019 LPP cycle. During 2019, the Company issued approximately 0.7 million shares in connection with performance achievements related to the 2016-2018 LPP cycle.
13.    Derivatives and Hedging
The Company is exposed to market risks, including changes in foreign currency exchange rates and interest rates. To manage the risk related to these exposures, the Company enters into various derivative instruments that reduce these risks by creating offsetting exposures. The Company does not enter into derivative transactions for trading or speculative purposes.
Foreign Exchange Risk Management
The Company is exposed to foreign exchange risk when it earns revenues, pays expenses, enters into monetary intercompany transfers or other transactions denominated in a currency that differs from its functional currency. The Company uses foreign exchange derivatives, typically forward contracts, options and cross-currency swaps, to reduce its overall exposure to the effects of currency fluctuations on cash flows. These exposures are hedged, on average, for less than two years. These derivatives are accounted for as hedges, and changes in fair value are recorded each period in Other comprehensive income (loss) in the Consolidated Statements of Comprehensive Income.
92


The Company also uses foreign exchange derivatives, typically forward contracts and options, to economically hedge the currency exposure of the Company’s global liquidity profile, including monetary assets or liabilities that are denominated in a non-functional currency of an entity, typically on a rolling 90-day basis, but may be for up to one year in the future. These derivatives are not accounted for as hedges, and changes in fair value are recorded each period in Other income in the Consolidated Statements of Income.
The notional and fair values of derivative instruments are as follows (in millions):
 Notional Amount
Net Amount of Derivative Assets Presented in the Statements of Financial Position (1)
Net Amount of Derivative Liabilities Presented in the Statements of Financial Position (2)
As of December 31202120202021202020212020
Foreign exchange contracts      
  Accounted for as hedges$629 $633 $27 $33 $— $— 
  Not accounted for as hedges (3)
412 367 — 
Total$1,041 $1,000 $29 $34 $— $
(1)Included within Other current assets ($21 million in 2021 and $11 million in 2020) or Other non-current assets ($8 million in 2021 and $23 million in 2020).
(2)Included within Other current liabilities ($1 million in 2020).
(3)These contracts typically are for 90-day durations and executed close to the last day of the most recent reporting month, thereby resulting in nominal fair values at the balance sheet date.
The amounts of derivative gains (losses) recognized in the Consolidated Financial Statements are as follows (in millions):
202120202019
Gain (loss) recognized in Accumulated other comprehensive loss$— $$(9)
The amounts of derivative gains (losses) reclassified from Accumulated other comprehensive loss to the Consolidated Statements of Income are as follows (in millions):
Years Ended December 31
202120202019
Total revenue$(3)$(14)$(12)
Compensation and benefits— (1)
Interest expense— (1)(1)
Total$(2)$(15)$(14)
The Company estimates that approximately $5 million of pretax gains currently included within Accumulated other comprehensive loss will be reclassified into earnings in the next twelve months.
The Company recorded a loss of $24 million in 2021, a gain of $1 million in 2020, and a loss of $18 million in 2019 in Other income for foreign exchange derivatives not designated or qualifying as hedges.
Net Investments in Foreign Operations Risk Management
The Company uses non-derivative financial instruments to protect the value of its investments in a number of foreign subsidiaries. The Company has designated a portion of its euro-denominated commercial paper issuances as a non-derivative hedge of the foreign currency exposure of a net investment in its European operations. The change in fair value of the designated portion of the euro-denominated commercial paper due to changes in foreign currency exchange rates is recorded in Foreign currency translation adjustment, a component of Accumulated other comprehensive loss, to the extent it is effective as a hedge. The foreign currency translation adjustment of the hedged net investments is also recorded in Accumulated other comprehensive loss. Ineffective portions of net investment hedges, if any, are reclassified from Accumulated other comprehensive loss into earnings during the period of change.
The Company had no outstanding euro-denominated commercial paper at December 31, 2021 and 2020 designated as a hedge of the foreign currency exposure of its net investment in its European operations. The unrealized gain recognized in Accumulated other comprehensive loss related to the net investment non-derivative hedging instrument was $29 million, as of December 31, 2021 and 2020.
93


The Company did not reclassify any deferred gains or losses related to net investment hedges from Accumulated other comprehensive loss to earnings for 2021, 2020, and 2019.
14.    Fair Value Measurements and Financial Instruments
Accounting standards establish a three-tier fair value hierarchy that prioritizes the inputs used in measuring fair values as follows:
Level 1 — observable inputs such as quoted prices for identical assets in active markets;
Level 2 — inputs other than quoted prices for identical assets in active markets, that are observable either directly or indirectly; and
Level 3 — unobservable inputs in which there is little or no market data which requires the use of valuation techniques and the development of assumptions.
The following methods and assumptions are used to estimate the fair values of the Company’s financial instruments, including pension assets (refer to Note 11 “Employee Benefits”):
Money market funds consist of institutional prime, treasury, and government money market funds. The Company reviews treasury and government money market funds to obtain reasonable assurance that the fund net asset value is $1 per share and reviews the floating net asset value of institutional prime money market funds for reasonableness.
Cash and cash equivalents consist of cash and institutional short-term investment funds. The Company reviews the short-term investment funds to obtain reasonable assurance that the fund net asset value is $1 per share.
Equity investments consist of equity securities and equity derivatives valued using the closing stock price on a national securities exchange. Over the counter equity derivatives are valued using observable inputs such as underlying prices of the underlying security and volatility. On a sample basis the Company reviews the listing of Level 1 equity securities in the portfolio, agrees the closing stock prices to a national securities exchange, and independently verifies the observable inputs for Level 2 equity derivatives and securities.
Fixed income investments consist of certain categories of bonds and derivatives. Corporate, government, and agency bonds are valued by pricing vendors who estimate fair value using recently executed transactions and proprietary models based on observable inputs, such as interest rate spreads, yield curves, and credit risk. Asset-backed securities are valued by pricing vendors who estimate fair value using DCF models utilizing observable inputs based on trade and quote activity of securities with similar features. Fixed income derivatives are valued by pricing vendors using observable inputs such as interest rates and yield curves. The Company obtains an understanding of the models, inputs, and assumptions used in developing prices provided by its vendors through discussions with the fund managers. The Company independently verifies the observable inputs, as well as assesses assumptions used for reasonableness based on relevant market conditions and internal Company guidelines. If an assumption is deemed unreasonable, based on internal Company guidelines, it is then reviewed by management and the fair value estimate provided by the vendor is adjusted, if deemed appropriate. These adjustments do not occur frequently and historically are not material to the fair value estimates used in the Consolidated Financial Statements.
Pooled funds consist of various equity, fixed income, and real estate mutual fund type investment vehicles. Pooled investment funds fair value is estimated based on the proportionate share ownership in the underlying net assets of the investment, which is based on the fair value of the underlying securities. The underlying securities typically trade on a national securities exchange or may be valued by the fund managers using applicable models, inputs, and assumptions. The Company gains an understanding of the investment guidelines and valuation policies of the fund and discusses fund performance with pooled fund managers. The Company obtains audited fund manager financial statements, when available. If the pooled fund is designed to replicate a publicly traded index, the Company compares the performance of the fund to the index to assess the reasonableness of the fair value measurement.
Alternative investments consist of limited partnerships, private equity, and hedge funds. Alternative investment fair value is generally estimated based on the proportionate share ownership in the underlying net assets of the investment as determined by the general partner or investment manager. The valuations are based on various factors depending on investment strategy, proprietary models, and specific financial data or projections. The Company obtains audited fund manager financial statements, when available. The Company obtains a detailed understanding of the models, inputs, and assumptions used in developing prices provided by the investment managers, or appropriate party, through regular discussions. The Company also obtains the investment manger’s valuation policies and assesses the assumptions used for reasonableness based on relevant market conditions and internal Company guidelines. If an assumption is deemed unreasonable, based on the Company’s guidelines, it is then reviewed by management and the fair value estimate provided by the vendor is adjusted, if deemed appropriate. These
94


adjustments do not occur frequently and historically are not material to the fair value estimates in the Consolidated Financial Statements.
Derivatives are carried at fair value, based upon industry standard valuation techniques that use, where possible, current market-based or independently sourced pricing inputs, such as interest rates, currency exchange rates, or implied volatility.
Annuity contracts consist of insurance group annuity contracts purchased to match the pension benefit payment stream owed to certain selected plan participant demographics within a few major U.K. defined benefit plans. Annuity contracts are valued using a DCF model utilizing assumptions such as discount rate, mortality, and inflation.
Real estate and REITs consist of publicly traded REITs and direct real estate investments. Level 1 REITs are valued using the closing stock price on a national securities exchange. Non-Level 1 values are based on the proportionate share of ownership in the underlying net asset value as determined by the investment manager. The Company independently reviews the listing of Level 1 REIT securities in the portfolio and agrees the closing stock prices to a national securities exchange. The Company gains an understanding of the investment guidelines and valuation policies of the non-Level 1 real estate funds and discusses performance with the fund managers. The Company obtains audited fund manager financial statements, when available. See the description of “Alternative investments” for further detail on valuation procedures surrounding non-Level 1 REITs.
Debt is carried at outstanding principal balance, less any unamortized issuance costs, discount or premium. Fair value is based on quoted market prices or estimates using DCF analyses based on current borrowing rates for similar types of borrowing arrangements.
The following tables present the categorization of the Company’s assets and liabilities that are measured at fair value on a recurring basis at December 31, 2021 and December 31, 2020 (in millions):
  Fair Value Measurements Using
 Balance at December 31, 2021Quoted Prices in
Active Markets
for Identical
Assets (Level 1)
Significant
Other
Observable
Inputs (Level 2)
Significant
Unobservable
Inputs
(Level 3)
Assets    
Money market funds (1)
$2,918 $2,918 $— $— 
Other investments    
Government bonds$$— $$— 
Derivatives (2)
    
Gross foreign exchange contracts$40 $— $40 $— 
Liabilities    
Derivatives (2)
    
Gross foreign exchange contracts$11 $— $11 $— 
95


  Fair Value Measurements Using
 Balance at December 31, 2020Quoted Prices in
Active Markets
for Identical
Assets (Level 1)
Significant
Other
Observable
Inputs (Level 2)
Significant
Unobservable
Inputs
(Level 3)
Assets    
Money market funds (1)
$2,781 $2,781 $— $— 
Other investments 
Government bonds$$— $$— 
Equity investments$$— $$— 
Derivatives (2)
 
Gross foreign exchange contracts$38 $— $38 $— 
Liabilities 
Derivatives (2)
 
Gross foreign exchange contracts$$— $$— 
(1)Included within Fiduciary assets or Short-term investments in the Consolidated Statements of Financial Position, depending on their nature and initial maturity.
(2)Refer to Note 13 “Derivatives and Hedging” for additional information regarding the Company’s derivatives and hedging activity.
There were no transfers of assets or liabilities between fair value hierarchy levels during 2021 or 2020. The Company recognized no realized or unrealized gains or losses in the Consolidated Statements of Income related to assets and liabilities measured at fair value using unobservable inputs in 2021, 2020, or 2019.
The fair value of debt is classified as Level 2 of the fair value hierarchy. The following table provides the carrying value and fair value for the Company’s term debt (in millions):
20212020
 As of December 31Carrying
Value
Fair
Value
Carrying
Value
Fair
Value
Current portion of long-term debt$499 $507 $400 $401 
Long-term debt$8,228 $9,204 $7,281 $8,752 
15.    Claims, Lawsuits, and Other Contingencies
Legal
Aon and its subsidiaries are subject to numerous claims, tax assessments, lawsuits and proceedings that arise in the ordinary course of business, which frequently include E&O claims. The damages claimed in these matters are or may be substantial, including, in many instances, claims for punitive, treble, or extraordinary damages. While Aon maintains meaningful E&O insurance and other insurance programs to provide protection against certain losses that arise in such matters, Aon has exhausted or materially depleted its coverage under some of the policies that protect the Company and, consequently, is self-insured or materially self-insured for some claims. Accruals for these exposures, and related insurance receivables, when applicable, are included in the Consolidated Statements of Financial Position and have been recognized in Other general expense in the Consolidated Statements of Income to the extent that losses are deemed probable and are reasonably estimable. These amounts are adjusted from time to time as developments warrant. Matters that are not probable and reasonably estimable are not accrued for in the financial statements.
The Company has included in the current matters described below certain matters in which (1) loss (including interest and costs) is probable, (2) loss (including interest and costs) is reasonably possible (that is, more than remote but not probable), or (3) there exists the reasonable possibility of loss (including interest and costs) greater than the accrued amount. In addition, the Company may from time to time disclose matters for which the probability of loss could be remote but the claim amounts associated with such matters are potentially significant. The reasonably possible range of loss (including interest and costs) for the matters described below for which loss is estimable, in excess of amounts that are deemed probable and estimable and therefore already accrued, is estimated to be between $0 and $0.8 billion, exclusive of any insurance coverage. These estimates are based on available information as of the date of this filing. As available information changes, the matters for which Aon is able to estimate, and the estimates themselves, may change. In addition, many estimates involve significant judgment and uncertainty. For example, at the time of making an estimate, Aon may only have limited information about the facts underlying the claim and predictions and assumptions about future court rulings and outcomes may prove to be inaccurate. Although
96


management at present believes that the ultimate outcome of all matters described below, individually or in the aggregate, will not have a material adverse effect on the consolidated financial position of Aon, legal proceedings are subject to inherent uncertainties and unfavorable rulings or other events. Unfavorable resolutions could include substantial monetary or punitive damages imposed on Aon or its subsidiaries. If unfavorable outcomes of these matters were to occur, future results of operations or cash flows for any particular quarterly or annual period could be materially adversely affected.
Current Matters
On October 3, 2017, CCC invoked arbitration to pursue a claim that it asserts against Aon New Zealand. Aon provided insurance broking services to CCC in relation to CCC’s 2010-2011 material damage and business interruption program. In December 2015, CCC settled its property and business interruption claim for its losses arising from the 2010-2011 Canterbury earthquakes against the underwriter of its material damage and business interruption program and the reinsurers of that underwriter. CCC contends that acts and omissions by Aon caused CCC to recover less in that settlement than it otherwise would have. CCC claims damages of approximately NZD 320 million ($218 million at December 31, 2021 exchange rates) plus interest and costs. Aon believes that it has meritorious defenses and intends to vigorously defend itself against these claims.
Aon Hewitt Investment Consulting, Inc, now known as Aon Investments USA, Inc. (“Aon Investments”), Lowe’s Companies, Inc. and the Administrative Committee of Lowe’s Companies, Inc. (collectively “Lowe’s”) were sued on April 27, 2018 in the U.S. District Court for the Western District of North Carolina (the “Court”) in a class action lawsuit brought on behalf of participants in the Lowe’s 401(k) Plan (the “Plan”). Aon Investments provided investment consulting services to Lowe’s under the ERISA. The plaintiffs contend that in 2015 Lowe’s imprudently placed the Hewitt Growth Fund in the Plan’s lineup of investments, the Hewitt Growth Fund underperformed its benchmarks, and that Aon had a conflict of interest in recommending the proprietary fund for the Plan. The plaintiffs allege the Plan suffered over $200 million in investment losses when compared to the eight funds it replaced. The plaintiffs allege that Aon Investments breached its duties of loyalty and prudence pursuant to the ERISA statute. The matter was tried to the Court the last week of June 2021, and the Court entered judgment in favor of Aon on all claims on October 12, 2021. Plaintiffs have filed an appeal with the United States Court of Appeals for the Fourth Circuit. Aon believes it has meritorious defenses and intends to vigorously defend itself against these claims.
A retail insurance brokerage subsidiary of Aon was sued on September 6, 2018 in the United States District Court for the Southern District of New York by a client, Pilkington North America, Inc., that sustained damage from a tornado to its Ottawa, Illinois property. The lawsuit seeks between $45 million and $85 million in property and business interruption damages from either its insurer or Aon. The insurer contends that insurance proceeds were limited to $15 million in coverage by a windstorm sub-limit purportedly contained in the policy procured by Aon for Pilkington. The insurer therefore has tendered $15 million to Pilkington and denied coverage for the remainder of the loss. Pilkington sued the insurer and Aon seeking full coverage for the loss from the insurer or, in the alternative, seeking the same damages against Aon on various theories of professional liability if the court finds that the $15 million sub-limit applies to the claim. Aon believes it has meritorious defenses and intends to vigorously defend itself against these claims.
Aon faces legal action arising out of a fatal plane crash in November 2016. Aon U.K. Limited placed an aviation civil liability reinsurance policy for the Bolivian insurer of the airline. After the crash, the insurer determined that there was no coverage under the airline’s insurance policy due to the airline’s breach of various policy conditions. In November 2018, the owner of the aircraft filed a claim in Bolivia against Aon, the airline, the insurer and the insurance broker. The claim is for $16 million plus any liability the owner has to third parties. In November 2019, a federal prosecutor in Brazil filed a public civil action naming 3 Aon entities as defendants, along with the airline, the insurer, and the lead reinsurer. That claim seeks pecuniary damages for families affected by the crash in the sum of $300 million; or, in the alternative, $50 million; or, in the alternative, $25 million; plus “moral damages” of an equivalent sum. Separately, in March 2020, the Brazilian Federal Senate invited Aon to give evidence to a Parliamentary Commission of Inquiry in an investigation into the accident. Aon is cooperating with that inquiry. In August 2020, 43 individuals (surviving passengers and estates of the deceased) filed a motion in the Circuit Court of the 11th Judicial Circuit in and for Miami-Dade County, Florida, seeking permission to commence proceedings against Aon (and the insurer and reinsurers) for claims totaling $844 million. Finally, in April 2021, representatives of 16 passengers issued a claim against Aon in the High Court in England seeking damages under the Fatal Accidents Act 1976 in the sum of £29 million ($39 million at December 31, 2021 exchange rates). Aon believes that it has meritorious defenses and intends to vigorously defend itself against these claims.
Aon Investments and AGI were sued on September 16, 2020, in the U.S. District Court for the Southern District of New York by the Blue Cross and Blue Shield Association NEBC. Aon Investments and its predecessors provided investment advisory services to NEBC since 2009. The NEBC contends that it suffered investment losses exceeding $2 billion in several Structured Alpha funds managed by AGI and recommended by Aon. The NEBC is pursuing claims against Aon Investments for breach of fiduciary duty and breach of cofiduciary duty. The NEBC alleges that Aon Investments and AGI are jointly and severally liable for damages, which include the restoration of investment losses, disgorgement of fees and profits, and attorneys’ fees. Aon believes that it has meritorious defenses and intends to vigorously defend itself against these claims.
97


In April 2017, the FCA announced an investigation relating to suspected competition law breaches in the aviation and aerospace broking industry, which, for Aon in 2016, represented less than $100 million in global revenue. The European Commission assumed jurisdiction over the investigation in place of the FCA, and the European Commission has now closed its investigation. Other antitrust agencies outside the E.U. are conducting formal or informal investigations regarding these matters. Aon intends to work diligently with all antitrust agencies concerned to ensure they can carry out their work as efficiently as possible. At this time, in light of the uncertainties and many variables involved, Aon cannot estimate the ultimate impact on our company from these investigations or any related private litigation, nor any damages, penalties, or fines related to them.
Guarantees and Indemnifications
The Company provides a variety of guarantees and indemnifications to its customers and others. The maximum potential amount of future payments represents the notional amounts that could become payable under the guarantees and indemnifications if there were a total default by the guaranteed parties, without consideration of possible recoveries under recourse provisions or other methods. These amounts may bear no relationship to the expected future payments, if any, for these guarantees and indemnifications. Any anticipated amounts payable are included in the Financial Statements and are recorded at fair value.
The Company expects that, as prudent business interests dictate, additional guarantees and indemnifications may be issued from time to time.
Guarantee of Registered Securities
In connection with the Reorganization, on April 1, 2020 Aon plc and Aon Global Holdings plc, a company incorporated under the laws of England and Wales, entered into various agreements pursuant to which they agreed to guarantee the obligations of Aon Corporation arising under issued and outstanding debt securities, which were previously guaranteed solely by Aon Global Limited and the obligations of Aon Global Limited arising under issued and outstanding debt securities, which were previously guaranteed solely by Aon Corporation. Those agreements include: (1) Second Amended and Restated Indenture, dated April 1, 2020, among Aon Corporation, Aon Global Limited, Aon plc, and Aon Global Holdings plc and The Bank of New York Mellon Trust Company, N.A., as trustee (the “Trustee”) (amending and restating the Amended and Restated Indenture, dated April 2, 2012, among Aon Corporation, Aon Global Limited and the Trustee); (2) Amended and Restated Indenture, dated April 1, 2020, among Aon Corporation, Aon Global Limited, Aon plc, Aon Global Holdings plc and the Trustee (amending and restating the Indenture, dated December 12, 2012, among Aon Corporation, Aon Global Limited plc and the Trustee); (3) Second Amended and Restated Indenture, dated April 1, 2020, among Aon Corporation, Aon Global Limited, Aon plc, Aon Global Holdings plc and the Trustee (amending and restating the Amended and Restated Indenture, dated May 20, 2015, among Aon Corporation, Aon Global Limited and the Trustee); (4) Amended and Restated Indenture, dated April 1, 2020, among Aon Corporation, Aon Global Limited, Aon plc, Aon Global Holdings plc and the Trustee (amending and restating the Indenture, dated November 13, 2015, among Aon Corporation, Aon Global Limited and the Trustee); and (5) Amended and Restated Indenture, dated April 1, 2020, among Aon Corporation, Aon Global Limited, Aon plc, Aon Global Holdings plc and the Trustee (amending and restating the Indenture, dated December 3, 2018, among Aon Corporation, Aon Global Limited and the Trustee).
Sale of the Divested Business
In connection with the sale of the Divested Business, the Company guaranteed future operating lease commitments related to certain facilities assumed by the buyer. The Company is obligated to perform under the guarantees if the Divested Business defaults on such leases at any time during the remainder of the lease agreements, which expire on various dates through 2025. As of December 31, 2021, the undiscounted maximum potential future payments under the lease guarantee were $40 million, with an estimated fair value of $5 million. No cash payments were made in connection with the lease commitments during the year ended December 31, 2021.
Additionally, the Company is subject to performance guarantee requirements under certain client arrangements that were assumed by the buyer. Should the Divested Business fail to perform as required by the terms of the arrangements, the Company would be required to fulfill the remaining contract terms, which expire on various dates through 2023. As of December 31, 2021, the undiscounted maximum potential future payments under the performance guarantees were $52 million, with an estimated fair value of less than $1 million. No cash payments were made in connection to the performance guarantees during the year ended December 31, 2021.
98


Letters of Credit
Aon has entered into a number of arrangements whereby the Company’s performance on certain obligations is guaranteed by a third party through the issuance of LOCs. The Company had total LOCs outstanding of approximately $75 million at December 31, 2021, and $79 million at December 31, 2020. These LOCs cover the beneficiaries related to certain of Aon’s U.S. and Canadian non-qualified pension plan schemes and secure deductible retentions for Aon’s own workers compensation program. The Company has also obtained LOCs to cover contingent payments for taxes and other business obligations to third parties, and other guarantees for miscellaneous purposes at its international subsidiaries.
Premium Payments
The Company has certain contractual contingent guarantees for premium payments owed by clients to certain insurance companies. The maximum exposure with respect to such contractual contingent guarantees was approximately $153 million at December 31, 2021 compared to $113 million at December 31, 2020.
16.    Segment Information
The Company operates as 1 segment that includes all of Aon’s operations, which as a global professional services firm provides a broad range of risk, health, and wealth solutions through 4 solution lines which make up its principal products and services. The CODM assesses the performance of the Company and allocates resources based on 1 segment: Aon United.
The Company’s reportable operating segment has been determined using a management approach, which is consistent with the basis and manner in which the CODM uses financial information for the purposes of allocating resources and evaluating performance. The CODM assesses performance and allocates resources based on total Aon results against its key 4 metrics, including organic revenue growth, expense discipline, and collaborative behaviors that maximize value for Aon and its shareholders, regardless of which solution line it benefits.
As Aon operates as 1 segment, segment profit or loss is consistent with consolidated reporting as disclosed in the Consolidated Statements of Income. Refer to Note 3 “Revenue from Contracts with Customers” for further information on revenue by principal service line.
Consolidated long-lived assets, net by geographic area are as follows (in millions):
As of December 31TotalUnited
States
Americas other
than U.S.
United
Kingdom
IrelandOther Europe, Middle East, & AfricaAsia
Pacific
2021$1,378 563 121 180 293 214 
2020$1,599 681 127 213 11 357 210 

99


Item 9.    Changes in and Disagreements with Accountants on Accounting and Financial Disclosure
None.
Item 9A.    Controls and Procedures
Evaluation of Disclosure Controls and Procedures
We have conducted an evaluation of the effectiveness of the design and operation of our disclosure controls and procedures, as defined in Rules 13a-15(e) and 15d-15(e) under the Securities Exchange Act of 1934, as amended (the “Exchange Act”) as of the end of the period covered by this annual report of December 31, 2021. Based on this evaluation, our chief executive officer and chief financial officer concluded as of December 31, 2021 that our disclosure controls and procedures were effective such that the information relating to Aon, including our consolidated subsidiaries, required to be disclosed in our SEC reports is recorded, processed, summarized and reported within the time periods specified in SEC rules and forms, and is accumulated and communicated to Aon’s management, including our chief executive officer and chief financial officer, as appropriate to allow timely decisions regarding required disclosure.
Management’s Report on Internal Control Over Financial Reporting
Management of Aon plc is responsible for establishing and maintaining adequate internal control over financial reporting as defined in Rules 13a-15(f) and 15d-15(f) under the Exchange Act. The Company’s internal control over financial reporting is designed to provide reasonable assurance regarding the reliability of financial reporting and the preparation of financial statements for external purposes in accordance with U.S. GAAP. Because of its inherent limitations, internal control over financial reporting may not prevent or detect misstatements. Also, projections of any evaluation of effectiveness to future periods are subject to the risk that controls may become inadequate because of changes in conditions, or that the degree of compliance with the policies or procedures may deteriorate.
Under the supervision and with the participation of our senior management, including our Chief Executive Officer and Chief Financial Officer, we assessed the effectiveness of our internal control over financial reporting as of December 31, 2021. In making this assessment, we used the criteria set forth by the Committee of Sponsoring Organizations of the Treadway Commission in the Internal Control — Integrated Framework (2013 Framework). Based on this assessment, management has concluded our internal control over financial reporting is effective as of December 31, 2021.
The effectiveness of our internal control over financial reporting as of December 31, 2021 has been audited by Ernst & Young, LLP, the Company’s independent registered public accounting firm, as stated in their report titled “Report of Independent Registered Public Accounting Firm on Internal Control over Financial Reporting.”
Changes in Internal Control Over Financial Reporting
No changes in Aon’s internal control over financial reporting (as defined in Rule 13a-15(f) under the Exchange Act) occurred during 2021 that have materially affected, or that are reasonably likely to materially affect, Aon’s internal control over financial reporting.


100


Report of Independent Registered Public Accounting Firm
To the Board of Directors and Shareholders of Aon plc
Opinion on Internal Control over Financial Reporting
We have audited Aon plc’s internal control over financial reporting as of December 31, 2021, based on criteria established in Internal Control—Integrated Framework issued by the Committee of Sponsoring Organizations of the Treadway Commission (2013 Framework), (the COSO criteria). In our opinion, Aon plc (the Company) maintained, in all material respects, effective internal control over financial reporting as of December 31, 2021, based on the COSO criteria.
We also have audited, in accordance with the standards of the Public Company Accounting Oversight Board (United States) (PCAOB), the consolidated statements of financial position of the Company as of December 31, 2021 and 2020, and the related consolidated statements of income, comprehensive income, shareholders' equity and cash flows for each of the three years in the period ended December 31, 2021, and the related notes and our report dated February 18, 2022 expressed an unqualified opinion thereon.
Basis for Opinion
The Company’s management is responsible for maintaining effective internal control over financial reporting and for its assessment of the effectiveness of internal control over financial reporting included in the accompanying Management’s Report on Internal Control Over Financial Reporting. Our responsibility is to express an opinion on the Company’s internal control over financial reporting based on our audit. We are a public accounting firm registered with the PCAOB and are required to be independent with respect to the Company in accordance with the U.S. federal securities laws and the applicable rules and regulations of the Securities and Exchange Commission and the PCAOB.
We conducted our audit in accordance with the standards of the PCAOB. Those standards require that we plan and perform the audit to obtain reasonable assurance about whether effective internal control over financial reporting was maintained in all material respects.
Our audit included obtaining an understanding of internal control over financial reporting, assessing the risk that a material weakness exists, testing and evaluating the design and operating effectiveness of internal control based on the assessed risk, and performing such other procedures as we considered necessary in the circumstances. We believe that our audit provides a reasonable basis for our opinion.
Definition and Limitations of Internal Control Over Financial Reporting
A company’s internal control over financial reporting is a process designed to provide reasonable assurance regarding the reliability of financial reporting and the preparation of financial statements for external purposes in accordance with generally accepted accounting principles. A company’s internal control over financial reporting includes those policies and procedures that (1) pertain to the maintenance of records that, in reasonable detail, accurately and fairly reflect the transactions and dispositions of the assets of the company; (2) provide reasonable assurance that transactions are recorded as necessary to permit preparation of financial statements in accordance with generally accepted accounting principles, and that receipts and expenditures of the company are being made only in accordance with authorizations of management and directors of the company; and (3) provide reasonable assurance regarding prevention or timely detection of unauthorized acquisition, use, or disposition of the company’s assets that could have a material effect on the financial statements.
Because of its inherent limitations, internal control over financial reporting may not prevent or detect misstatements. Also, projections of any evaluation of effectiveness to future periods are subject to the risk that controls may become inadequate because of changes in conditions, or that the degree of compliance with the policies or procedures may deteriorate.

aon-20211231_g1.jpg

Chicago, Illinois
February 18, 2022
101


Item 9B.    Other Information
Not applicable.
Item 9C.    Disclosure Regarding Foreign Jurisdictions that Prevents Inspections
Not applicable.
102


PART III
Item 10.    Directors, Executive Officers and Corporate Governance
Information relating to Aon’s directors is set forth under the heading “Proposal 1 — Resolutions Regarding the Election of Directors” in the Proxy Statement for the 2022 Annual General Meeting of Shareholders (the “Proxy Statement”) and is incorporated herein by reference. Information relating to Aon’s executive officers is set forth in Part I of this report and is incorporated herein by reference. The remaining information required by this item is set forth under the headings “Corporate Governance” and “Board of Directors and Committees” in the Proxy Statement, and all such information is incorporated herein by reference.

We have adopted a code of ethics that applies to the Company’s directors, officers, and employees, including the Chief Executive Officer, Chief Financial Officer, Controller, and Chief Accounting Officer and other persons performing similar functions. The text of our code of ethics, which we call our Code of Business Conduct, is available on our website as disclosed in Part 1 of this report.the Original Filing. We will provide a copy of the code of ethics without charge upon request to the Company Secretary, Metropolitan Building, James Joyce Street, Dublin 1, Ireland. We will disclose on our website any amendment to or waiver from our code of ethics on behalf of any of our executive officers or directors.

8


Item

ITEM 11. Executive Compensation.

Compensation Discussion and Analysis

This Compensation Discussion and Analysis (“CD&A”) describes our executive compensation program for our Named Executive Officers (each an “NEO” and collectively the “NEOs”), who are listed below, for 2023. We recommend that you read this section in conjunction with the executive compensation tables and corresponding footnotes that follow, as it provides context for the amounts shown in the tables and the footnote disclosures.

 Name

Role

Gregory C. Case

Chief Executive Officer

Christa Davies (1)

Executive Vice President and Chief Financial Officer

Eric Andersen

President

Lisa Stevens

Executive Vice President and Chief People Officer

Darren Zeidel

Executive Vice President, General Counsel, and Company Secretary

(1) On April 1, 2024, Ms. Davies notified the Company of her intention to retire from the position of Chief Financial Officer. Ms. Davies is expected to serve as Chief Financial Officer into the third quarter of 2024 and is thereafter expected to serve as a senior advisor for a transition period into 2025.

Executive Summary

Who We Are

Aon exists to shape decisions for the better — to protect and enrich the lives of people around the world. Our colleagues provide our clients in over 120 countries and sovereignties with advice and solutions that give them the clarity and confidence to make better decisions to protect and grow their business.

2023 Business Highlights

In assessing our performance, we focus on our performance against four non-Generally Accepted Accounting Principles (“GAAP”) metrics that we communicate to shareholders: organic revenue growth, adjusted operating margin, adjusted diluted earnings per share, and free cash flow. Management believes that these measures are important to make meaningful period-to-period comparisons and that this supplemental information is helpful to investors. Management also uses these measures to assess operating performance and performance for compensation. These non-GAAP metrics should be viewed in addition to, not instead of, our consolidated financial statements and notes thereto. A reconciliation of these non-GAAP metrics to the most directly comparable GAAP metrics is set forth in Appendix A to this Amendment.

In 2023, we continued to deliver across these four metrics:

Total revenue growth was 7% compared to 2022, reflecting organic revenue growth of 7%, driven by the ongoing strength of our Aon United strategy, and a 2% favorable impact from fiduciary investment income, partially offset by a 2% unfavorable impact from acquisitions, divestitures and other.

Information

Operating margin was 28.3% and adjusted operating margin was 31.6%, driven by revenue growth outpacing expense growth and long-term investments.

Diluted earnings per share was $12.51 and adjusted diluted earnings per share was $14.14, reflecting strong operational performance and effective capital management, highlighted by $2.7 billion of share repurchases during 2023, partially offset by an unfavorable impact from higher non-cash pension expense and other non-operating expenses.

9


Cash flows provided by operating activities was $3.4 billion in 2023, an increase of $216 million, or 7%, from $3.2 billion in 2022, reflecting strong operating income growth and overall working capital optimization, partially offset by higher cash tax payments and a negative impact to working capital due to temporary invoicing delays associated with the implementation of a new system. Free cash flow was $3.2 billion in 2023, an increase of $160 million, or 5%, from $3.0 billion in 2022, reflecting an increase in cash flows from operations, partially offset by a $56 million increase in capital expenditures.

Performing at the levels described above allows us to continue to execute on our goals of strategically investing in long-term growth, improving return on invested capital over the long term, and effectively allocating capital.

During 2023, we returned nearly $3.2 billion of capital to our shareholders through share repurchases and dividends, which highlights our strong cash flow generation and effective allocation of capital. Our consistent focus on the four key metrics and our capital allocation strategy has helped drive meaningful total shareholder returns throughout the tenure of our senior management team. Specifically, during Mr. Case’s leadership, which began in April 2005, our average annual total shareholder return has been 16%, compared to the return of the benchmark Standard & Poor’s (the “S&P”) 500 of 8% and 12% for our industry peer averages (Arthur J. Gallagher & Co., Brown & Brown, Inc., Marsh & McLennan Companies, Inc., and Willis Towers Watson Public Limited Company). We believe we are well positioned to create long-term value by driving growth and operating performance, resulting in strong free cash flow generation.

We compensate our senior executives through incentive programs that measure both long-term and short-term performance. Our regular long-term incentive plan (described in this CD&A under “Long-Term Leadership Performance Program Under Our Shareholder-Approved Plan”) is based on cumulative adjusted diluted earnings per share, a measure driven by operational performance and capital management, across overlapping three-year performance periods. Our short-term incentive plan (described in this CD&A under “Annual Incentive Awards Under Our Shareholder-Approved Plan”) is primarily based on adjusted operating income, a measure driven by operating margin and organic revenue growth, as well as a people and culture component, which assesses the Company’s progress against inclusion and diversity objectives.

We achieved strong results across these metrics, which were the key performance measures under our 2021-2023 long-term and 2023 annual incentive compensation plans. Set forth below are the results across these metrics as well as the results against their GAAP comparative metrics:

$30.20 cumulative diluted earnings per share for 2021-2023; $38.75 Leadership Performance Program (“LPP”) cumulative adjusted diluted earnings per share for 2021-2023, as compared to target LPP cumulative adjusted diluted earnings per share of $32.47; and

$3,785M operating income; $4,223M adjusted operating income, an increase of 10% year-over-year.

In addition, the Company has progressed our inclusion and diversity initiatives and has advanced representations in leadership roles for women and racially diverse leaders globally and in the United States, advanced our recruitment of candidates from diverse backgrounds, and has significantly exceeded our learning goals for all colleagues on inclusion topics.

In addition, in December 2023, we entered into a definitive agreement to acquire NFP, a leading middle market property and casualty broker, benefits consultant, wealth manager, and retirement plan advisor, for an aggregate purchase price of (i) approximately $7 billion in cash and (ii) approximately 20,000,000 class A ordinary shares of the Company (“Class A Ordinary Shares”).

Features of Our Executive Compensation Program

The following table provides an overview of our compensation program elements for our NEOs. The guiding philosophy underlying our executive compensation program is to provide a fair, flexible, and market-based total compensation package that is meaningfully tied to the Company’s short- and long-term performance and aligned with the interests of our shareholders.

10


Element

Description

Objectives

Fixed

Base Salary

Fixed amount of compensation for services provided during the year.

Provide our executives with a predictable level of income; determined in view of job responsibilities, experience, contractual commitments, individual performance, and market pay data.

Performance-Contingent

Annual Incentive Compensation

Performance-based annual incentive determined and paid based on achievement of specified annual corporate performance objectives and individual review of executives’ contributions to business and financial results, delivery of key strategic initiatives, and personal leadership. Annual incentives historically have been paid under the Aon plc 2011 Incentive Plan, as amended and restated (and its predecessor plans) (the “Shareholder-Approved Plan”) in a combination of cash, restricted share units that vest over a three-year period, and performance share units (“PSUs”). For 2023, annual incentives for our NEOs generally were paid in PSUs that vest over a three-year period as subsequently explained under “Annual Incentive Awards Under Our Shareholder-Approved Plan.”

Serve as a vehicle for recognizing annual results and performance, while payment in share units promotes retention and provides value tied to long-term Company performance.

Long-Term Incentive Compensation

Annual performance-based long-term incentive determined and paid under our LPP. LPP awards are issued under our Shareholder-Approved Plan in the form of PSUs that vest upon achievement of specific corporate performance objectives over a three-year performance period.

From time to time, our NEOs may also receive one-time long-term performance awards, as appropriate and subject to the limits of our Shareholder-Approved Plan.

Encourage and reward long-term performance by giving executives a stake in the Company’s long-term financial success. Also intended to promote leadership continuity and/or recognize executives for exceptional performance against our key financial metrics.

11


Element

Description

Objectives

Benefit Plans

Retirement and Health and Welfare Benefits

Standard 401(k) plan and health and welfare benefits as provided to non-executive full-time employees. We also offer a nonqualified supplemental savings plan to eligible employees whose contributions would exceed statutory U.S. Internal Revenue Service (“IRS”) limits under our 401(k) plan, as well as a nonqualified plan through which eligible employees may defer receipt of their salary and/or annual incentive payments.

Provide competitive benefits to attract and retain talented employees.

Severance

Severance and Change in Control Benefits

Severance benefits payable upon certain qualifying terminations of employment without cause or with specified good reason, including in connection with a change in control.

Provide a temporary income stream following termination of employment without cause or with specified good reason and, in the case of change in control protection, to ensure continuity and objectivity of management during a change in control event.

Other

Certain Other Benefits

Certain NEOs receive housing, tax equalization, and/or various cost of living payments for agreeing to perform services primarily at the Company’s global operational headquarters in London, limited personal use of Company aircraft, annual health screenings, supplemental insurance, reimbursement for business-related club dues, relocation benefits, and/or car allowances.

Recognize and make non-resident NEOs whole for expenses incurred in performance of services primarily at the Company’s global operational headquarters in London; also intended to attract and retain committed employees and allow them to focus on job duties and wellbeing.

12


Our Pay for Performance Orientation and Executive Compensation Philosophy

The core principle of our executive compensation program continues to be pay for performance, as we progress toward our goal of being the leading global professional services firm focused on delivering human capital and risk capital solutions to our clients. That core principle dictates that performance-based pay elements (which constitute the bulk of our NEOs’ total direct compensation (consisting of base salary, annual incentive compensation and long-term incentive compensation, with long-term equity awards based on grant date value assuming target performance)) will not be earned or paid unless specified performance objectives are achieved. For 2023, performance-based compensation comprised approximately 93% of the total direct compensation for Mr. Case and averaged approximately 86% of the total direct compensation for our other NEOs:

LOGO

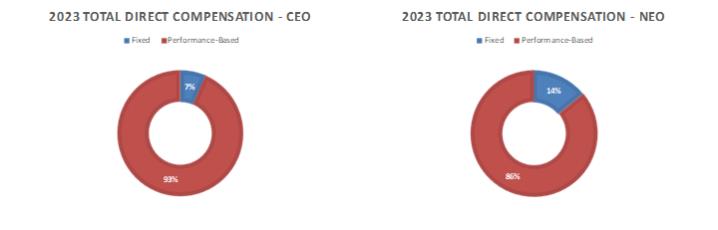
The “performance-based” pay component shown in the above graphs is the grant date fair value of equity awards granted to our NEOs during 2023, excluding the one-time performance-based awards to Ms. Davies and Mr. Andersen described below. The “fixed” pay component is the NEO’s 2023 base salary. For our NEOs other than Mr. Case, the actual performance-based percentage of total direct compensation ranged from 74% to 89%.

In addition to our focus on pay for performance, our executive compensation program is complemented by practices designed to mitigate compensation-related risk and align with the long-term interests of our shareholders:

Officer Share Ownership Guidelines

Our officer share ownership guidelines are designed to increase executives’ equity stakes in Aon and to align executives’ interests more closely with those of our shareholders. The guidelines provide that our Chief Executive Officer should attain an investment position in Class A Ordinary Shares equal to six times his annual base salary and all other senior executives, including each of our other NEOs, should attain an investment position in Class A Ordinary Shares equal to three times his or her annual base salary. The guidelines also establish equity retention rules generally requiring that net shares received through the exercise of share options, the vesting of restricted share units, and the vesting of PSUs are retained until the required investment position is achieved. Class A Ordinary Shares counted toward these guidelines include any shares owned outright, shares owned through an Aon-sponsored savings or retirement plan, shares purchased through an Aon-sponsored employee share purchase plan, shares obtained through the exercise of share options, and shares issued upon the vesting of restricted share units or PSUs. Each of our NEOs held the requisite number of shares under the guidelines as of December 31, 2023.

Mr. Case has agreed to maintain an investment position in Class A Ordinary Shares in excess of those required under our share ownership guidelines. In his employment agreement, he agreed to maintain an investment position equal to 20 times his annual base salary and was in compliance with this investment level as of December 31, 2023.

13


Hedging and Pledging

Policies

We have an insider trading policy which, among other things, specifically prohibits all employees, executive officers, and non-management directors from engaging in: short sales; publicly traded options; puts and calls; forward sale contracts; and other swap, hedging, and derivative transactions relating to our securities. The policy also specifically prohibits our executive officers and non-management directors from holding our securities in margin accounts or pledging our securities as collateral for a loan.

Independent Compensation Consultant

The Compensation Committee retains an independent compensation consultant to provide advice and market data to bolster the Compensation Committee’s decision-making.

Clawback Policy and

Forfeiture Provisions

We have adopted a revised Clawback Policy, which is applicable to our Section 16 officers, to address the recovery of incentive compensation in compliance with the requirements of the Dodd-Frank Act, the final SEC rules, and final applicable listing standards. Pursuant to the Clawback Policy, the Compensation Committee will seek recoupment with respect to covered incentive compensation paid to an executive officer if (i) the Company is required to prepare an accounting restatement due to material noncompliance with any financial reporting requirement, (ii) the amount of the covered compensation is calculated based upon the achievement of financial results that were subsequently the subject of such a restatement, and (iii) the amount received would have been lower if the financial results were properly reported. In addition to the Clawback Policy, unvested equity-based awards are also subject to forfeiture in the event of a material violation of the Company’s policies or procedures or a breach of applicable restrictive covenants. Further information on the Clawback Policy can be found in the section captioned “Clawback Policy and Forfeiture Provisions”. A copy of the Clawback Policy was filed as Exhibit 97.1 to the Original Filing.

The Executive Compensation Process

Process of Determining Executive Compensation

Management assists the Compensation Committee in developing and administering our executive compensation program. Direct responsibilities of management include, but are not limited to:

Recommending executive compensation adjustments, short- and long-term incentive awards, and other benefits, where applicable, for executive officers other than our Chief Executive Officer;

Providing ongoing review of the effectiveness of our executive compensation program and alignment of the program with our business and strategic objectives;

Designing and recommending appropriate amendments to our long-term and short-term cash and equity-based incentive plans for executives; and

Designing and recommending appropriate amendments to our employee benefit plans.

In the first quarter of 2023, our independent directors evaluated our Chief Executive Officer’s performance and compensation. At that time, the Compensation Committee also evaluated the performance and reviewed the compensation of our other executive officers. During this review, the Compensation Committee approved for each executive officer a target annual incentive for 2023 performance and the specific corporate performance metrics that our performance would be measured against for purposes of this incentive award. The Compensation Committee also approved in March 2023 a target number of PSUs to be awarded to each executive officer under the LPP.

As described in further detail below under “July 2023 Long-Term Performance-Based Awards,” on July 26, 2023, the Compensation Committee, after taking into account the recommendations of our Chief Executive Officer and the Compensation Committee’s independent compensation consultant, approved special, performance-based awards to the Company’s Executive Vice President and Chief Financial Officer and the Company’s President, in each case subject to the limits of our Shareholder-Approved Plan. These grants were designed to drive shareholder value creation and support leadership continuity, and can only be earned if we deliver significant stock price growth over the performance period while the recipients are continuously employed.

14


In early 2024, in connection with the Compensation Committee’s annual compensation review, management presented the Compensation Committee with compensation tally sheets reporting compensation paid for the prior four years and competitive pay data. The Compensation Committee also reviewed and considered Aon’s overall performance against targets that were established for 2023. This review culminated in certain compensation decisions made by the Compensation Committee with respect to our executive officers during the first quarter of 2024, which are described in more detail below.

Engagement of Independent Compensation Consultant

The Compensation Committee retains Meridian Compensation Partners, LLC (“Meridian”) as its independent compensation consultant. Meridian is engaged by, and reports directly to, the Compensation Committee, and advises on matters covered by the Compensation Committee’s Board-approved charter, while doing no work for management. Meridian typically participates in all Compensation Committee meetings and communicates with the Chair of the Compensation Committee and management between meetings. During 2023, Meridian assisted the Compensation Committee by: advising on our compensation philosophy, objectives, and strategy; reviewing the competitiveness and effectiveness of our senior executive and Board compensation levels and program structure; identifying our peer group for executive and Board compensation and Company performance review purposes; assessing potential compensation-related risks; providing change-in-control severance calculations for our NEOs in the 2023 annual proxy disclosure; providing compensation data from our peer group based on their proxy statements and other disclosures; reporting on executive-compensation related trends, say-on-pay governance, and regulatory initiatives; and reviewing and commenting on related disclosures. Management periodically retains other consulting firms to provide pay survey data and other non-executive compensation services.

The Compensation Committee has assessed the independence of Meridian pursuant to the SEC and NYSE rules and concluded that no conflict of interest exists that would prevent Meridian from serving as an independent consultant to the Compensation Committee.

How We Determine Compensation

The Compensation Committee generally targets a competitive level and mix of total direct compensation elements using market data as a reference point. For 2023, the Compensation Committee did not use a specific formula or comparative percentile targets to determine total compensation, individual components of compensation, or the relative mix of pay components, and the establishment of compensation levels in 2023 was not a mechanical process. Rather, the Compensation Committee used its judgment and business experience. The Compensation Committee’s overall intent was to evaluate the various elements of total compensation so that the emphasis of the Company’s compensation program was on its variable components of pay in the form of long-term equity awards and annual bonus award opportunities, and the amounts earned from such awards, which vary based on Aon’s performance.

Use of Tally Sheets

The Compensation Committee regularly reviews compensation tally sheets. The tally sheets assign dollar amounts to each component of the executives’ compensation, including base salary, annual incentives (target and actual), long-term incentives granted and outstanding, employee benefits (including health care and qualified and nonqualified retirement plans), relocation benefits, including income tax equalization, perquisites, and potential change in control severance payments. The tally sheets are presented to the Compensation Committee to help ensure that it is aware of all rewards components and the value of such components when making compensation decisions.

Involvement of Mr. Case in the Compensation Process

Each year, the Compensation Committee approves all elements of compensation for our NEOs and other executive officers (other than Mr. Case). These decisions are typically made during the annual compensation review process conducted in the first quarter of the year. The Compensation Committee solicits certain recommendations from Mr. Case and our Chief People Officer.

Mr. Case recommends to the Compensation Committee the annual long-term equity awards, annual incentive payments, base salary adjustments, and special, and other one-time awards, if any, for the executive officers who report directly to him. He has direct knowledge of the contributions made to Aon by these executive officers, and he shares this knowledge with the Compensation Committee and provides feedback on the performance of his direct reports.

15


During the annual review process, our Chief People Officer and the Chair of the Compensation Committee work together on Mr. Case’s annual evaluation report, which summarizes Mr. Case’s qualitative and quantitative performance for the year. The report is considered, along with other factors (including the Compensation Committee’s own assessment of Mr. Case’s performance, relevant market data, and Aon’s overall performance), in recommending Mr. Case’s compensation to the independent directors of the Board.

The Compensation Committee has the ultimate authority to make compensation decisions for our NEOs and other executive officers except for Mr. Case, whose compensation is approved by the independent directors of the Board. The Compensation Committee discusses its preliminary compensation decisions with independent members of the Board who do not serve on the Compensation Committee. As part of this process, these directors share their evaluations of the executives’ performance. The sharing of performance review information also aids the directors in carrying out their succession planning responsibilities. After considering input from those directors, the Compensation Committee makes its final determinations.

Mr. Case, together with our Chief People Officer and our Chief Financial Officer, makes recommendations to the Compensation Committee relating to directorthe performance targets to be established under Aon’s annual incentive and long-term equity incentive plans. The Compensation Committee reviews such recommendations with its independent compensation consultant and reserves the ultimate authority to set such targets and to determine whether such targets were achieved.

Result of Advisory Vote by Shareholders on Our “Say-on-Pay” Proposal

The Compensation Committee considered the results of the advisory vote by shareholders on the say-on-pay proposal presented to our shareholders at our 2023 annual general meeting. Shareholders demonstrated strong support for our executive compensation program in 2023, as evidenced by the approximately 92% of shareholder votes cast at our 2023 annual general meeting in support of the compensation program offered to our NEOs for 2022, as reported in our Current Report on Form 8-K, filed with the SEC on June 22, 2023. Accordingly, the Compensation Committee has continued its philosophy and approach with respect to our executive compensation program and practices in 2023.

Following the 2023 annual general meeting, we continued our shareholder outreach and engagement efforts. In the fall of 2023, shareholders representing approximately 32% of our shares outstanding, including seven of our largest shareholders, met with members of our senior management team, and in some instances, a member of the Compensation Committee, and discussed a variety of key themes, including executive compensation and corporate governance focus areas for the Board, such as strategy, capital allocation, and risks and opportunities around data privacy and cyber security, talent, and succession. These investors were generally supportive of the rationale for the July 2023 PSU grants and their designs, and in particular suggested expanded narrative disclosure around these grants and broader executive compensation decisions (which we have considered in preparing this Amendment).

Internal Pay Relationships

In determining an executive officer’s target annual incentive or long-term performance award value, the Compensation Committee will, from time to time, consider internal pay relationships. However, the Compensation Committee has not adopted a broad internal pay equity policy pursuant to which each executive officer’s compensation, or one or more components thereof, is related to or benchmarked against the compensation of other executive officers.

Analysis of Key 2023 Compensation Decisions

Peer Group

The Compensation Committee selects our executive compensation peer group based on a process that considers objective criteria including: industry segment; revenues, market capitalization, assets, and employee headcount; business complexity; and global footprint; as well as peers of our direct peers (“peers of peers”) and proxy-advisor compensation peer groups. The Compensation Committee’s goal is to have relevant market data to inform its decisions on pay levels and practices. As such, the Compensation Committee looks for peer-group balance with larger and smaller companies in a comparable range, and to have continuity through an annual review process.

Industry-related criteria used as guidelines for identifying peers include global financial services companies and major professional services firms that we compete with for executive talent and/or financial capital. Size-related criteria used as guidelines for identifying peers include companies that are one-fourth to four times our size in average market capitalization (calculated over the most recent eight quarters to reduce volatility) and in trailing four-quarter revenues, and that have latest year total assets less than $500 billion.

16


Our peer group members are reviewed on an annual basis with Meridian. In 2022, we reviewed our peer group and removed IHS Markit Ltd. due to its merger with S&P Global Inc. and added Equifax Inc. In 2023, we reviewed our peer group and concluded that no changes should be made to the peer group for 2024.

Our 2023 and 2024 peer group members are listed below.

2023 and 2024 Peer Group

Accenture plc

Equifax Inc.Northern Trust Corporation

A.J. Gallagher & Co.

Fidelity National Information Services, Inc.S&P Global Inc.

Automatic Data Processing, Inc.

Fiserv, Inc.State Street Corporation

Bank of New York Mellon Corp.

Marsh & McLennan Companies, Inc.Willis Towers Watson plc

BlackRock, Inc.

Moody’s Corporation

Cognizant Technology Solutions Corp.

Morgan Stanley

Base Salary

Using the peer group and executive officer compensation review processes outlined above, the Compensation Committee annually considers and reviews base salaries for our executive officers. Base salaries are adjusted periodically to, among other things, recognize changes in job responsibilities or bring the fixed component of an executive’s total compensation in line with his or her peers at the Company or the industry generally. Base salary adjustments generally take effect on April 1. In 2023, the Compensation Committee, consistent with the recommendations of our Chief Executive Officer, determined that no adjustments would be made to the base salary rates for our NEOs based on the above criteria.

Long-Term Leadership Performance Program under Our Shareholder-Approved Plan

The LPP is a sub-plan of our Shareholder-Approved Plan, which means that LPP awards are subject to plan terms approved by our shareholders. Each annual award granted under the LPP consists of PSUs that are eligible to vest over a three-year performance period based on achievement of cumulative adjusted diluted earnings per share targets over that period. The Compensation Committee historically has approved LPP awards for our NEOs each year. The three-year LPP performance cycles run concurrently, so we may have up to three active cycles during a given year. For example, during 2023, our NEOs held LPP 16, LPP 17, and LPP 18 awards (for the 2021-2023, 2022-2024, and 2023-2025 performance periods, respectively). This design is intended to ensure that our NEOs remain focused on long-term sustainable performance while providing the Compensation Committee with the ability to evaluate performance metrics on a regular basis. We do not pay dividends or credit dividend equivalents on PSUs.

During the first quarter of 2023, we granted PSUs to our executive officers, including each NEO, pursuant to LPP 18 (2023-2025 performance period). During the first quarter of 2024, we determined our actual levels of achievement under LPP 16 (2021-2023 performance period) and granted PSUs under LPP 19 (2024-2026 performance period).

LPP 18 Awards Granted in 2023

LPP 18 (2023 Grant for 2023-2025 Performance Period). This is our eighteenth annual three-year performance cycle for long-term incentive awards granted to our most senior leaders. The LPP is intended to further strengthen the relationship between wealth accumulation for our executives and long-term financial performance of the Company and increase in shareholder value, and the PSUs awarded under LPP 18 are payable (to the extent earned) in the form of Class A Ordinary Shares. The grant date value of the awards (at target) was determined and approved by the Compensation Committee. From that value, the number of target PSUs was calculated on the date of grant based on that day’s closing price for Class A Ordinary Shares on NYSE. The PSUs under LPP 18 will be earned and settled in a range of 0% (if the threshold level of performance is not achieved) to 200% of the target number of shares (if the maximum level of performance is achieved) based on the Company’s cumulative adjusted diluted earnings per share over the three-year performance period.

17


The performance results for LPP 18 will be measured against the three-year publicly reported cumulative adjusted diluted earnings per share target rate, subject to limited adjustments set forth in the plan documentation at the beginning of the three-year period. The adjustments are intended to exclude the impact of material and/or significant items, to provide a target that, while challenging, eliminates the impact of certain events and circumstances outside of the control of the relevant executive officers. The Compensation Committee’s selection under LPP 18 of the three-year performance period and cumulative adjusted diluted earnings per share financial performance metric is intended to provide the award recipients a reasonable period within which to achieve and sustain what are intended to be challenging long-term growth objectives. The Compensation Committee believes adjusted diluted earnings per share is a more effective measure of Company performance for purposes of motivating executive performance than diluted earnings per share calculated in accordance with U.S. GAAP, as the adjusted measure provides a target that is more within the executives’ control and area of accountability. Further, the Company believes that adjusted diluted earnings per share provides a perspective on the Company’s ongoing core operating performance that is consistent with how shareholders measure our success and that creates transparency and clarity for participants.

In determining the individual awards under LPP 18 granted in the first quarter of 2023, the Compensation Committee considered internal pay relationships, the award recipient’s compensation mix, and total direct compensation, including the recipient’s total direct compensation for 2022 relative to similarly situated executives at our 2023 peer group members. For further information regarding individual awards under LPP 18, see footnote (1) in the Summary Compensation Table below, and also the Grants of Plan-Based Awards in Fiscal Year 2023 below.

LPP 16 Awards Earned in 2023

LPP 16 (2021 Grant for 2021-2023 Performance Period). In early 2024, we determined the actual achievement under LPP 16. The performance period for LPP 16 ended on December 31, 2023.

LPP 16 PSUs (Performance Period 1/1/2021—12/31/2023)

      Metric  Threshold
(50% Payout)
   Target
(100% Payout)
   Maximum
(200% Payout)
 

Cumulative Adjusted EPS

  $31.23     $32.47   $35.72 
     Actual   $38.75 

For LPP 16, the cumulative adjusted diluted earnings per share goals from continuing operations ranged from a threshold level of $31.23, below which no payout would occur, to $35.72 or higher, which would yield shares equal to 200% of the target number. A result of $32.47 in cumulative adjusted diluted earnings per share from continuing operations would have yielded shares equal to 100% of the target number. This target performance represented a 12.3% increase over the target for LPP 15, the fifteenth cycle of our LPP established for the performance period from 2020 through 2022. Our actual cumulative adjusted diluted earnings per share from continuing operations for the three-year period of 2021-2023 was $38.75, resulting in a payout at 200% of the target number of shares awarded.

For the 2023 performance period associated with LPP 16, the Compensation Committee approved a discretionary downward adjustment to earnings per share (“EPS”) from continuing operations to remove the impact of incremental growth in fiduciary investment income over the prior year, which adjustment was permitted under the terms of the plan. Each NEO received a distribution under LPP 16.

July 2023 Long-Term Performance-Based Awards

On July 26, 2023, the Compensation Committee, taking into account the recommendations of Mr. Case and Meridian, approved special grants of PSUs (the “July 2023 PSUs”) to each of Christa Davies, the Company’s Executive Vice President and Chief Financial Officer, and Eric Andersen, the Company’s President, under our Shareholder-Approved Plan. In determining to grant the July 2023 PSUs, the Compensation Committee considered the objectives of our executive compensation program, including promoting leadership continuity, delivering against our key financial metrics, and driving significant shareholder value creation. Further, the Compensation Committee considered Ms. Davies’ continued leadership of the Company’s Aon Business Services strategy to drive efficiency, innovation, and client service across the Company, and Mr. Andersen’s performance and responsibility for driving the Company’s growth initiatives across its solution lines in approving these grants, which it viewed as “on-top” incentive opportunities. Consequently, the Compensation Committee set performance goals so that the July 2023 PSUs only would be earned and paid if commensurate exceptional, “on-top” performance is achieved. The Compensation Committee believed that the July 2023 PSUs would strengthen the Company’s Aon United strategy and promote the alignment of Ms. Davies’ and Mr. Andersen’s compensation and long-term shareholder value creation.

18


Each of Ms. Davies and Mr. Andersen were awarded 50,000 PSUs under the July 2023 PSUs, which at target convert on a one-to-one basis to Class A Ordinary Shares, with 0% to 200% of the target PSUs eligible to vest on March 31, 2028 (the “Vesting Date”), based on the price of the Class A Ordinary Shares from July 26, 2023 (the “Grant Date”) through the Vesting Date. None of the July 2023 PSUs will vest if the average closing price of Class A Ordinary Shares for the 90 consecutive trading days ending on the Vesting Date is below $475 (the “Performance Hurdle”), which was well in excess of the average closing price of $325.08 preceding the grant. Subject to achieving the Performance Hurdle, the percentage of July 2023 PSUs to vest will be based upon the highest trading day average closing price of the Class A Ordinary Shares for any 90 consecutive trading days during the Performance Period (the “Average Share Price”), as follows: (i) entry (50%) if the Average Share Price is $475, (ii) target (100%) if the Average Share Price is $500 and (iii) stretch (200%) if the Average Share Price is at least $550. If Average Share Price is between the entry, target, and stretch levels, a proportionate number of the July 2023 PSUs between those levels will be earned.

The July 2023 PSUs will be forfeited in the event of the recipient’s retirement or voluntary resignation, including for good reason, prior to the Vesting Date. Additional information about the termination and change in control provisions of the July 2023 PSUs is set forth in the section captioned “Potential Payments and Benefits on Termination or Change in Control” contained in this Amendment under “July 2023 PSUs”.

The July 2023 PSUs are not part of Ms. Davies’ or Mr. Andersen’s regular annual compensation and will not be awarded on a recurring basis. The July 2023 PSUs have the following features that align with shareholders’ interests:

Long-term – the awards have a five-year term, which is longer than our regular annual long-term incentive awards.

Performance-based – shares are only earned if and to the extent rigorous share price hurdles are met.

Reasonably-sized – the awards represent approximately 20% of Ms. Davies’ and 22% of Mr. Andersen’s total target annual compensation on an annualized basis.

Subject to conservative termination provisions – vesting is subject to continuous service and the awards will be forfeited in the event of retirement or voluntary resignation, including for good reason.

Subject to clawback – the awards are subject to forfeiture and clawback provisions.

Annual Incentive Awards under Our Shareholder-Approved Plan

Annual Incentives. Under our Shareholder-Approved Plan, the Compensation Committee annually approves the framework for our annual incentive compensation plan, including the applicable Aon-wide performance metric and minimum achievement threshold against that performance metric. If the threshold level performance metric is not achieved, then no annual incentives are payable under our Shareholder-Approved Plan. If the minimum achievement threshold is achieved, then our Shareholder-Approved Plan allows for the payment of current-year annual incentives to each of our executive officers up to a cap of the lesser of $10 million or the maximum annual incentive otherwise established by the Compensation Committee for each executive officer. Our Chief Executive Officer retains the discretion to approve increases (up to 10%, subject to Compensation Committee consent) and decreases (up to 20%, not subject to consent) in the size of the incentive pool. However, no individual may receive an award in excess of the maximum amount established by the Compensation Committee (two times his or her target annual incentive).

19


In the first quarter of 2023, the Compensation Committee set target 2023 annual incentive opportunities for our NEOs in the context of their total compensation opportunity considering the performance and growth of the NEOs in both capability and scope against the competitive market for top talent. For each NEO, annual incentive opportunities were set as a target percentage of the executive’s base salary at year end (and, for Ms. Davies, including her annual foreign service allowance received in connection with her relocation to London). The target annual incentives for each of our NEOs for 2023 remained unchanged from 2022, and are shown in the table below:

NEO  2022 Target as %
of Base Salary
 2023 Target as %
of Base Salary
 2023 Target Annual
Incentive

Gregory C. Case

  250% 250% $3,750,000

Christa Davies

  200% 200% $2,740,000

Eric Andersen

  200% 200% $2,500,000

Lisa Stevens

  150% 150% $1,500,000

Darren Zeidel

  100% 100% $  900,000

As explained below, for 2023, the Compensation Committee used a framework (the “Senior Executive Incentive Compensation Plan”) for determining actual annual incentives to be earned if the metric under our Shareholder-Approved Plan was achieved.

2023 Performance Metrics. In the first quarter of 2023, the Compensation Committee determined that 2023 Aon-wide performance would be measured by two components. First, 80% of the performance would be measured by the growth in our adjusted operating income (“OI”) for 2023 as compared to a 2022 baseline adjusted OI number of $3,840 million, greater than a 200-bps hurdle. The Compensation Committee retained the discretion to further adjust OI for material and/or significant items. The Compensation Committee selected OI as the primary measure to emphasize performance of Aon as a whole and link executives’ awards to Aon’s key business initiatives.

Second, 20% of the performance would be measured by the Compensation Committee’s assessment of the Company’s progress against quantitative goals in the recruitment, promotion, education, and representation strategy pillars on a firm-wide basis, as determined by the Inclusion & Wellbeing Sub-Committee and the Compensation Committee (the “People & Culture” component). This component is intended to be leveraged (0% to 200%), and success is measured by examining the number of pre-established goals met and the degree of over- or under-performance across the goals established by the Compensation Committee. This assessment is made in consultation with the Inclusion & Wellbeing Sub-Committee.

In addition, the Compensation Committee set a minimum achievement threshold at 70% of the 2022 adjusted OI, or $2,688 million. The Compensation Committee set the minimum threshold at 70% because it believed performance below that level would not create enough value for the Company’s shareholders and, therefore, should not result in annual incentive payments. If the minimum achievement threshold is satisfied, an annual incentive pool may be funded as described below under “Determining 2023 Annual Incentives.”

2023 Actual Performance. The Company’s adjusted OI for 2023 was $4,223 million for purposes of determining 2023 annual incentives, which exceeded the minimum threshold of 70% established under our Shareholder-Approved Plan. The $4,223 million of adjusted OI was 10.0% greater than 2022 adjusted OI of $3,840 million, or 8.0% greater than our 200-bps hurdle, resulting in a performance factor of 108.0% for the financial component. The Compensation Committee reviewed the Company’s progress against a robust set of goals demonstrating progress in our People & Culture component, and determined that the Company progressed on its objectives, including (1) advancing representation in senior leadership roles for women globally and for racially diverse leaders in the United States, (2) surpassing its goals with respect to promotions of racially diverse leaders in the United States, (3) advancing its recruitment of candidates from diverse backgrounds in the United States, and (4) significantly exceeding its learning goals for all colleagues on inclusion topics. Based on its assessment of progress around these goals, the Compensation Committee determined that the performance factor was 113% for the People & Culture component.

Determining 2023 Annual Incentives. In accordance with our Shareholder-Approved Plan, the Senior Executive Incentive Compensation Plan (“SEICP”) would not be funded for 2023 unless Aon achieved the minimum threshold of 70% of the 2022 baseline OI. After determining that this minimum threshold had been achieved, the Compensation Committee met in February 2024 to determine the funding status of the SEICP pool for 2023. After application of the formula guidelines described above, the total incentive pool reserved for participating members of the Company’s senior management team (including our NEOs) was determined to be approximately $14.5 million, or 109% of target. In determining annual incentives for our NEOs, the Compensation Committee (or, with respect to Mr. Case, the independent members of the Board) considered Mr. Case’s compensation recommendations for the NEOs (other than himself), business and financial results, individual delivery of key strategic initiatives and personal leadership qualities.

20


Mr. Case. The independent directors of the Board determined that, under Mr. Case’s leadership, the Company delivered continued strong progress across the four key financial metrics that we report to shareholders: organic revenue growth, adjusted operating margin, adjusted diluted earnings per share, and free cash flow. Organic revenue growth was 7%, operating margin on an adjusted basis increased 80 basis points to 31.6%, adjusted diluted earnings per share increased 6% to $14.14, and free cash flow increased to $3.2 billion. During 2023, the firm returned nearly $3.2 billion of capital to shareholders through share repurchases and dividends. Under Mr. Case’s leadership, Aon announced its 3x3 Plan to drive our Aon United strategy, bringing together Risk Capital and Human Capital, strengthening the Aon Client Leadership model, and accelerating service delivery and innovation through Aon Business Services. His leadership was instrumental in progress made on key strategic initiatives to support the plan, including the $900 million cash restructuring charge to accelerate our Aon Business Services strategy and optimize our workforce, and a definitive agreement to acquire leading middle-market broker, NFP. Mr. Case led execution of these initiatives while continuing to navigate a dynamic external economic environment, the ongoing competitive talent market, and other challenges to achieve continued record-high colleague engagement, retention rates above pre-pandemic levels, and meaningful progress on inclusion and diversity initiatives.

Ms. Davies. The Compensation Committee determined that Ms. Davies’ individual efforts contributed substantially to the Company’s strong business and financial results in 2023, including the four key financial metrics that we report to shareholders: organic revenue growth, adjusted operating margins, adjusted diluted earnings per share, and free cash flow. Her leadership around operating income growth and working capital improvement meaningfully contributed to the firm’s $3.2 billion free cash flow and 23.8% free cash flow margin. Further, she led our disciplined approach to capital allocation, realizing the completion of $2.7 billion in share repurchase and a 33.1% return on invested capital. Ms. Davies was heavily engaged in developing the 3x3 Plan to accelerate our Aon United strategy and led key strategic initiatives including accelerating Aon Business Services and the related restructuring program, the expected acquisition of NFP, and ongoing outreach to shareholders to effectively communicate strategy and financial results. Ms. Davies continues to lead with a focus on inclusion in colleague interactions and the development of key talent, inspiring multiple senior leaders to similarly take actions.

Mr. Andersen. The Compensation Committee determined that Mr. Andersen’s individual efforts contributed substantially to the Company’s strong business and financial results in 2023, including the four key financial metrics that we report to shareholders: organic revenue growth, adjusted operating margins, adjusted diluted earnings per share, and free cash flow. Mr. Andersen’s leadership was essential to delivering impressive, double-digit organic revenue growth in two solution lines, including 10% in each of Health Solutions and Reinsurance Solutions, as well as 5% in Commercial Risk Solutions and 4% in Wealth Solutions. Mr. Andersen led ongoing development of the future Aon United strategy through the 3x3 Plan and drove ongoing progress on our Risk Capital and Human Capital strategies and the Aon Client Leadership model within the plan, as well as leading work to sign the definitive agreement to acquire NFP. Mr. Andersen’s leadership was instrumental in supporting colleague engagement and retention in a competitive talent marketplace, and in setting a standard for inclusive leadership with business leaders.

Ms. Stevens. The Compensation Committee determined that Ms. Stevens’ individual efforts contributed substantially to Company’s strong business and financial results, as well as the development of the 3x3 Plan and to the attraction, retention, and motivation of leading talent. These and other actions have allowed us to maintain record-high colleague engagement and retention in a competitive talent market, and providing enhanced support to people leaders and managers, driving exceptional results in these dimensions on our annual colleague support survey. Ms. Stevens’s contributions include strategic workforce planning, managing hiring and attrition in line with business demand, reshaping and redeploying colleagues for maximum impact and alignment with client demand, and building longer-term infrastructure around skills-based hiring and development. She has also helped introduce enhanced learning and development models, particularly for early career colleagues and high-potential leaders.

21


Mr. Zeidel. The Compensation Committee determined that Mr. Zeidel’s individual efforts in driving legal and compliance operational initiatives, advancing the firm’s commercial initiatives, and promoting enhancements to compliance and risk management practices across the firm enabled the Company’s strong business and financial results in 2023. Mr. Zeidel enhanced the firm’s approach to negotiation and standardization of commercial terms and implemented improvements to the management of compliance risk globally, including efforts to enhance compliance and risk management practices involving privacy and other evolving and complex regulatory regimes. Mr. Zeidel also provided extraordinary effort and helped lead work to sign the definitive agreement to acquire NFP and has continued that effort and leadership as we move toward consummating the transaction. He has provided ongoing counsel and leadership with respect to our inclusion and engagement initiatives. Mr. Zeidel has been a passionate advocate for underserved communities and under his leadership, the firm’s law and compliance department has led community service and pro bono initiatives, including in the areas of criminal justice, disability law, and asylum.

Adjustment of 2023 Annual Incentives. As part of the annual review process, Mr. Case proposed to the Compensation Committee that he and the other participants in the Senior Executive Incentive Compensation Plan receive annual incentives below the target amounts for fiscal year 2023. While we achieved strong performance as highlighted above, this recommendation was made to more rigorously reflect and further align our pay-for-performance executive compensation philosophy with the high expectations for overall Company performance. Following their review of individual NEO performance, the Compensation Committee (and the Board, in the case of Mr. Case) determined that each NEO receive 68% of his or her target annual incentive, other than Mr. Zeidel, who received an annual incentive of 96% of his target. For 2023, annual incentive awards to our NEOs were paid out entirely in PSUs, vesting on similar terms as LPP 19 awards, subject to attainment of a share price hurdle, except that Mr. Zeidel received a portion ($250,000) of his earned annual incentive in cash. As we embark on the 3x3 Plan, we remain exceptionally well-positioned to deliver results in 2024 and in the future.

The following table sets forth the actual annual incentive awarded to each of our NEOs under the Senior Executive Incentive Compensation Plan for the year:

 NEO  2023 Actual Annual
Incentive

Gregory C. Case

   $2,550,000

Christa Davies

   $1,863,200

Eric Andersen

   $1,700,000

Lisa Stevens

   $1,020,000

Darren Zeidel

   $862,000

Executive and Relocation Benefits

Executive Benefits. In addition to the broad-based employee benefit programs that are available to our employees generally (such as health coverage, 401(k) plan, etc.), each of our NEOs is eligible to participate in a deferred compensation program and a supplemental savings plan. Only Mr. Andersen participates in our defined benefit pension plan and the supplemental pension program (each of which are frozen to new participation) because each other NEO was hired after the Aon pension plan was closed to new hires in 2004. Additional information regarding these qualified and nonqualified plan benefits is set forth under the headings “Compensation“Pension Benefits in Fiscal Year 2023” and “Nonqualified Deferred Compensation in Fiscal Year 2023” contained in this Amendment. We also provide an executive health screening program available to all of our NEOs and certain other members of our senior management team.

Relocation Benefits. In 2023, we continued to provide benefits to Mr. Case and Ms. Davies for their continued agreement to perform services primarily at the Company’s global operational headquarters in London. The Aon group global operational headquarters remained in London following the Company’s reorganization as a public company organized under the laws of Ireland in April 2020 term not used elsewhere, while parent company Aon plc is resident in Dublin. Relocation benefits are customary for expatriate assignments for us and other employers in our industry, and the Compensation Committee Report,approved certain benefits for Mr. Case and Ms. Davies after consulting with its independent compensation consultant. Each relocated NEO has signed an international assignment letter with Aon that sets forth the relocation benefits available to him or her. The Compensation Committee periodically reviews the relocation packages of Mr. Case and Ms. Davies. These benefits are provided pursuant to international assignment letters with Mr. Case and Ms. Davies, which are described in more detail under the heading “International Assignment Letters.”

22


The compensation received in the form of such benefits is reflected in the Summary Compensation Table for Fiscal Years 2023, 2022, and 2021.

Post-Termination Compensation

We believe that providing severance and change in control severance benefits is important to recruit talented employees and secure the continued employment and dedication of our existing employees. A significant number of the companies with which we compete for talent have similar arrangements in place for their senior executives. While we consider these benefits to be important, the terms of these benefits are not considered as part of the compensation strategy when the Compensation Committee annually determines the compensation for the NEOs. Additional information about post-termination compensation is set forth in the section captioned “Potential Payments and Benefits on Termination or Change in Control” contained in this Amendment.

Severance Benefits Upon Change in Control. Our NEOs, other than Mr. Case, are eligible for change in control severance benefits under our Senior Executive Combined Severance and Change in Control Plan (referred to throughout this CD&A and the accompanying compensation tables as the “Combined Severance Plan”). The Combined Severance Plan provides that covered executives would receive certain severance benefits upon qualifying terminations of employment in connection with or within two years following a change in control of Aon. Thus, the Combined Severance Plan requires a “double trigger”—a qualifying change in control of Aon and a qualifying termination of the executive’s employment—for severance benefits to become payable. Mr. Case, who is not covered under the Combined Severance Plan, is party to an individual change in control severance agreement with the Company that also provides certain severance benefits upon a qualifying termination in connection with or within two years following a change in control of Aon. Neither the Combined Severance Plan nor Mr. Case’s individual agreement provides for excise tax gross-up protection in the event the executive becomes subject to tax under Section 280G of the Internal Revenue Code of 1986, as amended (the “Code”) in connection with such change in control of Aon.

Additional information regarding the change in control arrangements for our NEOs is set forth in the section captioned “Potential Payments and Benefits on Termination or Change in Control” contained in this Amendment.

Severance Benefits Pursuant to Employment Agreements and Combined Severance Plan. We have entered into agreements with certain executive officers that provide for post-employment severance benefits and transitional compensation if the officer’s employment terminates for a qualifying event or circumstance unrelated to a change in control of Aon, such as being terminated without “cause,“Compensationas such term is defined in the applicable operative agreement.

In the case of Mr. Andersen, we entered into an employment agreement with him on July 26, 2023, pursuant to which he will continue to serve as President of the Company and Aon Corporation. Additional information about Mr. Andersen’s employment agreement is provided in the section captioned “Summary Compensation Table for Fiscal Years 2023, 2022 and 2021” in this Amendment under “Mr. Andersen’s Employment Letter and Agreement” and in the section captioned “Potential Payments and Benefits on Termination or Change in Control” under “Employment Agreement with Mr. Andersen.”

To the extent that our NEOs are not party to an individual employment agreement providing for severance benefits, those individuals are eligible to receive severance benefits under the Combined Severance Plan. During 2023, each of our NEOs had an employment agreement or letter providing for severance benefits or was eligible to receive severance benefits under the Combined Severance Plan. Additional information regarding such post-employment severance or transitional compensation for Mr. Case and the other NEOs is set forth in the section captioned “Potential Payments and Benefits on Termination or Change in Control” contained in this Amendment.

23


Risk Assessment of Compensation Policies and Practices

We believe that we maintain an appropriate level of prudence associated with our compensation practices and will continue to do so. We engage in a process to evaluate whether our executive and broad-based compensation programs contribute to unnecessary risk-taking. This includes a detailed annual assessment by the Compensation Committee’s independent consultant. We concluded that the risks arising from these programs are not reasonably likely to have a material adverse effect on the Company. In the first quarter of 2024, Meridian independently assessed our compensation practices for 2023 and concluded that they reflect appropriate balance and incorporate appropriate policies and oversight to mitigate imprudent risk-taking.

Compensation Committee Report

The Organization and Compensation Committee of the Board has reviewed and discussed with management the Compensation Discussion and Analysis required by Item 402(b) of Regulation S-K and “Executive Compensation”set forth in this Amendment.

Based on its review and discussions with management, the Organization and Compensation Committee recommended to the Board that the Compensation Discussion and Analysis be included in this Amendment and thereby incorporated into Aon’s Annual Report on Form 10-K for the year ended December 31, 2023.

The Compensation Committee’s report is provided by the Organization and Compensation Committee, which is composed entirely of the following independent directors:

Richard C. Notebaert, Chair

Cheryl A. Francis

Jin-Yong Cai

Byron O. Spruell

Jeffrey C. Campbell

Carolyn Y. Woo

24


Executive Compensation Tables

The executive compensation disclosure contained in this section reflects compensation information for the years ended December 31, 2023, December 31, 2022, and December 31, 2021, with respect to our NEOs for all years in which each NEO served in that capacity. The following Summary Compensation Table contains compensation information for the following NEOs: (1) Mr. Case, who served as our Chief Executive Officer during 2023, (2) Ms. Davies, who served as our Chief Financial Officer during 2023, and (3) Mr. Andersen, Ms. Stevens, and Mr. Zeidel, who were our three other most highly compensated executive officers serving as of December 31, 2023.

Summary Compensation Table for Fiscal Years 2023, 2022 and 2021

Name and Principal

Position

  Year  Salary
($)
  Bonus
($)
  Stock
Awards
($)(1)
  Option
Awards
($)
  Non-Equity
Incentive Plan
Awards
($)(2)
  Change in
Pension Value
and
Nonqualified
Deferred
Compensation
Earnings
($)
  All Other
Compensation
($)(3)
  Total ($)

Gregory C. Case

    2023    1,500,000        21,487,348                674,485    23,661,834

Chief Executive Officer

    2022    1,500,000        17,497,455                671,530    19,668,985
    2021    1,500,000        15,262,436        2,437,500        668,448    19,868,384

Christa Davies

    2023    1,250,000        25,042,451                5,340,367    31,632,818

Executive Vice President and

Chief Financial Officer

    2022    1,250,000        7,608,231                3,130,577    11,988,808
    2021    1,000,000        8,313,103        1,365,000        4,536,093    15,214,195

Eric Andersen

    2023    1,250,000        23,356,614            108,811    50,022    24,765,447

President

    2022    1,250,000        6,056,776                56,912    7,363,688
    2021    1,000,000        6,381,328        1,218,750        43,450    8,643,528

Lisa Stevens

    2023    1,000,000        5,269,440                36,446    6,305,886

Executive Vice President and

Chief People Officer

    2022    1,000,000        3,365,712                33,147    4,398,859
    2021    900,000        2,106,188        780,000        34,960    3,821,148

Darren Zeidel

    2023    900,000        2,573,886        250,000        37,695    3,761,581

Executive Vice President, General Counsel and Company Secretary

    2022    900,000        1,885,973                37,140    2,823,113


2021


    750,000        1,534,728        585,000        29,100    2,898,828

(1)

The amounts shown reflect the aggregate grant date fair value (determined in accordance with Financial Accounting Standards Board Accounting Standards Codification Topic 718, Compensation—Stock Compensation (“ASC Topic 718”)) of restricted share unit awards (paid in satisfaction of all or part of each NEO’s annual incentive award for the previous performance year) and performance share unit awards granted to our NEOs pursuant to our Shareholder-Approved Plan in 2023 and, where applicable, 2022, and 2021. These amounts disregard adjustments for forfeiture assumptions and do not reflect amounts actually paid to, or realized by, the NEOs in the years shown, or any prior years.

LPP Awards. In 2021-2023, each of our NEOs received awards of PSUs under the LPP (and, in the Proxy Statement,case of Mr. Case, also in satisfaction of a portion of his annual incentive from the previous year) with grant date fair values as set forth in the table below.

25


 Name  Year  Grant Date Fair Value of
Performance Share Unit Awards
Assuming Probable Outcomes
Under LPP
($)
  Grant Date Fair Value of
Performance Share Unit Awards
Assuming Achievement of
Maximum Performance Levels
Under LPP
($)
   

Gregory C. Case

    2023    19,293,739    38,587,479   
    2022    17,497,455    34,994,910   
    2021    14,054,964    28,109,929   

Christa Davies

    2023    7,839,084    15,678,167   
    2022    6,873,311    13,746,622   
    2021    7,613,019    15,226,039   

Eric Andersen

    2023    6,369,181    12,738,362   
    2022    5,400,548    10,801,096   
    2021    5,856,437    11,712,874   

Lisa Stevens

    2023    3,919,542    7,839,084   
    2022    2,945,838    5,891,676   
    2021    1,756,260    3,512,521   

Darren Zeidel

    2023    1,763,823    3,527,647   
    2022    1,570,927    3,141,854   
    2021    1,219,656    2,439,312   

July 2023 PSUs. On July 26, 2023, the Compensation Committee approved special grants of PSUs to each of Ms. Davies and all suchMr. Andersen with grant date fair values, assuming probable outcomes, of $14,737,500 each.

For awards granted under the LPP and the July 2023 PSUs, the grant date fair value of PSUs is calculated in accordance with ASC Topic 718 based on the probable outcome of the performance conditions at the time of grant. See Note 12 “Share-Based Compensation Plans” of the Notes to Consolidated Financial Statements in Part II, Item 8 of the Original Filing for information regarding assumptions underlying the valuation of equity awards. Set forth above are the grant date fair values of the PSUs granted under the LPP and the July 2023 PSUs, calculated assuming (i) the probable outcome of the performance conditions for each program, which amount is incorporated herein by reference.

included in the “Stock Awards” column of this Summary Compensation Table and (ii) for units granted under the LPP, achievement of the maximum levels of performance. No maximum amounts are reflected for the July 2023 PSUs because the threshold performance level has not been achieved. The material incorporated herein by referenceamounts shown in the tables above reflect the aggregate grant date fair value for these awards computed in accordance with ASC Topic 718, and do not correspond to the information setactual value that will be recognized by our NEOs.

(2)

The amounts shown in the “Non-Equity Incentive Plan Compensation” column for each of 2023, 2022, and 2021 reflect the cash portion of the annual incentive awards earned by the NEOs for performance in those years. For 2021, 65% was paid in the form of cash and 35% was paid in the form of restricted share units (reported in the “Stock Awards Column”), except that Mr. Case received 35% in the form of PSUs. For 2022, 100% was paid in the form of restricted share units, except that Mr. Case received 65% in the form of restricted share units and 35% in the form of PSUs. For 2023, other than for Mr. Zeidel, 100% was paid in the form of PSUs with terms similar to LPP 19 awards, except that such units are also subject to attainment of a share price hurdle. For Mr. Zeidel, in addition to the PSUs, he received a portion ($250,000) of his annual incentive in cash. All amounts shown in this column were actually paid or granted to the NEOs in the first quarter of the year following the relevant performance year, which, for annual awards settled in share units, causes the amounts to be reflected as stock awards in the Summary Compensation Table two years following the relevant performance year.

(3)

For 2023, the amounts reported as “All Other Compensation” consist of the following components:

 Name  Company
Contributions
($)(a)
  Perquisites
($)(b)
  Other
($)(c)
  Tax
Reimbursements
($)(d)
  Total ($)   

Gregory C. Case

    31,650    28,322    614,513        674,485   

Christa Davies

    31,650    86,260    527,510    4,694,947    5,340,367   

Eric Andersen

    31,650    18,372            50,022   

Lisa Stevens

    28,250    8,196            36,446   

Darren Zeidel

    29,950    7,745            37,695   

(a)

The amounts shown in the “Company Contributions” column represent, for each of our NEOs, (i) a contribution by Aon of $21,450 for each of Mr. Case, Ms. Stevens, and Mr. Zeidel, and $21,150 for each of Ms. Davies and Mr. Andersen to the Aon Savings Plan, our qualified defined contribution plan; and (ii) a contribution by Aon of $10,200 for Mr. Case, $10,500 for each of Ms. Davies and Mr. Andersen, $6,800 for Ms. Stevens, and $8,500 for Mr. Zeidel to the Aon Supplemental Savings Plan, a nonqualified defined contribution plan.

(b)

Mr. Case and Ms. Davies have agreed to provide services primarily at Aon’s London, U.K. headquarters. They are each provided relocation packages that are intended to keep them “whole” on a total rewards basis, be transparent and equitable, and reflect competitive practices and benchmarks of industry counterparts. This column also includes amounts Aon paid to third parties for Ms. Davies’ eligible dependents’ schooling or assistance in preparing her tax returns in connection with her international assignment.

In 2023, the Company provided perquisites to Ms. Davies related to the assignment of $54,914 for schooling assistance and $31,346 for tax preparation services.

26


For a description of cash allowances and cash bonuses paid to our NEOs in connection with the international assignments, see footnote (c) below.

All NEOs except Ms. Davies participated in Aon’s executive health screening program in 2023. The actual cost to Aon of the NEO’s use of this program was $7,687 for Mr. Case, $5,000 for Mr. Andersen, $4,356 for Ms. Stevens, and $6,620 for Mr. Zeidel.

As part of Mr. Case’s employment agreement, Aon provides him with life insurance coverage in the amount no less than $5,000,000 during the term of his agreement. This amount reflects the cost above and beyond the cost of life insurance that is provided to a typical Aon employee. For 2023, the cost was $20,635.

Ms. Stevens received reimbursement for club dues of $3,840. Mr. Andersen received an annual car allowance of $12,000.

We maintain an arrangement with NetJets for use of chartered aircraft and associated ground travel as necessary. Infrequently, a NEO will use a NetJets flight for personal purposes, or the spouse or guests of a NEO may accompany the executive when a NetJets flight is already going to a specific destination for a business purpose. In the case of a personal flight, the cost to the Company of such flight is reimbursed to the Company by the NEO. In the case of a spouse or other guest on a business flight, this has a minimal cost to the Company and, where applicable, the variable costs associated with the additional passenger are included in determining the aggregate incremental cost to the Company. No amounts were included in the Summary Compensation Table this year with respect to such aircraft.

(c)

In connection with their international assignment to London, U.K., Mr. Case and Ms. Davies are entitled to additional cash compensation in accordance with the terms of their international assignment letters and our relocation programs. The following table sets forth the additional compensation received by them with respect to 2023 service:

 Name  

Housing
Allowance

($)


Cost of
Living
Allowance

($)


Foreign
Service
Allowance

($)


Transportation

Allowance

($)


Total

($)


 Gregory C. Case

   382,013    97,500    135,000        614,513 

 Christa Davies

   286,510    97,500    120,000    23,500    527,510 

(d)

In connection with her international assignment, Ms. Davies is entitled to receive a tax equalization benefit designed to equalize the income tax paid by her so that her total income and social tax costs related to any earnings from the Company while on the international assignment (including earnings related to granting or vesting of equity-based awards) will be no more than an amount she would have paid had all of the earnings been taxable solely pursuant to U.S. income tax laws.

The tax equalization benefit caps the executive’s total income tax exposure to what she would be taxed on earnings from the Company under the heading “Compensation Committee Report”U.S. tax laws (as compared to the U.K. tax laws as in the Proxy Statement shall be deemed furnished,existence from time to time). This policy is designed and not filed, in this Form 10-K and shall not be deemed incorporated by reference into any filing under the Securities Act of 1933, as amended, or the Exchange Actintended to yield neither an economic benefit nor detriment to Ms. Davies as a result of her international assignment.

For Ms. Davies, any applicable schooling assistance and allowances for foreign service, housing, cost of living, home leave, and transportation are grossed up for applicable U.S. taxes.

The amounts shown in the “All Other Compensation” table represent Aon’s calculation of the excess U.K. taxes paid above the hypothetical tax that Ms. Davies would have paid had she not been relocated to London, U.K. and the amount paid by Aon to neutralize the tax impact on Ms. Davies with respect to eligible relocation compensation.

Employment Agreements and Other Compensation Agreements

Mr. Case’s Employment Agreement

We are party to an employment agreement with Mr. Case pursuant to which he serves as our Chief Executive Officer. The current term of Mr. Case’s agreement continues through April 1, 2028, unless terminated earlier or extended. The agreement also provides that Mr. Case will be nominated for re-election as a member of the Board at each annual general meeting of shareholders during the period of his employment.

Mr. Case’s employment agreement provides for an initial base salary of $1,500,000, subject to adjustment at the discretion of the Board, and a target annual incentive bonus of not less than 200% of base salary, subject to the provisions of our Shareholder-Approved Plan. The Board retains the discretion to determine Mr. Case’s actual bonus payment. In the first quarter of 2022, the Compensation Committee performed its annual compensation review (as described above under “The Executive Compensation Process”) and adjusted Mr. Case’s target annual incentive to 250% of base salary.

27


In addition, Mr. Case’s agreement provides that he will be provided with life insurance coverage in an amount equal to no less than $5,000,000 during the term of the agreement. Under the agreement, Mr. Case has also agreed to maintain an investment position in Class A Ordinary Shares equal to no less than 20 times his annual base salary.

Ms. Davies’s Employment Agreement

We are party to an employment agreement with Ms. Davies pursuant to which she serves as our Executive Vice President and Chief Financial Officer. The current term of Ms. Davies’s agreement continues through April 1, 2026, unless terminated earlier or extended. The agreement provides for an initial base salary and a target annual incentive bonus of her base salary and foreign service allowance. In the first quarter of 2022, the Compensation Committee performed its annual compensation review (as described above under “The Executive Compensation Process”) and adjusted Ms. Davies’s base salary to $1,250,000 and target annual incentive to 200% of base salary.

On April 1, 2024, Ms. Davies notified the Company of her intention to retire from the position of Chief Financial Officer. Ms. Davies will continue to serve as Chief Financial Officer into the third quarter of 2024 and will thereafter remain at the Company as a senior advisor for a transition period into 2025.

Mr. Andersen’s Employment Agreement and Letter

We are party to an employment agreement with Mr. Andersen, effective July 1, 2023, pursuant to which he serves as President of the Company and Aon Corporation. The current term of Mr. Andersen’s agreement continues until June 30, 2026, unless earlier terminated or extended. The employment agreement supersedes Mr. Andersen’s employment letter confirming certain terms and conditions of his at-will employment dated as of May 11, 2018. Mr. Andersen’s agreement provides for an initial base salary of no less than $1,250,000 per year, and a target annual incentive of no less than 200% of his base salary. The agreement also provides for the grant of the July 2023 PSUs.

Ms. Stevens’s Employment Letter

We have provided Ms. Stevens an employment letter pursuant to which she serves as our Executive Vice President and Chief People Officer. The letter provides that Ms. Stevens’s continued employment with us is on an at-will basis, and that she is eligible to participate in our Combined Severance Plan. Ms. Stevens’s letter also provides for an initial base salary, which has subsequently been adjusted to $1,000,000 by our Compensation Committee as permitted under the letter, a target annual bonus of 100% of her base salary, which has subsequently been adjusted to 150% by our Compensation Committee as permitted under the letter, and an initial target long-term incentive award of 150% of her base salary.

Mr. Zeidel’s Employment Letter

We have provided Mr. Zeidel an employment letter pursuant to which he serves as our Executive Vice President, General Counsel, and Company Secretary. The letter provides that Mr. Zeidel’s continued employment with us is on an at-will basis, and that he is eligible to participate in our Combined Severance Plan. Mr. Zeidel’s letter also provides for an initial base salary, which has subsequently been adjusted to $900,000 by our Compensation Committee as permitted under the letter, a target annual bonus of 100% of his base salary, and an initial target long-term incentive award of 150% of his base salary.

International Assignment Letters

In connection with their agreeing to provide services primarily at Aon’s London global operational headquarters, we entered into international assignment letters with each of Mr. Case and Ms. Davies. These letters describe the international assignments and set forth the relocation benefits to the executives, which are described below. The letters are not intended to diminish the rights of the executives under their current employment arrangements; however, the letters provide by their terms that the executives’ acceptance of their international assignments, and repatriation thereafter, will not give rise to any right to terminate for good reason (as such term is defined in the applicable executive’s employment agreement, if applicable).

28


The letters for Mr. Case and Ms. Davies were amended and extended in July 2014 for an additional two years, in July 2016 for an additional two years, and on each July 1 of 2018 through 2023 for an additional year.

Depending on each executive’s personal circumstances, and as disclosed in the tables above, the relocation packages, as amended, generally provide some or all of the following benefits:

a monthly housing allowance of approximately $31,834 for Mr. Case and $23,876 for Ms. Davies;

a monthly cost of living differential of $8,125;

a monthly foreign service allowance of $11,250 for Mr. Case, and $10,000 for Ms. Davies;

a monthly car allowance of approximately $1,958 for Ms. Davies;

eligible dependents’ schooling assistance, including tuition and application fees, for Ms. Davies;

a tax equalization benefit for Ms. Davies, designed to equalize the income tax paid by her so that her total income tax costs related to any earnings from the Company while on the international assignment (including earnings related to granting or vesting of equity-based awards) will be no more than an amount she would have paid had all of the earnings been taxable solely pursuant to the U.S. income tax laws;

a tax gross-up for Ms. Davies on schooling assistance and on allowances related to housing, cost of living, home leave, and transportation; and

enhanced tax preparation and planning and expatriate services for the tax years covered by the international assignment or for which international earnings are taxed by the U.K. or Ireland.

All of the relocation benefits are subject to recoupment if the executive officer resigns employment with the Company within two years of commencing the international assignment, or 12 months after the end of the assignment, and becomes employed by a direct competitor of the Company.

29


Grants of Plan-Based Awards in Fiscal Year 2023

The following table provides information on non-equity incentive plan compensation, restricted share unit awards, and PSU awards granted in 2023 to each of the NEOs.

 Name  Grant
Date


Estimated Possible
Payouts Under
Non-Equity Incentive
Plan Awards (1)


Estimated Future Payouts Under

Equity Incentive Plan Awards (2)

   All
Other
Stock
Awards:
Number
of
Shares
of
Stock
or Units
(#)(3)
   

All Other
Option
Awards:
Number of
Securities
Underlying

Options
(#)

   Exercise
or Base
Price of
Option
Awards
($/Sh)
   Grant
Date Fair
Value of
Stock and
Option
Awards
($)(4)
 
  Target
($)
   Maximum
($)
   Threshold
(#)
   Target
(#)
   Maximum
(#)
 

Gregory C. Case

   2/17/2023    3,750,000    7,500,000                7,070            2,193,609 
   3/24/2023            31,831    63,661    127,322                19,293,739 

Christa Davies

   2/16/2023    2,740,000    5,480,000                7,948            2,465,867 
   3/23/2023            13,202    26,404    52,808                7,839,084 
   7/26/2023            25,000    50,000    100,000                14,737,500 

Eric Andersen

   2/16/2023    2,500,000    5,000,000                7,252            2,249,933 
   3/23/2023            10,727    21,453    42,906                6,369,181 
   7/26/2023            25,000    50,000    100,000                14,737,500 

Lisa Stevens

   2/16/2023    1,500,000    3,000,000                4,351            1,349,898 
   3/23/2023            6,601    13,202    26,404                3,919,542 

Darren Zeidel

   2/16/2023    900,000    1,800,000                2,611            810,063 
   3/23/2023            2,971    5,941    11,882                1,763,823 

(1)

The amounts shown relate to potential annual incentive plan awards for 2023 service for each NEO under our Shareholder-Approved Plan. The amounts shown as “Target” represent the target payment level of 250% for Mr. Case, 200% for Ms. Davies and Mr. Andersen, 150% for Ms. Stevens, and 100% for Mr. Zeidel, of their respective base salaries (after giving effect to annual increases), and the amounts shown in “Maximum” reflect the maximum payment level of two times the target incentive amount, as provided by the terms of our Shareholder-Approved Plan. For Ms. Davies, the annual foreign service allowance is included with base salary in determining her bonus target.

Our Shareholder-Approved Plan does not contain a threshold payment level for any of the NEOs. If pre-established performance measures are not met, no payments are made.

(2)

The amounts shown in columns titled “Threshold,” “Target,” and “Maximum” represent the threshold, target, and maximum number of (a) PSUs granted to our NEOs pursuant to Aon’s LPP 18 (and, for Mr. Case, in respect of 35% of his 2022 annual incentive award) that will be earned and settled in Class A Ordinary Shares if certain performance criteria are achieved during the 2023 to 2025 performance period, and (ii) for Ms. Davies and Mr. Andersen, PSUs granted to them on July 26, 2023 (the July 2023 PSUs). As the potential payments for these units are dependent on achieving certain performance criteria, actual payouts could differ by a significant amount. For more information regarding the terms of the PSUs granted pursuant to LPP 18, see the section titled “Leadership Performance Program under Our Shareholder-Approved Plan” in the CD&A. For more information regarding the terms of the July 2023 PSUs, see the section titled “July 2023 Long-Term Performance-Based Awards” in the CD&A.

(3)

The amounts shown in this column represent the number of restricted share units granted to each NEO in 2023 in satisfaction of 100% of the annual incentive award earned by such NEO for 2022 performance, other than Mr. Case, who received 65% in the form of restricted share units. Within the framework of our Shareholder-Approved Plan, the target amount of each NEO’s annual incentive award for 2022 performance (calculated as a percentage of base salary and, with respect to Ms. Davies, her annual foreign service allowance) was 150% for each of Ms. Davies and Mr. Andersen, 100% for each of Ms. Stevens and Mr. Zeidel; the bonus range was capped at 300% for each of Ms. Davies and Mr. Andersen, and 200% for each of Ms. Stevens and Mr. Zeidel. The determination of the actual incentive amount payable was determined based, among other things, on Aon’s overall performance and an individual performance assessment. These restricted share units will vest in installments of 331/3% on the first through third anniversaries of the date of grant. Effective with grants in 2023 onward, dividend equivalents will accumulate and pay when the restricted share unit vests. Voting rights do not attach to any unvested restricted share units.

(4)

The amounts shown in this column are the grant date fair values of the restricted share units and PSUs. The grant date fair value reflects the aggregate grant date fair value computed in accordance with ASC Topic 718 and, with respect to the performance share unit awards granted under the LPP and the July 2023 PSUs, is based on the probable outcome of the performance-based conditions at the time of grant. These amounts do not correspond to the actual value (if any) that may be recognized by the NEOs. For additional information about the applicable assumptions for determining the grant date fair value of restricted share unit awards, see footnote (1) to the Summary Compensation Table.

30


Outstanding Equity Awards at 2023 Fiscal Year-End

The following table sets forth information regarding outstanding restricted share units and PSUs held by each of our NEOs on December 31, 2023. See “Potential Payments and Benefits on Termination or Change in Control” for information regarding the impact of certain employment termination scenarios on outstanding equity awards.

   Stock Awards
 Name  Grant Date  Number of Shares 
or Units of Stock
That Have Not
Vested (#)
  Market Value of
Shares or Units of
 Stock That Have Not 
Vested ($) (5)
  Equity Incentive Plan
Awards: Number of
Unearned Shares,
Units or Other Rights
 That Have Not Vested 
(#)
  Equity Incentive Plan
Awards: Market or
Payout Value of
 Unearned Shares, Units 
or Other Rights That
Have Not Vested ($) (5)

 Gregory C.

  2/12/2021(1) 1,765    513,650    -    - 

 Case

  3/26/2021(2) 126,144    36,710,427    -    - 
  3/25/2022(3) -    -    8,128    2,365,411 
  3/25/2022(3) -    -    102,186    29,738,170 
  2/17/2023(1) 7,070    2,057,511    -    - 
  3/24/2023(3) -    -    127,322    37,053,248 

 Christa

  2/11/2021(1) 1,018    296,258    -    - 

 Davies

  3/25/2021(2) 47,104    13,708,206    -    - 
  8/6/2021(2) 19,118    5,563,720    -    - 
  2/17/2022(1) 1,744    507,539    -    - 
  3/24/2022(3) -    -    44,112    12,837,474 
  2/16/2023(1) 7,948    2,313,027    -    - 
  3/23/2023(3) -    -    52,808    15,368,184 
  7/26/2023(4) -    -    25,000    7,275,500 

 Eric

  2/11/2021(1) 763    222,048    -    - 

 Andersen

  3/25/2021(2) 35,550    10,345,761    -    - 
  8/6/2021(2) 15,296    4,451,442    -    - 
  2/17/2022(1) 1,557    453,118    -    - 
  3/24/2022(3) -    -    34,660    10,086,753 
  2/16/2023(1) 7,252    2,110,477    -    - 
  3/23/2023(3) -    -    42,906    12,486,504 
  7/26/2023(4) -    -    25,000    7,275,500 

 Lisa

  2/22/2019(1) 639    185,962    -    - 

 Stevens

  2/11/2021(1) 509    148,129    -    - 
  3/25/2021(2) 15,998    4,655,738    -    - 
  2/17/2022(1) 996    289,856    -    - 
  3/24/2022(3) -    -    18,906    5,502,024 

31


  2/16/2023(1) 4,351    1,266,228    -    - 
  3/23/2023(3) -    -    26,404    7,684,092 

 Darren

  5/21/2019(1) 44    12,805    -    - 

 Zeidel

  2/11/2021(1) 458    133,287    -    - 
  3/25/2021(2) 11,110    3,233,232    -    - 
  2/17/2022(1) 748    217,683    -    - 
  3/24/2022(3) -    -    10,082    2,934,064 
  2/16/2023(1) 2,611    759,853    -    - 
  3/23/2023(3) -    -    11,882    3,457,900 

(1)

The vesting schedule for the restricted share units, other than PSUs, held by each NEO is as follows:

Vesting
Date
  Gregory
C. Case
  Christa
Davies
  Eric
Andersen
  Lisa
Stevens
   Darren
Zeidel
 
 2/11/2024    1,018   763   509    458 
 2/12/2024   1,765      
 2/16/2024    2,649   2,417   1,450    870 
 2/17/2024   2,356   872   778   498    374 
 2/22/2024      639   
 5/21/2024        44 
 2/16/2025    2,649   2,417   1,450    870 
 2/17/2025   2,357   872   779   498    374 
 2/16/2026    2,650   2,418   1,451    871 
 2/17/2026   2,357      
  Total   8,835   10,710   9,572   6,495    3,861 

(2)

The PSUs, to the extent earned, convert into Class A Ordinary Shares on a one-to-one basis after the conclusion of a three-year performance period. For PSUs with a March 25, 2021, March 26, 2021, or August 6, 2021 grant date, the three-year performance period ended on December 31, 2023. These PSUs were subsequently settled in Class A Ordinary Shares on February 16, 2024.

(3)

The PSUs, to the extent earned, convert into Class A Ordinary Shares on a one-to-one basis after the conclusion of a three-year performance period. A pre-established cumulative adjusted diluted earnings per share target as certified by the Compensation Committee in the first quarter of the year after the performance period must be met. For PSUs with a March 24, 2022 or March 25, 2022 grant date, the three-year performance period ends on December 31, 2024. For PSUs with a March 23, 2023 or March 24, 2023 grant date, the three-year performance period ends on December 31, 2025. If the minimum or threshold performance is not attained, the PSUs will be forfeited. In this table, the maximum number of PSUs is shown for outstanding awards for all LPP cycles as awards granted under these cycles are currently tracking at or above target payout levels. If Aon does not attain the maximum cumulative target over the three-year period, the number of Class A Ordinary Shares received by the NEOs upon settlement will be reduced.

(4)

The July 2023 PSUs, to the extent earned, convert into Class A Ordinary Shares on a one-to-one basis, with 0% to 200% of the target number of July 2023 PSUs (50,000) eligible to vest on the Vesting Date, as follows: (a) no July 2023 PSUs will vest if the average closing price of a Class A Ordinary Share for the 90 consecutive trading days ending on the Vesting Date is below the Performance Hurdle; and (b) subject to achieving the Performance Hurdle, the percentage of July 2023 PSUs to vest will be based upon the Average Share Price, as follows - (i) 50% if the Average Share Price is $475 (threshold), (ii) 100% if the Average Share Price is $500 (target), and (iii) 200% if the Average Share Price is at least $550 (max), with straight line vesting if the Average Share Price is between the threshold, target, and max levels. In this table, the threshold number of July 2023 PSUs is shown, as the share price Performance Hurdle has not been achieved due to the fact that these awards are intended to vest based on share price increases over a five-year period.

(5)

The market value is calculated using $291.02, the closing price of a Class A Ordinary Share on NYSE on December 29, 2023 (the last trading day of 2023).

32


Stock Vested in Fiscal Year 2023

The following table sets forth (1) the number of Class A Ordinary Shares acquired during 2023 by our NEOs upon the vesting of restricted share unit awards and the settlement of performance share unit awards, and (2) the value realized upon such vesting or settlement.

   Stock Awards 
 Name  

Number of Shares
Acquired
on Vesting

(#)(1)


  Value Realized on  

  Vesting  

  ($)(2)  


 Gregory C. Case

   200,049       62,076,563     

 Christa Davies

   86,379       26,805,945     

 Eric Andersen

   55,857       17,334,867     

 Lisa Stevens

   16,503       5,124,486     

 Darren Zeidel

   14,867       4,617,807     

(1)

Represents (a) the vesting of restricted share units granted under our Shareholder-Approved Plan and (b) the settlement of performance share unit awards granted under the LPP in March 2020 for the three-year performance period ending on December 31, 2022, which were converted into Class A Ordinary Shares on February 11, 2023. Of the amounts shown, the following aggregate number of Class A Ordinary Shares were withheld to pay taxes due in connection with the vesting: Mr. Case, 88,578 shares; Ms. Davies, 33,990 shares; Mr. Andersen, 27,998 shares; Ms. Stevens, 7,720 shares; and Mr. Zeidel, 6,588 shares.

(2)

Calculated by multiplying (a) the fair market value of Class A Ordinary Shares on the vesting date, which was determined using the closing price on NYSE of a Class A Ordinary Share on the vesting date or, if such day is a holiday, on the immediately preceding working day, by (b) the number of Class A Ordinary Shares acquired upon vesting.

Pension Benefits in Fiscal Year 2023

The table below provides information regarding the benefits expected to be paid from the Company’s defined benefit pension plans, as well as a supplemental contractual arrangement, for Mr. Andersen, the only NEO who participates in these plans.

 Name  Plan Name  

Number of Years
of Credited Service

(#)

  Present Value of
Accumulated Benefit
($)(1)
  

  Payments During Last  

  Fiscal Year  

  ($)  

 Eric Andersen

  Aon Pension Plan  12  371,723  
  Excess Benefit Plan  12  540,553  
  Supplemental Contractual Pension  5  520,874  

(1)

Reflects the actuarial present value of benefits accumulated under the respective plans from service and compensation through December 31, 2023, in accordance with the assumptions disclosed in Note 11 to the audited financial statements included in the Original Filing.

Mr. Andersen commenced participation in the Aon Pension Plan on May 16, 1997. Under the Aon Pension Plan, a participant is generally entitled to an annual pension benefit commencing at the normal retirement age of 65, calculated based on the participant’s years of service, compensation, and Social Security benefits. Participants are fully vested after completing five years of service. Eligible compensation under the plan is subject to applicable IRS limits; accordingly, the maximum eligible compensation under the plan was $245,000 up to April 1, 2009, the date that the Aon Pension Plan was frozen. The pension formula for service after January 1, 1998, through December 31, 2006, is 1.15% of the participant’s final average earnings multiplied by years of service on or after January 1, 1998, plus 0.45% of the participant’s final average earnings in excess of covered compensation multiplied by years of service on or after January 1, 1998 (not in excess of 35 years). “Final average earnings” is the average of the participant’s base salary and certain eligible bonus payments for the five consecutive calendar years within the last 10 calendar years of employment for which the average was the highest. “Covered compensation” is the average of the Social Security Taxable Wage Base for the 35-year period prior to the participant’s normal retirement age. Effective January 1, 2007, the prior plan benefit was frozen and a career average formula of 1.15% of each year’s earnings plus 0.45% of earnings in excess of covered compensation is effective for service after December 31, 2006. The default form of benefit payment for married participants is a 50% joint and survivor pension; other actuarially equivalent payment options are also available. The Aon Pension Plan was frozen as to benefit accrual effective April 1, 2009, and was previously closed to newly hired employees effective January 1, 2004. Effective January 1, 2020, a portion of the liabilities of the Aon Pension Plan was spun-off to a mirror plan, the Aon Retirement Pension Plan, and Mr. Andersen’s pension plan participation continues under the Aon Retirement Pension Plan as of that date.

33


The Excess Benefit Plan was established in 1989 as an unfunded deferred compensation plan for a select group of management or highly compensated employees and was intended to replace benefits lost under the Aon Pension Plan due to application of certain IRS compensation limits. To be eligible for a benefit under this furnishing, exceptplan, participants must have attained age 50 and at least 10 years of benefit accrual service. Mr. Andersen satisfied those requirements as of February 3, 2015. The benefit under this plan is determined based on amount of the monthly benefit payable under the Aon Pension Plan had such plan not applied the maximum annual benefit limitation imposed by Section 415 of the Code. Effective for the 2002 plan year and thereafter, the Excess Benefit Plan was amended to provide that earnings in excess of $500,000 would not be taken into account for purposes of calculating the plan benefit. Effective January 1, 2006, the Excess Benefit Plan was further amended to incorporate an alternative benefit formula that provides a benefit of 1% of final average compensation multiplied by total years of service, subject to a maximum annual pension benefit of $500,000. Upon retirement, a participant will receive the greater of the pension from the basic formula (1.15%/0.45%) or the 1% formula. With respect to plan benefits that were earned and vested after December 31, 2004, the form of benefit is an actuarially equivalent term certain annuity for five years, payable monthly. With respect to plan benefits earned and vested on or before December 31, 2004, the form of benefit is the same that would apply under the Aon Pension Plan (subject to certain exceptions). The Excess Benefit Plan was frozen as to benefit accrual effective April 1, 2009.

Mr. Andersen and the Company entered into a Supplemental Pension Agreement effective January 19, 2010, in connection with the Company’s decision to freeze further benefit accruals under the Aon Pension Plan and the Excess Benefit Plan in 2009. Under this supplemental agreement, Mr. Andersen is entitled to a supplemental pension benefit upon termination of employment equal to the aggregate pension benefit earned under the Aon Pension Plan and the Excess Benefit Plan for the 2008 plan year, multiplied by five (effectively giving Mr. Andersen an additional five years of pension service). Mr. Andersen became fully vested in this benefit upon his continuous employment with the Company through the later of December 31, 2014, or attainment of age 50 and completion of 10 years of benefit accrual service. This benefit is payable in the form of a 100% joint and survivor annuity commencing following termination of employment or, if later, attaining age 55.

Nonqualified Deferred Compensation in Fiscal Year 2023

The table below shows any executive contributions, contributions by Aon, earnings, withdrawals, and account balances for the NEOs with respect to our Supplemental Savings Plan. None of our NEOs participate in the Aon Deferred Compensation Plan.

See the section titled “Executive and Relocation Benefits” in the CD&A and the narratives set forth below the following table for additional information on these plans.

Nonqualified Deferred Compensation in Fiscal Year 2023

 Name  Name of Plan  

Executive

Contributions
in Last Fiscal
Year

($)


Aon
Contributions
in Last Fiscal
Year

($)(1)


Aggregate
Earnings in
Last Fiscal
Year

($)

  Aggregate
Withdrawals/
Distributions
($)
  

 Aggregate 

 Balance at 

 Last Fiscal 

 Year End 

 ($)(2) 

 Gregory C. Case

  Supplemental Savings Plan    10,200  6,010    229,971

 Christa Davies

  Supplemental Savings Plan    10,500  6,504    243,496

 Eric Andersen

  Supplemental Savings Plan    10,500  2,916    912,238

 Lisa Stevens

  Supplemental Savings Plan     6,800    534     26,309

 Darren Zeidel

  Supplemental Savings Plan     8,500  2,753    109,159

(1)

These amounts are included in “All Other Compensation” for 2023 in the Summary Compensation Table.

(2)

The following table provides the amount reported in the “Aggregate Balance at Last Fiscal Year End” column for each NEO that has been previously reported as compensation in the Summary Compensation Tables for 2023, 2022, and 2021.

34


 Name  Name of Plan  Amount Included
in 2023
Compensation in
Summary
Compensation
Table ($)
  Amount Included
in 2022
Compensation in
Summary
Compensation
Table ($)
  

 Amount Included 

 in 2021 

 Compensation in 

 Summary 

 Compensation 

 Table ($) 

 Gregory C. Case

  Supplemental Savings Plan  10,200  11,700  12,600

 Christa Davies

  Supplemental Savings Plan  10,500  12,125  10,900

 Eric Andersen

  Supplemental Savings Plan  10,500  12,125  13,000

 Lisa Stevens

  Supplemental Savings Plan   6,800   5,850   6,300

 Darren Zeidel

  Supplemental Savings Plan   8,500   9,750   8,400

Aon Supplemental Savings Plan

The Aon Supplemental Savings Plan was created to provide matching and other company allocations similar to what participants in the Aon Savings Plan (our qualified 401(k) plan) would have received had the Code limits not restricted contributions under the Aon Savings Plan. Participants eligible for Aon Savings Plan company contributions who are active at the end of the plan year and who attain the IRS 401(k) contribution limit and compensation limit (or participate in the Aon Deferred Compensation Plan) receive supplemental allocations to the Supplemental Savings Plan based on their years of service and their match eligible compensation in excess of the IRS limit or Deferred Compensation Plan deferrals (to a combined plan limit of $500,000). Distributions from the Supplemental Savings Plan must begin at the earlier of retirement or age 65.

Each NEO participated in the Supplemental Savings Plan in 2023. If an executive officer contributes on a match-eligible basis to the Aon Savings Plan an amount equal to the annual contribution limit imposed by the Code ($22,500 in 2023), the Supplemental Savings Plan provides for a company allocation as a percentage of eligible compensation deferred under the Aon Deferred Compensation Plan and of eligible compensation in excess of the IRS limit ($330,000 in 2023). The combined total annual eligible compensation for the Aon Savings and Aon Supplemental Savings Plans is capped at $500,000. The percentage allocation varies by length of service. In the first four years of employment the Company allocation percentage is 3% and that percentage increases incrementally to 6% after 15 years of service.

Potential Payments and Benefits on Termination or Change in Control

During 2023, each NEO was party to either an employment agreement with Aon that addresses the payments and benefits that he or she will receive under various termination of employment scenarios or an employment letter that provides for participation in the Combined Severance Plan. Non-competition and non-solicitation covenants apply to each NEO for a period of two years following the termination of employment of such executive without regard to the reason for such termination.

Each NEO other than Mr. Case is entitled to participate in our the Combined Severance Plan, which provides certain severance benefits upon a qualifying termination of employment in connection with or during the two years following a change in control of Aon. Mr. Case is party to an individual change of control severance agreement with the Company providing certain severance benefits in connection with a qualifying termination of employment in connection with a change in control of Aon.

The tables below outline the potential payments to the NEOs upon the occurrence of various termination of employment events, including a termination in connection with a change in control of Aon. The following assumptions apply with respect to the tables below and any termination of employment of a NEO:

Each NEO was terminated on December 31, 2023, and the price per Class A Ordinary Share is $291.02 per share, the closing market price per share on December 29, 2023 (the last trading day of 2023). Accordingly, the tables set forth amounts as of December 31, 2023, and include estimates of amounts that would be paid to the NEO upon the occurrence of a termination of employment event.

Each NEO is entitled to receive amounts earned during the term of his or her employment regardless of the manner of termination. These amounts include accrued base salary, accrued vacation time, and other employee benefits to which the NEO was entitled on the date of termination and are not shown in the tables below. Under each NEO’s employment agreement, other than Mr. Case’s, or by virtue of the NEO’s eligibility for the Combined Severance Plan, the NEO is entitled to 365 days’ notice in the event that the Company terminates his or her employment without cause, during which period the NEO would continue to receive base salary and remain eligible for the Company’s standard benefit plans.

35


The specific definitions of (i) “good reason” applicable to “Involuntary—Good Reason” and (ii) “cause” applicable to “Involuntary—For Cause,” and (iii) “without cause” or “not for cause” applicable to “Involuntary—Without Cause” for each of the NEOs can be found, to the extent applicable, in their respective employment agreements or the Combined Severance Plan. In addition, the specific definitions of “qualifying termination” applicable to “Qualifying After Change in Control” can be found in the Combined Severance Plan or, with respect to Mr. Case, in his change in control severance agreement.

The definition of “retirement” applicable to “Retirement” means a voluntary termination of employment upon or after the individual’s attainment of age 55. The LPP provided in 2023 for pro rata vesting in the event of retirement on the same terms that apply to a termination “without cause” or for “good reason.”

 Name  Termination Reason  Total Cash
Payment
($)(1)
   Accelerated
Share
Vesting
($)(2)
   Welfare,
Retirement
and Other
Benefits
($)
   Severance
Cutback
($)(3)
   Total ($) 

 Gregory C. Case

  Retirement       56,158,323            56,158,323 
  Involuntary-Good Reason   14,250,000    56,158,323    96,000        70,504,323 
  Death   3,750,000    73,860,003    5,000,000        82,610,003 
  Disability   3,750,000    73,860,003            77,610,003 
  Involuntary-Without Cause   14,250,000    56,158,323    96,000        70,504,323 
  Qualifying After Change in Control   17,310,000    73,860,003    238,950        91,408,952 

 Christa Davies

  Involuntary-Good Reason   3,990,000    29,229,273            33,219,273 
  Death   3,055,068    36,491,580            39,546,648 
  Disability   4,555,068    36,491,580            41,046,648 
  Involuntary-Without Cause   6,730,000    29,229,273            35,959,273 
  Qualifying After Change in Control   4,753,333    36,491,580    90,066      41,334,979 

 Eric Andersen

  Retirement       23,026,181            23,026,181 
  Involuntary-Good Reason   9,369,863    23,026,181    65,567        32,461,612 
  Death   2,500,000    28,869,475            31,369,475 
  Disability   2,500,000    28,869,475            31,369,475 
  Involuntary-Without Cause   9,369,863    28,869,475    65,567        38,304,905 
  Qualifying After Change in Control   4,450,000    28,869,475    115,754    (1,958,844   31,476,385 

 Lisa Stevens

  Involuntary-Good Reason   1,000,000    9,633,538            10,633,538 
  Death       13,138,971            13,138,971 
  Disability       13,138,971            13,138,971 
  Involuntary-Without Cause   1,000,000    9,633,538            10,633,538 
  Qualifying After Change in Control   3,256,667    13,138,971    107,326        16,502,963 

 Darren Zeidel

  Involuntary-Good Reason   900,000    5,906,251            6,806,251 
  Death       7,552,842            7,552,842 
  Disability       7,552,842            7,552,842 
  Involuntary-Without Cause   900,000    5,906,251            6,806,251 
  Qualifying After Change in Control   2,775,000    7,552,842    101,154        10,428,996 

(1)

The Total Cash Payment is calculated in accordance with the terms of the agreements and plans described below. The components of the Total Cash Payment are set forth in the following table:

36


 Name  Termination
Reason
(a)
     Base
Salary
($)
       Base
Salary
Multiple
       Bonus
($)
       Bonus
Multiple
     Average
Annual
Cash Bonus
($)
       Total
Severance
($)
       Pro Rata
Bonus
($)
       Total
Cash
Payment
($)
 

 Gregory C. Case

  Death                 3,750,000     1x           3,750,000            3,750,000 
  Disability                 3,750,000     1x           3,750,000            3,750,000 
  IV-GR     1,500,000      2x      3,750,000     2x           10,500,000      3,750,000      14,250,000 
  I-WC     1,500,000      2x      3,750,000     2x           10,500,000      3,750,000      14,250,000 
  C-in-C     1,500,000      3x      3,750,000     3x     1,560,000      17,310,000            17,310,000 

 Christa Davies

  Death     315,068            2,740,000     1x           3,055,068            3,055,068 
  Disability     1,815,068            2,740,000     1x           4,555,068            4,555,068 
  IV-GR     1,250,000      1x      2,740,000     1x           3,990,000            3,990,000 
  I-WC     1,250,000      1x      2,740,000     2x           6,730,000            6,730,000 
  C-in-C     1,250,000      2x      682,500     2x     888,333      4,753,333            4,753,333 

 Eric Andersen

  Death                           2,500,000      2,500,000            2,500,000 
  Disability                           2,500,000      2,500,000            2,500,000 
  IV-GR     3,123,288            6,246,575                9,369,863            9,369,863 
  I-WC     3,123,288            6,246,575                9,369,863            9,369,863 
  C-in-C     1,250,000      2x      609,375     2x     731,250      4,450,000            4,450,000 

 Lisa Stevens

  Death                                              
  Disability                                              
  IV-GR     1,000,000      1x                      1,000,000            1,000,000 
  I-WC     1,000,000      1x                      1,000,000            1,000,000 
  C-in-C     1,000,000      2x      390,000     2x     476,667      3,256,667            3,256,667 

 Darren Zeidel

  Death                                              
  Disability                                              
  IV-GR     900,000      1x                      900,000            900,000 
  I-WC     900,000      1x                      900,000            900,000 
  C-in-C     900,000      2x      292,500     2x     390,000      2,775,000            2,775,000 

(a)

The termination reasons are abbreviated as follows: IV-GR = Involuntary termination for good reason; I-WC = involuntary termination without cause; C-in-C = qualifying termination after change in control.

(2)

Amounts reflected under Accelerated Share Vesting for LPP units are calculated based on actual performance results for LPP 16 and assume payout at target for LPP 17 and LPP 18. No amounts are reflected for the July 2023 PSUs because the threshold performance level has not been achieved as of December 31, 2023.

(3)

The Company is not obligated to make any gross-up payments to cover any excise and related income tax liability arising under Sections 4999 and 280G of the Internal Revenue Code for any of our NEOs. Instead, the applicable plans and agreements provide for a reduction in amounts payable so that no excise tax would be imposed. Pursuant to the terms of the Combined Severance Plan, an executive’s payments and benefits are capped at the greater of: (i) the “safe harbor” amount under Section 280G of the Code, such that the payments and benefits are not deemed to be “excess parachute payments” or (ii) the amount of payments and benefits that would otherwise be provided under the agreement so long as the payments and benefits outweigh the tax consequences to them of receipt thereof. Mr. Andersen would be subject to a cutback in severance payments in accordance with such provision.

37


Change in Control Severance Arrangements

The Company maintains the Combined Severance Plan, under which our NEOs (other than Mr. Case) are eligible to receive certain severance benefits upon a qualifying termination of employment in connection with or within two years following a change in control of the Company. Mr. Case is party to an individual change in control severance agreement with the Company, which also provides these benefits. The protections contained in the Combined Severance Plan and Mr. Case’s individual agreement are intended to secure the continued service and to ensure the dedication and objectivity of our most senior executives in the event of an actual or potential change in control of the Company.

The Combined Severance Plan and Mr. Case’s individual agreement provide that each NEO would receive the following severance benefits upon a qualifying termination of employment in connection with or within two years following a change in control of the Company:

a lump sum cash amount equal to the NEO’s prorated bonus for the year of termination, based upon the executive’s average annual incentive for the preceding three years;

for NEOs other than Mr. Case, a lump sum cash amount equal to two times the sum of: (i) the executive’s annual base salary in effect immediately prior to the date of termination; and (ii) the executive’s average annual incentive bonus over the previous two years;

with regard to Mr. Case, a lump sum cash amount equal to three times the sum of (i) his highest annual base salary in effect during the twelve-month period prior to the date of termination; and (ii) his target annual incentive bonus for the fiscal year in which the date of termination occurs;

with regard to Mr. Case, a lump sum cash amount equal to the amount forfeited under any qualified defined contribution plan as a result of his termination;

immediate vesting of all accrued benefits under the Company’s nonqualified benefit plans, which shall be calculated assuming an additional two years of age and service credits and, in the case of the Supplemental Savings Plan, two additional years of contributions (with regard to Mr. Case, assuming three additional years of age and service credit and, in the case of the Supplemental Savings Plan, three additional years of contributions); and

continued medical, dental, and life insurance benefits under the Company’s employee benefit plans, at the same cost as applicable to the NEO if he or she were an active employee, until the earlier of the executive’s eligibility to receive similar benefits under another employer’s plan or two years following separation (or, with regard to Mr. Case, three years following separation).

In addition, pursuant to the terms of Mr. Case’s severance agreement, the Company is required to pay Mr. Case a lump sum cash amount equal to the actuarial equivalent of Mr. Case’s accrued benefits under the Company’s nonqualified benefit plans within 30 days of his termination of employment with the Company.

Qualifying terminations consist of termination by the Company other than for cause or by the executive for “CIC good reason” (as defined below), in each case in connection with or within two years following a change in control of the Company. For purposes of the Combined Severance Plan and Mr. Case’s individual agreement, “CIC good reason” means: (i) a substantial adverse change in authority, powers, functions, duties, or responsibilities; (ii) a material reduction in salary or bonus opportunity; (iii) a failure to maintain material employee benefit or compensation plans; or (iv) a reassignment of the executive to an office location more than 50 miles from the executive’s current location. For purposes of the Combined Severance Plan, “cause” means: (i) a deliberate act of dishonesty, fraud, theft, embezzlement, or misappropriation relating to the executive’s employment, or a breach of the duty of loyalty; (ii) an act of discrimination or harassment that may result in material liability or exposure to the Company; (iii) a material violation of Company policies and procedures; (iv) material non-compliance with any applicable restrictive covenants; or (v) any criminal act resulting in a criminal felony charge or conviction. For purposes of Mr. Case’s individual agreement, “cause” means: (i) a demonstrably willful and material breach of the executive’s duties and responsibilities, committed in bad faith or without reasonable belief that the breach is in the best interests of the Company and which is not remedied within a reasonable period of time after receipt of written notice thereof; (ii) gross misconduct, theft, fraud, breach of trust, or any act of dishonesty which results in material harm to the Company; or (iii) commission of a felony involving moral turpitude.

38


A “change in control” for purposes of the Combined Severance Plan and Mr. Case’s individual agreement generally would have occurred upon any of the following: (i) an acquisition by any individual, entity or group of 30% or more of either the then outstanding Class A Ordinary Shares or the combined voting power of the outstanding securities entitled to vote in the election of directors (but excluding, generally, any acquisition from or by the Company or a Company employee benefit plan, or any acquisition that meets the requirements of clauses (a), (b), and (c) of subsection (iii) of this definition); (ii) a change in the majority of the current Board; (iii) the consummation of reorganization, merger, consolidation or other similar business combination involving the Company or its subsidiaries, or the sale or other disposition of all or substantially all of the assets of the Company and its subsidiaries (unless each of the following is applicable: (a) all or substantially all of the Company’s existing shareholders will beneficially own, directly or indirectly, as a consequence of the transaction, more than 60% of the outstanding shares of common stock and the combined voting power, respectively, of the ultimate parent company resulting from such transaction, in the same proportions relative to each shareholder as their ownership immediately prior to such transaction; (b) no person or group owns, directly or indirectly, 30% or more of the outstanding Class A Ordinary Shares or combined voting power of the surviving company; and (c) individuals who were members of the Board prior to such transaction will constitute the majority of the members of the board of directors of the resulting entity); or (iv) a complete liquidation or dissolution of the Company.

As a condition to the receipt of change in control severance payments and benefits, the executive would be required to enter into an agreement with the Company providing that the executive would not compete with the Company or solicit employees or customers of the Company for a two-year period and would not use or disclose any confidential information of the Company. In addition, the executive would be required to execute a full release of claims in connection with the payment of severance benefits.

Pursuant to the terms of the Combined Severance Plan and Mr. Case’s individual agreement, the Company is not obligated to provide a gross up payment in connection with any excise taxes imposed by Section 4999 of the Code. In addition, Mr. Case’s individual agreement provides that Mr. Case’s cash and non-equity award payments shall be capped at the “safe harbor” amount under Section 280G of the Code, such that the cash and non-equity award payments are not deemed to be “excess parachute payments” within the meaning of Section 280G of the Code. The Combined Severance Plan provides that the executive’s payments and benefits shall be capped at the greater of: (i) the “safe harbor” amount under Section 280G of the Code, such that the payments and benefits are not deemed to be “excess parachute payments” or (ii) the amount of payments and benefits that would otherwise be provided under the agreement so long as the payments and benefits outweigh the tax consequences to them of receipt thereof.

Employment Agreements and Letters

As noted in “Employment Agreements and Other Compensation Arrangements” above, each NEO has entered into an employment agreement or employment letter with the Company that was in effect during 2023. The terms of these various employment agreements that provide benefits upon a termination of employment under various scenarios are set forth below.

Employment Agreement with Mr. Case

Mr. Case’s employment agreement provides that, in the event of Mr. Case’s death or termination of employment due to disability during the term of the agreement, he (or, if applicable, his heirs, executors or the administrators of his estate) will receive: (i) any accrued base salary through and including his termination date; (ii) any annual incentive bonus earned and payable but not yet paid for the bonus year prior to the year in which termination of employment occurs; (iii) a prorated annual incentive bonus through and including his termination date; (iv) other employee benefits to which he was entitled at the time of termination in accordance with the terms of the plans and programs of the Company; and (v) accelerated vesting of the restricted share unit awards, continued vesting of the share option awards, and payment or vesting of any other long-term incentive awards, in each case granted to him pursuant to his prior employment agreement.

39


Mr. Case’s employment agreement also provides that if the Company terminates Mr. Case’s employment for cause (as defined in the agreement), or if Mr. Case voluntarily terminates his employment without good reason (as defined in the agreement) as determined by a majority of the members of the Board (excluding Mr. Case), Mr. Case will be entitled to receive: (i) his accrued base salary through and including his date of termination; and (ii) other employee benefits to which he was entitled at the time of his termination in accordance with the terms of the plans and programs of the Company. In the event of a termination for cause, Mr. Case must immediately resign from the Board.

If the Company terminates his employment for any reason other than cause (as defined in the agreement), or if Mr. Case voluntarily terminates his employment with good reason (as defined in the agreement), Mr. Case will be entitled to receive: (i) any accrued base salary through and including his date of termination; (ii) any annual incentive bonus earned and payable but not yet paid for the bonus year prior to the year in which termination of employment occurs; (iii) a prorated annual incentive bonus through and including his date of termination, subject to the satisfaction of the specified performance goals established for the applicable bonus year; (iv) other employee benefits to which he was entitled at the time of his termination in accordance with the terms of the plans and programs of the Company, provided that the Company shall continue to provide medical, dental and vision benefits to Mr. Case, his spouse and dependent children for a period of 24 months following the date of termination, followed with immediate eligibility for coverage under the Company’s retiree medical program until Mr. Case, his spouse and dependent children become covered by the plan of another employer providing comparable benefits; (v) accelerated vesting of the restricted share unit awards, continued vesting of the share option awards and payment or vesting of any other long-term incentive awards, in each case granted to him pursuant to his prior employment agreement; (vi) a lump sum cash payment equal to two times Mr. Case’s target annual incentive bonus for the bonus year in which his employment terminates; and (vii) subject to continuing compliance with the non-competition, non-solicitation, and confidentiality covenants set forth in the agreement, an amount equal to two times Mr. Case’s base salary, payable in installment payments when the Company provides salary payments to its executives generally, through the two year non-competition period. The definition of “cause” under Mr. Case’s employment agreement is substantially similar to the definition of “cause” in the Combined Severance Plan, as described above under “Change in Control Severance Arrangements.”

If Mr. Case voluntarily terminates his employment with good reason, he will be entitled to receive the payments and benefits set forth in items (i) through (vii) of the immediately preceding paragraph. Under his employment agreement, “good reason” is defined as (i) the assignment to Mr. Case of any duties materially inconsistent with his position, authority, duties, or responsibilities contemplated by his employment agreement; (ii) the Company’s failure to comply with the provisions of his employment agreement regarding compensation; or (iii) any other material breach by the Company of his employment agreement.

Non-competition and non-solicitation covenants apply to Mr. Case for a period of two years following the termination of his employment without regard to the reason for such termination.

Employment Agreement with Ms. Davies

Ms. Davies’s employment agreement, as amended, provides that, in the event of the death of Ms. Davies during the term of the agreement, her heirs or executors or the administrators of her estate will receive: (i) any accrued base salary through and including her date of death plus any unpaid annual or long-term bonus earned for the completed year prior to her death; and (ii) a lump sum cash payment equal to her base salary at the date of death through April 1, 2026, reduced by the amount of any benefits paid under any life insurance policy maintained by the Company for her benefit. In the event of the Company’s termination of the employment of Ms. Davies by reason of disability, she will receive: (i) any accrued base salary through and including her date of termination plus any unpaid annual or long-term bonus earned for the completed year prior to her termination; and (ii) continuation of her base salary at the rate in effect at the date of termination through April 1, 2026, reduced by the amount of any benefits paid under any disability insurance policy maintained by the Company for her benefit.

40


If the Company terminates Ms. Davies’s employment for cause (as defined in her agreement), Ms. Davies will receive: (i) any accrued base salary through her date of termination; and (ii) other employee benefits to which she was entitled at the time of termination in accordance with the terms of the plans and programs of the Company. If the Company terminates Ms. Davies’s employment for any reason, other than for cause, death or disability, the Company must give Ms. Davies 365 days’ prior written notice of termination, and she will be entitled to the following: (i) for the period of time beginning with the Company’s delivery of notice of termination to Ms. Davies and extending through the date of termination: (a) the Company will continue to pay her salary at the rate in effect on the date of delivery of notice of termination; (b) Ms. Davies will remain eligible for annual bonuses determined in accordance with the terms of the senior management incentive plan; (c) Ms. Davies will continue to be entitled to all employee benefits; and (d) Ms. Davies will continue to vest in and be eligible to earn long-term incentive awards; (ii) on the termination date, Ms. Davies shall receive a lump sum cash payment equal to any accrued but unpaid base salary; any unpaid annual or long-term bonus earned for the completed year prior to such date; and an amount equal to her target full year annual incentive award based on her base salary and target annual award percentage (or value, as applicable) as determined under the senior management incentive plan in effect for the bonus year in which the notice of termination is given; and (iii) for two years, provided that Ms. Davies complies with the non-competition, non-solicitation, and confidentiality provisions of the employment agreement, the continuation of base salary at the rate in effect on the date notice of termination is given. The definition of “cause” under Ms. Davies’s employment agreement is substantially similar to the definition of “cause” in the Combined Severance Plan, as described above under “Change in Control Severance Arrangements.”

If Ms. Davies voluntarily terminates her employment without good reason (as defined in the agreement), Ms. Davies must give the Company ninety (90) days’ prior written notice and will receive: (i) any accrued base salary through her date of termination; and (ii) other employee benefits to which she was entitled at the time of termination in accordance with the terms of the plans and programs of the Company. If Ms. Davies voluntarily terminates her employment for good reason (as defined in the agreement), Ms. Davies must give the Company thirty (30) days’ prior written notice and Ms. Davies will receive the benefits outlined in the second sentence of the immediately preceding paragraph, with the date of the delivery by Ms. Davies to the Company of notice of termination deemed to be the date of the notice of termination, and the date specified in such notice as Ms. Davies’s last day of employment with the Company as the termination date. Under her employment agreement, “good reason” is defined as (i) the assignment to Ms. Davies of any duties materially inconsistent with her position, authority, duties or responsibilities contemplated by her employment agreement; (ii) the Company’s failure to comply with the provisions of her employment agreement regarding compensation; or (iii) any other material breach by the Company of her employment agreement.

In addition, if Ms. Davies is terminated without cause, or if she voluntarily terminates her employment for good reason, the share awards and share options granted to Ms. Davies pursuant to the employment agreement will immediately vest as of the date of termination.

Non-competition and non-solicitation covenants apply to Ms. Davies for a period of two years following the termination of her employment without regard to the reason for such termination.

In connection with her retirement as described above, Ms. Davies is expected to enter into an agreement with respect to her service as a senior advisor and to receive compensation under such agreement.

Employment Agreement with Mr. Andersen

On July 26, 2023, Aon Corporation, a wholly owned subsidiary of the Company, entered into an employment agreement with Mr. Andersen, effective July 1, 2023, pursuant to which he will continue to serve as President of the Company and Aon Corporation. Mr. Andersen’s employment agreement supersedes his at-will employment letter dated as of May 11, 2018, which contained substantially similar termination provisions as described in the next section below.

In the event of Mr. Andersen’s death or termination of employment due to his incapacity or disability during the term of the employment agreement, he or his heirs, executors or the administrators of his estate (as applicable) will receive: (1) any accrued base salary through the date of his employment termination; (2) any unpaid annual bonus earned for the completed year (or other performance period) prior to termination; (3) any prorated annual incentive bonus (based on the target annual incentive for the bonus year in which his employment terminates) through the date of his employment termination; (4) other employee benefits to which he is entitled in accordance with the terms of such benefit plans and programs; and (5) payment or vesting of any long-term incentive awards that have been granted to him prior to the date of his employment termination, to the extent that itsuch payment or vesting is specifically incorporatedprovided for in the terms of the award agreements.

41


If the Company terminates Mr. Andersen’s employment for “cause” (as defined in the employment agreement), he will be entitled to receive: (1) any accrued base salary through and including the date of his employment termination, and (2) other vested employee benefits to which he is entitled upon his termination of employment, in accordance with the terms of such benefit plans and programs. The definition of “cause” under Mr. Andersen’s employment agreement is substantially similar to the definition of “cause” in the Combined Severance Plan, as described above under “Change in Control Severance Arrangements.”

The Company may notify Mr. Andersen that his employment will be terminated upon the expiration of the employment period (as defined in the employment agreement) with a minimum of 365 days’ advance notice (“Notice”) of such termination. If the employment period expires prior to the end of the Notice period, Mr. Andersen will be converted to an at-will employee upon the expiration of the employment period and the termination will be treated as a qualifying termination under the Combined Severance Plan.

Mr. Andersen’s employment agreement also provides that, if the Company removes him from the role of President and/or reduces his substantive duties (“Company Removal”), or if Mr. Andersen notifies the Company in writing that he no longer wishes to perform the duties and responsibilities of President (“Executive Notification”), Mr. Andersen will remain employed through the employment period (with approval of the Chief Executive Officer in the case of Executive Notification) and will be entitled to receive: (1) his base salary and annual incentive target bonus through the duration of the employment period; (2) pro rata vesting of any outstanding LPP awards through the duration of the employment period or through the date of Executive Notification (as applicable); (3) continued vesting of any outstanding ISP awards; and (4) other employee benefits to which he is entitled at the date of Company Removal or Executive Notification (as applicable). In the event of Company Removal, Mr. Andersen would also be entitled to receive pro rata vesting of the July 2023 PSUs through the duration of the employment period. The removal of Mr. Andersen from his role as President, Executive Notification, and/or any reduction in his duties by referencethe Company is deemed not to be a qualifying termination under the Combined Severance Plan.

Non-competition and non-solicitation covenants apply to Mr. Andersen for a period of two years following the termination of his employment without regard to the reason for such termination.

Employment Letters with Ms. Stevens and Mr. Zeidel

Ms. Stevens and Mr. Zeidel are parties to employment letters dated September 2019 and July 2019, respectively. The employment letters with Ms. Stevens and Mr. Zeidel contain substantially similar termination provisions and each provide that the executive is eligible to participate in the Combined Severance Plan. Under the Combined Severance Plan, if the executive experiences a “non-qualifying termination” (meaning a termination by Aon.

Information relatingthe Company for cause, a termination by the executive without good reason, or a termination due to death or total disability), the executive will receive all base salary, benefits, and other compensation committee interlocksentitlements that are accrued and insidervested but unpaid through the date of termination. In the event of a “qualifying termination” (meaning a termination by the Company without cause or a termination by the executive for good reason), the executive is entitled to receive a cash payment equal to his or her then-current base salary, as well as all base salary, benefits, and other compensation entitlements that are accrued and vested but unpaid through the date of termination. The Company is required to provide the executive at least 365 days’ prior notice of termination without cause, and the executive is required to provide the Company at least 30 days’ prior notice of voluntary termination for any reason. Under the Combined Severance Plan, “good reason” means (i) a substantial adverse change in authority, powers, functions, duties or responsibilities, or (ii) a material reduction in salary or bonus opportunity. The definition of “cause” under the Combined Severance Plan is described above under “Change in Control Severance Arrangements.”

42


Leadership Performance Program

The LPP is a sub-plan of our Shareholder-Approved Plan that is intended to unite senior leaders of the Company around the common objectives of growing value, driving and motivating performance, and aligning senior executives with the overall success of the Company. For purposes of the tables above, PSUs granted pursuant to the LPP performance cycles are treated as follows upon the occurrence of various termination events:

If the executive’s employment is terminated voluntarily without good reason or involuntarily for cause, participation in the LPP is cancelled retroactively back to the beginning of the performance period and PSUs will be forfeited in their entirety.

Under “Death” and “Disability”: (i) if death or disability occurs in the first or second calendar years of the performance cycle, the PSUs will become immediately vested at the target award level and convert to Class A Ordinary Shares as soon as administratively feasible following such death or disability; and (ii) if death or disability occurs in the third calendar year of the performance cycle, the PSUs will become vested at the greater of: (a) the target award level; or (b) the number of units earned based on the actual achievement of cumulative earnings for the entire performance cycle.

Under “Retirement,” “Involuntary—Good Reason,” and “Involuntary—Without Cause,” a prorated amount of the outstanding PSUs convert to Class A Ordinary Shares at the end of the performance period based on the ratio of cumulative growth achieved during the NEO’s employment during the performance period over the total achieved over the performance period. For purposes of the calculation set forth in the preceding sentence only, the growth achieved during the NEO’s employment will be measured as of the last full calendar quarter preceding the termination date. The prorated amount will be based on the percentage of full participating quarters completed during the NEO’s employment during the performance period as a proportion of the total performance period.

Under “Qualifying After Change in Control,” the outstanding PSUs convert to Class A Ordinary Shares as follows: (i) if the NEO’s employment is terminated without cause following a change in control but prior to the end of the performance period, the conversion occurs at the greater of: (a) 100% of the target level; or (b) the number of shares that would have resulted from the growth rate achieved during the NEO’s period of service during the performance period, measured as of the last full calendar quarter preceding the termination date; and (ii) in the event of a termination for cause, voluntary termination, death or disability, or if the NEO’s employment continues through the end of the performance period, the treatment of PSUs described elsewhere in this section shall apply as if a change in control did not occur. In addition, amounts calculated using the methodology as described in this paragraph represent, for all grants, the payout of a prorated amount of the outstanding PSUs at current performance levels. For grants of PSUs under the LPP, in the event of a change in control, without a qualifying termination, where the successor entity does not assume and continue the respective LPP, the outstanding PSUs will immediately convert to Class A Ordinary Shares at the greater of: (i) 100% of the target level; or (ii) the number of shares that would have resulted from the growth rate achieved during the performance period measured as of the last full calendar quarter preceding the consummation of the change in control.

July 2023 PSUs

For the July 2023 PSUs granted to Ms. Davies and Mr. Andersen (which are discussed in further detail in the section above captioned “Compensation Discussion & Analysis” contained in this Amendment under “July 2023 Long-Term Performance Based Awards”), such awards will be forfeited in the event of the recipient’s retirement or voluntary resignation, including for good reason, prior to the Vesting Date (March 31, 2028). Upon a termination of the recipient by the Company without cause or due to the recipient’s death or disability on or prior to March 31, 2026, the recipient will be eligible to earn a prorated portion of the target level of the July 2023 PSUs (based on completed days of service during the Performance Period), subject to achievement of the Performance Hurdle at the end of the performance period on March 31, 2028. If such a termination occurs after March 31, 2026, the recipient will be eligible to earn a prorated portion of the July 2023 PSUs (based on completed days of service during the Performance Period), based on the Average Share Price as of the termination date, and subject to achievement of the Performance Hurdle at the end of the performance period on March 31, 2028. Upon a change in control prior to the Vesting Date, the performance conditions of the July 2023 PSUs will be tested at the time of such change in control utilizing the price used in the transaction. To the extent the performance conditions are achieved as of the date of such change in control, the July 2023 PSUs will remain subject to their time-vesting requirements, except that if (i) the July 2023 PSUs are not assumed by the buyer in the change in control, or (ii) the July 2023 PSUs are assumed, but the recipient is terminated involuntarily without cause or resigns with good reason during the two-year period following the change in control, then the July 2023 PSUs will immediately vest.

43


2023 Director Compensation

Director Compensation Table

The table below summarizes compensation for the Company’s Board members who are not employees of the Company for the fiscal year ended December 31, 2023. All such directors are referred to in this Amendment as “non-management directors.”

Mr. Case receives no additional compensation for his services as a member of the Board. The compensation received by Mr. Case as an employee of the Company is shown in the Summary Compensation Table for Fiscal Years 2023, 2022, and 2021 set forth in this Amendment.

The Compensation Committee periodically reviews the compensation of the Company’s non-management directors, including the compensation of the Company’s non-executive Chair.

Name  Fees Earned
or Paid in
Cash ($)
    Stock
Awards
($)(1)
    All Other
Compensation
($)(2)
    Total
($)
 

Jin-Yong Cai

   145,000       210,223      155,409       510,632 

Jeffrey C. Campbell

   175,000      210,223      42,094      427,317 

Fulvio Conti

   170,000      210,223      154,800      535,023 

Cheryl A. Francis

   170,000      210,233      10,000      390,223 

Adriana Karaboutis

   145,000      210,223      70,552      425,776 

Lester B. Knight

   170,000      435,013      111,355      716,368 

J. Michael Losh

   66,342      -      29,691      96,033 

Richard C. Notebaert

   170,000      210,223      10,000      390,223 

Gloria Santona

   170,000      210,223      41,301      421,524 

Sarah Smith

   103,685      243,490      63,500      410,676 

Byron O. Spruell

   145,000      210,223      37,334      392,558 

Carolyn Y. Woo

   145,000      210,223      10,000      365,223 

(1) The amounts shown in “Stock Awards” reflect the aggregate grant date fair value computed in accordance with ASC Topic 718 of Class A Ordinary Shares granted in 2023. See Note 12 “Share-Based Compensation Plans” of the Notes to Consolidated Financial Statements in Part II, Item 8 of the Original Filing for information regarding assumptions underlying the valuation of equity awards. Additional information regarding the share awards granted to each non-management director in 2023 is contained under the heading “Compensation Discussion“Elements of Director Compensation.”

(2) During 2023, the amounts reported as “All Other Compensation” consist of the following components:

Name  Matching
Contribution
($)(a)
    Estimated
Tax
Equalization
($)(b)
    

Other

($)(c)

    Total
($)

Jin-Yong Cai

   10,000       145,409       -      155,409 

Jeffrey C. Campbell

   -      42,094      -      42,094 

Fulvio Conti

   10,000      144,800      -      154,800 

Cheryl A. Francis

   10,000      -      -      10,000 

Adriana Karaboutis

   10,000      60,552      -      70,552 

Lester B. Knight

   10,000      101,355      -      111,355 

J. Michael Losh

   10,000      9,691      10,000       29,691 

Richard C. Notebaert

   10,000      -      -      10,000 

Gloria Santona

   -      41,301      -      41,301 

44


 Name  

Matching
  Contribution  

($)(a)

  Estimated
Tax
  Equalization  
($)(b)
  

 Other 

($)(c)


  Total  

($)

 Sarah Smith

    10,000  53,500     -  63,500

 Byron O. Spruell

        -  37,334     -  37,334

 Carolyn Y. Woo

    10,000      -     -  10,000

(a)

The amounts shown in the “Matching Contribution” column consist of a matching contribution of up to $10,000 on behalf of the non-management director to various qualified organizations pursuant to the Aon Foundation Directors Matching Gift Program.

(b)

The amounts shown in the “Estimated Tax Equalization” column reflect payments made by Aon in 2023 towards estimated Ireland income taxes imposed on compensation received in 2023 on behalf of the non-management director under our tax equalization policy. In the case of Mr. Cai and Mr. Conti, we estimated Irish tax withholding on 100% of compensation paid. In the case of the other non-management directors, we estimated Irish tax withholding on 75% of compensation paid, as taxes may be apportioned between Ireland and a non-management director’s home country. In the case of Mr. Knight, the amount includes the estimated tax equalization payments made by Aon in 2023 ($75,949) and a net payment made by Aon in 2023 to settle prior year tax equalization amounts ($25,406). With respect to Ms. Francis, Mr. Notebaert, and Dr. Woo, the amount of estimated tax equalization payments made by Aon in 2023 on their behalf was less than the net payment received by Aon in 2023 to settle their prior year tax equalization amounts (so no amounts are reflected). Final tax equalization amounts for 2023 will not be known until the non-management director files his or her tax returns in 2024. See “Other Policies and Practices—Tax Equalization” below.

(c)

The amount shown in the “Other” column represents the value of a charitable donation made by Aon in honor of Mr. Losh in connection with his retirement from the Board.

Elements of Director Compensation

Meridian independently reviewed the director compensation program on behalf of the Compensation Committee, using the same peer group as used for executive compensation comparisons. Taking into consideration Aon’s global complexity, Meridian’s independent recommendations were approved by the independent directors as set forth in the table below.

 Element

Description

2023 Value

2024 Changes

 Cash Compensation

Cash compensation payable quarterly in arrears to each non-management director.

LOGO  $145,000

LOGO  Increase of $5,000 in additional retainer for the Chair of each Board committee

LOGO  Additional cash retainer of $25,000 for the Chair of each Board committee (other than Audit Committee)*

LOGO  Additional cash retainer of $30,000 for Chair of Audit Committee

 Equity Compensation

Annual grant of fully vested shares to each non-management director. The number of Class A Ordinary Shares granted is determined by dividing the grant date value by the closing price of a Class A Ordinary Share on the date of grant.

LOGO  $210,000 for each non-management director

LOGO  Additional $225,000 for the non-executive Chair

LOGO  Increase of $15,000 in annual equity compensation for each non-management director

*

With respect to sub-committee Chair retainer fees, the Company has adopted the policy that any director who chairs one of the standing committees will not be entitled to receive an additional cash retainer if he or she is also the chair of any sub-committee to that standing parent committee.

The Company applies individual limits on annual non-management director compensation. The maximum value of total cash and Analysis - equity compensation that may be paid annually is $600,000 for non-management directors other than the non-executive Chair, and $900,000 for the non-executive Chair. The maximum tax equalization payment that may be paid annually is $150,000 for non-management directors other than the non-executive Chair, and $250,000 for the non-executive Chair. The maximum value of other benefits (excluding charitable contributions under the Aon Corporation Outside Director Corporate Bequest Plan) that may be provided annually is $25,000 for all non-management directors, including the non-executive Chair.

45


Other Policies and Practices

 Tax Equalization

For compensation paid in 2023 or earlier, non-management directors are eligible to receive a tax equalization payment if the Ireland income taxes owed on their director compensation exceed the income taxes owed on such compensation in their country of residence. Without these tax equalization payments, a director may be subject to double taxation since they are already paying taxes on their director income in their country of residence. To the extent non-management director compensation is withheld to satisfy Ireland withholding requirements, we provide these tax equalization payments during the year in which the corresponding services are rendered so that the directors are tax-equalized on a current basis, with payment to us in the following year, if required, in order for them to be in the same position as if they were only taxed in their country of residence. Effective in 2024, Aon updated its tax equalization policy for non-management directors to make tax equalization payments in the event a non-management director is subject to double taxation in jurisdictions outside of Ireland where tax treaties (or lack thereof) do not provide full or partial tax credits with respect to director compensation. In such cases, the Company will withhold hypothetical and actual taxes from director compensation and transmit any required taxes to the governing authority. At tax year-end, after tax equalization calculations have been finalized, the director and the Company will settle any amounts due in order for them to be in the same position as if they were only taxed in their country of residence. We believe tax equalization is appropriate to help ensure our ability to continue to attract qualified persons who may not reside in Ireland.

 Matching Charitable

 Contributions

During 2023, Aon Foundation matched up to $10,000 of charitable contributions made to a qualified organization by any non-management director under the Aon Foundation Directors Matching Gift Program.

 Bequest Plan

Non-management directors elected or appointed to serve on the Board before January 1, 2006, and who have completed at least one year of service as a member of the Board, remain eligible to participate in the Aon Corporation Outside Director Corporate Bequest Plan (the “Bequest Plan”), established in 1994. Non-management directors elected or appointed to serve on the Board on or after January 1, 2006 are not eligible to participate in the Bequest Plan.

The Bequest Plan was established to acknowledge the service of non-management directors, to recognize the mutual interest of Aon and our non-management directors in supporting worthy charitable institutions, and to assist us in attracting and retaining non-management directors of the highest caliber. Individual non-management directors derive no financial benefit from the Bequest Plan, as any and all insurance proceeds and tax-deductible charitable donations accrue solely to Aon.

The Bequest Plan allows each eligible non-management director to recommend total charitable contributions of up to $1,000,000 to eligible tax-exempt organizations chosen by the eligible non-management director and approved by Aon Foundation. Each eligible non-management director may designate up to five tax-qualified organizations to receive a portion of the $1,000,000 bequest amount, subject to a $100,000 minimum amount per organization. Each eligible non-management director is paired with another eligible non-management director under the Bequest Plan. The distribution of each eligible non-management director’s charitable bequest amount will begin at the later of: (i) the death of such eligible non-management director; or (ii) the death of the other eligible non-management director with whom such eligible non-management director is paired. Distributions under the Bequest Plan, once they begin, will be made to the designated tax qualified organization(s) in 10 equal annual installments.

 Expense

 Reimbursement

Aon pays or reimburses non-management directors for reasonable travel, lodging, and related expenses in connection with their attendance at Board, Committee, or business meetings, and for other reasonable expenses related to Board service such as continuing education.

46


CEO Pay Ratio Disclosure

As required by the Dodd-Frank Wall Street Reform and Consumer Protection Act, we are providing the following information regarding the relationship between the annual total compensation of our median employee and the annual total compensation of our Chief Executive Officer, Mr. Case. For 2023, our last completed fiscal year, the median annual total compensation of our employees (excluding Mr. Case) was $88,009, and the annual total compensation of Mr. Case was $23,689,198 (this amount is approximately $27,000 higher than the total compensation amount reflected in the Summary Compensation Table appearing of this Amendment because it also includes the value of certain personal benefits and compensation under our non-discriminatory benefit plans, because we included these same types of benefits when calculating the median employee’s compensation). Based on this information and applicable SEC rules, our estimate of the ratio of Mr. Case’s annual total compensation to the median of the annual total compensation for all employees in 2023 was 269 to 1. Given the different methodologies that various public companies will use to determine an estimate of their pay ratio, the estimated ratio reported above should not be used as a basis for comparison between companies.

To identify the median of the annual total compensation of all our employees, we first determined that our total global employee population (including full-time, part-time, and temporary employees) as of December 1, 2023, was 52,582. As permitted by SEC rules, which allow exclusion of a de minimis number of non-US employees in certain jurisdictions, we then excluded the following number of employees in the following jurisdictions, resulting in a total employee number (after applying the exclusions) of 52,271.

Excluded JurisdictionNumber of Employees 

Barbados

9

Estonia

9

Greece

85

Kazakhstan

17

Malta

32

Oman

39

Papua New Guinea

49

Puerto Rico

71

TOTAL

311

Percentage of Total Population Excluded

0.59%

To identify the median employee from this population, we determined that our compensation measure for this purpose would include: (1) an estimate of base salary, determined using the employee’s rate of pay and their work schedule (part-time or full-time), and (for permanent employees who worked part of the year) adjusted for annualization as permitted under SEC rules; and (2) actual performance-based incentives paid under our annual incentive plan during 2023. We chose to use base salary and annual incentives as our compensation measure because these two components represent the most consistently used elements of remuneration across our global workforce (unlike, for example, long-term incentive equity awards, which are only granted to roughly 10% of our employee population). Further, these two components are the most consistently recorded items in our global compensation system. A small percentage of our global employee population is employed on a seasonal or temporary basis; due to difficulties in collecting consistent data regarding periods of actual employment, we estimated the base salary and annual incentive for this group to be zero.

After identifying our median employee by applying the above-described compensation measure consistently to all employees included in the calculation, we identified and calculated the elements of that employee’s total compensation for 2023 and included the value of any personal benefits and compensation under our non-discriminatory benefit plans, as provided in applicable SEC rules. For the median employee, a substantial percentage (approximately 24%) of the total compensation amount was provided in the form of Company contributions to retirement funds and the cost of health and welfare coverage, which are in addition to the cash component of compensation.

47


Pay vs. Performance

As described in the CD&A, Aon has a strong pay for performance philosophy that shapes how we deliver compensation to all colleagues, including the senior executives of the firm. This is evidenced by (1) the weighting of fixed vs variable compensation awarded annually, (2) the proportion of variable compensation delivered in the form of company equity instruments, and (3) the proportion of equity awards that are leveraged on performance conditions above and beyond share price.

2023 Compensation Details

Variable compensation awarded to the Chief Executive Officer (“CEO”) and other NEOs (on average) represented 93% of the total compensation awarded for 2023. To maximize shareholder alignment, over 99% of their variable compensation was delivered in the form of equity, including the annual incentive for the year. Finally, 84% and 81%, respectively, of the equity compensation for the CEO and other NEOs (on average) is comprised of PSUs under our LPP and the July 2023 PSUs that can result in a 0x – 2x payout based on performance against Adjusted EPS goals, and share price performance, respectively, which we believe closely aligns with shareholder value creation.
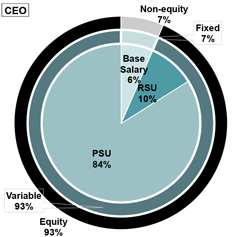
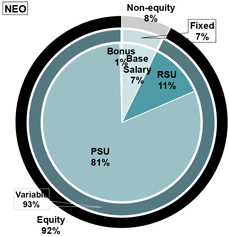
LOGOLOGO

48


PVP Disclosure

In accordance with rules adopted by the SEC pursuant to the Dodd-Frank Wall Street Reform and Consumer Protection Act of 2010, we provide the following disclosure regarding executive compensation covering calculations and narrative of Compensation Actually Paid (“CAP”) under new SEC Pay Versus Performance (“PVP”) disclosure requirements for our principal executive officer (“PEO”) and Non-PEO NEOs and Company performance for the fiscal years listed below. The Compensation Committee did not consider the pay versus performance disclosure below in making its pay decisions for any of the years shown.

 Year 

Summary
Compensation
Table Total for

PEO1

($)


CAP to

PEO 1,2

($)

 Average
Summary
Compensation
Table Total for
Non-PEO
NEOs
1
($)
 Average
CAP Paid
to
Non-PEO
NEOs
1,2
($)
 Value of
Initial Fixed
$100
Investment
based on:
3
 Net
Income
($
Millions)
 Adjusted
Earnings per
Share
Growth
4
 TSR
($)
 Peer
Group
TSR
($)

2023

  23,661,834   26,595,162   16,616,433   14,770,260   144   133   2,564   6%  

2022

  19,668,985   18,544,322   6,643,617   6,472,711   148   119   2,589   12%  

2021

  19,868,384   101,103,407   7,644,425   25,641,567   147   133   1,308   22%  

2020

  20,294,496   39,560,227   6,898,103   11,455,444   102   98   2,018   7%  

1.

The PEO for each year reflected in the table is Gregory C. Case, the Company’s CEO. The non-PEO NEOs are Christa Davies, Eric Andersen (for years 2020, 2021, 2022 and 2023 only), Lisa Stevens, Darren Zeidel (for years 2021, 2022 and 2023 only), John Bruno (for 2020 only) and Anthony Goland (for 2020 only).

2.

The amounts shown for CAP have been calculated in accordance with Item 402(v) of Regulation S-K and do not reflect compensation actually earned, realized, or received by the Company’s NEOs. CAP amounts reflect the Summary Compensation Table Total with exclusions and inclusions of certain amounts for the PEO and the Non-PEO NEOs as set forth below. Equity values are calculated in accordance with FASB ASC Topic 718. Amounts in the Exclusion of Stock Awards column are the totals from the Stock Awards column set forth in the Summary Compensation Table. CAP values for 2020, 2021 and 2022 have been updated from last year’s disclosure to reflect revised guidance from the SEC related to treatment of equity upon retirement eligibility.

PEO

 Year

 Summary
Compensation
Table Total for
PEO
 Exclusion of
Stock Awards
for PEO
 Inclusion of
Equity Values
for PEO
 CAP to PEO

2023

  $23,661,834   ($21,487,348)   $24,420,677   $26,595,162 

2022

  $19,668,985   ($17,497,455)   $16,372,792   $18,544,322 

2021

  $19,868,384   ($15,262,436)   $96,497,459   $101,103,407 

2020

  $20,294,496   ($15,880,566)   $35,146,297   $39,560,227 

Average Non-PEO NEOs

 Year

 Average
Summary
Compensation
Table Total for
Non-PEO
NEOs
 Average
Exclusion of
Change in
Pension
Value for
Non-PEO
NEOs
 Average
Exclusion of
Stock Awards
for Non-PEO
NEOs
 Average
Inclusion of
Equity
Values for
Non-PEO
NEOs
 Average
CAP for
Non-PEO
NEOs

2023

 $16,616,433 ($27,203) ($14,060,598) $12,241,628 $14,770,260

2022

 $6,643,617 $0 ($4,729,173) $4,558,267 $6,472,711

2021

 $7,644,425 $0 ($4,583,837) $22,580,979 $25,641,567

2020

 $6,898,103 ($76,821) ($4,387,596) $9,021,758 $11,455,444

49


The amounts in the Inclusion of Equity Values in the tables above are derived from the amounts set forth in the following tables:

PEO

 Year

 Year-End
Fair Value of
Equity
Awards
Granted
During Year
That
Remained
Unvested as
of Last Day
of Year For
PEO
 Change in
Fair Value
from Last
Day of Prior
Year to Last
Day of Year
of Unvested
Equity
Awards for
PEO
 Change in
Fair Value
from Last Day
of Prior Year
to Vesting
Date of
Unvested
Equity Awards
that Vested for
PEO
 During
Year for
PEO
Value of
Dividends
or Other
Earnings
Paid on
Equity
Awards
Not
Otherwise
Included
For PEO
 Total –
Inclusion of
Equity
Values for
PEO

2023

 $20,584,136 $4,938,480 ($1,119,228) $17,289 $24,420,677

2022

 $16,554,822 ($54,463) ($135,298) $7,731 $16,372,792

2021

 $39,505,306 $38,771,675 $18,213,691 $6,787 $96,497,459

2020

 $20,945,730 $12,685,477 $1,504,280 $10,809 $35,146,297

Average Non-PEO NEOs

 Year

 Average
Year-End
Fair Value of
Equity
Awards
Granted
During Year
That
Remained
Unvested as
of Last Day
of Year For
Non-PEO
NEOs
 Average
Change in
Fair Value
from Last
Day of Prior
Year to Last
Day of Year
of Unvested
Equity
Awards for
Non-PEO
NEOs
 Average
Change in
Fair Value
from Last
Day of
Prior Year
to
Vesting
Date of
Unvested
Equity
Awards
that
Vested for
Non-PEO
NEOs
 Average
Value of
Dividends
or Other
Earnings
Paid on
Equity
Awards Not
Otherwise
Included For
Non-PEO
NEOs
 Total –
Average
Inclusion of
Equity
Values for
Non-PEO
NEOs

2023

 $11,342,481 $1,190,742 ($306,856) $15,261 $12,241,628

2022

 $4,610,526 ($15,910) ($44,340) $7,991 $4,558,267

2021

 $11,452,689 $8,260,538 $2,864,745 $3,007 $22,580,979

2020

 $5,769,308 $2,893,500 $353,392 $5,558 $9,021,758

3.

The Peer Group Total Shareholder Return (“TSR”) set forth in this table utilizes the S&P 500 Financials Index, which we also utilize in the stock performance graph required by Item 201(e) of Regulation S-K included in the Original Filing. The comparison assumes $100 was invested for the period starting December 31, 2019, through the end of the listed year in the Company and in the S&P 500 Financials Index, respectively. Historical stock performance is not necessarily indicative of future stock performance.

4.

We determined Adjusted EPS to be the most important financial performance measure used to link Company performance to CAP to our PEO and Non-PEO NEOs in 2022 and 2023. This performance measure may not have been the most important financial performance measure for years 2021 and 2020 and we may determine a different financial performance measure to be the most important financial performance measure in future years.

50


Description of Relationship Between PEO and Non-PEO NEO CAP and Company Performance

The following describes the relationship between CAP to our PEO, the average of CAP to our Non-PEO NEOs, and the Company’s Adjusted EPS Growth, Net Income and TSR performance over the three most recently completed fiscal years, in accordance with the SEC rules. However, we note that this description is not an explanation of the relationship between Company performance and our executive compensation decisions and pay outcomes, which are described in our CD&A.

Given the structure of the compensation described in our CD&A, CAP to the PEO and Non-PEO NEOs is primarily a function of the combined effects of:

Achievement of our Adjusted EPS goals over overlapping three-year performance cycles, which is reasonably represented by the growth in Adjusted EPS; and

Share price appreciation, which is reasonably represented in TSR performance

The charts below demonstrate the relationship between CAP and these performance measures.

LOGOLOGOLOGO

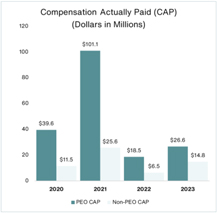
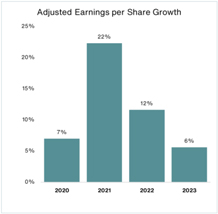
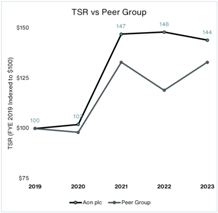
Of note during the period covered by this disclosure is the exceptional TSR performance and growth in our share price during 2021 coincident with very strong growth in Adjusted EPS. This resulted in attainment of the maximum performance levels and corresponding earning of 200% of the target number of shares under the LPP performance share units for more than one performance cycle, which is the primary source of equity compensation provided to our PEO and non-PEO NEOs, as described in our CD&A.

Our net income grew 27% over the 2019-2023 period reflective of strong growth and performance on our key financial metrics, including a decline of 1% for 2023. In 2023, we had adjusted operating income growth of 10%, driven by strong revenue growth, offset by expenses that were not representative of normal business operations and other non-operating expenses which resulted in a net income decline of 1% year over year. Net income performance does not have a strong relationship with the reported CAP to our PEO and Non-PEO NEOs given the lower relative weighting of this measurement of performance as compared to the others previously discussed.

Tabular List of Most Important Financial Performance Measures

The following table presents the financial performance measures that the Company considers to have been the most important in linking CAP to our PEO and Non-PEO NEOs for 2023 to Company performance. The measures in this table are not ranked.

Adjusted Earnings Per Share Growth
Adjusted Operating Income Growth

51


Compensation Committee Interlocks and Insider Participation” inParticipation

No member of the Proxy Statement and is incorporated herein by reference.Compensation Committee has been an officer or employee of the Company. None of our executive officers serves on the board of directors or compensation committee of a company that has an executive officer that serves on our Board of Directors or the Compensation Committee.

52


Item

ITEM 12. Security Ownership of Certain Beneficial Owners and Management and Related Stockholder Matters

Matters.

Equity Compensation Plan Information relating to

The following table summarizes the number of Class A Ordinary Shares that may be issued under our equity compensation plans as of December 31, 2023.

  Plan Category  

Number of securities to be
issued upon exercise of
outstanding options,
warrants and rights
(a)

  Weighted average
exercise price of
outstanding options,
warrants and rights
(b)
  Number of securities
remaining available for
future issuance under
equity compensation
plans (excluding securities
reflected in column (a))
(c)

Equity compensation plans approved by security holders

      5,424,182(1)(2)          299.17(3)          6,787,487(4)  

Equity compensation plans not approved by security holders(5)

        273,069               (6)                (7)    


Total

      5,697,251         299.17         6,787,487 


(1)

This amount includes the following:

2,665,329 shares that may be issued in connection with share awards under the Shareholder-Approved Plan;

543,995 shares that may be issued in connection with outstanding options under the Shareholder-Approved Plan.

8,351 shares that may be used in connection with share awards under the 2001 Aon Stock Incentive Plan;

13,966 shares that may be issued in connection with deferred share awards under the 2001 Aon Stock Incentive Plan;

81,973 shares that may be issued in connection with the US employee share purchase plan;

132,586 shares that may be issued in connection with the UK ShareSave share plan;

23,073 shares that may be issued to satisfy obligations under the Aon Deferred Compensation Plan in connection with the 2001 Aon Stock Incentive Plan; and

1,954,909 shares that may be issued in connection with the settlement of PSUs under the Shareholder-Approved Plan. For awards where the performance period has been completed, the actual number of shares to be issued is shown. For awards tracking significantly below threshold, the threshold number of shares which may be issued is shown. For all other performance share awards, the maximum number of shares which may be issued is shown.

(2)

On November 1, 2002, the Aon Deferred Compensation Plan was amended to discontinue the distribution of shares with respect to deferrals after November 1, 2002, from that plan. As of December 31, 2023, based on a share price of $291.02, the maximum number of shares that could be issued under the Aon Deferred Compensation Plan was 23,073.

(3)

Indicates weighted average exercise price of 543,995 outstanding options under the Shareholder-Approved Plan.

(4)

The total number of Class A Ordinary Shares authorized for issuance in connection with awards under the Shareholder-Approved Plan is 42,800,000. As of December 31, 2023, 4,587,147 shares remained available for future issuance under this plan. The amount shown in column (c) also includes 2,200,340 shares available for future issuance under the Aon plc Global Share Purchase Plan, including 81,973 shares subject to purchase as of December 31, 2023. Permissible awards under the Shareholder-Approved Plan include share options, share appreciation rights, restricted shares, restricted share units and other share-based awards, including awards where the vesting, granting or settlement of which is contingent upon the achievement of specified performance goals, called “performance awards.”

(5)

Below are the material features of our equity compensation plans that have not been approved by shareholders:

Aon Supplemental Savings Plan

The Supplemental Savings Plan (SSP) was adopted by the security ownershipboard of certain beneficial owners and managementdirectors of Aon plc’s ordinary sharesCorporation in 1998. It is set fortha nonqualified supplemental retirement plan that provides benefits to participants in the Aon Savings Plan whose employer matching contributions are limited because of IRS-imposed restrictions. The planoriginally allowed contributions to be credited to a Class A Ordinary Shares account. All amounts credited to a Class A Ordinary Shares accountwere then credited with dividends and other investment returns as under the headings “Equity CompensationAon Savings Plan Information,” “Principal Holdersfund and are settled in Class A Ordinary Shares. Prior to April 1, 2017, before the beginning of Voting Securities,”each plan year, an election could be made by any participant to transfer some or all of a participant’s existing money market account under the SSP to Class A Ordinary Shares account. Beginning April 1, 2017, no new contributions are permitted to be invested in a Class A Ordinary Shares account and “Securityno amounts may be transferred out of such account to another investment option.

53


Under the SSP, eligible employees receive a supplemental allocation based on years of service (between 3 and 6 percent of eligible compensation) and are credited with an additional matching allocation they would have received under the Aon Savings Plan match provision had compensation up to $500,000 been considered. Participants must also contribute the limit prescribed by the IRS ($22,500 for 2023) and be active on the last day of the year to receive the allocation. As of December 31, 2023, the number of shares that could be issued under the plan was 189,735.

Aon Supplemental Employee Stock Ownership Plan

The Aon Supplemental Employee Stock Ownership Plan was a plan established in 1989 as a nonqualified supplemental retirement plan that provided benefits to participants in the Aon Employee Stock Ownership Plan whose employer contributions were limited because of IRS-imposed restrictions. As of 1998, no additional amounts have been credited to participant accounts. Account balances are maintained for participants, and credited with dividends, until distribution is required under the plan. Distributions are made solely in Class A Ordinary Shares. No specific authorization of Class A Ordinary Shares for the plan has been made. As of December 31, 2023, the number of shares that could be issued under the plan was 83,334.

(6)

The weighted-average exercise price of such shares is uncertain and is not included in this column.

(7)

None of these equity compensation plans contain a limit on the number of shares that may be issued under such plans; however, these plans are subject to the limitations set forth in the descriptions of these plans contained in Note 5 above.

Security Ownership of Certain Beneficial Owners and Management

Security Ownership of Directors and Executive Officers”Officers

The following table sets forth the number of Class A Ordinary Shares beneficially owned as of April 12, 2024 by each of Aon’s directors, nominees and NEOs and by Aon’s directors and executive officers as a group. As used in this Amendment, “beneficially owned” means a person has, or may have within 60 days, the sole or shared power to vote or direct the voting of a security and/or the sole or shared investment power with respect to a security (i.e., the power to dispose or direct the disposition of a security). No shares held by Aon’s directors or executive officers are pledged as security. The address of each person named in the Proxy Statement,table below is c/o Aon plc, Metropolitan Building, James Joyce Street, Dublin 1, Ireland.

 Name  Aggregate Number of
Class A Ordinary Shares
Beneficially Owned
1
 

Percent of  

Class2  

Directors


Lester B. Knight3

   363,461    * 

Gregory C. Case4

   1,542,602   * 

Jose Antonio Álvarez

   141   * 

Jin-Yong Cai

   6,756   * 

Jeffrey C. Campbell

   10,970   * 

Fulvio Conti

   30,467   * 

Cheryl A. Francis

   27,643   * 

Adriana Karaboutis

   955   * 

Richard C. Notebaert

   33.497   * 

Gloria Santona

   38,547   * 

Sarah E. Smith

   476   * 

Byron O. Spruell

   4,001   * 

Carolyn Y. Woo

   27,278   * 

Other NEOs


Christa Davies

   161,706   * 

Eric Andersen

   161,118   * 

Lisa Stevens

   9,723   * 

Darren Zeidel5

   31,051   * 

All directors and executive officers as a group (21 persons) 5

   2,504,150   1.3

54


(1)

The directors, nominees and NEOs, and all directors and executive officers of Aon combined, have sole voting power and sole investment power over the Class A Ordinary Shares listed, except as indicated in notes (3), (4), and (5).

(2)

As of April 12, 2024, we had 198,506,718 Class A Ordinary Shares outstanding.

(3)

Includes 134,000 Class A Ordinary Shares that are beneficially owned by family partnership, 124,604 Class A Ordinary Shares owned by Mr. Knight’s spouse, 83,911 Class A Ordinary Shares owned in trusts, and 19,997 Class A Ordinary Shares owned by a family foundation of which Mr. Knight and his spouse are trustees.

(4)

Includes 622,985 Class A Ordinary Shares that are beneficially owned in trust and 547,075 Class A Ordinary Shares held by trusts for which an immediate family member serves as trustee.

(5)

Includes Class A Ordinary Shares that may be acquired by vesting of restricted stock units (“RSUs”) within 60 days after April 12, 2024.

*

An asterisk indicates that the percentage of Class A Ordinary Shares beneficially owned does not exceed 1% of our outstanding Class A Ordinary Shares.

Principal Holders of Voting Securities

As of April 12, 2024, the beneficial owners of 5% or more of Aon’s Class A Ordinary Shares entitled to vote at the Annual Meeting and all such information is incorporated herein by reference.known to the Company were:

  Name and Address of Beneficial Owner  

Number of Class A

Ordinary Shares


Percent

of Class(1)


The Vanguard Group
100 Vanguard Blvd.
Malvern, PA 19355

   17,596,5722   8.86

BlackRock, Inc.
50 Hudson Yards
New York, NY 10001

   13,428,2053   6.76

Massachusetts Financial Services Company
111 Huntington Avenue
Boston, MA 02199

   12,472,4914   6.72

(1)

As of April 12, 2024, we had 198,506,718 Class A Ordinary Shares outstanding.

(2)

Based upon information contained in a Schedule 13G/A filed with the SEC on February 13, 2024, pursuant to Rule 13d-1(b) of the Exchange Act. The Vanguard Group is an investment advisor and has (a) sole voting power as to no Class A Ordinary Shares; (b) shared voting power as to 249,859 Class A Ordinary Shares; (c) sole dispositive power as to 16,751,944 Class A Ordinary Shares; and (d) shared dispositive power as to 844,628 Class A Ordinary Shares.

(3)

Based upon information contained in a Schedule 13G/A filed with the SEC on February 1, 2024, pursuant to Rule 13d-1(b) of the Exchange Act. BlackRock, Inc. is a parent holding company and has: (a) sole voting power as to 12,078,011 Class A Ordinary Shares; (b) shared voting power as to no Class A Ordinary Shares; (c) sole dispositive power as to 13,428,205 Class A Ordinary Shares; and (d) shared dispositive power as to no Class A Ordinary Shares.

(4)

Based upon information contained in a Schedule 13G/A filed with the SEC on February 9, 2024, pursuant to Rule 13d-1(b) of the Exchange Act. Massachusetts Financial Services Company is an investment adviser and has: (a) sole voting power as to 11,557,331 Class A Ordinary Shares; (b) shared voting power as to no Class A Ordinary Shares; (c) sole dispositive power as to 12,472,491 Class A Ordinary Shares; and (d) shared dispositive power as to no Class A Ordinary Shares.

55


Item

ITEM 13. Certain Relationships and Related Transactions, and Director Independence

Information required by this Item is included under the headings “Corporate Governance — Director Independence” and “CertainIndependence.

Certain Relationships and Related Transactions”Transactions

There have been no related person transactions or pending related person transactions since January 1, 2023 that require disclosure pursuant to Item 404 of Regulation S-K. Aon has adopted a written Related Person Transaction Policy governing the review and approval of related person transactions. The terms of these procedures provide that the Governance/Nominating Committee will review transactions in which: (i) Aon is a party or participant; and (ii) any director, director nominee, executive officer, or holder of five percent (5%) or more of Aon’s voting securities, an immediate family member of any such person or an entity controlled by any such person or immediate family member, has a direct or indirect material interest. To facilitate the review and approval of related person transactions, Aon’s directors and executive officers complete an annual director and officer questionnaire and disclose all potential related person transactions involving themselves and their immediate family members. Throughout the year, directors and executive officers are required to notify Aon’s General Counsel of any potential related person transactions of which they become aware. Aon’s General Counsel reports these transactions, as well as any other related person transactions of which he is aware, to the Governance/Nominating Committee. The Governance/Nominating Committee considers all relevant facts of any related person transactions to determine whether to approve or ratify the transaction.

Director Independence

Aon’s Corporate Governance Guidelines require that a majority of directors meet the independence requirements of NYSE. The Corporate Governance Guidelines further provide that each of the Audit Committee, Governance/Nominating Committee and Compensation Committee be composed entirely of independent directors.

The Board has affirmatively determined that each nominee for director other than Mr. Case is independent. Mr. Case is considered a management director because of his position as our Chief Executive Officer. In addition, the Board has affirmatively determined that J. Michael Losh, who retired as a director effective as of June 16, 2023, was independent during the time he served on the Board and that Dr. Woo, who will be retiring from the Board effective as of the Annual Meeting, is independent.

In determining that each of the non-management directors is independent, the Board also considered the following relationships that it deemed were immaterial to such director’s independence:

With respect to Mr. Knight, Mr. Campbell, Ms. Karaboutis, and Mr. Spruell, the Board considered that, in the Proxy Statementordinary course of business, Aon has sold services to, or received services from, a company or other entity at which the director is (or during 2023 was) an employee and is incorporated herein by reference.the amount that we received from or paid to the entity in any of the previous three fiscal years was below the greater of $1 million or two percent (2%) of that entity’s annual revenue; and

With respect to Mr. Knight, Mr. Álvarez, Ms. Francis, Mr. Notebaert, Ms. Santona, and Mr. Spruell, the Board considered that Aon or certain of its affiliates made charitable contributions in 2023 to organizations in which the director or the director’s spouse was an officer, director, or trustee. In each case, the amount that we contributed was below the greater of $1 million or two percent (2%) of that organization’s consolidated gross revenue.

56


Item

ITEM 14. Principal AccountantAccounting Fees and Services

InformationServices.

The following is a summary of the fees billed by Ernst & Young LLP for professional services rendered for the years ended December 31, 2023 and December 31, 2022:

 Type of Fees  2023
($ in millions)
    

2022

($ in millions)

 Audit

      17.3            15.4    

 Audit-Related

   1.5      1.4 

 Tax

   .5      .3 

 All Other Fees


 Total Fees

   19.3      17.1 

Audit Fees

Audit fees included services associated with the annual audit, including fees related to Section 404 of the Sarbanes Oxley Act of 2002, as amended, the reviews of Aon’s documents filed with the SEC and substantially all statutory audits required domestically and internationally.

Audit-Related Fees

Audit-related fees include services such as employee benefit plan audits, other attestation services, due diligence in connection with acquisitions and accounting consultations not included in audit fees.

Tax Fees

Tax fees consist of fees for tax services, including tax compliance, tax advice and tax planning.

All Other Fees

The fees in this category pertain to permissible services not related to financial reporting.

Audit Committee’s Pre-Approval Policies and Procedures

The Audit Committee pre-approves all audit and permissible non-audit services provided by this Item is included under the heading “Auditor Fees”independent registered public accounting firm. These services may include audit services, audit-related services, tax services and other services. Each pre-approval provides details regarding the particular service or category of service to be provided. The Audit Committee requires that the independent registered public accounting firm and management report on the actual fees charged by the independent registered public accounting firm for each category of service at Audit Committee meetings held during the year.

The Audit Committee may pre-approve engagements either on a case-by-case basis or on a category basis. The Audit Committee grants pre-approvals for certain categories of services at the start of each year which are applicable for the year. In considering these pre-approvals, the Audit Committee reviews a description of the scope of services falling within each category and approves budgetary limits for each category. The Audit Committee acknowledges that circumstances may arise throughout the year that require the engagement of the independent registered public accounting firm to provide additional services not contemplated in the Proxy Statement andAudit Committee’s initial pre-approval process. In those circumstances, the Audit Committee requires that specific pre-approval be obtained for any audit or permitted non-audit service that is incorporated herein by reference.

103


PART IV
Item 15.    Exhibits and Financial Statement Schedules
(a)(1) and (2). The following documents have been included in Part II, Item 8.
Report of Ernst & Young LLP, Independent Registered Public Accounting Firm (PCAOB ID: 42), on Financial Statements
Consolidated Statements of Financial Position — As of December 31, 2021 and 2020
Consolidated Statements of Income — Years Ended December 31, 2021, 2020, and 2019
Consolidated Statements of Comprehensive Income — Years Ended December 31, 2021, 2020 and 2019
Consolidated Statements of Shareholders’ Equity — Years Ended December 31, 2021, 2020 and 2019
Consolidated Statements of Cash Flows — Years Ended December 31, 2021, 2020 and 2019
Notes to Consolidated Financial Statements
The following document has beennot included in Part II, Item 9.
Report of Ernst & Young LLP, Independent Registered Public Accounting Firm, on Internal Control over Financial Reporting
All schedulesan approved category, or for which total fees are expected to exceed the Registrant and consolidated subsidiaries have been omitted becauserelevant budgetary limits. The Audit Committee also requires specific pre-approval be obtained for any services in the required information is not present in amounts sufficientother services category.

The Audit Committee has delegated pre-approval authority to require submissionthe Chair of the schedules or becauseAudit Committee for those instances when pre-approval is needed prior to a scheduled Audit Committee meeting. Such pre-approvals are reported to the information required is included inAudit Committee at the respective financial statements or notes thereto.next scheduled Audit Committee meeting.

57


PART IV

ITEM 15. Exhibits.

Exhibit Index

(a)(3). List of Exhibits (numbered in accordance with Item 601 of Regulation S-K)

31.1+

Plan of Acquisition, Reorganization, Arrangement, Liquidation or Succession.
2.1*
2.2*
2.3*
2.4*
2.5*
Articles of Association.
3.1*
Instruments Defining the Rights of Security Holders, Including Indentures.
4.1*
4.2*Capital Securities Guarantee Agreement dated as of January 13, 1997 between Aon and The Bank of New York, as Guarantee Trustee — incorporated by reference to Exhibit 4.8 to Aon’s Registration Statement on Form S-4 (File No. 333-21237) filed on February 6, 1997.
4.3*Capital Securities Exchange and Registration Rights Agreement dated as of January 13, 1997 among Aon, Aon Capital A, Morgan Stanley & Co. Incorporated and Goldman, Sachs & Co. — incorporated by reference to Exhibit 4.10 to Aon’s Registration Statement on Form S-4 (File No. 333-21237) filed on February 6, 1997.
4.4*Debenture Exchange and Registration Rights Agreement dated as of January 13, 1997 among Aon, Aon Capital A, Morgan Stanley & Co. Incorporated and Goldman, Sachs & Co. — incorporated by reference to Exhibit 4.11 to Aon’s Registration Statement on Form S-4 (File No. 333-21237) filed on February 6, 1997.
104


4.5*Guarantee Exchange and Registration Rights Agreement dated as of January 13, 1997 among Aon, Aon Capital A, Morgan Stanley & Co. Incorporated and Goldman, Sachs & Co. — incorporated by reference to Exhibit 4.12 to Aon’s Registration Statement on Form S-4 (File No. 333-21237) filed on February 6, 1997.
4.6*
4.7*
4.8*
4.9*
4.10*
4.11*
4.12*
4.13*
4.14*
4.15*
4.16*
4.17*
4.18*
4.19*
4.20*
4.21*
4.22*
4.23*
105


4.24*
4.25*
4.26*


4.27*
4.28*
4.29*


4.30*


Material Contracts.
10.1*
10.2*
10.3*
10.4*
10.5*


10.6*
10.7*
10.8*
10.9*#
10.10*#
106


10.11*#
10.12*#
10.13*#
10.14*#
10.15*#
10.16*#
10.17*#
10.18*#
10.19*#
10.20#
10.21*#
10.22*#
10.23*#


10.24*#
10.25*#
10.26*#
10.27*#
10.28*#
10.29*#
10.30*#
10.31*#
107


10.32*#
10.33*#
10.34*#
10.35*#
10.36*#
10.37*#
10.38*#
10.39*#
10.40*#
10.41*#
10.42*#


10.43*#

10.44*#
10.45*#
10.46*#


10.47*#
10.48*#
10.49*#
10.50#
10.51#
108


10.52*#
10.53*#
10.54*#
10.55*#
10.56*#
10.57*#
10.58*#
10.59*#
10.60*#
10.61*#
10.62*#
10.63*#
10.64#
10.65*#
10.66*#
10.67*#
10.68*#
10.69*#
10.70*#
10.71*#
10.72*#
109


10.73*#
10.74#
10.75*#
10.76*#
10.77*#
10.78*
10.79*#
10.80*
10.81*#
Subsidiaries of the Registrant.
21.1
Subsidiary Guarantors and Issuers of Guaranteed Securities and Affiliates Whose Securities Collateralize Securities of the Registrant
22.1
Consents of Experts and Counsel.
23
Rule 13a-14(a)/15d-14(a) Certifications.
31.1.

31.2+

31.2.
110


(104)*

Section 1350 Certifications.
32.1.
32.2.
XBRL Exhibits.
Interactive Data Files. The following materials are filed electronically with this Annual Report on Form 10-K:
101.SCHInline XBRL Taxonomy Extension Schema Document.
101.CALInline XBRL Taxonomy Calculation Linkbase Document.
101.DEFInline XBRL Taxonomy Definition Linkbase Document.
101.PREInline XBRL Taxonomy Presentation Linkbase Document.
101.LABInline XBRL Taxonomy Calculation Linkbase Document.
104Cover Page Interactive Data File (formatted as- the cover page interactive data file does not appear in the Interactive Data File because its XBRL tags are embedded within the Inline XBRL and containeddocument (included in Exhibit 101).

*

Submitted electronically with this Amendment.

+

Filed herewith.
*    Document has been previously filed with the SEC and is incorporated herein by reference herein. Unless otherwise indicated, such document was filed under Commission File Number 001-07933.
#    Indicates a management contract or compensatory plan or arrangement.
The registrant agrees to furnish to the SEC upon request a copy of (1) any long-term debt instruments that have been omitted pursuant to Item 601(b)(4)(iii)(A) of Regulation S-K, and (2) any schedules omitted with respect to any material plan of acquisition, reorganization, arrangement, liquidation or succession set forth above.
Item16.    Form 10-K Summary
None.
111

58


SIGNATURES

Pursuant to the requirements of Section 13 or 15(d) of the Securities Exchange Act of 1934, the registrant has duly caused this reportAmendment to be signed on its behalf by the undersigned, thereunto duly authorized.

Aon plc

By:

Aon plc

/s/ Gregory C. Case

By:/s/ GREGORY C. CASE

Gregory C. Case, Chief Executive Officer

Date:February 18, 2022

Date:  April 17, 2024

59


    Pursuant to the requirements

Appendix A

Reconciliation of the Securities Exchange Act Non-GAAP Measures

Aon plc

Reconciliation of 1934, this report has been signed below by the following persons on behalf Non-GAAP Measures—Organic Revenue Growth and Free Cash Flow (Unaudited)

Organic Revenue Growth (Unaudited)

  Years Ended                
(millions) 

December

31, 2023


December

31, 2022

  %
Change
  Less:
Currency
Impact (1)
  Less: Fiduciary
Investment
Income (2)
  Less: Acquisitions,
Divestitures &
Other
  Organic
Revenue
Growth (3)
 

Revenue


Commercial Risk Solutions

 $7,043  $6,715   5  -  2  (2)%   5

Reinsurance Solutions

  2,481   2,190   13   (1  4   -   10 

Health Solutions

  2,433   2,224   9   -   -   (1  10 

Wealth Solutions

  1,431   1,367   5   -   -   1   4 

Elimination

  (12  (17  N/A   N/A   N/A   N/A   N/A 

Total revenue

 $13,376  $12,479   7  -  2  (2)%   7
                             

(1)

Currency impact represents the effect on prior year period results if they were translated at current period foreign exchange rates.

(2)

Fiduciary investment income for the years ended December 31, 2023, 2022, and 2021 was $274 million, $76 million, and $8 million, respectively.

(3)

Organic revenue growth includes the impact of certain intercompany activity and excludes the impact of changes in foreign exchange rates, fiduciary investment income, acquisitions, divestitures (including held for sale disposal groups, which had a 1% favorable impact on total organic revenue growth for the year-ended December 31, 2023), transfers between revenue lines, and gains or losses on derivatives accounted for as hedges.

Free Cash Flow (Unaudited)

   Years Ended December 31    
(millions)    2023      2022    % Change 

Cash provided by operating activities

  $3,435  $3,219   7

Capital expenditures

   (252  (196  29

 Free cash flows(1)

  $3,183  $3,023   5
              

(1)

Free cash flows is defined as cash flow provided by operations minus capital expenditures and as a non-GAAP measure of our core operating performance and cash generating capabilities of our business operations. This non-GAAP measure does not imply or represent a precise calculation of residual cash flow available for discretionary expenditures.

A-1


Aon plc

Reconciliation of the registrantNon-GAAP Measures—Operating Income and in the capacities and on the dates indicated.Diluted Earnings Per Share (Unaudited)(1)

    Years Ended December 31     
(millions except percentages)  2023  2022  %
Change
 

Revenue

  $13,376  $12,479   7% 

Operating income

  $3,785  $3,669   3% 

Amortization and impairment of intangible assets

   89   113   (21)% 

Accelerating Aon United Program expenses (2)

   135   -   100% 

Legal settlements (3)

   197   58   240% 

Transaction costs (4)

   17   -   100% 

Operating income—as adjusted

  $4,223  $3,840   10% 

Operating margin—as reported

   28.3  29.4    

Operating margin—as adjusted

   31.6  30.8    
    Years Ended December 31     
(millions except percentages)  2023  2022  %
Change
 

Operating income—as adjusted

  $4,223  $3,840   10% 

Interest income

   31   18   72% 

Interest expense

   (484  (406  19% 

Total Other income (expense)—as adjusted (5)

   (136  45   (402)% 

Income before income taxes—as adjusted

   3,634   3,497   4% 

Income tax expense (6)

   671   585   15% 

Net income—as adjusted

   2,963   2,912   2% 

Less: Net income attributable to noncontrolling interests

   64   57   12% 

Net income attributable to Aon shareholders—as adjusted

   2,899   2,855   2% 

Diluted net income per share attributable to Aon shareholders—as adjusted

  $14.14  $13.39   6% 

Net income attributable to Aon shareholders—as reported

  $2,564  $2,589   (1)% 

Basic net income per share attributable to Aon shareholders

  $12.60  $12.23   3% 

Diluted net income per share attributable to Aon shareholders – as reported

  $12.51  $12.14   3% 

Weighted average ordinary shares outstanding - basic

   203.5   211.7   (4)% 

Weighted average ordinary shares outstanding - diluted

   205.0   213.2   (4)% 

Effective tax rates (6)


U.S. GAAP

   17.1  16.2    

Non-GAAP

   18.5  16.7    

(1)

Certain noteworthy items impacting operating income in 2023 and 2022 are described in this schedule. The items shown with the caption “as adjusted” are non-GAAP measures.

(2)

Total charges related to the Accelerating Aon United Program are expected to include technology-related costs to facilitate streamlining and simplifying operations, headcount reduction costs, and costs associated with asset impairments, including real estate consolidation costs.

(3)

In the fourth quarter of 2023, Aon recognized actual and anticipated legal settlement expenses in connection with transactions for which capital was arranged by a third party, Vesttoo Ltd. primarily in the form of letters of credit from third party banks that are alleged to have been fraudulent. Certain actual or anticipated legal settlements expenses totaling $197 million have been recognized in the current period, where certain potentially

A-2


SignatureTitleDate
/s/ GREGORY C. CASEChief Executive Officer and
Director (Principal Executive Officer)
February 18,

meaningful amounts may be recoverable in future periods. Additionally, a $58 million charge was recognized in the second quarter of 2022

Gregory C. Case
/s/ LESTER B. KNIGHTNon-Executive Chairman and DirectorFebruary 18, 2022
Lester B. Knight
/s/ JIN-YONG CAIDirectorFebruary 18, 2022
Jin-Yong Cai
/s/ JEFFREY C. CAMPBELLDirectorFebruary 18, 2022
Jeffrey C. Campbell
/s/ FULVIO CONTIDirectorFebruary 18, 2022
Fulvio Conti
/s/ CHERYL A. FRANCISDirectorFebruary 18, 2022
Cheryl A. Francis
/s/ J. MICHAEL LOSHDirectorFebruary 18, 2022
J. Michael Losh
/s/ RICHARD B. MYERSDirectorFebruary 18, 2022
Richard B. Myers
/s/ RICHARD C. NOTEBAERTDirectorFebruary 18, 2022
Richard C. Notebaert
/s/ GLORIA SANTONADirectorFebruary 18, 2022
Gloria Santona
/s/ BYRON SPRUELLDirectorFebruary 18, 2022
Byron Spruell
/s/ CAROLYN Y. WOODirectorFebruary 18, 2022
Carolyn Y. Woo
/s/ CHRISTA DAVIESChief Financial Officer
(Principal Financial Officer)
February 18, 2022
Christa Davies
/s/ MICHAEL NELLERGlobal Controller
(Principal Accounting Officer)
February 18, 2022
Michael Neller with certain other legal settlements reached in matters unrelated to Vesttoo.

112

(4)

In the fourth quarter of 2023, we entered into a definitive agreement to acquire NFP. As part of the definitive agreement, certain transaction costs were incurred including advisory, legal, accounting, and other professional or consulting fees required to complete the acquisition.

(5)

To further our pension de-risking strategy, we settled certain pension obligations in the Netherlands through the purchase of annuities, where certain pension assets were liquidated to purchase the annuities. A non-cash settlement charge totaling $27 million was recognized in the second quarter of 2023, which is excluded from the 2023 Total Other income (expense) - as adjusted. We also purchased an annuity for portions of our U.S. pension plans that will settle certain obligations. A non-cash settlement charge totaling $170 million was recognized in the fourth quarter of 2022, which is excluded from the 2022 Total Other income (expense) - as adjusted.

(6)

Adjusted items are generally taxed at the estimated annual effective tax rate, except for the applicable tax impact associated with the anticipated sale of certain assets and liabilities classified as held for sale, certain pension and legal settlements, AAU Program expenses, and certain transaction costs and other charges related to the definitive agreement to acquire NFP, which are adjusted at the related jurisdictional rate.

A-3