UNITED STATES
SECURITIES AND EXCHANGE COMMISSION
WASHINGTON, D.C. 20549
___________________________________
FORM 10-K
_______________________________________________
| | | | | |
| ☑ | ANNUAL REPORT PURSUANT TO SECTION 13 OR 15(d) OF THE SECURITIES EXCHANGE ACT OF 1934 |
For the fiscal year ended December 31, 20212023
OR
| | | | | |
| ☐ | TRANSITION REPORT PURSUANT TO SECTION 13 OR 15(d) OF THE SECURITIES EXCHANGE ACT OF 1934 |
For the transition period from to
Commission file number 001-38730
LINDE PLC
(Exact name of registrant as specified in its charter)
| | | | | | | | |
| Ireland | | 98-1448883 |
| (State or other jurisdiction of incorporation) | | (I.R.S. Employer Identification No.) |
| | |
| 10 Riverview Drive, | | The Priestley CentreForge |
| Danbury, Connecticut | | 10 Priestly Road43 Church Street West |
| United States 06810 | | Woking, Surrey Research ParkGU21 6HT |
| | Guilford, Surrey GU2 7XY |
| | United Kingdom |
| | |
| (Address of principal executive offices) (Zip Code) |
| (203) 837 - 2000 | | +44 14 83 242200 |
| (Registrant's telephone number, including area code) |
Securities registered pursuant to Section 12(b) of the Act:
| | | | | | | | |
| Title of each class: | Trading Symbol(s) | Name of each exchange on which registered: |
| Ordinary shares (€0.001 nominal value per share) | LIN | New York Stock ExchangeNASDAQ |
| | |
| | |
| | |
| | |
| | |
| | |
| | |
| | |
| | |
| | |
| | |
| | |
| | |
| | |
Securities registered pursuant to Section 12(g) of the Act: None
___________________________________
Indicate by check mark if the registrant is a well-known seasoned issuer, as defined in Rule 405 of the Securities Act. Yes ☑ No ☐
Indicate by check mark if the registrant is not required to file reports pursuant to Section 13 or Section 15(d) of the Act. Yes ☐ No ☑
Indicate by check mark whether the registrant (1) has filed all reports required to be filed by Section 13 or 15(d) of the Securities Exchange Act of 1934 during the preceding 12 months (or for such shorter period that the registrant was required to file such reports), and (2) has been subject to such filing requirements for the past 90 days. Yes ☑ No ☐
Indicate by check mark whether the registrant has submitted electronically every Interactive Data File required to be submitted and posted pursuant to Rule 405 of Regulation S-T (§232.405 of this chapter) during the preceding 12 months (or for such shorter period that the registrant was required to submit such files). Yes ☑ No ☐
Indicate by check mark whether the registrant is a large accelerated filer, an accelerated filer, a non-accelerated filer, a smaller reporting company, or emerging growth company. See the definitions of "large accelerated filer," "accelerated filer," " smaller reporting company, " and "emerging growth company" in Rule 12b-2 of the Exchange Act.
Large accelerated filer ☑ Accelerated filer ☐ Non- accelerated filer ☐ Smaller reporting company ☐ Emerging growth company ☐
If an emerging growth company, indicate by check mark if the registrant has elected not to use the extended transition period for complying with any new or revised financial accounting standards provided pursuant to Section 13(a) of the Exchange Act. ☐
Indicate by check mark whether the registrant has filed a report on and attestation to its management's assessment of the effectiveness of its internal control over financial reporting under Section 404(b) of the Sarbanes-Oxley Act (15 U.S.C. 7262(b)) by the registered public accounting firm that prepared or issued its audit report. Yes ☑ No ☐
If securities are registered pursuant to Section 12(b) of the Act, indicate by check mark whether the financial statements the registrant included in the filing reflect the correction of an error to previously issued financial statements. ☐
Indicate by check mark whether any of those error corrections are restatements that required a recovery analysis of incentive-based compensation received by any of the registrant’s executive officers during the relevant recovery period pursuant to §240.10D-1(b). ☐
Indicate by check mark whether the registrant is a shell company (as defined in Rule 12b-2 of the Act). Yes ☐ No ☑
The aggregate market value of the voting and non-voting common stock held by non-affiliates as of June 30, 2021,2023, was approximately $149$186 billion (based on the closing sale price of the stock on that date as reported on the New York Stock Exchange). NYSE was the exchange on which Linde’s stock was listed before it delisted from the NYSE and became listed on the Nasdaq Stock Market as of November 7, 2023.
At January 31, 2022, 507,744,5772024, 481,576,472 ordinary shares of €0.001 nominal value per share of the Registrant were outstanding.
Documents incorporated by reference:
Portions of the Proxy Statement of Linde plc for its 20222024 Annual General Meeting of Shareholders, to be filed with the Securities and Exchange Commission within 120 days after the end of the company’s fiscal year, are incorporated in Part III of this report.
LINDE PLC
ANNUAL REPORT ON FORM 10-K
For the fiscal year ended December 31, 20212023
TABLE OF CONTENTS
| | | | | | | | |
| | | Page |
| | |
| Part I | | |
| | |
| Item 1: | | |
| Item 1A: | | |
| Item 1B: | | |
| Item 1C: | | |
| Item 2: | | |
| Item 3: | | |
| Item 4: | | |
| | |
| Part II | | |
| | |
| Item 5: | | |
| Item 6: | | |
| Item 7: | | |
| Item 7A: | | |
| Item 8: | | |
| Item 9: | | |
| Item 9A: | | |
| Item 9B: | | |
| | |
| Item 9C: | | |
| | |
| Part III | | |
| | |
| Item 10: | | |
| Item 11: | | |
| Item 12: | | |
| Item 13: | | |
| Item 14: | | |
| | |
| Part IV | | |
| | |
| Item 15: | | |
| Item 16: | | |
| |
| |
FORWARD-LOOKING STATEMENTS
This document contains “forward-looking statements” within the meaning of the Private Securities Litigation Reform Act of 1995. These forward-looking statements are identified by terms and phrases such as: anticipate, believe, intend, estimate, expect, continue, should, could, may, plan, project, predict, will, potential, forecast, and similar expressions. They are based on management’s reasonable expectations and assumptions as of the date the statements are made but involve risks and uncertainties. These risks and uncertainties include, without limitation: the performance of stock markets generally; developments in worldwide and national economies and other international events and circumstances, including trade conflicts and tariffs; changes in foreign currencies and in interest rates; the cost and availability of electric power, natural gas and other raw materials; the ability to achieve price increases to offset cost increases; catastrophic events including natural disasters, epidemics, pandemics such as COVID-19, and acts of war and terrorism; the ability to attract, hire, and retain qualified personnel; the impact of changes in financial accounting standards; the impact of changes in pension plan liabilities; the impact of tax, environmental, healthcare and other legislation and government regulation in jurisdictions in which the company operates; the cost and outcomes of investigations, litigation and regulatory proceedings; the impact of potential unusual or non-recurring items; continued timely development and market acceptance of new products and applications; the impact of competitive products and pricing; future financial and operating performance of major customers and industries served; the impact of information technology system failures, network disruptions and breaches in data security; and the effectiveness and speed of integrating new acquisitions into the business. These risks and uncertainties may cause actual future results or circumstances to differ materially from accounting principles generally accepted in the United States of America, International Financial Reporting Standards or adjusted projections, estimates or other forward-looking statements.
Linde plc assumes no obligation to update or provide revisions to any forward-looking statement in response to changing circumstances. The above listed risks and uncertainties are further described in Item 1A (Risk Factors) in this report, which should be reviewed carefully. Please consider Linde plc’s forward-looking statements in light of those risks.
Linde plc and Subsidiaries
PART I
ITEM 1. BUSINESS
General
Linde plc is a public limited company formed under the laws of Ireland with its principal offices in the United Kingdom and United States. Linde is the largest industrial gas company worldwide and is a major technological innovator in the industrial gases industry. Its primary products in its industrial gases business are atmospheric gases (oxygen, nitrogen, argon, and rare gases) and process gases (carbon dioxide, helium, hydrogen, electronic gases, specialty gases, and acetylene)acetylene etc). The company also designs and builds equipment that produces industrial gases and offers customers a wide range of gas production and processing services such as olefin plants, natural gas plants, air separation plants, hydrogen and synthesis gas plants and other types of plants.
Linde serves a diverse group of industries including healthcare, chemicals and energy, manufacturing, metals and mining, food and beverage, and electronics.
Linde’s sales were $32,854 million, $33,364 million, and $30,793 million $27,243 million,for 2023, 2022, and $28,228 million for 2021, 2020, and 2019, respectively. Refer to Item 7, Management's Discussion and Analysis, for a discussion of consolidated sales and Note 18 to the consolidated financial statements for additional information related to Linde’s reportable segments.
Industrial Gases Products and Manufacturing Processes
Atmospheric gases are the highest volume products produced by Linde. Using air as its raw material, Linde produces oxygen, nitrogen and argon through several air separation processes of which cryogenic air separation is the most prevalent. Rare gases, such as krypton, neon and xenon, are also produced through cryogenic air separation. As a pioneer in the industrial gases industry, Linde is a leader in developing a wide range of proprietary and patented applications and supply systems technology. Linde also led the development and commercialization of non-cryogenic air separation technologies for the production of industrial gases. These technologies open important new markets and optimize production capacity for the company by lowering the cost of supplying industrial gases. These technologies include proprietary vacuum pressure swing adsorption (“VPSA”) and membrane separation to produce gaseous oxygen and nitrogen, respectively.
Process gases, including carbon dioxide, hydrogen, carbon monoxide, helium, specialty gases and acetylene are produced by methods other than air separation. Most carbon dioxide is purchased from by-product sources, including chemical plants, refineries and industrial processes or is recovered from carbon dioxide wells. Carbon dioxide is processed in Linde’s plants to produce commercial and food-grade carbon dioxide.
Hydrogen is produced from a range of feedstocks using an array of different technologies. Despite hydrogen being an invisible molecule, colors are often used to designate and differentiate between the production processes used to produce the molecule. The vast majority of hydrogen currently produced by Linde is what is termed gray hydrogen and is derived from natural gas or methane, using steam methane reformation technology. Linde has multiple technologies to produce other types of hydrogen, including blue and green hydrogen, which are both considered types of clean energy. Blue hydrogen is produced by capturing the carbon emissions from the hydrogen plant and either utilizing them in a way that stops them from being emitted or sequestering them in the subsurface for the long term. Green hydrogen is produced by electrolysis using renewable energy or from the steam methane reforming of biomethane. Low carbon intensity, high-purity hydrogen is also produced by purifying and recovering by-product hydrogen sources from the chemical and petrochemical industries.
Carbon monoxide can be produced by either steam methane reforming or auto-thermal reforming of natural gas or other feed streams such as naphtha. Most carbon dioxide is purchased from by-product sources, including chemical plants, refineries and industrial processes or is recovered from carbon dioxide wells. Carbon dioxide is processed in Linde’s plants to produce commercial and food-grade carbon dioxide. Helium is sourced from certain helium-rich natural gas streams in the United States, with additional supplies being acquired from outside the United States. Carbon monoxide can be produced by either steam methane reforming or auto-thermal reforming of natural gas or other feed streams such as naphtha. Acetylene is primarily sourced as a chemical by-product, but may also be produced from calcium carbide and water.
Industrial Gases Distribution
There are three basic distribution methods for industrial gases: (i) on-site or tonnage; (ii) merchant or bulk liquid; and (iii) packaged or cylinder gases. These distribution methods are often integrated, with products from all three supply modes coming from the same plant. The method of supply is generally determined by the lowest cost means of meeting the customer’s needs, depending upon factors such as volume requirements, purity, pattern of usage, and the form in which the product is used (as a gas or as a cryogenic liquid).
On-site. Customers that require the largest volumes of product (typically oxygen, nitrogen and hydrogen) and that have a relatively constant demand pattern are supplied by cryogenic and process gas on-site plants. Linde constructs plants on or
adjacent to these customers’ sites and supplies the product directly to customers by pipeline. On-site product supply contracts generally are total requirement contracts with terms typically ranging from 10-20 years and containing minimum purchase requirements and price escalation provisions. Many of the cryogenic on-site plants also produce liquid products for the merchant market. Therefore, plants are typically not dedicated to a single customer. Advanced air separation processes allow on-site delivery to customers with smaller volume requirements.
Merchant. The merchant business is generally associated with distributable liquid oxygen, nitrogen, argon, carbon dioxide, hydrogen and helium. The deliveries generally are made from Linde’s plants by tanker trucks to storage containers at the customer's site which are usually owned and maintained by Linde and leased to the customer. Due to distribution cost, merchant oxygen and nitrogen generally have a relatively small distribution radius from the plants at which they are produced. Merchant argon, hydrogen and helium can be shipped much longer distances. The customer agreements used in the merchant business are usually three to seven-year requirement contracts.
Packaged Gases. Customers requiring small volumes are supplied products in metal containers called cylinders, under medium to high pressure. Packaged gases include atmospheric gases, carbon dioxide, hydrogen, helium, acetylene and related products. Linde also produces and distributes in cylinders a wide range of specialty gases and mixtures. Cylinders may be delivered to the customer’s site or picked up by the customer at a packaging facility or retail store. Packaged gases are generally sold under one to three-year supply contracts and through purchase orders.
Engineering
Linde’s Engineering business has a global presence, with its focus on market segments such as olefin, natural gas, air separation, hydrogen, synthesis, olefin and synthesisnatural gas plants. The company utilizes its extensive process engineering know-how in the planning, design and construction of highly efficient turnkey plants for the production and processing of gases. With its state-of-the-art sustainable technologies Engineering also helps customers avoid, capture and utilize CO2 emissions. Its technology portfolio covers the entire value chain for production, liquefaction, storage, distribution and application of hydrogen which supports the transition to clean energy. Its digital services and solutions increase plant efficiency and performance.
Linde's plants are used in a wide variety of fields: in the petrochemical and chemical industries, in refineries and fertilizer plants, to recover air gases, to produce synthesis gases, to treat natural gas and to produce noble gases. The Engineering business either supplies plant components directly to the customer or to the industrial gas business of Linde which operates the plants under a long-term gases supply contract.
Inventories – Linde carries inventories of merchant and cylinder gases and hardgoods to supply products to its customers on a reasonable delivery schedule. On-site plants and pipeline complexes have limited inventory. InventoryInventory obsolescence is not material to Linde’s business.
Customers – Linde is not dependent upon a single customer or a few customers.
International – Linde is a global enterprise with approximately 70%68% of its 20212023 sales outside of the United States. The company also has majority or wholly owned subsidiaries that operate in approximately 45 European, Middle Eastern and African countries (including Germany, the United Kingdom (U.K.), France, Sweden, and the Republic of South Africa, and the United Kingdom (U.K.))Africa); approximately 20 Asian and South Pacific countries (including China, Australia, India, South Korea and Thailand); and approximately 20 countries in North and South America (including Canada, Mexico and Brazil).
The company also has equity method investments operating in Europe, Asia, Africa,and the Middle East, and North America.East.
Linde’s non-U.S. business is subject to risks customarily encountered in non-U.S. operations, including fluctuations in foreign currency exchange rates, import and export controls, and other economic, political and regulatory policies of local governments. Also, see Item 1A. “Risk Factors” and Item 7A. “Quantitative and Qualitative Disclosures About Market Risk.”
Seasonality – Linde’s business is generally not subject to seasonal fluctuations to any significant extent.
Research and Development – Linde’s research and development is directed toward development of gas processing, separation and liquefaction technologies, and clean energy technologies; improving distribution of industrial gases and the development of new markets and applications for these gases. This results in the development of new advanced air separation, hydrogen, synthesis gas, natural gas, adsorption and chemical process technologies; novel clean energy and carbon management solutions; as well as the frequent introduction of new industrial gas applications. Research and
development is primarily conducted at Munich,in Pullach, Germany, Tonawanda, New York, Burr Ridge, Illinois and Shanghai, China.
Patents and Trademarks – Linde owns or licenses a large number of patents that relate to a wide variety of products and processes. Linde’s patents expire at various times over the next 20 years. While these patents and licenses are considered important to its individual businesses, Linde does not consider its business as a whole to be materially dependent upon any one particular patent, or patent license, or family of patents. Linde also owns a large number of trademarks, of which the "Linde" trademark is the most significant.
Raw Materials and Energy Costs – Energy is the single largest cost item in the production and distribution of industrial gases. Most of Linde’s energy requirements are in the form of electricity, natural gas and diesel fuel for distribution. The company mitigates electricity, natural gas, and hydrocarbon price fluctuations contractually through pricing formulas, surcharges, and cost pass–through and tolling arrangements.
The supply of energy has not typically been a significant issue in the geographic areas where the company conducts business. However, energy availability and price is unpredictable and may pose unforeseen future risks.
For carbon dioxide, carbon monoxide, helium, hydrogen and specialty gases, raw materials are largely purchased from outside sources. Linde has contracts or commitments for, or readily available sources of, most of these raw materials; however, their long-term availability and prices are subject to market conditions.
Competition – Linde participates in highly competitive markets in industrial gases and engineering, which are characterized by a mixture of local, regional and global players, all of which exert competitive pressure on the parties. In locations where Linde has pipeline networks, which enable the company to provide reliable and economic supply of products to larger customers, Linde derives a competitive advantage.
Competitors in the industrial gases industry include global and regional companies such as L’Air Liquide S.A., Air Products and Chemicals, Inc., Messer Group GmbH, Mitsubishi Chemical Holdings Corporation (through Taiyo Nippon Sanso Corporation) as well as an extensive number of small to medium size independent industrial gas companies which compete locally as producers or distributors. In addition, a significant portion of the international gases market relates to customer-owned plants.
Employees – The company sources talent from an ever-changing and competitive environment. The ability to source and retain qualified and committed employees is a prerequisite for the company’s success, and represents a general risk for Linde.
The Board of Directors ("Board") has established a strategic business objective to maintain world-class standards in talent management. Executive variable compensation is assessed annually based on performance in financial measures as well as in several strategic non-financial areas, including talent management. The Human Capital Committee assists the Board in its oversight of Linde’s compensation and incentive policies and programs, and management development and succession, particularly in regard to reviewing executive compensation for Linde’s executive officers. The Human Capital Committee also periodicallyannually reviews the company’s management development and succession programs, diversity policies and objectives, and the associated programs to achieve those objectives. The global head of Human Resources reports to the Chief Executive Officer ("CEO"). A global leader of Diversity, Equity and Inclusion reports to the head of Human Resources.
Linde has aligned diversity and inclusion with its business strategies and implemented diversity action planning into business process and performance management. Diversity, equity and inclusion are line management responsibilities and Linde seeks competitive advantage through proactive management of its talent pipeline procurement and recruiting processes. Linde provides equal employment opportunity, and recruits, hires, promotes and compensates people based solely on their meritperformance and ability.
Employees receive a competitive salary and variable compensation components based on meritperformance and depending on their position.job level. Linde has collective bargaining agreements with unions at numerous locations throughout the world. Additional benefits are offered such as occupational pensions and contributions towards health insurance or medical screening, reflecting regional conditions and local competition. Managers’ compensation is based on performance. Senior managers participate directly in the company’s growth in value through the Long Term Incentive Plan of Linde plc. In addition, annually managers have the ability to grant leadership awards under the Long Term Incentive Plan to certain eligible employees. From time to time, Linde may introduce special compensation schemes to recognize or reward specific individuals such as the one implemented in 2020 for global front-line employees. Work-life balance is promoted by providing a range of opportunities that are based on the overall local conditions. Linde also invests in professional development of its employees through formal and on-the-job training.
As of December 31, 2021,2023, Linde had 72,32766,323 employees worldwide comprised of approximately 27 percent women and 73 percent men . The total professional workforce comprised of approximately 28 percent women and 72 percent men. The total professional workforce is comprised of approximately 29 percent women and 71 percent men.
Environment – Information required by this item is incorporated herein by reference to the section captioned “Management’s Discussion and Analysis – Environmental Matters” in Item 7 of this 10-K.
Available Information – The company makes its periodic and current reports available, free of charge, on or through its website, www.linde.com, as soon as practicable after such material is electronically filed with, or furnished to, the Securities and Exchange Commission ("SEC"). Investors may also access from the company website other investor information such as press releases and presentations. Information on the company’s website is not incorporated by reference herein. In addition, the public may read and copy any materials filed with the SEC free of charge at the SEC’s website, www.sec.gov, that contains reports, proxy information statements and other information regarding issuers that file electronically.
Executive Officers – The following Executive Officers have been elected by the Board of Directors and serve at the pleasure of the Board. It is expected that the Board will elect officers annually following each annual meeting of shareholders.
Stephen F. Angel, 66, has been Chief Executive Officer and a director of Linde since 2018. Effective March 1, 2022, Mr. Angel will retire from the position of Chief Executive Officer and assume the role of Chairman of the Board of Directors of Linde. Prior to his appointment as
Sanjiv Lamba, 59, was appointed Chief Executive Officer of Linde Mr. Angeleffective March 1, 2022. Prior to being appointed CEO, he was Chairman, President and CEO of Praxair, Inc. since 2007. Mr. Angel joined Praxair in 2001 as an Executive Vice President and was named President and Chief Operating Officer starting in February 2006. Prior to joining Praxair, Mr. Angel spent 22 years in a variety of management positions with General Electric. Mr. Angel serves on the board of directors of PPG Industries where he chairs the Human Capital Management and Compensation Committee and serves on the Nominating and Governance Committee. He also serves on the Hydrogen Council and is a member of The Business Council.
Sean Durbin, 51, became Executive Vice President, EMEA in April 2021. Previously, he served as Senior Vice President, Global Functions beginning in July 2020. Durbin joined Praxair, Inc. in 1993 and served in various roles across operations, engineering, project management, business development and sales. In recent years, he has held leadership positions including Business President, Region Europe South from 2019 to 2020, and President, Praxair Canada Inc. from 2013 to 2019.
Kelcey E. Hoyt, 52, became the Chief Accounting Officer of Linde in October 2018. Prior to this, she served as Vice President and Controller of Praxair, Inc. beginning in August 2016. Prior to becoming Controller, she served as Praxair’s Director of Investor Relations since 2010. She joined Praxair in 2002 and served as Director of Corporate Accounting and SEC Reporting through 2008, and later served as Controller for various divisions within Praxair’s North American Industrial Gas business. Previously, she was in audit at KPMG, LLP.
Sanjiv Lamba, 57, was appointed Chief Operating Officer of Linde effective January 1, 2021 and effective March 1, 2022, Mr. Lamba will become Chief Executive Officer of Linde. Previously, he servedafter serving as the Executive Vice President, APAC, beginning in October 2018. Prior to that,Previously, Mr. Lamba was appointed a Member of the Executive Board of Linde AG in 2011, responsible for the Asia, Pacific segment of the Gases Division, for Global Gases Businesses Helium & Rare Gases, Electronics as well as Asia Joint Venture Management. Mr. Lamba started his career 1989 with BOC India in Finance where he progressed to become Director of Finance before being appointed as Managing Director for BOC’s India’s business in 2001. Throughout his years with BOC/Linde, he worked in various roles across a number of different geographies including Germany, the UK,U.K., Singapore and India.
Guillermo Bichara, 49, is Executive Vice President and Chief Legal Officer. He previously served as Praxair’s Vice President and General Counsel. Mr. Bichara joined the company in 2006, first as Director of Legal Affairs at Praxair Mexico before being promoted to Vice President and General Counsel of Praxair Asia. He subsequently had responsibility for Europe, Mexico and corporate transactions before being promoted to Associate General Counsel and Assistant Secretary. Mr. Bichara previously held roles at Cemex and various global law firms.
Sean Durbin, 53, became Executive Vice President, North America effective September 1, 2023. Previously, he served as Executive Vice President, EMEA from April 2021 to September 2023 and Senior Vice President, Global Functions from July 2020. Durbin joined Praxair, Inc. in 1993 and served in various roles across operations, engineering, project management, business development and sales. In recent years, he has held leadership positions including Business President, Region Europe South from 2019 to 2020, and President, Praxair Canada Inc. from 2013 to 2019.
Kelcey E. Hoyt, 54, became the Chief Accounting Officer of Linde in October 2018. Prior to this, she served as Vice President and Controller of Praxair, Inc. beginning in August 2016. Prior to becoming Controller, she served as Praxair’s Director of Investor Relations since 2010. She joined Praxair in 2002 and served as Director of Corporate Accounting and SEC Reporting through 2008, and later served as Controller for various divisions within Praxair’s North American Industrial Gas business. Previously, she was in audit at KPMG, LLP.
Juergen Nowicki, 58,60, was appointed Executive Vice President and CEO, Linde Engineering in April 2020. Prior to this, he was Senior Vice President, Commercial, Linde Engineering. Mr. Nowicki joined Linde in 1991 as an Internal Auditor and held various positions in Finance and Controlling. In 2002, he was appointed CFO Linde Gas North America, USA, and was named Head of Finance and Control for The Linde Group in 2006. Nowicki assumed the role of Managing Director, Linde Engineering in 2011.
Dr. Andreas Opfermann, 50, became Executive Vice President, Clean Energy in June 2021. Previously, he was Executive Vice President Americas beginning in November 2019. Prior to this, from 2016-2019, he was the regional business unit leader for Linde’s North European region. Dr. Opfermann joined Linde in 2005 initially in Corporate Strategy. He has subsequently served as Head of Innovation Management from 2008 to 2010, Head of Clean Energy and Innovation Management from 2010 to 2014, and Head of Technology and Innovation from 2015 to 2016, responsible for all Linde research and development. Before joining Linde, he held positions at McKinsey & Company.
John Panikar, 54,56, was appointed Executive Vice President, APAC of Linde effective in January 2021. Previously, he served as President UK & Africa of Linde since October 2018. From 2014 to 2018, Mr. Panikar was President of Praxair Asia. He began his career with Praxair in 1991 as an Applications Engineer. Over the years, Mr. Panikar held increasingly responsible positions including Manager of Site Services and Equipment, Business Development Director for Praxair Asia, Managing Director of Praxair India, VP, South Region, North American Industrial Gases and President, Praxair Distribution, Inc.
Oliver Pfann, 55, was appointed Senior Vice President, EMEA effective September 1, 2023. Since 1995, Oliver Pfann has served in a range of roles at Linde. He began his career in Product Development and then as Sales Manager in Romania. He transitioned to Global Key Accounts and was named General Manager of Linde Italy in 2004. Since 2007, Pfann led a
regional cluster in Eastern Europe with an increasing number of countries. In 2017, he was promoted to lead the Region UK, Ireland and Africa before assuming his assignment as Business President for Region Europe East in 2019.
David P. Strauss, 65, has been Executive Vice President and Chief Human Resources Officer since 2022. From 2018 to 2021, he was Senior Vice President and Chief Human Resources Officer. Mr. Strauss joined Linde in 1990 as an Applications Engineer before being promoted to lead the electronics materials business. From 2000 to 2013, he served as the General Manager for Linde Advanced Material Technologies Inc. (formerly “Praxair Surface Technologies, Inc.”). In 2013, he became Vice President of Safety, Health and Environment before being named Chief Human Resources Officer of Praxair, Inc., a position he held from 2016 until 2018.
Matthew J. White, 49,51, became Executive Vice President and Chief Financial Officer of Linde in October 2018. He previously served as the Senior Vice President and Chief Financial Officer of Praxair, Inc. since January 1, 2014. Prior to this, Mr. White was President of Praxair Canada from 2011-2014.2011 to 2013. He joined Praxair in 2004 as finance director for the company’s largest business unit, North American Industrial Gases. In 2008, he became Vice President and Controller of Praxair, Inc., then was named Vice President and Treasurer in 2010. Before joining Praxair, White was vice president, finance,Vice President, Finance, at Fisher Scientific and before that he held various financial positions, including group controller, at GenTek, a manufacturing and performance chemicals company.
ITEM 1A. RISK FACTORS
Due to the size and geographic reach of the company’s operations, a wide range of factors, many of which are outside of the company’s control, could materially affect the company’s future operations and financial performance. Management believes the following risks may significantly impact the company:
The COVID-19 global pandemic could materially adversely affect our results of operations.
The COVID-19 global pandemic, including resurgences and variants of the virus that causes COVID-19, and efforts to reduce its spread have led, and may continue to lead to, significant changes in levels of economic activity and significant disruption and volatility in global markets. COVID-19 has resulted in authorities implementing numerous measures to try to contain the virus, such as travel bans and restrictions, quarantines, shelter in place orders, and shutdowns. These measures have impacted and may further impact our workforce and operations, the operations of our customers, vendors and suppliers. There is considerable uncertainty regarding such measures and potential future measures, and restrictions on our access to our manufacturing facilities or on our support operations or workforce, or similar limitations for our vendors and suppliers, and restrictions or disruptions of transportation, such as reduced availability of air transport, port closures, and increased border controls or closures, could limit our capacity to meet customer demand and have a material adverse effect on our results of operations. These restrictions and disruptions could affect our performance on our contracts.
Furthermore, COVID-19 has impacted and may further impact the broader economies of affected countries, including negatively impacting economic growth, the proper functioning of financial and capital markets, foreign currency exchange rates, and interest rates. Risks related to economic conditions are described in our Principal Risks and Uncertainties titled “Weakening economic conditions in markets in which Linde does business may adversely impact its financial results and/or cash flows” and “Macroeconomic factors may impact Linde’s ability to obtain financing or increase the cost of obtaining financing which may adversely impact Linde’s financial results and/or cash flows."
Weakening economic conditions in markets in which Linde does business may adversely impact its financial results and/or cash flows.
Linde serves a diverse group of industries across more than 10080 countries, which generally leads to financial stability through various business cycles. However, a broad decline in general economic or business conditions in the industries served by its customers could adversely affect the demand for Linde’s products and impair the ability of its customers to satisfy their obligations to Linde, resulting in uncollected receivables and/or unanticipated contract terminations or project delays. For example, global political and economic uncertainty could reduce investment activities of Linde’s customers, which could adversely affect Linde’s business.
In addition, many of Linde’s customers are in businesses that are cyclical in nature, such as the chemicals, metals and energy industries. Downturns in these industries may adversely impact Linde during these cycles. Additionally, such conditions could impact the utilization of Linde’s manufacturing capacity which may require it to recognize impairment losses on tangible assets such as property, plant and equipment, as well as intangible assets such as goodwill, customer relationships or intellectual property.
Increases in the cost of energy and raw materials and/or disruption in the supply of these materials could result in lost sales or reduced profitability.
Energy is the single largest cost item in the production and distribution of industrial gases. Most of Linde’s energy requirements are in the form of electricity, natural gas and diesel fuel for distribution. Linde attempts to minimize the financial impact of variability in these costs through the management of customer contracts and reducing demand through operational productivity and energy efficiency. Large customer contracts typically have escalation and pass-through clauses to recover energy and feedstock costs. Such attempts may not successfully mitigate cost variability, which could negatively impact Linde’s financial condition or results of operations. The supply of energy has not been a significant issue in the geographic areas where Linde conducts business. However, regional energy conditions are unpredictable and may pose future risk.
For carbon dioxide, carbon monoxide, helium, hydrogen and specialty gases, raw materials are largely purchased from outside sources. Where feasible, Linde sources several of these raw materials, including carbon dioxide, hydrogen and calcium carbide, as chemical or industrial byproducts. In addition, Linde has contracts or commitments for, or readily
available sources of, most of these raw materials; however, their long-term availability and prices are subject to market conditions. A disruption in supply of such raw materials could impact Linde’s ability to meet contractual supply commitments.
Linde’s international operations are subject to the risks of doing business abroad and international events and circumstances may adversely impact its business, financial condition or results of operations.
Linde has substantial international operations which are subject to risks including devaluations in currency exchange rates, transportation delays and interruptions, political and economic instability and disruptions, restrictions on the transfer of funds, trade conflicts and the imposition of duties and tariffs, import and export controls, changes in governmental policies, labor unrest, possible nationalization and/or expropriation of assets, changes in U.S. and non-U.S. tax policies and compliance with governmental regulations. These events could have an adverse effect on the international operations of Linde in the future by reducing the demand for its products, decreasing the prices at which it can sell its products, reducing the revenue from international operations or otherwise having an adverse effect on its business.
Currency exchange rate fluctuations and other related risks may adversely affect Linde's results.
Because a significant portion of Linde's revenue is denominated in currencies other than its reporting currency, the U.S. dollar, changes in exchange rates will produce fluctuations in revenue, costs and earnings and may also affect the book value of assets and liabilities and related equity. Although the company from time to time utilizes foreign exchange
forward contracts to hedge these exposures, its efforts to minimize currency exposure through such hedging transactions may not be successful depending on market and business conditions. As a result, fluctuations in foreign currency exchange rates could adversely affect Linde’s financial condition, results of operations or cash flows.
Macroeconomic factors may impact Linde’s ability to obtain financing or increase the cost of obtaining financing which may adversely impact Linde’s financial results and/or cash flows.
Volatility and disruption in the U.S., European and global credit and equity markets, from time to time, could make it more difficult for Linde to obtain financing for its operations and/or could increase the cost of obtaining financing. In addition, Linde’s borrowing costs can be affected by short- and long-term debt ratings assigned by independent rating agencies which are based, in significant part, on its performance as measured by certain criteria such as interest coverage and leverage ratios. A decrease in these debt ratings could increase the cost of borrowing or make it more difficult to obtain financing.
An impairment of goodwill or intangible assets could negatively impact the company's financial results.
As of December 31, 2021,2023, the net carrying value of goodwill and other indefinite-lived intangible assets was $27 billion and $2 billion, respectively, primarily as a result of the business combination and the related acquisition method of accounting applied to Linde AG. In accordance with generally accepted accounting principles, the company periodically assesses these assets to determine if they are impaired. Significant negative industry or economic trends, disruptions to business, unexpected significant changes or planned changes in use of the assets, divestitures and sustained market capitalization declines may result in recognition of impairments to goodwill or other indefinite-lived assets. Any charges relating to such impairments could have a material adverse impact on Linde's results of operations in the periods recognized.
Catastrophic events could disrupt the operations of Linde and/or its customers and suppliers and may have a significant adverse impact on the results of operations.
The occurrence of catastrophic events or natural disasters such as extreme weather, including hurricanes and floods; health epidemics; pandemics, such as COVID-19; and acts of war or terrorism, could disrupt or delay Linde’s ability to produce and distribute its products to customers and could potentially expose Linde to third-party liability claims. In addition, such events could impact Linde’s customers and suppliers resulting in temporary or long-term outages and/or the limitation of supply of energy and other raw materials used in normal business operations. Linde evaluates the direct and indirect business risks, consults with vendors, insurance providers and industry experts, makes investments in suitably resilient design and technology, and conducts regular reviews of the business risks with management. Despite these steps, however, these situations are outside Linde’s control and may have a significant adverse impact on its financial results.
The inability to attract and retain qualified personnel may adversely impact Linde’s business.
If Linde fails to attract, hire and retain qualified personnel, it may not be able to develop, market or sell its products or successfully manage its business. Linde is dependent upon a highly skilled, experienced and efficient workforce to be successful. Much of Linde’s competitive advantage is based on the expertise and experience of key personnel regarding marketing, technology, manufacturing and distribution infrastructure, systems and products. The inability to attract and hire qualified individuals or the loss of key employees in very skilled areas could have a negative effect on Linde’s financial results.
If Linde fails to keep pace with technological advances in the industry or if new technology initiatives do not become commercially accepted, customers may not continue to buy Linde’s products and results of operations could be adversely affected.
Linde’s research and development is directed toward developing new and improved methods for the production and distribution of industrial gases, the design and construction of plants and toward developing new markets and applications for the use of industrial and process gases. This results in the introduction of new applications and the development of new advanced process technologies. As a result of these efforts, Linde develops new and proprietary technologies and employs necessary measures to protect such technologies within the global geographies in which Linde operates. These technologies help Linde to create a competitive advantage and to provide a platform to grow its business. If Linde’s research and
development activities do not keep pace with competitors or if Linde does not create new technologies that benefit customers, future results of operations could be adversely affected.
Risks related to pension benefit plans may adversely impact Linde’s results of operations and cash flows.
Pension benefits represent significant financial obligations that will be ultimately settled in the future with employees who meet eligibility requirements. Because of the uncertainties involved in estimating the timing and amount of future payments and asset returns, significant estimates are required to calculate pension expense and liabilities related to Linde’s plans. Linde utilizes the services of independent actuaries, whose models are used to facilitate these calculations. Several key assumptions are used in the actuarial models to calculate pension expense and liability amounts recorded in the consolidated financial statements. In particular, significant changes in actual investment returns on pension assets, discount rates, or legislative or regulatory changes could impact future results of operations and required pension contributions.
Operational risks may adversely impact Linde’s business or results of operations.
Linde’s operating results are dependent on the continued operation of its production facilities and its ability to meet customer contract requirements and other needs. Insufficient or excess capacity threatens Linde’s ability to generate competitive profit margins and may expose Linde to liabilities related to contract commitments. Operating results are also dependent on Linde’s ability to complete new construction projects on time, on budget and in accordance with performance requirements. Failure to do so may expose Linde’s business to loss of revenue, potential litigation and loss of business reputation.
Also inherent in the management of Linde’s production facilities and delivery systems, including storage, vehicle transportation and pipelines, are operational risks that require continuous training, oversight and control. Material operating failures at production, storage facilities or pipelines, including fire, toxic release and explosions, or the occurrence of vehicle transportation accidents could result in loss of life, damage to the environment, loss of production and/or extensive property damage, all of which may negatively impact Linde’s financial results.
Linde may be subject to information technology system failures, network disruptions and breaches in data security.
Linde relies on information technology systems and networks for business and operational activities, and also stores and processes sensitive business and proprietary information in these systems and networks. These systems are susceptible to outages due to fire, flood, power loss, telecommunications failures, viruses, break-ins and similar events, or breaches of security.
Linde has taken steps to address these risks and concerns by implementing advanced security technologies, internal controls, network and data center resiliency and recovery process.processes. Despite these steps, however, our information technology systems have in the past been and in the future will likely be subject to increasingly sophisticated cyber attacks.
Operational failures and breaches of security from such attempts could lead to the loss or disclosure of confidential information or personal data belonging to Linde or our employees and customers or suppliers. These failures and breaches could result in business interruption or malfunction and lead to legal or regulatory actions that could result in a material adverse impact on Linde’s operations, reputation and financial results. To date, such attempts have not had any significant impact on Linde's operations or financial results.
The inability to effectively integrate acquisitions or collaborate with joint venture partners could adversely impact Linde’s financial position and results of operations.
Linde has evaluated and expects to continue to evaluate, a wide array of potential strategic acquisitions and joint ventures. Many of these transactions, if consummated, could be material to its financial condition and results of operations. In addition, the process of integrating an acquired company, business or group of assets may create unforeseen operating difficulties and expenditures. Although historically Linde has been successful with its acquisition strategy and execution, the areas where Linde may face risks include:
•the need to implement or remediate controls, procedures and policies appropriate for a larger public company at companies that prior to the acquisition lacked these controls, procedures and policies;
•diversion of management time and focus from operating existing business to acquisition integration challenges;
•cultural challenges associated with integrating employees from the acquired company into the existing organization;
•the need to integrate each company’s accounting, management information, human resources and other administrative systems to permit effective management;
•difficulty with the assimilation of acquired operations and products;
•failure to achieve targeted synergies and cost reductions; and
•inability to retain key employees and business relationships of acquired companies.
Foreign acquisitions and joint ventures involve unique risks in addition to those mentioned herein, including those related to integration of operations across different cultures and languages, currency risks and the particular economic, political and regulatory risks associated with specific countries.
Also, the anticipated benefit of potential future acquisitions may not materialize. Future acquisitions or dispositions could result in the incurrence of debt, contingent liabilities or amortization expenses, or impairments of goodwill, any of which could adversely impact Linde’s financial results.
Linde is subject to a variety of international laws and government regulations and changes in, or failure to comply with, these laws or regulations could have an adverse impact on the company’s business, financial position and results of operations.
Linde is subject to regulations in the following areas, among others:
•environmental protection, including climate change and energy efficiency laws and policies;
•U.S. and non-U.S. tax laws and currency controls;
•safety;
•securities laws applicable in the United States, the European Union, Germany, Ireland, and other jurisdictions;
•trade and import/export restrictions, as well as economic sanctions laws;
•antitrust matters;
•data protection;
•global anti-bribery laws, including the U.S. Foreign Corrupt Practices Act; and
•healthcare regulations.
Changes in these or other regulatory areas may impact Linde’s profitability and may give rise to new or increased compliance risks: it may become more complex and costly to ensure compliance, and the level of sanctions in the event of non-compliance may rise. Noncompliance with such laws and regulations could result in penalties or sanctions, cancellation of marketing rights or restrictions on participation in, or even exclusion from, public tender proceedings, all of which could have a material adverse impact on Linde’s financial results and/or reputation.
Such changes may also restrict Linde’s ability to compete effectively in the marketplace. Changes to regulations in the areas of environmental protection and climate change, for example, may impact customer and competitor behavior driving structural changes in key end markets. While Linde will work to mitigate these risks through the pursuit of strategic alliances and investment in applications technologies to capture new growth areas, given the uncertainty about the type and scope of new regulations, it is difficult to predict how such changes and their impact on market behavior will ultimately impact Linde’s business. However, such changes could have a material adverse impact on Linde's results of operations.
Doing business globally requires Linde to comply with anti-corruption, trade, compliance and economic sanctions and similar laws, and to implement policies and procedures designed to ensure that its employees and other intermediaries comply with the applicable restrictions. These restrictions include prohibitions on the sale or supply of certain products, services and any other economic resources to embargoed or sanctioned countries, governments, persons and entities. Compliance with these restrictions requires, among other things, screening of business partners. Despite its commitment to legal compliance and corporate ethics, the company cannot ensure that its policies and procedures will always protect it from intentional, reckless or negligent acts committed by employees or agents under the applicable laws. If Linde fails to comply with laws governing the conduct of international operations, Linde may be subject to criminal and civil penalties and other remedial measures, which could materially adversely affect its reputation, business and results of operations.
The outcome of litigation or governmental investigations may adversely impact the company’s business or results of operations.
Linde’s subsidiaries are party to various lawsuits and governmental investigations arising in the ordinary course of business. Adverse outcomes in some or all of the claims pending may result in significant monetary damages or injunctive relief that could adversely affect Linde’s ability to conduct business. Linde and its subsidiaries may in the future become subject to further claims and litigation, which is impossible to predict. The litigation and other claims Linde faces are subject to inherent uncertainties. Legal or regulatory judgments or agreed settlements might give rise to expenses which are not covered, or are not fully covered, by insurance benefits and may also lead to negative publicity and reputational damage. An unfavorable outcome or determination could cause a material adverse impact on the company’s results of operations.
Potential product defects or inadequate customer care may adversely impact Linde’s business or results of operations.
Risks associated with products and services may result in potential liability claims, the loss of customers or damage to Linde’s reputation. Principal possible causes of risks associated with products and services are product defects or an inadequate level of customer care when Linde is providing services.
Linde is exposed to legal risks relating to product liability in the countries where it operates, including countries such as the United States, where legal risks (in particular through class actions) have historically been more significant than in other countries. The outcome of any pending or future products and services proceedings or investigations cannot be predicted and legal or regulatory judgments or agreed settlements may give rise to significant losses, costs and expenses.
The manufacturing and sale of products as well as the construction and sale of plants by Linde may give rise to risks associated with the production, filling, storage, handling and transport of raw materials, goods or waste. Industrial gases are potentially hazardous substances and medical gases and the related healthcare services must comply with the relevant specifications in order to not adversely affect the health of patients treated with them.
Linde’s products and services, if defective or not handled or performed appropriately, may lead to personal injuries, business interruptions, environmental damages or other significant damages, which may result, among other consequences, in liability, losses, monetary penalties or compensation payments, environmental clean-up costs or other costs and expenses, exclusion from certain market sectors deemed important for future development of the business and loss of reputation. All these consequences could have a material adverse effect on Linde’s business and results of operations.
U.S. civil liabilities may not be enforceable against Linde.
Linde is organized under the laws of Ireland and substantial portions of its assets are located outside of the United States. In addition, certain directors and officers of Linde and its subsidiaries reside outside the United States. As a result, it may be difficult for investors to effect service of process within the United States upon Linde or such persons, or to enforce outside the United States judgments obtained against such persons in U.S. courts in any action, including actions predicated upon the civil liability provisions of the U.S. federal securities laws. In addition, it may be difficult for investors to enforce, in
original actions brought in courts in jurisdictions located outside the United States, rights predicated upon the U.S. federal securities laws.
A judgment for the payment of money rendered by a court in the United States based on civil liability would not be automatically enforceable in Ireland. There is no treaty between Ireland and the United States providing for the reciprocal enforcement of foreign judgments. The following requirements must be met before the foreign judgment will be deemed to be enforceable in Ireland (i) the judgment must be for a definite sum, (ii) the judgment must be final and conclusive; and (iii) the judgment must be provided by a court of competent jurisdiction.
An Irish court will also exercise its right to refuse judgment if the foreign judgment (i) was obtained by fraud; (ii) violated Irish public policy; (iii) is in breach of natural justice; or (iv) if the judgment is irreconcilable with an earlier foreign judgment.
In addition, there is doubt as to whether an Irish court would accept jurisdiction and impose civil liability on Linde or such persons in an original action predicated solely upon the U.S. federal securities laws brought in a court of competent jurisdiction in Ireland against Linde or such member, officer or expert, respectively.
Changes in tax laws or policy could adversely impact the company’s financial position or results of operations.
Linde and its subsidiaries are subject to the tax rules and regulations in the U.S., Germany, Ireland, the U.K. and other countries in which they operate. Those tax rules and regulations are subject to change on a prospective or retroactive basis. Under current economic and political conditions tax rates and policies in any jurisdiction, including the U.S., the U.K. and the EU, are subject to significant changes which could result in a significant change to Linde's current and deferred income tax. In particular, since Linde is currently treated as U.K. tax resident, any potential changes in the tax rules applying to U.K. tax-resident companies would directly affect Linde.
This includes the Organization for Economic Cooperation & Development's (“OECD”) framework for a 15% global minimum tax rate (“Pillar Two”). The U.K. and a majority of EU member states implemented Pillar Two effective January 1, 2024. The OECD continues to issue additional guidance as countries adopt legislation. Linde continues to monitor and evaluate enacted and pending legislation in the jurisdictions in which it operates, as such changes could result in an increase in our effective tax rate.
A change in Linde’s tax residency could have a negative effect on the company’s future profitability and may trigger taxes on dividends or exit charges. If Linde ceases to be resident in the U.K. and becomes resident in another jurisdiction, it may be subject to U.K. exit charges, and/or could become liable for additional tax charges in the other jurisdiction. If Linde were to be treated as resident in more than one jurisdiction, it could be subject to duplicative taxation. Furthermore, although Linde is incorporated in Ireland and is not expected to be treated as a domestic corporation for U.S. federal income tax purposes, it is possible that the IRS could challenge this result or that changes in U.S. federal income tax law could alter this result. If the IRS successfully asserted such a position or the law were to change, significant adverse tax consequences may result for Linde, the company and Linde’s shareholders.
Changes in tax laws may result in higher tax expense and tax payments. In addition, changes in tax legislation and uncertainty about the tax environment in some regions may restrict Linde's opportunity to enforce its respective rights under the law. Linde also operates in countries with complex tax regulations which could be interpreted in different ways. Linde and its subsidiaries are subject to audits by taxing authorities in various jurisdictions or other review actions by the relevant financial or tax authorities. The ultimate tax outcome may differ from the amounts recorded in Linde’s or its subsidiaries’ financial statements and may materially affect their respective financial results for the period when such determination is made.
ITEM 1B. UNRESOLVED STAFF COMMENTS
Linde has received no written SEC staff comments regarding any of its Exchange Act reports which remain unresolved.Not applicable.
ITEM 1C. CYBERSECURITY
Risk Management & Strategy
Cybersecurity is identified as a top enterprise risk given the company's reliance on information technology systems and networks for business and operational activities. Linde has taken steps to address these risks and concerns by implementing cybersecurity and risk management processes that include advanced security technologies, internal controls, network and data center resiliency and disaster recovery processes.
Linde is implementing a series of security enhancements based on the Zero Trust principle. Linde maintains a Standard Operating Procedure for Global Security Incident Response that defines how Linde responds to cyber incidents, including escalation, reporting and remediation procedures. Dedicated cybersecurity teams conduct surveillance for potential threats and implement both procedural and technological controls to protect data and to maintain safe, uninterrupted operations. The company engages third parties in connection with these efforts to provide independent analysis and advice on cybersecurity risks, incidents and other cyber security related matters. In addition, to help our people recognize information and cybersecurity concerns and respond accordingly, Linde conducts mandatory trainings and cybersecurity awareness programs for employees.
Third party software providers that facilitate Linde’s business activities are also sources of cybersecurity risk for the company. Linde performs risk assessment procedures including evaluation of the overall health of the control environment for certain third-party providers.
Despite these steps, however, our information technology systems have in the past been and in the future will likely be subject to increasingly sophisticated cyber attacks. Operational failures and breaches of security from such attempts could lead to the loss or disclosure of confidential information or personal data belonging to Linde or our employees and customers or suppliers. These failures and breaches could result in business interruption or malfunction and lead to legal or regulatory actions that could result in a material adverse impact on Linde’s operations, reputation and financial results. To date, such attempts have not had any significant impact on Linde's operations or financial results.
Governance
Information and cybersecurity risk management fall under the oversight of the Audit Committee. The Audit Committee receives an annual review, followed by quarterly updates, of the Company’s cybersecurity systems, enhancements, strategies and risk management efforts, and the Chair of the Audit Committee will be promptly notified of any material cybersecurity breach incident. In addition, the full Board reviews cybersecurity as part of its regular risk reviews. Linde has appointed a Global Chief Information Officer (CIO) reporting to the Chief Financial Officer (CFO). A Chief Information Security Officer reports to the CIO and is supported by a global IT security team.
ITEM 2. PROPERTIES
Linde's principal executive offices are located in leased office space in Guildford,Woking, United Kingdom and owned office space in Danbury, Connecticut. Linde also owns principal administrative office space in Tonawanda, New York, United States and Pullach, Germany.
Due to the nature of Linde’s industrial gas products, it is generally uneconomical to transport themmost products distances greater than a few hundred miles from the production facility. As a result, Linde operates a significant number of production facilities spread globally throughout a number of geographic regions.
The following is a description of production facilities for Linde by segment. No significant portion of these assets was leased at December 31, 2021.2023. Generally, these facilities are utilized and are sufficient to meet the company's manufacturing needs.
Americas
The Americas segment operates production facilities primarily in the U.S., Canada, Mexico and Brazil, approximately 350 of which are mainly cryogenic air separation plants, hydrogen plants and carbon dioxide plants. There are five major pipeline complexes in North America located in northern Indiana, Houston, along the Gulf Coast of Texas, Detroit and Louisiana. Also located throughout the Americas are noncryogenic air separation plants, packaged gas facilities and other smaller plant facilities.
EMEA
The EMEA segment has production facilities primarily in Germany, the U.K., Eastern Europe, France, Sweden and the Republic of South Africa and the U.K. which include approximately 275 cryogenic air separation plants and carbon dioxide plants. Also located throughout Europe are noncryogenic air separation plants, pipelines, hydrogen, packaged gas facilities and other smaller plant facilities.
APAC
The APAC segment has production facilities located primarily in China, Australia, India, South Korea and Thailand, approximately 230 of which are cryogenic air separation plants and carbon dioxide plants. Also located throughout Asia are noncryogenic air separation plants, pipelines, hydrogen, packaged gas and other production facilities.
Engineering
The Linde Engineering business designs and constructs turnkey process plants for third-party customers as well as for the gases businesses in many locations worldwide, such as olefin plants, natural gas plants, air separation, plants, hydrogen, synthesis, olefin and synthesisnatural gas plants. Plant components are produced in owned factories in Pullach and Tacherting, Germany; Hesinque,Hesingue, France; New York and Oklahoma, United States; and Dalian, China.
ITEM 3. LEGAL PROCEEDINGS
Information required by this item is incorporated herein by reference to the section captioned “Notes to Consolidated Financial Statements – 17. Commitments and Contingencies” in Item 8 of this 10-K.
ITEM 4. MINE SAFETY DISCLOSURES
Not Applicable.
PART II
ITEM 5. MARKET FOR REGISTRANT’S COMMON EQUITY, RELATED STOCKHOLDER MATTERS AND ISSUER PURCHASES OF EQUITY SECURITIES
Linde plc shares trade on the New YorkNasdaq Stock ExchangeMarket LLC (“NYSE”) and the Frankfurt Stock Exchange (“FSE”Nasdaq”) under the ticker symbol “LIN”. At December 31, 20212023 there were 8,3636,596 shareholders of record.From January 1, 2023 through November 6, 2023, Linde’s shares were traded on the New York Stock Exchange (“NYSE”), but effective November 7, 2023, Linde delisted its shares from the NYSE and began listing and trading its shares on the Nasdaq.
Purchases of Equity Securities – Certain information regarding purchases made by or on behalf of the company or any affiliated purchaser (as defined in Rule 10b-18(a)(3) under the Securities Exchange Act of 1934, as amended) of its ordinary shares during the three months ended December 31, 20212023 is provided below:
| | | | | | | | | | | | | | | | | | | | | | | |
| Period | Total Number of Shares Purchased (Thousands) | | Average
Price Paid
Per Share | | Total Number of Shares Purchased as Part of Publicly Announced Program (1) (Thousands) | | Approximate Dollar Value of Shares that May Yet be Purchased Under the Program (2) (Millions) |
| October 2021 | 931 | | | $ | 304.49 | | | 931 | | | $ | 1,554 | |
| November 2021 | 1,570 | | | $ | 329.60 | | | 1,570 | | | $ | 1,037 | |
| December 2021 | 1,626 | | | $ | 333.23 | | | 1,626 | | | $ | 495 | |
| Fourth Quarter 2021 | 4,127 | | | $ | 325.37 | | | 4,127 | | | $ | 495 | |
| | | | | | | | | | | | | | | | | | | | | | | |
| Period | Total Number of Shares Purchased (Thousands) | | Average
Price Paid
Per Share | | Total Number of Shares Purchased as Part of Publicly Announced Programs (1) (Thousands) | | Approximate Dollar Value of Shares that May Yet be Purchased Under the Programs (2) (Millions) |
| October 2023 | 852 | | | $ | 373.13 | | | 852 | | | $ | 17,051 | |
| November 2023 | 657 | | | $ | 400.45 | | | 657 | | | $ | 16,788 | |
| December 2023 | 1,042 | | | $ | 405.41 | | | 1,042 | | | $ | 16,366 | |
| Fourth Quarter 2023 | 2,551 | | | $ | 393.35 | | | 2,551 | | | $ | 16,366 | |
| | | | | | | |
| | | | | | | |
________________________
(1)On January 25, 2021 the company's board of directors approved the repurchase of $5.0 billion of its ordinary shares ("2021 program") which could take place from time to time on the open market (and could include the use of 10b5-1 trading plans), subject to market and business conditions. The 2021 program has a maximum repurchase amount of 15% of outstanding shares, began on February 1, 2021 and expires on July 31, 2023.
(2)As of December 31, 2021, the company repurchased $4.5 billion of its ordinary shares pursuant to the 2021 program, leaving an additional $0.5 billion authorized under the 2021 program.
On February 28, 2022 the company's board of directors approved the repurchase of $10.0 billion of its ordinary shares ("2022 program") which could take place from time to time on the open market (and could include the use of 10b5-1 trading plans), subject to market and business conditions. The 2022 program has a maximum repurchase amount of 15% of outstanding shares, beginning on March 1, 2022 and expires on July 31, 2024.
On October 23, 2023, the company's board of directors approved the repurchase of $15.0 billion of its ordinary shares ("2023 program") which could take place from time to time on the open market (and could include the use of 10b5-1 trading plans), subject to market and business conditions. The 2023 program began on October 23, 2023 and will terminate on the earlier of the date as the maximum authority under the 2023 program is reached or the board terminates the 2023 program.
(2) As of December 31, 2023, the company repurchased $8.6 billion of its ordinary shares pursuant to the 2022 program. As of December 31, 2023, $1.4 billion and $15 billion of share repurchases remain authorized under the 2022 and 2023 programs, respectively.
Peer Performance Table – The graph below compares the most recent five-year cumulative returns of the common stock of Praxair, the company's predecessor, through October 31, 2018 and Linde's ordinary shares for periods subsequent to October 31, 2018 with those of the Standard & Poor’s 500 Index ("SPX") and the S5 Materials Index ("S5MATR") which covers 28 companies, including Linde. The figures assume an initial investment of $100 on December 31, 20162018 and that all dividends have been reinvested. 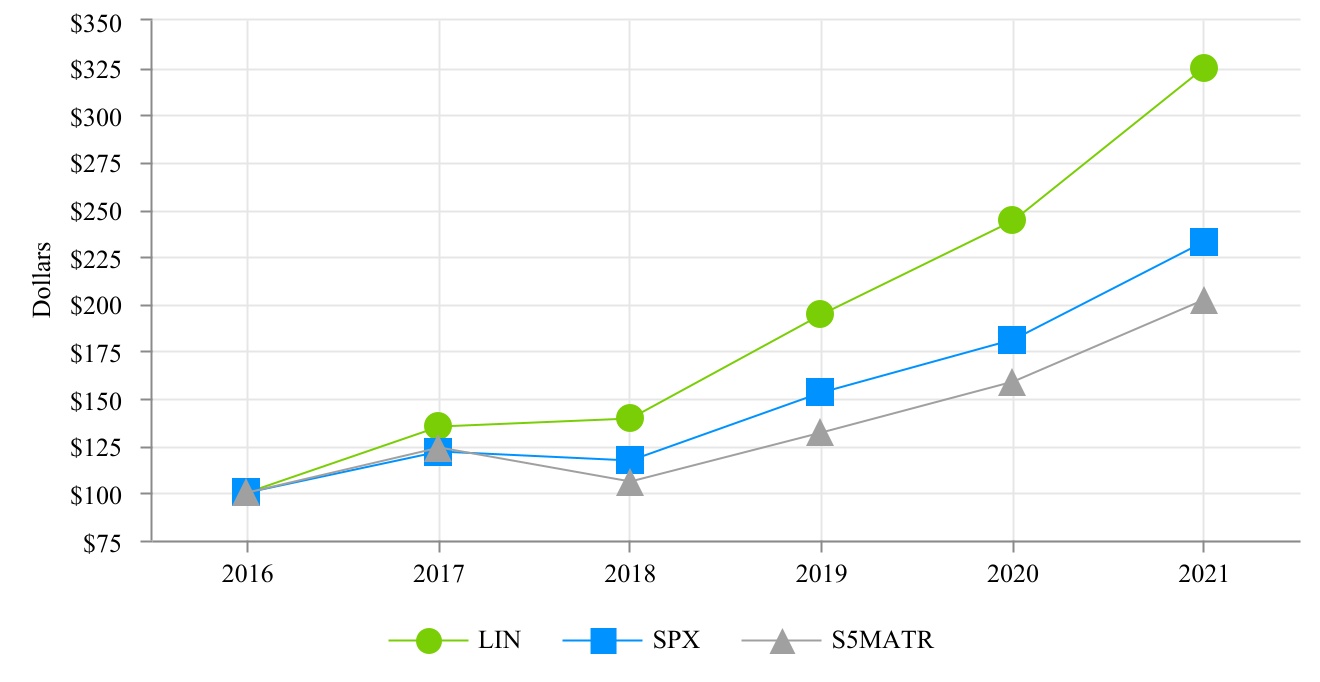

| | 2016 | 2017 | 2018 | 2019 | 2020 | 2021 |
| 2018 | | | 2018 | 2019 | 2020 | 2021 | 2022 | 2023 |
| LIN | LIN | $100 | $135 | $139 | $194 | $244 | $325 | LIN | $100 | $139 | $175 | $234 | $223 | $285 |
| SPX | SPX | $100 | $122 | $117 | $153 | $181 | $233 | SPX | $100 | $131 | $156 | $200 | $164 | $207 |
| S5MATR | S5MATR | $100 | $124 | $106 | $132 | $159 | $202 | S5MATR | $100 | $125 | $150 | $191 | $168 | $189 |
ITEM 6. RESERVED
Not applicable.
ITEM 7. MANAGEMENT’S DISCUSSION AND ANALYSIS OF FINANCIAL CONDITION AND RESULTS OF OPERATIONS
The following discussion of the company’s financial condition and results of operations should be read together with its consolidated financial statements and notes to the consolidated financial statements included in Item 8 of this Form 10-K.
| | | | | |
| Page |
| Business Overview | |
| Executive Summary – Financial Results & Outlook | |
| Consolidated Results and Other Information | |
| Segment Discussion | |
| Liquidity, Capital Resources and Other Financial Data | |
| Off-Balance Sheet Arrangements | |
| Critical Accounting Estimates | |
| New Accounting Standards | |
| Fair Value Measurements | |
| Non-GAAP Financial Measures | |
| Supplemental Guarantee Information | |
| |
BUSINESS OVERVIEW
The company's primary products in its industrial gases business are atmospheric gases (oxygen, nitrogen, argon, rare gases) and process gases (carbon dioxide, helium, hydrogen, electronic gases, specialty gases, acetylene). The company also designs, engineers, and builds equipment that produces industrial gases and offers its customers a wide range of gas production and processing services such as olefin plants, natural gas plants, air separation plants, hydrogen and synthesis gas plants and other types of plants.
Linde’s industrial gas operations are managed on a geographical basis and in 2021 84%2023 90% of sales were generated by Linde's three geographic segments (Americas, EMEA and APAC) and the remaining 16%10% are related primarilylargely to the Engineering segment, and to a lesser extent Other (see Note 18 to the consolidated financial statements for operating segment details).
Linde serves a diverse group of industries including healthcare, chemicals and energy, manufacturing, metals and mining, food and beverage, and electronics. The diversity of end-markets supports financial stability for Linde in varied business cycles.
LindeLinde's industrial gas business generates most of its revenues and earnings in the following geographies where the company has its strongest market positions and where distribution and production operations allow the company to deliver the highest level of service to its customers at the lowest cost.
| | | | | | | | | | | | | | |
| North and South America ("Americas") | | Europe, Middle East and Africa (“EMEA”) | | Asia and Pacific
(“APAC”) |
| United States | | Germany | | China |
| Brazil | | United Kingdom | | Australia |
| Mexico | | Eastern Europe | | South Korea |
| Canada | | | South Africa | India |
The company manufactures and distributes its industrial gas products through networks of thousands of production plants, pipeline complexes, distribution centers and delivery vehicles. Major pipeline complexes are primarily located in the United States and China. These networks are a competitive advantage, providing the foundation of reliable product supply to the company’s customer base. The majority of Linde’s business is conducted through long-term contracts which provide stability in cash flow and the ability to pass through changes in energy and feedstock costs to customers. The company has growth opportunities in all major geographies and in diverse end-markets such as healthcare, chemicals and energy, manufacturing, metals and mining, food and beverage, and electronics.
EXECUTIVE SUMMARY – FINANCIAL RESULTS & OUTLOOK
20212023 Year in review
•Sales of $30,793$32,854 million were 13% above 20202% below 2022 sales of $27,243$33,364 million. Volume growth across all end markets and project start-ups increasedCost pass-through, representing the contractual billing of energy cost variances primarily to onsite customers, decreased sales by 8% . Higher pricing across all geographic segments contributed 3% to sales. Favorable currency translation and higher cost pass-through increasedwith minimal impact on operating profit. Engineering decreased sales by 5%2%. Volumes decreased sales by 1%. Currency translation decreased sales by 1%, largely in APAC. Divestitures, net of acquisitions, decreased sales by 1% primarily due to the divestment of the GIST business, partially offset by the deconsolidation of a joint venture with operations in APAC which decreased salesnexAir, LLC acquisition. The aforementioned drivers were partially offset by 3% .6% higher price attainment across all geographic segments.
•Reported operating profit of $4,984$8,024 million was 50%49% above 2020.2022. Adjusted operating profit of $7,176$9,070 million was 24%15% above 2020.2022. The increase in boththe reported and adjusted operating profit was primarily driven by higher volume and price and the benefit of cost reduction programsRussia-Ukraine conflict and other charges recorded in 2022 and included higher pricing, savings from productivity initiatives, and lower depreciation and amortization driven by merger related intangible assets. These increases more than offset the adverse impacts of cost inflation and lower volumes in the year. The adjusted operating profit increase was primarily due to higher pricing and productivity initiatives, partiallywhich more than offset by the deconsolidationeffects of a joint venture with operations in APAC.cost inflation and lower volumes during the year.*
•Income from continuing operationsNet income - Linde plc of $3,821$6,199 million and diluted earnings per share from continuing operations of $7.32$12.59 increased from $2,497$4,147 million and $4.70,$8.23, respectively in 2020.2022. Adjusted net income from continuing operations- Linde plc of $5,579$6,989 million and adjusted diluted earnings per share from continuing operations of $10.69$14.20 were 28%13% and 30%16%, respectively above 20202022 adjusted amounts.*
•Cash flow from operations of $9,725$9,305 million was 31%$441 million above 2020.2022. The increase was driven by higher net income partially offset by higher net working capital requirements, including lower inflows from contract liabilities from engineering customer advanced payments. Capital expenditures were $3,086$3,787 million; dividends paid were $2,189$2,482 million; net purchases of ordinary shares of $4,562$3,925 million; and debt repayments,borrowings, net were $514$1,060 million.
*A reconciliation of the adjusted amounts can be found in the "Non-GAAP Financial Measures" section in this MD&A.
20222024 Outlook
Linde provides quarterly updates on operating results, material trends that may affect financial performance, and financial guidance via earnings releases and investor teleconferences. These materials are available on the company’s website, www.linde.com, but are not incorporated herein.
CONSOLIDATED RESULTS AND OTHER INFORMATION
The discussion that follows includes a comparison of our results of operations and liquidity and capital resources for the years ended December 31, 20212023 and 2020.2022. For the discussion comparing the years ended December 31, 20202022 and 2019,2021, refer to Part II, Item 7, Management’s Discussion and Analysis of Financial Condition and Results of Operations, of our Form 10-K for the year ended December 31, 2020.2022.
The following table provides summary information for 20212023 and 2020.2022. The reported amounts are GAAP amounts from the Consolidated Statements of Income. The adjusted amounts are intended to supplement investors' understanding of the company's financial information and are not a substitute for GAAP measures.
| (Millions of dollars, except per share data) Year Ended December 31, | (Millions of dollars, except per share data) Year Ended December 31, | 2021 | | 2020 | | Variance | (Millions of dollars, except per share data) Year Ended December 31, | 2023 | | 2022 | | Variance |
| Reported Amounts | Reported Amounts | | | | | |
| Sales | Sales | $ | 30,793 | | | $ | 27,243 | | | 13 | % |
| Sales | |
| Sales | | $ | 32,854 | | | $ | 33,364 | | | (2) | % |
| Cost of sales, exclusive of depreciation and amortization | Cost of sales, exclusive of depreciation and amortization | $ | 17,543 | | | $ | 15,383 | | | 14 | % | Cost of sales, exclusive of depreciation and amortization | $ | 17,492 | | | $ | | $ | 19,450 | | | (10) | | (10) | % |
| As a percent of sales | As a percent of sales | 57.0 | % | | 56.5 | % | |
| Selling, general and administrative | Selling, general and administrative | $ | 3,189 | | | $ | 3,193 | | | — | % |
| Selling, general and administrative | |
| Selling, general and administrative | | $ | 3,295 | | | $ | 3,107 | | | 6 | % |
| As a percent of sales | As a percent of sales | 10.4 | % | | 11.7 | % | |
| Depreciation and amortization | Depreciation and amortization | $ | 4,635 | | | $ | 4,626 | | | — | % |
| Cost reduction programs and other charges (a) | $ | 273 | | | $ | 506 | | | (46) | % |
| Depreciation and amortization | |
| Depreciation and amortization | | $ | 3,816 | | | $ | 4,204 | | | (9) | % |
| Other charges (a) | |
| | Operating Profit | Operating Profit | $ | 4,984 | | | $ | 3,322 | | | 50 | % |
| Operating Profit | |
| Operating Profit | | $ | 8,024 | | | $ | 5,369 | | | 49 | % |
| Operating margin | Operating margin | 16.2 | % | | 12.2 | % | |
| Interest expense – net | |
| Interest expense – net | |
| Interest expense – net | Interest expense – net | $ | 77 | | | $ | 115 | | | (33) | % | $ | 200 | | | $ | | $ | 63 | | | 217 | | 217 | % |
| Net pension and OPEB cost (benefit), excluding service cost | Net pension and OPEB cost (benefit), excluding service cost | $ | (192) | | | $ | (177) | | | 8 | % | Net pension and OPEB cost (benefit), excluding service cost | $ | (164) | | | $ | | $ | (237) | | | (31) | | (31) | % |
| Effective tax rate | Effective tax rate | 24.7 | % | | 25.0 | % | |
| Income from equity investments | Income from equity investments | $ | 119 | | | $ | 85 | | | 40 | % |
| Noncontrolling interests from continuing operations | $ | (135) | | | $ | (125) | | | 8 | % |
| Income from continuing operations | $ | 3,821 | | | $ | 2,497 | | | 53 | % |
| Diluted earnings per share from continuing operations | $ | 7.32 | | | $ | 4.70 | | | 56 | % |
| Income from equity investments | |
| Income from equity investments | | $ | 167 | | | $ | 172 | | | (3) | % |
| Noncontrolling interests | | Noncontrolling interests | $ | (142) | | | $ | (134) | | | 6 | % |
| Net Income - Linde plc | | Net Income - Linde plc | $ | 6,199 | | | $ | 4,147 | | | 49 | % |
| Diluted earnings per share | | Diluted earnings per share | $ | 12.59 | | | $ | 8.23 | | | 53 | % |
| Diluted shares outstanding | Diluted shares outstanding | 521,875 | | | 531,157 | | | (2) | % | Diluted shares outstanding | 492,290 | | | 504,038 | | 504,038 | | | (2) | | (2) | % |
| Number of employees | Number of employees | 72,327 | | | 74,207 | | | (3) | % | Number of employees | 66,323 | | | 65,010 | | 65,010 | | | 2 | | 2 | % |
| Adjusted Amounts (b) | Adjusted Amounts (b) | |
| Operating profit | Operating profit | $ | 7,176 | | | $ | 5,797 | | | 24 | % |
| Operating profit | |
| Operating profit | | $ | 9,070 | | | $ | 7,904 | | | 15 | % |
| Operating margin | Operating margin | 23.3 | % | | 21.3 | % | |
| Income from continuing operations | $ | 5,579 | | | $ | 4,371 | | | 28 | % |
| Diluted earnings per share from continuing operations | $ | 10.69 | | | $ | 8.23 | | | 30 | % |
| Net Income - Linde plc | |
| Net Income - Linde plc | |
| Net Income - Linde plc | | $ | 6,989 | | | $ | 6,195 | | | 13 | % |
| Diluted earnings per share | | Diluted earnings per share | $ | 14.20 | | | $ | 12.29 | | | 16 | % |
| Other Financial Data (b) | Other Financial Data (b) | |
| EBITDA from continuing operations | $ | 9,738 | | | $ | 8,033 | | | 21 | % |
| EBITDA | |
| EBITDA | |
| EBITDA | | $ | 12,007 | | | $ | 9,745 | | | 23 | % |
| As percent of sales | As percent of sales | 31.6 | % | | 29.5 | % | |
| Adjusted EBITDA from continuing operations | $ | 10,179 | | | $ | 8,645 | | | 18 | % |
| Adjusted EBITDA | |
| Adjusted EBITDA | |
| Adjusted EBITDA | | $ | 12,133 | | | $ | 10,873 | | | 12 | % |
| As percent of sales | As percent of sales | 33.1 | % | | 31.7 | % | |
________________________
(a)See Note 3 to the consolidated financial statements.
(b)Adjusted amounts and Other Financial Data are non-GAAP performance measures. A reconciliation of reported amounts to adjusted amounts can be found in the "Non-GAAP Financial Measures" section of this MD&A.
Results of Operations
The following table provides a summary of changes in consolidated sales:
| | | | | | | | |
| | 20212023 vs. 20202022 |
| | | % Change |
| Factors Contributing to Changes - Sales | | |
| Volume | | 8 (1) | % |
| Price/Mix | | 36 | % |
| Cost pass-through | | 3 (3) | % |
| Currency | | 2 (1) | % |
| Acquisitions/divestitures | | (3)(1) | % |
| Engineering | | — (2) | % |
| | 13 (2) | % |
20212023 Compared With 20202022
Sales
Linde sales increased $3,550decreased $510 million, or 13%2%, for the 20212023 year versus 2020. Volume growth across all end markets and project start ups increased sales by 8%.2022. Higher pricing across all geographic segments contributed 3%6% to sales. Currency translation increased sales by 2%, largely in EMEA and APAC, driven by the strengthening of the Euro, Australian dollar, Chinese yuan and British pound against the U.S. dollar. Cost pass-through, representing the contractual billing of energy cost variances primarily to onsite customers, increaseddecreased sales by 3%, with minimal impact on operating profit. DivestituresVolumes decreased sales by 3%1% primarily driven by the deconsolidationelectronics and metals and mining end markets. The impact of a joint venture with operationsdivestitures, net of acquisitions decreased sales by 1%. Currency translation decreased sales by 1%, largely in APAC, (see Note 2 todriven by the consolidated financial statements).weakening of the Chinese yuan and Australian dollar against the U.S. dollar, partially offset by EMEA, driven by the strengthening of the Euro and British pound.
Cost of sales, exclusive of depreciation and amortization
Cost of sales, exclusive of depreciation and amortization, increased $2,160decreased $1,958 million, or 14%10%, for the year primarily due to higher volumes,lower cost pass-through and currency impacts, partiallyvolumes, the net impact of acquisitions and divestitures and productivity gains which more than offset by productivity initiatives.cost inflation. Cost of sales, exclusive of depreciation and amortization, was 57.0%53.2% and 56.5%58.3% of sales, respectively, in 20212023 compared to 2020.2022. The increasedecrease as a percentage of sales was primarily due primarily to higher pricing and lower cost pass-through.
Selling, general and administrative expenses
Selling, general and administrative expense ("SG&A") decreased $4increased $188 million, from $3,193$3,107 in 20202022 to $3,189$3,295 million in 2021.2023. SG&A was 10.4%10.0% of sales in 20212023 versus 11.7%9.3% in 2020, primarily due to continued productivity initiatives and the impact of higher cost pass-through on sales.2022. Currency impacts increaseddecreased SG&A by approximately $62$3 million in 2021.2023. Excluding currency impacts, underlying SG&A decreasedincreased primarily due to continued productivity initiatives.higher costs including the acquisition of nexAir.
Depreciation and amortization
Reported depreciation and amortization expense increased $9decreased $388 million, or 9% versus 2020.2022. The increasedecrease is primarily due to currency translation impacts, partially offset by a decrease related primarily to intangiblelower depreciation and amortization of assets acquired in the merger becoming fully amortized.merger.
On an adjusted basis, depreciation and amortization expense increased $66$102 million, or 2%4%, versus 2020. The increase is primarily due to currency translation2022. Currency impacts which increaseddecreased depreciation and amortization by approximately $60$29 million in 2021.2023. Excluding currency, impacts, underlying depreciation was relatively flat asand amortization increased due to the net impact of acquisitions and new project start ups was largely offset byups.
Other charges
Other charges were $40 million and $1,029 million for 2023 and 2022, respectively. In 2023, the decreasecosts primarily related to severance in the Engineering segment and expenses incurred due to the intercompany reorganization. The charge for 2022 relates primarily to the deconsolidation and impairment of a joint venture with operationsRussian subsidiaries resulting from the ongoing war in APAC (see Note 2 to the consolidated financial statements).
Cost reduction programsUkraine and other charges
Linderelated sanctions recorded cost reduction programs and other chargesas of $273 million and $506 million for 2021 and 2020, respectively, primarily associated with the company's cost reduction program, which represents charges for achieving synergies and cost efficiencies related to the merger (see Note 3 to the consolidated financial statements).June 30, 2022.
On an adjusted basis, these costscharges have been excluded in both periods.
Operating profit
Reported operating profit increased $1,662$2,655 million in 2021,2023, or 50%49%. On an adjusted basis, operating profit increased $1,379$1,166 million, or 24%15%, for 20212023 versus 2020.2022.
On a reported basis, operating profit increased $1,662 million, or 50%the increase was primarily driven by Russia-Ukraine conflict and other charges recorded in 2021. The increase2022 and included higher pricing, savings from productivity initiatives, and lower depreciation and amortization driven by merger related intangible assets. These increases more than offset the adverse impacts of inflation and currency in the year was driven by higher volumes and price, partially offset by the deconsolidation of a joint venture with operations in APAC. Cost reduction programs andas well as other charges were $273 million in 2021 and $506 million in 2020.of $40 million.
On an adjusted basis, which excludes the impacts of purchase accounting cost reduction programs andas well as other charges, operating profit increased $1,379$1,166 million, or 24%15%. Operating profit growth was driven by higher volume and price and the benefit of cost reduction programspricing, and productivity initiatives, partially offset by the deconsolidation of a joint venture with operations in APAC.cost inflation and lower volumes. A discussion of operating profit by segment is included in the segment discussion that follows.
Interest expense - net
Reported interest expense – net in 2021 decreased $382023 increased $137 million, or 33%217%, versus 2020 .2022. On an adjusted basis interest expense decreased $54increased $118 million, or 29%120% in 20212023 as compared to 2020.
On both a reported and adjusted basis, the decrease year over year2022. The increase was driven primarily by a lower effective borrowing ratehigher interest rates on debt and the impactincluded approximately $28 million of unfavorable foreign currency revaluation on an unhedged intercompany loan in the prior year.devaluation impacts from hyperinflationary countries.
Net pension and OPEB cost (benefit), excluding service cost
Reported net pension and OPEB cost (benefit), excluding service cost was a benefitwere benefits of $192$164 million and $177$237 million in 20212023 and 2020,2022, respectively. The increasedecrease in benefit largelyprimarily relates to a higher expected return on plan assets and lower interest costs, partially offset bycost reflective of the higher amortization of deferred lossesdiscount rate environment year-over-year (see Note 16 to the consolidated financial statements).
Effective tax rate
The reported effective tax rate ("ETR") for 20212023 was 24.7%22.7% versus 25.0%25.9% in 2020.2022. The decrease in the rate is primarily driven by increased pre-tax income and jurisdictional mix. 2021 includes a deferred income tax charge related to the revaluation ofa net deferred tax liabilities for a tax rate increasedecrease in the United Kingdom, offset by a reduction tocompany's uncertain tax positions and the absence of the net unfavorable tax expense related to uncertain tax benefitsresulting from the Russia impairment and accrued interest and penalties of $47 milliondeconsolidation in 2022 (see Note 53 to the consolidated financial statements).
On an adjusted basis, the ETR for 20212023 was 24.1%23.6% versus 23.8%24.2% in 2020.2022. The increase in the adjusted ETR is primarily due to lowerdecrease includes higher tax benefits in 2021 relative to higher pre-tax income.from share based compensation.
Income from equity investments
Reported income from equity investments for 20212023 was $119$167 million as compared to $85$172 million in 2020.2022. On an adjusted basis, income from equity investments for 20212023 was $231$239 million versus $142$247 million in 2020.2022.
On a reportedan adjusted basis, the increaseyear-over-year decrease in income from equity investments was primarily driven by the deconsolidationoverall performance of a joint venture with operationsinvestments in APAC which is reflected in equity income effective January 1, 2021, partially offset by a $35 million impairment charge related to a joint venture in the APAC segment in the third quarter of 2021.
On an adjusted basis, the increase in income from equity investments was primarily driven by the deconsolidation of a joint venture with operations in APAC which is reflected in equity income effective January 1, 2021.APAC.
Noncontrolling interests from continuing operations
At December 31, 2021,2023, noncontrolling interests from continuing operations consisted primarily of noncontrolling shareholders’ investments in APAC (primarily in China) and surface technologies..
Reported noncontrolling interests from continuing operations increased $10$8 million, from $125$134 million in 20202022 to $135$142 million in 2021, primarily driven by higher income from continuing operations, partially offset by the deconsolidation of a joint venture with operations in APAC (see Note 2 to the consolidated financial statements) and the buyout of minority shareholders in the Republic of South Africa.2023.
Adjusted noncontrolling interests from continuing operations decreased $36$2 million in 20212023 as compared to 2020, primarily driven by the deconsolidation of a joint venture with operations in APAC (See Note 2 to the consolidated financial statements) and the buyout of minority shareholders in the Republic of South Africa, which more than offset the increase from higher income from continuing operations.2022.
Net Income from continuing operations- Linde plc
Reported net income from continuing operations- Linde plc increased $1,324$2,052 million, or 53%, primarily due to higher overall operating profit.
49%. On an adjusted basis, which excludes the impacts of purchase accounting and other non-GAAP adjustments,charges, net income from continuing operations- Linde plc increased $1,208$794 million, or 28%13%, in 20212023 versus 2020. The2022. On both a reported and adjusted basis, the increase was primarily due todriven by higher adjusted operating profit.
Diluted earnings per share from continuing operations
Reported diluted earnings per share from continuing operations increased $2.62,$4.36, or 56%53%, in 20212023 as compared to 2020.2022. On an adjusted basis, diluted EPS of $10.69$14.20 in 20212023 increased 30%16% versus 2020.2022. The increase on both a reported and adjusted basis wasis primarily due to higher net income from continuing operations- Linde plc and lower diluted shares outstanding.
Employees
The number of employees at December 31, 20212023 was 72,327, a decrease66,323, an increase of 3%2%, or 1,8801,313 employees from December 31, 2020,2022, driven primarily driven by cost reduction actions and divestitures.the acquisition of nexAir.
Other Financial Data
EBITDA increased to $9,738$12,007 million in 20212023 from $8,033$9,745 million in 2020.2022. Adjusted EBITDA from continuing operations increased to $10,179$12,133 million for 20212023 as compared to $8,645$10,873 million in 2020, primarily due to2022. The increase in both periods was driven by higher net income from continuing operations- Linde plc versus the prior year period.year.
See the "Non-GAAP Financial Measures" section for definitions and reconciliations of these non-GAAP measures to reported GAAP amounts.
Other Comprehensive Income (Loss)
Other comprehensive income (loss) for the year ended December 31, 20212023 was a loss of $358$35 million resulted primarily from losses related to the change in funded status of retirement plans of $380 million and derivative losses of $55 million largely offset by currency translation adjustments of $1,175 million largely offset by an increase in the funded status of the company's retirement obligations of $746 million driven by a higher discount rate environment and strong asset performance.$400 million. The translation adjustments reflect the impact of translating local currency foreign subsidiary financial statements to U.S. dollars, and are largely driven by the movement of the U.S. dollar against major currencies including the Euro, British pound and the Chinese yuan and the British pound.yuan. See the "Currency" section of the MD&A for exchange rates used for translation purposes and Note 7 to the consolidated financial statements for a summary of the currency translation adjustment component of accumulated other comprehensive income (loss) by segment.
Related Party Transactions
The company’s related parties are primarily unconsolidated equity affiliates. The company did not engage in any material transactions involving related parties that included terms or other aspects that differ from those which would be negotiated with independent parties.
Environmental Matters
Linde’s principal operations relate to the production and distribution of atmospheric and other industrial gases, many of which historically have not had a significant impact on the environment. However, worldwideare used to help customers reduce their emissions. Worldwide costs relating to environmental protection may continue to grow due to increasingly stringent laws and regulations, and Linde's ongoing commitment to rigorous internal standards.regulations. In addition, Linde may face physical risks from climate change and extreme weather.
Climate Change
Linde operates in jurisdictions that have, or are developing, laws and/or regulations to reduce or mitigate the adverse effects of greenhouse gas ("GHG") emissions and therefore faces a highly uncertain regulatory environment in this area. For example, the U.S. Environmental Protection Agency ("EPA") has promulgated rules requiring reporting of GHG emissions andto which Linde, and many of its suppliers and customers are subject to these rules.to. EPA has also promulgated regulations to restrict GHG emissions, including final rules regulating GHG emissions from light-duty vehicles and certain large manufacturing facilities, manyincluding some of which are LindeLinde’s suppliers orand customers. In addition to these developments in the United States, several other countries worldwide have already implemented carbon taxation or trading systems which impact the company'scompany and its customers, and Linde operations, including regulations in China, Singapore and the European Union. Among other impacts, such regulations are expected to raise the cost of energy, which is a significant cost for Linde. Nevertheless, Linde's long-term customer contracts routinely provide rights to recover increased electricity, natural gas, and other costs that are incurred by the company as a result of climate change regulation.
Linde anticipates continued growth in its hydrogen businesssales due to increased focus on lowering GHG emissions.decarbonization projects. Traditionally, hydrogen production plants and a large number of other manufacturing and electricity-generating plants have been identified in California and the European Union as a sourcesources of carbon dioxide emissions and these plants are subject to cap-and-trade regulations in those jurisdictions.jurisdictions including California and the European Union. Linde believes it will be able to mitigate the costs of these regulations through the terms of its product supply contracts. However, legislation that limits GHG emissions may impact growth by increasing capital, compliance, operating and maintenance costs and/or decreasing demand.
To manage business risks from current and potential GHG emission regulation as well as physical consequences of climate change, Linde actively monitors current developments, evaluates the direct and indirect business risks, and takes appropriate actions. Among others, actions include: increasing relevant resources and training; maintaining contingency plans; obtaining advice and counsel from expert vendors, insurance providers and industry experts; incorporating GHG provisions in commercial agreements; and conducting regular reviews of the business risks with management. Although there are considerable uncertainties, Linde believes that the business risk from potential regulations can be effectively managed through its commercial contracts. Additionally, LindeLinde’s plant design, operations, and risk management teams are
engaged to manage and mitigate losses from physical climate change, and the company does not anticipate any material effects regarding its plant operations or business arising from potential physical risks of climate change.
Linde continuously seeks opportunities to optimize energy use and GHG emissions through research and development in customer applications and rigorous operational energy efficiency, sourcing renewablelow-carbon source energy, and purchasing hydrogen as a chemical byproduct where feasible. Linde tracks GHG emission performance versus targets and reports regularly to business management and annually to Linde's Board of Directors. Effective November 2021, a newThe Sustainability Committee was created. The Committee is responsible for Board oversight of the Company's programs, policies and strategies related to environmental matters, generally, including climate change, greenhouse gas reduction goals and decarbonization solutions, such as clean hydrogenenergy and carbon capture.management.
At the same time, external factors may provide Linde with future business opportunities. Examples include current legislation, such as the Inflation Reduction Act in the U.S., which provides for investments in production of suchclean hydrogen and decarbonization technologies. Other factors include governmental regulation of GHG and other emissions; uncertain costs of energy and certain natural resources; the development of renewable energy alternatives; and new technologies that help extract natural gas, improve air quality, increase energy efficiency and mitigate the impacts of climate change. Linde continues to develop new applications that can lower emissions and help customers lower emissions by reducing energy consumption and increaseincreasing product throughput. Stricter regulation of water quality in emerging economies such as China provide a growing market for a number of gases, e.g., oxygen for wastewater treatment. Increased concern about drought in areas such as California and Australia may create additional markets for carbon dioxide for desalination. Renewable fuel standards in the European Union and U.S. can create a market for second-generation biofuels which use industrial gases such as oxygen, carbon dioxide, and hydrogen.
Costs Relating to the Protection of the Environment
Environmental protection costs in 20212023 were not significant. Linde anticipates that future annual environmental protection expenditures will be similar to 2021,2023, subject to any significant changes in existing laws and regulations. Based on historical results and current estimates, management does not believe that environmental expenditures will have a material adverse effect on the consolidated financial position, the consolidated results of operations or cash flows in any given year.
Legal Proceedings
See Note 17 to the consolidated financial statements for information concerning legal proceedings.
Retirement Benefits
Pensions
The net periodic benefit cost (benefit) for the U.S. and non-U.S. pension plans was a benefit of $80 million, $110 million and $35 million in 2023, 2022 and $28 million in 2021, and 2020, respectively, and costs of $107 million in 2019. 2019 net periodic pension cost included pension settlement charges of $97 million related to lump sum payments, which were triggered by either a change in control provision or merger-related divestitures, and a net curtailment charge of $8 million for termination benefits, primarily in connection with a defined benefit pension plan freeze. Settlement charges were $4 million and $6 million for 2021 and 2020, respectively.
The funded status (pension benefit obligation ("PBO") less the fair value of plan assets) for the U.S. plans was a deficit of $135$137 million and $436$238 million at December 31, 20212023 and 2020,2022, respectively. The funded status for non-U.S. plans was a deficit of $1,409$207 million and $2,334surplus of $208 million at December 31, 20212023 and 2020,2022, respectively. Both theThe U.S. and non-U.S.
plansplan derived thea benefit from the actual return on plan assets. Non-U.S. plans also experienced an increase in plan assets, as well as favorabilityoffset by unfavorability generated from a lowerhigher PBO due to an increasea decrease in discount rates.
Global pension contributions were $46 million in 2023, $51 million in 2022, and $42 million in 2021, $91 million in 2020, and $94 million in 2019.2021. At a minimum, Linde contributes to its pension plans to comply with local regulatory requirements (e.g., ERISA in the U.S.). Discretionary contributions in excess of the local minimum requirements are made based on many factors, including long-term projections of the plans' funded status, the economic environment, potential risk of overfunding, pension insurance costs and alternative uses of cash. Changes to these factors can impact the timing of discretionary contributions from year to year. Estimated required contributions for 20212024 are currently expected to be in the range of $40$35 million to $50$45 million.
Linde assumes expected returns on plan assets for 20222024 of 7.00% and 5.54%5.83% for the U.S. and non-U.S. plans, respectively, which are consistent with the long-term expected returns on its investment portfolios.
Excluding the impact of any settlements, 20222024 consolidated pension expense is expected to be a benefit of approximately $91115 million. The benefit derived from the expected return on assets assumption for Linde's most significant plans is anticipated to more than offset the expense from service and interest cost accruals and the higher amortization of deferred losses.
Refer to the Critical Accounting PoliciesEstimates section and Note 16 to the consolidated financial statements for a more detailed discussion of the company’s retirement benefits, including a description of the various retirement plans and the assumptions used in the calculation of net periodic benefit cost (benefit) and funded status.
Insurance
Linde purchases insurance to limit a variety of property and casualty risks, including those related to property, business interruption, third-party liability and workers’ compensation. Currently, the company self retains up to $10 million per occurrence for vehicle liability in the United States, $5 million per occurrence for workers' compensation and general liability. In addition, the company self retains risk up to €5 to €7.5 million at its various properties worldwide for property damage resulting from fire, flood and other perils affecting its properties along with a separate €5 to €7.5 million deductible on all business interruption resulting from a major peril loss. To mitigate its aggregate loss potential above these retentions, the company purchases catastrophic insurance coverage from highly rated insurance companies. The company does not currently operate or participate in any captive insurance companies or other non-traditional risk transfer alternatives.
At December 31, 20212023 and 2020,2022, the company had recorded a total of $75 million and $71 million, respectively, representing an estimate of the retained liability for the ultimate cost of claims incurred and unpaid as of the balance sheet dates. The estimated liability is established using statistical analysis and is based upon historical experience, actuarial assumptions and professional judgment. These estimates are subject to the effects of trends in loss severity and frequency and are subject to a significant degree of inherent variability. If actual claims differ from the company’s estimates, they will be adjusted at that time and financial results could be impacted.
Linde recognizes estimated insurance proceeds relating to damages at the time of loss only to the extent of incurred losses. Any insurance recoveries for business interruption and for property damages in excess of the net book value of the property are recognized only when realized or pending payments confirmed by its insurance companies.
SEGMENT DISCUSSION
Linde’s operations consist of two major product lines: industrial gases and engineering. As further described in the following paragraph, Linde’s industrial gases operations are managed on a geographic basis, which represents three of the company's reportable segments - Americas, EMEA (Europe/Middle East/Africa), and APAC (Asia/South Pacific); a fourth reportable segment, which represents the company's Engineering business, which designs and manufactures equipment for air separation and other industrial gas applications specifically for end customers and is managed on a worldwide basis operating in all geographic segments. Other consists of corporate costs and a few smaller businesses which individually do not meet the quantitative thresholds for separate presentation.
The industrial gases product line centers on the manufacturing and distribution of atmospheric gases (oxygen, nitrogen, argon, rare gases) and process gases (carbon dioxide, helium, hydrogen, electronic gases, specialty gases, acetylene). Many of these products are co-products of the same manufacturing process. Linde manufactures and distributes nearly all of its products and manages its customer relationships on a regional basis. Linde’s industrial gases are distributed to various end-markets within a regional segment through one of three basic distribution methods: on-site or tonnage; merchant or bulk; and packaged or cylinder gases. The distribution methods are generally integrated in order to best meet the customer’s needs and very few of its products can be economically transported outside of a region. Therefore, the distribution economics are specific to the various geographies in which the company operates and are consistent with how management assesses performance.
The company’s measure of profit/loss for segment reporting purposes is segment operating profit. Segment operating profit is defined as operating profit excluding purchase accounting impacts of the Linde AG merger, intercompany royalties, and items not indicative of ongoing business trends. This is the manner in which the company’s Chief Operating Decision Maker ("CODM") assesses performance and allocates resources.
The table below presents sales and operating profit information about reportable segments and Other for the years ended December 31, 20212023 and 2020.2022.
| (Millions of dollars) Year Ended December 31, | (Millions of dollars) Year Ended December 31, | 2021 | | 2020 | | Variance | (Millions of dollars) Year Ended December 31, | 2023 | | 2022 | | Variance |
| Sales | Sales | | | | | |
| Americas | |
| Americas | |
| Americas | Americas | $ | 12,103 | | | $ | 10,459 | | | 16 | % | $ | 14,304 | | | $ | | $ | 13,874 | | | 3 | | 3 | % |
| EMEA | EMEA | 7,643 | | | 6,449 | | | 19 | % | EMEA | 8,542 | | | 8,443 | | 8,443 | | | 1 | | 1 | % |
| APAC | APAC | 6,133 | | | 5,687 | | | 8 | % | APAC | 6,559 | | | 6,480 | | 6,480 | | | 1 | | 1 | % |
| Engineering | Engineering | 2,867 | | | 2,851 | | | 1 | % | Engineering | 2,160 | | | 2,762 | | 2,762 | | | (22) | | (22) | % |
| Other | Other | 2,047 | | | 1,797 | | | 14 | % | Other | 1,289 | | | 1,805 | | 1,805 | | | (29) | | (29) | % |
| Total sales | Total sales | $ | 30,793 | | | $ | 27,243 | | | 13 | % | Total sales | $ | 32,854 | | | $ | | $ | 33,364 | | | (2) | | (2) | % |
| | Operating Profit | Operating Profit | |
| Operating Profit | |
| Operating Profit | |
| Americas | |
| Americas | |
| Americas | Americas | $ | 3,368 | | | $ | 2,773 | | | 21 | % | $ | 4,244 | | | $ | | $ | 3,732 | | | 14 | | 14 | % |
| EMEA | EMEA | 1,889 | | | 1,465 | | | 29 | % | EMEA | 2,486 | | | 2,013 | | 2,013 | | | 23 | | 23 | % |
| APAC | APAC | 1,502 | | | 1,277 | | | 18 | % | APAC | 1,806 | | | 1,670 | | 1,670 | | | 8 | | 8 | % |
| Engineering | Engineering | 473 | | | 435 | | | 9 | % | Engineering | 491 | | | 555 | | 555 | | | (12) | | (12) | % |
| Other | Other | (56) | | | (153) | | | 63 | % | Other | 43 | | | (66) | | (66) | | | 165 | | 165 | % |
| Segment operating profit | Segment operating profit | 7,176 | | | 5,797 | | | 24 | % | Segment operating profit | 9,070 | | | 7,904 | | 7,904 | | | 15 | | 15 | % |
| Reconciliation to reported operating profit : | Reconciliation to reported operating profit : | | | | |
| Cost reduction programs and other charges (Note 3) | (273) | | | (506) | | |
| Other charges (Note 3) | |
| Other charges (Note 3) | |
| Other charges (Note 3) | |
| Purchase accounting impacts - Linde AG | |
| Purchase accounting impacts - Linde AG | |
| Purchase accounting impacts - Linde AG | Purchase accounting impacts - Linde AG | (1,919) | | | (1,969) | | |
| Total operating profit | Total operating profit | $ | 4,984 | | | $ | 3,322 | | |
| Total operating profit | |
| Total operating profit | |
Americas
| | (Dollar amounts in millions) | (Dollar amounts in millions) | | Variance | (Dollar amounts in millions) | | | | | | Variance |
| Year Ended December 31, | Year Ended December 31, | | 2021 | | 2020 | | 2021 vs. 2020 | Year Ended December 31, | | 2023 | | 2022 | | 2023 vs. 2022 |
| Sales | Sales | | $ | 12,103 | | | $ | 10,459 | | | 16 | % | Sales | | $ | 14,304 | | | $ | | $ | 13,874 | | | 3 | | 3 | % |
| | Operating profit | Operating profit | | $ | 3,368 | | | $ | 2,773 | | | 21 | % |
| Operating profit | |
| Operating profit | | | $ | 4,244 | | | $ | 3,732 | | | 14 | % |
| As a percent of sales | As a percent of sales | | 27.8 | % | | 26.5 | % | |
| | | | | | | | |
| | 20212023 vs. 20202022 |
| | | % Change |
| Factors Contributing to Changes - Sales | | |
| Volume | | 9— | % |
| Price/Mix | | 36 | % |
| Cost pass-through | | 3 (6) | % |
| Currency | | 1— | % |
| Acquisitions/Divestitures | | —3 | % |
| | 163 | % |
The Americas segment includes Linde’s industrial gases operations in approximately 20 countries including the United States, Canada, Mexico and Brazil.
Sales
Sales for the Americas segment increased $1,644$430 million, or 16%3%, in 20212023 versus 2020.2022. Higher pricing contributed 3%6% to sales. Higher volumesThe impact of net acquisitions increased sales by 9%, led by higher demand across all end markets and project start-ups. Currency translation increased3% primarily due to the acquisition of nexAir, LLC (See Note 2 to the consolidated financial statements). Cost past-through decreased sales by 1%, primarily driven by the strengthening of the Canadian dollar and Mexican peso against the U.S. Dollar. Cost past-through increased sales by 3%6% with minimal impact on operating profit. Volumes and currency translation remained flat.
Operating Profit
Operating profit in the Americas segment increased $595$512 million, or 21%14%, in 20212023 versus 2020. Operating profit increased due2022 driven primarily toby higher pricing, and volumesacquisitions and continued productivity initiatives.initiatives which more than offset cost inflation the year.
EMEA
| | (Dollar amounts in millions) | (Dollar amounts in millions) | | | | Variance | (Dollar amounts in millions) | | | | Variance |
| Year Ended December 31, | Year Ended December 31, | | 2021 | | 2020 | | 2021 vs. 2020 | Year Ended December 31, | | 2023 | | 2022 | | 2023 vs. 2022 |
| | Sales | Sales | | $ | 7,643 | | | $ | 6,449 | | | 19 | % |
| Sales | |
| Sales | | | $ | 8,542 | | | $ | 8,443 | | | 1 | % |
| | Operating profit | Operating profit | | $ | 1,889 | | | $ | 1,465 | | | 29 | % |
| Operating profit | |
| Operating profit | | | $ | 2,486 | | | $ | 2,013 | | | 23 | % |
| As a percent of sales | As a percent of sales | | 24.7 | % | | 22.7 | % | |
| | | | | | | | |
| | 20212023 vs. 20202022 |
| | | % Change |
| Factors Contributing to Changes - Sales | | |
| Volume | | 5 (4) | % |
| Price/Mix | | 49 | % |
| Cost pass-through | | 6 (3) | % |
| Currency | | 51 | % |
| Acquisitions/Divestitures | | (1)(2) | % |
| | 191 | % |
The EMEA segment includes Linde's industrial gases operations in approximately 45 European, Middle Eastern and African countries including Germany, the U.K., France, Sweden and the Republic of South Africa, and the U.K.Africa.
Sales
EMEA segment sales increased $1,194by $99 million, or 19%1%, in 20212023 versus 2020.2022. Higher price attainment increased sales by 9%. Volumes increased 5% drivendecreased sales by increased demand across all4% led by the chemicals and energy end markets.market. Cost pass-through decreased sales by 3% with minimal impact on operating profit. Currency translation increased sales by 5% due1% due largely to the strengthening of the Euro and British pound and Swedish Krona against the U.S. dollar. Higher price contributed 4% to sales. Cost pass-through, representing the contractual billingDollar. The impact of energy cost variances primarily to onsite customers increasednet divestitures decreased sales by 6% with minimal impact on operating profit. Sales decreased 1% related2% primarily due to the divestituredeconsolidation of a non-core businessthe Russian subsidiaries in Scandinavia.June 2022.
Operating Profit
Operating Profit for the EMEA segment increased $424$473 million, or 29%23%, in 20212023 versus 20202022. The increase was driven primarily by higher price and volumespricing and continued productivity initiatives.initiatives, partially offset by cost inflation, lower volumes and divestitures.
APAC
| | (Dollar amounts in millions) | (Dollar amounts in millions) | | | | Variance | (Dollar amounts in millions) | | | | Variance |
| Year Ended December 31, | Year Ended December 31, | | 2021 | | 2020 | | 2021 vs. 2020 | Year Ended December 31, | | 2023 | | 2022 | | 2023 vs. 2022 |
| | Sales | Sales | | $ | 6,133 | | | $ | 5,687 | | | 8 | % |
| Sales | |
| Sales | | | $ | 6,559 | | | $ | 6,480 | | | 1 | % |
| | Operating profit | Operating profit | | $ | 1,502 | | | $ | 1,277 | | | 18 | % |
| Operating profit | |
| Operating profit | | | $ | 1,806 | | | $ | 1,670 | | | 8 | % |
| As a percent of sales | As a percent of sales | | 24.5 | % | | 22.5 | % | |
| | | | | | | | | | |
| | 20212023 vs. 20202022 | | |
| | | % Change | | |
| Factors Contributing to Changes - Sales | | | | |
| Volume/Equipment | | 11 | % | | |
Price/Mix | | 2 | % | | |
| Price/Mix | | 4 | % | | |
| Cost pass-through | | 2 (1) | % | | |
| Currency | | 5 (4) | % | | |
| Acquisitions/Divestitures | | (12)— | % | | |
| | | | |
| | 81 | % | | |
The APAC segment includes Linde's industrial gases operations in approximately 20 Asian and South Pacific countries and regions including China, Australia, India and South Korea.
Sales
Sales for the APAC segment increased $446$79 million, or 8%1%, in 20212023 versus 2020. Volumes2022. Volume increased 11% driven by increased demand across all end markets, led by cyclical end markets and2% including project start-ups in the electronics and project start-us.chemicals and energy end markets. Higher price increased sales by 2%4%. Currency translation increasedCost pass-through decreased sales by 5% driven primarily by the strengthening of the Chinese yuan, Australian dollar and Korean won against the U.S. dollar. Cost pass-through increased sales by 2%1% with minimal impact on operating profit. DivestituresCurrency translation decreased sales by 12%4% driven primarily due toby the deconsolidationweakening of a joint venture with operations in Taiwan which decreased sales by $639 million (See Note 2 to the consolidated financial statements).Australian dollar, Indian rupee and Chinese Yuan against the U.S. Dollar.
Operating Profit
Operating profit in the APAC segment increased $225$136 million, or 18%8%, in 20212023 versus 2020. Higher volumes and price,2022. The increase was primarily driven by higher pricing and continued productivity initiatives were partiallywhich more than offset by a $126 million reduction due to the deconsolidationimpact of the joint venture with operations in Taiwan.
Engineering
| | (Dollar amounts in millions) | (Dollar amounts in millions) | | | | Variance | (Dollar amounts in millions) | | | | Variance |
| Year Ended December 31, | Year Ended December 31, | | 2021 | | 2020 | | 2021 vs. 2020 | Year Ended December 31, | | 2023 | | 2022 | | 2023 vs. 2022 |
| | Sales | Sales | | $ | 2,867 | | | $ | 2,851 | | | 1 | % |
| Sales | |
| Sales | | | $ | 2,160 | | | $ | 2,762 | | | (22) | % |
| | Operating profit | Operating profit | | $ | 473 | | | $ | 435 | | | 9 | % |
| Operating profit | |
| Operating profit | | | $ | 491 | | | $ | 555 | | | (12) | % |
| As a percent of sales | As a percent of sales | | 16.5 | % | | 15.3 | % | |
| | | | | | | | |
| | 20212023 vs. 20202022 |
| | | % Change |
| Factors Contributing to Changes - Sales | | |
| | |
VolumeCurrency | | (3)1 | % |
| | |
CurrencyOther | | 4 (23) | % |
| | |
| | 1 (22) | % |
Sales
Engineering segment sales increased $16decreased $602 million, or 1%22%, in 20212023 versus 2020,2022 . The decrease was driven by project timing, partially offset by currency impacts which increasedtiming.
Projects for Russia that were sanctioned, and therefore terminated or suspended, have been lawfully wound down and represented approximately $238 million and $894 million of the Engineering segment sales by 4% .during 2023 and 2022, respectively.
Operating profit
Engineering segment operating profit increased $38decreased $64 million, or 9%12%, in 20212023 versus 2020 driven primarily2022. The decline from lower sales was partially offset by currency, favorable cost performance and project timing.
higher margin on wind down of terminated or suspended projects sanctioned in Russia.
Other
| | | | | | | | | | | | | | | | | | | | |
| (Dollar amounts in millions) | | | Variance |
| Year Ended December 31, | | 2021 | | 2020 | | 2021 vs. 2020 |
| | | | | | |
| Sales | | $ | 2,047 | | | $ | 1,797 | | | 14 | % |
| | | | | | |
| Operating profit | | $ | (56) | | | $ | (153) | | | 63 | % |
| As a percent of sales | | (2.7) | % | | (8.5) | % | | |
Other
| | | | | | | | | | | | | | | | | | | | |
| (Dollar amounts in millions) | | | Variance |
| Year Ended December 31, | | 2023 | | 2022 | | 2023 vs. 2022 |
| | | | | | |
| Sales | | $ | 1,289 | | | $ | 1,805 | | | (29) | % |
| | | | | | |
| Operating profit | | $ | 43 | | | $ | (66) | | | 165 | % |
| As a percent of sales | | 3.3 | % | | (3.7) | % | | |
| | | | | | | | | | |
| | 20212023 vs. 20202022 | | |
| | | % Change | | |
| Factors Contributing to Changes - Sales | | | | |
| Volume/Price | | 112 | % | | |
Cost pass-throughCurrency | | — | % | | |
Currency | | 3 | % | | |
| Acquisitions/Divestitures | | — (31) | % | | |
| | | | |
| | 14 (29) | % | | |
Other consists of corporate costs and a few smaller businesses including: Surface Technologies, GIST,Linde Advanced Materials Technology and global helium wholesale; which individually do not meet the quantitative thresholds for separate presentation.
Sales
Sales for Other increased $250decreased $516 million, or 14%29%, in 20212023 versus 2020. Higher volumes and price2022. Divestitures decreased sales by 31% primarily due to sale of GIST business in third quarter of 2022. Volume/Price increased sales by 11%. Currency translation increased sales 3%.2% driven primarily by price in the coatings and global helium businesses, partially offset by lower coatings volumes.
Operating profit
Operating profit in Other increased $97$109 million, or 63%165%, in 20212023 versus 2020, due2022 driven primarily to volume growth,by higher pricepricing in global helium and continued productivity initiatives.coatings and lower corporate costs which more than offset the impact of divestitures and lower volumes.
Currency
The results of Linde’s non-U.S. operations are translated to the company’s reporting currency, the U.S. dollar, from the functional currencies used in the countries in which the company operates. For most foreign operations, Linde uses the local currency as its functional currency. There is inherent variability and unpredictability in the relationship of these functional currencies to the U.S. dollar and such currency movements may materially impact Linde’s results of operations in any given period.
To help understand the reported results, the following is a summary of the significant currencies underlying Linde’s consolidated results and the exchange rates used to translate the financial statements (rates of exchange expressed in units of local currency per U.S. dollar):
| | | Percent of 2021 | | Statements of Income | | Balance Sheets | | Percent of 2023 | | Statements of Income | | Balance Sheets |
| | Consolidated | | Average Year Ended December 31, | | December 31, | | Consolidated | | Average Year Ended December 31, | | December 31, |
| Currency | Currency | Sales | | 2021 | | 2020 | | 2021 | | 2020 | Currency | Sales | | 2023 | | 2022 | | 2023 | | 2022 |
| Euro | Euro | 21 | % | | 0.85 | | | 0.88 | | | 0.88 | | | 0.82 | |
| Chinese yuan | Chinese yuan | 9 | % | | 6.45 | | | 6.90 | | | 6.36 | | | 6.53 | |
| British pound | British pound | 7 | % | | 0.73 | | | 0.78 | | | 0.74 | | | 0.73 | |
| Australian dollar | Australian dollar | 4 | % | | 1.33 | | | 1.45 | | | 1.38 | | | 1.30 | |
| Brazilian real | Brazilian real | 4 | % | | 5.39 | | | 5.11 | | | 5.58 | | | 5.20 | |
| Korean won | Korean won | 3 | % | | 1,144 | | | 1,178 | | | 1,189 | | | 1,087 | |
| Canadian dollar | Canadian dollar | 3 | % | | 1.25 | | | 1.34 | | | 1.26 | | | 1.27 | |
| Mexican peso | Mexican peso | 2 | % | | 20.28 | | | 21.35 | | | 20.53 | | | 19.91 | |
| Indian rupee | Indian rupee | 2 | % | | 73.91 | | | 74.08 | | | 74.34 | | | 73.07 | |
| Republic of South African rand | Republic of South African rand | 2 | % | | 14.77 | | | 16.37 | | | 15.94 | | | 14.69 | |
| Swedish krona | Swedish krona | 1 | % | | 8.58 | | | 9.18 | | | 9.05 | | | 8.23 | |
| Thailand bhat | Thailand bhat | 1 | % | | 31.93 | | | 31.28 | | | 33.40 | | | 29.96 | |
| Russian ruble | 1 | % | | 73.69 | | | 71.95 | | | 74.68 | | | 74.04 | |
|
LIQUIDITY, CAPITAL RESOURCES AND OTHER FINANCIAL DATA
| (Millions of dollars) Year Ended December 31, | (Millions of dollars) Year Ended December 31, | 2021 | | 2020 | (Millions of dollars) Year Ended December 31, | 2023 | | 2022 |
| Net Cash Provided by (Used for) | Net Cash Provided by (Used for) | | | |
| Operating Activities | Operating Activities | |
| Operating Activities | |
| Operating Activities | |
| Income from continuing operations (including noncontrolling interests) | |
| Income from continuing operations (including noncontrolling interests) | |
| Income from continuing operations (including noncontrolling interests) | Income from continuing operations (including noncontrolling interests) | $ | 3,956 | | | $ | 2,622 | |
| Non-cash charges (credits): | Non-cash charges (credits): | |
| Add: Cost reduction programs and other charges, net of payments (a) | 98 | | | 258 | |
| Add: Other charges, net of payments (a) | |
| Add: Other charges, net of payments (a) | |
| Add: Other charges, net of payments (a) | |
| | Add: Depreciation and amortization | Add: Depreciation and amortization | 4,635 | | | 4,626 | |
| | Add: Depreciation and amortization | |
| | Add: Depreciation and amortization | |
| Add (Less): Deferred income taxes | Add (Less): Deferred income taxes | (254) | | | (369) | |
| Add (Less): non-cash charges and other | 109 | | | 285 | |
| Add (Less): Non-cash charges and other | |
| Income from continuing operations adjusted for non-cash charges and other | Income from continuing operations adjusted for non-cash charges and other | 8,544 | | | 7,422 | |
| Less: Pension contributions | Less: Pension contributions | (42) | | | (91) | |
| Add (Less): Working capital | Add (Less): Working capital | 1,148 | | | 364 | |
| Add (Less): Other | Add (Less): Other | 75 | | | (266) | |
| Net cash provided by operating activities | $ | 9,725 | | | $ | 7,429 | |
| Net cash provided by (used for) operating activities | |
| Investing Activities | Investing Activities | | | |
| Capital expenditures | |
| Capital expenditures | |
| Capital expenditures | Capital expenditures | $ | (3,086) | | | $ | (3,400) | |
| Acquisitions, net of cash acquired | Acquisitions, net of cash acquired | (88) | | | (68) | |
| | Divestitures and asset sales, net of cash divested | Divestitures and asset sales, net of cash divested | 167 | | | 482 | |
| Divestitures and asset sales, net of cash divested | |
| Divestitures and asset sales, net of cash divested | |
| | Net cash provided by (used for) investing activities | Net cash provided by (used for) investing activities | $ | (3,007) | | | $ | (2,986) | |
| Net cash provided by (used for) investing activities | |
| Net cash provided by (used for) investing activities | |
| Financing Activities | Financing Activities | | | |
| Debt increases (decreases) – net | |
| Debt increases (decreases) – net | |
| Debt increases (decreases) – net | Debt increases (decreases) – net | $ | (514) | | | $ | 1,313 | |
| Issuances (purchases) of ordinary shares – net | Issuances (purchases) of ordinary shares – net | (4,562) | | | (2,410) | |
| Cash dividends – Linde plc shareholders | Cash dividends – Linde plc shareholders | (2,189) | | | (2,028) | |
| | Noncontrolling interest transactions and other | Noncontrolling interest transactions and other | (323) | | | (220) | |
| Net cash (used) for financing activities | $ | (7,588) | | | $ | (3,345) | |
| Noncontrolling interest transactions and other | |
| Noncontrolling interest transactions and other | |
| Net cash provided by (used for) financing activities | |
| | Effect of exchange rate changes on cash | |
| Effect of exchange rate changes on cash | |
| Effect of exchange rate changes on cash | Effect of exchange rate changes on cash | $ | (61) | | | $ | (44) | |
| | Cash and cash equivalents, end-of-period | Cash and cash equivalents, end-of-period | $ | 2,823 | | | $ | 3,754 | |
| | Cash and cash equivalents, end-of-period | |
| | Cash and cash equivalents, end-of-period | |
____________________
(a)See Note 3 to the consolidated financial statements.
Cash decreased $931$772 million in 20212023 versus 2020.2022. The primary sources of cash in 20212023 were cash flows from operations of $9,725$9,305 million and debt borrowings, net of $1,060 million. The primary uses of cash included capital expenditures of $3,086$3,787 million, net purchases of ordinary shares of $4,562$3,925 million, and cash dividends to shareholders of $2,189$2,482 million.
Cash Flows From Operations
2021 compared with 2020
Cash flows from operations was $9,725$9,305 million, an increase of $2,296$441 million or 31% from 2020.2022. The increase was driven primarily by higher net income adjusted for non-cash charges, and lowerpartially offset by higher working capital requirements, including an increase inlower inflows from contract liabilities due tofrom engineering customer advanced payments which more than offsetand higher cash taxes. Cost reduction programs and othertax payments. Other charges net of payments was $98were $40 million and $258$1,029 million, for the years ended December 31, 20212023 and 2020, respectively, representing2022, respectively. 2022 charges related primarily to the deconsolidation and impairment of $273Russian subsidiaries resulting from the ongoing war in Ukraine and related sanctions. Related Other charges cash outflows were $158 million and $506$127 million netfor the years ended December 31, 2023 and 2022, respectively.
As of December 31, 2023, Linde has approximately $418 million recorded in contract liabilities within the consolidated balance sheet related cash outflows of $175 million and $248 million, respectively,to suspended engineering projects in each period.
Investing
2021 compared with 2020
Net cash used for investing activities was $3,007$4,670 million in 20212023 compared to $2,986$3,088 million in 2020. The increase was primarily driven by lower proceeds from divestitures in 2021, largely offset by lower2022 due to higher acquisitions, net of cash acquired and higher capital expenditures.
Capital expenditures in 20212023 were $3,086$3,787 million, a decreasean increase of $314$614 million from 2020.2022. Capital expenditures during 20212023 related primarily to investments in new plant and production equipment for growth.operating and growth requirements. Approximately 42%63% of the capital expenditures were in the Americas segment with 32%21% in the APAC segment and the rest primarily in the EMEA segment.
At December 31, 20212023 , Linde's sale of gas backlog of large projects under construction was approximately $3.5$4.9 billion. This represents the total estimated capital cost of large plants under construction.
Acquisition expenditures in 2021Acquisitions, net of cash acquired for 2023 were $88$953 million, an increase of $20$843 million from 20202022, and related primarily to acquisitionsthe acquisition of nexAir in the Americas and EMEA.(see Note 2 to the consolidated financial statements). Acquisitions, net of cash acquired for the year ended December 31, 20202022 were $68$110 million and related primarily to acquisitions in the Americas and APAC.EMEA segments.
Divestitures and asset sales, net of cash divested in 2021 totaled $1672023 were $70 million as compared to $482$195 million in 2020. The 2020 period includes net2022. Divestiture proceeds from merger-related divestitures of $98 millionin 2022 include cash received from the sale of selected assetsthe company's GIST business of Linde China and$184 million, net of cash divested of $75 million, for net proceeds of approximately $130$109 million related(see Note 2 to the divestiture of a non-core business in Scandinavia.consolidated financial statements).
Financing
Linde’s financing strategy is to secure long-term committed funding by issuing public notes and debentures and commercial paper backed by a long-term bank credit agreement. Linde’s international operations are funded through a combination of local borrowing and intercompany funding to minimize the total cost of funds and to manage and centralize currency exchange exposures. As deemed necessary, Linde manages its exposure to interest-rate changes through the use of financial derivatives (see Note 12 to the consolidated financial statements and Item 7A. Quantitative and Qualitative Disclosures About Market Risk).
Cash used for financing activities was $7,588$5,400 million in 20212023 compared to $3,345$3,089 million in 2020.2022. Cash used for debt was $514 million in 2021 versus cash provided by debt of $1,313was $1,060 million in 20202023 versus $4,475 million in 2022, driven primarily due toby lower proceedsinflows from debt issuances and decreased commercial paper borrowings partially offset byand lower net debt repayments. issuances in 2023. In February 2023, Linde repaid $500 million of 2.70% notes that became due. In April 2023, Linde repaid €650 million of 2.00% notes and £300 million of 5.875% notes that became due. In June 2023, Linde issued €500 million of 3.625% notes due in 2025, €750 million of 3.375% notes due in 2029 and €650 million of 3.625% notes due in 2034.
In February 2024, Linde issued €700 million of 3.00% notes due in 2028, €850 million of 3.20% notes due in 2031 and €700 million of 3.40% notes due in 2036.
Net purchases of ordinary shares were $4,562$3,925 million in 20212023 versus $2,410$5,132 million in 2020. 2022. On October 23, 2023, the company's board of directors approved a new share repurchase program for up to $15 billion of Linde's ordinary shares. For additional information related to share repurchase programs, see Part II Item 5. Market for Registrant's Common Equity, Related Stockholder Matters and Issuer Purchases of Equity Securities.
Cash dividends increased to $2,189$2,482 million in 20212023 versus $2,028$2,344 million in 20202022 driven primarily by a 10%9% increase in dividends per share from $3.852to $5.10 per share to $4.24from $4.68 per share.share, partially offset by lower shares outstanding. Cash used for Noncontrolling interest transactions and other was $323$53 million for the year ended December 31, 20212023 versus cash used of $220$88 million for the respective 2020 period2022 period.
Linde’s total net debt outstanding at December 31, 2023 was $14,709 million, $2,231 million higher than $12,478 million at December 31, 2022. The December 31, 2023 net debt balance includes $18,907 million in public securities, and $466 million representing primarily due to the settlementworldwide bank borrowings, net of the buyout$4,664 million of minority interests in the Republic of South Africa in January of 2021.cash. Linde’s global effective borrowing rate was approximately 2.6% for 2023.
The company believes that it has sufficient operating flexibility, cash reserves, and funding sources to maintain adequate amounts of liquidity to meet its business needs around the world. At December 31, 2021,2023, Linde's credit ratings as reported by Standard & Poor’s and Moody’s were A-1 and P-1 for short-term debt, respectively, and A and A2 for long-term debt, respectively. The company maintains a $5 billion and a $1.5 billion unsecured and undrawn revolving credit agreements with no associated financial covenants. No borrowings were outstanding under the credit agreements as of December 31, 2023. The company does not anticipate any limitations on its ability to access the debt capital markets and/or other external funding sources and remains committed to its strong ratings from Moody’s and Standard & Poor’s.
Note 11 to the consolidated financial statements includes information with respect to the company’s debt activity, in 2021, current debt position, debt covenants and the available credit facilities; and Note 12 includes information relating to derivative financial instruments. Linde's credit facilities are with major financial institutions and are non-cancelable until maturity. Therefore, the company believes the risk of the financial institutions being unable to make required loans under the credit facilities, if requested, to be low. Linde’s major bank credit and long-term debt agreements contain standard covenants. The company was in compliance with these covenants at December 31, 20212023 and expects to remain in compliance for the foreseeable future.
The company maintains a $5 billion unsecured and undrawn revolving credit agreement with no associated financial covenants. No borrowings were outstanding under the credit agreement as of December 31, 2021. The company does not anticipate any limitations on its ability to access the debt capital markets and/or other external funding sources and remains committed to its strong ratings from Moody’s and Standard & Poor’s.
Linde’s total net debt outstanding at December 31, 2021 was $11,384 million, $1,016 million lower than $12,400 million at December 31, 2020. The December 31, 2021 net debt balance includes $13,069 million in public securities, $1,138 million representing primarily worldwide bank borrowings, net of $2,823 million of cash. Linde’s global effective borrowing rate was approximately 1.4% for 2021.
In June 2021, Linde repaid €600 million of 3.875% notes that became due. In September 2021, Linde issued €700 million of 0.000% notes due 2026, €500 million of 0.375% notes due 2033, and €700 million of 1.000% notes due 2051. In November 2021, Linde repaid $600 million of 2.45% notes that were due in 2022. There was no impact to interest within the consolidated statements of income (see Note 11 to the consolidated financial statements).
In January 2022, Linde repaid €1.0 billion of 0.250% notes that became due in 2022.
On February 28, 2022, the company’s Board of Directors approved the additional repurchase of $10.0 billion of its ordinary shares. For additional information related to the share repurchase programs, see Part II Item 5. Market for Registrant's Common Equity, Related Stockholder Matters and Issuer Purchases of Equity Securities.
OFF-BALANCE SHEET ARRANGEMENTS
As discussed in Note 17 to the consolidated financial statements, at December 31, 2021,2023, Linde had undrawn outstanding letters of credit, bank guarantees and surety bonds entered into in connection with normal business operations and they are not reasonably likely to have a material impact on Linde’s consolidated financial condition, results of operations, or liquidity.
CRITICAL ACCOUNTING ESTIMATES
The policies discussed below are considered by management to be critical to understanding Linde’s financial statements and accompanying notes prepared in accordance with accounting principles generally accepted in the United States ("U.S. GAAP"). Their application places significant importance on management’s judgment as a result of the need to make estimates of matters that are inherently uncertain. Linde’s financial position, results of operations and cash flows could be materially affected if actual results differ from estimates made. These policies are determined by management and have been reviewed by Linde’s Audit Committee.
Revenue Recognition
Long-Term Construction Contracts
The company designs and manufactures equipment for air separation and other varied gas production and processing plants manufactured specifically for end customers. Revenues for sale of equipment contracts are generally recognized over time as Linde has an enforceable right to payment for performance completed to date and performance does not create an asset with alternative use. For contracts recognized over time, revenue is recognized primarily using a cost incurred input method. Costs incurred to date relative to total estimated costs at completion are used to measure progress toward satisfying performance obligations. The result is applied to total expected revenue and results in financial statement recognition of revenue in addition to costs incurred to date. Any expected loss on a contract is recognized as an expense immediately. Contract modifications are typically accounted for as part of the existing contract and are recognized as a cumulative adjustment for the inception-to-date effect of such change. We assess performance as progress towards completion is achieved on specific projects, earnings will be impacted by changes to our forecast of revenues and costs on these projects.
The cost incurred input method places considerable importance on accurate estimates of the extent of progress towards completion and may involve estimates on the scope of deliveries and services required to fulfill the contractually defined obligations. The key source of estimation uncertainty is the total estimated costs at completion including material, labor and overhead costs and the resultant state of completion of the contracts. There are inherent uncertainties associated with the estimation process, including technical complexity, duration of construction cycle, potential cost inflation (whether equipment or manpower), and scope considerations all of which may affect the total estimation process. Changes in these estimates may lead to a significant impact on future financial statements.
Pension Benefits
Pension benefits represent financial obligations that will be ultimately settled in the future with employees who meet eligibility requirements. Because of the uncertainties involved in estimating the timing and amount of future payments, significant estimates are required to calculate pension expense and liabilities related to the company’s plans. The company utilizes the services of independent actuaries, whose models are used to facilitate these calculations.
Several key assumptions are used in actuarial models to calculate pension expense and liability amounts recorded in the financial statements. Management believes the three most significant variables in the models are the expected long-term rate of return on plan assets, the discount rate, and the expected rate of compensation increase. The actuarial models also use assumptions for various other factors, including long-term inflation rates, employee turnover, retirement age, and
mortality. Linde management believes the assumptions used in the actuarial calculations are reasonable, reflect the company’s experience and expectations for the future and are within accepted practices in each of the respective
geographic locations in which it operates. Actual results in any given year will often differ from actuarial assumptions because of economic and other factors. The sensitivities to each of the key assumptions presented below exclude the impact of special items that occurred during the year.
The weighted-average expected long-term rates of return on pension plan assets were 7.00% for U.S. plans and 5.28%5.64% for non-U.S. plans for the year endedat December 31, 20212023 (7.00% and 5.31%5.60%, respectively at December 31, 2020)2022). The expected long-term rate of return on the U.S. and Non-U.S. plan assets is estimated based on the plans' investment strategy and asset allocation, historical capital market performance and, to a lesser extent, historical plan performance. A 0.50% change in these expected long-term rates of return, with all other variablesassumptions held constant, would change Linde’s pension expense by approximately $46$44 million.
The company has consistently used a market-related value of assets rather than the fair value at the measurement date to determine annual pension expense. The market-related value recognizes investment gains or losses over a five-year period. As a result, changes in the fair value of assets from year to year are not immediately reflected in the company’s annual pension expense. Instead, annual pension expense in future periods will be impacted as deferred investment gains or losses are recognized in the market-related value of assets over the five-year period. The consolidated market-related value of assets was $9,612$9,180 million, or $804$952 million lowerhigher than the fair value of assets of $10,416$8,228 million at December 31, 2021.2023. These net deferred investment losseslo of $804$952 million will be recognized in the calculation of the market-related value of assets ratably over the next four years and will impact future pension expense. Future actual investment gains or losses will impact the market-related value of assets and, therefore, will impact future annual pension expense in a similar manner.
Discount rates are used to calculate the present value of plan liabilities and pension costs and are determined annually by management. The company measures the service and interest cost components of pension and OPEB expense for significant U.S. and non-U.S. plans using the spot rate approach. U.S. plans that do not use the spot rate approach continue to determine discount rates by using a cash flow matching model provided by the company's independent actuaries. The model includes a portfolio of corporate bonds graded AaAA or better by at least half of the ratings agencies and matches the U.S. plans' projected cash flows to the calculated spot rates. Discount rates for the remaining Non-U.S. plans are based on market yields for high-quality fixed income investments representing the approximate duration of the pension liabilities on the measurement date. Refer to Note 16 to the consolidated financial statements for a summary of the discount rates used to calculate plan liabilities and benefit costs, and to the Retirement Benefits section of the Consolidated Results and Other Information section of this MD&A for a further discussion of 20212023 benefit costs. A 0.50% reduction in discount rates, with all other variables held constant, would increase Linde’s pension expense by approximately $52$4 million whereas a 0.50% increase in discount rates would result in a decrease of $47$3 million. A 0.50% reduction in discount rates would increase the PBO by approximately $951$521 million whereas a 0.50% increase in discount rates would have a favorable impact to the PBO of approximately $841$477 million.
The weighted-average expected rate of compensation increase was 3.25%3.50% for U.S. plans and 2.55%2.58% for non-U.S. plans at December 31, 20212023 (3.25% and 2.55%2.59%, respectively, at December 31, 2020)2022). The estimated annual compensation increase is determined by management every year and is based on historical trends and market indices. A 0.50% change in the expected rate of compensation increase, with all other variables held constant, would change Linde’s pension expense by approximately $8$5 million and would impact the PBO by approximately $54$50 million.
Asset Impairments
Goodwill and Other Indefinite-Lived Intangibles Assets
At December 31, 2021,2023, the company had goodwill of $27,038$26,751 million and $1,813$1,745 million of other indefinite-lived intangible assets. Goodwill represents the aggregate of the excess consideration paid for acquired businesses over the fair value of the net assets acquired. Indefinite-lived other intangibles relate to the Linde name.
The company performs a goodwill impairment test annually as of October 1 or more frequently if events or circumstances indicate that an impairment loss may have been incurred.
The impairment teststest performed during the fourth quarter of 20212023 indicated no impairment. At December 31, 2021,2023, Linde’s enterprise value was approximately $188$213 billion (outstanding shares multiplied by the year-end stock price plus net debt, and without any control premium) while its total capital was approximately $57$56 billion.
The impairment test allows an entity to first assess qualitative factors to determine if it is more likely than not that the fair value of a reporting unit is less than carrying value. If it is determined that it is more likely than not that the fair value of a reporting unit is less than carrying value then the company will estimate and compare the fair value of its reporting units to
their carrying value, including goodwill. Reporting units are determined based on one level below the operating segment level.
Management believes that the quantitative and qualitative factors used to perform its annual goodwill impairment assessment are appropriate and reasonable. Although the 20212023 assessment indicated that it is more likely than not that the fair value of each reporting unit exceeded its carrying value, changes in circumstances or conditions affecting this analysis could have a significant impact on the fair value determination, which could then result in a material impairment charge to the company's results of operations. Reporting units with greater concentration of Linde AG assets fair valued during the 2018 Praxair, Inc. and Linde AG merger are at greater risk of impairment in future periods.
Other indefinite-lived intangible assets are evaluated for impairment on an annual basis or more frequently if events and circumstances indicate that an impairment loss may have been incurred, and no impairments were indicated.
See Notes 9 and 10 to the consolidated financial statements.
Long-Lived Assets
Long-lived assets, including property, plant and equipment and finite-lived other intangible assets, are tested for impairment whenever events or changes in circumstances indicate that the carrying amount of an individual asset or asset group may not be recoverable. For purposes of this test, asset groups are determined based upon the lowest level for which there are independent and identifiable cash flows. Based upon Linde's business model an asset group may be a single plant and related assets used to support on-site, merchant and packaged gas customers. Alternatively, the asset group may be a collection of distribution related assets (cylinders, distribution centers, and stores) or be a pipeline complex which includes multiple interdependent plants and related assets connected by pipelines within a geographic area used to support the same distribution methods. As a result of the Russia-Ukraine conflict, Linde deconsolidated its Russian gas and engineering business entities as of June 30, 2022. See Note 3 to the consolidated financial statements.
Income Taxes
At December 31, 2021,2023, Linde had deferred tax assets of $1,829$1,292 million (net of valuation allowances of $235$176 million), and deferred tax liabilities of $7,826$6,815 million. At December 31, 2021,2023, uncertain tax positions totaled $387$304 million (see Note 1 and Note 5 to the consolidated financial statements). Income tax expense was $1,262$1,814 million for the year ended December 31, 2021,2023, or about 24.7%22.7% of pre-tax income (see Note 5 to the consolidated financial statements for additional information related to taxes).
In the preparation of consolidated financial statements, Linde estimates income taxes based on diverse legislative and regulatory structures that exist in various jurisdictions where the company conducts business. Deferred income tax assets and liabilities represent tax benefits or obligations that arise from temporary differences due to differing treatment of certain items for accounting and income tax purposes. Linde evaluates deferred tax assets each period to ensure that estimated future taxable income will be sufficient in character (e.g. capital gain versus ordinary income treatment), amount and timing to result in their recovery. A valuation allowance is established when management determines that it is more likely than not that a deferred tax asset will not be realized to reduce the assets to their realizable value. Considerable judgments are required in establishing deferred tax valuation allowances and in assessing exposures related to tax matters. As events and circumstances change, related reserves and valuation allowances are adjusted to income at that time. Linde’s tax returns are subject to audit and local taxing authorities could challenge the company’s tax positions. The company’s practice is to review tax filing positions by jurisdiction and to record provisions for uncertain income tax positions, including interest and penalties when applicable. Linde believes it records and/or discloses such potential tax liabilities as appropriate and has reasonably estimated its income tax liabilities and recoverable tax assets. If new information becomes available, adjustments are charged or credited against income at that time. Management does not anticipate that such adjustments would have a material adverse effect on the company’s consolidated financial position or liquidity; however, it is possible that the final outcomes could have a material impact on the company’s reported results of operations.
Contingencies
The company accrues liabilities for non-income tax contingencies when management believes that a loss is probable and the amounts can be reasonably estimated, while contingent gains are recognized only when realized or realizable. If new information becomes available or losses are sustained in excess of recorded amounts, adjustments are charged against income at that time. Management does not anticipate that in the aggregate such losses would have a material adverse effect on the company’s consolidated financial position or liquidity; however, it is possible that the final outcomes could have a material impact on the company’s reported results of operations.
Linde is subject to various claims, legal proceedings and government investigations that arise from time to time in the ordinary course of business. These actions are based upon alleged environmental, tax, antitrust and personal injury claims, among others (see Note 17 to the consolidated financial statements). Such contingencies are significant and the accounting requires considerable management judgments in analyzing each matter to assess the likely outcome and the need for
establishing appropriate liabilities and providing adequate disclosures. Linde believes it records and/or discloses such contingencies as appropriate and has reasonably estimated its liabilities.
NEW ACCOUNTING STANDARDS
See Note 1 to the consolidated financial statements for information concerning new accounting standards and the impact of the implementation of these standards on the company’s financial statements.
FAIR VALUE MEASUREMENTS
Linde does not expect changes in the aggregate fair value of its financial assets and liabilities to have a material impact on the consolidated financial statements. See Note 13 to the consolidated financial statements.
NON-GAAP FINANCIAL MEASURES
The following non-GAAP measures are intended to supplement investors’ understanding of the company’s financial information by providing measures which investors, financial analysts and management use to help evaluate the company’s financial leverage and operating performance. Special items which the company does not believe to be indicative of on-going business performance are excluded from these calculations so that investors can better evaluate and analyze historical and future business trends on a consistent basis. Definitions of these non-GAAP measures may not be comparable to similar definitions used by other companies and are not a substitute for similar GAAP measures.
The non-GAAP measures in the following reconciliations are presented in this MD&A.
Adjusted Amounts
| | | | | | | | | | | |
| (Dollar amounts in millions, except per share data) | | | |
| Year Ended December 31, | 2021 | 2020 | |
| Adjusted Operating Profit and Operating Margin | | | |
| Reported operating profit | $ | 4,984 | | $ | 3,322 | | |
| | | |
| Add: Cost reduction programs and other charges | 273 | | 506 | | |
| | | |
| Add: Purchase accounting impacts - Linde AG (c) | 1,919 | | 1,969 | | |
| Total adjustments | 2,192 | | 2,475 | | |
| Adjusted operating profit | $ | 7,176 | | $ | 5,797 | | |
| | | |
| Reported percentage change | 50 | % | | |
| Adjusted percentage change | 24 | % | | |
| | | |
| Reported sales | $ | 30,793 | | $ | 27,243 | | |
| | | |
| Reported operating margin | 16.2 | % | 12.2 | % | |
| Adjusted operating margin | 23.3 | % | 21.3 | % | |
| | | |
| Adjusted Depreciation and amortization | | | |
| Reported depreciation and amortization | $ | 4,635 | | $ | 4,626 | | |
| Less: Purchase accounting impacts - Linde AG (c) | (1,863) | | (1,920) | | |
| Adjusted depreciation and amortization | $ | 2,772 | | $ | 2,706 | | |
| | | |
| Adjusted Other Income (Expense) - net | | | |
| Reported Other Income (Expense) - net | $ | (26) | | $ | (61) | | |
| Add: Purchase accounting impacts - Linde AG (c) | (56) | | (49) | | |
| Adjusted Other Income (Expense) - net | $ | 30 | | $ | (12) | | |
| | | |
| Adjusted Net Pension and OPEB Cost (Benefit), Excluding Service Cost | | | |
| Reported net pension and OPEB cost (benefit), excluding service cost | $ | (192) | | $ | (177) | | |
| Add: Pension settlement charges | (4) | | (6) | | |
| Adjusted Net Pension and OPEB cost (benefit), excluding service costs | $ | (196) | | $ | (183) | | |
| | | |
| Adjusted Interest Expense - Net | | | |
| Reported interest expense - net | $ | 77 | | $ | 115 | | |
| Add: Purchase accounting impacts - Linde AG (c) | 53 | | 85 | | |
| Less: Bond Redemption | — | | (16) | | |
| Adjusted interest expense - net | $ | 130 | | $ | 184 | | |
| | | |
| | | | | | | | | | | |
| Adjusted Income Taxes (a) | | | |
| Reported income taxes | $ | 1,262 | | $ | 847 | | |
| Add: Purchase accounting impacts - Linde AG (c) | 452 | | 399 | | |
| Add: Pension settlement charges | 1 | | 1 | | |
| Add: Cost reduction programs and other charges | 29 | | 130 | | |
| Less: Bond Redemption | — | | 4 | | |
| Total adjustments | 482 | | 534 | | |
| Adjusted income taxes | $ | 1,744 | | $ | 1,381 | | |
| | | |
| Adjusted Effective Tax Rate (a) | | | |
| Reported income before income taxes and equity investments | $ | 5,099 | | $ | 3,384 | | |
| Add: Pension settlement charge | 4 | | 6 | | |
| Add: Purchase accounting impacts - Linde AG (c) | 1,866 | | 1,884 | | |
| Add: Cost reduction programs and other charges | 273 | | 506 | | |
| Less: Bond Redemption | — | | 16 | | |
| Total adjustments | 2,143 | | 2,412 | | |
| Adjusted income before income taxes and equity investments | $ | 7,242 | | $ | 5,796 | | |
| | | |
| Reported Income taxes | $ | 1,262 | | $ | 847 | | |
| Reported effective tax rate | 24.7 | % | 25.0 | % | |
| | | |
| Adjusted income taxes | $ | 1,744 | | $ | 1,381 | | |
| Adjusted effective tax rate | 24.1 | % | 23.8 | % | |
| | | |
| Income from Equity Investments | | | |
| Reported income from equity investments | $ | 119 | | $ | 85 | | |
| Add: Cost reduction programs and other charges (d) | 35 | | — | | |
| Add: Purchase accounting impacts - Linde AG (c) | 77 | | 57 | | |
| Adjusted income from equity investments | $ | 231 | | $ | 142 | | |
| | | |
| Adjusted Noncontrolling Interests from Continuing Operations | | | |
| Reported noncontrolling interests from continuing operations | $ | (135) | | $ | (125) | | |
| Add: Cost reduction programs and other charges | — | | (4) | | |
| Add: Purchase accounting impacts - Linde AG (c) | (15) | | (57) | | |
| Total adjustments | (15) | | (61) | | |
| Adjusted noncontrolling interests from continuing operations | $ | (150) | | $ | (186) | | |
| | | |
| Adjusted Income from Continuing Operations (b) | | | |
| Reported income from continuing operations | $ | 3,821 | | $ | 2,497 | | |
| Add: Pension settlement charge | 3 | | 5 | | |
| Add: Cost reduction programs and other charges | 279 | | 372 | | |
| Add: Purchase accounting impacts - Linde AG (c) | 1,476 | | 1,485 | | |
| Less: Bond Redemption | — | | 12 | | |
| Total adjustments | 1,758 | | 1,874 | | |
| Adjusted income from continuing operations | $ | 5,579 | | $ | 4,371 | | |
| | | |
| | | | | | | | | | | |
| Adjusted Diluted EPS from Continuing Operations (b) | | | |
| Reported diluted EPS from continuing operations | $ | 7.32 | | $ | 4.70 | | |
| Add: Pension settlement charge | 0.01 | | 0.01 | | |
| Add: Cost reduction programs and other charges | 0.53 | | 0.70 | | |
| Less: Bond Redemption | — | | 0.02 | | |
| Add: Purchase accounting impacts - Linde AG | 2.83 | | 2.80 | | |
| Total adjustments | 3.37 | | 3.53 | | |
| Adjusted diluted EPS from continuing operations | $ | 10.69 | | $ | 8.23 | | |
| | | |
| Reported percentage change | 56 | % | | |
| Adjusted percentage change | 30 | % | | |
| | | |
| Adjusted EBITDA and % of Sales | | | |
| Income from continuing operations | $ | 3,821 | | $ | 2,497 | | |
| Add: Noncontrolling interests related to continuing operations | 135 | | 125 | | |
| Add: Net pension and OPEB cost (benefit), excluding service cost | (192) | | (177) | | |
| Add: Interest expense | 77 | | 115 | | |
| Add: Income taxes | 1,262 | | 847 | | |
| Add: Depreciation and amortization | 4,635 | | 4,626 | | |
| EBITDA from continuing operations | 9,738 | | 8,033 | | |
| Add: Cost reduction programs and other charges | 308 | | 506 | | |
| Add: Purchase accounting impacts - Linde AG | 133 | | 106 | | |
| Total adjustments | 441 | | 612 | | |
| Adjusted EBITDA from continuing operations | $ | 10,179 | | $ | 8,645 | | |
| | | |
| Reported sales | $ | 30,793 | | $ | 27,243 | | |
| % of sales | | | |
| EBITDA from continuing operations | 31.6 | % | 29.5 | % | |
| Adjusted EBITDA from continuing operations | 33.1 | % | 31.7 | % | |
| | | | | | | | |
| (Dollar amounts in millions, except per share data) | | |
| Year Ended December 31, | 2023 | 2022 |
| Adjusted Operating Profit and Operating Margin | | |
| Reported operating profit | $ | 8,024 | | $ | 5,369 | |
| Add: Other charges (a) | 40 | | 1,029 | |
| Add: Purchase accounting impacts - Linde AG (c) | 1,006 | | 1,506 | |
| Total adjustments | 1,046 | | 2,535 | |
| Adjusted operating profit | $ | 9,070 | | $ | 7,904 | |
| | |
| Reported percentage change | 49 | % | |
| Adjusted percentage change | 15 | % | |
| | |
| Reported sales | $ | 32,854 | | $ | 33,364 | |
| | |
| Reported operating margin | 24.4 | % | 16.1 | % |
| Adjusted operating margin | 27.6 | % | 23.7 | % |
| | |
| Adjusted Depreciation and amortization | | |
| Reported depreciation and amortization | $ | 3,816 | | $ | 4,204 | |
| Less: Purchase accounting impacts - Linde AG (c) | (991) | | (1,481) | |
| Adjusted depreciation and amortization | $ | 2,825 | | $ | 2,723 | |
| | |
| Adjusted Other Income (Expense) - net | | |
| Reported Other Income (Expense) - net | $ | (41) | | $ | (62) | |
| Add: Purchase accounting impacts - Linde AG (c) | (15) | | (25) | |
| Adjusted Other Income (Expense) - net | $ | (26) | | $ | (37) | |
| | |
| Adjusted Net Pension and OPEB Cost (Benefit), Excluding Service Cost | | |
| Reported net pension and OPEB cost (benefit), excluding service cost | $ | (164) | | $ | (237) | |
| Add: Pension settlement charges | (16) | | (6) | |
| Adjusted Net Pension and OPEB cost (benefit), excluding service costs | $ | (180) | | $ | (243) | |
| | |
| Adjusted Interest Expense - Net | | |
| Reported interest expense - net | $ | 200 | | $ | 63 | |
| Add: Purchase accounting impacts - Linde AG (c) | 16 | | 35 | |
| Adjusted interest expense - net | $ | 216 | | $ | 98 | |
| | | | | | | | |
| | |
| Adjusted Income Taxes (a) | | |
| Reported income taxes | $ | 1,814 | $ | 1,434 |
| Add: Purchase accounting impacts - Linde AG (c) | 232 | 374 |
| Add: Pension settlement charges | 3 | 1 |
| Add: Other charges (a) | 81 | 136 |
| Total adjustments | 316 | 511 |
| Adjusted income taxes | $ | 2,130 | $ | 1,945 |
| | |
| Adjusted Effective Tax Rate (a) | | |
| Reported income before income taxes and equity investments | $ | 7,988 | $ | 5,543 |
| Add: Pension settlement charge | 16 | 6 |
| Add: Purchase accounting impacts - Linde AG (c) | 990 | 1,471 |
| Add: Other charges (a) | 40 | 1,029 |
| Total adjustments | 1,046 | 2,506 |
| Adjusted income before income taxes and equity investments | $ | 9,034 | $ | 8,049 |
| | |
| Reported Income taxes | $ | 1,814 | $ | 1,434 |
| Reported effective tax rate | 22.7% | 25.9% |
| | |
| Adjusted income taxes | $ | 2,130 | $ | 1,945 |
| Adjusted effective tax rate | 23.6% | 24.2% |
| | |
| Income from Equity Investments | | |
| Reported income from equity investments | $ | 167 | $ | 172 |
| Add: Purchase accounting impacts - Linde AG (c) | 72 | 75 |
| Total adjustments | 72 | 75 |
| Adjusted income from equity investments | $ | 239 | $ | 247 |
| | |
| Adjusted Noncontrolling Interests | | |
| Reported noncontrolling interests | $ | (142) | $ | (134) |
| Add: Purchase accounting impacts - Linde AG (c) | (12) | (22) |
| Adjusted noncontrolling interests | $ | (154) | $ | (156) |
| | |
| Adjusted Net Income - Linde plc (b) | | |
| Reported net income | $ | 6,199 | | $ | 4,147 | |
| Add: Pension settlement charge | 13 | | 5 | |
| Add: Other charges (a) | (41) | | 893 | |
| Add: Purchase accounting impacts - Linde AG (c) | 818 | | 1,150 | |
| Total adjustments | 790 | | 2,048 | |
| Adjusted net income - Linde plc | $ | 6,989 | | $ | 6,195 | |
| | |
| Adjusted Diluted EPS (b) | | |
| Reported diluted EPS | $ | 12.59 | | $ | 8.23 | |
| Add: Pension settlement charge | 0.03 | | 0.01 | |
| Add: Other charges (a) | (0.08) | | 1.77 | |
| | | | | | | | |
| Add: Purchase accounting impacts - Linde AG (c) | 1.66 | | 2.28 | |
| Total adjustments | 1.61 | | 4.06 | |
| Adjusted diluted EPS | $ | 14.20 | | $ | 12.29 | |
| | |
| Reported percentage change | 53 | % | |
| Adjusted percentage change | 16 | % | |
| | |
| Adjusted EBITDA and % of Sales | | |
| Net Income - Linde plc | $ | 6,199 | | $ | 4,147 | |
| Add: Noncontrolling interests | 142 | | 134 | |
| Add: Net pension and OPEB cost (benefit), excluding service cost | (164) | | (237) | |
| Add: Interest expense | 200 | | 63 | |
| Add: Income taxes | 1,814 | | 1,434 | |
| Add: Depreciation and amortization | 3,816 | | 4,204 | |
| EBITDA | 12,007 | | 9,745 | |
| Add: Other charges (a) | 40 | | 1,029 | |
| Add: Purchase accounting impacts - Linde AG (c) | 86 | | 99 | |
| Total adjustments | 126 | | 1,128 | |
| Adjusted EBITDA | $ | 12,133 | | $ | 10,873 | |
| | |
| Reported sales | $ | 32,854 | | $ | 33,364 | |
| % of sales | | |
| EBITDA | 36.5 | % | 29.2 | % |
| Adjusted EBITDA | 36.9 | % | 32.6 | % |
| | | | | | | | | | | | | | | | | | | | | | | | | | | | | | | | | | | | | | | | | |
| (a) The income tax expense (benefit) on the non-GAAP pre-tax adjustments was determined using the applicable tax rates for the jurisdictions that were utilized in calculating the GAAP income tax expense (benefit) and included both current and deferred income tax amounts. |
| (b) Net of income taxes which are shown separately in “Adjusted Income Taxes and Effective Tax Rate”. |
(c) The company believes that its non-GAAP measures excluding Purchase accounting impacts - Linde AG are useful to investors because: (i) the business combination was a merger of equals in an all-stock merger transaction, with no cash consideration, (ii) the company is managed on a geographic basis and the results of certain geographies are more heavily impacted by purchase accounting than others, causing results that are not comparable at the reportable segment level, therefore, the impacts of purchasing accounting adjustments to each segment vary and are not comparable within the company and when compared to other companies in similar regions, (iii) business management is evaluated and variable compensation is determined based on results excluding purchase accounting impacts, and; (iv) it is important to investors and analysts to understand the purchase accounting impacts to the financial statements.
A summary of each of the adjustments made for Purchase accounting impacts - Linde AG are as follows:
Adjusted Operating Profit and Margin: The purchase accounting adjustments for the periods presented relate primarily to depreciation and amortization related to the fair value step up of fixed assets and intangible assets (primarily customer related) acquired in the merger and the allocation of fair value step-up for ongoing Linde AG asset disposals (reflected in Other Income/(Expense)).
Adjusted Interest Expense - Net: Relates to the amortization of the fair value of debt acquired in the merger.
Adjusted Income Taxes and Effective Tax Rate: Relates to the current and deferred income tax impact on the adjustments discussed above. The income tax expense (benefit) on the non-GAAP pre-tax adjustments was determined using the applicable tax rates for the jurisdictions that were utilized in calculating the GAAP income tax expense (benefit) and included both current and deferred income tax amounts.
Adjusted Income from Equity Investments: Represents the amortization of increased fair value on equity investments related to depreciable and amortizable assets.
Adjusted Noncontrolling Interests from Continuing Operations: Represents the noncontrolling interests’ ownership portion of the adjustments described above determined on an entity by entity basis.
|
(d) Impairment charge related to a joint venture in the APAC segment |
Net Debt and Adjusted Net Debt
Net debt is a financial liquidity measure used by investors, financial analysts and management to evaluate the ability of a company to repay its debt. Purchase accounting impacts have been excluded as they are non-cash and do not have an impact on liquidity.
| | | December 31,
2021 | | December 31,
2020 |
| December 31,
2023 | |
| December 31,
2023 | |
| December 31,
2023 | | | December 31,
2022 |
| (Millions of dollars) | (Millions of dollars) | | | | (Millions of dollars) | | | |
| Debt | Debt | $ | 14,207 | | | $ | 16,154 | |
| Less: cash and cash equivalents | Less: cash and cash equivalents | (2,823) | | | (3,754) | |
| Net debt | Net debt | 11,384 | | | 12,400 | |
| Less: purchase accounting impacts - Linde AG | Less: purchase accounting impacts - Linde AG | (61) | | | (121) | |
| Adjusted net debt | Adjusted net debt | $ | 11,323 | | | $ | 12,279 | |
SUPPLEMENTAL GUARANTEE INFORMATION
On June 6, 2020,May 3, 2023, the company filed a Form S-3 Registration Statement with the SEC (the "Registration("the Registration Statement").
Linde plc may offer debt securities, preferred shares, depositary shares and ordinary shares under the Registration Statement, and debt securities exchangeable for or convertible into preferred shares, ordinary shares or other debt securities. Debt securities of Linde plc may be guaranteed by Linde Inc. (previously Praxair, Inc.)Inc and/or Linde GmbH (previously Linde AG).GmbH. Linde plc may provide guarantees of debt securities offered by its wholly owned subsidiaries Linde Inc. or Linde Finance under the Registration Statement.
Linde Inc. is a wholly owned subsidiary of Linde plc. Linde Inc. may offer debt securities under the Registration Statement. Debt securities of Linde Inc. will be guaranteed by Linde plc, and such guarantees by Linde plc may be guaranteed by Linde GmbH. Linde Inc. may also provide (i) guarantees of debt securities offered by Linde plc under the Registration Statement and (ii) upstream guarantees of thedownstream guarantees provided by Linde plc of debt securities of Linde Finance offered under the Registration Statement.
Linde Finance B.V. is a wholly owned subsidiary of Linde plc. Linde Finance may offer debt securities under the Registration Statement. Linde plc will guarantee debt securities of Linde Finance offered under the Registration Statement. Linde GmbH and Linde Inc. may guarantee Linde plc’s obligations under its downstream guarantee.
Linde GmbH is a wholly owned subsidiary of Linde plc. Linde GmbH may provide (i) guarantees of debt securities offered by Linde plc under the Registration Statement and (ii) upstream guarantees of downstream guarantees provided by Linde plc of debt securities of Linde Inc. or Linde Finance offered under the Registration Statement.
In September 2019, Linde plc provided downstream guarantees of all of the pre-business combinationpre-existing Linde Inc. and Linde Finance notes, and Linde GmbH and Linde Inc., respectively, provided upstream guarantees of Linde plc’s downstream guarantees.
Linde plc has filed a base prospectus with the Luxembourg Stock Exchange for a €10.0 billion debt issuance program, under which Linde plc may offer debt securities. Linde Inc. and Linde GmbH have provided to Linde plc upstream guarantees in relation to debt securities of Linde plc offered under the European debt program.
For further information about the guarantees of the debt securities registered under the Registration Statement (including the ranking of such guarantees, limitations on enforceability of such guarantees and the circumstances under which such guarantees may be released), see “Description of Debt Securities – Guarantees” and “Description of Debt Securities – Ranking” in the Registration Statement, which subsections are incorporated herein by reference.
The following tables present summarized financial information for Linde plc, Linde Inc., Linde GmbH and Linde Finance on a combined basis, after eliminating intercompany transactions and balances between them and excluding investments in and equity in earnings from non-guarantor subsidiaries.
| | (Millions of dollars) | (Millions of dollars) | |
| Statement of Income Data | |
| Statement of Income Data | |
| Statement of Income Data | Statement of Income Data | Twelve Months Ended December 31, 2021 | | Twelve Months Ended December 31, 2020 | Twelve Months Ended December 31, 2023 | | Twelve Months Ended December 31, 2022 |
| Sales | Sales | $ | 7,767 | | | $ | 6,876 | |
| Operating profit | Operating profit | 973 | | | 786 | |
| Net income | Net income | 721 | | | 690 | |
| Transactions with non-guarantor subsidiaries | Transactions with non-guarantor subsidiaries | 2,067 | | | 2,222 | |
| | Balance Sheet Data (at period end) | Balance Sheet Data (at period end) | |
| Balance Sheet Data (at period end) | |
| Balance Sheet Data (at period end) | |
| Current assets (a) | |
| Current assets (a) | |
| Current assets (a) | Current assets (a) | $ | 5,826 | | | $ | 4,174 | |
| Long-term assets (b) | Long-term assets (b) | 15,928 | | | 17,978 | |
| Current liabilities (c) | Current liabilities (c) | 8,853 | | | 8,337 | |
| Long-term liabilities (d) | Long-term liabilities (d) | 42,860 | | | 39,208 | |
| (a) From current assets above, amount due from non-guarantor subsidiaries | (a) From current assets above, amount due from non-guarantor subsidiaries | $ | 4,209 | | | $ | 1,984 | |
(a) From current assets above, amount due from non-guarantor subsidiaries | |
(a) From current assets above, amount due from non-guarantor subsidiaries | |
| (b) From long-term assets above, amount due from non-guarantor subsidiaries | (b) From long-term assets above, amount due from non-guarantor subsidiaries | 3,257 | | | 4,565 | |
| (c) From current liabilities above, amount due to non-guarantor subsidiaries | (c) From current liabilities above, amount due to non-guarantor subsidiaries | 1,304 | | | 1,054 | |
| (d) From long-term liabilities above, amount due to non-guarantor subsidiaries | (d) From long-term liabilities above, amount due to non-guarantor subsidiaries | 28,142 | | | 23,394 | |
|
ITEM 7A. QUANTITATIVE AND QUALITATIVE DISCLOSURES ABOUT MARKET RISK
Linde is exposed to market risks relating to fluctuations in interest rates and currency exchange rates. The objective of financial risk management at Linde is to minimize the negative impact of interest rate and foreign exchange rate fluctuations on the company’s earnings, cash flows and equity.
To manage these risks, Linde uses various derivative financial instruments, including interest-rate swaps, treasury rate locks, currency swaps, forward contracts, and commodity contracts. Linde only uses commonly traded and non-leveraged instruments. These contracts are entered into primarily with major banking institutions thereby minimizing the risk of credit loss. Also, see Note 1 and Note 12 to the consolidated financial statements for a more complete description of Linde’s accounting policies and use of such instruments.
The following discussion presents the sensitivity of the market value, earnings and cash flows of Linde’s financial instruments to hypothetical changes in interest and exchange rates assuming these changes occurred at December 31, 2021.2023. The range of changes chosen for these discussions reflects Linde’s view of changes which are reasonably possible over a one-year period. Market values represent the present values of projected future cash flows based on interest rate and exchange rate assumptions.
Interest Rate Risk
At December 31, 2021,2023, Linde had debt totaling $14,207$19,373 million ($16,15417,914 million at December 31, 2020)2022). For fixed-rate instruments, interest rate changes affect the fair market value but do not impact earnings or cash flows. Conversely, for floating-rate instruments, interest rate changes generally do not affect the fair market value of the instrument but impact future earnings and cash flows, assuming that other factors are held constant. At December 31, 2021,2023, including the impact of derivatives, Linde had fixed-rate debt of $12,492$14,345 million and floating-rate debt of $1,715$5,028 million, representing 88%74% and 12%26%, respectively, of total debt. At December 31, 2020,2022, including the impact of derivatives, Linde had fixed-rate debt of $10,365$13,000 million and floating-rate debt of $5,789$4,914 million, representing 64%73% and 36%27%, respectively, of total debt.
Fixed Rate Debt
In order to mitigate interest rate risk, when considered appropriate, interest-rate swaps are entered into as hedges of underlying financial instruments to effectively change the characteristics of the interest rate without actually changing the underlying financial instrument. At December 31, 2021, Linde had fixed-to-floating interest rate swaps outstanding that were designated as hedging instruments of the underlying debt issuances - refer to Note 12 to the consolidated financial statements for additional information. This sensitivity analysis assumes that, holding all other variables constant (such as foreign exchange rates, swaps and debt levels), a one hundred basis point increase in interest rates would decrease the unrealized fair market value of the fixed-rate debt portfolio by approximately $834$742 million ($674666 million in 2020)2022). A one hundred basis point increase in interest rates would result in an approximate $37$65 million decreaseincrease to derivative assets recorded.
Variable Rate Debt
At December 31, 2021,2023, the after-tax earnings and cash flows impact of a one hundred basis point increase in interest rates, including offsetting impact of derivatives, on the variable-rate debt portfolio would be approximately $33$50 million ($4425 million in 2020)2022).
Foreign Currency Risk
Linde’s exchange-rate exposures result primarily from its investments and ongoing operations in Latin America (primarily Brazil and Mexico), Europe (primarily Germany, Scandinavia, and the U.K.), Canada, Asia Pacific (primarily Australia and China) and other business transactions such as the procurement of equipment from foreign sources. Linde frequently utilizes currency contracts to hedge these exposures. At December 31, 2021,2023, Linde had a notional amount outstanding of $5,870$5,651 million ($7,5533,870 million at December 31, 2020)2022) related to foreign exchange contracts. The majority of these were to hedge recorded balance sheet exposures, primarily intercompany loans denominated in non-functional currencies. See Note 12 to the consolidated financial statements.
Holding all other variables constant, if there were a 10% increase in foreign-currency exchange rates for the portfolio, the fair market value of foreign-currency contracts outstanding at December 31, 20212023 would decrease by approximately $28$58 million and at December 31, 20202022 would decreaseincrease by approximately $99$83 million, which would be largely offset by an offsetting loss or gain on the foreign-currency fluctuation of the underlying exposure being hedged.
Holding all other variables constant, if there were a 10% increase in foreign-currency exchange rates on the external debt portfolio, the fair market value of foreign-currency denominated debt outstanding at December 31, 2023 would decrease by approximately $970 million and at December 31, 2022 would decrease by approximately $803 million, which would be largely offset by an offsetting loss or gain on the underlying exposure being hedged.
ITEM 8. FINANCIAL STATEMENTS AND SUPPLEMENTARY DATA
INDEX TO CONSOLIDATED FINANCIAL STATEMENTS
| | | | | |
| |
| | Page |
| |
| |
| |
| |
| Audited Consolidated Financial Statements | |
| |
| |
| |
| |
| |
| |
| Notes to Consolidated Financial Statements | |
| |
| |
| |
| |
| |
| |
| |
| |
| |
| |
| |
| |
| |
| |
| |
| |
| |
| |
| |
| |
MANAGEMENT’S STATEMENT OF RESPONSIBILITY FOR FINANCIAL STATEMENTS
Linde’s consolidated financial statements are prepared by management, which is responsible for their fairness, integrity and objectivity. The accompanying financial statements have been prepared in conformity with accounting principles generally accepted in the United States of America applied on a consistent basis, except for accounting changes as disclosed, and include amounts that are estimates and judgments. All historical financial information in this annual report is consistent with the accompanying financial statements.
Linde maintains accounting systems, including internal accounting controls, monitored by a staff of internal auditors, that are designed to provide reasonable assurance of the reliability of financial records and the protection of assets. The concept of reasonable assurance is based on recognition that the cost of a system should not exceed the related benefits. The effectiveness of those systems depends primarily upon the careful selection of financial and other managers, clear delegation of authority and assignment of accountability, inculcation of high business ethics and conflict-of-interest standards, policies and procedures for coordinating the management of corporate resources, and the leadership and commitment of top management. In compliance with Section 404 of the Sarbanes-Oxley Act of 2002, Linde assessed its internal control over financial reporting and issued a report (see below).
The Audit Committee of the Board of Directors, which consists solely of non-employee directors, is responsible for overseeing the functioning of the accounting system and related controls and the preparation of annual financial statements. The Audit Committee periodically meets with management, internal auditors and the independent registered public accounting firm to review and evaluate their accounting, auditing and financial reporting activities and responsibilities, including management’s assessment of internal control over financial reporting. The independent registered public accounting firm and internal auditors have full and free access to the Audit Committee and meet with the committee, with and without management present.
MANAGEMENT’S REPORT ON INTERNAL CONTROL OVER FINANCIAL REPORTING
Linde’s management is responsible for establishing and maintaining adequate internal control over financial reporting, as such term is defined in Exchange Act Rule 13a-15(f). Under the supervision and with the participation of management, including the company’s principal executive officer and principal financial officer, the company conducted an evaluation of the effectiveness of its internal control over financial reporting based on the framework in Internal Control – Integrated Framework (2013) issued by the Committee of Sponsoring Organizations of the Treadway Commission (often referred to as COSO). Based on this evaluation, management concluded that the company’s internal control over financial reporting was effective as of December 31, 2021.2023.
PricewaterhouseCoopers LLP, an independent registered public accounting firm, has audited and issued their opinion on the effectiveness of the company’s internal control over financial reporting as of December 31, 20212023 as stated in their report.
| | | | | | | | |
/s/ STEPHENANJIV F. ALNGELAMBA | | /s/ KELCEY E. HOYT |
Stephen F. Angel Sanjiv Lamba
Chief Executive Officer | | Kelcey E. Hoyt
Chief Accounting Officer |
/s/ MATTHEW J. WHITE | |
Matthew J. White
Chief Financial Officer | |
February 28, 20222024 |
Report of Independent Registered Public Accounting Firm
To the Board of Directors and Shareholders of Linde plc
Opinions on the Financial Statements and Internal Control over Financial Reporting
We have audited the accompanying consolidated balance sheets of Linde plc and its subsidiaries (the “Company”) as of December 31, 20212023 and 2020,2022, and the related consolidated statements of income, of comprehensive income, of equity and of cash flows for each of the three years in the period ended December 31, 2021,2023, including the related notes (collectively referred to as the “consolidated financial statements”). We also have audited the Company's internal control over financial reporting as of December 31, 2021,2023, based on criteria established in Internal Control - Integrated Framework (2013) issued by the Committee of Sponsoring Organizations of the Treadway Commission (COSO).
In our opinion, the consolidated financial statements referred to above present fairly, in all material respects, the financial position of the Company as of December 31, 20212023 and 2020,2022, and the results of its operations and its cash flows for each of the three years in the period ended December 31, 20212023 in conformity with accounting principles generally accepted in the United States of America. Also in our opinion, the Company maintained, in all material respects, effective internal control over financial reporting as of December 31, 2021,2023, based on criteria established in Internal Control - Integrated Framework (2013) issued by the COSO.
Basis for Opinions
The Company's management is responsible for these consolidated financial statements, for maintaining effective internal control over financial reporting, and for its assessment of the effectiveness of internal control over financial reporting, included in the accompanying Management’s Report on Internal Control Overover Financial Reporting.Reporting appearing under Item 9A. Our responsibility is to express opinions on the Company’s consolidated financial statements and on the Company's internal control over financial reporting based on our audits. We are a public accounting firm registered with the Public Company Accounting Oversight Board (United States) (PCAOB) and are required to be independent with respect to the Company in accordance with the U.S. federal securities laws and the applicable rules and regulations of the Securities and Exchange Commission and the PCAOB.
We conducted our audits in accordance with the standards of the PCAOB. Those standards require that we plan and perform the audits to obtain reasonable assurance about whether the consolidated financial statements are free of material misstatement, whether due to error or fraud, and whether effective internal control over financial reporting was maintained in all material respects.
Our audits of the consolidated financial statements included performing procedures to assess the risks of material misstatement of the consolidated financial statements, whether due to error or fraud, and performing procedures that respond to those risks. Such procedures included examining, on a test basis, evidence regarding the amounts and disclosures in the consolidated financial statements. Our audits also included evaluating the accounting principles used and significant estimates made by management, as well as evaluating the overall presentation of the consolidated financial statements. Our audit of internal control over financial reporting included obtaining an understanding of internal control over financial reporting, assessing the risk that a material weakness exists, and testing and evaluating the design and operating effectiveness of internal control based on the assessed risk. Our audits also included performing such other procedures as we considered necessary in the circumstances. We believe that our audits provide a reasonable basis for our opinions.
Definition and Limitations of Internal Control over Financial Reporting
A company’s internal control over financial reporting is a process designed to provide reasonable assurance regarding the reliability of financial reporting and the preparation of financial statements for external purposes in accordance with generally accepted accounting principles. A company’s internal control over financial reporting includes those policies and procedures that (i) pertain to the maintenance of records that, in reasonable detail, accurately and fairly reflect the transactions and dispositions of the assets of the company; (ii) provide reasonable assurance that transactions are recorded as necessary to permit preparation of financial statements in accordance with generally accepted accounting principles, and that receipts and expenditures of the company are being made only in accordance with authorizations of management and directors of the company; and (iii) provide reasonable assurance regarding prevention or timely detection of unauthorized acquisition, use, or disposition of the company’s assets that could have a material effect on the financial statements.
Because of its inherent limitations, internal control over financial reporting may not prevent or detect misstatements. Also, projections of any evaluation of effectiveness to future periods are subject to the risk that controls may become inadequate because of changes in conditions, or that the degree of compliance with the policies or procedures may deteriorate.
Critical Audit MattersMatter
The critical audit matter communicated below is a matter arising from the current period audit of the consolidated financial statements that was communicated or required to be communicated to the audit committee and that (i) relates to accounts or disclosures that are material to the consolidated financial statements and (ii) involved our especially challenging, subjective, or complex judgments. The communication of critical audit matters does not alter in any way our opinion on the consolidated financial statements, taken as a whole, and we are not, by communicating the critical audit matter below, providing a separate opinion on the critical audit matter or on the accounts or disclosures to which it relates.
Revenue Recognition - Estimated Costs at Completion
As described in Note 19 to the consolidated financial statements, $2,867$2,160 million of the Company’s total revenues for the year ended December 31, 20212023 was generated from the sale of equipment contracts. SaleSales of equipment contracts are generally comprised of a single performance obligation. Revenue from the sale of equipment is generally recognized over time as the Company has an enforceable right to payment for performance completed to date and performance does not create an asset with alternative use. For contracts recognized over time, revenue is recognized primarily using a cost incurred input method. Costs incurred to date relative to total estimated costs at completion are used to measure progress toward satisfying performance obligations. Costs incurred include material, labor, and overhead costs and represent work contributing and proportionate to the transfer of control to the customer.
The principal considerations for our determination that performing procedures relating to revenue recognition - estimated costs at completion is a critical audit matter are (i) the significant judgment by management when developing the estimated costs at completion for the sale of equipment contracts; (ii) a high degree of auditor judgment, subjectivity, and effort in performing procedures and evaluating audit evidence related to the estimated costs at completion and management’s significant assumptions related to the total estimated material and labor costs; and (iii) the audit effort involved the use of professionals with specialized skill and knowledge.
Addressing the matter involved performing procedures and evaluating audit evidence in connection with forming our overall opinion on the consolidated financial statements. These procedures included testing the effectiveness of controls relating to the revenue recognition process, including controls over developing the estimated costs at completion for the sale of equipment contracts. These procedures also included, among others, evaluating and testing management’s process for developing the estimated costs at completion for the sale of equipment contracts, which included evaluating the reasonableness of management’s significant assumptions related to the total estimated material and labor costs. Evaluating the reasonableness of management’s significant assumptions involved evaluating management’s ability to reasonably estimate costs at completion for the sale of equipment contracts on a sample basis by (i) performing a comparison of the originally estimated and actual costs incurred on similar completed equipment contracts, and (ii) evaluating the timely identification of circumstances that may warrant a modification to estimated costs at completion, including actual costs in excess of estimates. Professionals with specialized skill and knowledge were used to assist in evaluating the reasonableness of management’s estimates and significant assumptions related to the total estimated material and labor costs.
/s/ PricewaterhouseCoopers LLP
Stamford, Connecticut
February 28, 20222024
We have served as the Company’s or its predecessor’s auditor since 1992.
CONSOLIDATED STATEMENTS OF INCOME
LINDE PLC AND SUBSIDIARIES
(Dollar amounts in millions, except per share data)
| | Year Ended December 31, | Year Ended December 31, | 2021 | | 2020 | | 2019 | Year Ended December 31, | 2023 | | 2022 | | 2021 |
| Sales | Sales | $ | 30,793 | | | $ | 27,243 | | | $ | 28,228 | |
| Cost of sales, exclusive of depreciation and amortization | Cost of sales, exclusive of depreciation and amortization | 17,543 | | | 15,383 | | | 16,644 | |
| Selling, general and administrative | Selling, general and administrative | 3,189 | | | 3,193 | | | 3,457 | |
| Depreciation and amortization | Depreciation and amortization | 4,635 | | | 4,626 | | | 4,675 | |
| Research and development | Research and development | 143 | | | 152 | | | 184 | |
| Cost reduction programs and other charges | 273 | | | 506 | | | 567 | |
| Net gain on sale of businesses | — | | | — | | | 164 | |
| Other charges | |
| | Other income (expenses) – net | |
| Other income (expenses) – net | |
| Other income (expenses) – net | Other income (expenses) – net | (26) | | | (61) | | | 68 | |
| Operating Profit | Operating Profit | 4,984 | | | 3,322 | | | 2,933 | |
| Interest expense – net | Interest expense – net | 77 | | | 115 | | | 38 | |
| Net pension and OPEB cost (benefit), excluding service cost | Net pension and OPEB cost (benefit), excluding service cost | (192) | | | (177) | | | (32) | |
| Income From Continuing Operations Before Income Taxes and Equity Investments | 5,099 | | | 3,384 | | | 2,927 | |
| Income taxes on continuing operations | 1,262 | | | 847 | | | 769 | |
| Income Before Income Taxes and Equity Investments | |
| Income taxes | |
| Income From Continuing Operations Before Equity Investments | Income From Continuing Operations Before Equity Investments | 3,837 | | | 2,537 | | | 2,158 | |
| Income from equity investments | Income from equity investments | 119 | | | 85 | | | 114 | |
| Income From Continuing Operations (Including Noncontrolling Interests) | Income From Continuing Operations (Including Noncontrolling Interests) | 3,956 | | | 2,622 | | | 2,272 | |
| Income from discontinued operations, net of tax | Income from discontinued operations, net of tax | 5 | | | 4 | | | 109 | |
| Net Income (Including Noncontrolling Interests) | Net Income (Including Noncontrolling Interests) | 3,961 | | | 2,626 | | | 2,381 | |
| Less: noncontrolling interests from continuing operations | Less: noncontrolling interests from continuing operations | (135) | | | (125) | | | (89) | |
| Less: noncontrolling interests from discontinued operations | — | | | — | | | (7) | |
| | Net Income – Linde plc | |
| Net Income – Linde plc | |
| Net Income – Linde plc | Net Income – Linde plc | $ | 3,826 | | | $ | 2,501 | | | $ | 2,285 | |
| | Net Income – Linde plc | Net Income – Linde plc | |
| Net Income – Linde plc | |
| Net Income – Linde plc | |
| Income from continuing operations | |
| Income from continuing operations | |
| Income from continuing operations | Income from continuing operations | $ | 3,821 | | | $ | 2,497 | | | $ | 2,183 | |
| Income from discontinued operations | Income from discontinued operations | $ | 5 | | | $ | 4 | | | $ | 102 | |
| | Per Share Data – Linde plc Shareholders | Per Share Data – Linde plc Shareholders | |
| Per Share Data – Linde plc Shareholders | |
| Per Share Data – Linde plc Shareholders | |
| Basic earnings per share from continuing operations | |
| Basic earnings per share from continuing operations | |
| Basic earnings per share from continuing operations | Basic earnings per share from continuing operations | $ | 7.39 | | | $ | 4.74 | | | $ | 4.03 | |
| Basic earnings per share from discontinued operations | Basic earnings per share from discontinued operations | 0.01 | | | 0.01 | | | 0.19 | |
| Basic earnings per share | Basic earnings per share | $ | 7.40 | | | $ | 4.75 | | | $ | 4.22 | |
| Diluted earnings per share from continuing operations | Diluted earnings per share from continuing operations | $ | 7.32 | | | $ | 4.70 | | | $ | 4.00 | |
| Diluted earnings per share from discontinued operations | Diluted earnings per share from discontinued operations | 0.01 | | | 0.01 | | | 0.19 | |
| Diluted earnings per share | Diluted earnings per share | $ | 7.33 | | | $ | 4.71 | | | $ | 4.19 | |
| | Weighted Average Shares Outstanding (000’s): | Weighted Average Shares Outstanding (000’s): | |
| Weighted Average Shares Outstanding (000’s): | |
| Weighted Average Shares Outstanding (000’s): | |
| Basic shares outstanding | |
| Basic shares outstanding | |
| Basic shares outstanding | Basic shares outstanding | 516,896 | | | 526,736 | | | 541,094 | |
| Diluted shares outstanding | Diluted shares outstanding | 521,875 | | | 531,157 | | | 545,170 | |
The accompanying Notes are an integral part of these financial statements.
CONSOLIDATED STATEMENTS OF COMPREHENSIVE INCOME
LINDE PLC AND SUBSIDIARIES
(Dollar amounts in millions)
| | Year Ended December 31, | Year Ended December 31, | 2021 | | 2020 | | 2019 | Year Ended December 31, | 2023 | | 2022 | | 2021 |
| NET INCOME (INCLUDING NONCONTROLLING INTERESTS) | NET INCOME (INCLUDING NONCONTROLLING INTERESTS) | $ | 3,961 | | | $ | 2,626 | | | $ | 2,381 | |
| | OTHER COMPREHENSIVE INCOME (LOSS) | OTHER COMPREHENSIVE INCOME (LOSS) | |
| OTHER COMPREHENSIVE INCOME (LOSS) | |
| OTHER COMPREHENSIVE INCOME (LOSS) | |
| Translation adjustments: | Translation adjustments: | |
| Translation adjustments: | |
| Translation adjustments: | |
| Foreign currency translation adjustments | |
| Foreign currency translation adjustments | |
| Foreign currency translation adjustments | Foreign currency translation adjustments | (1,116) | | | 565 | | | 118 | |
| Reclassifications to net income | Reclassifications to net income | (52) | | | — | | | 12 | |
| Income taxes | Income taxes | (7) | | | 30 | | | 3 | |
| Translation adjustments | Translation adjustments | (1,175) | | | 595 | | | 133 | |
| Funded status - retirement obligations (Note 16): | Funded status - retirement obligations (Note 16): | | | | | |
| | Retirement program remeasurements | Retirement program remeasurements | 826 | | | (675) | | | (852) | |
| | | Retirement program remeasurements | |
| | Retirement program remeasurements | |
| | Reclassifications to net income | |
| | Reclassifications to net income | |
| | Reclassifications to net income | Reclassifications to net income | 175 | | | 92 | | | 154 | |
| Income taxes | Income taxes | (255) | | | 114 | | | 154 | |
| Funded status - retirement obligations | Funded status - retirement obligations | 746 | | | (469) | | | (544) | |
| Derivative instruments (Note 12): | Derivative instruments (Note 12): | | | | | |
| Current year unrealized gain (loss) | Current year unrealized gain (loss) | 140 | | | (3) | | | (32) | |
| Current year unrealized gain (loss) | |
| Current year unrealized gain (loss) | |
| Reclassifications to net income | Reclassifications to net income | (49) | | | 42 | | | — | |
| Income taxes | Income taxes | (20) | | | (8) | | | 7 | |
| Derivative instruments | Derivative instruments | 71 | | | 31 | | | (25) | |
| Securities: | | | |
| Current year unrealized gain (loss) | — | | | — | | | 1 | |
| Reclassifications to net income | — | | | — | | | — | |
| Income taxes | — | | | — | | | — | |
| Securities | — | | | — | | | 1 | |
| | TOTAL OTHER COMPREHENSIVE INCOME (LOSS) | |
| | TOTAL OTHER COMPREHENSIVE INCOME (LOSS) | |
| | TOTAL OTHER COMPREHENSIVE INCOME (LOSS) | TOTAL OTHER COMPREHENSIVE INCOME (LOSS) | (358) | | | 157 | | | (435) | |
| | COMPREHENSIVE INCOME (INCLUDING NONCONTROLLING INTERESTS) | COMPREHENSIVE INCOME (INCLUDING NONCONTROLLING INTERESTS) | 3,603 | | | 2,783 | | | 1,946 | |
| COMPREHENSIVE INCOME (INCLUDING NONCONTROLLING INTERESTS) | |
| COMPREHENSIVE INCOME (INCLUDING NONCONTROLLING INTERESTS) | |
| Less: noncontrolling interests | Less: noncontrolling interests | (135) | | | (158) | | | (19) | |
| COMPREHENSIVE INCOME - LINDE PLC | COMPREHENSIVE INCOME - LINDE PLC | $ | 3,468 | | | $ | 2,625 | | | $ | 1,927 | |
The accompanying Notes are an integral part of these financial statements.
CONSOLIDATED BALANCE SHEETS
LINDE PLC AND SUBSIDIARIES
(Dollar amounts in millions)
| | | | | | | | | | | |
| December 31, | 2021 | | 2020 |
| Assets | | | |
| Cash and cash equivalents | $ | 2,823 | | | $ | 3,754 | |
| Accounts receivable – net | 4,499 | | | 4,167 | |
| Contract assets | 134 | | | 162 | |
| Inventories | 1,733 | | | 1,729 | |
| Prepaid and other current assets | 970 | | | 1,112 | |
| Total Current Assets | 10,159 | | | 10,924 | |
| Property, plant and equipment – net | 26,003 | | | 28,711 | |
| Equity investments | 2,619 | | | 2,061 | |
| Goodwill | 27,038 | | | 28,201 | |
| Other intangible assets – net | 13,802 | | | 16,184 | |
| Other long-term assets | 1,984 | | | 2,148 | |
| Total Assets | $ | 81,605 | | | $ | 88,229 | |
| Liabilities and Equity | | | |
| Accounts payable | $ | 3,503 | | | $ | 3,095 | |
| Short-term debt | 1,163 | | | 3,251 | |
| Current portion of long-term debt | 1,709 | | | 751 | |
| Contract liabilities | 2,940 | | | 1,769 | |
| Accrued taxes | 429 | | | 542 | |
| Other current liabilities | 3,899 | | | 4,332 | |
| Total Current Liabilities | 13,643 | | | 13,740 | |
| Long-term debt | 11,335 | | | 12,152 | |
| Other long-term liabilities | 4,188 | | | 5,519 | |
| Deferred credits | 6,998 | | | 7,236 | |
| Total Liabilities | 36,164 | | | 38,647 | |
| Commitments and contingencies (Note 17) | 0 | | 0 |
| Redeemable noncontrolling interests | 13 | | | 13 | |
| Linde plc Shareholders’ Equity: | | | |
| Ordinary shares (€0.001 par value, authorized 1,750,000,000 shares, 2021 issued: 552,012,862 ordinary shares; 2020 issued: 552,012,862 ordinary shares) | 1 | | | 1 | |
| Additional paid-in capital | 40,180 | | | 40,202 | |
| Retained earnings | 18,710 | | | 17,178 | |
| Accumulated other comprehensive income (loss) | (5,048) | | | (4,690) | |
Less: Treasury shares, at cost (2021 – 43,331,983 shares and 2020 – 28,718,333 shares) | (9,808) | | | (5,374) | |
| Total Linde plc Shareholders’ Equity | 44,035 | | | 47,317 | |
| Noncontrolling interests | 1,393 | | | 2,252 | |
| Total Equity | 45,428 | | | 49,569 | |
| Total Liabilities and Equity | $ | 81,605 | | | $ | 88,229 | |
The accompanying Notes are an integral part of these financial statements.
CONSOLIDATED STATEMENTS OF CASH FLOWS
LINDE PLC AND SUBSIDIARIES
(Millions of dollars) | | | | | | | | | | | | | | | | | |
| Year Ended December 31, | 2021 | | 2020 | | 2019 |
| Increase (Decrease) in Cash and Cash Equivalents | | | | | |
| Operations | | | | | |
| Net income – Linde plc | $ | 3,826 | | | $ | 2,501 | | | $ | 2,285 | |
| Less: income from discontinued operations, net of tax and noncontrolling interests | (5) | | | (4) | | | (102) | |
| Add: Noncontrolling interests from continuing operations | 135 | | | 125 | | | 89 | |
| Income from continuing operations (including noncontrolling interests) | $ | 3,956 | | | $ | 2,622 | | | $ | 2,272 | |
| Adjustments to reconcile net income to net cash provided by operating activities: | | | | | |
| Cost Reduction Programs and other charges, net of payments | 98 | | | 258 | | | (236) | |
| Amortization of merger-related inventory step-up | — | | | — | | | 12 | |
| | | | | |
| Depreciation and amortization | 4,635 | | | 4,626 | | | 4,675 | |
| | | | | |
| Deferred income taxes | (254) | | | (369) | | | (303) | |
| Share-based compensation | 128 | | | 133 | | | 95 | |
| Net gain on sale of businesses, net of tax | — | | | — | | | (108) | |
| | | | | |
| | | | | |
| Non-cash charges and other | (19) | | | 152 | | | (127) | |
| Working capital | | | | | |
| Accounts receivable | (553) | | | 19 | | | 80 | |
| Contract assets and liabilities, net | 1,307 | | | 90 | | | 87 | |
| Inventory | (129) | | | 18 | | | (81) | |
| Prepaid and other current assets | 76 | | | 128 | | | (72) | |
| Payables and accruals | 447 | | | 109 | | | (174) | |
| Pension contributions | (42) | | | (91) | | | (94) | |
| Long-term assets, liabilities and other | 75 | | | (266) | | | 93 | |
| Net cash provided by operating activities | 9,725 | | | 7,429 | | | 6,119 | |
| | | | | |
| | | | | |
| Investing | | | | | |
| Capital expenditures | (3,086) | | | (3,400) | | | (3,682) | |
| Acquisitions, net of cash acquired | (88) | | | (68) | | | (225) | |
| | | | | |
| Divestitures and asset sales, net of cash divested | 167 | | | 482 | | | 5,096 | |
| | | | | |
| | | | | |
| | | | | |
| Net cash provided by (used for) investing activities | (3,007) | | | (2,986) | | | 1,189 | |
| | | | | |
| Financing | | | | | |
| Short-term debt borrowings (repayments) – net | (1,329) | | | 1,198 | | | 224 | |
| Long-term debt borrowings | 2,283 | | | 2,796 | | | 99 | |
| Long-term debt repayments | (1,468) | | | (2,681) | | | (1,583) | |
| Issuances of ordinary shares | 50 | | | 47 | | | 72 | |
| Purchases of ordinary shares | (4,612) | | | (2,457) | | | (2,658) | |
| Cash dividends – Linde plc shareholders | (2,189) | | | (2,028) | | | (1,891) | |
| | | | | |
| | | | | |
| Noncontrolling interest transactions and other | (323) | | | (220) | | | (3,260) | |
| | | | | |
| | | | | |
| Net cash used for financing activities | (7,588) | | | (3,345) | | | (8,997) | |
| Discontinued Operations | | | | | |
| Cash provided by operating activities | $ | — | | | $ | — | | | $ | 69 | |
| Cash used for investing activities | — | | | — | | | (60) | |
| Cash provided by financing activities | — | | | — | | | 5 | |
| Net cash provided by discontinued operations | — | | | — | | | 14 | |
| | | | | |
| Effect of exchange rate changes on cash and cash equivalents | (61) | | | (44) | | | (77) | |
| | | | | |
| Change in cash and cash equivalents | (931) | | | 1,054 | | | (1,752) | |
| Cash and cash equivalents, beginning-of-period | 3,754 | | | 2,700 | | | 4,466 | |
| Cash and cash equivalents, including discontinued operations | $ | 2,823 | | | $ | 3,754 | | | $ | 2,714 | |
| Cash and cash equivalents of discontinued operations | — | | | — | | | (14) | |
| Cash and cash equivalents, end-of-period | $ | 2,823 | | | $ | 3,754 | | | $ | 2,700 | |
| | | | | |
| Supplemental Data | | | | | |
| | | | | | | | | | | | | | | | | |
| Income taxes paid | $ | 1,710 | | | $ | 1,066 | | | $ | 1,357 | |
| Interest paid, net of capitalized interest (Note 7) | $ | 233 | | | $ | 322 | | | $ | 275 | |
| | | | | | | | | | | |
| December 31, | 2023 | | 2022 |
| Assets | | | |
| Cash and cash equivalents | $ | 4,664 | | | $ | 5,436 | |
| Accounts receivable – net | 4,718 | | | 4,559 | |
| Contract assets | 196 | | | 124 | |
| Inventories | 2,115 | | | 1,978 | |
| Prepaid and other current assets | 927 | | | 950 | |
| Total Current Assets | 12,620 | | | 13,047 | |
| Property, plant and equipment – net | 24,552 | | | 23,548 | |
| Equity investments | 2,190 | | | 2,350 | |
| Goodwill | 26,751 | | | 25,817 | |
| Other intangible assets – net | 12,399 | | | 12,420 | |
| Other long-term assets | 2,299 | | | 2,476 | |
| Total Assets | $ | 80,811 | | | $ | 79,658 | |
| Liabilities and Equity | | | |
| Accounts payable | $ | 3,020 | | | $ | 2,995 | |
| Short-term debt | 4,713 | | | 4,117 | |
| Current portion of long-term debt | 1,263 | | | 1,599 | |
| Contract liabilities | 1,901 | | | 3,073 | |
| Accrued taxes | 664 | | | 613 | |
| Other current liabilities | 4,156 | | | 4,082 | |
| Total Current Liabilities | 15,717 | | | 16,479 | |
| Long-term debt | 13,397 | | | 12,198 | |
| Other long-term liabilities | 3,804 | | | 2,795 | |
| Deferred credits | 6,798 | | | 6,799 | |
| Total Liabilities | 39,716 | | | 38,271 | |
| Commitments and contingencies (Note 17) | | | |
| Redeemable noncontrolling interests | 13 | | | 13 | |
| Linde plc Shareholders’ Equity: | | | |
| Ordinary shares (€0.001 par value, authorized 1,750,000,000 shares, 2023 issued: 490,766,972 ordinary shares; 2022 issued: 552,012,862 ordinary shares) | 1 | | | 1 | |
| Additional paid-in capital | 39,812 | | | 40,005 | |
| Retained earnings | 8,845 | | | 20,541 | |
| Accumulated other comprehensive income (loss) | (5,805) | | | (5,782) | |
Less: Treasury shares, at cost (2023 – 8,321,827 shares and 2022 – 59,555,235 shares) | (3,133) | | | (14,737) | |
| Total Linde plc Shareholders’ Equity | 39,720 | | | 40,028 | |
| Noncontrolling interests | 1,362 | | | 1,346 | |
| Total Equity | 41,082 | | | 41,374 | |
| Total Liabilities and Equity | $ | 80,811 | | | $ | 79,658 | |
The accompanying Notes are an integral part of these financial statements.
CONSOLIDATED STATEMENTS OF CASH FLOWS
LINDE PLC AND SUBSIDIARIES
(Millions of dollars) | | | | | | | | | | | | | | | | | |
| Year Ended December 31, | 2023 | | 2022 | | 2021 |
| Increase (Decrease) in Cash and Cash Equivalents | | | | | |
| Operations | | | | | |
| Net income – Linde plc | $ | 6,199 | | | $ | 4,147 | | | $ | 3,826 | |
| Less: income from discontinued operations, net of tax and noncontrolling interests | — | | | — | | | (5) | |
| Add: Noncontrolling interests from continuing operations | 142 | | | 134 | | | 135 | |
| Income from continuing operations (including noncontrolling interests) | $ | 6,341 | | | $ | 4,281 | | | $ | 3,956 | |
| Adjustments to reconcile net income to net cash provided by operating activities: | | | | | |
| Other charges, net of payments | (118) | | | 902 | | | 98 | |
| | | | | |
| | | | | |
| Depreciation and amortization | 3,816 | | | 4,204 | | | 4,635 | |
| | | | | |
| Deferred income taxes | (84) | | | (383) | | | (254) | |
| Share-based compensation | 141 | | | 107 | | | 128 | |
| | | | | |
| | | | | |
| | | | | |
| Non-cash charges and other | 43 | | | (49) | | | (19) | |
| Working capital | | | | | |
| Accounts receivable | (86) | | | (423) | | | (553) | |
| Contract assets and liabilities, net | (168) | | | 310 | | | 1,307 | |
| Inventory | (127) | | | (347) | | | (129) | |
| Prepaid and other current assets | 66 | | | (157) | | | 76 | |
| Payables and accruals | (168) | | | 307 | | | 447 | |
| Pension contributions | (46) | | | (51) | | | (42) | |
| Long-term assets, liabilities and other | (305) | | | 163 | | | 75 | |
| Net cash provided by operating activities | 9,305 | | | 8,864 | | | 9,725 | |
| | | | | |
| | | | | |
| Investing | | | | | |
| Capital expenditures | (3,787) | | | (3,173) | | | (3,086) | |
| Acquisitions, net of cash acquired | (953) | | | (110) | | | (88) | |
| | | | | |
| Divestitures and asset sales, net of cash divested | 70 | | | 195 | | | 167 | |
| | | | | |
| | | | | |
| | | | | |
| Net cash used for investing activities | (4,670) | | | (3,088) | | | (3,007) | |
| | | | | |
| Financing | | | | | |
| Short-term debt borrowings (repayments) – net | 554 | | | 3,050 | | | (1,329) | |
| Long-term debt borrowings | 2,188 | | | 3,210 | | | 2,283 | |
| Long-term debt repayments | (1,682) | | | (1,785) | | | (1,468) | |
| Issuances of ordinary shares | 33 | | | 36 | | | 50 | |
| Purchases of ordinary shares | (3,958) | | | (5,168) | | | (4,612) | |
| Cash dividends – Linde plc shareholders | (2,482) | | | (2,344) | | | (2,189) | |
| | | | | |
| | | | | |
| Noncontrolling interest transactions and other | (53) | | | (88) | | | (323) | |
| | | | | |
| | | | | |
| Net cash used for financing activities | (5,400) | | | (3,089) | | | (7,588) | |
| | | | | |
| | | | | |
| | | | | |
| | | | | |
| | | | | |
| | | | | |
| Effect of exchange rate changes on cash and cash equivalents | (7) | | | (74) | | | (61) | |
| | | | | |
| Change in cash and cash equivalents | (772) | | | 2,613 | | | (931) | |
| Cash and cash equivalents, beginning-of-period | 5,436 | | | 2,823 | | | 3,754 | |
| | | | | |
| | | | | |
| Cash and cash equivalents, end-of-period | $ | 4,664 | | | $ | 5,436 | | | $ | 2,823 | |
| | | | | |
| Supplemental Data | | | | | |
| Income taxes paid | $ | 1,955 | | | $ | 1,735 | | | $ | 1,710 | |
| Interest paid, net of capitalized interest (Note 7) | $ | 451 | | | $ | 170 | | | $ | 233 | |
The accompanying Notes are an integral part of these financial statements.
CONSOLIDATED STATEMENTS OF EQUITY
LINDE PLC AND SUBSIDIARIES
(Dollar amounts in millions, except per share data, shares in thousands) | | | | Linde plc Shareholders’ Equity | | | | |
| | | Ordinary shares | | Additional
Paid-in
Capital | | Retained
Earnings | | Accumulated Other
Comprehensive
Income (Loss)
(Note 7) | | Treasury Stock | | Linde plc
Shareholders’
Equity | | Noncontrolling
Interests | | Total Equity |
| | |
| | |
| | |
| | |
| Activity | |
| Activity | |
| Activity | Activity | Shares | | Amounts | | Additional
Paid-in
Capital | | Retained
Earnings | | Accumulated Other
Comprehensive
Income (Loss)
(Note 7) | | Shares | | Amounts | | Linde plc
Shareholders’
Equity | | Noncontrolling
Interests | | Total Equity |
| | | Balance, December 31, 2018 | 551,310 | | | $ | 1 | | | $ | 40,151 | | | $ | 16,529 | | | $ | (4,456) | | | 4,069 | | | $ | (629) | | | $ | 51,596 | | | $ | 5,484 | | | $ | 57,080 | |
| Net Income available for Linde plc shareholders | | 2,285 | | | 2,285 | | | 94 | | | 2,379 | |
| Other comprehensive income (loss) | | (358) | | | (358) | | | (77) | | | (435) | |
| Noncontrolling interests: | |
| Dividends and other capital reductions | | — | | | (132) | | | (132) | |
| Additions (Reductions) - (Note 14) | | — | | | (2,921) | | | (2,921) | |
| Redemption value adjustments | | (8) | | | (8) | | | (8) | |
| Dividends ($3.50 per ordinary share) | | (1,891) | | | (1,891) | | | (1,891) | |
| Issuances of common stock: | |
| | For employee savings and incentive plans | 703 | | | (45) | | | (73) | | | (770) | | | 127 | | | 9 | | | 9 | |
| Purchases of common stock | | 14,333 | | | (2,654) | | | (2,654) | | | (2,654) | |
| Share-based compensation | | 95 | | 95 | | | 95 | |
| Balance, December 31, 2019 | 552,013 | | | 1 | | | 40,201 | | | 16,842 | | | (4,814) | | | 17,632 | | | (3,156) | | | 49,074 | | | 2,448 | | | 51,522 | |
| Net Income available for Linde plc shareholders | | 2,501 | | | 2,501 | | | 125 | | | 2,626 | |
| Other comprehensive income (loss) | | 124 | | | 124 | | | 33 | | | 157 | |
| Noncontrolling interests: | |
| Dividends and other capital reductions | | — | | | (161) | | | (161) | |
| Additions (Reductions) - (Note 14) | | — | | | (193) | | | (193) | |
| Redemption value adjustments | | 17 | | | 17 | | | 17 | |
| Dividends ($3.852 per ordinary share) | | (2,028) | | | (2,028) | | | (2,028) | |
| | | | | | Issuances of ordinary shares: | |
| | For employee savings and incentive plans | | (132) | | | (154) | | | (1,208) | | | 233 | | | (53) | | | (53) | |
| | Purchases of ordinary shares | | 12,294 | | | (2,451) | | | (2,451) | | | (2,451) | |
| Share-based compensation | | 133 | | 133 | | 133 | |
| | Balance, December 31, 2020 | |
| | Balance, December 31, 2020 | |
| | Balance, December 31, 2020 | Balance, December 31, 2020 | 552,013 | | | $ | 1 | | | $ | 40,202 | | | $ | 17,178 | | | $ | (4,690) | | | 28,718 | | | $ | (5,374) | | | $ | 47,317 | | | $ | 2,252 | | | $ | 49,569 | |
| Net Income available for Linde plc shareholders | Net Income available for Linde plc shareholders | | | | | | | 3,826 | | | | | | | | | $ | 3,826 | | | 135 | | | $ | 3,961 | |
| Net Income available for Linde plc shareholders | |
| Net Income available for Linde plc shareholders | |
| Other comprehensive income (loss) | |
| Other comprehensive income (loss) | |
| Other comprehensive income (loss) | Other comprehensive income (loss) | | (358) | | | (358) | | | — | | | (358) | |
| Noncontrolling interests: | Noncontrolling interests: | |
| Noncontrolling interests: | |
| Noncontrolling interests: | |
| Dividends and other capital reductions | Dividends and other capital reductions | | — | | | (118) | | | (118) | |
| Additions (Reductions) - (Note 14) | | — | | | (876) | | | (876) | |
| Dividends and other capital reductions | |
| Dividends and other capital reductions | |
| Additions (Reductions) | |
| Additions (Reductions) | |
| Additions (Reductions) | |
| | Dividends ($4.24 per ordinary share) | |
| | Dividends ($4.24 per ordinary share) | |
| | Dividends ($4.24 per ordinary share) | Dividends ($4.24 per ordinary share) | | (2,189) | | | (2,189) | | | (2,189) | |
| Issuances of ordinary shares: | Issuances of ordinary shares: | |
| Issuances of ordinary shares: | |
| Issuances of ordinary shares: | |
| For employee savings and incentive plans | |
| For employee savings and incentive plans | |
| For employee savings and incentive plans | For employee savings and incentive plans | | (150) | | | (105) | | | (1,026) | | | 209 | | | (46) | | | (46) | |
| Purchases of ordinary shares | Purchases of ordinary shares | | 15,640 | | | (4,643) | | | (4,643) | | | (4,643) | |
| Purchases of ordinary shares | |
| Purchases of ordinary shares | |
| Share-based compensation | |
| Share-based compensation | |
| Share-based compensation | Share-based compensation | | 128 | | | 128 | | | 128 | |
| Balance, December 31, 2021 | Balance, December 31, 2021 | 552,013 | | | $ | 1 | | | $ | 40,180 | | | $ | 18,710 | | | $ | (5,048) | | | 43,332 | | | $ | (9,808) | | | $ | 44,035 | | | $ | 1,393 | | | $ | 45,428 | |
| Balance, December 31, 2021 | |
| Balance, December 31, 2021 | |
| Net Income available for Linde plc shareholders | |
| Net Income available for Linde plc shareholders | |
| Net Income available for Linde plc shareholders | |
| Other comprehensive income (loss) | |
| Other comprehensive income (loss) | |
| Other comprehensive income (loss) | |
| Noncontrolling interests: | |
| Noncontrolling interests: | |
| Noncontrolling interests: | |
| Dividends and other capital reductions | |
| Dividends and other capital reductions | |
| Dividends and other capital reductions | |
| Additions (Reductions) - (Note 14) | |
| Additions (Reductions) - (Note 14) | |
| Additions (Reductions) - (Note 14) | |
| | Dividends ($4.68 per ordinary share) | |
| | Dividends ($4.68 per ordinary share) | |
| | Dividends ($4.68 per ordinary share) | |
| Issuances of ordinary shares: | |
| Issuances of ordinary shares: | |
| Issuances of ordinary shares: | |
| For employee savings and incentive plans | |
| For employee savings and incentive plans | |
| For employee savings and incentive plans | |
| Purchases of ordinary shares | |
| Purchases of ordinary shares | |
| Purchases of ordinary shares | |
| Share-based compensation | |
| Share-based compensation | |
| Share-based compensation | |
| Balance, December 31, 2022 | |
| Balance, December 31, 2022 | |
| Balance, December 31, 2022 | |
| Net Income available for Linde plc shareholders | |
| Net Income available for Linde plc shareholders | |
| Net Income available for Linde plc shareholders | |
| Other comprehensive income (loss) | |
| Other comprehensive income (loss) | |
| Other comprehensive income (loss) | |
| Noncontrolling interests: | |
| Noncontrolling interests: | |
| Noncontrolling interests: | |
| Dividends and other capital reductions | |
| Dividends and other capital reductions | |
| Dividends and other capital reductions | |
| Additions (Reductions) | |
| Additions (Reductions) | |
| Additions (Reductions) | |
| | Dividends ($5.10 per common share) | |
| | Dividends ($5.10 per common share) | |
| | Dividends ($5.10 per common share) | |
| Issuances of ordinary shares: | |
| Issuances of ordinary shares: | |
| Issuances of ordinary shares: | |
| For employee savings and incentive plans | |
| For employee savings and incentive plans | |
| For employee savings and incentive plans | |
| Purchases of ordinary shares | |
| Purchases of ordinary shares | |
| Purchases of ordinary shares | |
| Share-based compensation | |
| Share-based compensation | |
| Share-based compensation | |
| Intercompany reorganization (Note 14) | |
| Intercompany reorganization (Note 14) | |
| Intercompany reorganization (Note 14) | |
| Balance, December 31, 2023 | |
| Balance, December 31, 2023 | |
| Balance, December 31, 2023 | |
|
The accompanying Notes are an integral part of these financial statementsstatements.
NOTES TO CONSOLIDATED FINANCIAL STATEMENTS
LINDE PLC AND SUBSIDIARIES
NOTE 1. SUMMARY OF SIGNIFICANT ACCOUNTING POLICIES
Linde plc ("Linde" or "the company") is an incorporated public limited company formed under the laws of Ireland. Linde’s registered office is located at Ten Earlsfort Terrace, Dublin 2, D02 T380 Ireland. Linde’s principal executive offices are located at The Priestley Centre, 10 Priestley Road,Forge, 43 Church Street West, Woking, Surrey Research Park, Guildford, Surrey GU2 7XY,GU21 6HT, United Kingdom and 10 Riverview Drive, Danbury, Connecticut, United States.States 06810. Linde trades on the New York Stock Exchange and onNasdaq under the symbol LIN.
On January 18, 2023, shareholders approved the company’s proposal for an intercompany reorganization that resulted in the delisting of its ordinary shares from the Frankfurt Stock Exchange, on March 1, 2023, after the completion of legal and regulatory approvals.
In connection with the closing of the intercompany reorganization on March 1, 2023, Linde shareholders automatically received one share of the new holding company in exchange for each share of Linde plc that was previously owned. The new holding company is also named “Linde plc” and trades under the symbolexisting ticker LIN.
Principles of Consolidation – The consolidated financial statements were prepared in conformity with accounting principles generally accepted in the United States of America ("U.S. GAAP") and include the accounts of all significant subsidiaries where control exists and, in limited situations, variable-interest entities where the company is the primary beneficiary. Intercompany transactions and balances are eliminated in consolidation and any significant related-party transactions have been disclosed.
Equity investments generally consist of 20% to 50% owned operations where the company exercises significant influence, but does not have control. Income from equity investments in corporations is reported on an after-tax basis. Pre-tax income from equity investments that are partnerships or limited-liability corporations is included in other income (expenses) – net with related taxes included in Income taxes. Equity investments are reviewed for impairment whenever events or circumstances reflect that an impairment loss may have been incurred.
Changes in ownership interest that result either in consolidation or deconsolidation of an investment are recorded at fair value through earnings, including the retained ownership interest, while changes that do not result in either consolidation or deconsolidation of a subsidiary are treated as equity transactions.
Use of Estimates – The preparation of financial statements in conformity with U.S. GAAP requires management to make estimates and assumptions that affect the reported amounts of assets and liabilities and the disclosure of contingent assets and liabilities at the date of the financial statements and the reported amounts of revenues and expenses during the reporting period. While actual results could differ, management believes such estimates to be reasonable.
Operations – Linde is the largest industrial gases company globally. The company produces, sells and distributes atmospheric, process and specialty gases to a diverse group of industries including aerospace, chemicals, food and beverage, electronics, energy, healthcare, manufacturing, and metals. Linde’s Engineering business offers its customers an extensive range of gas production and processing services including supplying plant components and services directly to customers.
Revenue Recognition – Revenue is recognized as control of goods or services are transferred to customers in an amount that reflects the consideration to which an entitythe company expects to be entitled to receive in exchange for the goods or services. See Note 19 for additional details regarding Linde's revenue recognition policies.
Cash Equivalents – Cash equivalents are considered to be highly liquid securities with original maturities of three months or less.
Inventories – Inventories are stated at the lower of cost or net realizable value. Cost is determined using the average-cost method.
Property, Plant and Equipment – Net – Property, plant and equipment are carried at cost, net of accumulated depreciation. The company capitalizes labor, applicable overhead and interest as part of the cost of constructing major facilities. Expenditures for additions and improvements that extend the lives or increase the capacity of plant assets are also capitalized. Depreciation is calculated on the straight-line method based on the estimated useful lives of the assets, which range from 3 years to 40 years (see Note 8). Linde uses accelerated depreciation methods for tax purposes where appropriate. Maintenance of property, plant and equipment is generally expensed as incurred.
The company performs a test for impairment whenever events or changes in circumstances indicate that the carrying amount of an individual asset or asset group may not be recoverable. Should projected undiscounted future cash flows be less than the carrying amount of the asset or asset group, an impairment charge reducing the carrying amount to fair value ismay be required. Fair value is determined based on the most appropriate valuation technique, including discounted cash flows.
Asset-Retirement Obligations – An asset-retirement obligation is recognized in the period in which sufficient information exists to determine the fair value of the liability with a corresponding increase to the carrying amount of the related property, plant and equipment which is then depreciated over its useful life. The liability is initially measured at fair
value and then accretion expense is recorded in each subsequent period. The company’s asset-retirement obligations are primarily associated with its on-site long-term supply arrangements where the company has built a facility on land leased from the customer and is obligated to remove the facility at the end of the contract term. The company's asset-retirement obligations are not material to its consolidated financial statements.
Foreign Currency Translation – For most foreign operations, the local currency is the functional currency and translation gains and losses are reported as part of the accumulated other comprehensive income (loss) component of equity as a cumulative translation adjustment (see Note 7).
Financial Instruments – Linde enters into various derivative financial instruments to manage its exposure to fluctuating interest rates, currency exchange rates, commodity pricing and energy costs. Such instruments primarily include interest-rate swap and treasury rate lock agreements; currency-swap agreements; forward contracts; currency options; and commodity-swap agreements. These instruments are not entered into for trading purposes. Linde only uses commonly traded and non-leveraged instruments.
There are three types of derivatives the company enters into: (i) those relating to fair-value exposures, (ii) those relating to cash-flow exposures, and (iii) those relating to foreign currency net investment exposures. Fair-value exposures relate to recognized assets or liabilities, and firm commitments; cash-flow exposures relate to the variability of future cash flows associated with recognized assets or liabilities, or forecasted transactions; and net investment exposures relate to the impact of foreign currency exchange rate changes on the carrying value of net assets denominated in foreign currencies.
When a derivative is executed and hedge accounting is appropriate, it is designated as either a fair-value hedge, cash-flow hedge, or a net investment hedge. Currently, Linde designates all interest-rate and treasury rate locks as hedges for accounting purposes; however, currency contracts are generally not designated as hedges for accounting purposes unless they are related to forecasted transactions. Whether designated as hedges for accounting purposes or not, all derivatives are linked to an appropriate underlying exposure. On an ongoing basis, the company assesses the hedge effectiveness of all derivatives designated as hedges for accounting purposes to determine if they continue to be highly effective in offsetting changes in fair values or cash flows of the underlying hedged items. If it is determined that the hedge is not highly effective, then hedge accounting will be discontinued prospectively.
Changes in the fair value of derivatives designated as fair-value hedges are recognized in earnings as an offset to the change in the fair values of the underlying exposures being hedged. The changes in fair value of derivatives that are designated as cash-flow hedges are deferred in accumulated other comprehensive income (loss) and are reclassified to earnings as the underlying hedged transaction affects earnings. Provided the hedge remains highly effective, any ineffectiveness is deferred in accumulated other comprehensive income (loss) and areis reclassified to earnings as the underlying hedged transaction affects earnings. Hedges of net investments in foreign subsidiaries are recognized in the cumulative translation adjustment component of accumulated other comprehensive income (loss) on the consolidated balance sheets to offset translation gains and losses associated with the hedged net investment. Derivatives that are entered into for risk-management purposes and are not designated as hedges (primarily related to currency derivatives other than for firm commitments) are recorded at their fair market values and recognized in current earnings.
See Note 12 for additional information relating to financial instruments.
Goodwill – Acquisitions are accounted for using the acquisition method which requires allocation of the purchase price to assets acquired and liabilities assumed based on estimated fair values. Any excess of the purchase price over the fair value of the assets and liabilities acquired is recorded as goodwill. Allocations of the purchase price are based on preliminary estimates and assumptions at the date of acquisition and are subject to revision based on final information received, including appraisals and other analyses which support underlying estimates.
The company performs a goodwill impairment test annually during the fourth quarter,as of October 1 or more frequently if events or circumstances indicate that an impairment loss may have been incurred. The impairment test allows an entity to first assess qualitative factors to determine if it is more likely than not that the fair value of a reporting unit is less than carrying value. If it is determined that it is more likely than not that the fair value of a reporting unit is less than carrying value then the
company will estimate and compare the fair value of its reporting units to their carrying value, including goodwill. Reporting units are determined based on one level below the operating segment level. The qualitative analysis of goodwill for the year ended December 31, 20212023 showed the fair value of the reporting units substantially exceeded the carrying value, as such further analysis was not performed.
See Note 9 for additional information relating to goodwill.
Other Intangible Assets – Other intangible assets, primarily customer relationships, are amortized over the estimated period of benefit. The determination of the estimated period of benefit will be dependent upon the use and underlying
characteristics of the intangible asset. Linde evaluates the recoverability of its intangible assets subject to amortization when facts and circumstances indicate that the carrying value of the asset may not be recoverable. If the carrying value is not recoverable, impairment is measured as the amount by which the carrying value exceeds its estimated fair value. Fair value is generally estimated based on either appraised value or other valuation techniques. Indefinite lived intangible assets related to the Linde brand are evaluated for impairment on an annual basis or more frequently if events or circumstances indicate an impairment loss may have occurred.
See Note 10 for additional information relating to other intangible assets.
Assets Held for Sale and Discontinued Operations – Assets held for sale, as well as liabilities directly related to these assets, are classified separately in the consolidated balance sheets as held for sale if the requirements of the FASB’s Accounting Standards Codification (“ASC”) 360, Property, Plant and Equipment, are satisfied. The main requirements of ASC 360 are: (i) management having the authority to approve the action has committed to a plan to sell the assets and an active program to locate a buyer has been initiated, (ii) the assets are available for sale in their present condition at a reasonable market price, and (iii) a sale within the next twelve months is probable. Assets classified as held for sale are measured at the lower of carrying amount and fair value less costs to sell. Amortization and depreciation has been discontinued. The process involved in determining the fair value less costs to sell involves estimates and assumptions that are subject to uncertainty.
Discontinued operations are reported as soon as a business is classified as held for sale, or has already been disposed of, and when the business to be disposed of represents a strategic shift that has (or will have) a major effect on the company’s operations and financial results. Businesses acquired with the intent of divesting are also required to be reported as discontinued operations. The profit/loss from discontinued operations is reported separately from the expenses and income from continuing operations in the consolidated statements of income. In the consolidated statement of cash flows, the cash flows from discontinued operations are shown separately from the cash flows from continuing operations. The information provided in the Notes relates to continuing operations. If the information relates exclusively to discontinued operations, this is highlighted accordingly.
Income Taxes – Deferred income taxes are recorded for the temporary differences between the financial statement and tax bases of assets and liabilities using currently enacted tax rates. Valuation allowances are established against deferred tax assets whenever circumstances indicate that it is more likely than not that such assets will not be realized in future periods.
Under the guidance for accounting for uncertainty in income taxes, the company can recognize the benefit of an income tax position only if it is more likely than not (greater than 50%) that the tax position will be sustained upon tax examination, based solely on the technical merits of the tax position. Otherwise, no benefit can be recognized. The tax benefits recognized are measured based on the largest benefit that has a greater than 50% likelihood of being realized upon ultimate settlement. Additionally, the company accrues interest and related penalties, if applicable, on all tax exposures for which reserves have been established consistent with jurisdictional tax laws. Interest and penalties are classified as income tax expense in the financial statements.
See Note 5 for additional information relating to income taxes.
Retirement Benefits – Most Linde employees participate in a form of defined benefit or contribution retirement plan, and additionally certain employees are eligible to participate in various post-employment health care and life insurance benefit plans. The cost of contribution plans is recognized in the year earned while the cost of other plans is recognized over the employees’ expected service period to the company, all in accordance with the applicable accounting standards. The funded status of the plans is recorded as an asset or liability in the consolidated balance sheets. Funding of retirement benefits varies and is in accordance with local laws and practices.
See Note 16 for additional information relating to retirement programs.
Share-based Compensation– The company has historically granted share-based awards which consist of stock options, restricted stock and performance-based stock. Share-based compensation expense is generally recognized on a straight-line basis over the stated vesting period. For stock awards granted to full-retirement-eligible employees, compensation expense is recognized over the period from the grant date to the date retirement eligibility is achieved. For performance-based awards, compensation expense is recognized only if it is probable that the performance condition will be achieved.
See Note 15 for additional disclosures relating to share-based compensation.
Reclassifications – Certain prior years’ amounts have been reclassified to conform to the current year’s presentation.
Recently Issued Accounting Standards
Accounting Standards Implemented in 20212023
There were no new accounting pronouncements implemented in 2023 that would materially impact the 2023 financial statements.
Accounting Standards to be Implemented
•Income Taxes - Simplifying the Accounting for Income TaxesImprovements to Reportable Segments Disclosures - In December 2019,November 2023, the FASB issued guidance which simplifies the accounting for income taxes by removing several exceptions in the current standard and adds guidancerequiring enhanced disclosure related to reduce complexity in certain areas, such as requiring that an entity reflect the effect of an enacted change in tax laws or rates in the annual effective tax rate computation in the interim period that includes the enactment date, evaluating whether a step-up in tax basis of goodwill relates to a business combination or a separate transaction and allocating taxes to members of a consolidated group.reportable segments. The new standard is effective for fiscal years beginning after December 15, 2023, and interim periods within those fiscal years beginning after December 15, 2020,2024, with early adoption permitted. The
adoption of this standard will only impact disclosures within the company's consolidated financial statements and the company is evaluating the impact this guidance will have on those disclosures.
Improvements to Income Tax Disclosures - In December 2023, the FASB issued guidance requiring enhanced disclosure related to income taxes. The standard requires additional or modified disclosures related to the income tax rate reconciliation, disaggregation of income taxes paid, and several other disclosures. The new standard is effective for fiscal years beginning after December 15, 2024, with early adoption permitted. The adoption of this standard did not materiallywill only impact disclosures within the company's consolidated financial statements.
•Reference Rate Reform - In March 2020 with amendments in 2021,statements and the FASB issued guidance related to reference rate reform which provides practical expedients and exceptions for applying U.S. GAAP to contract modifications, hedging relationships and other transactions thatcompany is evaluating the reference London Interbank Offered Rate (“LIBOR”) and other interbank offered rates. This update is applicable to our contracts and hedging relationships that reference LIBOR and other interbank offered rates. The amendments may be applied to impacted contracts and hedges prospectively through December 31, 2022. The application ofimpact this guidance did not materially impact the company's consolidated financial statements.will have on those disclosures.
NOTE 2. Business CombinationAcquisitions and Divestitures
MergerAcquisitions
Acquisitions were $953 million, $110 million and $88 million for the years ended December 31, 2023, 2022 and 2021, respectively. Acquisitions in 2023 primarily related to the Americas. Acquisitions in 2022 and 2021 primarily related to the Americas and EMEA.
Acquisition of Praxair, Inc. and Linde AGnexAir, LLC
On October 31, 2018 PraxairJanuary 5, 2023, Linde completed the acquisition of nexAir, LLC, a gas distribution and Linde AG combined their respective businesses through an all-stock transaction and became subsidiarieswelding supply company in the United States, in order to further expand the company’s geographic footprint into different regions. Prior to completion of the company.acquisition, Linde held a 23% interest in nexAir, LLC. Pursuant to a signed purchase agreement between Linde and nexAir, LLC, Linde purchased the remaining 77% ownership interest in an all cash transaction with a total purchase price of $866 million, or $811 million net of cash acquired. The fair value of Linde’s equity interest in nexAir, LLC immediately preceding the acquisition date was $183 million, which resulted in a gain on remeasurement of the company’s previously held equity interest which was not material; this gain is recorded within “Other income (expenses) – net” on the consolidated statements of income.
Final Allocation of Purchase Price
The acquisition of nexAir, LLC was accounted for as a business combination. Following the acquisition date, 100% of nexAir, LLC's results were consolidated in the Americas business segment. Linde's twelve months ended December 31, 2023 consolidated income statement includes sales of $408 million related to nexAir, LLC. Pro forma results for 2022 have not been included as the impact of the acquisition is not material to the consolidated statements of income.
The company estimated the preliminary fair value of net assets acquired based on information currently available at the time of the acquisition and has continued to adjust those estimates as additional information has become available. Measurement period adjustments totaled approximately $27 million, and related to working capital adjustments and deferred taxes. The following table summarizes the fair value of identifiable assets acquired and liabilities assumed in the acquisition of nexAir, LLC as of the acquisition date.
| | | | | |
| (Millions of dollars) | January 5, 2023 |
| |
| Assets: | |
| Cash and cash equivalents | $ | 55 | |
| Other current assets - net | 49 | |
| Property, plant and equipment, net | 241 | |
| Other intangible assets - net | 245 | |
| Other long-term liabilities - net | (1) | |
| Deferred taxes | (25) | |
| Total identifiable net assets | $ | 564 | |
| |
| Goodwill | $ | 485 | |
| Fair value of previously held equity interest | $ | 183 | |
| Total purchase price | $ | 866 | |
nexAir, LLC’s assets and liabilities were measured at estimated fair values at January 5, 2023. Estimates of fair value represent management's best estimate of assumptions about future events and uncertainties, including significant judgments related to future cash flows (sales, costs, customer attrition rates, and contributory asset charges), discount rates, competitive trends, and market comparables. Inputs used were generally obtained from historical data supplemented by current and anticipated market conditions and growth rates.
The fair value of the previously held equity interest was based upon a purchase price valuation (excluding debt) multiplied by the company’s previously held ownership interest adjusted by a discount for lack of marketability. The fair value of property, plant & equipment, net is based on assumptions that market participants would use in pricing an asset, based on the most advantageous market for the asset (i.e., its highest and best use). The cost approach, adjusted for the age and condition of the property, plant and equipment, was used to estimate fair value.
Identifiable intangible assets primarily consist of customer relationships of approximately $245 million that will be amortized over their estimated useful life of 20 years. The fair value of the customer relationships intangible asset was valued using a multi-period excess earnings method, a form of the income approach, which incorporates the estimated future cash flows to be generated from nexAir, LLC's existing customer base. There were no indefinite-lived intangible assets identified in conjunction with the acquisition.
The excess of the consideration for the acquisition over the preliminary fair value of net assets acquired was recorded as goodwill. The acquisition resulted in $485 million of goodwill, the majority of which is expected to be deductible for tax purposes. The goodwill balance is primarily attributable to the assembled workforce and operating synergies expected to result from the acquisition. The goodwill recorded as a result of the acquisition was allocated to the Americas reportable segment, which represents the reportable segment anticipated to experience operating synergies as a result of the acquisition.
Linde AG Merger-Related Divestitures - Primarily Americas Industrial Gases Business
As a condition
Sale of the U.S. regulatory approval of the merger, Linde AG agreed to sell the majority of its industrial gasesGIST business in the Americas, as described below:
•The Linde AG Americas Sales and Purchase Agreement, dated July 16, 2018, as and further amended on September 22, 2018, October 19, 2018, and February 20, 2019 whereby Linde AG and Praxair, Inc. entered into an agreement with a consortium comprising companiesIn the third quarter of 2022, the German industrial gases manufacturer Messer Group and CVC Capital Partners Fund VII to sell the majority ofLinde AG’s industrial gases business in North America and certain industrial gases business activities of Linde AG's in South America for $2.9 billion in cash consideration after purchase price adjustments for certain items relating to assets and liabilities of the sold businesses.In addition, divestitures include $0.5 billion of proceeds for incremental plant sales within the Americas under other agreements. These transactions were completed on March 1, 2019.
•On April 30, 2019, Lindecompany completed the sale of select assets of Linde South Korea withits GIST business. Proceeds from the sale pricewere $184 million, net of $1.2 billion to IMM Private Equity Inc.cash divested of $75 million, for net proceeds of $109 million. The sale resulted in a loss of $21 million (benefit of $3 million, after tax), to satisfy requirementsrecorded within the other charges in the consolidated statement of the Korea Fair Trade Commission. The assets divested include bulk and on-site business in Giheung, Pohang and Seosan sites as well as oxygen and nitrogen on-site generators.
•On December 16, 2019, Linde completed the sale of select assets of Linde India with a sale price of $193 million.
•In March 2020, Linde completed the sale of select assets of Linde China with a sale price of $98 million.
Discontinued OperationsNOTE 3. Other Charges
Only2023 Charges
Other charges were $40 million for the salesyear ended December 31, 2023. Costs primarily related to severance in the Engineering segment and expenses incurred due to the intercompany reorganization for the year ended December 31, 2023. Other charges for 2023 included an income tax benefit of the Linde AG merger-related divestitures meet the criteria for discontinued operations, Praxair merger-related divestitures do not qualify as discontinued operations. As such, operations$81 million primarily comprised of a benefit of $124 million related to the Linde AG merger-related divestitures are included within Income from discontinued operations, netresolution of an income tax audit, partially offset by an accrual of $85 million for periods subsequent to the merger, as summarized below:
| | | | | | | | | | | | | | | | | | | | |
| Millions of dollars | | 2021 | | 2020 | | 2019 |
| Net sales | | $ | 5 | | | $ | 7 | | | $ | 449 | |
| Cost of sales | | 1 | | | 3 | | | 251 | |
| Other operating costs | | 1 | | | 1 | | | 43 | |
| Operating profit | | $ | 3 | | | $ | 3 | | | $ | 155 | |
| Income from equity investments | | 2 | | | 1 | | | 8 | |
| Income taxes | | — | | | — | | | 54 | |
| Income from discontinued operations, net of tax | | $ | 5 | | | $ | 4 | | | $ | 109 | |
| Noncontrolling interests | | — | | | — | | | (7) | |
| Income from continuing operations, net of tax and noncontrolling interests | | $ | 5 | | | $ | 4 | | | $ | 102 | |
For2022 Charges
Other charges were $1 billion ($896 million, after tax and noncontrolling interests) for the yearsyear ended December 31, 2021, 20202022, largely attributable to the Russia-Ukraine conflict.
Russia-Ukraine Conflict
In response to the Russian invasion of Ukraine, multiple jurisdictions, including Europe and 2019 there werethe U.S., have imposed several tranches of economic sanctions on Russia. As a result, Linde reassessed its ability to control its Russian subsidiaries and determined that as of June 30, 2022 it can no material amountslonger exercise control over these entities. As such, Linde deconsolidated its Russian gas and engineering business entities as of capital expenditures or significant operating or investing non-cash items related to discontinued operations.June 30, 2022. The deconsolidation of the company's Russian gas and engineering business entities resulted in a loss of $787 million ($730 million after tax).
Non-Merger Related Acquisitions
Non-merger related acquisitions of $88 million, $68 million and $225 million for the years ended December 31, 2021, 2020 and 2019, respectively, were primarily related to the Americas and are not material, individually or in the aggregate.
Non-Merger Related Divestitures
Effective January 1, 2021, Linde deconsolidated a joint venture with operations in APAC, due to the expiration of certain contractual rights that the parties mutually agreed not to renew. From the effective date, the joint venture is reflected as an equity investment on Linde's consolidated balance sheet with the corresponding results reflected in income from equity investments on the consolidated statement of income.
The fair value of the joint venture at January 1, 2021Linde’s Russian subsidiaries was determined using a probability weighted discounted cash flow model, and approximatedwhich resulted in the carrying amountrecognition of its net assets. The neta $407 million loss on deconsolidation when compared to the carrying value of $852 million was mainly comprisedthe entities. This loss is recorded within Other charges in the consolidated statements of assets of approximately $1.9 billion (primarily Other intangibles and Property plant and equipment - net), net of liabilities of approximately $1.0 billion. income.
Upon deconsolidation an equity investment was recorded, representing Linde's sharewhich represents the fair value of the joint venture's net assets. The deconsolidation resulted in a gain of $52 million recorded within cost reduction programs and other charges (see Note 3) related to the release of the CTA balance recorded within AOCI. The company did not receive any consideration, cash or otherwise, as part of the deconsolidation. Linde will maintain its interest in its Russian subsidiaries and will continue to comply with sanctions and government restrictions. The investment will be monitored for impairment in future periods.
The joint venture contributed salesReceivables, primarily loans receivable, with newly deconsolidated entities were reassessed for collectability resulting in a write-off of approximately $600 million in 2020. Future earnings per share will not be affected as the ownership percent remains the same.$380 million.
NOTE 3. COST REDUCTION PROGRAMS AND OTHER CHARGES
Cost reduction programs and otherOther Russia related charges were $273 million, $506 million, and $567 million for the 12 months ended December 31, 2021, 2020, and 2019, respectively. After tax and noncontrolling interests, charges were $279 million, $372 million, and $444 million for the same respective periods.
The following tables provide a summary of the pre-tax charges by reportable segment for the years ended December 31, 2021, 2020, and 2019:
| | | | | | | | | | | | | | | | | | | | | | | | | | | | | |
| Year Ended December 31, 2021 |
| (millions of dollars) | Severance costs | | Other cost reduction charges | | Total cost reduction program related charges | | Merger related and other charges | | Total |
| Americas | $ | 4 | | | $ | 2 | | | 6 | | | (6) | | | $ | — | |
| EMEA | 204 | | | 33 | | | 237 | | | 1 | | | 238 | |
| APAC | 16 | | | 12 | | | 28 | | | (50) | | | (22) | |
| Engineering | 20 | | | 6 | | | 26 | | | — | | | 26 | |
| Other | 15 | | | 26 | | | 41 | | | (10) | | | 31 | |
| Total | $ | 259 | | | $ | 79 | | | $ | 338 | | | $ | (65) | | | $ | 273 | |
| | | | | | | | | | | | | | | | | | | | | | | | | | | | | |
| Year Ended December 31, 2020 |
| (millions of dollars) | Severance costs | | Other cost reduction charges | | Total cost reduction program related charges | | Merger related and other charges | | Total |
| Americas | $ | 35 | | | $ | 24 | | | 59 | | | 13 | | | $ | 72 | |
| EMEA | 131 | | | 21 | | | 152 | | | 3 | | | 155 | |
| APAC | 7 | | | 2 | | | 9 | | | 3 | | | 12 | |
| Engineering | 38 | | | 28 | | | 66 | | | 4 | | | 70 | |
| Other | 87 | | | 18 | | | 105 | | | 92 | | | 197 | |
| Total | $ | 298 | | | $ | 93 | | | $ | 391 | | | $ | 115 | | | $ | 506 | |
| | | | | | | | | | | | | | | | | | | | | | | | | | | | | |
| Year Ended December 31, 2019 |
| (millions of dollars) | Severance costs | | Other cost reduction charges | | Total cost reduction program related charges | | Merger related and other charges | | Total |
| Americas | $ | 36 | | | $ | 20 | | | 56 | | | 34 | | | $ | 90 | |
| EMEA | 105 | | | 16 | | | 121 | | | 21 | | | 142 | |
| APAC | 40 | | | 10 | | | 50 | | | 72 | | | 122 | |
| Engineering | 1 | | | 12 | | | 13 | | | (9) | | | 4 | |
| Other | 22 | | | 42 | | | 64 | | | 145 | | | 209 | |
| Total | $ | 204 | | | $ | 100 | | | $ | 304 | | | $ | 263 | | | $ | 567 | |
Cost Reduction Programs
In 2019, Linde initiated a cost reduction program, which represents charges of achieving synergies and cost efficiencies expected from the merger of Praxair and Linde AG (see Note 2). TotalOther charges related specifically to the cost reduction programsRussia-Ukraine conflict were $338$103 million ($253 million, after tax), $391 million ($277 million, after tax and noncontrolling interests), and $304 million ($23373 million after tax) for the years ended December 31, 2021, 2020, and 2019, respectively.
Severance costs
During the year ended December 31, 2021, severance costs2022, and are primarily comprised of $259 million were recorded for the eliminationimpairments of approximately 2,000 positions. Severance costs of $298 million and $204 million for the years ended December 31, 2020 and December 31, 2019 were recorded for the elimination of approximately 3,100 and 2,400 positions, respectively. As of December 31, 2021, the majorityassets which are maintained by international entities in support of the actions have been taken, with the remaining actions planned to be completed within the next 12 months.Russian business.
Other cost reduction charges
Other cost reduction charges were $79 million, $93 million, and $100 million for the years ended December 31, 2021, 2020, and 2019, respectively. These amounts primarily represent charges related to the execution of the company's
synergistic actions including location consolidations and business rationalization projects, software and process harmonization, and associated non-recurring costs.
Merger-Related Costs and Other Charges
Merger-related costs and other charges were a benefit of $65139 million ($2693 million, after tax) and charges of $115 million ($95 million, after tax) and $263 million ($211 million, after tax and noncontrolling interests)for the yearsyear ended December 31, 20212022, 2020primarily related to severance actions within the Engineering segment recorded during the fourth quarter, the impairment of an equity method investment in the EMEA segment, and the sale of the GIST business completed on September 30, 2022 (see Note 2).
The following table provides a summary of the pre-tax charges by reportable segment for the year ended December 31, 2022:
| | | | | | | | | | | | | | | | | | | | | | | | | | | | | |
| Year Ended December 31, 2022 |
| (millions of dollars) | Russia deconsolidation charges | | Other Russia related charges | | Total Russia charges | | Merger-related costs and other charges | | Total |
| Americas | $ | — | | | $ | — | | | $ | — | | | $ | 4 | | | $ | 4 | |
| EMEA | 733 | | | (7) | | | 726 | | | 25 | | | 751 | |
| APAC | — | | | — | | | — | | | 28 | | | 28 | |
| Engineering | 54 | | | 110 | | | 164 | | | 41 | | | 205 | |
| Other | — | | | — | | | — | | | 41 | | | 41 | |
| Total | $ | 787 | | | $ | 103 | | | $ | 890 | | | $ | 139 | | | $ | 1,029 | |
2021 Charges
Other charges were $273 million ($279 million after tax) for the year ended December 31, 2021.
Total cost reduction program related charges were $338 million ($253 million after tax), for the year ended December 31, 2021. These expenses consisted primarily of severance charges of $259 million and other charges of $79 million for the year ended December 31, 2021. Other charges related primarily to the execution of the company's synergistic actions including location consolidations and business rationalization projects, process harmonization, and associated non-recurring costs.
2019, respectively.
Merger-related and other charges were benefits of $65 million (benefit of $26 million, after tax) for the year ended December 31, 2021. The 2021 pretaxpre-tax benefit was primarily due to a $52 million gain triggered by a joint venture deconsolidation in the APAC segment in the first quarter (see Note 2). After-tax charges also include the impactsegment.
The following table provides a summary of the below items.pre-tax charges by reportable segment for the year ended December 31, 2021:
2021 after-tax charges include a net income tax charge of $56 million, primarily related to (i) $83 million of expense due to the revaluation of a net deferred tax liability resulting from a tax rate increase in the United Kingdom which was enacted in the second quarter, and (ii) a tax settlement benefit of $33 million. 2021 also includes an impairment charge of $35 million ($35 million, after tax) related to a joint venture in the APAC segment. The charge is shown within income from equity investments in the consolidated statements of income. | | | | | | | | | | | | | | | | | | | | | | | | | | | | | |
| Year Ended December 31, 2021 |
| (millions of dollars) | Severance costs | | Other cost reduction charges | | Total cost reduction program related charges | | Merger related and other charges | | Total |
| Americas | $ | 4 | | | $ | 2 | | | $ | 6 | | | $ | (6) | | | $ | — | |
| EMEA | 204 | | | 33 | | | 237 | | | 1 | | | 238 | |
| APAC | 16 | | | 12 | | | 28 | | | (50) | | | (22) | |
| Engineering | 20 | | | 6 | | | 26 | | | — | | | 26 | |
| Other | 15 | | | 26 | | | 41 | | | (10) | | | 31 | |
| Total | $ | 259 | | | $ | 79 | | | $ | 338 | | | $ | (65) | | | $ | 273 | |
2019 includes other charges for an asset impairment related to a joint venture in APAC of approximately $73 million ($42 million, after tax and noncontrolling interests) resulting from an unfavorable arbitration ruling.
Cash Requirements
TotalThe total cash requirements of the cost reduction program and other charges incurred duringfor the twelve monthsyear ended December 31, 20212023 are estimatedexpected to be approximately $259 million, of which $175 million was paid through December 31, 2021.immaterial. Remaining cash requirements are expected to be paid primarily through 2023. Total cost reduction programs and other2024. Other charges, net of payments in the consolidated statements of cash flows for the twelve months ended December 31, 20212023 and 20202022 also reflect the impact of cash payments of liabilities, including merger-related tax liabilities, accrued as of December 31, 20202022 and 2019,2021, respectively.
The following table summarizes the activities related to the company's cost reduction programs and other charges during 20202022 and 2021:2023:
| | | | | | | | | | | | | | | | | | | | | | | | | | | | | |
| (millions of dollars) | Severance costs | | Other cost reduction charges | | Total cost reduction program related charges | | Merger related and other charges | | Total |
| | | | | | | | | |
| | | | | | | | | |
| | | | | | | | | |
| | | | | | | | | |
| Balance, December 31, 2019 | $ | 117 | | | $ | 16 | | | $ | 133 | | | $ | 67 | | | $ | 200 | |
| 2020 Cost Reduction Programs and Other Charges | 298 | | | 93 | | | 391 | | | 115 | | | 506 | |
| Less: Cash payments | (156) | | | (20) | | | (176) | | | (45) | | | (221) | |
| Less: Non-cash charges | — | | | (68) | | | (68) | | | (82) | | | (150) | |
| Foreign currency translation and other | 24 | | | 1 | | | 25 | | | 9 | | | 34 | |
| Balance, December 31, 2020 | $ | 283 | | | $ | 22 | | | $ | 305 | | | $ | 64 | | | $ | 369 | |
| 2021 Cost Reduction Programs and Other Charges | 259 | | | 79 | | | 338 | | | (65) | | | 273 | |
| Less: Cash payments | (138) | | | (15) | | | (153) | | | (22) | | | (175) | |
| Less: Non-cash charges | — | | | (41) | | | (41) | | | 54 | | | 13 | |
| Foreign currency translation and other | (20) | | | (7) | | | (27) | | | — | | | (27) | |
| Balance, December 31, 2021 | $ | 384 | | | $ | 38 | | | $ | 422 | | | $ | 31 | | | $ | 453 | |
| | | | | | | | | | | | | | | | | | | | | | | | | | | | | | | | | | | | |
| (millions of dollars) | Total Russia charges | | | Severance costs | | Other cost reduction charges | | Total cost reduction program related charges | | Merger related and other charges | | Total |
| | | | | | | | | | | | |
| | | | | | | | | | | | |
| | | | | | | | | | | | |
| | | | | | | | | | | | |
| | | | | | | | | | | | |
| | | | | | | | | | | | |
| | | | | | | | | | | | |
| | | | | | | | | | | | |
| | | | | | | | | | | | |
| | | | | | | | | | | | |
| | | | | | | | | | | | |
| | | | | | | | | | | | |
| | | | | | | | | | | | |
| | | | | | | | | | | | |
| Balance, December 31, 2021 | $ | — | | | | $ | 384 | | | $ | 38 | | | $ | 422 | | | $ | 31 | | | $ | 453 | |
| 2022 Russia-Ukraine conflict and other charges | 890 | | | | 41 | | | 24 | | | 65 | | | 74 | | | 1,029 | |
| Less: Cash payments | — | | | | (122) | | | (24) | | | (146) | | | 19 | | | (127) | |
| Less: Non-cash charges | (890) | | | | — | | | (7) | | | (7) | | | (109) | | | (1,006) | |
| Foreign currency translation and other | — | | | | (22) | | | (4) | | | (26) | | | (3) | | | (29) | |
| Balance, December 31, 2022 | $ | — | | | | $ | 281 | | | $ | 27 | | | $ | 308 | | | $ | 12 | | | $ | 320 | |
| 2023 Other Charges | — | | | | 26 | | | — | | | 26 | | | 14 | | | 40 | |
| Less: Cash payments | — | | | | (134) | | | (1) | | | (135) | | | (23) | | | (158) | |
| Less: Non-cash charges | — | | | | — | | | — | | | — | | | 12 | | | 12 | |
| Foreign currency translation and other | — | | | | (1) | | | — | | | (1) | | | 1 | | | — | |
| Balance, December 31, 2023 | $ | — | | | | $ | 172 | | | $ | 26 | | | $ | 198 | | | $ | 16 | | | $ | 214 | |
| | | | | | | | | | | | |
Classification in the consolidated financial statements
The pre-tax charges for each year are shown within operating profit in a separate line item on the consolidated statements of income. In the consolidated balance sheets, reductions in assets are recorded against the carrying value of the related assets and unpaid amounts are recorded as other current or long-term liabilities (see Note 7). On the consolidated statements of cash flows, the pre-tax impact of these charges, net of cash payments, is shown as an adjustment to reconcile net income to net cash provided by operating activities. In Note 18 Segment Information, Linde excluded these charges from its management definition of segment operating profit; a reconciliation of segment operating profit to consolidated operating profit is shown within the segment operating profit table.
NOTE 4. LEASES
In the normal course of its business, Linde enters into various leases as the lessee, primarily involving manufacturing and distribution equipment and office space. Linde determines whether a contract is or contains a lease at contract inception. Total lease and rental expenses related to operating lease right of use assets for the twelve months ended December 31, 20212023 and 20202022 was $317 million, and $341 million respectively.$284 million. Operating leaseslease costs are included in selling, general and administrative expenses and cost of sales, exclusive of depreciation and amortization. The related assets and obligations are included in other long termlong-term assets and other current liabilities and other long termlong-term liabilities, respectively. Total lease and rental expenses related to finance lease right of use assets for the twelve months ended December 31, 20212023 and 2020 was $512022 were $58 million and $44$57 million, respectively, and the costs are included in depreciation and amortization and interest. Related assets and obligations are included in other long termlong-term assets and other current liabilities and other long termlong-term liabilities, respectively. Linde includes renewal options that are reasonably certain to be exercised as part of the lease term. Operating and financing lease expenses above include short term and variable lease costs which are immaterial.
As most leases do not provide an implicit rate, Linde uses the applicable incremental borrowing rate at lease commencement to measure lease liabilities and right-of-use assets. Linde determines incremental borrowing rates through market sources.
The company has elected to apply the short-term lease exception for all underlying asset classes. Short-term leases are leases that, at the commencement date, have a lease term of twelve months or less and do not include a purchase option that the lessee is reasonably certain to exercise. Leases that meet the short-term lease definition are not recognized on the balance sheet, but rather expensed on a straight-line basis over the lease term.
Some leasing arrangements require variable payments that are dependent on usage, output, or may vary for other reasons, such as insurance. The company does not have material variable lease payments.
Gains and losses on sale and leaseback transactions were immaterial. Operating cash flows used for operating leases for the twelve months ended December 31, 20212023 and 20202022 were $290$249 million and $317$254 million, respectively. Cash flows used for finance leases for the same period were immaterial.
Supplemental balance sheet information related to leases is as follows:
| | (Millions of dollars) | (Millions of dollars) | | December 31, 2021 | December 31, 2020 | (Millions of dollars) | | December 31, 2023 | December 31, 2022 |
| Operating Leases | Operating Leases | |
| Operating lease right-of-use assets | Operating lease right-of-use assets | | $ | 853 | | $ | 935 | |
| Operating lease right-of-use assets | |
| Operating lease right-of-use assets | |
| | Other current liabilities | |
| Other current liabilities | |
| Other current liabilities | Other current liabilities | | 215 | | 237 | |
| Other long-term liabilities | Other long-term liabilities | | 618 | | 669 | |
| Total operating lease liabilities | Total operating lease liabilities | | 833 | | 906 | |
| | Finance Leases | Finance Leases | |
| Finance Leases | |
| Finance Leases | |
| Finance lease right-of-use assets | |
| Finance lease right-of-use assets | |
| Finance lease right-of-use assets | Finance lease right-of-use assets | | 163 | | 155 | |
| | Other current liabilities | Other current liabilities | | 47 | | 38 | |
| Other current liabilities | |
| Other current liabilities | |
| Other long-term liabilities | Other long-term liabilities | | 129 | | 125 | |
| Total finance lease liabilities | Total finance lease liabilities | | $ | 176 | | $ | 163 | |
Supplemental operating lease information:
| | December 31, 2021 | December 31, 2020 |
| | December 31, 2023 | | | | December 31, 2023 | December 31, 2022 |
| Weighted average lease term (years) | Weighted average lease term (years) | | 9 | Weighted average lease term (years) | | 8 | 8 |
| Weighted average discount rate | Weighted average discount rate | | 2.91 | % | 2.83 | % | Weighted average discount rate | | 4.19 | % | 3.26 | % |
Future operating and finance lease payments as of December 31, 20212023 are as follows (millions of dollars):
| | Period | Period | | Operating Leases | | Financing Leases | Period | | Operating Leases | | Financing Leases |
| 2022 | | $ | 227 | | | $ | 54 | |
| 2023 | | 162 | | | 40 | |
| 2024 | 2024 | | 116 | | | 29 | |
| 2025 | 2025 | | 84 | | | 20 | |
| 2026 | 2026 | | 61 | | | 11 | |
| 2027 | |
| 2028 | |
| Thereafter | Thereafter | | 281 | | | 67 | |
| Total future undiscounted lease payments | Total future undiscounted lease payments | | 931 | | | 221 | |
| Less imputed interest | Less imputed interest | | (98) | | | (45) | |
| Total reported lease liability | Total reported lease liability | | $ | 833 | | | $ | 176 | |
NOTE 5. INCOME TAXES
Pre-tax income applicable to U.S. and non-U.S. operations is as follows:
| (Millions of dollars) Year Ended December 31, | (Millions of dollars) Year Ended December 31, | 2021 | | 2020 | | 2019 | (Millions of dollars) Year Ended December 31, | 2023 | | 2022 | | 2021 |
| United States | United States | $ | 2,020 | | | $ | 1,253 | | | $ | 1,161 | |
| Non-U.S. | Non-U.S. | 3,079 | | | 2,131 | | | 1,766 | |
| Total income before income taxes | Total income before income taxes | $ | 5,099 | | | $ | 3,384 | | | $ | 2,927 | |
Provision for Income Taxes
The following is an analysis of the provision for income taxes:
| | | | | | | | | | | | | | | | | |
(Millions of dollars) Year Ended December 31, | 2021 | | 2020 | | 2019(a) |
| Current tax expense (benefit) | | | | | |
| U.S. federal | $ | 287 | | | $ | 185 | | | $ | 64 | |
| State and local | 87 | | | 17 | | | 39 | |
| Non-U.S. | 1,142 | | | 1,013 | | | 969 | |
| 1,516 | | | 1,215 | | | 1,072 | |
| Deferred tax expense (benefit) | | | | | |
| U.S. federal | 63 | | | 20 | | | 85 | |
| State and local | 8 | | | 7 | | | — | |
| Non-U.S. | (325) | | | (395) | | | (388) | |
| (254) | | | (368) | | | (303) | |
| Total income taxes | $ | 1,262 | | | $ | 847 | | | $ | 769 | |
(a)2019 includes $70 million related to divestitures, non-U.S. current tax expense of $48 million and non-U.S. deferred tax expense of $22 million. | | | | | | | | | | | | | | | | | |
(Millions of dollars) Year Ended December 31, | 2023 | | 2022 | | 2021 |
| Current tax expense (benefit) | | | | | |
| U.S. federal | $ | 291 | | | $ | 486 | | | $ | 287 | |
| State and local | 116 | | | 92 | | | 87 | |
| Non-U.S. | 1,491 | | | 1,239 | | | 1,142 | |
| 1,898 | | | 1,817 | | | 1,516 | |
| Deferred tax expense (benefit) | | | | | |
| U.S. federal | 57 | | | (12) | | | 63 | |
| State and local | 5 | | | 7 | | | 8 | |
| Non-U.S. | (146) | | | (378) | | | (325) | |
| (84) | | | (383) | | | (254) | |
| Total income taxes | $ | 1,814 | | | $ | 1,434 | | | $ | 1,262 | |
U.S. Tax Cuts and Jobs Act (Tax Act) 2018
As of December 31, 2021 and 2020, the tax payable related to the deemed repatriation tax is $178 million and $230 million, respectively, of which $178 million and $204 million is classified as other long-term liabilities on the consolidated balance sheet (See Note 7), respectively. The company is required to fund the balance in annual installments through 2025.
Effective Tax Rate Reconciliation
For purposes of the effective tax rate reconciliation, the company utilizes the U.S. statutory income tax rate of 21%. An analysis of the difference between the provision for income taxes and the amount computed by applying the U.S. statutory income tax rate to pre-tax income follows:
| | | | | | | | | | | | | | | | | | | | | | | | | | | | | | | | | | | |
(Dollar amounts in millions) Year Ended December 31, | 2021 | | 2020 | | 2019 |
| U.S. statutory income tax | $ | 1,071 | | | 21.0 | % | | $ | 711 | | | 21.0 | % | | $ | 615 | | | 21.0 | % |
| State and local taxes – net of federal benefit | 83 | | | 1.6 | % | | 21 | | | 0.6 | % | | 31 | | | 1.1 | % |
| U.S. tax credits and deductions (a) | (23) | | | (0.5) | % | | (8) | | | (0.2) | % | | (31) | | | (1.1) | % |
| Non-U.S. tax differentials (b) (c) | 219 | | | 4.3 | % | | 167 | | | 4.9 | % | | 113 | | | 3.9 | % |
| | | | | | | | | | | |
| Share-Based compensation | (56) | | | (1.1) | % | | (53) | | | (1.6) | % | | (41) | | | (1.4) | % |
| Divestitures | — | | | — | % | | — | | | — | % | | 36 | | | 1.2 | % |
| Other – net (d) | (32) | | | (0.6) | % | | 9 | | | 0.3 | % | | 46 | | | 1.6 | % |
| Provision for income taxes | $ | 1,262 | | | 24.7 | % | | $ | 847 | | | 25.0 | % | | $ | 769 | | | 26.3 | % |
| | | | | | | | | | | | | | | | | | | | | | | | | | | | | | | | | | | |
(Dollar amounts in millions) Year Ended December 31, | 2023 | | 2022 | | 2021 |
| U.S. statutory income tax | $ | 1,677 | | | 21.0 | % | | $ | 1,164 | | | 21.0 | % | | $ | 1,071 | | | 21.0 | % |
| State and local taxes – net of federal benefit | 105 | | | 1.3 | % | | 84 | | | 1.5 | % | | 83 | | | 1.6 | % |
| Tax on Non-U.S. activities (a) | 169 | | | 2.1 | % | | 176 | | | 3.2 | % | | 219 | | | 4.3 | % |
| | | | | | | | | | | |
| Share-Based compensation | (66) | | | (0.8) | % | | (41) | | | (0.7) | % | | (56) | | | (1.1) | % |
| Russia/Ukraine Charges | — | | | — | % | | 108 | | | 1.9 | % | | — | | | — | % |
| Other (b) | (71) | | | (0.9) | % | | (57) | | | (1.0) | % | | (55) | | | (1.1) | % |
| Provision for income taxes | $ | 1,814 | | | 22.7 | % | | $ | 1,434 | | | 25.9 | % | | $ | 1,262 | | | 24.7 | % |
________________________
(a)U.S. tax credits and deductions relate to non-U.S. derived intangible income and the research and experimentation tax credit in 2021, 2020 and 2019.
(b)Primarily related to differences between the U.S. tax rate and the statutory tax rate in the countries wherein which the company operates. Excluding (c),It also includes the U.S. tax impact of the non-U.S. activities and other non-U.S. permanent items and tax rate changes were not significant.
(c)changes. Excluding 2021, includeswhich included an $83 million deferred income tax charge related to a tax rate increase in the United Kingdom.U.K., these other items were not material.
(d)(b)Other -Includes net includes $8 million, $11 million and $26 million of U.S tax benefits related to Global Intangible Low-Taxed Incometax audit settlements of $54 million in 2021, 20202023, of $71 million in 2022, and 2019, respectively and a decrease in unrecognized tax benefits and accrued interest and penalties of $47 million in 2021.
Net Deferred Tax Liabilities
Net deferred tax liabilities included in the consolidated balance sheets are comprised of the following:
| | | | | | | | | | | |
(Millions of dollars) December 31, | 2023 | | 2022 |
| Deferred tax liabilities | | | |
| Fixed assets | $ | 2,686 | | | $ | 2,775 | |
| Goodwill | 215 | | | 173 | |
| Other intangible assets | 2,872 | | | 2,939 | |
| Subsidiary/equity investments | 586 | | | 545 | |
| Other (a) | 456 | | | 471 | |
| $ | 6,815 | | | $ | 6,903 | |
| Deferred tax assets | | | |
| Carryforwards | $ | 285 | | | $ | 289 | |
| Benefit plans and related (b)(c) | 243 | | | 165 | |
| Inventory | 82 | | | 68 | |
| Accruals and other (d) | 858 | | | 1,001 | |
| $ | 1,468 | | | $ | 1,523 | |
| Less: Valuation allowances (e) | (176) | | | (276) | |
| $ | 1,292 | | | $ | 1,247 | |
| Net deferred tax liabilities | $ | 5,523 | | | $ | 5,656 | |
| Recorded in the consolidated balance sheets as (Note 7): | | | |
| Other long-term assets | 226 | | | 230 | |
| Deferred credits | 5,749 | | | 5,886 | |
| $ | 5,523 | | | $ | 5,656 | |
________________________
(a)Includes $221 million in 2023 and $206 million in 2022 related to right-of-use lease assets.
| | | | | | | | | | | |
(Millions of dollars) December 31, | 2021 | | 2020 |
| Deferred tax liabilities | | | |
| Fixed assets | $ | 3,177 | | | $ | 3,430 | |
| Goodwill | 166 | | | 173 | |
| Other intangible assets (a) | 3,263 | | | 3,703 | |
| Subsidiary/equity investments | 586 | | | 609 | |
| Other (b) | 634 | | | 791 | |
| $ | 7,826 | | | $ | 8,706 | |
| Deferred tax assets | | | |
| Carryforwards | $ | 358 | | | $ | 386 | |
| Benefit plans and related (c) | 607 | | | 814 | |
| Inventory | 57 | | | 70 | |
| Accruals and other (d) | 1,042 | | | 1,243 | |
| $ | 2,064 | | | $ | 2,513 | |
| Less: Valuation allowances (e) | (235) | | | (243) | |
| $ | 1,829 | | | $ | 2,270 | |
| Net deferred tax liabilities | $ | 5,997 | | | $ | 6,436 | |
| Recorded in the consolidated balance sheets as (Note 7): | | | |
| Other long-term assets | 242 | | | 268 | |
| Deferred credits | 6,239 | | | 6,704 | |
| $ | 5,997 | | | $ | 6,436 | |
________________________
(a)Excludes $230 million of Intangibles in 2021 due to the effects of the deconsolidation of a joint venture with operations in APAC (See Note 2).
(b)Includes $236deferred tax asset of $60 million and deferred tax liability of $54 million in 20212023 and $255 million in 2020 related to right-of-use lease assets.
(c)Includes deferred taxes of $305 million and $560 million in 2021 and 2020,2022, respectively, related to pension / OPEB funded status (See(see Notes 7 and 16).
(c)The amounts are net of non-US deferred tax liabilities of $187 million in 2023 and $315 million in 2022.
(d)Includes $246$228 million in 20212023 and $255$212 million in 20202022 related to lease liabilities and $42 million and $63 million in 2021 and 2020, respectively, related to research and development costs.liabilities.
(e)Summary of changes in valuation allowances relating to deferred tax assets follows (millions of dollars):
| | | | | | | | | | | | | | | | | |
| 2021 | | 2020 | | 2019 |
| Balance, January 1, | $ | (243) | | | $ | (222) | | | $ | (237) | |
| Income tax (charge) benefit | 8 | | | (21) | | | (31) | |
| Merger with Linde AG | — | | | — | | | 18 | |
| Other, including write-offs (i) | — | | | 2 | | | 26 | |
| Translation adjustments | — | | | (2) | | | 2 | |
| Balance, December 31, | $ | (235) | | | $ | (243) | | | $ | (222) | |
(i)2019 includes $26 million related to the squeeze out of Linde AG (See Note 14).
| | | | | | | | | | | | | | | | | |
| 2023 | | 2022 | | 2021 |
| Balance, January 1, | $ | (276) | | | $ | (235) | | | $ | (243) | |
| Income tax (charge) benefit | 65 | | | (44) | | | 8 | |
| Other, including write-offs | 34 | | | — | | | — | |
| Translation adjustments | 1 | | | 3 | | | — | |
| Balance, December 31, | $ | (176) | | | $ | (276) | | | $ | (235) | |
The company evaluates deferred tax assets quarterly to ensure that estimated future taxable income will be sufficient in character (e.g., capital gain versus ordinary income treatment), amount and timing to result in their recovery. After considering the positive and negative evidence, a valuation allowance is established to reduce the assets to their realizable value when management determines that it is more likely than not (i.e., greater than 50% likelihood) that a deferred tax asset will not be realized. Considerable judgment is required in establishing deferred tax valuation allowances.
As of December 31, 2021,2023, the company had $358$285 million of deferred tax assets relating to net operating losses (“NOLs”) and tax credits and $235$176 million of valuation allowances. These deferred tax assets include $266$235 million relating to NOLs of which $84$82 million expire within 5 years, $53$24 million expire after 5 years and $129 million have no expiration. The deferred tax assets also include $92$50 million related to credits of which $5$3 million expire within 5 years, $83$40 million expire after 5 years, and $4$7 million have no expiration. The valuation allowances of $235$176 million primarily relate to NOLs and are required because managementNOLs. Management has determined, based on financial projections and available tax strategies, that it is unlikely that the NOLsbenefit of these losses will be utilized before they expire.realized. If events or circumstances change, valuation allowances are adjusted at that time resulting in an income tax benefit or charge.
The company has $586 million of non-U.S.non-U.S income and withholding taxes accrued related to its investmentsinvestment in non-U.S. subsidiaries and equity investments as of December 31, 2021.investments. A provision has not been made for any additional non-U.S. income taxor withholding taxes at December 31, 20212023 on approximately $32$4 billion related to its investments in subsidiaries becauseof unremitted non-U.S. earnings on which the company intends to remain indefinitely reinvested. While the $32 billion could become subjectreinvested or on other outside basis differences in its investments unrelated to additional non-U.S. income tax if there is a saleunremitted earnings. A determination of a subsidiary, or earnings are remitted as dividends, itthese deferred taxes related to these amounts is not practicable to estimate the unrecognized deferred tax liability.practicable.
Uncertain Tax Positions
Unrecognized income tax benefits represent income tax positions taken on income tax returns but not yet recognized in the consolidated financial statements. The company has unrecognized income tax benefits totaling $387$304 million, $452$325 million and $472$387 million as of December 31, 2021, 20202023, 2022 and 2019,2021, respectively. If recognized, essentially allthe majority of the unrecognized tax benefits and related interest and penalties would be recorded as a benefit to income tax expense on the consolidated statements of income.
A reconciliation of the beginning and ending amount of unrecognized tax benefits is as follows:
| | (Millions of dollars) | (Millions of dollars) | 2021 | | 2020 | | 2019 | (Millions of dollars) | 2023 | | 2022 | | 2021 |
| Unrecognized income tax benefits, January 1 | Unrecognized income tax benefits, January 1 | $ | 452 | | | $ | 472 | | | $ | 319 | |
| Additions for tax positions of prior years (a) | 11 | | | 35 | | | 151 | |
| Reductions for tax positions of prior years | (11) | | | (34) | | | (3) | |
| Additions for tax positions of prior years | |
| Reductions for tax positions of prior years (a) | |
| Additions for current year tax positions | Additions for current year tax positions | 19 | | | 11 | | | 33 | |
| Reductions for settlements with taxing authorities (b) | (60) | | | (39) | | | (26) | |
| Foreign currency translation and other | (24) | | | 7 | | | (2) | |
| Reductions for settlements with taxing authorities (a)(b) | |
| Other (c) | |
| Unrecognized income tax benefits, December 31 | Unrecognized income tax benefits, December 31 | $ | 387 | | | $ | 452 | | | $ | 472 | |
________________________
(a)Increase2023 and 2022 amounts are primarily relates to tax positions in the United States and Europe, $66 million in 2019 related to the merger with Linde AG.settlement of tax audits.
(b)Settlements are uncertain tax positions that were effectively settled with the taxing authorities, including positions where the company has agreed to amend its tax returns to eliminate the uncertainty.
(c)Other includes reductions for statute of limitation lapses and foreign currency translation.
The company classifies interest income and expense related to income taxes as tax expense in the consolidated statements of income. The company recognized net interest benefit of $15$17 million and $3 million and expense of $29 million and $1$15 million for the years ended December 31, 2021, December 31, 20202023, 2022 and December 31, 2019,2021, respectively. The company had $40$14 million and $99$35 million of accrued interest and penalties as of December 31, 20212023 and December 31, 2020,2022, respectively, which were recorded in other long-term liabilities in the consolidated balance sheets (See Note 7).
As of December 31, 2021,2023, the company remained subject to examination in the following major tax jurisdictions for the tax years as indicated below:
| | | | | |
| |
| Major tax jurisdictions | Open Years |
| North and South America | |
| United States | 20172020 through 20212023 |
| Canada | 2014 through 20212023 |
| Mexico | 2014 through 20212023 |
| Brazil | 20032008 through 20212023 |
| |
| Europe and Africa | |
| France | 20142019 through 20212023 |
| Germany | 2016 through 2021 |
Republic of South Africa | 2018 through 20212023 |
| Spain | 2010 through 20212023 |
| United Kingdom | 20162021 through 20212023 |
| |
| Asia and Australia | |
| Australia | 20172019 through 20212023 |
| China | 20162018 through 20212023 |
| India | 2006 through 20212023 |
| South Korea | 20162020 through 20212023 |
The company is currently under audit in a number of jurisdictions. As a result, it is reasonably possible that some of these matters will conclude or reach the stage where a change in unrecognized income tax benefits may occur within the next twelve months. At the time new information becomes available, the company will record any adjustment to income tax expense as required. Final determinations, if any, are not expected to be material to the consolidated financial statements. The company is also subject to income taxes in many hundreds of state and local taxing jurisdictions that are open to tax examinations.
NOTE 6. EARNINGS PER SHARE – LINDE PLC SHAREHOLDERS
Basic and Diluted earnings per share - Linde plc shareholders is computed by dividing Income from continuing operations, Income from discontinued operations, net of tax, and Net income – Linde plc for the period by the weighted average number of either basic or diluted shares outstanding, as follows:
| | 2021 | | 2020 | | 2019 |
| 2023 | | | 2023 | | 2022 | | 2021 |
| Numerator (Millions of dollars) | Numerator (Millions of dollars) | | | | | |
| Income from continuing operations | |
| Income from continuing operations | |
| Income from continuing operations | Income from continuing operations | $ | 3,821 | | | $ | 2,497 | | | $ | 2,183 | |
| Income from discontinued operations, net of tax | Income from discontinued operations, net of tax | 5 | | | 4 | | | 102 | |
| Net Income – Linde plc | Net Income – Linde plc | $ | 3,826 | | | $ | 2,501 | | | $ | 2,285 | |
| Denominator (Thousands of shares) | Denominator (Thousands of shares) | | | | | |
| Weighted average shares outstanding | Weighted average shares outstanding | 516,507 | | | 526,404 | | | 540,859 | |
| Weighted average shares outstanding | |
| Weighted average shares outstanding | |
| Shares earned and issuable under compensation plans | Shares earned and issuable under compensation plans | 389 | | | 332 | | | 235 | |
| Weighted average shares used in basic earnings per share | Weighted average shares used in basic earnings per share | 516,896 | | | 526,736 | | | 541,094 | |
| Effect of dilutive securities | Effect of dilutive securities | |
| Stock options and awards | |
| Stock options and awards | |
| Stock options and awards | Stock options and awards | 4,979 | | | 4,421 | | | 4,076 | |
| Weighted average shares used in diluted earnings per share | Weighted average shares used in diluted earnings per share | 521,875 | | | 531,157 | | | 545,170 | |
| Basic earnings per share from continuing operations | Basic earnings per share from continuing operations | $ | 7.39 | | | $ | 4.74 | | | $ | 4.03 | |
| Basic earnings per share from discontinued operations | Basic earnings per share from discontinued operations | 0.01 | | | 0.01 | | | 0.19 | |
| Basic Earnings Per Share | Basic Earnings Per Share | $ | 7.40 | | | $ | 4.75 | | | $ | 4.22 | |
| Diluted earnings per share from continuing operations | Diluted earnings per share from continuing operations | $ | 7.32 | | | $ | 4.70 | | | $ | 4.00 | |
| Diluted earnings per share from discontinued operations | Diluted earnings per share from discontinued operations | 0.01 | | | 0.01 | | | 0.19 | |
| Diluted Earnings Per Share | Diluted Earnings Per Share | $ | 7.33 | | | $ | 4.71 | | | $ | 4.19 | |
There were no antidilutive shares for the years ended December 31, 2021, 2020 or 2019.2023, 2022 and 2021.
NOTE 7. SUPPLEMENTAL INFORMATION
Income Statement
| (Millions of dollars) Year Ended December 31, | (Millions of dollars) Year Ended December 31, | 2021 | | 2020 | | 2019 | (Millions of dollars) Year Ended December 31, | 2023 | | 2022 | | 2021 |
| Selling, General and Administrative | Selling, General and Administrative | | | | | |
| Selling | Selling | $ | 1,342 | | | $ | 1,303 | | | $ | 1,600 | |
| Selling | |
| Selling | |
| General and administrative | General and administrative | 1,847 | | | 1,890 | | | 1,857 | |
| $ | 3,189 | | | $ | 3,193 | | | $ | 3,457 | |
| $ | |
| | Year Ended December 31, | Year Ended December 31, | 2021 | | 2020 | | 2019 | Year Ended December 31, | 2023 | | 2022 | | 2021 |
| Depreciation and Amortization (a) | Depreciation and Amortization (a) | | | | | |
| Depreciation | Depreciation | $ | 3,912 | | | $ | 3,861 | | | $ | 3,940 | |
| Depreciation | |
| Depreciation | |
| Amortization of intangibles (Note 10) | Amortization of intangibles (Note 10) | 723 | | | 765 | | | 735 | |
| Depreciation and Amortization | Depreciation and Amortization | $ | 4,635 | | | $ | 4,626 | | | $ | 4,675 | |
| | Year Ended December 31, | Year Ended December 31, | 2021 | | 2020 | | 2019 | Year Ended December 31, | 2023 | | 2022 | | 2021 |
| Other Income (Expenses) – Net | Other Income (Expenses) – Net | | | | | |
| Currency related net gains (losses) | Currency related net gains (losses) | $ | (29) | | | $ | (28) | | | $ | (11) | |
| Currency related net gains (losses) | |
| Currency related net gains (losses) | |
| Partnership income | Partnership income | 13 | | | 10 | | | 8 | |
| | Severance expense | Severance expense | (5) | | | (5) | | | (7) | |
| Severance expense | |
| Severance expense | |
| Asset divestiture gains (losses) – net | Asset divestiture gains (losses) – net | (31) | | | (78) | | | 10 | |
| Other – net | 26 | | | 40 | | | 68 | |
| $ | (26) | | | $ | (61) | | | $ | 68 | |
| Other – net gains (losses) | |
| $ | |
|
Year Ended December 31, |
Year Ended December 31, | 2021 | | 2020 | | 2019 |
Year Ended December 31, | 2023 | | 2022 | | 2021 |
| Interest Expense – Net | Interest Expense – Net | | | | | |
| Interest incurred on debt and other | Interest incurred on debt and other | $ | 227 | | | $ | 277 | | | $ | 284 | |
| Interest incurred on debt and other | |
| Interest incurred on debt and other | |
| Interest income | Interest income | (40) | | | (55) | | | (112) | |
| Amortization on acquired debt | Amortization on acquired debt | (53) | | | (85) | | | (96) | |
| Interest capitalized | Interest capitalized | (57) | | | (38) | | | (38) | |
| Bond redemption (b) | — | | | 16 | | | — | |
| $ | 77 | | | $ | 115 | | | $ | 38 | |
| $ | |
| | | | | | | | | | | | | | | | | |
Year Ended December 31, | 2021 | | 2020 | | 2019 |
| Income Attributable to Noncontrolling Interests | | | | | |
| Noncontrolling interests' operations (c) | $ | 135 | | | $ | 125 | | | $ | 87 | |
| | | | | |
| Redeemable noncontrolling interests' operations (Note 14) | — | | | — | | | 2 | |
| Noncontrolling interests from continuing operations | $ | 135 | | | $ | 125 | | | $ | 89 | |
| Noncontrolling interests from discontinued operations | — | | | $ | — | | | $ | 7 | |
Balance Sheet
| (Millions of dollars) December 31, | (Millions of dollars) December 31, | 2021 | | 2020 | (Millions of dollars) December 31, | 2023 | | 2022 |
| Accounts Receivable | Accounts Receivable | | | |
| | Trade and Other receivables | Trade and Other receivables | $ | 4,904 | | | $ | 4,638 | |
| | Trade and Other receivables | |
| | Trade and Other receivables | |
| Less: allowance for expected credit losses | Less: allowance for expected credit losses | (405) | | | (471) | |
| $ | 4,499 | | | $ | 4,167 | |
| $ | |
Receivables
Linde applies loss rates that are lifetime expected credit losses at initial recognition of the receivables. These expected loss rates are based on an analysis of the actual historical default rates for each business, taking regional circumstances into account. If necessary, these historical default rates are adjusted to reflect the impact of current changes in the macroeconomic environment using forward-looking information. The loss rates are also evaluated based on the expectations of the responsible management team regarding the collectability of the receivables. Gross trade receivables aged less than one year were $4,425$4,667 million and $4,169$4,498 million at December 31, 20212023 and December 31, 2020,2022, respectively, and gross receivables aged greater than one year were $329$354 million and $358$321 million at December 31, 20212023 and December 31, 2020,2022, respectively. Gross other receivables were $150$154 million and $111$145 million at December 31, 20212023 and December 31, 2020,2022, respectively. Receivables aged greater than one year are generally fully reserved unless specific circumstances warrant exceptions, such as those backed by federal governments.
Provisions for expected credit losses were $129$175 million, $182$163 million and $170$129 million for the twelve months ended December 31, 2021, 20202023, 2022 and 2019,2021, respectively. The allowance activity in the twelve months ended December 31, 20212023 related to write-offs of uncollectible amounts, net of recoveries and currency movements is not material.
| | | | | | | | | | | | | |
December 31, | | | 2023 | | 2022 |
| Inventories | | | | | |
| Raw materials and supplies | | | $ | 614 | | | $ | 567 | |
| Work in process | | | 390 | | | 368 | |
| Finished goods | | | 1,111 | | | 1,043 | |
| | | $ | 2,115 | | | $ | 1,978 | |
| | | | | | | | | | | | | |
December 31, | | | 2021 | | 2020 |
| Inventories | | | | | |
| Raw materials and supplies | | | $ | 399 | | | $ | 411 | |
| Work in process | | | 334 | | | 337 | |
| Finished goods | | | 1,000 | | | 981 | |
| | | $ | 1,733 | | | $ | 1,729 | |
| | | | | | | | | | | |
| December 31, | 2023 | | 2022 |
| Prepaid and Other Current Assets | | | |
| | | |
| Prepaid and other deferred charges (b) | $ | 583 | | | $ | 597 | |
| VAT recoverable | 178 | | | 225 | |
| Unrealized gains on derivatives (Note 12) | 73 | | | 24 | |
| Other | 93 | | | 104 | |
| $ | 927 | | | $ | 950 | |
| | | | | | | | | | | |
| December 31, | 2021 | | 2020 |
| Prepaid and Other Current Assets | | | |
| | | |
| Prepaid and other deferred charges (d) | $ | 527 | | | $ | 516 | |
| VAT recoverable | 196 | | | 261 | |
| Unrealized gains on derivatives (Note 12) | 101 | | | 110 | |
| Assets held for sale (Note 2) | — | | | 4 | |
| Other | 146 | | | 221 | |
| $ | 970 | | | $ | 1,112 | |
| | | | | | | | | | | |
| December 31, | 2023 | | 2022 |
| Other Long-term Assets | | | |
| Pension assets (Note 16) | $ | 380 | | | $ | 661 | |
| Insurance contracts (c) | 38 | | | 39 | |
| Long-term receivables, net (d) | 163 | | | 164 | |
| Lease assets (Note 4) | 938 | | | 872 | |
| Deposits | 76 | | | 52 | |
| Investments carried at cost (e) | 187 | | | 184 | |
| Deferred charges | 60 | | | 66 | |
| Deferred income taxes (Note 5) | 226 | | | 230 | |
| Unrealized gains on derivatives (Note 12) | 8 | | | 4 | |
| Other | 223 | | | 204 | |
| $ | 2,299 | | | $ | 2,476 | |
| | | | | | | | | | | |
| December 31, | 2021 | | 2020 |
| Other Long-term Assets | | | |
| Pension assets (Note 16) | $ | 139 | | | $ | 55 | |
| Insurance contracts (e) | 46 | | | 61 | |
| Long-term receivables, net (f) | 105 | | | 201 | |
| Lease assets (Note 4) | 1,016 | | | 1,090 | |
| Deposits | 43 | | | 47 | |
| Investments carried at cost | 18 | | | 23 | |
| Deferred charges | 62 | | | 96 | |
| Deferred income taxes (Note 5) | 242 | | | 268 | |
| Unrealized gains on derivatives (Note 12) | 35 | | | 90 | |
| Other | 278 | | | 217 | |
| $ | 1,984 | | | $ | 2,148 | |
| | December 31, | December 31, | 2021 | | 2020 | December 31, | 2023 | | 2022 |
| Other Current Liabilities | Other Current Liabilities | | | |
| Accrued expenses | |
| Accrued expenses | |
| Accrued expenses | Accrued expenses | $ | 1,248 | | | $ | 1,226 | |
| Payroll | Payroll | 710 | | | 653 | |
| VAT payable | VAT payable | 295 | | | 336 | |
| Pension and postretirement (Note 16) | Pension and postretirement (Note 16) | 38 | | | 34 | |
| Interest payable | Interest payable | 102 | | | 135 | |
| Lease liability (Note 4) | Lease liability (Note 4) | 262 | | | 275 | |
| Insurance reserves | Insurance reserves | 19 | | | 38 | |
| Unrealized losses on derivatives (Note 12) | Unrealized losses on derivatives (Note 12) | 27 | | | 70 | |
| Noncontrolling interest redemption and dividend (Note 14) | — | | | 231 | |
| Synergy cost accruals (Note 3) | 200 | | | 199 | |
| | Cost reduction programs and other charges (Note 3) | |
| Cost reduction programs and other charges (Note 3) | |
| Cost reduction programs and other charges (Note 3) | |
| Other | Other | 998 | | | 1,135 | |
| $ | 3,899 | | | $ | 4,332 | |
| $ | |
| | December 31, | December 31, | 2021 | | 2020 | December 31, | 2023 | | 2022 |
| Other Long-term Liabilities | Other Long-term Liabilities | | | |
| Pension and postretirement (Note 16) | Pension and postretirement (Note 16) | $ | 1,802 | | | $ | 2,963 | |
| Pension and postretirement (Note 16) | |
| Pension and postretirement (Note 16) | |
| Tax liabilities for uncertain tax positions (Note 5) | Tax liabilities for uncertain tax positions (Note 5) | 302 | | | 355 | |
| Tax Act liabilities for deemed repatriation (Note 5) | 178 | | | 204 | |
| Tax Act liabilities (f) | |
| | Lease liability (Note 4) | |
| Lease liability (Note 4) | |
| Lease liability (Note 4) | Lease liability (Note 4) | 747 | | | 794 | |
| Interest and penalties for uncertain tax positions (Note 5) | Interest and penalties for uncertain tax positions (Note 5) | 40 | | | 99 | |
| Insurance reserves | Insurance reserves | 56 | | | 33 | |
| Asset retirement obligation | Asset retirement obligation | 305 | | | 302 | |
| Unrealized losses on derivatives (Note 12) | Unrealized losses on derivatives (Note 12) | 8 | | | 11 | |
| Synergy cost accruals (Note 3) | 253 | | | 170 | |
| Cost reduction programs and other charges (Note 3) | |
| Contingent liabilities (Note 17) | |
| Other | Other | 497 | | | 588 | |
| $ | 4,188 | | | $ | 5,519 | |
| $ | |
| | December 31, | December 31, | 2021 | | 2020 | December 31, | 2023 | | 2022 |
| Deferred Credits | Deferred Credits | | | |
| Deferred income taxes (Note 5) | Deferred income taxes (Note 5) | $ | 6,239 | | | $ | 6,704 | |
| Other | 759 | | | 532 | |
| $ | 6,998 | | | $ | 7,236 | |
| Deferred income taxes (Note 5) | |
| Deferred income taxes (Note 5) | |
| Contract liabilities (Note 19) | |
| $ | |
| | December 31, | December 31, | 2021 | | 2020 | December 31, | 2023 | | 2022 |
| Accumulated Other Comprehensive Income (Loss) | Accumulated Other Comprehensive Income (Loss) | | | |
| Cumulative translation adjustment - net of taxes: | Cumulative translation adjustment - net of taxes: | |
| Cumulative translation adjustment - net of taxes: | |
| Cumulative translation adjustment - net of taxes: | |
| Americas (g) | |
| Americas (g) | |
| Americas (g) | Americas (g) | $ | (3,985) | | | $ | (3,788) | |
| EMEA (g) | EMEA (g) | 94 | | | 1,020 | |
| APAC (g) | APAC (g) | 154 | | | 616 | |
| Engineering | Engineering | 24 | | | 354 | |
| Other | Other | (280) | | | (1,020) | |
| (3,993) | | | (2,818) | |
| (5,372) | |
| Derivatives – net of taxes | Derivatives – net of taxes | 75 | | | 4 | |
| | Pension/OPEB funded status obligation (net of $305 million and $560 million tax benefit in 2021 and 2020) (Note 16) | (1,130) | | | (1,876) | |
| Pension/OPEB funded status obligation (net of $60 million tax benefit in 2023 and $(54) million tax obligation in 2022) (Note 16) | |
| | $ | (5,048) | | | $ | (4,690) | |
| Pension/OPEB funded status obligation (net of $60 million tax benefit in 2023 and $(54) million tax obligation in 2022) (Note 16) | |
| | Pension/OPEB funded status obligation (net of $60 million tax benefit in 2023 and $(54) million tax obligation in 2022) (Note 16) | |
| $ | |
(a)Depreciation and amortization expense in 20212023 include $1,245$529 million and $618$462 million, respectively, of Linde AG purchase accounting impacts. In 2020,2022, depreciation and amortization expense include $1,267$1,006 million and $653$474 million, respectively, of Linde AG purchase accounting impacts.
(b)In December 2020, the company repaid $500 million of 4.05% notes and $500 million of 3.00% notes that were due in 2021 resulting in a $16 million interest charge.
(c)In 2021, 2020 and 2019 noncontrolling interests from continuing operations includes $15 million, $57 million and $54 million, respectively, of Linde AG purchase accounting impacts. The decrease in 2021 is primarily related to the deconsolidation of a joint venture with operations in APAC (see Note 2) and the buyout of minority interests in the Republic of South Africa (see Note 14).
(d) Includes estimated income tax payments of $122$173 million in 20212023 and $115$164 million in 2020.2022.
(e)(c) Consists primarily of insurance contracts and other investments to be utilized for non-qualified pension and OPEB obligations.
(f)(d) The balances at December 31, 20212023 and 20202022 are net of reserves of $33$42 million and $34$36 million, respectively. The amounts in both years relate primarily to long-term notes receivable from customers in APAC, and EMEA and government receivables in Brazil.Brazil and receivables from the sale of GIST.
(e) Includes investments from the deconsolidation of Russian subsidiaries.
(f) Represents tax payable related to the deemed repatriation tax pursuant to the U.S. Tax Cuts and Jobs Act of 2018. The company is required to fund the balance in annual installments through 2025.
(g) Americas consists of currency translation adjustments primarily in Canada, Mexico, and Brazil. EMEA relates primarily to Germany, the U.K., the Netherlands, Hungary, Norway and Sweden. APAC relates primarily to China, South Korea, India and Australia.
NOTE 8. PROPERTY, PLANT AND EQUIPMENT – NET
Significant classes of property, plant and equipment are as follows:
| (Millions of dollars) December 31, | (Millions of dollars) December 31, | | Depreciable Lives (Yrs) | | 2021 | | 2020 | (Millions of dollars) December 31, | | Depreciable Lives (Yrs) | | 2023 | | 2022 |
| Production plants (primarily 15-year life) (a) | Production plants (primarily 15-year life) (a) | | 10-20 | | $ | 29,120 | | | $ | 28,226 | |
| Storage tanks | Storage tanks | | 15-20 | | 4,441 | | | 4,461 | |
| Transportation equipment and other | Transportation equipment and other | | 3-15 | | 2,973 | | | 2,978 | |
| Cylinders | Cylinders | | 10-30 | | 4,474 | | | 4,491 | |
| Buildings | Buildings | | 25-40 | | 3,265 | | | 3,327 | |
| Land and improvements (b) | Land and improvements (b) | | 0-20 | | 1,121 | | | 1,259 | |
| Construction in progress | Construction in progress | | 3,062 | | | 3,257 | |
| 48,456 | | | 47,999 | |
| | | | 55,325 | |
| Less: accumulated depreciation | Less: accumulated depreciation | | (22,453) | | | (19,288) | |
| $ | 26,003 | | | $ | 28,711 | |
| | | | $ | |
(a) - Depreciable lives of production plants related to long-term customer supply contracts are generally consistent with the contract lives.
(b) - Land is not depreciated.
NOTE 9. GOODWILL
Changes in the carrying amount of goodwill for the years ended December 31, 20212023 and 20202022 were as follows:
| | (Millions of dollars) | (Millions of dollars) | Americas | | EMEA | | APAC | | Engineering | | Other | | Total | (Millions of dollars) | Americas | | EMEA | | APAC | | Engineering | | Other | | Total |
| Balance, December 31, 2019 | $ | 9,042 | | | $ | 10,243 | | | $ | 4,957 | | | $ | 2,470 | | | $ | 307 | | | $ | 27,019 | |
| Balance, December 31, 2021 | |
| Acquisitions | Acquisitions | 13 | | | — | | | — | | | — | | | — | | | 13 | |
| Foreign currency translation and other | Foreign currency translation and other | 35 | | | 643 | | | 305 | | | 212 | | | 23 | | | 1,218 | |
| Disposals (Note 2 & Note 3) | |
| Balance, December 31, 2022 | |
| Acquisitions (Note 2) | |
| Foreign currency translation and other | |
| Disposals | Disposals | (7) | | | (42) | | | — | | | — | | | — | | | (49) | |
| Balance, December 31, 2020 | 9,083 | | | 10,844 | | | 5,262 | | | 2,682 | | | 330 | | | 28,201 | |
| Acquisitions | 45 | | | 1 | | | — | | | — | | | — | | | 46 | |
| Foreign currency translation and other | (41) | | | (559) | | | (173) | | | (186) | | | (7) | | | (966) | |
| Disposals (Note 2) | — | | | (8) | | | (235) | | | — | | | — | | | (243) | |
| Balance, December 31, 2021 | $ | 9,087 | | | $ | 10,278 | | | $ | 4,854 | | | $ | 2,496 | | | $ | 323 | | | $ | 27,038 | |
| Balance, December 31, 2023 | |
Linde has performedperforms its goodwill impairment tests annually duringas of October 1 or more frequently if events or circumstances indicate that an impairment loss may have been incurred. For the fourth quarter of each year and has determined that the fair value of each of its reporting units was substantially in excess of its carrying value. For the 20212023 test, the company applied the FASB's accounting guidance which allows the company to first assess qualitative factors to determine the extent of additional quantitative analysis, if any, that may be required to test goodwill for impairment. Based on the qualitative assessments performed, the company concluded that it was more likely than not that the fair value of each reporting unit substantially exceeded its carrying value and therefore, further quantitative analysis was not required. As a result, no impairment was recorded. There were no indicators of impairment since the annual goodwill impairment test was performed through December 31, 2021.2023.
NOTE 10. OTHER INTANGIBLE ASSETS
The following is a summary of Linde’s other intangible assets at December 31, 20212023 and 2020:2022:
| | (Millions of dollars) For the year ended December 31, 2021 | Customer Relationships | | Brands/Tradenames | | Other Intangible Assets | | Total |
| (Millions of dollars) For the year ended December 31, 2023 | | (Millions of dollars) For the year ended December 31, 2023 | Customer Relationships | | Brands/Tradenames | | Other Intangible Assets | | Total |
| Cost: | Cost: | | | | | | | |
| Balance, December 31, 2020 | $ | 13,776 | | | $ | 2,895 | | | $ | 1,697 | | | $ | 18,368 | |
| Balance, December 31, 2022 | |
| Balance, December 31, 2022 | |
| Balance, December 31, 2022 | |
| Additions | |
| Foreign currency translation | |
| Disposals | |
| Other * | |
| Balance, December 31, 2023 | |
| Less: accumulated amortization: | |
| Balance, December 31, 2022 | |
| Balance, December 31, 2022 | |
| Balance, December 31, 2022 | |
| Amortization expense (Note 7) | |
| Foreign currency translation | |
| Disposals | |
| Other * | |
| Balance, December 31, 2023 | |
| Net balance at December 31, 2023 | |
| | (Millions of dollars) For the year ended December 31, 2022 | |
| (Millions of dollars) For the year ended December 31, 2022 | |
| (Millions of dollars) For the year ended December 31, 2022 | | Customer Relationships | | Brands/Tradenames | | Other Intangible Assets | | Total |
| Cost: | |
| Balance, December 31, 2021 | |
| Balance, December 31, 2021 | |
| Balance, December 31, 2021 | |
| Additions | Additions | 12 | | | — | | | 61 | | | 73 | |
| Foreign currency translation | Foreign currency translation | (490) | | | (113) | | | (69) | | | (672) | |
| Disposals (Note 2) | Disposals (Note 2) | (1,085) | | | (94) | | | (46) | | | (1,225) | |
| Other * | Other * | (354) | | | (3) | | | (14) | | | (371) | |
| Balance, December 31, 2022 | |
| Less: accumulated amortization: | |
| Balance, December 31, 2021 | Balance, December 31, 2021 | 11,859 | | | 2,685 | | | 1,629 | | | 16,173 | |
| Less: accumulated amortization: | | | | | | | |
| Balance, December 31, 2020 | (1,470) | | | (118) | | | (596) | | | (2,184) | |
| Balance, December 31, 2021 | |
| Balance, December 31, 2021 | |
| Amortization expense (Note 7) | Amortization expense (Note 7) | (553) | | | (45) | | | (125) | | | (723) | |
| Foreign currency translation | Foreign currency translation | 64 | | | 3 | | | 22 | | | 89 | |
| Disposals (Note 2) | Disposals (Note 2) | 66 | | | 1 | | | 13 | | | 80 | |
| Other * | Other * | 352 | | | — | | | 15 | | | 367 | |
| Balance, December 31, 2021 | (1,541) | | | (159) | | | (671) | | | (2,371) | |
| Net intangible asset balance at December 31, 2021 | $ | 10,318 | | | $ | 2,526 | | | $ | 958 | | | $ | 13,802 | |
| | (Millions of dollars) For the year ended December 31, 2020 | Customer Relationships | | Brands/Tradenames | | Other Intangible Assets | | Total |
| Cost: | | | | | | | |
| Balance, December 31, 2019 | $ | 13,205 | | | $ | 2,764 | | | $ | 1,612 | | | $ | 17,581 | |
| Additions | 5 | | | — | | | 56 | | | 61 | |
| Foreign currency translation | 632 | | | 134 | | | 47 | | | 813 | |
| Disposals | (2) | | | — | | | (20) | | | (22) | |
| Other * | (64) | | | (3) | | | 2 | | | (65) | |
| Balance, December 31, 2020 | 13,776 | | | 2,895 | | | 1,697 | | | 18,368 | |
| Less: accumulated amortization: | | | | | | | |
| Balance, December 31, 2019 | (885) | | | (69) | | | (490) | | | (1,444) | |
| Amortization expense (Note 7) | (589) | | | (45) | | | (131) | | | (765) | |
| Foreign currency translation | (53) | | | (3) | | | 1 | | | (55) | |
| Disposals | 1 | | | — | | | 20 | | | 21 | |
| Other * | 56 | | | (1) | | | 4 | | | 59 | |
| Balance, December 31, 2020 | (1,470) | | | (118) | | | (596) | | | (2,184) | |
| Net balance at December 31, 2020 | $ | 12,306 | | | $ | 2,777 | | | $ | 1,101 | | | $ | 16,184 | |
| Balance, December 31, 2022 | |
| Net balance at December 31, 2022 | |
*Other primarily relates to the write-off of fully amortized assets and reclassifications. 2021 Other is primarily due to merger related customer lists in the Americas.
There are no expected residual values related to these intangible assets. Amortization expense for the years ended December 31, 2023, 2022 and 2021 2020 and 2019 was $723$550 million, $765$571 million and $735$723 million, respectively. The remaining weighted-average amortization period for intangible assets is approximately 24 years.
Total estimated annual amortization expense related to finite-lived intangibles is as follows:
| | (Millions of dollars) | (Millions of dollars) | | (Millions of dollars) | |
| 2022 | $ | 615 | |
| 2023 | 579 | |
| 2024 | 2024 | 571 | |
| 2025 | 2025 | 530 | |
| 2026 | 2026 | 511 | |
| 2027 | |
| 2028 | |
| Thereafter | Thereafter | 9,183 | |
| Total amortization related to finite-lived intangible assets | Total amortization related to finite-lived intangible assets | 11,989 | |
| Indefinite-lived intangible assets at December 31, 2021 | 1,813 | |
| Net intangible assets at December 31, 2021 | $ | 13,802 | |
| Indefinite-lived intangible assets at December 31, 2023 | |
| Net intangible assets at December 31, 2023 | |
NOTE 11. DEBT
The following is a summary of Linde’s outstanding debt at December 31, 20212023 and 20202022:
| | (Millions of dollars) | (Millions of dollars) | December 31, 2021 | | December 31, 2020 | (Millions of dollars) | December 31, 2023 | | December 31, 2022 |
| SHORT-TERM | SHORT-TERM | | | |
| Commercial paper | |
| Commercial paper | |
| Commercial paper | Commercial paper | $ | 278 | | | $ | 2,527 | |
| Other borrowings (primarily non U.S.) | Other borrowings (primarily non U.S.) | 885 | | | 724 | |
| Total short-term debt | Total short-term debt | 1,163 | | | 3,251 | |
| LONG-TERM (a) | LONG-TERM (a) | | | |
| (U.S. dollar denominated unless otherwise noted) | (U.S. dollar denominated unless otherwise noted) | |
| 3.875% Euro denominated notes due 2021 (c) | — | | | 748 | |
| 0.250% Euro denominated notes due 2022 (b) (f) | 1,137 | | | 1,226 | |
| 2.45% Notes due 2022 (e) | — | | | 599 | |
| 2.20% Notes due 2022 | 500 | | | 499 | |
| 2.70% Notes due 2023 | 500 | | | 499 | |
| 2.00% Euro denominated notes due 2023 (b) | 759 | | | 832 | |
| 5.875% GBP denominated notes due 2023 (b) | 432 | | | 460 | |
| (U.S. dollar denominated unless otherwise noted) | |
| (U.S. dollar denominated unless otherwise noted) | |
| 2.70% Notes due 2023 (c) | |
| 2.70% Notes due 2023 (c) | |
| 2.70% Notes due 2023 (c) | |
| 2.00% Euro denominated notes due 2023 (d) | |
| 5.875% GBP denominated notes due 2023 (d) | |
| 1.20% Euro denominated notes due 2024 | 1.20% Euro denominated notes due 2024 | 625 | | | 671 | |
| 1.875% Euro denominated notes due 2024 (b) | 1.875% Euro denominated notes due 2024 (b) | 356 | | | 389 | |
| 4.800% Notes due 2024 | |
| 4.700% Notes due 2025 | |
| 2.65% Notes due 2025 | 2.65% Notes due 2025 | 399 | | | 398 | |
| 1.625% Euro denominated notes due 2025 | 1.625% Euro denominated notes due 2025 | 565 | | | 607 | |
| 0.00% Euro denominated notes due 2026 (d) | 799 | | | — | |
| 3.625% Euro denominated notes due 2025 (e) | |
| 0.00% Euro denominated notes due 2026 | |
| 3.20% Notes due 2026 | 3.20% Notes due 2026 | 725 | | | 725 | |
| 3.434% Notes due 2026 | 3.434% Notes due 2026 | 197 | | | 196 | |
| 1.652% Euro denominated notes due 2027 | 1.652% Euro denominated notes due 2027 | 94 | | | 100 | |
| 0.250% Euro denominated notes due 2027 | 0.250% Euro denominated notes due 2027 | 850 | | | 914 | |
| 1.00% Euro denominated notes due 2027 | |
| 1.00% Euro denominated notes due 2028 (b) | 1.00% Euro denominated notes due 2028 (b) | 879 | | | 966 | |
| 3.375% Euro denominated notes due 2029 (e) | |
| 1.10% Notes due 2030 | 1.10% Notes due 2030 | 696 | | | 696 | |
| 1.90% Euro denominated notes due 2030 | 1.90% Euro denominated notes due 2030 | 118 | | | 127 | |
| 1.375% Euro denominated notes due 2031 | |
| 0.550% Euro denominated notes due 2032 | 0.550% Euro denominated notes due 2032 | 847 | | | 909 | |
| 0.375% Euro denominated notes due 2033 (d) | 565 | | | — | |
| 0.375% Euro denominated notes due 2033 | |
| 3.625% Euro denominated notes due 2034 (e) | |
| 1.625% Euro denominated notes due 2035 | |
| 3.55% Notes due 2042 | 3.55% Notes due 2042 | 664 | | | 664 | |
| 2.00% Notes due 2050 | 2.00% Notes due 2050 | 296 | | | 296 | |
| 1.00% Euro denominated notes due 2051 (d) | 788 | | | — | |
| 1.00% Euro denominated notes due 2051 | |
| Non U.S. borrowings | Non U.S. borrowings | 243 | | | 372 | |
| Other | Other | 10 | | | 10 | |
| | 14,660 | |
| | 13,044 | | | 12,903 | |
| 14,660 | |
| | 14,660 | |
| Less: current portion of long-term debt | Less: current portion of long-term debt | (1,709) | | | (751) | |
| Total long-term debt | Total long-term debt | 11,335 | | | 12,152 | |
| Total debt | Total debt | $ | 14,207 | | | $ | 16,154 | |
________________________
(a)Amounts are net of unamortized discounts, premiums and/or debt issuance costs as applicable.
(b)December 31, 20212023 and 2020December 31, 2022 included a cumulative $42$46 million and $79$56 million adjustment to carrying value, respectively, related to hedge accounting of interest rate swaps.swaps, including related terminations. Refer to Note 12.
(c)In June 2021, the companyFebruary 2023, Linde repaid €600$500 million of 3.875% note2.70% notes that became due.
(d)In September 2021,April 2023, Linde issued €700repaid €650 million of 0.000%2.00% notes due 2026, €500and £300 million of 0.375%5.875% notes due 2033, and €700 million of 1.000% notes due 2051.that became due.
(e)In November 2021,June 2023, Linde repaid $600issued €500 million of 2.45%3.625% notes that were due in 2022. There was no impact to interest within the consolidated statements2025, €750 million of income.
(f)In January 2022, Linde repaid €1.0 billion of 0.250%3.375% notes that became due in 2022.2029 and €650 million of 3.625% notes due in 2034.
Credit Facilities
On March 26, 2019December 7, 2022, the company and certain of its subsidiaries entered into an amended and restated unsecured revolving credit agreement ("the(the “Five Year Credit Agreement"Agreement”) with a syndicate of banking institutions, which became effective on March 29, 2019.institutions. The Five Year Credit Agreement provides for total commitments of $5.0 billion, which may be increased up to $6.5 billion, subject to receipt of additional commitments and satisfaction of customary conditions. There are no financial maintenance covenants contained within the Credit Agreement. The revolving credit facility expires on March 26,December 7, 2027 with the option to request two one-year extensions of the expiration date.
In addition, on December 6, 2023, the company and certain of its subsidiaries entered into an unsecured 364-day revolving credit agreement (the “364-Day Credit Agreement” and, together with the Five Year Credit Agreement, the “Credit Agreements”) with a syndicate of banking institutions. The 364-Day Credit Agreement provides for total commitments of $1.5 billion. There are no financial maintenance covenants contained within the Credit Agreement. The 364-Day Credit Agreement expires on December 4, 2024 with the option to request 2 one-year extensions ofelect to have the expirationentire principal balances outstanding under the Credit Agreement converted into non-revolving term loans, which will be due and payable one year after the commitment termination date.
No borrowings were outstanding under the Credit AgreementAgreements as of December 31, 2021.2023.
Other Debt Information
As of December 31, 2021 and 2020, theThe weighted-average interest raterates of short-term borrowings outstanding was 0.0% in both years.were 4.8% and 3.2% as of December 31, 2023 and 2022, respectively.
Expected maturities of long-term debt are as follows:
| | (Millions of dollars) | (Millions of dollars) | | |
| 2022 | $ | 1,709 | | |
| 2023 | 1,706 | | |
| (Millions of dollars) | |
| (Millions of dollars) | |
| 2024 | |
| 2024 | |
| 2024 | 2024 | 988 | | |
| 2025 | 2025 | 984 | | |
| 2025 | |
| 2025 | |
| 2026 | 2026 | 1,735 | | |
| 2026 | |
| 2026 | |
| 2027 | |
| 2027 | |
| 2027 | |
| 2028 | |
| 2028 | |
| 2028 | |
| Thereafter | Thereafter | 5,922 | | |
| $ | 13,044 | | |
| Thereafter | |
| Thereafter | |
| $ | |
| $ | |
| $ | |
As of December 31, 2021,2023, the amount of Linde's assets pledged as collateral was immaterial.
See Note 13 for the fair value information related to debt.
NOTE 12. FINANCIAL INSTRUMENTS
In its normal operations, Linde is exposed to market risks relating to fluctuations in interest rates, foreign currency exchange rates, energy and commodity costs. The objective of financial risk management at Linde is to minimize the negative impact of such fluctuations on the company’s earnings and cash flows. To manage these risks, among other strategies, Linde routinely enters into various derivative financial instruments (“derivatives”) including interest-rate swap and treasury rate lock agreements, currency-swap agreements, forward contracts, currency options, and commodity-swap agreements. These instruments are not entered into for trading purposes and Linde only uses commonly traded and non-leveraged instruments.
There are three types of derivatives that the company enters into: (i) those relating to fair-value exposures, (ii) those relating to cash-flow exposures, and (iii) those relating to foreign currency net investment exposures. Fair-value exposures relate to recognized assets or liabilities, and firm commitments; cash-flow exposures relate to the variability of future cash flows associated with recognized assets or liabilities, or forecasted transactions; and net investment exposures relate to the impact of foreign currency exchange rate changes on the carrying value of net assets denominated in foreign currencies.
When a derivative is executed and hedge accounting is appropriate, it is designated as either a fair-value hedge, cash-flow hedge, or a net investment hedge. Currently, Linde designates all interest-rate and treasury-ratetreasury rate locks as hedges for accounting purposes; however, cross-currency contracts are generally not designated as hedges for accounting purposes. Certain currency contracts related to forecasted transactions are designated as hedges for accounting purposes. Whether designated as hedges for accounting purposes or not, all derivatives are linked to an appropriate underlying exposure. On
an ongoing basis, the company assesses the hedge effectiveness of all derivatives designated as hedges for accounting purposes to determine if they continue to be highly effective in offsetting changes in fair values or cash flows of the underlying hedged items. If it is determined that the hedge is not highly effective, through the use of a qualitative assessment, then hedge accounting will be discontinued prospectively.
Counterparties to Linde’s derivatives are major banking institutions with credit ratings of investment grade or better. The company has Credit Support Annexes ("CSAs") in place for certain entities with their principal counterparties to minimize potential default risk and to mitigate counterparty risk. Under the CSAs, the fair values of derivatives for the purpose of interest rate and currency management are collateralized with cash on a regular basis. As of December 31, 2021,2023, the impact of such collateral posting arrangements on the fair value of derivatives was insignificant. Management believes the risk of incurring losses on derivative contracts related to credit risk is remote and any losses would be immaterial.
The following table is a summary of the notional amount and fair value of derivatives outstanding at December 31, 20212023 and 20202022 for consolidated subsidiaries:
| | | | | | | | Fair Value | | | | | | Fair Value |
| (Millions of dollars) | (Millions of dollars) | Notional Amounts | | Assets (a) | | Liabilities (a) | (Millions of dollars) | Notional Amounts | | Assets (a) | | Liabilities (a) |
| December 31, | December 31, | 2021 | | 2020 | | 2021 | | 2020 | | 2021 | | 2020 | December 31, | 2023 | | 2022 | | 2023 | | 2022 | | 2023 | | 2022 |
| Derivatives Not Designated as Hedging Instruments: | Derivatives Not Designated as Hedging Instruments: | | | | | | | | | | | |
| Currency contracts: | Currency contracts: | |
| Currency contracts: | |
| Currency contracts: | |
| Balance sheet items | |
| Balance sheet items | |
| Balance sheet items | Balance sheet items | $ | 4,427 | | | $ | 6,470 | | | $ | 22 | | | $ | 72 | | | $ | 17 | | | $ | 48 | |
Forecasted transactions | Forecasted transactions | 537 | | | 823 | | | 6 | | | 16 | | | 11 | | | 12 | |
Cross-currency swaps | Cross-currency swaps | 148 | | | 260 | | | 21 | | | 24 | | | 4 | | | 7 | |
| Commodity contracts | Commodity contracts | N/A | | N/A | | — | | | 1 | | | — | | | — | |
| Total | Total | $ | 5,112 | | | $ | 7,553 | | | $ | 49 | | | $ | 113 | | | $ | 32 | | | $ | 67 | |
| Derivatives Designated as Hedging Instruments: | Derivatives Designated as Hedging Instruments: | | | | | | | | | | | |
| Currency contracts: | Currency contracts: | |
| Balance sheet items | $ | — | | | $ | — | | | $ | — | | | $ | — | | | $ | — | | | $ | — | |
| Currency contracts: | |
| Currency contracts: | |
| Forecasted transactions | |
| Forecasted transactions | |
| Forecasted transactions | Forecasted transactions | 758 | | | 355 | | | 14 | | | 20 | | | 3 | | | 14 | |
| Commodity contracts | Commodity contracts | N/A | | N/A | | 49 | | | 3 | | | — | | | — | |
| Interest rate swaps | Interest rate swaps | 1,251 | | | 1,923 | | | 24 | | | 64 | | | — | | | — | |
| Total Hedges | Total Hedges | $ | 2,009 | | | $ | 2,278 | | | $ | 87 | | | $ | 87 | | | $ | 3 | | | $ | 14 | |
| Total Derivatives | Total Derivatives | $ | 7,121 | | | $ | 9,831 | | | $ | 136 | | | $ | 200 | | | $ | 35 | | | $ | 81 | |
(a) Amounts at December 31, 20212023 and 20202022 included current assets of $101$73 million and $110$24 million, which are recorded in prepaid and other current assets; long-term assets of $35$8 million and $90$4 million, which are recorded in other long-term assets; current liabilities of $27$41 million and $70$23 million, which are recorded in other current liabilities; and long-term liabilities of $8$6 million and $11$73 million, which are recorded in other long-term liabilities.
Balance Sheet Items
Foreign currency contracts related to balance sheet items consist of forward contracts entered into to manage the exposure to fluctuations in foreign-currency exchange rates on recorded balance sheet assets and liabilities denominated in currencies other than the functional currency of the related operating unit. Certain forward currency contracts are entered into to protect underlying monetary assets and liabilities denominated in foreign currencies from foreign exchange risk and are not designated as hedging instruments. For balance sheet items that are not designated as hedging instruments, the fair value adjustments on these contracts are offset by the fair value adjustments recorded on the underlying monetary assets and liabilities.
Forecasted Transactions
Foreign currency contracts related to forecasted transactions consist of forward contracts entered into to manage the exposure to fluctuations in foreign-currency exchange rates on (1) forecasted purchases of capital-related equipment and services, (2) forecasted sales, or (3) other forecasted cash flows denominated in currencies other than the functional
currency of the related operating units. For forecasted transactions that are designated as cash flow hedges, fair value adjustments are recorded to accumulated other comprehensive income ("AOCI")(loss) with deferred amounts reclassified to earnings over the same time period as the income statement impact of the associatedassociated purchase. For forecasted transactions that do not qualify for cash flow hedging relationships, fair value adjustments are recorded directly to earnings. Linde is hedging forecasted transactions for a maximum period of three years.
Cross-Currency Swaps
Cross-currency interest rate swaps are entered into to limit the foreign currency risk of future principal and interest cash flows associated with intercompany loans, and to a more limited extent bonds, denominated in non-functional currencies. The fair value adjustments on the cross-currency swaps are recorded to earnings, where they are offset by fair value adjustments on the underlying intercompany loan or bond.
Commodity Contracts
Commodity contracts are entered into to manage the exposure to fluctuations in commodity prices, which arise in the normal course of business from its procurement transactions. To reduce the extent of this risk, Linde enters into a limited number of electricity, natural gas, and propane gas derivatives. For forecasted transactions that are designated as cash flow hedges, fair value adjustments are recorded to accumulated other comprehensive income ("AOCI")(loss) with deferred amounts reclassified to earnings over the same time period as the income statement impact of the associated purchase. Linde is hedging commodity contracts for a maximum period of three years.
Net Investment Hedges
As of December 31, 2021,2023, Linde has €4.2€10.7 billion ($4.811.7 billion) Euro-denominated notes and intercompany loans and ¥4.7 billion ($0.7 billion) CNY-denominated intercompany loans that are designated as hedges of the net investment positions in certain foreign operations. Since hedge inception, the deferred gain recorded within cumulative translation adjustment component of AOCIaccumulated other comprehensive income (loss) in the consolidated balance sheet andis $45 million (deferred loss of $305 million in the consolidated statement of comprehensive income is $140 million (deferred gain of $140 million for the year ended December 31, 2021)2023).
As of December 31, 2021,2023, exchange rate movements relating to previously designated hedges that remain in AOCIaccumulated other comprehensive income (loss) is a lossgain of $42$56 million. These movements will remain in AOCI,accumulated other comprehensive income (loss), until appropriate, such as upon sale or liquidation of the related foreign operations at which time amounts will be reclassified to the consolidated statements of income.
Interest Rate Swaps
Linde uses interest rate swaps to hedge the exposure to changes in the fair value of financial assets and financial liabilities as a result of interest rate changes. These interest rate swaps effectively convert fixed-rate interest exposures to variable rates; fair value adjustments are recognized in earnings along with an equally offsetting charge/benefit to earnings for the changes in the fair value of the underlying financial asset or financial liability.liability (see Note 11). Certain interest rate swaps in a designated fair value hedge relationship were terminated during 2023. Upon termination, adjustments are no longer recorded to the hedged items for changes in respective fair values attributable to the risk being hedged. The unrecognized
loss on the terminated interest rate swaps is shown as a discount to long-term debt of $56 million, and will be amortized to interest expense over the remaining life of the debt, which extends through April 2028.
In addition, as of December 31, 2023, Linde is using interest rate swaps with a notional value of outstanding€1 billion to hedge the variability of future cash flows of forecasted transactions due to interest rate swaps of Linde with maturity dates from 2022 through 2028 was $1,251 million at December 31, 2021risk and $1,923 million at December 31, 2020 (see Note 11 for further information).
Terminated Treasury Rate Locks
The unrecognized aggregated losses related to terminated treasury rate lock contracts on the underlying $500 million 2.20% fixed-rate notes that mature in 2022 at December 31, 2021 and December 31, 2020 were immaterial in both periods. The unrecognized gains/(losses) for the treasury rate locks are shown in AOCI and are being recognized onhas designated this as a straight line basis to interest expense - net over the term of the underlying debt agreements.cash flow hedge.
Derivatives Impact on Consolidated Statements of Income
The following table summarizes the impact of the company's derivatives on the consolidated statements of income:
| | (Millions of dollars) | (Millions of dollars) | Amount of Pre-Tax Gain (Loss)
Recognized in Earnings * | (Millions of dollars) | Amount of Pre-Tax Gain (Loss)
Recognized in Earnings * |
| December 31, | December 31, | 2021 | | 2020 | | 2019 | December 31, | 2023 | | 2022 | | 2021 |
| Derivatives Not Designated as Hedging Instruments | Derivatives Not Designated as Hedging Instruments | | | | | |
| Currency contracts: | Currency contracts: | |
| Currency contracts: | |
| Currency contracts: | |
| Balance sheet items: | Balance sheet items: | |
| Balance sheet items: | |
| Balance sheet items: | |
| Debt-related | |
| Debt-related | |
| Debt-related | Debt-related | $ | 42 | | | $ | (125) | | | $ | 253 | |
| Other balance sheet items | Other balance sheet items | (5) | | | (40) | | | 65 | |
| Total | Total | $ | 38 | | | $ | (165) | | | $ | 318 | |
* The gains (losses) on balance sheet items are offset by gains (losses) recorded on the underlying hedged assets and liabilities. Accordingly, the gains (losses) for the derivatives and the underlying hedged assets and liabilities related to debt items are recorded in the consolidated statements of income as
interest expense-net. Other balance sheet items and anticipated net income gains (losses) are recorded in the consolidated statements of income as other income (expenses)-net.
The amounts of gain or loss recognized in AOCIaccumulated other comprehensive income (loss) and reclassified to the consolidated statement of income was immaterialnot material for the yearyears ended December 31, 2023, 2022, and 2021. Net lossesimpacts expected to be reclassified to earnings during the next twelve months are also not material.
NOTE 13. FAIR VALUE DISCLOSURES
The fair value hierarchy prioritizes the inputs to valuation techniques used to measure fair value into three broad levels as follows:
Level 1 – quoted prices in active markets for identical assets or liabilities
Level 2 – quoted prices for similar assets and liabilities in active markets or inputs that are observable
Level 3 – inputs that are unobservable (for example cash flow modeling inputs based on assumptions)
Assets and Liabilities Measured at Fair Value on a Recurring Basis
The following table summarizes assets and liabilities measured at fair value on a recurring basis at December 31, 20212023 and 2020:2022:
| | | | Fair Value Measurements Using | | Fair Value Measurements Using |
| (Millions of dollars) | (Millions of dollars) | Level 1 | | Level 2 | | Level 3 | (Millions of dollars) | Level 1 | | Level 2 | | Level 3 |
| | | 2021 | | 2020 | | 2021 | | 2020 | | 2021 | | 2020 | | 2023 | | 2022 | | 2023 | | 2022 | | 2023 | | 2022 |
| Assets | Assets | | | | | | | | | | | |
| Derivative assets | Derivative assets | $ | — | | | $ | — | | | $ | 136 | | | $ | 200 | | | $ | — | | | $ | — | |
| Derivative assets | |
| Derivative assets | |
| Investments and securities * | Investments and securities * | 42 | | | 21 | | | — | | | — | | | 20 | | | 47 | |
| Total | Total | $ | 42 | | | $ | 21 | | | $ | 136 | | | $ | 200 | | | $ | 20 | | | $ | 47 | |
| Liabilities | Liabilities | | | | | | | | | | | |
| Derivative liabilities | Derivative liabilities | $ | — | | | $ | — | | | $ | 35 | | | $ | 81 | | | $ | — | | | $ | — | |
| Derivative liabilities | |
| Derivative liabilities | |
*Investments and securities are recorded in prepaid and other current assets and other long-term assets in the company's consolidated balance sheets.
Level 1 investments and securities are marketable securities traded on an exchange. Level 2 investments are based on market prices obtained from independent brokers or determined using quantitative models that use as their basis readily observable market parameters that are actively quoted and can be validated through external sources, including third-party pricing services, brokers and market transactions. Level 3 investments and securities consist of a venture fund. For the
valuation, Linde uses the net asset value received as part of the fund's quarterly reporting, which for the most part is not based on quoted prices in active markets. In order to reflect current market conditions, Linde proportionally adjusts these by observable market data (stock exchange prices) or current transaction prices.
Changes in level 3 investments and securities were immaterial.
The fair value of cash and cash equivalents, short-term debt, accounts receivable-net, and accounts payable approximate carrying value because of the short-term maturities of these instruments.
The fair value of long-term debt is estimated based on the quoted market prices for the same or similar issues. Long-term debt is categorized within either Level 1 or Level 2 of the fair value hierarchy depending on the trading volume of the issues and whether or not they are actively quoted in the market as opposed to traded through over-the-counter transactions.hierarchy. At December 31, 2021,2023, the estimated fair value of Linde’s long-term debt portfolio was $13,219$13,337 million versus a carrying value of $13,044$14,660 million. At December 31, 20202022 the estimated fair value of Linde’s long-term debt portfolio was $13,611$11,994 million versus a carrying value of $12,903$13,797 million. Differences between the carrying value and the fair value are attributable to fluctuations in interest rates subsequent to when the debt was issued and relative to stated coupon rates.
NOTE 14. EQUITY AND NONCONTROLLING INTERESTS
Linde plc Shareholders’ Equity
On March 1, 2023, in connection with the shareholder approved intercompany reorganization that resulted in the delisting of old Linde plc from the New York Stock Exchange (NYSE) and the Frankfurt Stock Exchange (FSE), and the subsequent relisting of new Linde plc to the NYSE, Linde shareholders automatically received one share of the new holding company in exchange for each share of Linde plc that was previously owned. The company issued 490,766,972 new Linde shares. Linde plc's historical treasury shares were immediately canceled which resulted in an approximate $15 billion decrease in treasury shares and retained earnings in Shareholders' Equity. On November 7, 2023, Linde plc transferred the listing of its ordinary shares from the NYSE to the Nasdaq, and continued trading under the ticker symbol "LIN".
At December 31, 20212023 and 2020,2022, Linde has total authorized share capital of €1,825,000 divided into 1,750,000,000 ordinary shares of €0.001 each, 25,000 A ordinary shares of €1.00 each, 25,000 deferred shares of €1.00 each and 25,000,000 preferred shares of €0.001 each.
At December 31, 20212023 there were 552,012,862490,766,972 and 508,680,879482,445,145 of Linde plc ordinary shares issued and outstanding, respectively. At December 31, 20212023 there were no shares of A ordinary shares, deferred shares or preferred shares issued or outstanding.
At December 31, 20202022 there were 552,012,862 and 523,294,529492,457,627 of Linde plc ordinary shares issued and outstanding, respectively. At December 31, 2020,2022, there were no shares of A ordinary shares, deferred shares or preferred shares issued or outstanding.
Linde’s Board of Directors may from time to time authorize the issuance of one or more series of preferred stock and, in connection with the creation of such series, determine the characteristics of each such series including, without limitation, the preference and relative, participating, optional or other special rights, and the qualifications, limitations or restrictions of the series.
Other Linde plc Ordinary Share and Treasury Share Transactions
Linde may issue new ordinary shares for dividend reinvestment and stock purchase plans and employee savings and incentive plans. The number of new Linde ordinary shares issued from the merger date through December 31, 2019 was 958,293 shares. No new ordinary shares were issued in 2020 or2023, 2022 and 2021.
On December 10, 2018 the Linde board of directors approved the repurchase of $1.0 billion of its ordinary shares under which Linde had repurchased 6,385,887 shares through December 31, 2019 (4,068,642 shares were repurchased through December 31, 2018). Linde completed the repurchases under this program in the first quarter of 2019.
On January 22, 2019 the company’s board of directors approved the additional repurchase of $6.0 billion of its ordinary shares under which Linde had repurchased 24,847,354 shares through December 31, 2021 (24,310,534 shares were repurchased through December 31, 2020). This2021. Linde completed the repurchases under this program expired on February 1,in the first quarter of 2021.
On January 25, 2021 the company's board of directors approved the additional repurchase of $5.0 billion of its ordinary shares under which Linde had repurchased 15,103,33516,662,678 shares through December 31, 2021. This2022. Linde completed the repurchases under this program is set to expire on July 31, 2023.in the first quarter of 2022.
On February 28, 2022, the Lindecompany's board of directors authorized a new share repurchase program for up to $10.0 billion of its ordinary shares expiring("2022 program") under which Linde had repurchased 26,411,514 shares through December 31, 2023. This program expires on July 31, 2024.
On October 23, 2023, the company's board of directors approved a new share repurchase program for up to $15.0 billion of its ordinary shares ("2023 program") under which Linde has no repurchases as of December 31, 2023. This program will
terminate on the earlier of the date as the maximum authority under the 2023 program is reached or the board terminates the 2023 program.
Noncontrolling Interests
Noncontrolling interest ownership changes are presented within the consolidated statements of equity. The decrease during 2021 is primarily related to2022 includes the deconsolidationimpact of a joint venture with operations in APACdeconsolidating the company's Russian gas and engineering business entities (see Note 2)3).
The decrease during 2020 primarily relates to the initiated buyout of minority interests in the Republic of South Africa. As of December 31, 2020, the conditions of the buyout were met obligating the company to execute in January 2021. Therefore, the company reclassified $196 million from non-controlling interest to other current liabilities reflecting the transaction price. An additional $35 million of dividends declared to the minority owners, reflected on the Dividends and other capital reductions line, was also reclassified to other current liabilities at December 31, 2020 and was paid in January 2021.
The $2,921 million decrease during 2019 was primarily driven by the completion of the cash merger squeeze-out of the 8% of Linde AG shares which were not tendered in the Exchange Offer related to the merger.
Redeemable Noncontrolling Interests
Noncontrolling interests with redemption features, such as put/sell options, that are not solely within the company’s control (“redeemable noncontrolling interests”) are reported separately in the consolidated balance sheets at the greater of carrying value or redemption value. For redeemable noncontrolling interests that are not yet exercisable, Linde calculates the redemption value by accreting the carrying value to the redemption value over the period until exercisable. If the redemption value is greater than the carrying value, any increase is adjusted directly to retained earnings and does not impact net income. At December 31, 20212023 and 2020,2022, the redeemable noncontrolling interest balance includes an industrial gas business in EMEA where the noncontrolling shareholders have put options.
NOTE 15. SHARE-BASED COMPENSATION
Share-based compensation expense was $141 million in 2023 ($107 million and $128 million in 2021 ($133 million2022 and $95 million in 2020 and 2019,2021, respectively). The related income tax benefit recognized was $88 million in 2023 ($64 million and $64 million in 2021 ($79 million2022 and $42 million in 2020 and 2019,2021, respectively). The expense was primarily recorded in selling, general and administrative expenses and no share-based compensation expense was capitalized.
Summary of Plans
The 2021 Linde plc Long Term Incentive Plan (the “2021 Plan") was adopted by the Board of Directors and shareholders of Linde plc on July 26, 2021. Upon adoption of the 2021 Plan, any authorized shares that remained available for grant for new awards under the Amended and Restated 2009 Linde Long Term Incentive Plan (the “2009 Plan”) were cancelled. The 2021 Plan permits awards of stock options, stock appreciation rights, restricted stock and restricted stock units, performance-based stock units and other equity awards to eligible officer and non-officer employees and non-employee directors of the company and its affiliates. As of December 31, 2021, 8,995,7102023, 7,661,431 shares remained available for equity grants under the 2021 Plan, of which 2,995,7102,452,443 shares may be granted as awards other than options or stock appreciation rights.
Exercise prices for options granted under the 2021 Plan may not be less than the closing market price of the company’s ordinary shares on the date of grant and granted options may not be re-priced or exchanged without shareholder approval. Options granted under the 2021 Plan subject only to time vesting requirements may become partially exercisable after a minimum of one year after the date of grant but may not become fully exercisable until at least three years have elapsed from the date of grant, and all options have a maximum duration of ten years.
In connection with the business combination, on October 31, 2018 the company's Board of Directors adopted the Long Term Incentive Plan 2018 of Linde plc (“the LTIP 2018”), the purpose of which was to replace certain outstanding Linde AG equity based awards that were terminated. Under the LTIP 2018, the aggregate number of shares available for replacement option rights and replacement restricted share units was set at 473,128. As of December 31, 2021, 285,113 shares remained available for grant, and since the company was obligated to make these replacement awards only in 2019, no further grants will be made under this plan.
Exercise prices for the replacement option rights that were granted in 2019 under the LTIP 2018 were equal to EUR 1.67 ($1.92 as converted at an exchange rate from the time the exchange offer was completed as the option rights are exercisable in U.S. dollars on the NYSE) as prescribed in the business combination agreement. Each replacement option right granted under the LTIP 2018 is subject to vesting based on continued service until the end of the four-year waiting period applicable to the relevant Linde AG award that had been granted before the business combination. After vesting, each option right will be exercisable for one year.
In order to satisfy option exercises and other equity grants, the company may issue authorized but previously unissued shares or it may issue treasury shares.
Stock Option Fair Value
The company utilizes the Black-Scholes Options-Pricing Model to determine the fair value of stock options consistent with that used in prior years. Management is required to make certain assumptions with respect to selected model inputs, including anticipated changes in the underlying stock price (i.e., expected volatility) and option exercise activity (i.e., expected life). Expected volatility is based on the historical volatility of the company’s stock over the most recent period commensurate with the estimated expected life of the company’s stock options and other factors. The expected life of options granted, which represents the period of time that the options are expected to be outstanding, is based primarily on historical exercise experience. The expected dividend yield is based on the company’s most recent history and expectation of dividend payouts. The risk-free rate is based on the U.S. Treasury yield curve in effect at the time of grant for a period commensurate with the estimated expected life. If factors change and result in different assumptions in future periods, the stock option expense that the company records for future grants may differ significantly from what the company has recorded in the current period.
The weighted-average fair value of options granted during 20212023 was $83.69 ($45.07 in 2022 and $37.80 ($17.37 in 2020 and $23.38 in 2019)2021) based on the Black-Scholes Options-Pricing model. The increase in the grant date fair value year-over-year is primarily attributable to the increase in the stock price. The weighted-average fair value of replacement option rights granted in 2019 was $160.08 based on intrinsic value method.
The following weighted-average assumptions were used to value the grants in 2021, 20202023, 2022 and 2019:2021:
| | Year Ended December 31, | Year Ended December 31, | 2021 | | 2020 | | 2019 | Year Ended December 31, | 2023 | | 2022 | | 2021 |
| Dividend yield | Dividend yield | 1.7 | % | | 2.2 | % | | 2.0 | % | Dividend yield | 1.4 | % | | 1.7 | % | | 1.7 | % |
| Volatility | Volatility | 18.4 | % | | 15.8 | % | | 14.3 | % | Volatility | 22.0 | % | | 20.6 | % | | 18.4 | % |
| Risk-free interest rate | Risk-free interest rate | 1.10 | % | | 0.60 | % | | 2.38 | % | Risk-free interest rate | 4.23 | % | | 1.70 | % | | 1.10 | % |
| Expected term years | Expected term years | 6 | | 6 | | 6 | Expected term years | 5 | | 5 | | 6 |
|
The following table summarizes option activity under the plans as of December 31, 20212023 and changes during the period then ended (averages are calculated on a weighted basis; life in years; intrinsic value expressed in millions):
| | | | | | | | | | | | | | | | | | | | | | | |
| Activity | Number of
Options
(000’s) | | Average
Exercise
Price | | Average
Remaining
Life | | Aggregate
Intrinsic
Value |
| Outstanding at January 1, 2021 | 8,067 | | | $ | 136.05 | | | | | |
| Granted | 831 | | | 253.68 | | | | | |
| Exercised | (1,672) | | | 121.40 | | | | | |
| Cancelled or expired | (60) | | | 207.35 | | | | | |
| Outstanding at December 31, 2021 | 7,166 | | | $ | 152.56 | | | 6.0 | | $ | 1,389 | |
| Exercisable at December 31, 2021 | 5,297 | | | $ | 132.84 | | | 5.0 | | $ | 1,131 | |
| | | | | | | | | | | | | | | | | | | | | | | |
| Activity | Number of
Options
(000’s) | | Average
Exercise
Price | | Average
Remaining
Life | | Aggregate
Intrinsic
Value |
| Outstanding at January 1, 2023 | 6,720 | | | $ | 164.03 | | | | | |
| Granted | 361 | | | 354.16 | | | | | |
| Exercised | (1,225) | | | 137.78 | | | | | |
| Cancelled or expired | (31) | | | 311.86 | | | | | |
| Outstanding at December 31, 2023 | 5,825 | | | $ | 180.58 | | | 5.0 | | $ | 1,341 | |
| Exercisable at December 31, 2023 | 4,926 | | | $ | 159.18 | | | 4.4 | | $ | 1,239 | |
The aggregate intrinsic value represents the difference between the company’s closing stock price of $346.43$410.71 as of December 31, 20212023 and the exercise price multiplied by the number of in the money options outstanding as of that date. The total intrinsic value of stock options exercised during 20212023 was $283 million ($176 million and $294 million ($264 millionin 2022 and $219 million in 2020 and 2019,2021, respectively).
Cash received from option exercises under all share-based payment arrangements for 20212023 was $50$33 million ($36 million and $64$50 million in 20202022 and 2019,2021, respectively). The cash tax benefit realized from share-based compensation totaled $64$86 million for 20212023 ($7061 million and $56$64 million cash tax benefit in 20202022 and 2019,2021, respectively).
As of December 31, 2021,2023, $17 million of unrecognized compensation cost related to non-vested stock options is expected to be recognized over a weighted-average period of approximately 1 year.
Performance-Based and Restricted Stock Unit Awards
In 2021,2023, the company granted 187,830341,915 performance-based stock unit awards under the 20092021 Plan to senior management that vest, subject to the attainment of pre-established minimum performance criteria, principally on the third anniversary of their date of grant. These awards are tied to either after tax return on capital ("ROC") performance or relative total shareholder return ("TSR") performance versus that of a blended group of companies that is comprised of the S&P 500, (weighted 67%)excluding the Financial sector, and Eurofirst 300 (weighted 33%).300. The actual number of shares issued in settlement of a vested award can range from zero to 200 percent of the target number of shares granted based upon the company’s attainment of specified performance targets at the end of a three-yearthree-year period. Compensation expense related to these awards is recognized over the three-year performance period based on the fair value of the closing market price of the company’s ordinary shares on the date of the grant and the estimated performance that will be achieved. Compensation expense for ROC awards will be adjusted during the three-year performance period based upon the estimated performance levels that will be achieved. TSR awards are measured at their grant date fair value and not subsequently re-measured. The number of performance-based stock unit awards granted in 2023 includes an increase of 201,120 stock units to the target number of performance-based awards originally granted in 2020, as these awards achieved a higher payout factor upon completion of the three-year performance period.
The weighted-average fair value of ROC performance-based stock awards granted in 20212023 was $340.80 ($257.63 in 2022 and $241.10 ( $161.56 in 2020 and $168.47 in 2019)2021). These fair values are based on the closing market price of Linde's ordinary shares on the grant date adjusted for dividends that will not be paid during the vesting period.
The weighted-average fair value of performance-based stock tied to relative TSR performanceawards granted in 20212023 was $489.33 ($301.42 in 2022 and $301.04 ($198.61 in 2020 and $215.85 in 2019)2021) and was estimated using a Monte Carlo simulation performed as of the grant date.
There were 175,597160,839 restricted stock units granted to employees by Linde during 2021.2023. The weighted-average fair value of restricted stock units granted during 20212023 was $332.69 ($260.27 in 2022 and $242.60 ($174.95 in 2020 and $165.04 in 2019)2021). These fair values are based on the closing market price of Linde's ordinary shares on the grant date adjusted for dividends that will not be paid during the vesting period. Compensation expense related to the restricted stock units is recognized over the vesting period.
The following table summarizes non-vested performance-based and restricted stock unit award activity as of December 31, 20212023 and changes during the period then ended (shares based on target amounts, averages are calculated on a weighted basis):
| | | | | | | | | | | | | | | | | | | | | | | |
| Performance-Based | | Restricted Stock |
| Number of
Shares
(000’s) | | Average
Grant Date
Fair Value | | Number of
Shares
(000’s) | | Average
Grant Date
Fair Value |
| Non-vested at January 1, 2021 | 437 | | | $ | 179.76 | | | 688 | | | $ | 148.56 | |
| Granted | 188 | | | 262.56 | | | 176 | | | 242.60 | |
| Vested | — | | | — | | | (213) | | | 147.84 | |
| Cancelled and Forfeited | (15) | | | 221.70 | | | (15) | | | 206.65 | |
| Non-vested at December 31, 2021 | 610 | | | $ | 204.39 | | | 636 | | | $ | 172.90 | |
| | | | | | | | | | | | | | | | | | | | | | | |
| Performance-Based | | Restricted Stock |
| Number of
Shares
(000’s) | | Average
Grant Date
Fair Value | | Number of
Shares
(000’s) | | Average
Grant Date
Fair Value |
| Non-vested at January 1, 2023 | 583 | | | $ | 226.04 | | | 646 | | | $ | 190.33 | |
| Granted | 342 | | | 385.10 | | | 161 | | | 332.69 | |
| Vested | (340) | | | 174.99 | | | (154) | | | 176.06 | |
| Cancelled and Forfeited | (13) | | | 156.14 | | | (15) | | | 163.12 | |
| Non-vested at December 31, 2023 | 572 | | | $ | 281.11 | | | 638 | | | $ | 232.15 | |
There are approximately 1411 thousand performance-based sharesstock units and 1517 thousand restricted stock sharesunits that are non-vested at December 31, 20212023 which will be settled in cash due to foreign regulatory limitations. The liability related to these grants reflects the current estimate of performance that will be achieved and the current share price.
As of December 31, 2021, $472023, $48 million of unrecognized compensation cost related to performance-based awards and $31$42 million of unrecognized compensation cost related to the restricted stock unit awards is expected to be recognized primarily through the first quarter of 2024.2026.
NOTE 16. RETIREMENT PROGRAMS
Defined Benefit Pension Plans - U.S.
The Linde retirement plans are non-contributory defined benefit plans covering eligible employees and its participating affiliates. Effective July 1, 2002, the Linde U.S. Pension Plan was amended to give participating employees a one-time irrevocable choice between a traditional benefit (the “Traditional Design”) and an account-based benefit (the “Account-Based Design”). The Traditional Design pays a monthly benefit based on years of service and average pay during the last years of the participant’s career with Linde. The Account-Based Design gives participants annual pay credits equal to 4% of eligible compensation, plus interest credits based on long-term treasury rates on the accumulated account balance. This new formula applies to all new employees hired after April 30, 2002 into businesses adopting this plan. The U.S. pension plan assets are comprised of a diversified mix of investments, including corporate equities, government securities and corporate debt securities. Linde has several plans that provide supplementary retirement benefits primarily to higher level employees that are unfunded and are nonqualified for federal tax purposes. Pension coverage for employees of certain of Linde’s non-U.S. subsidiaries generally is provided by those companies through separate plans. Obligations under such plans are primarily provided for through diversified investment portfolios, with some smaller plans provided for under insurance policies or by book reserves.
Defined Benefit Pension Plans - Non-U.S.
Linde has Non-U.S., defined benefit commitments primarily in Germany and the U.K that include pension plan assets comprised of a diversified mix of investments. The defined benefit commitments in Germany relate to old age pensions, invalidity pensions and surviving dependents pensions. These commitments also take into account vested rights for periods of service prior to January 1, 2002 based on earlier final-salary pension plan rules. In addition, there are direct commitments in respect of the salary conversion scheme for the form of cash balance plans. The resulting pension payments are calculated on the basis of an interest guarantee and the performance of the corresponding investment. There are no minimum funding requirements. The pension obligations in Germany are partly funded by a Contractual Trust Agreement (CTA). Defined benefit commitments in the U.K. prior to July 1, 2003 are earnings-related and dependent on the period of service. Such commitments relate to old age pensions, invalidity pensions and surviving dependents pensions. Beginning in April 1, 2011, the amount of future increases in inflation-linked pensions and of increases in pensionable emoluments was restricted.
Multi-employer Pension Plans
In the United States Linde participates in 8eight multi-employer defined benefit pension plans ("MEPs"), pursuant to the terms of collective bargaining agreements, that cover approximately 200 union-represented employees. The collective
bargaining agreements expire on different dates through 2026.2028. In connection with such agreements, the company is required to make periodic contributions to the MEPs in accordance with the terms of the respective collective bargaining agreements. Linde’s participation in these plans is not material either at the plan level or in the aggregate. For all MEPs, Linde’s contributions were significantly less than 1% of the total contributions to each plan for 20202022 and 2019.2021. Total 20212023 contributions were not yet available from the MEPs.
Linde has obtained the most recently available Pension Protection Act ("PPA") annual funding notices from the Trustees of the MEPs. As of December 31, 2021,2023, there were 4two Red Zone plans, deemed to be in "critical" or "critical and declining" status that have implemented financial improvement or rehabilitation plans. Linde does not currently anticipate significant future obligations due to the funding status of these plans and any such obligation would be immaterial. If Linde determined it was probable that it would withdraw from an MEP, the company would record a liability for its portion of the MEP’s unfunded pension obligations, as calculated at that time. Historically, such withdrawal payments have not been significant.
Defined Contribution Plans
Linde’s U.S. employees are eligible to participate in defined contribution savings plans offered by their applicable business. Employee contribution percentages vary by plan and are subject to the maximum allowable by IRS regulations.Theregulations. The cost for these defined contribution plans was $59 million in 2023, $56 million in 2022 and $51 million in 2021 $46 million in 2020 and $47 million in 2019 (these costs are not included in the tables that follow).
The defined contribution plans include a non-leveraged employee stock ownership plan ("ESOP") which covers all employees participating in this plan. The collective number of shares of Linde ordinary shares in the ESOP totaled 1,761,6081,660,694 at December 31, 2021.2023.
Certain non-U.S. subsidiaries of the company also sponsor defined contribution plans where contributions are determined under various formulas. The expense for these plans was $60 million in 2023, $80 million in 2022 and $101 million in 2021 $106 million in 2020 and $95 million in 2019 (these expenses are not included in the tables that follow).
Postretirement Benefits Other Than Pensions (OPEB)
Linde provides health care and life insurance benefits to certain eligible retired employees. These benefits are provided through various insurance companies and healthcare providers. The company does not currently fund its postretirement benefits obligations. Linde’s retiree plans may be changed or terminated by Linde at any time for any reason with no liability to current or future retirees.
Linde uses a measurement date of December 31 for its pension and other post-retirement benefit plans.
Pension and Postretirement Benefit Costs
The components of net pension and postretirement benefits other than pension ("OPEB") costs for 2021, 20202023, 2022 and 20192021 are shown in the table below:
| (Millions of dollars) Year Ended December 31, | Pensions | | OPEB |
| 2021 | | 2020 | | 2019 | | 2021 | | 2020 | | 2019 |
| (Millions of dollars) | | (Millions of dollars) | Year Ended December 31, |
| 2023 | | 2022 | | 2021 |
| Amount recognized in Operating Profit | Amount recognized in Operating Profit | | | | | | | | | | | |
| Service cost | |
| Service cost | |
| Service cost | Service cost | $ | 155 | | | $ | 150 | | | $ | 142 | | | $ | 2 | | | $ | 2 | | | $ | 2 | |
| Amount recognized in Net pension and OPEB cost (benefit), excluding service cost | Amount recognized in Net pension and OPEB cost (benefit), excluding service cost | |
| Interest cost | Interest cost | 151 | | | 208 | | | 261 | | | 3 | | | 5 | | | 7 | |
| Interest cost | |
| Interest cost | |
| Expected return on plan assets | Expected return on plan assets | (521) | | | (482) | | | (462) | | | — | | | — | | | — | |
| Net amortization and deferral | Net amortization and deferral | 176 | | | 90 | | | 61 | | | (5) | | | (4) | | | (4) | |
| Curtailment and termination benefits (a) | — | | | — | | | 8 | | | — | | | — | | | — | |
| Settlement charges (b) | 4 | | | 6 | | | 97 | | | — | | | — | | | — | |
| | $ | (190) | | | $ | (178) | | | $ | (35) | | | $ | (2) | | | $ | 1 | | | $ | 3 | |
| Settlement charges (a) | |
| Settlement charges (a) | |
| Settlement charges (a) | |
| $ | |
| | Net periodic benefit cost (benefit) | Net periodic benefit cost (benefit) | $ | (35) | | | $ | (28) | | | $ | 107 | | | $ | — | | | $ | 3 | | | $ | 5 | |
| Net periodic benefit cost (benefit) | |
| Net periodic benefit cost (benefit) | |
(a) In 2019, Linde recorded curtailment gains of $9 million and a charge of $17 million for termination benefits, primarily in connection with a defined benefit pension plan freeze.
(b) Linde recorded a pension settlement charge of $4 million and $6 million during the third quarter of 2021 and 2020, respectively. Settlement charges were triggered by lump sum benefit payments made from a U.S. non-qualified plan.payments.
Funded Status
In the first quarter of 2019, benefits of $91 million were paid related to the settlement of a U.S. non-qualified plan. Such benefits were triggered by a change in control provision and resulted in a settlement charge of $51 million. In the third and fourth quarters of 2019, Linde recorded pension settlement charges of $40 million and $6 million, respectively, related to lump sum payments made from a U.S. qualified plan. These payments were triggered by merger-related divestitures.
Funded Status
Changes in the benefit obligation and plan assets for Linde’s pension and OPEB programs, including reconciliation of the funded status of the plans to amounts recorded in the consolidated balance sheet, as of December 31, 20212023 and 20202022 are shown below.
| | | | | | | | | | | | | | | | | | | | | | | |
| (Millions of dollars) | Year Ended December 31, |
| 2023 | | 2022 |
| U.S. | | Non-U.S. | | U.S. | | Non-U.S. |
| Change in Benefit Obligation ("PBO") | | | | | | | |
| Benefit obligation, January 1 | $ | 2,129 | | | $ | 5,586 | | | $ | 2,719 | | | $ | 9,398 | |
| Service cost | 25 | | | 59 | | | 34 | | | 93 | |
| Interest cost | 105 | | | 268 | | | 60 | | | 141 | |
| | | | | | | |
| Participant contributions | 11 | | | 18 | | | 11 | | | 17 | |
| | | | | | | |
| Actuarial loss (gain) | 100 | | | 532 | | | (528) | | | (2,972) | |
| Benefits paid | (162) | | | (324) | | | (158) | | | (296) | |
| Plan settlement | (21) | | | (14) | | | (9) | | | (8) | |
| | | | | | | |
| Foreign currency translation and other changes | — | | | 260 | | | — | | | (787) | |
| Benefit obligation, December 31 | $ | 2,187 | | | $ | 6,385 | | | $ | 2,129 | | | $ | 5,586 | |
| Accumulated benefit obligation ("ABO") | $ | 2,037 | | | $ | 6,300 | | | $ | 1,982 | | | $ | 5,508 | |
| Change in Plan Assets | | | | | | | |
| Fair value of plan assets, January 1 | $ | 1,891 | | | $ | 5,794 | | | $ | 2,448 | | | $ | 7,968 | |
| Actual return on plan assets | 300 | | | 365 | | | (421) | | | (1,302) | |
| Company contributions | — | | | 46 | | | — | | | 51 | |
| Participant contributions | — | | | 18 | | | — | | | 17 | |
| Benefits paid from plan assets | (141) | | | (320) | | | (136) | | | (248) | |
| | | | | | | |
| Foreign currency translation and other changes | — | | | 275 | | | — | | | (692) | |
| Fair value of plan assets, December 31 | $ | 2,050 | | | $ | 6,178 | | | $ | 1,891 | | | $ | 5,794 | |
| Funded Status, End of Year | $ | (137) | | | $ | (207) | | | $ | (238) | | | $ | 208 | |
| Recorded in the Balance Sheet (Note 7) | | | | | | | |
| Other long-term assets | $ | 19 | | | $ | 361 | | | $ | 13 | | | $ | 648 | |
| Other current liabilities | (17) | | | (14) | | | (38) | | | (13) | |
| Other long-term liabilities | (139) | | | (554) | | | (213) | | | (427) | |
| Net amount recognized, December 31 | $ | (137) | | | $ | (207) | | | $ | (238) | | | $ | 208 | |
| Amounts recognized in accumulated other comprehensive income (loss) consist of: | | | | | | | |
| Net actuarial loss (gain) | $ | 290 | | | $ | 219 | | | $ | 357 | | | $ | (343) | |
| Prior service cost (credit) | (10) | | | 1 | | | (12) | | | 4 | |
| Deferred tax obligation (benefit) (Note 7) | (67) | | | 7 | | | (85) | | | 139 | |
| Amount recognized in accumulated other comprehensive income (loss) (Note 7) | $ | 213 | | | $ | 227 | | | $ | 260 | | | $ | (200) | |
| | | | | | | | | | | | | | | | | | | | | | | | | | | | | | | | | | | |
(Millions of dollars) Year Ended December 31, | Pensions | | |
| 2021 | | 2020 | | OPEB |
| U.S. | | Non-U.S. | | U.S. | | Non-U.S. | | 2021 | | 2020 |
| Change in Benefit Obligation ("PBO") | | | | | | | | | | | |
| Benefit obligation, January 1 | $ | 2,746 | | | $ | 9,987 | | | $ | 2,552 | | | $ | 8,689 | | | $ | 172 | | | $ | 192 | |
| Service cost | 37 | | | 118 | | | 37 | | | 113 | | | 2 | | | 2 | |
| Interest cost | 46 | | | 105 | | | 68 | | | 140 | | | 3 | | | 5 | |
| Divestitures | — | | | (13) | | | — | | | — | | | — | | | — | |
| Participant contributions | — | | | 19 | | | — | | | 18 | | | 11 | | | 11 | |
| Plan amendment | — | | | — | | | — | | | 7 | | | — | | | (13) | |
| Actuarial loss (gain) | (94) | | | (209) | | | 250 | | | 893 | | | (8) | | | (2) | |
| Benefits paid | (145) | | | (331) | | | (152) | | | (320) | | | (23) | | | (22) | |
| Plan settlement | (7) | | | (13) | | | (9) | | | (14) | | | — | | | — | |
| Plan curtailment | — | | | — | | | — | | | (1) | | | — | | | — | |
| Foreign currency translation and other changes | — | | | (286) | | | — | | | 462 | | | — | | | (1) | |
| Benefit obligation, December 31 | $ | 2,583 | | | $ | 9,377 | | | $ | 2,746 | | | $ | 9,987 | | | $ | 157 | | | $ | 172 | |
| Accumulated benefit obligation ("ABO") | $ | 2,503 | | | $ | 9,278 | | | $ | 2,646 | | | $ | 9,830 | | | | | |
| Change in Plan Assets | | | | | | | | | | | |
| Fair value of plan assets, January 1 | $ | 2,310 | | | $ | 7,653 | | | $ | 2,048 | | | $ | 6,888 | | | $ | — | | | $ | — | |
| Actual return on plan assets | 281 | | | 728 | | | 386 | | | 641 | | | — | | | — | |
| Company contributions | 0 | | 42 | | | 25 | | | 66 | | | — | | | — | |
| Participant contributions | — | | | 19 | | | — | | | 18 | | | — | | | — | |
| Benefits paid from plan assets | (143) | | | (272) | | | (149) | | | (267) | | | — | | | — | |
| Divestitures | — | | | (14) | | | — | | | — | | | — | | | — | |
| Foreign currency translation and other changes | — | | | (188) | | | — | | | 307 | | | — | | | — | |
| Fair value of plan assets, December 31 | $ | 2,448 | | | $ | 7,968 | | | $ | 2,310 | | | $ | 7,653 | | | $ | — | | | $ | — | |
| Funded Status, End of Year | $ | (135) | | | $ | (1,409) | | | $ | (436) | | | $ | (2,334) | | | $ | (157) | | | $ | (172) | |
| Recorded in the Balance Sheet (Note 7) | | | | | | | | | | | |
| Other long-term assets | $ | 15 | | | $ | 124 | | | $ | 2 | | | $ | 53 | | | $ | — | | | $ | — | |
| Other current liabilities | (12) | | | (12) | | | (9) | | | (13) | | | (14) | | | (12) | |
| Other long-term liabilities | (138) | | | (1,521) | | | (429) | | | (2,374) | | | (143) | | | (160) | |
| Net amount recognized, December 31 | $ | (135) | | | $ | (1,409) | | | $ | (436) | | | $ | (2,334) | | | $ | (157) | | | $ | (172) | |
| Amounts recognized in accumulated other comprehensive income (loss) consist of: | | | | | | | | | | | |
| Net actuarial loss (gain) | $ | 383 | | | $ | 1,075 | | | $ | 687 | | | $ | 1,766 | | | $ | (16) | | | $ | (11) | |
| Prior service cost (credit) | — | | | 6 | | | — | | | 9 | | | (13) | | | (15) | |
| Deferred tax benefit (Note 7) | (96) | | | (217) | | | (182) | | | (383) | | | 8 | | | 5 | |
| Amount recognized in accumulated other comprehensive income (loss) (Note 7) | $ | 287 | | | $ | 864 | | | $ | 505 | | | $ | 1,392 | | | $ | (21) | | | $ | (21) | |
Comparative funded status information as of December 31, 20212023 and 20202022 for select non-U.S. pension plans is presented in the table below as the benefit obligations of these plans are considered to be significant relative to the total benefit obligation:
| | | | United Kingdom | | Germany | | Other Non-U.S. | | Total Non-U.S. | | United Kingdom | | Germany | | Other Non-U.S. | | Total Non-U.S. |
| (Millions of dollars) | (Millions of dollars) | 2021 | | 2021 | | 2021 | | 2021 | (Millions of dollars) | 2023 | | 2023 |
| Benefit obligation, December 31 | Benefit obligation, December 31 | $ | 5,879 | | | $ | 2,240 | | | $ | 1,258 | | | $ | 9,377 | |
| Fair value of plan assets, December 31 | Fair value of plan assets, December 31 | 5,577 | | | 1,359 | | | 1,032 | | | 7,968 | |
| Funded Status, End of Year | Funded Status, End of Year | $ | (302) | | | $ | (881) | | | $ | (226) | | | $ | (1,409) | |
| | | | United Kingdom | | Germany | | Other Non-U.S. | | Total Non-U.S. |
| | |
| | | United Kingdom | | Germany | | Other Non-U.S. | | Total Non-U.S. |
| (Millions of dollars) | (Millions of dollars) | 2020 | | 2020 | | 2020 | | 2020 | (Millions of dollars) | 2022 | | 2022 | | 2022 |
| Benefit obligation, December 31 | Benefit obligation, December 31 | $ | 6,012 | | | $ | 2,582 | | | $ | 1,393 | | | $ | 9,987 | |
| Fair value of plan assets, December 31 | Fair value of plan assets, December 31 | 5,355 | | | 1,258 | | | 1,040 | | | 7,653 | |
| Funded Status, End of Year | Funded Status, End of Year | $ | (657) | | | $ | (1,324) | | | $ | (353) | | | $ | (2,334) | |
The changes in plan assets and benefit obligations recognized in other comprehensive income in 20212023 and 20202022 are as follows:
| | | | Pensions | | OPEB | | Pensions |
| (Millions of dollars) | (Millions of dollars) | 2021 | | 2020 | | 2021 | | 2020 | (Millions of dollars) | 2023 | | 2022 |
| Current year net actuarial losses (gains)* | Current year net actuarial losses (gains)* | $ | (779) | | | $ | 598 | | | $ | (8) | | | $ | (2) | |
| Amortization of net actuarial gains (losses) | Amortization of net actuarial gains (losses) | (173) | | | (89) | | | 3 | | | 2 | |
| | Plan amendment | — | | | 7 | | | — | | | (13) | |
| | Amortization of prior service credits (costs) | |
| | Amortization of prior service credits (costs) | |
| | Amortization of prior service credits (costs) | Amortization of prior service credits (costs) | (3) | | | (1) | | | 2 | | | 2 | |
| Pension settlements | Pension settlements | (4) | | | (6) | | | — | | | — | |
| Curtailments | — | | | (1) | | | — | | | — | |
| | Foreign currency translation and other changes | |
| Foreign currency translation and other changes | |
| Foreign currency translation and other changes | Foreign currency translation and other changes | (39) | | | 87 | | | — | | | (1) | |
| Total recognized in other comprehensive income | Total recognized in other comprehensive income | $ | (998) | | | $ | 595 | | | $ | (3) | | | $ | (12) | |
________________________
* Pension net actuarial gainslosses in 20212023 are largely driven by an increasethe decrease in the actual return on assets during the year and favorability generated from a lower PBO due to an increase in discount rates. In 2020, the low discount rate environment resultedresulting in actuarial losses from a higher PBO, and outweighedwhich is partially offset by favorable plan asset experience for non-U.S plans. The U.S. plan derived a benefit from the actual return on plan assets. In 2022, the actuarial gains were largely driven by the significant increase in the discount rate environment resulting in actuarial gains from a lower PBO, which is partially offset by unfavorable plan asset experience for both the non-U.S. and U.S. plans.
The following table provides information for pension plans where the accumulated benefit obligation exceeds the fair value of plan assets:
| (Millions of dollars) Year Ended December 31, | (Millions of dollars) Year Ended December 31, | Pensions | (Millions of dollars) Year Ended December 31, | Pensions |
| 2021 | | 2020 | 2023 | | 2022 |
| U.S. | | Non-U.S. | | U.S. | | Non-U.S. | U.S. | | Non-U.S. | | U.S. | | Non-U.S. |
| Accumulated benefit obligation ("ABO") | Accumulated benefit obligation ("ABO") | $ | 2,387 | | | $ | 8,404 | | | $ | 2,518 | | | $ | 8,694 | |
| Fair value of plan assets | Fair value of plan assets | $ | 2,317 | | | $ | 6,947 | | | $ | 2,180 | | | $ | 6,254 | |
The following table provides information for pension plans where the projected benefit obligation exceeds the fair value of plan assets:
| (Millions of dollars) Year Ended December 31, | (Millions of dollars) Year Ended December 31, | Pensions | (Millions of dollars) Year Ended December 31, | Pensions |
| 2021 | | 2020 | 2023 | | 2022 |
| U.S. | | Non-U.S. | | U.S. | | Non-U.S. | U.S. | | Non-U.S. | | U.S. | | Non-U.S. |
| Projected benefit obligation ("PBO") | Projected benefit obligation ("PBO") | $ | 2,467 | | | $ | 8,499 | | | $ | 2,618 | | | $ | 8,845 | |
| Fair value of plan assets | Fair value of plan assets | $ | 2,317 | | | $ | 6,964 | | | $ | 2,180 | | | $ | 6,282 | |
Assumptions
The assumptions used to determine benefit obligations are as of the respective balance sheet dates and the assumptions used to determine net benefit cost are as of the previous year-end, as shown below:
| | | | Pensions | | | | | | Pensions |
| | | U.S. | | Non-U.S. | | OPEB | | U.S. | | Non-U.S. |
| | | 2021 | | 2020 | | 2021 | | 2020 | | 2021 | | 2020 | | 2023 | | 2022 | | 2023 | | 2022 |
| Weighted average assumptions used to determine benefit obligations at December 31, | Weighted average assumptions used to determine benefit obligations at December 31, | | | | | | | | | | | |
| Discount rate | Discount rate | 2.78 | % | | 2.40 | % | | 1.82 | % | | 1.36 | % | | 2.85 | % | | 2.39 | % |
| Discount rate | |
| Discount rate | | 5.03 | % | | 5.35 | % | | 4.27 | % | | 4.58 | % |
| Interest crediting rate | Interest crediting rate | 2.06 | % | | 1.57 | % | | 1.03 | % | | 1.01 | % | | N/A | | N/A | Interest crediting rate | 4.03 | % | | 4.02 | % | | 1.70 | % | | 2.13 | % |
| Rate of increase in compensation levels | Rate of increase in compensation levels | 3.25 | % | | 3.25 | % | | 2.55 | % | | 2.55 | % | | N/A | | N/A | Rate of increase in compensation levels | 3.50 | % | | 3.25 | % | | 2.58 | % | | 2.59 | % |
| Weighted average assumptions used to determine net periodic benefit cost for years ended December 31, | Weighted average assumptions used to determine net periodic benefit cost for years ended December 31, | |
| Discount rate | Discount rate | 2.40 | % | | 3.20 | % | | 1.36 | % | | 1.91 | % | | 2.39 | % | | 3.19 | % |
| Discount rate | |
| Discount rate | | 5.35 | % | | 2.78 | % | | 4.58 | % | | 1.82 | % |
| Interest crediting rate | Interest crediting rate | 1.57 | % | | 2.19 | % | | 1.01 | % | | 1.08 | % | | N/A | | N/A | Interest crediting rate | 4.02 | % | | 2.06 | % | | 2.13 | % | | 1.03 | % |
| Rate of increase in compensation levels | Rate of increase in compensation levels | 3.25 | % | | 3.25 | % | | 2.55 | % | | 2.46 | % | | N/A | | N/A | Rate of increase in compensation levels | 3.25 | % | | 3.25 | % | | 2.59 | % | | 2.55 | % |
| Expected long-term rate of return on plan assets (1) | Expected long-term rate of return on plan assets (1) | 7.00 | % | | 7.00 | % | | 5.28 | % | | 5.31 | % | | N/A | | N/A | Expected long-term rate of return on plan assets (1) | 7.00 | % | | 7.00 | % | | 5.64 | % | | 5.60 | % |
________________________
(1) The expected long term rate of return on the U.S. and non-U.S. plan assets is estimated based on the plans' investment strategy and asset allocation, historical capital market performance and, to a lesser extent, historical plan performance. For the U.S. plans, the expected rate of return of 7.00% was derived based on the target asset allocation of 40%-60%50%-70% equity securities (approximately 7.7%8.40% expected return), 30%20%-50% fixed income securities (approximately 5.4%4.80% expected return) and 5%-15%2%-8% alternative investments (approximately 6.3%3.40% expected return). For the non-U.S. plans, the expected rate of return was derived based on the weighted average target asset allocation of 15%-25% equity securities (approximately 6.4%7.20% expected return), 30%-50% fixed income securities (approximately 5.2%5.90% expected return), and 30%-50% alternative investments (approximately 5%5.80% expected return). For the U.S. plan assets, the actual annualized total return for the most recent 10-year period ended December 31, 20212023 was approximately 10.8%6.60%. For the non-U.S. plan assets, the actual annualized total return for the same period was approximately 9.0%4.90%. Changes to plan asset allocations and investment strategy over this time period limit the value of historical plan performance as a factor in estimating the expected long term rate of return. For 2022,2024, the expected long-term rate of return on plan assets will be 7.00% for the U.S. plans. For 2022, the expected weighted average long-term rate of returnplans and 5.83%. for non-U.S. plans will be 5.54%.plans.
| | | | | | | | | | | |
| | OPEB |
| Assumed healthcare cost trend rates | 2021 | | 2020 |
| Healthcare cost trend assumed | 7.00 | % | | 6.50 | % |
| Rate to which the cost trend rate is assumed to decline (the ultimate trend rate) | 5.00 | % | | 5.00 | % |
| Year that the rate reaches the ultimate trend rate | 2030 | | 2027 |
Pension Plan Assets
The investments of the U.S. pension plan are managed to meet the future expected benefit liabilities of the plan over the long term by investing in diversified portfolios consistent with prudent diversification and historical and expected capital market returns. Investment strategies are reviewed by management and investment performance is tracked against appropriate benchmarks. There are no concentrations of risk as it relates to the assets within the plans. The non-U.S. pension plans are managed individually based on diversified investment portfolios, with different target asset allocations that vary for each plan. Weighted-average asset allocations at December 31, 20212023 and 20202022 for Linde’s U.S. and non-U.S. pension plans, as well as respective asset allocation ranges by major asset category, are generally as follows:
| | | | U.S. | | Non-U.S. | | U.S. | | Non-U.S. |
| Asset Category | Asset Category | Target 2021 | | Target 2020 | | 2021 | | 2020 | | Target 2021 | | Target 2020 | | 2021 | | 2020 | Asset Category | Target 2023 | | Target 2022 | | 2023 | | 2022 | | Target 2023 | | Target 2022 | | 2023 | | 2022 |
| Equity securities | Equity securities | 40%-60% | | 40%-60% | | 66 | % | | 66 | % | | 15%-25% | | 15%-25% | | 27 | % | | 27 | % | Equity securities | 50% | - | 70% | | 50% | - | 70% | | 59% | | 60% | | 15% | - | 25% | | 15% | - | 25% | | 22% | | 20% |
| Fixed income securities | Fixed income securities | 30%-50% | | 30%-50% | | 25 | % | | 27 | % | | 30%-50% | | 30%-50% | | 35 | % | | 34 | % | Fixed income securities | 20% | - | 50% | | 20% | - | 50% | | 31% | | 29% | | 30% | - | 50% | | 30% | - | 50% | | 30% |
| Other | Other | 5%-15% | | 5%-15% | | 9 | % | | 7 | % | | 30%-50% | | 30%-50% | | 38 | % | | 39 | % | Other | 2% | - | 8% | | 2% | - | 8% | | 10% | | 11% | | 30% | - | 50% | | 30% | - | 50% | | 48% | | 50% |
The following table summarizes pension assets measured at fair value by asset category at December 31, 20212023 and 2020. For the twelve months ended December 31, 2021, transfers2022. Transfers of assets were not material. Formaterial for the twelve monthsyear ended December 31, 2020, transfers of assets of $15 million into Level 3 include insurance contract2023 and real estate investments of $11 million and $4 million, respectively, which were reclassified as there is no active market quotation available.2022. See Note 13 for the definition of levels within the fair value hierarchy:
| | | | Fair Value Measurements Using | | | | | | Fair Value Measurements Using | | |
| | | Level 1 | | Level 2 | | Level 3 ** | | Total | | Level 1 | | Level 2 | | Level 3 ** | | Total |
| (Millions of dollars) | (Millions of dollars) | 2021 | | 2020 | | 2021 | | 2020 | | 2021 | | 2020 | | 2021 | | 2020 | (Millions of dollars) | 2023 | | 2022 | | 2023 | | 2022 | | 2023 | | 2022 | | 2023 | | 2022 |
| Cash and cash equivalents | Cash and cash equivalents | $ | 259 | | | $ | 524 | | | $ | — | | | $ | — | | | $ | — | | | $ | — | | | $ | 259 | | | $ | 524 | |
| Equity securities: | Equity securities: | |
| Global equities | Global equities | 1,633 | | | 1,974 | | | — | | | — | | | — | | | — | | | 1,633 | | | 1,974 | |
| Global equities | |
| Global equities | |
| | Mutual funds | Mutual funds | 314 | | | 324 | | | — | | | — | | | — | | | — | | | 314 | | | 324 | |
| Mutual funds | |
| Mutual funds | |
| Fixed income securities: | Fixed income securities: | |
| Government bonds | |
| Government bonds | |
| Government bonds | Government bonds | — | | | — | | | 1,624 | | | 1,545 | | | — | | | — | | | 1,624 | | | 1,545 | |
| Emerging market debt | Emerging market debt | — | | | — | | | 509 | | | 520 | | | — | | | — | | | 509 | | | 520 | |
| Mutual funds | Mutual funds | 121 | | | 123 | | | 12 | | | 12 | | | — | | | — | | | 133 | | | 135 | |
| Corporate bonds | Corporate bonds | — | | | — | | | 647 | | | 573 | | | — | | | — | | | 647 | | | 573 | |
| Bank loans | Bank loans | — | | | — | | | 253 | | | 242 | | | — | | | — | | | 253 | | | 242 | |
| Alternative investments: | Alternative investments: | |
| Real estate funds | |
| Real estate funds | |
| Real estate funds | Real estate funds | — | | | — | | | — | | | — | | | 360 | | | 335 | | | 360 | | | 335 | |
| Private debt | Private debt | — | | | — | | | — | | | 0 | | 1,368 | | | 1,120 | | | 1,368 | | | 1,120 | |
| Insurance contracts | Insurance contracts | — | | | — | | | — | | | — | | | 12 | | | 11 | | | 12 | | | 11 | |
| Liquid alternative | Liquid alternative | — | | | — | | | 1,193 | | | 1,083 | | | — | | | — | | | 1,193 | | | 1,083 | |
| Other investments | Other investments | 1 | | | — | | | 58 | | | 60 | | | — | | | — | | | 59 | | | 60 | |
Total plan assets at fair value,
December 31, | Total plan assets at fair value,
December 31, | $ | 2,328 | | | $ | 2,945 | | | $ | 4,296 | | | $ | 4,035 | | | $ | 1,740 | | | $ | 1,466 | | | $ | 8,364 | | | $ | 8,446 | |
| Pooled funds * | Pooled funds * | | | | | | | | | | | | | 2,052 | | | 1,517 | |
Total fair value plan assets
December 31, | Total fair value plan assets
December 31, | | $ | 10,416 | | | $ | 9,963 | |
* Pooled funds are measured using the net asset value ("NAV") as a practical expedient for fair value as permissible under the accounting standard for fair value measurements and have not been categorized in the fair value hierarchy.
** The following table summarizes changes in fair value of the pension plan assets classified as level 3 for the periods ended December 31, 20212023 and 2020:2022:
| | | | | | | | | | | | | | | | | | | | | | | |
| (Millions of dollars) | Insurance Contracts | | Real Estate Funds | | Private Debt | | Total |
| Balance, December 31, 2019 | $ | — | | | $ | 316 | | | $ | 1003 | | | $ | 1319 | |
| Gain/(Loss) for the period | — | | | (10) | | | 4 | | | (6) | |
| | | | | | | |
| Purchases | — | | | 21 | | | 137 | | | 158 | |
| Sales | — | | | (10) | | | (69) | | | (79) | |
| Transfer into/ (out of) Level 3 | 11 | | | 4 | | | — | | | 15 | |
| Foreign currency translation | — | | | 14 | | | 45 | | | 59 | |
| Balance, December 31, 2020 | 11 | | | 335 | | | 1,120 | | | 1,466 | |
| Gain/(Loss) for the period | 1 | | | 27 | | | 28 | | | 56 | |
| | | | | | | |
| Purchases | — | | | 13 | | | 289 | | | 302 | |
| Sales | — | | | (4) | | | (42) | | | (46) | |
| Transfer into / (out of) Level 3 | 1 | | | (1) | | | — | | | — | |
| Foreign currency translation | (1) | | | (10) | | | (27) | | | (38) | |
| Balance, December 31, 2021 | $ | 12 | | | $ | 360 | | | $ | 1,368 | | | $ | 1,740 | |
| | | | | | | | | | | | | | | | | | | | | | | |
| (Millions of dollars) | Insurance Contracts | | Real Estate Funds | | Private Debt | | Total |
| Balance, December 31, 2021 | $ | 12 | | | $ | 360 | | | $ | 1,368 | | | $ | 1,740 | |
| Gain/(Loss) for the period | — | | | 5 | | | 93 | | | 98 | |
| | | | | | | |
| Purchases | 2 | | | 18 | | | 63 | | | 83 | |
| Sales | — | | | (22) | | | (34) | | | (56) | |
| Transfer into/ (out of) Level 3 | 33 | | | — | | | — | | | 33 | |
| Foreign currency translation | (1) | | | (8) | | | (130) | | | (139) | |
| Balance, December 31, 2022 | 46 | | | 353 | | | 1,360 | | | 1,759 | |
| Gain/(Loss) for the period | — | | | (27) | | | (38) | | | (65) | |
| | | | | | | |
| Purchases | 1 | | | 3 | | | 1 | | | 5 | |
| Sales | — | | | (15) | | | (44) | | | (59) | |
| Transfer into / (out of) Level 3 | — | | | — | | | — | | | — | |
| Foreign currency translation | 4 | | | 10 | | | 66 | | | 80 | |
| Balance, December 31, 2023 | $ | 51 | | | $ | 324 | | | $ | 1,345 | | | $ | 1,720 | |
The descriptions and fair value methodologies for the company's pension plan assets are as follows:
Cash and Cash Equivalents – This category includes cash and short-term interest bearing investments with maturities of three months or less. Investments are valued at cost plus accrued interest. Cash and cash equivalents are classified within level 1 of the valuation hierarchy.
Equity Securities – This category is comprised of shares of common stock in U.S. and non-U.S. companies from a diverse set of industries and size. Common stock is valued at the closing market price reported on a U.S. or non-U.S. exchange where the security is actively traded. Equity securities are classified within level 1 of the valuation hierarchy.
Mutual Funds – These categories consist of publicly and privately managed funds that invest primarily in marketable equity and fixed income securities. The fair value of these investments is determined by reference to the net asset value of the underlying securities of the fund. Shares of publicly traded mutual funds are valued at the net asset value quoted on the exchange where the fund is traded and are primarily classified as level 1 within the valuation hierarchy.
Emerging Market Debt - This category includes fixed income debt issued by countries with developing economies as well as by corporations within those nations. They typically have higher yields but lower credit ratings relative to developed country corporate and government bonds. The fair values for these investments are classified as level 2 within the valuation hierarchy.
U.S. and Non-U.S. Government Bonds – This category includes U.S. treasuries, U.S. federal agency obligations and non-U.S. government debt. The majority of these investments do not have quoted market prices available for a specific government security and so the fair value is determined using quoted prices of similar securities in active markets and is classified as level 2 within the valuation hierarchy.
Corporate Bonds – This category is comprised of corporate bonds of U.S. and non-U.S. companies from a diverse set of industries and size. The fair values for U.S. and non-U.S. corporate bonds are determined using quoted prices of similar securities in active markets and observable data or broker or dealer quotations. The fair values for these investments are classified as level 2 within the valuation hierarchy.
Pooled Funds - Pooled fund NAVs are provided by the trustee and are determined by reference to the fair value of the underlying securities of the trust, less its liabilities, which are valued primarily through the use of directly or indirectly observable inputs. Depending on the pooled fund, underlying securities may include marketable equity securities or fixed income securities.
Bank Loans - This category is comprised of traded syndicated loans of larger corporate borrowers. Such loans are issued by sub-investment grade rated companies both in the U.S. and internationally and are syndicated by investment banks to institutional investors. They are regularly traded in an active dealer market comprised of large investment banks, which supply bid and offer quotes and are therefore classified within level 2 of the valuation hierarchy.
Liquid Alternative Investments - This category is comprised of investments in alternative mutual funds whose holdings include liquid securities, cash, and derivatives. Such funds focus on diversification and employ a variety of investing strategies including long/short equity, multi-strategy, and global macro. The fair value of these investments is determined by reference to the net asset value of the underlying holdings of the fund, which can be determined using
observable data (e.g., indices, yield curves, quoted prices of similar securities), and is classified within level 2 of the valuation hierarchy.
Insurance Contracts – This category is comprised of purchased annuity insurance contracts (annuity contract buy-ins) and is intended to mitigate the Company's exposure to certain risks, such as longevity risk. The fair value is calculated based on the cash surrender value of the purchased annuity insurance contract, which is determined based on such factors as the fair value of the underlying assets and discounted cash flows. These contracts are with highly rated insurance companies. Insurance contracts are classified within level 3 of the valuation hierarchy.
Real Estate Funds – This category includes real estate properties, partnership equities and investments in operating companies. The fair value of the assets is determined using discounted cash flows by estimating an income stream for the property plus a reversion into a present value at a risk adjusted rate. Yield rates and growth assumptions utilized are derived from market transactions as well as other financial and industry data. The fair value for these investments are classified within level 3 of the valuation hierarchy.
Private Debt - This category includes non-traded, privately-arranged loans between one or a small group of private debt investment managers and corporate borrowers, which are typically too small to access the syndicated market and have no credit rating. This category also includes similar loans to real estate companies or individual properties. Loans included in this category are valued at par value, are held to maturity or to call, and are classified within level 3 of the valuation hierarchy.
Contributions
At a minimum, Linde contributes to its pension plans to comply with local regulatory requirements (e.g., ERISA in the United States). Discretionary contributions in excess of the local minimum requirements are made based on many factors, including long-term projections of the plans' funded status, the economic environment, potential risk of overfunding, pension insurance costs and alternative uses of the cash. Changes to these factors can impact the timing of discretionary contributions from year to year. Pension contributions were $46 million in 2023, $51 million in 2022 and $42 million in 2021, $91 million in 2020 and $94 million in 2019.2021. Estimated required contributions for 20222024 are currently expected to be in the range of $40$35 million to $50$45 million.
Estimated Future Benefit Payments
The following table presents estimated future benefit payments, net of participant contributions:
| | (Millions of dollars) | (Millions of dollars) | Pensions | | | (Millions of dollars) | Pensions |
| Year Ended December 31, | Year Ended December 31, | U.S. | | Non-U.S. | | OPEB | Year Ended December 31, | U.S. | | Non-U.S. |
| 2022 | $ | 183 | | | $ | 348 | | | $ | 14 | |
| 2023 | 155 | | | 346 | | | 11 | |
| 2024 | 2024 | 149 | | | 357 | | | 11 | |
| 2025 | 2025 | 152 | | | 366 | | | 10 | |
| 2026 | 2026 | 150 | | | 388 | | | 9 | |
| 2027-2031 | 763 | | | 1,952 | | | 41 | |
| 2027 | |
| 2028 | |
| 2029-2033 | |
NOTE 17. COMMITMENTS AND CONTINGENCIES
The company accrues non income-tax liabilities for contingencies when management believes that a loss is probable and the amounts can be reasonably estimated, while contingent gains are recognized only when realized. In the event any losses are sustained in excess of accruals, they will be charged against income at that time. Attorney fees are recorded as incurred. Commitments represent obligations, such as those for future purchases of goods or services, that are not yet recorded on the company’s balance sheet as liabilities. The company records liabilities for commitments when incurred (i.e., when the goods or services are received).
Contingent Liabilities
Linde is subject to various lawsuits and government investigations that arise from time to time in the ordinary course of business. These actions are based upon alleged environmental, tax, antitrust and personal injury claims, among others. Linde has strong defenses in these cases and intends to defend itself vigorously. It is possible that the company may incur losses in connection with some of these actions in excess of accrued liabilities. Management does not anticipate that in the aggregate such losses would have a material adverse effect on the company’s consolidated financial position or liquidity; however, it is possible that the final outcomes could have a significant impact on the company’s reported results of operations in any given period.
Significant matters are:
•During 2009, the Brazilian government published Law 11941/2009 instituting a new voluntary amnesty program (“Refis Program”) which allowed Brazilian companies to settle certain federal tax disputes at reduced amounts. During 2009, the company decided that it was economically beneficial to settle many of its outstanding federal tax disputes and such disputes were enrolled in the Refis Program, subject to final calculation and review by the Brazilian federal government. The company recorded estimated liabilities based on the terms of the Refis Program. Since 2009, Linde has been unable to reach final agreement on the calculations and initiated litigation against the government in an attempt to resolve certain items. Open issues relate to the following matters: (i) application of cash deposits and net operating loss carryforwards to satisfy obligations and (ii) the amount of tax reductions available under the Refis Program. It is difficult to estimate the timing of resolution of legal matters in Brazil.
•At December 31, 20212023, the most significant non-income and income tax claims in Brazil, after enrollment in the Refis Program, relate to state VAT tax matters and a federal income tax matter where the taxing authorities are challenging the tax rate that should be applied to income generated by a subsidiary company.matters. The total estimated exposure relating to such claims, including interest and penalties, as appropriate, is approximately $200$115 million. Linde has not recorded any liabilities related to such claims based on management judgments, after considering judgmentsjudgment and opinions of outside counsel.
During the first quarter of 2023, the Brazilian Supreme Court issued a decision confirming the constitutionality of a specific federal income tax, with retroactive effect. As a result of this decision, the company recorded a reserve based on its best estimate of potential settlement (see Note 3). This decision has not yet been finalized and is subject to ongoing motions for clarification. Because litigation in Brazil historically takes many years to resolve, it is very difficult to estimate the timing of resolution of these matters; however, it is possible that certain of these matters may be resolved within the near term. The company is vigorously defending against the proceedings.
•On September 1, 2010, CADE (Brazilian Administrative Council for Economic Defense) announced alleged anticompetitive activity on the part of five industrial gas companies in Brazil and imposed fines. Originally, CADE imposed a civil fine of $2.2R$1.7 billion Brazilian reais ($395350 million) on White Martins, the Brazil-based subsidiary of Linde Inc. The fine was reduced to $1.7, and R$0.2 billion Brazilian reais ($305 million) due to a calculation error made by CADE. The fine against White Martins was overturned by the Ninth Federal Court of Brasilia. CADE appealed this decision, and the Federal Court of Appeals rejected CADE's appeal and confirmed the decision of the Ninth Federal Court of Brasilia. CADE has filed an appeal with the Superior Court of Justice and a decision is pending.
Similarly, on September 1, 2010, CADE imposed a civil fine of $237 million Brazilian reais ($4341 million) on Linde Gases Ltda., the former Brazil-based subsidiary of Linde AG, which was divested to MG Industries GmbH on March 1, 2019 and with respect to which Linde provided a contractual indemnity. The fine was reduced to $188 million Brazilian reais ($34 million) due to a calculation error made by CADE.
The fine against White Martins and Linde Gases Ltda. was overturned by the Ninth and Seventh Federal Court in Brasilia.Courts of Brasilia, respectively. CADE appealed this decision,these decisions, and the Federal Court of Appeals rejected CADE's appealappeals and confirmed the decision of the Ninth and Seventh Federal CourtCourts of Brasilia. CADE had filed an appealappeals for both subsidiaries with the Superior Court of Justice which were denied.CADE filed subsequent appeals to a panel of the Supreme Court of Justice and a final decision is pending.and binding decisions were issued by the Supreme Court of Justice annulling the fine imposed against Linde Gases Ltda and White Martins in September 2023 and January 2024, respectively.
Linde has strong defenses and is confident that it will prevail on appeal and have the fines overturned. Linde strongly believes that the allegations of anticompetitive activity against our current and former Brazilian
subsidiaries are not supported by valid and sufficient evidence. Linde believes that this decision will not stand up to judicial review and deems the possibility of cash outflows to be extremely unlikely. As a result, no reserves have been recorded as management does not believe that a loss from this case is probable.
•On and after April 23, 2019 former shareholders of Linde AG filed appraisal proceedings at the District Court (Landgericht)(Landgericht) Munich I (Germany), seeking an increase of the cash consideration paid in connection with the previously completed cash merger squeeze-out of all of Linde AG’s minority shareholders for €189.46 per share. Any such increase would apply to all 14,763,113 Linde AG shares that were outstanding on April 8, 2019, when
the cash merger squeeze-out was completed. The period for plaintiffs to file claims expired on July 9, 2019. In November 2023, the court issued a decision rejecting the plaintiffs’ claims in their entirety and determining that the cash merger squeeze-out consideration was appropriate. The plaintiffs are entitled to appeal this decision.
The company believes the consideration paid was fair and that the claims lack merit,are not supported by sufficient evidence, and no reserve has been established. We cannot estimate the timing of resolution.
•On December 30, 2022, the Russian Arbitration Court of the St. Petersburg and Leningrad Region ("St. Petersburg Court") issued an injunction preventing (i) the sale of any shares in Linde’s subsidiaries and joint ventures in Russia, and (ii) the disposal of any of the assets in those entities exceeding 5% of the relevant company’s overall asset value. The injunction was requested by RusChemAlliance (RCA) as a preliminary measure to secure payment of a possible eventual award under an arbitration proceeding RCA intended to file against Linde Engineering for alleged breach of contract under the agreement to build a gas processing plant in Ust Luga, Russia entered into between a consortium of Linde Engineering, Renaissance Heavy Industries LLC, and RCA on July 7, 2021. Performance of the agreement was lawfully suspended by Linde Engineering on May 27, 2022 in compliance with applicable sanctions and in accordance with a decision by the sanctions authority in Germany. On March 1, 2023, RCA filed a claim in St. Petersburg against Linde GmbH for recovery of advance payments under the agreement ("Russian Claim"), and subsequently (i) added Linde and other Linde subsidiaries as defendants, and (ii) is seeking payment of alleged damages from Linde (pursuant to corporate guarantees) and guarantor banks.
On March 4, 2023, in accordance with the dispute resolution provisions of the agreement, Linde GmbH filed a notice of arbitration with the Hong Kong International Arbitration Centre ("HKIAC") against RCA to claim that (i) RCA has no entitlement to payment, (ii) RCA’s Russian claim is in breach of the arbitration agreement which requires HKIAC arbitration, and (iii) RCA must compensate Linde for the losses and damages caused by the injunction. Additionally, Linde GmbH filed for and on March 17, 2023 obtained an anti-suit injunction from a Hong Kong court against RCA directing RCA to seek a stay of the Russian Claim and ordering it to resolve any disputes in accordance with HKIAC arbitration. On September 27, 2023, the anti-suit injunction was confirmed by the same Hong Kong court. On January 4, 2024, the Hong Kong court issued a final judgment in Linde’s favor (i) granting a permanent anti-suit injunction against RCA, (ii) granting a permanent, global anti-enforcement injunction against RCA, and (iii) ordering that the injunction issued by the St. Petersburg Court be lifted.
As of December 31, 2023, Linde has a contingent liability of $1.1 billion recorded in Other long-term liabilities, which represents advance payments previously recorded in contract liabilities as of December 31, 2022 related to terminated engineering projects with RCA. As a result of the contract terminations, Linde no longer has future performance obligations for these projects. Linde deconsolidated its Russian gas and engineering business entities as of June 30, 2022, and the remaining investment value of its Russia subsidiaries is immaterial.
Despite the January 4, 2024 decision of the Hong Kong court, the injunction affecting Linde’s shares and assets has not been lifted, the proceeding in St. Petersburg has not been stayed and RCA is continuing to pursue its claim in Russia. On February 20, 2024, the St. Petersburg Court issued its decision and granted the Russian Claim in RCA’s favor. Linde has 30 days to appeal this decision and expects to do so prior to the expiration of that deadline. If Linde appeals, RCA cannot enforce the decision (including foreclosing on the shares of the Russian entities) until after the appeal is decided.
Linde does not expect an adverse impact on earnings from this decision given the contingent liability recorded as of December 31, 2023 and the immaterial remaining investment value of its deconsolidated Russia subsidiaries.
It is difficult to estimate the timing of resolution of this matter. The company intends to vigorously defend its interests in both the Russian Claim and arbitration proceedings.
Commitments
At December 31, 2021,2023, Linde had undrawn outstanding letters of credit, bank guarantees and surety bonds valued at approximately $3,695$3,344 million from financial institutions. These relate primarily to customer contract performance guarantees (including plant construction in connection with certain on-site contracts), self-insurance claims and other commercial and governmental requirements, including non-U.S. litigation matters.
Other commitments related to leases, tax liabilities for uncertain tax positions, long-term debt, other post retirement and pension obligations are summarized elsewhere in the financial statements (see Notes 4, 5, 11, and 16).
NOTE 18. SEGMENT INFORMATION
Linde’s operations consist of 2two major product lines: industrial gases and engineering. As further described in the following paragraph, Linde’s industrial gases operations are managed on a geographic basis, which represent 3three of the company's reportable segments - Americas, EMEA (Europe/Middle East/Africa), and APAC (Asia/South Pacific); a fourth reportable segment, which represents the company's Engineering business, designs and manufactures equipment for air separation and other industrial gas applications specifically for end customers and is managed on a worldwide basis operating in all 3three geographic segments. Other consists of corporate costs and a few smaller businesses which individually do not meet the quantitative thresholds for separate presentation.
The industrial gases product line centers on the manufacturing and distribution of atmospheric gases (oxygen, nitrogen, argon, rare gases) and process gases (carbon dioxide, helium, hydrogen, electronic gases, specialty gases, acetylene). Many of these products are co-products of the same manufacturing process. Linde manufactures and distributes nearly all of its products and manages its customer relationships on a regional basis. Linde’s industrial gases are distributed to various end-markets within a regional segment through one of three basic distribution methods: on-site or tonnage; merchant or bulk; and packaged or cylinder gases. The distribution methods are generally integrated in order to best meet the customer’s needs and very few of its products can be economically transported outside of a region. Therefore, the distribution economics are specific to the various geographies in which the company operates and are consistent with how management assesses performance.
The company’s measure of profit/loss for segment reporting is segment operating profit. Segment operating profit is defined as operating profit excluding purchase accounting impacts of the Linde AG merger, intercompany royalties, and items not indicative of ongoing business trends. This is the manner in which the company’s CODM assesses performance and allocates resources. Similarly, total assets have not been included as this is not provided to the CODM for their assessment.
The table below presents information about reportable segments for the years ended December 31, 2021, 20202023, 2022 and 2019.2021.
| | | | | | | | | | | | | | | | | |
| (Millions of dollars) | 2023 | | 2022 | | 2021 |
| Sales (a) | | | | | |
| Americas | $ | 14,304 | | | $ | 13,874 | | | $ | 12,103 | |
| EMEA | 8,542 | | | 8,443 | | | 7,643 | |
| APAC | 6,559 | | | 6,480 | | | 6,133 | |
| Engineering | 2,160 | | | 2,762 | | | 2,867 | |
| Other | 1,289 | | | 1,805 | | | 2,047 | |
| Total Sales | $ | 32,854 | | | $ | 33,364 | | | $ | 30,793 | |
| | | | | | | | | | | | | | | | | |
| 2023 | | 2022 | | 2021 |
| Segment Operating Profit | | | | | |
| Americas | $ | 4,244 | | | $ | 3,732 | | | $ | 3,368 | |
| EMEA | 2,486 | | | 2,013 | | | 1,889 | |
| APAC | 1,806 | | | 1,670 | | | 1,502 | |
| Engineering | 491 | | | 555 | | | 473 | |
| Other | 43 | | | (66) | | | (56) | |
| | | | | |
| Reported Segment operating profit | 9,070 | | | 7,904 | | | 7,176 | |
| Other charges (Note 3) | (40) | | | (1,029) | | | (273) | |
| Purchase accounting impacts - Linde AG | (1,006) | | | (1,506) | | | (1,919) | |
| Total operating profit | $ | 8,024 | | | $ | 5,369 | | | $ | 4,984 | |
| | (Millions of dollars) | 2021 | | 2020 | | 2019 |
| Sales (a) | | | | | |
| 2023 | | | 2023 | | 2022 | | 2021 |
| Depreciation and Amortization | |
| Americas | |
| Americas | |
| Americas | Americas | $ | 12,103 | | | $ | 10,459 | | | $ | 10,989 | |
| EMEA | EMEA | 7,643 | | | 6,449 | | | 6,643 | |
| APAC | APAC | 6,133 | | | 5,687 | | | 5,779 | |
| Engineering | Engineering | 2,867 | | | 2,851 | | | 2,799 | |
| Other | Other | 2,047 | | | 1,797 | | | 1,953 | |
| Total Segment Sales | 30,793 | | | 27,243 | | | 28,163 | |
| Merger-related divestitures | — | | | — | | | 65 | |
| Total Sales | $ | 30,793 | | | $ | 27,243 | | | $ | 28,228 | |
| | Segment depreciation and amortization | |
| Segment depreciation and amortization | |
| Segment depreciation and amortization | |
| Purchase accounting impacts - Linde AG | |
| Total depreciation and amortization | |
| | | | | | | | | | | | | | | | | |
| 2023 | | 2022 | | 2021 |
| Capital Expenditures and Acquisitions | | | | | |
| Americas | $ | 2,999 | | | $ | 1,698 | | | $ | 1,354 | |
| EMEA | 635 | | | 550 | | | 669 | |
| APAC | 975 | | | 889 | | | 995 | |
| Engineering | 24 | | | 28 | | | 25 | |
| Other | 107 | | | 118 | | | 131 | |
| | | | | |
| Total Capital Expenditures and Acquisitions | $ | 4,740 | | | $ | 3,283 | | | $ | 3,174 | |
| | | | | |
| | | | | |
| | | | | | | | | | | | | | | | | |
| 2021 | | 2020 | | 2019 |
| Segment Operating Profit | | | | | |
| Americas | $ | 3,368 | | | $ | 2,773 | | | $ | 2,577 | |
| EMEA | 1,889 | | | 1,465 | | | 1,367 | |
| APAC | 1,502 | | | 1,277 | | | 1,184 | |
| Engineering | 473 | | | 435 | | | 390 | |
| Other | (56) | | | (153) | | | (246) | |
| | | | | |
| Reported Segment operating profit | 7,176 | | | 5,797 | | | 5,272 | |
| Cost reduction programs and other charges (Note 3) | (273) | | | (506) | | | (567) | |
| Net gain on sale of business | — | | | — | | | 164 | |
| Purchase accounting impacts - Linde AG | (1,919) | | | (1,969) | | | (1,952) | |
| Merger-related divestitures | — | | | — | | | 16 | |
| Total operating profit | $ | 4,984 | | | $ | 3,322 | | | $ | 2,933 | |
| | | | | | | | | | | | | | | | | |
| 2023 | | 2022 | | 2021 |
| Sales by Major Country | | | | | |
| United States | $ | 10,566 | | | $ | 10,553 | | | $ | 9,123 | |
| Germany (c) | 2,827 | | | 3,662 | | | 3,601 | |
| China | 2,585 | | | 2,643 | | | 2,562 | |
| United Kingdom | 1,507 | | | 1,954 | | | 2,060 | |
| Australia | 1,303 | | | 1,372 | | | 1,307 | |
| Brazil | 1,302 | | | 1,158 | | | 1,065 | |
| Other – non-U.S. | 12,764 | | | 12,022 | | | 11,075 | |
| Total sales | $ | 32,854 | | | $ | 33,364 | | | $ | 30,793 | |
| | | | | | | | | | | | | | | | | |
| 2021 | | 2020 | | 2019 |
| Depreciation and Amortization | | | | | |
| Americas | $ | 1,243 | | | $ | 1,196 | | | $ | 1,195 | |
| EMEA | 752 | | | 723 | | | 749 | |
| APAC | 611 | | | 619 | | | 613 | |
| Engineering | 39 | | | 36 | | | 35 | |
| Other | 127 | | | 132 | | | 143 | |
| | | | | |
| Segment depreciation and amortization | 2,772 | | | 2,706 | | | 2,735 | |
| Purchase accounting impacts - Linde AG | 1,863 | | | 1,920 | | | 1,940 | |
| Total depreciation and amortization | $ | 4,635 | | | $ | 4,626 | | | $ | 4,675 | |
| | | | | | | | | | | | | | | | | |
| 2021 | | 2020 | | 2019 |
| Capital Expenditures and Acquisitions | | | | | |
| Americas | $ | 1,354 | | | $ | 1,425 | | | $ | 1,814 | |
| EMEA | 669 | | | 670 | | | 738 | |
| APAC | 995 | | | 1,214 | | | 1,231 | |
| Engineering | 25 | | | 13 | | | 79 | |
| Other | 131 | | | 146 | | | 45 | |
| | | | | |
| Total Capital Expenditures and Acquisitions | $ | 3,174 | | | $ | 3,468 | | | $ | 3,907 | |
| | | | | |
| | | | | |
| | | | | | | | | | | | | | | | | |
| 2021 | | 2020 | | 2019 |
| Sales by Major Country | | | | | |
| United States | $ | 9,123 | | | $ | 8,475 | | | $ | 8,604 | |
| Germany | 3,601 | | | 3,740 | | | 3,630 | |
| China | 2,562 | | | 2,061 | | | 2,005 | |
| United Kingdom | 2,060 | | | 1,595 | | | 1,653 | |
| Australia | 1,307 | | | 1,071 | | | 1,127 | |
| Brazil | 1,065 | | | 822 | | | 994 | |
| Other – non-U.S. | 11,075 | | | 9,479 | | | 10,215 | |
| Total sales | $ | 30,793 | | | $ | 27,243 | | | $ | 28,228 | |
| | 2021 | | 2020 | | 2019 |
| 2023 | | | 2023 | | 2022 | | 2021 |
| Long-lived Assets by Major Country (b) | Long-lived Assets by Major Country (b) | | | | | |
| United States | |
| United States | |
| United States | United States | $ | 7,659 | | | $ | 7,777 | | | $ | 7,498 | |
| Germany | Germany | 2,003 | | | 2,394 | | | 2,429 | |
| China | China | 2,385 | | | 2,413 | | | 2,254 | |
| United Kingdom | United Kingdom | 1,078 | | | 1,313 | | | 1,479 | |
| Australia | Australia | 872 | | | 1,105 | | | 1,214 | |
| Brazil | Brazil | 705 | | | 734 | | | 956 | |
| Other – non-U.S. | Other – non-U.S. | 11,301 | | | 12,976 | | | 13,234 | |
| Total long-lived assets | Total long-lived assets | $ | 26,003 | | | $ | 28,711 | | | $ | 29,064 | |
________________________
(a)Sales reflect external sales only. Intersegment sales, primarily from Engineering to the industrial gases segments, were not material.$1,479 million, $1,035 million and $896 million for the year ended December 31, 2023, 2022 and 2021, respectively.
(b)Long-lived assets include property, plant and equipment - net.
(c)Sales in Germany include Engineering sales to third parties, locally and internationally, which represent 35%, 44% and 53% of Germany sales in 2023, 2022 and 2021, respectively.
19. REVENUE RECOGNITION
Revenue is accounted for in accordance with ASC 606. Revenue is recognized as control of goods or services are transferred to customers in an amount that reflects the consideration to which an entity expects to be entitled to receive in exchange for the goods or services.
Contracts with Customers
Linde serves a diverse group of industries including healthcare, chemicals and energy, manufacturing, metals and mining, food and beverage, carbonation, fiber-optics, steel making, aerospace, chemicals and water treatment.electronics.
Industrial Gases
Within each of the company’s geographic segments for industrial gases, there are 3three basic distribution methods: (i) on-site or tonnage; (ii) merchant or bulk liquid; and (iii) packaged or cylinder gases. The distribution method used by Linde to supply a customer is determined by many factors, including the customer’s volume requirements and location. The distribution method generally determines the contract terms with the customer and, accordingly, the revenue recognition accounting practices. Linde's primary products in its industrial gases business are atmospheric gases (oxygen, nitrogen, argon, rare gases) and process gases (carbon dioxide, helium, hydrogen, electronic gases, specialty gases, acetylene). These products are generally sold through one of the three distribution methods.
Following is a description of each of the 3three industrial gases distribution methods and the respective revenue recognition policies:
On-site. Customers that require the largest volumes of product and that have a relatively constant demand pattern are supplied by cryogenic and process gas on-site plants. Linde constructs plants on or adjacent to these customers’ sites and supplies the product directly to customers by pipeline. Where there are large concentrations of customers, a single pipeline
may be connected to several plants and customers. On-site product supply contracts generally are total requirement contracts with terms typically ranging from 10-20 years and contain minimum purchase requirements and price escalation provisions. Many of the cryogenic on-site plants also produce liquid products for the merchant market. Therefore, plants are typically not dedicated to a single customer. Additionally, Linde is responsible for the design, construction, operations and maintenance of the plants and our customers typically have no involvement in these activities. Advanced air separation processes also allow on-site delivery to customers with smaller volume requirements.
The company’s performance obligations related to on-site customers are satisfied over time as customers receive and obtain control of the product. Linde has elected to apply the practical expedient for measuring progress towards the completion of a performance obligation and recognizes revenue as the company has the right to invoice each customer, which generally corresponds with product delivery. Accordingly, revenue is recognized when product is delivered to the customer and the company has the right to invoice the customer in accordance with the contract terms. Consideration in these contracts is generally based on pricing which fluctuates with various price indices. Variable components of consideration exist within on-site contracts but are considered constrained.
Merchant. Merchant deliveries generally are made from Linde's plants by tanker trucks to storage containers at the customer's site. Due to the relatively high distribution cost, merchant oxygen and nitrogen generally have a relatively small distribution radius from the plants at which they are produced. Merchant argon, hydrogen and helium can be shipped much longer distances. The customer agreements used in the merchant business are usually three to seven year supply agreements based on the requirements of the customer. These contracts generally do not contain minimum purchase requirements or volume commitments.
The company’s performance obligations related to merchant customers are generally satisfied at a point in time as the customers receive and obtain control of the product. Revenue is recognized when product is delivered to the customer and the company has the right to invoice the customer in accordance with the contract terms. Any variable components of consideration within merchant contracts are constrained however this consideration is not significant.
Packaged Gases. Customers requiring small volumes are supplied products in containers called cylinders, under medium to high pressure. Linde distributes merchant gases from its production plants to company-owned cylinder filling plants where cylinders are then filled for distribution to customers. Cylinders may be delivered to the customer’s site or picked up by the customer at a packaging facility or retail store. Linde invoices the customer for the industrial gases and the use of the cylinder container(s). The company also sells hardgoods and welding equipment purchased from independent manufacturers. Packaged gases are generally sold under one to three-yearthree-year supply contracts and purchase orders and do not contain minimum purchase requirements or volume commitments.
The company’s performance obligations related to packaged gases are satisfied at a point in time. Accordingly, revenue is recognized when product is delivered to the customer or when the customer picks up product from a packaged gas facility or retail store, and the company has the right to payment from the customer in accordance with the contract terms. Any variable consideration is constrained and will be recognized when the uncertainty related to the consideration is resolved.
Linde Engineering
The company designs and manufactures equipment for air separation and other industrial gas applications manufactured specifically for end customers. Sale of equipment contracts are generally comprised of a single performance obligation. Revenue from sale of equipment is generally recognized over time as Linde has an enforceable right to payment for performance completed to date and performance does not create an asset with alternative use. For contracts recognized over time, revenue is recognized primarily using a cost incurred input method. Costs incurred to date relative to total estimated costs at completion are used to measure progress toward satisfying performance obligations. Costs incurred include material, labor, and overhead costs and represent work contributing and proportionate to the transfer of control to the customer. ContractChanges to cost estimates and contract modifications are typically accounted for as part of the existing contract and are recognized as a cumulative adjustmentadjustments for the inception-to-date effect of such change.
Contract Assets and Liabilities
Contract assets and liabilities result from differences in timing of revenue recognition and customer invoicing. Contract assets primarily relate to sale of equipment contracts for which revenue is recognized over time. The balance represents unbilled revenue which occurs when revenue recognized under the measure of progress exceeds amounts invoiced to customers. Customer invoices may be based on the passage of time, the achievement of certain contractual milestones or a combination of both criteria. Contract liabilities include advance payments or right to consideration prior to performance under the contract. Contract liabilities are recognized as revenue as performance obligations are satisfied under contract terms. Linde has contract assets of $134$196 million at December 31, 20212023 and $162$124 million at December 31, 2020.2022. Total contract liabilities are $3,699$2,950 million at December 31, 20212023 (current of $2,940$1,901 million and $759$1,049 million within other long-
term liabilitiesdeferred credits in the consolidated balance sheets). As of December 31, 2023, Linde has $418 million recorded in contract liabilities related to engineering projects in Russia subject to sanctions and therefore suspended and lawfully wound down. Total contract liabilities were $2,301$3,986 million at December 31, 20202022 (current contract liabilities of $1,769$3,073 million and $532$913 million within other long-term liabilitiesdeferred credits in the consolidated balance sheets). The decrease in contract liabilities is primarily related to a reclassification of contract liabilities to a contingent liability in other long-term liabilities associated with an engineering project in Russia (see Note 17). Revenue recognized for the twelve months ended December 31, 20212023 that was included in the contract liability at December 31, 20202022 was $1,173$1,017 million. Contract assets and liabilities primarily relate to the Linde Engineering business.
Payment Terms and Other
Linde generally receives payment after performance obligations are satisfied, and customer prepayments are not typical for the industrial gases business. Payment terms vary based on the country where sales originate and local customary payment practices. Linde does not offer extended financing outside of customary payment terms. Amounts billed for sales and use taxes, value-added taxes, and certain excise and other specific transactional taxes imposed on revenue producing transactions are presented on a net basis and are not included in sales within the consolidated statement of income. Additionally, sales returns and allowances are not a normal practice in the industry and are not significant.
Disaggregated Revenue Information
As described above and in Note 18, the company manages its industrial gases business on a geographic basis, while the Engineering and Other businesses are generally managed on a global basis. Furthermore, the company believes that reporting sales by distribution method by reportable geographic segment best illustrates the nature, timing, type of customer, and contract terms for its revenues, including terms and pricing.
The following tables show sales by distribution method at the consolidated level and for each reportable segment and Other for the years ended December 31, 2021, 20202023, 2022 and 2019.2021.
| | | | | | | | | | | | | | | | | | | | | | | |
| (Millions of dollars) | Year Ended December 31, 2021 |
| Sales | Americas | EMEA | APAC | Engineering | Other | Total | % |
| | | | | | | |
| Merchant | $ | 3,279 | | $ | 2,227 | | $ | 2,181 | | $ | — | | $ | 173 | | $ | 7,860 | | 26 | % |
| On-Site | 3,225 | | 1,824 | | 2,296 | | — | | — | | 7,345 | | 24 | % |
| Packaged Gas | 5,456 | | 3,539 | | 1,532 | | — | | 24 | | 10,551 | | 34 | % |
| Other | 143 | | 53 | | 124 | | 2,867 | | 1,850 | | 5,037 | | 16 | % |
| $ | 12,103 | | $ | 7,643 | | $ | 6,133 | | $ | 2,867 | | $ | 2,047 | | $ | 30,793 | | 100 | % |
|
| (Millions of dollars) | Year Ended December 31, 2020 |
| Sales | Americas | EMEA | APAC | Engineering | Other | Total | % |
| | | | | | | |
| Merchant | $ | 2,839 | | $ | 1,870 | | $ | 2,005 | | $ | — | | $ | 145 | | $ | 6,859 | | 25 | % |
| On-Site | 2,513 | | 1,354 | | 2,049 | | — | | — | | 5,916 | | 22 | % |
| Packaged Gas | 5,034 | | 3,175 | | 1,559 | | — | | 22 | | 9,790 | | 36 | % |
| Other | 73 | | 50 | | 74 | | 2,851 | | 1,630 | | 4,678 | | 17 | % |
| $ | 10,459 | | $ | 6,449 | | $ | 5,687 | | $ | 2,851 | | $ | 1,797 | | $ | 27,243 | | 100 | % |
| | | | | | | |
| (Millions of dollars) | Year Ended December 31, 2019 |
| Sales | Americas | EMEA | APAC | Engineering | Other (a) | Total | % |
| | | | | | | |
| Merchant | $ | 2,945 | | $ | 1,856 | | $ | 2,080 | | $ | — | | $ | 184 | | $ | 7,065 | | 25 | % |
| On-Site | 2,757 | | 1,434 | | 2,020 | | — | | — | | 6,211 | | 22 | % |
| Packaged Gas | 5,183 | | 3,347 | | 1,542 | | — | | 19 | | 10,091 | | 36 | % |
| Other | 104 | | 6 | | 137 | | 2,799 | | 1,815 | | 4,861 | | 17 | % |
| $ | 10,989 | | $ | 6,643 | | $ | 5,779 | | $ | 2,799 | | $ | 2,018 | | $ | 28,228 | | 100 | % |
(a) Other includes $65 million for the year ended December 31, 2019 of merger-related divestitures that have been excluded from segment sales.
| | | | | | | | | | | | | | | | | | | | | | | |
| (Millions of dollars) | Year Ended December 31, 2023 |
| Sales | Americas | EMEA | APAC | Engineering | Other | Total | % |
| | | | | | | |
| Merchant | $ | 4,370 | | $ | 2,773 | | $ | 2,242 | | $ | — | | $ | 218 | | $ | 9,603 | | 29 | % |
| On-Site | 3,246 | | 1,980 | | 2,599 | | — | | — | | 7,825 | | 24 | % |
| Packaged Gas | 6,457 | | 3,735 | | 1,416 | | — | | 46 | | 11,654 | | 35 | % |
| Other | 231 | | 54 | | 302 | | 2,160 | | 1,025 | | 3,772 | | 12 | % |
| $ | 14,304 | | $ | 8,542 | | $ | 6,559 | | $ | 2,160 | | $ | 1,289 | | $ | 32,854 | | 100 | % |
|
| (Millions of dollars) | Year Ended December 31, 2022 |
| Sales | Americas | EMEA | APAC | Engineering | Other | Total | % |
| | | | | | | |
| Merchant | $ | 3,786 | | $ | 2,509 | | $ | 2,220 | | $ | — | | $ | 176 | | $ | 8,691 | | 26 | % |
| On-Site | 4,048 | | 2,415 | | 2,471 | | — | | — | | 8,934 | | 27 | % |
| Packaged Gas | 5,831 | | 3,466 | | 1,523 | | — | | 51 | | 10,871 | | 33 | % |
| Other | 209 | | 53 | | 266 | | 2,762 | | 1,578 | | 4,868 | | 14 | % |
| $ | 13,874 | | $ | 8,443 | | $ | 6,480 | | $ | 2,762 | | $ | 1,805 | | $ | 33,364 | | 100 | % |
| | | | | | | |
| (Millions of dollars) | Year Ended December 31, 2021 |
| Sales | Americas | EMEA | APAC | Engineering | Other | Total | % |
| | | | | | | |
| Merchant | $ | 3,279 | | $ | 2,227 | | $ | 2,181 | | $ | — | | $ | 173 | | $ | 7,860 | | 26 | % |
| On-Site | 3,225 | | 1,824 | | 2,296 | | — | | — | | 7,345 | | 24 | % |
| Packaged Gas | 5,456 | | 3,539 | | 1,532 | | — | | 24 | | 10,551 | | 34 | % |
| Other | 143 | | 53 | | 124 | | 2,867 | | 1,850 | | 5,037 | | 16 | % |
| $ | 12,103 | | $ | 7,643 | | $ | 6,133 | | $ | 2,867 | | $ | 2,047 | | $ | 30,793 | | 100 | % |
Remaining Performance Obligations
As described above, Linde's contracts with on-site customers are under long-term supply arrangements which generally require the customer to purchase their requirements from Linde and also have minimum purchase requirements. Additionally, plant sales from the Linde Engineering business are primarily contracted on a fixed price basis. The company estimates the consideration related to future minimum purchase requirements isand plant sales was approximately $57 billion.$48 billion (excludes Russian projects which are impacted by sanctions). This amount excludes all on-site sales above minimum purchase requirements, which can be significant depending on customer needs. In the future, actual amounts will be different due to impacts from several factors, many of which are beyond the company’s control including, but not limited to, timing of newly signed, terminated and renewed contracts, inflationary price escalations, currency exchange rates, and pass-through costs related to natural gas and electricity. The actual duration of long-term supply contracts ranges up to twenty years. The company estimates that approximately half of the revenue related to minimum purchase requirements will be earned in the next five years and the remaining thereafter.
20. SUBSEQUENT EVENTS
In February 2024, Linde issued €700 million of 3.00% notes due in 2028, €850 million of 3.20% notes due in 2031 and €700 million of 3.40% notes due in 2036.
ITEM 9. CHANGES IN AND DISAGREEMENTS WITH ACCOUNTANTS ON ACCOUNTING AND FINANCIAL DISCLOSURE
None.
ITEM 9A. CONTROLS AND PROCEDURES
Conclusion Regarding the Effectiveness of Disclosure Controls and Procedures
Based on an evaluation of the effectiveness of Linde’s disclosure controls and procedures, which was made under the supervision and with the participation of management, including Linde’s principal executive officer and principal financial officer, the principal executive officer and principal financial officer have each concluded that, as of December 31, 2021,2023, such disclosure controls and procedures are effective in ensuring that information required to be disclosed by Linde in reports that it files or submits under the Exchange Act of 1934 is recorded, processed, summarized and reported within the time periods specified in the Securities and Exchange Commission’s rules and forms, and accumulated and communicated to management including Linde’s principal executive officer and principal financial officer, to allow timely decisions regarding required disclosure.
Management’s Report on Internal Control Over Financial Reporting
Refer to Item 8 for Management’s Report on Internal Control Over Financial Reporting as of December 31, 2021.2023.
Changes in Internal Control over Financial Reporting
There were no changes in Linde’s internal control over financial reporting that occurred during the quarter ended December 31, 20212023 that have materially affected, or are reasonably likely to materially affect, Linde’s internal control over financial reporting.
ITEM 9B. OTHER INFORMATION
None.
ITEM 9C. DISCLOSURE REGARDING FOREIGN JURISDICTIONS THAT PREVENT INSPECTIONS
None.
PART III
ITEM 10. DIRECTORS, EXECUTIVE OFFICERS AND CORPORATE GOVERNANCE
Certain information required by this item is incorporated herein by reference to the sections captioned “Corporate Governance and Board Matters - Director Nominees" and “Corporate Governance And Board Matters - "Delinquent Section 16 (a) Reports" in Linde’s Proxy Statement to be filed by April 30, 2022 for the Annual General Meeting.Statement.
Identification of the Audit Committee
Linde has a separately-designated standing Audit Committee established in accordance with Section 3(a)(58)(A) of the Securities Exchange Act of 1934 as amended (the “Exchange Act”). The members of that audit committee are Prof. Dr. Clemens BörsigMartin H. Richenhagen (chairman), Dr. Nance K. Dicciani, Dr. Thomas Enders, Edward G. Galante, Larry D. McVay, Dr. Victoria Ossadnik and Alberto Weisser and each member is independent within the meaning of the independence standards adopted by the Board of Directors and those of the New York Stock Exchange.Nasdaq.
Audit Committee Financial Expert
The Linde Board of Directors has determined that Prof. Dr. Clemens Börsig and Alberto Weisser satisfy the criteria adopted by the SEC to serve as an “audit committee financial experts”expert” as defined by Item 407(d)(5)(ii) of Regulation S-K of the Exchange Act and is independent within the meaning of the independence standards adopted by the Board of Directors and those of the New York Stock Exchange.Nasdaq.
Code of Ethics
Linde has adopted a code of ethics that applies to the company’s directors and all employees, including its Chief Executive Officer, Chief Financial Officer, and Chief Accounting Officer. This code of ethics, including specific standards for implementing certain provisions of the code, has been approved by the Linde Board of Directors and is named the “Code of Business Integrity”. This document is posted on the company’s public website, www.linde.com but is not incorporated herein.
ITEM 11. EXECUTIVE COMPENSATION
Information required by this item is incorporated herein by reference to the sections captioned “Executive Compensation Matters” and “Corporate Governance and Board Matters - Director Compensation” in Linde’s Proxy Statement to be filed by April 30, 2022 for the Annual General Meeting.Statement.
ITEM 12. SECURITY OWNERSHIP OF CERTAIN BENEFICIAL OWNERS AND MANAGEMENT AND RELATED STOCKHOLDER MATTERS
Equity Compensation Plans Information - The table below provides information as of December 31, 20212023 about company shares that may be issued upon the exercise of options, warrants and rights granted to employees or members of Linde’s Board of Directors under equity compensation plans that were assumed by Linde upon the completionwith awards outstanding as of the business combination on OctoberDecember 31, 2018.2023.
EQUITY COMPENSATION PLANS TABLE
| | Plan Category | Plan Category | Number of securities to
be issued upon exercise
of outstanding options,
warrants and rights (a) | | Weighted-average
exercise price of
outstanding options,
warrants and rights (b) | | Number of securities
remaining available for
future issuance under
equity compensation plans
(excluding securities
reflected in column (a)) (c) | |
| Equity compensation plans approved by shareholders | Equity compensation plans approved by shareholders | 8,414,538 | | (1) | $ | 152.57 | | | 9,280,823 | | (2) |
| Equity compensation plans approved by shareholders | |
| Equity compensation plans approved by shareholders | | 7,034,362 | | (1) | $ | 180.58 | | | 7,661,431 | | (2) |
| Equity compensation plans not approved by shareholders | Equity compensation plans not approved by shareholders | — | | | — | | | — | | |
| Total | Total | 8,414,538 | | | $ | 152.57 | | | 9,280,823 | | |
| Total | |
| Total | |
________________________
(1)This amount includes 636,715637,600 restricted shares and 610,245571,628 performance shares.
(2)This amount includes 8,995,710reflects shares available for future issuanceissuances pursuant to the 2021 Linde plc Long Term Incentive Plan and 285,113 shares available for future issuance pursuant to the Long Term Incentive Plan 2018 of Linde plc.
Certain information required by this item regarding the beneficial ownership of the company’s ordinary shares is incorporated herein by reference to the section captioned “Information on Share Ownership” in Linde’s Proxy Statement to be filed by April 30, 2022 for the Annual General Meeting.Statement.
ITEM 13. CERTAIN RELATIONSHIPS AND RELATED TRANSACTIONS AND DIRECTOR INDEPENDENCE
Information required by this item is incorporated herein by reference to the sections captioned “Corporate Governance And Board Matters – Review, Approval or Ratification of Transactions with Related Persons,” “Corporate Governance And Board Matters – Certain Relationships and Transactions,” and “Corporate Governance And Board Matters – Director Independence” in Linde’s Proxy Statement to be filed by April 30, 2022 for the Annual General Meeting.Statement.
ITEM 14. PRINCIPAL ACCOUNTING FEES AND SERVICES
Information required by this item is incorporated herein by reference to the section captioned “Audit Matters” in Linde’s Proxy Statement to be filed by April 30, 2022 for the Annual General Meeting.Statement.
PART IV
ITEM 15. EXHIBITS, FINANCIAL STATEMENT SCHEDULES
(a)The following documents are filed as part of this report:
(i)The company’s 20212023 Consolidated Financial Statements and the Report of the Independent Registered Public Accounting Firm are included in Part II, Item 8. Financial Statements and Supplementary Data.
(ii)Financial Statement Schedules – All financial statement schedules have been omitted because they are not applicable or the required information is shown in the financial statements or notes thereto.
(iii)Exhibits – The exhibits filed as part of this Annual Report on Form 10-K are listed in the accompanying index.
INDEX TO EXHIBITS
Linde plc and Subsidiaries
| | | | | | | | |
| Exhibit No. | | Description |
| |
| 2.1 | | Business Combination Agreement by and among Linde Aktiengesellschaft, Praxair, Inc., Zamalight PLC, Zamalight Holdco LLC and Zamalight Subco, Inc. dated as of June 1, 2017 (Filed as Exhibit 2.1 to Praxair, Inc.'s Current Report on Form 8-K dated June 1, 2017, Filing No. 1-11037, and is incorporated herein by reference.) |
| | |
| 2.1a | | Amendment No. 1, dated August 10, 2017, to the Business Combination Agreement, by and among Praxair, Inc., Linde Aktiengesellschaft, Linde plc, Zamalight Holdco LLC and Zamalight Subco, Inc. (Filed as Exhibit 2.1 to Praxair, Inc.'s Current Report on Form 8-K dated August 10, 2017, Filing No. 1-11037, and is incorporated hereby by reference.) |
| | |
| **2.2 | | |
| |
| **2.3 | | Sale and Purchase Agreement, dated July 16, 2018, by and among Linde AG, Praxair, Inc., MG Industries GmbH, Messer Canada Inc., MG Industries USA, Inc. (the MG entities and Messer Canada, Inc. being collectively referred to as “Messer”), and Linde plc with respect to the sale of certain assets of Linde AG in the Americas and certain assets of Praxair, Inc. to Messer in connection with the Business Combination Agreement (Filed as Exhibit 2.2 to the Company’s Quarterly Report on Form 10-Q for the quarter ended September 30, 2018, File No. 1-38730, and is incorporated hereby by reference). |
| |
| **2.3a | | First Amendment dated September 21, 2018 to the Sale and Purchase Agreement, dated July 16, 2018, by and among Linde AG, Praxair, Inc., Messer, and Linde plc with respect to the sale of certain additional assets of Linde AG in the Americas to Messer in connection with the Business Combination Agreement (Filed as Exhibit 2.3 to the Company’s Quarterly Report on Form 10-Q for the quarter ended September 30, 2018, File No. 1-38730, and is incorporated hereby by reference). |
| |
| **2.3b | | Second Amendment dated October 19, 2018 to the Sale and Purchase Agreement, dated July 16, 2018, as amended by the First Amendment thereto, by and among Linde AG, Praxair, Inc., Messer, and Linde plc, with respect to the sale of certain additional assets of Linde AG in the Americas to Messer in connection with the Business Combination Agreement (Filed as Exhibit 2.2 to the Company’s Quarterly Report on Form 10-Q for the quarter ended September 30, 2018, File No. 1-11037, and is incorporated hereby by reference). |
| | |
| **2.3c | | Third Amendment dated February 20, 2019 to the Sale and Purchase Agreement, dated July 16, 2018, as amended by the First and Second Amendment thereto, by and among Linde AG, Praxair, Inc., Messer, and Linde plc, with respect to the sale of certain additional assets of Linde AG in the Americas to Messer in connection with the Business Combination Agreement dated as of June 1, 2017, as amended, to effect a combination of the businesses of Linde AG and Praxair, Inc. (Filed as Exhibit 2.4 to the Company’s Current Report on Form 8-K, filed on March 7, 2019, File No. 1-11037, and is incorporated hereby by reference). |
| |
| 3.01 | | |
| |
| 4.01 | | |
| | |
| 4.02 | | Indenture, dated as of July 15, 1992, between Praxair, Inc. and U.S. Bank National Association, as the ultimate successor trustee to Bank of America, Illinois, formerly Continental Bank, National Association (Filed as Exhibit 4 to Praxair, Inc.'s Current Report on Form 8-K dated March 19, 2007, Filing No. 1-11037, and incorporated herein by reference). |
| | |
| 4.03 | | |
| |
| 4.04 | | |
| |
| 4.05 | | |
| | |
| | | | | | | | |
| 4.06 | | |
| | |
| 4.07 | | Supplemental Indenture, dated as of March 1, 2023, by and among the Company, Linde Inc., Linde GmbH and U.S. Bank Trust Company, National Association (as successor in interest to U.S. Bank National Association), as trustee, to that certain indenture, dated as of July 15, 1992, by and among Linde Inc. and U.S. Bank National Association, as trustee (Filed as Exhibit 4.1 to the Company’s Current Report on Form 8-K, filed on March 1, 2023, File No. 001-38730, and incorporated herein by reference). |
| | |
| 4.08 | | Supplemental Indenture, dated as of March 1, 2023, by and among the Company, Linde Inc., Linde GmbH and U.S. Bank Trust Company, National Association (as successor in interest to U.S. Bank National Association), as trustee, to that certain indenture, dated as of August 10, 2020, by and among Linde Inc., the Predecessor and U.S. Bank National Association, as trustee(Filed as Exhibit 4.2 to the Company’s Current Report on Form 8-K, filed on March 1, 2023, File No. 001-38730, and incorporated herein by reference). |
| | |
| 4.09 | | Supplemental Indenture, dated as of September 3, 2019, among Linde plc, Praxair, Inc., Linde AG and U.S. Bank National Association, as trustee (Filed as Exhibit 4.2 to the Linde plc Form 8-K dated September 6, 2019, Filing No. 1-38730, and incorporated herein by reference). |
| | |
4.054.10 | | |
| | |
4.064.11 | | |
| | |
4.074.12 | | |
| | |
| 4.13 | | Amended and Restated Fiscal Agency Agreement, dated May 4, 2023, among Linde plc, as Issuer, and Deutsche Bank Aktiengesellschaft, as Fiscal Agent and Paying Agent (Filed as Exhibit 4.54.6 to the Linde plc Form 8-K, dated May 26, 2020,June 12, 2023, Filing No.1-38730,No. 1-38730, and incorporated herein by reference).reference.) |
| | |
| | | | | | | | |
4.084.14 | | Fiscal Agency Agreement, dated May 11, 2020, among Linde plc, as Issuer and as Guarantor, Linde Finance B.V., as Issuer, and Deutsche Bank Aktiengesellschaft, as Fiscal Agent and Paying Agent (Filed as Exhibit 4.6 to the Linde plc Form 8-K dated May 26. 2020, Filing No 1-37830, and incorporated herein by reference). |
| | |
4.094.15 | | |
| | |
4.104.16 | | Amended and Restated Fiscal Agency Agreement, dated August 3, 2021, among Linde plc, as Issuer and as Guarantor, Linde Finance B.V., as Issuer, and Deutsche Bank Aktiengesellschaft, as Fiscal Agent and Paying Agent (Filed as Exhibit 4.6 to Linde plc 's current report on Form 8-K, dated September 30, 2021, Filing No. 1-38730, and incorporated herein by reference). |
| | |
4.114.17 | | Copies of the agreements related to long-term debt which are not required to be filed as exhibits to this Annual Report on Form 10-K will be furnished to the Securities and Exchange Commission upon request. |
| | |
*10.0e10 | | |
| | |
| 10.01 | | Amended and Restated Five Year Credit Agreement, dated as of March 26, 2019,December 7, 2022, among Linde plc, certain of its subsidiaries parties thereto as borrowers, the lenders party thereto and Bank of America, N.A., as Administrative Agent (FiledAgent.(Filed as Exhibit 10.1 to Linde plc's current report on Form 8-K, dated April 3, 2019,December 8, 2022, Filing No. 1-38730, and incorporated herein by reference). |
| |
10.01a10.02 | | 364-Day Credit Agreement, Additional Guarantor Supplement, dated as of September 3, 2019, byDecember 6, 2023, among Linde AG,plc, the Subsidiary Borrowers, certain Subsidiary Guarantors, the lenders party thereto and acknowledged by Bank of America, N.A., as Administrative Agent (FiledAgent.(Filed as Exhibit 10.210.1 to the Linde plcplc's current report on Form 8-K, dated SeptemberDecember 6, 2019,2023, Filing No. 1-38730, and incorporated herein by reference). |
| |
*10.0210.03 | | |
| | |
*10.02a10.03a | | |
| | | | | | | | |
| | |
*10.02b10.03b | | |
| | |
*10.02c10.03c | | |
| | |
*10.02d10.03d | | |
| | |
| *10.03 | |
| |
| *10.04 | | |
| | |
| *10.05 | | |
| |
| *10.05a | | |
| | |
| *10.05b | | |
| | |
| *10.05c | | |
| | |
| *10.05d | | |
| | |
| | | | | | | | |
| *10.05e | | |
| | |
| *10.05f | | |
| | |
| *10.05g | | |
| | |
| *10.05h | | |
| | |
| *10.06 | | |
| | |
| *10.06a | | |
| | |
| *10.06b | | |
| | |
| *10.06c | | |
| | |
| *10.06d | | |
| | |
| *10.06e | | |
| | |
| | | | | | | | |
| *10.06f | |
|
| | |
| *10.07 | | |
| | |
| *10.08 | | |
| |
| *10.09 | | |
| | |
| *10.10 | | |
| |
*10.11 | | |
| |
*10.11a10.10a | | |
| | |
*10.11b10.10b | | |
| | |
*10.11c10.10c | | |
| |
| | | | | | | | |
*10.11d10.10d | | |
| | |
*10.11e10.10e | | |
| |
*10.11f10.10f | |
|
| |
*10.11g10.10g | | |
| | |
*10.11h10.10h | | |
| | |
*10.11i10.10i | | |
| | |
*10.11j10.10j | | |
| | |
*10.11k10.10k | | |
| | |
*10.11l10.10l | | |
| | |
*10.1210.11 | | |
| | |
| | | | | | | | |
10.1310.12 | | |
| | |
10.1410.13 | | |
| | |
*10.1510.14 | | |
| | |
| | |
| 21.01 | | |
| |
| 23.01 | | |
| |
| | |
| | |
| 31.01 | | |
| | |
| 31.02 | | |
| |
| 32.01 | | |
| | |
| 32.02 | | |
| | |
| 97.1 | | |
| |
| 101.INS | | XBRL Instance Document: The XBRL Instance Document does not appear in the Interactive Data File because its XBRL tags are embedded within the Inline XBRL document. |
| |
| 101.SCH | | XBRL Taxonomy Extension Schema |
| |
| 101.CAL | | XBRL Taxonomy Extension Calculation Linkbase |
| |
| | | | | | | | |
| 101.LAB | | XBRL Taxonomy Extension Label Linkbase |
| |
| 101.PRE | | XBRL Taxonomy Extension Presentation Linkbase |
| |
| 101.DEF | | XBRL Taxonomy Extension Definition Linkbase |
| | |
Copies of exhibits incorporated by reference can be obtained from the SEC and are located in SEC File No. 1-11037.
| | | | | |
| * | Indicates a management contract or compensatory plan or arrangement. |
| ** | Certain schedules or similar attachments have been omitted pursuant to Item 601(b)(2) of Regulation S-K. The Registrant agrees to furnish supplemental copies of any of the omitted schedules or attachments upon request by the SEC. |
ITEM 16. FORM 10-K SUMMARY
None.
SIGNATURES
Linde plc and Subsidiaries
Pursuant to the requirements of the Securities Exchange Act of 1934, the registrant has duly caused this report to be signed on its behalf by the undersigned thereunto duly authorized.
| | | | | | | | | | | | | | | | | | | | |
| | Linde plc |
| | (Registrant) |
Date: February 28, 20222024 | By: | /s/ KELCEY E. HOYT KELCEY E. HOYT |
| | Kelcey E. Hoyt Chief Accounting Officer |
Pursuant to the requirements of the Securities Exchange Act of 1934, this report has been signed below by the following persons on behalf of the Registrant and in the capacities indicated on February 28, 2022.2024.
| | | | | | | | | | | | | | |
/s/ PROF. DR. WOLFGANG REITZLESTEPHEN F. ANGEL | | /s/ STEPHEN F. ANGELSANJIV LAMBA | | /s/ MATTHEW J. WHITE |
Wolfgang ReitzleStephen F. Angel
Chairman | | Stephen F. AngelSanjiv Lamba
Chief Executive Officer and Director | | Matthew J. White Chief Financial Officer |
| | |
| /s/ PROF. DDR. ANN-KRISTIN ACHLIETNER | | /s/ ROBERT L. WOOD | | /s/ DR. CLEMENS BÖRSIG | | /s/ DR. NANCE K. DICCIANI THOMAS ENDERS |
Ann-Kristin Achleitner Director | | Clemens BörsigRobert L. Wood
Director | | Nance K. DiccianiThomas Enders
Director |
| | |
/s/ DR. THOMAS ENDERSJOSEF KAESER | | /s/ FRANZ FEHRENBACH | | /s/ EDWARD G. GALANTE |
Thomas Enders
Director
| | Franz Fehrenbach
Director
| | Edward G. Galante
Director
|
| | | | |
/s/ LARRY D. MCVAY | | /s/ DR. VICTORIA OSSADNIK | | /s/ PROF. DR. MARTIN H. RICHENHAGENALBERTO WEISSER |
Larry D. McVayJosef Kaeser
Director | | Victoria Ossadnik Director | | Alberto Weisser Director |
| | | | |
| /s/ PROF. DR. MARTIN H. RICHENHAGEN | | /s/ HUGH GRANT | | |
Martin Richenhagen Director |
| | | | |
/s/ ROBERT L. WOOD | | /s/ ALBERTO WEISSER | | /s/ JOSEF KAESER |
Robert L. WoodHugh Grant
Director | | | Alberto Weisser
Director
| Josef Kaeser
Director
|
| | | | |
| | | | |
| | | | |
| | | | |