0000828944us-gaap:AccumulatedNetUnrealizedInvestmentGainLossMember2023-01-012023-12-31
UNITED STATES
SECURITIES AND EXCHANGE COMMISSION
Washington, D.C. 20549
FORM 10-K | | | | | |
| (Mark One) |
| ☒ | ANNUAL REPORT PURSUANT TO SECTION 13 OR 15(d) OF THE SECURITIES EXCHANGE ACT OF 1934 |
| For the fiscal year ended December 31, 20212023 |
| OR |
| ☐ | TRANSITION REPORT PURSUANT TO SECTION 13 OR 15(d) OF THE SECURITIES EXCHANGE ACT OF 1934 |
For the transition period from to |
| Commission file number 001-35638 |
| WSFS FINANCIAL CORPORATION |
| (Exact Name of Registrant as Specified in its Charter) |
| | | | | | | | |
| Delaware | | 22-2866913 |
| (State or other Jurisdiction of Incorporation or Organization) | | (I.R.S. Employer Identification No.) |
| 500 Delaware Avenue, Wilmington, Delaware | | 19801 |
| (Address of Principal Executive Offices) | | (Zip Code) |
Registrant’s Telephone Number, Including Area Code: (302) 792-6000 |
| | | | | | | | | | | | | | |
| Securities registered pursuant to Section 12(b) of the Act: |
| Title of Each Class | | Trading Symbol(s) | | Name of Each Exchange on Which Registered |
| Common Stock, $0.01 par value | | WSFS | | Nasdaq Global Select Market |
| Securities registered pursuant to Section 12(g) of the Act: None |
Indicate by check if the registrant is a well-known seasoned issuer as defined in Rule 405 of the Securities Act. Yes x No ☐
Indicate by check if the registrant is not required to file reports pursuant to Section 13 or Section 15(d) of the Exchange Act. Yes ☐ No x
Indicate by check mark whether the registrant (1) has filed all reports required to be filed by Section 13 or 15(d) of the Securities Exchange Act of 1934 during the preceding 12 months (or for such shorter period that the registrant was required to file such reports), and (2) has been subject to such filing requirements for the past 90 days. Yes x No ☐
Indicate by check mark whether the registrant has submitted electronically every Interactive Data File required to be submitted pursuant to Rule 405 of Regulation S-T (§232.405 of this chapter) during the preceding 12 months (or for such shorter period that the registrant was required to submit such files). Yes x No ☐
Indicate by check mark whether the registrant is a large accelerated filer, an accelerated filer, a non-accelerated filer, smaller reporting company or an emerging growth company. See definitions of “large accelerated filer,” “accelerated filer,” “smaller reporting company” and “emerging growth company” in Rule 12b-2 of the Exchange Act.
| | | | | | | | | | | | | | | | | | | | |
| Large accelerated filer | | x | | Accelerated filer | | ☐ |
| Non-accelerated filer | | ☐ | | Smaller reporting company | | ☐ |
| Emerging growth company | | ☐ | | | | |
If an emerging growth company, indicate by check mark if the registrant has elected not to use the extended transition period for complying with any new or revised financial accounting standards provided pursuant to Section 13(a) of the Exchange Act. ☐
Indicate by check mark whether the registrant has filed a report on and attestation to its management's assessment of the effectiveness of its internal control over financial reporting under Section 404(b) of the Sarbanes-Oxley Act (15. U.S.C. 7262(b)) by the registered public accounting firm that prepared or issued its audit report. ☒
If securities are registered pursuant to Section 12(b) of the Act, indicate by check mark whether the financial statements of the registrant included in the filing reflect the correction of an error to previously issued financial statements. ☐
Indicate by check mark whether any of those error corrections are restatements that required a recovery analysis of incentive-based compensation received by any of the registrant’s executive officers during the relevant recovery period pursuant to § 240.10D-1(b). ☐
Indicate by check mark whether the registrant is a shell company (as defined in Rule 12b-2 of the Act). Yes ☐ No x
The aggregate market value of the voting and non-voting common equity held by nonaffiliates of the registrant, based on the closing price of the registrant’s common stock as quoted on Nasdaq as of June 30, 2021,2023, was $2,185,763,654.$2,282,293,260. For purposes of this calculation only, affiliates are deemed to be directors, executive officers and beneficial owners of greater than 10% of the registrant's outstanding common stock.
As of February 24, 2022,26, 2024, there were issued and outstanding 65,378,95560,280,040 shares of the registrant’s common stock, par value $0.01 per share.
DOCUMENTS INCORPORATED BY REFERENCE
Portions of the Registrant’s Proxy Statement for the 20222024 Annual Meeting of Stockholders are incorporated by reference in Part III hereof.
WSFS FINANCIAL CORPORATION
TABLE OF CONTENTS
| | | | | | | | |
| | |
| | | Page |
| | |
| Item 1. | | |
| Item 1A. | | |
| Item 1B. | | |
| Item 1C. | | |
| Item 2. | | |
| Item 3. | | |
| Item 4. | | |
| | |
| | |
| Item 5. | | |
| Item 6. | | |
| Item 7. | | |
| Item 7A. | | |
| Item 8. | | |
| Item 9. | | |
| Item 9A. | | |
| Item 9B. | | |
| Item 9C. | | |
| | |
| | |
| Item 10. | | |
| Item 11. | | |
| Item 12. | | |
| Item 13. | | |
| Item 14. | | |
| | |
| | |
| Item 15. | | |
| Item 16. | | |
| | |
FORWARD-LOOKING STATEMENTS
This Annual Report on Form 10-K, and exhibits hereto, contains estimates, predictions, opinions, projections and other “forward-looking statements” as that phrase is defined in the Private Securities Litigation Reform Act of 1995. Such statements include, without limitation, references to the Company’s predictions or expectations of future business or financial performance as well as its goals and objectives for future operations, financial and business trends, business prospects and management’s outlook or expectations for earnings, revenues, expenses, capital levels, liquidity levels, asset quality or other future financial or business performance, strategies or expectations. The words “believe,” “expect,” “anticipate,” “plan,” “estimate,” “target,” “project” and similar expressions, among others, generally identify forward-looking statements. Such forward-looking statements are based on various assumptions (some of which may be beyond the Company’s control) and are subject to risks and uncertainties (which change over time) and other factors which could cause actual results to differ materially from those currently anticipated. Such risks and uncertainties include, but are not limited to:
•difficult market conditions and unfavorable economic trends in the United States generally and in financial markets, particularly in the markets in which the Company operates and in which its loans are concentrated, including an increase indifficult and unfavorable conditions and trends related to housing markets, costs of living, unemployment levels, inflation,interest rates, supply chain issues, inflation, and slowdowns in economic growth,growth;
•the impacts related to or resulting from bank failures and other economic industry volatility, including as a result of the novel coronaviruspotential increased regulatory requirements and its variants (COVID-19) pandemic;costs and potential impacts to macroeconomic conditions;
•possible additional loan losses and impairment of the collectability of loans;
•additional credit, fraud and litigation risks associated with our PPP lending activities;
•the economic and financial impact of federal, state and local emergency orders, vaccine mandates and other actions taken in response to the COVID-19 pandemic;
•the continuation of these conditions related to the COVID-19 pandemic, including whether due to a resurgence or additional waves of COVID-19 infections or variants thereof, particularly as the geographic areas in which we operate, how quickly and to what extent normal economic and operating conditions can resume and continue, and the potential waning of vaccine effectiveness or effects of low vaccination rates;
•the Company’s level of nonperforming assets and the costs associated with resolving problem loans including litigation and other costs and complying with government-imposed foreclosure moratoriums;
•changes in market interest rates, which may increase funding costs and reduce earning asset yields and thus reduce margin;
•the impact of changes in interest rates and the credit quality and strength of underlying collateral and the effect of such changes on the market value of the Company’s investment securities portfolio;portfolio, which could impact market confidence in our operations;
•the credit risk associated with the substantial amount of commercial mortgage,real estate, commercial and industrial, and construction and land development and commercial and industrial loans in the Company’sCompany's loan portfolio;
•the extensive federal and state regulation, supervision and examination governing almost every aspect of the Company’s operations, and potential expenses associated with complying with such regulations;
•the Company’s ability to comply with applicable capital and liquidity requirements, including its ability to generate liquidity internally or raise capital on favorable terms;
•possible changes in trade, monetary and fiscal policies and stimulus programs, laws and regulations and other activities of governments, agencies, and similar organizations, and the uncertainty of the short- and long-term impacts of such changes;
•any impairments of the Company’sCompany's goodwill or other intangible assets;
•conditions in the financial markets, that may limit the Company’s access to additional funding to meet its liquidity needs;
•the discontinued publication of London Inter-Bank Offered Rate (LIBOR) and the transition to an alternative reference interest rate, such as the Secured Overnight Financing Rate (SOFR), including methodologies for calculating the rate that are different from the LIBOR methodology and changed language for existing and new floating or adjustable rate contracts;
•the success of the Company's growth plans including its plans to grow the commercial small business leasing portfolio and residential, small business and Small Business Administration (SBA) portfolios, and wealth management business following its recent acquisition of Bryn Mawracross our WSFS Bank, Corporation (BMBC);Cash Connect
•the Company’s ability to successfully integrate and fully realize the cost savings and other benefits of its acquisitions, manage risks related to business disruption following those acquisitions, and post-acquisition Customer acceptance of the Company’s products and services and related Customer disintermediation, including its recent acquisition of BMBC;disintermediation;
•negative perceptions or publicity with respect to the Company generally and, in particular, the Company’s trust and wealth management business;
•failure of the financial andand/or operational controls of the Company’s Cash Connect® division;and/or Wealth Management segments;
•adverse judgments or other resolution of pending and future legal proceedings, and cost incurred in defending such proceedings;
•the Company’sCompany's reliance on third parties for certain important functions, including the operation of its core systems, and any failures by such third parties;
•system failures or cybersecurity incidents or other breaches of the Company’s network security, particularly given widespread remote working arrangements;
•the Company’s ability to recruit and retain key Associates;
•
the effects of problems encountered by other financial institutions that adversely affect the Company or the banking industry generally;
•the effects of weather, including climate change, and natural disasters such as floods, droughts, wind, tornadoes and hurricanes as well as effects from geopolitical instability, armed conflicts, public health crises and man-made disasters including terrorist attacks;
•the effects of regional or national civil unrest (including any resulting branch or ATM closures or damage);
•possible changes in the speed of loan prepayments by the Company’s Customers and loan origination or sales volumes;
•possible changes in market valuations and/or the speed of prepayments of mortgage-backed securities (MBS) due to changes in the interest rate environment and the related acceleration of premium amortization on prepayments in the event that prepayments accelerate;
•regulatory limits on the Company’s ability to receive dividends from its subsidiaries and pay dividends to its stockholders;
•any reputation, credit, interest rate, market, operational, litigation, legal, liquidity, regulatory and compliance risk resulting from developments related to any of the risks discussed above;
•any compounding effects or unexpected interactions of the risks discussed above; and
•other risks and uncertainties, including those discussed herein under the heading “Risk Factors” and in other documents filed by the Company with the Securities and Exchange Commission (SEC) from time to time.
The Company cautions readers not to place undue reliance on any such forward-looking statements, which speak only as of the date they are made. The Company disclaims any duty to revise or update any forward-looking statement, whether written or oral, that may be made from time to time by or on behalf of the Company for any reason, except as specifically required by law.
As used in this Annual Report on Form 10-K, the terms “WSFS”, “the Company”, “registrant”, “we”, “us”, and “our” mean WSFS Financial Corporation and its subsidiaries, on a consolidated basis, unless the context indicates otherwise.
The following are registered trademarks of the Company: Bryn Mawr Trust®, Cash Connect®, Christiana Trust Company of Delaware®,NewLane Finance®, Powdermill® Financial Solutions, West Capital Management®, WSFS Institutional Services®, WSFS Mortgage®and WSFS Wealth® Investments. Any other trademarks appearing in this Annual Report on Form 10-K are the property of their respective holders.
PART I
ITEM 1. BUSINESS
OUR BUSINESS
WSFS Financial Corporation (the Company or WSFS) is a savings and loan holding company headquartered in Wilmington, Delaware. Substantially all of our assets are held by the Company's subsidiary, Wilmington Savings Fund Society, FSB (WSFS Bank or the Bank), one of the ten oldest bank and trust companies in the United States (U.S.) continuously operating under the same name. With $15.8$20.6 billion in assets and $34.6$84.3 billion in assets under management (AUM) and assets under administration (AUA) at December 31, 2021,2023, WSFS Bank is the oldest and largest locally-managed bank and trust company headquartered in the DelawareGreater Philadelphia and Greater PhiladelphiaDelaware region. As a federal savings bank that was formerly chartered as a state mutual savings bank, WSFS Bank enjoys a broader scope of permissible activities than most other financial institutions.
A fixture in the community, WSFS Bank has been in operation for more than 189191 years. In addition to its focus on stellar customer experiences, WSFS Bank has continued to fuel growth and remain a leader in our community. We are a relationship-focused and locally-managed community banking institution.and wealth franchise, complemented by nationwide businesses. Our mission is simple: “We Stand for Service.” Our strategy of “Engaged Associates, living our culture, making a better life for allenriching the Communities we serve” focuses on exceeding customerCustomer expectations, delivering stellar experiences and building customer advocacy through highly-trained, relationship-oriented, friendly, knowledgeable and empowered Associates. As of December 31, 2021,2023, we serviced our Customers primarily from our 112114 offices located in Pennsylvania (52)(57), Delaware (42)(40), New Jersey (16)(14), VirginiaFlorida (1), Nevada (1) and NevadaVirginia (1), our ATM network, our website at www.wsfsbank.com and our mobile apps.
Subsidiaries
As of December 31, 2021,2023, the Company had six consolidated subsidiaries: WSFS Bank, The Bryn Mawr Trust Company of Delaware (BMT-DE), Bryn Mawr Capital Management, LLC (BMCM), WSFS Wealth Management, LLC (Powdermill®), WSFS CapitalSPE Services, LLC, and 601 Perkasie, LLC.
•BMT-DE, a Delaware state chartered non-depository trust company, supplements our existing Wealth Management LLC (West Capital),segment by offering Delaware advantage trust services including directed trusts, asset protection trusts and dynasty trusts via centers of influence such as estate planning attorneys. BMT-DE has approximately $53.0 billion in AUM and AUA at December 31, 2023.
•BMCM is a registered investment adviser and provides fee-only asset management services. On January 1, 2023, WSFS subsidiaries Cypress Capital Management, LLC (Cypress), Christiana Trust Companyand West Capital Management, LLC merged and rebranded as BMCM. In the third quarter of 2023, BMCM expanded its business in Southern Delaware® (Christiana Trust DE), and WSFS SPE Services, LLC.established a new presence in Boca Raton, Florida with the acquisition of a registered investment advisory firm's business based in Rehoboth Beach, Delaware. BMCM had approximately $3.3 billion in AUM and AUA at December 31, 2023.
•Powdermill® provides multi-family office services to affluent clientele in the local community and throughout the U.S.
•West Capital, a registered investment adviser, provides fee-only wealth management services tailored to the needs of high net worth individuals operating under a multi-family office philosophy. West Capital had approximately $947.5 million in AUM at December 31, 2021, compared to approximately $806.5 million at December 31, 2020.
•Cypress provides asset management services. As a registered investment adviser and fee-only wealth management firm, Cypress had approximately $1.3 billion in AUM at December 31, 2021 compared to approximately $1.2 billion at December 31, 2020.
•Christiana Trust DE supplements our existing Wealth Management segment by offering Delaware advantage trust services including directed trusts, asset protection trusts and dynasty trusts.
•WSFS SPE Services, LLC provides commercial domicile services which include providing employees, directors, subleases of office facilities and registered agent services in Delaware and Nevada.
•601 Perkasie, LLC was formed to hold certain tax credit investments.
As of December 31, 2021,2023, WSFS Bank had two wholly ownedwholly-owned subsidiaries: Beneficial Equipment Finance Corporation (BEFC), and 1832 Holdings, Inc. WSFS Bank had one majority-owned subsidiary, NewLane Finance Company (NewLane Finance®).
•BEFC, a small equipment and fixed assets leasing company, was acquired during the Beneficial Bancorp, Inc. (Beneficial) acquisition and is in the business of leasing small equipment and fixed assets.acquisition. Subsequent to the Beneficial acquisition, theBEFC ceased origination of new leases and its leasing operations of BEFC were combined with NewLane Finance®, described below.
•1832 Holdings, Inc. was formed to hold certain debt and equity investment securities.
•NewLane Finance® originates small business leases and provides commercial financing to businesses nationwide, targeting various equipment categories including technology, software, office, medical, veterinary and other areas. In addition, NewLane Finance® offers new product offerings for insurance through a newly-formedits subsidiary, Prime Protect.
As of December 31, 2021,2023, WSFS had onethree unconsolidated subsidiary,subsidiaries, WSFS Capital Trust III (the Trust), whichRoyal Bancshares Capital Trust I, and Royal Bancshares Capital Trust II.
•The Trust was formed in 2005 to issue $67.0 million aggregate principal amount of Pooled Floating Rate Capital Securities. These securities are currently callable and have a maturity date of June 1, 2035. The proceeds from this issue were used to fund the redemption of $51.5 million Floating Rate WSFS Capital Trust I Preferred Securities (formerly, WSFS Capital Trust I). WSFS Capital Trust I invested all of the proceeds from the sale of the Pooled Floating Rate Capital Securities in our Junior Subordinated Debentures. Although WSFS owns $2.0 million of the common securities of the Trust, the Trust is not consolidated into the Company’s Consolidated Financial Statements as the Company is not deemed to be the primary beneficiary of the entity.
•Royal Bancshares Capital Trust I (Trust I) and Royal Bancshares Capital Trust II (Trust II) (collectively, the RBC Trusts), which were acquired from Bryn Mawr Bank Corporation. The RBC Trusts were utilized for the sole purpose of issuing and selling capital securities representing preferred beneficial interests. Although WSFS owns an aggregate of $0.8 million of the common securities of Trust I and Trust II, the RBC Trusts are not consolidated into the Company’s Consolidated Financial Statements as the Company is not deemed to be the primary beneficiary of these entities.
Segment Information
For financial reporting purposes, our business has three segments: WSFS Bank, Cash Connect® and Wealth Management. The WSFS Bank segment provides loans and leases, deposits and other financial products to commercial and retailconsumer customers. Cash Connect® provides ATM vault cash, smart safe and other cash logistics services in the U.S, through strategic partnershipsservicing non-bank ATMs and smart safes nationwide and supporting ATMs for WSFS Bank Customers with severalone of the largest branded ATM networks manufacturers and service providers in the cash logistics industry.our region. The Wealth Management segment provides a broad array of planning and advisor services, investment management, personal and institutional trust services, and credit and deposit products to individuals, corporate, and institutional clients.
WSFS Bank
As of December 31, 2021,2023, WSFS Bank's banking business had a total loan and lease portfolio of $7.9 billion, which was funded primarily through commercial relationships and retail and customer-generated deposits.$12.8 billion. We have built a $6.2$9.9 billion commercial loan and lease portfolio by recruiting seasoned commercial lenders in our markets, offering the high level of service and flexibility typically associated with a community bank and through acquisitions. We fund this businessour lending businesses primarily with deposits generated through commercial relationships and retailconsumer deposits, as well as through our digital banking platforms.
WSFS Bank also offers a broad variety of consumer loan products, retail securities and insurance brokerage services through our retail branches, and mortgage and title services in collaboration withthrough WSFS Mortgage®. Our WSFS Mortgage® business is a mortgage banking company and abstract and title company specializing in a variety of residential mortgage and refinancing solutions.
Cash Connect®
Our Cash Connect® business is a premier provider of ATM vault cash, smart safe (safes that automatically accept, validate, record and hold cash in a secure environment) and other cash logistics services through strategic partnerships with several of the largest networks, manufacturers and service providers in the U.S.ATM industry. Cash Connect® services non-bank and WSFS-branded ATMs and smart safes nationwide. As of December 31, 2021,2023, Cash Connect® manages approximately $1.7$1.9 billion in total cash and services approximately 27,40033,000 non-bank ATMs and approximately 6,3008,700 smart safes nationwide. Cash Connect® provides related services such as online reporting and ATM cash management, predictive cash ordering and reconcilement services, armored carrier management, loss protection ATM processing equipment sales and deposit safe cash logistics. As of December 31, 2021,2023, Cash Connect® also supports over 600590 owned andor branded ATMs for WSFS Bank, which has one of the largest branded ATM networks in our market.
Wealth Management
Our Wealth Management business provides a broad array of planning and advisory services, investment management, trust services, and credit and deposit products to individual, corporate, and institutional clients through multiple integrated businesses.clients. Combined, these businesses had $34.6$84.3 billion of AUM and AUA at December 31, 2021. WSFS Wealth2023.
Bryn Mawr Trust® Investments provides financialis our predominant Private Wealth Management brand, providing advisory, investment management and trustee services to institutions, affluent and high-net-worth individuals. Private Wealth Management, which includes Private Banking, serves high-net-worth clients and institutions by providing trustee and advisory services, along with insurancefinancial planning, customized investment strategies, brokerage products such as annuities and brokerage products. Cypress,customized banking services including credit and deposit products tailored to its clientele. Private Wealth Management includes businesses that operate under the bank’s charter, through a broker/dealer and as a registered investment adviser, is aadvisor (RIA). It generates revenue through fee-only wealth management firm managing a “balanced” investment style portfolio focused on preservation of capitalarrangements, net interest income and generating current income. West Capital, a registered investment adviser, is aother fee-only wealth management firm operating under a multi-family office philosophy to provide customized solutions to institutionsservices such as estate administration, trust tax planning and high-net-worth individuals. The trust division of WSFS, comprised of WSFS Institutional Services® and Christiana Trust DE, provides trustee, agency, bankruptcy administration, custodial and commercial domicile services to institutional and corporate clients and special purpose vehicles. Christiana Trust DE also provides personal trust and fiduciary services to families and individuals across the U.S. Powdermill®custody. Powdermill® is a multi-family office specializing in providing independent solutions to high-net-worth individuals, families and corporate executives through a coordinated, centralized approach.
The Bryn Mawr Trust Company of Delaware provides personal trust and fiduciary services to families and individuals across the U.S. and internationally. WSFS Wealth Client Management serves high-net-worthInstitutional Services® provides trustee, agency, bankruptcy administration, custodial and commercial domicile services to institutional, corporate clients by delivering credit and deposit products and partnering with other Wealth Management businesses to provide comprehensive solutions to clients.special purpose vehicles.
For segment financial information for the years ended December 31, 2021, 20202023, 2022 and 2019,2021, see Note 21 to the Consolidated Financial Statements in this report.
Recent Business Developments
•Acquisition and Integration Efforts: On January 1, 2022, we completed our acquisition of Bryn Mawr Bank Corporation (BMBC), a Pennsylvania corporation and the parent holding company of The Bryn Mawr Trust Company, a Pennsylvania chartered bank and wholly owned subsidiary of BMBC. Our bank technology, branding, and branch conversion is scheduled to occur later in the first quarter of 2022, with our Trust and Wealth integration expected to follow in late 2022 or early 2023. Throughout this document, we refer to these acquired entities collectively as “Bryn Mawr Trust.”
•Upstart Strategic Partnership: During 2021 we launched our strategic partnership with Upstart Holdings, Inc. (Upstart), a leading white label lending-as-a-service platform provider specializing in risk-based priced unsecured consumer loans. With this relationship WSFS is now able to deliver an AI enabled underwriting program customized to our specifications. The Upstart partnership enables WSFS to digitize our unsecured personal loan product, acquire new in-footprint customers, and provides cross-sell opportunities within our footprint.
•Future Forward: Throughout the COVID-19 pandemic, our Retail branch office locations remained open servicing our Customers while following the recommended Federal, State and local guidance, including appropriate personal protective equipment and social distancing. During 2021, we began a phased transition to the office at our corporate locations with approximately 30% of Associates in these locations working from the office at least 3 days per week. As we move into 2022, we look to further expand our Future Forward initiative and transition more Associates into office locations while taking the appropriate precautions. Our Future Forward strategy is also focused on our current and future office capacity and including assessment of our current space utilized by us and potential for optimization in this area. This strategy will continue to evolve as we progress into 2022.
WSFS DIFFERENTIATION STRATEGY
While most banks offer similar products and services, weWe believe that WSFS, through its provenour unique competitive position in our market as the only community bank with a full suite of product offerings to compete with larger institutions, diversified and resilient fee income, and high-touch customer service, model, sets itself apart from other banks in our market and the industry in general. In addition, community banks such as WSFS have been able to distinguish themselves from large national or international banks by providing our Customers with the service levels, responsiveness and local decision making they prefer.
Our focus on this differentiation strategy supports our core franchise with a mix of organic and acquisition-related growth and builds value for our stockholders. Since December 31, 2017,2018, our commercial loans and leases, which exclude loans held-for-sale, have grown 146% from $4.0 billion to $6.2$9.9 billion at December 31, 2021, a 9% compound annual growth rate (CAGR).2023. Over the same period, customer deposits have grown 202% from $5.0$5.4 billion to $13.2 billion, a 21% CAGR. For further details, refer to the Comparative Stock Performance Graph in Item 5. Market for Registrant’s Common Equity, Related Stockholder Matters and Issuer Purchases of Equity Securities.$16.4 billion.
The following factors summarize what we believe is our differentiation strategy:
Our Mission
We Stand for Service® is our mission and our daily call to action. Since 1832, WSFS has been a service-oriented, locally managedlocally-managed community banking institution serving Greater Philadelphia and Delaware Valleyregion families and businesses. We strive to meet our Customers’ evolving banking needs and to exceed their expectations each and every day.
Values
Our values address integrity, service, accountability, transparency, honesty, growth and desire to improve. They are the corefoundation of our culture. They define us and serve as our moral compass. Our values are rooted in integrity; we do the right thing, unconditionally. We live our values every day; they nourish our culture they make us whoand practiced over time, become “the WSFS way.” Our values are the fuel that ignites our virtuous cycle: when we aredo well, our Community does well and when our Community does well, we live them every day.
At WSFS, we:do well.
•Do the right thingService: Serving others is fundamental to our mission and grounds our purpose. We serve by listening, caring, collaborating, volunteering and “getting things done” for those who rely on us to be there for them.
•Serve othersTruth: The truth is non-negotiable. The truth brings clarity to a challenging situation or sensitive matter; it guides us with confidence and conviction. Being open and honest earns trust and underpins our conversations, decisions and communications.
•Are welcoming, openRespect: We value and candid
•Growrespect each other and improveall we serve. The many unique attributes of our team makes us stronger. Respecting others’ beliefs, experiences, perspectives and feelings sparks dialogue, facilitates learning and growth, drives change, inspires innovation and builds valued relationships.
Human SigmaEngagement and Culture
Our business model is designed using the science of Human Sigma, which is built on a foundation of engagement. The Human SigmaOur model identified by Gallup, Inc. (Gallup), begins with Associates (employees) who take ownership for their responsibilities and impact; as such, they are more likely to consistently perform at a higher level. We significantly invest in our culture ofand engagement which underpinsas they underpin all that we do at WSFS, including attracting, inspiring and retaining our Associates, delivering stellar Customer experiences and strengthening the well-being of our communities. Our culture is based on the fundamental principal of “a really good life.”communities as evidenced by our Vision: "We envision a day when everyone will thrive." Our strategy, “Engaged Associates, living our culture, making a better life for allenriching the Communities we serve” builds upon that principal.

Our strategy in action starts aour virtuous cycle whereby, as we do better, our community does better and as our community does better, we do better.cycle. It’s a simple premise that plays out in a big way every day. Research studies validate the direct link between engagement and a company’s financial performance. Our strategy, which drives our virtuous cycle, ensuresis built upon that research and reinforces our culture that is evidenced in our Company results.
Human Resources
At December 31, 2021,2023, we had 1,8392,229 full-time equivalent Associates. Our Associates are not represented by a collective bargaining unit and we believe our relationship with our Associates is strong.
During 2021,2023, WSFS captured the voice of our Associates and our Customers through multiple channels including our ongoing partnership with Gallup Inc. (Gallup), which was used to measure our Associate and Customer engagement.
Surveys conducted for us by Gallup indicate that, in 2021:
•Our Associate engagement survey results placed WSFS in the 93rd88th percentile of Gallup's global overall company-level database. Our Associate engagement ratio was 16.5:12.4:1, which means there were 16.512.4 engaged Associates for every actively disengaged Associate. This compares to a U.S. working population ratio of 2.1:1.
•Our culture of inclusion index of 4.484.38 placed WSFS in the 74th percentiletop quartile of Gallup's global overall workgroup-level database. We believe these results reflect that Associates are encouraged to be themselves, are a valued part of their teams, experience strength-based developments, have inclusive conversations and trust in the Company's mission, values and leadership.
•62.7% of Customers surveyed ranked WSFS a “five” out of five, strongly agreeing with the statement “WSFS is the perfect bank for people like me,” which placed WSFS in the 71st percentile of Gallup's global overall customer database. Our Customer engagement ratio was 6.1:1, which means there were 6.1 engaged Customers for every actively disengaged Customer.
•Customer loyalty grewremained consistent during the year, as measured by our Net Promoter Scores (NPS). Our branch networkWSFS achieved an overall NPS of 79.368.1 in 2021 compared to 72.3 in 2020. The fourth quarter of 2021 resulted2023, which placed WSFS in the highest quarter performance since program inception.top quartile of Medallia's global database of financial services companies for relationship surveys.
By fostering a culture of engaged and empowered Associates, we believe we have become the employer and bank of choice in our market. In 2021,2023, we were honored to receive the following accolades:
•Ranked #10 in the United States on the Forbes America’s Best Banks Listing;
•Received The Gallup Exceptional Workplace Award for the fifthseventh time;
•Named a Top Workplace in Delawareto Forbes' list of America's Best Banks for the 15thfourth year in a row;
•Named a Top Workplace2023 honoree of The Civic 50 Greater Philadelphia by the Philadelphia Foundation, in Philadelphiapartnership with Points of Light and southeastern PAother local partners, for the seventhsecond year in a row;
•Selected as Reader's Pick for Named to the 'Soaring 76', recognizing us as one"Best of the 76 fastest growing companiesBiz" for Customer Service in the Greater Philadelphia region for the fifth yearSouth Jersey Magazine;
•Recognized in a row by the Philadelphia Business Journal;Newsweek's List of America's Best Regional Banks and Credit Unions 2024; and
•Named "Bestone of Biz Editor's Pick" for customer serviceAmerica's Best Midsize Employers in 2023 by Forbes.
During 2023, our Associates continued to embody our strategy through the South Jersey Business Magazine; andfollowing community enrichment activities:
•Volunteered more than 18,000 hours during 2023 through Team WSFS, our corporate volunteer program;
•Recognized by The ForumIn June, we held our first-ever "We Stand for Service Day", during which approximately 1,200 of Executive Women as a "Championour Associates provided nearly 5,000 hours of Board Diversity."
Diversity, Equityservice to more than 80 nonprofit and Inclusion
Diversity, Equitycommunity organizations across the Greater Philadelphia, Southern New Jersey and Inclusion (DE&I) is rooted in the values of WSFS, which is led by our Director of DE&I, Michelle Burroughs, who was hired in October 2021. Our DE&I efforts focus on educating, supporting, managing and implementing diversity and inclusion strategies and programs, and creating and delivering initiatives designed to sustain a culture of inclusion.
During 2021, the Company completed the following DE&I accomplishments:
•Created DE&I Strategic Pillars and socialized with Executive Leadership Team;Delaware region.
•CompletedWe contributed $4.9 million to the DE&I Steering Committee Charter and structure;WSFS CARES Foundation, the charitable giving arm of WSFS Bank, to enhance community support activities, which included a one-time $2.0 million special contribution in the fourth quarter.
•Established 2022 Focus Areas for DE&I Steering CommitteeThe WSFS CARES Foundation provided grants and Strategic Pillars;
•Completed "Listening Tours" with approximately 50 Associatesdonations totaling more than $2.7 million to capture qualitative data regarding DE&I;more than 390 community organizations located across Delaware, New Jersey and
•Established report routine with Voice Pennsylvania, bolstering our key pillars of Customer team that will review Customer discrimination data.support including community investments, affordable housing, revitalization and business economic empowerment, education and leadership development, and strengthening those in need.
Diversity, Equity and Inclusion
Beyond having diverse talent and Customers, WSFS works to create a truly inclusive environment with opportunities to find commonalities, build relationships and provide support to our diverse Communities from different backgrounds and cultures. We are committed to enhancing workforce diversity, creating developmental opportunities and continually improving hiring practices to retain our status as an employer of choice.
During 2023, the Company completed the following Diversity, Equity, and Inclusion (DEI) accomplishments:
•The number of Associates engaged as members of one or more Resource groups more than doubled compared to 2022.
•Launched the inaugural cohort of a formalized, 9-month mentoring program for Associates in Resource Groups.
•Implemented monthly challenges to increase leadership opportunities to engage in DEI trainings, conversations, and activities.
•Developed an interactive DEI scorecard to assist with monitoring trends and reporting data for each Executive Leadership Team member.
•Facilitated Implicit Bias and Ally Training to Associates.
•Successfully launched an external DEI page on the company website.
•Integrated the ability to display pronouns into email signatures.
•Established DEI engagement goals for Executive Leadership Team.
•Implemented a recognition program which allows Associates the opportunity to recognize colleagues for demonstrating behaviors that promote inclusion and belonging.
Community Banking Model
Our size and community banking model play a key role in our success. Our approach to business combines a service-oriented culture with a full complement of products and services, all aimed at meeting the needs of our retail,consumer, business and wealth Customers. We believe the essence of being a community bank means that we are:
•Small enough to offer Customers responsive, personalized service and direct access to decision makers, yet
•Large enough to provide the products, services and balance sheet lending capacity needed by our target market Customers.
As the financial services industry has consolidated, many independent banks have been acquired by national companies that have centralized their decision-making authority and focused their product offerings on a regional or even national customer base. As a result, many of these banks have lost the deep knowledge of the local markets expected by our Customer base. We believe this trend has underserved small and medium size business owners who have become accustomed to dealing directly with their bank’s senior executives, discouraged retailconsumer customers who often experience deteriorating levels of service in branches and other service outlets, and resulted in less empowered bank employees who are less engaged to provide good and timely service to their customers.
We have created the largest, premier, locally-headquarteredlocally headquartered community bank in the DelawareGreater Philadelphia and Greater PhiladelphiaDelaware region, offering the benefits of local market knowledge and decision-making, a full-service product suite, the balance sheet to compete with larger regional and national banks, and most importantly, a culture of engaged Associates that bring to life WSFS’ mission of We Stand For Service in our daily delivery of stellar Customer experiences.
WSFS Bank offers:
•One primary point of contact: Each of our relationship managers is responsible for understanding his or hertheir Customers’ needs and bringing together the right resources in WSFS Bank to meet those needs.
•A customized approach to serving our Customers: We believe that this gives us an advantage over our competitors who are too large or centralized to offer customized products or services.
•Products and services that our Customers value: This includes a broad array of banking, cashtreasury management, capital markets and trust and wealth management products, as well as a legal lending limit high enough to meet the credit needs of our Customers, especially as they grow.
•Rapid response and a company that is easy to do business with: Our Customers tell us this is an important differentiator from larger in-market competitors.
Our Diversified Business
Diversified Revenue Streams
With over 25 discrete lines of business, our diversified revenue model is a key differentiator for the Company. We focus on relationship-based lending which provides the potential for higher profit margins, more resilient deposits and strong consumer relationships. In addition, our diversified fee revenue businesses, which include banking fees, Wealth, Trust, Cash Connect®, and capital markets, account for 32.8% of our noninterest income and further differentiate us from our peers and provide additional growth opportunities for the Company.
Balance Sheet Management
We put a great deal of focus on actively managing our balance sheet. This manifests itself in:
•Prudent capital levels - Maintaining prudent capital levels is key to our operating philosophy. At December 31, 2021 all regulatory capital levels for the Bank were in excess of "well-capitalized" levels. For the capital position of the Bank and the Company, refer to Note 13 of the Consolidated Financial Statements. At December 31, 2021, the Company's common equity to assets ratio was 12.29% and its tangible common equity to tangible assets ratio, which is a non-GAAP financial measure, was 9.14%. For a reconciliation of tangible common equity and tangible assets to net income and total assets, the most comparable measures in accordance with U.S. generally accepted accounting principles (GAAP), refer to “Reconciliation of non-GAAP financial measures included in Item 1” located at the end of this section.
•Disciplined lending - We maintain discipline in our lending with a particular focus on portfolio diversification and granularity. Diversification includes limits on loans to one borrower as well as industry and product concentrations. We supplement this portfolio diversification with a disciplined underwriting process and the benefit of knowing our customers. We have also taken a proactive approach to identifying credit-related trends in our local economy and have responded to areas of concern.
•Focus on credit quality - We seek to control credit risk in our investment portfolio and use this portion of our balance sheet primarily to help us manage liquidity and interest rate risk, while providing marginal income and tax relief. Our philosophy and pre-purchase due diligence have allowed us to control credit risk in our investment portfolio.
•Asset/liability management strategies - Our investment portfolio is consistent with the approved risk appetite of our Board of Directors. We work to optimize duration, yield and liquidity and to minimize credit risk within policy guidelines. The concentration in agency MBS (98%(96% of investment portfolio) and bank qualified municipal bonds (2%(4% of investment portfolio) provides liquidity, yield and credit to meet the intended risk profile.
Disciplined Capital Management
We understand that our capital (or stockholders’ equity) belongs to our stockholders. They have entrusted this capital to us with the expectation that it will earn an appropriate return relative to the risks we take. Mindful of this balance, we prudently, but aggressively, manage our capital.
Maintaining prudent capital levels is key to our operating philosophy. At December 31, 2023 all regulatory capital levels for the Bank were in excess of "well-capitalized" levels. For the capital position of the Bank and the Company, refer to Note 13 of the Consolidated Financial Statements. At December 31, 2023, the Company's common equity to assets ratio was 12.03% and its tangible common equity to tangible assets ratio, which is a non-GAAP financial measure, was 7.52%. For a reconciliation of tangible common equity and tangible assets to net income and total assets, the most comparable measures in accordance with U.S. generally accepted accounting principles (GAAP), refer to “Reconciliation of non-GAAP financial measures included in Item 1” located at the end of this section.
We continue to execute our current Board-approved share repurchase plan,plans, as well as any future Board-approved share repurchase plans, including opportunistically repurchasing shares, based on current valuation levels, above our stated practice of returning a minimum of 25%35% of annual net income to stockholders through dividends and share repurchases. All share repurchases were temporarily suspended upon the announcement of the signing of the Merger Agreement with BMBC on March 10, 2021. We resumed repurchases during the first quarter of 2022 following the close of our combination with Bryn Mawr Trust on January 1, 2022.
Performance Expectations and Alignment with Stockholder Priorities
We are focused on high-performing, long-term financial goals. We define “high-performing” as the top quintile of a relevant peer group in return on assets (ROA).key financial metrics. Management incentives are, in large part, based on driving performance of ROA as well as return on average tangible common equity (ROTCE), which is a non-GAAP financial measure, and EPS growth.EPS. More details on management incentive plans will be included in the proxy statement for our 20222024 Annual Meeting of Stockholders.
For the year ended December 31, 2021,2023, WSFS reported ROA of 1.82%1.33%. Core ROA, which excludes non-core items and is a non-GAAP financial measure, was 1.80%1.38% for the year ended December 31, 2021.2023.
Core ROA for 20212023 excludes (i) securities gains, (ii) realized and realized/unrealized gains and losses on equity investments, net,(ii) valuation adjustments related to our derivative liability established from the sale of 360,000 Visa Class B shares in 2Q 2020, (iii) loss on debt extinguishment,FDIC special assessment, (iv) corporate development and restructuring expense, (v) recovery of legal settlement,certain contributions to the WSFS CARES Foundation, and (vi) contributionincome tax adjustments related to WSFS CARES Foundation.bank-owned life insurance (BOLI) policy surrender.
For a reconciliation of Core ROA to ROA, the most comparable GAAP measure, refer to “Reconciliation of non-GAAP financial measures included in Item 1” located at the end of this section.
Growth Plans
We have achieved success over the long-term in lending and deposit gathering, growing the Wealth Management segment’s client base and product offerings and growing Cash Connect®’s customer base and services. Our success has been the result of a focused strategy that provides service, responsiveness and careful execution in a consolidating marketplace.
We plan to continue to grow by:
•DevelopingRecruiting and developing talented, service-focused Associates: We have successfully recruited Associates with strong ties to, and the passion to serve, their communities to enhance our service in existing markets and to provide a strong start in new communities. We also focus on developing talent and leadership from our current Associate base to better equipprepare those Associates for their jobsroles and prepare them for leadership roles at WSFS.to ensure we have bench strength across our various lines of business. Our strategy continues to be diligent on attracting, retaining and rewarding the best talent, which we believe has positioned us well in the current climate of the Great Resignation that has seen many employees of U.S. companies reconsider their priorities and voluntarily resign.climate.
•Embracing the Human Sigma concept: We are committed to building Associate Engagementengagement and Customer Advocacyloyalty and advocacy as a way to differentiate ourselves and grow our franchise.
•Building fee income through investment in and growth of our Wealth Management and Cash Connect® segments.
◦Wealth Management experienced near-record growth during 2021 in AUA/AUM and corresponding AUM-based revenues largely due to market performance.ended 2023 31% above 2022 balances. WSFS Institutional Services® ended 20212023 as the securitization industry's fourth most active trustee for U.S. Asset and Mortgage Backed Securities by number of deals completed according to Asset-Backed Alert’s ABS Database.
◦Cash Connect® saw sustained demand forincreased fee revenue due to the rising interest rate environment, increasing market share in the ATM vault cash space, and related services duringcontinued growth in the on-going COVID-19 pandemic, andsmart safe space. The division, in partnership with our retail strategy, continued to serve the DelawareGreater Philadelphia and the Greater PhiladelphiaDelaware region through the WSFS ATM network. The number of owned andor branded ATMs was 609590 as of December 31, 2021.2023.
•Continuing strong growth in commercial and retailconsumer lending by:
◦Offering local decision-making by seasoned banking professionals with significant local market experience.
◦Executing our community banking model that combines stellar experiences with the banking products and services our business customers demand.
◦Continuing to grow our NewLane Finance® leasing business.
◦Adding seasoned lending professionals that have helped us win customers in our Delaware, southeastern Pennsylvania and southern New Jersey markets, which contributes to our expanding commercial small business leasing portfolio and residential, small business and SBA portfolios in the footprint we operate.markets.
◦Leveraging our strategic partnership withpartnerships, including Spring EQ, LLC, Upstart, a leading white label lending-as-a-service platform provider specializing in risk-based priced unsecured consumer loans, which we launched in 2021.LendKey Technologies, Inc, and Cred Technologies (cred.ai).
•Continuing to grow deposits by:
◦OfferingProviding a stellar experience to our Customers and offering products through an expanded and updatedour branch network, increasing our market presence in Philadelphia,Delaware, southeastern Pennsylvania and southern New Jersey.
◦Providing a stellar experience to our Customers.
◦Further expanding our commercialCommercial and Small Business Customer relationships with deposit and cash management products.
◦Expanding services within WSFS Institutional Services® and increasing cross-sell opportunities within Private Wealth Management.
◦Finding creative ways to build deposit market share such as targeted marketing programs.
•Continuing investment inEnhancing our Delivery Transformation initiative (described in greater detail in “Innovation” below)capabilities to increase adoption and usageserve the needs of digital channels aligned with our strategyCustomers through our Capital Markets division by:
◦Improving branch NPS scoresMaking strategic investments to build our Interest Rate Derivatives, Foreign Exchange, and expanding NPS surveys to our contact center.Trade Finance lines of business.
◦Deploying MedalliaEmploying products and services that enable customers to better manage their own market risk exposures, providing additional sources of non-interest fee income for real-time customer feedback from our branches and contact center.
◦Expanding DocuSign capabilities to improve turnaround time and document retention across the Company.
◦Executing multichannel target marketing campaigns with our Customers.Making continued investments in a team of highly experienced markets personnel and improved technology solutions.
◦Implementing Salesforce to support our customer relationship managementDelivering the capabilities of a globally capable financial institution with focus on change management, adoption and governance.a locally headquartered team that is fully embedded in the WSFS culture.
•Seeking targeted, strategic opportunities in our non-banking businesses while we focus on optimizing our recent franchise investments.
•Continuing investment in our franchise to increase adoption and usage of digital channels aligned with our strategy by
◦Enabling business outcomes through optimizing and leveraging the full capabilities of current and future investments in our franchise to increase Associate efficiencies and improve the overall Customer experience.
◦Building out Salesforce to support our customer relationship management with focus on change management, adoption and governance
◦Increased control, transparency, automation & efficiencies through platform integrations, enhancements and bot implementations
◦Advancing how we use data, the deployment of artificial intelligence, and predictive modeling to create operational efficiencies and redesign business models
◦Continue to build upon people, processes and controls within a focus on information security and fraud prevention
Disciplined Cost Management
We maintain a disciplined cost management strategy while continuing to make prudent investments in our businesses through the lens of our Strategic Plan. This wasis evident in management's execution of the cost synergies and branch optimization plan following the acquisition of Beneficial. Further, we have experienced and continue to anticipate increased costs as a result of our previously announced Delivery Transformation initiative andcontinued investment in marketing technology,the franchise, fully supported by business cases indicating strong return on investment, and driving our future growth.
Innovation
Our organization is committed to product and service innovation as a means to drive growth and to stay ahead of changing customer demands and emerging competition. We are focused on developing and maintaining a strong “culture of innovation” that solicits, captures, prioritizes and executes innovation initiatives, including feedback from our customers, as well as leveraging technology from product creation to process improvements. Cash Connect®, a premier provider of ATM vault cash, smart safe and other cash logistics services in the U.S., serves as an innovation engine by driving enhancements such as mobile phone cash withdrawals from WSFS ATMs, and has developed best-in-class cash logistics and reconciliation software. WSFS Institutional Services®, which offers owner and indenture trustee services for asset-backed securities, custody, escrow, verification agent services as well as numerous other services, has partnered with several technology firms and fintechs to enhance and expand our client offerings. These innovations have created internal efficiencies and valued services for our local banking customers, institutional clients and merchants across the nation. We intend to continue to leverage technology and innovation to grow our business and to successfully execute on our strategy.
In 2019, we embarked on a multi-year Delivery Transformation initiative focusedWe maintain an organizational philosophy of continuous, prudent investment in technology to continue to meet our customer needs. We focus on melding our physical and digital delivery, consistent with our brand, by enabling our Associates with the latest technology and actionable data to better serve our Customers. Industry and customer behavior trends continue to shift as observed in reduced branch traffic and increased mobile adoption.digital channel adoption. As such, we have concluded that we need to stay nimble as we transform our delivery channels to meet these new expectations. Our transformationcontinued investment includes optimizing our physical branch network and making strategic investments in meaningful technology solutions, supported by specialized talent. Those investments are expected to provide our Customers with leading edge products and elevate our Associates, as they strive to serve in a competitive and compelling way. We are designing and integrating solutions to provide personalized experiences to our Customers, while retaining the essence of what makes WSFS great. Through our Delivery Transformationinvestments in the franchise and our ongoing commitment to Stellar Service, we intend to continue to lead the community and regional banking industry with regards to service delivery and Customer experience.
Our organization is committed to product and service innovation as a means to drive growth and to stay ahead of changing customer demands and emerging competition. We are focused on developing and maintaining a strong “culture of innovation” that solicits, captures, prioritizes and executes innovation initiatives, including feedback from our customers, as well as leveraging technology from product creation to process improvements.We have embraced a partnership model to help diversify our consumer business and learn from innovators in the industry. We position ourselves with strategic partners when it is the best experience for our Customers and aligned to our strategic plan. Through these partnerships, we look forward to offering and supporting even more innovative products to the financial services marketplace, continuing our organizational learning in this fast-developing space, and participating in value creation for our stockholders. These current partnerships include:
•LendKey Technologies, Inc.: A digital lending platform that specializes in student loans and student loan refinancing.
•Spring EQ, LLC: A digital mortgage solution specializing in home equity, refinancing, cash out, and home purchase loans.
•Cred Technologies (cred.ai): A Philadelphia-based fintech company that provides a high-tech, mobile-first everyday card spending experience. Through our partnership with cred.ai, we issue credit cards and provide deposit accounts.
•Upstart: A leading white label lending-as-a-service platform provider specializing in risk-based priced unsecured consumer loans. Our partnership with Upstart allowed us to expand our personal loan offerings to a wider, more inclusive Customer base while diversifying our business and creating more digital-friendly Customer experiences.
Previously, we partnered with•LendKey Technologies, Inc.: A digital lending platform that specializes in student loans and made an investment in Social Finance, Inc. (SoFi), an online personal financestudent loan refinancing.
•Cred Technologies (cred.ai): A Philadelphia-based fintech company that provides a full suite of products. During 2021,high-tech, mobile-first everyday card spending experience. Through our partnership with cred.ai, we liquidated our investment in SoFi for a net gain of $4.4 million.issue credit cards and provide deposit accounts.
Enterprise Risk Management
We manage our risks through our Enterprise Risk Management (ERM) program administered by the Chief Risk Officer (CRO) and ERM department. Our stand-alone ERM department is separate from our lines of business. Formal Risk Appetite Statementsrisk appetite statements have been developed for each risk category throughout the institution; these statements are reviewed and approved by the Board annually. From a regulatory perspective, our ERM program is evaluated as part of the regular Safety and Soundness examination by the Office of the Comptroller of the Currency (OCC).
Key Risk Indicators (KRIs) or Riskrisk metrics are continually monitored in relation to risk appetite though a Risk Assessment Summary dashboard. Each KRI has an assigned quantitative tolerance level which considers our overall risk appetite, regulatory requirements, the bank’s peer group statistics, best practices, and general industry guidelines. As part of our ERM program, approximately 90100 KRIs are monitored company-wide. In the event that risk levels exceed our defined risk appetite, management action is required.
The CRO and the ERM department conduct meetings with managementfacilitates a risk liaison program, consisting of individuals in the first line of defense that monitor and report risks from their respective business lineslines. ERM engages and support areashas credible challenge discussions with Risk Liaisons and business line leaders to discuss and gather information for ERM reporting. ERM reporting is also provided to the Board of Directors quarterly. In addition, our Management Risk Committee (MRC), which meets each quarter, provides management governance and oversight of the Company's risk management program on an enterprise-wide basis, and includes members of the Company's executive and senior management teams.
Market Demographics
Our primary market is Delaware and the Greater Philadelphia and Delaware region, including southeastern Pennsylvania and southern New Jersey. This market benefits from an urban concentration as well as from a unique political, legal, tax and business environment. The following table shows key demographics for our markets compared to the national average.
| | | | | | | | | | | | | | | | | | | | | | | | | | |
| (Most recent available statistics) | | Delaware | | Southeastern Pennsylvania(1) | | Southern New Jersey(2) | | National
Average |
Unemployment (For November 2021) (3) (4) (5) | | 5.1% | | 4.1% | | 5.0% | | 4.2% |
Median Household Income (2015-2019) (6) | | $68,287 | | $80,261 | | $78,934 | | $62,843 |
Population Growth (2010-2020) (7) | | 10.3% | | 5.2% | | 2.4% | | 7.4% |
| | | | | | | | | | | | | | | | | | | | | | | | | | |
| (Most recent available statistics) | | Delaware | | Southeastern Pennsylvania(1) | | Southern New Jersey(2) | | National
Average |
Unemployment (For November 2023) (3) (4) (5) | | 4.2% | | 2.8% | | 4.2% | | 3.7% |
Median Household Income (2018-2022) (6) | | $79,325 | | $95,554 | | $92,310 | | $75,149 |
Population Growth (2020-2022) (7) | | 3.0% | | (0.5)% | | 0.6% | | 0.5% |
(1)Comprised of Bucks, Chester, Delaware, Montgomery, and Philadelphia Counties
(2)Comprised of Burlington and Camden Counties
(3)Bureau of Labor Statistics - Delaware and National unemployment rates are as of November 2021,2023, seasonally adjusted
(4)Bureau of Labor Statistics - Southeastern Pennsylvania unemployment rate is a simple average of the November 20212023 not seasonally adjusted unemployment rates for Bucks, Chester, Delaware, Montgomery, and Philadelphia Counties
(5)Bureau of Labor Statistics - Southern New Jersey unemployment rate is a simple average of the November 20212023 not seasonally adjusted unemployment rates for Burlington and Camden Counties
(6)U.S. Census Bureau - Quick Facts 20152018 - 20192022
(7)U.S. Census Bureau - Quick Facts 20102020 - 20202022
DISTRIBUTION OF ASSETS, LIABILITIES AND STOCKHOLDERS’ EQUITY
Condensed average balance sheets for each of the last two years and analyses of net interest income and changes in net interest income due to changes in volume and rate are presented in “Results of Operations” included in the section entitled “Management’s Discussion and Analysis of Financial Condition and Results of Operations.”
CREDIT EXTENSION ACTIVITIES
Over the past several years we have focused on growing the more profitable, relationship-oriented segments of our loan portfolio.portfolio as well as growing our consumer portfolio primarily through our consumer partnerships. Our current portfolio lending activity is concentrated on small- to mid-sized businesses in the mid-Atlantic region of the U.S., primarily in Delaware, southeastern Pennsylvania, southern New Jersey, Maryland and northern Virginia. Based on current market conditions, we expect our focus on growing commercial and industrial loans and other relationship-based commercial loans to continue during the remainder of 20222024 and beyond.
The following table shows the composition of our loan and lease portfolio at year-end for the last two years:
| | | |
| | | | | At December 31, | | At December 31, |
| (Dollars in thousands) | (Dollars in thousands) | | 2021 | | 2020 | |
| | | | Amount | | Percent | | Amount | | Percent | |
| | |
| | |
| Types of Loans | Types of Loans | | | | | | | | | |
Commercial and industrial(1) | | $ | 1,918,043 | | | 24.6 | % | | $ | 2,700,418 | | | 30.7 | % | |
| Types of Loans | |
| Types of Loans | |
| Commercial and industrial | |
| Commercial and industrial | |
| Commercial and industrial | |
| Owner-occupied commercial | |
| Owner-occupied commercial | |
| Owner-occupied commercial | Owner-occupied commercial | | 1,341,707 | | | 17.2 | | | 1,332,727 | | | 15.2 | | |
| Commercial mortgages | Commercial mortgages | | 1,881,510 | | | 24.2 | | | 2,086,062 | | | 23.7 | | |
| Commercial mortgages | |
| Commercial mortgages | |
| Construction | Construction | | 687,213 | | | 8.8 | | | 716,275 | | | 8.1 | | |
| Construction | |
| Construction | |
| Commercial small business leases | |
| Commercial small business leases | |
| Commercial small business leases | Commercial small business leases | | 352,276 | | | 4.5 | | | 248,885 | | | 2.8 | | |
| Residential(2) | | 546,667 | | | 7.0 | | | 774,455 | | | 8.8 | | |
Consumer(3) | | 1,158,573 | | | 14.9 | | | 1,165,917 | | | 13.3 | | |
Residential(1) | |
| Residential(1) | |
| Residential(1) | |
Consumer(2) | |
Consumer(2) | |
Consumer(2) | |
| | Gross loans and leases | |
| | Gross loans and leases | |
| | Gross loans and leases | Gross loans and leases | | 7,885,989 | | | 101.2 | | | 9,024,739 | | | 102.6 | | |
| Less: | Less: | | |
| Less: | |
| Less: | |
| | Allowance for credit losses | Allowance for credit losses | | 94,507 | | | 1.2 | | | 228,804 | | | 2.6 | | |
Net loans and leases(4) | | $ | 7,791,482 | | | 100.0 | % | | $ | 8,795,935 | | | 100.0 | % | |
| | Allowance for credit losses | |
| | Allowance for credit losses | |
Net loans and leases(3) | |
Net loans and leases(3) | |
Net loans and leases(3) | |
(1)Includes $31.5 million and $751.2 million of PPP loans at December 31, 2021 and 2020, respectively.
(2)Includes reverse mortgages, at fair value of $3.9$2.8 million and $10.1$2.4 million at December 31, 20212023 and 2020,2022, respectively.
(3)(2)Includes home equity lines of credit, installment loans unsecured lines of credit and education loans.
(4)(3)Excludes $113.329.3 million and $197.5$43.0 million of commercial and industrial loans and residential loans held for sale at December 31, 20212023 and 2020,2022, respectively.
The following table shows the remaining contractual maturity and rate sensitivity of the loan portfolio by loan category as of December 31, 2021.2023. Loans may be pre-paid, so the actual maturity may differ from the contractual maturity. Prepayments tend to be highly dependent upon the interest rate environment. Loans having no stated maturity or repayment schedule are reported in the "Less than One Year" category.
| | (Dollars in thousands) | (Dollars in thousands) | | Less than One Year | | One to Five Years | | Five to Fifteen Years | | Over Fifteen Years | | Total | (Dollars in thousands) | | Less than One Year | | One to Five Years | | Five to Fifteen Years | | Over Fifteen Years | | Total |
Commercial and industrial(1) | | | | | | | | | | |
| Commercial and industrial | |
| Interest rate: | Interest rate: | |
| Interest rate: | |
| Interest rate: | |
| Fixed | |
| Fixed | |
| Fixed | Fixed | | $ | 2,694 | | | $ | 353,443 | | | $ | 184,525 | | | $ | 48,104 | | | $ | 588,766 | |
| Adjustable | Adjustable | | 204,697 | | | 803,975 | | | 295,743 | | | 24,862 | | | 1,329,277 | |
| Total | Total | | $ | 207,391 | | | $ | 1,157,418 | | | $ | 480,268 | | | $ | 72,966 | | | $ | 1,918,043 | |
| Owner-occupied commercial | Owner-occupied commercial | |
| Interest rate: | Interest rate: | |
| Interest rate: | |
| Interest rate: | |
| Fixed | |
| Fixed | |
| Fixed | Fixed | | $ | 3,247 | | | $ | 319,842 | | | $ | 291,038 | | | $ | 206,156 | | | $ | 820,283 | |
| Adjustable | Adjustable | | 14,059 | | | 160,111 | | | 287,282 | | | 59,972 | | | 521,424 | |
| Total | Total | | $ | 17,306 | | | $ | 479,953 | | | $ | 578,320 | | | $ | 266,128 | | | $ | 1,341,707 | |
| Commercial mortgages | Commercial mortgages | |
| Interest rate: | Interest rate: | |
| Interest rate: | |
| Interest rate: | |
| Fixed | |
| Fixed | |
| Fixed | Fixed | | $ | 9,988 | | | $ | 506,952 | | | $ | 233,631 | | | $ | 157,139 | | | $ | 907,710 | |
| Adjustable | Adjustable | | 16,543 | | | 402,286 | | | 492,934 | | | 62,037 | | | 973,800 | |
| Total | Total | | $ | 26,531 | | | $ | 909,238 | | | $ | 726,565 | | | $ | 219,176 | | | $ | 1,881,510 | |
| Construction | Construction | |
| Interest rate: | Interest rate: | |
| Interest rate: | |
| Interest rate: | |
| Fixed | |
| Fixed | |
| Fixed | Fixed | | $ | 788 | | | $ | 19,089 | | | $ | 19,198 | | | $ | 4,817 | | | $ | 43,892 | |
| Adjustable | Adjustable | | 41,108 | | | 479,838 | | | 118,586 | | | 3,789 | | | 643,321 | |
| Total | Total | | $ | 41,896 | | | $ | 498,927 | | | $ | 137,784 | | | $ | 8,606 | | | $ | 687,213 | |
| Commercial small business leases | Commercial small business leases | |
| Interest rate: | Interest rate: | |
| Interest rate: | |
| Interest rate: | |
| Fixed | |
| Fixed | |
| Fixed | Fixed | | $ | — | | | $ | 274,525 | | | $ | 77,751 | | | $ | — | | | $ | 352,276 | |
| Adjustable | Adjustable | | — | | | — | | | — | | | — | | | — | |
| Total | Total | | $ | — | | | $ | 274,525 | | | $ | 77,751 | | | $ | — | | | $ | 352,276 | |
Residential(2) | |
Residential(1) | |
| Interest rate: | |
| Interest rate: | |
| Interest rate: | Interest rate: | |
| Fixed | Fixed | | $ | 684 | | | $ | 25,498 | | | $ | 99,525 | | | $ | 312,979 | | | $ | 438,686 | |
Adjustable(3) | | — | | | 588 | | | 15,681 | | | 87,778 | | | 104,047 | |
| Fixed | |
| Fixed | |
Adjustable(2) | |
| Total | Total | | $ | 684 | | | $ | 26,086 | | | $ | 115,206 | | | $ | 400,757 | | | $ | 542,733 | |
| Consumer | Consumer | |
| Interest rate: | Interest rate: | |
| Interest rate: | |
| Interest rate: | |
| Fixed | |
| Fixed | |
| Fixed | Fixed | | $ | 30 | | | $ | 104,613 | | | $ | 312,498 | | | $ | 303,808 | | | $ | 720,949 | |
| Adjustable | Adjustable | | 14,973 | | | 18,912 | | | 57,369 | | | 346,370 | | | 437,624 | |
| Total | Total | | $ | 15,003 | | | $ | 123,525 | | | $ | 369,867 | | | $ | 650,178 | | | $ | 1,158,573 | |
| Total loans and leases | Total loans and leases | | $ | 308,811 | | | $ | 3,469,672 | | | $ | 2,485,761 | | | $ | 1,617,811 | | | $ | 7,882,055 | |
|
(1) Includes $31.5 million of PPP loans.
(2) Excludes reverse mortgages at fair value of $3.9$2.8 million.
(3)(2) Includes hybrid adjustable-rate mortgages.
Commercial Lending
Pursuant to section 5(c) of the Home Owners’ Loan Act (HOLA), federal savings banks are generally permitted to invest up to 400% of their total regulatory capital in nonresidential real estate loans and up to 20% of their assets in commercial loans, but no more than 10% may be in loans that do not qualify as small business loans. As a federal savings bank that was formerly chartered as a Delaware savings bank, the Bank has certain additional lending authority.
Commercial, owner-occupied commercial, commercial mortgage and construction loans have higher levels of risk than residential lending. These loans typically involve larger loan balances concentrated with single borrowers or groups of related borrowers. In addition, the payment experience on loans secured by income-producing properties is typically dependent on the successful operation of the related real estate project and may be more subject to adverse conditions in the commercial real estate market or in the general economy than residential loans. The majority of our commercial and commercial mortgage loans are concentrated in Delaware and Pennsylvania.
We offer commercial mortgage loans on multi-family properties and on other commercial real estate. Generally, loan-to-value ratios for these loans do not exceed 80% of appraised value at origination.
Our commercial mortgage portfolio was $1.9$3.8 billion at December 31, 2021.2023. Generally, this portfolio is diversified by property type, with no type representing more than 27%30% of the portfolio. The three largest type istypes are retail-related (non-mall, neighborhood shopping centers and other retail), residential multi-family, and office with outstanding balances of $496.0 million$1.1 billion, $1.0 billion and $0.7 billion at December 31, 2021.2023, respectively. The average size of a loan in the commercial mortgage portfolio is $0.7$1.1 million and only nine46 loans are greater than $12.0 million, with one loaneight loans greater than $24.0 million.
We offer commercial construction loans to developers. In some cases these loans are made as “construction/permanent” loans, which provides for disbursement of loan funds during construction with the option of conversion to mini-permanent loans (one - five years) upon completion of construction. These construction loans are short-term, usually not exceeding three years, with interest rates generally indexed to our WSFS prime rate, the “Wall Street” prime rate or LIBOR,the Secured Overnight Financing Rate (SOFR), and are adjusted periodically as these indices change. The loan appraisal process includes the same evaluation criteria as required for permanent mortgage loans, but also takes into consideration: completed plans, specifications, comparables and cost estimates. Prior to approval of each loan, these criteria are used as a basis to determine the appraised value of the subject property when completed. Our policy requires that all appraisals be reviewed independently from our commercial business development staff. At origination, the loan-to-value ratios for construction loans generally do not exceed 75%. The initial interest rate on the permanent portion of the financing is determined by the prevailing market rate at the time of conversion to the permanent loan. At December 31, 2021, $1.12023, $1.8 billion was committed for construction loans, of which $687.2 million$1.0 billion was outstanding. Also at December 31, 2021,2023, the residential construction and land development (CLD) portfolio represented $316.7$607.4 million, or 4%5%, of total loans and the commercial CLD portfolio represented $279.9$204.1 million, or 4%2%, of total loans. At December 31, 2021,2023, the construction portfolio included $38.3$101.6 million of “land hold” loans, which are land loans not currently being developed.
Commercial and industrial and owner-occupied commercial loans include loans for working capital, financing equipment and real estate acquisitions, business expansion and other business purposes. These relationships generally range in amounts of up to $35.0$100.0 million with an average loan balance in the portfolio of $0.4$1.4 million, (excluding PPP loans), and terms ranging from less than one year to ten years. The loans generally carry variable interest rates indexed to our WSFS prime rate, “Wall Street” prime rate or LIBOR.SOFR. At December 31, 2021,2023, our commercial and industrial and owner-occupied commercial loan portfolios were $3.3$4.4 billion and represented 41%35% of our total loan and lease portfolio. These loans are diversified by industry, with no industry representing more than 20%12% of the portfolio.
Small business and middle market commercial loans that include specialty-lending products, including small business leases and SBA loans, comprise the remainder of our commercial portfolio. As of December 31, 2021,2023, our small business and SBA loans include loan exposures up to $1.5$1.4 million and $5.0$2.7 million, respectively.
Our commercial small business leases generated through NewLane Finance®, finance critical equipment through advanced technologies, a customer-centric approach and transparent business lending practices. The commercial small business leases portfolio was $352.3$623.6 million, or 4%5% of total loans, at December 31, 2021.2023. These leases included initial average deal sizes of approximately $30$28 thousand, with yields ranging from 4%5% to 29%25% and initial maturity terms of 12 to 7284 months.
Federal law limits the Bank’s extensions of credit to any one borrower to 15% of our unimpaired capital (approximately $247.7$355.5 million), and an additional 10% if the additional extensions of credit are secured by readily marketable collateral. Extensions of credit include outstanding loans as well as contractual commitments to advance funds, such as standby letters of credit. At December 31, 2021, no borrower had collective (relationship) total extensions of credit exceeding these legal lending limits. Our internal "House Limit" to any one borrowing relationship is $100.0 million. At December 31, 2023, no borrower had collective (relationship) total extensions of credit exceeding either the legal lending limits or our internal limit.
Residential Lending
Generally, we originate held-for-sale residential first mortgage loans with loan-to-value ratios of up to 90%80% and require private mortgage insurance or government guarantee for up to 35% of the mortgage amount for mortgage loans with loan-to-value ratios exceeding 80%. On a very limited basis, we have originated or purchased loans with loan-to-value ratios exceeding 80% without a private mortgage insurance requirement or government guarantee. Any such loans are either originated for sale into the secondary market.market or held for investment. At December 31, 2021,2023, the balance of all such loans was approximately $37.5$123.9 million.
Our residential loans generally are underwritten and documented in accordance with standard underwriting criteria published by Fannie Mae, Freddie Mac, Federal Housing Agency, Veterans Administration, the U.S. Department of Agriculture and other secondary market participants to assure maximum eligibility for subsequent sale in the secondary market.
To protect the propriety of our liens, we require borrowers to provide title insurance. We also require fire, extended coverage casualty and flood insurance (where applicable) for properties securing residential loans. All properties securing our residential loans are appraised by independent, licensed and certified appraisers and are subject to review in accordance with our standards. The exception to this policy is when we in limited circumstances receive an "appraisal waiver" from one of the governmental agencies, Fannie Mae or Freddie Mac.
The majority of our adjustable-rate, residential loans have interest rates that adjust yearly or bi-yearly after an initial period. The change in rate for the first adjustment date could be higher than the typical limited rate change of two percentage points per annum at each subsequent adjustment date. Adjustments are generally based upon a margin (as of December 31, 2021,2023, ranging from 2.75% for the U.S Treasury, and 2.75% to 3.00% for the Standard Overnight Finance Rate) over the weekly average yield on U.S. Treasury securities adjusted to a constant maturity, as published by the Board of Governors of the Federal Reserve System (the Federal Reserve).
Usually, the maximum rate on these loans is five percent5.0% above the initial interest rate. We underwrite adjustable-rate loans under standards consistent with private mortgage insurance and secondary market underwriting criteria. We do not originate adjustable-rate mortgages with payment limitations that could produce negative amortization.
The adjustable-rate mortgage loans in our loan portfolio help mitigate the risk related to our exposure to changes in interest rates. However, there are unquantifiable credit risks resulting from potential increased costs to the borrower as a result of re-pricing adjustable-rate mortgage loans. During periods of rising interest rates, the risk of default on adjustable-rate mortgage loans may increase due to the upward adjustment of interest costs to the borrower. Further, although adjustable-rate mortgage loans allow us to increase the sensitivity of our asset base to changes in interest rates, the extent of this interest sensitivity is limited by the periodic and lifetime interest rate adjustment limitations. Accordingly, yields on our adjustable-rate mortgages may not adjust sufficiently to compensate for increases to our cost of funds during periods of extreme interest rate increases.
The original contractual loan payment period for residential loans is normally 10 to 30 years. Because borrowers may refinance or prepay their loans without penalty, these loans tend to remain outstanding for a substantially shorter period of time. First mortgage loans customarily include “due-on-sale” clauses. This provision gives us the right to declare a loan immediately due and payable in the event the borrower sells or otherwise disposes of the real property subject to the mortgage. We enforce due-on-sale clauses through foreclosure and other legal proceedings to the extent available under applicable laws.
In general, loans are sold without recourse except for the repurchase right arising from standard contract provisions covering violation of representations and warranties or, under certain investor contracts, a default by the borrower on the first payment. We also have limited recourse exposure under certain investor contracts in the event a borrower prepays a loan in total within a specified period after sale, typically 120 days. The recourse is limited to a pro rata portion of the premium paid by the investor for that loan, less any prepayment penalty collectible from the borrower. There were no repurchaseswas one loan repurchased in 20212023 for $0.8 million, two repurchased in 2022 for $0.8 million, and 2020, and one repurchasenone repurchased in 2019 with minimal impact.2021.
Consumer Lending
Our primaryThe Company has focused on diversifying our consumer credit products (excluding first mortgage loans)to meet our Customers’ needs, with over 50% of the portfolio from our fintech lending partnerships. We purchase certain second-lien home equity installment loans through our partnership with Spring EQ, LLC (Spring EQ). These select loans meet or exceed our current underwriting standards and are similar to home equity loans originated through our branch network. We originate personal loans, which are typically unsecured with 36-month or 60-month terms, through our partnership with Upstart. We have student loans through our partnership with LendKey Technologies Inc. (LendKey). LendKey student loans are primarily to consolidate existing student debt and are also underwritten in accordance with our current credit standards. The student loans portfolio also includes loans acquired from past acquisitions, which are U.S. government guaranteed with little risk of credit loss.
Our in-house originations consist primarily of home equity lines of credit and installment loans. At December 31, 2021,2023, home equity lines of credit outstanding totaled $361.5$466.4 million and installment loans totaled $565.7$221.0 million. In total, these product lines represented approximately 80%34% of total consumer loans. Typically, maximum loan to value (LTV) limits are 85% for primary residences and 70% for all other properties. At December 31, 2021,2023, we had $956.4 million$1.4 billion in total commitments for home equity lines of credit. Home equity lines of credit offer customers the convenience of checkbook and debit card access, and revolving credit features for a portion of the life of the loan and typically are more attractive in a low interest rate environment. Home equity lines of credit expose us to the risk that falling collateral values may leave us inadequately secured. This credit risk is mitigated by our underwriting standards and limit on the combined LTV on residences with a value greater than $700 thousand.
We purchase certain second-lien home equity installment loans through our partnership with Spring EQ, LLC (Spring EQ). These select loans meet or exceed our current underwriting standards and are similar to home equity loans originated through our branch network. We have student loans through our partnership with LendKey Technologies Inc. (LendKey). LendKey student loans are primarily to consolidate existing student debt and are also underwritten in accordance with our current credit standards. The student loans portfolio also includes loans acquired from Beneficial, which are U.S. government guaranteed with little risk of credit loss. We originate personal loans, which are typically unsecured with 36-month or 60-month terms, through our partnership with Upstart.$2.5 million.
The following table shows the composition of our consumer loan portfolio at year-end for the last two years:
| | | |
| | | | | At December 31, | | At December 31, |
| | | | 2021 | | 2020 | |
| (Dollars in thousands) | (Dollars in thousands) | | Amount | | Percent | | Amount | | Percent | |
| (Dollars in thousands) | |
| (Dollars in thousands) | |
Consumer Partnerships(1) | |
Consumer Partnerships(1) | |
Consumer Partnerships(1) | |
| Home equity lines of credit | |
| Home equity lines of credit | |
| Home equity lines of credit | Home equity lines of credit | | $ | 361,486 | | | 31 | % | | $ | 348,715 | | | 30 | % | |
Installment Loans - Other(1)(2) | Installment Loans - Other(1)(2) | | 565,706 | | | 49 | | | 552,685 | | | 48 | | |
Installment Loans - Other(1)(2) | |
Installment Loans - Other(1)(2) | |
| Education loans | |
| Education loans | |
| Education loans | |
| Unsecured lines of credit | Unsecured lines of credit | | 33,028 | | | 3 | | | 26,773 | | | 2 | | |
| Education loans | | 198,353 | | | 17 | | | 237,744 | | | 20 | | |
| Unsecured lines of credit | |
| Unsecured lines of credit | |
| Total consumer loans | Total consumer loans | | $ | 1,158,573 | | | 100 | % | | $ | 1,165,917 | | | 100 | % | |
| Total consumer loans | |
| Total consumer loans | |
(1)Includes Spring EQ, Upstart, and LendKey portfolios.
(2)Includes secured and unsecured installment loans, personal and other loans.
Loan Originations, Purchases and Sales
We engage in traditional lending activities primarily in Delaware, southeastern Pennsylvania, southern New Jersey, and contiguous areas of neighboring states. As a federal savings bank, however, we may originate, purchase and sell loans throughout the U.S. We purchase loans from outside our traditional lending area through our relationships with Spring EQ and LendKey, when such purchases are deemed appropriate. We originate fixed-rate and adjustable-rate residential loans through our banking offices and WSFS Mortgage®, our mortgage banking company, and personal loans through our partnership with Upstart.
Commercial: We originate commercial mortgage and commercial loans through our commercial lending division and SBA loan program. Commercial loans are made for working capital, financing equipment acquisitions, business expansion and other business purposes. During 2021,2023, we originated $1.5$2.4 billion of commercial and commercial mortgage loan exposures compared to $2.8$2.3 billion in 2020 (including nearly $1.0 billion of PPP loans).2022. To reduce our exposure on certain types of these loans, and/or to maintain relationships within internal lending limits, at times we will sell a portion of our commercial loan portfolio, typically through loan participations. Commercial loan sales totaled $58.6$261.5 million and $159.3$201.6 million in 20212023 and 2020,2022, respectively. These amounts represent gross contract amounts and do not necessarily reflect amounts outstanding on those loans. We also periodically buy loan participations from other banks. Commercial loan participation purchases totaled $50.6$264.2 million and $93.4$241.9 million in 20212023 and 2020,2022, respectively.
Commercial credit approvals require a minimum of two authorized signers, and three signers, of escalating authority, are required for new credit actions to relationships with exposure over $2.5 million up to $35 million. New credit actions to relationships exceeding $35 million, along with new single transactions of $30 million or more, new transactions exceeding the Bank’s Single Borrower or Project Hold limits and new transactions of $10 million or more with two or more Tier 1 exceptions require approval by Senior Loan Committee. The Executive and Risk Committee of the Board of Directors reviews the minutes of the Senior Loan Committee meetings. Our credit policy includes a “House Limit” to any one borrowing relationship of $100.0 million. Our policy allows for 10 relationships with an aggregate exposure in excess of the "House Limit" not to exceed 10% of Tier 1 Capital plus ACL. At December 31, 2021,2023, no relationships exceeded the $100.0 million “House Limit.”
Residential and Consumer: During 2021,2023, we originated $976.9$343.7 million of residential loans, an increasea decrease compared to $929.7$493.5 million in 2020.2022. From time to time, we have purchased whole loans and loan participations in accordance with our ongoing asset and liability management objectives. There were $2.3 million ofno purchases in 20212023 or 2022 related to our Community Reinvestment Act (CRA) obligations compared to $0.8 million of purchases in 2020.obligations. We sell most newly originated mortgage loans in the secondary market to generate fee income and to manage our overall balance sheet mix. Residential loan sales totaled $965.7$195.7 million in 20212023 and $798.9$498.1 million in 2020.2022. We hold certain fixed-rate mortgage loans for investment, consistent with our current asset/liability management strategies and our relationship-based lending philosophy.
At December 31, 2021,2023, we serviced $91.5$248.3 million of residential first mortgage loans and reverse mortgage loans for others, compared to $132.4$286.4 million at December 31, 2020.2022. At December 31, 2023, we had $211.3 million of residential first mortgage loans serviced by others, compared to $233.7 million at December 31, 2022. We also serviced residential first mortgage loans and reverse mortgage loans for our own portfolio totaling $546.7$659.4 million and $774.5$528.2 million at December 31, 20212023 and 2020,2022, respectively. We offer government-insured reverse mortgages to our customers. These loans do not close in our name and we process them as a reverse mortgage broker. During 20212023 and 2020,2022, we originated $1.8$3.3 million and $1.0$0.8 million in reverse mortgages, respectively.
Our consumer lending activity is conducted through our branch offices, our website, our partnerships with Upstart, Spring EQ, Upstart, and LendKey and referrals from other parts of our business. We originate a variety of consumer credit products including home improvementequity loans, home equity lines of credit, automobile loans, unsecured lines of credit and other secured and unsecured personal installment loans.
Fee Income from Lending Activities
We earn fee income from lending activities, including fees for originating, servicing and selling loans and loan participations. We also receive fee income for making commitments to originate construction, residential and commercial mortgage loans. Additionally, we collect fees related to existing loans which include prepayment charges, late charges, assumption fees and interest rate swap fees. As part of the loan application process, the borrower also may pay us for out-of-pocket costs to review the application, whether or not the loan is closed.
Most loan fees are not recognized in our Consolidated Statements of Income immediately, but are deferred as adjustments to yield in accordance with GAAP, and are reflected in interest income over the expected life of the loan. Those fees represented interest income of $8.8 million, $12.1 million and $25.4 million $23.5 millionduring 2023, 2022 and $7.1 million during 2021 2020 and 2019 respectively. Loan fee income was mainly due to fee accretion on new and existing loans (including the acceleration of the accretion on loans that paid early), loan growth and prepayment penalties. The increase in loan fee income since 2019 was concentrated in commercial and industrial due to $15.4 million and $15.6 million in fees earned on PPP loans for 2021 and 2020, respectively.
LOAN AND LEASE LOSS EXPERIENCE, PROBLEM ASSETS AND DELINQUENCIES
Our results of operations can be negatively impacted by nonperforming assets, which include nonaccruing loans, other real estate owned and restructured loans. Nonaccruing loans are those on which the accrual of interest has ceased. Loans are placed on nonaccrual status immediately if, in our opinion, collection is doubtful, or when principal or interest is past due 90 days (120 days for leases and consumer loans from our partnership with Upstart) and collateral is insufficient to cover principal and interest payments. Interest accrued, but not collected at the date a loan is placed on nonaccrual status, is reversed and charged against interest income. In addition, the accretion of net deferred loan fees is suspended when a loan is placed on nonaccrual status. Subsequent cash receipts are applied either to the outstanding principal balance or recorded as interest income, depending on our assessment of the ultimate collectability of principal and interest.
We manage our portfolio to identify problem loans as promptly as possible and take immediate actions to minimize losses. To accomplish this, our LoanRisk Management Administration and Risk Management DepartmentsCredit and Asset Recovery departments monitor the asset quality of our loans and real estate portfolios and reports such information to the Consumer Credit Quality Committee, Credit Policy Committee, the Finance Department,Division, and the Audit Committee of our Board of Directors.
SOURCES OF FUNDS
We manage our liquidity risk and funding needs through our Treasury function and our Asset/Liability Committee. We have significant experience managing our funding needs through both borrowings and deposit growth.
As a financial institution, we and the Bank have access to several sources of funding. Among these are:
•Retained earnings
•Commercial, consumer, wealth and retailtrust deposits
•Loan repayments
•Investment securities
•Federal funds purchased
•Federal Reserve Bank Term Funding Program (BTFP)
•Federal Home Loan Bank (FHLB) borrowings
•Federal Reserve Discount Window access
•Brokered deposits
•Trust preferred borrowings
•Senior and subordinated debt
Our branch strategy has been focused on expanding our market penetration and retail footprint in Delaware, southeastern Pennsylvania and southern New Jersey and attracting new customers in part to provide additional deposit growth.
Deposits
WSFS Bank is the largest locally-headquartered community bank in the Delaware and Greater Philadelphia region. WSFS Bank primarily attracts deposits through its retail branch offices and loan production offices, in Delaware, southeastern Pennsylvania and southern New Jersey, as well as through our digital banking platforms.
WSFS Bank offers various deposit products to our customers, including savings accounts, demand deposits, interest-bearing demand deposits, money market deposit accounts and certificates of deposit. In addition, WSFS Bank accepts “jumbo” certificates of deposit with balances in excess of $250,000 from individuals, businesses and municipalities.
The following table shows the maturities of certificates of deposit of $250,000 or more as of December 31, 2021:2023:
| | | | | |
| (Dollars in thousands) | |
| Maturity Period | December 31, 20212023 |
| Less than 3 months | $ | 39,347111,858 | |
| Over 3 months to 6 months | 15,04133,642 | |
| Over 6 months to 12 months | 40,567160,011 | |
| Over 12 months | 35,0946,565 | |
| Total | $ | 130,049312,076 | |
The estimated amount of total uninsured deposits as of December 31, 20212023 was $7.5$6.3 billion as compared to $5.6$6.9 billion at December 31, 2020.2022.
Federal Home Loan Bank Advances
As a member of the FHLB, we are able to obtain FHLB advances. At December 31, 2021,2023, we had no FHLB advances compared to $6.6$350.0 million of FHLB advances at December 31, 2020.2022. Pursuant to collateral agreements with the FHLB, the advances are secured by qualifying first mortgage loans, qualifying fixed-income securities, FHLB stock and an interest-bearing demand deposit account with the FHLB. As a member of the FHLB, we are required to purchase and hold shares of capital stock in the FHLB and we were in compliance with this requirement with a stock investment in FHLB of $6.1$15.4 million as of December 31, 20212023 and with $5.8$24.1 million at December 31, 2020.2022.
We received $0.1$1.1 million in dividends from the FHLB during 20212023 compared to $0.5$0.3 million during 2020.2022. For additional information regarding FHLB stock, see Note 12 to the Consolidated Financial Statements.
Trust Preferred Borrowings
In 2005, the TrustCompany issued $67.0 million of aggregate principal amount of Pooled Floating Rate Securities at a variable interest rate of 177 basis points over the three-month LIBOR rate. The reference rate on these securities was updated to three-month term SOFR upon the discontinuation of LIBOR on June 30th, 2023. These securities are currently callable and have a maturity date of June 1, 2035.
Senior Debt
On June 13, 2016, we issued $100.0Royal Bancshares Capital Trust I (Trust I) and Royal Bancshares Capital Trust II (Trust II) (collectively, the RBC Trusts), which were acquired from Bryn Mawr Bank Corporation, were utilized for the sole purpose of issuing and selling capital securities representing preferred beneficial interests. Although WSFS owns an aggregate of $0.8 million of senior notes due 2026 (the 2026 Notes).the common securities of Trust I and Trust II, the RBC Trusts are not consolidated into the Company’s Consolidated Financial Statements as the Company is not deemed to be the primary beneficiary of these entities. WSFS assumed junior subordinated debentures to the RBC Trusts with a current carrying value of$11.8 million each, totaling $23.6 million, inclusive of the fair value marks. The 2026 Notes were redeemed on June 15, 2021junior subordinated debentures incur interest at 100% of principal plus accrued and unpaid interest using cash on hand. The 2026 Notes had a fixed coupon rate of 4.50% from issuance7.80% as of December 31, 2023. The rate resets quarterly based on three-month term SOFR plus 2.41%.
Each of Trust I and Trust II issued an aggregate principal amount of $12.5 million of capital securities initially bearing fixed and/or fixed/floating interest rates corresponding to but excluding, Junethe debt securities held by each Trust to an unaffiliated investment vehicle and an aggregate principal amount of $0.4 million of common securities bearing fixed and/or fixed/floating interest rates corresponding to the debt securities held by each Trust to the Company. The Company has fully and unconditionally guaranteed all of the obligations of the RBC Trusts, including any distributions and payments on liquidation or redemption of the capital securities.
The rights of holders of common securities of the RBC Trusts are subordinate to the rights of the holders of capital securities only in the event of a default; otherwise, the common securities’ economic and voting rights are pari passu with the capital securities. The capital and common securities of the RBC Trusts are subject to mandatory redemption upon the maturity or call of the junior subordinated debentures held by each. Unless earlier dissolved, the RBC Trusts will dissolve on December 15, 2021.2034. The junior subordinated debentures are the sole assets of the RBC Trusts, mature on December 15, 2034, and may be called at par by the Company any time. The Company records its investments in the RBC Trusts’ common securities of $0.4 million each as investments in unconsolidated entities and records dividend income upon declaration by Trust I and Trust II.
Senior and Subordinated Debt
On December 3, 2020, wethe Company issued $150.0 million of senior notes due 2030 (the 2030 Notes). The 2030 Notes mature on December 15, 2030 and have a fixed coupon rate of 2.75% from issuance until December 15, 2025 and a variable coupon rate equal to the three-month term Secured Overnight Funding Rate, (SOFR),SOFR, reset quarterly, plus 2.485% from December 15, 2025 until maturity. The 2030 Notes may be redeemed beginning December 15, 2025 at 100% of principal plus accrued and unpaid interest.
The net proceedsCompany assumed $30.0 million in aggregate principal amount of fixed-to-floating rate subordinated notes due 2025 (the 2025 Notes) from Bryn Mawr Bank Corporation, which were issued in a private placement to institutional accredited investors on August 6, 2015. Effective February 15, 2023, the issuanceCompany redeemed all remaining outstanding principal amount of the 20302025 Notes. The 2025 Notes are being used for general corporate purposes,bore interest at a variable rate that reset quarterly to a level equal to the then-current three-month LIBOR plus an issuance spread of 3.068%.
The Company assumed $70.0 million in aggregate principal amount of fixed-to-floating rate subordinated notes due 2027 (the 2027 Notes) from Bryn Mawr Bank Corporation, which were issued by Bryn Mawr Bank Corporation in an underwritten public offering on December 13, 2017. The 2027 Notes mature on December 15, 2027, and had a fixed annual interest of 4.25% until and including but not limitedDecember 14, 2022, and currently bear interest at a variable rate of 7.70%. The variable rate will reset quarterly to financing organic growth, acquisitions, repurchases of common stock, anda level equal to the three-month term SOFR plus 2.31% until December 15, 2027, or any early redemption of outstanding indebtedness.date.
Reconciliation of non-GAAP financial measures included in Item 1
We prepare our financial statements in accordance with U.S. GAAP. To supplement our financial information presented in accordance with U.S. GAAP, we provide the following non-GAAP financial measures in Item 1: core ROA and the tangible common equity to tangible assets ratio. We believe these measures provide investors with useful information for understanding the Company’s performance when analyzing changes in our underlying business between reporting periods and provide for greater transparency with respect to supplemental information used by management in its financial and operational decision making. We believe the presentation of these non-GAAP financial measures, when used in conjunction with GAAP financial measures, is a useful financial analysis tool that can assist investors in assessing the company’s operating performance and underlying prospects. This analysis should not be considered in isolation or as a substitute for analysis of our results as reported under GAAP.
Core ROA is calculated as follows: | | | | | |
| | For the year ended |
| (Dollars in thousands) | December 31, 20212023 |
| Calculation of Core ROA (non-GAAP): | |
| Net income attributable to WSFS (GAAP) | $ | 271,442269,156 | |
| |
(Less): Securities gains | (331) | |
| Less: Unrealized gains on equity investments, net | (5,141)(329) | |
RecoveryRealized gain on sale of legal settlementequity investment, net | (15,000)(9,493) | |
Plus: Realized loss on equity investments, netVisa derivative valuation adjustment | 7062,460 | |
Loss of debt extinguishmentFDIC special assessment | 1,0875,052 | |
| |
| |
| Corporate development and restructuring expenses | 13,0223,701 | |
| Contribution to WSFS CARES Foundation | 1,0002,000 | |
| Plus: Tax adjustments: BOLI surrender | 7,056 | |
| Less: Tax impact of pre-tax adjustments | 1,764(764) | |
| Adjusted net income (non-GAAP) | $ | 268,549278,839 | |
| Average assets | $ | 14,903,92020,203,037 | |
| ROA (GAAP) | 1.821.33 | % |
| Core ROA (non-GAAP) | 1.801.38 | % |
| |
| |
| |
| |
| |
| |
| |
| |
| |
| |
| |
| |
| |
| |
| |
| |
| |
| |
| |
| |
| |
| |
| |
| |
| |
| |
| |
The tangible common equity to tangible assets ratio is calculated as follows:
| | | | | |
| (Dollars in thousands) | December 31, 20212023 |
| Period End Tangible Assets | |
| Period end assets | $ | 15,777,32720,594,672 | |
| Goodwill and intangible assets | (547,231)(1,004,560) | |
| Tangible assets | $ | 15,230,09619,590,112 | |
| Period End Tangible Common Equity | |
| Period end Stockholder’s equity of WSFS | $ | 1,939,0992,477,636 | |
| Goodwill and intangible assets | (547,231)(1,004,560) | |
| Tangible common equity | $ | 1,391,8681,473,076 | |
| Tangible common equity to assets | 9.147.52 | % |
REGULATION
Overview
The Company and the Bank are subject to extensive federal and state banking laws, regulations, and policies that are intended primarily for the protection of depositors, the Deposit Insurance Fund of the Federal Deposit Insurance Corporation (FDIC) and the banking system as a whole, and not for the protection of our other creditors and stockholders. The Office of the Comptroller of the Currency (OCC) is the Bank’s primary regulator and the Federal Reserve is the Company’s primary regulator. The Consumer Financial Protection Bureau (CFPB) regulates the Bank’s compliance with federal consumer financial protection laws.
The statutes enforced by, and regulations and policies of, these agencies affect most aspects of our business, including prescribing permissible types of activities and investments, the amount of required capital and reserves, requirements for branch offices, the permissible scope of our activities and various other requirements. These laws and regulations and the ways in which they are applied to us can change significantly. For example, the Dodd-Frank Act, which was enacted in 2010 and amended by the Economic Growth Act in 2018, imposed significant new restrictions and an expanded framework of regulatory oversight for banking institutions and their holding companies.
The Bank’s deposits are insured by the FDIC to the fullest extent allowed by law. As an insurer of bank deposits, the FDIC promulgates regulations, requires the filing of reports, and has authority to examine the operations of all institutions to which it provides deposit insurance for insurance purposes.
The laws and regulations to which the Company and the Bank are subject cover all aspects of our business, including lending and collection practices, treatment of our customers, safeguarding deposits, customer privacy and information security, capital structure, liquidity, dividends and other capital distributions, transactions with affiliates and conduct and qualifications of personnel. Such laws and regulations directly and indirectly affect key drivers of our profitability, including, for example, capital and liquidity, product offerings, risk management, and costs of compliance. As a result, the extensive laws and regulations to which we are subject and with which we must comply significantly impact our earnings, results of operations, financial condition and competitive position. The impact of such regulations on our business is discussed further below, as well as in "Management’s Discussion and Analysis of Financial Condition and Results of Operations" and "Risk Factors – Risks Relating to Regulation."
Coronavirus Aid, Relief, and Economic Security (CARES) Act
On March 27, 2020, the CARES Act was enacted, providing wide ranging economic relief for individuals and businesses impacted by COVID-19. These economic relief initiatives included the Paycheck Protection Program (PPP), relief with respect to troubled debt restructurings (TDRs), mortgage forbearance, government stimulus payments and extended unemployment benefits. The Paycheck Protection Program and Health Care Enhancement Act, enacted on April 24, 2020, supplemented certain programs established by the CARES Act and provided $310 billion in additional funding for the PPP after the initial $349 billion appropriation had been exhausted. The Consolidated Appropriations Act, 2021, enacted on December 27, 2020, extended some of these relief provisions in certain respects.
The PPP was a stimulus response to the potential economic impacts of COVID-19, and its purpose is to provide forgivable loans to smaller businesses that use the proceeds of the loans for payroll and certain other qualifying expenses. The Small Business Administration (SBA) manages the PPP and guarantees the PPP loans. If a loan is fully forgiven, SBA will repay the lending bank in full. If a loan is partially forgiven or not forgiven at all, a bank must look to the borrower for repayment of unforgiven principal and interest. If the borrower defaults, the loan is guaranteed by the SBA.
The Consolidated Appropriations Act, 2021 appropriated a further $284 billion to the PPP (PPP 2.0), and permitted certain PPP borrowers to receive “second draw” loans. In January 2021, WSFS Bank began participating in the PPP 2.0 by outsourcing the processing and servicing of PPP 2.0 loans to third party providers. The PPP 2.0 loans were not originated on our balance sheet; however, the resulting deposits from our Customers obtaining PPP 2.0 loans from other originating lenders has impacted our financial condition.
The CARES Act and related guidance from the federal banking agencies provide financial institutions the option to temporarily suspend requirements under GAAP related to classification of certain loan modifications as TDRs, to account for the current and anticipated effects of COVID-19. The CARES Act, as amended by the Consolidated Appropriations Act, 2021, specified that COVID-19 related loan modifications executed between March 1, 2020 and the earlier of (i) 60 days after the date of termination of the national emergency declared by the President and (ii) January 1, 2022, on loans that were current as of December 31, 2019 are not subject to TDR accounting requirements under GAAP. Additionally, under guidance from the federal banking agencies, other short-term modifications made on a good faith basis in response to COVID-19 to borrowers who were current prior to any relief are not TDRs under ASC Subtopic 310-40, “Troubled Debt Restructuring by Creditors.” These modifications include short-term (e.g., up to six months) modifications such as payment deferrals, fee waivers, extensions of repayment terms, or delays in payment that are insignificant.
The CARES Act also included a range of other provisions designed to support the U.S. economy and mitigate the impact of COVID-19 on financial institutions and their customers. For example, provisions of the CARES Act require mortgage servicers to grant, on a borrower’s request, forbearance for up to 180 days (which can be extended for an additional 180 days) on a federally-backed single-family mortgage loan, or forbearance up to 30 days (which can be extended for two additional 30-day periods) on a federally-backed multifamily mortgage loan when the borrower experiences financial hardship due to the COVID-19 pandemic. Further, in response to the COVID-19 pandemic, the Federal Reserve established a number of facilities to provide emergency liquidity to various segments of the U.S. economy and financial markets. All of these facilities have since expired. The absence of these facilities could adversely affect the U.S. economy and ultimately our business if economic conditions decline.
Transition from London Inter-Bank Offered Rate (LIBOR)
In 2014,LIBOR, a committee of private-market derivative participants and their regulators, the Alternative Reference Rate Committee (ARRC), was convened by the Federal Reserve to identify an alternative referencebenchmark interest rate that was widely referenced in the past, is no longer published as of June 30, 2023.Financial market regulators had taken steps in previous years to replace LIBOR. In June 2017,prepare for the ARRC announcedtransition away from LIBOR and to encourage banks and other market participants to do the Secured Overnight Funding Rate (SOFR), a broad measure of the cost of borrowing cash overnight collateralized by Treasury securities, as its preferred alternative to LIBOR.same. The United Kingdom Financial Conduct Authority (FCA), ceased publishing most caused several LIBOR settings as of January 1, 2022, however, the FCA will continue to publish five U.S. LIBOR settings through mid-2023. The Federal Reserve has continued to encourage banks to transition away from LIBOR as soon as practicable and the federal banking agencies have encouraged banking organizations to cease entering into new contracts that use U.S. LIBOR as a reference rate by no later thanpublication after December 31, 2021 and the remaining settings to ensure existing contracts have robust fallback language that includes a clearly defined alternative reference rate. cease publication after June 30, 2023.
The Adjustable Interest Rate (LIBOR) Act and implementing regulations of the Federal Reserve Bankcreated a set of New York has published SOFR rates on a daily basis since April 2018 and has published SOFR "term rates" daily since early 2020. The ARRC and other institutions continue to take steps to advance SOFR as an alternative benchmark. In July 2020, the federal banking agencies issued guidancedefault rules for banking organizations on managing the transition to an alternative reference rate; for the agencies, however, SOFR is not the exclusive alternative.
The International Swaps and Derivatives Association, which develops standardized language for the derivativespreexisting contracts that we enter into, has developed language that took effect in January 2021 replacingreference LIBOR, with alternative risk-free benchmark rates, including SOFR for derivative contracts denominated in U.S. dollars. In 2021 the ARRC announced the SOFR program, whichand created a phased transitionsafe harbor from liability for switching trading conventions from USD LIBORpersons who elected to SOFR for multiple financial instruments duringuse the second half of 2021. The program is intended to migrateSecured Overnight Financing Rate (SOFR) as the market from LIBOR and create liquidityreplacement rate in SOFR.a contract that references LIBOR.
Given LIBOR’s extensive use across financial markets, the transition away from LIBOR presents various risks and challenges to financial markets and institutions, including to the Company. The Company’s commercial and consumer businesses issue, trade, and holdused various products that arewere indexed to LIBOR. AsMost of December 31, 2021,these instruments gave the Company had approximately $1.5 billion of loans and $0.9 billion of derivatives that are utilized for customer guarantees, indexed to LIBOR, that mature after 2021. In addition, the Company had approximately $67.0 million of debt securities outstanding that are indexed to LIBOR (either currently or in the future) as of December 31, 2021. The Company had one investment security totaling $0.5 million, and no repurchase and resale agreements or FHLB advances indexed to LIBOR as of December 31, 2021.
Due to the uncertainty surrounding the future of LIBOR, it is expected that the transition will span several reporting periods through June 2023. A cross-functional team from Finance, Lending, Risk and IT is leading our efforts to monitor this activity and evaluate the related risks and potential process changes arising from the transition from LIBOR. An internal risk assessment was completed and the cross-functional team is working towards the migration of our existing contracts and system implementation. Our variable or floating rate instruments currently use LIBOR and give us discretion to determine a replacement benchmark rate ifwhen LIBOR becomesbecame unavailable. In
This discretion combined with the fourthLIBOR Act's safe harbor allowed the Company to select and migrate to SOFR as a replacement to LIBOR in the first quarter of 20212022. Currently, the Bank started utilizing Wall Street Journal (WSJ) Prime as a LIBOR alternative. The use of WSJ Prime is intended to bridgeCompany's new variable rate loan production until a broader market consensus on a LIBOR replacement is achieved. Weproducts are still considering the appropriate transition for our legacy contracts; however, we have begun to shift some new products from LIBOR. Most recently, the floating rate on our $150 million of senior notes issuedprimarily originated in 2020 (due 2030), beginning on December 15, 2025, is based on an alternative benchmark rate (which is expected to be the three-month term SOFR).
For additional information related to the potential impact surrounding the transition from LIBOR on the Company’s business, see "Risk Factors."SOFR.
Regulation of the Company
General
The Company is a registered savings and loan holding company and is subject to the regulation, examination, supervision and reporting requirements of the Federal Reserve. The Federal Reserve conducts regular safety and soundness examinations or inspections of the Company, which result in ratings for risk management, financial condition, and potential impact on subsidiary depository institution(s), a composite rating, and a rating for subsidiary depository institution(s) (referred to collectively as the “RFI/C(D)” rating). The Federal Reserve treats the ratings and the examination reports as highly confidential, and they are not available to the public.
The Company is also a public company subject to the reporting requirements of the SEC. We file electronically with the SEC our Annual Reports on Form 10-K, Quarterly Reports on Form 10-Q, Current Reports on Form 8-K, and all amendments to those reports filed or furnished pursuant to Section 13(a) or 15(d) of the Securities Exchange Act of 1934. We make available on the investor relations page of our website at www.wsfsbank.com, free of charge, copies of these reports as soon as reasonably practicable after filing or furnishing them to the SEC. The information on our website is not incorporated by reference in this Annual Report on Form 10-K.
Restrictions on Acquisitions
Federal law generally prohibits a savings and loan holding company from acquiring, without prior regulatory approval, direct or indirect control, all or substantially all of the assets, or more than 5% of the voting shares of a savings association or savings and loan holding company. These provisions also prohibit, among other things, any director or officer of a savings and loan holding company, or any individual who owns or controls more than 25% of the voting shares of such holding company, from acquiring control of any savings association that is not a subsidiary of such savings and loan holding company, unless the acquisition is approved by the Federal Reserve. Comparable restrictions apply to a savings and loan holding company’s acquisition or control of a bank or bank holding company although in such event the savings and loan holding company would become a bank holding company.
The Company is a grandfathered unitary thrift holding company, a status that allows us to acquire companies or business lines that engage in a wide range of non-banking activities. Should we lose that status, we will be constrained in our ability to acquire many non-banking companies or business lines.
Safe and Sound Banking Practices
Savings and loan holding companies and their non-bank subsidiaries are prohibited from engaging in activities that represent unsafe and unsound banking practices or constitute violations of laws or regulations. For example, the Federal Reserve opposes any repurchase of common stock or any other regulatory capital instrument if the repurchase would be inconsistent with the savings and loan holding company’s prospective capital needs and continued safe and sound operation. As another example, a savings and loan holding company may not impair its subsidiary savings association’s soundness by causing it to make funds available to non-depository subsidiaries or their customers if the Federal Reserve believes it not prudent for the Company to do so. The Federal Reserve can assess civil money penalties on a party for unsafe and unsound activities conducted on a knowing or reckless basis, if those activities caused a loss to an institution or pecuniary gain to the party. The penalties can range up to $25,000 for certain reckless violations and up to $1.0 million for certain knowing violations for each day such a violation continues.
Source of Strength
Confirming a longstanding policy of the Federal Reserve, the Dodd-Frank Act requires the Company to act as a source of financial strength to the Bank in the event of financial distress at the Bank. Under this standard, the Company is expected to commit resources to support the Bank, including at times when the Company would not otherwise be inclined to do so. The Federal Reserve also expects the Company to provide managerial support to the Bank as needed. The Federal Reserve may require a savings and loan holding company to terminate an otherwise lawful activity or divest control of a subsidiary if the activity or subsidiary poses a serious risk to the financial safety, soundness, or stability of a subsidiary savings association and is inconsistent with sound banking principles.
In addition, pursuant to the Dodd-Frank Act, the capital rules for savings and loan holding companies are no less stringent than those that apply to their subsidiary savings associations.
Dividends
The principal sources of the Company’s cash are debt issuances and dividends from the Bank, supplemented by dividends from its other operating subsidiaries (including Bryn Mawr Capital Management, LLC, Powdermill®, West Capital, Cypress, Christiana Trust DE, and WSFS SPE Services, LLC)LLC and The Bryn Mawr Trust Company of Delaware). Our earnings and activities are affected by federal, state and local laws and regulations. For example, these include limitations on the ability of the Bank to pay dividends to the holding company and our ability to pay dividends to our stockholders. It is the policy of the Federal Reserve that holding companies should pay cash dividends on common stock only out of earnings available for the period for which the dividend is being paid and only if prospective earnings retention is consistent with the organization’s expected future capital needs and current and prospective financial condition. The policy provides that holding companies should not maintain a level of cash dividends that undermines the holding company’s ability to serve as a source of strength to its banking subsidiary. Consistent with this policy, a banking organization should have comprehensive policies on dividend payments that clearly articulate the organization’s objectives and approaches for maintaining a strong capital position and achieving the objectives of the Federal Reserve’s policy statement.
A Federal Reserve supervisory letter setting forth expectations for the payment of dividends by holding companies states that a holding company’s board of directors considering the payment of dividends should consider, among other things, the following factors: (i) overall asset quality, potential need to increase reserves and write down assets, and concentrations of credit; (ii) the potential for unanticipated losses and declines in asset values; (iii) implicit and explicit liquidity and credit commitments, including off-balance sheet and contingent liabilities; (iv) the quality and level of current and prospective earnings, including earnings capacity under a number of plausible economic scenarios; (v) current and prospective cash flow and liquidity; (vi) the ability to serve as an ongoing source of financial and managerial strength to depository institution subsidiaries insured by the FDIC, including the extent of double leverage and the condition of subsidiary depository institutions; (vii) other risks that affect the holding company’s financial condition and are not fully captured in regulatory capital calculations; (viii) the level, composition, and quality of capital; and (ix) the ability to raise additional equity capital in prevailing market and economic conditions (the Dividend Factors). It is particularly important for a holding company’s board of directors to ensure that the level of a prospective dividend is prudent relative to the organization’s financial position and is not based on overly optimistic earnings scenarios. In addition, a holding company’s board of directors should strongly consider, after careful analysis of the Dividend Factors, reducing, deferring, or eliminating dividends when the quantity and quality of the holding company’s earnings have declined or the holding company is experiencing other financial problems, or when the macroeconomic outlook for the holding company’s primary profit centers has deteriorated. The supervisory letter also states that, as a general matter, a holding company should eliminate, defer or significantly reduce its distributions if: (i) its net income available to shareholders for the past four quarters, net of dividends previously paid during that period, is not sufficient to fully fund the dividends, (ii) its prospective rate of earnings retention is not consistent with its capital needs and overall current and prospective financial condition, or (iii) it will not meet, or is in danger of not meeting, its minimum regulatory capital adequacy ratios. Failure to do so could result in a supervisory finding that the holding company is operating in an unsafe and unsound manner.
Additionally, as discussed above, the Federal Reserve possesses enforcement powers over savings and loan holding companies and their non-bank subsidiaries to prevent or remedy actions that represent unsafe or unsound practices, or violations of applicable statutes and regulations. Among these powers is the authority to proscribe the payment of dividends by bank and savings and loan holding companies.
Cypress and WestBryn Mawr Capital Management, LLC
Cypress and WestBryn Mawr Capital areManagement, LLC is a registered investment advisersadviser under the Investment Advisers Act of 1940 (the Investment Advisers Act) and as such areis supervised by the SEC. The Investment Advisers Act imposes numerous obligations on registered investment advisers, including record-keeping, operational and marketing requirements, disclosure obligations and prohibitions on fraudulent activities. The SEC is authorized to institute proceedings and impose sanctions for violations of the Investment Advisers Act, ranging from fines and censure to termination of an investment adviser’s registration. Investment advisers also are subject to certain state securities laws and regulations. Noncompliance with the Investment Advisers Act or other federal and state securities laws and regulations could result in investigations, sanctions, disgorgement, fines and reputation damage.
Regulation of WSFS Bank
General
As a federally chartered savings association the Bank is subject to regulation, examination and supervision by the OCC. The OCC conducts regular safety and soundness examinations of the Bank, which result in ratings for capital, asset quality, management, earnings, liquidity, and sensitivity to market risk and a composite rating (referred to collectively as the “CAMELS” ratings). The OCC treats the CAMELS ratings and the examination reports as highly confidential, and they are not available to the public. The lending activities and other investments of the Bank must comply with various federal regulatory requirements. The OCC periodically examines the Bank regarding information technology, asset management/trust, and compliance with certain regulatory requirements. The Bank must file reports with the OCC describing its activities and financial condition, including a quarterly “call report” that is publicly available. The FDIC also has the authority to conduct special examinations of the Bank. The CFPB has exclusive authority to examine the Bank for compliance with federal consumer financial laws. The Bank is also subject to certain reserve requirements promulgated by the Federal Reserve.
Transactions with Affiliates and Insiders; Tying Arrangements
The Bank is subject to certain restrictions in its dealings with us and our affiliates. Transactions between savings associations and any affiliate are governed by Sections 23A and 23B of the Federal Reserve Act, with additional limitations found in Section 11 of the Home Owners’ Loan Act. An affiliate of a savings association, generally, is any company or entity which controls or is under common control with the savings association. Some but not all subsidiaries of a savings association may be exempt from the definition of an affiliate. In a holding company context, the parent holding company of a savings association (such as the Company) and any companies which are controlled by such parent holding company are affiliates of the savings association. Generally, Sections 23A and 23B (i) limit the extent to which the savings association or its subsidiaries may engage in “covered transactions” with any one affiliate to an amount equal to 10% of such institution’s capital stock and surplus, and limit the aggregate of all such transactions with all affiliates to an amount equal to 20% of such capital stock and surplus and (ii) require that all such transactions be on terms substantially the same, or at least as favorable, to the institution or subsidiary as those that would be provided to a non-affiliate. The term “covered transaction” includes the making of loans to an affiliate, purchase of assets from an affiliate, issuance of a guarantee on behalf of an affiliate and several other types of transactions. Extensions of credit to an affiliate usually must be over-collateralized. In addition to the restrictions imposed by Sections 23A and 23B, the Home Owners’ Loan Act also prohibits a savings association from (i) lending or otherwise extending credit to an affiliate that engages in any activity impermissible for bank holding companies, or (ii) purchasing or investing in any stocks, bonds, debentures, notes or similar obligations of any affiliate, except for the purchase of shares of a subsidiary.
Restrictions also apply to extensions of credit by the Bank to its executive officers, directors, principal shareholders, and their related interests and to similar individuals at the Company and the Bank’s affiliates. In general, such extensions of credit (i) may not exceed certain dollar limitations, (ii) must be made on substantially the same terms, including interest rates and collateral, as those prevailing at the time for comparable transactions with third parties, and (iii) must not involve more than the normal risk of repayment or present other unfavorable features. Certain extensions of credit also require the approval of the Bank’s Board of Directors.
The Bank may not extend credit, lease, sell property, or furnish any service or fix or vary the consideration for the foregoing on the condition that (i) the customer obtain or provide some additional credit, property, or service from or to the Bank or the Company or their subsidiaries (other than a loan, discount, deposit, or trust service or that are related to and usually provided in connection with any such product or service) or (ii) the customer not obtain some other credit, property, or services from a competitor, except to the extent such a condition is reasonably imposed to assure the soundness of the credit extended. The federal banking agencies have, however, allowed banks and savings associations to offer combined-balance discount packages and otherwise to offer more favorable terms if a customer obtains two or more traditional bank products. The law authorizes the Federal Reserve to grant additional exceptions by regulation or order.
Regulatory Capital Requirements
The regulatory capital rules require savings associations and their holding companies to maintain minimum levels of common equity Tier 1 capital equal to at least 4.5% of risk-weighted assets, Tier 1 capital equal to at least 6% of risk-weighted assets, total capital (the aggregate of Tier 1 and Tier 2 capital) equal to at least 8% of risk-weighted assets, and a leverage ratio of Tier 1 capital to average total consolidated assets equal to at least 4%. In addition, the capital rules subject savings associations and their holding companies to certain limitations on capital distributions and discretionary bonus payments to executive officers if the organization does not maintain a capital conservation buffer with a ratio of common equity Tier 1 to total risk-based assets of at least 2.5% on top of the minimum risk-based capital requirements. As a result, the Bank and the Company must adhere to the following minimum capital ratios to satisfy minimum regulatory capital requirements and to avoid limitations on capital distributions and discretionary bonus payments to executive officers: (i) common equity Tier 1 risk-based capital ratio of at least 7.0%; (ii) a Tier 1 risk-based capital ratio of at least 8.5%; (iii) a total risk-based capital ratio of at least 10.5%, and (iv) a Tier 1 leverage ratio of at least 4.0%.
A related set of rules, discussed below under “Prompt Corrective Action,” imposes additional requirements on insured depository institutions based on the same risk-based capital ratios and leverage ratio. Separately, the Home Owners’ Loan Act requires a savings association to maintain a ratio of tangible capital to total assets of at least 1.5%. In general terms, tangible capital is Tier 1 capital less intangible assets and certain other assets.
Under the regulatory capital rules, the components of common equity Tier 1 capital include common stock instruments (including related surplus), retained earnings, and certain minority interests in the equity accounts of fully consolidated subsidiaries (subject to certain limitations). A savings association must make certain deductions from and adjustments to the sum of these components to determine common equity Tier 1 capital. The required deductions for federal savings associations include, among other items, goodwill (net of associated deferred tax liabilities), certain other intangible assets (net of deferred tax liabilities), certain deferred tax assets, gains on sale in connection with securitization exposures and investments in and extensions of credit to certain subsidiaries engaged in activities not permissible for national banks. The adjustments require several complex calculations and include adjustments to the amounts of deferred tax assets, mortgage servicing assets, and certain investments in the capital of unconsolidated financial institutions that are includable in common equity Tier 1 capital. Additional Tier 1 capital includes noncumulative perpetual preferred stock and related surplus, and certain minority interests in the equity accounts of fully consolidated subsidiaries not included in common equity Tier 1 capital (subject to certain limitations). Tier 2 capital includes subordinated debt with a minimum original maturity of five years, related surplus, certain minority interests in in the equity accounts of fully consolidated subsidiaries not included in Tier 1 capital (subject to certain limitations), and limited amounts of a bank’s allowance for credit losses (ACL). Certain deductions and adjustments are necessary for both additional Tier 1 capital and Tier 2 capital.
In December 2018, the federal banking agencies issued a final rule that allows institutions to elect to phase in the regulatory capital effects of the Current Expected Credit Losses (CECL) accounting standard over three years. In addition, as a result of the CARES Act enacted on March 27, 2020 in response to the COVID-19 pandemic, the federal bank regulatory agencies issued rules that allow banking organizations that implemented CECL in 2020 to elect to mitigate the effects of the CECL accounting standard on their regulatory capital for two years. This two-year delay is in addition to the three-year transition period that the agencies had already made available. We have elected to phase in the regulatory capital effects of CECL over three years, beginning in 2020, and have not opted to defer the effects of CECL for two years before the three-year phase-in period.
The capital ratios for the Bank and the Company, as of December 31, 2021,2023, indicate regulatory capital levels in excess of the regulatory minimums and the levels necessary for the Bank to be considered “well capitalized.“well-capitalized.”
Prompt Corrective Action
All banks and savings associations are subject to a “prompt corrective action” regime. This regime is designed primarily to impose increasingly stringent limits on insured depository institutions as their capital deteriorates below certain levels. There are five different capital levels: well capitalized,well-capitalized, adequately capitalized, undercapitalized, significantly undercapitalized, and critically undercapitalized. A well-capitalized institution usually is entitled to various regulatory advantages, such as expedited treatment of applications, and no express restrictions on brokered deposits. In order to be “well capitalized”“well-capitalized”, an OCC-regulated savings association must have a common equity Tier 1 risk-based capital ratio of at least 6.5%, a Tier 1 risk-based capital ratio of at least 8.0%, a total risk-based capital ratio of at least 10.0%, and a Tier 1 leverage ratio of at least 5.0%, and not be subject to any written agreement, order or capital directive, or prompt corrective action directive issued by the OCC. An adequately capitalized savings association must maintain a common equity Tier 1 risk-based capital ratio of at least 4.5%, a Tier 1 risk-based capital ratio of at least 6.0%, a total risk-based capital ratio of at least 8.0%, and a Tier 1 leverage ratio of at least 4.0%. If a savings association falls below any one of these floors, it becomes undercapitalized and subject to a variety of restrictions on its operations. There is no tangible capital requirement under prompt corrective action.
As of December 31, 2021,2023, the Bank met all of the prerequisites for well-capitalized status. Additionally, for the Company to be considered “well capitalized”“well-capitalized” under Federal Reserve regulations, the Bank must be well-capitalized and the Company must not be subject to any written agreement, order, capital directive, or prompt corrective action directive issued by the Federal Reserve to meet and maintain a specific capital level for any capital measure.
Dividend Restrictions
Both OCC and Federal Reserve regulations govern capital distributions by federal savings associations to their holding companies. Covered distributions include cash dividends, stock repurchases and other transactions charged to the capital account of a savings association. A savings association must file a notice with the Federal Reserve at least 30 days before making any capital distribution. A federal savings association also must file an application with the OCC for approval of a capital distribution if, among other things: (1) the total capital distributions for the current calendar year (including the proposed capital distribution) exceed the sum of the institution’s net income for that year to date plus the institution’s retained net income for the preceding two years, (2) the institution would not be well capitalizedwell-capitalized following the distribution, or (3) the distribution would violate any applicable statute, regulation, agreement or OCC-imposed condition. If an application to the OCC is not required, the federal savings association must provide the OCC a copy of the notice it files with the Federal Reserve.
The OCC may prohibit a proposed capital distribution that would otherwise be permitted by OCC regulations, if the OCC determines that such distribution would constitute an unsafe or unsound practice.
Under federal law, an insured depository institution cannot make any capital distribution if the capital distribution would cause the institution to become undercapitalized or if it is already undercapitalized. The FDIC also prohibits an insured depository institution from paying dividends on its capital stock or interest on its capital notes or debentures (if such interest is required to be paid only out of net profits) or distributing any of its capital assets while it remains in default in the payment of any assessment due the FDIC. The Bank is currently not in default in any assessment payment to the FDIC.
Insurance of Deposit Accounts
The Bank’s deposits are insured to the maximum extent permitted by the Deposit Insurance Fund. As insurer, the FDIC is authorized to conduct examinations of, and to require reporting by, insured institutions. It also may prohibit any insured institution from engaging in any activity determined by regulation or order to pose a serious threat to the FDIC. The FDIC also has the authority to initiate enforcement actions against savings associations, after giving the OCC an opportunity to take such action.
The maximum deposit insurance amount per depositor per insured depository institution per certain types of accounts is $250,000.
The FDIC uses a risk-based premium system to calculate quarterly assessments for FDIC-insured institutions. It has revised its methodology from time to time. The current methodology has a range of initial assessment rates from 3 basis points to 30 basis points on insured deposits, subject to adjustments. An insured depository institution's rate is determined within a range of base assessment rates based in part on its CAMELS composite rating, taking into account other factors and adjustments. The methodology that the FDIC uses to calculate assessment amounts is also based on whether the Deposit Insurance Fund has met the FDIC's designated reserve ratio, which is currently 2%, and the minimum reserve ratio of 1.35% set forth in the Dodd-Frank Act. Since the outbreak of the COVID-19 pandemic, the amount of total estimated insured deposits has grown very rapidly while the funds in the DIFFDIC's Deposit Insurance Fund (DIF) have grown at a normal rate, causing the DIF reserve ratio to fall below the statutory minimum of 1.35%. The FDIC adopted a restoration plan onin September 15, 2020, which it amended in June 2022, to restore the DIF reserve ratio to at least 1.35% by September 30, 2028.
Under the restoration plan,On October 18, 2022 the FDIC will continueadopted a final rule to closely monitor the factors that affect the DIF reserve ratio and maintain its current schedule of assessment rates. Any future changes in insurance premiums could have an adverse effect on the operating expenses and results of operations and we cannot predict whatincrease initial base deposit insurance assessment rates for insured depository institutions by 2 basis points, beginning with the first quarterly assessment period of 2023. The increased assessment rate schedules will beremain in effect unless and until the reserve ratio of the DIF meets or exceeds 2%. As a result of the new rule, the FDIC insurance costs of insured depository institutions, including the Bank, have increased.
On November 16, 2023, the FDIC approved a final rule to implement a special deposit insurance assessment to recover losses to the DIF arising from the protection of uninsured depositors following the receiverships of failed institutions in the future.spring of 2023. Under the final rule, the assessment base for the special assessment is equal to an insured depository institution’s estimated uninsured deposits, reported for the quarter ended December 31, 2022, minus the first $5 billion in estimated uninsured deposits. As of December 31, 2022, the Bank had approximately $6.9 billion of estimated uninsured deposits. The FDIC will collect the special assessment over eight quarterly assessment periods starting with the first quarter of 2024, at a quarterly rate of 3.36 basis points (0.0336%).We recognized the entire special assessment expense of approximately $5.1.million in the fourth quarter of 2023. However, depending on future adjustments to the DIF’s estimated loss, the FDIC has retained the ability to cease collection early, extend the special assessment collection period, or impose a one-time final shortfall assessment.
The FDIC may terminate the deposit insurance of any insured depository institution, including the Bank, if it determines after a hearing that the institution has engaged or is engaging in unsafe or unsound practices, is in an unsafe or unsound condition to continue operations, or has violated any applicable law, regulation, order or any condition imposed by an agreement with the FDIC. It also may suspend deposit insurance temporarily during the hearing process for the permanent termination of insurance, if the institution has no tangible capital. Management is not aware of any existing circumstances that would result in termination of our deposit insurance.
Reserves
Pursuant to regulations of the Federal Reserve, a savings association must maintain reserves against its transaction accounts. Because required reserves must be maintained in the form of vault cash or in a noninterest bearing account at a Federal Reserve Bank, the effect of the reserve requirement may reduce the amount of an institution’s interest-earning assets. During 2020, in response to the COVID-19 pandemic, the Federal Reserve reduced all reserve requirement ratios to zero. The Federal Reserve indicated that it may adjust reserve requirement ratios in the future if conditions warrant.
Retail Branch Office Network
The Bank maintains branch offices in three states,states: Delaware, Pennsylvania and New Jersey. A federal savings association may open new branch offices in any state or relocate branch offices. Prior OCC approval is necessary unless the association is an “eligible” savings association and meets certain other conditions. The Bank currently qualifies as an eligible savings association. If prior approval is necessary, the OCC will consider the effect of the acquisition on a safe and sound banking system, the branch office's role in providing fair access to financial services by helping to meet the credit needs of the entire community, the association's compliance with laws and regulations, and the fair treatment of customers including efficiency and better service. If a federal savings association acquires branch offices through a merger with or through a branch purchase from another bank or savings association, the acquiring federal savings association must submit a Bank Merger Act application to the OCC, which requires a favorable decision on the acquisition of the branch offices. The Bank has grown its branch office network primarily through mergers with other institutions, rather than branch office purchases or de novo offices. A federal savings association also may open agency offices for certain purposes without prior OCC approval. The Bank does not have any agency offices and has no plans to open any such offices.
Consumer Protection Regulations
The Bank’s offerings of retail products and services to consumers are subject to a large number of statutes and regulations designed to protect the finances of consumers and to promote lending to various sectors of the economy and population. These laws include, but are not limited to the Equal Credit Opportunity Act, the Fair Credit Reporting Act, the Truth in Lending Act, the Home Mortgage Disclosure Act, the Real Estate Settlement Procedures Act, the Truth in Savings Act, the Electronic Funds Transfer Act, federal and state prohibitions on unfair, deceptive, or abusive acts or practices, and regulations implementing each of these statutes. The CFPB has exclusive authority to examine the Bank for compliance with these laws. States may adopt more stringent consumer financial protection statutes that could apply to us as well. State attorneys general also may file suit to enforce federal and state laws.
Since the CFPB first began operations, the CFPB's supervisory, enforcement, and rulemaking priorities have shifted as its leadership has changed, and we are unable to predict what effect, if any, future changes to the CFPB's leadership and priorities may have on the Bank.
Since its creation in 2011, the
The CFPB has issued a number of significant rules, including rules that affect nearly every aspect of the residential mortgage lending and servicing process, from origination through maturity or foreclosure. Among other things, the rules require home mortgage lenders to: (i) develop and implement procedures to ensure compliance with a “reasonable ability to repay” test and identify whether a loan meets a new definition for a “qualified mortgage,” in which case a rebuttable presumption exists that the creditor extending the loan has satisfied the reasonable ability to repay test; (ii) implement new or revised disclosures, policies and procedures for originating and servicing mortgages including, but not limited to, pre-loan counseling, early intervention with delinquent borrowers and specific loss mitigation procedures for loans secured by a borrower’s principal residence; (iii) comply with additional restrictions on mortgage loan originator hiring and compensation; (iv) comply with new disclosure requirements and standards for appraisals and certain financial products; and (v) maintain escrow accounts for higher-priced mortgage loans for a longer period of time. Some of these rules may be modified, but the CFPB has not finalized any changes. The CFPB also has authority to establish rules prohibiting unfair, deceptive, or abusive acts or practices.
Debit Card Interchange Fees
The Federal Reserve has issued rules under the Electronic Fund Transfer Act, as amended by a section of the Dodd-Frank Act, known as the Durbin Amendment, to limit interchange fees that an issuer with $10 billion or more in assets, such as the Bank, may receive or charge for an electronic debit card transaction. Under the rules, the maximum permissible interchange fee that an issuer may receive for an electronic debit transaction is the sum of 21 cents per transaction and five basis points multiplied by the value of the transaction. In addition, the rules allow for an upward adjustment of no more than one cent to an issuer’s debit card interchange fee if the issuer develops and implements policies and procedures reasonably designed to achieve the fraud-prevention standards set out in the rule. The Bank became subject to these rules beginning July 1, 2020.
In October 2023, the Federal Reserve proposed changes to its rules implementing the Durbin Amendment that would decrease the maximum interchange fees that an issuer may receive for an electronic debit transaction to the sum of 14.4 cents and four basis points multiplied by the value of the transaction, and increase the fraud prevention adjustment to 1.3 cents.We are evaluating the impact of the proposal.
Privacy and Cybersecurity
Several federal statutes and regulations require savings associations (as well as banks and other financial institutions) to take several steps to protect nonpublic consumer financial information. The Bank has prepared a privacy policy, which it must disclose to consumers annually. In some cases, the Bank must obtain a consumer's consent before sharing information with an unaffiliated third party, and the Bank must allow a consumer to opt out of the Bank's sharing of information with its affiliates for marketing and certain other purposes. Additional conditions come into play in the Bank's information exchanges with credit reporting agencies. The Bank's privacy practices and the effectiveness of its systems to protect consumer privacy are one of the subjects covered in the OCC's periodic compliance examinations.
The federal banking agencies pay close attention to the cybersecurity practices of savings associations, banks, and their holding companies and affiliates. The interagency council of the agencies, the Federal Financial Institutions Examination Council, has issued several policy statements and other guidance for banks as new cybersecurity threats arise. FFIEC has recently focused on such matters as compromised customer credentials and business continuity planning. Examinations by the banking agencies now include review of an institution’s information technology and its ability to thwart or mitigate cyber-attacks. Additionally, a final rule that the federal banking agencies issued in November 2021 requires banking organizations are required to notify their primary federal regulator of significant computer security incidents within 36 hours of determining that such an incident has occurred. The compliance date of this rule is May 1, 2022.
Bank Secrecy Act and Anti-Money Laundering
The Bank Secrecy Act requires federal savings associations and other financial institutions to establish a risk-based system of internal controls reasonably designed to prevent money laundering and the financing of terrorism. Principal requirements for an insured depository institution include (i) establishment of an anti-money laundering program that includes training and audit components; (ii) establishment of a "know your customer" program involving due diligence to confirm the identity of persons seeking to open accounts and to deny accounts to those persons unable to demonstrate their identities; (iii) the filing of currency transaction reports for deposits and withdrawals of large amounts of currency; (iv) additional precautions for accounts sought and managed for non-U.S. persons; (v) verification and certification of money laundering risk with respect to private banking and foreign correspondent banking relationships; and (vi) the filing of suspicious activity reports for suspicious transactions. For many of these tasks an insured depository institution must keep records to be made available to its primary federal regulator. Anti- money laundering rules and policies are developed and enforced by a bureau within the U.S. Department of the Treasury, the Financial Crimes Enforcement Network (FinCEN), but compliance by individual institutions is also overseen by their primary federal regulator, which in the Bank's case is the OCC.
Bank Secrecy Act and anti-money laundering compliance has been a special focus of the OCC and the other federal banking agencies in recent years. Any non-compliance is likely to result in an enforcement action, often with substantial monetary penalties and reputation damage. A savings association or bank that is required to strengthen its compliance program often must put on hold any initiatives that require banking agency approval.
The Office of Foreign Assets Control (OFAC), an office within the U.S. Treasury Department, administers laws and Executive Orders that prohibit U.S. entities from engaging in transactions with certain prohibited parties. OFAC publishes lists of persons and organizations suspected of aiding, harboring or engaging in terrorist acts, known as Specially Designated Nationals and Blocked Persons. Generally, if a bank or savings association identifies a transaction, account or wire transfer relating to a person or entity on an OFAC list, it must freeze the account or block the transaction, file a suspicious activity report and notify the appropriate authorities.
Community Reinvestment Act
All savings associations and banks are subject to the Community Reinvestment Act (CRA), which requires each such institution to help meet the credit needs of low- to moderate-income communities and individuals within the institution’s assessment area. The CRA does not impose specific lending requirements, and it does not contemplate that a savings association or bank would take any action inconsistent with safety and soundness. The federal banking agencies evaluate the performance of each of their regulated institutions periodically. Evaluations that result in a conclusion of “Needs to Improve” or “Substantial Non-Compliance” may block or impede regulatory approvals for other actions by an institution.
The Bank received a rating of “Outstanding” in its most recent performance evaluation.
On December 15, 2021,October 24, 2023, the Federal Reserve, FDIC, and OCC adoptedissued a final rule revising their framework for evaluating banks’ records of community reinvestment under the CRA. Under the revised framework, banks with assets of at least $2 billion, such as the Bank, are considered large banks and their retail lending, retail services and products, community development financing, and community development services will be subject to periodic evaluation. Depending on a large bank’s geographic distribution of lending, the evaluation of retail lending may include assessment areas in which took effect onthe bank extends loans but does not operate any deposit-taking facilities, in addition to assessment areas in which the bank has deposit taking facilities. The rule becomes effective April 1, 2024. Compliance with most provisions of the final rule will be required beginning January 1, 2022, to rescind changes to2026, and compliance with the OCC’s CRA regulations thatremaining provisions will be required beginning January 1, 2027. We are evaluating the agency had adopted in June 2020 and to restore the CRA standards that previously applied to OCC-regulated institutions. The federal banking agencies have indicated their intent to engage in an interagency rulemaking process to modernize the CRA regulatory framework.
Sales of Insurance Products and Annuities
The Bank’s sales of insurance products and annuities, including through subsidiaries, are subject to regulation under federal and state law. In particular, consumer protection rulesimpact of the federal banking agencies apply to the retail sales practices, solicitation, advertising final rule, including whether it will make it more challenging and/or offers of insurance products and annuities by depository institutions and, in some cases, their subsidiaries.
These rules provide that before the sale of an insurance or annuity product can be completed, disclosures must be made that state (i) such product is not a deposit or other obligation of, or guaranteed by,costly for the Bank its affiliates, the FDICto achieve an “Outstanding” or any other agency of the United States; and (ii) in the case of an insurance or annuity product that involves an investment risk, that there is an investment risk involved with the product, including a possible loss of value. The rules require formal acknowledgement from the consumer that such disclosures have been received.
The rules also provide that the Bank and its subsidiaries may not condition an extension of credit on the consumer’s purchase of an insurance product or annuity from the Bank or its affiliates or on the consumer’s agreement not“Satisfactory” CRA rating, which could negatively impact our ability to obtain or a prohibition on the consumer obtainingregulatory approval for an insurance product or annuity from an unaffiliated entity.acquisition.
In addition, to the extent practical, the Bank and its subsidiaries must keep insurance and annuity sales activities physically separate from the areas where retail banking transactions are routinely accepted from the general public.
ITEM 1A. RISK FACTORS
As a financial services organization, we are subject to a number of risks inherent in our transactions and present in the business decisions we make. Described below are the primary risks and uncertainties that if realized could have a material and adverse effect on our business, financial condition, results of operations, cash flows, and liquidity. The risks and uncertainties described below are not the only risks we face.
We have identified our major risk categories as: market risk, credit risk, capital and liquidity risk, compliance risk, operational risk, strategic risk, reputation risk and model risk. Market risk is the risk of loss due to changes in external market factors such as interest rates. Credit risk is the risk of loss that arises when an obligor fails to meet the terms of an obligation. We are exposed to both customer credit risk, from our loans, and institutional credit risk, principally from our various business partners and counterparties. Capital and liquidity risk is the risk that financial condition or overall safety and soundness are adversely affected by an inability, or perceived inability, to meet obligations and support business growth. Compliance risk is the risk that we fail to adequately comply with applicable laws, rules and regulations. Operational risk is the risk of loss arising from inadequate or failed processes, people or systems, external events (such as natural disasters) or compliance, reputation or legal matters and includes those risks as they relate directly to the Company as well as to third parties with whom we contract or otherwise do business. Strategic risk is the risk from changes in the business environment, improper implementation of decisions or inadequate responsiveness to changes in the business environment. Reputation risk is the risk of loss that arises from negative publicity or perceptions regarding our business practices. Model risk refers to the possibility of unintended business outcomes arising from the design, implementation or use of models.
1. Market Risk
The novel coronavirus (“COVID-19”) pandemic and the impact of actions to mitigate the spread of the virus has adversely affected our business, financial condition and results of operations and may to continue to do so.
Over the course of the COVID-19 pandemic, federal, state and local governments enacted various restrictions and policies in an attempt to limit the spread of COVID-19. Such measures have disrupted economic activity and contributed to job losses and reductions in consumer and business spending. In response to the economic and financial effects of COVID-19, the Federal Reserve reduced interest rates through 2020 and 2021 and instituted quantitative easing measures as well as domestic and global capital market support programs although the Federal Reserve has suggested that it may take steps to raise interest rates in 2022. In addition, federal, state and local governments have taken measures to address the economic and social consequences of the pandemic, including the passage of the CARES Act. The CARES Act, among other things, provides certain measures to support individuals and businesses in maintaining solvency through monetary relief, including in the form of financing, loan forgiveness and automatic forbearance.
In 2021, the pandemic continued to evolve with the rapid spread of the Omicron variant. The uncertainty regarding the duration of the pandemic and the resulting economic disruption contributed to a slowdown in economic growth and business generally and continues to contribute to increased market volatility and a significant decrease in consumer confidence, compounded by unfavorable economic trends such as increased unemployment levels, inflation, and supply chain issues. The continuation of these conditions, including whether due to a resurgence or additional waves of COVID-19 infections or variants thereof, particularly as the geographic areas in which we operate, how quickly and to what extent normal economic and operating conditions can resume and continue, and the potential waning of vaccine effectiveness or effects of low vaccination rates, has adversely affected our results of operations and financial condition, and have and may further adversely impact our businesses and results of operations and the operations of our borrowers, customers and business partners. In particular, these events have had, and/or can be expected to continue to have, the following effects, among other things:
•impair the ability of borrowers to repay outstanding loans or other obligations, resulting in increases in delinquencies and modifications to loans;
•impair the value of collateral securing loans;
•impair the value of our assets, including our securities portfolio, goodwill and intangible assets;
•require an increase in our allowance for credit losses;
•adversely affect the stability of our deposit base or otherwise impair our liquidity;
•reduce our revenues from fee-based services, including wealth management and the demand for our products and services;
•negatively impact our self-insurance healthcare costs;
•result in increased compliance risk as we become subject to new regulatory and other requirements, related to programs in which we participate;
•impair the ability of loan guarantors to honor commitments;
•negatively impact our regulatory capital ratios;
•present increased operational risks to our business practices with part of our workforce and third-party service providers who perform critical services for us working remotely and at risk of missing work; and
•increase cyber and payment fraud risk and other operational risks, given increased online and remote activity, which may adversely affect the realization of the anticipated benefits of our Delivery Transformation initiative.
Prolonged or renewed measures by health or other governmental authorities encouraging or requiring significant restrictions on travel, assembly or other core business practices could further harm our business and those of our customers, in particular our small to medium sized business customers. Although we have business continuity plans and other safeguards in place, they may not be effective.
Our loan portfolio includes loans that are in forbearance but which are not classified as TDRs because they were current at the time forbearance began. When the forbearance periods end, we may be required to classify a substantial portion of these loans as problem loans.
Our results of operations have been adversely affected by the factors described above. For example, for the year ended December 31, 2020 these factors caused a substantial increase in our provision for credit losses and the amount of our problem loans. While the ultimate impact of these factors over the longer term is uncertain and we do not yet know the full extent of the impacts on our business, our operations or the global economy as a whole, nor the pace of economic recovery when the COVID-19 pandemic subsides, the decline in economic conditions generally and a prolonged negative impact on small to medium sized businesses, in particular, due to COVID-19 may result in an adverse effect on our business, financial condition and results of operations in future periods.
Difficult market conditions and unfavorable economic trends could adversely affect our industry and our business.
We are exposed to downturns in the DelawareGreater Philadelphia and Greater PhiladelphiaDelaware region, Mid-Atlantic and overall U.S. economy and housing markets. Unfavorable economic trends, sustained high unemployment, high costs of living, and declines in real estate values can cause a reduction in the availability of commercial credit and can negatively impact the credit performance of commercial and consumer loans, resulting in increased write-downs. These negative trends can cause economic pressure on consumers and businesses and diminish confidence in the financial markets, which may adversely affect our business, financial condition, results of operations and ability to access capital. A worsening of these conditions, such as a recession or economic slowdown, would likely exacerbate the adverse effects of these difficult market conditions on us and others in the financial services industry. In particular, we may face the following risks in connection with these events:
•An increase in the number of customers unable to repay their loans in accordance with the original terms, which could result in a higher level of loan and lease losses and provision for loan and lease losses;
•Decreases in customer deposits;
•Impaired ability to assess the creditworthiness of customers as the models and approaches we use to select, manage and underwrite our customers become less predictive of future performance;
•Impaired ability to estimate the losses inherent in our credit exposure as the process we use to make such estimates requires difficult, subjective and complex judgments based on forecasts of economic or market conditions that might impair the ability of our customers to repay their loans, and this estimating process becomes less accurate and thus less reliable as economic conditions worsen;
•Increases in foreclosures, delinquencies and customer bankruptcies, as well as more restricted access to commercial credit;
•Decreases in our Wealth Management segment's AUM portfolios as a result of, among other things, decreases in market value from investment performance losses;losses and customers' increased financial needs;
•Downward pressure on our stock price or an impaired ability to access the capital markets or otherwise obtain needed funding on attractive terms or at all;
•Changes in the regulatory environment, including regulations promulgated or to be promulgated under federal banking legislation or other new regulations, and changes in accounting standards, which could influence recognition of loan and lease losses and our allowance for credit losses, and could result in earlier recognition of loan losses and decreases in capital; and
•Increased competition due to intensified consolidation of the financial services industry.
Changes in interest rates and other factors beyond our control could have an adverse impact on our earnings.
Over the past several years, our earnings have been, and continue to be, significantly impacted by substantial fluctuations in the interest rate environment. In response to the economic and financial effects of the COVID-19 pandemic, the Federal Reserve initially reduced interest rates through 2020 and 2021 and instituted quantitative easing measures as well as domestic and global capital market support programs. In 2022 and 2023, to curb rising inflation, the Federal Reserve increased the target Federal Funds rate−the interest rate that banks charge each other for overnight lending in order to help maintain the reserve requirements of the Federal Reserve−to a range between 5.25% and 5.50% as of December 2023 and enacted policies to achieve that target range. As the increases in the target Federal Funds rate resulted in increased costs of operating a financial institution, the costs of borrowing increased while the availability of credit and the favorable credit terms available under the Federal Reserve’s 2020 and 2021 policies generally decreased.
Our operating income and net income depend to a significant extent on our net interest margin, which is the difference between the interest yields we receive on loans, securities and other interest-earning assets and the interest rates we pay on interest-bearing deposits and other liabilities. Net interest margin is affected by changes in market interest rates, because different types of assets and liabilities may react differently, and at different times, to market interest rate changes. When interest-bearing liabilities mature or reprice more quickly than interest-earning assets in a period, an increase in market rates of interest could reduce net interest income. Similarly, when interest-earning assets mature or reprice more quickly than interest-bearing liabilities, falling interest rates could reduce net interest income. These rates are highly sensitive to many factors beyond our control, including competition, general economic conditions and monetary and fiscal policies of various governmental regulatory agencies, including the Federal Reserve.Reserve and the target Federal Funds rate.
We seek to manage our risk from changes in market interest rates by adjusting the rates, maturity, repricing, and balances of our different types of interest-earning assets and interest-bearing liabilities, but these interest rate risk management techniques are not capable of eliminating such risks and they may not be as effective as we intend. AIn particular, rapid increaseincreases or decreasedecreases in interest rates could have anunusually adverse effecteffects on our net interest margin, including the impact of deposit betas, and results of operations.operations to the extent our interest rate risk management techniques are insufficient to mitigate these risks in a timely manner. The results of our interest rate sensitivity simulation models depend upon a number of assumptions which may prove to be inaccurate. We may not be able to successfully manage our interest rate risk. In addition, increases in market interest rates and/or adverse changes in the local residential real estate market, the general economy or consumer confidence would likely have a significant adverse impact on our noninterest income, as a result of reduced demand for residential loans that we pre-sell.
Interest rate increases often result in larger payment requirements for our borrowers, which increase the potential for default and could result in a decrease in the demand for loans. At the same time, the marketability of the property securing a loan may be adversely affected by any reduced demand resulting from higher interest rates. In a declining interest rate environment, there may be an increase in prepayments on loans as borrowers refinance their loans at lower rates. In addition, in a low interest rate environment, loan customers often pursue long-term fixed rate credits, which could adversely affect our earnings and net interest margin if rates increase. Changes in interest rates also can affect the value of loans, securities and other assets. An increase in interest rates that adversely affects the ability of borrowers to pay the principal or interest on loans may lead to an increase in nonperforming assets and a reduction of income recognized, which could have an adverse effect on our results of operations and cash flows. Further, when we place a loan on nonaccrual status, we reverse any accrued but unpaid interest receivable, which decreases interest income. At the same time, we continue to have a cost to fund the loan, which is reflected as interest expense, without any interest income to offset the associated funding expense. Thus, an increase in the amount of nonperforming assets would have an adverse impact on net interest income.
The market value of our investment securities portfolio may be impacted by the level of interest rates and the credit quality and strength of the underlying collateral.
Our net interest income varies as a result of changes in interest rates as well as changes in interest rates across the yield curve. When interest rates are low, borrowers have an incentive to refinance into mortgages with longer initial fixed rate periods and fixed rate mortgages, causing our securities to experience faster prepayments. Increases in prepayments on our portfolio will cause our premium amortization to accelerate, lowering the yield on such assets. If this happens, we could experience a decrease in interest income, which may negatively impact our results of operations and financial position.condition.
Future changes in interest rates may reduce the market value of our investment securities.securities, which could impact market confidence in our operations. A series of bank failures in the spring of 2023 was precipitated by losses in the value of securities portfolios due to rising interest rates and subsequent reduction in deposits. In addition, our securities portfolio is subject to risk as a result of our exposure to the credit quality and strength of the issuers of the securities or the collateral backing such securities. Any decrease in the value of the underlying collateral will likely decrease the overall value of our securities, affecting equity and possibly impacting earnings.
Changes in or questions about the soundness of other financial institutions could adversely affect us.
Our ability to engage in routine funding transactions could be adversely affected by the actions of and changes in the commercial soundness of other financial institutions. Defaults by, or even rumors or questions about, one or more financial services institutions, or the financial services industry generally, have led to market-wide liquidity problems and could lead to losses or defaults by us or by other institutions and damage to our reputation by association. Such events could adversely affect our business, results of operations.
operations, or financial condition.The financial services industry and our market area are highly competitive.
We compete with regional and national financial institutions and other non-bank companies, some of which may have larger client bases, operate with greater resources, and offer lending terms and services that we do not or cannot offer. Some of these competitors may have other advantages, such as the favorable tax treatments available to credit unions. The financial services industry continues to consolidate due to the benefits of operating at a larger scale and is undergoing rapid technological development that may require us to further develop and invest in our digital capabilities. This competition can affect the pricing for our products and services and if the Company cannot compete effectively, we may lose market share and income resulting in an adverse effect on our earnings,business, results of operations and financial position.condition.
2. Credit Risk
Significant increases of nonperforming assets, or greater than anticipated costs to resolve these credits, can have an adverse effect on our earnings.
Our nonperforming assets, which consist of non-accrual loans, assets acquired through foreclosure, and troubled debt restructurings (TDRs)restructured loans adversely affect our net income in various ways. We do not record interest income on nonaccrual loans and assets acquired through foreclosure. We must establish an allowance for credit losses which reserves for losses inherent in the loan and lease portfolio that are both probable and reasonably estimable. From time to time, we also write down the value of properties in our portfolio of assets acquired through foreclosure to reflect changing market values. Additionally, there are legal fees associated with the resolution of problem assets as well as carrying costs such as taxes, insurance and maintenance related to assets acquired through foreclosure. The resolution of nonperforming assets requires the active involvement of management, which can distract management from daily operations and other income producing activities. Finally, if our estimate of the allowance for credit losses is inadequate, we will have to increase the allowance for credit losses accordingly, which will have an adverse effect on our earnings. Significant increases in the level of our nonperforming assets from the current level, or greater than anticipated costs to resolve these credits, will have an adverse effect on our earnings.
Our loan portfolio includes a substantial amount of commercial mortgage, commercial and industrial, and construction and land development and commercial and industrial loans. The credit risk related to these types of loans is greater than the risk related to residential loans.
Our commercial loan portfolio includes commercial and industrial loans, commercial mortgage loans, and construction and land development loans. Commercial mortgage loans generally carry larger loan balances and involve a greater degree of risk of nonpayment or late payment than home equity loans or residential mortgage loans. Any significant failure to pay or late payments by our customers would adversely affect our earnings. The increased credit risk associated with these types of loans is a result of several factors, including the concentration of principal in a limited number of loans and borrowers, the larger size of loan balances, and the potential that adverse changes in general economic and working conditions can adversely affect income-producing properties.properties, such as reduced office usage as a result of remote work policies. A portion of our commercial mortgage, construction and land development and commercial and industrial loan portfolios includes a balloon payment feature. A number of factors may affect a borrower’s ability to make or refinance a balloon payment, including the financial condition of the borrower, the prevailing local economic conditions and the prevailing interest rate environment.
Furthermore, commercial and industrial loans secured by owner-occupied properties are dependent upon the successful operation of the borrower’s business. If the operating company suffers difficulties, including reduction in sales volume and/or profitability, the borrower’s ability to repay the loan may be impaired. Loans secured by properties where repayment is dependent upon payment of rent by third party tenants or the sale of the property may be impacted by loss of tenants, lower lease rates needed to attract new tenants or the inability to sell a completed project in a timely fashion and at a profit.
We are exposed to increased credit losses and credit related expenses in the event of a major natural disaster, public health crisis, other catastrophic event or significant climate change effects.
The occurrence of a major natural or environmental disaster, public health crisis or similar catastrophic event, as well as significant climate change effects such as rising sea levels or wildfires, especially in densely populated geographic areas, could increase our credit losses and credit related expenses. A natural disaster, public health crisis or catastrophic event or other significant climate change effect that either damages or destroys residential or multifamily real estate underlying mortgage loans or REOreal estate owned properties, or negatively affects the ability of borrowers to continue to make payments on loans, could increase our serious delinquency rates and average loan loss severity in the affected areas. Such events could also cause downturns in economic and market conditions generally, which could have an adverse effect on our business and financial results. We may not have adequate insurance coverage for some of these natural, catastrophic, public health or climate change-related events.
Concentration of loans in our primary markets may increase our risk.
Our success depends primarily on the general economic conditions and housing markets in the state of Delaware, southeastern Pennsylvania, southern New Jersey and northern Virginia, as a large portion of our loans are made to customers in these markets. This makes us vulnerable to a downturn in the local economy and real estate markets in these areas. Declines in real estate valuations in these markets would lower the value of the collateral securing those loans, which could cause us to realize losses in the event of increased foreclosures. Local economic conditions have a significant impact on the ability of borrowers to repay loans as well as our ability to originate new loans. In addition, weakening in general economic conditions such as inflation, stagflation, increased costs-of-living, recession, unemployment, natural disasters or other factors beyond our control could negatively affect demand for loans, the performance of our borrowers and our financial results.
If our allowance for credit losses is not sufficient to cover actual loan and lease losses, our earnings will decrease.
We make various assumptions and judgments about the collectability of the loans and leases in our portfolio, including the creditworthiness of our borrowers and the value of the real estate and other assets serving as collateral for the repayment of many of our loans and leases. In determining the amount of the allowance for credit losses, we review our portfolio mix and segmentation, modeling methodology, historical loss experience, relevant available information from internal and external sources relating to qualitative adjustment factors, prepayment speeds and reasonable and supportable forecasts about future economic conditions. If our assumptions are incorrect or if there is a significant deterioration in economic conditions, our allowance for credit losses may not be sufficient to cover expected credit losses in our loan and lease portfolio, resulting in unanticipated losses and additions to our allowance for credit losses. Material additions to our allowance for credit losses could materially decrease our net income.
3. Capital and Liquidity Risk
Our inability to grow deposits in the future could adversely affect our liquidity and ability to grow our business.
A key part of our strategy is to grow deposits. The market for deposits is highly competitive, with intense competition in attracting and retaining deposits. We compete on the basis of the rates we pay on deposits, features and benefits of our products, the quality of our customer service and the competitiveness of our digital banking capabilities. Our ability to originate and maintain deposits is also highly dependent on the strength of the Bank and the perceptions of customers and others of our business practices and our financial health. Adverse perceptions regarding our reputation could lead to difficulties in attracting and retaining deposits accounts. Negative public opinion could result from actual or alleged conduct in a number of areas, including lending practices, regulatory compliance, inadequate protection of customer information or sales and marketing activities, and from actions taken by regulators or others in response to such conduct.
The demand for the deposit products we offer may also be reduced due to a variety of factors, such as demographic patterns, changes in customer preferences, reductions in consumers’ disposable income, regulatory actions that decrease customer access to particular products or the availability of competing products. Competition from other financial services firms and others that use deposit funding products may affect deposit renewal rates, costs or availability. Changes we make to the rates offered on our deposit products may affect our profitability and liquidity.
The FDIA prohibits an insured bank from accepting brokered deposits or offering interest rates on any deposits significantly higher than the prevailing rate in the bank’s normal market area or nationally (depending upon where the deposits are solicited), unless it is “well capitalized,“well-capitalized,” or it is “adequately capitalized” and receives a waiver from the FDIC. A bank that is “adequately capitalized” and accepts brokered deposits under a waiver from the FDIC may not pay an interest rate on any deposit in excess of 75 basis points over certain prevailing market rates. There are no such restrictions under the FDIA on a bank that is “well capitalized”“well-capitalized” and at December 31, 2021,2023, the Bank met or exceeded all applicable requirements to be deemed “well capitalized”“well-capitalized” for purposes of the FDIA. However, the Bank may not continue to meet these requirements. Limitations on the Bank’s ability to accept brokered deposits (including regulatory limitations on the amount of brokered deposits in total or as a percentage of total assets) for any reason in the future could adversely impact our funding costs and liquidity. Any limitation on the interest rates the Bank can pay on deposits could competitively disadvantage us in attracting and retaining deposits and have an adverse effect on our business.
We could experience an unexpected inability to obtain needed liquidity.
Liquidity is essential to our business, as we use cash to fund loans and investments, other interest-earning assets and deposit withdrawals that occur in the ordinary course of our business. We also are required by federal and state regulatory authorities to maintain adequate levels of capital to support our operations. Additionally, the operations of our Cash Connect® segment depends on us having access to large amounts of cash.
Our principal sources of liquidity include customer deposits, the Bank Term Funding Program FHLB borrowings, brokered certificates of deposit, sales of loans, repayments to the Bank from borrowers and paydowns and sales of investment securities. Our ability to obtain funds from these sources could become limited, or our costs to obtain such funds could increase, due to a variety of factors, including changes in our financial performance, the imposition of regulatory restrictions on us, or adverse developments in the capital markets, including weakening economic conditions or negative views and expectations about the prospects for the financial services industry as a whole. If our ability to obtain necessary funding is limited or the costs of such funding increase, our ability to meet our obligations or grow our banking business would be adversely affected and our financial condition and results of operations could be harmed.
Restrictions on our subsidiaries’ ability to pay dividends to us could negatively affect our liquidity and ability to pay dividends.
We are a separate and distinct legal entity from our subsidiaries, including the Bank. We receive substantially all of our revenue from dividends from our subsidiaries. These dividends are the principal source of funds to pay dividends on our common stock, and interest and principal on our debt. Various federal and/or state laws and regulations limit the amount of dividends that the Bank and certain of our nonbank subsidiaries may pay us, and the OCC may block dividend payments by the Bank. Also, our right to participate in a distribution of assets upon a subsidiary’s liquidation or reorganization is subject to the prior claims of the subsidiary’s creditors. Limitations on our subsidiaries to pay dividends to us could have an adverse effect on our liquidity and on our ability to pay dividends on our common stock. Additionally, if our subsidiaries’ earnings are not sufficient to make dividend payments to us while maintaining adequate capital levels; we may not be able to make dividend payments to our common stockholders.
4. Compliance Risk
We are subject to extensive regulation which could have an adverse effect on our operations.
We are subject to extensive federal and state regulation, supervision and examination governing almost all aspects of our operations. The laws and regulations governing our business are intended primarily to protect depositors, our customers, the public, the FDIC’s Deposit Insurance Fund, and the banking system as a whole, and not our stockholders or holders of our debt. The Federal Reserve is the primary federal regulator for the Company, the OCC is the Bank’s primary regulator and the CFPB regulates the Bank’s compliance with consumer financial protection laws. The banking laws, regulations and policies applicable to us govern a variety of matters, including certain debt obligations, changes in control, maintenance of adequate capital, and general business operations, including permissible types, amounts and terms of loans and investments, the amount of reserves held against deposits, restrictions on dividends, establishment of new offices, the maximum interest rate that may be charged by law and treatment of customers. In addition, federal and state banking regulators have broad authority to supervise our banking business, including the authority to prohibit activities that represent unsafe or unsound banking practices or constitute violations of statute, rule, regulation or administrative order. Failure to appropriately comply with any such laws, regulations or regulatory policies could result in sanctions by regulatory agencies, civil money penalties or damage to our reputation, all of which could adversely affect our business, results of operations, financial condition or prospects. A government shutdown or understaffing at the Federal Reserve, the OCC and/or the CFPB could result in unforeseen delays in our ability to receive approval for certain transactions or deal with other regulatory issues. Such a delay could adversely affect our business, results of operations, or financial condition.
We are subject to changes in federal and state banking statutes, regulations and governmental policies, and their interpretation or implementation. Certain of our subsidiaries are registered with the SEC as investment advisers and, as such, are subject to regulation, supervision and enforcement by the SEC under the Investment Advisers Act. Regulations affecting banks and other financial institutions in particular are undergoing continuous review and frequently change and the ultimate effect of such changes cannot be predicted. Regulations and laws may be modified at any time, and new legislation may be enacted that will affect us. Any changes in any federal and state law, as well as regulations and governmental policies could subject us to additional compliance costs and otherwise affect us in substantial and unpredictable ways, including ways that may adversely affect our business, results of operations, financial condition or prospects.
We face a risk of noncompliance and enforcement action under the Bank Secrecy Act and other anti-money laundering statutes and regulations.
The Bank Secrecy Act, the USA PATRIOT Act of 2001, and other laws and regulations require financial institutions, among other duties, to institute and maintain an effective anti-money laundering program and file suspicious activity and currency transaction reports when appropriate. These laws and regulations also provide that we are ultimately responsible to ensure our third party vendors adhere to the same laws and regulations. In addition to other bank regulatory agencies, FinCEN is authorized to impose significant civil money penalties for violations of those requirements and has recently engaged in coordinated enforcement efforts with the state and federal banking regulators, as well as the U.S. Department of Justice, CFPB, Drug Enforcement Administration, and Internal Revenue Service.
We are also subject to increased scrutiny of compliance with the rules enforced by OFAC regarding, among other things, the prohibition on transacting business with, and the need to freeze assets of, certain persons and organizations identified as a threat to the national security, foreign policy or economy of the United States. If our policies, procedures and systems or those of our third party vendors are deemed deficient, we would be subject to liability, including fines and regulatory actions, which may include restrictions on our ability to pay dividends and the necessity to obtain regulatory approvals to proceed with certain aspects of our business plan, including any acquisition plans. Any of these results could have an adverse effect on our business, financial condition, results of operations and future prospects.
We are subject to numerous laws designed to protect consumers and promote community investment, including fair lending laws and the Community Reinvestment Act. Failure to comply with these laws or perform satisfactorily could lead to a wide variety of sanctions.
The Equal Credit Opportunity Act, the Fair Housing Act and other fair lending laws and regulations impose nondiscriminatory lending requirements on financial institutions. Adverse findings in an evaluation of our fair lending compliance could result in a wide variety of sanctions, including damages and civil money penalties, injunctive relief, restrictions on mergers and acquisitions activity, restrictions on expansion, and restrictions on entering new business lines. Private parties may also have the ability to challenge our performance under fair lending laws in private class action litigation. Such actions could have an adverse effect on our business, financial condition, results of operations and future prospects.
The Community Reinvestment Act imposes community investment obligations on insured depository institutions. If the Bank does not perform satisfactorily under the Community Reinvestment Act, as determined by the OCC, the Company and the Bank could be restricted in their ability to expand through mergers, acquisitions, andand/or the establishment of branches.
The fiscal, monetary and regulatory policies of the federal government and its agencies could have an adverse effect on our results of operations.
The Federal Reserve regulates the supply of money and credit in the U.S. Its policies determine in large part the cost of funds for lending and investing and the return earned on those loans and investments, both of which affect our net interest margin. Its policies can also adversely affect borrowers, potentially increasing the risk that they may fail to repay their loans. Congress controls fiscal policy through decisions on taxation and expenditures. Depending on industries and markets involved, changes to tax law and increased or reduced public expenditures could affect us directly or the business operations of our customers. Changes in Federal Reserve policies, fiscal policy, and our regulatory environment generally are beyond our control, and we are unable to predict what changes may occur or the manner in which any future changes may affect our business, financial condition and results of operations.
The intention and actions of the United Kingdom’s FCA to cease support of LIBOR could negatively affect the fair value of our financial assets and liabilities, results of operations and net worth. The transition to alternative reference interest rate could present operational problems and result in market disruption, including inconsistent approaches for different financial products, as well as disagreements with counterparties.
The FCA ceased publishing most LIBOR settings as of January 1, 2022 but will continue to publish five U.S. LIBOR settings through mid-2023. We expect that the capital and debt markets will cease to use LIBOR as a benchmark, but we cannot predict whether LIBOR will actually cease to be available after its current expiration dates, whether the Secured Overnight Funding Rate (SOFR) will become the market benchmark in its place or what impact such a transition may have on our business, results of operations and financial condition.
The selection of SOFR as the alternative reference rate for these products currently presents certain market concerns because SOFR (unlike LIBOR) does not have an inherent term structure or credit risk component. A methodology has been developed to calculate SOFR-based term rates, and the Federal Reserve Bank of New York has published such rates daily since early 2020 and encouraged banks to transition away from LIBOR as soon as practicable. However, the methodology has not been tested for an extended period of time, which may limit market acceptance of the use of SOFR. In addition, SOFR may not be a suitable alternative to LIBOR for all of our financial products, and it is uncertain what other rates might be appropriate for that purpose. It is uncertain whether these other indices will remain acceptable alternatives for such products.
We have a significant number of financial products, including mortgage loans, mortgage-related securities, other debt securities and derivatives, that are indexed to LIBOR, and we continue to enter into transactions involving such products that will mature after 2021, with appropriate alternative reference rates to take effect after LIBOR's discontinuation, including the use of the WSJ Prime as a LIBOR alternative. We expect that the transition will span several reporting periods through June 2023. The replacement of LIBOR also may result in economic mismatches between different categories of instruments that now consistently rely on the LIBOR benchmark. Additionally, inconsistent approaches to a transition from LIBOR to an alternative rate among different market participants and for different financial products may cause market disruption and operational problems, which could adversely affect us, including by exposing us to increased basis risk and resulting costs in connection with remediating these problems, and by creating the possibility of disagreements with counterparties.
If we fail to comply with legal standards, we could incur liability to our clients or lose clients, which could negatively affect our earnings.
Managing or servicing assets with reasonable prudence in accordance with the terms of governing documents and applicable laws is important to client satisfaction, which in turn is important to the earnings and growth of our investment businesses. Failure to comply with these standards, adequately manage these risks or manage the differing interests often involved in the exercise of fiduciary responsibilities could also result in liability.
WSFS and WSFS Bank have over $10 billion in total consolidated assets, which leads to increased regulatory scrutiny.
Banking and thrift organizations with $10 billion or more in assets are subject to debit card interchange fee restrictions set forth in section 1075 of the Dodd-Frank Act, known as the Durbin Amendment, and implemented by regulations of the Federal Reserve. These provisions cap the maximum debit interchange fee that an issuer may receive per transaction at the sum of 21 cents plus five basis points. An issuer that adopts certain fraud prevention procedures may charge an additional one cent per transaction. The Bank became subject to the interchange restrictions of the Durbin Amendment on July 1, 2020.
Additionally, an insured depository institution with $10 billion or more in total assets is subject to supervision, examination, and enforcement with respect to consumer protection laws by the CFPB. WSFS Bank became subject to CFPB supervision, examination, and enforcement at the beginning of the first quarter of 2020.
Other regulatory requirements apply, to insured depository institution holding companies and insured depository institutions with $10 billion or more in total consolidated assets. Congress and/or regulatory agencies may impose new requirements or surcharges on such institutions in the future. The Economic Growth, Regulatory Relief, and Consumer Protection Act included provisions that relieve banking organizations with less than $10 billion in total consolidated assets (and that satisfy certain other conditions) from risk-based capital requirements, restrictions on proprietary trading and investment and sponsorship in hedge funds and private equity funds known as the Volcker Rule, and certain other regulatory requirements. By exceeding $10 billion in total consolidated assets, WSFS and WSFS Bank do not qualify for any of this relief.
The CFPB has reshaped consumer financial regulations through rulemaking and enforcement of prohibitions against unfair, deceptive or abusive business acts or practices. Compliance with any such change may impact the manner in which WSFS and WSFS Bank offer consumer financial products or services, and our results of operations.
As an insured depository institution with $10 billion or more in total assets, WSFS Bank is subject to supervision, examination, and enforcement with respect to consumer protection laws by the CFPB. The CFPB has broad authority to administer and carry out provisions of the Dodd-Frank Act with respect to the Company's consumer financial products and services and may impose requirements more onerous than those of other bank regulatory agencies. For example, the Dodd-Frank Act authorizes the CFPB to write rules or bring enforcement actions to prohibit acts or practices that are unfair, deceptive or abusive in connection with consumer financial products or services, and the concept of an "abusive" act or practice did not previously exist in federal banking law.
The CFPB has initiated enforcement actions against a variety of bank and non-bank market participants with respect to a number of consumer financial products and services, which has resulted in those participants expending significant time and money, including the costs of penalties, to respond to the actions pursued by the CFPB. As part of its rulemaking and enforcement activities, the CFPB has adopted interpretations of consumer protection laws that have required many market participants to change their practices and expend substantial resources to do so. The CFPB has used its authorities to penalize market participants and/or change market practices in several areas of the financial services industry, including automobile loan servicing, credit card account management, debt collection, small business lending, the operation of ATMs, mortgage origination, depository account management, the charging of late fees or other credit card fees, the charging of overdraft fees and insufficient funds fees on deposit accounts, and consumer reporting, among others.
There continues to be uncertainty as to how CFPB's strategies and priorities will impact the Company's business and operations. Any changes by the CFPB in regulatory expectations, interpretations or practices could increase the risk of additional enforcement actions, fines and penalties, which could have an adverse impact to the Company's business and results of operations.
As a lender that participated in the SBA’s Paycheck Protection Program (PPP), the Company is subject to added risks, including credit, fraud, and litigation risks.
As a lender that participated in the PPP, we face increased risks, particularly in terms of credit, fraud and litigation risks. The PPP opened to borrower applications shortly after the enactment of its authorizing legislation, and, as a result, there was some ambiguity in the laws, rules and guidance regarding the program’s operation. Subsequent rounds of legislation and associated agency guidance did not provide the needed clarity and in certain instances potentially created additional inconsistencies and ambiguities. Accordingly, the Company is exposed to risks relating to compliance with PPP requirements, including the risk of becoming the subject of governmental investigations, enforcement actions, private litigation, and negative publicity.
We have additional credit risk with respect to PPP loans if a determination is made by the SBA that there is a deficiency in the manner in which the loan was originated, funded or serviced, such as an issue with the eligibility of a borrower to receive a PPP loan, which may or may not be related to the ambiguity in the laws, rules and guidance regarding the operation of the PPP. In the event of a loss resulting from a default on a PPP loan and a determination by the SBA that there was a deficiency in the manner in which the PPP loan was originated, funded, or serviced by the Bank, the SBA may deny its liability under the guaranty, reduce the amount of the guarantee or, if it has already paid under the guarantee, seek recovery of any loss related to the deficiency from the Bank.
Also, PPP loans are fixed, low interest rate loans that are guaranteed by the SBA and subject to numerous other regulatory requirements, and a borrower may apply to have all or a portion of the loan forgiven. If PPP borrowers fail to qualify for loan forgiveness, we face a heightened risk of holding these loans at unfavorable interest rates for an extended period of time.
Furthermore, since the launch of the PPP, several larger banks have been subject to litigation regarding the process and procedures that such banks used in processing applications for the PPP, and the Company and the Bank may be exposed to the risk of litigation, from both customers and non-customers that approached us regarding PPP loans, relating to these or other matters.
Also many financial institutions throughout the country have been named in putative class actions regarding the alleged nonpayment of fees that may be due to certain agents who facilitated PPP loan applications. The costs and effects of litigation related to PPP participation could have an adverse effect on our business, financial condition and results of operations.operations, and financial condition.
5. Operational Risk
Our risk managementtechnology-related operational processes and procedures may not be effective in mitigating our risks.accomplishing their intended purposes.
Management of our risks in some cases dependsOur operations depend upon the use of computer programs, algorithms, and other analytical and/or forecasting models.tools. If the models that we use to manage these risks aresuch technology is ineffective at predicting future lossesits intended purposes or are otherwise inadequate, we may incur unexpected losses or otherwise be adversely affected. Even if the underlying assumptions and historical correlations used in our models are adequate, our models may be deficient due toincludes errors in computer code, unintended bias, bad data, misuse of data, or fraud, or the use of a model for a purpose outside the scope of the model’s design.it may adversely affect our operations. Additionally, as societal norms, legal requirements, businesses and markets evolve, our measurementstechnology may not accurately reflect this evolution. There may also be riskstechnology-related issues that exist, or that develop in the future, that we have not appropriately anticipated, identified or mitigated, including when processes are changed or new products and services are introduced. In particular, the implementations of new technologies and digital solutions may cause business disruptions that affect our ability to maintain relationships with clients, customers, depositor and employees. If our risk management framework does not effectively identify and control oursuch risks, we could suffer unexpected losses or be adversely affected, and that could have an adverse effect on our business, results of operations and financial condition.
Our results of operations and financial condition could be adversely affected if our Cash Connect® segment��ssegment’s policies, procedures and controls are inadequate to prevent a misappropriation of funds, or if a misappropriation of funds is not insured or not fully covered through insurance.
The profitability of our Cash Connect® segment depends to a large degree on its ability to accurately and efficiently distribute, track, and settle large amounts of cash to its customers’ ATMs which, in turn, depends on the successful implementation and monitoring of a comprehensive system of financial and operational controls that are designed to help prevent, detect, and recover any potential loss of funds. These controls require the implementation and maintenance of complex proprietary software, the ability to track and monitor an extensive network of armored car companies, and the ability to settle large amounts of electronic funds transfers (EFT) from various ATM networks. There is a risk that those associated with armored car companies, ATM networks and processors, ATM operators, or other parties may misappropriate funds belonging to Cash Connect®. Cash Connect® has experienced such occurrences in the past. If our Cash Connect® division’s established policies, procedures and controls are inadequate, or not properly executed to prevent or detect a misappropriation of funds, or if a misappropriation of funds is not insured or not fully covered through any insurance maintained by us, our business, results of operations or financial condition could be adversely affected.
System failure or cybersecurity breaches of our network security could subject us to increased operating costs as well as litigation and other potential losses.
Failures in, or breaches of, our computer systems and network infrastructure, or those of our third party vendors or other service providers, including as a result of cyber-attacks, could disrupt our business, result in the disclosure or misuse of confidential or proprietary information, damage our reputation, increase our costs and cause losses. Our operations are dependent upon our ability to protect our computer equipment against damage from fire, power loss, telecommunications failure or a similar catastrophic event. Any damage or failure that causes an interruption in our operations could have an adverse effect on our business, financial condition and results of operations. In addition, our operations are dependent upon our ability to protect the computer systems, software and network infrastructurenetworks utilized by us, including our Internet banking activities, against damage from physical break-ins, cyber-attacks, cybersecurity breaches and other disruptive problems caused by the Internetproblems. Failures in, or breaches of, our computer systems, software and networks, or those of our third-party vendors or other users. Cybersecurityservice providers, including as a result of cyber-attacks, cybersecurity breaches and other disruptions, would jeopardizecould disrupt our business or operations or those of our Customers and counterparties, result in the disclosure or misuse of confidential or proprietary information, result in supervisory liability or regulatory enforcement action, damage our reputation, result in a loss of Customers and business, result in a loss of confidence in the security of information stored inour systems, products and transmitted throughservices, increase our computer systemscosts and network infrastructure, which may result in significant liabilitycause losses to us and damage to our reputation, and may discourage current and potential customers from using our Internet banking services.us. Our security measures, including firewalls and penetration testing, as well as Board oversight and management's assessment, identification and management of cybersecurity risks, may not prevent or detect future potential losses or liabilities from system failures or breaches or cyber-attacks, cybersecurity breaches.breaches, or other disruptions. We seek to continuously monitor for and nimbly react to any and all such malicious cyber activity, and we develop our systems to protect our technology infrastructure and data from misuse, misappropriation or corruption. Senior management gives a quarterly update on cybersecurity to the Risk Committee of our Board of Directors and an annual update to our full Board of Directors.
In the normal course of business, we collect, process, and retain sensitive and confidential information regarding our Customers. Although we devote significant resources and Board oversight and management focus to ensuring the integrity of our systems through information security and business continuity programs, our facilitiescomputer systems, software and systems,networks, and those of our third-party service providers, are vulnerable to external or internal security breaches, acts of vandalism, computer viruses or malware, misplaced or lost data, denial-of-service attacks, programming or human errors, or other similar events. In particular, the technologies and digital solutions we have introduced as partWe also experience large volumes of our Delivery Transformation initiative, including our enhanced website and personalized messaging app, are susceptible to these events. We and our third-party service providers have experienced all of these events and expect to continue to experience them in the future. These events could interrupt our business or operations, result in significant legal and financial exposure, supervisory liability, regulatory enforcement action, damage to our reputation, loss of customers and business or a loss of confidence in the security of our systems, products and services. Although the impact to date from these events has not had an adverse effect on us, we cannot be sure this will be the case in the future. Any of these occurrences could have an adverse effect on our financial condition and results of operations.
Information security risks for financial institutions like us have increased recently in part because of new technologies, the use of the internet and telecommunications technologies (including mobile devices) to conduct financialphishing and other business transactions andforms of social engineering attempted for the increased sophistication and activitiespurpose of organized crime, perpetrators ofperpetrating fraud hackers, terrorists and others.against us, our Associates, or our Customers. In addition to cyber-attacks or other security breaches involving the theft of sensitive and confidential information, hackers recently have engaged in attacks against large financial institutions that are designed to disrupt key business services, such as consumer-facing web sites. We and our third-party vendors or other service providers have experienced all of these events and expect to continue to experience them in the future. Any of these occurrences could have an adverse effect on our business, financial condition and results of operations. Although the impact to date from these events has not had an adverse effect on us, we cannot be sure this will be the case in the future. We are not able to anticipate or implement effective preventive measures against all security breaches of these types, especially because the techniques usedattacks are increasingly sophisticated, change frequently, often not recognized until launched, and because attacks can originate from a wide variety of sources. Our early detection and response mechanisms could fail to detect, mitigate or remediate these risks in a timely manner. Despite our implementation of protective measures and endeavoring to modify them as circumstances warrant, our computer systems, software and networks may be thwarted by sophisticatedvulnerable to human error, equipment failure, natural disasters, power loss, unauthorized access, supply chain attacks, distributed denial of service attacks, computer viruses and malwareother malicious code, and other events that could result in significant liability and damage to our reputation, and have an ongoing impact on the security and stability of our operations. In addition, although we maintain insurance coverage that may, subject to terms and conditions, cover certain aspects of cyber and information security risks, such insurance coverage may be insufficient to cover all losses, such as litigation costs or financial losses that exceed our policy limits or are not covered under any of our current insurance policies.
Information security risks for financial institutions like us have increased recently in part because of new technologies, the use of the internet, cloud, and telecommunications technologies (including mobile devices) to conduct financial and other business transactions and the increased sophistication and activities of organized crime, perpetrators of fraud, hackers, terrorists and others. Additionally, like many large enterprises, we have introduced more remote work arrangements for our Associates. The increase in remote work arrangements over the past few years has introduced potential new vulnerabilities to cyber threats. We also face increased cybersecurity risk as we deploy additional technologies and digital solutions, including our website and personalized messaging app. We may also face increased cybersecurity risk for a period of time after acquisitions as we transition the acquired entity’s historical systems and networks to our standards. Moreover, any cyber-attack or other security breach may persist for an extended period of time without detection. We endeavor to design and implement policies and procedures to identify such cyber-attacks or breaches as quickly as possible; however, we expect that any investigation of a cyber-attack or breach would take substantial amounts of time, and that there may be extensive delays before we obtain full and reliable information. During such time we would not necessarily know the extent of the harm or how best to remediate it, and certain errors or actions could be repeated or compounded before they are discovered and remediated, all of which would further increase the costs and consequences of such an attack or breach.
The SEC recently enacted rules, effective as of December 18, 2023, requiring public companies to disclose material cybersecurity incidents that they experience on Form 8-K within four business days of determining that a material cybersecurity incident has occurred and to disclose on annual basis material information regarding their cybersecurity risk management, strategy, and governance. If we fail to comply with these new requirements we could incur regulatory fines in addition to other adverse consequences to our reputation, business, financial condition and results of operations.
We may also be subject to liability under various data protection laws. In the normal course of business, we collect, process, and retain sensitive and confidential information regarding our Customers and Associates, including personal data. As a result, we are subject to numerous laws and regulations designed to avoid detection.protect this information, such as U.S. federal, state and international laws governing the protection of personally identifiable information. These laws and regulations are increasing in complexity and number. If any person, including any of our associates, negligently disregards or intentionally breaches our established controls with respect to client or employee data, or otherwise mismanages or misappropriates such data, we could be subject to significant monetary damages, regulatory enforcement actions, fines and/or criminal prosecution. In addition, unauthorized disclosure of sensitive or confidential client or employee data, whether through system failure, employee negligence, fraud or misappropriation, could damage our reputation and cause us to lose clients and related revenue. Potential liability in the event of a security breach of client data could be significant. Depending on the circumstances giving rise to the breach, this liability may not be subject to a contractual limit or an exclusion of consequential or indirect damages.
We rely on third parties for certain important functions. Any failures by those vendors and service providers could disrupt our business operations or expose us to loss of confidential information or intellectual property.
Our use of third-party service providers exposes us to the risk of failures in their operations and their risk and control environments. We outsource certain key functions to external parties, including some that are critical to financial reporting (including our use of hedge accounting), valuations, our mortgage-related investment activity, loan underwriting, and loan servicing. We may enter into other key outsourcing relationships in the future and continue to expand our existing reliance on third-party service providers. If one or more of these key external parties were not able to perform their functions for a period of time, perform them at an acceptable service level or handle increased volumes, or if one of them experiences a disruption in its own business or technology from any cause, our business operations could be constrained, disrupted, or otherwise negatively affected. Our use of third-party service providers also exposes us to the risk of losing intellectual property or confidential information and to other harm, including to our reputation. Our ability to monitor the activities or performance of third-party service providers may be constrained, which may make it difficult for us to assess and manage the risks associated with these relationships.
Our business may be adversely impacted by litigation and regulatory enforcement, which could expose us to significant liabilities and/or damage our reputation.
From time to time, we have and may become party to various litigation claims and legal proceedings. Our businesses involve the risk that clients or others may sue us, claiming that we have failed to perform under a contract or otherwise failed to carry out a duty perceived to be owed to them. Our trust, custody and investment management businesses are particularly subject to this risk. This risk may be heightened during periods when credit, equity or other financial markets are deteriorating in value or are particularly volatile, or when clients or investors are experiencing losses. In addition, as a publicly-heldpublicly-traded company, we are subject to the risk of claims under the federal securities laws, and volatility in our stock price and those of other financial institutions increases this risk. Actions brought against us may result in injunctions, settlements, damages, fines or penalties, which could have an adverse effect on our business, financial condition or results of operations or require changes to our business. Even if we defend ourselves successfully, the cost of litigation may be substantial, and public reports regarding claims made against us may cause damage to our reputation among existing and prospective clients or negatively impact the confidence of counterparties, rating agencies and stockholders, consequently negatively affecting our earnings.
In the ordinary course of our business, we also are subject to various regulatory, governmental and enforcement inquiries, investigations and subpoenas. These may be directed generally to participants in the businesses in which we are involved or may be specifically directed at us. In enforcement matters, claims for disgorgement, the imposition of civil and criminal penalties and the imposition of other remedial sanctions are possible.
WSFS Bank provides indenture trustee and loan agency services, including administrative and collateral agent fee-based services for first lien, second lien, debtor-in-possession and exit facilities, and WSFS Bank professionals work with ad hoc committees, unsecured creditors’ committees, borrowers and other professionals involved in restructuring and bankruptcy. In this capacity, in the normal course of business, WSFS Bank may be named as a party in litigation. Although WSFS Bank has no credit or direct exposure in conjunction with this administrative role, the fact that the Bank’s name appears in the case caption may create the erroneous impression that WSFS Bank may have financial exposure in such a lawsuit.
Actual outcomes, losses and related expenses of pending legal proceedings may differ materially from assessments and estimates, and may exceed the amount of any reserves we have established, which could adversely affect our reputation, business, financial condition and results of operations.
Errors, breakdowns in controls or other mistakes in the provision of services to clients or in carrying out transactions for our own account can subject us to liability, result in losses or negatively affect our earnings in other ways.
In our asset servicing, investment management, fiduciary administration and other business activities, we effect or process transactions for clients and for us that involve very large amounts of money. Failure to properly manage or mitigate operational risks can have adverse consequences, and increased volatility in the financial markets may increase the magnitude of resulting losses. Given the high volume of transactions we process, errors that affect earnings may be repeated or compounded before they are discovered and corrected.
6. Strategic Risk
Integrating Bryn Mawr Trust's business into the Company's may be more difficult, costly or time consuming than expected and the anticipated benefits and cost savings of our acquisition of Bryn Mawr Trust may not be fully realized.
If we are unable to successfully integrate the business of Bryn Mawr Trust, the anticipated benefits of our acquisition of Bryn Mawr Trust, including expected revenue synergies, may not be realized fully, or at all, or may take longer to realize than expected. The company expects to integrate Bryn Mawr Trust’s business and it is possible that the integration process could result in the loss of key employees or create inconsistencies in standards, contracts, procedures and policies. The Company expects to incur substantial expenses in integrating the business, operations, networks, systems, technology, policies and procedures of Bryn Mawr Trust into its own. As with any merger of financial institutions, integration efforts have diverted management attention and resources, and there may be business disruptions that affect our ability to maintain relationships with clients, customers, depositors and employees or to achieve the anticipated benefits and cost savings of our acquisition of Bryn Mawr Trust. In addition, the impacts of the COVID-19 pandemic may make it more costly or difficult to integrate the businesses. These integration matters could have an adverse effect on WSFS, our financial results and the value of our common stock for an undetermined period.
The Company expects to incur substantial expenses related to our acquisition of Bryn Mawr Trust.
The Company expects to continue to incur substantial expenses in connection with consummation of our acquisition of Bryn Mawr Trust and combining the business, operations, networks, systems, technologies, policies and procedures of the two companies. Although we have assumed that a certain level of transaction and combination expenses would be incurred, there are a number of factors beyond their control that could affect the total amount or the timing of the combination expenses. Due to these factors, the transaction and combination expenses associated with our acquisition of Bryn Mawr Trust could, particularly in the near term, exceed the savings that we expect to achieve from the elimination of duplicative expenses and the realization of economies of scale and cost savings related to the combination of the businesses following the consummation of our acquisition of Bryn Mawr Trust. As a result of these expenses, we have taken and expect to continue to take charges against our earnings. The charges taken in connection with our acquisition of Bryn Mawr Trust have been and are expected to be significant, although the aggregate amount and timing of such charges are uncertain at present.
Our business strategy includes significant investment in growth plans, and our financial condition and results of operations could be negatively affected if we fail to grow or fail to manage our growth and investment in infrastructure effectively.
We are pursuing a significant growth strategy for our business. Our growth initiatives have required us to recruit experienced personnel to assist in such initiatives. The failure to retain such personnel would place significant limitations on our ability to successfully execute our growth strategy. In addition, as we expand our lending beyond our current market areas, we could incur additional risk related to those new market areas. We may not be able to expand our market presence in our existing market areas or successfully enter new markets.
A weak economy, low demand and competition for credit may impact our ability to successfully execute our growth plan and adversely affect our business, financial condition, results of operations, reputation and growth prospects. While we believe we have the executive management resources and internal systems in place to successfully manage our future growth, there can be no assurance growth opportunities will be available or that we will successfully manage our growth.
We regularly evaluate potential acquisitions and expansion opportunities. If appropriate opportunities present themselves, we expect to engage in selected acquisitions or other business growth initiatives or undertakings. We may not successfully identify appropriate opportunities, may not be able to negotiate or finance such activities and such activities, if undertaken, may not be successful.
We have in the past and may in the future pursue acquisitions, which may disrupt our business and adversely affect our operating results of operations, and we may fail to realize all of the anticipated benefits of any such acquisition.
We have historically pursued acquisitions, and may seek acquisitions in the future. We may not be able to successfully identify suitable candidates, negotiate appropriate acquisition terms, complete proposed acquisitions, successfully integrate acquired businesses into the existing operations, or expand into new markets. Once integrated, acquired operations may not achieve levels of revenues, profitability, or productivity comparable with those achieved by our existing operations, or otherwise perform as expected.
Acquisitions, such as our recent acquisition of Bryn Mawr Trust in January 2022, involve numerous risks, including difficulties in the integration of the operations, technologies, services and products of the acquired companies, and the diversion of management’s attention from other business concerns. We may not properly ascertain all such risks prior to an acquisition or prior to such a risk impacting us while integrating an acquired company. As a result, difficulties encountered with acquisitions could have an adverse effect on our business, financial condition and results of operations.
Furthermore, we must generally receive federal regulatory approval before we can acquire another insured depository institution or its holding company. In determining whether to approve a proposed acquisition, federal regulators will consider, among other factors, the effect of the acquisition on competition, the financial condition of the acquiring institution and the target, the future prospects of the acquiring institution, including current and projected capital levels, the competence, experience, and integrity of management, compliance with laws and regulations, the convenience and needs of the communities to be served, including the acquiring institution’s record of compliance under the Community Reinvestment Act, and the effectiveness of the acquiring institution in combating money laundering. In addition, we cannot be certain when or if, or on what terms and conditions, any required regulatory approvals will be granted. Consequently, we may not obtain regulatory approval for a proposed acquisition on acceptable terms or at all, in which case we would not be able to complete the acquisition despite the time and expenses invested in pursuing it.
The anticipated benefits of our Delivery Transformation initiative may not be fully realized.
We have devoted substantial resources to our strategic Delivery Transformation initiative. The success of this initiative will depend on, among other things, our ability to upgrade our technology and digital solutions in a manner that improves experiences of customers and employees. If we are unable to successfully achieve this objective, the anticipated benefits of the Delivery Transformation initiative may not be realized fully, or at all, or may take longer to realize than expected.
Additionally, the implementation of new technologies and digital solutions may cause business disruptions that affect our ability to maintain relationships with clients, customers, depositors and employees and could have an adverse effect on WSFS for an undetermined period.
Key employeesassociates may be difficult to attract and retain.
Our Associates are our most important resource and, in many areas of the financial services industry, competition for qualified personnel is intense. We invest significantly in recruitment, training, development and talent management as our Associates are the cornerstone of our model. If we were unable to continue to attract and retain qualified key employeesassociates to support the various functions of our businesses, our performance, including our competitive position, could be adversely affected. As economic conditions improve, we may face increased difficulty in retaining top performers and critical skilled employees.associates. If key personnel were to leave us and equally knowledgeable or skilled personnel are unavailable within WSFS or could not be sourced in the market, our ability to manage our business may be hindered or impaired.
7. Reputation Risk
Damage to our reputation could significantly harm our businesses.
Our ability to attract and retain customers, clients, investors, and highly-skilled management and employeesAssociates is affected by our reputation. Public perceptionreputation and the reputation of the financial services industry declined as a result of the recent economic downturn and related government response, and we face increased public and regulatory scrutiny as a result. Further adversewhole. Adverse developments may result in additional scrutiny or new litigation against us. Otherus and potential sources of reputational damage are discussed throughout these risk factors. Although we monitor developments for areas of potential risk to our reputation and brand, negative perceptions or publicity could adversely impact our business, financial condition and results of operations.
Significant harm to our reputation can also arise from other sources, including economic changes, regulatory scrutiny, employee misconduct, actual or perceived unethical behavior, litigation or regulatory outcomes, failing to deliver minimum or required standards of service and quality, compliance failures, disclosure of confidential information, significant or numerous failures, interruptions or breaches of our information systems, and the activities of our clients, customers and counterparties, including vendors.
In particular, the success of our Wealth Management segment is highly dependent on reputation. Our Wealth Management segment derives the majority of its revenue from noninterest income which consists of trust, investment and other servicing fees, and our ability to attract trust and wealth management clients is highly dependent upon external perceptions of this segment’s level of service, trustworthiness, business practices and financial condition. Negative perceptions or publicity regarding these matters could damage the division’s and our reputation among existing customers and corporate clients, which could make it difficult for the Wealth Management segment to attract new clients and maintain existing ones.
We could also suffer significant harm to our reputation if we fail to properly identify and manage potential conflicts of interest. Management of potential conflicts of interests has become increasingly complex as we expand our business activities through more numerous transactions, obligations and interests with and among our clients. The actual or perceived failure to adequately address conflicts of interest could affect the willingness of clients to deal with us, which could adversely affect our businesses.businesses, financial condition and results of operations
8. Model Risk
The quantitative models we use to manage certain accounting and risk management functions may not be effective, which may cause adverse effects on our results of operations and financial condition.
We use quantitative models to help manage certain aspects of our business and to assist with certain business decisions, including estimating probable loan losses, measuring the fair value of financial instruments when reliable market prices are unavailable and estimating the effects of changing interest rates and other market measures on our financial condition and results of operations. Our modeling methodologies rely on many assumptions, historical analyses and correlations. These assumptions may be incorrect, particularly in times of market distress, and the historical correlations on which we rely may no longer be relevant. Additionally, as businesses and markets evolve, our measurements may not accurately reflect this evolution. Even if the underlying assumptions and historical correlations used in our models are adequate, our models may be deficient due to errors in computer code, bad data, misuse of data, fraud or the use of a model for a purpose outside the scope of the model’s design.
As a result, our models may not capture or fully express the risks we face, may suggest that we have sufficient capitalization when we do not, or may lead us to misjudge the business and economic environment in which we will operate. If our models fail to produce reliable results on an ongoing basis, we may not make appropriate risk management or other business or financial decisions. Furthermore, strategies that we employ to manage and govern the risks associated with our use of models may not be effective or fully reliable, and as a result, we may realize losses or other lapses.
Banking regulators continue to focus on the models used by banks and bank holding companies in their businesses. The failure or inadequacy of a model may result in increased regulatory scrutiny on us or may result in an enforcement action or proceeding against us by one of our regulators.
9. General Risk
Impairment of goodwill and/or intangible assets could require charges to earnings, which could negatively impact our results of operations.
Goodwill and other intangible assets arise when a business is purchased for an amount greater than the net fair value of its identifiable assets. We have recognized goodwill as an asset on the balance sheet in connection with several recent acquisitions. We evaluate goodwill and intangibles for impairment at least annually. Although we have determined that goodwill and other intangible assets were not impaired during 2021,2023, a significant and sustained decline in our stock price and market capitalization, a significant decline in our expected future cash flows, a significant adverse change in the business climate, slower growth rates or other factors could result in impairment of goodwill mortgage servicing rights asset, or other intangible assets. Any future write-down of the goodwill mortgage servicing rights asset, or other intangible assets could result in a material charge to earnings.
Changes in accounting standards or changes in how the accounting standards are interpreted or applied could adversely impact the Company’s financial statements.
From time to time, the Financial Accounting Standards Board (FASB) or the SEC may change the financial accounting and reporting standards that govern the preparation of the Company’s financial statements. In addition, the FASB, SEC, banking regulators and the Company’s independent registered public accounting firm may also amend or even reverse their previous interpretations or positions on how various standards should be applied. These changes may be difficult to predict and could impact how we prepare and report the Company’s financial statements. In some cases, the Company could be required to apply a new or revised standard retroactively, potentially resulting in the Company restating prior period’s financial statements.
Changes in the value of our deferred tax assets could adversely affect our operating results of operations and regulatory capital ratios.
Our deferred tax assets are subject to an evaluation of whether it is more likely than not that they will be realized for financial statement purposes. In making this determination, we consider all positive and negative evidence available, including the impact of recent operating results, as well as potential carryback of tax to prior years’ taxable income, changes in statutory tax rates, reversals of existing taxable temporary differences, tax planning strategies and projected earnings within the statutory tax loss carryover period. If we conclude in the future that a significant portion of our deferred tax assets are not more likely than not to be realized, we will record a valuation allowance, which could adversely affect our financial position, results of operations and regulatory capital ratios.
ITEM 1B. UNRESOLVED STAFF COMMENTS
None.
ITEM 1C. CYBERSECURITY
Risk Management and Strategy
The Company maintains an Information Security Program to safeguard all WSFS information assets against unauthorized use, disclosure, modification, damage, or loss. Information Security, in conjunction with Operations, Technology, and Executive Leadership, work together to provide and maintain security processes and procedures pursuant to which the Company will:
•Ensure the security and confidentiality of customer and bank records covered by law.
•Protect against any anticipated threats or hazards to the security of such records.
•Protect against the unauthorized access or use of such records or information in ways that could result in substantial harm to the Company, our Customers, and Associates.
•Establish guidelines and practices for ensuring Information Technology compliance to external and regulatory requirements.
•Ensure proper and effective Business Continuity and Disaster Recovery programs are implemented and tested.
The Company's Chief Information Security Officer (CISO) is designated as the program coordinator responsible for coordinating and overseeing the program.
Our Information Security Department performs annual risk assessments to evaluate the effectiveness of the controls as set forth in the Information Security Program to support the requirements under Gramm-Leach Bliley Act (GLBA), and Federal Financial Institutions Examination Council (FFIEC) Guidance on Securing Customer Information. The focus areas include:
•technology systems used for information that is collected, processed and stored;
•assessing internal and external cybersecurity threats and vulnerabilities;
•performing regular penetration and controls testing;
•evaluation and assessment of impact should the information or systems become compromised;
•evaluation for the effectiveness of the governance structure for Information security risk management.
Internal and external Penetration Testing is performed annually. Tests are conducted or reviewed by independent third parties or qualified Associates independent of those that develop or maintain the security program. Testing is performed annually by third party auditors contracted through the Company's Risk Management Department. Management reviews test results promptly and ensures that appropriate steps are taken to address adverse test results.Remediation efforts are organized and made available to the Risk committee of the Board of Directors (Risk Committee)as well as for review by third party auditors and examiners.
The Company has implemented a Cybersecurity Incident Response Plan (CSIRP), which is integrated into its Master Business Continuity Plan, to identify, assess and respond to cybersecurity threats. The CSIRP provides a well-defined, consistent, and organized approach to information security related incidents and is supplemented by playbooks designed to respond to specific attacks. The CSIRP requires approval by the Executive Leadership Team under the Cybersecurity Committee and is governed by the Continuity of Operations Policy that is approved annually by the Board of Directors.
The Company is not aware of any cybersecurity threats, including as a result of any previous cybersecurity incidents, that have materially affected or are reasonably likely to materially affect the Company's business strategy, results of operations or financial condition.
Governance
Our Information Security Policy and Information Security Program are the standards used to protect the Bank’s confidential information. The Information Security Policy is annually reviewed, updated, and approved by the Risk Committee and the Board of Directors.
The CISO reports security related incidents, findings, changes, etc. to the Risk Committee, on an annual basis or quarterly as needed. This information is communicated through the Company's Risk Department. The CISO has more than 25 years of experience in the information security field, including 20 years at WSFS, and holds several professional certifications and memberships in the Information Security, IT, and financial services fields.
The Board and Senior Management are charged with the ultimate responsibility for understanding the company’s risk environment. A Management Risk Committee, chaired by our Chief Risk Officer (CRO), is responsible to oversee the Company’s risk management program on an enterprise-wide basis.
The Company has dedicated incident management and response teams in place to facilitate response protocols and execute designed strategies necessary to mitigate business risk and support recovery initiatives. The Incident Management Team structure is based on the Incident Command System and follows a flexible, adaptable approach with response team membership designed to support expanding response team needs. An Incident Response Task Force (IRTF) is in place to oversees the assessment of cybersecurity incidents and operational response needs. The CISO and the Head of Regulatory Affairs/Relations co-lead IRTF response.
The CSIRP includes a framework to timely report cybersecurity incidents to our Executive Leadership Team. The severity of an incident is based on perceived impacts that include the severity of damage, compromise, or loss, and probability of further exploitation or escalation. The Chief Information Officer (CIO) and CRO are notified of all incidents that are determined to be significant. based on perceived impacts of the incident or event. The Chief Executive Officer and Board of Directors are notified of these incidents by the CIO and CRO as necessary.
For further information on risks to the Company from cybersecurity threats, see "System failure or cybersecurity breaches of our network security could subject us to increased operating costs as well as litigation and other potential losses" under Item 1A. Risk Factors."
ITEM 2. PROPERTIES
Our headquarters are located at 500 Delaware Ave., Wilmington, Delaware where we lease 78,432 square feet of space. At December 31, 2021,2023, we conducted our business through 8988 banking offices located in Delaware, southeastern Pennsylvania and southern New Jersey. We owned 33 of our banking offices while all other facilities were leased.
In addition to our branch network, we own or lease office space for 2326 other loan production offices and facilities located in Delaware, southeastern Pennsylvania, southern New Jersey, VirginiaFlorida, Nevada and NevadaVirginia to house operational activities, Cash Connect® and our Wealth Management businesses. We owned 37 of our banking offices and other facilities while all other locations were leased.
At December 31, 2021,2023, our premises and equipment had a net book value of $87.3$104.5 million. All of these properties are generally in good condition and are appropriate for their intended use. While these facilities are adequate to meet our current needs, available space is limited and additional facilities may be required to support future expansion.
For additional detail regarding our properties and equipment, see Note 8 to the Consolidated Financial Statements.
ITEM 3. LEGAL PROCEEDINGS
For information regarding legal proceedings, see Note 24 to the Consolidated Financial Statements.
Item 103 of Regulation S-K requires disclosure of certain environmental matters when a governmental authority is a party to the proceedings and the proceedings involve potential monetary sanctions unless we reasonably believe the monetary sanctions will not equal or exceed a threshold which we determine is reasonably designed to result in disclosure of any such proceeding that is material to our business or financial condition. We have determined such disclosure threshold to be $1 million.
ITEM 4. MINE SAFETY DISCLOSURES
Not applicable.
PART II
ITEM 5. MARKET FOR REGISTRANT’S COMMON EQUITY, RELATED STOCKHOLDER MATTERS AND ISSUER PURCHASES OF EQUITY SECURITIES
Market for Registrant’s Common Equity and Related Stockholder Matters
Our common stock is traded on the Nasdaq Global Select Market under the symbol “WSFS.” At February 24, 2022,26, 2024, we had 3,6903,404 registered common stockholders of record.
The closing market price of our common stock at February 24, 202226, 2024 was $49.76.$41.81.
Dividends
For a discussion of dividend restrictions on our common stock, or of restrictions on dividends from the Company's subsidiaries to the Company, see “Business - Regulation - Regulation of the Company - Dividends” and “Business - Regulation - Regulation of WSFS Bank - Dividends Restrictions.”
Securities Authorized for Issuance Under Equity Compensation Plans
Shown below is information as of December 31, 20212023 with respect to compensation plans under which equity securities of the Registrant are authorized for issuance.
| | Equity Compensation Plan Information | Equity Compensation Plan Information | Equity Compensation Plan Information |
| | | (a) | | (b) | | (c) | | (a) | | (b) | | (c) |
| | | Number of Securities to be issued upon exercise of outstanding options, warrants and rights | | Weighted-Average exercise price of outstanding options, warrants and rights | | Number of securities remaining available for future issuance under equity compensation plans (excluding securities reflected in column (a)) | | Number of Securities to be issued upon exercise of outstanding options, warrants and rights | | Weighted-Average exercise price of outstanding options, warrants and rights | | Number of securities remaining available for future issuance under equity compensation plans (excluding securities reflected in column (a)) |
Equity compensation plans approved by stockholders (1) | Equity compensation plans approved by stockholders (1) | 465,424 | | | $ | 41.39 | | | 1,584,835 | |
| Equity compensation plans not approved by stockholders | Equity compensation plans not approved by stockholders | N/A | | N/A | | N/A | Equity compensation plans not approved by stockholders | N/A | | N/A |
| Total | Total | 465,424 | | | $ | 41.39 | | | 1,584,835 | |
(1)Plans approved by stockholders include the 2013 Incentive Plan and the 2018 Incentive Plan.
Share Repurchases:
During the first quarter of 2020, the Board of Directors approved a share repurchase program authorizing the repurchase of 7,594,977 shares, or 15% of our outstanding shares as of March 31, 2020. This repurchase program was completed during the first quarter of 2023. During the second quarter of 2022, the Board of Directors approved an additional share repurchase authorization under the program of 6,358,727 shares of common stock, or 10% of its outstanding shares as of June 30, 2022. Under the program,programs, repurchases may be made from time to time in the open market or through negotiated transactions, subject to market conditions and other factors, and in accordance with applicable securities laws. The program isprograms are consistent with our intent to return a minimum of 25%35% of annual net income to stockholders through dividends and share repurchases while maintaining capital ratios in excess of regulatory minimums and, in the case of the Bank, the “well-capitalized” benchmarks.
During the three months ended December 31, 2021,2023, the Company had no241,000 shares of common stock repurchased under the current share repurchase program. All share repurchases were temporarily suspended upon the announcement of the signing of the Merger Agreement with BMBC on March 10, 2021. We resumed repurchases during the first quarter of 2022 following the close of our combination with Bryn Mawr Trust on January 1, 2022.programs.
| | | | | | | | | | | | | | | | | | | | | | | |
| | | | | | | |
| Month | Total Number of Shares Purchased | | Average Price Paid Per Share | | Total Number of Shares Purchased as Part of Publicly Announced Programs | | Maximum Number of Shares that May Yet Be Purchased Under the Programs |
| October 1, 2023 - October 31, 2023 | — | | | $ | — | | | — | | | 5,582,593 | |
| November 1, 2023 - November 28, 2023 | 169,000 | | | 38.49 | | | 169,000 | | | 5,413,593 | |
| December 1, 2023 - December 31, 2023 | 72,000 | | | 41.50 | | | 72,000 | | | 5,341,593 | |
| Total | 241,000 | | | 39.39 | | | 241,000 | | | |
COMPARATIVE STOCK PERFORMANCE GRAPH
The graph and table which follow show the yearly percentage change in the cumulative total shareholder return on our common stock over the last five years compared with the cumulative total shareholder return of the Dow Jones Total Market Index, the Nasdaq Bank Index and KBW Nasdaq Regional Bank Index over the same period as obtained from Bloomberg L.P. Cumulative total shareholder return on our common stock or the indices equals the total increase in value since December 31, 2016,2018, assuming reinvestment of all dividends paid into the common stock or the index, respectively. The graph and table were prepared assuming $100 was invested on December 31, 20162018 in our common stock and in each of the indices. There can be no assurance that our future stock performance will be the same or similar to the historical stock performance shown in the graph below. We neither make nor endorse any predictions as to stock performance.

| | | | | | | | | | | | | | | | | | | | | | | | | | | | | | | | | | | |
| | December 31, 2018 through December 31, 2023 Cumulative Total Return |
| 2018 | | 2019 | | 2020 | | 2021 | | 2022 | | 2023 |
| WSFS Financial Corporation | $ | 100 | | | $ | 117 | | | $ | 122 | | | $ | 137 | | | $ | 126 | | | $ | 129 | |
| Dow Jones Total Market Index | 100 | | | 125 | | | 138 | | | 166 | | | 155 | | | 180 | |
| Nasdaq Bank Index | 100 | | | 124 | | | 115 | | | 164 | | | 138 | | | 133 | |
| KBW Nasdaq Regional Bank Index | 100 | | | 124 | | | 113 | | | 155 | | | 144 | | | 143 | |
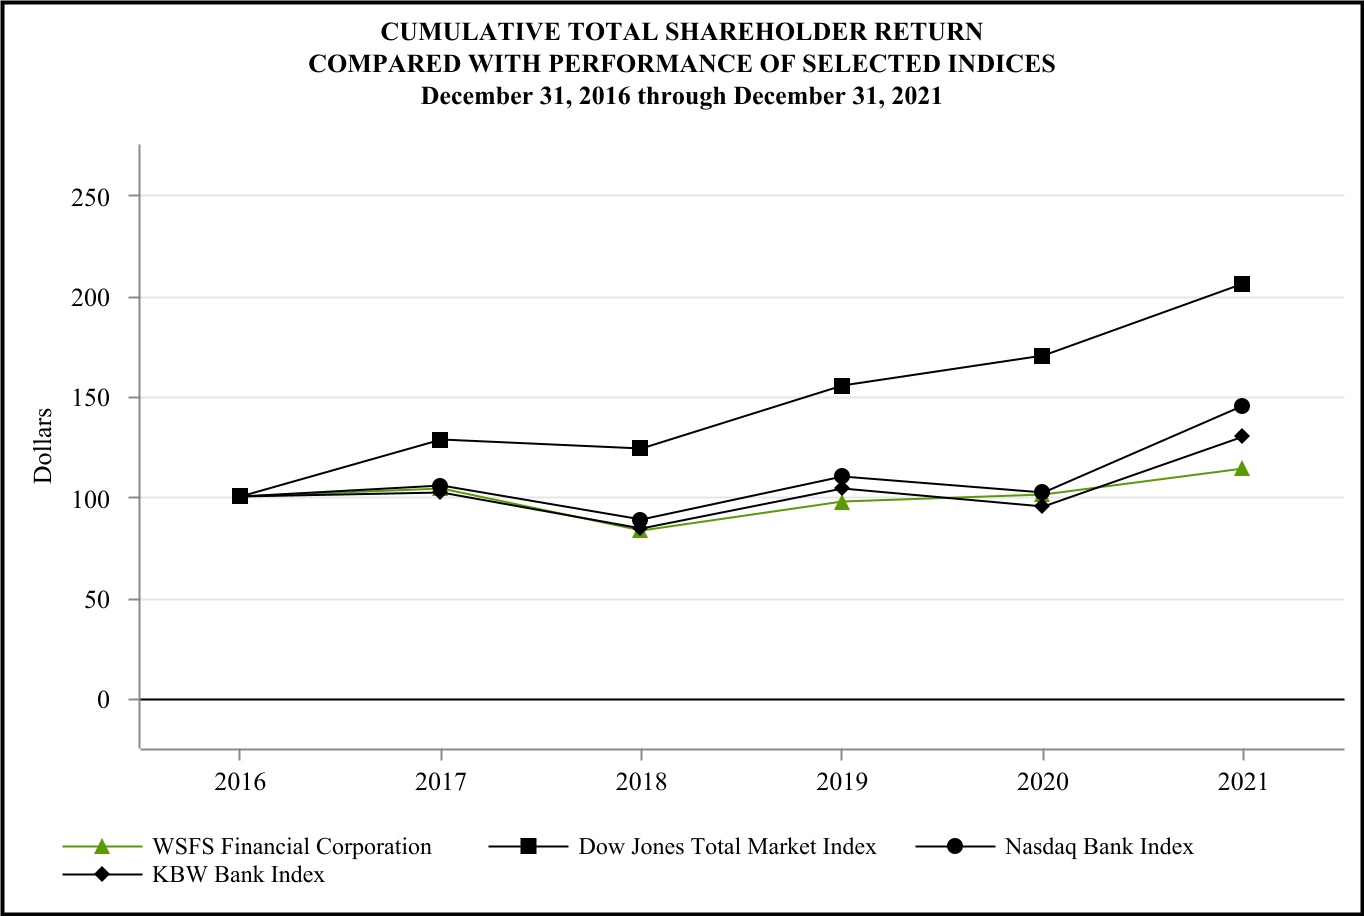
| | | | | | | | | | | | | | | | | | | | | | | | | | | | | | | | | | | |
| | December 31, 2016 through December 31, 2021 Cumulative Total Return |
| 2016 | | 2017 | | 2018 | | 2019 | | 2020 | | 2021 |
| WSFS Financial Corporation | $ | 100 | | | $ | 104 | | | $ | 83 | | | $ | 97 | | | $ | 101 | | | $ | 114 | |
| Dow Jones Total Market Index | 100 | | | 128 | | | 124 | | | 155 | | | 170 | | | 206 | |
| Nasdaq Bank Index | 100 | | | 105 | | | 88 | | | 110 | | | 102 | | | 145 | |
| KBW Bank Index | 100 | | | 102 | | | 84 | | | 104 | | | 95 | | | 130 | |
ITEM 6. [RESERVED]
ITEM 7. MANAGEMENT’S DISCUSSION AND ANALYSIS OF FINANCIAL CONDITION AND RESULTS OF OPERATIONS
OVERVIEW
WSFS Financial Corporation (the Company or WSFS) is a savings and loan holding company headquartered in Wilmington, Delaware. Substantially all of our assets are held by the Company’s subsidiary, Wilmington Savings Fund Society, FSB (WSFS Bank or the Bank), one of the ten oldest bank and trust companies in the United States (U.S.) continuously operating under the same name. With $15.8$20.6 billion in assets and $34.6$84.3 billion in assets under management (AUM) and assets under administration (AUA) at December 31, 2021,2023, WSFS Bank is the oldest and largest locally-managed bank and trust company headquartered in the DelawareGreater Philadelphia and Greater PhiladelphiaDelaware region. As a federal savings bank that was formerly chartered as a state mutual savings bank, WSFS Bank enjoys a broader scope of permissible activities than most other financial institutions. A fixture in the community, WSFS Bank has been in operation for more than 189191 years. In addition to itsour focus on stellar customer experiences, WSFS Bank hasexperience, we have continued to fuel growth and remain a leader in our community. We are a relationship-focused, locally-managed, community banking institution. Our mission is simple: “We Stand for Service.” Our strategy of “Engaged Associates, living our culture, making a better life for allenriching the communities we serve” focuses on exceeding customer expectations, delivering stellar experiences and building customer advocacy through highly-trained, relationship-oriented, friendly, knowledgeable and empowered Associates.
As of December 31, 2021,2023, we had six consolidated subsidiaries: WSFS Bank, The Bryn Mawr Trust Company of Delaware (BMT-DE), Bryn Mawr Capital Management, LLC (BMCM), WSFS Wealth Management, LLC (Powdermill®), WSFS Capital Management,SPE Services, LLC, (West Capital), Cypress Capital Management, LLC (Cypress), Christiana Trust Company of Delaware® (Christiana Trust DE) and WSFS SPE Services,601 Perkasie, LLC. We also had onethree unconsolidated subsidiary,subsidiaries, WSFS Capital Trust III.III, Royal Bancshares Capital Trust I, and Royal Bancshares Capital Trust II. WSFS Bank had two wholly ownedwholly-owned subsidiaries: Beneficial Equipment Finance Corporation (BEFC) and 1832 Holdings, Inc., and one majority-owned subsidiary, NewLane Finance Company (NewLane Finance®).
On January 1, 2023, WSFS completed the merger and brand conversion of WSFS Capital Management, LLC (West Capital) and Cypress Capital Management, LLC and renamed the combined entity Bryn Mawr Capital Management, LLC. BMCM is registered as an investment advisor with the U.S. Securities and Exchange Commission and is a wholly-owned subsidiary of WSFS. In the third quarter of 2023, BMCM expanded its business in Southern Delaware and established a new presence in Boca Raton, Florida with the acquisition of a registered investment advisory firm's business based in Rehoboth Beach, Delaware.
Our banking business had a total loan and lease portfolio of $7.9$12.8 billion as of December 31, 2021,2023, which was funded primarily through commercial relationships and retailconsumer and customer generated deposits. We have built a $6.2$9.9 billion commercial loan and lease portfolio by recruiting seasoned commercial lenders in our markets, offering the high level of service and flexibility typically associated with a community bank and through acquisitions. We also offer a broad variety of consumer loan products and retail securities and insurance brokerage through our retail branches, andin addition to mortgage and title services in collaboration withthrough our branches and WSFS Mortgage®. WSFS Mortgage® is a, our mortgage banking company and abstract and title company specializing in a variety of residential mortgage and refinancing solutions. Our leasing business, is conducted by NewLane Finance®. NewLane Finance®, originates small business leases and provides commercial financing to businesses nationwide, targeting various equipment categories including technology, software, office, medical, veterinary and other areas. In addition, NewLane Finance® offers captive insurance through its subsidiary, Prime Protect.
Our Cash Connect® business is a premier provider of ATM vault cash, smart safe (safes that automatically accept, validate, record and hold cash in a secure environment) and other cash logistics services through strategic partnerships with several of the largest networks, manufacturers and service providers in the U.S. As of December 31, 2021,ATM industry. Cash Connect®services non-bank and WSFS-branded ATMs and smart safes nationwide, and manages approximately $1.7$1.9 billion in total cash and services approximately 27,40033,000 non-bank ATMs and approximately 6,3008,700 smart safes nationwide. Cash Connect® provides related services such as online reporting and ATM cash management, predictive cash ordering and reconcilement services, armored carrier management, loss protection ATM processing equipment sales and deposit safe cash logistics. As of December 31, 2021, Cash Connect®also supports over 600590 owned andor branded ATMs for WSFS Bank Customers, which hasis one of the largest branded ATM networks in our market.
Our Wealth Management business provides a broad array of planning and advisory services, investment management, trust services, and credit and deposit products to individual, corporate and institutional clients through multiple integrated businesses.clients. Combined, these businesses had $34.6$84.3 billion of AUM and AUA at December 31, 2021. WSFS Wealth2023.
Bryn Mawr Trust® Investments provides financialis our predominant Private Wealth Management brand, providing advisory, investment management and trustee services to institutions, affluent and high-net-worth individuals. Private Wealth Management serves high-net-worth clients and institutions by providing trustee and advisory services, along with insurancefinancial planning, customized investment strategies, brokerage products such as annuities and brokerage products. Cypress,traditional banking services such as credit and deposit products tailored to its clientele. Private Wealth Management includes businesses that operate under the bank’s charter, through a broker/dealer and as a registered investment adviser, isadvisor (RIA). It generates revenue through a percentage fee based on account assets, fee-only wealth management firm managing a “balanced” investment style portfolio focused on preservation of capitalarrangements, net interest income and generating current income. West Capital, a registered investment adviser, is aother fee-only wealth management firm operating under a multi-family office philosophy to provide customized solutions to institutionsservices such as estate administration, trust tax planning and high-net-worth individuals. The trust division of WSFS, comprised of WSFS Institutional Services® and Christiana Trust DE, provides trustee, agency, bankruptcy administration, custodial and commercial domicile services to institutional and corporate clients and special purpose vehicles. Christiana Trust DE, a subsidiary of WSFS, provides personal trust and fiduciary services to families and individuals across the U.S.custody. Powdermill® is a multi-family office specializing in providing independent solutions to high-net-worth individuals, families and corporate executives through a coordinated, centralized approach.
BMT-DE provides personal trust and fiduciary services to families and individuals across the U.S. and internationally. WSFS Wealth Client Management serves high-net-worthInstitutional Services® provides trustee, agency, bankruptcy administration, custodial and commercial domicile services to institutional, corporate clients by delivering credit and deposit products and partnering with other Wealth Management businesses to provide comprehensive solutions to clients.special purpose vehicles.
As of December 31, 2021,2023, we service our customers primarily from our 112114 offices located in Pennsylvania (52)(57), Delaware (42)(40), New Jersey (16) Virginia(14), Florida (1), Nevada (1) and NevadaVirginia (1), our ATM network, our website at www.wsfsbank.com, and our mobile apps.app.
Notable Items Impacting Results of Operations, Financial Condition and Business Outlook
Notable items in 20212023 include the following:
•Bryn Mawr Trust Acquisition
◦We recorded $13.0 million of corporate development and restructuring expenses during the year ended December 31, 2021 primarily related to our merger with Bryn Mawr Bank Corporation (BMBC), a Pennsylvania corporation and the parent holding company of The Bryn Mawr Trust Company, a Pennsylvania chartered bank and wholly owned subsidiary of BMBC. Throughout this document, we refer to these acquired entities collectively as “Bryn Mawr Trust.”
◦The merger was completed on January 1, 2022 with the purchase price consideration of $908 million to acquire or assume the following (at carrying value):
▪Total assets of $5.0 billion, including $3.5 billion in loans and leases,
▪Total liabilities of $4.4 billion, including $4.1 billion in deposits, and
▪Total AUM and AUA of $23.6 billion.
◦Our bank technology, branding and branch conversion is scheduled to occur later in the first quarter of 2022, with our Trust and Wealth integration expected to follow in late 2022 or early 2023.
◦Balance Sheet
◦On June 15, 2021, WSFS completed the redemption of $100.0the $30.0 million in aggregate principal amount of our 4.50% fixed-to-floating rate seniorsubordinated notes due 20262025 (the 20262025 Notes). We recorded acquired from Bryn Mawr Trust. The 2025 Notes were redeemed at a $1.1 million lossprice of debt extinguishment to recognize100%, plus accrued and unpaid interest through the remaining unamortized debt issue costs associated with these notes.
◦During the year ended December 31, 2021, our balance sheet was significantly impacted by continued high levelsdate of excess liquidity due to deposit growth stemming from strong Customer relationships across all business lines coupled with elevated loan payoffs. We used a portion of the excess liquidity to purchase $3.5 billion of investment securities, available-for-sale, and to pay down our borrowings.redemption.
•Credit Metrics
◦There was a reductionan increase in the allowance for credit losses (ACL) of $134.3$34.3 million during the year ended December 31, 2021,2023, primarily due to net loan growth across the CRE, Consumer and commercial small business leasing portfolios as a result ofwell as higher provisions on our CRE, commercial small business leasing, and Upstart portfolios and the future recovery in our economic forecasts used in the ACL model and improved credit quality metrics with notable declines in our problem assets and delinquencies.elder care portfolio within C&I. See “Results of Operations - Provision/Allowance for Credit Losses (ACL)” for further information.
•Other Notable ItemsWe realized a $9.5 million gain on our equity investment in Spring EQ, a digital home equity origination platform, which was sold during the fourth quarter.
◦•During 2021, we recorded a $4.4Recorded an income tax charge of $7.1 million net gain on the liquidation offrom our investment in Social Finance, Inc. (SoFi). We used $1.0decision to surrender $65.5 million of previously acquired BOLI policies. This resulted from recent changes in the interest rate environment lowering our yields on these long-term assets and the termination of a stable value protection wrap policy. We expect to deploy the net proceeds from the surrender into higher yielding interest-earning assets or payoff wholesale funding.
•Recorded a $5.1 million expense for the FDIC Special Assessment charged to make a contributionrecover losses to the Deposit Insurance Fund related to the closures of certain banks in 2023.
•We contributed $4.9 million to the WSFS CARES Foundation to further fundenhance community support to our expanded communities.activities, which included a one-time $2.0 million special contribution in the fourth quarter.
◦•During 2023, WSFS repurchased 1,247,178 shares of common stock under the third quarterCompany's share repurchase program at an average price of 2021, we launched$41.52 per share, for an aggregate purchase price of $51.8 million and paid dividends on our strategic partnership with Upstart Holdings, Inc. (Upstart), a leading white label lending-as-a-service platform provider specializing in risk-based priced unsecured consumer loans.common stock of $36.7 million, returning total capital to shareholders of $88.5 million.
◦•The Bank and the Company continue to be well above well-capitalized across all measures of regulatory capital, with total common equity tier 1 capital of 13.72% and 13.17%, respectively, and total risk-based capital of 14.96% and 15.23%, respectively.
•BMCM expanded into southern Delaware and established a new presence in Boca Raton, Florida, after an acquisition of a woman-founded, owned and managed registered investment advisory firm based in Rehoboth Beach, Delaware.
•In October 2021, Michelle L. Burroughs joinedJune, we held our first-ever "We Stand for Service Day", during which approximately 1,200 of our Associates provided nearly 5,000 hours of service to more than 80 nonprofit and community organizations across the Bank as Vice President, Director of Diversity, EquityGreater Philadelphia, Southern New Jersey and Inclusion (DE&I), supporting WSFS in creating and delivering a work environment designed to foster a culture of inclusion and ensure the long-term sustainability of the Company’s DE&I efforts.
◦During 2021, we resolved all outstanding legal matters associated with Nature's Healing Trust and Charter Oak. In the fourth quarter of 2021, we recognized $15.0 million legal settlement recovery associated with Charter Oak.
FINANCIAL CONDITION
Total assets increased $1.5$0.7 billion, or 10%3%, to $15.8$20.6 billion as of December 31, 2021,2023, compared to $14.3$19.9 billion as of December 31, 2020.2022. These increases are primarily comprised of the following (in descending order of magnitude):
•InvestmentNet loans and leases, excluding loans held for sale, increased $823.2 million, primarily driven by growth of $450.1 million in commercial mortgages, $201.2 million in consumer loans driven by our consumer partnerships and $108.8 million in residential.
•Total cash and cash equivalents increased $255.6 million, primarily due to increased deposits.
•Total investment securities available-for-sale:decreased $299.6 million:
◦Investment securities, available for sale increased $2.7 billion, or 106%,available-for-sale decreased $246.5 million, primarily due to $3.5 billion in purchasesrepayments of $354.8 million, partially offset by repayments of $697.5 million, decreased market-valuesincreased market values on available-for-sale securities of $93.8$83.7 million and sales of $14.1 million.$27.7 million in purchases.
•Loans and leases, net of allowance:Loans and leases, net of allowance,Bank-owned life insurance decreased $1.0 billion, or 11%, reflecting a $782.4$59.2 million decline in commercial and industrial loans that included a $719.7 million decreaseprimarily due to forgiveness of PPP loans and higher loan payoffs, a $227.8 million declineour decision to surrender certain previously-acquired BOLI policies in residential loans, largely due to non-relationship run-off portfolios acquired through the Beneficial Bancorp, Inc. (Beneficial) acquisition, and a $204.6 million decline in commercial mortgage loans due to higher loan payoffs. Partially offsetting these decreases were $103.4 million of growth in our commercial small business leases portfolio, and a reduction of $134.3 million in our allowance for credit losses as described above.
•Cash, cash equivalents, and restricted cash: Cash, cash equivalents, and restricted cash decreased $121.8 million, or 7%, primarily reflecting our purchases of available-for-sale investment securities, as noted above, partially offset by elevated customer deposits due to strong relationships across all of our lending and fee based business lines.
•Loans, held for sale: Loans, held for sale are recorded at fair value and decreased $84.2 million, or 43%, driven by a combination of lower origination volume and higher loans sales in our mortgage banking business.
•Investment securities, held-to-maturity:Investment securities, held-to-maturity decreased $21.1 million, or 19%, primarily reflecting repayments, maturities and calls during the year.2023.
Total liabilities increased $1.3$0.4 billion, or 10%2%, to $13.8$18.1 billion at December 31, 20212023 compared to the prior year, primarily comprised of the following (in descending order of magnitude):
•Total Deposits:Other borrowed funds increased Total depositsincreased $1.4 billion, or 12%, to $13.2 billion,$547.8 million primarily due to an$565.0 million borrowed from the Bank Term Funding Program (BTFP) as a result of favorable terms and pricing.
•Total deposits increased $270.5 million, primarily driven by a $236.6 million increase in customer funding, reflecting continued elevated deposits from strong customer relationships across all lendingtrust deposits.
•FHLB advances decreased $350.0 million due to the repayment of fixed rate FHLB term advances as part of our routine balance sheet management.
•Other liabilities decreased $68.2 million primarily due to a net decrease of $65.3 million in collateral held on derivatives and fee based business lines, including our trust line of businessderivative liabilities driven by changes in Wealth Management, which had $1.2 billion in deposits as of December 31, 2021, an increase of $750.8 million from the prior year. The ratio of net loans and leases (including loans held for sale) to customer deposits was 60% at December 31, 2021 reflecting significant liquidity capacity.interest rates.
•Senior debt: Seniorand subordinated debt decreased $98.7$29.8 million due to the redemption of the 2026 Notes, as described above.
•Other liabilities:Other liabilities increased $14.4 million, primarily due to $17.7 million reflecting the timing of settlements for debt security trades, partially offset by a decrease of $5.8 million in certain retirement plan liabilities.2025 Notes.
Stockholders’ equity increased $147.4$272.5 million to $1.9$2.5 billion at December 31, 20212023 compared to $1.8 billion at December 31, 2020.the prior year. The increase was primarily due to earnings of $271.4$269.2 million during the year and a decrease of $81.9 million in accumulated other comprehensive loss from market value increases on investment securities, partially offset by $93.8significant levels of capital return to shareholders including $54.6 million in unfavorable market-value changes on available-for-sale securities, $24.2 million infrom the repurchase of shares of common stock under our stock repurchase plan and shares withheld to cover tax liabilities, and the payment of dividends paid and $13.3 million related to share repurchases during 2021.on our common stock of $36.7 million.
We repurchased 267,3091,247,178 and 3,950,8554,151,117 shares of our common stock in 20212023 and 2020,2022, respectively. We held 10,086,93615,557,263 shares and 9,819,62714,310,085 shares of our common stock as treasury shares at December 31, 20212023 and 2020,2022, respectively.
For further information on our regulatory capital requirements, refer to our Capital Resources discussion below.
LIQUIDITY AND CAPITAL RESOURCES
Capital Resources
Regulatory capital requirements for the Bank and the Company include a minimum common equity Tier 1 capital ratio of 4.50% of risk-weighted assets, a Tier 1 capital ratio of 6.00% of risk-weighted assets, a minimum Total capital ratio of 8.00% of risk-weighted assets and a minimum Tier 1 leverage capital ratio of 4.00% of average assets. PPP loans receive a zero percent risk weighting under the regulators' capital rules. In order to avoid limits on capital distributions and discretionary bonus payments, the Bank and the Company must maintain a capital conservation buffer of 2.5% of common equity Tier 1 capital over each of the risk-based capital requirements. Failure to meet minimum capital requirements can initiate certain mandatory actions and possibly additional discretionary actions by regulators that, if undertaken, could have a direct material effect on our financial statements.
Regulators have established five capital tiers: well-capitalized, adequately-capitalized, under-capitalized, significantly under-capitalized, and critically under-capitalized. A depository institution’s capital tier depends upon its capital levels in relation to various relevant capital measures, which include leveraged and risk-based capital measures and certain other factors. Under the Prompt Corrective Action framework of the Federal Deposit Insurance Corporation Act, depository institutions that are not classified as well-capitalized are subject to various restrictions regarding capital distributions, payment of management fees, acceptance of brokered deposits and other operating activities. At December 31, 2021,2023, the Bank was in compliance with regulatory capital requirements and all of its regulatory ratios exceeded “well-capitalized” regulatory benchmarks. The Bank’s December 31, 20212023 common equity Tier 1 capital ratio of 15.11%13.72%, Tier 1 capital ratio of 15.11%13.72%, total risk based capital ratio of 15.91%14.96% and Tier 1 leverage capital ratio of 10.44%10.92%, all remain substantially in excess of “well-capitalized” regulatory benchmarks, the highest regulatory capital rating. In addition, and not included in the Bank's capital, the holding company held $103.7$197.3 million in cash to support potential dividends, acquisitions and strategic growth plans.
As part of our adoption of the CECL methodology in 2020, we elected to phase in the day-one adverse effects on regulatory capital that may result from the adoption of CECL over a three-year period, as permitted under a final rule of the federal banking agencies.
Liquidity
We manage our liquidity and funding needs through our Treasury function and our Asset/Liability Committee. We have a policy that separately addresses liquidity, and management monitors our adherence to policy limits. Also, liquidity risk management is a primary area of examination by the banking regulators.
Funding sources to support growth and meet our liquidity needs include cash from operations, commercial, consumer, wealth and retailtrust deposit programs, loan repayments, FHLB borrowings, repurchase agreements, BTFP borrowings, access to the Federal Reserve Discount Window, and access to the brokered deposit market as well as other wholesale funding avenues. In addition, we have a large portfolio of high-quality, liquid investments, primarily short-duration mortgage-backed securities, that provide a near-continuous source of cash flow to meet current cash needs, or can be sold to meet larger discrete needs for cash. We believe these sources are sufficient to meet our funding needs as well as maintain required and prudent levels of liquidity over the next twelve months and beyond.
As of December 31, 2023, the Company has $1.1 billion in cash, cash equivalents, and restricted cash. Our estimated uninsured deposits were $6.3 billion, or 38% of total customer deposits, and our estimated unprotected deposits (uninsured and uncollateralized) were $4.8 billion, or 29% of total customer deposits.
As of December 31, 2023, the Company had a readily available, secured borrowing capacity of $5.4 billion from the FHLB, $0.6 billion through the Federal Reserve Discount Window, and $1.7 billion through the BTFP. In addition, the Company had $1.5 billion in unpledged securities that could be used to support additional borrowings and $0.5 billion of cash deposited with the Federal Reserve Bank. The Company’s readily available, secured borrowing capacity to estimated unprotected deposits ratio is 202%.
During the year ended December 31, 2021,2023, cash, cash equivalents and restricted cash decreased $121.8 millionincreased $0.3 billion to $1.5$1.1 billion from $1.7$0.8 billion as of December 31, 2020.2022. Cash provided by operating activities was $125.6$237.0 million, primarily reflecting the cash impact of earnings. Cash used infor investing activities was $1.5 billion$326.3 million primarily due to a $486.8 million net increase in loans and leases and purchases of loans held for investment of $313.4 million. These outflows were partially offset by net repayments of available-for-sale and held-to-maturity debt securities of $2.8 billion partially offset by $1.3 billion from decreased lending activity related to PPP loan forgiveness$327.1 million and meaningful payoffs and paydowns in the commercial loan portfolio.$73.0 million, respectively. Cash provided by financing activities was $1.2 billion,$344.9 million, primarily due to the borrowing of $565.0 million from the BTFP and a $1.4 billion$252.5 million net increase in deposits, as a result of the increase in customer funding discussed above, partially offset by $350.0 million for the redemptionrepayment of $100.0 million in aggregate principal amount of the 2026 Notes, liquidity management and common stock dividends of $24.2 million, $13.3fixed rate FHLB term advances, $54.6 million for repurchases of common stock under the previously announced stock repurchase plan, common stock dividends of $36.7 million, and $6.6the $30.0 million for repaymentredemption of FHLB advances due to the termination2025 Notes
Our primary cash contractual obligations relate to operating leases, long-term debt, credit obligations, and data processing. At December 31, 2021,2023, we had $250.5$211.3 million in total contractual payments for ongoing leases that have remaining lease terms of less than 1one year to 4022 years, which includes renewal options that are exercised at our discretion. For additional information on our operating leases see Note 9 to the Consolidated Financial Statements. At December 31, 2021,2023, we had no FHLB advances, and obligations for principal payments on long-term debt includedincluding $67.0 million for our trust preferred borrowings, due June 1, 2035, $70.0 million in aggregate principal amount of fixed-to-floating rate subordinated notes due 2027, and $150.0 million for our senior debt, due December 15, 2030. Royal Bancshares Capital Trust I (Trust I) and Royal Bancshares Capital Trust II (Trust II) (collectively, the RBC Trusts), which were acquired from Bryn Mawr Bank Corporation, were utilized for the sole purpose of issuing and selling capital securities representing preferred beneficial interests. Although WSFS owns an aggregate of $0.8 million of the common securities of Trust I and Trust II, the RBC Trusts are not consolidated into the Company’s Consolidated Financial Statements as the Company is not deemed to be the primary beneficiary of these entities. Inclusive of the fair value marks, WSFS assumed junior subordinated debentures owed to the RBC Trusts with a carrying value of $11.8 million each, totaling $23.6 million. The Company records its investments in the RBC Trusts’ common securities of $0.4 million each as investments in unconsolidated entities and records dividend income upon declaration by Trust I and Trust II. The Company has fully and unconditionally guaranteed all of the obligations of the RBC Trusts, including any distributions and payments on liquidation or redemption of the capital securities. We are also contractually obligated to make interest payments on our long-term debt through their respective maturities.
We are also contractually obligated to make interest payments on our long-term debt through their respective maturities. For additional information regarding long-term debt, see Note 12 to the Consolidated Financial Statements. At December 31, 2021,2023, the Company had total commitments to extend credit of $2.5$4.1 billion, which are generally one year commitments. For additional information regarding commitments to extend credit, see Note 17 to the Consolidated Financial Statements.
In 2022, we plan to invest approximately $15 million in our Delivery Transformation initiative to increase adoption and usage of digital channels aligned with our strategy. Our organization is committed to product and service innovation as a means to drive growth and to stay ahead of changing customer demands and emerging competition. We are focused on developing and maintaining a strong “culture of innovation” that solicits, captures, prioritizes and executes innovation initiatives, including feedback from our customers, as well as leveraging technology from product creation to process improvements.
NONPERFORMING ASSETS
Nonperforming assets (NPAs) include nonaccruing loans, other real estate owned (OREO)OREO and restructured loans. Nonaccruing loans are those on which the accrual of interest has ceased.we no longer accrue interest. Loans are placed on nonaccrual status immediately if, in the opinion of management, collection is doubtful, or when principal or interest is past due 90 days or more and the value of the collateral is insufficient to cover principal and interest. Interest accrued but not collected at the date a loan is placed on nonaccrual status is reversed and charged against interest income. In addition, the amortization of net deferred loan fees is suspended when a loan is placed on nonaccrual status. Subsequent cash receipts are applied either to the outstanding principal balance or recorded as interest income, depending on management’s assessment of the ultimate collectability of principal and interest. Past due loans are defined as loans contractually past due 90 days or more as to principal or interest payments but which remain in accrual status because they are considered well secured and in the process of collection.
The following table shows our nonperforming assets and past due loans at the dates indicated:
| | At December 31, |
| At December 31, | |
| At December 31, | |
| At December 31, | |
| (Dollars in thousands) | (Dollars in thousands) | 2021 | | 2020 | |
| Nonaccruing loans: | Nonaccruing loans: | | | | |
| Nonaccruing loans: | |
| Nonaccruing loans: | |
| Commercial and industrial | |
| Commercial and industrial | |
| Commercial and industrial | Commercial and industrial | $ | 8,211 | | | $ | 13,816 | | |
| Owner-occupied commercial | Owner-occupied commercial | 811 | | | 5,360 | | |
| Owner-occupied commercial | |
| Owner-occupied commercial | |
| Commercial mortgages | |
| Commercial mortgages | |
| Commercial mortgages | Commercial mortgages | 2,070 | | | 17,175 | | |
| Construction | Construction | 12 | | | — | | |
| Construction | |
| Construction | |
| Residential | |
| Residential | |
| Residential | Residential | 3,125 | | | 3,247 | | |
| Consumer | Consumer | 2,380 | | | 2,310 | | |
| Total nonaccruing loans | 16,609 | | | 41,908 | | |
| Other real estate owned (OREO) | 2,320 | | | 3,061 | | |
Restructured loans(1)(6) | 14,204 | | | 15,539 | | |
| Total nonperforming assets (NPAs) | $ | 33,133 | | | $ | 60,508 | | |
| Consumer | |
| Consumer | |
Total nonaccruing loans(1) | |
Total nonaccruing loans(1) | |
Total nonaccruing loans(1) | |
| Other real estate owned | |
| Other real estate owned | |
| Other real estate owned | |
Restructured loans(2) | |
Restructured loans(2) | |
Restructured loans(2) | |
| Total nonperforming assets | |
| Total nonperforming assets | |
| Total nonperforming assets | |
| Past due loans: | |
| Past due loans: | |
| Past due loans: | Past due loans: | | | | |
| Commercial | Commercial | $ | 1,357 | | | $ | 5,634 | | |
| Commercial | |
| Commercial | |
| Consumer(3) | |
| Consumer(3) | |
| Consumer(3) | |
| Total past due loans | |
| Total past due loans | |
| Total past due loans | |
Troubled loans(4)(5): | |
Troubled loans(4)(5): | |
Troubled loans(4)(5): | |
| Commercial | |
| Commercial | |
| Commercial | |
| Residential | Residential | — | | | 25 | | |
Consumer(2) | 8,634 | | | 11,035 | | |
| Total past due loans | $ | 9,991 | | | $ | 16,694 | | |
Ratio of allowance for credit losses to total gross loans and leases(3) | 1.19 | % | | 2.51 | % | |
| Residential | |
| Residential | |
| Consumer | |
| Consumer | |
| Consumer | |
| Total troubled loans | |
| Total troubled loans | |
| Total troubled loans | |
Ratio of allowance for credit losses to total gross loans and leases(6) | |
Ratio of allowance for credit losses to total gross loans and leases(6) | |
Ratio of allowance for credit losses to total gross loans and leases(6) | |
| Ratio of nonaccruing loans to total gross loans and leases (4) | 0.21 | | | 0.46 | | |
Ratio of nonaccruing loans to total gross loans and leases(7) | |
| Ratio of nonaccruing loans to total gross loans and leases(7) | |
| Ratio of nonaccruing loans to total gross loans and leases(7) | |
| Ratio of nonperforming assets to total assets | |
| Ratio of nonperforming assets to total assets | |
| Ratio of nonperforming assets to total assets | Ratio of nonperforming assets to total assets | 0.21 | | | 0.42 | | |
| Ratio of allowance for credit losses to nonaccruing loans | Ratio of allowance for credit losses to nonaccruing loans | 569 | | | 546 | | |
Ratio of allowance for credit losses to total nonperforming assets(5) | 285 | | | 378 | | |
| Ratio of allowance for credit losses to nonaccruing loans | |
| Ratio of allowance for credit losses to nonaccruing loans | |
Ratio of allowance for credit losses to total nonperforming assets(8) | |
Ratio of allowance for credit losses to total nonperforming assets(8) | |
Ratio of allowance for credit losses to total nonperforming assets(8) | |
(1)Includes nonaccrual loans held-for-sale.
(2)Accruing loans only, which includes acquired nonimpaired loans. Nonaccruing Troubled Debt Restructurings (TDRs) are included in their respective categories of nonaccruing loans.
(2)(3)Includes delinquent, but still accruing, U.S. government guaranteed student loans with little risk of credit lossloss.
(3)(4)Loans with certain modifications (as prescribed in ASU No. 2022-02) to borrowers experiencing financial difficulty.
(5)Includes troubled loan held-for-sale.
(6)Represents amortized cost basis for loans, leases and held-to-maturity securities.
(4)(7)Total loans exclude loans held for saleheld-for-sale and reverse mortgages.
(5)(8)Excludes acquired impairedPCD loans.
(6)Balance excludes COVID-19 modifications.
Nonperforming assets decreased $27.4increased $32.4 million between December 31, 20202022 and December 31, 2021. Non-performing loans decreased $25.32023. This increase was primarily due to the transfer in of seven commercial relationships totaling $61.1 million primarily from $15.8and two CRE relationships totaling $19.4 million of net collections and charge-off activity on three commercial and industrial relationships during the fourth quarterperiod. These inflows were partially offset by partial charge-offs on some of 2021the C&I relationships totaling $20.7 million, several smaller payoffs and the payoffcontinued collection of one commercial real estate relationshipprincipal payments on the majority of approximately $15.1 million in the first quarter. Restructured loans at December 31, 2021 decreased by $1.3 million compared to December 31, 2020.these loans. The ratio of nonperforming assets to total assets decreasedslightly increased from 0.42%0.22% at December 31, 20202022 to 0.21%0.37% at December 31, 2021.
The following table provides an analysis ofsummarizes the changechanges in the balance of nonperforming assets during the last two years:periods indicated:
| | | |
| | | | | Year Ended December 31, | | Year Ended December 31, |
| (Dollars in thousands) | (Dollars in thousands) | | 2021 | | 2020 | |
| Beginning balance | Beginning balance | | $ | 60,508 | | | $ | 39,808 | | |
| Beginning balance | |
| Beginning balance | |
| Additions | |
| Additions | |
| Additions | Additions | | 45,387 | | | 45,929 | | |
| Collections | Collections | | (47,477) | | | (16,192) | | |
| Transfers to accrual | | (494) | | | (134) | | |
| Collections | |
| Collections | |
Transfers to accrual(1) | |
Transfers to accrual(1) | |
Transfers to accrual(1) | |
| Charge-offs | |
| Charge-offs | |
| Charge-offs | Charge-offs | | (24,791) | | | (8,903) | | |
| Ending balance | Ending balance | | $ | 33,133 | | | $ | 60,508 | | |
| Ending balance | |
| Ending balance | |
The timely identification of problem loans is a key element in our strategy to manage our loan portfolio. Problem loans are all criticized, classified and nonperforming loans and other real estate owned. Timely identification enables us to take appropriate action and accordingly, minimize losses. An asset review system established to monitor the asset quality of our loans and investments in real estate portfolios facilitates the identification of problem assets. In general, this system utilizesuses guidelines established by federal regulation.
RESULTS OF OPERATIONS
20202022 compared with 2019
For a discussion of our results for the year ended December 31, 20202022 compared to the year ended December 31, 2019,2021, please see "Management’s Discussion and Analysis of Financial Condition and Results of Operations" in our Annual Report on Form 10-K for the year ended December 31, 20202022 filed with the SEC on March 1, 2021.February 28, 2023.
20212023 compared with 20202022
We recorded net income attributable to WSFS of $271.4$269.2 million, or $5.69$4.40 per diluted common share, for the year ended December 31, 2021, an2023, a increase of $156.7$46.8 million compared to $114.8$222.4 million, or $2.27$3.49 per diluted common share, for the year ended December 31, 2020.2022.
•Net interest income for the year ended December 31, 20212023 was $433.6$725.1 million, a decreasean increase of $32.3$62.2 million compared to 2020,2022, primarily due to the the benefits of our asset-sensitive balance sheet and an increase from the balance sheet size and mix. The increase was partially offset by lower purchase accounting accretion, the lower interest rate environment and balance sheet mix, as well as the impact of PPP loans.accretion. See “Net Interest Income” for further information.
•Our provision for credit losses decreased $270.3increased $40.0 million in 2021,2023, primarily due to positive impacts in the economic forecast included inhigher provisions on our CECL modelingCRE, commercial small business leasing, and improved credit quality metrics reflecting overall declines in problem assets and delinquencies, partially offset by new loan originations.Upstart portfolios as well as our elder care portfolio within C&I. See “Provision/Allowance for Credit Losses” for further information.
•Noninterest income decreased $15.5increased $29.7 million in 2021,2023, primarily due to the impactincreases in income from the sale of Visa Class B sharesCash Connect®, Wealth Management fee income, a realized gain from our investment in the prior year, lower securities gains, a decline in our mortgage banking business,Spring EQ, and lower interchange fees due to the impact of the Durbin Amendment on 2021 results.capital markets income. These decreasesincreases were partially offset by higher revenues from Wealth Management,decreases in other income and traditional banking fees and total netmortgage banking activities, and unrealized gains on equity investments.investments and income from BMTIA (business sold in 2022). See “Noninterest Income” for further information.
•Noninterest expense increased $9.7decreased $12.7 million in 2021,2023, primarily reflecting an increase in salaries and benefits due to higher salaries and franchise growth, higher net corporate development and restructuring costs related to our acquisition of Bryn Mawr Trust and higher equipment expense,incurred in 2022, partially offset by the Charter Oak legal settlement recoveryincreases in December 2021, and decreases in loan workout and other credit costs, professional fees, and other operating expenses.expenses driven by Cash Connect®, FDIC expenses, salaries and benefits costs, and professional fees. See “Noninterest Expense” for further information.
Net Interest Income
The following table provides information regarding the average balances of, and yields/rates on, interest-earning assets and interest-bearing liabilities during the periods indicated:
| | Year Ended December 31, | Year Ended December 31, | | 2021 | | 2020 | |
| Year Ended December 31, | |
| Year Ended December 31, | |
| (Dollars in thousands) | |
| (Dollars in thousands) | |
| (Dollars in thousands) | (Dollars in thousands) | | Average Balance | | Interest & Dividends | | Yield/ Rate(1) | | Average
Balance | | Interest &
Dividends | | Yield/ Rate (1) | |
| Assets: | Assets: | | | | | | | | | | | | | |
| Assets: | |
| Assets: | |
| Interest-earning assets: | |
| Interest-earning assets: | |
| Interest-earning assets: | Interest-earning assets: | | |
Loans:(2) | Loans:(2) | | |
Loans:(2) | |
Loans:(2) | |
| Commercial loans and leases | |
| Commercial loans and leases | |
| Commercial loans and leases | Commercial loans and leases | | $ | 3,801,816 | | | $ | 183,782 | | | 4.84 | % | | $ | 4,174,451 | | | $ | 221,595 | | | 5.32 | % | |
| Commercial mortgage loans | Commercial mortgage loans | | 2,770,241 | | | 113,979 | | | 4.11 | | | 2,827,875 | | | 125,811 | | | 4.45 | | |
| Commercial mortgage loans | |
| Commercial mortgage loans | |
| Residential | |
| Residential | |
| Residential | Residential | | 636,443 | | | 42,063 | | | 6.61 | | | 910,263 | | | 53,780 | | | 5.91 | | |
| Consumer | Consumer | | 1,134,569 | | | 49,330 | | | 4.35 | | | 1,144,435 | | | 55,304 | | | 4.83 | | |
| Consumer | |
| Consumer | |
| Loans held for sale | |
| Loans held for sale | |
| Loans held for sale | Loans held for sale | | 118,803 | | | 4,094 | | | 3.45 | | | 106,398 | | | 3,904 | | | 3.67 | | |
| Total loans and leases | Total loans and leases | | 8,461,872 | | | 393,248 | | | 4.65 | | | 9,163,422 | | | 460,394 | | | 5.03 | | |
| Total loans and leases | |
| Total loans and leases | |
Mortgage-backed securities(3) | |
Mortgage-backed securities(3) | |
Mortgage-backed securities(3) | Mortgage-backed securities(3) | | 3,340,001 | | | 55,802 | | | 1.67 | | | 2,052,672 | | | 48,377 | | | 2.36 | | |
Investment securities(3) | Investment securities(3) | | 321,599 | | | 5,524 | | | 1.94 | | | 219,603 | | | 4,619 | | | 2.47 | | |
Investment securities(3) | |
Investment securities(3) | |
| Other interest-earning assets | |
| Other interest-earning assets | |
| Other interest-earning assets | Other interest-earning assets | | 1,320,229 | | | 1,795 | | | 0.14 | | | 369,229 | | | 1,015 | | | 0.27 | | |
| Total interest-earning assets | Total interest-earning assets | | 13,443,701 | | | 456,369 | | | 3.40 | | | 11,804,926 | | | 514,405 | | | 4.37 | | |
| Total interest-earning assets | |
| Total interest-earning assets | |
| Allowance for credit losses | |
| Allowance for credit losses | |
| Allowance for credit losses | Allowance for credit losses | | (161,770) | | | | | (177,052) | | | | | |
| Cash and due from banks | Cash and due from banks | | 144,778 | | | 119,337 | | | |
| Cash and due from banks | |
| Cash and due from banks | |
| Cash in non-owned ATMs | |
| Cash in non-owned ATMs | |
| Cash in non-owned ATMs | Cash in non-owned ATMs | | 454,803 | | | 347,925 | | | |
| Bank owned life insurance | Bank owned life insurance | | 32,818 | | | 30,729 | | | |
| Bank owned life insurance | |
| Bank owned life insurance | |
| Other noninterest-earning assets | |
| Other noninterest-earning assets | |
| Other noninterest-earning assets | Other noninterest-earning assets | | 989,590 | | | 1,022,452 | | | |
| Total assets | Total assets | | $ | 14,903,920 | | | $ | 13,148,317 | | | |
| Total assets | |
| Total assets | |
| Liabilities and stockholders’ equity: | |
| Liabilities and stockholders’ equity: | |
| Liabilities and stockholders’ equity: | Liabilities and stockholders’ equity: | | | | | | |
| Interest-bearing liabilities: | Interest-bearing liabilities: | | |
| Interest-bearing liabilities: | |
| Interest-bearing liabilities: | |
| Interest-bearing deposits: | |
| Interest-bearing deposits: | |
| Interest-bearing deposits: | Interest-bearing deposits: | | |
| Interest-bearing demand | Interest-bearing demand | | $ | 2,655,887 | | | $ | 2,262 | | | 0.09 | % | | $ | 2,304,558 | | | $ | 4,229 | | | 0.18 | % | |
| Interest-bearing demand | |
| Interest-bearing demand | |
| Money market | |
| Money market | |
| Money market | Money market | | 2,740,573 | | | 3,218 | | | 0.12 | | | 2,324,259 | | | 9,423 | | | 0.41 | | |
| Savings | Savings | | 1,912,568 | | | 586 | | | 0.03 | | | 1,690,240 | | | 3,518 | | | 0.21 | | |
| Savings | |
| Savings | |
| Customer time deposits | |
| Customer time deposits | |
| Customer time deposits | Customer time deposits | | 1,065,137 | | | 7,332 | | | 0.69 | | | 1,247,197 | | | 18,699 | | | 1.50 | | |
| Total interest-bearing customer deposits | Total interest-bearing customer deposits | | 8,374,165 | | | 13,398 | | | 0.16 | | | 7,566,254 | | | 35,869 | | | 0.47 | | |
| Total interest-bearing customer deposits | |
| Total interest-bearing customer deposits | |
| Brokered deposits | |
| Brokered deposits | |
| Brokered deposits | Brokered deposits | | 70,090 | | | 1,525 | | | 2.18 | | | 246,644 | | | 3,393 | | | 1.38 | | |
| Total interest-bearing deposits | Total interest-bearing deposits | | 8,444,255 | | | 14,923 | | | 0.18 | | | 7,812,898 | | | 39,262 | | | 0.50 | | |
| Total interest-bearing deposits | |
| Total interest-bearing deposits | |
| Federal Home Loan Bank advances | |
| Federal Home Loan Bank advances | |
| Federal Home Loan Bank advances | Federal Home Loan Bank advances | | 184 | | | 5 | | | 2.72 | | | 88,011 | | | 1,950 | | | 2.22 | | |
| Trust preferred borrowings | Trust preferred borrowings | | 67,011 | | | 1,274 | | | 1.90 | | | 67,011 | | | 1,751 | | | 2.61 | | |
| Senior debt | | 192,243 | | | 6,497 | | | 3.38 | | | 108,420 | | | 4,998 | | | 4.61 | | |
| Trust preferred borrowings | |
| Trust preferred borrowings | |
| Senior and subordinated debt | |
| Senior and subordinated debt | |
| Senior and subordinated debt | |
Other borrowed funds(4) | |
Other borrowed funds(4) | |
Other borrowed funds(4) | Other borrowed funds(4) | | 21,661 | | | 21 | | | 0.10 | | | 53,828 | | | 489 | | | 0.91 | | |
| Total interest-bearing liabilities | Total interest-bearing liabilities | | 8,725,354 | | | 22,720 | | | 0.26 | | | 8,130,168 | | | 48,450 | | | 0.60 | | |
| Total interest-bearing liabilities | |
| Total interest-bearing liabilities | |
| Noninterest-bearing demand deposits | |
| Noninterest-bearing demand deposits | |
| Noninterest-bearing demand deposits | Noninterest-bearing demand deposits | | 4,008,140 | | | | | 2,848,243 | | | | | |
| Other noninterest-bearing liabilities | Other noninterest-bearing liabilities | | 323,715 | | | 335,456 | | | |
| Other noninterest-bearing liabilities | |
| Other noninterest-bearing liabilities | |
| Stockholders’ equity of WSFS | |
| Stockholders’ equity of WSFS | |
| Stockholders’ equity of WSFS | Stockholders’ equity of WSFS | | 1,848,904 | | | 1,836,115 | | | |
| Noncontrolling interest | Noncontrolling interest | | (2,193) | | | (1,665) | | | |
| Noncontrolling interest | |
| Noncontrolling interest | |
| Total liabilities and stockholders’ equity | |
| Total liabilities and stockholders’ equity | |
| Total liabilities and stockholders’ equity | Total liabilities and stockholders’ equity | | $ | 14,903,920 | | | $ | 13,148,317 | | | |
| Excess of interest-earning assets over interest-bearing liabilities | Excess of interest-earning assets over interest-bearing liabilities | | $ | 4,718,347 | | | $ | 3,674,758 | | | |
| Excess of interest-earning assets over interest-bearing liabilities | |
| Excess of interest-earning assets over interest-bearing liabilities | |
| Net interest and dividend income | |
| Net interest and dividend income | |
| Net interest and dividend income | Net interest and dividend income | | | | $ | 433,649 | | | | | $ | 465,955 | | | |
| Interest rate spread | Interest rate spread | | | | 3.14 | % | | | | 3.77 | % | |
| Interest rate spread | |
| Interest rate spread | |
| Net interest margin | Net interest margin | | 3.23 | % | | 3.96 | % | |
| Net interest margin | |
| Net interest margin | |
(1)Weighted average yields for tax-exempt securities and loans have been computed on a tax-equivalent basis.
(2)Average balances are net of unearned income and include nonperforming loans.
(3)Includes securities held-to-maturity (at amortized cost) and securities available-for-sale (at fair value).
(4)Includes federal funds purchased.
Net interest income decreased $32.3increased $62.2 million, or 7%9%, to $433.6$725.1 million in 2021, from 20202023, compared to 2022 primarily due to a $20.9$60.6 million increase from the benefits of our asset-sensitive balance sheet and a $4.0 million increase from the balance sheet size and mix, offset by a $2.4 million decrease in purchase accounting accretion, a net decline of $8.2 million due to a full year impact of the lower rate environment and change in balance sheet mix from optimization of excess customer liquidity, and $3.2 million lower PPP income.accretion. Net interest margin decreased 73increased 40 bps to 3.23%4.11% in 20212023 from 3.96%3.71% in 2020.2022. The decreaseincrease was primarily due to a 5924 bps net declineincrease from the lower interest rate environment and balance sheet size and mix and 2317 bps from the benefits of our asset-sensitive balance sheet, partially offset by 1 bp from lower purchase accounting accretion, partially offset by 9 bps from the impact of PPP loans.accretion.
The following table provides certain information regarding changes in net interest income attributable to changes in the volumes of interest-earning assets and interest-bearing liabilities and changes in the rates for the periods indicated. For each category of interest-earning assets and interest-bearing liabilities, information is provided on the changes that are attributable to: (i) changes in volume (change in volume multiplied by prior year rate); (ii) changes in rates (change in rate multiplied by prior year volume on each category); and (iii) net change (the sum of the change in volume and the change in rate). Changes due to the combination of rate and volume changes (changes in volume multiplied by changes in rate) are allocated proportionately between changes in rate and changes in volume.
| | Year Ended December 31, | Year Ended December 31, | 2021 vs. 2020 | Year Ended December 31, | 2023 vs. 2022 |
| (Dollars in thousands) | (Dollars in thousands) | Volume | | Yield/Rate | | Net | (Dollars in thousands) | Volume | | Yield/Rate | | Net |
| Interest Income: | Interest Income: | | | | | |
| Loans: | Loans: | |
| Loans: | |
| Loans: | |
Commercial loans and leases(1) | |
Commercial loans and leases(1) | |
Commercial loans and leases(1) | Commercial loans and leases(1) | $ | (18,805) | | | $ | (19,008) | | | $ | (37,813) | |
| Commercial mortgage loans | Commercial mortgage loans | (2,492) | | | (9,340) | | | (11,832) | |
| Residential | Residential | (17,551) | | | 5,834 | | | (11,717) | |
| Consumer | Consumer | (477) | | | (5,497) | | | (5,974) | |
| Loans held for sale | Loans held for sale | 435 | | | (245) | | | 190 | |
| Mortgage-backed securities | Mortgage-backed securities | 24,384 | | | (16,959) | | | 7,425 | |
Investment securities(2) | Investment securities(2) | 2,211 | | | (1,306) | | | 905 | |
| Other interest-earning assets | Other interest-earning assets | 1,466 | | | (686) | | | 780 | |
| Unfavorable | (10,829) | | | (47,207) | | | (58,036) | |
| Favorable | |
| Interest expense: | Interest expense: | | | | | |
| Deposits: | Deposits: | |
| Deposits: | |
| Deposits: | |
| Interest-bearing demand | |
| Interest-bearing demand | |
| Interest-bearing demand | Interest-bearing demand | 509 | | | (2,476) | | | (1,967) | |
| Money market | Money market | 1,470 | | | (7,675) | | | (6,205) | |
| Savings | Savings | 419 | | | (3,351) | | | (2,932) | |
| Customer time deposits | Customer time deposits | (2,419) | | | (8,948) | | | (11,367) | |
| Brokered certificates of deposits | Brokered certificates of deposits | (3,212) | | | 1,344 | | | (1,868) | |
| FHLB advances | FHLB advances | (2,305) | | | 360 | | | (1,945) | |
| Trust preferred borrowings | Trust preferred borrowings | — | | | (477) | | | (477) | |
| Senior debt | 3,098 | | | (1,599) | | | 1,499 | |
| Senior and subordinated debt | |
| Other borrowed funds | Other borrowed funds | (188) | | | (280) | | | (468) | |
| Favorable | (2,628) | | | (23,102) | | | (25,730) | |
| Unfavorable | |
| Net change, as reported | Net change, as reported | $ | (8,201) | | | $ | (24,105) | | | $ | (32,306) | |
(1)Includes a tax-equivalent income adjustment related to commercial loans.
(2)Includes a tax-equivalent income adjustment related to municipal bonds.
Investment Securities
The following table details the maturity and weighted average yield of the available for saleavailable-for-sale investment portfolio as of December 31, 2021:2023:
| | (Dollars in thousands) | (Dollars in thousands) | Maturing During 2022 | | Maturing From 2023 Through 2026 | | Maturing From 2027 Through 2031 | | Maturing After 2031 | | Total | (Dollars in thousands) | Maturing During 2024 | | Maturing From 2025 Through 2028 | | Maturing From 2029 Through 2033 | | Maturing After 2033 | | Total |
| Collateralized mortgage obligations (CMO) | Collateralized mortgage obligations (CMO) | | | | | | | | | |
| Amortized cost | Amortized cost | $ | 1,507 | | | $ | 25,483 | | | $ | 52,301 | | | $ | 507,539 | | | $ | 586,830 | |
| Amortized cost | |
| Amortized cost | |
| Weighted average yield | Weighted average yield | 2.00 | % | | 2.22 | % | | 1.98 | % | | 1.59 | % | | 1.65 | % | Weighted average yield | — | % | | 2.37 | % | | 1.97 | % | | 1.84 | % | | 1.88 | % |
| Fannie Mae (FNMA) mortgage-backed securities (MBS) | Fannie Mae (FNMA) mortgage-backed securities (MBS) | |
| Amortized cost | |
| Amortized cost | |
| Amortized cost | Amortized cost | 1,530 | | | 75,441 | | | 102,188 | | | 4,096,148 | | | 4,275,307 | |
| Weighted average yield | Weighted average yield | 2.57 | % | | 2.28 | % | | 1.66 | % | | 1.71 | % | | 1.71 | % | Weighted average yield | — | % | | 2.38 | % | | 2.05 | % | | 1.99 | % | | 2.00 | % |
| Freddie Mac (FHLMC) MBS | Freddie Mac (FHLMC) MBS | |
| Amortized cost | Amortized cost | — | | | — | | | 25,898 | | | 113,810 | | | 139,708 | |
| Amortized cost | |
| Amortized cost | |
| Weighted average yield | Weighted average yield | — | % | | — | % | | 2.11 | % | | 2.91 | % | | 2.76 | % | Weighted average yield | — | % | | 2.43 | % | | 2.39 | % | | 3.15 | % | | 2.84 | % |
| Ginnie Mae (GNMA) MBS | Ginnie Mae (GNMA) MBS | |
| Amortized cost | |
| Amortized cost | |
| Amortized cost | Amortized cost | ��� | | | — | | | 1,034 | | | 16,422 | | | 17,456 | |
| Weighted average yield | Weighted average yield | — | % | | — | % | | 3.00 | % | | 2.49 | % | | 2.52 | % | Weighted average yield | — | % | | 4.79 | % | | 2.98 | % | | 3.39 | % | | 3.38 | % |
| Government-sponsored enterprises (GSE) | Government-sponsored enterprises (GSE) | |
| Amortized cost | Amortized cost | — | | | — | | | 47,454 | | | 183,127 | | | 230,581 | |
| Amortized cost | |
| Amortized cost | |
| Weighted average yield | Weighted average yield | — | % | | — | % | | 1.28 | % | | 1.29 | % | | 1.28 | % | Weighted average yield | — | % | | — | % | | 1.30 | % | | 1.44 | % | | 1.30 | % |
| Total amortized cost | Total amortized cost | $ | 3,037 | | | $ | 100,924 | | | $ | 228,875 | | | $ | 4,917,046 | | | $ | 5,249,882 | |
| Weighted average yield | Weighted average yield | 2.29 | % | | 2.27 | % | | 1.71 | % | | 1.70 | % | | 1.71 | % | Weighted average yield | — | % | | 2.38 | % | | 1.78 | % | | 2.01 | % | | 1.99 | % |
As of December 31, 2021,2023, WSFS does not have any tax-exempt securities within the available for saleavailable-for-sale investment portfolio. Yields are calculated on a weighted average basis using the investments amortized cost and respective average yields for each investment category. Expected maturities of mortgage-backed securities may differ from contractual maturities due to calls or prepay obligations.
Provision/Allowance for Credit Losses (ACL)
We maintain an ACL at an appropriate level based on our assessment of estimable and probable losses in the loan portfolio, which we evaluate in accordance with applicable accounting principles, as discussed further in “Nonperforming Assets.” Our evaluation is based on a review of the portfolio and requires significant, complex and difficult judgments.
For the year ended December 31, 2021,2023, we recorded a recovery ofprovision for credit losses of $117.1$88.1 million, a net change of $270.3$40.0 million, compared to the provision forof credit losses of $153.2$48.1 million in 2020. 2022. The increase was primarily due to higher provisions on our CRE, commercial small business leasing, and Upstart portfolios as well as our elder care portfolio within C&I.
The ACL was $94.5$186.1 million at December 31, 20212023 compared to $228.8$151.9 million at December 31, 2020.
2022. The decreaseincrease of the ACL was primarily due to positive impacts in our economic outlook from our ACL modelingnet loan growth across the CRE, Consumer, and improved credit quality metrics reflecting overall declines in problem assetscommercial small business leasing portfolios and delinquencies, offset by new loan originations.the higher provisions noted above. The ratio of allowance for credit losses to total loans and leases was 1.19%1.35% at December 31, 20212023 and 2.51%1.17% at December 31, 2020.2022.
The following chart detailsNet charge-offs were $53.8 million for the changes in the ACL fromyear ended December 31, 20202023 compared to $16.8 million for the year-ended December 31, 2021:
(1)Other includes changes that can affect future cash flows that impact ACL, such as changes to maturity dates2022. The increase in net charge-offs was primarily driven by our Upstart and payment schedules.commercial small business leasing portfolios.
The following tables detail the allocation of the ACL and show our net charge-offs (recoveries) by portfolio category:
| | (Dollars in thousands) | (Dollars in thousands) | | Commercial and Industrial(1) | | Owner-
occupied
Commercial | | Commercial
Mortgages | | Construction | | Residential(2) | | Consumer(3) | | Total | (Dollars in thousands) | | Commercial and Industrial(1) | | Owner-
occupied
Commercial | | Commercial
Mortgages | | Construction | | Residential(2) | | Consumer(3) | | Total |
| As of December 31, 2021 | | | | | | | | | | | | | | |
| As of December 31, 2023 | |
| Allowance for credit losses | |
| Allowance for credit losses | |
| Allowance for credit losses | Allowance for credit losses | | $ | 49,967 | | | $ | 4,574 | | | $ | 11,623 | | | $ | 1,903 | | | $ | 3,352 | | | $ | 23,088 | | | $ | 94,507 | |
| % of ACL to total ACL | % of ACL to total ACL | | 53 | % | | 5 | % | | 12 | % | | 2 | % | | 4 | % | | 24 | % | | 100 | % | % of ACL to total ACL | | 35 | % | | 6 | % | | 19 | % | | 6 | % | | 3 | % | | 31 | % | | 100 | % |
| Loan portfolio balance | Loan portfolio balance | | $ | 2,270,319 | | | $ | 1,341,707 | | | $ | 1,881,510 | | | $ | 687,213 | | | $ | 546,667 | | | $ | 1,158,573 | | | $ | 7,885,989 | |
| % to total loans and leases | % to total loans and leases | | 28 | % | | 17 | % | | 24 | % | | 9 | % | | 7 | % | | 15 | % | | 100 | % | % to total loans and leases | | 24 | % | | 15 | % | | 30 | % | | 8 | % | | 7 | % | | 16 | % | | 100 | % |
| Year ended December 31, 2021 | |
| Year ended December 31, 2023 | |
| Charge-offs | |
| Charge-offs | |
| Charge-offs | Charge-offs | | $ | 23,592 | | | $ | 83 | | | $ | 73 | | | $ | 2,473 | | | $ | — | | | $ | 2,094 | | | $ | 28,315 | |
| Recoveries | Recoveries | | 8,756 | | | 160 | | | 269 | | | — | | | 789 | | | 1,131 | | | 11,105 | |
| Net charge-offs (recoveries) | Net charge-offs (recoveries) | | $ | 14,836 | | | $ | (77) | | | $ | (196) | | | $ | 2,473 | | | $ | (789) | | | $ | 963 | | | $ | 17,210 | |
| Average loan balance | Average loan balance | | $ | 2,463,933 | | | $ | 1,337,883 | | | $ | 1,994,995 | | | $ | 775,246 | | | $ | 628,411 | | | $ | 1,134,569 | | | $ | 8,335,037 | |
| Ratio of net charge-offs (recoveries) to average gross loans | Ratio of net charge-offs (recoveries) to average gross loans | | 0.60 | % | | (0.01) | % | | (0.01) | % | | 0.32 | % | | (0.13) | % | | 0.08 | % | | 0.21 | % | Ratio of net charge-offs (recoveries) to average gross loans | | 1.03 | % | | 0.01 | % | | 0.01 | % | | 0.03 | % | | (0.03) | % | | 1.08 | % | | 0.44 | % |
| | (Dollars in thousands) | (Dollars in thousands) | | Commercial and Industrial(1) | | Owner-
occupied
Commercial | | Commercial
Mortgages | | Construction | | Residential(2) | | Consumer(3) | | Total | (Dollars in thousands) | | Commercial and Industrial(1) | | Owner-
occupied
Commercial | | Commercial
Mortgages | | Construction | | Residential(2) | | Consumer(3) | | Total |
| As of December 31, 2020 | | | | | | | | | | | | | | |
| As of December 31, 2022 | |
| Allowance for credit losses | |
| Allowance for credit losses | |
| Allowance for credit losses | Allowance for credit losses | | $ | 150,875 | | | $ | 9,615 | | | $ | 31,071 | | | $ | 12,190 | | | $ | 6,893 | | | $ | 18,160 | | | $ | 228,804 | |
| % of ACL to total ACL | % of ACL to total ACL | | 66 | % | | 4 | % | | 14 | % | | 5 | % | | 3 | % | | 8 | % | | 100 | % | % of ACL to total ACL | | 39 | % | | 4 | % | | 14 | % | | 5 | % | | 3 | % | | 35 | % | | 100 | % |
| Loan portfolio balance | Loan portfolio balance | | $ | 2,949,303 | | | $ | 1,332,727 | | | $ | 2,086,062 | | | $ | 716,275 | | | $ | 774,455 | | | $ | 1,158,573 | | | $ | 9,024,739 | |
| % to total loans and leases | % to total loans and leases | | 32 | % | | 15 | % | | 23 | % | | 8 | % | | 9 | % | | 13 | % | | 100 | % | % to total loans and leases | | 26 | % | | 15 | % | | 28 | % | | 9 | % | | 7 | % | | 15 | % | | 100 | % |
| Year ended December 31, 2020 | |
| Year ended December 31, 2022 | |
| Charge-offs | |
| Charge-offs | |
| Charge-offs | Charge-offs | | $ | 10,388 | | | $ | 336 | | | $ | 104 | | | $ | — | | | $ | 229 | | | $ | 2,464 | | | $ | 13,521 | |
| Recoveries | Recoveries | | 4,255 | | | 142 | | | 158 | | | 36 | | | 230 | | | 893 | | | 5,714 | |
| Net charge-offs (recoveries) | Net charge-offs (recoveries) | | $ | 6,133 | | | $ | 194 | | | $ | (54) | | | $ | (36) | | | $ | (1) | | | $ | 1,571 | | | $ | 7,807 | |
| Average loan balance | Average loan balance | | $ | 2,854,798 | | | $ | 1,319,653 | | | $ | 2,173,632 | | | $ | 654,243 | | | $ | 895,551 | | | $ | 1,144,435 | | | $ | 9,042,312 | |
| Ratio of net charge-offs (recoveries) to average gross loans | Ratio of net charge-offs (recoveries) to average gross loans | | 0.21 | % | | 0.01 | % | | NMF | | (0.01) | % | | NMF | | 0.14 | % | | 0.09 | % | Ratio of net charge-offs (recoveries) to average gross loans | | 0.42 | % | | (0.01) | % | | 0.01 | % | | (0.27) | % | | (0.06) | % | | 0.44 | % | | 0.15�� | % |
(1)Includes commercial small business leases and PPP loans.
(2)Excludes reverse mortgages.
(3)Includes home equity lines of credit, installment loans unsecured lines of credit and education loans.
Noninterest Income
Noninterest income decreased $15.5increased $29.7 million to $185.5$289.9 million in 20212023 from $201.0$260.1 million in 2020.2022. This decreaseincrease reflects a decrease$26.9 million increase from Cash Connect® driven by the rising rate environment and continued growth in Realized (loss) gain on equity investments, net due to the $22.1smart safe space, $10.2 million increase in Wealth Management revenue, a $9.5 million gain on Visa Class B shares that occurredrealized from our investment in June 2020, an $8.7Spring EQ, and $4.0 million in capital markets income. The increase was partially offset by a $10.6 million decrease in Securities gains, net,other banking fees, including fees associated with our consumer lending partnerships, gain on sale of SBA loans and traditional bank service fees, and a $7.0$2.5 million decrease in mortgage banking activities dueactivities. In addition to a decline in volume compared to the historically higher levels in the prior year, and a $5.5 million decrease in Credit/debit card and ATM income primarily as a result of the Durbin Amendment enacted on July 1, 2020. Partially offsetting these decreases, were increaseswe recognized $6.0 million of $13.4 million in Wealth Management revenues driven by our institutional trust business, $5.7unrealized gains on equity investments and $2.6 million from otherBMTIA in 2022. Our diverse fee-based businesses support sustainability of noninterest income primarily from Cash Connect® and gains on the sale of SBA loans, $5.1 million from higher traditional banking fees, and $4.4 million of net gains from the sale of our SoFi investment.through economic cycles.
Noninterest Expenses
Noninterest expense increased $9.7decreased $12.7 million to $378.5$561.6 million in 20212023 from $368.8$574.3 million in 2020.2022. The increasedecrease was primarily due to a $19.9$61.5 million increase in Salaries, benefits and other compensation as a result of higher salaries and incentive compensation due to franchise growth, an $8.2 million increase inlower net corporate development and restructuring costs, related to our acquisition of Bryn Mawr Trust, and a $5.2 million increase in Equipment expense including higher third-party software expenses related to our ongoing delivery transformation initiatives. These increases were partially offset by increases of $29.5 million in other operating expense driven by higher variable operating costs from Cash Connect®, $9.8 million in FDIC expenses which includes the $15.0$5.1 million recovery of legal settlement previously mentioned, a $6.2 million decrease in Loan workout and other credit costs dueFDIC special assessment charged to recover losses to the releaseDeposit Insurance Fund related to closures of reserves on our unfunded commitments driven by improved credit metricscertain banks in 2023, $5.3 million in salaries and higher loan workoutbenefits costs, in the prior period, a $3.1and $2.7 million decrease in professional fees, and a $1.9 million decrease in Other operating expense, primarily due to $2.0 million in lower contributions to the WSFS CARES Foundation when compared to the prior year.fees.
Income Taxes
We recorded $86.1$96.2 million of income tax expense for the year ended December 31, 20212023 compared to $31.6$78.0 million for the year ended December 31, 2020.2022. The increase in income tax expense was primarily driven by an increase in income before taxes of $212.7$64.7 million for the year ended December 31, 20212023 compared to the year ended December 31, 2020.2022. The effective tax rates for the years ended December 31, 20212023 and 20202022 were 24.1%26.3% and 21.8%25.9%, respectively. The effective tax rate for year ended December 31, 20212023 increased primarily due to higherour decision to surrender certain BOLI policies in 2023 that resulted in $7.1 million of tax expense. In addition, the 2022 effective tax rate reflects the impact of the write-off of $6.7 million of nondeductible expensesgoodwill related to the sale of the BMT Insurance Advisors business. Further, the tax expense associated with the acquisition of Bryn Mawr Trust which occurred on January 1, 2022. Nondeductiblenondeductible acquisition costs of $3.9 millionin 2023 decreased compared to 2022. There were recognizedno nondeductible acquisition costs during the year ended December 31, 2021, whereas none were2023 compared to $1.8 million incurred in the same period in 2020. In addition, we recognized $1.7 million in tax benefits during the year ended December 31, 2020 related to tax law changes contained in the CARES Act (see "Regulation - Coronavirus Aid, Relief, and Economic Security (CARES) Act"), related to the ability to carry back certain acquired net operating losses to prior years where the statutory tax rate was higher than the current statutory tax rate. Further, the tax benefit related to stock-based compensation activity for the year ended December 31, 2021 increased compared to the prior year. We recorded $0.4 million of income tax benefit during the year ended December 31, 2021 compared to less than $0.1 million of income tax expense for the same period in 2020.2022.
The effective tax rate reflects the recognition of certain tax benefits in the financial statements including those benefits from tax-exempt interest income, federal low-income housing/research and development tax credits, and excess tax benefits from recognized stock compensation. These tax benefits are offset by the tax effect of stock-based compensation expense related to incentive stock options, nondeductible acquisition costs and a provision for state income tax expense.
We frequently analyze our projections of taxable income and make adjustments to our provision for income taxes accordingly.
SEGMENT INFORMATION
For financial reporting purposes, our business has three reporting segments: WSFS Bank, Cash Connect®, and Wealth Management. The WSFS Bank segment provides loans and leases and other financial products to commercial and retailconsumer customers. Cash Connect® provides ATM vault cash, smart safe and other cash logistics services in the U.S through strategic partnerships with several of the largest networks, manufacturers and service providers in the ATM industry. Cash Connect® services non-bank and WSFS-branded ATMs and retailsmart safes nationwide. The Wealth Management segment provides a broad array of planning and advisory services, investment management, trust services, and credit and deposit products to individual, corporate and institutional clients.
WSFS Bank Segment
The WSFS Bank segment income before taxes increased $181.1$38.9 million, or 160%18%, in 20212023 compared to 2020 due2022 primarily to a $263.2 million decrease in the provision for credit losses due to positive impactsan $80.0 million increase in our economic outlook from our ACL modelingnet external customer interest income due to the rising interest rate environment and improved credit quality metrics reflecting overall declines in problem assets and delinquencies, offset by new loan originations. Thea decrease in the provision for credit losses was partially offset by an increase in external operating expenses of $17.5$40.3 million, primarily driven by lower corporate development and restructuring costs, or 6%9%, to support franchise growth, a decreasepartially offset by increases in external netinter-segment interest incomeexpense of $33.3$52.2 million or 7%, and a decreaseprovision for credit losses of $31.3 million, or 28%, in external noninterest income primarily due to a decrease in the realized/unrealized gains on equity investments including the gain on Visa Class B shares previously mentioned, and a decline in our mortgage business from the prior year.$39.6 million.
Cash Connect® Segment
The Cash Connect® segment income before taxes increaseddecreased to $10.2$4.2 million in 20212023 from $9.2$7.3 million in 2020.2022. During 2021,2023, the Cash Connect® segment focused on expanding smart safe and ATM managed services to increase fee income while optimizing funding source composition and margins. This focus on improving margin and growing on balance sheet remote cash capture volume resultedoperational efficiency in the rapidly rising interest rate environment. The interest rate environment materially increased vault operating expenses, resulting in a full-year 20212023 ROA for the Cash Connect® segment of 1.68%0.80%, a decrease of 29 bps21bps in comparison with full-year 2020.2022. Cash Connect® had $1.7 billion and $1.6$1.9 billion in total cash managed at December 31, 20212023 and 2020, respectively.$1.7 billion at December 31, 2022. At year-end 2021,2023, Cash Connect® serviced approximately 27,40033,000 non-bank ATMs compared to approximately 26,300 at year-end 2022 as a result of a large industry participant exiting their ATM cash vault business and approximately 6,300 retail8,700 smart safes nationwide compared to approximately 27,900 non-bank ATMs and approximately 4,5007,500 smart safes at year-end 2020.2022.

Wealth Management Segment
The Wealth Management segment income before taxes increased $30.7$28.9 million in 20212023 compared to 2020, reflecting significant2022, primarily attributable to growth in our institutional trust activity and activity. At December 31, 2023, Wealth Management had AUA/AUM growthof $84.3 billion, a 31% increase from equity market performance, and $13.3 million of the overall $15.0 million recovery of legal settlement related to Charter Oak.2022 balances. WSFS Institutional Services®Services® ended 20212023 as the securitization industry's fourth most active trustee by number of deals for U.S. ABS and MBS according to Asset-Backed Alert’s ABS Database, an improvement from sixth most active in the prior year.
Segment financial information for the years ended December 31, 2021, 20202023, 2022 and 20192021 is provided in Note 21 to the Consolidated Financial Statements.
ASSET/LIABILITY MANAGEMENT
Our primary asset/liability management goal is to optimize long term net interest income opportunities within the constraints of managing interest rate risk, ensuring adequate liquidity and funding and maintaining a strong capital base.
In general, interest rate risk is mitigated by closely matching the maturities or repricing periods of interest-sensitive assets and liabilities to ensure a favorable interest rate spread. We regularly review our interest-rate sensitivity, and use a variety of strategies as needed to adjust that sensitivity within acceptable tolerance ranges established by management and our Board of Directors. Changing the relative proportions of fixed-rate and adjustable-rate assets and liabilities is one of our primary strategies to accomplish this objective.
The matching of assets and liabilities may be analyzed using a number of methods including by examining the extent to which such assets and liabilities are “interest-rate sensitive” and by monitoring our interest-sensitivity gap. An interest-sensitivity gap is considered positive when the amount of interest-rate sensitive assets exceeds the amount of interest-rate sensitive liabilities repricing within a defined period, and is considered negative when the amount of interest-rate sensitive liabilities exceeds the amount of interest-rate sensitive assets repricing within a defined period. For additional information related to interest rate sensitivity, see "Quantitative and Qualitative Disclosures About Market Risk."
The repricing and maturities of our interest-rate sensitive assets and interest-rate sensitive liabilities at December 31, 20212023 are shown in the following table:
| | (Dollars in thousands) | (Dollars in thousands) | | Less than One Year | | One to Five Years | | Five to Fifteen Years | | Over Fifteen Years | | Total | (Dollars in thousands) | | Less than One Year | | One to Five Years | | Five to Fifteen Years | | Over Fifteen Years | | Total |
| Interest-rate sensitive assets: | Interest-rate sensitive assets: | | | | | | | | | | |
| Loans: | |
Commercial loans and leases(2) | | $ | 2,965,358 | | | $ | 1,098,580 | | | $ | 281,560 | | | $ | 11,259 | | | $ | 4,356,757 | |
Commercial mortgage loans(2) | | 1,173,254 | | | 557,367 | | | 159,057 | | | 7,051 | | | 1,896,729 | |
Residential(1)(2) | | 182,103 | | | 265,950 | | | 111,403 | | | 7,681 | | | 567,137 | |
Consumer(2) | | 575,263 | | | 369,970 | | | 199,607 | | | 4,395 | | | 1,149,235 | |
Loans held for sale(2) | | 134,609 | | | 1,364 | | | 1,628 | | | 109 | | | 137,710 | |
Loans(1): | |
Loans(1): | |
Loans(1): | |
| Commercial loans and leases | |
| Commercial loans and leases | |
| Commercial loans and leases | |
| Commercial mortgage loans | |
Residential(2) | |
| Consumer | |
| Loans held for sale | |
| Investment securities, available-for-sale | Investment securities, available-for-sale | | 1,734,964 | | | 2,742,747 | | | 1,681,258 | | | 52,508 | | | 6,211,477 | |
| Investment securities, held-to-maturity | Investment securities, held-to-maturity | | 17,267 | | | 66,800 | | | 6,579 | | | — | | | 90,646 | |
| Other interest-earning assets | |
| Total interest-rate sensitive assets: | Total interest-rate sensitive assets: | | $ | 6,782,818 | | | $ | 5,102,778 | | | $ | 2,441,092 | | | $ | 83,003 | | | $ | 14,409,691 | |
| Interest-rate sensitive liabilities: | Interest-rate sensitive liabilities: | | | | | | | | | | |
| Interest-bearing deposits: | Interest-bearing deposits: | |
| Interest-bearing deposits: | |
| Interest-bearing deposits: | |
| Interest-bearing demand | |
| Interest-bearing demand | |
| Interest-bearing demand | Interest-bearing demand | | $ | 1,396,639 | | | $ | — | | | $ | — | | | $ | — | | | $ | 1,396,639 | |
| Savings | Savings | | 1,129,268 | | | — | | | — | | | — | | | 1,129,268 | |
| Money market | Money market | | 2,285,014 | | | — | | | — | | | — | | | 2,285,014 | |
| Customer time deposits | Customer time deposits | | 717,678 | | | 269,525 | | | 732 | | | — | | | 987,935 | |
| | Trust preferred borrowings | Trust preferred borrowings | | 67,011 | | | — | | | — | | | — | | | 67,011 | |
| Senior debt | | — | | | 147,939 | | | — | | | — | | | 147,939 | |
| Trust preferred borrowings | |
| Trust preferred borrowings | |
| Senior and subordinated debt | |
| Other borrowed funds | Other borrowed funds | | 37,860 | | | — | | | — | | | — | | | 37,860 | |
| Total interest-rate sensitive liabilities: | Total interest-rate sensitive liabilities: | | $ | 5,633,470 | | | $ | 417,464 | | | $ | 732 | | | $ | — | | | $ | 6,051,666 | |
| | Excess of interest-rate sensitive assets over interest-rate liabilities (interest-rate sensitive gap) | | $ | 1,149,348 | | | $ | 4,685,314 | | | $ | 2,440,360 | | | $ | 83,003 | | | $ | 8,358,025 | |
| (Shortfall) excess of interest-rate sensitive assets over interest-rate liabilities (interest-rate sensitive gap) | |
| (Shortfall) excess of interest-rate sensitive assets over interest-rate liabilities (interest-rate sensitive gap) | |
| (Shortfall) excess of interest-rate sensitive assets over interest-rate liabilities (interest-rate sensitive gap) | |
| One-year interest-rate sensitive assets/interest-rate sensitive liabilities | One-year interest-rate sensitive assets/interest-rate sensitive liabilities | | 120.40 | % | | | | | | | | |
| One-year interest-rate sensitive gap as a percent of total assets | One-year interest-rate sensitive gap as a percent of total assets | | 7.28 | % | |
| One-year interest-rate sensitive gap as a percent of total assets | |
| One-year interest-rate sensitive gap as a percent of total assets | |
(1)Includes reverse mortgage loans
(2)Loan balances exclude nonaccruing loans, deferred fees and costs
(2)Includes reverse mortgage loans
Generally, during a period of rising interest rates, a positive gap would result in an increase in net interest income while a negative gap would adversely affect net interest income. Conversely, during a period of falling rates, a positive gap would result in a decrease in net interest income while a negative gap would augment net interest income. However, the interest-sensitivity table does not provide a comprehensive representation of the impact of interest rate changes on net interest income. Each category of assets or liabilities will not be affected equally or simultaneously by changes in the general level of interest rates. Even assets and liabilities which contractually reprice within the rate period may not reprice at the same price, at the same time or with the same frequency. It is also important to consider that the table represents a specific point in time. Variations can occur as we adjust our interest sensitivity position throughout the year.
To provide a more accurate position of our one-year gap, certain deposit classifications are based on the interest-rate sensitive attributes and not on the contractual repricing characteristics of these deposits. For the purpose of this analysis, we estimate, based on historical trends of our deposit accounts, with the exception of certain deposits estimated at 100%, that the majority of our money market deposits are 75%, and the majority of our savings and interest-bearing demand deposits are 50% sensitive to interest rate changes. Accordingly, these interest-sensitive portions are classified in the “Less than One Year” category with the remainder in the “Over Five Years” category. Deposit rates other than time deposit rates are variable. Changes in deposit rates are generally subject to local market conditions and our discretion and are not indexed to any particular rate.
Impact of Inflation
Our Consolidated Financial Statements have been prepared in accordance with GAAP, which require the measurement of financial position and operating results in terms of historical dollars without consideration of the changes in the relative purchasing power of money over time due to inflation. The impact of inflation is reflected in the increased costs of our operations. Unlike most industrial companies, nearly all of our assets and liabilities are monetary. As a result, interest rates have a greater impact on our performance than do the effects of general levels of inflation. Interest rates do not necessarily move in the same direction or the same extent as the price of goods and services.
OFF BALANCE SHEET ARRANGEMENTS
We have no off balance sheet arrangements that have or are reasonably likely to have a material current or future effect on our financial condition, changes in financial condition, revenues or expenses, results of operations, liquidity, capital expenditures or capital resources. For a description of certain financial instruments to which we are party and which expose us to certain credit risk not recognized in our financial statements, see Note 17 to the Consolidated Financial Statements.
CRITICAL ACCOUNTING ESTIMATES
The discussion and analyses of the financial condition and results of operations are based on the Consolidated Financial Statements, which are prepared in conformity with U.S. GAAP and general practices within the banking industry. The significant accounting policies of the Company are described in Note 2 to the Consolidated Financial Statements. The preparation of these Consolidated Financial Statements requires us to make estimates and assumptions that may materially affect the reported amounts of assets, liabilities, revenues and expenses. We regularly evaluate these estimates and assumptions including those related to the allowance for credit losses, business combinations, deferred taxes, fair value measurements and goodwill and other intangible assets. We base our estimates on historical experience and various other factors and assumptions that are believed to be reasonable under the circumstances. These form the basis for making judgments on the carrying value of certain assets and liabilities that are not readily apparent from other sources. Actual results may differ from these estimates. The following critical accounting policy involves more significant judgments and estimates. We have reviewed this critical accounting policy and estimates with the Audit Committee.
Allowance for Credit Losses
We maintain an allowance for credit losses (ACL) which represents our best estimate of expected losses in our financial assets, which include loans, leases and held-to-maturity debt securities. We establish our allowance in accordance with guidance provided in ASC 326, Financial Instruments – Credit Losses. The ACL includes two primary components: (i) an allowance established on financial assets which share similar risk characteristics collectively evaluated for credit losses (collective basis), and (ii) an allowance established on financial assets which do not share similar risk characteristics with any loan segment and is individually evaluated for credit losses (individual basis). We consider the determination of the allowance for credit lossesACL to be critical because it requires significant judgment reflecting our best estimate of expected credit losses based on our historical loss experience, current conditions and economic forecasts. Our evaluation is based upon a continuous review of our financial assets, with consideration given to evaluations resulting from examinations performed by regulatory authorities. See Note 7 to the Consolidated Financial Statements, for further discussion of the ACL.
The calculation of expected credit losses is determined using a single scenario third-party economic forecast to adjust the calculated historical loss rates of the portfolio segments to incorporate the effects of current and future economic conditions. The determination of the appropriate level of the ACL inherently involves a high degree of subjectivity and requires us to make significant estimates, including modeling methodology, historical loss experience, relevant available information from internal and external sources relating to qualitative adjustment factors, prepayment speeds and reasonable and supportable forecasts about future economic conditions. The Company's economic forecast considers the general health of the economy, the interest rate environment, real estate pricing and market riskrisk.
The ACL may increase or decrease due to changes in economic conditions affecting borrowers and macroeconomic variables that our financial assets are more susceptible to, including unforeseen events such as natural disasters and pandemics, new information regarding existing financial assets, identification of additional problems assets, the fair value of underlying collateral, and other factors. These changes, both within and outside the Control’sCompany’s control, may frequently update and have a material impact to our financial results.
Because current economic conditions and forecasts can change and future events are inherently difficult to predict, the anticipated amount of estimated credit losses on our financial assets, and therefore the appropriateness of the ACL, could change significantly. It is difficult to estimate how potential changes in any one economic factor or input might affect the overall ACL because a wide variety of factors and inputs are considered in these estimates and changes in those factors and inputs considered may not occur at the same rate and may not be consistent across the Company’s portfolio mix and segmentation. Additionally, changes in factors and inputs may be directionally inconsistent, such that improvement in one factor may offset deterioration in others. As of December 31, 2021,2023, the Company believes that its ACL was adequate.
For information on Recent Accounting Pronouncements see Note 2 to the Consolidated Financial Statements.
ITEM 7A. QUANTITATIVE AND QUALITATIVE DISCLOSURES ABOUT MARKET RISK
Our primary objective in managing interest rate risk is to minimize the adverse impact of changes in interest rates on net interest income and capital, while maximizing the yield/cost spread on our asset/liability structure. Interest rates are partly a function of decisions by the Federal Open Market Committee (FOMC) on the target range for the federal funds rate, and these decisions are sometimes difficult to anticipate. In response to the economic and financial effects of COVID-19, the FOMC reduced interest rates through 2020 and 2021 and instituted quantitative easing measures as well as domestic and global capital market support programs althoughprograms. The FOMC raised the FOMC has suggested that it may take steps to raise interest rates in 2022.federal funds target rate a total of 525 basis points between 2022 and 2023. In order to manage the risks associated with changes or possible changes in interest rates, we rely primarily on our asset/liability structure.
The matching of maturities or repricing periods of interest rate-sensitive assets and liabilities to promote a favorable interest rate spread and mitigate exposure to fluctuations in interest rates is our primary tool for achieving our asset/liability management strategies. We regularly review our interest rate sensitivity and adjust the sensitivity within acceptable tolerance ranges. At December 31, 2021 interest-earning assets exceeded2023 interest-bearing liabilities that mature or reprice within one year exceeded interest-earning assets (interest-sensitive gap) by $1.1 billion.$29.4 million. Our interest-sensitive assets as a percentage of interest-sensitive liabilities within the one-year window was 120.40%99.67% at December 31, 20212023 compared with 133.10%116.93% at December 31, 2020.2022. In addition, the one-year interest-sensitive gap as a percentage of total assets was 7.28%(0.14)% at December 31, 20212023 compared to 13.07%6.29% at December 31, 2020.2022.
Market risk is the risk of loss from adverse changes in market prices and rates. Our market risk arises primarily from interest rate risk inherent in our lending, investing, and funding activities. To that end, we actively monitor and manage our interest rate risk exposure. One measure, which we are required to perform by federal regulation, measures the impact of an immediate change in interest rates in 100 basis point increments on the economic value of equity ratio. The economic value of the equity ratio is defined as the economic value of the estimated cash flows from assets and liabilities as a percentage of economic value of cash flows from total assets.
The following table shows the estimated impact of immediate changes in interest rates on our net interest margin and economic value of equity at the specified levels at December 31, 20212023 and December 31, 2020.2022.
| | Change in Interest Rate (Basis Points) | Change in Interest Rate (Basis Points) | December 31, 2021 | | December 31, 2020 | Change in Interest Rate (Basis Points) | December 31, 2023 | | December 31, 2022 |
% Change in Net Interest Margin (1) | | Economic Value of Equity (2) | | % Change in Net Interest Margin (1) | | Economic Value of Equity (2) | % Change in Net Interest Margin (1) | | Economic Value of Equity (2) | | % Change in Net Interest Margin (1) | | Economic Value of Equity (2) |
| 300 | 300 | 25.1% | | 24.27% | | 19.7% | | 19.10% | 300 | 15.7% | | 22.44% | | 18.5% | | 27.54% |
| 200 | 200 | 16.6% | | 23.07% | | 13.1% | | 18.69% | 200 | 10.4% | | 21.46% | | 12.3% | | 26.44% |
| 100 | 100 | 8.2% | | 21.76% | | 6.5% | | 18.05% | 100 | 5.2% | | 20.41% | | 6.1% | | 25.22% |
| 50 | 50 | 4.1% | | 20.33% | | 3.2% | | 17.59% | 50 | 2.6% | | 19.85% | | 3.1% | | 24.56% |
| 25 | 25 | 2.0% | | 20.05% | | 1.5% | | 17.32% | 25 | 1.3% | | 19.56% | | 1.5% | | 24.22% |
| — | — | —% | | 19.73% | | —% | | 17.04% | — | —% | | 19.26% | | —% | | 23.87% |
| (25) | (25) | (1.4)% | | 19.28% | | (1.5)% | | 16.62% | (25) | (1.3)% | | 18.96% | | (1.6)% | | 23.50% |
| (50) | (50) | (2.2)% | | 18.72% | | (2.1)% | | 16.20% | (50) | (2.6)% | | 18.64% | | (3.3)% | | 23.10% |
| (100) | (100) | (3.8)% | | 17.36% | | (2.8)% | | 15.16% | (100) | (4.9)% | | 18.00% | | (6.8)% | | 22.20% |
(200) (3) | NMF | | NMF | | NMF | | NMF |
(300) (3) | NMF | | NMF | | NMF | | NMF |
| (200) | | (200) | (9.6)% | | 16.50% | | (14.0)% | | 20.20% |
| (300) | | (300) | (14.2)% | | 14.80% | | (21.2)% | | 17.90% |
(1)The percentage difference between net interest income in a stable interest rate environment and net interest margin as projected under the various rate change environments.
(2)The economic value of equity ratio in a stable interest rate environment and the economic value of equity projected under the various rate change environments.
(3)Sensitivity indicated by a decrease of 200 and 300 basis points is deemed not meaningful (NMF) given the low absolute level of interest rates at that time.
We also engage in other business activities that are sensitive to changes in interest rates. For example, mortgage banking revenues and expenses can fluctuate with changing interest rates. These fluctuations are difficult to model and estimate.
ITEM 8. FINANCIAL STATEMENTS AND SUPPLEMENTARY DATA
The following audited Consolidated Financial Statements and related documents are set forth in this Annual Report on Form 10-K on the following pages:
Report of Independent Registered Public Accounting Firm
To the Stockholders and Board of Directors
WSFS Financial Corporation:
Opinion on the Consolidated Financial Statements
We have audited the accompanying consolidated statements of financial condition of WSFS Financial Corporation and subsidiaries (the Company) as of December 31, 20212023 and 2020,2022, the related consolidated statements of income, comprehensive income (loss), changes in stockholders’ equity, and cash flows for each of the years in the three-year period ended December 31, 2021,2023, and the related notes (collectively, the consolidated financial statements). In our opinion, the consolidated financial statements present fairly, in all material respects, the financial position of the Company as of December 31, 20212023 and 2020,2022, and the results of its operations and its cash flows for each of the years in the three-year period ended December 31, 2021,2023, in conformity with U.S. generally accepted accounting principles.
We also have audited, in accordance with the standards of the Public Company Accounting Oversight Board (United States) (PCAOB), the Company’s internal control over financial reporting as of December 31, 2021,2023, based on criteria established in Internal Control -– Integrated Framework (2013) issued by the Committee of Sponsoring Organizations of the Treadway Commission, and our report dated March 1, 2022February 29, 2024 expressed an unqualified opinion on the effectiveness of the Company’s internal control over financial reporting.
Change in Accounting Principle
As discussed in Note 2 to the consolidated financial statements, the Company has changed its method of accounting for the recognition and measurement of credit losses as of January 1, 2020 due to the adoption of ASC 326, Financial Instruments - Credit Losses.
Basis for Opinion
These consolidated financial statements are the responsibility of the Company’s management. Our responsibility is to express an opinion on these consolidated financial statements based on our audits. We are a public accounting firm registered with the PCAOB and are required to be independent with respect to the Company in accordance with the U.S. federal securities laws and the applicable rules and regulations of the Securities and Exchange Commission and the PCAOB.
We conducted our audits in accordance with the standards of the PCAOB. Those standards require that we plan and perform the audit to obtain reasonable assurance about whether the consolidated financial statements are free of material misstatement, whether due to error or fraud. Our audits included performing procedures to assess the risks of material misstatement of the consolidated financial statements, whether due to error or fraud, and performing procedures that respond to those risks. Such procedures included examining, on a test basis, evidence regarding the amounts and disclosures in the consolidated financial statements. Our audits also included evaluating the accounting principles used and significant estimates made by management, as well as evaluating the overall presentation of the consolidated financial statements. We believe that our audits provide a reasonable basis for our opinion.
Critical Audit Matter
The critical audit matter communicated below is a matter arising from the current period audit of the consolidated financial statements that was communicated or required to be communicated to the audit committee and that: (1) relates to accounts or disclosures that are material to the consolidated financial statements and (2) involved our especially challenging, subjective, or complex judgments. The communication of a critical audit matter does not alter in any way our opinion on the consolidated financial statements, taken as a whole, and we are not, by communicating the critical audit matter below, providing a separate opinion on the critical audit matter or on the accounts or disclosures to which it relates.
Assessment of the Allowance for Credit Losses for Loans and Leases Evaluated on a Collective Basis
As discussed in NoteFootnotes 2 and 7 to the consolidated financial statements, the Company’s total allowance for credit losses as of December 31, 20212023 was $94.5$186.1 million, of which $94.5$184.5 million related to the allowance for credit losses on loans and leases evaluated on a collective basis (the collective ACL). The collective ACL includes the measure of expected credit losses on a collective (pooled) basis for those loans and leases that share similar risk characteristics. For the commercial portfolio, the Company uses a base loss rate methodology which applies a probability of default (PD) and loss given default (LGD) which are calculated based on the historical rate of migration. The historical rate of migration is based on the historical rate of credit loss measured during a look-back period (LBP). The historical rate of credit loss is determined based on internally assessed risk ratings and loan segments and then adjusted for the economic forecast scenario and macroeconomic assumptions over reasonable and supportable forecast periods. For the retail portfolio,and leasing portfolios, the Company uses a base loss rate methodology which calculates historical loss rates based on average net loss rates over the LBP that incorporates the economic forecast assigned to that loan. After the reasonable and supportable forecast periods, the Company reverts on a straight-line basis over the reversion period to its historical loss rates, evaluated over the LBP, for the remaining life of both commercial and retail loans and leases. The LBP, reasonable and supportable forecast, and reversion period are established for each portfolio segment. The Company estimates the exposure at default using a method which projects prepayments over the life of the loans and leases. In order to capture the unique risks of the loan and lease portfolio within the PD, LGD and average net loss rates, the Company segments the portfolio into pools, considering similar risk characteristics. A portion of the collective ACL is comprised of adjustments to historical loss information for various internal and external conditions. These adjustments are based on qualitative factors not reflected in the quantitative model but are likely to impact the measurement of estimated credit losses.
We identified the assessment of the December 31, 20212023 collective ACL as a critical audit matter. A high degree of audit effort, including specialized skills and knowledge, and subjective and complex auditor judgment was involved in the assessment. Specifically, the assessment encompassed the evaluation of the collective ACL methodology, including the methods and quantitative model used to estimate (1) the PD, LGD and average net loss rates and their significant assumptions, including portfolio segmentation, the economic forecast scenario and macroeconomic assumptions, the reasonable and supportable forecast periods, the LBP for both the commercial and retail portfolio, and credit risk ratings for commercial loans, and (2) the qualitative factors. The assessment also included an evaluation of the conceptual soundness and performance of the quantitative model. In addition, auditor judgment was required to evaluate the sufficiency of audit evidence obtained.
The following are the primary procedures we performed to address this critical audit matter. We evaluated the design and tested the operating effectiveness of certain internal controls related to the Company’s measurement of the collective ACL estimates, including controls over the:
•development of the collective ACL methodology
•continued use and appropriateness of changes made to the quantitative model
•identification and determination of the significant assumptions used in the quantitative model
•developmentapplication of certain qualitative factors
•analysis of the collective ACL results, trends, and ratios.
We evaluated the Company’s process to develop the collective ACL estimates by testing certain sources of data, factors, and assumptions that the Company used, and considered the relevance and reliability of such data, factors, and assumptions. In addition, we involved credit risk professionals with specialized skills and knowledge, who assisted in:
•evaluating the Company’s collective ACL methodology for compliance with U.S. generally accepted accounting principles
•evaluating judgments made by the Company relative to the assessment and performance testing of the quantitative model used
•assessing the conceptual soundness and performance of the quantitative model used by inspecting the model documentation to determine whether the model is suitable for its intended use
•evaluating the selection of economic forecast scenario by comparing it to the Company’s business environment and relevant industry practices
•evaluating the length of the historical observation period and reasonable and supportable forecast periods by comparing to specific portfolio risk characteristics and trends
•determining whether the loan portfolio is segmented by similar risk characteristics by comparing to the Company’s business environment and relevant industry practices
•testing individual credit risk ratings for a selection of commercial loans by evaluating the financial performance of the borrower, sources of repayment, and any relevant guarantees or underlying collateral
•evaluating the effect of certain qualitative factors on the collective ACL compared with relevant credit risk factors and consistency with credit trends and identified limitations of the underlying quantitative model.
We also assessed the sufficiency of the audit evidence obtained related to the December 31, 20212023 collective ACL by evaluating:
•cumulative results of the audit procedures
•qualitative aspects of the Company’s accounting practices
•potential bias in the account estimatesestimates.
| | | | | | | | | | | | | | |
| /s/ KPMG LLP |
|
| We have served as the Company's auditor since 1994. |
| | | | |
| Philadelphia, Pennsylvania | | |
March 1, 2022February 29, 2024 | | |
CONSOLIDATED STATEMENTS OF INCOME | | Year Ended December 31, | |
| | Year Ended December 31, | |
| | Year Ended December 31, | |
| | Year Ended December 31, | |
| (Dollars in thousands, except per share data) | |
| (Dollars in thousands, except per share data) | |
| (Dollars in thousands, except per share data) | (Dollars in thousands, except per share data) | | 2021 | | 2020 | | 2019 | |
| Interest income: | Interest income: | | | | | | | |
| Interest income: | |
| Interest income: | |
| Interest and fees on loans and leases | |
| Interest and fees on loans and leases | |
| Interest and fees on loans and leases | Interest and fees on loans and leases | | $ | 393,248 | | | $ | 460,394 | | | $ | 463,220 | | |
| Interest on mortgage-backed securities | Interest on mortgage-backed securities | | 55,802 | | | 48,377 | | | 48,954 | | |
| Interest on mortgage-backed securities | |
| Interest on mortgage-backed securities | |
| Interest and dividends on investment securities: | |
| Interest and dividends on investment securities: | |
| Interest and dividends on investment securities: | Interest and dividends on investment securities: | | |
| Taxable | Taxable | | 2,805 | | | 1,191 | | | 131 | | |
| Taxable | |
| Taxable | |
| Tax-exempt | |
| Tax-exempt | |
| Tax-exempt | Tax-exempt | | 2,719 | | | 3,428 | | | 3,884 | | |
| Other interest income | Other interest income | | 1,795 | | | 1,015 | | | 4,903 | | |
| 456,369 | | | 514,405 | | | 521,092 | | |
| Other interest income | |
| Other interest income | |
| | 976,522 | |
| | 976,522 | |
| | 976,522 | |
| Interest expense: | |
| Interest expense: | |
| Interest expense: | Interest expense: | | | | | | | |
| Interest on deposits | Interest on deposits | | 14,923 | | | 39,262 | | | 60,075 | | |
| Interest on deposits | |
| Interest on deposits | |
| Interest on Federal Home Loan Bank advances | Interest on Federal Home Loan Bank advances | | 5 | | | 1,950 | | | 5,520 | | |
| Interest on senior debt | | 6,497 | | | 4,998 | | | 4,717 | | |
| Interest on Federal Home Loan Bank advances | |
| Interest on Federal Home Loan Bank advances | |
| Interest on senior and subordinated debt | |
| Interest on senior and subordinated debt | |
| Interest on senior and subordinated debt | |
| Interest on trust preferred borrowings | |
| Interest on trust preferred borrowings | |
| Interest on trust preferred borrowings | Interest on trust preferred borrowings | | 1,274 | | | 1,751 | | | 2,772 | | |
| Interest on federal funds purchased | Interest on federal funds purchased | | — | | | 471 | | | 2,971 | | |
| Interest on federal funds purchased | |
| Interest on federal funds purchased | |
| Interest on other borrowings | Interest on other borrowings | | 21 | | | 18 | | | 89 | | |
| 22,720 | | | 48,450 | | | 76,144 | | |
| Interest on other borrowings | |
| Interest on other borrowings | |
| | 251,419 | |
| | 251,419 | |
| | 251,419 | |
| Net interest income | Net interest income | | 433,649 | | | 465,955 | | | 444,948 | | |
| (Recovery of) provision for credit losses | | (117,087) | | | 153,180 | | | 25,560 | | |
| Net interest income after provision for credit losses | | 550,736 | | | 312,775 | | | 419,388 | | |
| Net interest income | |
| Net interest income | |
| Provision for (recovery of) credit losses | |
| Provision for (recovery of) credit losses | |
| Provision for (recovery of) credit losses | |
| Net interest income after provision for (recovery of) credit losses | |
| Net interest income after provision for (recovery of) credit losses | |
| Net interest income after provision for (recovery of) credit losses | |
| Noninterest income: | |
| Noninterest income: | |
| Noninterest income: | Noninterest income: | | | | | | | |
| Credit/debit card and ATM income | Credit/debit card and ATM income | | 29,479 | | | 35,014 | | | 50,383 | | |
| Credit/debit card and ATM income | |
| Credit/debit card and ATM income | |
| Investment management and fiduciary revenue | |
| Investment management and fiduciary revenue | |
| Investment management and fiduciary revenue | Investment management and fiduciary revenue | | 62,348 | | | 48,979 | | | 42,450 | | |
| Deposit service charges | Deposit service charges | | 22,090 | | | 19,999 | | | 22,972 | | |
| Deposit service charges | |
| Deposit service charges | |
| Mortgage banking activities, net | |
| Mortgage banking activities, net | |
| Mortgage banking activities, net | Mortgage banking activities, net | | 23,216 | | | 30,201 | | | 11,053 | | |
| Loan and lease fee income | Loan and lease fee income | | 7,533 | | | 4,518 | | | 3,577 | | |
| Loan and lease fee income | |
| Loan and lease fee income | |
| Security gains, net | |
| Security gains, net | |
| Security gains, net | Security gains, net | | 331 | | | 9,076 | | | 333 | | |
| Unrealized gains on equity investments, net | Unrealized gains on equity investments, net | | 5,141 | | | 761 | | | 26,175 | | |
| Realized (loss) gain on sale of equity investment, net | | (706) | | | 22,052 | | | — | | |
| Unrealized gains on equity investments, net | |
| Unrealized gains on equity investments, net | |
| Realized gain (loss) on sale of equity investment, net | |
| Realized gain (loss) on sale of equity investment, net | |
| Realized gain (loss) on sale of equity investment, net | |
| Bank owned life insurance income | |
| Bank owned life insurance income | |
| Bank owned life insurance income | Bank owned life insurance income | | 1,251 | | | 1,280 | | | 1,247 | | |
| Other income | Other income | | 34,797 | | | 29,145 | | | 29,919 | | |
| 185,480 | | | 201,025 | | | 188,109 | | |
| Other income | |
| Other income | |
| | 289,871 | |
| | 289,871 | |
| | 289,871 | |
| Noninterest expense: | |
| Noninterest expense: | |
| Noninterest expense: | Noninterest expense: | | | | | | | |
| Salaries, benefits and other compensation | Salaries, benefits and other compensation | | 214,167 | | | 194,317 | | | 182,564 | | |
| Salaries, benefits and other compensation | |
| Salaries, benefits and other compensation | |
| Occupancy expense | |
| Occupancy expense | |
| Occupancy expense | Occupancy expense | | 32,802 | | | 32,105 | | | 33,068 | | |
| Equipment expense | Equipment expense | | 29,040 | | | 23,793 | | | 20,879 | | |
| Equipment expense | |
| Equipment expense | |
| Professional fees | |
| Professional fees | |
| Professional fees | Professional fees | | 15,614 | | | 18,757 | | | 11,167 | | |
| Data processing and operations expenses | Data processing and operations expenses | | 14,074 | | | 12,600 | | | 13,373 | | |
| Data processing and operations expenses | |
| Data processing and operations expenses | |
| Marketing expense | |
| Marketing expense | |
| Marketing expense | Marketing expense | | 5,413 | | | 5,677 | | | 6,714 | | |
| FDIC expenses | FDIC expenses | | 4,081 | | | 2,148 | | | 1,483 | | |
| FDIC expenses | |
| FDIC expenses | |
| Loan workout and other credit costs | |
| Loan workout and other credit costs | |
| Loan workout and other credit costs | Loan workout and other credit costs | | 663 | | | 6,899 | | | 3,616 | | |
| Corporate development expense | Corporate development expense | | 11,676 | | | 4,328 | | | 55,697 | | |
| Corporate development expense | |
| Corporate development expense | |
| Restructuring expense | |
| Restructuring expense | |
| Restructuring expense | Restructuring expense | | 1,346 | | | 510 | | | 16,133 | | |
| Recovery of legal settlement | Recovery of legal settlement | | (15,000) | | | — | | | — | | |
| Recovery of fraud loss | | — | | | — | | | (463) | | |
| Recovery of legal settlement | |
| Recovery of legal settlement | |
| | Loss on early extinguishment of debt | |
| | Loss on early extinguishment of debt | |
| | Loss on early extinguishment of debt | Loss on early extinguishment of debt | | 1,087 | | | 2,280 | | | — | | |
| Other operating expense | Other operating expense | | 63,553 | | | 65,430 | | | 68,896 | | |
| 378,516 | | | 368,844 | | | 413,127 | | |
| Other operating expense | |
| Other operating expense | |
| | 561,633 | |
| | 561,633 | |
| | 561,633 | |
| Income before taxes | |
| Income before taxes | |
| Income before taxes | Income before taxes | | 357,700 | | | 144,956 | | | 194,370 | | |
| Income tax provision | Income tax provision | | 86,095 | | | 31,636 | | | 46,452 | | |
| Income tax provision | |
| Income tax provision | |
| Net income | Net income | | $ | 271,605 | | | $ | 113,320 | | | $ | 147,918 | | |
| Less: Net income (loss) attributable to noncontrolling interest | | 163 | | | (1,454) | | | (891) | | |
| Net income | |
| Net income | |
| Less: Net (loss) income attributable to noncontrolling interest | |
| Less: Net (loss) income attributable to noncontrolling interest | |
| Less: Net (loss) income attributable to noncontrolling interest | |
| Net income attributable to WSFS | |
| Net income attributable to WSFS | |
| Net income attributable to WSFS | Net income attributable to WSFS | | $ | 271,442 | | | $ | 114,774 | | | $ | 148,809 | | |
| Basic earnings per share | Basic earnings per share | | $ | 5.71 | | | $ | 2.27 | | | $ | 3.02 | | |
| Basic earnings per share | |
| Basic earnings per share | |
| Diluted earnings per share | Diluted earnings per share | | $ | 5.69 | | | $ | 2.27 | | | $ | 3.00 | | |
| Diluted earnings per share | |
| Diluted earnings per share | |
The accompanying notes are an integral part of these Consolidated Financial Statements
CONSOLIDATED STATEMENTS OF COMPREHENSIVE INCOMEINCOME(LOSS)
| | | | | | | | | | | | | | | | | | | | |
| | Year Ended December 31, |
| (Dollars in thousands) | | 2021 | | 2020 | | 2019 |
| Net income | | $ | 271,605 | | | $ | 113,320 | | | $ | 147,918 | |
| Less: Net gain (loss) attributable to noncontrolling interest | | 163 | | | (1,454) | | | (891) | |
| Net income attributable to WSFS | | $ | 271,442 | | | $ | 114,774 | | | $ | 148,809 | |
| Other comprehensive (loss) income: | | | | | | |
| Net change in unrealized (losses) gains on investment securities available-for-sale | | | | | | |
| Net unrealized (losses) gains arising during the period, net of tax (benefit) expense of $(29,523), $12,585, and $13,179, respectively | | (93,503) | | | 39,853 | | | 41,733 | |
| Less: reclassification adjustment for net gains on sales realized in net income, net of tax expense of $80, $2,178, and $80, respectively | | (252) | | | (6,898) | | | (253) | |
| | (93,755) | | | 32,955 | | | 41,480 | |
| Net change in securities held-to-maturity | | | | | | |
| Amortization of unrealized gain on securities reclassified to held-to-maturity, net of tax expense of $32, $60, and $98, respectively | | (101) | | | (192) | | | (311) | |
| Net change in unfunded pension liability | | | | | | |
| Change in unfunded pension liability related to unrealized gain (loss), prior service cost and transition obligation, net of tax expense (benefit) of $50, $(585), and $(1,439), respectively | | 97 | | | (1,683) | | | (4,151) | |
| Pension settlement, net of tax expense of $—, $67 and $—, respectively | | — | | | 212 | | | — | |
| | 97 | | | (1,471) | | | (4,151) | |
| Net change in cash flow hedge | | | | | | |
| Net unrealized gain arising during the period, net of tax expense of $—, $493, and $593, respectively | | — | | | 1,560 | | | 1,877 | |
Amortization of unrealized gain on terminated cash flow hedges, net of tax benefit of $119, $106 and $—, respectively | | (378) | | | (337) | | | — | |
| | (378) | | | 1,223 | | | 1,877 | |
| Net change in equity method investments | | | | | | |
Net change in other comprehensive loss of equity method investments, net of tax expense (benefit) of $114, $(3), and $—, respectively | | 362 | | | (9) | | | — | |
| Total other comprehensive (loss) income | | (93,775) | | | 32,506 | | | 38,895 | |
| Total comprehensive income | | $ | 177,667 | | | $ | 147,280 | | | $ | 187,704 | |
| | | | | | | | | | | | | | | | | | | | |
| | Year Ended December 31, |
| (Dollars in thousands) | | 2023 | | 2022 | | 2021 |
| Net income | | $ | 269,025 | | | $ | 222,648 | | | $ | 271,605 | |
| Less: Net (loss) gain attributable to noncontrolling interest | | (131) | | | 273 | | | 163 | |
| Net income attributable to WSFS | | $ | 269,156 | | | $ | 222,375 | | | $ | 271,442 | |
| Other comprehensive income (loss): | | | | | | |
| Net change in unrealized gains (losses) on investment securities available-for-sale | | | | | | |
| Net unrealized gains (losses) arising during the period, net of tax expense (benefit) of $20,085, $(167,261), and $(29,523), respectively | | 63,601 | | | (529,660) | | | (93,503) | |
| Less: reclassification adjustment for net gains on sales realized in net income, net of tax expense of $—, $—, and $80, respectively | | — | | | — | | | (252) | |
| | 63,601 | | | (529,660) | | | (93,755) | |
| Net change in securities held-to-maturity | | | | | | |
Net change in unrealized gains (losses) on securities reclassified to held-to-maturity, net of tax (benefit) expense of $(5,361), $34,319, and $32, respectively(1)(2) | | 16,980 | | | (108,678) | | | (101) | |
| Net change in unfunded pension liability | | | | | | |
| Change in unfunded pension liability related to unrealized (loss) gain and prior service cost, net of tax expense (benefit) of $1, $(5), and $50, respectively | | (132) | | | 209 | | | 97 | |
| | | | | | |
| | | | | | |
| Net change in cash flow hedge | | | | | | |
| Net unrealized gain arising during the period, net of tax expense of $504, $—, and $—, respectively | | 1,596 | | | — | | | — | |
Amortization of unrealized gain on terminated cash flow hedges, net of tax benefit of $34, $51 and $119, respectively | | (107) | | | (160) | | | (378) | |
| | 1,489 | | | (160) | | | (378) | |
| Net change in equity method investments | | | | | | |
| Net change in other comprehensive (loss) income of equity method investments, net of tax (benefit) expense of $(27), $67, and $114, respectively | | (85) | | | 213 | | | 362 | |
| Total other comprehensive income (loss) | | 81,853 | | | (638,076) | | | (93,775) | |
| Total comprehensive income (loss) | | $ | 351,009 | | | $ | (415,701) | | | $ | 177,667 | |
The accompanying notes are an integral part of these Consolidated Financial Statements
CONSOLIDATED STATEMENTS OF FINANCIAL CONDITION
| | December 31, |
| | December 31, | | | | December 31, |
| (Dollars in thousands, except per share and share data) | (Dollars in thousands, except per share and share data) | | 2021 | | 2020 | (Dollars in thousands, except per share and share data) | | 2023 | | 2022 |
| Assets: | Assets: | | | | |
| Cash and due from banks | Cash and due from banks | | $ | 1,046,992 | | | $ | 1,244,705 | |
| Cash and due from banks | |
| Cash and due from banks | |
| Cash in non-owned ATMs | Cash in non-owned ATMs | | 480,527 | | | 402,339 | |
| Interest-bearing deposits in other banks including collateral (restricted cash) of $5,050 at December 31, 2021 and $7,390 at December 31, 2020 | | 5,420 | | | 7,691 | |
| Interest-bearing deposits in other banks including collateral (restricted cash) of $4,270 at December 31, 2023 and $4,650 at December 31, 2022 | |
| Total cash, cash equivalents, and restricted cash | Total cash, cash equivalents, and restricted cash | | 1,532,939 | | | 1,654,735 | |
| Investment securities, available for sale (amortized cost of $5,249,882 at December 31, 2021 and $2,450,265 at December 31, 2020) | | 5,205,311 | | | 2,529,057 | |
| Investment securities, held to maturity, net of allowance for credit losses of $4 at December 31, 2021 and $6 at December 31, 2020 (fair value $94,131 at December 31, 2021 and $116,421 at December 31, 2020) | | 90,642 | | | 111,741 | |
| Investment securities, available for sale (amortized cost of $4,504,342 at December 31, 2023 and $4,834,550 at December 31, 2022) | |
| Investment securities, held to maturity, net of allowance for credit losses of $8 at December 31, 2023 and $10 at December 31, 2022 (fair value $985,931 at December 31, 2023 and $1,040,104 at December 31, 2022) | |
| Other investments | Other investments | | 10,518 | | | 9,541 | |
| Loans held for sale at fair value | Loans held for sale at fair value | | 113,349 | | | 197,541 | |
| Loans and leases, net of allowance of $94,507 at December 31, 2021 and $228,804 at December 31, 2020 | | 7,791,482 | | | 8,795,935 | |
| Loans and leases, net of allowance of $186,126 at December 31, 2023 and $151,861 at December 31, 2022 | |
| Bank-owned life insurance | Bank-owned life insurance | | 33,099 | | | 32,051 | |
| Stock in Federal Home Loan Bank of Pittsburgh, at cost | Stock in Federal Home Loan Bank of Pittsburgh, at cost | | 6,073 | | | 5,771 | |
| Other real estate owned | Other real estate owned | | 2,320 | | | 3,061 | |
| Accrued interest receivable | Accrued interest receivable | | 41,596 | | | 44,335 | |
| Premises and equipment | Premises and equipment | | 87,295 | | | 96,556 | |
| Goodwill | Goodwill | | 472,828 | | | 472,828 | |
| Intangible assets | Intangible assets | | 74,403 | | | 84,558 | |
| Other assets | Other assets | | 315,472 | | | 296,204 | |
| Total assets | Total assets | | $ | 15,777,327 | | | $ | 14,333,914 | |
| Liabilities and Stockholders’ Equity | Liabilities and Stockholders’ Equity | | | | |
| Liabilities: | Liabilities: | |
| Liabilities: | |
| Liabilities: | |
| Deposits: | Deposits: | |
| Deposits: | |
| Deposits: | |
| Noninterest-bearing | |
| Noninterest-bearing | |
| Noninterest-bearing | Noninterest-bearing | | $ | 4,565,143 | | | $ | 3,415,021 | |
| Interest-bearing demand | Interest-bearing demand | | 8,674,919 | | | 8,441,643 | |
| Total deposits | Total deposits | | 13,240,062 | | | 11,856,664 | |
| | Federal Home Loan Bank advances | Federal Home Loan Bank advances | | — | | | 6,623 | |
| Federal Home Loan Bank advances | |
| Federal Home Loan Bank advances | |
| Trust preferred borrowings | Trust preferred borrowings | | 67,011 | | | 67,011 | |
| Senior debt | | 147,939 | | | 246,617 | |
| Senior and subordinated debt | |
| Other borrowed funds | Other borrowed funds | | 24,527 | | | 20,390 | |
| Accrued interest payable | Accrued interest payable | | 736 | | | 1,450 | |
| Other liabilities | Other liabilities | | 360,036 | | | 345,679 | |
| Total liabilities | Total liabilities | | 13,840,311 | | | 12,544,434 | |
| Stockholders’ Equity: | Stockholders’ Equity: | | | | |
| Common stock 0.01 par value, shares authorized of 90,000,000; shares issued of 57,695,676 at December 31, 2021 and 57,575,783 at December 31, 2020 | | 577 | | | 576 | |
| Common stock 0.01 par value, shares authorized of 90,000,000; shares issued of 76,095,094 at December 31, 2023 and 75,921,997 at December 31, 2022 | |
| Common stock 0.01 par value, shares authorized of 90,000,000; shares issued of 76,095,094 at December 31, 2023 and 75,921,997 at December 31, 2022 | |
| Common stock 0.01 par value, shares authorized of 90,000,000; shares issued of 76,095,094 at December 31, 2023 and 75,921,997 at December 31, 2022 | |
| Capital in excess of par value | Capital in excess of par value | | 1,058,997 | | | 1,053,022 | |
| Accumulated other comprehensive (loss) income | | (37,768) | | | 56,007 | |
| Accumulated other comprehensive loss | |
| Retained earnings | Retained earnings | | 1,224,614 | | | 977,414 | |
| Treasury stock at cost, 10,086,936 shares at December 31, 2021 and 9,819,627 shares at December 31, 2020 | | (307,321) | | | (295,293) | |
| Treasury stock at cost, 15,557,263 shares at December 31, 2023 and 14,310,085 shares at December 31, 2022 | |
| Total stockholders’ equity of WSFS | Total stockholders’ equity of WSFS | | 1,939,099 | | | 1,791,726 | |
| Noncontrolling interest | Noncontrolling interest | | (2,083) | | | (2,246) | |
| Total stockholders’ equity | Total stockholders’ equity | | 1,937,016 | | | 1,789,480 | |
| Total liabilities and stockholders’ equity | Total liabilities and stockholders’ equity | | $ | 15,777,327 | | | $ | 14,333,914 | |
The accompanying notes are an integral part of these Consolidated Financial Statements
CONSOLIDATED STATEMENTS OF CHANGES IN STOCKHOLDERS’ EQUITY
| | | | | | | | | | | | | | | | | | | | | | | | | | | | | | | | | | | | | | | | | | | | | | | | | | | | | | | | |
| (Dollars in thousands, except per share and share amounts) | | Shares | | Common
Stock | | Capital in
Excess of
Par Value | | Accumulated
Other
Comprehensive
(Loss) Income | | Retained
Earnings | | Treasury
Stock | | Total
Stockholders’
Equity of WSFS | | Non-controlling Interest | | Total Stockholders' Equity |
| Balance, December 31, 2018 | | 56,926,978 | | | $ | 569 | | | $ | 349,810 | | | $ | (15,394) | | | $ | 791,031 | | | $ | (305,096) | | | $ | 820,920 | | | $ | — | | | $ | 820,920 | |
| Net income (loss) | | — | | | — | | | — | | | — | | | 148,809 | | | — | | | 148,809 | | | (891) | | | 147,918 | |
| Other comprehensive income | | — | | | — | | | — | | | 38,895 | | | — | | | — | | | 38,895 | | | — | | | 38,895 | |
| Cash dividend, $0.47 per share | | — | | | — | | | — | | | — | | | (22,463) | | | — | | | (22,463) | | | — | | | (22,463) | |
Issuance of common stock including proceeds from exercise of common stock
options | | 508,680 | | | 6 | | | 7,749 | | | — | | | — | | | — | | | 7,755 | | | — | | | 7,755 | |
| Re-issuance of treasury stock in connection with BNCL merger and related items | | — | | | — | | | 687,897 | | | — | | | — | | | 262,071 | | | 949,968 | | | 76 | | | 950,044 | |
| Stock-based compensation expense | | — | | | — | | | 3,608 | | | — | | | — | | | — | | | 3,608 | | | — | | | 3,608 | |
| Repurchase of common stock, 2,132,390 shares | | — | | | — | | | — | | | — | | | — | | | (97,186) | | | (97,186) | | | — | | | (97,186) | |
| Balance, December 31, 2019 | | 57,435,658 | | | $ | 575 | | | $ | 1,049,064 | | | $ | 23,501 | | | $ | 917,377 | | | $ | (140,211) | | | $ | 1,850,306 | | | $ | (815) | | | $ | 1,849,491 | |
Cumulative change in
accounting principle
(Note 2) | | — | | | — | | | — | | | — | | | (30,368) | | | — | | | (30,368) | | | — | | | (30,368) | |
| Balance, January 1, 2020 (as adjusted for change in accounting principle) | | 57,435,658 | | | 575 | | | 1,049,064 | | | 23,501 | | | 887,009 | | | (140,211) | | | 1,819,938 | | | (815) | | | 1,819,123 | |
| Net income (loss) | | — | | | — | | | — | | | — | | | 114,774 | | | — | | | 114,774 | | | (1,454) | | | 113,320 | |
| Other comprehensive income | | — | | | — | | | — | | | 32,506 | | | — | | | — | | | 32,506 | | | — | | | 32,506 | |
| Cash dividend, $0.48 per share | | — | | | — | | | — | | | — | | | (24,369) | | | — | | | (24,369) | | | — | | | (24,369) | |
| Issuance of common stock including proceeds from exercise of common stock options | | 140,125 | | | 1 | | | 2,031 | | | — | | | — | | | — | | | 2,032 | | | — | | | 2,032 | |
| Contributions from noncontrolling shareholders | | — | | | — | | | — | | | — | | | — | | | — | | | — | | | 23 | | | 23 | |
| Stock-based compensation expense | | — | | | — | | | 2,677 | | | — | | | — | | | — | | | 2,677 | | | — | | | 2,677 | |
Repurchase of common stock (1) | | — | | | — | | | (750) | | | — | | | — | | | (155,082) | | | (155,832) | | | — | | | (155,832) | |
| Balance, December 31, 2020 | | 57,575,783 | | | $ | 576 | | | $ | 1,053,022 | | | $ | 56,007 | | | $ | 977,414 | | | $ | (295,293) | | | $ | 1,791,726 | | | $ | (2,246) | | | $ | 1,789,480 | |
| Net income | | — | | | — | | | — | | | — | | | 271,442 | | | — | | | 271,442 | | | 163 | | | 271,605 | |
| Other comprehensive loss | | — | | | — | | | — | | | (93,775) | | | — | | | — | | | (93,775) | | | — | | | (93,775) | |
| Cash dividend, $0.51 per share | | — | | | — | | | — | | | — | | | (24,242) | | | — | | | (24,242) | | | — | | | (24,242) | |
| Issuance of common stock including proceeds from exercise of common stock options | | 119,893 | | | 1 | | | 1,521 | | | — | | | — | | | — | | | 1,522 | | | — | | | 1,522 | |
| Stock-based compensation expense | | — | | | — | | | 5,694 | | | — | | | — | | | — | | | 5,694 | | | — | | | 5,694 | |
Repurchase of common stock (1) | | — | | | — | | | (1,240) | | | — | | | — | | | (12,028) | | | (13,268) | | | — | | | (13,268) | |
| Balance, December 31, 2021 | | 57,695,676 | | | $ | 577 | | | $ | 1,058,997 | | | $ | (37,768) | | | $ | 1,224,614 | | | $ | (307,321) | | | $ | 1,939,099 | | | $ | (2,083) | | | $ | 1,937,016 | |
(1)Repurchase of common stock for the years ended December 31, 2021 and 2020 included 267,309 and 3,950,855 shares repurchased, respectively, in connection with the Company's share buyback program approved by the Board of Directors, and 31,188 and 24,910 shares withheld, respectively, to cover tax liabilities.
The accompanying notes are an integral part of these Consolidated Financial Statements
CONSOLIDATED STATEMENTS OF CHANGES IN STOCKHOLDERS’ EQUITY
| | | | | | | | | | | | | | | | | | | | | | | | | | | | | | | | | | | | | | | | | | | | | | | | | | | | | | | | |
| (Dollars in thousands, except per share and share amounts) | | Shares | | Common
Stock | | Capital in
Excess of
Par Value | | Accumulated
Other
Comprehensive
Income (Loss) | | Retained
Earnings | | Treasury
Stock | | Total
Stockholders’
Equity of WSFS | | Non-controlling Interest | | Total Stockholders' Equity |
| Balance, December 31, 2020 | | 57,575,783 | | | $ | 576 | | | $ | 1,053,022 | | | $ | 56,007 | | | $ | 977,414 | | | $ | (295,293) | | | $ | 1,791,726 | | | $ | (2,246) | | | $ | 1,789,480 | |
| Net income | | — | | | — | | | — | | | — | | | 271,442 | | | — | | | 271,442 | | | 163 | | | 271,605 | |
| Other comprehensive loss | | — | | | — | | | — | | | (93,775) | | | — | | | — | | | (93,775) | | | — | | | (93,775) | |
| Cash dividend, $0.51 per share | | — | | | — | | | — | | | — | | | (24,242) | | | — | | | (24,242) | | | — | | | (24,242) | |
Issuance of common stock including proceeds from exercise of common stock
options | | 119,893 | | | 1 | | | 1,521 | | | — | | | — | | | — | | | 1,522 | | | — | | | 1,522 | |
| | | | | | | | | | | | | | | | | | |
| Stock-based compensation expense | | — | | | — | | | 5,694 | | | — | | | — | | | — | | | 5,694 | | | — | | | 5,694 | |
Repurchase of common stock (1) | | — | | | — | | | (1,240) | | | — | | | — | | | (12,028) | | | (13,268) | | | — | | | (13,268) | |
| Balance, December 31, 2021 | | 57,695,676 | | | $ | 577 | | | $ | 1,058,997 | | | $ | (37,768) | | | $ | 1,224,614 | | | $ | (307,321) | | | $ | 1,939,099 | | | $ | (2,083) | | | $ | 1,937,016 | |
| Net income | | — | | | — | | | — | | | — | | | 222,375 | | | — | | | 222,375 | | | 273 | | | 222,648 | |
| Other comprehensive loss | | — | | | — | | | — | | | (638,076) | | | — | | | — | | | (638,076) | | | — | | | (638,076) | |
| Cash dividend, $0.56 per share | | — | | | — | | | — | | | — | | | (35,746) | | | — | | | (35,746) | | | — | | | (35,746) | |
| Distributions to noncontrolling shareholders | | — | | | — | | | — | | | — | | | — | | | — | | | — | | | (504) | | | (504) | |
| Issuance of common stock including proceeds from exercise of common stock options | | 109,473 | | | 1 | | | 3,178 | | | — | | | — | | | — | | | 3,179 | | | — | | | 3,179 | |
| Issuance of common stock in acquisition of BMT | | 18,116,848 | | | 181 | | | 907,835 | | | — | | | — | | | — | | | 908,016 | | | — | | | 908,016 | |
| Noncontrolling interest assumed in acquisition | | — | | | — | | | — | | | — | | | — | | | — | | | — | | | (913) | | | (913) | |
| Stock-based compensation expense | | — | | | — | | | 6,349 | | | — | | | — | | | — | | | 6,349 | | | — | | | 6,349 | |
Repurchase of common stock (1) | | — | | | — | | | (2,149) | | | — | | | — | | | (197,934) | | | (200,083) | | | — | | | (200,083) | |
| Balance, December 31, 2022 | | 75,921,997 | | | $ | 759 | | | $ | 1,974,210 | | | $ | (675,844) | | | $ | 1,411,243 | | | $ | (505,255) | | | $ | 2,205,113 | | | $ | (3,227) | | | $ | 2,201,886 | |
| Net income | | — | | | — | | | — | | | — | | | 269,156 | | | — | | | 269,156 | | | (131) | | | 269,025 | |
| Other comprehensive income | | — | | | — | | | — | | | 81,853 | | | — | | | — | | | 81,853 | | | — | | | 81,853 | |
| Cash dividend, $0.60 per share | | — | | | — | | | — | | | — | | | (36,742) | | | — | | | (36,742) | | | — | | | (36,742) | |
| Distributions to noncontrolling shareholders | | — | | | — | | | — | | | — | | | — | | | — | | | — | | | (4,463) | | | (4,463) | |
| Issuance of common stock including proceeds from exercise of common stock options | | 173,097 | | | 2 | | | 3,296 | | | — | | | — | | | — | | | 3,298 | | | — | | | 3,298 | |
| | | | | | | | | | | | | | | | | | |
| | | | | | | | | | | | | | | | | | |
| Stock-based compensation expense | | — | | | — | | | 9,605 | | | — | | | — | | | — | | | 9,605 | | | — | | | 9,605 | |
Repurchase of common stock (1) | | — | | | — | | | (2,365) | | | — | | | — | | | (52,282) | | | (54,647) | | | — | | | (54,647) | |
| Balance, December 31, 2023 | | 76,095,094 | | | $ | 761 | | | $ | 1,984,746 | | | $ | (593,991) | | | $ | 1,643,657 | | | $ | (557,537) | | | $ | 2,477,636 | | | $ | (7,821) | | | $ | 2,469,815 | |
(1)Repurchase of common stock for the years ended December 31, 2023, 2022 and 2021 included 1,247,178, 4,151,117 and 267,309 shares repurchased, respectively, in connection with the Company's share buyback program approved by the Board of Directors, and 45,489, 113,039 and 31,188 shares withheld, respectively, to cover tax liabilities.
The accompanying notes are an integral part of these Consolidated Financial Statements
CONSOLIDATED STATEMENTS OF CASH FLOWS | | Year Ended December 31, |
| | Year Ended December 31, | | | | Year Ended December 31, |
| (Dollars in thousands) | (Dollars in thousands) | | 2021 | | 2020 | | 2019 | (Dollars in thousands) | | 2023 | | 2022 | | 2021 |
| Operating activities: | Operating activities: | | | | | | |
| Net income | Net income | | $ | 271,605 | | | $ | 113,320 | | | $ | 147,918 | |
| Net income | |
| Net income | |
| Adjustments to reconcile net income to net cash provided by operating activities: | Adjustments to reconcile net income to net cash provided by operating activities: | |
| (Recovery of) provision for credit losses | | (117,087) | | | 153,180 | | | 25,560 | |
| Provision for (recovery of) credit losses | |
| Provision for (recovery of) credit losses | |
| Provision for (recovery of) credit losses | |
| Depreciation of premises and equipment, net | Depreciation of premises and equipment, net | | 15,410 | | | 14,999 | | | 15,852 | |
| Accretion of fees, premiums and discounts, net | Accretion of fees, premiums and discounts, net | | (38,257) | | | (60,159) | | | (45,548) | |
| Amortization of intangible assets | Amortization of intangible assets | | 10,583 | | | 10,909 | | | 11,113 | |
| Amortization of right of use lease asset | Amortization of right of use lease asset | | 11,844 | | | 12,290 | | | 22,850 | |
| Decrease in operating lease liability | Decrease in operating lease liability | | (11,941) | | | (12,170) | | | (12,507) | |
| Income from mortgage banking activities, net | Income from mortgage banking activities, net | | (23,216) | | | (30,201) | | | (11,053) | |
| Gain on sale of securities, net | Gain on sale of securities, net | | (331) | | | (9,076) | | | (333) | |
| (Gain) loss on sale of other real estate owned and valuation adjustments, net | | (385) | | | (25) | | | 125 | |
| Loss (gain) on sale of other real estate owned and valuation adjustments, net | |
| Stock-based compensation expense | Stock-based compensation expense | | 5,694 | | | 2,677 | | | 3,608 | |
| Unrealized gains on equity investments, net | Unrealized gains on equity investments, net | | (5,141) | | | (761) | | | (26,175) | |
| Realized loss (gain) on sale of equity investment, net | | 706 | | | (22,052) | | | — | |
| Realized (gain) loss on sale of equity investment, net | |
| | Deferred income tax expense (benefit) | | 39,838 | | | (32,848) | | | 7,074 | |
| Deferred income tax (benefit) expense | |
| Deferred income tax (benefit) expense | |
| Deferred income tax (benefit) expense | |
| | Decrease (increase) in accrued interest receivable | | 2,739 | | | (6,241) | | | 1,406 | |
| (Increase) decrease in accrued interest receivable | |
| (Increase) decrease in accrued interest receivable | |
| (Increase) decrease in accrued interest receivable | |
| Increase in other assets | Increase in other assets | | (46,378) | | | (18,339) | | | (4,676) | |
| Origination of loans held-for-sale | Origination of loans held-for-sale | | (971,863) | | | (942,188) | | | (479,289) | |
| Proceeds from sales of loans held-for-sale | Proceeds from sales of loans held-for-sale | | 991,411 | | | 824,134 | | | 406,012 | |
| (Decrease) increase in accrued interest payable | | (714) | | | (1,653) | | | 1,203 | |
| Increase (decrease) in accrued interest payable | |
| (Decrease) increase in other liabilities | (Decrease) increase in other liabilities | | (4,807) | | | 24,675 | | | 30,922 | |
| Increase in value of bank-owned life insurance | | (1,048) | | | (1,757) | | | (806) | |
| Decrease (increase) in value of bank-owned life insurance | |
| Increase in capitalized interest, net | Increase in capitalized interest, net | | (3,014) | | | (3,572) | | | (3,390) | |
| Net cash provided by operating activities | Net cash provided by operating activities | | $ | 125,648 | | | $ | 15,142 | | | $ | 89,866 | |
| Investing activities: | Investing activities: | | | | | | |
| Purchases of investment securities held to maturity | |
| Purchases of investment securities held to maturity | |
| Purchases of investment securities held to maturity | Purchases of investment securities held to maturity | | $ | — | | | $ | (6,307) | | | $ | — | |
| Repayments, maturities and calls of investment securities held to maturity | Repayments, maturities and calls of investment securities held to maturity | | 20,365 | | | 27,085 | | | 16,170 | |
| Sale of investment securities available-for-sale | Sale of investment securities available-for-sale | | 14,051 | | | 305,812 | | | 618,194 | |
| Purchases of investment securities available-for-sale | Purchases of investment securities available-for-sale | | (3,490,596) | | | (1,454,699) | | | (958,259) | |
| Repayments of investment securities available-for-sale | Repayments of investment securities available-for-sale | | 697,480 | | | 606,156 | | | 269,697 | |
| Proceeds from bank-owned life insurance death benefit | |
| Proceeds from bank-owned life insurance surrender | Proceeds from bank-owned life insurance surrender | | — | | | — | | | 59,710 | |
| Net proceeds from sale of equity investments | Net proceeds from sale of equity investments | | 4,899 | | | 85,850 | | | — | |
| Net cash from business combinations | | — | | | — | | | 76,072 | |
| Net decrease (increase) in loans and leases | | 1,265,395 | | | (449,091) | | | 201,934 | |
| Net cash (paid for) from business combinations | |
| Net (increase) decrease in loans and leases | |
| | Purchases of loans held for investment | |
| | Purchases of loans held for investment | |
| | Purchases of loans held for investment | |
| Purchases of FHLB stock | Purchases of FHLB stock | | (625) | | | (145,400) | | | (394,428) | |
| Redemption of FHLB stock | Redemption of FHLB stock | | 323 | | | 160,726 | | | 415,771 | |
| Sales of assets acquired through foreclosure, net | Sales of assets acquired through foreclosure, net | | 2,489 | | | 2,014 | | | 3,089 | |
| Sale of premise and equipment | Sale of premise and equipment | | 427 | | | 69 | | | 71 | |
| Investment in premises and equipment, net | Investment in premises and equipment, net | | (6,576) | | | (7,159) | | | (14,198) | |
| Net cash (used in) provided by investing activities | | $ | (1,492,368) | | | $ | (874,944) | | | $ | 293,823 | |
| Net cash used in investing activities | |
(continued on following page)
CONSOLIDATED STATEMENT OF CASH FLOWS (CONTINUED)
| | Year Ended December 31, |
| | Year Ended December 31, | | | | Year Ended December 31, |
| (Dollars in thousands) | (Dollars in thousands) | | 2021 | | 2020 | | 2019 | (Dollars in thousands) | | 2023 | | 2022 | | 2021 |
| Financing activities: | Financing activities: | | | | | | |
| Net increase in demand and saving deposits | | $ | 1,760,031 | | | $ | 2,501,442 | | | $ | 69,761 | |
| Decrease in time deposits | | (169,871) | | | (197,765) | | | (55,400) | |
| Decrease in brokered deposits | | (202,625) | | | (29,474) | | | (156,396) | |
| Net (decrease) increase in demand and saving deposits | |
| Net (decrease) increase in demand and saving deposits | |
| Net (decrease) increase in demand and saving deposits | |
| Increase (decrease) in time deposits | |
| (Decrease) increase in brokered deposits | |
| | Receipts from FHLB advances | |
| Receipts from FHLB advances | |
| Receipts from FHLB advances | Receipts from FHLB advances | | 1,000 | | | 5,047,424 | | | 32,320,456 | |
| Repayments of FHLB advances | Repayments of FHLB advances | | (7,623) | | | (5,153,476) | | | (32,536,246) | |
| Receipts from federal funds purchased | Receipts from federal funds purchased | | — | | | 8,030,475 | | | 32,252,775 | |
| Repayments of federal funds purchased | Repayments of federal funds purchased | | — | | | (8,225,475) | | | (32,215,750) | |
| Contribution from noncontrolling shareholders | | — | | | 23 | | | — | |
| Receipts from Bank Term Funding Program | |
| Distributions to noncontrolling shareholders | |
| Cash dividend | Cash dividend | | (24,242) | | | (24,369) | | | (22,463) | |
| Issuance of common stock and exercise of common stock options | Issuance of common stock and exercise of common stock options | | 1,522 | | | 2,032 | | | 7,755 | |
| Redemption of senior debt | | (100,000) | | | — | | | — | |
| Issuance of senior debt, net of costs | | — | | | 147,780 | | | — | |
| Redemption of senior and subordinated debt | |
| | Repurchase of common shares | |
| Repurchase of common shares | |
| Repurchase of common shares | Repurchase of common shares | | (13,268) | | | (155,832) | | | (97,186) | |
| Net cash provided by (used in) financing activities | Net cash provided by (used in) financing activities | | $ | 1,244,924 | | | $ | 1,942,785 | | | $ | (432,694) | |
| (Decrease) increase in cash, cash equivalents, and restricted cash | | $ | (121,796) | | | $ | 1,082,983 | | | $ | (49,005) | |
| Increase (decrease) in cash, cash equivalents, and restricted cash | |
| Cash, cash equivalents, and restricted cash at beginning of period | Cash, cash equivalents, and restricted cash at beginning of period | | 1,654,735 | | | 571,752 | | | 620,757 | |
| Cash, cash equivalents, and restricted cash at end of period | Cash, cash equivalents, and restricted cash at end of period | | $ | 1,532,939 | | | $ | 1,654,735 | | | $ | 571,752 | |
| Supplemental disclosure of cash flow information: | Supplemental disclosure of cash flow information: | | | | | | |
| Cash paid for interest during the period | Cash paid for interest during the period | | $ | 23,434 | | | $ | 50,103 | | | $ | 74,942 | |
| Cash paid for interest during the period | |
| Cash paid for interest during the period | |
| Cash paid for income taxes, net | Cash paid for income taxes, net | | 40,691 | | | 72,756 | | | 33,843 | |
| Non-cash information: | Non-cash information: | |
| Loans transferred to other real estate owned | Loans transferred to other real estate owned | | $ | 1,972 | | | $ | 2,674 | | | $ | 2,541 | |
| Loans transferred to other real estate owned | |
| Loans transferred to other real estate owned | |
| Loans transferred to portfolio from held-for-sale at fair value | Loans transferred to portfolio from held-for-sale at fair value | | 72,621 | | | 34,517 | | | 24,862 | |
| Securities transferred to held-to-maturity from available-for-sale at fair value | |
| | Available-for-sale securities purchased, not settled | Available-for-sale securities purchased, not settled | | 34,489 | | | — | | | — | |
| Available-for-sale securities purchased, not settled | |
| Available-for-sale securities purchased, not settled | |
| | Receivable for bank-owned life insurance surrender proceeds | |
| Receivable for bank-owned life insurance surrender proceeds | |
| Receivable for bank-owned life insurance surrender proceeds | |
| Receivable for bank-owned life insurance death benefit proceeds | |
| Fair value of assets acquired, net of cash received | Fair value of assets acquired, net of cash received | | — | | | — | | | 5,032,156 | |
| Fair value of liabilities assumed | Fair value of liabilities assumed | | — | | | — | | | 5,108,228 | |
| | Impact of ASC 842 Adoption: | |
| Right of use asset | | — | | | — | | | 121,288 | |
| Lease liability | | — | | | — | | | (132,346) | |
| Impact of ASC 326 Adoption (Note 2): | |
| Allowance for credit losses on held-to-maturity debt securities | | — | | | (8) | | | — | |
| Allowance for credit losses on loans and leases | | — | | | (35,855) | | | — | |
| Deferred tax assets | | — | | | 8,461 | | | — | |
| Allowance for credit losses on unfunded lending commitments | | — | | | (2,966) | | | — | |
| Retained earnings | | — | | | 30,368 | | | — | |
|
The accompanying notes are an integral part of these Consolidated Financial Statements
NOTES TO CONSOLIDATED FINANCIAL STATEMENTS
1. BASIS OF PRESENTATION
General
WSFS Financial Corporation (the Company or WSFS) is a savings and loan holding company organized under the laws of the State of Delaware. Substantially all of the Company's assets are held by its subsidiary, Wilmington Savings Fund Society, FSB (WSFS Bank or the Bank), is a federal savings bank organized under the laws of the United States (U.S.).
The Consolidated Financial Statements include the accounts of the Company, WSFS Bank, The Bryn Mawr Trust Company of Delaware (BMT-DE), Bryn Mawr Capital Management, LLC (BMCM), WSFS Wealth Management, LLC (Powdermill®), WSFS Capital Management,SPE Services, LLC, (West Capital), Cypress Capital Management, LLC (Cypress), Christiana Trust Company of Delaware® (Christiana Trust DE) and WSFS SPE Services,601 Perkasie, LLC. The Company also has 1three unconsolidated subsidiary,subsidiaries, WSFS Capital Trust III (the Trust), Royal Bancshares Capital Trust I, and Royal Bancshares Capital Trust II. WSFS Bank has 2 wholly ownedtwo wholly-owned subsidiaries: Beneficial Equipment Finance Corporation (BEFC) and 1832 Holdings, Inc., and 1one majority-owned subsidiary, NewLane Finance Company (NewLane Finance®).
Overview
Founded in 1832, the Bank is one of the ten oldest bank and trust companies continuously operating under the same name in the U.S. The Company provides residential and commercial mortgage, commercial and consumer lending services, as well as retail deposit and cashtreasury management services. The Company's core banking business is commercial lending funded primarily by customer-generated deposits. In addition, the Company offers a variety of wealth management and trust services to individual, corporate and institutional clients. The Federal Deposit Insurance Corporation (FDIC) insures the Company's customers’ deposits to their legal maximums. The Company serves its Customers primarily from 112114 offices located in Pennsylvania (52)(57), Delaware (42)(40), New Jersey (16)(14), VirginiaFlorida (1), and Nevada (1) and Virginia (1), its ATM network, website at www.wsfsbank.com, and mobile apps.app. Information on the Company's website is not incorporated by reference into this Annual Report on Form 10-K.
The Company's leasing business is conducted by NewLane Finance®. NewLane Finance® originates small business leases and provides commercial financing to businesses nationwide, targeting various equipment categories including technology, software, office, medical, veterinary and other areas. In addition, NewLane Finance® offers captive insurance through its subsidiary, Prime Protect.
Basis of Presentation
The Consolidated Financial Statements are prepared in conformity with accounting principles generally accepted in the U.S. (GAAP). In preparing the Consolidated Financial Statements, the Company is required to make estimates and assumptions that affect the reported amounts of assets, liabilities, revenues and expenses. Although the Company's estimates contemplate current conditions and how it expects them to change in the future, it is reasonably possible that actual conditions in 20222024 could be worse than anticipated in those estimates, which could materially affect its results of operations and financial condition. The accounting for the allowance for credit losses (including loans and leases held for investment, investment securities available-for-sale and held-to-maturity), lending related commitments, goodwill, intangible assets, post-retirement benefit obligations, the fair value of financial instruments, and income taxes are subject to significant estimates. Among other effects, changes to these estimates could result in future impairments of investment securities, goodwill and intangible assets, the establishment of additional allowance and lending-related commitment reserves, changes in the fair value of financial instruments, as well as increased post-retirement benefits and income tax expense.
Certain reclassifications have been made to the prior year’s Consolidated Financial Statements to conform to the current year’s presentation. All significant intercompany accounts and transactions were eliminated in consolidation.
2. SUMMARY OF SIGNIFICANT ACCOUNTING POLICIES
SIGNIFICANT ACCOUNTING POLICIES
Cash, Cash Equivalents and Restricted Cash
For purposes of reporting cash flows, cash, cash equivalents and restricted cash include cash, cash in non-owned ATMs, amounts due from banks, federal funds sold and securities purchased under agreements to resell and cash collateral held for derivatives, including a financial derivative related to the sale of certain Visa Class B shares.
Debt Securities
Debt securities mostly include mortgage-backed securities (MBS), municipal bonds, and U.S. government and agency securities and are classified into one of the following three categories and accounted for as follows:
•Securities purchased with the intent of selling them in the near future are classified as “trading” and reported at fair value, with unrealized gains and losses included in earnings.
•Securities purchased with the positive intent and ability to hold to maturity are classified as “held to maturity” and reported at amortized cost.
•Securities not classified as either trading or held to maturity are classified as “available-for-sale” and reported at fair value, with unrealized gains and losses excluded from earnings and reported, net of tax, as a separate component of stockholders’ equity in accumulated other comprehensive income (loss).
Realized gains and losses are determined using the specific identification method and included in Security gains, net on the Consolidated Statements of Income. All sales are made without recourse.
The fair value of debt securities is primarily obtained from third-party pricing services. Implicit in the valuation of MBS are estimated prepayments based on historical and current market conditions.
Premiums and discounts on MBS collateralized by residential 1-4 family loans are recognized in interest income using a level yield method over the period to expected maturity. Premiums and discounts on all other securities are recognized on a straight linestraight-line basis over the period to expected maturity, with the exception of premiums on callable debt securities, which are recognized over the period to the earliest call date.
A debt security is placed on nonaccrual status at the time any principal or interest payments are contractually past due 90 days or more. Interest accrued but not received for a security placed on nonaccrual status is reversed against interest income.
The Company's investment portfolio is reviewed each quarter for indications of potential credit losses. Refer to the respective held-to-maturity and available-for-sale debt securities sections for the allowance for credit loss policies for each portfolio.
Allowance for Credit Losses - Held-to-Maturity Debt Securities
The Company follows Accounting Standards Codification (ASC) 326-20, Financial Instruments - Credit Loss - Measured at Amortized Cost, to measure expected credit losses on held-to-maturity debt securities on a collective basis by security investment grade. The estimate of expected credit losses considers historical credit loss information adjusted by a security's credit rating.
The Company classifies the held-to-maturity debt securities into the following major security types: mortgage backed securities, state and political subdivisions, and foreign bonds. These securities are highly rated with a history of no credit losses, and are assigned ratings based on the most recent data from ratings agencies depending on the availability of data for the security. Credit ratings of held-to-maturity debt securities, which are a significant input in calculating the expected credit loss, are reviewed on a quarterly basis.
Accrued interest receivable on held-to-maturity debt securities is excluded from the estimate of credit losses and is included in Accrued interest receivable on the Consolidated Statements of Financial Condition.
Allowance for Credit Losses - Available-for-Sale Debt Securities
The Company follows ASC 326-30, Financial Instruments - Credit Loss - Available-for-Sale Debt Securities, which provides guidance related to the recognition of and expanded disclosure requirements for expected credit losses on available-for-sale debt securities. For available-for-sale debt securities in an unrealized loss position, the Company first evaluates whether it intends to sell, or if it is more likely than not that it will be required to sell the security before recovery of its amortized cost basis. If either criterion is met, the security's amortized cost basis is reduced to fair value and recognized as a reduction to Noninterest income in the Consolidated Statements of Income.
For debt securities available-for-sale in which the Company does not intend to sell, or it is not likely the security would be required to be sold before recovery, it evaluates whether a decline in fair value has resulted from credit losses or other adverse factors, such as a change in the security's credit rating. In assessing whether a credit loss exists, the Company compares the present value of cash flows expected to be collected from the security with the amortized cost basis of the security. If the present value of cash flows expected to be collected is less than the amortized cost basis, a credit loss exists and an allowance is recorded, limited to the fair value of the security.
The Company performs these analyses on a quarterly basis to review the conditions and risks associated with the individual securities. Credit losses on an impaired security is measured using the present value of expected future cash flows. Any impairment not recorded through an allowance for credit loss is included in other comprehensive income (loss), net of the tax effect. The Company is required to use its judgment in determining impairment in certain circumstances.
For additional detail regarding debt securities, see Note 5.
Equity Investments
The Company has equity investments in certain strategic partnerships that are accounted for in accordance with both ASC 321-10, Investments - Equity Securities and ASC 323-10, Investments - Equity Method and Joint Ventures. Our equity investments are recorded in Other investments on the Consolidated Statements of Financial Condition.
Equity investments recorded in accordance with ASC 321-10 are classified into one of the following two categories and accounted for as follows:
•Investments with a readily determinable fair value are reported at fair value, with unrealized gains and losses included in earnings. Any dividends received are recorded in interest income.
•Investments without a readily determinable fair value are reported at cost less impairment, if any, plus or minus adjustments resulting from observable price changes in orderly transactions for the identical or similar investment of the same issuer. Any dividends received are recorded in interest income.
The fair value of equity investments with readily determinable fair values is primarily obtained from third-party pricing services. For equity investments without readily determinable fair values, when an orderly transaction for the identical or similar investment of the same issuer is identified, the Company uses valuation techniques permitted under ASC 820, Fair Value Measurement, to evaluate the observed transaction(s) and adjust the carrying value.
ASC 321-10 also provides impairment accounting guidance for equity investments without readily determinable fair values. The qualitative assessment to determine whether impairment exists requires the use of the Company's judgment. If, after completing the qualitative assessment, the Company concludes an equity investment without a readily determinable fair value is impaired, a loss for the difference between the equity investment’s carrying value and its fair value may be recognized as a reduction to noninterest income in the Consolidated Statements of Income.
Equity investments recorded in accordance with ASC 323-10 are initially recorded at cost based on the Company’s percentage ownership in the investee. Subsequently, the carrying amount of the investment is adjusted to reflect the recognition of the Company’s proportionate share of income or loss of the investee based on the investee’s earnings for the reporting period, recorded on a one-quarter lag.
The Company assesses its equity method investments for impairment using ASC 323-10 guidance. The qualitative assessment to determine whether impairment exists requires the use of the Company’s judgment. If, after completing the qualitative assessment, the Company concludes an equity method investment is impaired, a loss for the difference between the equity investment’s carrying value and its fair value may be recognized in Unrealized gains on equity investments, net on the Consolidated Statements of Income. After an impairment charge is recorded, the new cost basis cannot be subsequently written up to a higher value as a result of increases in fair value.
For additional detail regarding equity securities, see Note 5.
Loans and leases
Loans and leases held for investment are recorded at amortized cost, net of allowance for credit losses. Amortized cost is the amount at which a financial asset is originated or acquired, adjusted for the amortization of premium and discount, net deferred fees or costs, collection of cash, and write-offs. Interest income on loans is recognized using the level yield method. Loan origination fees, commitment fees and direct loan origination costs are deferred and recognized over the life of the related loans using a level yield method over the period to maturity.
Past Due and Nonaccrual Loans
Past due loans are defined as loans contractually past due 90 days or more as to principal or interest payments. Past due loans 90 days or more that remain in accrual status are considered well secured and in the process of collection.
Nonaccruing loans are those on which the accrual of interest has ceased. Loans are placed on nonaccrual status immediately if, in the opinion of the Company, collection is doubtful, or when principal or interest is past due 90 days or more and the loan is not well secured and in the process of collection. Interest accrued but not collected at the date a loan is placed on nonaccrual status is reversed and charged against interest income. In addition, the amortization of net deferred loan fees is suspended when a loan is placed on nonaccrual status. Subsequent cash receipts are applied either to the outstanding principal balance or recorded as interest income, depending on the Company’s assessment of the ultimate collectability of principal and interest. Loans are returned to accrual status when the Company assesses that the borrower has the ability to make all principal and interest payments in accordance with the terms of the loan (i.e., a consistent repayment record, generally six consecutive payments, has been demonstrated).
UnlessFor loans greater than 90 days past due, unless loans are well-secured and collection is imminent, for loans greater than 90 days past due their respective reserves are generally charged off once the loss has been confirmed. Expected recoveries do not exceed the aggregate of amounts previously charged off and expected to be charged off.
A loan, for which the terms have been modified resulting in the current reporting period in the form of principal forgiveness, an interest rate reduction, an other than-insignificant payment delay, or a concessionterm extension to thea borrower experiencing financial difficulty, is considered a TDR. troubled loan. The assessment of whether a borrower is experiencing financial difficulty is made on the date of a modification.
Principal balances are generally not forgiven when a loan is modified as a TDR.troubled loan. Nonaccruing restructuredtroubled loans remain in nonaccrual status until there has been a period of sustained repayment performance demonstrated as noted above, and repayment is reasonably assured.
The CARES Act which was signed into law on March 27, 2020 allows financial institutions to exclude eligible loan modifications from TDR reporting. The Consolidated Appropriations Act, 2021 modified Since the CARES Act to extendeffect of most troubled loans are already included in the TDR reporting relief period. Under the CARES Act, as amended, eligible modifications must be relatedCompany’s estimate of expected credit losses, a change to the COVID-19 pandemic, executed on a loan that wasallowance for credit losses is generally not more than 30 days past due as of December 31, 2019 and executed between March 1, 2020 and the earlier of 60 days after the date of the termination of the national emergency or January 1, 2022.
In addition, certain regulatory agencies have issued guidance during the year stating certain loan modifications to borrowers experiencing financial distress as a result of the economic impacts created by COVID-19 may also exclude eligible loan modifications from TDR reporting. For COVID-19 related loan modifications which met the criteria under either the CARES Act, as amended, or the interagency guidance, the Company has elected to account for and report eligible modifications under this guidance.recorded upon modification.
For additional detail regarding past due and nonaccrual loans, see Note 7.
Allowance for Credit Losses - Loans and Leases
The Company establishes its allowance in accordance with guidance provided in ASC 326, Financial Instruments - Credit Losses. The allowance for credit losses includes quantitative and qualitative factors that comprise the Company's current estimate of expected credit losses, including the Company's portfolio mix and segmentation, modeling methodology, historical loss experience, relevant available information from internal and external sources relating to qualitative adjustment factors, prepayment speeds and reasonable and supportable forecasts about future economic conditions.
The Company's portfolio segments, established based on similar risk characteristics and loss behaviors, are:
•Commercial Loans and Leases: Commercial and industrial - real estate secured, commercial and industrial - non-real estate secured, owner-occupied commercial, commercial mortgages, construction and commercial small business leases, (collectively, commercial loans), and
•Residential and Consumer Loans: Residential mortgage, equity secured lines and loans, installment loans, unsecured lines of credit, originated education loans and previously acquired education loans (collectively, retail loans).loans.
Expected credit losses are net of expected recoveries and estimated over the contractual term, adjusted for expected prepayments. The contractual term excludes any extensions, renewals and modifications unless the Company has reasonable expectations at the reporting date that it will result in a troubled debt restructuring (TDR) or they are not unconditionally cancellable. Expected recoveries do not exceed the aggregate of amounts previously charged-off and expected to be charged-off. Expected prepayments are based on historical experience and considers adjustments for current and future economic conditions.
The allowance includes two primary components: (i) an allowance established on loans which share similar risk characteristics collectively evaluated for credit losses (collective basis) and (ii) an allowance established on loans which do not share similar risk characteristics with any loan segment and are individually evaluated for credit losses (individual basis).
Loans that share similar risk characteristics are collectively reviewed for credit loss and are evaluated based on historical loss experience, adjusted for current economic conditions and future economic forecasts. Estimated losses are determined differently for commercial and retailresidential and consumer loans, and each portfoliocommercial segment is further segmented by internally assessed risk ratings.
The Company uses a single scenario third-party economic forecast to adjust the calculated historical loss rates of the portfolio segments to incorporate the effects of current and future economic conditions. The Company's economic forecast considers the general health of the economy, the interest rate environment, real estate pricing and market risk. The Company's forecast extends out 6 quarters (the forecast period) and reverts to the historical loss rates on a straight-line basis over 4 quarters (the reversion period) as it believes this to be reasonable and supportable in the current environment. The economic forecast and reversion periods will be evaluated periodically by the Company and updated as appropriate.
The historical loss rates for commercial loans are estimated by determining the probability of default (PD) and expected loss given default (LGD) and are applied to the loans' exposure at default. The probability of default is calculated based on the historical rate of migration to an event of credit loss during the look-back period. The historical loss rates for retailconsumer loans isare calculated based on average net loss rates over the same look-back period. The current look-back period is 4452 quarters which ensures historical loss rates are adequately considering losses within a full credit cycle.
Loans that do not share similar risk characteristics with any loan segments are evaluated on an individual basis. These loans, which may include TDRs,troubled loans, are not included in the collective basis evaluation. When it is probable the Company will not collect all principal and interest due according to their contractual terms, which is assessed based on the credit characteristics of the loan and/or payment status, these loans are individually reviewed and measured for potential credit loss.
The amount of the potential credit loss is measured using any of the following three methods: (i) the present value of expected future cash flows discounted at the loan’s effective interest rate; (ii) the fair value of collateral if the loan is collateral dependent; or (iii) the loan’s observable market price. If the measured fair value of the loan is less than the amortized cost basis of the loan, an allowance for credit loss is recorded.
For collateral dependent loans, the expected credit losses at the individual asset level isare the difference between the collateral's fair value (less cost to sell) and the amortized cost.
Qualitative adjustment factors consider various internal and external conditions which are allocated among loan segments and take into consideration:
•Current underwriting policies, staffstaffing and portfolio concentrations,
•Risk rating accuracy and credit and administration,
•Internal risk emergence (including internal trends of delinquency, and criticized loans by segment),
•Economic forecasts and conditions - locally and nationally (including market trends impacting collateral values), which is separate from or in addition to the third partythird-party economic forecast described above, and
•Competitive environment, as it could impact loan structure and underwriting.
These factors are based on their relative standing compared to the period in which historical losses are used in quantitative reserve estimates and current directional trends, and reasonable and supportable forecasts. Qualitative factors can add to or subtract from quantitative reserves.
The Company's loan officers and risk managers meet at least quarterly to discuss and review the conditions and risks associated with individual problem loans. In addition, various regulatory agencies periodically review the Company's loan ratings and allowance for credit losses and the Bank's internal loan review department performs recurring loan reviews.
Accrued interest receivable on loans is excluded from the estimate of credit losses and is included in Accrued interest receivable on the unaudited Consolidated Statements of Financial Condition.
For additional detail regarding the allowance for credit losses and the provision for credit losses, see Note 7.
Unfunded Lending Commitments
For unfunded lending commitments, the Company estimates expected credit losses over the contractual period in which the Company is exposed to credit risk via a contractual obligation to extend credit, unless that obligation is unconditionally cancellable by the Company. The estimate includes consideration of the probability of default and utilization rate at default to calculate expected credit losses on commitments expected to be funded based on historical losses.
The allowance for credit losses for off-balance sheet exposures is included in Other liabilities on the Consolidated Statements of Financial Condition and the provision for credit losses for off-balance sheet exposure is included in Loan workout and other credit costs on the Consolidated Statements of Income.
For additional detail regarding unfunded lending commitments, see Note 17.
Allowance for Loan and Lease Losses (Prior to the Company's Adoption of CECL)
The Company adopted the ASC 326 guidance on January 1, 2020, using the modified retrospective approach for financial assets recorded at amortized cost with the exception of purchase credit deteriorated assets, which were previously classified as purchase credit impaired accounted for under ASC 310-30, adopted using the prospective approach. The cumulative effect of the adoption resulted in a $30.4 million decrease to the beginning balance of retained earnings as of January 1, 2020.
For periods prior to the adoption of CECL, the Company maintain an allowance for loan and lease losses (allowance) which represents our best estimate of probable losses within our loan portfolio. As losses are realized, they are charged to the allowance. We establish our allowance in accordance with guidance provided in ASC 450, Contingencies, ASC 310, and the SEC’s Staff Accounting Bulletin 102, Selected Loan Loss Allowance Methodology and Documentation Issues (SAB 102). The allowance includes two primary components: (i) an allowance established on loans collectively evaluated for impairment (general allowance), and (ii) an allowance established on loans individually evaluated for impairment (specific allowance). In addition, we also maintain an allowance for acquired loans as necessary.
The general allowance is calculated on a pooled loan basis using both quantitative and qualitative factors in accordance with ASC 450. The specific allowance is calculated on an individual loan basis when collectability of all contractually due principal and interest is no longer believed to be probable in accordance with ASC 310. Lastly, the allowance related to acquired loans is calculated when (i) there is deterioration in credit quality subsequent to acquisition for loans accounted for under ASC 310-30, and (ii) the inherent losses in the loans exceed the remaining total loan mark recorded at the time of acquisition for loans accounted for under ASC 310-20, Receivables - Nonrefundable Fees and Other Costs.
Allowances for pooled homogeneous loans, that are not deemed impaired, are based on historical net loss experience. Estimated losses for pooled portfolios are determined differently for commercial loan pools and retail loan pools. Commercial loans are pooled as follows: commercial and industrial, owner-occupied commercial, commercial mortgages and construction. Each pool is further segmented by internally assessed risk ratings. Loan losses for commercial loans are estimated by determining the probability of default and expected loss severity upon default. The probability of default is calculated based on the historical rate of migration to impaired status during the last 36 quarters. During the year ended December 31, 2019, we increased the look-back period to 36 quarters from 32 quarters used at December 31, 2018. This increase in the look-back period allows us to continue to anchor to the fourth quarter of 2010 to ensure that the quantitative reserves calculated by the allowance for loan and lease loss model are adequately considering the losses within a full credit cycle. Loss severity upon default is calculated as the actual loan losses (net of recoveries) on impaired loans in their respective pool during the same time frame. Retail loans are pooled into the following segments: residential mortgage, consumer secured and consumer unsecured loans. Pooled reserves for retail loans are calculated based solely on average net loss rates over the same 36 quarter look-back period.
Qualitative adjustment factors consider various internal and external conditions which are allocated among loan segments and take into consideration:
•Current underwriting policies, staff and portfolio mix,
•Internal trends of delinquency, nonaccrual and criticized loans by segment,
•Risk rating accuracy, control and regulatory assessments/environment,
•General economic conditions - locally and nationally,
•Market trends impacting collateral values, and
•Competitive environment, as it could impact loan structure and underwriting.
The above factors are based on their relative standing compared to the period in which historic losses are used in quantitative reserve estimates and current directional trends. Qualitative factors in our model can add to or subtract from quantitative reserves.
The allowance methodology uses a loss emergence period (LEP), which is the period of time between an event that triggers the probability of a loss and the confirmation of the loss. We estimate the commercial LEP to be approximately nine quarters as of December 31, 2019. Our residential mortgage and consumer LEP remained at four quarters as of December 31, 2019.
We evaluate LEP quarterly for reasonableness and complete a detailed historical analysis of our LEP annually for our commercial portfolio and review of the current four quarter LEP for the retail portfolio to determine the continued reasonableness of this assumption.
Our loan officers and risk managers meet at least quarterly to discuss and review the conditions and risks associated with individual problem loans. In addition, various regulatory agencies periodically review our loan ratings and allowance for loan and lease losses and the Bank’s internal loan review department performs loan reviews.
For impaired loans, if the measure is less than the recorded investment in the loan, a related allowance is allocated for the impairment. Impairment of troubled debt restructurings are measured at the present value of estimated future cash flows using the loan’s effective interest rate at inception or the fair value of the underlying collateral if the loan is collateral dependent. Troubled debt restructurings consist of concessions granted to borrowers facing financial difficulty.
Loans Held for Sale
Mortgage loans held for sale are recorded at fair value on a loan level basis, using pricing information obtained from secondary markets and brokers and applied to loans with similar interest rates and maturities.
Other loans held for sale are carried at the lower of amortized cost or estimated fair value. The estimated fair value is based on pricing information from secondary markets and brokers, when available, or a discounted cash flow analysis when market information is unavailable.
Other Real Estate Owned
Upon initial receipt, other real estate owned (OREO) is recorded at the estimated fair value less costs to sell. Costs subsequently incurred to improve the assets are capitalized, provided that the resultant carrying value does not exceed the estimated fair value less costs to sell. Costs related to holding or disposing of the assets are charged to expense as incurred. The Company periodically evaluates OREO for impairment and write-down the value of the asset when declines in fair value below the carrying value are identified. Loan workout and OREO expenses include costs of holding and operating the assets, net gains or losses on sales of the assets and provisions for losses to reduce such assets to the estimated fair values less costs to sell.
For additional detail regarding other real estate owned, see Note 7.
Premises, Equipment and Software
Premises and equipment are stated at cost less accumulated depreciation and amortization. Depreciation and amortization expense are computed on a straight-line basis over the estimated useful lives of the assets or, for leasehold improvements, over the terms of the related lease or effective useful lives of the assets, whichever is less. In general, computer equipment, furniture and equipment and building renovations are depreciated over three, five and ten years, respectively. Software, which includes purchased or externally hosted software is recorded in Other assets and is amortized on a straight-line basis over the lesser of the contract term or estimated useful life of the software.
Maintenance and repairs are expensed as incurred, while costs of major replacements, improvements and additions are capitalized.
Premises and equipment acquired in business combinations are initially recorded at fair value and subsequently carried at cost less accumulated depreciation and amortization. Assets to be disposed of are recorded at the lower of the carrying amount or fair value less costs to sell.
For additional detail regarding premises and equipment, see Note 8.
Goodwill and Intangible Assets
The Company accounts for goodwill and intangible assets in accordance with ASC 805, Business Combinations and ASC 350, Intangibles-Goodwill and Other. Accounting for goodwill and other intangible assets requires the Company to make significant judgments, for goodwill particularly, with respect to estimating the fair value of each reporting unit. The estimates utilize historical data, cash flows, and market and industry data specific to each reporting unit as well as projected data. Industry and market data are used to develop material assumptions such as transaction multiples, required rates of return, control premiums, long-term growth rates, and capitalization.
Goodwill is not amortized, rather it is subject to periodic impairment testing. The Company reviews goodwill for impairment annually on October 1 and more frequently if events and circumstances indicate that the fair value of a reporting unit is less than its carrying value. Other intangible assets with finite lives are amortized over their estimated useful lives. The Company reviews other intangible assets with finite lives for impairment if events and circumstances indicate that the carrying value may not be recoverable. For additional information regarding goodwill and intangible assets, see Note 10.
Leases
The Company accounts for its leases in accordance with ASC 842 - Leases. Most leases are recognized on the balance sheet by recording a right-of-use asset and lease liability for each lease. The right-of-use asset represents the right to use the asset under lease for the lease term, and the lease liability represents the contractual obligation to make lease payments. The right-of-use asset is tested for impairment whenever events or changes in circumstances indicate the carrying amount may not be recoverable.
As a lessee, the Company enters into operating leases for certain bank branches, office space, and office equipment. The right-of-use assets and lease liabilities are initially recognized based on the net present value of the remaining lease payments which include renewal options where the Company is reasonably certain they will be exercised. The net present value is determined using the incremental collateralized borrowing rate at commencement date. The right-of-use asset is measured at the amount of the lease liability adjusted for any prepaid rent, lease incentives and initial direct costs incurred. The right-of-use asset and lease liability is amortized over the individual lease terms. Lease expense for lease payments is recognized on a straight-line basis over the lease term.
As a lessor, the Company provides direct financing to customers through the Company's equipment and small-business leasing business. Direct financing leases are recorded at the aggregate of minimum lease payments net of unamortized deferred lease origination fees and costs and unearned income. Interest income on direct financing leases is recognized over the term of the lease. Origination fees and costs are deferred, and the net amount is amortized to interest income over the estimated life of the lease. For additional information regarding leases, see Note 9.
Derivative Financial Instruments
The Company accounts for derivatives in accordance with ASC 815, Derivatives and Hedging. Derivatives are recognized as either assets or liabilities at fair value in the Consolidated Statements of Financial Condition with changes in fair value recorded to earnings or accumulated other comprehensive income, as appropriate. At the inception of a derivative contract, the Company designates the derivative as a hedging or non-hedging instrument. To qualify for hedge accounting, derivatives must be highly effective at reducing the risk associated with the exposure being hedged and must be designated as a hedge at the inception of the derivative contract. For fair value hedges, changes to the fair value are recorded in earnings, while for cash flow hedges, fair value changes are recorded in accumulated other comprehensive income and subsequently reclassified into earnings in the period that the hedged forecast transaction affects earnings. The ineffective portion of a hedge’s change in fair value is recognized in earnings immediately. For derivatives not designated as hedges, adjustments to fair value are recorded through earnings. For additional detail regarding derivatives, see Note 19.
Income Taxes
The provision for income taxes includes federal, state and local income taxes currently payable and those deferred due to temporary differences between the financial statement basis and tax basis of assets and liabilities. Income taxes are accounted for in accordance with ASC 740, Income Taxes. ASC 740 requires the recording of deferred income taxes that reflect the net tax effects of temporary differences between the carrying amounts of assets and liabilities for financial reporting purposes and the amounts used for income tax purposes. It prescribes a recognition threshold and a measurement attribute for the financial statement recognition and measurement of tax positions taken or expected to be taken in a tax return. Benefits from tax positions are recognized in the financial statements only when it is more-likely-than-not that the tax position will be sustained upon examination by the appropriate taxing authority that would have full knowledge of all relevant information.
A tax position that meets the more-likely-than-not recognition threshold is measured at the largest amount of benefit that is greater than 50% likely of being realized upon ultimate settlement. Tax positions that previously failed to meet the more-likely-than-not recognition threshold are recognized in the first subsequent financial reporting period in which that threshold is met. Previously recognized tax positions that no longer meet the more-likely-than-not recognition threshold are derecognized in the first subsequent financial reporting period in which that threshold is no longer met. ASC 740 also provides guidance on the accounting for and disclosure of unrecognized tax benefits, interest and penalties. For additional detail regarding income taxes, see Note 15.
Securities Sold Under Agreements to Repurchase
The Company enters into sales of securities under agreements to repurchase which are treated as financings, with the obligation to repurchase securities sold reflected as a liability in the Consolidated Statements of Financial Condition. The securities underlying the agreements are assets. For additional detail regarding the securities sold under agreements to repurchase, see Note 12.
Stock-Based Compensation
Stock-based compensation is accounted for in accordance with ASC 718, Stock Compensation. Compensation expense relating to all share-based payments is recognized on a straight-line basis, over the applicable vesting period. For additional detail regarding stock-based compensation, see Note 16.
RECENT ACCOUNTING PRONOUNCEMENTS
Accounting Guidance Adopted in 2021The following accounting pronouncements were adopted by the Company during the year ended December 31, 2023, but do not have a material impact on the Consolidated Financial Statements:
ASU No. 2019-12, Income Taxes2022-02, Financial Instruments – Credit Losses (Topic 740)326): Simplifying the Accounting for Income Taxes:Troubled Debt Restructurings and Vintage Disclosures: In December 2019,March 2022, the FASB issued ASU No. 2019-12,2022-02, Financial Instruments – Credit Losses (Topic 326): Troubled Debt Restructurings and Vintage Disclosures. The guidance eliminates the accounting guidance for troubled debt restructurings by creditors (ASC 310-40) while enhancing disclosure requirements for certain loan refinancings and restructurings by creditors when a borrower is experiencing financial difficulty. The guidance also requires that an entity disclose current-period write-offs by year of origination for financing receivables and net investments in leases within the scope of Topic 326. The Company adopted this guidance prospectively on January 1, 2023. For further details on the impact of the adoption and accounting policies, see updated Significant Accounting Policies, as described above, and troubled loans disclosures in Note 7 - Income Taxes (Topic 740): Simplifying the AccountingAllowance for Income TaxesCredit Losses and Credit Quality Information.
Accounting Guidance Pending Adoption as of December 31, 2023
ASU No. 2023-01, Leases (Topic 842:) Common Control Agreements: In March 2023, the FASB issued ASU No. 2023-01, Leases (Topic 842) Common Control Agreements. The guidance adds new amendments to simplify income tax accounting and removes certain exceptions and modifiesamendment clarifies the accounting for certain income tax transactions.leasehold improvements associated with common control leases by allowing the lessee to amortize the leasehold improvements over the useful life of the common control group’s use of the underlying asset, regardless of the lease term. The guidance is effective for annual periodsfiscal years beginning after December 15, 2020.2023. Early adoption is permitted. Adoption is required on a modified retrospective basis, consistent with the Company's adoption of Topic 842. The Company does not expect this update to have a material impact on the Consolidated Financial Statements.
ASU No. 2023-02, Investments—Equity Method and Joint Ventures (Topic 323): Accounting for Investments in Tax Credit Structures Using the Proportional Amortization Method: In March 2023, The FASB issued ASU 2023-02, Investments—Equity Method and Joint Ventures (Topic 323) Accounting for Investments in Tax Credit Structures Using the Proportional Amortization Method. The amendments permit reporting entities to elect to account for any equity investments in a tax credit program using the proportional amortization method if certain conditions are met. The amendments are effective for fiscal years beginning after December 15, 2023. Early adoption is permitted. Adoption is required on a prospective, modified-retrospectivemodified retrospective, or retrospective basis depending on the amendment. The Company adopteddoes not expect this standardupdate to have a material impact on January 1, 2021, on a prospective basis with no impact to the Consolidated Financial Statements at the time of adoption.
ASU No. 2020-01, Investments-Equity Securities2023-07, Segment Reporting (Topic 321), Investments-Equity Method and Joint Ventures (Topic 323), and Derivatives and Hedging (Topic 815) – Clarifying the Interactions between Topic 321, Topic 323, and Topic 815: 280): Improvements to Reportable Segment Disclosures:In January 2020,November 2023, the FASB issued ASU No. 2020-01, Investments-Equity Securities2023-07, Segment Reporting (Topic 321), Investments-Equity Method280): Improvements to Reportable Segment Disclosures. The amendments are intended to improve reportable segment disclosure requirements, primarily through enhanced disclosures about significant segment expenses that are regularly provided to the chief operating decision maker and Joint Ventures (Topic 323), and Derivatives and Hedging (Topic 815) –Clarifying the Interactions between Topic 321, Topic 323, and Topic 815.included within each reported measure of segment profit or loss. The new guidance clarifies that observable transactions under the measurement alternative method (ASC 321) should be considered when applying or discontinuing the equity method of accounting (ASC 323). The guidance also clarifies that certain non-derivative forward contracts and purchase call options to acquire securities, should be measured at fair value before settlement or exercise. The guidance isamendments are effective for annual periodsfiscal years beginning after December 15, 2020.2023, and interim periods within fiscal years beginning after December 15, 2024. Early adoption is permitted. Use ofAdoption is required retrospectively to all prior periods presented in the prospective method is required.financial statements. The Company adoptedis currently evaluating this standardupdate to determine the impact on January 1, 2021, on a prospective basis with no impact to the Consolidated Financial Statements at the time of adoption.
ASU No. 2021-01, Reference Rate Reform2023-09, Income Taxes (Topic 848)740): Scope: Improvements to Income Tax Disclosures:In January 2021,December 2023, the FASB issued ASU No. 2021-01, Reference Rate Reform2023-09, Income Taxes (Topic 848)740): Scope.Improvements to Income Tax Disclosures. The new guidance expandsamendments further enhance income tax disclosures, primarily through standardization and clarifies the scopedisaggregation of ASU No. 2020-04 to include derivatives affectedrate reconciliation categories and income taxes paid by changes in interest rates usedjurisdiction. The amendments are effective for margining, discounting,fiscal years beginning after December 15, 2024, and interim periods within fiscal years beginning after December 15, 2025. Early adoption is permitted and should be applied either prospectively or contract price alignment, commonly referred to as the “discounting transaction.” Derivatives impacted by the discounting transaction will be eligible for certain optional expedients and exceptions related to contract modifications and hedge accounting as defined in Topic 848. The guidance is effective upon issuance through December 31, 2022 and there was no impact to the Company at the time the guidance became effective.retrospectively. The Company will applyis currently evaluating this guidanceupdate to any derivatives affected bydetermine the discounting transaction due to reference rate reform.
There was no material accounting guidance pending adoption at December 31, 2021.
3. NONINTEREST INCOME
Credit/debit card and ATM income
The following table presents the components of credit/debit card and ATM income:
| | Twelve Months Ended December 31, |
| | Twelve Months Ended December 31, | | | | Twelve Months Ended December 31, |
| (Dollars in thousands) | (Dollars in thousands) | | 2021 | | 2020 | | 2019 | (Dollars in thousands) | | 2023 | | 2022 | | 2021 |
| Bailment fees | Bailment fees | | $ | 12,940 | | | $ | 14,615 | | | $ | 26,256 | |
| Interchange fees | Interchange fees | | 13,520 | | | 17,747 | | | 22,975 | |
| Other card and ATM fees | Other card and ATM fees | | 3,019 | | | 2,652 | | | 1,152 | |
| Total credit/debit card and ATM income | Total credit/debit card and ATM income | | $ | 29,479 | | | $ | 35,014 | | | $ | 50,383 | |
Credit/debit card and ATM income is composed of bailment fees, interchange fees, and other card and ATM fees. Bailment fees are earned from bailment arrangements with customers. Bailment arrangements are legal relationships in which property is delivered to another party without a transfer of ownership. The party who transferred the property (the bailor) retains ownership interest of the property. In the event that the bailee files for bankruptcy protection, the property is not included in the bailee's assets. The bailee pays an agreed-upon fee for the use of the bailor's property in exchange for the bailor allowing use of the assets at the bailee's site. Bailment fees are earned from cash that is made available for customers' use at an offsite location, such as cash located in an ATM at a customer's place of business. These fees are typically indexed to a market interest rate. This revenue stream generates fee income through monthly billing for bailment services. Bailment fees decreased in 2021 as compared to 2020 and 2019 due to the lower interest rate environment.
Credit/debit card and ATM income also includes interchange fees. Interchange fees are paid by a merchant's bank to a bank that issued a debit or credit card used in a transaction to compensate the issuing bank for the value and benefit the merchant receives from accepting electronic payments. These revenue streams generate fee income at the time a transaction occurs and are recorded as revenue at the time of the transaction. Interchange fees decreased in 2021 and 2020 as compared to 2019 as a result of the Durbin Amendment which became effective for the Company on July 1, 2020. The Durbin Amendment is a provision of the Dodd-Frank Wall Street Reform and Consumer Protection Act of 2010 that established a cap on interchange fees with respect to debit transactions for banks that, together with their affiliates, have over $10 billion in assets.
Investment management and fiduciary income
The following table presents the components of investment management and fiduciary income: | | | | | | | | | | | | | | | | | | | | |
| | Twelve Months Ended December 31, |
| (Dollars in thousands) | | 2021 | | 2020 | | 2019 |
| Trust fees | | $ | 43,725 | | | $ | 33,288 | | | $ | 27,383 | |
| Wealth management and advisory fees | | 18,623 | | | 15,691 | | | 15,067 | |
| Total investment management and fiduciary income | | $ | 62,348 | | | $ | 48,979 | | | $ | 42,450 | |
| | | | | | | | | | | | | | | | | | | | |
| | Twelve Months Ended December 31, |
| (Dollars in thousands) | | 2023 | | 2022 | | 2021 |
| Trust fees | | $ | 89,396 | | | $ | 79,472 | | | $ | 43,725 | |
| Wealth management and advisory fees | | 41,654 | | | 42,136 | | | 18,623 | |
| Total investment management and fiduciary income | | $ | 131,050 | | | $ | 121,608 | | | $ | 62,348 | |
Investment management and fiduciary income is composed of trust fees and wealth management and advisory fees. Trust fees are based on revenue earned from custody, escrow, and trustee and trustee related services on structured finance transactions; indenture trustee, administrative agent and collateral agent services to individuals, institutions and corporations; commercial domicile and independent director services; and investment and trustee services to families and individuals across the U.S.individuals. Most fees are flat fees, except for a portion of personal and corporate trustee fees where the Company earns a percentage on the assets under management or assets held within a trust. This revenue stream primarily generates fee income through monthly, quarterly and annual billings for services provided. Trust fees increased in 2021 as compared to 2020 and 2019 primarily due to increased institutional trust activity.
Wealth management and advisory fees consists of fees from Cypress, West Capital,Bryn Mawr Trust®, BMCM, Powdermill®, and WSFS Wealth® Investments. Wealth management and advisory fees are based on revenue earned from services including asset management, financial planning, family office, and brokerage. The fees are based on the market value of assets, are assessed as a flat fee, or are brokerage commissions. This revenue stream primarily generates fee income through monthly, quarterly and annual billingbillings for the services.
Deposit service charges
The following table presents the components of deposit service charges:
| | Twelve Months Ended December 31, |
| | Twelve Months Ended December 31, | | | | Twelve Months Ended December 31, |
| (Dollars in thousands) | (Dollars in thousands) | | 2021 | | 2020 | | 2019 | (Dollars in thousands) | | 2023 | | 2022 | | 2021 |
| Service fees | Service fees | | $ | 14,220 | | | $ | 12,725 | | | $ | 12,420 | |
| Return and overdraft fees | Return and overdraft fees | | 6,789 | | | 6,819 | | | 9,911 | |
| Other deposit service fees | Other deposit service fees | | 1,081 | | | 455 | | | 641 | |
| Total deposit service charges | Total deposit service charges | | $ | 22,090 | | | $ | 19,999 | | | $ | 22,972 | |
Deposit service charges includes revenue earned from core deposit products, certificates of deposit, and brokered deposits. The Company generates fee revenues from deposit service charges primarily through service charges and overdraft fees. Service charges consist primarily of monthly account maintenance fees, cashtreasury management fees, foreign ATM fees and other maintenance fees. All of these revenue streams generate fee income through service charges for monthly account maintenance and similar items, transfer fees, late fees, overlimit fees, and stop payment fees. Revenue is recorded at the time of the transaction.
Other income
The following table presents the components of other income:
| | Twelve Months Ended December 31, |
| | Twelve Months Ended December 31, | | | | Twelve Months Ended December 31, |
| (Dollars in thousands) | (Dollars in thousands) | | 2021 | | 2020 | | 2019 | (Dollars in thousands) | | 2023 | | 2022 | | 2021 |
| Managed service fees | Managed service fees | | $ | 16,425 | | | $ | 15,448 | | | $ | 14,152 | |
| Currency preparation | Currency preparation | | 4,064 | | | 3,854 | | | 3,195 | |
| ATM loss protection | ATM loss protection | | 2,522 | | | 2,401 | | | 2,551 | |
| Capital markets revenue | |
Miscellaneous products and services | Miscellaneous products and services | | 11,786 | | | 7,442 | | | 10,021 | |
| Total other income | Total other income | | $ | 34,797 | | | $ | 29,145 | | | $ | 29,919 | |
(1)Includes commissions income from BMTIA in 2022. The BMTIA business was sold during the second quarter of 2022.
Other income consists of managed service fees, which are primarily courier fees related to cashtreasury management, currency preparation, ATM loss protection, capital markets revenue, and other miscellaneous products and services offered by the Bank. These fees are primarily generated through monthly billings or at the time of the transaction. Capital markets revenue consists of fees related to interest rate swaps, risk participation agreements, foreign exchange contracts, letters of credit, and trade finance products and services offered by the Bank.
Arrangements with multiple performance obligations
The Company's contracts with customers may include multiple performance obligations. For such arrangements, the Company allocates revenue to each performance obligation based on its relative standalone selling price. The Company generally determines standalone selling prices based on the prices charged to customers.
Practical expedients and exemptions
The Company does not disclose the value of unsatisfied performance obligations for (i) contracts with an original expected length of one year or less and (ii) contracts for which the Company recognizes revenue at the amount to which it has the right to invoice for services performed.
See Note 21 for further information about the disaggregation of noninterest income by segment.
4. EARNINGS PER SHARE
The following table shows the computation of basic and diluted earnings per share:
| | (Dollars and shares in thousands, except per share data) | (Dollars and shares in thousands, except per share data) | 2021 | | 2020 | | 2019 | (Dollars and shares in thousands, except per share data) | 2023 | | 2022 | | 2021 |
| Numerator: | Numerator: | | | | | |
| Net income attributable to WSFS | Net income attributable to WSFS | $ | 271,442 | | | $ | 114,774 | | | $ | 148,809 | |
| Net income attributable to WSFS | |
| Net income attributable to WSFS | |
| Denominator: | Denominator: | | | | | |
| Weighted average basic shares | |
| Weighted average basic shares | |
| Weighted average basic shares | Weighted average basic shares | 47,539 | | | 50,510 | | | 49,298 | |
| Dilutive potential common shares | Dilutive potential common shares | 164 | | | 37 | | | 256 | |
| Weighted average fully diluted shares | Weighted average fully diluted shares | 47,703 | | | 50,547 | | | 49,554 | |
| Earnings per share: | Earnings per share: | | | | | |
| Basic | Basic | $ | 5.71 | | | $ | 2.27 | | | $ | 3.02 | |
| Basic | |
| Basic | |
| Diluted | Diluted | $ | 5.69 | | | $ | 2.27 | | | $ | 3.00 | |
| Outstanding common stock equivalents having no dilutive effect | Outstanding common stock equivalents having no dilutive effect | 1 | | | 12 | | | 1 | |
Basic earnings per share is calculated by dividing Net income attributable to WSFS by the weighted-average basic shares outstanding. Diluted earnings per share is calculated by dividing Net income attributable to WSFS by the weighted-average fully diluted shares outstanding, using the treasury stock method. Fully diluted shares include the adjustment for the dilutive effect of common stock awards, which include outstanding stock options and unvested restricted stock units under the 2013 Incentive Plan and the 2018 Incentive Plan.
5. INVESTMENT SECURITIES
The following tables detail the amortized cost, allowance for credit losses and the estimated fair value of the Company's investments in available-for-sale and held-to-maturity debt securities. None of the Company's investments in debt securities are classified as trading.
| | December 31, 2021 |
| December 31, 2023 | | | December 31, 2023 |
| (Dollars in thousands) | (Dollars in thousands) | Amortized Cost | | Gross Unrealized Gain | | Gross Unrealized Loss | | Allowance for
Credit Losses | | Fair Value | (Dollars in thousands) | Amortized Cost | | Gross Unrealized Gain | | Gross Unrealized Loss | | Allowance for
Credit Losses | | Fair Value |
| Available-for-Sale Debt Securities | Available-for-Sale Debt Securities | | | | | | | | | |
| Collateralized mortgage obligation (CMO) | |
| Collateralized mortgage obligation (CMO) | |
| Collateralized mortgage obligation (CMO) | Collateralized mortgage obligation (CMO) | $ | 586,830 | | | $ | 3,569 | | | $ | 14,633 | | | $ | — | | | $ | 575,766 | |
| Fannie Mae (FNMA) mortgage-backed securities (MBS) | Fannie Mae (FNMA) mortgage-backed securities (MBS) | 4,275,307 | | | 24,170 | | | 53,793 | | | — | | | 4,245,684 | |
| Freddie Mac (FHLMC) MBS | Freddie Mac (FHLMC) MBS | 139,708 | | | 6,336 | | | 516 | | | — | | | 145,528 | |
| Ginnie Mae (GNMA) MBS | Ginnie Mae (GNMA) MBS | 17,456 | | | 551 | | | 71 | | | — | | | 17,936 | |
| Government-sponsored enterprises (GSE) agency notes | Government-sponsored enterprises (GSE) agency notes | 230,581 | | | — | | | 10,184 | | | — | | | 220,397 | |
| $ | |
Held-to-Maturity Debt Securities(1) | |
| FNMA MBS | |
| FNMA MBS | |
| FNMA MBS | |
| State and political subdivisions | |
| | $ | 5,249,882 | | | $ | 34,626 | | | $ | 79,197 | | | $ | — | | | $ | 5,205,311 | |
Held-to-Maturity Debt Securities(1) | | | | | | | | | |
| State and political subdivisions | $ | 90,146 | | | $ | 3,489 | | | $ | — | | | $ | 4 | | | $ | 93,631 | |
| Foreign bonds | 500 | | | — | | | — | | | — | | | 500 | |
| $ | 90,646 | | | $ | 3,489 | | | $ | — | | | $ | 4 | | | $ | 94,131 | |
| $ | |
| $ | |
| $ | |
(1)Held-to-maturity securities transferred from available-for-sale are included in held-to-maturity at amortized cost basis at the time of transfer. The amortized cost of transferred held-to-maturity securities included net unrealized gainslosses of $0.2$120.4 million at December 31, 2021,2023, which are offset in Accumulated other comprehensive income (loss)loss. At the time of transfer, there was no allowance for credit loss on the available-for-sale securities. Subsequent to transfer, the securities were evaluated for credit loss.
| | December 31, 2020 |
| December 31, 2022 | | | December 31, 2022 |
| (Dollars in thousands) | (Dollars in thousands) | Amortized Cost | | Gross Unrealized Gain | | Gross Unrealized Loss | | Allowance for
Credit Losses | | Fair Value | (Dollars in thousands) | Amortized Cost | | Gross Unrealized Gain | | Gross Unrealized Loss | | Allowance for
Credit Losses | | Fair Value |
| Available-for-Sale Debt Securities | Available-for-Sale Debt Securities | | | | | | | | | |
| CMO | |
| CMO | |
| CMO | CMO | $ | 461,819 | | | $ | 9,949 | | | $ | 443 | | | $ | — | | | $ | 471,325 | |
| FNMA MBS | FNMA MBS | 1,544,105 | | | 55,747 | | | 882 | | | — | | | 1,598,970 | |
| FHLMC MBS | FHLMC MBS | 190,856 | | | 12,142 | | | 105 | | | — | | | 202,893 | |
| GNMA MBS | GNMA MBS | 22,716 | | | 1,046 | | | — | | | — | | | 23,762 | |
| GSE agency notes | GSE agency notes | 230,769 | | | 1,987 | | | 649 | | | — | | | 232,107 | |
| $ | 2,450,265 | | | $ | 80,871 | | | $ | 2,079 | | | $ | — | | | $ | 2,529,057 | |
| $ | |
Held-to-Maturity Debt Securities(1) | Held-to-Maturity Debt Securities(1) | | | | | | | | | |
| FNMA MBS | |
| FNMA MBS | |
| FNMA MBS | |
| State and political subdivisions | State and political subdivisions | $ | 111,246 | | | $ | 4,678 | | | $ | — | | | $ | 6 | | | $ | 115,918 | |
| Foreign bonds | Foreign bonds | 501 | | | 2 | | | — | | | — | | | 503 | |
| $ | 111,747 | | | $ | 4,680 | | | $ | — | | | $ | 6 | | | $ | 116,421 | |
| $ | |
(1)Held-to–maturity securities transferred from available-for-sale are included in held-to-maturity at fair valueamortized cost basis at the time of transfer. The amortized cost of transferred held-to-maturity securities included net unrealized gainslosses of $0.4$142.8 million at December 31, 2020,2022, which are offset in Accumulated other comprehensive income (loss)loss. At the time of transfer, there was no allowance for credit loss on the available-for-sale securities. Subsequent to transfer, the securities were evaluated for credit loss.
The scheduled maturities of available-for-sale and held-to-maturity debt securities at December 31, 20212023 and December 31, 20202022 are presented in the table below:
| | | Available-for-Sale | | Available-for-Sale |
| (Dollars in thousands) | (Dollars in thousands) | Amortized Cost | | Fair Value | (Dollars in thousands) | Amortized Cost | | Fair Value |
December 31, 2021 (1) | | | |
December 31, 2023 (1) | |
| Within one year | |
| Within one year | |
| Within one year | Within one year | $ | — | | | $ | — | |
| After one year but within five years | After one year but within five years | 103,960 | | | 107,009 | |
| After five years but within ten years | After five years but within ten years | 204,186 | | | 204,289 | |
| After ten years | After ten years | 4,941,736 | | | 4,894,013 | |
| $ | 5,249,882 | | | $ | 5,205,311 | |
December 31, 2020 (1) | | | |
| $ | |
December 31, 2022 (1) | |
| Within one year | |
| Within one year | |
| Within one year | Within one year | $ | — | | | $ | — | |
| After one year but within five years | After one year but within five years | 37,852 | | | 39,985 | |
| After five years but within ten years | After five years but within ten years | 239,845 | | | 251,874 | |
| After ten years | After ten years | 2,172,568 | | | 2,237,198 | |
| $ | 2,450,265 | | | $ | 2,529,057 | |
| | Held-to-Maturity |
| (Dollars in thousands) | Amortized Cost | | Fair Value |
December 31, 2021 (1) | | | |
| Within one year | $ | 232 | | | $ | 234 | |
| After one year but within five years | 2,675 | | | 2,736 | |
| After five years but within ten years | 44,137 | | | 45,404 | |
| After ten years | 43,602 | | | 45,757 | |
| $ | 90,646 | | | $ | 94,131 | |
December 31, 2020 (1) | | | |
| Within one year | $ | 1,144 | | | $ | 1,154 | |
| After one year but within five years | 972 | | | 990 | |
| After five years but within ten years | 35,967 | | | 37,317 | |
| After ten years | 73,664 | | | 76,960 | |
| $ | 111,747 | | | $ | 116,421 | |
| $ | |
(1)Actual maturities could differ from contractual maturities.
As of December 31, 2023, the Company’s available-for-sale investment securities consisted of 966 securities, 957 of which were in an unrealized loss position.
As of December 31, 2023, substantially all of the Company’s available-for-sale investment securities were mortgage-backed securities or collateral mortgage obligations which were issued or guaranteed by U.S. government-sponsored entities and agencies.
As of December 31, 2023 and December 31, 2022, there were no holdings of securities of any one issuer, other than the U.S. government and its agencies, in an amount greater than 10% of shareholders’ equity.
The scheduled maturities of held-to-maturity debt securities at December 31, 2023 and December 31, 2022 are presented in the table below:
| | | | | | | | | | | |
| Held-to-Maturity |
| (Dollars in thousands) | Amortized Cost | | Fair Value |
December 31, 2023 (1) | | | |
| Within one year | $ | — | | | $ | — | |
| After one year but within five years | 10,932 | | | 10,856 | |
| After five years but within ten years | 46,489 | | | 46,246 | |
| After ten years | 1,001,144 | | | 928,829 | |
| $ | 1,058,565 | | | $ | 985,931 | |
December 31, 2022 (1) | | | |
| Within one year | $ | 731 | | | $ | 732 | |
| After one year but within five years | 9,530 | | | 9,476 | |
| After five years but within ten years | 46,170 | | | 45,944 | |
| After ten years | 1,055,198 | | | 983,952 | |
| $ | 1,111,629 | | | $ | 1,040,104 | |
MBS may have expected maturities that differ from their contractual maturities. These differences arise because issuers may have the right to call securities and borrowers may have the right to prepay obligations with or without prepayment penalty. The estimated weighted average duration of MBS was 4.65.8 years at December 31, 2021.2023.
The held-to-maturity debt securities are not collateral-dependent securities as these are general obligation bonds issued by cities, states, counties, or other local and foreign governments.
During the second quarter of 2022, the Company transferred investment securities with a book value of $1.1 billion from available-for-sale to held-to-maturity to mitigate the impact of the rising interest rate environment to Accumulated other comprehensive income (loss) in the Company's Consolidated Statement of Changes in Stockholders' Equity. The transfer occurred at a fair value totaling $931.4 million. The amortized cost of transferred held-to-maturity securities included net unrealized losses of $157.6 million at June 30, 2022, which are offset in Accumulated other comprehensive income (loss). No gains or losses on these securities were recognized at the time of transfer.
Investment securities with fair market values aggregating $2.2$3.3 billion and $1.3$2.8 billion were pledged as collateral for retail customerinvestment sweep repurchase agreements, municipal deposits, and other obligations as of December 31, 20212023 and December 31, 2020,2022, respectively.
During the years ended December 31, 2023 and December 31, 2022, the Company had no sales of debt securities categorized as available-for-sale. During the year ended December 31, 2021, the Company sold $14.1 million of debt securities categorized as available-for-sale, resulting in $0.3 million of realized gains and no realized losses. During the year ended December 31, 2020, the Company sold $305.8 million of debt securities categorized as available-for-sale, resulting in $9.1 million of realized gains and no realized losses. During the year ended December 31, 2019, the Company sold $618.2 million, of which $578.8 million was related to the acquisition of Beneficial. The remaining $39.8 million resulted in realized gains of $0.3 million and no realized losses.
As of December 31, 20212023 and December 31, 2020,2022, the Company's debt securities portfolio had remaining unamortized premiums of $69.4$56.9 million and $60.4$66.6 million, respectively, and unaccreted discounts of $12.7$20.9 million and $2.6$25.2 million, respectively.
For debt securities in an unrealized loss position and an allowance has not been recorded, the table below shows the gross unrealized losses and fair value by investment category and length of time that individual debt securities were in a continuous unrealized loss position at December 31, 2021.2023.
| | | | Duration of Unrealized Loss Position | | | | | | Duration of Unrealized Loss Position | | |
| Less than 12 months | | 12 months or longer | | Total |
| Less than 12 months | | | Less than 12 months | | 12 months or longer | | Total |
| (Dollars in thousands) | (Dollars in thousands) | Fair Value | | Unrealized Loss | | Fair Value | | Unrealized Loss | | Fair Value | | Unrealized Loss | (Dollars in thousands) | Fair Value | | Unrealized Loss | | Fair Value | | Unrealized Loss | | Fair Value | | Unrealized Loss |
| Available-for-sale debt securities: | Available-for-sale debt securities: | | | | | | | | | | | |
| CMO | |
| CMO | |
| CMO | CMO | $ | 411,347 | | | $ | 12,730 | | | $ | 35,638 | | | $ | 1,903 | | | $ | 446,985 | | | $ | 14,633 | |
| FNMA MBS | FNMA MBS | 3,018,606 | | | 41,021 | | | 356,665 | | | 12,772 | | | 3,375,271 | | | 53,793 | |
| FHLMC MBS | FHLMC MBS | 11,227 | | | 348 | | | 1,917 | | | 168 | | | 13,144 | | | 516 | |
| GNMA MBS | GNMA MBS | 4,847 | | | 71 | | | — | | | — | | | 4,847 | | | 71 | |
| GSE agency notes | GSE agency notes | 64,509 | | | 1,918 | | | 155,888 | | | 8,266 | | | 220,397 | | | 10,184 | |
| $ | |
| | $ | 3,510,536 | | | $ | 56,088 | | | $ | 550,108 | | | $ | 23,109 | | | $ | 4,060,644 | | | $ | 79,197 | |
| |
For debt securities in an unrealized loss position and an allowance has not been recorded, the table below shows the gross unrealized losses and fair value by investment category and length of time that individual debt securities were in a continuous unrealized loss position at December 31, 2020.2022.
| | Duration of Unrealized Loss Position | |
| | |
| | |
| | | Less than 12 months | | 12 months or longer | | Total |
| Fair | | | Fair | | Unrealized | | Fair | | Unrealized | | Fair | | Unrealized |
| (Dollars in thousands) | | (Dollars in thousands) | Value | | Loss | | Value | | Loss | | Value | | Loss |
| Available-for-sale debt securities: | |
| CMO | |
| CMO | |
| CMO | |
| FNMA MBS | |
| FHLMC MBS | |
| GNMA MBS | |
| GSE agency notes | |
| $ | |
| | | Duration of Unrealized Loss Position | |
| | | Less than 12 months | | 12 months or longer | | Total |
| | Fair | | Unrealized | | Fair | | Unrealized | | Fair | | Unrealized |
| (Dollars in thousands) | Value | | Loss | | Value | | Loss | | Value | | Loss |
| Available-for-sale debt securities: | | | | | | | | | |
| CMO | $ | 183,983 | | | $ | 443 | | | $ | — | | | $ | — | | | $ | 183,983 | | | $ | 443 | |
| FNMA MBS | 289,338 | | | 879 | | | 4,355 | | | 3 | | | 293,693 | | | 882 | |
| FHLMC MBS | 5,191 | | | 105 | | | — | | | — | | | 5,191 | | | 105 | |
| | GSE agency notes | 101,016 | | | 649 | | | — | | | — | | | 101,016 | | | 649 | |
| $ | 579,528 | | | $ | 2,076 | | | $ | 4,355 | | | $ | 3 | | | $ | 583,883 | | | $ | 2,079 | |
|
At December 31, 2021,2023, available-for-sale debt securities for which the amortized cost basis exceeded fair value totaled $4.1$3.8 billion. Total unrealized losses on these securities were $79.2$658.0 million at December 31, 2021.2023. The Company does not have the intent to sell, nor is it more likely than not it will be required to sell these securities before it is able to recover the amortized cost basis. The unrealized losses are the result of changes in market interest rates subsequent to purchase, not credit loss, as these are highly rated agency securities with no expected credit loss, in the event of a default. As a result, there is no allowance for credit losses recorded for available-for-sale debt securities as of December 31, 2021.2023.
At December 31, 20212023 and December 31, 2020,2022, held-to-maturity debt securities had an amortized cost basis of $90.6 million and $111.7 million, respectively.$1.1 billion. The held-to-maturity debt security portfolio primarily consists of mortgage-backed securities which were issued or guaranteed by U.S. government-sponsored entities and agencies and highly rated municipal bonds. The Company monitors credit quality of its debt securities through credit ratings.
The following table summarizes the amortized cost of debt securities held-to-maturity as of December 31, 2021,2023, aggregated by credit quality indicator:
| | | | | | | | | | | | | | |
| (Dollars in thousands) | | State and political subdivisions | | Foreign bonds |
| A+ rated or higher | | $ | 90,146 | | | $ | 500 | |
| Not rated | | — | | | — | |
| Ending balance | | $ | 90,146 | | | $ | 500 | |
| | | | | | | | | | | | | | | | |
| (Dollars in thousands) | | FNMA MBS | | State and political subdivisions | | |
| A+ rated or higher | | $ | — | | | $ | 185,912 | | | |
| Not rated | | 872,653 | | | — | | | |
| Ending balance | | $ | 872,653 | | | $ | 185,912 | | | |
The following table summarizes the amortized cost of debt securities held-to-maturity as of December 31, 2020,2022, aggregated by credit quality indicator:
| | (Dollars in thousands) | (Dollars in thousands) | | State and political subdivisions | | Foreign bonds | (Dollars in thousands) | | FNMA MBS | | State and political subdivisions | | Foreign bonds |
| A+ rated or higher | A+ rated or higher | | $ | 110,959 | | | $ | 501 | |
| Not rated | Not rated | | 287 | | | — | |
| Ending balance | Ending balance | | $ | 111,246 | | | $ | 501 | |
The Company reviewed its held-to-maturity debt securities by major security type for potential credit losses. There was no activity in the allowance for credit losses for FNMA MBS and foreign bond debt securities for the twelve months ended December 31, 20212023 and 2020.2022. The following table presents the activity in the allowance for credit losses for state and political subdivisions debt securities for the twelve months ended December 31, 20212023 and 2020:2022:
| | Twelve months ended December 31, | |
| | Twelve months ended December 31, | |
| | Twelve months ended December 31, | |
| | Twelve months ended December 31, | |
| (Dollars in thousands) | |
| (Dollars in thousands) | |
| (Dollars in thousands) | (Dollars in thousands) | | 2021 | | 2020 | | 2023 | | 2022 |
| | Allowance for credit losses: | Allowance for credit losses: | | | | | | |
| Allowance for credit losses: | |
| Allowance for credit losses: | |
| Beginning balance | Beginning balance | | $ | 6 | | | | $ | — | | |
| Impact of adoption ASC 326 | | — | | | | 8 | | |
| Beginning balance | |
| Beginning balance | |
| | Provision for credit losses | Provision for credit losses | | (2) | | | | (2) | | |
| | Charge-offs, net | | — | | | | — | | |
| Provision for credit losses | |
| | Provision for credit losses | |
| | | Ending balance | Ending balance | | $ | 4 | | | | $ | 6 | | |
| | Ending balance | |
| | Ending balance | |
Accrued interest receivable of $0.9$3.7 million and $1.1$2.4 million as of December 31, 20212023 and December 31, 2020,2022, respectively, for held-to-maturity debt securities were excluded from the evaluation of allowance for credit losses. There were no nonaccrual or past due held-to-maturity debt securities as of December 31, 20212023 and December 31, 2020.
Equity Investments
The Company had equity investments with a fair value of $10.5$17.4 million and $9.5$26.1 million as of December 31, 20212023 and December 31, 2020,2022, respectively.
During the year ended December 31, 2023, total net gains on equity investments of $9.8 million were recorded, driven by a realized gain on the Company's investment in Spring EQ presented within Realized gain (loss) on sale of equity investment, net in the Consolidated Statements of Income. During the year ended December 31, 2023, the Company recognized $2.5 million of net gains related to our equity method investments within Other income on the Consolidated Statements of Income.
During the year ended December 31, 2022, total net gains on equity investments of $6.0 million were recorded, driven by an unrealized gain on the Company's investment in cred.ai presented within Unrealized gain on equity investment, net in the Consolidated Statements of Income. During the year ended December 31, 2022, the Company recognized $5.4 million of net gains related to our equity method investments within Other income on the Consolidated Statements of Income.
During the twelve months ended December 31, 2021, total net gains on equity investments of $4.4 million were recorded from the sale of the Company's investment in Social Finance, Inc. (SoFi) in July 2021. This included a net realized loss of $0.7 million which was recorded inRealized loss (gain)gain (loss) on sale of equity investments,investment, net in the Consolidated Statements of Income at the time of sale.
During the twelve months ended December 31, 2020, total net gains on equity investments of $22.8 million were recorded in the Company's Consolidated Statements of Income. This included a net realized gain of $22.1 million which was recorded in Realized loss (gain) on equity investments, net for the sale of Visa Class B shares in June 2020.
During the twelve months ended December 31, 2019, total net gains on equity investments of $26.2 million were recorded in the Company's Consolidated Statements of Income.
6. LOANS AND LEASES
The following table shows the Company's loan portfolio by category: | | | | December 31, | | December 31, |
| (Dollars in thousands) | (Dollars in thousands) | 2021 | | 2020 | (Dollars in thousands) | 2023 | | 2022 |
Commercial and industrial(1) | $ | 1,918,043 | | | $ | 2,700,418 | |
| Commercial and industrial | |
| Owner-occupied commercial | Owner-occupied commercial | 1,341,707 | | | 1,332,727 | |
| Commercial mortgages | Commercial mortgages | 1,881,510 | | | 2,086,062 | |
| Construction | Construction | 687,213 | | | 716,275 | |
| Commercial small business leases | Commercial small business leases | 352,276 | | | 248,885 | |
Residential(2) | 546,667 | | | 774,455 | |
Consumer(3) | 1,158,573 | | | 1,165,917 | |
| 7,885,989 | | | 9,024,739 | |
Residential(1) | |
Consumer(2) | |
| 12,769,328 | |
| Less: | Less: | | | |
| | Allowance for credit losses | Allowance for credit losses | 94,507 | | | 228,804 | |
| | Allowance for credit losses | |
| | Allowance for credit losses | |
| Net loans and leases | Net loans and leases | $ | 7,791,482 | | | $ | 8,795,935 | |
(1)Includes PPP loans of $31.5 million and $751.2 million at December 31, 2021 and 2020, respectively.
(2)Includes reverse mortgages, at fair value of $3.9$2.8 million and $10.1$2.4 million at December 31, 20212023 and 2020,2022, respectively.
(3)(2)Includes home equity lines of credit, installment loans unsecured lines of credit and education loans.
Accrued interest receivable on loans outstanding was $31.6$69.8 million and $37.6$59.3 million at December 31, 20212023 and 2020,2022, respectively.
7. ALLOWANCE FOR CREDIT LOSSES AND CREDIT QUALITY INFORMATION
The following tables provide the activity of the Company's allowance for credit losses and loan and lease balances for the years ended December 31, 20212023, 2022, and December 31, 2020 in accordance with ASC 326.2021. During 2021,2023, the decrease to the allowance for credit lossesincrease was primarily due to positive impactsnet loan growth in our commercial mortgage, commercial small business leasing, and Upstart portfolios and higher provision on the economic forecastsour commercial small business leasing, Upstart, commercial mortgage and significantly improved credit quality metrics that reverted the Company's problem assets, nonperforming assets and delinquencies to at or near the levels prior to the COVID-19 pandemic.elder care (subset of C&I) portfolios.
| | (Dollars in thousands) | (Dollars in thousands) | Commercial and Industrial(1) | | Owner- occupied Commercial | | Commercial Mortgages | | Construction | | Residential(2) | | Consumer(3) | | Total | (Dollars in thousands) | Commercial and Industrial(1) | | Owner- occupied Commercial | | Commercial Mortgages | | Construction | | Residential(2) | | Consumer(3) | | Total |
Year Ended December 31, 2021 | | Year Ended December 31, 2023 | | Year Ended December 31, 2023 |
| Allowance for credit losses | Allowance for credit losses | |
| Beginning balance | Beginning balance | $ | 150,875 | | | $ | 9,615 | | | $ | 31,071 | | | $ | 12,190 | | | $ | 6,893 | | | $ | 18,160 | | | $ | 228,804 | |
| Beginning balance | |
| Beginning balance | |
| | Charge-offs | |
| Charge-offs | |
| Charge-offs | Charge-offs | (23,592) | | | (83) | | | (73) | | | (2,473) | | | — | | | (2,094) | | | (28,315) | |
| Recoveries | Recoveries | 8,756 | | | 160 | | | 269 | | | — | | | 789 | | | 1,131 | | | 11,105 | |
| (Credit) provision | (86,072) | | | (5,118) | | | (19,644) | | | (7,814) | | | (4,330) | | | 5,891 | | | (117,087) | |
| Provision | |
| Ending balance | Ending balance | $ | 49,967 | | | $ | 4,574 | | | $ | 11,623 | | | $ | 1,903 | | | $ | 3,352 | | | $ | 23,088 | | | $ | 94,507 | |
| Period-end allowance allocated to: | Period-end allowance allocated to: | | | | | | | | | | | | | |
| Loans evaluated on an individual basis | |
| Loans evaluated on an individual basis | |
| Loans evaluated on an individual basis | Loans evaluated on an individual basis | $ | 1 | | | $ | — | | | $ | 7 | | | $ | — | | | $ | — | | | $ | — | | | $ | 8 | |
| Loans evaluated on a collective basis | Loans evaluated on a collective basis | 49,966 | | | 4,574 | | | 11,616 | | | 1,903 | | | 3,352 | | | 23,088 | | | 94,499 | |
| Ending balance | Ending balance | $ | 49,967 | | | $ | 4,574 | | | $ | 11,623 | | | $ | 1,903 | | | $ | 3,352 | | | $ | 23,088 | | | $ | 94,507 | |
| Period-end loan balances: | Period-end loan balances: | | | | | | | | | | | | | |
| Loans evaluated on an individual basis | Loans evaluated on an individual basis | $ | 8,363 | | | $ | 1,690 | | | $ | 3,764 | | | $ | — | | | $ | 5,000 | | | $ | 2,321 | | | $ | 21,138 | |
| Loans evaluated on an individual basis | |
| Loans evaluated on an individual basis | |
| Loans evaluated on a collective basis | Loans evaluated on a collective basis | 2,261,956 | | | 1,340,017 | | | 1,877,746 | | | 687,213 | | | 537,733 | | | 1,156,252 | | | 7,860,917 | |
| Ending balance | Ending balance | $ | 2,270,319 | | | $ | 1,341,707 | | | $ | 1,881,510 | | | $ | 687,213 | | | $ | 542,733 | | | $ | 1,158,573 | | | $ | 7,882,055 | |
(1)Includes commercial small business leases.
(2)Period-end loan balance excludes reverse mortgages at fair value of $2.8 million.
(3)Includes home equity lines of credit, installment loans, unsecured lines of credit and education loans.
| | | | | | | | | | | | | | | | | | | | | | | | | | | | | | | | | | | | | | | | | |
| (Dollars in thousands) | Commercial and Industrial(1) | | Owner-
occupied
Commercial | | Commercial
Mortgages | | Construction | | Residential(2) | | Consumer(3) | | Total |
| Year Ended December 31, 2022 |
| Allowance for credit losses | | | | | | | | | | | | | |
| Beginning balance | $ | 49,967 | | | $ | 4,574 | | | $ | 11,623 | | | $ | 1,903 | | | $ | 3,352 | | | $ | 23,088 | | | $ | 94,507 | |
| Initial allowance on acquired PCD loans | 22,614 | | | 595 | | | 2,684 | | | 71 | | | 61 | | | 78 | | | 26,103 | |
| Charge-offs | (19,004) | | | (179) | | | (581) | | | — | | | (186) | | | (7,520) | | | (27,470) | |
| Recoveries | 6,112 | | | 278 | | | 223 | | | 2,567 | | | 665 | | | 793 | | | 10,638 | |
(Credit) provision(4) | (295) | | | 751 | | | 7,524 | | | 2,446 | | | 776 | | | 36,881 | | | 48,083 | |
| Ending balance | $ | 59,394 | | | $ | 6,019 | | | $ | 21,473 | | | $ | 6,987 | | | $ | 4,668 | | | $ | 53,320 | | | $ | 151,861 | |
| Period-end allowance allocated to: | | | | | | | | | | | | | |
| Loans evaluated on an individual basis | $ | 2,428 | | | $ | — | | | $ | — | | | $ | — | | | $ | — | | | $ | — | | | $ | 2,428 | |
| Loans evaluated on a collective basis | 56,966 | | | 6,019 | | | 21,473 | | | 6,987 | | | 4,668 | | | 53,320 | | | 149,433 | |
| Ending balance | $ | 59,394 | | | $ | 6,019 | | | $ | 21,473 | | | $ | 6,987 | | | $ | 4,668 | | | $ | 53,320 | | | $ | 151,861 | |
| Period-end loan balances: | | | | | | | | | | | | | |
| Loans evaluated on an individual basis | $ | 17,572 | | | $ | 1,929 | | | $ | 6,369 | | | $ | 5,143 | | | $ | 7,680 | | | $ | 2,047 | | | $ | 40,740 | |
| Loans evaluated on a collective basis | 3,116,754 | | | 1,807,653 | | | 3,344,715 | | | 1,038,906 | | | 751,785 | | | 1,808,883 | | | 11,868,696 | |
| Ending balance | $ | 3,134,326 | | | $ | 1,809,582 | | | $ | 3,351,084 | | | $ | 1,044,049 | | | $ | 759,465 | | | $ | 1,810,930 | | | $ | 11,909,436 | |
(1)Includes commercial small business leases.
(2)Period-end loan balance excludes reverse mortgages at fair value of $2.4 million.
(3)Includes home equity lines of credit, installment loans, unsecured lines of credit and education loans.
(4)Includes $23.5 million initial provision for credit losses on non-PCD loans.
| | | | | | | | | | | | | | | | | | | | | | | | | | | | | | | | | | | | | | | | | |
| (Dollars in thousands) | Commercial and Industrial(1) | | Owner- occupied Commercial | | Commercial Mortgages | | Construction | | Residential(2) | | Consumer(3) | | Total |
| Year Ended December 31, 2021 | | | | | | | | | | | | | |
| Allowance for loan and lease losses | | | | | | | | | | | | | |
| Beginning balance | $ | 150,875 | | | $ | 9,615 | | | $ | 31,071 | | | $ | 12,190 | | | $ | 6,893 | | | $ | 18,160 | | | $ | 228,804 | |
| | | | | | | | | | | | | |
| Charge-offs | (23,592) | | | (83) | | | (73) | | | (2,473) | | | — | | | (2,094) | | | (28,315) | |
| Recoveries | 8,756 | | | 160 | | | 269 | | | — | | | 789 | | | 1,131 | | | 11,105 | |
| (Credit) provision | (86,072) | | | (5,118) | | | (19,644) | | | (7,814) | | | (4,330) | | | 5,891 | | | (117,087) | |
| Ending balance | $ | 49,967 | | | $ | 4,574 | | | $ | 11,623 | | | $ | 1,903 | | | $ | 3,352 | | | $ | 23,088 | | | $ | 94,507 | |
| Period-end allowance allocated to: | | | | | | | | | | | | | |
| Loans evaluated on an individual basis | $ | 1 | | | $ | — | | | $ | 7 | | | $ | — | | | $ | — | | | $ | — | | | $ | 8 | |
| Loans evaluated on a collective basis | 49,966 | | | 4,574 | | | 11,616 | | | 1,903 | | | 3,352 | | | 23,088 | | | 94,499 | |
| Ending balance | $ | 49,967 | | | $ | 4,574 | | | $ | 11,623 | | | $ | 1,903 | | | $ | 3,352 | | | $ | 23,088 | | | $ | 94,507 | |
| Period-end loan balances: | | | | | | | | | | | | | |
| Loans evaluated on an individual basis | $ | 8,363 | | | $ | 1,690 | | | $ | 3,764 | | | $ | — | | | $ | 5,000 | | | $ | 2,321 | | | $ | 21,138 | |
| Loans evaluated on a collective basis | 2,261,956 | | | 1,340,017 | | | 1,877,746 | | | 687,213 | | | 537,733 | | | 1,156,252 | | | 7,860,917 | |
| Ending balance | $ | 2,270,319 | | | $ | 1,341,707 | | | $ | 1,881,510 | | | $ | 687,213 | | | $ | 542,733 | | | $ | 1,158,573 | | | $ | 7,882,055 | |
(1)Includes commercial small business leases and PPP loans.
(2)Period-end loan balance excludes reverse mortgages at fair value of $3.9 million.
(3)Includes home equity lines of credit, installment loans, unsecured lines of credit and education loans.
| | | | | | | | | | | | | | | | | | | | | | | | | | | | | | | | | | | | | | | | | |
| (Dollars in thousands) | Commercial and Industrial(1) | | Owner-
occupied
Commercial | | Commercial
Mortgages | | Construction | | Residential(2) | | Consumer(3) | | Total |
| Year Ended December 31, 2020 |
| Allowance for credit losses | | | | | | | | | | | | | |
| Beginning balance, prior to adoption of ASC 326 | $ | 22,849 | | | $ | 4,616 | | | $ | 7,452 | | | $ | 3,891 | | | $ | 1,381 | | | $ | 7,387 | | | $ | 47,576 | |
Impact of adoption ASC 326(4) | 19,747 | | | (1,472) | | | 1,662 | | | 681 | | | 7,522 | | | 7,715 | | | 35,855 | |
| Charge-offs | (10,388) | | | (336) | | | (104) | | | — | | | (229) | | | (2,464) | | | (13,521) | |
| Recoveries | 4,255 | | | 142 | | | 158 | | | 36 | | | 230 | | | 893 | | | 5,714 | |
| Provision (credit) | 114,412 | | | 6,665 | | | 21,903 | | | 7,582 | | | (2,011) | | | 4,629 | | | 153,180 | |
| Ending balance | $ | 150,875 | | | $ | 9,615 | | | $ | 31,071 | | | $ | 12,190 | | | $ | 6,893 | | | $ | 18,160 | | | $ | 228,804 | |
| Period-end allowance allocated to: | | | | | | | | | | | | | |
| Loans evaluated on an individual basis | $ | 1 | | | $ | — | | | $ | 13 | | | $ | — | | | $ | — | | | $ | — | | | $ | 14 | |
| Loans evaluated on a collective basis | 150,874 | | | 9,615 | | | 31,058 | | | 12,190 | | | 6,893 | | | 18,160 | | | 228,790 | |
| Ending balance | $ | 150,875 | | | $ | 9,615 | | | $ | 31,071 | | | $ | 12,190 | | | $ | 6,893 | | | $ | 18,160 | | | $ | 228,804 | |
| Period-end loan balances: | | | | | | | | | | | | | |
| Loans evaluated on an individual basis | $ | 14,048 | | | $ | 6,496 | | | $ | 20,309 | | | $ | 79 | | | $ | 5,921 | | | $ | 2,371 | | | $ | 49,224 | |
| Loans evaluated on a collective basis | 2,935,255 | | | 1,326,231 | | | 2,065,753 | | | 716,196 | | | 758,472 | | | 1,163,546 | | | 8,965,453 | |
| Ending balance | $ | 2,949,303 | | | $ | 1,332,727 | | | $ | 2,086,062 | | | $ | 716,275 | | | $ | 764,393 | | | $ | 1,165,917 | | | $ | 9,014,677 | |
(1)Includes commercial small business leases and PPP loans.
(2)Period-end loan balance excludes reverse mortgages at fair value of $10.1 million.
(3)Includes home equity lines of credit, installment loans, unsecured lines of credit and education loans.
(4)Includes $0.1 million for the initial allowance on loans purchased with credit deterioration.
The following table provides the activity of the allowance for loan and lease losses and loan and lease balances for the year ended 2019 under the incurred loss model:
| | | | | | | | | | | | | | | | | | | | | | | | | | | | | | | | | | | | | | | | | |
| (Dollars in thousands) | Commercial and Industrial(1) | | Owner- occupied Commercial | | Commercial Mortgages | | Construction | | Residential(2) | | Consumer | | Total |
| Year Ended December 31, 2019 | | | | | | | | | | | | | |
| Allowance for loan and lease losses | | | | | | | | | | | | | |
| Beginning balance | $ | 14,211 | | | $ | 5,057 | | | $ | 6,806 | | | $ | 3,712 | | | $ | 1,428 | | | $ | 8,325 | | | $ | 39,539 | |
| Charge-offs | (17,258) | | | (354) | | | (159) | | | (42) | | | (322) | | | (4,138) | | | (22,273) | |
| Recoveries | 1,621 | | | 200 | | | 1,546 | | | 4 | | | (84) | | | 1,463 | | | 4,750 | |
| Provision (credit) | 23,977 | | | (472) | | | (830) | | | 207 | | | 126 | | | 1,465 | | | 24,473 | |
| Provision for acquired loans | 298 | | | 185 | | | 89 | | | 10 | | | 233 | | | 272 | | | 1,087 | |
| Ending balance | $ | 22,849 | | | $ | 4,616 | | | $ | 7,452 | | | $ | 3,891 | | | $ | 1,381 | | | $ | 7,387 | | | $ | 47,576 | |
| Period-end allowance allocated to: | | | | | | | | | | | | | |
| Individually evaluated for impairment | $ | 1,179 | | | $ | 23 | | | $ | — | | | $ | — | | | $ | 463 | | | $ | 176 | | | $ | 1,841 | |
| Collectively evaluated for impairment | 21,664 | | | 4,383 | | | 7,387 | | | 3,867 | | | 824 | | | 7,210 | | | 45,335 | |
| Acquired loans evaluated for impairment | 6 | | | 210 | | | 65 | | | 24 | | | 94 | | | 1 | | | 400 | |
| Ending balance | $ | 22,849 | | | $ | 4,616 | | | $ | 7,452 | | | $ | 3,891 | | | $ | 1,381 | | | $ | 7,387 | | | $ | 47,576 | |
| Period-end loan balances: | | | | | | | | | | | | | |
Individually evaluated for impairment(3) | $ | 11,158 | | | $ | 4,060 | | | $ | 1,753 | | | $ | — | | | $ | 12,151 | | | $ | 7,467 | | | $ | 36,589 | |
| Collectively evaluated for impairment | 1,619,549 | | | 971,694 | | | 1,105,174 | | | 437,999 | | | 145,582 | | | 899,724 | | | 5,179,722 | |
| Acquired nonimpaired loans | 603,157 | | | 313,955 | | | 1,107,379 | | | 142,592 | | | 834,820 | | | 219,413 | | | 3,221,316 | |
| Acquired impaired loans | 1,564 | | | 6,757 | | | 8,670 | | | 491 | | | 7,326 | | | 2,127 | | | 26,935 | |
Ending balance(4) | $ | 2,235,428 | | | $ | 1,296,466 | | | $ | 2,222,976 | | | $ | 581,082 | | | $ | 999,879 | | | $ | 1,128,731 | | | $ | 8,464,562 | |
(1)Includes commercial small business leases.
(2)Period-end loan balance excludes reverse mortgages at fair value of $16.6 million as of December 31, 2019.
(3)The difference between this amount and nonaccruing loans represents accruing troubled debt restructured loans which are considered to be impaired loans of $14.3 million as of December 31, 2019.
(4)Ending loan balances do not include net deferred fees.
The following tables show nonaccrual and past due loans presented at amortized cost at the date indicated:
| | December 31, 2021 |
| December 31, 2023 | | | December 31, 2023 |
| (Dollars in thousands) | (Dollars in thousands) | 30–89 Days
Past Due and
Still Accruing | | Greater Than 90 Days Past Due and Still Accruing | | Total Past Due And Still Accruing | | Accruing Current Balances | | Nonaccrual Loans(1) | | Total Loans | (Dollars in thousands) | 30–89 Days
Past Due and
Still Accruing | | Greater Than 90 Days Past Due and Still Accruing | | Total Past Due And Still Accruing | | Accruing Current Balances | | Nonaccrual Loans With No Allowance(1) | | Nonaccrual Loans With An Allowance | | Total Loans |
Commercial and industrial(2) | Commercial and industrial(2) | $ | 5,007 | | | $ | 547 | | | $ | 5,554 | | | $ | 2,256,554 | | | $ | 8,211 | | | $ | 2,270,319 | |
| Owner-occupied commercial | Owner-occupied commercial | 741 | | | — | | | 741 | | | 1,340,155 | | | 811 | | | 1,341,707 | |
| Commercial mortgages | Commercial mortgages | 3,525 | | | 810 | | | 4,335 | | | 1,875,105 | | | 2,070 | | | 1,881,510 | |
| Construction | Construction | 7,933 | | | — | | | 7,933 | | | 679,268 | | | 12 | | | 687,213 | |
Residential(3) | Residential(3) | 1,856 | | | — | | | 1,856 | | | 537,752 | | | 3,125 | | | 542,733 | |
Consumer(4) | Consumer(4) | 10,227 | | | 8,634 | | | 18,861 | | | 1,137,332 | | | 2,380 | | | 1,158,573 | |
Total(4) | Total(4) | $ | 29,289 | | | $ | 9,991 | | | $ | 39,280 | | | $ | 7,826,166 | | | $ | 16,609 | | | $ | 7,882,055 | |
| % of Total Loans | % of Total Loans | 0.37 | % | | 0.13 | % | | 0.50 | % | | 99.29 | % | | 0.21 | % | | 100.00 | % | % of Total Loans | 0.28 | % | | 0.09 | % | | 0.37 | % | | 99.13 | % | | 0.46 | % | | 0.04 | % | | 100.00 | % |
(1)NonaccrualExcludes nonaccruing loans with an allowance totaled less than $0.1 million.held-for-sale.
(2)Includes commercial small business leases and PPP loans.leases.
(3)Residential accruing current balances exclude reverse mortgages at fair value of $3.9$2.8 million.
(4)Includes $17.0$14.5 million of delinquent, but still accruing, U.S. government-guaranteed student loans that carry little risk of credit loss.
| | | | | | | | | | | | | | | | | | | | | | | | | | | | | | | | | | | |
| December 31, 2022 |
| (Dollars in thousands) | 30–89 Days
Past Due and
Still Accruing | | Greater Than 90 Days Past Due and Still Accruing | | Total Past Due And Still Accruing | | Accruing Current Balances | | Nonaccrual Loans(1) | | Total Loans |
Commercial and industrial(2) | $ | 10,767 | | | $ | 311 | | | $ | 11,078 | | | $ | 3,116,478 | | | $ | 6,770 | | | $ | 3,134,326 | |
| Owner-occupied commercial | 3,500 | | | 474 | | | 3,974 | | | 1,805,222 | | | 386 | | | 1,809,582 | |
| Commercial mortgages | 2,137 | | | 237 | | | 2,374 | | | 3,343,551 | | | 5,159 | | | 3,351,084 | |
| Construction | — | | | — | | | — | | | 1,038,906 | | | 5,143 | | | 1,044,049 | |
Residential(3) | 2,563 | | | — | | | 2,563 | | | 753,703 | | | 3,199 | | | 759,465 | |
Consumer(4) | 12,263 | | | 15,513 | | | 27,776 | | | 1,781,009 | | | 2,145 | | | 1,810,930 | |
Total(4) | $ | 31,230 | | | $ | 16,535 | | | $ | 47,765 | | | $ | 11,838,869 | | | $ | 22,802 | | | $ | 11,909,436 | |
| % of Total Loans | 0.26 | % | | 0.14 | % | | 0.40 | % | | 99.41 | % | | 0.19 | % | | 100.00 | % |
(1)There were no nonaccrual loans with an allowance as of December 31, 2022.
(2)Includes commercial small business leases.
(3)Residential accruing current balances exclude reverse mortgages at fair value of $2.4 million.
(4)Includes $21.1 million of delinquent, but still accruing, U.S. government-guaranteed student loans that carry little risk of credit loss.
| | | | | | | | | | | | | | | | | | | | | | | | | | | | | | | | | | | |
| December 31, 2020 |
| (Dollars in thousands) | 30–89 Days
Past Due and
Still Accruing | | Greater Than 90 Days Past Due and Still Accruing | | Total Past Due And Still Accruing | | Accruing Current Balances | | Nonaccrual Loans(1) | | Total Loans |
Commercial and industrial(2) | $ | 7,313 | | | $ | 3,652 | | | $ | 10,965 | | | $ | 2,924,522 | | | $ | 13,816 | | | $ | 2,949,303 | |
| Owner-occupied commercial | 3,120 | | | 892 | | | 4,012 | | | 1,323,355 | | | 5,360 | | | 1,332,727 | |
| Commercial mortgages | 5,944 | | | 1,090 | | | 7,034 | | | 2,061,853 | | | 17,175 | | | 2,086,062 | |
| Construction | 371 | | | — | | | 371 | | | 715,904 | | | — | | | 716,275 | |
Residential(3) | 3,049 | | | 25 | | | 3,074 | | | 758,072 | | | 3,247 | | | 764,393 | |
Consumer(4) | 8,355 | | | 11,035 | | | 19,390 | | | 1,144,217 | | | 2,310 | | | 1,165,917 | |
Total(4) | $ | 28,152 | | | $ | 16,694 | | | $ | 44,846 | | | $ | 8,927,923 | | | $ | 41,908 | | | $ | 9,014,677 | |
| % of Total Loans | 0.31 | % | | 0.19 | % | | 0.50 | % | | 99.04 | % | | 0.46 | % | | 100.00 | % |
(1)Nonaccrual loans with an allowance totaled less than $0.1 million.
(2)Includes commercial small business leases and PPP loans.
(3)Residential accruing current balances exclude reverse mortgages at fair value of $10.1 million.
(4)Includes $18.2 million of delinquent, but still accruing, U.S. government-guaranteed student loans that carry little risk of credit loss.
The following table presents the amortized cost basis of nonaccruing collateral-dependent loans by class at December 31, 20212023 and December 31, 2020:2022:
| | December 31, 2021 | | December 31, 2020 |
| | December 31, 2023 | |
| | December 31, 2023 | |
| | December 31, 2023 | | | December 31, 2022 |
| (Dollars in thousands) | (Dollars in thousands) | | Property | | | Equipment and other | | Property | | | Equipment and other | (Dollars in thousands) | | Property | | | | Equipment and other | | Property | | | | Equipment and other |
Commercial and industrial(1) | | $ | 4,199 | | | | $ | 4,012 | | | $ | 10,646 | | | | $ | 3,170 | |
Commercial and industrial(1)(2) | |
| Owner-occupied commercial | Owner-occupied commercial | | 811 | | | | — | | | 5,360 | | | | — | |
| Commercial mortgages | Commercial mortgages | | 2,070 | | | | — | | | 17,175 | | | | — | |
| Construction | Construction | | 12 | | | | — | | | — | | | | — | |
Residential(2) | | 3,125 | | | | — | | | 3,247 | | | | — | |
Consumer(3) | | 2,380 | | | | — | | | 2,294 | | | | 16 | |
Residential(3) | |
Consumer(4) | |
| Total | Total | | $ | 12,597 | | | | $ | 4,012 | | | $ | 38,722 | | | | $ | 3,186 | |
(1)Includes commercial small business leases.
(2)Excludes nonaccruing loans held-for-sale.
(3)Excludes reverse mortgages at fair value.
(3)(4)Includes home equity lines of credit, installment loans, unsecured lines of credit and education loans.
Interest income of $0.8 million was recognized on individually reviewed loans during 2021 and 2020.
As of December 31, 2021,2023, there were 2831 residential loans and 9 commercial loans in the process of foreclosure. The total outstanding balance on the loans was $2.5$3.2 million and $3.2$1.1 million, respectively. As of December 31, 2020,2022, there were 2745 residential loans and 238 commercial loans in the process of foreclosure. The total outstanding balance on the loans was $1.9$6.7 million and $12.8$1.6 million, respectively. Loan workout and OREO expenses recognized were $0.6 million in 2023, $0.4 million in 2022, and $1.5 million in 2021, $3.2 million in 2020, and $2.7 million in 2019.2021. Loan workout and OREO expenses are included in Loan workout and other credit costs on the Consolidated StatementStatements of Income.
Credit Quality Indicators
Below is a description of each of the risk ratings for all commercial loans:
•Pass. These borrowers currently show no indication of deterioration or potential problems and their loans are considered fully collectible.
•Special Mention. These borrowers have potential weaknesses that deserve management’s close attention. Borrowers in this category may be experiencing adverse operating trends, for example, declining revenues or margins, high leverage, tight liquidity, or increasing inventory without increasing sales. These adverse trends can have a potential negative effect on the borrower’s repayment capacity. These assets are not adversely classified and do not expose the Bank to significant risk that would warrant a more severe rating. Borrowers in this category may also be experiencing significant management problems, pending litigation, or other structural credit weaknesses.
•Substandard or Lower. These borrowers have well-defined weaknesses that require extensive oversight by management. Borrowers in this category may exhibit one or more of the following: inadequate debt service coverage, unprofitable operations, insufficient liquidity, high leverage, and weak or inadequate capitalization. Relationships in this category are not adequately protected by the sound financial worth and paying capacity of the obligor or the collateral pledged on the loan, if any. A distinct possibility exists that the Bank will sustain some loss if the deficiencies are not corrected. In addition, some borrowers in this category could have the added characteristic that the possibility of loss is extremely high. Current circumstances in the credit relationship make collection or liquidation in full highly questionable. Such impending events include: perfecting liens on additional collateral, obtaining collateral valuations, an acquisition or liquidation preceding, proposed merger, or refinancing plan.
Residential and Consumer Loans
The residential and consumer loan portfolios are monitored on an ongoing basis using delinquency information and loan type as credit quality indicators. These credit quality indicators are assessed in the aggregate in these relatively homogeneous portfolios. Loans that are greater than 90 days past due are generally considered nonperforming and placed on nonaccrual status.
The following table provides an analysis of loans by portfolio segment based on the credit quality indicators used to determine the allowance for credit losses as of December 31, 2023.
| | | | | | | | | | | | | | | | | | | | | | | | | | | | | | | | | | | | | | | | | | | | | | | | | | | | | | | | |
| | Term Loans Amortized Cost Basis by Origination Year(1) | | | | | | |
| | 2023 | | 2022 | | 2021 | | 2020 | | 2019 | | Prior | | Revolving loans amortized cost basis | | Revolving loans converted to term | | Total |
| (Dollars in thousands) | | | | | | | | | | | | | | | | | | |
Commercial and industrial(2): | | | | | | | | | | | | | | | | |
| Risk Rating | | | | | | | | | | | | | | | | | | |
| Pass | | $ | 977,196 | | | $ | 682,680 | | | $ | 283,771 | | | $ | 251,848 | | | $ | 105,933 | | | $ | 395,601 | | | $ | 8,785 | | | $ | 237,786 | | | $ | 2,943,600 | |
| Special mention | | 7,209 | | | 11,860 | | | 2,804 | | | 463 | | | 735 | | | 743 | | | — | | | 1,649 | | | 25,463 | |
Substandard or Lower(3) | | 72,993 | | | 54,024 | | | 5,951 | | | 10,224 | | | 22,046 | | | 17,906 | | | — | | | 11,485 | | | 194,629 | |
| | $ | 1,057,398 | | | $ | 748,564 | | | $ | 292,526 | | | $ | 262,535 | | | $ | 128,714 | | | $ | 414,250 | | | $ | 8,785 | | | $ | 250,920 | | | $ | 3,163,692 | |
| Current-period gross writeoffs | | $ | 1,528 | | | $ | 7,818 | | | $ | 9,661 | | | $ | 3,201 | | | $ | 8,302 | | | $ | 11,784 | | | $ | — | | | $ | — | | | $ | 42,294 | |
| Owner-occupied commercial: | | | | | | | | | | | | | | | | |
| Risk Rating | | | | | | | | | | | | | | | | | | |
| Pass | | $ | 346,908 | | | $ | 264,895 | | | $ | 251,262 | | | $ | 212,365 | | | $ | 194,153 | | | $ | 313,801 | | | $ | — | | | $ | 178,150 | | | $ | 1,761,534 | |
| Special mention | | 2,885 | | | 3,115 | | | 5,419 | | | 1,105 | | | 11,002 | | | 5,559 | | | — | | | 1,393 | | | 30,478 | |
| Substandard or Lower | | 996 | | | 18,865 | | | 11,109 | | | 6,787 | | | 8,019 | | | 35,330 | | | — | | | 12,969 | | | 94,075 | |
| | $ | 350,789 | | | $ | 286,875 | | | $ | 267,790 | | | $ | 220,257 | | | $ | 213,174 | | | $ | 354,690 | | | $ | — | | | $ | 192,512 | | | $ | 1,886,087 | |
| Current-period gross writeoffs | | $ | — | | | $ | — | | | $ | — | | | $ | — | | | $ | 184 | | | $ | — | | | $ | — | | | $ | — | | | $ | 184 | |
| Commercial mortgages: | | | | | | | | | | | | | | | | | | |
| Risk Rating | | | | | | | | | | | | | | | | | | |
| Pass | | $ | 847,137 | | | $ | 464,895 | | | $ | 526,280 | | | $ | 465,354 | | | $ | 486,855 | | | $ | 619,448 | | | $ | — | | | $ | 290,083 | | | $ | 3,700,052 | |
| Special mention | | 20,632 | | | — | | | 67 | | | 1,837 | | | 10,666 | | | — | | | — | | | — | | | 33,202 | |
| Substandard or Lower | | 9,862 | | | 1,153 | | | 1,047 | | | 13,837 | | | 14,352 | | | 12,212 | | | — | | | 15,463 | | | 67,926 | |
| | $ | 877,631 | | | $ | 466,048 | | | $ | 527,394 | | | $ | 481,028 | | | $ | 511,873 | | | $ | 631,660 | | | $ | — | | | $ | 305,546 | | | $ | 3,801,180 | |
| Current-period gross writeoffs | | $ | — | | | $ | 83 | | | $ | — | | | $ | 217 | | | $ | — | | | $ | — | | | $ | — | | | $ | — | | | $ | 300 | |
| Construction: | | | | | | | | | | | | | | | | | | |
| Risk Rating | | | | | | | | | | | | | | | | | | |
| Pass | | $ | 429,055 | | | $ | 319,958 | | | $ | 111,333 | | | $ | 3,030 | | | $ | 388 | | | $ | 7,016 | | | $ | — | | | $ | 87,741 | | | $ | 958,521 | |
| Special mention | | 28,718 | | | 19,769 | | | 8,227 | | | — | | | — | | | — | | | — | | | — | | | 56,714 | |
| Substandard or Lower | | 5,698 | | | — | | | 3,308 | | | 8,598 | | | 2,134 | | | — | | | — | | | 557 | | | 20,295 | |
| | $ | 463,471 | | | $ | 339,727 | | | $ | 122,868 | | | $ | 11,628 | | | $ | 2,522 | | | $ | 7,016 | | | $ | — | | | $ | 88,298 | | | $ | 1,035,530 | |
| Current-period gross writeoffs | | $ | — | | | $ | — | | | $ | 794 | | | $ | — | | | $ | — | | | $ | — | | | $ | — | | | $ | — | | | $ | 794 | |
Residential(4): | | | | | | | | | | | | | | | | | | |
| Risk Rating | | | | | | | | | | | | | | | | | | |
| Performing | | $ | 188,644 | | | $ | 67,358 | | | $ | 102,982 | | | $ | 57,273 | | | $ | 33,499 | | | $ | 412,099 | | | $ | — | | | $ | — | | | $ | 861,855 | |
| Nonperforming | | — | | | 170 | | | 713 | | | 486 | | | 1,251 | | | 3,420 | | | — | | | — | | | 6,040 | |
| | $ | 188,644 | | | $ | 67,528 | | | $ | 103,695 | | | $ | 57,759 | | | $ | 34,750 | | | $ | 415,519 | | | $ | — | | | $ | — | | | $ | 867,895 | |
| Current-period gross writeoffs | | $ | 33 | | | $ | — | | | $ | — | | | $ | — | | | $ | — | | | $ | 8 | | | $ | — | | | $ | — | | | $ | 41 | |
Consumer(5): | | | | | | | | | | | | | | | | | | |
| Risk Rating | | | | | | | | | | | | | | | | | | |
| Performing | | $ | 391,580 | | | $ | 568,919 | | | $ | 153,930 | | | $ | 104,248 | | | $ | 44,996 | | | $ | 245,849 | | | $ | 494,663 | | | $ | 5,662 | | | $ | 2,009,847 | |
| Nonperforming | | — | | | — | | | 135 | | | 352 | | | 176 | | | 30 | | | 1,362 | | | 232 | | | 2,287 | |
| | $ | 391,580 | | | $ | 568,919 | | | $ | 154,065 | | | $ | 104,600 | | | $ | 45,172 | | | $ | 245,879 | | | $ | 496,025 | | | $ | 5,894 | | | $ | 2,012,134 | |
| Current-period gross writeoffs | | $ | 1,790 | | | $ | 15,227 | | | $ | 4,411 | | | $ | 313 | | | $ | 198 | | | $ | 455 | | | $ | — | | | $ | — | | | $ | 22,394 | |
(1)Origination date represent the most recent underwriting of the loan which includes new relationships, renewals and extensions.
(2)Includes commercial small business leases.
(3)Excludes nonacrruing loans held-for-sale.
(4)Excludes reverse mortgages at fair value.
(5)Includes home equity lines of credit, installment loans, unsecured lines of credit and education loans.
The following table provides an analysis of loans by portfolio segment based on the credit quality indicators used to determine the allowance for credit losses as of December 31, 2021.2022.
| | Term Loans Amortized Cost Basis by Origination Year | |
| 2021 | | 2020 | | 2019 | | 2018 | | 2017 | | Prior | | Revolving loans amortized cost basis | | Revolving loans converted to term | | Total |
| | Term Loans Amortized Cost Basis by Origination Year | |
| | 2022 | |
| | 2022 | |
| | 2022 | | | 2021 | | 2020 | | 2019 | | 2018 | | Prior | | Revolving loans amortized cost basis | | Revolving loans converted to term | | Total |
| (Dollars in thousands) | (Dollars in thousands) | | | | | | | | | | | | | | | | | | |
Commercial and industrial(1): | Commercial and industrial(1): | |
Commercial and industrial(1): | |
Commercial and industrial(1): | |
| Risk Rating | Risk Rating | |
Pass(2) | | $ | 556,896 | | | $ | 420,698 | | | $ | 329,354 | | | $ | 273,345 | | | $ | 139,800 | | | $ | 148,809 | | | $ | 5,551 | | | $ | 176,006 | | | $ | 2,050,459 | |
| Special mention | | 35,910 | | | 949 | | | 3,052 | | | 1,057 | | | 429 | | | 15,299 | | | — | | | 17,545 | | | 74,241 | |
| Substandard or Lower | | 12,533 | | | 14,408 | | | 53,655 | | | 29,046 | | | 19,114 | | | 6,921 | | | 29 | | | 9,913 | | | 145,619 | |
| $ | 605,339 | | | $ | 436,055 | | | $ | 386,061 | | | $ | 303,448 | | | $ | 159,343 | | | $ | 171,029 | | | $ | 5,580 | | | $ | 203,464 | | | $ | 2,270,319 | |
| Owner-occupied commercial: | | | | | | | | | | | | | | | | | | |
| Risk Rating | Risk Rating | |
| Risk Rating | |
| Pass | |
| Pass | |
| Pass | Pass | | $ | 305,156 | | | $ | 189,128 | | | $ | 172,503 | | | $ | 67,526 | | | $ | 136,697 | | | $ | 262,629 | | | $ | — | | | $ | 128,188 | | | $ | 1,261,827 | |
| Special mention | Special mention | | 938 | | | 5,359 | | | 2,561 | | | 891 | | | — | | | 7,019 | | | — | | | 10,543 | | | 27,311 | |
| Substandard or Lower | Substandard or Lower | | 3,192 | | | 13,736 | | | 4,138 | | | 9,418 | | | 5,580 | | | 11,039 | | | — | | | 5,466 | | | 52,569 | |
| $ | 309,286 | | | $ | 208,223 | | | $ | 179,202 | | | $ | 77,835 | | | $ | 142,277 | | | $ | 280,687 | | | $ | — | | | $ | 144,197 | | | $ | 1,341,707 | |
| Commercial mortgages: | | | | | | | | | | | | | | | | | | |
| | $ | |
| Owner-occupied commercial: | |
| Risk Rating | Risk Rating | |
| Risk Rating | |
| Risk Rating | |
| Pass | |
| Pass | |
| Pass | Pass | | $ | 416,149 | | | $ | 280,889 | | | $ | 217,311 | | | $ | 134,477 | | | $ | 229,863 | | | $ | 368,527 | | | $ | — | | | $ | 187,396 | | | $ | 1,834,612 | |
| Special mention | Special mention | | — | | | 4,185 | | | — | | | 861 | | | 11,588 | | | 1,385 | | | — | | | 2,097 | | | 20,116 | |
| Substandard or Lower | Substandard or Lower | | 2,438 | | | 1,624 | | | 3,789 | | | 2,114 | | | 2,254 | | | 14,085 | | | — | | | 478 | | | 26,782 | |
| $ | 418,587 | | | $ | 286,698 | | | $ | 221,100 | | | $ | 137,452 | | | $ | 243,705 | | | $ | 383,997 | | | $ | — | | | $ | 189,971 | | | $ | 1,881,510 | |
| Construction: | | | | | | | | | | | | | | | | | | |
| | $ | |
| Commercial mortgages: | |
| Risk Rating | Risk Rating | |
| Risk Rating | |
| Risk Rating | |
| Pass | |
| Pass | |
| Pass | Pass | | $ | 248,053 | | | $ | 195,269 | | | $ | 84,868 | | | $ | 39,585 | | | $ | 2,223 | | | $ | 11,297 | | | $ | — | | | $ | 88,839 | | | $ | 670,134 | |
| Special mention | Special mention | | — | | | — | | | — | | | — | | | — | | | — | | | — | | | — | | | — | |
| Substandard or Lower | Substandard or Lower | | 12,922 | | | — | | | 2,422 | | | — | | | 90 | | | — | | | — | | | 1,645 | | | 17,079 | |
| $ | 260,975 | | | $ | 195,269 | | | $ | 87,290 | | | $ | 39,585 | | | $ | 2,313 | | | $ | 11,297 | | | $ | — | | | $ | 90,484 | | | $ | 687,213 | |
Residential(3): | | | | | | | | | | | | | | | | | | |
| | $ | |
| Construction: | |
| Risk Rating | |
| Risk Rating | |
| Risk Rating | |
| Pass | |
| Pass | |
| Pass | |
| Special mention | |
| Substandard or Lower | |
| | $ | |
Residential(2): | |
| Risk Rating | |
| Risk Rating | |
| Risk Rating | Risk Rating | |
| Performing | Performing | | $ | 59,977 | | | $ | 28,426 | | | $ | 12,526 | | | $ | 32,871 | | | $ | 44,969 | | | $ | 358,964 | | | $ | — | | | $ | — | | | $ | 537,733 | |
Nonperforming(4) | | — | | | 112 | | | 1,044 | | | — | | | 63 | | | 3,781 | | | — | | | — | | | 5,000 | |
| $ | 59,977 | | | $ | 28,538 | | | $ | 13,570 | | | $ | 32,871 | | | $ | 45,032 | | | $ | 362,745 | | | $ | — | | | $ | — | | | $ | 542,733 | |
Consumer(5): | | | | | | | | | | | | | | | | | | |
| Performing | |
| Performing | |
| Nonperforming | |
| | $ | |
Consumer(3): | |
| Risk Rating | |
| Risk Rating | |
| Risk Rating | Risk Rating | |
| Performing | Performing | | $ | 219,918 | | | $ | 169,922 | | | $ | 74,048 | | | $ | 203,519 | | | $ | 39,113 | | | $ | 60,952 | | | $ | 382,718 | | | $ | 5,364 | | | $ | 1,155,554 | |
Nonperforming(6) | | — | | | 147 | | | — | | | 600 | | | 71 | | | — | | | 1,655 | | | 546 | | | 3,019 | |
| $ | 219,918 | | | $ | 170,069 | | | $ | 74,048 | | | $ | 204,119 | | | $ | 39,184 | | | $ | 60,952 | | | $ | 384,373 | | | $ | 5,910 | | | $ | 1,158,573 | |
| Performing | |
| Performing | |
| Nonperforming | |
| | $ | |
(1)Includes commercial small business leases.
(2)Includes $31.5 million of PPP loans
(3)Excludes reverse mortgages at fair value.
(4)Includes troubled debt restructured mortgages performing in accordance with the loans' modified terms and are accruing interest.
(5)(3)Includes home equity lines of credit, installment loans, unsecured lines of credit and education loans.
(6)Includes troubled debt restructured home equity installment loans performing in accordance with the loans' modified terms and are accruing interest.
Troubled Loans
The Company offers loan modifications to commercial and consumer borrowers that may result in a payment delay, interest rate reduction, term extension, principal forgiveness, or combination thereof. Loan modifications are offered on a case-by-case basis and are generally term extension, payment delay, and interest rate reduction modification types. Forbearance (due to hardship) programs result in modification types including payment delay and/or term extension. In addition, certain reorganization bankruptcy judgments may result in interest rate reduction, term extension, or principal forgiveness modification types.
The following table provides an analysisshows the amortized cost basis at the end of the reporting period of troubled loans, disaggregated by portfolio segment based on the credit quality indicators used to determine the allowance for credit losses asand type of December 31, 2020.modification granted.
| | | | | | | | | | | | | | | | | | | | | | | | | | | | | | | | | | | | | | | | | | | | | | | | | | | | | | | | |
| | Term Loans Amortized Cost Basis by Origination Year | | | | | | |
| | 2020 | | 2019 | | 2018 | | 2017 | | 2016 | | Prior | | Revolving loans amortized cost basis | | Revolving loans converted to term | | Total |
| (Dollars in thousands) | | | | | | | | | | | | | | | | | | |
Commercial and industrial(1): | | | | | | | | | | | | | | | | | | |
| Risk Rating | | | | | | | | | | | | | | | | | | |
Pass(2) | | $ | 1,250,528 | | | $ | 448,704 | | | $ | 296,594 | | | $ | 157,359 | | | $ | 97,036 | | | $ | 125,361 | | | $ | 6,182 | | | $ | 136,110 | | | $ | 2,517,874 | |
| Special mention | | 3,040 | | | 26,470 | | | 28,636 | | | 8,482 | | | 2,577 | | | 16,993 | | | — | | | 34,403 | | | 120,601 | |
| Substandard or Lower | | 82,868 | | | 60,227 | | | 57,880 | | | 50,446 | | | 15,151 | | | 35,150 | | | 63 | | | 9,043 | | | 310,828 | |
| | $ | 1,336,436 | | | $ | 535,401 | | | $ | 383,110 | | | $ | 216,287 | | | $ | 114,764 | | | $ | 177,504 | | | $ | 6,245 | | | $ | 179,556 | | | $ | 2,949,303 | |
| Owner-occupied commercial: | | | | | | | | | | | | | | | | | | |
| Risk Rating | | | | | | | | | | | | | | | | | | |
| Pass | | $ | 220,165 | | | $ | 225,766 | | | $ | 90,515 | | | $ | 135,903 | | | $ | 123,897 | | | $ | 271,086 | | | $ | — | | | $ | 123,194 | | | $ | 1,190,526 | |
| Special mention | | 1,525 | | | 5,885 | | | 1,838 | | | 17,578 | | | 4,125 | | | 1,997 | | | — | | | 14,467 | | | 47,415 | |
| Substandard or Lower | | 3,703 | | | 13,426 | | | 15,272 | | | 19,883 | | | 11,581 | | | 19,331 | | | — | | | 11,590 | | | 94,786 | |
| | $ | 225,393 | | | $ | 245,077 | | | $ | 107,625 | | | $ | 173,364 | | | $ | 139,603 | | | $ | 292,414 | | | $ | — | | | $ | 149,251 | | | $ | 1,332,727 | |
| Commercial mortgages: | | | | | | | | | | | | | | | | | | |
| Risk Rating | | | | | | | | | | | | | | | | | | |
| Pass | | $ | 379,592 | | | $ | 283,004 | | | $ | 240,924 | | | $ | 257,809 | | | $ | 254,780 | | | $ | 375,473 | | | $ | — | | | $ | 148,210 | | | $ | 1,939,792 | |
| Special mention | | 8,324 | | | 1,774 | | | 21,762 | | | 21,269 | | | 1,274 | | | 6,507 | | | — | | | 1,870 | | | 62,780 | |
| Substandard or Lower | | 26,343 | | | 25,402 | | | 2,253 | | | 1,950 | | | 3,242 | | | 24,300 | | | — | | | — | | | 83,490 | |
| | $ | 414,259 | | | $ | 310,180 | | | $ | 264,939 | | | $ | 281,028 | | | $ | 259,296 | | | $ | 406,280 | | | $ | — | | | $ | 150,080 | | | $ | 2,086,062 | |
| Construction: | | | | | | | | | | | | | | | | | | |
| Risk Rating | | | | | | | | | | | | | | | | | | |
| Pass | | $ | 189,257 | | | $ | 214,956 | | | $ | 208,981 | | | $ | 11,414 | | | $ | 7,414 | | | $ | 3,645 | | | $ | — | | | $ | 66,018 | | | $ | 701,685 | |
| Special mention | | — | | | — | | | — | | | 3,515 | | | — | | | — | | | — | | | — | | | 3,515 | |
| Substandard or Lower | | — | | | 8,648 | | | — | | | — | | | — | | | 79 | | | — | | | 2,348 | | | 11,075 | |
| | $ | 189,257 | | | $ | 223,604 | | | $ | 208,981 | | | $ | 14,929 | | | $ | 7,414 | | | $ | 3,724 | | | $ | — | | | $ | 68,366 | | | $ | 716,275 | |
Residential(3): | | | | | | | | | | | | | | | | | | |
| Risk Rating | | | | | | | | | | | | | | | | | | |
| Performing | | $ | 42,475 | | | $ | 26,309 | | | $ | 71,410 | | | $ | 85,277 | | | $ | 149,643 | | | $ | 383,358 | | | $ | — | | | $ | — | | | $ | 758,472 | |
Nonperforming(4) | | 113 | | | — | | | — | | | — | | | 283 | | | 5,525 | | | — | | | — | | | 5,921 | |
| | $ | 42,588 | | | $ | 26,309 | | | $ | 71,410 | | | $ | 85,277 | | | $ | 149,926 | | | $ | 388,883 | | | $ | — | | | $ | — | | | $ | 764,393 | |
Consumer(5): | | | | | | | | | | | | | | | | | | |
| Risk Rating | | | | | | | | | | | | | | | | | | |
| Performing | | $ | 235,948 | | | $ | 134,064 | | | $ | 251,087 | | | $ | 63,713 | | | $ | 44,700 | | | $ | 53,717 | | | $ | 371,842 | | | $ | 8,287 | | | $ | 1,163,358 | |
Nonperforming(6) | | — | | | — | | | 636 | | | 232 | | | — | | | — | | | 1,396 | | | 295 | | | 2,559 | |
| | $ | 235,948 | | | $ | 134,064 | | | $ | 251,723 | | | $ | 63,945 | | | $ | 44,700 | | | $ | 53,717 | | | $ | 373,238 | | | $ | 8,582 | | | $ | 1,165,917 | |
| | | | | | | | | | | | | | | | | | | | | | | | | | | | | | | | | | | | | | | | | | | | | | | | |
| | December 31, 2023 |
| (Dollars in thousands) | | Term Extension | | | | | | More-Than-Insignificant Payment Delay | | Combination- Term Extension and Payment Delay | | Combination- Term Extension and Interest Rate Reduction | | Combination - Payment Delay and Interest Rate Reduction | | Total | | % of Total Loan Category |
Commercial and industrial(1)(2) | | $ | 44,123 | | | | | | | $ | 10,523 | | | $ | 5,568 | | | $ | 27 | | | $ | — | | | $ | 60,241 | | | 1.90 | % |
| Owner-occupied commercial | | 66 | | | | | | | — | | | — | | | 138 | | | — | | | 204 | | | 0.01 | % |
| Commercial mortgages | | 9,386 | | | | | | | — | | | — | | | — | | | — | | | 9,386 | | | 0.25 | % |
| Construction | | 15,411 | | | | | | | — | | | — | | | — | | | — | | | 15,411 | | | 1.49 | % |
| Residential | | 561 | | | | | | | 216 | | | — | | | — | | | — | | | 777 | | | 0.09 | % |
Consumer(3) | | 1,782 | | | | | | | 1,937 | | | 5,092 | | | 156 | | | 194 | | | 9,161 | | | 0.46 | % |
| Total | | $ | 71,329 | | | | | | | $ | 12,676 | | | $ | 10,660 | | | $ | 321 | | | $ | 194 | | | $ | 95,180 | | | 0.75 | % |
(1)Includes commercial small business leases.
(2)Includes $751.2 million of PPP loansExcludes troubled loan held-for-sale.
(3)Excludes reverse mortgages at fair value.
(4)Includes troubled debt restructured mortgages performing in accordance with the loans' modified terms and are accruing interest.
(5)Includes home equity lines of credit, installment loans, unsecured lines of credit and education loans.
The following table describes the financial effect of the modifications made to troubled loans as of December 31, 2023:
| | | | | | | | | | | | | | | | | | | | | | | | | | | | |
| | Term Extension(1) | | | | Interest Rate Reduction(2) | | More-Than-Insignificant Payment Delay(3) | | | | | | |
Commercial and industrial(4) | | 1.34 | | | | 4.00% | | 0.13% | | | | | | |
| Owner-occupied commercial | | 0.95 | | | | 2.59 | | — | | | | | | |
| Commercial mortgages | | 1.33 | | | | — | | — | | | | | | |
| Construction | | 1.00 | | | | — | | — | | | | | | |
| Residential | | 20.18 | | | | — | | — | | | | | | |
| Consumer | | 3.08 | | | | 2.65 | | 0.06 | | | | | | |
(6)(1)IncludesRepresents the weighted-average increase in the life of modified loans measured in years, which reduces monthly payment amounts for borrowers.
(2)Represents the weighted-average decrease in the contractual interest rate on the modified loans.
(3)Represents the percentage of loans deferred over the total loan portfolio excluding reverse mortgages at fair value.
(4)Excludes troubled debt restructured home equity installment loans performing in accordance withloan held-for-sale.
As of December 31, 2023, the loans'Company had commitments to extend credit of $18.4 million to borrowers experiencing financial difficulty whose terms had been modified.
Upon the Company’s determination that a modified termsloan (or portion of a loan) has subsequently been deemed uncollectible, the loan (or a portion of the loan) is written off. Therefore, the amortized cost basis of the loan is reduced by the uncollectible amount and are accruing interest.the allowance for credit losses is adjusted by the same amount.
The following table shows the amortized cost of loans that received a term extension modification that had a payment default during the period and were modified in the 12 months before default to borrowers experiencing financial difficulty as of December 31, 2023.
| | | | | | | | | | | | | | | | | | | | | | | | | | | | | | |
| | | | | | | | More-Than-Insignificant Payment Delay | | Combination Term Extension & Payment Delay | | | | | | Total |
| Commercial and industrial | | | | | | | | $ | — | | | $ | 5,568 | | | | | | | $ | 5,568 | |
| | | | | | | | | | | | | | | | |
| | | | | | | | | | | | | | | | |
| | | | | | | | | | | | | | | | |
| | | | | | | | | | | | | | | | |
| Consumer | | | | | | | | 98 | | | — | | | | | | | 98 | |
| Total | | | | | | | | $ | 98 | | | $ | 5,568 | | | | | | | $ | 5,666 | |
The Company closely monitors the performance of troubled loans to understand the effectiveness of its modification efforts. The following table shows the performance of loans that have been modified in the last 12 months:
| | | | | | | | | | | | | | | | | | | | | | | | | | | | | | | | |
| | December 31, 2023 |
| (Dollars in thousands) | | 30-89 Days Past Due and Still Accruing | | 90+ Days Past Due and Still Accruing | | Accruing Current Balances | | Nonaccrual Loans | | Total |
Commercial and industrial(1)(2) | | $ | 21 | | | $ | 293 | | | $ | 53,989 | | | $ | 5,938 | | | $ | 60,241 | |
| Owner-occupied commercial | | — | | | — | | | — | | | 204 | | | 204 | |
| Commercial mortgages | | — | | | — | | | 9,386 | | | — | | | 9,386 | |
| Construction | | — | | | — | | | 15,411 | | | — | | | 15,411 | |
| Residential | | — | | | — | | | 607 | | | 170 | | | 777 | |
Consumer(3) | | 1,021 | | | 205 | | | 7,539 | | | 396 | | | 9,161 | |
| Total | | $ | 1,042 | | | $ | 498 | | | $ | 86,932 | | | $ | 6,708 | | | $ | 95,180 | |
(1)Includes commercial small business leases.
(2)Excludes troubled loan held-for-sale.
(3)Includes home equity lines of credit, installment loans, unsecured lines of credit and education loans.
Troubled Debt Restructurings (TDR)(TDRs) under ASC 326 for periods prior to adoption of ASU 2022-02
The following table presents the balance of TDRs as of the indicated dates:date:
| | | | | | | | | | | |
| (Dollars in thousands) | December 31, 2021 | | December 31, 2020 |
| Performing TDRs | $ | 14,204 | | | $ | 15,539 | |
| Nonperforming TDRs | 756 | | | 4,601 | |
| Total TDRs | $ | 14,960 | | | $ | 20,140 | |
| | | | | | | |
| (Dollars in thousands) | | | December 31, 2022 |
| Performing TDRs | | | $ | 19,737 | |
| Nonperforming TDRs | | | 2,006 | |
| Total TDRs | | | $ | 21,743 | |
Approximately $0.2 million and less than $0.1$0.6 million in related reserves have been established for these loans at December 31, 2021 and December 31, 2020, respectively.2022.
The following tables present information regarding the types of loan modifications made and the balances of loans modified as TDRs during the yearsyear ended and December 31, 2021 and 2020:2022:
| | December 31, 2021 | | December 31, 2020 |
| Contractual payment reduction | | Maturity date extension | | Discharged in bankruptcy | | Other (1) | | Total | | Contractual
payment
reduction | | Maturity
date
extension | | Discharged
in
bankruptcy | | Other (1) | | Total |
| | | December 31, 2022 | |
| | | December 31, 2022 | |
| | | December 31, 2022 | |
| | | | | | | | | | | Contractual
payment
reduction | | | | | | | | | | | | | Contractual
payment
reduction | | Maturity
date
extension | | Discharged
in
bankruptcy | | Other (1) | | Total |
| Commercial | Commercial | — | | | — | | | — | | | — | | | — | | | 1 | | | — | | | — | | | — | | | 1 | |
| Owner-occupied commercial | Owner-occupied commercial | — | | | — | | | — | | | — | | | — | | | 3 | | | — | | | — | | | — | | | 3 | |
| Commercial mortgages | Commercial mortgages | — | | | — | | | — | | | — | | | — | | | — | | | 1 | | | — | | | — | | | 1 | |
| Construction | Construction | — | | | — | | | — | | | — | | | — | | | — | | | — | | | — | | | — | | | — | |
| Residential | Residential | — | | | — | | | 2 | | | — | | | 2 | | | — | | | — | | | 6 | | | 4 | | | 10 | |
| Consumer | Consumer | — | | | 1 | | | 23 | | | 6 | | | 30 | | | — | | | — | | | 12 | | | 7 | | | 19 | |
| Total | Total | — | | | 1 | | | 25 | | | 6 | | | 32 | | | 4 | | | 1 | | | 18 | | | 11 | | | 34 | |
(1)Other includes interest rate reduction, forbearance, and interest only payments.
| | | | | | | | | | | | | | | | | | | | | | | |
| | Year Ended December 31, |
| (Dollars in thousands) | 2021 | | 2020 |
Pre
Modification | | Post
Modification | | Pre Modification | | Post Modification |
| Commercial | $ | — | | | $ | — | | | $ | 1 | | | $ | 1 | |
| Owner-occupied commercial | — | | | — | | | 1,192 | | | 1,192 | |
| Commercial mortgages | — | | | — | | | 93 | | | 93 | |
| Construction | — | | | — | | | — | | | — | |
| Residential | 146 | | | 146 | | | 1,396 | | | 1,396 | |
| Consumer | 1,585 | | | 1,585 | | | 1,714 | | | 1,714 | |
Total(1)(2)(3) | $ | 1,731 | | | $ | 1,731 | | | $ | 4,396 | | | $ | 4,396 | |
| | | | | | | | | | | | | | | |
| | | | | | Year Ended December 31, |
| (Dollars in thousands) | | | 2022 |
| | | | Pre Modification | | Post Modification |
| Commercial | | | | | $ | 1,067 | | | $ | 1,067 | |
| Owner-occupied commercial | | | | | 2,087 | | | 2,087 | |
| Commercial mortgages | | | | | 2,380 | | | 2,380 | |
| | | | | | | |
| Residential | | | | | 302 | | | 302 | |
| Consumer | | | | | 4,178 | | | 4,178 | |
Total(1)(2) | | | | | $ | 10,014 | | | $ | 10,014 | |
(1)During the year ended December 31, 2021,2022 the TDRs in the table above resulted in a less than $0.1$0.5 million increase in the allowance for credit losses, and no additional charge-offs. During the year ended December 31, 2021,2022, no TDRs defaulted that had received troubled debt modification during the past twelve months.
(2)During the year ended December 31, 2020 the TDRs in the table above resulted in a $0.5 million decrease in the allowance for credit losses, respectively, and no additional charge-offs. During the year ended December 31, 2020, no TDRs defaulted that had received troubled debt modification during the past twelve months.
(3)The TDRs in the table above did not occur as a result of the loan forbearance program under the CARES Act.
8. PREMISES AND EQUIPMENT
The following table shows the components of premises and equipment, at cost, summarized by major classifications: | | December 31, |
| December 31, | | | December 31, |
| (Dollars in thousands) | (Dollars in thousands) | 2021 | | 2020 | (Dollars in thousands) | 2023 | | 2022 |
| Land | Land | $ | 18,469 | | | $ | 20,209 | |
| Buildings | Buildings | 34,481 | | | 35,343 | |
| Leasehold improvements | Leasehold improvements | 66,098 | | | 63,365 | |
| Furniture and equipment | Furniture and equipment | 70,915 | | | 67,336 | |
| Gross premises and equipment | Gross premises and equipment | 189,963 | | | 186,253 | |
| Less: Accumulated depreciation | Less: Accumulated depreciation | 102,668 | | | 89,697 | |
| Net premises and equipment | Net premises and equipment | $ | 87,295 | | | $ | 96,556 | |
The Company recognized depreciation expense of $13.5$17.9 million, $14.3$20.9 million and $15.0$13.5 million for the years ended December 31, 2021, 20202023, 2022 and 2019,2021, respectively.
9. LEASES
As a lessee, the Company enters into leases for its bank branches, corporate offices, and certain equipment. As a lessor, the Company primarily provides financing through its equipment leasing business.
Lessee
The Company's ongoing leases have remaining lease terms of less than 1one year to 4022 years, which includes renewal options that are exercised at its discretion. The Company's lease terms to calculate the lease liability and right-of-use asset include options to extend the lease when it is reasonably certain that the Company will exercise the option. The lease liability and right-of-use asset is included in Other liabilities and Other assets, respectively, in the Consolidated Statement of Financial Condition. Leases with an initial term of 12 months or less are not recorded on the balance sheet. Lease expense is recognized on a straight-line basis over the lease term. Operating lease expense is included in Occupancy expense in the Consolidated Statement of Income. The Company accounts for lease components separately from nonlease components and subleases certain real estate to third parties.
The components of the Company's ongoing operating lease cost were as follows: | | | Twelve months ended |
| | | | Twelve months ended | |
| | | | Twelve months ended | |
| | | | Twelve months ended | |
| (Dollars in thousands) | (Dollars in thousands) | | | December 31, 2021 | | December 31, 2020 | | December 31, 2019 | (Dollars in thousands) | | | | December 31, 2023 | | December 31, 2022 | | December 31, 2021 |
Operating lease cost (1) | Operating lease cost (1) | | | $ | 18,564 | | | $ | 18,690 | | | $ | 19,574 | |
| Sublease income | Sublease income | | | (365) | | | (372) | | | (486) | |
| Net lease cost | Net lease cost | | | $ | 18,199 | | | $ | 18,318 | | | $ | 19,088 | |
(1)Includes variable lease cost and short-term lease cost.
Supplemental balance sheet information related to operating leases was as follows:
| | | | | | | | | | | | | | | | |
| (Dollars in thousands) | | | | December 31, 2021 | | December 31, 2020 |
| Assets | | | | | | |
| Right-of-use assets | | | | $ | 144,134 | | | $ | 150,985 | |
| Total | | | | $ | 144,134 | | | $ | 150,985 | |
| | | | | | |
| Liabilities | | | | | | |
| Lease liabilities | | | | $ | 159,526 | | | $ | 166,451 | |
| Total | | | | $ | 159,526 | | | $ | 166,451 | |
| | | | | | |
| | | | | | |
| Lease term and discount rate of operating leases | | | | | | |
| Weighted average remaining lease term (in years) | | | | 19.17 | | 19.36 |
| Weighted average discount rate | | | | 4.27 | % | | 4.26 | % |
| | | | | | | | | | | | | | | | |
| (Dollars in thousands) | | | | December 31, 2023 | | December 31, 2022 |
| | | | | | |
| Right-of-use assets | | | | $ | 130,601 | | | $ | 138,182 | |
| | | | | | |
| | | | | | |
| | | | | | |
| Lease liabilities | | | | $ | 151,596 | | | $ | 158,269 | |
| | | | | | |
| | | | | | |
| | | | | | |
| Lease term and discount rate of operating leases | | | | | | |
| Weighted average remaining lease term (in years) | | | | 13.01 | | 17.91 |
| Weighted average discount rate | | | | 5.20 | % | | 4.25 | % |
Maturities of operating lease liabilities were as follows: | | (Dollars in thousands) | (Dollars in thousands) | | December 31, 2021 | (Dollars in thousands) | | December 31, 2023 |
| 2022 | | $ | 17,204 | |
| 2023 | 2023 | | 17,440 | |
| 2024 | 2024 | | 16,227 | |
| 2025 | 2025 | | 16,240 | |
| 2026 | 2026 | | 12,703 | |
| After 2026 | | 170,643 | |
| 2027 | |
| After 2027 | |
| Total lease payments | Total lease payments | | 250,457 | |
| Less: Interest | Less: Interest | | (90,931) | |
| Present value of lease liabilities | Present value of lease liabilities | | $ | 159,526 | |
|
Supplemental cash flow information related to leases was as follows: | | Twelve months ended |
| | Twelve months ended | | | | Twelve months ended |
| (Dollars in thousands) | (Dollars in thousands) | | December 31, 2021 | | December 31, 2020 | | December 31, 2019 | (Dollars in thousands) | | December 31, 2023 | | December 31, 2022 | | December 31, 2021 |
| Cash paid for amounts included in the measurement of lease liabilities: | Cash paid for amounts included in the measurement of lease liabilities: | | | | | | |
| Operating cash flows from operating leases | Operating cash flows from operating leases | | $ | 17,834 | | | $ | 18,452 | | | $ | 17,606 | |
| Operating cash flows from operating leases | |
| Operating cash flows from operating leases | |
| Right of use assets obtained in exchange for new operating lease liabilities (non-cash) | Right of use assets obtained in exchange for new operating lease liabilities (non-cash) | | — | | | — | | | 61,693 | |
Lessor Equipment Leasing
The Company provides equipment and small business lease financing through its leasing subsidiary, NewLane Finance®, acquired from its Beneficial acquisition.. Interest income from direct financing leases where the Company is a lessor is recognized in Interest and fees on loans and leases on the Consolidated Statements of Income. The allowance for credit losses on finance leases are included within (RecoveryProvision for (recovery of) provision for credit losses on the Consolidated Statements of Income.
The components of direct finance lease income are summarized in the table below: | | | | | | | | | | | | | | | | | | | | |
| | Twelve months ended |
| (Dollars in thousands) | | December 31, 2021 | | December 31, 2020 | | December 31, 2019 |
| Direct financing leases: | | | | | | |
| Interest income on lease receivable | | $ | 21,947 | | | $ | 15,805 | | | $ | 9,032 | |
| (Amortization)/accretion of deferred fees and costs | | (1,963) | | | 433 | | | 427 | |
| Total direct financing lease income | | $ | 19,984 | | | $ | 16,238 | | | $ | 9,459 | |
| | | | | | | | | | | | | | | | | | | | |
| | Twelve months ended |
| (Dollars in thousands) | | December 31, 2023 | | December 31, 2022 | | December 31, 2021 |
| Direct financing leases: | | | | | | |
| Interest income on lease receivable | | $ | 53,572 | | | $ | 42,542 | | | $ | 21,947 | |
| Amortization of deferred fees and costs | | (6,301) | | | (3,718) | | | (1,963) | |
| Total direct financing lease income | | $ | 47,271 | | | $ | 38,824 | | | $ | 19,984 | |
Equipment leasing receivables relate to direct financing leases. The composition of the net investment in direct financing leases was as follows: | | | | | | | | | | | | | | |
| (Dollars in thousands) | | December 31, 2021 | | December 31, 2020 |
| Lease receivables | | $ | 399,688 | | | $ | 281,601 | |
| Unearned income | | (55,066) | | | (36,669) | |
| Deferred fees and costs | | 7,654 | | | 3,953 | |
| Net investment in direct financing leases | | $ | 352,276 | | | $ | 248,885 | |
| | | | | | | | | | | | | | |
| (Dollars in thousands) | | December 31, 2023 | | December 31, 2022 |
| Lease receivables | | $ | 721,338 | | | $ | 642,369 | |
| Unearned income | | (114,341) | | | (95,683) | |
| Deferred fees and costs | | 16,625 | | | 12,295 | |
| Net investment in direct financing leases | | $ | 623,622 | | | $ | 558,981 | |
Future minimum lease payments to be received for direct financing leases were as follows: | | (Dollars in thousands) | (Dollars in thousands) | | December 31, 2021 | (Dollars in thousands) | | December 31, 2023 |
| 2022 | | $ | 123,755 | |
| 2023 | 2023 | | 107,054 | |
| 2024 | 2024 | | 83,605 | |
| 2025 | 2025 | | 57,314 | |
| 2026 | 2026 | | 22,143 | |
| After 2026 | | 5,817 | |
| 2027 | |
| After 2027 | |
| Total lease payments | Total lease payments | | $ | 399,688 | |
10. GOODWILL AND INTANGIBLE ASSETS
In accordance with ASC 805, Business Combinations (ASC 805) and ASC 350, Intangibles - Goodwill and Other (ASC 350), all assets acquired and liabilities assumed in purchase acquisitions, including goodwill, indefinite-lived intangibles and other intangibles are recorded at fair value as of acquisition date.
Goodwill
WSFS performs its annual goodwill impairment test on October 1 or more frequently if events and circumstances indicate that the fair value of a reporting unit is less than its carrying value. In betweenBetween annual tests, management performs a qualitative review of goodwill quarterly as part of the Company's review of the overall business to ensure no events or circumstances have occurred that would impact its goodwill evaluation. During the year ended December 31, 2021,2023, management determined based on its qualitative assessment that it is not more likely than not that the fair values of our reporting units are less thanexceeded their carrying values. Novalues, and no goodwill impairment existsexisted during the year ended December 31, 2021.2023.
The following table shows the allocation of goodwill to the reportable operating segments for purposes of goodwill impairment testing:
| (Dollars in thousands) | (Dollars in thousands) | WSFS Bank | | | Wealth Management | | Consolidated Company |
| December 31, 2019 | $ | 452,629 | | | | $ | 20,199 | | | $ | 472,828 | |
(Dollars in thousands) | |
(Dollars in thousands) | | WSFS Bank | | | | Wealth Management | | Consolidated Company |
| December 31, 2021 | |
| Goodwill from business combinations | |
| Goodwill adjustments | |
| December 31, 2022 | |
Goodwill from business combinations(1) | |
| | Goodwill adjustments | — | | | | — | | | — | |
| December 31, 2020 | 452,629 | | | | 20,199 | | | 472,828 | |
| | Goodwill adjustments | — | | | | — | | | — | |
| December 31, 2021 | $ | 452,629 | | | | $ | 20,199 | | | $ | 472,828 | |
| December 31, 2023 | |
| December 31, 2023 | |
| December 31, 2023 | |
Other intangible assetsDuring the third quarter of 2023, BMCM acquired the business of a registered investment advisory firm.
ASC 350 requires that an acquired intangible asset be separately recognized if the benefit of the intangible asset is obtained through contractual or other legal rights, or if the asset can be sold, transferred, licensed, rented or exchanged, regardless of the acquirer’s intent to do so.
The following table summarizes the Company's intangible assets:
| | (Dollars in thousands) | (Dollars in thousands) | Gross Intangible Assets | | Accumulated Amortization | | Net Intangible Assets | | Amortization Period | (Dollars in thousands) | Gross Intangible Assets | | Accumulated Amortization | | Net Intangible Assets | | Amortization Period |
| December 31, 2021 | | | | | | | |
| December 31, 2023 | |
| Core deposits | |
| Core deposits | |
| Core deposits | Core deposits | $ | 93,811 | | | $ | (30,103) | | | $ | 63,708 | | | 10 years | $ | 104,751 | | | $ | | $ | (50,754) | | | $ | | $ | 53,997 | | | 10 years | | 10 years |
| Customer relationships | Customer relationships | 15,281 | | | (7,876) | | | 7,405 | | | 7-15 years | Customer relationships | 73,880 | | | (18,153) | | (18,153) | | | 55,727 | | 55,727 | | | 7-15 years | | 7-15 years |
| | Tradename | |
| Tradename | |
| Tradename | | 2,900 | | | — | | | 2,900 | | | indefinite |
Loan servicing rights(1) | Loan servicing rights(1) | 6,671 | | | (3,381) | | | 3,290 | | | 10-25 years | Loan servicing rights(1) | 12,613 | | | (6,575) | | (6,575) | | | 6,038 | | 6,038 | | | 10-25 years | | 10-25 years |
| Total intangible assets | Total intangible assets | $ | 115,763 | | | $ | (41,360) | | | $ | 74,403 | | |
| December 31, 2020 | | | | | | |
| December 31, 2022 | |
| December 31, 2022 | |
| December 31, 2022 | |
| Core deposits | |
| Core deposits | |
| Core deposits | Core deposits | $ | 95,711 | | | $ | (22,727) | | | $ | 72,984 | | | 10 years | $ | 104,751 | | | $ | | $ | (40,443) | | | $ | | $ | 64,308 | | | 10 years | | 10 years |
| Customer relationships | Customer relationships | 15,281 | | | (6,600) | | | 8,681 | | | 7-15 years | Customer relationships | 68,281 | | | (12,937) | | (12,937) | | | 55,344 | | 55,344 | | | 7-15 years | | 7-15 years |
| Non-compete agreements | Non-compete agreements | 221 | | | (190) | | | 31 | | | 5 years | Non-compete agreements | 200 | | | (200) | | (200) | | | — | | — | | | 1 year | | 1 year |
| Tradename | | Tradename | 2,900 | | | — | | | 2,900 | | | indefinite |
Loan servicing rights(2) | Loan servicing rights(2) | 5,302 | | | (2,440) | | | 2,862 | | | 10-25 years | Loan servicing rights(2) | 11,118 | | | (5,075) | | (5,075) | | | 6,043 | | 6,043 | | | 10-25 years | | 10-25 years |
| Total intangible assets | Total intangible assets | $ | 116,515 | | | $ | (31,957) | | | $ | 84,558 | | |
(1)Includes reversalimpairment losses of less than $0.1 million for the year ended December 31, 2023.
(2)Includes impairment losses of $0.3 million for the year ended December 31, 2021.
(2)Includes impairment losses of $0.2 million for the year ended December 31, 2020.2022.
The Company recognized amortization expense on other intangible assets of $10.6$15.5 million, $10.9$15.7 million and $9.7$10.6 million for the years ended December 31, 2021, 20202023, 2022 and 2019,2021, respectively.
The following presents the estimated amortization expense of intangibles:
| | | | | |
| (Dollars in thousands) | Amortization of Intangibles |
| 2022 | $ | 11,249 | |
| 2023 | 11,087 | |
| 2024 | 10,899 | |
| 2025 | 10,629 | |
| 2026 | 10,011 | |
| Thereafter | 20,528 | |
| Total | $ | 74,403 | |
| | | | | |
| (Dollars in thousands) | Amortization of Intangibles |
| 2024 | $ | 16,913 | |
| 2025 | 16,548 | |
| 2026 | 15,845 | |
| 2027 | 15,385 | |
| 2028 | 14,567 | |
| Thereafter | 36,504 | |
| Total | $ | 115,762 | |
Servicing Assets
The Company records mortgage servicing rights on its mortgage loan servicing portfolio, which includes mortgages that it acquires or originates as well as mortgages that it services for others, and servicing rights on Small Business Administration (SBA) loans. Mortgage servicing rights and SBA loan servicing rights are included are in Intangible assets in the accompanying Consolidated Statements of Financial Condition. Mortgage loans which the Company services for others are not included in Loans and leases, net of allowance in the accompanying Consolidated Statements of Financial Condition. Servicing rights represent the present value of the future net servicing fees from servicing mortgage loans the Company acquires or originates, or that it services for others.
The value of the Company's mortgage servicing rights was $0.5$1.7 million and $0.6$2.1 million at December 31, 20212023 and 2020,2022, respectively, and the value of its SBA loan servicing rights was $2.8$4.3 million and $2.3$4.0 million at December 31, 20212023 and 2020,2022, respectively. Changes in the value of these servicing rights resulted in a reversalimpairment losses of less than $0.1 million during 2023 and impairment losses of $0.3 million during 2021 and an impairment loss of $0.2 million during 2020.2022. Revenues from originating, marketing and servicing mortgage loans as well as valuation adjustments related to capitalized mortgage servicing rights are included in Mortgage Banking Activities, Net in the Consolidated Statements of Income and revenues from the Company's SBA loan servicing rights are included in Loan fee income, in the Consolidated Statements of Income.
Besides the impairment on loan servicing rights noted above, there was no impairment of other intangible assets as of December 31, 20212023 or 2020.2022. Changing economic conditions that may adversely affect the Company's performance and could result in impairment, which could adversely affect earnings in the future.
11. DEPOSITS
The following table is a summary of the Company's deposits by category: | | December 31, |
| | December 31, | | | | December 31, |
| (Dollars in thousands) | (Dollars in thousands) | | 2021 | | 2020 | (Dollars in thousands) | | 2023 | | 2022 |
| Noninterest-bearing: | Noninterest-bearing: | | | | |
| Noninterest-bearing demand | Noninterest-bearing demand | | $ | 4,565,143 | | | $ | 3,415,021 | |
| Noninterest-bearing demand | |
| Noninterest-bearing demand | |
| Total noninterest-bearing | Total noninterest-bearing | | $ | 4,565,143 | | | $ | 3,415,021 | |
| Interest-bearing: | Interest-bearing: | | | | |
| Interest-bearing demand | |
| Interest-bearing demand | |
| Interest-bearing demand | Interest-bearing demand | | $ | 2,793,279 | | | $ | 2,635,740 | |
| Savings | Savings | | 1,970,744 | | | 1,774,332 | |
| Money market | Money market | | 2,906,260 | | | 2,654,439 | |
| Customer time deposits | Customer time deposits | | 988,974 | | | 1,158,845 | |
| Brokered deposits | Brokered deposits | | 15,662 | | | 218,287 | |
| Total interest-bearing | Total interest-bearing | | $ | 8,674,919 | | | $ | 8,441,643 | |
| Total deposits | Total deposits | | $ | 13,240,062 | | | $ | 11,856,664 | |
The following table is a summary of the remaining time to maturity for customer time deposits: | | December 31, |
| | December 31, | | | | December 31, |
| (Dollars in thousands) | (Dollars in thousands) | | 2021 | | 2020 | (Dollars in thousands) | | 2023 | | 2022 |
| Certificates of deposit (not jumbo): | Certificates of deposit (not jumbo): | | | | |
| Less than one year | |
| Less than one year | |
| Less than one year | Less than one year | | $ | 434,039 | | | $ | 468,729 | |
| One year to two years | One year to two years | | 109,242 | | | 116,541 | |
| Two years to three years | Two years to three years | | 33,971 | | | 51,477 | |
| Three years to four years | Three years to four years | | 10,045 | | | 28,105 | |
| Over four years | Over four years | | 5,704 | | | 9,545 | |
| Total certificates of deposit (not jumbo) | Total certificates of deposit (not jumbo) | | $ | 593,001 | | | $ | 674,397 | |
Jumbo certificates of deposit (1) | Jumbo certificates of deposit (1) | | | | |
| Less than one year | Less than one year | | $ | 284,678 | | | $ | 349,396 | |
| Less than one year | |
| Less than one year | |
| One year to two years | One year to two years | | 74,802 | | | 66,030 | |
| Two years to three years | Two years to three years | | 32,459 | | | 35,830 | |
| Three years to four years | Three years to four years | | 2,393 | | | 30,682 | |
| Over four years | Over four years | | 1,641 | | | 2,510 | |
| Total jumbo certificates of deposit | Total jumbo certificates of deposit | | $ | 395,973 | | | $ | 484,448 | |
| Total certificates of deposit | Total certificates of deposit | | $ | 988,974 | | | $ | 1,158,845 | |
(1)Represents certificates of deposit balances in excess of $0.1 million$250 thousand from individuals, businesses and municipalities.
The following table is a summary of interest expense on deposits by category: | | Year Ended December 31, |
| Year Ended December 31, | | | Year Ended December 31, |
| (Dollars in thousands) | (Dollars in thousands) | 2021 | | 2020 | | 2019 | (Dollars in thousands) | 2023 | | 2022 | | 2021 |
| Interest-bearing demand | Interest-bearing demand | $ | 2,262 | | | $ | 4,229 | | | $ | 8,794 | |
| Money market | Money market | 3,218 | | | 9,423 | | | 18,169 | |
| Savings | Savings | 586 | | | 3,518 | | | 7,053 | |
| Time deposits | Time deposits | 7,332 | | | 18,699 | | | 19,642 | |
| Total customer interest expense | Total customer interest expense | $ | 13,398 | | | $ | 35,869 | | | $ | 53,658 | |
| Brokered deposits | Brokered deposits | 1,525 | | | 3,393 | | | 6,417 | |
| Total interest expense on deposits | Total interest expense on deposits | $ | 14,923 | | | $ | 39,262 | | | $ | 60,075 | |
12. BORROWED FUNDS
The following is a summary of borrowed funds by type, at or for the twelve months ended:
| | (Dollars in thousands) | (Dollars in thousands) | Balance at End of Period | | Weighted Average Interest Rate | | Maximum Outstanding at Month End During the Period | | Average Amount Outstanding During the Year | | Weighted Average Interest Rate During the Year | (Dollars in thousands) | Balance at End of Period | | Weighted Average Interest Rate | | Maximum Outstanding at Month End During the Period | | Average Amount Outstanding During the Year | | Weighted Average Interest Rate During the Year |
| December 31, 2021 | | | | | | | | | |
| December 31, 2023 | |
| Federal funds purchased | |
| Federal funds purchased | |
| Federal funds purchased | | $ | — | | | — | % | | $ | 130,000 | | | $ | 33,195 | | | 5.04 | % |
| FHLB advances | |
| Trust preferred borrowings | |
| Senior and subordinated debt | |
| Other borrowed funds | |
| December 31, 2022 | |
| Federal funds purchased | |
| Federal funds purchased | |
| Federal funds purchased | Federal funds purchased | $ | — | | | — | % | | $ | — | | | $ | 27 | | | — | % | $ | — | | | — | | — | % | | $ | — | | | $ | | $ | 11,603 | | | 3.82 | | 3.82 | % |
| FHLB advances | FHLB advances | — | | | — | | | — | | | 184 | | | 2.72 | |
| Trust preferred borrowings | Trust preferred borrowings | 67,011 | | | 1.91 | | | 67,011 | | | 67,011 | | | 1.90 | |
| Senior debt | Senior debt | 147,939 | | | 2.94 | | | 246,763 | | | 192,243 | | | 3.38 | |
| Other borrowed funds | Other borrowed funds | 24,527 | | | 0.10 | | | 27,292 | | | 21,634 | | | 0.10 | |
| December 31, 2020 | |
| Federal funds purchased | $ | — | | | — | % | | $ | 174,725 | | | $ | 34,974 | | | 1.35 | % |
| FHLB advances | 6,623 | | | 2.63 | | | 119,971 | | | 88,011 | | | 2.22 | |
| Trust preferred borrowings | 67,011 | | | 1.97 | | | 67,011 | | | 67,011 | | | 2.61 | |
| Senior debt | 246,617 | | | 3.79 | | | 246,617 | | | 108,420 | | | 4.61 | |
| Other borrowed funds | 20,390 | | | 0.10 | | | 23,673 | | | 18,854 | | | 0.10 | |
Federal Funds Purchased and Securities Sold Under Agreements to Repurchase
During 2021 and 2020, the Company purchased federal funds as a short-term funding source. The Company had no securities sold under agreements to repurchase at December 31, 2021 and December 31, 2020.
Federal Home Loan Bank Advances
AdvancesAs of December 31, 2023, there were no advances from the FHLB matured in January 2021, with an interest rate of 2.60%.FHLB.
Pursuant to collateral agreements with the FHLB, advances are secured by qualifying loan collateral, qualifying fixed-income securities, FHLB stock and an interest-bearing demand deposit account with the FHLB. As a member of the FHLB, the Company is required to purchase and hold shares of capital stock in the FHLB and was in compliance with this requirement with a stock investment in FHLB of $6.1$15.4 million at December 31, 20212023 and $5.8$24.1 million at December 31, 2020.2022. This stock is carried on the accompanying Consolidated Statements of Financial Condition at cost, which approximates liquidation value.
The Company received dividends on its stock investment in FHLB of $0.1$1.1 million and $0.5$0.3 million for the years ended December 31, 20212023 and 2020,2022, respectively. For additional information regarding FHLB Stock, see Note 18.
Trust Preferred Borrowings
In 2005, the CompanyTrust issued $67.0 million of aggregate principal amount of Pooled Floating Rate Securities at a variable interest rate of 177 basis points over the three-month LIBOR rate.rate with a scheduled maturity of June 1, 2035. The reference rate on these securities was updated to three-month term SOFR upon the discontinuation of LIBOR on June 30th, 2023. These securities are currently callable and have a maturity date of June 1, 2035.
Royal Bancshares Capital Trust I (Trust I) and Royal Bancshares Capital Trust II (Trust II) (collectively, the RBC Trusts), which were acquired from Bryn Mawr Bank Corporation, were utilized for the sole purpose of issuing and selling capital securities representing preferred beneficial interests. Although WSFS owns an aggregate of $0.8 million of the common securities of Trust I and Trust II, the RBC Trusts are not consolidated into the Company’s Consolidated Financial Statements as the Company is not deemed to be the primary beneficiary of these entities. Inclusive of the fair value marks, WSFS assumed junior subordinated debentures to the RBC Trusts with a current carrying value of$11.8 million each, totaling $23.6 million. The junior subordinated debentures incur interest at a coupon rate of 7.80% as of December 31, 2023. The rate resets quarterly based on three-month term SOFR plus 2.41%.
Each of Trust I and Trust II issued an aggregate principal amount of $12.5 million of capital securities initially bearing fixed and/or fixed/floating interest rates corresponding to the debt securities held by each Trust to an unaffiliated investment vehicle and an aggregate principal amount of $0.4 million of common securities bearing fixed and/or fixed/floating interest rates corresponding to the debt securities held by each Trust to the Company. The Company has fully and unconditionally guaranteed all of the obligations of the RBC Trusts, including any distributions and payments on liquidation or redemption of the capital securities.
The rights of holders of common securities of the RBC Trusts are subordinate to the rights of the holders of capital securities only in the event of a default; otherwise, the common securities’ economic and voting rights are pari passu with the capital securities. The capital and common securities of the RBC Trusts are subject to mandatory redemption upon the maturity or call of the junior subordinated debentures held by each. Unless earlier dissolved, the RBC Trusts will dissolve on December 15, 2034. The junior subordinated debentures are the sole assets of Trusts, mature on December 15, 2034, and may be called at par by the Company any time. The Company records its investments in the RBC Trusts’ common securities of $0.4 million each as investments in unconsolidated entities and records dividend income upon declaration by Trust I and Trust II.
Federal Funds Purchased and Securities Sold Under Agreements to Repurchase
During 2023 and 2022, the Company purchased federal funds as a short-term funding source. The Company had no securities sold under agreements to repurchase at December 31, 2023 and December 31, 2022.
Senior and Subordinated Debt
On June 13, 2016, the Company issued $100.0 million of senior notes due 2026 (the 2026 Notes). The 2026 Notes had a fixed coupon rate of 4.50% from issuance to but excluding June 15, 2021 and a variable coupon rate of three month LIBOR plus 3.30% from June 15, 2021 until maturity. The 2026 Notes were redeemed on June 15, 2021 at 100% of principal plus accrued and unpaid interest using cash on hand.
On December 3, 2020, the Company issued $150.0 million of senior notes due 2030 (the 2030 Notes). The 2030 Notes mature on December 15, 2030 and have a fixed coupon rate of 2.75% from issuance until December 15, 2025 and a variable coupon rate equal to the three-month term SOFR, reset quarterly, plus 2.485% from December 15, 2025 until maturity. The 2030 Notes may be redeemed beginning December 15, 2025 at 100% of principal plus accrued and unpaid interest. The remaining net proceeds from the issuance of the 2030 Notes are being used for general corporate purposes, including, but not limited to, financing organic growth, acquisitions, repurchases of common stock, and redemption of outstanding indebtedness. The carrying value of the 2030 Notes, inclusive of deferred issuance costs, was $148.4 million as of December 31, 2023 and $148.2 million as of December 31, 2022.
The Company assumed $30.0 million in aggregate principal amount of fixed-to-floating rate subordinated notes due 2025 (the 2025 Notes) from Bryn Mawr Bank Corporation, which were issued in a private placement to institutional accredited investors on August 6, 2015. Effective February 15, 2023, the Company redeemed all remaining outstanding principal amount of the 2025 Notes. The 2025 Notes bore interest at a variable rate that reset quarterly to a level equal to the then-current three-month LIBOR plus an issuance spread of 3.068%.
The Company assumed $70.0 million in aggregate principal amount of fixed-to-floating rate subordinated notes due 2027 (the 2027 Notes) from Bryn Mawr Bank Corporation, which were issued by Bryn Mawr Bank Corporation in an underwritten public offering on December 13, 2017. The 2027 Notes mature on December 15, 2027, and had a fixed annual interest of 4.25% until and including December 14, 2022, and currently bear interest at a variable rate of 7.70%. The variable rate will reset quarterly to a level equal to the three-month term SOFR rate plus 2.31% until December 15, 2027, or any early redemption date. The carrying value of the 2027 Notes was $70.0 million as of December 31, 2023 and December 31, 2022.
105
Other Borrowed Funds
Included in other borrowed funds are collateralized borrowings of $24.5$586.0 million and $20.4$38.3 million at December 31, 20212023 and 2020,2022, respectively, primarily consisting of Bank Term Funding Program (BTFP) borrowings of $565.0 million borrowed in 2023 as well as outstanding retail repurchase agreements, contractual arrangements under which portions of certain securities are sold overnight to retail customers under agreements to repurchase. Such borrowings were collateralized by mortgage-backed securities.
Borrower in Custody
The Company had $282.1 million$2.1 billion and $347.1 million$0.7 billion of loans and securities pledged to the Federal Reserve of Philadelphia (FRB) at December 31, 20212023 and December 31, 2020,2022, respectively. The Company borrowed $565.0 million from the FRB during 2023. The Company did not borrow funds from the FRB during 2021 or 2020.2022.
13. STOCKHOLDERS' EQUITY AND REGULATORY CAPITAL
Savings associations such as the Bank are subject to regulatory capital requirements administered by various banking regulators. Failure to meet minimum capital requirements could result in certain actions by regulators that could have a material effect on the Company’s Consolidated Financial Statements. Risk-based capital requirements applicable to bank holding companies and depository institutions include a minimum common equity Tier 1 capital ratio of 4.50% of risk-weighted assets, a minimum Tier 1 capital ratio of 6.00% of risk-weighted assets, and a current minimum total capital ratio of 8.00% of risk-weighted assets and a minimum Tier 1 leverage capital ratio of 4.00% of average assets.
As of December 31, 20212023 and 2020,2022, the Bank was in compliance with regulatory capital requirements and exceeded the levels necessary for the Bank to be considered “well capitalized”“well-capitalized” as defined in the regulations.
The following table presents the capital position of the Bank and the Company as of December 31, 20212023 and 2020:2022:
| | | | | | | | | | | | | | | | | | | | | | | | | | | | | | | | | | | |
| Consolidated Capital | | Minimum For Capital Adequacy Purposes | | To Be Well-Capitalized Under Prompt Corrective Action Provisions |
| (Dollars in thousands) | Amount | | Percent | | Amount | | Percent | | Amount | | Percent |
| December 31, 2021 | | | | | | | | | | | |
| Total Capital (to risk-weighted assets) | | | | | | | | | | | |
| Wilmington Savings Fund Society, FSB | $ | 1,639,708 | | | 15.91 | % | | $ | 824,687 | | | 8.00 | % | | $ | 1,030,858 | | | 10.00 | % |
| WSFS Financial Corporation | 1,610,964 | | | 15.59 | | | 826,839 | | | 8.00 | | | 1,033,548 | | | 10.00 | |
| Tier 1 Capital (to risk-weighted assets) | | | | | | | | | | | |
| Wilmington Savings Fund Society, FSB | 1,557,142 | | | 15.11 | | | 618,515 | | | 6.00 | | | 824,687 | | | 8.00 | |
| WSFS Financial Corporation | 1,528,398 | | | 14.79 | | | 620,129 | | | 6.00 | | | 826,839 | | | 8.00 | |
Common Equity Tier 1 Capital (to risk-weighted assets) | | | | | | | | | | | |
| Wilmington Savings Fund Society, FSB | 1,557,142 | | | 15.11 | | | 463,886 | | | 4.50 | | | 670,058 | | | 6.50 | |
| WSFS Financial Corporation | 1,463,398 | | | 14.16 | | | 465,097 | | | 4.50 | | | 671,806 | | | 6.50 | |
| Tier 1 Leverage Capital | | | | | | | | | | | |
| Wilmington Savings Fund Society, FSB | 1,557,142 | | | 10.44 | | | 596,711 | | | 4.00 | | | 745,889 | | | 5.00 | |
| WSFS Financial Corporation | 1,528,398 | | | 10.24 | | | 597,179 | | | 4.00 | | | 746,473 | | | 5.00 | |
| | | | | | | | | | | |
| December 31, 2020 | | | | | | | | | | | |
| Total Capital (to risk-weighted assets) | | | | | | | | | | | |
| Wilmington Savings Fund Society, FSB | $ | 1,412,290 | | | 13.76 | % | | $ | 821,012 | | | 8.00 | % | | $ | 1,026,265 | | | 10.00 | % |
| WSFS Financial Corporation | 1,415,780 | | | 13.76 | | | 823,355 | | | 8.00 | | | 1,029,194 | | | 10.00 | |
| Tier 1 Capital (to risk-weighted assets) | | | | | | | | | | | |
| Wilmington Savings Fund Society, FSB | 1,283,022 | | | 12.50 | | | 615,759 | | | 6.00 | | | 821,012 | | | 8.00 | |
| WSFS Financial Corporation | 1,286,150 | | | 12.50 | | | 617,517 | | | 6.00 | | | 823,355 | | | 8.00 | |
Common Equity Tier 1 Capital (to risk-weighted assets) | | | | | | | | | | | |
| Wilmington Savings Fund Society, FSB | 1,283,022 | | | 12.50 | | | 461,819 | | | 4.50 | | | 667,073 | | | 6.50 | |
| WSFS Financial Corporation | 1,221,150 | | | 11.87 | | | 463,137 | | | 4.50 | | | 668,976 | | | 6.50 | |
| Tier 1 Leverage Capital | | | | | | | | | | | |
| Wilmington Savings Fund Society, FSB | 1,283,022 | | | 9.74 | | | 526,803 | | | 4.00 | | | 658,503 | | | 5.00 | |
| WSFS Financial Corporation | 1,286,150 | | | 9.76 | | | 527,192 | | | 4.00 | | | 658,990 | | | 5.00 | |
| | | | | | | | | | | | | | | | | | | | | | | | | | | | | | | | | | | |
| Consolidated Capital | | Minimum For Capital Adequacy Purposes | | To Be Well-Capitalized Under Prompt Corrective Action Provisions |
| (Dollars in thousands) | Amount | | Percent | | Amount | | Percent | | Amount | | Percent |
| December 31, 2023 | | | | | | | | | | | |
| Total Capital (to risk-weighted assets) | | | | | | | | | | | |
| Wilmington Savings Fund Society, FSB | $ | 2,382,514 | | | 14.96 | % | | $ | 1,273,856 | | | 8.00 | % | | $ | 1,592,320 | | | 10.00 | % |
| WSFS Financial Corporation | 2,426,577 | | | 15.23 | | | 1,274,611 | | | 8.00 | | | 1,593,264 | | | 10.00 | |
| Tier 1 Capital (to risk-weighted assets) | | | | | | | | | | | |
| Wilmington Savings Fund Society, FSB | 2,184,193 | | | 13.72 | | | 955,392 | | | 6.00 | | | 1,273,856 | | | 8.00 | |
| WSFS Financial Corporation | 2,098,403 | | | 13.17 | | | 955,958 | | | 6.00 | | | 1,274,611 | | | 8.00 | |
Common Equity Tier 1 Capital (to risk-weighted assets) | | | | | | | | | | | |
| Wilmington Savings Fund Society, FSB | 2,184,193 | | | 13.72 | | | 716,544 | | | 4.50 | | | 1,035,008 | | | 6.50 | |
| WSFS Financial Corporation | 2,098,403 | | | 13.17 | | | 716,969 | | | 4.50 | | | 1,035,621 | | | 6.50 | |
| Tier 1 Leverage Capital | | | | | | | | | | | |
| Wilmington Savings Fund Society, FSB | 2,184,193 | | | 10.92 | | | 800,021 | | | 4.00 | | | 1,000,026 | | | 5.00 | |
| WSFS Financial Corporation | 2,098,403 | | | 10.48 | | | 800,934 | | | 4.00 | | | 1,001,168 | | | 5.00 | |
| | | | | | | | | | | |
| December 31, 2022 | | | | | | | | | | | |
| Total Capital (to risk-weighted assets) | | | | | | | | | | | |
| Wilmington Savings Fund Society, FSB | $ | 2,157,846 | | | 13.84 | % | | $ | 1,246,886 | | | 8.00 | % | | $ | 1,558,608 | | | 10.00 | % |
| WSFS Financial Corporation | 2,219,920 | | | 14.20 | | | 1,250,689 | | | 8.00 | | | 1,563,361 | | | 10.00 | |
| Tier 1 Capital (to risk-weighted assets) | | | | | | | | | | | |
| Wilmington Savings Fund Society, FSB | 2,003,779 | | | 12.86 | | | 935,165 | | | 6.00 | | | 1,246,886 | | | 8.00 | |
| WSFS Financial Corporation | 1,910,195 | | | 12.22 | | | 938,017 | | | 6.00 | | | 1,250,689 | | | 8.00 | |
Common Equity Tier 1 Capital (to risk-weighted assets) | | | | | | | | | | | |
| Wilmington Savings Fund Society, FSB | 2,003,779 | | | 12.86 | | | 701,373 | | | 4.50 | | | 1,013,095 | | | 6.50 | |
| WSFS Financial Corporation | 1,910,195 | | | 12.22 | | | 703,512 | | | 4.50 | | | 1,016,185 | | | 6.50 | |
| Tier 1 Leverage Capital | | | | | | | | | | | |
| Wilmington Savings Fund Society, FSB | 2,003,779 | | | 10.29 | | | 779,288 | | | 4.00 | | | 974,110 | | | 5.00 | |
| WSFS Financial Corporation | 1,910,195 | | | 9.79 | | | 780,333 | | | 4.00 | | | 975,416 | | | 5.00 | |
The Holding Company
As of December 31, 2021,2023, the Company's capital structure includes one class of stock, $0.01 par common stock outstanding with each share having equal voting rights.
In 2005, the Trust the Company's unconsolidated subsidiary, issued Pooled Floating Rate Securities at a variable interest rate of 177 basis points over the three-month LIBOR rate with a scheduled maturity of June 1, 2035. The reference rate on these securities was updated to three-month term SOFR upon the discontinuation of LIBOR on June 30th, 2023. The par value of these securities is $2.0 million and the aggregate principal is $67.0 million. The proceeds from the issue were invested in Junior Subordinated Debentures issued by the Company. At December 31, 2023, the coupon rate of the Trust securities was 7.41%. The effective rate will vary due to fluctuations in interest rates.
Royal Bancshares Capital Trust I (Trust I) and Royal Bancshares Capital Trust II (Trust II) (collectively, the RBC Trusts), which were acquired from Bryn Mawr Bank Corporation, were utilized for the sole purpose of issuing and selling capital securities representing preferred beneficial interests. Although WSFS owns an aggregate of $0.8 million of the common securities of Trust I and Trust II, the RBC Trusts are not consolidated into the Company’s Consolidated Financial Statements as the Company is not deemed to be the primary beneficiary of these entities. Inclusive of the fair value marks, WSFS assumed junior subordinated debentures to the RBC Trusts with a current carrying value of$11.8 million each, totaling $23.6 million. The junior subordinated debentures incur interest at a coupon rate of 7.80% as of December 31, 2023. The rate resets quarterly based on three-month term SOFR plus 2.41%.
These securities are treated as borrowings with interest included in Interest on trust preferred borrowings on the Consolidated Statements of Income and included in Trust preferred borrowings in the Consolidated Statements of Financial Condition. At December 31, 2021, the coupon rate of the Trust securities was 1.94%. The effective rate will vary due to fluctuations in interest rates.
When infused into the Bank, theThe Trust preferred borrowings qualify as Tier 2 capital. The Trust preferred borrowings issued in 2005 qualify aswere previously Tier 1 capital.capital, but migrated to Tier 2 capital following the acquisition of Bryn Mawr Bank Corporation and impacts of 12 C.F.R. § 217.300(c)(2)(i). The Bank is prohibited from paying any dividend or making any other capital distribution if, after making the distribution, the Bank would be under-capitalized within the meaning of the Prompt Corrective Action regulations.
At December 31, 2021, $103.72023, $197.3 million in cash remains at the holding company to support the parent company’s needs.
Pursuant to federal laws and regulations, the Company's ability to engage in transactions with affiliated corporations, including the loan of funds to, or guarantee of the indebtedness of, an affiliate, is limited.
During the year ended December 31, 2021,2023, the Company repurchased 267,3091,247,178 common shares at an average price of $44.97$41.52 per share as part of its share buy-back program approved by the Board of Directors. The program is consistent with the Company's intent to return a minimum of 25%35% of annual net income to stockholders through dividends and share repurchases while maintaining capital ratios in excess of regulatory minimums, and in the case of the Bank, the “well-capitalized” benchmarks.
14. ASSOCIATE BENEFIT PLANS
Associate 401(k) Savings Plan
Certain subsidiaries of ours maintain a qualified plan in which Associates may participate. Participants in the plan may elect to direct a portion of their wages into investment accounts that include professionally managed mutual and money market funds and the Company's common stock. Generally, the principal and related earnings are tax deferred until withdrawn. The Company matches a portion of the Associates’ contributions. As a result, the Company's total cash contributions to the plan on behalf of its Associates resulted in an expense of $10.1 million, $9.1 million, and $7.0 million $6.6 million,for 2023, 2022, and $5.8 million for 2021, 2020, and 2019, respectively.
All contributions are invested in accordance with the Associates’ selection of investments. If Associates do not designate how discretionary contributions are to be invested, 100% is invested in target-date fund that corresponds with the participant’s age. Associates may generally make transfers to various other investment vehicles within the plan. The plan’s yearly activity includes net sales of 33,000, 14,000, 8,000 and 9,00033,000 shares of the Company's common stock in 2021, 20202023, 2022 and 20192021 respectively. There were no purchases in 2021, 20202023, 2022 or 2019.2021.
Postretirement Medical Benefits
The Company shares certain costs of providing health and life insurance benefits to eligible retired Associates (employees) and their eligible dependents. Previously, all Associates were eligible for these benefits if they reached normal retirement age while working for the Company. Effective March 31, 2014, the Company changed the eligibility of this plan to include only those Associates who have achieved ten years of service as of March 31, 2014. The Company uses the mortality table issued by the Office of the Actuary of the U.S. Bureau of Census in its calculation.
The Company accounts for its obligations under the provisions of ASC 715, Compensation - Retirement Benefits (ASC 715). ASC 715 requires that the Company recognized the costs of these benefits over an Associate's active working career. Amortization of unrecognized net gains or losses resulting from experience different from that assumed and from changes in assumptions is included as a component of net periodic benefit cost over the remaining service period of active employees to the extent that such gains and losses exceed 10% of the accumulated postretirement benefit obligation, as of the beginning of the year. The Company recognizes its service cost in Salaries, benefits and other compensation and the other components of net periodic benefit cost in Other operating expenses in the Consolidated Statements of Income.
ASC 715 requires that the Company recognizes the funded status of its defined benefit postretirement plan in the statement of financial condition, with a corresponding adjustment to accumulated other comprehensive income (loss) income,, net of tax. The adjustment to accumulated other comprehensive income (loss) income at adoption represented the net unrecognized actuarial losses and unrecognized transition obligation remaining from the initial adoption of ASC 715, all of which were previously netted against the plan’s funded status in the statement of financial condition pursuant to the provisions of ASC 715. These amounts will be subsequently recognized as net periodic pension costs pursuant to the Company's historical accounting policy for amortizing such amounts. Further, actuarial gains and losses that arise in subsequent periods, and are not recognized as net periodic pension cost in the same periods, will be recognized as a component of other comprehensive income.income (loss). Those amounts will be subsequently recognized as a component of net periodic pension cost on the same basis as the amounts recognized in accumulated other comprehensive income (loss) at adoption of ASC 715.
The following disclosures relating to postretirement medical benefits were measured at December 31:
| | (Dollars in thousands) | (Dollars in thousands) | 2021 | | 2020 | | 2019 | (Dollars in thousands) | 2023 | | 2022 | | 2021 |
| Change in benefit obligation: | Change in benefit obligation: | | | | | |
| Benefit obligation at beginning of year | Benefit obligation at beginning of year | $ | 2,288 | | | $ | 2,170 | | | $ | 1,893 | |
| Benefit obligation at beginning of year | |
| Benefit obligation at beginning of year | |
| Service cost | Service cost | 67 | | | 61 | | | 54 | |
| Interest cost | Interest cost | 54 | | | 67 | | | 78 | |
| Actuarial (gain) loss | (216) | | | 80 | | | 229 | |
| Actuarial gain | |
| Benefits paid | Benefits paid | (55) | | | (90) | | | (84) | |
| Benefit obligation at end of year | Benefit obligation at end of year | $ | 2,138 | | | $ | 2,288 | | | $ | 2,170 | |
| Change in plan assets: | Change in plan assets: | | | | | |
| Fair value of plan assets at beginning of year | |
| Fair value of plan assets at beginning of year | |
| Fair value of plan assets at beginning of year | Fair value of plan assets at beginning of year | $ | — | | | $ | — | | | $ | — | |
| Employer contributions | Employer contributions | 55 | | | 90 | | | 84 | |
| Benefits paid | Benefits paid | (55) | | | (90) | | | (84) | |
| Fair value of plan assets at end of year | Fair value of plan assets at end of year | $ | — | | | $ | — | | | $ | — | |
| Unfunded status | Unfunded status | $ | (2,138) | | | $ | (2,288) | | | $ | (2,170) | |
Amounts recognized in accumulated other comprehensive income(1): | Amounts recognized in accumulated other comprehensive income(1): | | | | | |
| Net prior service credit | Net prior service credit | $ | 359 | | | $ | 435 | | | $ | 511 | |
| Net prior service credit | |
| Net prior service credit | |
| Net gain | Net gain | 607 | | | 376 | | | 491 | |
| Net amount recognized | Net amount recognized | $ | 966 | | | $ | 811 | | | $ | 1,002 | |
| Components of net periodic cost (benefit): | | | | | |
| Components of net periodic (benefit) cost: | |
| Service cost | |
| Service cost | |
| Service cost | Service cost | $ | 67 | | | $ | 61 | | | $ | 54 | |
| Interest cost | Interest cost | 54 | | | 67 | | | 78 | |
| Amortization of prior service cost | Amortization of prior service cost | (76) | | | (76) | | | (76) | |
| Net gain recognition | Net gain recognition | (20) | | | (36) | | | (63) | |
| Net periodic cost (benefit) | $ | 25 | | | $ | 16 | | | $ | (7) | |
| Net periodic (benefit) cost | |
| Assumption used to determine net periodic benefit cost: | Assumption used to determine net periodic benefit cost: | | | | | |
| Discount rate | |
| Discount rate | |
| Discount rate | Discount rate | 2.40 | % | | 3.20 | % | | 4.20 | % | 5.00 | % | | 2.80 | % | | 2.40 | % |
| | Assumption used to value the Accumulated Postretirement Benefit Obligation (APBO): | Assumption used to value the Accumulated Postretirement Benefit Obligation (APBO): | |
| Assumption used to value the Accumulated Postretirement Benefit Obligation (APBO): | |
| Assumption used to value the Accumulated Postretirement Benefit Obligation (APBO): | |
| Discount rate | |
| Discount rate | |
| Discount rate | Discount rate | 2.70 | % | | 2.40 | % | | 3.10 | % | 5.30 | % | | 5.00 | % | | 2.70 | % |
|
(1)Before tax effects
Estimated future benefit payments:
The following table shows the expected future payments for the next 10 years:
| | | | | |
| (Dollars in thousands) | |
During 2022 | $ | 58 | |
During 2023 | 60 | |
| During 2024 | 64 $ | 52 | |
| During 2025 | 7057 | |
| During 2026 | 7360 | |
During 2027 through 2031 | 43163 | |
| During 2028 | 67 | |
| During 2029 through 2033 | 402 | |
| $ | 756701 | |
The Company assumes medical benefits will increase at an average rate of less than 10% per annum. The costs incurred for retirees’ health care are limited since certain current and all future retirees are restricted to an annual medical premium cap indexed (since 1995) by the lesser of 4% or the actual increase in medical premiums paid by us. For 2021,2023, this annual premium cap amounted to $3,997$4,323 per retiree. The Company estimates that it will contribute approximately $4,157$4,496 per retiree to the plan during fiscal 2022.
Alliance Associate Pension Plan
During the fourth quarter of 2015, the Company completed the acquisition of Alliance. At the time of the acquisition the Company assumed the Alliance pension plan offered to current Alliance associates.
During the fourth quarter of 2018, the Company notified the Alliance pension plan participants, the Internal Revenue Service (IRS), and the Pension Benefit Guaranty Corporation (PBGC) of its intention to terminate the plan and received IRS and PBGC approval in the first quarter of 2020. The Company completed the termination and contributed $0.5 million to the plan to settle the obligation during the three months ended June 30, 2020.
The following disclosures relating to Alliance pension benefits were measured at:
| | | | | | | | | | | | | | |
| (Dollars in thousands) | | | June 30, 2020 | | December 31, 2019 | |
| Change in benefit obligation: | | | | | | |
| Benefit obligation at beginning of year | | | $ | 6,893 | | | $ | 6,289 | | |
| Interest cost | | | 105 | | | 253 | | |
| Settlements | | | (7,272) | | | (282) | | |
| Disbursements | | | — | | | (231) | | |
| Actuarial loss | | | 274 | | | 864 | | |
| Benefit obligation at end of period | | | $ | — | | | $ | 6,893 | | |
| Change in plan assets: | | | | | | |
| Fair value of plan assets at beginning of year | | | $ | 7,431 | | | $ | 6,533 | | |
| Actual return on plan assets | | | (159) | | | 1,435 | | |
| Settlements | | | (7,272) | | | (273) | | |
| Benefits paid | | | — | | | (231) | | |
| Administrative expenses | | | — | | | (33) | | |
| Fair value of plan assets at end of period | | | $ | — | | | $ | 7,431 | | |
| Funded status | | | $ | — | | | $ | 538 | | |
Amounts recognized in accumulated other comprehensive income(1): | | | | | | |
| Net loss | | | $ | — | | | $ | (279) | | |
| Components of net periodic cost (benefit): | | | | | | |
| Service cost | | | $ | 17 | | | $ | 40 | | |
| Interest cost | | | 105 | | | 253 | | |
| Expected return on plan assets | | | (196) | | | (471) | | |
| Settlements | | | — | | | 16 | | |
| Plan settlement loss | | | 1,431 | | | — | | |
| Net gain recognition | | | — | | | — | | |
| Net periodic cost (benefit) | | | $ | 1,357 | | | $ | (162) | | |
| | | | | | |
| | | | | | |
| | | | | | |
| | | | | | |
| | | | | | |
| | | | | | |
(1)Before tax effects
Beneficial Associate Pension and other postretirement benefit plans
On March 1, 2019, the Company closed the acquisition of Beneficial. At the time of acquisition, the Company assumed the pension plan covering certain eligible Beneficial Associates. The plan was frozen in 2008.
The following disclosures relating to Beneficial pension benefits and other postretirement benefit plans were measured at December 31, 2021:2023:
| | 2021 | | 2020 |
| | 2023 | | | | 2023 | | 2022 | | 2021 |
| (Dollars in thousands) | (Dollars in thousands) | | Pension Benefits | | Other Postretirement Benefits | | Pension Benefits | | Other Postretirement Benefits | (Dollars in thousands) | | Pension Benefits | | Other Postretirement Benefits | | Pension Benefits | | Other Postretirement Benefits | | Pension Benefits | | Other Postretirement Benefits |
| Change in benefit obligation: | Change in benefit obligation: | | | | | | | | |
| Benefit obligation at beginning of year | Benefit obligation at beginning of year | | $ | 112,283 | | | $ | 19,302 | | | $ | 102,878 | | | $ | 20,263 | |
| Benefit obligation at beginning of year | |
| Benefit obligation at beginning of year | |
| | Service cost | |
| Service cost | |
| Service cost | Service cost | | — | | | 39 | | | — | | | 48 | |
| Interest cost | Interest cost | | 2,100 | | | 309 | | | 2,910 | | | 475 | |
| Plan participants' contributions | Plan participants' contributions | | — | | | 68 | | | — | | | 35 | |
| Amendments | Amendments | | (83) | | | — | | | — | | | (202) | |
| Actuarial (loss) gain | | (4,420) | | | (442) | | | 11,499 | | | (520) | |
| Actuarial loss (gain) | |
| Benefits paid | Benefits paid | | (5,185) | | | (1,171) | | | (5,004) | | | (797) | |
| Benefit obligation at end of year | Benefit obligation at end of year | | $ | 104,695 | | | $ | 18,105 | | | $ | 112,283 | | | $ | 19,302 | |
| Change in plan assets: | Change in plan assets: | | | | | | | | |
| Fair value of plan assets at beginning of year | Fair value of plan assets at beginning of year | | $ | 111,129 | | | $ | — | | | $ | 100,388 | | | $ | — | |
| Fair value of plan assets at beginning of year | |
| Fair value of plan assets at beginning of year | |
| | Actual return on Plan Assets | |
| Actual return on Plan Assets | |
| Actual return on Plan Assets | Actual return on Plan Assets | | 2,734 | | | — | | | 15,985 | | | — | |
| Employer contribution | Employer contribution | | 308 | | | 1,103 | | | 340 | | | 762 | |
| Participants' contributions | Participants' contributions | | — | | | 68 | | | — | | | 35 | |
| Settlements | Settlements | | (83) | | | — | | | — | | | — | |
| Benefits paid | Benefits paid | | (5,185) | | | (1,171) | | | (5,004) | | | (797) | |
| Administrative expenses | Administrative expenses | | (661) | | | — | | | (580) | | | — | |
| Fair value of plan assets at end of year | Fair value of plan assets at end of year | | $ | 108,242 | | | $ | — | | | $ | 111,129 | | | $ | — | |
| Funded (unfunded) status | Funded (unfunded) status | | $ | 3,547 | | | $ | (18,105) | | | $ | (1,154) | | | $ | (19,302) | |
Amounts recognized in accumulated other comprehensive income(1): | Amounts recognized in accumulated other comprehensive income(1): | | | | | | | | |
| Net loss | | $ | 6,882 | | | $ | 87 | | | $ | 6,635 | | | $ | 517 | |
| Net loss (gain) | |
| Net loss (gain) | |
| Net loss (gain) | |
| Components of net periodic (benefit) cost: | Components of net periodic (benefit) cost: | |
| Service cost | |
| Service cost | |
| Service cost | Service cost | | $ | — | | | $ | 39 | | | $ | — | | | $ | 48 | |
| Interest cost | Interest cost | | 2,100 | | | 309 | | | 2,910 | | | 475 | |
| Expected return on plan assets | Expected return on plan assets | | (6,783) | | | — | | | (6,363) | | | — | |
| Net loss (gain) recognition | Net loss (gain) recognition | | 27 | | | (11) | | | 4 | | | (205) | |
| Net periodic (benefit) cost | Net periodic (benefit) cost | | $ | (4,656) | | | $ | 337 | | | $ | (3,449) | | | $ | 318 | |
|
(1)Before tax effects
Significant assumptions used to calculate the net periodic benefit cost and obligation for Beneficial postretirement plans as of December 31, 20212023 are as follows:
| | Consolidated Pension Plan | Consolidated Pension Plan | | 2021 | | 2020 | Consolidated Pension Plan | | 2023 | | 2022 | | 2021 |
| Discount rate for net periodic benefit cost | Discount rate for net periodic benefit cost | | 2.50 | % | | 2.91 | % | Discount rate for net periodic benefit cost | | 5.24 | % | | 2.82 | % | | 2.50 | % |
| Expected return on plan assets | Expected return on plan assets | | 6.25 | % | | 6.50 | % | Expected return on plan assets | | 6.25 | % | | 6.25 | % | | 6.25 | % |
| Discount rate for disclosure obligations | Discount rate for disclosure obligations | | 2.82 | % | | 3.25 | % | Discount rate for disclosure obligations | | 5.01 | % | | 5.24 | % | | 2.82 | % |
| Beneficial Bank Other Postretirement | Beneficial Bank Other Postretirement | |
| Discount rate for net periodic benefit cost | Discount rate for net periodic benefit cost | | 2.32 | % | | 3.12 | % |
| Discount rate for net periodic benefit cost | |
| Discount rate for net periodic benefit cost | | | 5.18 | % | | 2.69 | % | | 2.32 | % |
| Discount rate for disclosure obligations | Discount rate for disclosure obligations | | 2.70 | % | | 2.31 | % | Discount rate for disclosure obligations | | 4.96 | % | | 5.18 | % | | 2.70 | % |
| FMS Other Postretirement | FMS Other Postretirement | |
| Discount rate for net periodic benefit cost | |
| Discount rate for net periodic benefit cost | |
| Discount rate for net periodic benefit cost | Discount rate for net periodic benefit cost | | 1.47 | % | | 2.61 | % | | 4.93 | % | | 2.07 | % | | 1.47 | % |
| Discount rate for disclosure obligations | Discount rate for disclosure obligations | | 2.07 | % | | 1.49 | % | Discount rate for disclosure obligations | | 4.73 | % | | 4.93 | % | | 2.07 | % |
| Split-Dollar Plan | Split-Dollar Plan | |
| Discount rate for net periodic benefit cost | Discount rate for net periodic benefit cost | | 1.44 | % | | 2.57 | % |
| Discount rate for net periodic benefit cost | |
| Discount rate for net periodic benefit cost | | | 4.92 | % | | 2.05 | % | | 1.44 | % |
| Discount rate for disclosure obligations | Discount rate for disclosure obligations | | 2.04 | % | | 1.45 | % | Discount rate for disclosure obligations | | 4.73 | % | | 4.92 | % | | 2.04 | % |
Estimated future benefit payments:
The following table shows the expected future payments for the next 10 years:
| | | | | | | | | | | |
| (Dollars in thousands) | Pension Benefits | | Other Postretirement Benefits |
| During 2022 | $ | 5,124 | | | $ | 1,083 | |
| During 2023 | 5,284 | | | 1,092 | |
| During 2024 | 6,451 | | | 1,095 | |
| During 2025 | 5,236 | | | 1,143 | |
| During 2026 | 6,745 | | | 1,150 | |
| During 2027 through 2031 | 27,877 | | | 5,507 | |
| $ | 56,717 | | | $ | 11,070 | |
| | | | | | | | | | | |
| (Dollars in thousands) | Pension Benefits | | Other Postretirement Benefits |
| During 2024 | $ | 5,999 | | | $ | 1,079 | |
| During 2025 | 4,794 | | | 1,134 | |
| During 2026 | 5,354 | | | 1,150 | |
| During 2027 | 5,707 | | | 1,147 | |
| During 2028 | 5,038 | | | 1,139 | |
| During 2029 through 2033 | 26,480 | | | 5,176 | |
| $ | 53,372 | | | $ | 10,825 | |
The fair values and weighted average asset allocations in plan assets of all pension and postretirement plan assets at December 31, 20212023 and 20202022 by asset category are as follows: | | | | | | | | | | | | | | | | | | | | | | | | | | | | | | | | |
| | Category Used for Fair Value Measurement |
| | December 31, 2021 |
| (Dollars in thousands) | | Level 1 | | Level 2 | | Level 3 | | Total | | Percent |
| Assets: | | | | | | | | | | |
| Mutual Funds: | | | | | | | | | | |
| Large cap | | $ | 5,610 | | | $ | — | | | $ | — | | | $ | 5,610 | | | 5.2 | % |
| Mid cap | | 75 | | | — | | | — | | | 75 | | | 0.1 | |
| Small cap | | 59 | | | — | | | — | | | 59 | | | 0.1 | |
| International | | 9,728 | | | — | | | — | | | 9,728 | | | 9.0 | |
| Global Managed Volatility | | 8,640 | | | — | | | — | | | 8,640 | | | 8.0 | |
| U.S. Managed Volatility | | 3,243 | | | — | | | — | | | 3,243 | | | 3.0 | |
| Fixed Income | | 69,194 | | | — | | | — | | | 69,194 | | | 63.9 | |
| U.S. Government Agencies | | — | | | 11,524 | | | — | | | 11,524 | | | 10.6 | |
| Accrued Income | | 169 | | | — | | | — | | | 169 | | | 0.1 | |
| Total | | $ | 96,718 | | | $ | 11,524 | | | $ | — | | | $ | 108,242 | | | 100.0 | % |
| | Category Used for Fair Value Measurement |
| December 31, 2020 |
| | Category Used for Fair Value Measurement | | | | Category Used for Fair Value Measurement |
| | December 31, 2023 | | | | December 31, 2023 |
| (Dollars in thousands) | (Dollars in thousands) | | Level 1 | | Level 2 | | Level 3 | | Total | | Percent | (Dollars in thousands) | | Level 1 | | Level 2 | | Level 3 | | Total | | Percent |
| Assets: | Assets: | | | | | | | | | | |
| Mutual Funds: | Mutual Funds: | |
| Mutual Funds: | |
| Mutual Funds: | |
| Large cap | Large cap | | $ | 5,827 | | | $ | — | | | $ | — | | | $ | 5,827 | | | 5.2 | % |
| Mid cap | | 69 | | | — | | | — | | | 69 | | | 0.1 | |
| Small cap | | 61 | | | — | | | — | | | 61 | | | 0.1 | |
| Large cap | |
| Large cap | | | $ | 3,215 | | | $ | — | | | $ | — | | | $ | 3,215 | | | 3.9 | % |
| | International | |
| | International | |
| | International | International | | 10,249 | | | — | | | — | | | 10,249 | | | 9.2 | |
| Global Managed Volatility | Global Managed Volatility | | 8,970 | | | — | | | — | | | 8,970 | | | 8.1 | |
| U.S. Managed Volatility | U.S. Managed Volatility | | 3,363 | | | — | | | — | | | 3,363 | | | 3.0 | |
| Fixed Income | Fixed Income | | 73,071 | | | — | | | — | | | 73,071 | | | 65.8 | |
| U.S. Government Agencies | U.S. Government Agencies | | 9,345 | | | — | | | — | | | 9,345 | | | 8.4 | |
| Pooled separate accounts | |
| Accrued Income | Accrued Income | | 174 | | | — | | | — | | | 174 | | | 0.1 | |
| Total | Total | | $ | 111,129 | | | $ | — | | | $ | — | | | $ | 111,129 | | | 100.0 | % | Total | | $ | 71,347 | | | $ | | $ | 10,743 | | | $ | | $ | — | | | $ | | $ | 82,090 | | | 100.0 | | 100.0 | % |
| | | | | | | | | | | | | | | | | | | | | | | | | | | | | | | | |
| | Category Used for Fair Value Measurement |
| | December 31, 2022 |
| (Dollars in thousands) | | Level 1 | | Level 2 | | Level 3 | | Total | | Percent |
| Assets: | | | | | | | | | | |
| Mutual Funds: | | | | | | | | | | |
| Large cap | | $ | 3,721 | | | $ | — | | | $ | — | | | $ | 3,721 | | | 4.7 | % |
| | | | | | | | | | |
| | | | | | | | | | |
| International | | 6,651 | | | — | | | — | | | 6,651 | | | 8.4 | |
| Global Managed Volatility | | 5,901 | | | — | | | — | | | 5,901 | | | 7.4 | |
| U.S. Managed Volatility | | 2,216 | | | — | | | — | | | 2,216 | | | 2.8 | |
| Fixed Income | | 43,255 | | | — | | | — | | | 43,255 | | | 54.6 | |
| U.S. Government Agencies | | — | | | 17,259 | | | — | | | 17,259 | | | 21.8 | |
| Pooled Separate Accounts | | 123 | | | — | | | — | | | 123 | | | 0.2 | |
| Accrued Income | | 161 | | | — | | | — | | | 161 | | | 0.1 | |
| Total | | $ | 62,028 | | | $ | 17,259 | | | $ | — | | | $ | 79,287 | | | 100.0 | % |
As of December 31, 2021,2023, pension and postretirement plan assets were comprised of investments in equity andmutual funds, fixed income mutual funds.funds, and pooled separate accounts. The Bank’s consolidated pension plan investment policy provides that assets are to be managed over a long-term investment horizon to ensure that the chances and duration of investment losses are carefully weighed against the long-term potential for asset appreciation. The primary objective of managing a plan’s assets is to improve the plan’s funded status. A secondary financial objective is, where possible, to minimize pension expense volatility. The Company’s pension plan allocates assets based on the plan’s funded status to risk management and return enhancement asset classes. The risk management class is comprised of a long duration fixed income fund while the return enhancement class consists of equity and other fixed income funds. Asset allocation ranges are generally 40% to 80% for risk management and 20% to 60% for return enhancement when the funded status is less than 110%, and 50% to 90% in risk management and 10% to 50% for return enhancement when the funded status reaches 110%, subject to the discretion of the Company. Also, a small portion is maintained in cash reserves when appropriate.
The Company has 4four additional plans which are no longer being provided to current Associates: (1) a Supplemental Pension Plan with a corresponding liability of $0.4$0.2 million and $0.5$0.3 million for December 31, 20212023 and 20202022 respectively; (2) an Early Retirement Window Plan with a corresponding liability of $0.1 million for both December 31, 20212023 and 2020;2022; (3) a Supplemental Executive Retirement Plan with a corresponding liability of $1.4$1.3 million for both December 31, 20212023 and 2020,2022, and; (4) a Post-Retirement Medical Plan with a corresponding liability of $0.1 million for both December 31, 20212023 and 2020.2022.
15. INCOME TAXES
The Company and its subsidiaries file a consolidated federal income tax return and separate state income tax returns. The Company's income tax provision consists of the following:
| | | | | | | | | | | | | | | | | |
| Year ended December 31, |
| (Dollars in thousands) | 2021 | | 2020 | | 2019 |
| Current income taxes: | | | | | |
| Federal taxes | $ | 32,836 | | | $ | 57,716 | | | $ | 31,401 | |
| State and local taxes | 13,421 | | | 6,768 | | | 7,977 | |
| Deferred income taxes: | | | | | |
| Federal taxes | 37,251 | | | (32,962) | | | 5,987 | |
| State and local taxes | 2,587 | | | 114 | | | 1,087 | |
| Total | $ | 86,095 | | | $ | 31,636 | | | $ | 46,452 | |
Current federal income taxes include taxes on income that cannot be offset by net operating loss carryforwards. | | | | | | | | | | | | | | | | | |
| Year ended December 31, |
| (Dollars in thousands) | 2023 | | 2022 | | 2021 |
| Current income taxes: | | | | | |
| Federal taxes | $ | 81,674 | | | $ | 63,203 | | | $ | 32,836 | |
| State and local taxes | 19,968 | | | 18,763 | | | 13,421 | |
| Deferred income taxes: | | | | | |
| Federal taxes | (5,331) | | | (4,094) | | | 37,251 | |
| State and local taxes | (66) | | | 89 | | | 2,587 | |
| Total | $ | 96,245 | | | $ | 77,961 | | | $ | 86,095 | |
Deferred income taxes reflect the net tax effects of temporary differences between the carrying amounts of assets and liabilities for financial reporting purposes and the amounts used for income tax purposes. The following is a summary of the significant components of the Company's deferred tax assets and liabilities as of December 31, 20212023 and 2020:2022:
| | (Dollars in thousands) | (Dollars in thousands) | 2021 | | 2020 | (Dollars in thousands) | 2023 | | 2022 |
| Deferred tax assets: | Deferred tax assets: | | | |
| | Allowance for credit losses | |
| | Allowance for credit losses | |
| | Allowance for credit losses | Allowance for credit losses | $ | 19,847 | | | $ | 48,050 | |
| Purchase accounting adjustments—loans | Purchase accounting adjustments—loans | 10,264 | | | 18,084 | |
| Reserves and other accruals | Reserves and other accruals | 16,444 | | | 17,115 | |
| Investments | Investments | 2,038 | | | 2,045 | |
| | Net operating losses | |
| Net operating losses | |
| Net operating losses | |
| Derivatives | |
| | Derivatives | 4,181 | | | 5,009 | |
| Employee benefit plans | 1,340 | | | 2,504 | |
| Lease liabilities | |
| Lease liabilities | |
| Lease liabilities | Lease liabilities | 33,501 | | | 34,955 | |
| Unrealized losses on available-for-sale securities | Unrealized losses on available-for-sale securities | 10,642 | | | — | |
Other (1) | Other (1) | 479 | | | 821 | |
| Total deferred tax assets | Total deferred tax assets | $ | 98,736 | | | $ | 128,583 | |
| Deferred tax liabilities: | Deferred tax liabilities: | |
| Unrealized gains on available-for-sale securities | $ | — | | | $ | (18,997) | |
| | Legal settlement | (3,150) | | | — | |
| | Accelerated depreciation | |
| | Accelerated depreciation | |
| | Accelerated depreciation | Accelerated depreciation | (4,467) | | | (4,233) | |
| Right of use assets | Right of use assets | (30,268) | | | (31,707) | |
| Deferred loan costs | (230) | | | (783) | |
| | Intangibles | |
| Intangibles | |
| Intangibles | Intangibles | (20,897) | | | (22,373) | |
Other (2) | Other (2) | (756) | | | (1,278) | |
| Total deferred tax liabilities | Total deferred tax liabilities | (59,768) | | | (79,371) | |
| Net deferred tax asset | Net deferred tax asset | $ | 38,968 | | | $ | 49,212 | |
(1)Other deferred tax assets includes deferred gains, tax credits, and net operating losses.reverse mortgages in 2023 and 2022, and employee benefit plans in 2022.
(2)Other deferred tax liabilities includes deferred loan costs, derivatives and reverse mortgages.partnership investments in 2023 and 2022, and employee benefit plans in 2023.
Included in the table above is the effect of certain temporary differences for which noare deferred tax expense or benefit was recognized. In 2021,taxes recorded in accumulated other comprehensive income (loss). At December 31, 2023, such items consisted primarily of $10.6deferred tax assets of $186.8 million of unrealized losses on certain investments in debt and equity securities accounted for under ASC 320 and $1.5 million of unrealized losses related to postretirement benefit obligations accounted for under ASC 715. In 2020, theyAt December 31, 2022, the deferred tax assets consisted primarily of $19.0$212.2 million of unrealized gains on certain investments in debt and equity securities and $1.6$1.5 million of unrealized losses related to postretirement benefit obligations.
Based on the Company's history of prior earnings and its expectations of the future, it is anticipated that operating income and the reversal pattern of its temporary differences will, more likely than not, be sufficient to realize a net deferred tax asset of $39.0$230.3 million at December 31, 2021.
Pursuant to accounting guidance,2023. The Company is not required to provide deferred taxes on Beneficial’s tax loan loss reserve asreduces the carrying amounts of December 31, 1987. As of December 31, 2021, Beneficial had unrecognized deferred income taxes of approximately $1.7 million with respect to this reserve. This reserve could be recognized as taxable income and create a current and/or deferred tax liability usingassets by a valuation allowance if, based on the incomeavailable evidence, it is more likely than not that such assets will not be realized. The need to establish valuation allowances for deferred tax rates thenassets is assessed quarterly. In assessing the requirement for, and amount of, a valuation allowance in effect if oneaccordance with the more likely than not standard for all periods, the Company considers all positive and negative evidence related to the realization of the following occur: (1)deferred tax assets. This assessment considers, among other matters, the Bank’s retained earnings represented by this reserve are used for distributionsgeneration of future profitability, the reversal of deferred tax liabilities, and tax planning strategies.
The Company has $13.0 million of remaining Federal net operating losses (NOLs). Such NOLs expire beginning in liquidation or for any other purpose other than2030 and, due to absorb losses from bad debts; (2) the Bank fails to qualify as a Bank, as provided by the Internal Revenue Code; or (3) there is a change in federalService (IRS) limitations, $2.8 million are being utilized each year. Accordingly, the Company fully expects to utilize all of these NOLs. The Company has no state NOLs. Finally, the Company has $0.5 million of alternative minimum tax law.credits that have no expiration date and are fully expected to be utilized.
A reconciliation showing the differences between the Company's effective tax rate and the U.S. Federal statutory tax rate is as follows:
| | | | | | | | | | | | | | | | | |
| Year ended December 31, |
| Year Ended December 31, | 2021 | | 2020 | | 2019 |
| Statutory federal income tax rate | 21.0 | % | | 21.0 | % | | 21.0 | % |
| State tax, net of federal tax benefit | 3.9 | | | 3.7 | | | 3.5 | |
| | | | | |
| | | | | |
| Adjustment to net deferred tax asset for enacted changes in tax laws and rates | — | | | (1.2) | | | — | |
| Tax-exempt interest | (0.2) | | | (0.7) | | | (0.6) | |
| Bank-owned life insurance income | (0.1) | | | (0.2) | | | (0.1) | |
| Excess tax benefits from share-based compensation | (0.1) | | | — | | | (1.0) | |
| Nondeductible acquisition costs | 0.2 | | | — | | | 0.2 | |
| Federal tax credits, net of amortization | (0.5) | | | (0.8) | | | (0.2) | |
| Nondeductible compensation | — | | | — | | | 0.9 | |
| Other | (0.1) | | | — | | | 0.2 | |
| Effective tax rate | 24.1 | % | | 21.8 | % | | 23.9 | % |
As a result of the adoption of ASU 2016-09, Improvements to Employee Share-Based Payment Accounting, the Company recorded $0.4 million of income tax benefit in 2021, compared to less than $0.1 million of income tax expense and $2.0 million of income tax benefit in 2020 and 2019, respectively, related to excess tax benefits from stock compensation. This accounting standard will result in volatility to future effective tax rates.
The Company has $0.5 million of remaining Federal NOLs. Such NOLs expire beginning in 2030 and, due to Internal Revenue Service (IRS) limitations, $0.1 million are being utilized each year. Accordingly, the Company fully expects to utilize all of these NOLs. The Company has no state NOLs. | | | | | | | | | | | | | | | | | |
| Year ended December 31, |
| Year Ended December 31, | 2023 | | 2022 | | 2021 |
| Statutory federal income tax rate | 21.0 | % | | 21.0 | % | | 21.0 | % |
| State tax, net of federal tax benefit | 4.4 | | | 5.1 | | | 3.9 | |
| | | | | |
| Tax-exempt interest | (0.6) | | | (0.5) | | | (0.2) | |
| Bank-owned life insurance income | (0.1) | | | — | | | (0.1) | |
| Excess tax benefits from share-based compensation | — | | | — | | | (0.1) | |
| Nondeductible acquisition costs | — | | | 0.1 | | | 0.2 | |
| Federal tax credits, net of amortization | (0.5) | | | (0.4) | | | (0.5) | |
| Nondeductible compensation | 0.1 | | | 0.2 | | | — | |
| Nondeductible goodwill | — | | | 0.5 | | | — | |
| Surrender of bank-owned life insurance policies | 1.9 | | | — | | | — | |
| Other | 0.1 | | | (0.1) | | | (0.1) | |
| Effective tax rate | 26.3 | % | | 25.9 | % | | 24.1 | % |
ASC 740 prescribes a recognition threshold and a measurement attribute for the financial statement recognition and measurement of tax positions taken or expected to be taken in a tax return. Benefits from tax positions are recognized in the financial statements only when it is more-likely-than-not that the tax position will be sustained upon examination by the appropriate taxing authority that would have full knowledge of all relevant information. A tax position that meets the more-likely-than-not recognition threshold is measured at the largest amount of benefit that is greater than 50% likely of being realized upon ultimate settlement. Tax positions that previously failed to meet the more-likely-than-not recognition threshold are recognized in the first subsequent financial reporting period in which that threshold is met. Previously recognized tax positions that no longer meet the more-likely-than-not recognition threshold are derecognized in the first subsequent financial reporting period in which that threshold is no longer met. ASC 740 also provides guidance on the accounting for and disclosure of unrecognized tax benefits, interest and penalties.
Based on recent changes in the interest rate environment lowering our yields on ourBank Owned Life Insurance (BOLI) policies and the termination of a stable value protection wrap policy, we surrendered $65.5 million of previously acquired BOLI policies. This resulted in a taxable gain of $22.6 million and corresponding income tax charge of $7.1 million
There were no unrecognized tax benefits as of December 31, 2021.2023. The Company records interest and penalties on potential income tax deficiencies as income tax expense. The Company's federal and state tax returns for the 20182020 through 20212023 tax years are subject to examination as of December 31, 2021, while tax years 2018 through 2021 generally remain subject to examination by state taxing jurisdictions.2023. No federal or state income tax return examinations are currently in process. The Company does not expect to record or realize any material unrecognized tax benefits during 2022.
As a result of the adoption of ASC 326 - Credit Losses on January 1, 2020, the tax impact relating to the incremental provision for expected credit losses from financial assets held at amortized cost has been reflected as a credit to retained earnings to reflect the tax impact of increased credit reserves. Accordingly, $8.5 million of such impact has been reflected as an income tax credit and deferred tax asset on the Company's Consolidated Statements of Financial Condition.
Section 2303(b) of the CARES act provides the Company with an opportunity to carry back net operating losses (NOLs) arising from 2018, 2019 and 2020 to the prior five tax years. The Company has such NOLs reflected on its balance sheet as a portion of its current tax receivables, which were previously valued at the federal corporate income tax rate of 21%. However, the provisions of the CARES Act provide for NOL carryback claims to be calculated based on a rate of 35%, which was the federal corporate tax rate in effect for the carryback years. Consequently, effective March 31, 2020, the Company has revalued the benefit from its NOLs to reflect a 35% tax rate, which resulted in the recognition of an additional $1.7 million income tax benefit and deferred tax asset on the Company's Consolidated Statements of Financial Condition.2024.
The amortization of the low-income housing credit investments has been reflected as income tax expense in the amount of $3.6$3.9 million for the year ended December 31, 2021,2023, compared to $3.3$4.8 million and $3.0$3.6 million for the years ended December 31, 20202022 and December 31, 2019,2021, respectively.
The amount of affordable housing tax credits, amortization and tax benefits recorded as income tax expense for the year ended December 31, 20212023 were $3.5$4.7 million, $3.6$3.9 million and $0.7$1.9 million respectively. The carrying value of the investment in affordable housing credits is $39.6$87.1 million December 31, 2021,2023, compared to $26.6$69.0 million December 31, 2020.2022.
16. STOCK-BASED COMPENSATION
The Company's stock incentive plans provide for the granting of stock options, stock appreciation rights, performance awards, restricted stock, restricted stock units (RSUs), performance-based restricted stock units (PSUs) and other stock based awards or cash incentives that are consistent with the purpose of the incentive plans and interests of the Company. Generally, all time-based awards become fully vested and outstanding stock options and stock appreciation rights become exercisable immediately in the event of a change in control, as defined in the plans.
Upon stockholder approval in 2018, the 2013 Incentive Plan (2013 Plan) was replaced by the 2018 Incentive Plan (2018 Plan). However, outstanding awards under the 2013 Plan remain in effect in accordance with their original terms. The 2018 Plan was amended in 20212023 to increase the number of shares of Common Stock available for issuance. The 2018 Plan also includes 261,709 shares from the Bryn Mawr Incentive Plan and the Bryn Mawr Retainer Plan, which were assumed by the Company in connection with the acquisition of Bryn Mawr Bank Corporation. The number of shares reserved for issuance under the 2018 Plan is 6,261,709. The 2018 Plan will terminate on the tenth anniversary of its effective date, after which no awards may be granted. The number of shares reserved for issuance under the 2018 Plan is 3,000,000, of which 1,584,835At December 31, 2023, 3,313,543 shares were available for future grants at December 31, 2021. Generally, all time-basedunder the 2018 Plan.
During February 2022, the Board of Directors and the Leadership and Compensation Committee (the Committee) approved the Executive Leadership Team Incentive Plan (ELTIP), which provides for new cash and equity awards become fully vesteddesigned to recognize the rewards and outstanding stock optionsefforts of the Company's executive leadership team for the Company's achievement of certain key measures of short-term success and stock appreciation rights become exercisable immediatelythe value of such success to the Company's longer-term performance. Awards under the ELTIP include short-term incentive (STI) cash bonus awards and long-term incentive (LTI) awards of RSUs and PSUs that will be issued under the Company's 2018 Incentive Plan. LTI awards under the ELTIP will be awarded to the CEO and Executive Vice Presidents that directly report to the CEO in the eventform of RSUs that vest in equal annual installments over a three-year service period, and PSUs that vest based on a service condition defined as the achievement of a change in control, as defined inthree-year service period and a performance condition based on the plans.Company's cumulative core ROA performance over a three-year period relative to the KBW Nasdaq Regional Bank Index (the KRX Index) for the same period.
Total stock-based compensation expense recognized was $10.0 million ($7.6 million after tax) for 2023, $9.0 million ($6.7 million after tax) for 2022, and $6.3 million ($4.8 million after tax) for 2021, $3.1 million ($2.5 million after tax) for 2020, and $4.5 million ($3.4 million after tax) for 2019.2021. As part of the expense calculation, the Company has elected to recognize forfeitures as they occur. Stock-based compensation expense related to awards granted to Associates is recorded in Salaries, benefits and other compensation; expense related to awards granted to directors and advisory board members is recorded in Other operating expense in the Company's Consolidated Statements of Income.
Stock Options
Stock options are granted with an exercise price not less than the fair market value of the Company's common stock on the date of the grant. No stock options were granted during 2023 or 2022. All stock options granted during 2021 2020, and 2019 vest in 25% per annum increments, start to become exercisable in April of the year following the year of grant, and expire between five and seven years from the grant date. New shares are issued upon the exercise of options.
The Company determines the grant date fair value of stock options using the Black-Scholes option-pricing model. The model requires the use of numerous assumptions, many of which are subjective. Significant assumptions used to determine 2021 2020, and 2019 grant date fair value included expected term, which was derived from historical exercise patterns and represents the amount of time that stock options granted are expected to be outstanding; volatility, measured using the fluctuation in month end closing stock prices over a period which corresponds with the average expected option life; a weighted-average risk-free rate of return (zero coupon treasury yield); and a dividend yield indicative of the Company's current dividend rate. The assumptions used to determine the grant date fair value for options issued during 2021 2020, and 2019 are presented below:
| | | | | | | | | | | | | | | | | |
| 2021 | | 2020 | | 2019 |
| Expected term (in years) | 5.5 | | 5.5 | | 5.5 |
| Volatility | 23.9 | % | | 25.0 | % | | 23.6 | % |
| Weighted-average risk-free interest rate | 1.16 | % | | 1.06 | % | | 2.50 | % |
| Dividend yield | 1.33 | % | | 1.39 | % | | 1.02 | % |
| | | | | | | | | |
| | | | | 2021 |
| Expected term (in years) | | | | | 5.5 |
| Volatility | | | | | 23.9 | % |
| Weighted-average risk-free interest rate | | | | | 1.16 | % |
| Dividend yield | | | | | 1.33 | % |
A summary of option activity as of December 31, 2021,2023, and changes during the year the ended December 31, 2021,2023, is presented below:
| | | | 2021 | | 2023 |
| | | Shares | | Weighted- Average Exercise Price | | Weighted-Average Remaining Contractual Term (Years) | | Aggregate Intrinsic Value (In Thousands) | | Shares | | Weighted- Average Exercise Price | | Weighted-Average Remaining Contractual Term (Years) | | Aggregate Intrinsic Value (In Thousands) |
| Stock Options: | Stock Options: | | | | | | | |
| Outstanding at beginning of year | Outstanding at beginning of year | 449,761 | | | $ | 36.80 | | | 4.16 | | $ | 3,910 | |
| Plus: Granted | 105,164 | | | 51.84 | | |
| Outstanding at beginning of year | |
| Outstanding at beginning of year | |
| | Less: Exercised | |
| Less: Exercised | |
| Less: Exercised | Less: Exercised | (69,873) | | | 25.64 | | |
| Forfeited | Forfeited | (19,628) | | | 48.15 | | |
| Forfeited | |
| Forfeited | |
| Expired | |
| Expired | |
| Expired | |
| Outstanding at end of year | |
| Outstanding at end of year | |
| Outstanding at end of year | Outstanding at end of year | 465,424 | | | 41.39 | | | 4.52 | | 4,243 | |
| Nonvested at end of year | Nonvested at end of year | 245,462 | | | 43.28 | | | 2.57 | | 1,680 | |
| Exercisable at end of year | Exercisable at end of year | 219,962 | | | 39.29 | | | 3.49 | | 2,398 | |
The weighted-average fair value of options granted was $10.44 in 2021, $7.19 in 2020 and $10.26 in 2019.2021. The aggregate intrinsic value of options exercised was $0.5 million in 2023, $0.8 million in 2022, and $1.9 million in 2021, $1.8 million in 2020, and $12.3 million in 2019.2021.
The following table summarizes the non-vested stock option activity during the year the ended December 31, 2021:2023:
| | | | 2021 | | 2023 |
| Shares | | Weighted-Average Exercise Price | | Weighted-Average Grant Date Fair Value |
| Shares | | | Shares | | Weighted-Average Exercise Price | | Weighted-Average Grant Date Fair Value |
| Stock Options: | Stock Options: | | | | | |
| Nonvested at beginning of period | Nonvested at beginning of period | 242,158 | | | $ | 38.66 | | | $ | 8.51 | |
| Plus: Granted | 105,164 | | | 51.84 | | | 10.44 | |
| Nonvested at beginning of period | |
| Nonvested at beginning of period | |
| | Less: Vested | |
| Less: Vested | |
| Less: Vested | Less: Vested | (101,860) | | | 41.14 | | | 9.10 | |
| Forfeited | Forfeited | — | | | — | | | — | |
| Nonvested at end of period | Nonvested at end of period | 245,462 | | | 43.28 | | | 9.09 | |
The total amount of unrecognized compensation cost related to non-vested stock options as of December 31, 20212023 was $1.4$0.2 million. The weighted-average period over which the expense is expected to be recognized is 2.571.13 years. During 2021,2023, the Company recognized $1.1$0.3 million of compensation expense related to these awards.
Restricted Stock Units
RSUs are granted at no cost to the recipient and generally vest over a four year period, with the exception of RSUs from the ELTIP which vest over a three year period. All outstanding awards granted to senior executives vest over no less than a fourthree year period. The 2013 and 2018 Plans allow for awards with vesting periods less than four years, subject to Board approval. The fair value of RSUs is equal to the fair value of the common stock on the date of grant. The expense related to RSUs granted to Associates is recognized in Salaries, benefits and other compensation and granted to directors in Other operating expense on an accrual basis over the requisite service period for the entire award. When restricted stock is awarded to individuals from whom the Company may not receive services in the future, the expense is recognized when the award is granted, instead of amortizing the expense over the vesting period of the award.
The weighted-average fair value of RSUs granted was $47.68 in 2023, $49.24 in 2022, and $45.64 in 2021, $37.52 in 2020, and $43.28 in 2019.2021. The total amount of compensation cost to be recognized relating to nonvested restricted stock units as of December 31, 20212023 was $7.1$10.3 million. The weighted-average period over which the cost is expected to be recognized is 2.42.02 years. During 2021,2023, the Company recognized $5.3$6.3 million of compensation costexpense related to these awards.
The following table summarizes the Company’s RSUs and changes during the year:
| | Units (in whole) | | Weighted Average Grant-Date Fair Value per Unit |
| Balance at December 31, 2020 | 209,607 | | | $ | 39.66 | |
| Units (in whole) | | | Units (in whole) | | Weighted Average Grant-Date Fair Value per Unit |
| Balance at December 31, 2022 | |
| Plus: Granted | Plus: Granted | 119,714 | | | 45.64 | |
| Less: Vested | Less: Vested | (85,286) | | | 42.18 | |
| Forfeited | Forfeited | (8,194) | | | 44.47 | |
| Balance at December 31, 2021 | 235,841 | | | 41.62 | |
| Balance at December 31, 2023 | |
The total fair value of RSUs that vested was $5.1 million in 2023, $4.5 million in 2022, and $1.9 million in 2021, $1.92021.
Performance Stock Units
PSUs are granted at no cost to the recipient and vest based on both service and performance conditions. The service condition is defined as the achievement of a three-year service period between January 1, 2022 and December 31, 2024. The service condition can be waived at the discretion of the Committee. The performance condition is based on the Company's cumulative core ROA performance over a three-year period relative to the KRX Index for the same period. The actual number of shares that will vest at the end of the three-year period will be based on the core ROA performance over the three-year period relative to the KRX Index. If such performance is at the 25th percentile, 50th percentile, 75th percentile and 100th percentile, grantees will receive 25%, 50%, 75%, and 100% of their maximum award grant, respectively. The fair value of PSUs is equal to the fair value of the common stock on the date of grant. The expense related to PSUs granted to Associates is recognized in Salaries, benefits and other compensation on an accrual basis over the requisite service period if the performance condition is probable and the service condition is met.
The weighted-average fair value of PSUs granted was $49.69 in 2023. The total amount of compensation cost to be recognized relating to nonvested performance stock units (based on current performance estimates) was $4.9 million in 2020,as of December 31, 2023. The weighted-average period over which the cost is expected to be recognized is 1.85 years. During 2023, the Company recognized $1.6 million of compensation expense related to these awards. The following table summarizes the Company’s PSUs and $1.5 million in 2019.changes during the year:
| | | | | | | | | | | |
| Units (in whole) | | Weighted Average Grant-Date Fair Value per Unit |
| Balance at December 31, 2022 | 95,520 | | | $ | 49.76 | |
| Plus: Granted | 97,519 | | | 49.69 | |
| | | |
| Less: Forfeited | (35,291) | | | 49.73 | |
| Balance at December 31, 2023 | 157,748 | | | 49.72 | |
Integration Performance RSU Plan: Plan: In February 2019, the Board of Directors approved the Integration Performance RSU Plan (“the Integration Plan”), in which certain senior executives were granted awards based on the achievement of 3three defined goals measuring the success of the integration of Beneficial and execution of the Company's strategic goals over the five-year period ending 2023. The Plan providesprovided for a three-year performance achievement period beginning in 2021 and ending in 2023. If any or allIn February 2022, the Integration Plan was terminated. In connection with the termination of athe Integration Plan, the portion of RSUs vest priorthe related Integration Performance-Based RSU Awards (the Integration Awards) attributable to 2023, there will be an additional time-based vesting requirement thoughcore ROA was terminated, the end of 2023. The Performance RSUs were granted on February 28, 2019,Gallup Q12 performance goal was met, and the Company accrues expense for thisCommittee exercised its discretion under the Integration Plan based onto deem the estimated probability of achievementGallup CE3 performance goal met. Thus, 20% of the 3 definedrestricted stock units subject to the Integration Awards will performance goals.vest and become subject to service-based vesting conditions. During 2021,2023, the Company recognized $0.3$0.1 million of compensation expense related to these awards.
Beneficial Acquisition Success Plan: On December 10, 2020, the Board of Directors approved the Beneficial Acquisition Success Plan (the “Success Plan”), which isSuccess Plan) and granted 66,703 RSUs, vesting in equal installments over three years. The Success Plan was designed to recognize and reward the Company’s achievement of certain key measures of near-term success related to Beneficial and the efforts of the Company’s senior leaders and the value of such success to the Company’s longer term performance. The key measures of success related to Beneficial include acquisition economics, one-time acquisition costs, banking location integration and optimization, customer deposit retention, and cost synergies. Awards underDuring 2023, the Success Plan have been awarded as RSUs vesting in equal annual installments over three years. The Company granted 66,703 RSUs under the Success Plan on December 10, 2020. During 2021,awards fully vested and the Company recognized $1.1$0.6 million of compensation expense related to these awards.
Awards from both the Integration Plan and the Success Plan will bewere issued under the Company’s 2018 Incentive Plan.
17. COMMITMENTS AND CONTINGENCIES
Legal Proceedings
In the ordinary course of business, the Company is subject to legal actions that involve claims for monetary relief. See Note 24 for additional information.
Financial Instruments With Off-Balance Sheet Risk
In the ordinary course of business, the Company is a party to financial instruments with off-balance sheet risk, primarily to meet the financing needs of its customers. To varying degrees, these financial instruments involve elements of credit risk that are not recognized in the Consolidated Statements of Financial Condition.
Exposure to loss for commitments to extend credit and standby letters of credit written is represented by the contractual amount of those instruments. The Company generally requires collateral to support such financial instruments in excess of the contractual amount of those instruments and use the same credit policies in making commitments as it does for on-balance sheet instruments.
The following represents a summary of off-balance sheet financial instruments at year-end:
| | | | December 31, | | December 31, |
| (Dollars in thousands) | (Dollars in thousands) | 2021 | | 2020 | (Dollars in thousands) | 2023 | | 2022 |
| Financial instruments with contract amounts which represent potential credit risk: | Financial instruments with contract amounts which represent potential credit risk: | | | |
| Construction loan commitments | Construction loan commitments | $ | 403,767 | | | $ | 406,639 | |
| Construction loan commitments | |
| Construction loan commitments | |
| Commercial mortgage loan commitments | Commercial mortgage loan commitments | 91,871 | | | 100,729 | |
| Commercial loan commitments | Commercial loan commitments | 1,088,098 | | | 1,083,512 | |
| Owner-occupied commercial commitments | Owner-occupied commercial commitments | 74,846 | | | 70,155 | |
| Commercial standby letters of credit | Commercial standby letters of credit | 92,048 | | | 95,897 | |
| Residential loan commitments | 6,815 | | | 2,842 | |
| Consumer loan commitments | 731,850 | | | 591,856 | |
Residential loan commitments(1) | |
Consumer loan commitments(2) | |
| Total | Total | $ | 2,489,295 | | | $ | 2,351,630 | |
At December 31, 2021, the Company had total commitments to extend credit of $2.5 billion. Commitments for consumer lines of credit were $731.9 million of which, $600.7 million were secured by real estate. Residential loan commitments generally have closing dates within a one month period but can be extended to six months. (1)Not reflected in the table above are commitments to sell residential loans of $57.9$16.3 million and $91.9$15.3 million at December 31, 20212023 and 2020,2022, respectively.
Consumer loan commitments of $633.8 million were secured by real estate.Commitments provide for financing on predetermined terms as long as the customer continues to meet specific criteria. Commitments generally have fixed expiration dates or other termination clauses and may require payment of a fee. Since many of the commitments are expected to expire without being completely drawn upon, the total commitment amounts do not necessarily represent future cash requirements. Standby letters of credit are conditional commitments issued to guarantee the performance of a customer to a third party. The Company evaluates each customer’s creditworthiness and obtain collateral based on its credit evaluation of the counterparty.
Secondary Market Loan Sales
The Company typically sells newly originated residential loans in the secondary market to mortgage loan aggregators and on a more limited basis, to GSEs, such as FHLMC, FNMA, and the FHLB. Loans held for sale are reflected on the Consolidated Statements of Financial Condition at their fair value with changes in the value reflected in the Consolidated Statements of Income. Gains and losses are recognized at the time of sale. The Company periodically retains the servicing rights on residential loans sold which results in monthly service fee income. The mortgage servicing rights are included in Intangible assets in the Consolidated Statements of Financial Condition. Otherwise, the Company sells loans with servicing released on a nonrecourse basis. Rate-locked loan commitments that the Company intends to sell in the secondary market are accounted for as derivatives under ASC 815, Derivatives and Hedging (ASC 815).
The Company does not sell loans with recourse, except for standard loan sale contract provisions covering violations of representations and warranties and, under certain circumstances, early payment default by the borrower. These are customary repurchase provisions in the secondary market for residential loan sales. These provisions may include either an indemnification from loss or the repurchase of loans. Repurchases and losses have been rare and no provision is made for losses at the time of sale. There were no repurchaseswas one repurchase for $0.8 million during the yearsyear ended December 31, 20212023 and 2020.two repurchases for $0.8 million during the same period in 2022.
Unfunded Lending Commitments
At December 31, 20212023 and December 31, 2020,2022, the allowance for credit losses of unfunded lending commitments was $7.4$12.1 million and $8.2$11.9 million, respectively. A provision releaseexpense for unfunded lending commitments of $0.8$0.2 million was recognized during the year ended December 31, 2021,2023, and a provision expense for unfunded lending commitments of $3.7$0.3 million was recognized during year ended December 31, 2020.2022.
18. FAIR VALUE DISCLOSURES OF FINANCIAL ASSETS AND LIABILITIES
FAIR VALUE OF FINANCIAL ASSETS AND LIABILITIES
ASC 820-10, Fair Value Measurement (ASC 820-10) defines fair value as the price that would be received to sell an asset or paid to transfer a liability in an orderly transaction between market participants at the measurement date. ASC 820-10 establishes a fair value hierarchy that prioritizes the use of inputs used in valuation methodologies into the following three levels:
•Level 1: Inputs to the valuation methodology are quoted prices, unadjusted, for identical assets or liabilities in active markets. A quoted price in an active market provides the most reliable evidence of fair value and shall be used to measure fair value whenever available.
•Level 2: Inputs to the valuation methodology include quoted prices for similar assets or liabilities in active markets; inputs to the valuation methodology include quoted prices for identical or similar assets or liabilities in markets that are not active; or inputs to the valuation methodology that are derived principally from or can be corroborated by observable market data by correlation or other means.
•Level 3: Inputs to the valuation methodology are unobservable and significant to the fair value measurement. Level 3 assets and liabilities include financial instruments whose value is determined using discounted cash flow methodologies, as well as instruments for which the determination of fair value requires significant management judgment or estimation.
The following tables present financial instruments carried at fair value as of December 31, 20212023 and December 31, 20202022 by level in the valuation hierarchy (as described above):
| | December 31, 2021 |
| | December 31, 2023 | | | | December 31, 2023 |
| (Dollars in thousands) | (Dollars in thousands) | | Quoted Prices in Active Markets for Identical Asset (Level 1) | | Significant Other Observable Inputs (Level 2) | | Significant Unobservable Inputs (Level 3) | | Total Fair Value | (Dollars in thousands) | | Quoted Prices in Active Markets for Identical Asset (Level 1) | | Significant Other Observable Inputs (Level 2) | | Significant Unobservable Inputs (Level 3) | | Total Fair Value |
| Assets measured at fair value on a recurring basis: | Assets measured at fair value on a recurring basis: | | | | | | | | |
| Available-for-sale securities: | Available-for-sale securities: | |
| Available-for-sale securities: | |
| Available-for-sale securities: | |
| CMO | |
| CMO | |
| CMO | CMO | | $ | — | | | $ | 575,766 | | | $ | — | | | $ | 575,766 | |
| FNMA MBS | FNMA MBS | | — | | | 4,245,684 | | | — | | | 4,245,684 | |
| FHLMC MBS | FHLMC MBS | | — | | | 145,528 | | | — | | | 145,528 | |
| GNMA MBS | GNMA MBS | | — | | | 17,936 | | | — | | | 17,936 | |
| GSE agency notes | GSE agency notes | | — | | | 220,397 | | | — | | | 220,397 | |
| | Other assets | Other assets | | — | | | 5,153 | | | — | | | 5,153 | |
| Other assets | |
| Other assets | |
| Total assets measured at fair value on a recurring basis | Total assets measured at fair value on a recurring basis | | $ | — | | | $ | 5,210,464 | | | $ | — | | | $ | 5,210,464 | |
| Liabilities measured at fair value on a recurring basis: | Liabilities measured at fair value on a recurring basis: | | | | | | | | |
| Other liabilities | Other liabilities | | $ | — | | | $ | 3,039 | | | $ | 20,252 | | | $ | 23,291 | |
| Other liabilities | |
| Other liabilities | |
| Assets measured at fair value on a nonrecurring basis: | Assets measured at fair value on a nonrecurring basis: | | | | | | | | |
| Other investments | |
| Other investments | |
| Other investments | Other investments | | $ | — | | | $ | — | | | $ | 10,518 | | | $ | 10,518 | |
| Other real estate owned | Other real estate owned | | — | | | — | | | 2,320 | | | 2,320 | |
| Loans held for sale | Loans held for sale | | — | | | 113,349 | | | — | | | 113,349 | |
| | Total assets measured at fair value on a nonrecurring basis | Total assets measured at fair value on a nonrecurring basis | | $ | — | | | $ | 113,349 | | | $ | 12,838 | | | $ | 126,187 | |
| Total assets measured at fair value on a nonrecurring basis | |
| Total assets measured at fair value on a nonrecurring basis | |
| | | | | | | | | | | | | | | | | | | | | | | | | | |
| | December 31, 2020 |
| (Dollars in thousands) | | Quoted Prices in Active Markets
for Identical Asset (Level 1) | | Significant Other Observable Inputs (Level 2) | | Significant Unobservable Inputs (Level 3) | | Total Fair
Value |
| Assets measured at fair value on a recurring basis: | | | | | | | | |
| Available-for-sale securities: | | | | | | | | |
| CMO | | $ | — | | | $ | 471,325 | | | $ | — | | | $ | 471,325 | |
| FNMA MBS | | — | | | 1,598,970 | | | — | | | 1,598,970 | |
| FHLMC MBS | | — | | | 202,893 | | | — | | | 202,893 | |
| GNMA MBS | | — | | | 23,762 | | | — | | | 23,762 | |
| GSE agency notes | | — | | | 232,107 | | | — | | | 232,107 | |
| | | | | | | | |
| Other assets | | — | | | 14,448 | | | — | | | 14,448 | |
| Total assets measured at fair value on a recurring basis | | $ | — | | | $ | 2,543,505 | | | $ | — | | | $ | 2,543,505 | |
| Liabilities measured at fair value on a recurring basis: | | | | | | | | |
| Other liabilities | | $ | — | | | $ | 8,218 | | | $ | 24,039 | | | $ | 32,257 | |
| Assets measured at fair value on a nonrecurring basis: | | | | | | | | |
| Other investments | | $ | — | | | $ | — | | | $ | 9,541 | | | $ | 9,541 | |
| Other real estate owned | | — | | | — | | | 3,061 | | | 3,061 | |
| Loans held for sale | | — | | | 197,541 | | | — | | | 197,541 | |
| | | | | | | | |
| Total assets measured at fair value on a nonrecurring basis | | $ | — | | | $ | 197,541 | | | $ | 12,602 | | | $ | 210,143 | |
| | | | | | | | | | | | | | | | | | | | | | | | | | |
| | December 31, 2022 |
| (Dollars in thousands) | | Quoted Prices in Active Markets
for Identical Asset (Level 1) | | Significant Other Observable Inputs (Level 2) | | Significant Unobservable Inputs (Level 3) | | Total Fair
Value |
| Assets measured at fair value on a recurring basis: | | | | | | | | |
| Available-for-sale securities: | | | | | | | | |
| CMO | | $ | — | | | $ | 506,380 | | | $ | — | | | $ | 506,380 | |
| FNMA MBS | | — | | | 3,250,258 | | | — | | | 3,250,258 | |
| FHLMC MBS | | — | | | 121,999 | | | — | | | 121,999 | |
| GNMA MBS | | — | | | 36,138 | | | — | | | 36,138 | |
| GSE agency notes | | — | | | 178,285 | | | — | | | 178,285 | |
| | | | | | | | |
| Other assets | | — | | | 156,912 | | | 81 | | | 156,993 | |
| Total assets measured at fair value on a recurring basis | | $ | — | | | $ | 4,249,972 | | | $ | 81 | | | $ | 4,250,053 | |
| Liabilities measured at fair value on a recurring basis: | | | | | | | | |
| Other liabilities | | $ | — | | | $ | 156,520 | | | $ | 17,102 | | | $ | 173,622 | |
| Assets measured at fair value on a nonrecurring basis: | | | | | | | | |
| Other investments | | $ | — | | | $ | — | | | $ | 26,120 | | | $ | 26,120 | |
| Other real estate owned | | — | | | — | | | 833 | | | 833 | |
| Loans held for sale | | — | | | 42,985 | | | — | | | 42,985 | |
| | | | | | | | |
| Total assets measured at fair value on a nonrecurring basis | | $ | — | | | $ | 42,985 | | | $ | 26,953 | | | $ | 69,938 | |
Fair value is based on quoted market prices, where available. If such quoted market prices are not available, fair value is based on internally developed models or obtained from third parties that primarily use, as inputs, observable market-based parameters. Valuation adjustments may be made to ensure that financial instruments are recorded at fair value. These adjustments may include unobservable parameters. The Company's valuation methodologies may produce a fair value calculation that may not be indicative of net realizable value or reflective of future fair values. While the Company believes its valuation methodologies are appropriate and consistent with other market participants, the use of different methodologies or assumptions to determine the fair value of certain financial instruments could result in a different estimate of fair value at the reporting date.
Available-for-sale securities
Securities classified as available-for-sale are reported at fair value using Level 2 inputs. The Company believes that this Level 2 designation is appropriate under ASC 820-10, as these securities are GSEs and GNMA securities with almost all fixed income securities, none are exchange traded, and all are priced by correlation to observed market data. For these securities the Company obtains fair value measurements from an independent pricing service. The fair value measurements consider observable data that may include dealer quotes, market spreads, cash flows, U.S. government and agency yield curves, live trading levels, trade execution data, market consensus prepayment speeds, credit information, and the security’s terms and conditions, among other factors.
Other investments
Other investments includes equity investments without readily determinable fair values and equity method investments, which are categorized as Level 3. The Company'sCompany’s equity investments without readily determinable fair values are held at cost, and are adjusted for any observable transactions during the reporting period and its equity method investments are initially recorded at cost based on the Company’s percentage ownership in the investee, and are adjusted to reflect the recognition of the Company’s proportionate share of income or loss of the investee based on the investee’s earnings.
Other real estate owned
Other real estate owned consists of loan collateral which has been repossessed through foreclosure or other measures. Initially, foreclosed assets are recorded at the fair value of the collateral less estimated selling costs. Subsequent to foreclosure, valuations are updated periodically and the assets may be marked down further, reflecting a new cost basis. The fair value of other real estate owned was estimated using Level 3 inputs based on appraisals obtained from third parties.
Loans held for sale
The fair value of loans held for sale is based on estimates using Level 2 inputs. These inputs are based on pricing information obtained from wholesale mortgage banks and brokers and applied to loans with similar interest rates and maturities.
Other assets
Other assets include the fair value of interest rate products, and derivatives on the residential mortgage held for sale loan pipeline.pipeline, and risk participation agreements. Valuation of interest rate products is obtained from an independent pricing service and also from the derivative counterparty. Valuation of the derivative related to the residential mortgage held for sale loan pipeline is based on valuation of the loans held for sale portfolio as described above in Loans held for sale. Valuation of risk participation agreements are obtained from an independent pricing service.
Other liabilities
Other liabilities include the fair value of interest rate products, derivatives on the residential mortgage held for sale loan pipeline, foreign exchange forward contracts, risk participation agreements, and derivative related to the sale of certain Visa Class B common shares. Valuation of interest rate products is obtained from an independent pricing service and also from the derivative counterparty. Valuation of the derivative related to the residential mortgage held for sale loan pipeline is based on valuation of the loans held for sale portfolio as described above in Loans held for sale.Valuation of foreign exchange forward contracts and risk participation agreements are obtained from an independent pricing service. Valuation of the derivative related to the sale of certain Visa Class B common shares is based on: (i) the agreed upon graduated fee structure; (ii) the length of time until the resolution of the Visa covered litigation; and (iii) the estimated impact of dilution in the conversion ratio of Class B shares resulting from changes in the Visa covered litigation.
FAIR VALUE OF FINANCIAL INSTRUMENTS
The reported fair values of financial instruments are based on a variety of factors. In certain cases, fair values represent quoted market prices for identical or comparable instruments. In other cases, fair values have been estimated based on assumptions regarding the amount and timing of estimated future cash flows that are discounted to reflect current market rates and varying degrees of risk. Accordingly, the fair values may not represent actual values of the financial instruments that could have been realized as of period-end or that will be realized in the future.
The following methods and assumptions were used to estimate the fair value of each class of financial instruments for which it is practicable to estimate that value:
Cash, cash equivalents, and restricted cash
For cash and short-term investment securities, including due from banks, federal funds sold or purchased under agreements to resell and interest-bearing deposits with other banks, the carrying amount is a reasonable estimate of fair value.
Investment securities
Investment securities include debt securities classified as held-to-maturity or available-for-sale. Fair value is estimated using quoted prices for similar securities, which the Company obtains from a third party vendor. The Company uses one of the largest providers of securities pricing to the industry and management periodically assesses the inputs used by this vendor to price the various types of securities owned by the Company to validate the vendor’s methodology as described above in available-for-sale securities.
Other investments
Other investments includes equity investments without readily determinable fair values (see discussion in “Fair Value of Financial Assets and Liabilities” section above).
Loans held for sale
Loans held for sale are carried at their fair value (see discussion in “Fair Value of Financial Assets and Liabilities” section above).
Loans and leases
Loans and leases are segregated by portfolio segments with similar financial characteristics (see Note 2). The fair values of loans and leases, with the exception of reverse mortgages, are estimated by discounting expected cash flows using the current rates at which similar loans would be made to borrowers with comparable credit ratings and for similar remaining maturities. The fair values of reverse mortgages are based on the net present value of the expected cash flows using a discount rate specific to the reverse mortgages portfolio. The fair value of nonperforming loans is based on recent external appraisals of the underlying collateral, if the loan is collateral dependent. Estimated cash flows, discounted using a rate commensurate with current rates and the risk associated with the estimated cash flows, are used if appraisals are not available. This technique does contemplate an exit price.
Stock in the Federal Home Loan Bank (FHLB) of Pittsburgh
The fair value of FHLB stock is assumed to be equal to its cost basis, since the stock is non-marketable but redeemable at its par value.
Accrued interest receivable
The carrying amounts of interest receivable approximate fair value.
Other assets
Other assets include the fair value of interest rate products, and derivatives on the residential mortgage held for sale loan pipeline, and risk participation agreements (see discussion in “Fair Value of Financial Assets and Liabilities” section above).
Deposits
The fair value of deposits with no stated maturity, such as noninterest-bearing demand deposits, money market and interest-bearing demand deposits, is assumed to be equal to the amount payable on demand. The fair value of time deposits is based on the discounted value of contractual cash flows. The discount rate is estimated using rates currently offered for deposits with comparable remaining maturities.
Borrowed funds
Rates currently available to the Company for debt with similar terms and remaining maturities are used to estimate the fair value of existing debt.
Off-balance sheet instruments
The fair value of off-balance sheet instruments, including swap guarantees of $13.1$7.3 million and $12.8$10.4 million at December 31, 20212023 and December 31, 2020,2022, respectively, and standby letters of credit, approximates the recorded net deferred fee amounts. Because letters of credit are generally not assignable by either the Company or the borrower, they only have value to the Company and the borrower. In determining the fair value of the swap guarantees, the Company assesses the underlying credit risk exposure for each borrower in a paying position to the third-party financial institution.
Accrued interest payable
The carrying amounts of interest payable approximate fair value.
Other liabilities
Other liabilities include the fair value of interest rate products, derivatives on the residential mortgage held for sale loan pipeline, foreign exchange forward contracts, risk participation agreements, and derivative related to the sale of certain Visa Class B common shares (see discussion in “Fair Value of Financial Assets and Liabilities” section above).
Financial instruments measured at fair value using significant unobservable inputs (Level 3)
The following table provides a description of the valuation techniquetechniques and significant unobservable inputs for the Company's assetsfinancial instruments classified as Level 3 as of December 31, 2023 and measured at fair value on a nonrecurring basis:December 31, 2022:
| | | | | | | | | | | | | | | | | | | | | | | | | | |
| (Dollars in thousands) | | December 31, 2021 |
| Financial Instrument | | Fair Value | | Valuation Technique(s) | | Unobservable Input | | Range (Weighted Average) |
| Other investments | | $ | 10,518 | | | Observed market comparable transactions | | Period of observed transactions | | May 2021 |
| | | | | | | | |
| | | | | | | | |
| | | | | | | | |
| Other real estate owned | | $ | 2,320 | | | Fair market value of collateral | | Costs to sell | | 10.0% |
| | | | | | | | |
| Other liabilities | | $ | 20,252 | | | Discounted cash flow | | Timing of Visa litigation resolution | | 1.75 - 6.75 years (4.50 years or 4Q 2025) |
| | | | | | | | |
| | | | | | | | | | | | | | | | | | | | | | | | | | |
| (Dollars in thousands) | | December 31, 2023 |
| Financial Instrument | | Fair Value | | Valuation Technique(s) | | Unobservable Input | | Range (Weighted Average) |
| Other investments | | $ | 17,434 | | | Observed market comparable transactions | | Period of observed transactions | | December 2023 |
| | | | | | | | |
| | | | | | | | |
| | | | | | | | |
| Other real estate owned | | 1,569 | | | Fair market value of collateral | | Costs to sell | | 10.0%-20.0% (18.1%) |
| | | | | | | | |
| Other assets (Risk participation agreements purchased) | | 78 | | | Credit Value Adjustment | | CDS Spread and Loss Given Default (LGD) | | CDS spread: 110 - 360 bps (195 bps) LGD: –% - 30% (30%) |
| Other liabilities (Risk participation agreements sold) | | 3 | | | Credit Value Adjustment | | CDS Spread and Loss Given Default (LGD) | | CDS spread: 1 - 250 bps (95 bps) LGD: 30% |
| Other liabilities | | 14,023 | | | Discounted cash flow | | Timing of Visa litigation resolution | | 1.00 - 4.75 years (3.06 years or 4Q 2025) |
| | | | | | | | |
| | | | | | | | | | | | | | | | | | | | | | | | | | |
| (Dollars in thousands) | | December 31, 2022 |
| Financial Instrument | | Fair Value | | Valuation Technique(s) | | Unobservable Input | | Range
(Weighted Average) |
| Other investments | | $ | 26,120 | | | Observed market comparable transactions | | Period of observed transactions | | May 2022 |
| | | | | | | | |
| | | | | | | | |
| | | | | | | | |
| Other real estate owned | | 833 | | | Fair market value of collateral | | Costs to sell | | 10.0% |
| Other assets (Risk participation agreements purchased) | | 81 | | Credit Value Adjustment | | CDS Spread and Loss Given Default (LGD) | | CDS spread: 110 - 250 bps (205 bps) LGD: –% - 30% (30%) |
| Other liabilities (Risk participation agreements sold) | | 2 | | | Credit Value Adjustment | | CDS Spread and Loss Given Default (LGD) | | CDS spread: 1 - 250 bps (158 bps) LGD: 30% |
Other liabilities (Financial derivative related to
sales of certain Visa Class B shares) | | 17,100 | | | Discounted cash flow | | Timing of Visa litigation resolution | | 1.00 - 5.75 years (3.61 years or 4Q 2025) |
The book value and estimated fair value of the Company's financial instruments are as follows:
| | December 31, |
| Fair Value Measurement | | 2021 | | 2020 |
| | | December 31, | | | | | December 31, |
| Fair Value Measurement | | | Fair Value Measurement | | 2023 | | 2022 |
| (Dollars in thousands) | (Dollars in thousands) | Fair Value Measurement | | Book Value | | Fair Value | | Book Value | | Fair Value | (Dollars in thousands) | Book Value | | Fair Value | | Book Value | | Fair Value |
| Financial assets: | Financial assets: | | | | | | | |
| Cash, cash equivalents and restricted cash | |
| Cash, cash equivalents and restricted cash | |
| Cash, cash equivalents and restricted cash | Cash, cash equivalents and restricted cash | Level 1 | | $ | 1,532,939 | | | $ | 1,532,939 | | | $ | 1,654,735 | | | $ | 1,654,735 | |
| Investment securities, available for sale | Investment securities, available for sale | Level 2 | | 5,205,311 | | | 5,205,311 | | | 2,529,057 | | | 2,529,057 | |
| Investment securities, held to maturity, net | Investment securities, held to maturity, net | Level 2 | | 90,642 | | | 94,131 | | | 111,741 | | | 116,421 | |
| Other investments | Other investments | Level 3 | | 10,518 | | | 10,518 | | | 9,541 | | | 9,541 | |
| Loans, held for sale | Loans, held for sale | Level 2 | | 113,349 | | | 113,349 | | | 197,541 | | | 197,541 | |
Loans and leases, net(1) | Loans and leases, net(1) | Level 3 | | 7,791,482 | | | 7,723,867 | | | 8,795,935 | | | 9,130,003 | |
| | Stock in FHLB of Pittsburgh | Stock in FHLB of Pittsburgh | Level 2 | | 6,073 | | | 6,073 | | | 5,771 | | | 5,771 | |
| Stock in FHLB of Pittsburgh | |
| Stock in FHLB of Pittsburgh | |
| Accrued interest receivable | Accrued interest receivable | Level 2 | | 41,596 | | | 41,596 | | | 44,335 | | | 44,335 | |
| Other assets | Other assets | Level 2 | | 5,153 | | | 5,153 | | | 14,448 | | | 14,448 | |
| Financial liabilities: | Financial liabilities: | |
| Deposits | |
| Deposits | |
| Deposits | Deposits | Level 2 | | $ | 13,240,062 | | | $ | 13,236,816 | | | $ | 11,856,664 | | | $ | 11,868,897 | |
| Borrowed funds | Borrowed funds | Level 2 | | 239,477 | | | 225,119 | | | 340,641 | | | 340,106 | |
| Standby letters of credit | Standby letters of credit | Level 3 | | 674 | | | 674 | | | 630 | | | 630 | |
| Accrued interest payable | Accrued interest payable | Level 2 | | 736 | | | 736 | | | 1,450 | | | 1,450 | |
| Other liabilities | Other liabilities | Levels 2, 3 | | 23,291 | | | 23,291 | | | 32,257 | | | 32,257 | |
(1)Includes reverse mortgage loans.
At December 31, 20212023 and December 31, 20202022 the Company had no commitments to extend credit measured at fair value.
19. DERIVATIVE FINANCIAL INSTRUMENTS
Risk Management Objective of Using Derivatives
The Company is exposed to certain risks arising from both economic conditions and its business operations. The Company principally manages its exposures to a wide variety of business and operational risks through management of its core business activities. The Company manages economic risks, including interest rate, liquidity, and credit risk, primarily by managing the amount, sources, and duration of its assets and liabilities. The Company manages a matched book with respect to its derivative instruments in order to minimize its net risk exposure resulting from such transactions.
Fair Values of Derivative Instruments
The table below presents the fair value of derivative financial instruments as well as their location on the Consolidated Statements of Financial Condition as of December 31, 2021.2023.
| | | | | | Fair Values of Derivative Instruments | | | | | Fair Values of Derivative Instruments |
| | (Dollars in thousands) | (Dollars in thousands) | | | Notional | | Balance Sheet Location | | Derivatives
(Fair Value) |
| | (Dollars in thousands) | |
| (Dollars in thousands) | | | Count | | Notional | | Balance Sheet Location | | Derivatives
(Fair Value) |
| Derivatives designated as hedging instruments: | |
| Interest rate products | |
| Interest rate products | |
| Interest rate products | |
| Total | |
| Derivatives not designated as hedging instruments: | Derivatives not designated as hedging instruments: | | | | | | | |
| Interest rate products | Interest rate products | | | $ | 54,834 | | | Other assets | | $ | 2,625 | |
| Interest rate products | Interest rate products | | | 54,834 | | | Other liabilities | | (2,847) | |
| Risk participation agreements | | | 4,214 | | | Other liabilities | | (3) | |
| Interest rate products | |
| Interest rate products | |
| Interest rate lock commitments with customers | Interest rate lock commitments with customers | | | 102,264 | | | Other assets | | 1,991 | |
| Interest rate lock commitments with customers | | | 12,813 | | | Other liabilities | | (73) | |
| | Forward sale commitments | Forward sale commitments | | | 63,664 | | | Other assets | | 537 | |
| Forward sale commitments | Forward sale commitments | | | 67,032 | | | Other liabilities | | (116) | |
| Forward sale commitments | |
| Forward sale commitments | |
| FX forwards | |
| FX forwards | |
| Risk participation agreements sold | |
| Risk participation agreements purchased | |
| Financial derivative related to sales of certain Visa Class B shares | Financial derivative related to sales of certain Visa Class B shares | | | 113,177 | | | Other liabilities | | (20,252) | |
| Total derivatives | Total derivatives | | | $ | 472,832 | | | $ | (18,138) | |
The table below presents the fair value of derivative financial instruments as well as their location on the Consolidated Statements of Financial Condition as of December 31, 2020.2022.
| | | | | | Fair Values of Derivative Instruments |
| | | | | | | Fair Values of Derivative Instruments |
| | (Dollars in thousands) | |
| (Dollars in thousands) | |
| (Dollars in thousands) | (Dollars in thousands) | | | Notional | | Balance Sheet Location | | Derivatives
(Fair Value) | | | | Notional | | Balance Sheet Location | | Derivatives
(Fair Value) |
| | Derivatives not designated as hedging instruments: | Derivatives not designated as hedging instruments: | | | | | | | |
| | Derivatives not designated as hedging instruments: | |
| | Derivatives not designated as hedging instruments: | |
| Interest rate products | Interest rate products | | | $ | 61,326 | | | Other assets | | $ | 5,369 | |
| Interest rate products | Interest rate products | | | 61,326 | | | Other liabilities | | (5,851) | |
| Risk participation agreements | | | 4,372 | | | Other liabilities | | (10) | |
| Interest rate products | |
| Interest rate products | |
| Interest rate lock commitments with customers | Interest rate lock commitments with customers | | | 244,037 | | | Other assets | | 8,496 | |
| Interest rate lock commitments with customers | Interest rate lock commitments with customers | | | 8,413 | | | Other liabilities | | (117) | |
| Forward sale commitments | Forward sale commitments | | | 50,705 | | | Other assets | | 583 | |
| Forward sale commitments | Forward sale commitments | | | 258,186 | | | Other liabilities | | (2,240) | |
| FX forwards | |
| FX forwards | |
| Risk participation agreements sold | |
| Risk participation agreements purchased | |
| Financial derivative related to sales of certain Visa Class B shares | Financial derivative related to sales of certain Visa Class B shares | | | 113,177 | | | Other liabilities | | (24,039) | |
| Total derivatives | Total derivatives | | | $ | 801,542 | | | $ | (17,809) | |
Effect of Derivative Instruments on the Income Statement
The table below presents the effect of the derivative financial instruments on the unaudited Consolidated Statements of Income for the years ended December 31, 2023 and December 31, 2022.
| | | | | | | | | | | | | | | | | | | | | | | | | | |
| | Amount of Gain Recognized in OCI on Derivative (Effective Portion) | | Location of Gain Reclassified from Accumulated OCI into Income (Effective Portion) |
| (Dollars in thousands) | | Year Ended December 31, | | |
| Derivatives in Cash Flow Hedging Relationships | | 2023 | | 2022 | | 2021 | | |
| Interest Rate Products | | $ | 1,596 | | | $ | — | | | $ | — | | | Interest income |
| Total | | $ | 1,596 | | | $ | — | | | $ | — | | | |
| | | | | | | | |
| | Amount of (Loss) or Gain Recognized in Income | | Location of Gain (Loss) Recognized in Income |
| (Dollars in thousands) | | Year Ended December 31, | | |
| Derivatives Not Designated as a Hedging Instrument | | 2023 | | 2022 | | 2021 | | |
| Interest rate products | | $ | 10,294 | | | $ | 7,576 | | | $ | — | | | Other income |
| Interest rate lock commitments with customers | | 274 | | | (2,072) | | | (6,218) | | | Mortgage banking activities, net |
| Forward sale commitments | | 65 | | | 4,863 | | | 3,263 | | | Mortgage banking activities, net |
| FX forwards | | 130 | | | 80 | | | — | | | Other income |
| Risk participation agreements | | (5) | | | (195) | | | — | | | Other income |
| Total | | $ | 10,758 | | | $ | 10,252 | | | $ | (2,955) | | | |
Derivatives designated as hedging instruments:
Cash Flow Hedges of Interest Rate Risk
The Company's objectives in using interest rate derivatives are to add stability to interest income and to manage its exposure to interest rate movements. To accomplish these objectives,this objective, the Company primarily uses interest rate options, including floors, caps, collars, or swaps as part of its interest rate risk management strategy. Interest rate swapsoptions designated as cash flow hedges involve the receipt of fixed amounts from a counterparty in exchange for the Company making variable-rate payments over the life of the agreements without exchange of the underlying notional amount.
The Company has agreements with certain derivative counterparties that contain a provision under which, if it defaults on any of its indebtedness, including default where repayment of the indebtedness has not been accelerated by the lender, then the Company could also be declared in default on its derivative obligations. The Company also has agreements with certain derivative counterparties that contain a provision where if it fails to maintain its status as a well-capitalized or adequately capitalized institution, then the counterparty could terminate the derivative positions and the Company would be required to settle its obligations under the agreements.
During 2023, the Company purchased nine interest rate floors at a premium of $14.7 million with an aggregate notional amount of $750.0 million to hedge variable cash flows associated with a variable rate loan pool through the fourth quarter of 2026. Changes to the fair value of derivatives designated and that qualify as cash flow hedges are recorded in accumulated other comprehensive income (loss) and is subsequently reclassified into earnings in the period that the hedged forecast transaction affects earnings. If the Company determines that a cash flow hedge is no longer highly effective, future changes in the fair value of the hedging instrument would be reported in earnings. As of December 31, 2023, the Company determined the cash flow hedges remain highly effective. During the first halfyear ended December 31, 2023, $1.2 million of 2020, such derivatives were usedamortization expense on the premium was reclassified into interest income. The Company does not expect any unrealized gains or losses related to hedgecash flow hedges to be reclassified into earnings in the variable cash flows associated with a variable rate loan pool.next twelve months.
In 2020, the Company terminated its 3three interest rate derivatives that were designated as cash flow hedges for a net gain of $1.3 million, recognized in accumulated other comprehensive income (loss). Hedge accounting was discontinued, and the net gain in accumulated comprehensive income (loss) is reclassified into earnings when the transaction affects earnings. As the underlying hedged transaction continues to be probable, the $1.3 million net gain will be recognized into earnings on a straight-line basis over each derivative's original contract term. During the next twelve months, the Company estimates that $0.2 million will be reclassified as an increase to interest income. During the year ended December 31, 2021, $0.52023, $0.1 million was reclassified into interest income.
The table below presentsincome compared to $0.2 million during the effectsame period in 2022. As of the cash flow hedges on the Consolidated Statements of Income for the year ended December 31, 20202023, this gain has been fully recognized and 2019.
| | | | | | | | | | | | | | | | | | | | | | |
| | | | Amount of Gain Recognized in OCI on Derivative (Effective Portion) | | Location of Gain Reclassified from Accumulated OCI into Income (Effective Portion) |
| (Dollars in thousands) | | | | Year Ended December 31, | | |
| Derivatives in Cash Flow Hedging Relationships | | | | 2020 | | 2019 | | |
| Interest Rate Products | | | | $ | 1,560 | | | $ | 1,877 | | | Interest income |
| Total | | | | $ | 1,560 | | | $ | 1,877 | | | |
Derivatives not designated as hedging instruments:
Back-to-Back Swap TransactionsCustomer Derivatives – Interest Rate Swaps
The Company entered into agreements with two unrelated financial institutions whereby the Company enters into an interest rate swaps with commercial loan customers wishing to manage interest rate risk. The Company then enters into corresponding swap transactionagreements with swap dealer counterparties to economically hedge the customerexposure arising from these contracts. The interest rate swaps with both the customers and offsets that transaction with another counterparty. third parties are not designated as hedges under ASC 815, Derivatives and Hedging (ASC 815) and are marked to market through earnings. As the interest rate swaps are structured to offset each other, changes to the underlying benchmark interest rates considered in the valuation of these instruments do not result in an impact to earnings; however, there may be fair value adjustments related to credit quality variations between counterparties, which may impact earnings as required by ASC 820. As of December 31, 2023, there were no fair value adjustments related to credit quality.
Derivative Financial Instruments from Mortgage Banking Activities
Derivative financial instruments related to back-to-back swapsmortgage banking activities are recorded at fair value and are not designated as accounting hedges. This includes commitments to originate certain fixed-rate residential loans to customers, also referred to as interest rate lock commitments. The Company may also enter into forward sale commitments to sell loans to investors at a fixed price at a future date and trade asset-backed securities to mitigate interest rate risk.
Foreign Exchange Forward Contracts
The Company enters into foreign exchange forward contracts (FX forwards) with customers to exchange one currency for another on an agreed date in the future at an agreed exchange rate. The Company then enters into corresponding FX forwards with swap dealer counterparties to economically hedge its exposure on the exchange rate component of the customer agreements. The FX forwards with both the customers and third parties are not designated as hedges under ASC 815 and are marked to market through earnings. Exposure to gains and losses on these contracts increase or decrease over their respective lives as currency exchange and interest rates fluctuate. As the FX forwards are structured to offset each other, changes to the underlying term structure of currency exchange rates considered in the valuation of these instruments do not result in an impact to earnings; however, there may be fair value adjustments related to credit quality variations between counterparties, which may impact earnings as required by ASC 820. As of December 31, 2023, there were no fair value adjustments related to credit quality.
Risk Participation Agreements
The Company may enter into a risk participation agreement (RPA) with another institution as a means to assume a portion of the credit risk associated with a loan structure which includes a derivative instrument, in exchange for fee income commensurate with the risk assumed. This type of derivative is referred to as an “RPA sold.” In addition, in an effort to reduce the credit risk associated with an interest rate swap agreement with a borrower for whom the Company has provided a loan structured with a derivative, the Company may purchase an RPA from an institution participating in the facility in exchange for a fee commensurate with the risk shared. This type of derivative is referred to as an “RPA purchased.”
The following are not included in the tables in Fair Values of Derivative Instruments:
Swap Guarantees
The Company entered into agreementsan agreement with 6one unrelated financial institutionsinstitution whereby thosethat financial institutionsinstitution entered into interest rate derivative contracts (interest rate swap transactions) directly with customers referred to them by the Company. Under the terms of the agreements, those financial institutions have recourse to us for any exposure created under each swap transaction, only in the event that the customer defaults on the swap agreement and the agreement is in a paying position to the third-party financial institution. This is a customary arrangement that allows us to provide access to interest rate swap transactions for our customers without creating the swap ourselves. These swap guarantees are accounted for as credit derivatives.
At December 31, 20212023 and December 31, 2020,2022, there were 261188 and 234209 variable-rate to fixed-rate swap transactions between the third-party financial institutions and the Company's customers, respectively. The initial notional aggregate amount was approximately $1.1$0.7 billion and $0.8 billion at both December 31, 20212023 and December 31, 2020.2022, respectively. At December 31, 2021,2023, the swap transactions remaining maturities ranged from under 1 year to 1412 years. At December 31, 2021, 1932023, none of these customer swaps were in a paying position to third parties, for $35.8 million, with our swap guarantees having a fair value of $13.1$7.3 million. At December 31, 2020, 2312022, none of these customer swaps were in a paying position to third parties, for $81.6 million, with the Company's swap guarantees having a fair value of $12.8$10.4 million. However, forFor both periods, none of the Company's customers were in default of the swap agreements.
Derivative Financial Instruments from Mortgage Banking Activities
Derivative financial instruments related to mortgage banking activities are recorded at fair value and are not designated as accounting hedges. This includes commitments to originate certain fixed-rate residential loans to customers, also referred to as interest rate lock commitments. The Company may also enter into forward sale commitments to sell loans to investors at a fixed price at a future date and trade asset-backed securities to mitigate interest rate risk.
The table below presents the effect of the derivative financial instruments on the Consolidated Statements of Income for the years ended December 31, 2021, 2020 and 2019.
| | | | | | | | | | | | | | | | | | | | | | | | | | |
| | | | |
| | | | |
| | | | | | | | |
| | | | | | | | |
| | | | | | | | |
| | | | | | | | |
| | Amount of (Loss) or Gain Recognized in Income | | Location of (Loss) or Gain Recognized in Income |
| (Dollars in thousands) | | Year Ended December 31, | | |
| Derivatives Not Designated as a Hedging Instrument | | 2021 | | 2020 | | 2019 | | |
| Interest Rate Lock Commitments | | $ | (6,218) | | | $ | 6,490 | | | $ | 1,399 | | | Mortgage banking activities, net |
| Forward Sale Commitments | | 3,263 | | | (12,226) | | | (1,359) | | | Mortgage banking activities, net |
| Total | | $ | (2,955) | | | $ | (5,736) | | | $ | 40 | | | |
Credit-risk-related Contingent Features
The Company has agreements with certain derivative counterparties that contain a provision under which, if it defaults on any of its indebtedness, including default where repayment of the indebtedness has not been accelerated by the lender, then the Company could also be declared in default on its derivative obligations. The Company also has agreements with certain derivative counterparties that contain a provision where if it fails to maintain its status as a well-capitalized or adequately capitalized institution, then the counterparty could terminate the derivative positions and the Company would be required to settle its obligations under the agreements.
The Company has minimum collateral posting thresholds with certain of its derivative counterparties, and has posted collateral of $6.2 million in securities and $5.1$4.3 million in cash against its obligations under these agreements.agreements which meets or exceeds the minimum collateral posting requirements. If the Company had breached any of these provisions at December 31, 2021,2023, it could have been required to settle its obligations under the agreements at the termination value.
20. RELATED PARTY TRANSACTIONS
In the ordinary course of business, from time to time the Company enters into transactions with related parties, including, but not limited to, its officers and directors. They do not, in the opinion of management, involve greater than normal credit risk or include other features unfavorable to the Company. Any related party loans exceeding $0.5 million require review and approval by the Board of Directors.
There was 1one extension of credit to related party loanparties exceeding $0.5 million originated and sold during the year ended December 31, 2021 as compared2023 and no extensions of credit to 2 related party loans exceeding $0.5 millionparties originated and sold during the year ended December 31, 2020. 2022.
During 2021,2023, all new loans and credit line advances to related parties were $0.8$4.0 million and repayments were less than $0.1$5.6 million. The outstanding balances of loans to related parties at December 31, 20212023 and 20202022 were $0.4 million and $0.2$3.9 million, respectively.
Total deposits from related parties at December 31, 20212023 and 20202022 were $5.8$9.7 million and $8.3 million, respectively.$5.8 million.
21. SEGMENT INFORMATION
As defined in ASC 280, Segment Reporting (ASC 280), an operating segment is a component of an enterprise that engages in business activities from which it may earn revenues and incur expenses, whose operating results are regularly reviewed by the enterprise’s chief operating decision makers to make decisions about resources to be allocated to the segment and assess its performance, and for which discrete financial information is available. The Company evaluates performance based on pretax net income relative to resources used, and allocate resources based on these results. The accounting policies applicable to the Company's segments are those that apply to its preparation of the accompanying Consolidated Financial Statements. Based on these criteria, the Company has identified 3three segments: WSFS Bank, Cash Connect®, and Wealth Management.
The WSFS Bank segment provides financial products to commercial and retailconsumer customers. RetailConsumer and Commercial Banking, Commercial Real Estate Lending and other banking business units are operating departments of WSFS Bank. These departments share the same regulators, the same market, many of the same customers and provide similar products and services through the general infrastructure of the Bank. Accordingly, these departments are not considered discrete segments and are appropriately aggregated in the WSFS Bank segment.
The Company's Cash Connect® segment provides ATM vault cash, smart safe and other cash logistics services through strategic partnerships with several of the largest networks, manufacturers and service providers in the ATM industry. Cash Connect® services non-bank and WSFS-branded ATMs and retailsmart safes nationwide. The balance sheet category Cash in non-owned ATMs includes cash from which fee income is earned through bailment arrangements with customers of Cash Connect®.
The Wealth Management segment provides a broad array of planning and advisory services, investment management, trust services, and credit and deposit products to individual, corporate, and institutional clients through multiple integrated businesses. WSFS Wealthclients. Bryn Mawr Trust® Investments provides financialis our predominant Private Wealth Management brand, providing advisory, investment management and trustee services to institutions, affluent and high-net-worth individuals. Private Wealth Management, which includes Private Banking, serves high-net-worth clients and institutions by providing trustee and advisory services, along with insurancefinancial planning, customized investment strategies, brokerage products such as annuities and brokerage products. Cypress,customized banking services including credit and deposit products tailored to its clientele. Private Wealth Management includes businesses that operate under the bank’s charter, through a broker/dealer and as a registered investment adviser, is aadvisor (RIA). It generates revenue through fee-only wealth management firm managing a “balanced” investment style portfolio focused on preservation of capitalarrangements, net interest income and generating current income. West Capital, a registered investment adviser, is aother fee-only wealth management firm operating under a multi-family office philosophy to provide customized solutions to institutionsservices such as estate administration, trust tax planning and high-net-worth individuals. The trust division of WSFS, comprised of WSFS Institutional Services® and Christiana Trust DE, provides trustee, agency, bankruptcy administration, custodial and commercial domicile services to institutional, corporate clients and special purpose vehicles. Christiana Trust DE also provides personal trust and fiduciary services to families and individuals across the U.S. Powdermill®custody. Powdermill® is a multi-family office specializing in providing independent solutions to high-net-worth individuals, families and corporate executives through a coordinated, centralized approach.
The Bryn Mawr Trust Company of Delaware provides personal trust and fiduciary services to families and individuals across the U.S. and internationally. WSFS Wealth Client Management serves high-net-worthInstitutional Services® provides trustee, agency, bankruptcy administration, custodial and commercial domicile services to institutional, corporate clients by delivering credit and deposit products and partnering with other Wealth Management units to provide comprehensive solutions to clients.special purpose vehicles.
The following tables show segment results for the years ended December 31, 2021, 2020,2023, 2022, and 2019:2021:
| | Year Ended December 31, 2021 |
| Year Ended December 31, 2023 | | | Year Ended December 31, 2023 |
| (Dollars in thousands) | (Dollars in thousands) | WSFS Bank | | Cash Connect® | | Wealth Management | | Total | (Dollars in thousands) | WSFS Bank | | Cash Connect® | | Wealth Management | | Total |
| Statements of Income | Statements of Income | | | | | | | |
| External customer revenues: | External customer revenues: | |
| External customer revenues: | |
| External customer revenues: | |
| Interest income | |
| Interest income | |
| Interest income | Interest income | $ | 447,542 | | | $ | — | | | $ | 8,827 | | | $ | 456,369 | |
| Noninterest income | Noninterest income | 79,310 | | | 42,818 | | | 63,352 | | | 185,480 | |
| Total external customer revenues | Total external customer revenues | 526,852 | | | 42,818 | | | 72,179 | | | 641,849 | |
| Inter-segment revenues: | Inter-segment revenues: | | | | | | | |
| Interest income | |
| Interest income | |
| Interest income | Interest income | 3,460 | | | 1,088 | | | 12,002 | | | 16,550 | |
| Noninterest income | Noninterest income | 15,988 | | | 1,240 | | | 1,354 | | | 18,582 | |
| Total inter-segment revenues | Total inter-segment revenues | 19,448 | | | 2,328 | | | 13,356 | | | 35,132 | |
| Total revenue | Total revenue | 546,300 | | | 45,146 | | | 85,535 | | | 676,981 | |
| External customer expenses: | External customer expenses: | | | | | | | |
| Interest expense | Interest expense | 22,058 | | | — | | | 662 | | | 22,720 | |
| Interest expense | |
| Interest expense | |
| Noninterest expenses | Noninterest expenses | 328,277 | | | 29,465 | | | 20,774 | | | 378,516 | |
| (Recovery of) provision for credit losses | (113,715) | | | — | | | (3,372) | | | (117,087) | |
| Provision for credit losses | |
| Total external customer expenses | Total external customer expenses | 236,620 | | | 29,465 | | | 18,064 | | | 284,149 | |
| Inter-segment expenses | Inter-segment expenses | | | | | | | |
| Interest expense | |
| Interest expense | |
| Interest expense | Interest expense | 13,090 | | | 856 | | | 2,604 | | | 16,550 | |
| Noninterest expenses | Noninterest expenses | 2,594 | | | 4,636 | | | 11,352 | | | 18,582 | |
| Total inter-segment expenses | Total inter-segment expenses | 15,684 | | | 5,492 | | | 13,956 | | | 35,132 | |
| Total expenses | Total expenses | 252,304 | | | 34,957 | | | 32,020 | | | 319,281 | |
| Income before taxes | Income before taxes | $ | 293,996 | | | $ | 10,189 | | | $ | 53,515 | | | $ | 357,700 | |
| Income tax provision | Income tax provision | | 86,095 | |
| Consolidated net income | Consolidated net income | | $ | 271,605 | |
| Net loss attributable to noncontrolling interest | | 163 | |
| Net income attributable to noncontrolling interest | |
| Net income attributable to WSFS | Net income attributable to WSFS | | $ | 271,442 | |
| Supplemental Information | Supplemental Information | | |
| Capital expenditures for the period ended | Capital expenditures for the period ended | $ | 6,344 | | | $ | 232 | | | $ | — | | | $ | 6,576 | |
| Capital expenditures for the period ended | |
| Capital expenditures for the period ended | |
| | Year Ended December 31, 2020 |
| Year Ended December 31, 2022 | | | Year Ended December 31, 2022 |
| (Dollars in thousands) | (Dollars in thousands) | WSFS Bank | | Cash Connect® | | Wealth Management | | Total | (Dollars in thousands) | WSFS Bank | | Cash Connect® | | Wealth Management | | Total |
| Statements of Income | Statements of Income | | | | | | | |
| External customer revenues: | External customer revenues: | |
| External customer revenues: | |
| External customer revenues: | |
| Interest income | |
| Interest income | |
| Interest income | Interest income | $ | 505,258 | | | $ | — | | | $ | 9,147 | | | $ | 514,405 | |
| Noninterest income | Noninterest income | 110,585 | | | 40,899 | | | 49,541 | | | 201,025 | |
| Total external customer revenues | Total external customer revenues | 615,843 | | | 40,899 | | | 58,688 | | | 715,430 | |
| Inter-segment revenues: | Inter-segment revenues: | | | | | | | |
| Interest income | |
| Interest income | |
| Interest income | Interest income | 4,930 | | | 851 | | | 10,747 | | | 16,528 | |
| Noninterest income | Noninterest income | 13,038 | | | 835 | | | 1,832 | | | 15,705 | |
| Total inter-segment revenues | Total inter-segment revenues | 17,968 | | | 1,686 | | | 12,579 | | | 32,233 | |
| Total revenue | Total revenue | 633,811 | | | 42,585 | | | 71,267 | | | 747,663 | |
| External customer expenses: | External customer expenses: | | | | | | | |
| Interest expense | Interest expense | 46,428 | | | — | | | 2,022 | | | 48,450 | |
| Interest expense | |
| Interest expense | |
| Noninterest expenses | Noninterest expenses | 310,799 | | | 28,421 | | | 29,624 | | | 368,844 | |
| Provision for credit losses | Provision for credit losses | 149,453 | | | — | | | 3,727 | | | 153,180 | |
| Total external customer expenses | Total external customer expenses | 506,680 | | | 28,421 | | | 35,373 | | | 570,474 | |
| Inter-segment expenses | Inter-segment expenses | | | | | | | |
| Interest expense | |
| Interest expense | |
| Interest expense | Interest expense | 11,598 | | | 1,580 | | | 3,350 | | | 16,528 | |
| Noninterest expenses | Noninterest expenses | 2,667 | | | 3,340 | | | 9,698 | | | 15,705 | |
| Total inter-segment expenses | Total inter-segment expenses | 14,265 | | | 4,920 | | | 13,048 | | | 32,233 | |
| Total expenses | Total expenses | 520,945 | | | 33,341 | | | 48,421 | | | 602,707 | |
| Income before taxes | Income before taxes | $ | 112,866 | | | $ | 9,244 | | | $ | 22,846 | | | $ | 144,956 | |
| Income tax provision | Income tax provision | | 31,636 | |
| Consolidated net income | Consolidated net income | | $ | 113,320 | |
| Net loss attributable to noncontrolling interest | | (1,454) | |
| Net income attributable to noncontrolling interest | |
| Net income attributable to WSFS | Net income attributable to WSFS | | $ | 114,774 | |
| Supplemental Information | Supplemental Information | | |
| Capital expenditures for the period ended | Capital expenditures for the period ended | $ | 6,499 | | | $ | 420 | | | $ | 240 | | | $ | 7,159 | |
| Capital expenditures for the period ended | |
| Capital expenditures for the period ended | |
| | Year Ended December 31, 2019 |
| Year Ended December 31, 2021 | | | Year Ended December 31, 2021 |
| (Dollars in thousands) | (Dollars in thousands) | WSFS Bank | | Cash Connect® | | Wealth Management | | Total | (Dollars in thousands) | WSFS Bank | | Cash Connect® | | Wealth Management | | Total |
| Statements of Income | Statements of Income | | | | | | | |
| External customer revenues: | External customer revenues: | |
| External customer revenues: | |
| External customer revenues: | |
| Interest income | |
| Interest income | |
| Interest income | Interest income | $ | 510,492 | | | $ | — | | | $ | 10,600 | | | $ | 521,092 | |
| Noninterest income | Noninterest income | 92,898 | | | 51,143 | | | 44,068 | | | 188,109 | |
| Total external customer revenues | Total external customer revenues | 603,390 | | | 51,143 | | | 54,668 | | | 709,201 | |
| Inter-segment revenues: | Inter-segment revenues: | | | | | | | |
| Interest income | |
| Interest income | |
| Interest income | Interest income | 12,380 | | | — | | | 17,081 | | | 29,461 | |
| Noninterest income | Noninterest income | 9,654 | | | 890 | | | 902 | | | 11,446 | |
| Total inter-segment revenues | Total inter-segment revenues | 22,034 | | | 890 | | | 17,983 | | | 40,907 | |
| Total revenue | Total revenue | 625,424 | | | 52,033 | | | 72,651 | | | 750,108 | |
| External customer expenses: | External customer expenses: | | | | | | | |
| Interest expense | Interest expense | 71,158 | | | — | | | 4,986 | | | 76,144 | |
| Interest expense | |
| Interest expense | |
| Noninterest expenses | Noninterest expenses | 348,351 | | | 35,377 | | | 29,399 | | | 413,127 | |
| Provision for loan and lease losses | 24,884 | | | — | | | 676 | | | 25,560 | |
| Recovery of credit losses | |
| Total external customer expenses | Total external customer expenses | 444,393 | | | 35,377 | | | 35,061 | | | 514,831 | |
| Inter-segment expenses | Inter-segment expenses | | | | | | | |
| Interest expense | |
| Interest expense | |
| Interest expense | Interest expense | 17,081 | | | 78,080 | | | 4,572 | | | 29,461 | |
| Noninterest expenses | Noninterest expenses | 1,792 | | | 2,754 | | | 6,900 | | | 11,446 | |
| Total inter-segment expenses | Total inter-segment expenses | 18,873 | | | 10,562 | | | 11,472 | | | 40,907 | |
| Total expenses | Total expenses | 463,266 | | | 45,939 | | | 46,533 | | | 555,738 | |
| Income before taxes | Income before taxes | $ | 162,158 | | | $ | 6,094 | | | $ | 26,118 | | | $ | 194,370 | |
| Income tax provision | Income tax provision | | 46,452 | |
| Consolidated net income | Consolidated net income | | $ | 147,918 | |
| Net loss attributable to noncontrolling interest | Net loss attributable to noncontrolling interest | | (891) | |
| Net income attributable to WSFS | Net income attributable to WSFS | | $ | 148,809 | |
| Supplemental Information | Supplemental Information | | |
| Capital expenditures for the period ended | Capital expenditures for the period ended | $ | 11,806 | | | $ | 2,120 | | | $ | 272 | | | $ | 14,198 | |
| Capital expenditures for the period ended | |
| Capital expenditures for the period ended | |
The following table shows significant components of segment net assets as of December 31, 20212023 and 2020:2022:
| | December 31, |
| 2021 | | 2020 |
| December 31, | | | December 31, |
| 2023 | | | 2023 | | 2022 |
| (Dollars in thousands) | (Dollars in thousands) | WSFS
Bank | | Cash Connect® | | Wealth
Management | | Total | | WSFS
Bank | | Cash Connect® | | Wealth
Management | | Total | (Dollars in thousands) | WSFS
Bank | | Cash Connect® | | Wealth
Management | | Total | | WSFS
Bank | | Cash Connect® | | Wealth
Management | | Total |
| Cash and cash equivalents | Cash and cash equivalents | $ | 1,039,046 | | | $ | 477,806 | | | $ | 16,087 | | | $ | 1,532,939 | | | $ | 1,246,394 | | | $ | 397,878 | | | $ | 10,463 | | | $ | 1,654,735 | |
| Goodwill | Goodwill | 452,629 | | | — | | | 20,199 | | | 472,828 | | | 452,629 | | | — | | | 20,199 | | | 472,828 | |
| Other segment assets | Other segment assets | 13,481,370 | | | 6,785 | | | 283,405 | | | 13,771,560 | | | 11,963,345 | | | 6,997 | | | 236,009 | | | 12,206,351 | |
| Total segment assets | Total segment assets | $ | 14,973,045 | | | $ | 484,591 | | | $ | 319,691 | | | $ | 15,777,327 | | | $ | 13,662,368 | | | $ | 404,875 | | | $ | 266,671 | | | $ | 14,333,914 | |
|
22. PARENT COMPANY FINANCIAL INFORMATION
Condensed Statements of Income | | Year Ended December 31, |
| | Year Ended December 31, | | | | Year Ended December 31, |
| (Dollars in thousands) | (Dollars in thousands) | | 2021 | | 2020 | | 2019 | (Dollars in thousands) | | 2023 | | 2022 | | 2021 |
| Income: | Income: | | | | | | |
| Interest income | Interest income | | $ | 357 | | | $ | 356 | | | $ | 5,589 | |
| Realized loss on sale of equity investment | | (706) | | | — | | | — | |
| Unrealized gains (losses) on equity investments, net | | 5,389 | | | (1,617) | | | 3,646 | |
| Interest income | |
| Interest income | |
| Realized gain (loss) on sale of equity investment | |
| Unrealized gains on equity investments, net | |
| Other noninterest income | Other noninterest income | | 4,759 | | | 208,762 | | | 240,408 | |
| 9,799 | | | 207,501 | | | 249,643 | |
| | 110,866 | |
| Expense: | Expense: | | | | | | |
| Interest expense | Interest expense | | 7,771 | | | 6,748 | | | 7,490 | |
| Interest expense | |
| Interest expense | |
| Other operating expense | Other operating expense | | 7,508 | | | 2,553 | | | 259 | |
| 15,279 | | | 9,301 | | | 7,749 | |
| (Loss) income before equity in undistributed income of subsidiaries | | (5,480) | | | 198,200 | | | 241,894 | |
| | 23,575 | |
| Income (loss) before equity in undistributed income of subsidiaries | |
| Equity in undistributed income (loss) of subsidiaries | Equity in undistributed income (loss) of subsidiaries | | 276,208 | | | (84,346) | | | (92,020) | |
| Income before taxes | Income before taxes | | 270,728 | | | 113,854 | | | 149,874 | |
| Income tax (benefit) provision | | (714) | | | (920) | | | 1,065 | |
| Income tax expense (benefit) | |
| Net income attributable to WSFS | Net income attributable to WSFS | | $ | 271,442 | | | $ | 114,774 | | | $ | 148,809 | |
Condensed Statements of Financial Condition | | December 31, |
| | December 31, | | | | December 31, |
| (Dollars in thousands) | (Dollars in thousands) | | 2021 | | 2020 | (Dollars in thousands) | | 2023 | | 2022 |
| Assets: | Assets: | | | | |
| Cash and cash equivalents | Cash and cash equivalents | | $ | 103,708 | | | $ | 244,925 | |
| Cash and cash equivalents | |
| Cash and cash equivalents | |
| Investment in subsidiaries | Investment in subsidiaries | | 2,045,080 | | | 1,862,970 | |
| Investment in the Trust | | 2,011 | | | 2,011 | |
Investment in Trusts(1) | |
| Other assets | Other assets | | 4,514 | | | 4,728 | |
| Total assets | Total assets | | $ | 2,155,313 | | | $ | 2,114,634 | |
| Liabilities: | Liabilities: | | | | |
| Trust preferred borrowings | Trust preferred borrowings | | $ | 67,011 | | | $ | 67,011 | |
| Senior debt | | 147,939 | | | 246,617 | |
| Trust preferred borrowings | |
| Trust preferred borrowings | |
| Senior and subordinated debt | |
| Accrued interest payable | Accrued interest payable | | 298 | | | 581 | |
| Other liabilities | Other liabilities | | 966 | | | 8,699 | |
| Total liabilities | Total liabilities | | 216,214 | | | 322,908 | |
| Stockholders’ equity: | Stockholders’ equity: | | | | |
| Common stock | Common stock | | 577 | | | 576 | |
| Common stock | |
| Common stock | |
| Capital in excess of par value | Capital in excess of par value | | 1,058,997 | | | 1,053,022 | |
| Accumulated other comprehensive (loss) income | | (37,768) | | | 56,007 | |
| Accumulated other comprehensive loss | |
| Retained earnings | Retained earnings | | 1,224,614 | | | 977,414 | |
| Treasury stock | Treasury stock | | (307,321) | | | (295,293) | |
| Total stockholders’ equity of WSFS | Total stockholders’ equity of WSFS | | 1,939,099 | | | 1,791,726 | |
| Total liabilities and stockholders’ equity of WSFS | Total liabilities and stockholders’ equity of WSFS | | $ | 2,155,313 | | | $ | 2,114,634 | |
Condensed Statements of Cash Flows
| | Year Ended December 31, |
| | Year Ended December 31, | | | | Year Ended December 31, |
| (Dollars in thousands) | (Dollars in thousands) | | 2021 | | 2020 | | 2019 | (Dollars in thousands) | | 2023 | | 2022 | | 2021 |
| Operating activities: | Operating activities: | | | | | | |
| Net income attributable to WSFS | Net income attributable to WSFS | | $ | 271,442 | | | $ | 114,774 | | | $ | 148,809 | |
| Adjustments to reconcile net income to net cash provided by operating activities: | |
| Net income attributable to WSFS | |
| Net income attributable to WSFS | |
| Adjustments to reconcile net income to net cash provided by (used for) operating activities: | |
| Equity in undistributed (income) loss of subsidiaries | Equity in undistributed (income) loss of subsidiaries | | (276,208) | | | 84,346 | | | 92,020 | |
| Realized loss on sale of equity investments | | 706 | | | — | | | — | |
| Unrealized (gains) losses on equity investments | | (5,389) | | | 1,617 | | | (3,646) | |
| Decrease (increase) in other assets | | 10,910 | | | (4,537) | | | 3,538 | |
| (Decrease) increase in other liabilities | | (6,690) | | | 7,684 | | | 6,012 | |
| Net cash (used for) provided by operating activities | | $ | (5,229) | | | $ | 203,884 | | | $ | 246,733 | |
| Equity in undistributed (income) loss of subsidiaries | |
| Equity in undistributed (income) loss of subsidiaries | |
| Realized (gain) loss on sale of equity investments | |
| Unrealized gains on equity investments | |
| Decrease in other assets | |
| Increase (decrease) in other liabilities | |
| Net cash provided by (used for) operating activities | |
| Investing activities: | Investing activities: | | | | | | |
| | Net cash for business combinations | Net cash for business combinations | | $ | — | | | $ | — | | | $ | (93,990) | |
| | Net cash used for investing activities | | $ | — | | | $ | — | | | $ | (93,990) | |
| | Net cash for business combinations | |
| | Net cash for business combinations | |
| | Net cash provided by investing activities | |
| Net cash provided by investing activities | |
| Net cash provided by investing activities | |
| Financing activities: | Financing activities: | | | | | | |
| | Issuance of common stock and exercise of common stock options | Issuance of common stock and exercise of common stock options | | $ | 1,522 | | | $ | 2,032 | | | $ | 7,755 | |
| Issuance of senior debt | | — | | | 147,780 | | | — | |
| Redemption of senior debt | | (100,000) | | | — | | | — | |
| | Issuance of common stock and exercise of common stock options | |
| | Issuance of common stock and exercise of common stock options | |
| | Redemption of senior and subordinated debt | |
| Redemption of senior and subordinated debt | |
| Redemption of senior and subordinated debt | |
| Purchase of treasury stock | Purchase of treasury stock | | (13,268) | | | (155,832) | | | (97,186) | |
| Dividends paid | Dividends paid | | (24,242) | | | (24,369) | | | (22,463) | |
| Net cash used for financing activities | Net cash used for financing activities | | $ | (135,988) | | | $ | (30,389) | | | $ | (111,894) | |
| (Decrease) increase in cash and cash equivalents | | $ | (141,217) | | | $ | 173,495 | | | $ | 40,849 | |
| Decrease (increase) in cash and cash equivalents | |
| Cash and cash equivalents at beginning of period | Cash and cash equivalents at beginning of period | | 244,925 | | | 71,430 | | | 30,581 | |
| Cash and cash equivalents at end of period | Cash and cash equivalents at end of period | | $ | 103,708 | | | $ | 244,925 | | | $ | 71,430 | |
|
23. CHANGE IN ACCUMULATED OTHER COMPREHENSIVE INCOME (LOSS)
Accumulated other comprehensive income (loss) includes unrealized gains and losses on available-for-sale investments, unrealized gains and losses on cash flow hedges, as well as unrecognized prior service costs, transition costs, and actuarial gains and losses on defined benefit pensionpost-retirement plans. Changes to accumulated other comprehensive income (loss) are presented net of tax as a component of stockholders' equity. Amounts that are reclassified out of accumulated other comprehensive income (loss) are recorded on the Consolidated Statement of Income either as a gain or loss.
Changes to accumulated other comprehensive income (loss) by component are shown net of taxes in the following tables for the period indicated:
| | (Dollars in thousands) | (Dollars in thousands) | Net change in investment securities available for sale | | Net change in investment securities held to maturity | | Net change in defined benefit plan | | Net change in fair value of derivatives used for cash flow hedges (1) | | Net change in
equity method
investments | | Total | (Dollars in thousands) | Net change in investment securities available for sale | | Net change in investment securities held to maturity | | Net change in defined benefit plan | | Net change in fair value of derivatives used for cash flow hedges (1) | | Net change in
equity method
investments | | Total |
| Balance, December 31, 2018 | $ | (14,553) | | | $ | 779 | | | $ | 834 | | | $ | (2,454) | | | $ | — | | | $ | (15,394) | |
| Other comprehensive income (loss) before reclassifications | 41,733 | | | (2) | | | (4,045) | | | 1,877 | | | — | | | 39,563 | |
| Less: Amounts reclassified from accumulated other comprehensive (loss) income | (253) | | | (309) | | | (106) | | | — | | | — | | | (668) | |
| Net current-period other comprehensive income (loss) | 41,480 | | | (311) | | | (4,151) | | | 1,877 | | | — | | | 38,895 | |
| Balance, December 31, 2019 | $ | 26,927 | | | $ | 468 | | | $ | (3,317) | | | $ | (577) | | | $ | — | | | $ | 23,501 | |
| Other comprehensive income (loss) before reclassifications | 39,853 | | | — | | | (1,445) | | | 1,560 | | | (9) | | | 39,959 | |
| Less: Amounts reclassified from accumulated other comprehensive (loss) income | (6,898) | | | (192) | | | (26) | | | (337) | | | — | | | (7,453) | |
| Net current-period other comprehensive income (loss) | 32,955 | | | (192) | | | (1,471) | | | 1,223 | | | (9) | | | 32,506 | |
| Balance, December 31, 2020 | Balance, December 31, 2020 | $ | 59,882 | | | $ | 276 | | | $ | (4,788) | | | $ | 646 | | | $ | (9) | | | $ | 56,007 | |
| Other comprehensive (loss) income before reclassifications | Other comprehensive (loss) income before reclassifications | (93,503) | | | — | | | 162 | | | — | | | 362 | | | (92,979) | |
| Less: Amounts reclassified from accumulated other comprehensive (loss) income | Less: Amounts reclassified from accumulated other comprehensive (loss) income | (252) | | | (101) | | | (65) | | | (378) | | | — | | | (796) | |
| Net current-period other comprehensive (loss) income | |
| Balance, December 31, 2021 | |
Other comprehensive (loss) income before reclassifications(2) | |
| Less: Amounts reclassified from accumulated other comprehensive income (loss) | |
| Net current-period other comprehensive (loss) income | |
| Balance, December 31, 2022 | |
| Other comprehensive income (loss) before reclassifications | |
| Less: Amounts reclassified from accumulated other comprehensive income (loss) | |
| Net current-period other comprehensive income (loss) | Net current-period other comprehensive income (loss) | (93,755) | | | (101) | | | 97 | | | (378) | | | 362 | | | (93,775) | |
| Balance, December 31, 2021 | $ | (33,873) | | | $ | 175 | | | $ | (4,691) | | | $ | 268 | | | $ | 353 | | | $ | (37,768) | |
| Balance, December 31, 2023 | |
(1) CashIncludes amortization of net gain for cash flow hedges were terminated as of April 1, 2020.
(2)Includes $119.8 million, net of tax, of unrealized losses on transferred investment securities from available-for-sale to held-to-maturity.
Components of other comprehensive income (loss) that impact the Consolidated Statements of Income are presented in the table below.
| | | | Twelve Months Ended December 31, | | Affected line item in Consolidated Statements of Income | | Twelve Months Ended December 31, | | Affected line item in Consolidated Statements of Income |
| (Dollars in thousands) | (Dollars in thousands) | 2021 | | 2020 | | 2019 | | | (Dollars in thousands) | 2023 | | 2022 | | 2021 | | |
| Securities available-for-sale: | Securities available-for-sale: | | | | |
| Realized gains on securities transactions | Realized gains on securities transactions | $ | (331) | | | $ | (9,076) | | | $ | (333) | | | Securities gains, net |
| Realized gains on securities transactions | |
| Realized gains on securities transactions | | $ | — | | | $ | — | | | $ | (331) | | | Securities gains, net |
| Income taxes | Income taxes | 79 | | | 2,178 | | | 80 | | | Income tax provision | Income taxes | — | | | — | | — | | | 79 | | 79 | | | Income tax provision | | Income tax provision |
| Net of tax | Net of tax | $ | (252) | | | $ | (6,898) | | | $ | (253) | | |
| Net unrealized holding gains on securities transferred between available-for-sale and held-to-maturity: | | | | | | |
| Amortization of net unrealized gains to income during the period | $ | (133) | | | $ | (251) | | | $ | (407) | | | Interest and dividends on investment securities |
| Net unrealized holding losses (gains) on securities transferred between available-for-sale and held-to-maturity: | |
| Net unrealized holding losses (gains) on securities transferred between available-for-sale and held-to-maturity: | |
| Net unrealized holding losses (gains) on securities transferred between available-for-sale and held-to-maturity: | |
| Amortization of net unrealized losses (gains) to income during the period | |
| Amortization of net unrealized losses (gains) to income during the period | |
| Amortization of net unrealized losses (gains) to income during the period | | $ | 22,343 | | | $ | 14,593 | | | $ | (133) | | | Interest and dividends on investment securities |
| Income taxes | Income taxes | 32 | | | 59 | | | 98 | | | Income tax provision | Income taxes | (5,363) | | | (3,502) | | (3,502) | | | 32 | | 32 | | | Income tax provision | | Income tax provision |
| Net of tax | Net of tax | $ | (101) | | | $ | (192) | | | $ | (309) | | |
| Amortization of defined benefit pension plan-related items: | Amortization of defined benefit pension plan-related items: | | | | | | |
| Amortization of defined benefit pension plan-related items: | |
| Amortization of defined benefit pension plan-related items: | |
| Prior service (credits) costs | |
| Prior service (credits) costs | |
| Prior service (credits) costs | Prior service (credits) costs | $ | (85) | | | $ | (266) | | | $ | (76) | | |
| | Actuarial gains | Actuarial gains | — | | | (47) | | | (63) | | |
| | Actuarial gains | |
| | Actuarial gains | |
| Total before tax | |
| Total before tax | |
| Total before tax | Total before tax | $ | (85) | | | $ | (313) | | | $ | (139) | | | Salaries, benefits and other compensation | $ | (347) | | | $ | | $ | (144) | | | $ | | $ | (85) | | | Salaries, benefits and
other compensation | | Salaries, benefits and
other compensation |
| Income taxes | Income taxes | 20 | | | 75 | | | 33 | | | Income tax provision | Income taxes | 83 | | | 35 | | 35 | | | 20 | | 20 | | | Income tax provision | | Income tax provision |
| Net of tax | Net of tax | $ | (65) | | | $ | (238) | | | $ | (106) | | |
| Defined benefit pension plan settlement: | | | | | | |
| Realized losses on plan settlement | $ | — | | | $ | 279 | | | $ | — | | | Other operating expense |
| Income taxes | — | | | (67) | | | — | | | Income tax provision |
| Net of tax | $ | — | | | $ | 212 | | | $ | — | | |
| | Net unrealized gains on terminated cash flow hedges: | Net unrealized gains on terminated cash flow hedges: | | | | | | |
| | Net unrealized gains on terminated cash flow hedges: | |
| | Net unrealized gains on terminated cash flow hedges: | |
| Amortization of net unrealized gains to income during the period | |
| Amortization of net unrealized gains to income during the period | |
| Amortization of net unrealized gains to income during the period | Amortization of net unrealized gains to income during the period | $ | (497) | | | $ | (444) | | | $ | — | | | Interest and fees on loans and leases | $ | (141) | | | $ | | $ | (211) | | | $ | | $ | (497) | | | Interest and fees on loans and leases | | Interest and fees on loans and leases |
| Income taxes | Income taxes | 119 | | | 107 | | | — | | | Income tax provision | Income taxes | 34 | | | 51 | | 51 | | | 119 | | 119 | | | Income tax provision | | Income tax provision |
| Net of tax | Net of tax | $ | (378) | | | $ | (337) | | | $ | — | | |
| Total reclassifications | Total reclassifications | $ | (796) | | | $ | (7,453) | | | $ | (668) | | |
| Total reclassifications | |
| Total reclassifications | |
24. LEGAL AND OTHER PROCEEDINGS
In accordance with the current accounting standards for loss contingencies, the Company establishes reserves for litigation-related matters that arise in the ordinary course of its business activities when it is probable that a loss associated with a claim or proceeding has been incurred and the amount of the loss can be reasonably estimated. Litigation claims and proceedings of all types are subject to many uncertain factors that generally cannot be predicted with assurance. In addition, the Company's defense of litigation claims may result in legal fees, which it expenses as incurred.
As previously disclosed, on February 27, 2018, the Company entered into a settlement agreement with Universitas Education, LLC (Universitas) to resolve arbitration claims related to services provided by Christiana Bank and Trust Company (CB&T), as Insurance Trustee of the Charter Oak Trust, prior to CB&T's acquisition by the Company in December 2010. In accordance with the litigation settlement, the Company paid Universitas $12.0 million to fully settle the claims. During the third quarter of 2018, WSFS recovered $7.9 million in settlement and legal costs from insurance carriers that provided coverage relating to the Universitas matter. Thereafter, WSFS filed suit to recover the remaining amounts relating to the Universitas proceeding, including the Universitas settlement payment, legal fees and related costs, by enforcing the indemnity right in the 2010 purchase agreement by which WSFS acquired CB&T. In the fourth quarter of 2021, WSFS agreed to a $15.0 million settlement of the indemnity litigation, which with prior recoveries, resulted in a complete recovery of the $12.0 million paid to Universitas and of all litigation costs incurred by WSFS in the Universitas arbitration and all related lawsuits, including the indemnity litigation, plus an amount allocable to prejudgment interest.
In March 2017, Nature’s Healing Trust (NHT) filed a complaint against WSFS Bank in the Delaware Court of Chancery. NHT asserts that WSFS Bank failed to provide timely notice concerning the possible lapse of two life settlement policies (aggregate face amount of $6.3 million) held in the trust. NHT asserted claims against WSFS Bank for breach of contract, breach of fiduciary duty, and negligence, and sought the face value of the policies. WSFS Bank disputed the factual allegations and denied liability. On August 5, 2021, WSFS Bank reached a settlement with NHT, under which WSFS paid no damages and each of the parties agreed to dismiss and release all of their claims against the other. The parties incurred their own attorney's fees and costs.
There were no material changes or additions to other significant pending legal or other proceedings involving the Company other than those arising out of routine operations.
25. SUBSEQUENT EVENTS
The Company evaluated subsequent events in accordance with ASC Topic 855 and determined that the following qualifies as a non-recognized subsequent event:
Bryn Mawr Trust Acquisition
On January 1, 2022, WSFS, the parent holding company of WSFS Bank, completed its previously announced merger with Bryn Mawr Bank Corporation (BMBC), pursuant to the Agreement and Plan of Merger, dated as of March 9, 2021, by and between WSFS and BMBC, a Pennsylvania corporation and the parent holding company of The Bryn Mawr Trust Company (collectively, "Bryn Mawr Trust").
The purchase price consideration of $908 million was made at closing; however, due to the limited time since the closing, the related acquisition accounting is incomplete at this time.
ITEM 9. CHANGES IN AND DISAGREEMENTS WITH ACCOUNTANTS ON ACCOUNTING AND FINANCIAL DISCLOSURE
None.
ITEM 9A. CONTROLS AND PROCEDURES
Evaluation of Disclosure Controls and Procedures
Our management, with the participation of our Chief Executive Officer and Chief Financial Officer, evaluated the effectiveness of our disclosure controls and procedures as of December 31, 2021.2023. Based on that evaluation, the Chief Executive Officer and Chief Financial Officer concluded that our disclosure controls and procedures were effective as of such date.
Changes in Internal Control over Financial Reporting
There have been no changes in our internal control over financial reporting during the most recent fiscal quarter that have materially affected, or are reasonably likely to materially affect, our internal control over financial reporting.
Management’s Report on Internal Control Over Financial Reporting
To Our Stockholders:
Management of WSFS Financial Corporation (the “Corporation”)Corporation) is responsible for establishing and maintaining adequate internal control over financial reporting as defined in Rule 13a-15(f) under the Securities Exchange Act of 1934. The Corporation’s internal control over financial reporting is a process designed by, or under the supervision of, the Corporation’s Chief Executive Officer and Chief Financial Officer to provide reasonable assurance regarding the reliability of financial reporting and the preparation of the Corporation’s financial statements for external purposes in accordance with generally accepted accounting principles.
Management assessed the effectiveness of the Corporation’s internal control over financial reporting as of December 31, 2021.2023. In making this assessment, management used the criteria set forth by the Committee of Sponsoring Organizations of the Treadway Commission (COSO) in Internal Control - Integrated Framework (2013). Based on this assessment, management has concluded that, as of December 31, 2021,2023, the Corporation’s internal control over financial reporting was effective based on those criteria.
Because of its inherent limitations, internal control over financial reporting may not prevent or detect misstatements. Also, projections of any evaluation of effectiveness to future periods are subject to the risk that controls may become inadequate because of changes in conditions, or that the degree of compliance with the policies or procedures may deteriorate.
KPMG LLP, an independent registered public accounting firm, has audited the Corporation’s Consolidated Financial Statements as of and for the year ended December 31, 20212023 and the effectiveness of the Corporation’s internal control over financial reporting as of December 31, 2021,2023, as stated in their reports, which are included herein.
| | | | | | | | |
| | |
| /s/ Rodger Levenson | | /s/ Dominic C. CanusoArthur J. Bacci |
| Rodger Levenson | | Dominic C. CanusoArthur J. Bacci |
| Chairman, President and Chief Executive Officer | | Executive Vice President, Chief Wealth Officer and |
| | Interim Chief Financial Officer |
March 1, 2022February 29, 2024
Report of Independent Registered Public Accounting Firm
To the Stockholders and Board of Directors
WSFS Financial Corporation:
Opinion on Internal Control Over Financial Reporting
We have audited WSFS Financial Corporation and subsidiaries’ (the Company) internal control over financial reporting as of December 31, 2021,2023, based on criteria established in Internal Control - Integrated Framework (2013) issued by the Committee of Sponsoring Organizations of the Treadway Commission. In our opinion, the Company maintained, in all material respects, effective internal control over financial reporting as of December 31, 2021,2023, based on criteria established in Internal Control - Integrated Framework (2013) issued by the Committee of Sponsoring Organizations of the Treadway Commission.
We also have audited, in accordance with the standards of the Public Company Accounting Oversight Board (United States) (PCAOB), the consolidated statements of financial condition of the Company as of December 31, 20212023 and 2020,December 31, 2022, the related consolidated statements of income, comprehensive income (loss), changes in stockholders’ equity, and cash flows for each of the years in the three-year period ended December 31, 2021,2023, and the related notes (collectively, the consolidated financial statements), and our report dated March 1, 2022February 29, 2024 expressed an unqualified opinion on those consolidated financial statements.
Basis for Opinion
The Company’s management is responsible for maintaining effective internal control over financial reporting and for its assessment of the effectiveness of internal control over financial reporting, included in the accompanying Management’sManagement's Report on Internal Control Over Financial Reporting. Our responsibility is to express an opinion on the Company’s internal control over financial reporting based on our audit. We are a public accounting firm registered with the PCAOB and are required to be independent with respect to the Company in accordance with the U.S. federal securities laws and the applicable rules and regulations of the Securities and Exchange Commission and the PCAOB.
We conducted our audit in accordance with the standards of the PCAOB. Those standards require that we plan and perform the audit to obtain reasonable assurance about whether effective internal control over financial reporting was maintained in all material respects. Our audit of internal control over financial reporting included obtaining an understanding of internal control over financial reporting, assessing the risk that a material weakness exists, and testing and evaluating the design and operating effectiveness of internal control based on the assessed risk. Our audit also included performing such other procedures as we considered necessary in the circumstances. We believe that our audit provides a reasonable basis for our opinion.
Definition and Limitations of Internal Control Over Financial Reporting
A company’s internal control over financial reporting is a process designed to provide reasonable assurance regarding the reliability of financial reporting and the preparation of financial statements for external purposes in accordance with generally accepted accounting principles. A company’s internal control over financial reporting includes those policies and procedures that (1) pertain to the maintenance of records that, in reasonable detail, accurately and fairly reflect the transactions and dispositions of the assets of the company; (2) provide reasonable assurance that transactions are recorded as necessary to permit preparation of financial statements in accordance with generally accepted accounting principles, and that receipts and expenditures of the company are being made only in accordance with authorizations of management and directors of the company; and (3) provide reasonable assurance regarding prevention or timely detection of unauthorized acquisition, use, or disposition of the company’s assets that could have a material effect on the financial statements.
Because of its inherent limitations, internal control over financial reporting may not prevent or detect misstatements. Also, projections of any evaluation of effectiveness to future periods are subject to the risk that controls may become inadequate because of changes in conditions, or that the degree of compliance with the policies or procedures may deteriorate.
| | | | | | | | | | | | | | |
| /s/ KPMG LLP |
|
| Philadelphia, Pennsylvania | | | | |
March 1, 2022February 29, 2024 | | |
ITEM 9B. OTHER INFORMATION
None.
ITEM 9C. DISCLOSURE REGARDING FOREIGN JURISDICTIONS THAT PREVENT INSPECTIONS
Not applicable.
PART III
ITEM 10. DIRECTORS, EXECUTIVE OFFICERS AND CORPORATE GOVERNANCE
The Information required by this Item is incorporated herein by reference from the discussion responsive thereto under the headings “Director“Corporate Governance—Biographies of Director Nominees,” “Other“Corporate Governance—Other Continuing Directors,” “Executive Management,Compensation—Executive Leadership Team,” “Security Ownership of Certain Beneficial Owners and Management”Management,” "Executive Compensation—Executive Compensation Policies," “Corporate Governance-Committees” and “Committees”"Board Structure and Roles" in our definitive proxy statement for our 20222024 Annual Meeting of Stockholders to be filed with the Securities and Exchange Commission no later than 120 days after the close of the fiscal year covered by this Annual Report on Form 10-K (the Proxy Statement).
We have adopted a Code of Ethics that applies to our principal executive officer, principal financial officer, principal accounting officer, controller or persons performing similar functions. A copy of the Code of Ethics is posted on our website at www.wsfsbank.com.
ITEM 11. EXECUTIVE COMPENSATION
The information required by this Item is incorporated herein by reference from the discussion responsive thereto under the headings “Executive Compensation Discussion and Analysis” and “Compensation“Corporate Governance—Compensation of our Board of Directors” in the Proxy Statement.
ITEM 12. SECURITY OWNERSHIP OF CERTAIN BENEFICIAL OWNERS AND MANAGEMENT AND RELATED SHAREHOLDER MATTERS
Security Ownership of Certain Beneficial Owners and Management
Information required by this Item is incorporated herein by reference from the discussion responsive thereto under the headings “Security Ownership of Certain Beneficial Owners and Management” of the Proxy Statement.
Changes in Control
We know of no arrangements, including any pledge by any person of our securities, the operation of which may at a subsequent date result in a change in control of the registrant.
Securities Authorized for Issuance Under Equity Compensation Plans
Information relating to securities authorized for issuance under the Company’s equity compensation plans is included in Part II of this Annual Report on Form 10‑K under “Market for Registrant’s Common Equity, Related Shareholder Matters and Issuer Purchases of Equity Securities.”
ITEM 13. CERTAIN RELATIONSHIPS AND RELATED TRANSACTIONS, AND DIRECTOR INDEPENDENCE
The information required by this Item is incorporated herein by reference from the discussion responsive thereto under the heading “Transactions with Related Parties” and “Independence”“Our Director Nomination and Selection Process—Independence” in the Proxy Statement.
ITEM 14. PRINCIPAL ACCOUNTANT FEES AND SERVICES
The information required by this Item is incorporated herein by reference from the discussion responsive thereto under the heading “Audit Matters—Audit Services” in the Proxy Statement.
PART IV
ITEM 15. EXHIBITS AND FINANCIAL STATEMENT SCHEDULES
(a)Listed below are all financial statements and exhibits filed as part of this report, and which are herein incorporated by reference. | | | | | | | | |
| 1 | | The Consolidated Statements of Financial Condition of WSFS Financial Corporation and subsidiaries as of December 31, 20212023 and 2020,2022, and the related Consolidated Statements of Income, Comprehensive Income, Changes in Stockholders’ Equity and Cash Flows for each of the years in the three year period ended December 31, 2021,2023, together with the related notes and the report of KPMG LLP, independent registered public accounting firm. |
| 2 | | Schedules omitted as they are not applicable. |
The following exhibits are incorporated by reference herein or annexed to this Annual Report on Form 10-K:
| | | | | | | | |
Exhibit Number | | Description of Document |
| 2.1 | |
| 3.1 | | |
| 3.2 | | |
| 4.1 | | |
| 4.2 | | |
| 4.3 | | |
| 4.4 | | |
| | |
| | |
| | |
| 4.5 | | |
4.6 | | |
4.7 | | |
4.8 | | |
4.94.6 | | |
4.104.7 | | |
4.114.8 | | |
4.124.9 | | |
4.134.10 | | |
4.144.11 | | |
| | | | | | | | |
Exhibit
Number
| 4.12 | | Description of Document
4.15 | | |
4.164.13 | | |
4.174.14 | | |
| | | | | | | | |
Exhibit Number | | Description of Document |
4.184.15 | | |
4.194.16 | | |
| 10.1 | | |
| 10.2 | | |
| 10.3 | | |
| 10.4 | | |
| 10.5 | | |
| | |
| 10.6 | | Letter Agreement, and Plan of Reorganization, dated as of August 7, 2018, as amended on November 1, 2018,March 8, 2021, by and between WSFS Financial Corporation and Beneficial Bancorp, Inc., incorporated herein by reference to Exhibit 2.1 of the Registrant’s Form S-4/A filed on November 2, 2018. |
10.7 | | |
10.810.7 | | |
10.910.8 | | |
10.1010.9 | | |
| 10.11 | |
| 21 | | |
| 23 | | |
| | |
| 31.1 | | |
| 31.2 | | |
| 32 | | |
| 97 | | |
| 101.SCH | | XBRL Schema Document ** |
| 101.CAL | | XBRL Calculation Linkbase Document ** |
| 101.DEF | | XBRL Definition Linkbase Document ** |
| 101.LAB | | XBRL Labels Linkbase Document ** |
| 101.PRE | | XBRL Presentation Linkbase Document ** |
| 101.INS | | XBRL Instance Document ** |
| 104 | | The cover page of this Annual Report on Form 10-K for the year ended December 31, 2021,2023, filed with the SEC on March 1, 2022February 29, 2024 is formatted in Inline XBRL. |
+ Filed herewith
*Schedules have been omitted pursuant to Item 601(a)(5) of Regulation S-K. A copy of any omitted schedule will be furnished supplementally to the SEC upon request; provided, however, that the parties may request confidential treatment pursuant to Rule 24b-2 of the Securities Exchange Act of 1934, as amended, for any document so furnished.
** Submitted as Exhibits 101 to this Annual Report on Form 10-K are documents formatted in XBRL (Extensible Business Reporting Language). Pursuant to Rule 406T of Regulation S-T, these interactive data files are deemed not filed or part of a registration statement or prospectus for purposes of Sections 11 or 12 of the Securities Act of 1933 or Section 18 of the Securities Exchange Act of 1934, as amended, and otherwise are not subject to liability.
Exhibits 10.1 through 10.5 represent management contracts or compensatory plan arrangements.
ITEM 16. FORM 10-K SUMMARY
Not applicable.
SIGNATURES
Pursuant to the requirements of Section 13 or 15(d) of the Securities Exchange Act of 1934, the registrant has duly caused this report to be signed on its behalf by the undersigned, thereunto duly authorized.
| | | | | | | | | | | | | | |
| WSFS FINANCIAL CORPORATION |
| | | | |
| Date: | March 1, 2022February 29, 2024 | | BY: | /s/ Rodger Levenson |
| | | | Rodger Levenson |
| | | | Chairman, President and Chief Executive Officer |
| | | | | | | | | | | | | | |
| Pursuant to the requirements of the Securities Exchange Act of 1934, this report has been signed below by the following persons on behalf of the registrant and in the capacities and on the dates indicated. |
| | | | |
| Date: | March 1, 2022February 29, 2024 | | BY: | /s/ Rodger Levenson |
| | | | Rodger Levenson |
| | | | Chairman, President and Chief Executive Officer |
| | | | |
| Date: | March 1, 2022February 29, 2024 | | BY: | /s/ Anat Bird |
| | | | Anat Bird |
| | | | Director |
| | | | |
| Date: | March 1, 2022February 29, 2024 | | BY: | /s/ Francis B. Brake |
| | | | Francis B. Brake |
| | | | Director |
| | | | |
| Date: | March 1, 2022February 29, 2024 | | BY: | /s/ Karen Dougherty Buchholz |
| | | | Karen Dougherty Buchholz |
| | | | Director |
| | | | |
| Date: | March 1, 2022February 29, 2024 | | BY: | /s/ Diego F. Calderin |
| | | | Diego F. Calderin |
| | | | Director |
| | | | |
| Date: | March 1, 2022February 29, 2024 | | BY: | /s/ Jennifer W. Davis |
| | | | Jennifer W. Davis |
| | | | Director |
| | | | |
| Date: | March 1, 2022February 29, 2024 | | BY: | /s/ Michael J. Donahue |
| | | | Michael J. Donahue |
| | | | Director |
| | | | |
| Date: | March 1, 2022February 29, 2024 | | BY: | /s/ Eleuthère I. du Pont |
| | | | Eleuthère I. du Pont |
| | | | Director |
| | | | |
| Date: | March 1, 2022February 29, 2024 | | BY: | /s/ Nancy J. Foster |
| | | | Nancy J. Foster |
| | | | Director |
| | | | |
| Date: | March 1, 2022February 29, 2024 | | BY: | /s/ Christopher T. Gheysens |
| | | | Christopher T. Gheysens |
| | | | Director |
| | | | |
| Date: | March 1, 2022February 29, 2024 | | BY: | /s/ Francis J. Leto |
| | | | Francis J. Leto |
| | | | Director |
| | | | |
Date: | March 1, 2022 | | BY: | /s/ Lynn B. McKee |
| | | | Lynn B. McKee |
| | | | Director |
| | | | |
| | | | |
| | | | |
| | | | |
| | | | |
| | | | |
| | | | |
| Date: | March 1, 2022February 29, 2024 | | BY: | /s/ David G. Turner |
| | | | David G. Turner |
| | | | Director |
| | | | |
| | | | |
| | | | |
| | | | |
| | | | |
| | | | |
| | | | |
| | | | |
| | | | |
| | | | |
| | | | |
| | | | | | | | | | | | | | |
| | | | |
| | | | |
| Date: | March 1, 2022February 29, 2024 | | BY: | /s/ Mark A. TurnerArthur J. Bacci |
| | | | Mark A. TurnerArthur J. Bacci |
| | | | Director |
| | | | |
| | | | |
| | | | |
| | | | |
| | | | |
| | | | | | | | | | | | | | |
| | | | |
| | | | |
Date: | March 1, 2022 | | BY: | /s/ Dominic C. Canuso |
| | | | Dominic C. Canuso |
| | | | Executive Vice President, Chief Wealth Officer and Interim Chief Financial Officer |
| | | | |
| Date: | March 1, 2022February 29, 2024 | | BY: | /s/ Charles K. Mosher |
| | | | Charles K. Mosher |
| | | | Senior Vice President and Chief Accounting Officer |
| | | | |