0001590717ctre:CtrPartnershipMemberctre:InnAtBartonCreekMemberctre:AssistedAndIndependentLivingPropertiesMember2023-01-012023-12-31
UNITED STATES
SECURITIES AND EXCHANGE COMMISSION
Washington, D.C. 20549
Form 10-K
(Mark One)
☒ ANNUAL REPORT PURSUANT TO SECTION 13 OR 15(d) OF THE SECURITIES EXCHANGE ACT OF 1934
For the fiscal year ended December 31, 20222023
or
☐ TRANSITION REPORT PURSUANT TO SECTION 13 OR 15(d) OF THE SECURITIES EXCHANGE ACT OF 1934
For the transition period from _____ to _____
Commission file number 001-36181
CareTrust REIT, Inc.
(Exact name of registrant as specified in its charter) | | | | | | | | |
| Maryland | | 46-3999490 |
| (State or other jurisdiction of incorporation or organization) | | (I.R.S. Employer Identification No.) |
905 Calle Amanecer, Suite 300, San Clemente, CA 92673
(Address of principal executive offices, including zip code)
Registrant’s telephone number, including area code (949) 542-3130
Securities registered pursuant to Section 12(b) of the Act: | | | | | | | | |
| Title of each class | Trading Symbol(s) | Name of each exchange on which registered |
| Common Stock, par value $0.01 per share | CTRE | New York Stock Exchange |
| | |
Securities registered pursuant to Section 12(g) of the Act: None
Indicate by check mark if the registrant is a well-known seasoned issuer, as defined in Rule 405 of the Securities Act. Yes ☒ No ☐
Indicate by check mark if the registrant is not required to file reports pursuant to Section 13 or Section 15(d) of the Act. Yes ☐ No ☒
Indicate by check mark whether the registrant (1) has filed all reports required to be filed by Section 13 or 15(d) of the Securities Exchange Act of 1934 during the preceding 12 months (or for such shorter period that the registrant was required to file such reports), and (2) has been subject to such filing requirements for the past 90 days. Yes ☒ No ☐
Indicate by check mark whether the registrant has submitted electronically every Interactive Data File required to be submitted pursuant to Rule 405 of Regulation S-T (§232.405 of this chapter) during the preceding 12 months (or for such shorter period that the registrant was required to submit such files). Yes ☒ No ☐
Indicate by check mark whether the registrant is a large accelerated filer, an accelerated filer, a non-accelerated filer, a smaller reporting company, or an emerging growth company. See the definitions of “large accelerated filer,” “accelerated filer,” “smaller reporting company” and “emerging growth company” in Rule 12b-2 of the Exchange Act. | | | | | | | | | | | | | | |
| Large accelerated filer | ☒ | | Accelerated filer | ☐ |
| Non-accelerated filer | ☐ | | Smaller reporting company | ☐ |
| | | Emerging growth company | ☐ |
If an emerging growth company, indicate by check mark if the registrant has elected not to use the extended transition period for complying with any new or revised financial accounting standards provided pursuant to Section 13(a) of the Exchange Act. ☐
Indicate by check mark whether the registrant has filed a report on and attestation to its management’s assessment of the effectiveness of its internal control over financial reporting under Section 404(b) of the Sarbanes-Oxley Act (15 U.S.C. 7262(b)) by the registered public accounting firm that prepared or issued its audit report. ☒
If securities are registered pursuant to Section 12(b) of the Act, indicate by check mark whether the financial statements of the registrant included in the filing reflect the correction of an error to previously issued financial statements. ☐
Indicate by check mark whether any of those error corrections are restatements that required a recovery analysis of incentive-based compensation received by any of the registrant’s executive officers during the relevant recovery period pursuant to §240.10D-1(b). ☐
Indicate by check mark whether the registrant is a shell company (as defined by Rule 12b-2 of the Act.) Yes ☐ No ☒
State the aggregate market value of the voting and non-voting common equity held by non-affiliates computed by reference to the price at which the common equity was last sold, or the average bid and asked price of such common equity, as of the last business day of the registrant’s most recently completed second fiscal quarter:$1.8 billion. $2.0 billion.
As of February 8, 2023,7, 2024, there were 99,511,924130,503,392 shares of the registrant’s common stock outstanding.
DOCUMENTS INCORPORATED BY REFERENCE
Portions of the definitive Proxy Statement for the registrant’s 20232024 Annual Meeting of Stockholders, which will be filed with the Securities and Exchange Commission within 120 days after the end of fiscal year 2022,2023, are incorporated by reference into Part III of this Report.
TABLE OF CONTENTS
| | | | | | | | |
| PART I |
| Item 1. | | |
| Item 1A. | | |
| Item 1B. | | |
| Item 1C. | | |
| Item 2. | | |
| Item 3. | | |
| Item 4. | | |
| PART II |
| Item 5. | | |
| | |
| Item 6. | | |
| Item 7. | | |
| Item 7A. | | |
| Item 8. | | |
| Item 9. | | |
| Item 9A. | | |
| Item 9B. | | |
| Item 9C. | | |
| PART III |
| Item 10. | | |
| Item 11. | | |
| Item 12. | | |
| Item 13. | | |
| Item 14. | | |
| PART IV |
| Item 15. | | |
| Item 16. | | |
| Signatures | | |
STATEMENT REGARDING FORWARD-LOOKING STATEMENTS
Certain statements in this report may constitute forward-looking statements within the meaning of the Private Securities Litigation Reform Act of 1995. Those forward-looking statements include all statements that are not historical statements of fact and those regarding our intent, belief or expectations, including, but not limited to, statements regarding: future financing plans, business strategies, growth prospects and operating and financial performance; expectations regarding the making of distributions and the payment of dividends; and compliance with and changes in governmental regulations.
Words such as “anticipate(s),” “expect(s),” “intend(s),” “plan(s),” “believe(s),” “may,” “will,” “would,” “could,” “should,” “seek(s)” and similar expressions, or the negative of these terms, are intended to identify such forward-looking statements. These statements are based on management’s current expectations and beliefs and are subject to a number of risks and uncertainties that could lead to actual results differing materially from those projected, forecasted or expected. Although we believe that the assumptions underlying the forward-looking statements are reasonable, we can give no assurance that our expectations will be attained. Factors which could have a material adverse effect on our operations and future prospects or which could cause actual results to differ materially from our expectations include, but are not limited to: (i) the impact of possible additional surges of COVID-19 infections or the risk of other pandemics, epidemics or infectious disease outbreaks, measures taken to prevent the spread of such outbreaks and the related impact on our business or the businesses of our tenants; (ii) the ability and willingness of our tenants to meet and/or perform their obligations under the triple-net leases we have entered into with them, including without limitation, their respective obligations to indemnify, defend and hold us harmless from and against various claims, litigation and liabilities; (iii)(ii) the risk that we may have to incur additional impairment charges related to our assets held for sale if we are unable to sell such assets at the prices we expect; (iii) the impact of healthcare reform legislation, including minimum staffing level requirements, on the operating results and financial conditions of our tenants; (iv) the ability of our tenants to comply with applicable laws, rules and regulations in the operation of the properties we lease to them; (v) the ability and willingness of our tenants to renew their leases with us upon their expiration, and the ability to reposition our properties on the same or better terms in the event of nonrenewal or in the event we replace an existing tenant, as well as any obligations, including indemnification obligations, we may incur in connection with the replacement of an existing tenant; (vi) the availability of and the ability to identify (a) tenants who meet our credit and operating standards, and (b) suitable acquisition opportunities and the ability to acquire and lease the respective properties to such tenants on favorable terms; (vii) the ability to generate sufficient cash flows to service our outstanding indebtedness; (viii) access to debt and equity capital markets; (ix) fluctuating interest rates and inflation;rates; (x) the impact of public health crises, including significant COVID-19 outbreaks as well as other pandemics or epidemics; (xi) the ability to retain our key management personnel; (xi)(xii) the ability to maintain our status as a real estate investment trust (“REIT”); (xii)(xiii) changes in the U.S. tax law and other state, federal or local laws, whether or not specific to REITs; (xiii)(xiv) other risks inherent in the real estate business, including potential liability relating to environmental matters and illiquidity of real estate investments; and (xiv)(xv) any additional factors included in this report, including in the section entitled “Risk Factors” in Item 1A of this Annual Report, as such risk factors may be amended, supplemented or superseded from time to time by other reports we file with the Securities and Exchange Commission (the “SEC”), including subsequent Annual Reports on Form 10-K and Quarterly Reports on Form 10-Q.
Forward-looking statements speak only as of the date of this report. Except in the normal course of our public disclosure obligations, we expressly disclaim any obligation to release publicly any updates or revisions to any forward-looking statements to reflect any change in our expectations or any change in events, conditions or circumstances on which any statement is based.
TENANT INFORMATION
This Annual Report on Form 10-K includes information regarding certain of our tenants that lease properties from us, some of which are not subject to SEC reporting requirements. The Ensign Group, Inc. (“Ensign”) and The Pennant Group, Inc. (“Pennant”) are subject to the reporting requirements of the SEC and are required to file with the SEC annual reports containing audited financial information and quarterly reports containing unaudited financial information. You are encouraged to review Ensign and Pennant’s publicly available filings, which can be found at the SEC’s website at www.sec.gov.
The information related to our tenants contained or referred to in this Annual Report on Form 10-K was provided to us by such tenants or derived from SEC filings or other publicly available information. We have not verified this information through an independent investigation or otherwise. We have no reason to believe that this information is inaccurate in any material respect, but we cannot provide any assurance of its accuracy. We are providing this data for informational purposes only.
PART I
All references in this report to “CareTrust REIT,” the “Company,” “we,” “us” or “our” mean CareTrust REIT, Inc. together with its consolidated subsidiaries. Unless the context suggests otherwise, references to “CareTrust REIT, Inc.” mean the parent company without its subsidiaries.
ITEM 1. Business
Our Company
CareTrust REIT is a self-administered, publicly-traded REIT engaged in the ownership, acquisition, financing, development and leasing of skilled nursing, seniors housing and other healthcare-related properties. As of December 31, 2022,2023, CareTrust REIT’s real estate portfolio consisted of 216REIT owned, directly or through joint ventures, and leased to independent operators, 226 skilled nursing facilities (“SNFs”), multi-service campuses, assisted living facilities (“ALFs”) and independent living facilities (“ILFs”) (including facilities classified as held for sale) consisting of 22,83123,928 operational beds and units located in28states states with the highest concentration of properties by rental incomeincome located in California Texas, Louisiana, Idaho and Arizona.Texas. As of December 31, 2022,2023, we also had other real estate related investments consisting of threeone preferred equity investment, eight real estate secured loans receivable and twoone mezzanine loansloan receivable with a carrying value of $156.4$180.4 million.
The following table summarizes the Company’s acquisitions from January 1, 20222023 through February 9, 20238, 2024 (dollars in thousands): | | Type of Property | Type of Property | Purchase Price(1) | | Initial Annual Cash Rent | | Number of Properties | | Number of Beds/Units(2) | Type of Property | Purchase Price(1) | | Initial Annual Cash Rent(2) | | Number of Properties | | Number of Beds/Units(3) |
| Skilled nursing | $ | 8,918 | | | $ | 815 | | | 1 | | | 135 | |
Skilled nursing(4) | |
| Multi-service campuses | Multi-service campuses | 13,003 | | | 1,235 | | | 1 | | | 130 | |
| Assisted living(5) | |
| Total | Total | $ | 21,921 | | | $ | 2,050 | | | 2 | | | 265 | |
(1)Purchase price includes capitalized acquisition costs.
(2)Initial annual cash rent represents initial cash rent for the first twelve months excluding the impact of straight-line rent or rent abatement in the first one to three months, if applicable.
(3)The number of beds/units includes operating beds at the acquisition date.
(5)Includes one ALF held through a joint venture. See Note 14, Subsequent Events, for additional information.
The following table summarizes other real estate related investments by the Company from January 1, 20222023 through February 9, 20238, 2024 (dollars in thousands): | | | | | | | | | | | | | | | | | | | | | | | | | | |
| Investment Type | Investment | | Annual Initial Interest Income(1) | | Number of Properties | | Number of Beds/Units(2) | |
| Senior mortgage secured loan receivable | $ | 75,000 | | | $ | 6,281 | | | 18 | | | 1,796 | | |
| Mezzanine loan receivable | 25,000 | | | 2,750 | | | N/A | | N/A | |
| Mortgage secured loan receivable | 22,250 | | | 1,891 | | | 5 | | | 600 | | |
| Mortgage secured loan receivable | 24,900 | | | 2,241 | | | 4 | | | 690 | | |
| Total | $ | 147,150 | | | $ | 13,163 | | | 27 | | | 3,086 | | |
| | | | | | | | | | | | | | | | | | | | | | | | | | |
| Investment Type | Investment | | Annual Initial Interest Income(1) | | Number of Properties | | Number of Beds/Units(2) | |
| Mortgage secured loans receivable | $ | 51,584 | | | $ | 4,806 | | | 9 | | | 772 | | |
| Mezzanine loans receivable | 52,165 | | | 7,119 | | | N/A | | N/A | |
| Preferred equity | 1,782 | | | 267 | | | N/A | | N/A | |
| Total | $ | 105,531 | | | $ | 12,192 | | | 9 | | | 772 | | |
(1)Represents annualized acquisition-date interest income on any mortgage secured loans receivable and mezzanine loans, less subservicing fees, if applicable. For floating rate loans, interest income has been calculated using the benchmark rate floor.
(2)The number of beds/units includes operating beds at the investment date.
From January 1, 20222023 through December 31, 2022,2023, we sold seven SNFs, fiveone SNF and four ALFs one multi-service campus and one land parcel,for net proceeds of $18.3 million, resulting in a net lossgain on sale of property of $3.8$2.2 million. Subsequent to December 31, 2022,2023, we soldclosed on the sale of one ALF.SNF and one ALF with an aggregate carrying value of $1.0 million, which approximated the net sales proceeds received.
We generate revenues primarily by leasing healthcare-related properties to healthcare operators in triple-net lease arrangements, under which the tenant is solely responsible for the costs related to the property (including property taxes, insurance, maintenance and repair costs and capital expenditures, subject to certain exceptions in the case of properties leased to Ensign and Pennant)Pennant, as defined below). From time to time, we also extend secured mortgage loans to healthcare operators, secured by healthcare-related properties, and secured mezzanine loans to healthcare operators, secured by membership interests in healthcare-related properties. From time to time, we also partner with third-party institutional investors to invest in healthcare
real estate through joint ventures. Pursuant to our joint ventures, we typically contribute 97.5% of the joint venture’s total investment amount and we receive 100% of the preferred equity interest in the joint venture in exchange for 95% of that total investment and a 50% common equity interest in the joint venture in exchange for the remaining 2.5% of that investment. Our joint venture partner contributes the remaining 2.5% of the joint venture’s total investment amount in exchange for a 50% common equity interest in the joint venture.
We conduct and manage our business as one operating segment for internal reporting and internal decision making purposes. We expect to grow our portfolio by pursuing opportunities to acquire additional properties that will be leased to a diverse group of local, regional and national healthcare providers, which may include new or existing skilled nursing operators, as well as seniors housing operators, behavioral health facilities and related businesses. We also anticipate diversifying our portfolio over time, including by acquiring properties in different geographic markets, and in different asset classes. In addition, we actively monitor the clinical, regulatory and financial operating results of our tenants, and work to identify opportunities within their operations and
markets that could improve their operating results at our facilities. We communicate such observations to our tenants; however, we have no contractual obligation to do so. Moreover, our tenants have sole discretion with respect to the day-to-day operation of the facilities they lease from us, and how and whether to implement any observation we may share with them. We also actively monitor the overall occupancy, skilled mix, and other operating metrics of our tenants on at least a monthly basis including, beginning in the quarter ended June 30, 2020, any stimulus funds received by each tenant.basis. We have replaced tenants in the past, and may elect to replace tenants in the future, if they fail to meet the terms and conditions of their leases with us. In addition, we have, and may from time to time in the future, repurpose facilities for other uses, such as behavioral health. The replacement tenants may include tenants with whom we have had no prior landlord-tenant relationship as well as current tenants with whom we are comfortable expanding our relationships. We have also provided select tenants with strategic capital for facility upkeep and modernization, as well as short-term working capital loans when they are awaiting licensure and certification or conducting turnaround work in one or more of our properties, and we may continue to do so in the future. We have also assisted our tenants with transitioning to lower emissions technologies through our tenant incentive program, where we support efficiency projects through our dedicated tenant capital expenditure budget, providing sustainability incentives rent-free. In addition, we periodically reassess the investments we have made and the tenant relationships we have entered into, and have selectively disposed of facilities or investments, or terminated such relationships, and we expect to continue making such reassessments and, where appropriate, taking such actions.
We elected to be taxed as a REIT for U.S. federal income tax purposes beginning with our taxable year ended December 31, 2014. We believe that we have been organized and have operated, and we intend to continue to operate, in a manner to qualify for taxation as a REIT. We operate through an umbrella partnership, commonly referred to as an UPREIT structure, in which substantially all of our properties and assets are held through CTR Partnership, L.P. (the “Operating Partnership”). The Operating Partnership is managed by CareTrust REIT’s wholly owned subsidiary, CareTrust GP, LLC, which is the sole general partner of the Operating Partnership. To maintain REIT status, we must meet a number of organizational and operational requirements, including a requirement that we annually distribute to our stockholders at least 90% of our REIT taxable income, determined without regard to the dividends paid deduction and excluding any net capital gains.
Our Industry
The skilled nursing industry has evolved to meet the growing demand for post-acute and custodial healthcare services generated by an aging population, increasing life expectancies and the trend toward shifting of patient care to lower cost settings. We believe this evolution has led to a number of favorable improvements in the industry, as described below:
•Shift of Patient Care to Lower Cost Alternatives. The growth of the senior population in the United States continues to increase healthcare costs. In response, federal and state governments have adopted cost-containment measures that encourage the treatment of patients in more cost-effective settings such as SNFs, for which the staffing requirements and associated costs are often significantly lower than acute care hospitals, inpatient rehabilitation facilities and other post-acute care settings. As a result, SNFs are generally serving a larger population of higher-acuity patients than in the past. The same trend is impacting ALFs, which are now generally serving some patients who previously would have received services at SNFs.
•Significant Acquisition and Consolidation Opportunities. The skilled nursing industry is large and highly fragmented, characterized predominantly by numerous local and regional providers. We believe this fragmentation provides significant acquisition and consolidation opportunities for us.
•Widening Supply and Demand Imbalance. The number of SNFs has declined modestly over the past several years. According to the American Health Care Association, the nursing home industry was comprised of approximately 15,20015,000 facilities as of July 2022,2023, as compared with over 15,600 facilities as of July 2016. We expect that the supply/demand imbalance in the skilled nursing industry will increasinglyincreasingly favor skilled nursing and assisted living providers due to the shift of patient care to lower cost settings and an aging population.
•Increased Demand Driven by Aging Populations. As seniors account for a higher percentage of the total U.S. population, we believe the overall demand for skilled nursing services will increase. At present, the primary market demographic for skilled nursing services is individuals age 75 and older. The 2020 U.S. Census reportedestimates that there were over 5658 million people in the United States in 20202022 over the age of 65. The U.S. Census estimates this group to be one of the fastestfastest growing segments of the United States population, projecting that it will almost double between 2020 and 2060. According to the Centers for Medicare & Medicaid Services, nursing home care facilities and continuing care retirement expenditures are projected to grow from approximately $196.8$193.6 billion in 2020,2022, which includes federal expenditures in response to the COVID-19 pandemic, to approximately $273$283.3 billion in 2030.2031. Although seniors housing and skilled nursing and seniors housing occupancy rates have declined during the COVID-19 pandemic, we believe that these trends in population will support an increasing demand for skilled nursing services in the long-term, which in turn will likely support an increasing demand for the services provided within our properties.
Financial Condition and Results of Operations — Recent Developments — Regulatory Updates”) have led, and may continue to lead, to increased costs. Additionally, elevated interest rates and volatility in the capital markets have limited the availability of debt capital, increased our costs of capital to finance acquisitions and increased our borrowing costs. Further, our operators have experienced increased costs, liquidity constraints and financing difficulties due to the current market conditions, which could cause them to be unable or unwilling to make rental or interest payments when due. It is difficult to predict the duration of the effects of these economic and market conditions on the industry. Portfolio Summary
We have a geographically diverse portfolio of properties, consisting of the following types as of December 31, 2022:2023:
•Skilled Nursing Facilities. SNFs are licensed healthcare facilities that provide restorative, rehabilitative and nursing care for people not requiring the more extensive and sophisticated treatment available at acute care hospitals. Treatment programs include physical, occupational, speech, respiratory and other therapies, including sub-acute clinical protocols such as wound care and intravenous drug treatment. Charges for these services are generally paid from a combination of government reimbursement and private sources. As of December 31, 2022,2023, our portfolio included 178151 SNFs 24 of which(excluding 12 SNFs held for sale). Included in the 151 SNFs are three SNFs held through joint ventures and one SNF which is non-operational. In addition, our portfolio includes 25 SNFs located on campuses that also have ALFs or ILFs, which we refer to as multi-service campuses (see below under “Multi-Service Campuses”).
•Assisted Living Facilities. ALFs are licensed healthcare facilities that provide personal care services, support and housing for those who need help with activities of daily living, such as bathing, eating and dressing, yet require limited medical care. The programs and services may include transportation, social activities, exercise and fitness programs, beauty or barber shop access, hobby and craft activities, community excursions, meals in a dining room setting and other activities sought by residents. These facilities are often apartment-like buildings with private residences ranging from single rooms to large apartments. Certain ALFs may offer higher levels of personal assistance for residents requiring memory care as a result of Alzheimer’s disease or other forms of dementia. The level of personal assistance that may be provided at ALFs is based in part on state regulations. Since states often apply differing license classifications, and standards, regulatory requirements may differ significantly between states. As of December 31, 2022,2023, our portfolio included 3634 ALFs (excluding two ALFs classified as held for sale), some of which also contain independent living and memory care units. Included in the 3634 ALFs are five ALFs classified as held for sale as of December 31, 2022, two facilities which are in the process of being repurposed and two facilities which are non-operational.
•Independent Living Facilities. ILFs, also known as retirement communities or senior apartments, are not healthcare facilities and are not licensed to provide healthcare services to residents. The facilities typically consist of entirely self-contained apartments, complete with their own kitchens, baths and individual living spaces, as well as parking for tenant vehicles. They are most often rented unfurnished, and generally can be personalized by the tenants, and are typically occupied by an individual or a couple over the age of 55. These facilities offer various services and amenities such as laundry, housekeeping, dining options/meal plans, exercise and wellness programs, transportation, social, cultural and recreational activities, on site security and emergency response programs.programs. As of December 31, 2022,2023, our portfolio included 2 included two ILFs.
•Multi-Service Campuses. Multi-service campuses generally include some combination of co-located SNFs, ALFs, ILFs, and/or memory care units all housed at a single location and operated as a continuum of care. We also refer to continuing care retirement communities as multi-service campuses. These facilities are often marketed as an opportunity for residents to “age in place,” and tend to attract couples where the individuals may require or benefit
from differing levels of care.care. As of December 31, 2022,2023, our portfolio included 24 facilitiesincluded 25 facilities that we classify as multi-service campuses.
Our portfolio of SNFs, ALFs, ILFs and multi-service campuses is broadly diversified by geographic location throughout the United States, with concentrations in California and Texas Louisiana, Idaho and Arizona basedbased on rental income.
Significant Master Leases
As of December 31, 2022,2023, we leased 94 facilities to subsidiaries of Ensign, which have a total of 10,3999,776 operational beds. We have leased a significant number of our properties to subsidiaries of Ensign on a triple-net basis under eight long-term leases, each with its own pool of properties, that have varying maturities and diversity in both property type and geography (each an “Ensign Master Lease” and collectively, the “Ensign Master Leases”). TheThe Ensign Master Leases provide for initial terms in excess of ten years with staggered expiration dates and no purchase options. At Ensign’s option, each Ensign Master Lease may be extended for up to three five-year renewal terms beyond the initial term and, if elected, the renewal will be effective for all of the leased property then subject to the applicable Ensign Master Lease. During the year ended December 31, 2020, the Company acquired four additional facilities, which have a total of 620 operational beds, leased to subsidiaries of Ensign on a triple-net basis under two separate master lease agreements, each of which contains a purchase option. As of December 31, 2022,2023, annualized contractual rental income from the Ensign Master Leases was $62.3$63.8 million, and annualized contractual rental income from all Ensign leases was $66.2$67.8 million, representing 33%31% and 35%33% of total annualized contractual rental income, respectively. Rent is escalated annually in June under the Ensign Master Leases, and in December for the four additional facilities leased to Ensign, by an amount equal to the product of (1) the lesser of the percentage change in the Consumer Price Index (“CPI”) (but not less than zero) or 2.5%, and (2) the prior year’s rent.rent. The Ensign Master Leases are guaranteed by Ensign and contain cross-default provisions. The obligations under the lease agreements for the four additional facilities are guaranteed by Ensign but do not contain cross-default provisions with the Ensign Master Leases.
As of December 31, 2022, 2023, 15 of our properties were leased to subsidiaries of Priority Management Group (“PMG”) on a triple-net basis under one long-term lease (the “PMG Master Lease”), and have a total of 2,144 operational beds. The PMG Master Lease commenced on December 1, 2016, and provides for an initial term of fifteen years, with two five-year renewal options. As of December 31, 2022,2023, annualized contractual rental income from the PMG Master Lease was $30.2$31.2 million, representing 16%15% of total annualized contractual rental income.
See “Risk Factors -— Risks Related to Our Business -and Operations — We are dependent on the healthcare operators that lease our properties to successfully operate their business and make contractual lease payments, and an event that materially and adversely affects their business, financial position or results of operations could materially and adversely affect our business, financial position or results of operations.”
We monitor the creditworthiness of our tenants by evaluating the ability of the tenants to meet their lease obligations to us based on the tenants’ financial performance, including the evaluation of any guarantees of tenant lease obligations. The primary basis for our evaluation of the credit quality of our tenants (and more specifically the tenants’ ability to pay their rent obligations to us) is the tenants’ lease coverage ratios. These coverage ratios compare (i) earnings before interest, income taxes, depreciation, amortization and rent (“EBITDAR”) to rent coverage, and (ii) earnings before interest, income taxes, depreciation, amortization, rent and management fees (“EBITDARM”) to rent coverage. We utilize a standardized 5% management fee when we calculate lease coverage ratios. We obtain various financial and operational information from our tenants each month. We regularly review this information to calculate the above-described coverage metrics, to identify operational trends, to assess the operational and financial impact of the changes in the broader industry environment (including the potential impact of government reimbursement and regulatory changes), and to evaluate the management and performance of the tenants’ operations. These metrics help us identify potential areas of concern relative to our tenants’ credit quality and ultimately the tenants’ ability to generate sufficient liquidity to meet their ongoing obligations, including their obligations to continue paying contractual rents due to us and satisfying other financial obligations to third parties, as prescribed by our triple-net leases.
Properties by Type:
The following table displays the geographic distribution of our facilities, excluding those held for sale, and the related number of beds and units available for occupancy by property type, as of December 31, 2022.2023. The number of beds or units that are operational may be less than the official licensed capacity. | | | | | Total | | SNFs | | Multi-Service Campuses | | ALFs and ILFs | | | Total | | SNFs | | Multi-Service Campuses | | ALFs and ILFs |
| State | State | | Properties | Beds/Units | | Facilities | Beds | | Campuses | Beds/Units | | Facilities | Beds/Units | State | | Properties | Beds/Units | | Facilities | Beds | | Campuses | Beds/Units | | Facilities | Beds/Units |
CA(1) | |
| TX | TX | | 44 | | 5,627 | | | 38 | | 4,849 | | | 3 | | 536 | | | 3 | | 242 | |
| CA | | 40 | | 4,844 | | | 27 | | 3,048 | | | 8 | | 1,359 | | | 5 | | 437 | |
| ID | ID | | 17 | | 1,474 | | | 16 | | 1,405 | | | 1 | | 69 | | | — | | — | |
| IA | | 15 | | 970 | | | 13 | | 801 | | | 2 | | 169 | | | — | | — | |
| UT | UT | | 13 | | 1,374 | | | 9 | | 913 | | | 1 | | 272 | | | 3 | | 189 | |
| AZ | AZ | | 11 | | 1,340 | | | 8 | | 971 | | | — | | — | | | 3 | | 369 | |
| IL | |
| WA | WA | | 10 | | 936 | | | 9 | | 839 | | | — | | — | | | 1 | | 97 | |
| IL | | 9 | | 916 | | | 7 | | 642 | | | 2 | | 274 | | | — | | — | |
| LA | LA | | 8 | | 1,164 | | | 7 | | 949 | | | 1 | | 215 | | | — | | — | |
| CO | CO | | 7 | | 779 | | | 5 | | 511 | | | — | | — | | | 2 | | 268 | |
| OH | OH | | 6 | | 612 | | | 3 | | 256 | | | 3 | | 356 | | | — | | — | |
| IA | |
| MI | |
| NE | NE | | 5 | | 366 | | | 3 | | 220 | | | 2 | | 146 | | | — | | — | |
| FL | | 4 | | 420 | | | — | | — | | | — | | — | | | 4 | | 420 | |
| MI | | 4 | | 189 | | | — | | — | | | — | | — | | | 4 | | 189 | |
| MT | |
| NV | NV | | 3 | | 304 | | | 1 | | 92 | | | — | | — | | | 2 | | 212 | |
| MT | | 3 | | 259 | | | 3 | | 259 | | | — | | — | | | — | | — | |
| WI | | 3 | | 206 | | | — | | — | | | — | | — | | | 3 | | 206 | |
| MN | MN | | 2 | | 62 | | | — | | — | | | — | | — | | | 2 | | 62 | |
| NC | NC | | 2 | | 104 | | | — | | — | | | — | | — | | | 2 | | 104 | |
| NJ | NJ | | 2 | | 98 | | | — | | — | | | — | | — | | | 2 | | 98 | |
| IN | | 1 | | 162 | | | — | | — | | | — | | — | | | 1 | | 162 | |
| WI | |
| FL | |
| GA | |
| KS | |
| MD | MD | | 1 | | 120 | | | — | | — | | | — | | — | | | 1 | | 120 | |
| ND | |
| NM | NM | | 1 | | 116 | | | 1 | | 116 | | | — | | — | | | — | | — | |
| GA | | 1 | | 105 | | | 1 | | 105 | | | — | | — | | | — | | — | |
| ND | | 1 | | 83 | | | 1 | | 83 | | | — | | — | | | — | | — | |
| OR | |
| SD | SD | | 1 | | 81 | | | 1 | | 81 | | | — | | — | | | — | | — | |
| WV | WV | | 1 | | 67 | | | — | | — | | | 1 | | 67 | | | — | | — | |
| OR | | 1 | | 53 | | | 1 | | 53 | | | — | | — | | | — | | — | |
| | Total | Total | | 216 | | 22,831 | | | 154 | | 16,193 | | | 24 | | 3,463 | | | 38 | | 3,175 | |
| Total | |
| Total | |
(1)Includes three SNFs with 385 beds held in consolidated joint ventures.
Occupancy by Property Type:
The following table displays occupancy by property type for each of the years ended December 31, 20222023 and 2021.2022. Percentage occupancy in the below table is computed by dividing the average daily number of beds occupied by the total number of beds available for use during the periods indicated (beds are included in the computation following the date of acquisition, or through the date of disposition, only). | | | |
| | | | Year Ended December 31, | |
| Property Type | Property Type | 2022(1) | 2021(2) | |
| Property Type | |
| Property Type | |
Facilities Leased to Tenants: (3) | |
Facilities Leased to Tenants: (3) | |
Facilities Leased to Tenants: (3) | Facilities Leased to Tenants: (3) | | |
| SNFs | SNFs | 73 | % | 69 | % | |
| SNFs | |
| SNFs | |
| Multi-Service Campuses | Multi-Service Campuses | 71 | % | 66 | % | |
| Multi-Service Campuses | |
| Multi-Service Campuses | |
| ALFs and ILFs | |
| ALFs and ILFs | |
| ALFs and ILFs | ALFs and ILFs | 74 | % | 73 | % | |
|
(1) Occupancy data excludes two facilities which are in the process of being repurposed, one non-operational SNF and two non-operational ALFs while we identify an operator.ALFs.
(2) Occupancy data excludes two facilities which are in the process of being repurposed and two non-operational ALFs while we identify an operator.ALFs.
(3) Occupancy data derived solely from information provided by our tenants without independent verification by us. The leased facility financial performance data is presented one quarter in arrears.
Property Type -— Rental Income:
The following tables display the annual rental income for each property type leased to third-party tenants for the years ended December 31, 20222023 and 20212022 and total beds/units for each property type as of December 31, 20222023 and 2021.2022. | | | | | | | | | | | | | | |
| | For the Year Ended December 31, 2022 | | As of December 31, 2022 |
| Property Type | Rental Income
(in thousands) | Percent of Total | | Total Beds/ Units |
| SNFs | $ | 135,701 | | 72 | % | | 16,193 | |
| Multi-Service Campuses | 33,149 | | 18 | % | | 3,463 | |
| ALFs and ILFs | 18,656 | | 10 | % | | 3,175 | |
| Total | $ | 187,506 | | 100 | % | | 22,831 | |
| | | | For the Year Ended December 31, 2021 | | As of December 31, 2021 | | For the Year Ended December 31, 2023 | | As of December 31, 2023 |
| Property Type | Property Type | Rental Income
(in thousands) | Percent of Total | | Total Beds/ Units | Property Type | Rental Income
(in thousands) | Percent of Total | | Total Beds/ Units |
| SNFs | $ | 133,380 | | 70 | % | | 16,614 | |
SNFs(1) | |
| Multi-Service Campuses | Multi-Service Campuses | 30,440 | | 16 | % | | 3,545 | |
| ALFs and ILFs | ALFs and ILFs | 26,375 | | 14 | % | | 3,491 | |
| Total | Total | $ | 190,195 | | 100 | % | | 23,650 | |
| | | | | | | | | | | | | | |
| | For the Year Ended December 31, 2022 | | As of December 31, 2022 |
| Property Type | Rental Income
(in thousands) | Percent of Total | | Total Beds/ Units |
| SNFs | $ | 135,701 | | 72 | % | | 16,193 | |
| Multi-Service Campuses | 33,149 | | 18 | % | | 3,463 | |
| ALFs and ILFs | 18,656 | | 10 | % | | 3,175 | |
| Total | $ | 187,506 | | 100 | % | | 22,831 | |
Geographic Concentration -— Rental Income:
The following table displays the geographic distribution of annual rental income for properties leased to third-party tenants for the years ended December 31, 20222023 and 20212022 (dollars in thousands). | | | | For the Year Ended December 31, 2022 | | For the Year Ended December 31, 2021 | | For the Year Ended December 31, 2023 | | For the Year Ended December 31, 2022 |
State | State | Rental Income | Percent of Total | | Rental Income | Percent of Total | State | Rental Income(1) | Percent of Total | | Rental Income | Percent of Total |
| CA | CA | $ | 51,553 | | 27 | % | | $ | 47,304 | | 25 | % | CA | $ | 58,838 | | 30 | 30 | % | | $ | 51,553 | | 27 | 27 | % |
| TX | TX | 41,021 | | 22 | % | | 38,127 | | 20 | % | TX | 43,768 | | 22 | 22 | % | | 41,021 | | 22 | 22 | % |
| LA | LA | 17,092 | | 9 | % | | 16,322 | | 9 | % | LA | 17,856 | | 9 | 9 | % | | 17,092 | | 9 | 9 | % |
| ID | ID | 14,446 | | 8 | % | | 13,917 | | 7 | % | ID | 14,943 | | 8 | 8 | % | | 14,446 | | 8 | 8 | % |
| AZ | AZ | 12,968 | | 7 | % | | 12,652 | | 7 | % | AZ | 13,293 | | 7 | 7 | % | | 12,968 | | 7 | 7 | % |
| UT | UT | 7,612 | | 4 | % | | 7,453 | | 4 | % | UT | 7,823 | | 4 | 4 | % | | 7,612 | | 4 | 4 | % |
| IL | IL | 6,074 | | 3 | % | | 4,893 | | 3 | % | IL | 6,975 | | 4 | 4 | % | | 6,074 | | 3 | 3 | % |
| CO | CO | 5,796 | | 3 | % | | 5,642 | | 3 | % | CO | 5,960 | | 3 | 3 | % | | 5,796 | | 3 | 3 | % |
| WA | | WA | 4,893 | | 2 | % | | 4,793 | | 3 | % |
| IA | IA | 5,318 | | 3 | % | | 5,322 | | 3 | % | IA | 4,584 | | 2 | 2 | % | | 5,318 | | 3 | 3 | % |
| WA | 4,793 | | 3 | % | | 4,936 | | 3 | % |
| OH | OH | 4,128 | | 2 | % | | 9,071 | | 5 | % | OH | 4,141 | | 2 | 2 | % | | 4,128 | | 2 | 2 | % |
| MI | 3,003 | | 2 | % | | 3,081 | | 2 | % |
| MT | MT | 2,188 | | 1 | % | | 2,128 | | 1 | % | MT | 2,254 | | 1 | 1 | % | | 2,188 | | 1 | 1 | % |
| NV | NV | 2,177 | | 1 | % | | 2,123 | | 1 | % | NV | 2,231 | | 1 | 1 | % | | 2,177 | | 1 | 1 | % |
| MI | | MI | 2,069 | | 1 | % | | 3,003 | | 2 | % |
| GA | | GA | 1,454 | | 1 | % | | 944 | | 1 | % |
| MN | | MN | 1,100 | | 1 | % | | 1,064 | | 1 | % |
| NM | | NM | 1,083 | | 1 | % | | 937 | | 1 | % |
| NE | | NE | 1,020 | | 1 | % | | 995 | | 1 | % |
| SD | | SD | 972 | | * | | 944 | | * |
| WV | | WV | 776 | | * | | 751 | | * |
| WI | | WI | 556 | | * | | 520 | | * |
| KS | | KS | 511 | | * | | — | | * |
| NC | NC | 1,172 | | 1 | % | | 1,135 | | 1 | % | NC | 505 | | * | * | | 1,172 | | 1 | 1 | % |
| MN | 1,064 | | 1 | % | | 1,038 | | 1 | % |
| NE | 995 | | 1 | % | | 970 | | * |
| GA | 944 | | 1 | % | | 949 | | * |
| SD | 944 | | 1 | % | | 917 | | * |
| NM | 937 | | * | | 1,023 | | * |
| WV | 751 | | * | | 727 | | * |
| VA | 539 | | * | | 3,449 | | 2 | % |
| WI | 520 | | * | | 3,045 | | 2 | % |
| ND | ND | 461 | | * | | 448 | | * | ND | 475 | | * | * | | 461 | | * | * |
| OR | OR | 411 | | * | | 399 | | * | OR | 423 | | * | * | | 411 | | * | * |
| MD | MD | 247 | | * | | 588 | | * | MD | 71 | | * | * | | 247 | | * | * |
| FL | FL | 222 | | * | | 1,681 | | 1 | % | FL | 25 | | * | * | | 222 | | * | * |
| | VA | |
| VA | |
| VA | | — | | * | | 539 | | * |
| | IN | IN | 130 | | * | | 855 | | * |
| | IN | |
| IN | | — | | * | | 130 | | * |
| NJ | | NJ | — | | * | | — | | * |
| Total | Total | $ | 187,506 | | 100 | % | | $ | 190,195 | | 100 | % | Total | $ | 198,599 | | 100 | 100 | % | | $ | 187,506 | | 100 | 100 | % |
•Represents less than 1%
(1) Includes three SNFs held in consolidated joint ventures.
Investment and Financing Policies
Our investment objectives are to increase cash flow, provide quarterly cash dividends, maximize the value of our properties and acquire properties with cash flow growth potential. We intend to invest primarily in SNFs and seniors housing, including ALFs and ILFs. We are expanding our investments into behavioral health facilities and we may determine in the future to expand our investments to include medical office buildings, long-term acute care hospitals and inpatient rehabilitation facilities. We may utilize the RIDEA structure for future acquisitions (see “Business Strategies - Diversify Asset Portfolio” below). Our properties are located in 28 statesstates and we intend to continue to acquire properties in other states throughout the United States. Although our portfolio currently consists primarily of owned real property, we have also invested in joint ventures through which we own properties, as well as mortgage loans receivable and mezzanine loans. We expect that our future investments may also include first mortgages, mezzanine debt and other securities issued by, or joint ventures with, REITs or other entities that own real estate consistent with our investment objectives.
Our Competitive Strengths
We believe that our ability to acquire, integrate and improve facilities is a direct result of the following key competitive strengths:
Geographically Diverse Property Portfolio. Our properties are located in 28 different states, with concentrations in California and Texas Louisiana, Idaho and Arizona basebasedd on rental income.income. The properties in any one state do not account for more than 27%than 30% of our total rental income as of December 31, 2022.2023. We believe this geographic diversification will limit the effect of changes in any one market on our overall performance.
Long-Term, Triple-Net Lease Structure. All of our owned properties except two(including properties under a short-term lease,we own through joint ventures, excluding one SNF which is non-operational), are leased to our tenants under long-term, triple-net leases, pursuant to which the operators are responsible for all facility maintenance and repair, insurance required in connection with the leased properties and the business conducted on the leased properties, taxes levied on or with respect to the leased properties and all utilities and other services necessary or appropriate for the leased properties and the business conducted on the leased properties.
Financially Secure Primary Tenant. Ensign is an established provider of healthcare services with strong financial performance and accounted for 35%33% of our 2022total annualized contractual rental income exclusiveas of operating expense reimbursements.December 31, 2023. Ensign is subject to the reporting requirements of the SEC and is required to file with the SEC annual reports containing audited financial information and quarterly reports containing unaudited financial information. Ensign’s publicly available filings can be found at the SEC’s website at www.sec.gov.
Investments in Joint Ventures. From time to time, we partner with third-party institutional investors to invest in healthcare real estate through joint ventures. Pursuant to our joint ventures, we typically contribute 97.5% of the joint venture’s total investment amount and we receive 100% of the preferred equity interest in the joint venture in exchange for 95% of that total investment and a 50% common equity interest in the joint venture in exchange for the remaining 2.5% of that investment. Our joint venture partner contributes the remaining 2.5% of the joint venture’s total investment amount in exchange for a 50% common ownership interest in the joint venture. These are investments that we typically consolidate as they are variable interest entities and as we are considered to be the primary beneficiary and have the power to direct the activities that most significantly impact the entity’s economic performance and have the obligation to absorb losses of, or the right to receive benefits from, the entity that could potentially be significant.
Lower Cost of Capital. Our ability to access the capital markets provides us greater flexibility to manage our cost of capital and also offers us the ability to fund future acquisitions through the issuance of additional shares, including under our ATM Program (as defined below). During the year ended December 31, 2023, we sold approximately 30.9 million shares at an average gross price of $20.86 for gross proceeds of approximately $643.8 million under our ATM Program to fund future acquisitions.
Ability to Identify Talented Operators. As a result of our management team’s operating experience and network of relationships and insight, we believe that we are able to identify and pursue working relationships with qualified local, regional and national healthcare providers and seniors housing operators. We expect to continue our disciplined focus on pursuing investment opportunities, primarily with respect to stabilized assets but also some strategic investmentinvestments in new and/or improving properties, while seeking dedicated and engaged operators who possess local market knowledge, have solid operating records and emphasize quality services and outcomes. We intend to support these operators by providing strategic capital for facility acquisition, upkeep and modernization. Our management team’s experience gives us a key competitive advantage in objectively evaluating an operator’s financial position, care and service programs, operating efficiencies and likely business prospects.
Experienced Management Team. David M. Sedgwick was appointed as our Chief Executive Officer effective January 1, 2022. At the time of his appointment, Mr. Sedgwick was serving as our President, a role he had filled since February 2021, and he continues to hold that title. He previously served as our Chief Operating Officer from August 2018 through 2021, and as our Vice President-Operations from CareTrust’s launch as an independent public company in 2014 to 2018. Mr. Sedgwick has more than 2023 years of experience in the skilled nursing and seniors housing industry. Mr. Sedgwick’s President, Chief Operating Officer and Vice President duties regularly involved him in matters related to new investments, asset management, tenant relations, portfolio management, portfolio optimization, investor relations and capital markets activities for the Company. Prior to joining CareTrust, Mr. Sedgwick served as the Chief Human Capital Officer and President of Facility Services at Ensign. Mr. Sedgwick has been a licensed nursing home administrator since 2001.
Our Chief Financial Officer, William M. Wagner, has more than 2530 years of accounting and finance experience, primarily in real estate, including more than 1519 years of experience working extensively for REITs. Most notably, he worked for both Nationwide Health Properties, Inc., a healthcare REIT, and Sunstone Hotel Investors, Inc., a lodging REIT, serving as Senior Vice President and Chief Accounting Officer of each company prior to joining us as our Chief Financial Officer.
James B. Callister was appointed as our Executive Vice President effective July 2022 and Chief Investment Officer effective December 31, 2022, succeeding Mark D. Lamb in that role.2022. Mr. Callister continues to serve as Secretary, and previously served as General Counsel from February 2021 to July 2022. Prior to joining the Company, Mr. Callister worked as a real estate attorney and a partner at the law firm of Sherry Meyerhoff Hanson & Crance LLP and, before that, at the law firm of O’Melveny & Myers LLP. Since 2008, he has worked almost exclusively on healthcare REIT transactions, closing on acquisitions or financings of over 300 skilled nursing, seniors housing, and independent living facilities. Mr. Callister has assisted in the structure, negotiating and closing of all of our acquisitions since our formation as a REIT. As an attorney, Mr. Callister worked for nearly 20 years in private practice representing and advising clients in a diverse array of real estate transactions. Mr. Callister’s transactions-based legal experience has focused on the representation of publicly-traded REITs in the acquisition, disposition, leasing, and financing of healthcare-related properties. Mr. Callister holds a B.A. in History from Brigham Young University and a J.D. from the J. Reuben Clark Law School at Brigham Young University, where he graduated magna cum laude.
Flexible UPREIT Structure. We operate through an umbrella partnership, commonly referred to as an UPREIT structure, in which substantially all of our properties and assets are held through the Operating Partnership. Conducting business through the Operating Partnership allows us flexibility in the manner in which we structure the acquisition of properties. In particular, an UPREIT structure enables us to acquire additional properties from sellers in exchange for limited
partnership units, which provides property owners the opportunity to defer the tax consequences that would otherwise arise from a sale of their real properties and other assets to us. As a result, this structure allows us to acquire assets in a more efficient manner and may allow us to acquire assets that the owner would otherwise be unwilling to sell because of tax considerations.
Business Strategies
Our primary goal is to create long-term stockholder value through the payment of consistent cash dividends and the growth of our asset base. To achieve this goal, we intend to pursue a business strategy focused on opportunistic acquisitions and property diversification. We also intend to further develop our relationships with tenants and healthcare providers with a goal to progressively expand the mixture of tenants managing and operating our properties.
The key components of our business strategies include:
Diversify Asset Portfolio. We diversify through the acquisition of new and existing facilities from third parties and the expansion and upgrade of current facilities and strategically investing in new developments with options to acquire the developments at stabilization. We employ what we believe to be a disciplined, opportunistic acquisition strategy with a focus on the acquisition of SNFs, ALFs and ILFs. We plan to expandare expanding our investments into behavioral health facilities and we may determine in the future to expand our investments to include medical office buildings, long-term acute care hospitals and inpatient rehabilitation facilities. As we acquire, or invest in, additional properties, we expect to further diversify by geography, asset class and tenant within the healthcare and healthcare-related sectors. We may invest in seniors housing managed communities operated by third-party property managers pursuant to property management agreements utilizing the structure proposed in the REIT Investment Diversification and Empowerment Act of 2007, which is commonly referred to as a “RIDEA” structure. The seniors housing managed communities structure would give us direct exposure to the risks and benefits of the operations of the communities. The third-party property managers would manage our communities in exchange for the receipt of a management fee, and as such, we would not be directly exposed to the credit risk of the property managers in the same manner or to the same extent as our triple-net tenants. Under this management structure, we would be required to rely on a third-party operator to hire and train all facility employees, enter into third-party contracts for the benefit of the facility, comply with laws, and provide resident care and we would be substantially limited in our ability to control or influence day-to-day operators.
Maintain Balance Sheet Strength and Liquidity. We maintain a capital structure that provides the resources and flexibility to support the growth of our business. We intend to maintain a mix of credit facility debt, unsecured debt and possibly secured mortgage debt, which, together with our anticipated ability to complete future equity financings, including issuances of our common stock via registered public offerings or under an at-the-market equity program, we expect will fund the growth of our property portfolio.
Develop New Tenant Relationships. We cultivate new relationships with tenants and healthcare providers in order to expand the mix of tenants operating our properties. We expect that this objective will be achieved over time as part of our overall strategy to acquire new properties and further diversify our portfolio of healthcare properties.
Provide Capital to Underserved Operators. We believe there is a significant opportunity to be a capital source to healthcare operators, through the acquisition and leasing of healthcare properties to them that are consistent with our investment and financing strategy at appropriate risk-adjusted rates of return, which, due to size and other considerations, are not a focus for larger healthcare REITs. We pursue acquisitions and strategic opportunities that meet our investing and financing strategy and that are attractively priced, including funding development of properties through preferred equity or construction loans and thereafter entering into sale and leaseback arrangements with such developers as well as other secured term financing and mezzanine lending. We utilize our management team’s operating experience, network of relationships and industry insight to identify both large and small quality operators in need of capital funding for future growth. In appropriate circumstances, we may negotiate with operators to acquire individual healthcare properties from those operators and then lease those properties back to the operators pursuant to long-term triple-net leases.
Fund Strategic Capital Improvements. We support operators by providing capital to them for a variety of purposes, including capital expenditures and facility modernization. We expect to structure these investments as either lease amendments that produce additional rents or as loans that are repaid by operators during the applicable lease term. We have also assisted our
tenants with transitioning to lower emissions technologies through our tenant incentive program, where we support efficiency projects through our dedicated tenant capital expenditure budget, providing sustainability incentives rent-free.
Pursue Strategic Development Opportunities. We work with operators and developers to identify strategic development opportunities. These opportunities may involve replacing or renovating facilities that may have become less competitive. We also identify new development opportunities that present attractive risk-adjusted returns. We may provide funding to the developer of a property in conjunction with entering into a sale leaseback transaction or an option to enter into a sale leaseback transaction for the property.
Competition
We compete for real property investments with other REITs, investment companies, private equity and hedge fund investors, sovereign funds, pension funds, healthcare operators, lenders and other institutional investors. Some of these competitors are significantly larger and have greater financial resources and lower costs of capital than us. Increased competition will make it more challenging to identify and successfully capitalize on acquisition opportunities that meet our investment objectives. Our ability to compete is also impacted by national and local economic trends, availability of investment alternatives, availability and cost of capital, construction and renovation costs, existing laws and regulations, new legislation and population trends.
In addition, revenues from our properties are dependent on the ability of our tenants and operators to compete with other healthcare operators. Healthcare operators compete on a local and regional basis for residents and patients and their ability to
successfully attract and retain residents and patients depends on key factors such as the number of facilities in the local market, the types of services available, the quality of care, reputation, age and appearance of each facility and the cost of care in each locality. Private, federal and state payment programs and the effect of other laws and regulations may also have a significant impact on the ability of our tenants and operators to compete successfully for residents and patients at the properties.
Sustainability and Corporate Social Responsibility
As a healthcare-focused REIT,triple-net landlords, our assets are an integral part of the overall healthcare continuumcore responsibility lies in the communities thattracking, educating, and incentivizing our tenants, serve.who hold decision-making authority at the property level, to make sustainable and financially prudent business decisions. We believe that environmental sustainability is an important part of our commitment to helping people live and age well in those communities.communities. We are workingcommitted to implement sustainable practices in our corporate offices and to provideproviding tenant education, support and incentives to make sustainable improvements at our net-leased properties.
In 2022,2023, we published our secondthird annual Corporate ResponsibilitySustainability Report (our “ESG Report”) as part of our ongoing commitment to provide regular reporting on our environmental, social and governance (“ESG”) priorities. Our ESG Report outlines our high priority ESG initiatives and goals for our company and our property portfolio. In our 2022 ESG Report, we included a Global Reporting Initiative (“GRI”) Index in reference to the GRI Standards as well as a Task Force on Climate-Related Financial Disclosures (“TCFD”) index to further align with applicable global standards for sustainability reporting.
DuringBeginning in 2020, with the assistance of Conservice ESG, ouran ESG consultant, we designed a monitoring plan to collect key environmental data from a pilot group of 50 of our net-leased properties. The plan’s objective was to begin benchmarkingbenchmark energy and water usage and the impact of our facilities on greenhouse gas emissions and climate change. During 2021, we implemented the plan’s monitoring systems and began collecting data for this pilot group of 50 properties, increasing to almost 100 properties by the end of 2022.2023. During 2023, we added waste tracking for the 100 properties. We expect the data to help us identify the most promising opportunities for improvement in our portfolio, set informed ESG goals and measure progress over time. In addition, as a landlord and capital supplier to a key segment of the healthcare industry, we willintend to seek further opportunities to encourage and incentivize fair and healthy work environments for healthcare workers and suitable living conditions for patients and residents, and to promote diversity, inclusion and the ethical treatment of employees, residents, patients and others wherever our activities and influence can be felt.
During 2023, we partnered with a third party to conduct a portfolio level physical climate risk assessment on all standing assets. Physical risks assessed were heat, flood, precipitation, fire, and drought. In the overall portfolio physical climate risk assessment, four risk categories were defined with a portfolio risk percentage provided for each category, addressing each physical risk. The climate risk assessment found that the highest risk for our portfolio was heat caused by higher temperatures.
During 2023, we distributed a Tenant Climate Risk-Opportunity Survey and received a 50% response rate. This survey helped contribute to ESG dialogue with tenants and overall improved our risk management strategy. The survey found transitional risks for our tenants due to transitioning to a low carbon economy including increased material costs, volatility in utilities’ pricing, market preference for greener buildings, and higher insurance premiums.
Also in 2020, we published our Tenant Code of Conduct & Corporate Responsibility (our “Tenant ESG Program”). The Tenant ESG Program provides our eligible triple-net tenants with monetary inducements to make sustainable improvements to our properties. Incentive options include a wide variety of opportunities for tenants to upgrade everything from energy and
environmental systems to water-saving landscaping and more. Our board of directors has authorized annual allocations of up to $500,000 to fund the Tenant ESG Program. As disclosed in our 2022 ESG Report, we tracked $260,000$567,304 in environmental improvements at our properties from August 2021September 2022 to October 2022.
In 2022, we created and implemented an ESG checklist to be used to review new potential acquisitions. The checklist will help our team better identify and address ESG-related risk and opportunities in each potential acquisition including how tenant-operators can track utility energy and water usage, whether properties are in parts of the country where the U.S. Department of Energy has helped enable energy data for benchmarking purposes and how tenants can grow, develop and enhance their own ESG policies. In addition, we created and implemented an ESG training program to train all employees on our ESG commitments to increase awareness.September 2023.
The foregoing principles and additional ESG initiatives are reflected in our Environmental, Social and Governance policy adopted on October 29, 2021, and previously published Policy on Human Capital, Policy on Human Rights and Responsibilities, Policy on Environmental Sustainability and our proprietary Tenant ESG Program. All of these policies are located on the Investor Relations section of our website at www.caretrustreit.com. The information found on, or otherwise accessible through, our website is not incorporated by reference into, nor does it form a part of, this report or any other document that we file with the SEC.
Governance
Our corporate governance structure was carefully crafted to align with the interests of our investors and other stakeholders with a core leadership team that has over 65 years of collective experience as operators and investors. The members of our board of directors each bring deep expertise in healthcare, real estate, investing, accounting, and/or business development. In this oversight role, our board of directors serves as the ultimate decision-making body of our company, except for those matters reserved to or shared with our stockholders.
Human Capital Resources
Our employees are the heart of our company. Our Policy on Human Capital reflects our commitment to the dignity and rights of all people, especially our employees and others whose professional lives may be impacted by our properties and business activities. It represents a critical commitment to, and investment in, the current and long-term health and well-being of
our organization and its people. We believe our success depends on our ability to attract, develop and retain key personnel.
During 2023, we conducted an employee satisfaction survey with a 100% response rate and an overall satisfaction rate of 86%. The survey found that 70% or more employees agree that our comprehensive benefits package is very competitive and a strong point of working for CareTrust, employees are highly committed to their future at CareTrust, and that CareTrust has a culture that values inclusivity.
CareTrust invests significant time and resources in supporting and developing our employees and creating a desirable workplace. Our core philosophies and policies in this regard include:
Compensation and Benefits. The skills, experience and industry knowledge of key employees significantly benefit our performance. We believe we offer competitive compensation (including salary, incentive bonus and equity) and benefits packages (including a 401(k) plan with a fixed employer contribution, Flexible Spending Accounts (FSAs), employer-funded employee assistance program (EAP), a generous vacation, holiday and personal time off policy, and an array of voluntary benefits options and other benefits for employees and their families). Our compensation program is designed to attract and reward talented individuals who possess the skills necessary to support our business objectives, assist in the achievement of our strategic goals and create long-term value for our stockholders.
As of December 31, 2022,2023, we employed 1517 full-time employees (including our executive officers), none of whom is subject to a collective bargaining agreement. AtOur comprehensive benefits package includes flexible work hours, the onset of the COVID-19 pandemic, we temporarily closed our corporate officeoption to work remotely, and most of our employees were working remotely; however, we have since reopened our corporate office with continued workforce flexibility to promote employee safety.company workspaces/amenities.
Retention and Turnover. Recruiting, hiring, training and retaining excellent employees is a high priority for us. These activities carry real and substantial costs, which we regard as a meaningful investment in our workforce and our company. We believe that employee turnover is costly in direct and indirect ways, and we are committed to employee retention and satisfactionsatisfac.tion. During the year ended December 31, 2022,2023, we experienced turnover of onethree full-time employee,employees, excluding our executive officers. In addition, during the year ended December 31, 2022, we transitioned the role of our Chief Executive Officer from Mr. Stapley to Mr. Sedgwick, effective January 1, 2022, and our Chief Investment Officer from Mr. Lamb to Mr. Callister, effective December 31, 2022.
Training and Education. CareTrust’s culture values continuous learning, improvement and professional development. This helps our employees to keep their skills current and to adapt to new responsibilities and emerging market needs. CareTrust provides financial support for professional associate dues and memberships, continuing education credits, and fees and travel expenses to attend relevant conferences and seminars.
Government Regulation, Licensing and Enforcement
Overview
As operators of healthcare facilities, tenants of our healthcare properties are typically subject to extensive and complex federal, state and local healthcare laws and regulations relating to fraud and abuse practices, government reimbursement, licensure and certificate of need and similar laws governing the operation of healthcare facilities, and we expect that the healthcare industry, in general, will continue to face significant regulation and pressure in the areas of fraud, waste and abuse,
cost control, healthcare management and provision of services, among others. These regulations are wide-ranging and can subject our tenants to civil, criminal and administrative sanctions. Affected tenants may find it increasingly difficult and costly to comply with this complex and evolving regulatory environment because of a relative lack of guidance in many areas as certain of our healthcare properties are subject to oversight from several government agencies and the legal requirements often vary from one jurisdiction to another. Changes in laws and regulations and reimbursement enforcement activity and regulatory non-compliance by our tenants could have a significant effect on their operations and financial condition, which in turn may adversely affect us, as detailed below and set forth under “Risk Factors -— Risks Related to Our Business.Business and Operations.”
The following is a discussion of certain laws and regulations generally applicable to our tenants (as operators of our healthcare facilities) and, in certain cases, to us.
Enforcement
There are various extremely complex federal and state laws and regulations governing healthcare providers’ relationships and arrangements and prohibiting fraudulent and abusive practices by such providers. These laws include, but are not limited to, (i) federal and state false claims acts, which, among other things, prohibit providers from filing false claims or making false statements to receive payment from Medicare, Medicaid or other federal or state healthcare programs, (ii) federal and state anti-kickback and fee-splitting statutes, including the Medicare and Medicaid anti-kickback statute, which prohibit the payment or receipt of remuneration to induce referrals or recommendations of healthcare items or services, (iii) federal and state provider self-referral laws (including the federal law commonly referred to as the “Stark Law”), which generally prohibit referrals by physicians and in some cases other providers to entities with which the physician or an immediate family member has a financial relationship, and (iv) the federal Civil Monetary Penalties Law, which prohibits, among other things, the knowing presentation of a false or fraudulent claim for certain healthcare services. Violations of healthcare fraud and abuse laws carry civil, criminal and administrative sanctions, including punitive sanctions, monetary penalties, imprisonment, denial of Medicare and Medicaid reimbursement and potential exclusion from Medicare, Medicaid or other federal or state healthcare programs. These laws are enforced by a variety of federal, state and local agencies and can also be enforced by private litigants through,
among other things, federal and state false claims acts, which allow private litigants to bring qui tam or “whistleblower” actions. Ensign and our other tenants are (and many of our future tenants are expected to be) subject to these laws, and some of them may in the future become the subject of governmental enforcement actions if they fail to comply with applicable laws.
•State and Federal “Fraud and Abuse” Laws and Regulations. The Medicare and Medicaid anti-fraud and abuse amendments to the Social Security Act (the “Anti-Kickback Law”) make it a felony, subject to certain exceptions, for any person to engage in illegal remuneration arrangements with vendors, physicians and other health care providers for the referral of Medicare beneficiaries or Medicaid recipients. When a violation occurs, the government may proceed criminally or civilly. If the government proceeds criminally, a violation is a felony and may result in imprisonment for up to five years, fines of up to $25,000 and mandatory exclusion from participation in all federal health care programs. If the government proceeds civilly, it may impose a civil monetary penalty of $50,000 per violation and an assessment of not more than three times the total amount of remuneration involved, and it may exclude the parties from participation in all federal health care programs. Violations of the Anti-Kickback Statute also serve as a basis for federal False Claims Act cases. Many states have enacted laws similar to, and in some cases broader than, the Anti-Kickback Law.
The scope of prohibited payments in the Anti-Kickback Law is broad. The U. S.U.S. Department of Health and Human Services (“HHS”) has promulgated regulations which describe certain “safe harbor” arrangements that will not be deemed to constitute violations of the Anti-Kickback Law. An arrangement that fits squarely into a safe harbor is immune from prosecution under the Anti-Kickback Statute. The safe harbors described in the regulations are narrow and do not cover a wide range of economic relationships which many SNFs, physicians and other health care providers consider to be legitimate business arrangements not prohibited by the statute. Because the regulations describe safe harbors and do not purport to describe comprehensively all lawful and unlawful economic arrangements or other relationships between health care providers and referral sources, health care providers entering into these arrangements or relationships may be required to alter them in order to ensure compliance with the Anti-Kickback Law and may be subject to significant liability should an arrangement that does not fully satisfy a safe harbor be determined to be illegal. On November 20, 2020, HHS promulgated significant new Anti-Kickback Law regulations, including changes to existing safe harbors and the creation of new safe harbors, in an effort to reduce regulatory burden and incentivize coordinated care, including value-based arrangements.
The False Claims Act provides that any person who “knowingly presents, or causes to be presented” a “false or fraudulent claim for payment or approval” to the U.S. government, or its agents and contractors, is liable for a civil penalty ranging from $5,500 to $11,000 per claim, plus three times the amount of damages sustained by the government. Under the False Claims Act’s so-called “reverse false claims,” liability also could arise for “using” a false record or statement to “conceal,” “avoid” or “decrease” an “obligation” (which can include the retention of an overpayment) “to pay or transmit money or property to the government.” The False Claims Act also empowers and
provides incentives to private citizens (commonly referred to as qui tam relator or whistleblower) to file suit on the government’s behalf. The qui tam relator’s share of the recovery can be between 15% and 25% in cases in which the government intervenes, and 25% to 30% in cases in which the government does not intervene. Notably, the Affordable Care Act amended certain jurisdictional bars to the False Claims Act, effectively narrowing the “public disclosure bar” (which generally requires that a whistleblower suit not be based on publicly disclosed information) and expanding the “original source” exception (which generally permits a whistleblower suit based on publicly disclosed information if the whistleblower is the original source of that publicly disclosed information), thus potentially broadening the field of potential whistleblowers.
•Restrictions on Referrals. The federal physician self-referral law and its implementing regulations (commonly referred to as the “Stark Law”) prohibits providers of “designated health services” from billing Medicare or Medicaid if the patient is referred by a physician (or his/her immediate family member) with a financial relationship with the entity, unless an exception applies. “Designated health services” include clinical laboratory services; physical therapy services; occupational therapy services; outpatient speech-language pathology; radiology services, including magnetic resonance imaging, computerized axial tomography scans, and ultrasound services; radiation therapy services and supplies; durable medical equipment and services; parenteral and enteral nutrients, equipment and services; prosthetics, orthotics, and prosthetic devices and supplies; home health services; outpatient prescription drugs; and inpatient and outpatient hospital services. The Stark Law also prohibits the furnishing entity from submitting a claim for reimbursement or otherwise billing Medicare or any other person or entity for improperly referred designated health services. Many designated health services are commonly provided in SNFs and ALFs. The new regulations promulgated by HHS, discussed above in “State and Federal ‘Fraud and Abuse’ Laws and Regulations”, include significant changes to the Stark Law regulations, including (i) new exceptions designed to enable more value-based arrangements, (ii) a modification to the existing exception for electronic health records items and services, and (iii) new exceptions for limited remuneration to physicians and for cybersecurity technology and related services.
An entity that submits a claim for reimbursement in violation of the Stark Law must refund any amounts collected and may be: (1) subject to a civil penalty of up to $15,000 for each self-referred service; and (2) excluded from participation in federal health care programs. In addition, a physician or entity that has participated in a “scheme” to circumvent the operation of the Stark Law is subject to a civil penalty of up to $100,000 and possible exclusion from participation in federal health care programs.
Reimbursement
Sources of revenue for our tenants include (and for our future tenants is expected to include), among other sources, governmental healthcare programs, such as the federal Medicare program and state Medicaid programs, and non-governmental payors, such as insurance carriers and health maintenance organizations. As federal and state governments focus on healthcare reform initiatives, and as the federal government and many states face significant budget deficits, efforts to reduce costs by these payors will likely continue, which may result in reduced or slower growth in reimbursement for certain services provided by Ensign and our other tenants. Federal and state authorities are likely to continue to implement new and modified reimbursement methodologies, including value-based methodologies, that could have a negative impact on our tenants. Such changes to reimbursement methodologies could have a material impact on our tenants and we cannot provide assurances that the current revenue levels will be maintained under any future reimbursement arrangements. In addition, the impact of other health care reform efforts, such as “Medicare for all” or the provision of a new Medicare-like public option for consumers to receive health insurance, are impossible to predict.
The Patient Protection and Affordable Care Act, as amended by the Health Care and Education Reconciliation Act of 2010 (collectively, the “Affordable Care Act”) serves as the primary vehicle for comprehensive healthcare reform in the United States. Efforts initiated by the previous administration and certain members of Congress to repeal or make significant changes to the Affordable Care Act, its implementation and/or its interpretation including the successful repeal of the penalty associated with the individual mandate of the Affordable Care Act, continue to cast uncertainty on the future of the Affordable Care Act. For example, on December 14, 2018, a U.S. District Court in Texas ruled the Affordable Care Act unconstitutional in its entirety. This decision was appealed, and on December 18, 2019, the Fifth Circuit Court of Appeals ruled that the Affordable Care Act’s individual mandate was unconstitutional but remanded the case for further analysis. The decision was appealed, and on June 17, 2021, the Supreme Court of the United States ruled that the plaintiffs lacked standing to challenge the Affordable Care Act’s minimum essential coverage provision. These types of challenges may impact the number of individuals that elect to obtain public or private health insurance or the scope of such coverage, if purchased.
Given the divided nature of Congress, it is unclear whether Congress will successfully expand health insurance coverage and assess alternative health care delivery and payment systems. The Republican Party currently controls the United States House of Representatives (by a slim majority) and the Democratic Party currently controls the Senate (by a slim majority). Due
to this, healthcare reform legislation would likely require at least some support from both Republican and Democratic lawmakers to become law and it is uncertain whether any healthcare reform legislation will ultimately become law. We cannot predict the ultimate content, timing or effect of any healthcare reform legislation or the impact of potential legislation on our business. If our tenants’ residents do not have insurance, it could adversely impact the tenants’ ability to satisfy their obligations to us. Expansion of health insurance coverage to more citizens could have a positive financial impact on our tenants and their ability to satisfy their obligations to us.
Other legislative changes have been proposed and adopted since the Affordable Care Act was enacted, which also may impact our business. For instance, CMS is required to measure, track, and publish readmission rates of SNFs and to implement a value-based purchasing program for SNFs (the “SNF VBP Program”). The SNF VBP Program increases Medicare reimbursement rates for SNFs that achieve certain levels of quality performance measures developed by CMS, relative to other facilities. The value-based payments authorized by the SNF VBP Program are funded by reducing Medicare payment for all SNFs by 2% and redistributing up to 70% of those funds to high-performing SNFs. However, there is no assurance that payments made by CMS as a result of the SNF VBP Program will be sufficient to cover a facility’s costs. If Medicare reimbursement provided to our healthcare tenants is reduced under the SNF VBP Program, that reduction may have an adverse impact on the ability of our tenants to meet their obligations to us.
See “Risk Factors -— Risks Related to Our Business -and Operations — Healthcare reform legislation impacts cannot accurately be predicted and could adversely affect our results of operations” for additional risks related to changes in Medicare reimbursement.
Increased Government Oversight of Skilled Nursing Facilitiesand Transparency
Section 1150B of the Social Security Act requires employees of federally funded long-term care facilities to immediately report any reasonable suspicion of a crime committed against a resident of that facility. Those reports must be submitted to at least one law enforcement agency and the applicable Centers for Medicare & Medicaid Services (“CMS”) Survey Agency. Covered individuals who fail to report under Section 1150B are subject to various penalties, including civil monetary penalties of up to $300,000 and possible exclusion from participation in any Federal health care program. Medicare regulations require
SNFs to establish and implement written policies to ensure the reporting of crimes that occur in federally funded SNFs in accordance with Section 1150B.
In August 2017, the HHS Office of Inspector General (“OIG”) issued a preliminary report regarding quality of care concerns by operators of SNFs. In its report, the OIG determined that CMS has inadequate procedures in place to ensure that incidents of potential abuse or neglect of Medicare beneficiaries residing in SNFs are identified and reported. The report was issued in connection with the OIG’s ongoing review of potential abuse and neglect of Medicare beneficiaries residing in SNFs.
As a result of the OIG report, CMS enforcement activity against SNF operators may increase, especially with regard to the reporting of potential abuse or neglect of SNF residents. If any of our tenants or their employees are found to have violated any applicable reporting requirements, they may become subject to penalties or other sanctions up to and including loss of licensure.
In November 2023, CMS adopted a final rule implementing certain portions of the Affordable Care Act, requiring the disclosure of certain ownership, managerial, and other information regarding Medicare SNFs and Medicaid nursing facilities. This final rule defines the term “real estate investment trust,” which sets the stage for Medicare SNFs to disclose whether each direct or indirect owning or managing entity is a real estate investment trust. This may enable CMS and others to scrutinize more closely how direct and indirect ownership and management correlate with care outcomes and to determine which environments are more likely to deliver better care for residents and patients.
Healthcare Licensure and Certificate of Need
Our healthcare facilities are subject to extensive federal, state and local licensure, certification and inspection laws and regulations. In addition, various licenses and permits are required to operate SNFs and ALFs, dispense narcotics, operate pharmacies, handle radioactive materials and operate equipment. Many states require certain healthcare providers to obtain a certificate of need, which requires prior approval for the construction, modification and closure of certain healthcare facilities. The ability to obtain such approval and/or the approval process may impact some of our tenants’ abilities to expand or change their businesses. Any failure to comply with any of these laws, regulations, or standards could result in penalties which may include loss or restriction of license, loss of accreditation, denial of reimbursement, imposition of fines, suspension or decertification from federal and state healthcare programs, or closure of the facility.
Privacy, Security and Data Breach Notification Laws
The Health Insurance Portability and Accountability Act of 1996, as amended (“HIPAA”) regulates the privacy and security of certain health information (“Protected Health Information”) and requires entities subject to HIPAA to provide notification of breaches of Protected Health Information. Entities subject to HIPAA include health plans, healthcare
clearinghouses, and most health care providers (including many of our tenants). Business associates of these entities who create, receive, maintain or transmit Protected Health Information are also subject to HIPAA. Violations of the HIPAA requirements may result in civil monetary penalties of up to $50,000 per violation with a maximum civil penalty of $1.5 million in a calendar year for violations of the same requirement. However, a single breach or incident can result in violations of multiple requirements, resulting in possible penalties well in excess of $1.5 million. Breaches of unsecured Protected Health Information and other violations of HIPAA may have other material adverse consequences including material loss of business, business interruption, loss of patient or other critical data, regulatory enforcement, substantial legal liability and reputational harm. Certain violations of HIPAA can result in criminal penalties and enforcement.
Various other state and federal laws relate to privacy, security and the reporting of data breaches involving personal information (together with HIPAA, “Privacy Laws”). For example, various state laws and regulations may regulate the privacy and security of personal information, and require notification of affected individuals in the event of a data breach involving such individual’s personal information (including an individual’s name plus social security number, date of birth or credit card information, for example). Failure of the Company or its tenants to comply with applicable Privacy Laws could have a materially adverse effect on our Company. Failure of our tenants to comply with applicable Privacy Laws could have a material adverse effect on their ability to meet their obligations to us. Furthermore, the adoption of new Privacy Laws at the federal and state level could require us or our tenants to incur significant compliance costs.
Americans with Disabilities Act (the “ADA”)
Although most of our properties are not required to comply with the ADA because of certain “grandfather” provisions in the law, some of our properties must comply with the ADA and similar state or local laws to the extent that such properties are “public accommodations,” as defined in those statutes. These laws may require removal of barriers to access by persons with disabilities in certain public areas of our properties where such removal is readily achievable. Under our triple-net lease structure, our tenants would generally be responsible for additional costs that may be required to make our facilities ADA-compliant. Noncompliance with the ADA could result in the imposition of fines or an award of damages to private litigants.
Environmental Matters
A wide variety of federal, state and local environmental and occupational health and safety laws and regulations affect healthcare facility operations. These complex federal and state statutes, and their enforcement, involve a myriad of regulations, many of which involve strict liability on the part of the potential offender. Some of these federal and state statutes may directly impact us. Under various federal, state and local environmental laws, ordinances and regulations, an owner of real property, such as us, may be liable for the costs of removal or remediation of hazardous or toxic substances at, under or disposed of in connection with such property, as well as other potential costs relating to hazardous or toxic substances (including government
fines and damages for injuries to persons and adjacent property). The cost of any required remediation, removal, fines or personal or property damages and the owner’s liability therefore could exceed or impair the value of the property and/or the assets of the owner. In addition, the presence of such substances, or the failure to properly dispose of or remediate such substances, may adversely affect the owner’s ability to sell or rent such property or to borrow using such property as collateral which, in turn, could reduce our revenues. See “Risk Factors - General Risk Factors - Environmental compliance costs and liabilities may materially impair the value of properties owned by us.”
Labor and Employment Matters
A wide variety of federal, state and local labor and employment laws and regulations impact healthcare facility operations. Our tenants are required to comply with all applicable federal, state and local laws and regulations relating to employment, including occupational safety and health requirements, minimum staffing, wage and hour laws, overtime and other compensation requirements, employee benefits and other leave and sick pay requirements, proper classification of workers as employee or independent contractors, and immigration and equal employment opportunity laws, among others. These laws and regulations can vary significantly among jurisdictions, can change, and can be highly technical and involve strict liability for noncompliance with technical detail. Costs and expenses related to these requirements are a significant operating expense and may increase as laws and regulations change. For example, on October 13, 2023, California Senate Bill No. 525 (“SB 525”) was signed into law, requiring a substantial increase in the minimum wage for workers operating in certain health care facilities. As a result of SB 525, certain health care facilities (including licensed skilled nursing facilities) operating in California are required to increase the wages of their covered health care employees to at least $21 per hour from June 1, 2024 to May 31, 2026, $22 or $23 per hour (depending on facility type) from June 1, 2026 to May 31, 2028, and $25 per hour after June 1, 2028.
REIT Qualification
We elected to be taxed as a REIT for U.S. federal income tax purposes beginning with our taxable year ended December 31, 2014. Our qualification as a REIT will depend upon our ability to meet, on a continuing basis, various complex
requirements under the Internal Revenue Code of 1986, as amended (the “Code”), relating to, among other things, the sources of our gross income, the composition and values of our assets, our distribution levels to our stockholders and the concentration of ownership of our capital stock. We believe that we are organized in conformity with the requirements for qualification and taxation as a REIT under the Code and that our manner of operation has and will enable us to continue to meet the requirements for qualification and taxation as a REIT.
The Operating Partnership
We own substantially all of our assets and properties and conduct our operations through the Operating Partnership. We believe that conducting business through the Operating Partnership provides flexibility with respect to the manner in which we structure the acquisition of properties. In particular, an UPREIT structure enables us to acquire additional properties from sellers in tax deferred transactions. In these transactions, the seller would typically contribute its assets to the Operating Partnership in exchange for units of limited partnership interest in the Operating Partnership (“OP Units”). Holders of OP Units will have the right, after a 12-month holding period, to require the Operating Partnership to redeem any or all of such OP Units for cash based upon the fair market value of an equivalent number of shares of CareTrust REIT’s common stock at the time of the redemption. Alternatively, we may elect to acquire those OP Units in exchange for shares of our common stock on a one-for-one basis. The number of shares of common stock used to determine the redemption value of OP Units, and the number of shares issuable in exchange for OP Units, is subject to adjustment in the event of stock splits, stock dividends, distributions of warrants or stock rights, specified extraordinary distributions and similar events. The Operating Partnership is managed by our wholly owned subsidiary, CareTrust GP, LLC, which is the sole general partner of the Operating Partnership and owns one percent of its outstanding partnership interests. As of December 31, 2022,2023, CareTrust REIT is the only limited partner of the Operating Partnership, owning 99% of its outstanding partnership interests, and we have not issued OP Units to any other party.
The benefits of our UPREIT structure include the following:
•Access to capital. We believe the UPREIT structure provides us with access to capital for refinancing and growth. Because an UPREIT structure includes a partnership as well as a corporation, we can access the markets through the Operating Partnership issuing equity or debt as well as the corporation issuing capital stock or debt securities. Sources of capital include possible future issuances of debt or equity through public offerings or private placements.
•Growth. The UPREIT structure allows stockholders, through their ownership of common stock, and the limited partners, through their ownership of OP Units, an opportunity to participate in future investments we may make in additional properties.
•Tax deferral. The UPREIT structure provides property owners who transfer their real properties to the Operating Partnership in exchange for OP Units the opportunity to defer the tax consequences that otherwise would arise from a sale of their real properties and other assets to us or to a third party. As a result, this structure allows us to acquire assets in a more efficient manner and may allow us to acquire assets that the owner would otherwise be unwilling to sell because of tax considerations.
Insurance
We maintain, or require in our leases that our tenants maintain, all applicable lines of insurance on our properties and their operations. The amount and scope of insurance coverage provided by our policies and the policies maintained by our tenants is customary for similarly situated companies in our industry. However, we cannot assure you that our tenants will maintain the required insurance coverages, and the failure by any of them to do so could have a material adverse effect on us. We also cannot assure you that we will continue to require the same levels of insurance coverage under our leases, including the Ensign Master Leases, that such insurance will be available at a reasonable cost in the future or that the insurance coverage provided will fully cover all losses on our properties upon the occurrence of a catastrophic event, nor can we assure you of the future financial viability of the insurers.
Available Information
We file annual, quarterly and current reports, proxy statements and other information with SEC. The SEC maintains an internet site that contains these reports, and other information about issuers, like us, which file electronically with the SEC. The address of that site is http://www.sec.gov. We make available our reports on Form 10-K, 10-Q, and 8-K (as well as all amendments to these reports), and other information, free of charge, on the Investor Relations section of our website at www.caretrustreit.com. The information found on, or otherwise accessible through, our website is not incorporated by reference into, nor does it form a part of, this report or any other document that we file with the SEC.
ITEM 1A. Risk Factors
Risks Related to Our Business and Operations
We are dependent on the healthcare operators that lease our properties to successfully operate their businesses and make contractual lease payments, and an event that materially and adversely affects their business, financial position or results of operations could materially and adversely affect our business, financial position or results of operations.
Because all of ourthe properties we own, except for one SNF which is non-operational, are operated by our tenants pursuant to triple-net master leases (including properties we own through joint ventures), we are unable to directly implement strategic business decisions regarding the daily operation and marketing of these properties. While we have rights as the property owner under our triple-net leases and monitor our tenants’ and operators’ performance, we may have limited recourse under our master leases if we believe that a tenant or operator is not performing adequately, and any failure by a tenant to effectively conduct its operations or to maintain and improve our properties could adversely affect its business reputation and its ability to attract and retain residents in our properties, which in turn, could adversely affect their ability to make rental payments to us and otherwise adversely affect our results of operations, including our ability to repay our outstanding indebtedness or our ability to pay dividends to our stockholders as required to maintain our REIT status. Additionally, because each master lease is a triple-net lease, we depend on our tenants to pay all insurance, taxes, utilities and maintenance and repair expenses and to indemnify, defend and hold us harmless from and against various claims, litigation and liabilities arising in connection with their business. There can be no assurance that our tenants will have sufficient assets, income and financing to enable them to satisfy their contractual lease payment or indemnification obligations.obligations and our tenants have in the past, and may in the future, fail to make rent payments when due, or our tenants may declare bankruptcy.
Ensign leases or provides a guaranty forfor a significant portion of our properties. As of December 31, 2022,2023, properties leased to Ensign represented $66.2represented $67.8 million, or 35%33%, of total annualized contractual rental income, and properties leased to Pennant under thethe Pennant Master Lease for which Ensign provides a guaranty (the “Pennant Guaranty”) represented $7.1$7.3 million, or 4%, of total annualized contractual rental income. income. Ensign’s inability or unwillingness to meet its lease obligations or its obligations pursuant to the Pennant Guaranty could materially adversely affect our business, financial position or results of operations. In addition, Ensign’s inability to satisfy its other lease obligations including payment of insurance, taxes and utilities, could materially and adversely affect the condition of the properties leased to Ensign as well as Ensign’s business, financial position and results of operations. Accordingly, if Ensign were to experience a material and adverse effect on its business, financial position or results of operations, our business, financial position or results of operations could also be materially and adversely affected.
Further, our dependence on Ensign’s rental payments for a substantial portion of our rental income may limit our ability to enforce our rights under the Ensign leases or the Pennant Guaranty or to terminate the Ensign leases. Ensign’s failure to comply with its lease obligations or its obligations pursuant to the Pennant Guaranty, or with federal and state healthcare laws and regulations to which the leased properties are subject, could require us to find another lessee for such leased properties and result in a decrease in or cessation of rental payments. In such event, we may be unable to locate a suitable lessee at similar rental rates or at all, which would reduce our rental income.
We are subject to risks associated with public health crises, including the COVID-19 pandemic and other pandemics or epidemics.
We are subject to risks associated with public health crises and government measures to prevent the spread of infectious diseases, including the global health concerns related to the COVID-19 pandemic. The COVID-19 pandemic has adversely impacted and is likely to further adversely impact nearly all aspects of our business. Other public health crises, including any future epidemics or pandemic, could result in similar adverse impacts on our business, results of operations, cash flows and financial condition. Risks to our business that have been associated with the COVID-19 pandemic, and may be associated with future COVID-19 outbreaks or other public health crises, include:
•one or more of our tenants or borrowers could experience deteriorating financial conditions and be unable or unwilling to pay rent on time and in full (which has, and could continue to result from, among other reasons (i) increased operating costs and staffing requirements related to compliance with Centers for Disease Control and Prevention (“CDC”) protocols, (ii) decreased occupancy rates, (iii) increased scrutiny by regulators, (iv) potential repayments of relief funds received by tenants, (v) nursing or other staffing shortages; or (vi) decisions by elderly individuals to avoid or delay entrance into assisted living and other long-term care facilities);
•the possibility we may have to restructure tenants’ obligations and may not be able to do so on terms that are favorable to us;
•the potential need to recognize asset impairment charges or credit losses on our loans receivable if we determine that the full amount of our investments are not recoverable;
•increased costs or delays that we have incurred, and may continue to incur, if we need to reposition or transition any of our currently-leased properties to another tenant or operator, which have adversely impacted, and may continue to adversely impact, our revenues and results of operations;
•risks related to lawsuits and regulatory enforcement actions related to pandemic outbreaks involving us, our tenants, operators or borrowers, including increases in the costs of business, negative publicity and/or further decreases in occupancy and/or profitability at our facilities;
•the expiration, or lack of enforcement, of liability immunity for health care providers in relation to a qualified pandemic under the Public Readiness and Emergency Preparedness Act (the “PREP Act”);
•complete or partial closures of, or other operational issues at, one or more of our properties resulting from government actions or directives;
•limitations on our access to capital and other sources of funding, which could adversely impact our ability to make new property investments;
•our ability to continue to make cash distributions to our stockholders commensurate with historical levels; and
•our ability to repay outstanding debt or maintain compliance with covenants under our Second Amended Credit Facility (as defined below) and the indenture governing our Notes.
The extent to which the COVID-19 pandemic, or other future health crises, may impact our business, results of operations, cash flows and financial condition depends on many factors which are highly uncertain and are difficult to predict. These factors include, but are not limited to, the duration and spread of any outbreak, the timing, distribution and efficacy of vaccines and other treatments, Unites States and foreign government actions to respond to the outbreak, and how quickly and to what extent normal operation conditions can resume.
Unstable market and economic conditions may have serious adverse consequences on our business, results of operations and financial condition.
Global credit and financial markets have experienced extreme volatility and disruptions over the past several months,years, including declines in consumer confidence, concerns about declines in economic growth, increases in the rate of inflation, increases in borrowing rates and changes in liquidity and credit availability, and uncertainty about economic stability, including most recently in connection with actions undertaken by the U.S. Federal Reserve Board to address inflation, the military conflictconflicts in Ukraine and Gaza, the continuing effects of the COVID-19 pandemic and supply chain disruptions. ThereWhile consumer sentiment is on the rise, concerns about declines in economic growth have faded and inflation has cooled there can be no assurance that further deterioration in credit and financial markets and confidence in economic conditions will not occur. Our general business strategy may be adversely affected by any such economic downturn, volatile business environment or continued unpredictable and unstable market conditions. In addition, increased costs due to inflationary conditions may have material adverse effects on the operating expenses of our tenants and their ability to meet their obligations to us and may also increase the costs for us to make capital improvements to our facilities.
Our business could also be adversely impacted by volatility caused by geopolitical events, such as the conflictconflicts in Ukraine.Ukraine and Gaza. A significant downturn in the economic activity may cause a reduction in spending on healthcare matters and our tenants may need to seek to lower their costs by renegotiating leases. Such reductions may disproportionately affect our revenue. In addition, if the current equity and credit markets deteriorate, or do not improve, it may make any necessary debt or equity financing more difficult, more costly, and more dilutive. Furthermore, our stock price may decline due in part to the volatility of the stock market and the general economic downturn.
Our tenants depend on reimbursement from government and other third-party payors and if reimbursement rates from such payors are reduced by future legislative reform, it could cause our tenants’ revenues to decline and could affect their ability to meet their obligations to us.
Sometimes, governmental payors freeze or reduce payments to healthcare providers, or provide annual reimbursement rate increases that are smaller than expected, due to budgetary and other pressures. Healthcare reimbursement will likely continue to be of significant importance to federal and state authorities. For example, the federal government and a number of states are currently managing budget deficits and, as a result, many states are focusing on the reduction of expenditures under their Medicaid programs, which may result in a freeze on Medicaid rates or a decrease in reimbursement rates for our tenants. The need to control Medicaid expenditures may be exacerbated by the potential for increased enrollment in Medicaid due to unemployment and declines in family incomes. These potential reductions could be compounded by the potential for federal cost-cutting efforts that could lead to reductions in reimbursement to our tenants under both the Medicaid and Medicare programs. Additionally, in July 2023, Medicare excluded marriage and family therapist services and mental health counselor services from SNF consolidated billing. While these services may still be billed by the clinicians providing the services, such services may not be covered under the SNFs Medicare Part A payment. While we cannot make any assessment as to the ultimate timing or the effect that any future legislative reforms may have on our tenants’ costs of doing business and on the amount of reimbursement by government and other third-party payors, potential reductions in Medicaid and Medicare reimbursement, or in non-governmental third-party payor reimbursement, to our tenants could reduce the revenues of our tenants and their ability to meet their obligations to us.
Bankruptcy, insolvency or financial deterioration of our tenants could delay or prevent collection of unpaid rents or require us to find new tenants.
We receive substantially all of our income as rental payments under leases of properties we own directly or through our properties.joint ventures. We have no control over the success or failure of our tenants’ businesses and, at any time, any of our tenants may experience a downturn in its business that may weaken its financial condition. As a result, our tenants have in the past, and may in the future, fail to make rent payments when due, or our tenants may declare bankruptcy. Tenant bankruptcies or failures to make rent payments when due could result in termination of the tenant’s lease and could have a material adverse effect on our business, financial condition and results of operations and our ability to make distributions to our stockholders (which could adversely affect our ability to raise capital or service our indebtedness). This risk is magnified where we lease multiple properties to a single tenant, such as Ensign.
If a tenant is unable to comply with the terms of its lease, we may be forced to write off unpaid amounts due to us from the tenant, move to a cash basis method of accounting for recognizing rental income from the tenant or otherwise modify the tenant’s lease in ways that are unfavorable to us. Alternatively, failure of a tenant to perform under a lease could require us to declare a default, repossess the property, find a suitable replacement tenant, hire third-party managers to operate the property or sell the property. See Note 2, Summary of Significant Accounting Policies and Note 3, Real Estate Investments, Net for further information.
If one or more of our tenants files for bankruptcy relief, the U.S. Bankruptcy Code provides that a debtor has the option to assume or reject the unexpired lease within a certain period of time. Any bankruptcy filing by or relating to one of our tenants could bar all efforts by us to collect pre-bankruptcy debts from that tenant or seize its property. A tenant bankruptcy could also delay our efforts to collect past due balances under the leases and could ultimately preclude collection of all or a portion of these sums. It is possible that we may recover substantially less than the full value of any unsecured claims we hold, if any, which may have a material adverse effect on our business, financial condition and results of operations, and our ability to make distributions to our stockholders.
Replacement tenants or operators may be difficult to identify and we may be required to incur substantial renovation costs to make our healthcare properties suitable for such tenants or operators.
If our tenants terminate or do not renew their leases with us, we would attempt to reposition the properties with another tenant or operator. Rental payments on such properties could decline or cease altogether while we reposition the properties with a suitable replacement tenant or operator and we may be required to fund certain expenses and obligations (e.g., real estate taxes, debt costs and maintenance expenses) to preserve the value of, and avoid the imposition of liens on, such properties while they are being repositioned.
Healthcare facilities are typically highly customized and may not be easily adapted to non-healthcare-related uses. The improvements generally required to conform a property to healthcare use, such as upgrading electrical, gas and plumbing infrastructure and security, are costly and at times tenant-specific. A new or replacement tenant may require different features in a property, depending on that tenant’s particular operations. If a current tenant is unable to pay rent and vacates a property, we may incur substantial expenditures to modify a property before we are able to secure another tenant. Supply chain volatility and labor shortages may increase these construction costs. In addition, approvals of local authorities for any required modifications
and/or renovations may be necessary, resulting in delays in transitioning a facility to a new tenant. These expenditures or renovations and delays could materially and adversely affect our business, financial condition or results of operations.
In addition, we may fail to identify suitable replacements or enter into leases or other arrangements with new tenants or operators on a timely basis or on terms as favorable to us as our current leases, if at all. If we experience a significant number of properties not under a lease due to the inability to find suitable replacement tenants or successfully reposition the property, our operating expenses could increase significantly. Even after a suitable replacement tenant or operator has taken over operation of a property, it may still take an extended period of time before such property is fully repositioned and value restored, if at all. Any of these results could have a material adverse effect on our business, financial condition and results of operations and our ability to make distributions to stockholders.
We have and may in the future incur impairment charges, which could negatively impact our results of operations.
At each reporting period, we evaluate our real estate investments and other assets for impairment indicators whenever events or changes in circumstances indicate that the carrying amount of the assets may not be recoverable. The existence of impairment indicators is based on factors such as market conditions, operating performance and legal structure. If we determine that an impairment has occurred, we are required to adjust the net carrying value of the asset, which could have a material adverse effect on our results of operations in the period in which the write-off occurs. For example, in the twelve months ended December 31, 2023, we recorded impairment charges of approximately $36.3 million.
The geographic concentration of some of our facilities could leave us vulnerable to an economic downturn, regulatory changes or acts of nature in those areas.
As a result of the concentration of our properties in California Texas, Louisiana, Idaho and ArizonaTexas as described in “Portfolio Summary” under Item 1 of this Annual Report on Form 10-K, the conditions of local economies and real estate markets, including increases in real estate taxes, changes in governmental rules, regulations and reimbursement rates or criteria, changes in demographics, state funding, acts of nature, the impacts of climate change and other factors that may result in a decrease in demand and/or reimbursement for skilled nursing services in these states could have a disproportionately adverse effect on our tenants’ revenue, costs and results of operations, which may affect their ability to meet their obligations to us.
Our facilities located in Texas and Louisianacertain other states in the southeast are especially susceptible to natural disasters such as hurricanes, tornadoes and flooding and our facilities located in California are particularly susceptible to natural disasters such as fires, earthquakes
and mudslides. These types of natural disasters will likely increase in number, scope and intensity as a result of climate change. Further, these acts of nature may cause disruption to our tenants, their employees and our facilities, which could have an adverse impact on our tenants’ patients and businesses. In order to provide patient care, our tenants are dependent on consistent and reliable delivery of food, pharmaceuticals, utilities and other goods to our facilities, and the availability of employees to provide services at the facilities. If the power supply, delivery of goods or the ability of employees to reach our facilities is interrupted in any material respect due to a natural disaster or other reasons, it would have a significant impact on our facilities and our tenants’ businesses at those facilities. Furthermore, the impact, or impending threat, of a natural disaster may require that our tenants evacuate one or more facilities, which would be costly and would involve risks, including potentially fatal risks, for the patients at such facilities. The impact of disasters and similar events is inherently uncertain. Such events could harm our tenants’ patients and employees, severely damage or destroy one or more of our facilities, harm our tenants’ business, reputation, financial condition and financial performance, or otherwise cause our tenants’ businesses to suffer in ways that we currently cannot predict.
In addition, to the extent that significant changes in the climate occur in areas where our properties are located, we may experience extreme weather, and changesincluding higher temperatures, increases in precipitation, fire, drought and temperature,flood, all of which may result in physical damage to or a decrease in demand for properties located in these areas or affected by these conditions. Based on our overall portfolio physical climate risk assessment, we found that the highest climate risk for our portfolio was heat caused by higher temperatures, which may result in higher operating and energy costs for our tenants and higher capital costs for resiliency measures for us and our tenants to maintain the property and its value. Should the impact of climate change be material in nature, including destruction or degradation of our properties, or occur for lengthy periods of time, our financial condition or results of operations may be adversely affected. Increased costs to our tenants to maintain the properties and take appropriate resiliency measures could harm the financial condition and financial performance of our tenants. In addition, changes in federal and state legislation and regulation on climate change could result in increased capital expenditures to improve the energy efficiency of our existing properties and could also require us to spend more on our new development properties without a corresponding increase in revenue.
We are subject to risks associated with public health crises, including significant COVID-19 outbreaks as well as other pandemics or epidemics.
We are subject to risks associated with public health crises and government measures to prevent the spread of infectious diseases, including the global health concerns related to the COVID-19 pandemic. The COVID-19 pandemic adversely
impacted nearly all aspects of our business. Public health crises, including significant COVID-19 outbreaks and any future epidemics or pandemic, could result in similar adverse impacts on our business, results of operations, cash flows and financial condition. Risks to our business that have been associated with the COVID-19 pandemic, and may be associated with future COVID-19 outbreaks or other public health crises, include:
•one or more of our tenants or borrowers could experience deteriorating financial conditions and be unable or unwilling to pay rent on time and in full (which has, and could continue to result from, among other reasons (i) increased operating costs and staffing requirements related to compliance with Centers for Disease Control and Prevention (“CDC”) protocols, (ii) decreased occupancy rates, (iii) increased scrutiny by regulators, (iv) potential repayments of relief funds received by tenants, (v) nursing or other staffing shortages; or (vi) decisions by elderly individuals to avoid or delay entrance into assisted living and other long-term care facilities);
•the possibility we may have to restructure tenants’ obligations and may not be able to do so on terms that are favorable to us;
•the potential need to recognize asset impairment charges or credit losses on our loans receivable if we determine that the full amount of our investments are not recoverable;
•increased costs or delays that we have incurred, and may continue to incur, if we need to reposition or transition any of our currently-leased properties to another tenant or operator, which have adversely impacted, and may in the future adversely impact, our revenues and results of operations;
•risks related to lawsuits and regulatory enforcement actions related to pandemic outbreaks involving us, our tenants, operators or borrowers, including increases in the costs of business, negative publicity and/or further decreases in occupancy and/or profitability at our facilities;
•the expiration, or lack of enforcement, of certain liability immunity for health care providers in relation to a qualified pandemic under the Public Readiness and Emergency Preparedness Act (the “PREP Act”);
•complete or partial closures of, or other operational issues at, one or more of our properties resulting from government actions or directives;
•limitations on our access to capital and other sources of funding, which could adversely impact our ability to make new property investments;
•our ability to continue to make cash distributions to our stockholders commensurate with historical levels; and
•our ability to repay outstanding debt or maintain compliance with covenants under our Second Amended Credit Facility (as defined below) and the indenture governing our Notes.
The extent to which the COVID-19 pandemic, or other future health crises, may impact our business, results of operations, cash flows and financial condition depends on many factors which are highly uncertain and are difficult to predict. These factors include, but are not limited to, the duration and spread of any outbreak, the timing, distribution and efficacy of vaccines and other treatments, Unites States and foreign government actions to respond to the outbreak, the extent of disruption to our business and the business of our tenants and borrowers, and how quickly and to what extent normal operation conditions can resume.
We pursue property acquisitions and seek strategic opportunities in the ordinary course of our business, which may result in significant usage of management resources or costs, and we may not fully realize the potential benefits of such transactions.
We regularly review, evaluate, engage in discussions regarding, and pursue acquisitions of properties and seek other strategic opportunities in the ordinary course of business in order to maximize stockholder value. We may devote a significant amount of our management resources to, and incur significant costs in connection with, such transactions, which may not result in definitive agreements or the completion of any transaction and could negatively impact our operations. In addition, there is no assurance that we will fully realize the potential benefits of any past or future acquisition or strategic transaction.
Additionally, from time to time, we may invest in preferred equity interests in joint ventures. Our use of joint ventures may be subject to risks that may not be present with other ownership methods. Our joint ventures may involve property development, which presents additional risks that could render a development project less profitable or not profitable at all and, under certain circumstances, may prevent completion of development activities once undertaken.
If we cannot identify and purchase a sufficient quantity of suitable properties at favorable prices or if we are unable to finance acquisitions on commercially favorable terms, or at all, our business, financial position or results of operations could be materially and adversely affected. Furthermore, any future acquisitions may require the issuance of securities, the incurrence of debt, assumption of contingent liabilities or incurrence of significant expenditures, each of which could materially adversely impact our business, financial condition or results of operations. Additionally, the fact that we must distribute 90% of our REIT taxable income in order to maintain our qualification as a REIT may limit our ability to rely upon rental payments from our leased properties or subsequently acquired properties in order to finance acquisitions. As a result, if debt or equity financing is not available on acceptable terms, further acquisitions might be limited.
Investments through joint ventures involve risks not present in investments in which we are the sole investor.
We have invested, and may continue to invest, as a joint venture partner in joint ventures. Such investments may involve risks not otherwise present when acquiring real estate directly, including for example:
•the joint venture partner(s) may at any time have economic or business interests or goals which are or which may become inconsistent with our business interests or goals, including inconsistent goals relating to the sale of properties held in the joint venture or the timing of termination or liquidation of the joint venture;
•the possibility that the joint venture partner(s) might become insolvent or bankrupt;
•the possibility that we may incur liabilities as a result of an action taken by the joint venture partner(s);
•joint ventures may share certain approval rights over major decisions;
•a joint venture partner may be in a position to take action contrary to our instructions or requests or contrary to our policies or objectives, including our policy with respect to qualifying and maintaining our qualification as a REIT;
•our ability to sell or transfer our interest in the joint ventures on advantageous terms when we so desire may be limited or restricted under the terms of our agreements with the counterparties in the joint ventures;
•we may be required to contribute additional capital if the counterparties in the joint ventures fail to fund their share of required capital contributions;
•disputes between us and a joint venture partner may result in litigation or arbitration that would increase our expenses and distract our officers and directors from focusing their time and effort on our business and result in subjecting the properties owned by the applicable joint venture to additional risk; or
•under certain joint venture arrangements, neither joint venture partner may have the power to control the venture, and an impasse could be reached which might have a negative influence on the joint venture.
In the future, our joint ventures may also involve property development, which presents additional risks that could render a development project less profitable or not profitable at all and, under certain circumstances, may prevent completion of development activities once undertaken.
Increased competition has resulted and may further result in lower net revenues for some of our tenants and may affect their ability to meet their financial and other contractual obligations to us.
The healthcare industry is highly competitive. The occupancy levels at, and results of operations from, our facilities are dependent on our ability and the ability of our tenants to compete with other tenants and operators on a number of different levels, including the quality of care provided, reputation, the physical appearance of a facility, price, the range of services offered, family preference, amenities, alternatives for healthcare delivery, the supply of competing properties, physicians, staff, referral sources, location, and the size and demographics of the population in the surrounding area. Operating expenses such as food, utilities, taxes, insurance, labor costs (including due to minimum wage laws) and rent or debt service continue to increase. In addition, our tenants face an increasingly competitive labor market for skilled management personnel and nurses together with Medicaid reimbursement in some states that does not cover the full cost of caring for residents. Significant turnover, or a shortage of nurses or other trained personnel or general inflationary pressures on wages, may force tenants to enhance pay and benefits packages to compete effectively for skilled personnel, or to use more expensive contract personnel, but they may be unable to offset these added costs by increasing the rates charged to residents. Any increase in labor costs and other property operating expenses or any failure by our tenants to attract and retain qualified personnel could reduce the revenues of our tenants and their ability to meet their obligations to us.
Our tenants also compete with numerous other companies providing similar healthcare services or alternatives such as home health agencies, life care at home, community-based service programs, retirement communities and convalescent centers. We cannot be certain that our tenants will be able to achieve occupancy and rate levels, or manage their expenses, in a way that
will enable them to meet all of their obligations to us. Further, many competing companies may have resources and attributes that are superior to those of our tenants. They may encounter increased competition that could limit their ability to maintain or attract residents or expand their businesses or to manage their expenses, either of which could adversely affect their ability to meet their obligations to us, potentially decreasing our revenues, impairing our assets, and/or increasing our collection and dispute costs.
In addition, if development of seniors housing facilities outpaces demand for those assets in markets in which we are located, those markets may become saturated and our seniors housing tenants and operators could experience decreased occupancy, which may affect their ability to meet their financial and other contractual obligations to us.
Required regulatory approvals can delay or prohibit transfers of our healthcare properties, which could result in periods in which we are unable to receive rent for such properties.
Our tenants that operate SNFs and other healthcare facilities must be licensed under applicable state law and, depending upon the type of facility, certified or approved as providers under the Medicare and/or Medicaid programs. Prior to the transfer of the operations of such healthcare properties to successor operators, the new operator generally must become licensed under state law and, in certain states, receive change of ownership approvals under certificate of need laws (which provide for a
certification that the state has made a determination that a need exists for the beds located on the property) and, if applicable, file for a Medicare and Medicaid change of ownership. Upon termination or expiration of existing leases, delays or the failure of the new tenant in receiving regulatory approvals from the applicable federal, state or local government agencies, may prolong the period during which we are unable to collect rent and the property may experience performance declines. We could also incur substantial additional expenses in connection with any licensing, receivership or change of ownership proceedings.
We may not be able to sell properties when we desire because real estate investments are relatively illiquid, which could materially and adversely affect our business, financial position or results of operations.
Real estate investments are generally illiquid. As a result, we may be unable to vary our portfolio promptly in response to changes in the real estate market. A downturn in the real estate market could materially and adversely affect the value of our properties and our ability to sell such properties for acceptable prices or terms. We also cannot predict the length of time needed to find a willing purchaser and to close the sale of a property or portfolio of properties. These factors and any others that would impede our ability to respond to adverse changes in the performance of our properties could materially and adversely affect our business, financial position or results of operations and our ability to pay dividends and make distributions.
We or our tenants may experience uninsured or underinsured losses, which could result in a significant loss of the capital we have invested in a property, decrease anticipated future revenues or cause us to incur unanticipated expenses.
Our lease agreements require that the tenant maintain general and professional liability insurance and comprehensive liability and hazard insurance. However, there are certain types of losses (including, but not limited to, losses arising from environmental conditions or of a catastrophic nature, such as earthquakes, wildfires, hurricanes and floods) that may be uninsurable or not economically insurable. In addition, insurance coverage may be insufficient to pay the full current market value or replacement cost of any loss. Inflation, changes in tort liability laws, changes in building codes and ordinances, environmental considerations, and other factors also might make it infeasible to use insurance proceeds to protect a tenant in a liability claim or replace a property after such property has been damaged or destroyed. Under such circumstances, the insurance proceeds received might not be adequate to restore the economic position with respect to such tenant or property.
If one of our tenants experiences a material general or professional liability loss that is uninsured or exceeds policy coverage limits, it may be unable to satisfy its lease payment obligations to us. If one of our properties experiences a loss that is uninsured or that exceeds policy coverage limits, we could lose the capital invested in the damaged property as well as the anticipated future cash flows from the property.
In addition, even if damage to our properties is covered by insurance, business disruptions caused by a casualty event may result in lost revenue for our tenants or us for which insurance may not fully compensate them or us for such loss of revenue. If one of our tenants experiences such a loss, it may be unable to satisfy its lease payment obligations to us.
We are, and may continue to be, exposed to contingent rent escalators, which could hinder our profitability and growth.
We derive revenue primarily by leasing our assets under long-term triple-net leases with rental rates that, subject to certain limitations, are generally fixed with annual rent escalations contingent on changes in the Consumer Price Index, subject to maximum fixed percentages. If the Consumer Price Index does not increase, our revenues may not increase. In addition, if economic conditions resultresult in significant increases in the Consumer Price Index, but the escalations under our leases are capped, our growth and profitability also may be limited.
Cybersecurity incidents or other damage to the information systems and technology of us or our tenants could harm our business.
We rely on information technology networks, enterprise and other cloud-based applications and other information systems to process, transmit and store electronic information, and to manage and support our business processes, including financial transactions and records, and to maintain personal information and tenant and lease data. We purchase some of our information technology, including software and cloud-based technology, from third party service providers, on whom we and our systems depend. While we have taken steps to protect the security of our information systems, we have, from time to time, experienced cybersecurity incidents of varying degrees, although none of these cyber incidents have had a material adverse impact on our business, financial condition or results of operations. The technology infrastructure and systems of some of our cloud solution and other third party service providers have also in the past experienced, and may in the future experience, cybersecurity incidents of varying degrees. Cybersecurity incidents can be caused by ransomware, computer denial-of-service attacks, worms, and other malicious software programs or other attacks, including the covert introduction of malware to computers and networks, and the use of techniques or processes that change frequently, may be disguised or difficult to detect, or are designed to remain dormant until a triggering event, and may continue undetected for an extended period of time. Cybersecurity incidents also result from social engineering or impersonation of authorized users as well as efforts to discover and exploit any design flaws, bugs, security vulnerabilities or security weaknesses, intentional or unintentional acts by employees or other insiders with access privileges, intentional acts of vandalism or fraud by third parties and sabotage. The risk
of cybersecurity incidents has generally increased as the number, intensity and sophistication of attacks and intrusions from around the world have increased.
We have engaged a third-party cybersecurity firm who serves as our dedicated information technology and cybersecurity team and helps us oversee, implement and manage our processes and controls to assess, identify and manage risks from cybersecurity threats. It is possible that our processes and controls will not detect or protect against all cybersecurity threats or incidents. In addition, any failure on the part of our outsourced cybersecurity team to effectively monitor and protect our information systems could make us more vulnerable to cybersecurity incidents. Our technology infrastructure and information systems are also vulnerable to damage or interruption from natural disasters, power loss and telecommunications failures. Failure to maintain proper function, security and availability of our information systems or the loss or misuse of the data maintained in those systems could interrupt our operations, damage our reputation, subject us to significant costs to respond and implement remediation measures and liability claims or regulatory penalties and could have a material adverse effect on our business, financial condition and results of operations.
Our tenants may also from time to time experience cybersecurity incidents or other damage or interruption to their information systems that disrupt their operations or result in the loss or misuse of confidential information or other sensitive or personal information. Any resulting financial impact to our tenants, including liability claims or regulatory penalties, costs to respond and implement remediation measures as well as operational consequences or business impacts resulting from any damage to their reputation or harm to their business relationships, could negatively impact the ability of our tenants to meet their financial and other contractual obligations to us, which could have a material adverse effect on our business, financial condition and results of operations.
Bank failures or other events affecting financial institutions could have a material adverse effect on our and our tenants’ liquidity, results of operations, and financial condition.
The failure of a bank, or events involving limited liquidity, defaults, non-performance, or other adverse conditions in the financial or credit markets impacting financial institutions, or concerns or rumors about such events, may adversely impact us, either directly or through an adverse impact on our tenants, operators, and borrowers. A bank failure or other event affecting financial institutions could lead to disruptions in our or our tenants’, operators’, and borrowers’ access to bank deposits or borrowing capacity, including access to letters of credit from certain of our tenants relating to lease obligations. In addition, in the event of a bank failure or liquidity crisis, our or our tenants’, operators’, and borrowers’ deposits in excess of the Federal Deposit Insurance Corporation (“FDIC”) limits may not be backstopped by the U.S. government, and banks or financial institutions with which we or our tenants, operators, and borrowers do business may be unable to obtain needed liquidity from other banks, government institutions, or by acquisition. Any adverse effects to our tenants’, operators’, or borrowers’ liquidity or financial performance could affect their ability to meet their financial and other contractual obligations to us, which could have a material adverse effect our business, results of operations, and financial condition.
Risks Related to Laws and Regulations
Healthcare reform legislation impacts cannot accurately be predicted and could adversely affect our results of operations.
We and the healthcare operators leasing our properties depend on the healthcare industry and are susceptible to risks associated with healthcare reform. Legislative proposals are introduced each year that would introduce major changes in the healthcare system, both nationally and at the state level. For example, we believe that efforts may be made to, among other things, transition Federal payment programs further in the direction of value based care, but we cannot predict whether or in what form any of these measures may be enacted, or what effect they would have on our business or the businesses of our tenants if enacted. Efforts may also be made to reduce the age at which individuals become eligible for Medicare, which could have an adverse impact on our tenants because Medicare sometimes reimburses long term care providers at rates lower than those paid by commercial payors. We also believeIn addition, the Biden Administration announced a focus on implementing minimum staffing requirements and increased inspections as part of nursing home reforms announced in the 2022 State of the Union Address, and in July 2022, CMS announced it was evaluating a proposed federal staffing mandate for SNFs. Specifically, CMS sought input on establishing minimum staffing requirements for long-term care facilities and issued updates to guidance on minimum health and safety standards that long-term care facilities must meet to participate in Medicare and Medicaid and updated and developed new guidance in the State Operations Manual to address issues that significantly affect residents of long-term care facilities. In September 2023, CMS issued the Minimum Staffing Standards for Long-Term Care Facilities and Medicaid Institutional Payment Transparency Reporting proposed rule, which, if implemented as written would establish minimum nurse staffing standards, RN on-site requirements and staffing assessment requirements. It is uncertain whether the proposed rule will be implemented as written and, if it is, whether it will be accompanied by additional resources may be dedicatedfunding to regulatory enforcement, which couldoffset any increased staffing requirements for our operators. If additional funding is unavailable at sufficient levels or at all, a mandate to increase our tenants’ costs of doing business and negatively impact their ability to pay their rent obligations to us. Additional stimulus funding for state and local governmentsstaffing levels in SNFs may have a positivematerial adverse effect on the operating results and financial condition of our tenants. We cannot predict whether any future legislative proposals will be adopted or, if adopted, the impact these proposals would have on our tenants because it may alleviate some pressures on state and local governments to reduce overall Medicaid expenditures.or our business.
Our tenants are subject to extensive federal, state and local laws and regulations affecting the healthcare industry that include those relating to, among other things, licensure, conduct of operations, ownership of facilities, addition of facilities and equipment, allowable costs, services, prices for services, qualified beneficiaries, quality of care, patient rights and insurance, fraudulent or abusive behavior, labor and employment issues and financial and other arrangements that may be entered into by healthcare providers. See “Government Regulation, Licensing and Enforcement” in Item 1 of this Annual Report on Form 10-K for more information. If our tenants or operators fail to comply with the laws, regulations and other requirements applicable to their businesses and the operation of our properties, they could become ineligible to receive reimbursement from governmental and private third-party payor programs, face bans on admissions of new patients or residents, suffer civil or criminal penalties or be required to make significant operational changes. The cost to comply with these laws, regulations and other requirements results in increased costs of doing business for our tenants and operators. For example, on October 13, 2023, California Senate Bill No. 525 (“SB 525”) was signed into law, requiring a substantial increase in the minimum wage for workers operating in certain health care facilities. As a result of SB 525, certain health care facilities (including licensed skilled nursing facilities) operating in California are required to increase the wages of their covered health care employees to at least $21 per hour from June 1, 2024 to May 31, 2026, $22 or $23 per hour (depending on facility type) from June 1, 2026 to May 31, 2028, and $25 per hour after June 1, 2028. If our tenants are unable to offset these increased costs, the operating results and financial condition of our tenants will be adversely impacted and they may be unable to satisfy their rent obligations to us.
We believe that additional resources may be dedicated to regulatory enforcement, which could further increase our tenants’ costs of doing business and negatively impact their ability to pay their rent obligations to us. Changes in enforcement policies by federal and state governments have also resulted in a significant increase in inspection rates, citations of regulatory deficiencies and sanctions, including terminations from Medicare and Medicaid programs, bars on Medicare and Medicaid payments for new admissions, civil monetary penalties and criminal penalties. Our tenants and operators could be forced to expend considerable resources responding to an investigation, lawsuit or other enforcement action under applicable laws or regulations. Additionally, if our tenants’ residents do not have insurance, it could adversely impact the tenants’ ability to satisfy their obligation to us. We cannot predict whether any future legislative proposals will be adopted or, if adopted, the impact these proposals would have on our tenants or our business.
Tenants that fail to comply with applicable requirements of governmental reimbursement programs, such as Medicare or Medicaid, may cease to operate or be unable to meet their financial and other contractual obligations to us.
Our tenants are subject to the following risks, among others, relating to governmental healthcare reimbursement programs: statutory and regulatory changes; retroactive rate adjustments; recovery of program overpayments or set-offs; administrative rulings; policy interpretations; payment or other delays by fiscal intermediaries or carriers; government funding restrictions (at a program level or with respect to specific facilities); and interruption or delays in payments due to any ongoing governmental investigations and audits.
We expect healthcare reimbursement will continue to be a significant focus for federal and state authorities in their cost control efforts. We cannot predict the timing or effects of any future legislative reforms on our tenants’ business costs or government and other third-party payor reimbursement. More generally, because of the dynamic nature of the legislative and regulatory environment for health care products and services, and in light of existing federal budgetary concerns, we cannot predict the impact that broad-based, far-reaching legislative or regulatory changes could have on the U.S. economy, our business or that of our operators and tenants. The failure of any of our tenants to comply with these laws, requirements and regulations could materially and adversely affect their ability to meet their financial and contractual obligations to us.
Government investigations and enforcement actions brought against the health care industry have increased dramatically over the past several years and are expected to continue, particularly in the area of Medicare/Medicaid false claims, as well as an increase in the intensity of enforcement actions resulting from these investigations. Some of these enforcement actions represent novel legal theories and expansions in the application of the False Claims Act.
Medicare, Medicaid and other governmental health care payors require reporting of extensive financial information in a specific format or content. These requirements are technical and complex and may not be properly implemented by billing or reporting personnel. For certain required information, False Claims Act violations may occur without any intent to defraud by mere negligence or recklessness in information submission to the government. New billing systems, medical procedures and procedures for which there is not clear guidance may all result in liability. In addition, violations of the Anti-Kickback Law or Stark Law and, for provider tenants who received pandemic relief funds, the failure to comply with terms and conditions related to receipt or repayment of those funds, may form the basis for a federal False Claims Act violation. See “Government Regulation, Licensing and Enforcement,” in Item 1 of this Annual Report on Form 10-K for more information.
Many states have adopted laws similar to the False Claims Act, some of which apply to claims submitted to private and commercial payors, not just governmental payors. Violations of such laws by an operator of a health care property could result in loss of accreditation, denial of reimbursement, imposition of fines, suspension or decertification from government healthcare programs, civil liability, and in certain limited instances, criminal penalties, loss of license or closure of the property and/or the incurrence of considerable costs arising from an investigation or regulatory action.
If we or our tenants fail to adhere to applicable privacy and data security laws, or experience a data security incident or breach, this could have a material adverse effect on us or on our tenants’ ability to meet their obligations to us.
We and our tenants are subject to HIPAA and various other state and federal laws that relate to privacy and data security, including the reporting of data breaches involving personal information as discussed in “Government Regulation, Licensing and Enforcement - Privacy, Security and Data Breach Notification Laws” in Item 1 of this Annual Report on Form 10-K. Failure by us or our tenants to comply with these requirements could have a materiallymaterial adverse effect on us and the ability of our tenants to meet their obligations to us. Furthermore, the adoption of new privacy, security and data breach notification laws at the federal and state level could require us or our tenants to incur significant compliance costs. In addition, the cost and operational consequences of responding to cybersecurity incidents anddata breaches and implementing remediation measures could be significant.
While we and our tenants maintain various security controls, there is a risk of data security incidents or breaches resulting from unintentional or deliberate acts by third parties or insiders attempting to obtain unauthorized access to information, destroy or manipulate data, or disrupt or sabotage information systems. The trend toward increased remote work and rapid implementation of telehealth within the health care industry in response to the COVID-19 pandemic may have created new or increased cyber risks. Cyber incidents range from individual attempts to gain unauthorized access to our IT systems to sophisticated attacks by hacking groups and nation-state actors. Information technology systems are a vital part of the business of our Company and our tenants, and a security incident or breach could result in a material loss of business, business interruption, loss of patient or other critical data, regulatory enforcement, substantial legal liability and reputational harm. Despite the deployment of commercially reasonable efforts and sophisticated techniques to prevent cyber incidents, information systems remain potentially vulnerable because the techniques used by hackers continue to evolve and are designed not to be detected. In fact, some unauthorized access may not be detected for an extended period of time. As a result, we or our tenants may suffer cybersecurity incidents where we or our tenants have implemented cybersecurity protections. A data security incident or breach occurring at or involving the Company could have a material adverse impact on our Company. Where the data security incident or breach occurs at or involves a tenant, this could jeopardize the tenant’s ability to fulfill its obligations to us.
Tenants that fail to comply with federal, state and local licensure, certification and inspection laws and regulations may cease to operate our healthcare facilities or be unable to meet their financial and other contractual obligations to us.
The healthcare operators to whom we lease properties are subject to extensive federal, state, local and industry-related licensure, certification and inspection laws, regulations and standards. Our tenants’ failure to comply with any of these laws, regulations or standards could result in adverse publicity and reputational harm as well as penalties which may include loss or restriction of license, loss of accreditation, denial of reimbursement, imposition of fines, suspension or decertification from federal and state healthcare programs, or closure of the facility. Though the regulatory environment in which SNFs operate is more restrictive than for ALFs, ALFs face similar penalties for noncompliance with applicable legal requirements. For example, operations at our properties may require a license, registration, certificate of need, provider agreement or certification. Failure of any tenant to obtain, or the loss or imposition of restrictions on any required license, registration, certificate of need, provider agreement or certification would prevent a facility from operating in the manner intended by such tenant. Additionally, failure of our tenants to generally comply with applicable laws and regulations could adversely affect facilities owned by us, result in adverse publicity and reputational harm, and therefore could materially and adversely affect us. See “Government Regulation, Licensing and Enforcement - Healthcare Licensure and Certificate of Need” in Item 1 of this Annual Report on Form 10-K for additional information.
Environmental compliance costs and liabilities may materially impair the value of properties owned by us.
Under various federal, state and local laws, ordinances and regulations, as a current or previous owner of real estate, we may be required to investigate and clean up certain hazardous or toxic substances or petroleum released at a property, and may be held liable to a governmental entity or to third parties for property damage and for investigation and cleanup costs incurred by the third parties in connection with the contamination. In addition, some environmental laws create a lien on the contaminated site in favor of the government for damages and the costs it incurs in connection with the contamination. Neither we nor our tenants carry environmental insurance on our properties. Contamination or the failure to remediate contamination may materially adversely affect our ability to sell or lease the real estate or to borrow using the real estate as collateral. As the owner of a site, we may also be held liable to third parties for damages and injuries resulting from environmental contamination emanating from the site. Although we generally require our tenants, as operators of our healthcare properties, to indemnify us
for environmental liabilities they cause, such liabilities could exceed the financial ability of the tenant to indemnify us or the value of the contaminated property. We may also experience environmental liabilities arising from conditions not known to us.
Risks Related to Our Status as a REIT
If we fail to qualify or remain qualified as a REIT, we will be subject to U.S. federal income tax as a regular corporation and could face substantial tax liability, which could adversely affect our ability to raise capital or service our indebtedness.
We currently operate, and intend to continue to operate, in a manner that will allow us to continue to qualify to be taxed as a REIT for U.S. federal income tax purposes. We elected to be taxed as a REIT for U.S. federal income tax purposes beginning with our taxable year ended December 31, 2014. We received an opinion of our counsel with respect to our qualification as a REIT in connection with becoming a public company. Investors should be aware, however, that opinions of advisors are not binding on the IRS or any court. The opinion of our counsel represents only the view of our counsel based on its review and analysis of existing law and on certain representations as to factual matters and covenants made by us, including representations relating to the values of our assets and the sources of our income. The opinion is expressed as of the date issued. Our counsel has no obligation to advise us or the holders of any of our securities of any subsequent change in the matters stated, represented or assumed or of any subsequent change in applicable law. Furthermore, both the validity of the opinion of our counsel and our qualification as a REIT will depend on our satisfaction of certain asset, income, organizational, distribution, stockholder ownership and other requirements on a continuing basis, the results of which will not be monitored by our counsel. Our ability to satisfy the asset tests depends upon our analysis of the characterization and fair market values of our assets, some of which are not susceptible to a precise determination, and for which we will not obtain independent appraisals.
If we fail to qualify to be taxed as a REIT in any year, we would be subject to U.S. federal income tax, including any applicable alternative minimum tax, on our taxable income at regular corporate rates, and dividends paid to our stockholders
would not be deductible by us in computing our taxable income. Any resulting corporate liability could be substantial and would reduce the amount of cash available for distribution to our stockholders, which could have an adverse impact on the value of our common stock. Unless we were entitled to relief under certain Code provisions, we also would be disqualified from re-electing to be taxed as a REIT for the four taxable years following the year in which we failed to qualify to be taxed as a REIT, which could adversely affect our financial condition and results of operations.
Legislative or other actions affecting REITs could have a negative effect on us.
The rules dealing with U.S. federal income taxation are constantly under review by persons involved in the legislative process and by the IRS and the U.S. Department of the Treasury (the “Treasury”). Changes to the tax laws or interpretations thereof, with or without retroactive application, could materially and adversely affect our investors or us. We cannot predict how changes in the tax laws, including any tax reform called for by the current presidential administration, might affect our investors or us. New legislation, Treasury regulations, administrative interpretations or court decisions could significantly and negatively affect our ability to qualify to be taxed as a REIT or the U.S. federal income tax consequences to our investors and us of such qualification. For instance, the “Tax Cuts and Jobs Act” (the “Act”) significantly changed the U.S. federal income tax laws applicable to businesses and their owners, including REITs and their shareholders. Technical corrections or other amendments to the Act or administrative guidance interpreting the Act may be forthcoming at any time. We cannot predict the long-term effect of the Act or any future law changes on REITs or their shareholders. Changes to the U.S. federal tax laws and interpretations thereof, whether under the Act or otherwise, could adversely affect an investment in our stock
No prediction can be made regarding whether new legislation or regulation (including new tax measures) will be enacted by legislative bodies or governmental agencies, nor can we predict what consequences would result from this legislation or regulation. Accordingly, no assurance can be given that the currently anticipated tax treatment of an investment will not be modified by legislative, judicial or administrative changes, possibly with retroactive effect.
We could fail to qualify to be taxed as a REIT if income we receive from our tenants is not treated as qualifying income.
Under applicable provisions of the Code, we will not be treated as a REIT unless we satisfy various requirements, including requirements relating to the sources of our gross income. Rents received or accrued by us from our tenants will not be treated as qualifying rent for purposes of these requirements if the leases are not respected as true leases for U.S. federal income tax purposes and are instead treated as service contracts, joint ventures or other arrangements. If the leases are not respected as true leases for U.S. federal income tax purposes, we will likely fail to qualify to be taxed as a REIT.
In addition, subject to certain exceptions, rents received or accrued by us from our tenants will not be treated as qualifying rent for purposes of these requirements if we or a beneficial or constructive owner of 10% or more of our stock beneficially or constructively owns 10% or more of the total combined voting power of all classes of stock entitled to vote or 10% or more of the total value of all classes of stock. CareTrust REIT’s charter provides for restrictions on ownership and transfer of CareTrust REIT’s shares of stock, including restrictions on such ownership or transfer that would cause the rents received or accrued by us from our tenants to be treated as non-qualifying rent for purposes of the REIT gross income
requirements. Nevertheless, there can be no assurance that such restrictions will be effective in ensuring that rents received or accrued by us from our tenants will not be treated as qualifying rent for purposes of REIT qualification requirements.
Dividends payable by REITs do not qualify for the reduced tax rates available for some dividends.
The maximum U.S. federal income tax rate applicable to income from “qualified dividends” payable by U.S. corporations to U.S. stockholders that are individuals, trusts and estates is currently 20%. Dividends payable by REITs, however, generally are not eligible for the reduced rates. However, for taxable years beginning after December 31, 2017 and before January 1, 2026, under the recently enacted Tax Cuts and Jobs Act, noncorporate taxpayers may deduct up to 20% of certain qualified business income, including "qualified REIT dividends" (generally, dividends received by a REIT shareholder that are not designated as capital gain dividends or qualified dividend income), subject to certain limitations, resulting in an effective maximum U.S. federal income tax rate of 29.6% on such income. Although these rules do not adversely affect the taxation of REITs, the more favorable rates applicable to regular corporate qualified dividends, together with the recently reduced corporate tax rate (currently, 21%), could cause investors who are individuals, trusts and estates to perceive investments in REITs to be relatively less attractive than investments in the stocks of non-REIT corporations that pay dividends, which could adversely affect the value of the stock of REITs, including our stock. Although these rules do not adversely affect the taxation of REITs, the more favorable rates applicable to regular corporate qualified dividends could cause investors who are individuals, trusts and estates to perceive investments in REITs to be relatively less attractive than investments in the stocks of non-REIT corporations that pay dividends, which could adversely affect the value of the stock of REITs, including our stock.
REIT distribution requirements could adversely affect our ability to execute our business plan.
We generally must distribute annually at least 90% of our REIT taxable income, determined without regard to the dividends paid deduction and excluding any net capital gains, in order for us to qualify to be taxed as a REIT (assuming that certain other requirements are also satisfied) so that U.S. federal corporate income tax does not apply to earnings that we
distribute. To the extent that we satisfy this distribution requirement and qualify for taxation as a REIT but distribute less than 100% of our REIT taxable income, determined without regard to the dividends paid deduction and including any net capital gains, we will be subject to U.S. federal corporate income tax on our undistributed net taxable income. In addition, we will be subject to a 4% nondeductible excise tax if the actual amount that we distribute to our stockholders in a calendar year is less than a minimum amount specified under U.S. federal income tax laws. We intend to make distributions to our stockholders to comply with the REIT requirements of the Code.
Our funds from operations are generated primarily by rents paid under leases with our tenants. From time to time, we may generate taxable income greater than our cash flow as a result of differences in timing between the recognition of taxable income and the actual receipt of cash or the effect of nondeductible capital expenditures, the creation of reserves or required debt or amortization payments. If we do not have other funds available in these situations, we could be required to borrow funds on unfavorable terms, sell assets at disadvantageous prices or distribute amounts that would otherwise be invested in future acquisitions in order to make distributions sufficient to enable us to pay out enough of our taxable income to satisfy the REIT distribution requirement and to avoid being subject to corporate income tax and the 4% excise tax in a particular year. These alternatives could increase our costs or reduce our equity.
Even if we remain qualified as a REIT, we may face other tax liabilities that reduce our cash flow.
Even if we remain qualified for taxation as a REIT, we may be subject to certain U.S. federal, state, and local taxes on our income and assets, including taxes on any undistributed income and state or local income, property and transfer taxes. For example, we may hold some of our assets or conduct certain of our activities through one or more taxable REIT subsidiaries (each, a “TRS”) or other subsidiary corporations that will be subject to U.S. federal, state, and local corporate-level income taxes as regular C corporations. In addition, we may incur a 100% excise tax on transactions with a TRS if they are not conducted on an arm’s-length basis. Any of these taxes would decrease cash available for distribution to our stockholders.
Complying with REIT requirements may cause us to forgo otherwise attractive acquisition opportunities or liquidate otherwise attractive investments.
To qualify as a REIT for U.S. federal income tax purposes, we must on an ongoing basis satisfy tests concerning, among other things, the sources of our income, the nature and diversification of our assets, the amounts we distribute to our stockholders and the ownership of our shares of beneficial interest. We may be required to make distributions to our stockholders at disadvantageous times or when we do not have funds readily available for distribution. Thus, compliance with the REIT requirements may hinder our ability to make certain attractive investments.
Complying with REIT requirements may limit our ability to hedge effectively and may cause us to incur tax liabilities.
The REIT provisions of the Code substantially limit our ability to hedge our assets and liabilities. Income from certain hedging transactions that we may enter into to manage risk of interest rate changes with respect to borrowings made or to be made to acquire or carry real estate assets does not constitute “gross income” for purposes of the 75% or 95% gross income
tests that apply to REITs, provided that certain identification requirements are met. For taxable years beginning after December 31, 2015, income from new transactions entered into to hedge the income or loss from prior hedging transactions, where the indebtedness or property which was the subject of the prior hedging transaction was extinguished or disposed of, will not constitute gross income for purposes of the 75% or 95% gross income tests. To the extent that we enter into other types of hedging transactions or fail to properly identify such transaction as a hedge, the income is likely to be treated as non-qualifying income for purposes of both of the gross income tests. As a result of these rules, we may be required to limit our use of advantageous hedging techniques or implement those hedges through a TRS. This could increase the cost of our hedging activities because the TRS may be subject to tax on gains or expose us to greater risks associated with changes in interest rates than we would otherwise want to bear. In addition, losses in the TRS will generally not provide any tax benefit, except that such losses could theoretically be carried back or forward against past or future taxable income in the TRS.
Risks Related to Our Capital Resources and Indebtedness
From time to time, we may have substantial indebtedness and we are able to incur significant additional indebtedness.
As of December 31, 2022,2023, we had approximately $725.0$600.0 million of indebtedness, consisting of $400.0 million representing our 3.875% Senior Notes due 2028 (the “Notes”), $200.0 million under our unsecured term loan credit facility (the “Term Loan”) and $125.0 million inno borrowings outstanding under our unsecured revolving credit facility (the “Revolving Facility”). High levels of indebtedness could have one or more of the following adverse consequences, among others: require us to dedicate a substantial portion of our cash flow from operations to make principal and interest payments on our indebtedness, thereby reducing our cash flow available to fund working capital, dividends, capital expenditures and acquisitions and other general corporate purposes; require us to maintain certain debt coverage and other financial ratios at specified levels, thereby reducing our financial flexibility; make it more difficult for us to satisfy our financial obligations, including the Notes and borrowings under the Second Amended Credit Facility (as defined below); increase our vulnerability to general adverse economic and
industry conditions or a downturn in our business; limit, along with the financial and other restrictive covenants in our indebtedness, our ability to borrow additional funds on favorable terms or at all to expand our business or ease liquidity constraints; limit our ability to refinance all or a portion of our indebtedness on or before maturity on the same or more favorable terms or at all; and require us to dispose of one or more of our properties at disadvantageous prices in order to service our indebtedness or to raise funds to pay such indebtedness at maturity.
In addition, failure to satisfy our obligations under the Notes or our other debt or to comply with the financial and other restrictive covenants contained in the indenture governing the Notes or the Second Amended Credit Agreement (as defined below), could result in an event of default, which could result in all of our debt becoming immediately due and payable and permit certain of our lenders to foreclose on our assets securing such debt. Further, our Second Amended Credit Agreement and the indenture governing the Notes permit us to incur substantial additional debt, including secured debt, subject to our compliance with certain financial covenants set forth in the Second Amended Credit Agreement and our ability to satisfy certain covenants in the indenture governing the Notes. See “Risk Factors - Risks Related to Our Capital Resources and Indebtedness - Covenants in our debt agreements restrict our activities and could adversely affect our business” for a summary of these covenants.
We may be unable to service our indebtedness.
Our ability to make scheduled payments on and to refinance our indebtedness depends on and is subject to our future financial and operating performance, which in turn is affected by general and regional economic, financial, competitive, business and other factors beyond our control, including the availability of financing in the international banking and capital markets. Our business may fail to generate sufficient cash flow from operations or future borrowings may be unavailable to us under the Second Amended Credit Facility or from other sources in an amount sufficient to enable us to service our debt, to refinance our debt or to fund our other liquidity needs. If we are unable to meet our debt obligations or to fund our other liquidity needs, we will need to restructure or refinance all or a portion of our debt. We may be unable to refinance such debt on commercially reasonable terms or at all. If we were unable to make payments or refinance our debt or obtain new financing under these circumstances, we would have to consider other options, such as asset sales, equity issuances and/or negotiations with our lenders to restructure such debt. The Second Amended Credit Agreement and the indenture governing the Notes restrict, and market or business conditions may limit our ability to take, these actions. Any debt restructuring or refinancing could be at higher interest rates and may require us to comply with more onerous covenants that could further restrict our business operations.
We rely on our subsidiaries for our operating funds.
We conduct our operations through subsidiaries and depend on our subsidiaries for the funds necessary to operate and repay our debt obligations, including funds transfers to us which are necessary to make the payments due under the Notes. The obligations under the Notes are fully and unconditionally guaranteed, jointly and severally, on an unsecured basis, by us and all of our existing and future subsidiaries (other than CTR Partnership, L.P. and CareTrust Capital Corp.) that guarantee obligations under the Second Amended Credit Facility. However, under certain circumstances, one or more of our subsidiaries
may be released from, or may not be required to provide, a guarantee of the Notes, and in such circumstances, will not be responsible for any obligations with respect to the Notes. Each of our subsidiaries is a distinct legal entity and has no obligation, contingent or otherwise, to transfer funds to us. In addition, the ability of our subsidiaries to transfer funds to us could be restricted by the terms of subsequent financings.
Covenants in our debt agreements restrict our activities and could adversely affect our business.
Our debt agreements contain covenants that limit our and our subsidiaries’ ability to engage in various transactions including, as applicable: incurring or guaranteeing additional secured and unsecured debt; creating liens on our and our subsidiaries’ assets; paying dividends or making other distributions on, redeeming or repurchasing capital stock; making investments or other restricted payments; entering into transactions with affiliates; engaging in non-healthcare related business activities; creating restrictions on the ability of our subsidiaries to pay distributions or other amounts to us; selling assets; effecting a consolidation or merger or selling all or substantially all of our assets; making acquisitions; and amending organizational documents.
These covenants limit our operational flexibility and could prevent us from taking advantage of business opportunities as they arise, growing our business or competing effectively. The Second Amended Credit Agreement requires us to comply with financial maintenance covenants to be tested quarterly and also contains customary events of default, including the failure to make timely payments under the Second Amended Credit Facility or other material indebtedness, failure to satisfy certain covenants (including financial maintenance covenants), the occurrence of a change of control and specified events of bankruptcy and insolvency. Our ability to meet these requirements may be affected by events beyond our control and, if we fail to do so, we may be unable to obtain waivers from the lenders or amend the covenants.
Increases in interest rates could increase our existing and future debt borrowing costs and adversely affect our stock price.
Certain of our existing debt obligations require interest and related payments to vary with the movement of certain indices, such as the Secured Overnight Financing Rate, and we may incur additional indebtedness in connection with new credit facilities or financing of acquisitions or development activities. Increased interestInterest rates in recent years have increased, and may continue to increase, our interest costs for any new debt and our obligations under our Revolving Facility and Term Loan, which could make acquisition financings more costly or lower our current period earnings. Rising interest rates could limit our ability to refinance existing debt when it matures or cause us to pay higher interest rates upon refinancing. In addition, interest rate increases could decrease credit access globally, thereby decreasing the amount others are willing to pay for our assets and limiting our ability to reposition our portfolio promptly in response to changes in economic or other conditions. Further, the dividend yield on our common stock, as a percentage of the price of such common stock, will influence the price of such common stock. Thus, an increase in market interest rates may lead prospective purchasers of our common stock to expect a higher dividend yield, which could adversely affect the market price of our common stock.
Our Second Amended Credit Agreement uses Secured Overnight Financing Rate (“SOFR”), as a reference rate for our Term Loan and Revolving Facility, such that the interest rate applicable to such loans may, at our option, be calculated based on SOFR. The publication of SOFR began in April 2018, and, therefore, it has a very limited history. In addition, the future performance of SOFR cannot be predicted based on its limited historical performance. Future levels of SOFR may bear little or no relation to the historical actual or historical indicative data. Prior observed patterns, if any, in the behavior of market variables and their relation to SOFR, such as correlations, may change in the future. Because only limited historical data has been released by the Federal Reserve Bank of New York, such analysis inherently involves assumptions, estimates and approximations. The future performance of SOFR is impossible to predict and therefore no future performance of SOFR may be inferred from any of the historical actual or historical indicative data. Hypothetical or historical performance data are not indicative of, and have no bearing on, the potential performance of SOFR or any SOFR-linked notes.
SOFR is a relatively new rate, and the Federal Reserve Bank of New York (or a successor) or CME Group Benchmark Administration Ltd., as administrator of SOFR, may make methodological or other changes that could change the value of SOFR, including changes related to the methods by which SOFR is calculated, eligibility criteria applicable to the transactions used to calculate SOFR, or the averages or periods used to report SOFR. The administrator of SOFR may withdraw, modify, amend, suspend or discontinue the calculation or dissemination of SOFR in its sole discretion and without notice and has no obligation to consider the interests of holders of SOFR debt in calculating, withdrawing, modifying, amending, suspending or discontinuing SOFR.
As a result, we may experience volatility or increases in interest rates on our variable rate debt, which could adversely impact our interest expense, results of operations and cash flows.
A credit rating downgrade could impair our ability to obtain additional debt financing on favorable terms, if at all, and significantly reduce the trading price of our common stock.
Our credit rating can affect the amount, type and terms of capital financings we obtain. Factors affecting our credit rating include, among others, our financial performance, success in raising sufficient equity capital, adverse changes in our debt and
fixed charge coverage ratios, our capital structure, level of indebtedness and future changes in the regulatory framework applicable to our operators and industry. We may be unable to maintain our current credit ratings, and in the event that our current credit ratings deteriorate, a ratings agency downgrades our credit rating or places our rating under watch or review for possible downgrade, we would likely incur higher borrowing costs, which would make it more difficult or expensive to obtain additional financing or refinance existing obligations and commitments and the trading price of our common stock may decline.
Risks Related To Our Common Stock and Organizational Documents
Our charter restricts the ownership and transfer of our outstanding stock, which may have the effect of delaying, deferring or preventing a transaction or change of control of our company.
In order for us to qualify to be taxed as a REIT, not more than 50% in value of our outstanding shares of stock may be owned, beneficially or constructively, by five or fewer individuals at any time during the last half of each taxable year after our first taxable year as a REIT. Additionally, at least 100 persons must beneficially own our stock during at least 335 days of a taxable year (other than our first taxable year as a REIT). Our charter, with certain exceptions, authorizes our board of directors to take such actions as are necessary and desirable to preserve our qualification as a REIT. Our charter also provides that, unless exempted by the board of directors, no person may own more than 9.8% in value or in number of shares, whichever is more restrictive, of the outstanding shares of our common stock, or more than 9.8% in value of the outstanding shares of all classes or series of our stock. The constructive ownership rules are complex and may cause shares of stock owned directly or constructively by a group of related individuals or entities to be constructively owned by one individual or entity. These ownership limits could delay or prevent a transaction or a change in control of us that might involve a premium price for shares of our stock or otherwise be in our stockholders’ best interests. The acquisition of less than 9.8% of our outstanding stock by an individual or entity could cause that individual or entity to own constructively in excess of 9.8% in value of our outstanding stock, and thus violate our charter’s ownership limit. Our charter also prohibits any person from owning shares of our stock that would result in our being “closely held” under Section 856(h) of the Code or otherwise cause us to fail to qualify to be taxed as a REIT. In addition, our charter provides that (i) no person shall beneficially or constructively own shares of stock to the extent such beneficial or constructive ownership of stock would result in us failing to qualify as a “domestically controlled qualified investment entity” within the meaning of Section 897(h) of the Code, and (ii) no person shall beneficially or constructively own shares of stock to the extent such beneficial or constructive ownership would cause us to own, beneficially or constructively, more than a 9.9% interest (as set forth in Section 856(d)(2)(B) of the Code) in a tenant of our real property. Any attempt to own or transfer shares of our stock in violation of these restrictions may result in the transfer being automatically void.
Maryland law and provisions in our charter and bylaws may inhibit our stockholders from realizing a premium on their stock by delaying or preventing takeover attempts by third parties.
Our charter, bylaws and Maryland law contain provisions intended to deter coercive takeovers and inadequate takeover bids and to encourage prospective acquirors to negotiate with our board of directors rather than to attempt a hostile takeover. As currently in effect, our charter and bylaws, among other things, (1) contain transfer and ownership restrictions on the percentage by number and value of outstanding shares of our stock that may be owned or acquired by any stockholder; (2) prohibit stockholders action by non-unanimous written consent; (3) permit the board of directors, without further action of the stockholders, to amend the charter to increase or decrease the aggregate number of authorized shares or the number of shares of any class or series that may be issued; (4) permit the board of directors to classify or reclassify any unissued shares of common or preferred stock and set the preferences, rights and other terms of the classified or reclassified shares; (5) establish certain
advance notice procedures for stockholder proposals, and provide procedures for the nomination of candidates for our board of directors; (6) provide that special meetings of stockholders may only be called by the Company or upon written request of 25% of all the votes entitled to be cast at such meeting; (7) provide that a director may only be removed by stockholders for cause and upon the vote of two-thirds of the outstanding shares of common stock; and (8) require supermajority approval to amend or repeal certain charter provisions. In addition, specific anti-takeover provisions of the Maryland General Corporation Law (“MGCL”) could make it more difficult for a third party to attempt a hostile takeover, including:
•“business combination” provisions that, subject to limitations, prohibit certain business combinations between us and an “interested stockholder” (defined generally as any person who beneficially owns 10% or more of the voting power of our shares or an affiliate thereof) for five years after the most recent date on which the stockholder becomes an interested stockholder, and thereafter impose special appraisal rights and special stockholder voting requirements on these combinations; and
•“control share” provisions that provide that “control shares” of our company (defined as shares which, when aggregated with other shares controlled by the stockholder, entitle the stockholder to exercise one of three increasing ranges of voting power in electing directors) acquired in a “control share acquisition” (defined as the direct or indirect acquisition of ownership or control of “control shares”) have no voting rights except to the extent approved by our stockholders by the affirmative vote of at least two-thirds of all the votes entitled to be cast on the matter, excluding all interested shares.
We believe these provisions protect our stockholders from coercive or unfair takeover tactics by requiring potential acquirors to negotiate with our board of directors and by providing our board of directors with more time to assess any acquisition proposal. These provisions are not intended to prevent all takeovers, but they may delay, defer or prevent a change of control transaction even if such transaction involves a premium price for our common stock or it is in our stockholders’ best interests. These provisions may also prevent or discourage attempts to remove and replace incumbent directors.
Our bylaws provide that the Circuit Court for Baltimore City, Maryland will be the sole and exclusive forum for substantially all disputes between us and our stockholders, which could limit our stockholders’ ability to obtain a favorable judicial forum for disputes with us or our directors, officers or other employees.
Our bylaws provide that, unless we consent in writing to the selection of an alternative forum, the Circuit Court for Baltimore City, Maryland is the sole and exclusive forum for (i) any derivative action or proceeding brought on behalf of us, (ii) any action asserting a claim of breach of a fiduciary duty owed by any director, officer or other employee, (iii) any action asserting a claim arising pursuant to any provision of the MGCL, or (iv) any action asserting a claim governed by the internal affairs doctrine, and any of our record or beneficial stockholders who commences such an action shall cooperate in a request that the action be assigned to the Court’s Business & Technology Case Management Program. This exclusive forum provision is intended to apply to claims arising under the MGCL and would not apply to claims brought pursuant to the Exchange Act of 1934 or Securities Act of 1933, each as amended, or any other claim for which the federal courts have exclusive jurisdiction. The exclusive forum provision in our bylaws will not relieve us of our duties to comply with the federal securities laws and the rules and regulations thereunder, and our stockholders will not be deemed to have waived our compliance with these laws, rules and regulations.
This exclusive forum provision may limit a stockholder's ability to bring a claim in a judicial forum of its choosing for disputes with us or our directors, officers or other employees, which may discourage lawsuits against us and our directors, officers and other employees. In addition, stockholders who do bring a claim in the Circuit Court for Baltimore City, Maryland could face additional litigation costs in pursuing any such claim, particularly if they do not reside in or near Maryland. The Circuit Court for Baltimore City, Maryland may also reach different judgments or results than would other courts, including courts where a stockholder would otherwise choose to bring the action, and such judgments or results may be more favorable to us than to our stockholders. However, the enforceability of similar exclusive forum provisions in other companies' certificates of incorporation has been challenged in legal proceedings, and it is possible that a court could find this type of provision and/or the jurisdictional limitation contained therein to be inapplicable to, or unenforceable in respect of, one or more of the specified types of actions or proceedings. If a court were to find the exclusive forum provision contained in our bylaws to be inapplicable or unenforceable in an action, we might incur additional costs associated with resolving such action in other jurisdictions.
General Risk Factors
We rely on information technology in our operations, and any material failure, inadequacy, interruption or security failure of that technology could harm our business.
We rely on information technology networks and systems, including the internet, to process, transmit and store electronic information, and to manage or support our business processes, including financial transactions and records, and maintaining personal information and tenant and lease data. We purchase some of our information technology from vendors, on whom our systems depend. We rely on commercially available systems, software, tools and monitoring to provide security for the processing, transmission and storage of confidential tenant and customer data, including financial account information. While we have taken steps to protect the security of our information systems, we have, from time to time, experienced cyber incidents of varying degrees, although none of these cyber incidents have had a material adverse impact on our business, financial condition or results of operations. It is possible that in the future our safety and security measures will not prevent the systems’ improper functioning or damage, or the improper access or disclosure of personally identifiable or proprietary information and any such event could materially and adversely impact our business, financial condition or results of operations. In addition, data security incidents could occur due to unintentional misconfiguration of data management tools and network security systems. Due to the fast pace and unpredictability of cyber threats, measures for addressing cybersecurity risks may become obsolete quickly.
Security breaches, including physical or electronic break-ins, computer viruses, malware, phishing attacks, worms, attacks by hackers or foreign governments, disruptions from unauthorized access and tampering (including through social engineering such as phishing attacks), coordinated denial-of-service attacks, impersonation of authorized users and similar incidents, can create system disruptions, shutdowns or result in a loss of company assets or unauthorized disclosure of confidential information. The risk of security incidents has generally increased as the number, intensity and sophistication of attacks and intrusions from around the world have increased. In some cases, it may be difficult to anticipate or immediately detect such incidents and the damage they cause. In addition, our technology infrastructure and information systems are vulnerable to damage or interruption from natural disasters, power loss and telecommunications failures. Failure to maintain proper function, security and availability of our information systems and the data maintained in those systems could interrupt
our operations, damage our reputation, subject us to liability claims or regulatory penalties and could have a material adverse effect on our business, financial condition and results of operations.
We have and may in the future incur impairment charges, which could negatively impact our results of operations.
At each reporting period, we evaluate our real estate investments and other assets for impairment indicators whenever events or changes in circumstances indicate that the carrying amount of the assets may not be recoverable. The existence of impairment indicators is based on factors such as market conditions, operator performance and legal structure. If we determine that an impairment has occurred, we are required to adjust the net carrying value of the asset, which could have a material adverse effect on our results of operations in the period in which the write-off occurs. For example, in the twelve months ended December 31, 2022, we recorded impairment charges of approximately $79.1 million, contributing to the net loss of $7.5 million for the year.
We cannot assure you of our ability to pay dividends in the future.
We expect to make quarterly dividend payments in cash with the annual dividend amount no less than 90% of our annual REIT taxable income, determined without regard to the dividends paid deduction and excluding any net capital gains. Our ability to pay dividends may be adversely affected by a number of factors, including the risk factors described in this annual report. Dividends are authorized by our board of directors and declared by us based upon a number of factors, including but not limited to actual results of operations, restrictions under Maryland law or applicable debt covenants, our financial condition, our taxable income, the annual distribution requirements under the REIT provisions of the Code and our operating expenses. There is no assurance that our operating results will allow for specified levels of cash dividends or year-to-year increases in the future.
Furthermore, while we are required to pay dividends in order to maintain our REIT status (as described under “Risks Related to Our Status as a REIT - REIT distribution requirements could adversely affect our ability to execute our business plan”), we may elect not to maintain our REIT status and discontinue paying dividends. Even if we do elect to maintain our REIT status, after completing various procedural steps, we may elect to comply with the applicable distribution requirements by distributing, under certain circumstances, a portion of the required amount in the form of shares of our common stock in lieu of cash. Either of these actions could negatively affect our business and financial condition as well as the market price of our common stock.
ITEM 1B. Unresolved Staff Comments
None.
ITEM 1C.Cybersecurity
Cybersecurity Risk Management and Strategy
We have implemented several cybersecurity processes and controls to aid in our efforts to assess, identify, and manage material risks from cybersecurity threats, as such term is defined in Item 106(a) of Regulation S-K. We have engaged a third-party cybersecurity firm who serves as our dedicated information technology (IT) and cybersecurity team and helps us oversee, implement and manage these processes and controls.
To identify and assess material risks from cybersecurity threats, we consider cybersecurity threat risks individually and alongside other company risks as part of our overall risk assessment process. Management determines and prioritizes appropriate risk responses for each identified enterprise risk. In doing so, management coordinates with relevant subject matter specialists as appropriate for each relevant risk area, including our third-party IT and cybersecurity team with respect to information technology and security risks.
Management is accountable for our day to day risk management activities. With the assistance of our third-party IT and cybersecurity team, we employ a range of tools and services, including a governance, risk and compliance platform to inform our managements’ risk identification and assessment relating to our technology program. With this platform, we map our cybersecurity and risk management program to the Center for Internet Security (“CIS”) framework.
Processes and controls we have implemented with the assistance of our third-party IT and cybersecurity team to assess, identify, manage and protect against material risks from cybersecurity threats include the following:
•perform 24/7 security monitoring through an automated detection software managed by our third party cybersecurity firm;
•conduct annual cybersecurity management and incident training for employees involved in our systems and processes that handle sensitive data;
•conduct regular phishing email training for all employees with access to corporate email and other systems to enhance awareness and responsiveness to such possible threats;
•leverage the CIS Controls incident handling framework to help us identify, protect, detect, respond, and recover when there is an actual or potential cybersecurity incident.
At least annually, our third-party IT and cybersecurity firm conducts a cybersecurity risk assessment. We periodically review reporting on these risks and our cybersecurity threats, the status of our security infrastructure, our risk management activities and the status of, and our responses to, any cybersecurity incidents.
Through our incident response policy, we have designated an incident response team composed of representatives of management and other employees as well as representatives from our outsourced cybersecurity firm that has responsibility for overseeing cybersecurity incidents. Led by management, our third-party IT and cybersecurity team is responsible for the day-to-day investigation of and response to potential information security-related incidents. Pursuant to our incident response policy, incidents meeting specified severity levels are required to be escalated to the incident response team for review and response. The goal of the policy is to prevent, detect and react to information security incidents, determine their scope and risk, respond appropriately to the incident, communicate the results and risk to relevant stakeholders, and reduce the likelihood of the incident from reoccurring.
Pursuant to our incident response policy, if we are notified of a cybersecurity incident impacting a third-party service provider that affects our information systems or data, we will respond on the same basis as any other incident. We are implementing a business use case review process and vendor risk assessment for all third-party service providers that will
access or implicate our materially significant technology or data. If we deem the cybersecurity risk of a particular service provider too great, such service provider will not be approved or access will be terminated.
Based on information known to us, we also do not believe any risks from cybersecurity threats, including as a result of previous cybersecurity incidents, have materially affected or are reasonably likely to materially affect us, including our business strategy, results of operations or financial condition. We can give no assurance that we have detected or protected against all cybersecurity threats or incidents. Please refer to “Cybersecurity incidents or other damage to the information systems and technology of us or our tenants could harm our business” and “If we or our tenants fail to adhere to applicable privacy and data security laws, this could have a material adverse effect on us or on our tenants’ ability to meet their obligations to us” included “Item 1A, Risk Factors” of this Annual Report on Form 10-K for additional information about material risks related to cybersecurity threats.
Cybersecurity Governance
As described above, we have engaged a third-party IT and cybersecurity firm to whom we have outsourced primary responsibility to oversee, implement and manage our processes and controls to assess, identify, and manage material risks from cybersecurity threats. Members of this dedicated third-party IT and cybersecurity team include a virtual chief information security officer (vCISO) who is responsible for the overall development and implementation of our cybersecurity strategy and responses as well as individuals having the position of cybersecurity analyst, cybersecurity engineer, and director of information security. Our management, including our Chief Executive Officer, oversees the work of our third-party IT and cybersecurity team and regularly communicates with members of the team. Through the policies and controls described above, including our incident response policy, representatives of the third-party IT and cybersecurity team as well as members of our management, including our Chief Executive Officer, are informed about cybersecurity threats and incidents affecting our information systems and direct our efforts to prevent, detect, mitigate and remediate cybersecurity threats and incidents. The representatives of our third-party IT and cybersecurity team who lead our cybersecurity risk management and risk assessment process have collectively over 30 years of prior work experience in various roles managing information systems, developing cybersecurity strategy, implementing information security and cybersecurity programs, identifying and assessing cybersecurity risks and establishing incident response plans. The members of the cybersecurity team hold degrees in computer engineering and cybersecurity as well as advanced cybersecurity certifications, including a Certified Information Systems Security Professional (CISSP) certification, a Certified Information Systems Auditor (CISA) credential and a Certified Information Security Manager (CISM) certification. Other members of our third-party cybersecurity team have also obtained various professional certifications and advanced training in the areas of information security and cybersecurity.
Our audit committee is responsible for overseeing our overall risk assessment and risk management program as well as our policies and practices related to our information technology systems, information security and cybersecurity risks. The audit committee reviews at least annually our enterprise risks and related risk management program. In addition, on a quarterly basis, the audit committee receives a report from management on our cybersecurity threat risk management and strategic processes covering topics such as cybersecurity incidents and any remedial actions, if needed, data security posture, the results of third-party risk assessments as well as our cybersecurity risk management processes and strategies. Outside of quarterly presentations, the chair of the audit committee would be notified following any cybersecurity incident meeting specified severity levels, and the audit committee would also be expected to review management’s materiality assessment regarding any cybersecurity incident requiring disclosure to the Securities and Exchange Commission. Through their participation in meetings of the audit committee, other members of the Board are also kept apprised of material risks from cybersecurity threats and our related risk management activities.
ITEM 2. Properties
As of December 31, 2022,2023, all of ourthe properties we own are leased under long-term, triple-net leases (including properties we own through joint ventures), except for two ALFs forone SNF which we are in the process of identifying an operator and two ALFs which are being repurposed.is non-operational. The following table displays the expiration of the annualized contractual cash rental income under our lease agreements as of December 31, 20222023, excluding properties classified as held for sale, one SNF which is non-operational and two ALFs which are being repurposed, by year and total investment (dollars in thousands) and, in each case, without giving effect to any renewal or purchase options:
| | Lease | Lease | | |
| Maturity | |
| Maturity | |
| Maturity | Maturity | | Percent of Total | | Percent of | | | Percent of Total | | | | Percent of |
| Year | Year | Investment(1) | | Investment | | Rent(1) | | Total Rent | Year | Investment | | Investment | | Rent(1) | | Total Rent |
| 2024 | 2024 | $ | 15,800 | | | 0.9 | % | | $ | 1,537 | | | 0.8 | % | 2024 | $ | 15,800 | | | 0.8 | | 0.8 | % | | $ | 1,583 | | | 0.8 | | 0.8 | % |
| 2027 | 2027 | 46,801 | | | 2.6 | % | | 5,342 | | | 2.8 | % | 2027 | 46,801 | | | 2.4 | | 2.4 | % | | 5,476 | | | 2.7 | | 2.7 | % |
| | 2029 | |
| 2029 | |
| 2029 | 2029 | 114,116 | | | 6.3 | % | | 9,051 | | | 4.8 | % | 149,476 | | | 7.6 | | 7.6 | % | | 11,339 | | | 5.6 | | 5.6 | % |
| 2030 | 2030 | 119,868 | | | 6.6 | % | | 11,353 | | | 6.0 | % | 2030 | 51,487 | | | 2.6 | | 2.6 | % | | 5,107 | | | 2.5 | | 2.5 | % |
| 2031 | 2031 | 527,678 | | | 29.0 | % | | 54,672 | | | 29.1 | % | 2031 | 490,317 | | | 24.9 | | 24.9 | % | | 51,160 | | | 25.4 | | 25.4 | % |
| 2032 | 2032 | 179,936 | | | 9.9 | % | | 18,027 | | | 9.6 | % | 2032 | 178,836 | | | 9.1 | | 9.1 | % | | 18,502 | | | 9.2 | | 9.2 | % |
| 2033 | 2033 | 125,216 | | | 6.9 | % | | 19,847 | | | 10.6 | % | 2033 | 136,782 | | | 6.9 | | 6.9 | % | | 20,804 | | | 10.3 | | 10.3 | % |
| 2034 | 2034 | 438,011 | | | 24.1 | % | | 43,925 | | | 23.4 | % | 2034 | 352,416 | | | 17.9 | | 17.9 | % | | 33,984 | | | 16.8 | | 16.8 | % |
| 2036 | 2036 | 146,487 | | | 8.1 | % | | 13,862 | | | 7.4 | % | 2036 | 146,486 | | | 7.4 | | 7.4 | % | | 14,209 | | | 7.0 | | 7.0 | % |
| 2038 | 2038 | 103,001 | | | 5.6 | % | | 10,401 | | | 5.5 | % | 2038 | 401,514 | | | 20.4 | | 20.4 | % | | 39,575 | | | 19.7 | | 19.7 | % |
| | Total | Total | $ | 1,816,914 | | | 100.0 | % | | $ | 188,017 | | | 100.0 | % |
| Total | |
| Total | | $ | 1,969,915 | | | 100.0 | % | | $ | 201,739 | | | 100.0 | % |
(1) Amounts exclude properties classified asIncludes three SNFs held for sale as of December 31, 2022.in consolidated joint ventures.
See the “Tenant Purchase Options” section of Note 3, Real Estate Investments, Net in the Notes to consolidated financial statements for additional information on leases subject to purchase options.
The information set forth under “Portfolio Summary” in Item 1 of this Annual Report on Form 10-K is incorporated by reference herein.
ITEM 3. Legal Proceedings
The Company and its subsidiaries are and may become from time to time a party to various claims and lawsuits arising in the ordinary course of business, but none of the Company or any of its subsidiaries is, and none of their respective properties are, the subject of any material legal proceedings. Claims and lawsuits may include matters involving general or professional liability asserted against our tenants, which are the responsibility of our tenants and for which we are entitled to be indemnified by our tenants under the insurance and indemnification provisions in the applicable leases.
ITEM 4. Mine Safety Disclosures
None.
PART II
ITEM 5. Market for Registrant’s Common Equity, Related Stockholder Matters and Issuer Purchases of
Common Equity
Our common stock is listed on the New York Stock Exchange under the symbol “CTRE.”
At February 8, 2023,7, 2024, we had approximately 43 stockholders of record.
To maintain REIT status, we are required each year to distribute to stockholders at least 90% of our annual REIT taxable income after certain adjustments. All distributions will be made by us at the discretion of our board of directors and will depend on our financial position, results of operations, cash flows, capital requirements, debt covenants (which include limits on distributions by us), applicable law, and other factors as our board of directors deems relevant. For example, while the Notes and our Second Amended Credit Agreement permit us to declare and pay any dividend or make any distribution that is
necessary to maintain our REIT status, those distributions are subject to certain financial tests under the indenture governing the Notes, and therefore, the amount of cash distributions we can make to our stockholders may be limited.
Distributions with respect to our common stock can be characterized for federal income tax purposes as taxable ordinary dividends, nondividendnon-dividend distributions or a combination thereof. Following is the characterization of our annual cash dividends on common stock: | | | | Year Ended December 31, | | Year Ended December 31, |
| Common Stock | Common Stock | 2022 | | 2021 | Common Stock | 2023 | | 2022 |
| Ordinary dividend | Ordinary dividend | $ | 0.4291 | | | $ | 0.9411 | |
| Non-dividend distributions | Non-dividend distributions | 0.6609 | | | 0.1039 | |
| Total taxable distribution | Total taxable distribution | 1.0900 | | | 1.0450 | |
Distributions allocated from prior tax year(1) | Distributions allocated from prior tax year(1) | (0.2650) | | | (0.2500) | |
Distributions allocated to subsequent tax year(2) | Distributions allocated to subsequent tax year(2) | 0.2750 | | | 0.2650 | |
| Total distributions declared | Total distributions declared | $ | 1.1000 | | | $ | 1.0600 | |
(1) Because our aggregate cash distributions exceeded our annual earnings and profits, the cash distribution declared in the fourth quarter of 2021 and paid in January 2022, of $0.265 per share, was treated as a 2022 distribution for federal income tax purposes.
(2) Because our aggregate cash distributions exceeded our annual earnings and profits, the cash distribution declared in the fourth quarter of 2022 and paid in January 2023, of $0.275 per share, will be treated as a 2023 distribution for federal income tax purposes.
Unregistered Sales(2) Because our aggregate cash distributions exceeded our annual earnings and profits, the cash distribution declared in the fourth quarter of Equity Securities
On March 20, 2020, our board2023 and paid in January 2024, of directors authorized$0.280 per share, will be treated as a share repurchase program to repurchase up to $150.0 million of outstanding shares of our common stock (the “Repurchase Program”). Repurchases under the Repurchase Program, which expires on March 31, 2023, may be made through open market purchases, privately negotiated transactions, structured or derivative transactions, including accelerated share repurchase transactions, or other methods of acquiring shares, in each case subject to market conditions and at such times as shall be permitted by applicable securities laws and determined by management. Repurchases under the Repurchase Program may also be made pursuant to a plan adopted under Rule 10b5-1 promulgated under the Exchange Act. We expect to finance any share repurchases under the Repurchase Program using available cash and may also use short-term borrowings under the Revolving Facility. We did not repurchase any shares of common stock under the Repurchase Program during the years ended December 31, 2022, 2021 and 2020. The Repurchase Program may be modified, discontinued or suspended at any time.2024 distribution for federal income tax purposes.
Stock Price Performance Graph
The graph below compares the cumulative total return of our common stock, the S&P 500 Index, the S&P 500 REIT Index, the RMS (MSCI U.S. REIT Total Return Index) and the Russell 2000 Index (“Russell 2000”). We plan to replace the S&P 500 Index with the Russell 2000 as we have determined that the Russell 2000 is a more comparable index for us in terms of market capitalization. Total cumulative return is based on a $100 investment in CareTrust REIT common stock and in each of the indices at the market close on December 29, 201731, 2018 and assumes quarterly reinvestment of dividends before consideration of income taxes. Stockholder returns over the indicated periods should not be considered indicative of future stock prices or stockholder returns.
COMPARISON OF CUMULATIVE TOTAL RETURN
AMONG S&P 500 S&P 500 REIT INDEX, RMS, RUSSELL 2000 AND CARETRUST REIT, INC.
RATE OF RETURN TREND COMPARISON
DECEMBER 29, 201731, 2018 - DECEMBER 30, 202229, 2023
(DECEMBER 29, 201731, 2018 = $100)
Stock Price Performance Graph Total Return The stock performance graph shall not be deemed soliciting material or to be filed with the SEC or subject to Regulation 14A or 14C under the Securities Exchange Act of 1934, as amended (the “Exchange Act”) or to the liabilities of Section 18 of the Exchange Act, nor shall it be incorporated by reference into any past or future filing under the Securities Act of 1933 or the Exchange Act, except to the extent we specifically request that it be treated as soliciting material or specifically incorporate it by reference into a filing under the Securities Act of 1933 or the Exchange Act.
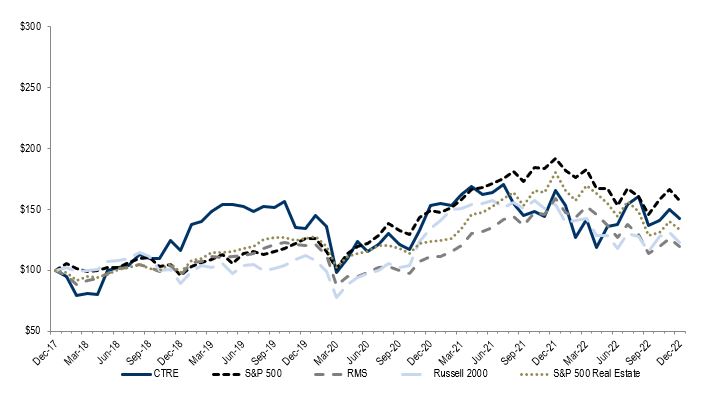

| | December 31, |
| 2017 | | 2018 | | 2019 | | 2020 | | 2021 | | 2022 |
| | December 31, | | | | December 31, |
| | 2018 | | | | 2018 | | 2019 | | 2020 | | 2021 | | 2022 | | 2023 |
| CareTrust REIT, Inc. | CareTrust REIT, Inc. | | $ | 100.00 | | | $ | 115.79 | | | $ | 134.62 | | | $ | 153.01 | | | $ | 165.07 | | | $ | 142.46 | |
| S&P 500 | | $ | 100.00 | | | $ | 95.62 | | | $ | 125.72 | | | $ | 148.85 | | | $ | 191.58 | | | $ | 156.89 | |
| RMS | RMS | | $ | 100.00 | | | $ | 95.43 | | | $ | 120.09 | | | $ | 110.99 | | | $ | 158.79 | | | $ | 119.87 | |
| Russell 2000 | Russell 2000 | | $ | 100.00 | | | $ | 88.99 | | | $ | 111.70 | | | $ | 134.00 | | | $ | 153.85 | | | $ | 122.41 | |
| S&P 500 Real Estate Index | S&P 500 Real Estate Index | | $ | 100.00 | | | $ | 97.78 | | | $ | 126.15 | | | $ | 123.41 | | | $ | 180.42 | | | $ | 133.28 | |
ITEM 6. [Reserved]
ITEM 7. Management’s Discussion and Analysis of Financial Condition and Results of Operations
The discussion below contains forward-looking statements that involve risks and uncertainties. Our actual results could differ materially from those anticipated in these forward-looking statements as a result of various factors, including those which are discussed in the section titled “Risk Factors.” Also see “Statement Regarding Forward-Looking Statements” preceding Part I.
The following discussion and analysis should be read in conjunction with our accompanying consolidated financial statements and the notes thereto.
Our Management’s Discussion and Analysis of Financial Condition and Results of Operations is organized as follows:
•Overview
•Recent Developments
•Results of Operations
•Liquidity and Capital Resources
•Critical Accounting Estimates
•Impact of Inflation
Overview
CareTrust REIT is a self-administered, publicly-traded REIT engaged in the ownership, acquisition, financing, development and leasing of skilled nursing, seniors housing and other healthcare-related properties. As of December 31, 2022, CareTrust REIT’s real estate portfolio comprised of 2162023, we owned, directly or indirectly through joint ventures, and leased to independent operators 226 skilled nursing facilities (“SNFs”), multi-service campuses, assisted living facilities (“ALFs”) and independent living facilities (“ILFs”), consisting of 22,83123,928 operational beds and units located in 28 states with the highest concentration of properties by rental income located in California Texas, Louisiana, Idaho and Arizona.Texas. As of December 31, 2022,2023, we also had other real estate related investments consisting of threeone preferred equity investment, eight real estate secured loans receivable and twoone mezzanine loansloan receivable with a carrying value of $156.4$180.4 million.
Recent Developments
COVID-19 UpdateMarket Trends and Uncertainties
Tenants of our properties operating pursuant to triple-net master leases have been adversely impacted, and we expect that they will continue to be adversely impacted, by the COVID-19 pandemic. Our tenants are experiencing increased operating costs as a result of actions they are taking to prevent or mitigate the outbreak or spread of COVID-19 at their facilities. Our tenants are also experiencing labor shortages resulting in limited admissions, reduced occupancy and higher agency expense. While our tenants have experienced some recent increases in occupancy, occupancy rates are still below pre-pandemic levels. The current limited availability or unavailability of grants and other funds being made available to our seniors housing facilities for healthcare related expenses or lost revenues attributable to COVID-19, as well as the tapering of grants and other funds for our SNFs, has also impacted some of our tenants’ ability to continue to meet some of their financial obligations, as they continue to experience lower occupancy levels and higher operating costs. In some cases, we may have to restructure tenants’ long-term rent obligations and may not be able to do so on terms that are as favorable to us as those currently in place.
At a portfolio wide level, occupancy levels at our seniors housing facilities remained relatively stable from the onset of the COVID-19 pandemic until the beginning of the fourth quarter of 2020, at which time we began to see a decline. This decline in occupancy continued through the fourth quarter of 2021; however, seniors housing facilities occupancy has begun to increase in the beginning of the first quarter of 2022 and continued throughout 2022. Occupancy levels at our SNFs, which declined at the onset of the COVID-19 pandemic and continued to decline through January 2021, have been on a steady incline through the fourth quarter of 2022. Beginning in early 2020, the federal government temporarily suspended the three-day hospital stay requirement for a patient’s Medicare benefits to refresh. Providers can now “skill in place,” eliminating the risk of transferring the patient to the hospital. Because of this temporary rule change, overall skilled mix remained slightly elevated in the three months ended December 31, 2022 compared to the pre-pandemic skilled mix during the three months ended March 31, 2020. An increase in skilled mix can, but may not necessarily, offset some or all of the adverse financial impact to the operator of the SNF from a decline in occupancy. However, the skilled mix in our SNFs during the three months ended December 31, 2022 was lower than the peak level seen in December 2020, and we anticipate that skilled mix in our SNFs will continue to decline as cases of COVID-19 decline and temporary suspensions are retired.
The Coronavirus Aid, Relief, and Economic Security Act (the “CARES Act”) included a temporary suspension of a 2% Medicare sequestration cut through the end of March 2022. Beginning April 1, 2022, a 1% sequestration cut went into effect through June 30, 2022 with the full 2% cut resuming thereafter. On January 30, 2023, the U.S. Department of Health and Human Services (“HHS”) announced that the COVID-19 Public Health Emergency (“PHE”) will end on May 11, 2023. The PHE has allowed HHS to provide temporary regulatory waivers, including the waiver of the three-day hospital stay requirement for a patient’s Medicare benefits to refresh. The temporary 6.2% increase in Federal Medical Assistance Percentages (“FMAP”) was approved retroactive to January 1, 2020, but is expected to be phased down by December 31, 2023 under the Consolidated Appropriations Act of 2023 and the ending of the PHE. With the expiration of the PHE and the potential lifting of the three-day hospital stay requirement, SNFs may experience decreases in occupancy levels or revenues, which may adversely impact the business and financial condition of the operators of our SNFs.
As a result of the foregoing impacts of the COVID-19 pandemic and actions taken in response, our tenants’ ability to continue to meet some of their financial obligations to us has been negatively impacted. See “Impairment of Real Estate Assets, Assets Held for Sale and Asset Sales” below. During the three and twelve months ended December 31, 2022, we collected 95.5% and 95.2% of contractual rents due from our operators including cash deposits used to offset rent shortfalls, respectively. During both the three and twelve months ended December 31, 2022, we collected 94.0% of contractual rents due from our operators excluding cash deposits. In January 2023, we collected 94.5% of contractual rents due from our operators.
During the year ended December 31, 2022, we determined that it was not probable that we would collect substantially all of the contractual obligations from five existing and former operators and, accordingly, we reversed $0.7 million of operating expense reimbursements, $0.2 million of contractual rent and $0.5 million of straight-line rent. In addition, we determined that the collectibility of contractual rents from four operators was not probable and we moved these four operators to a cash basis method of accounting during the year ended December 31, 2022.
Impact of Macroeconomic Conditions
The substantial inflationary pressures that our economy continues to face has resulted in many headwinds for us and our tenants, most notably in the form of rising interest rates, volatility in the capital markets, a softening of consumer sentiment and signs of a potential broader economic slowdown. These currentCurrent macroeconomic conditions, particularly inflation (including risinghigher wages and supply costs), risingelevated interest rates and related changes to consumer spending, including, but not limited to, causing individuals to delay or defer moves to seniors housing, has adversely impacted and could continue to adversely impact our tenants’ ability to meet some of their financial obligations to us. RisingHigher interest rates also increase our costs of capital to finance acquisitions and increase our borrowing costs, and future changes in market interest rates could materially impact the estimated discounted cash flows that are used to determine the fair value of our other real estate related investments.costs. In addition, current macroeconomic conditions and the resulting market volatility may adversely impact our ability to sell properties on acceptable terms, if at all, which could result in additional impairment charges.
As a result of the above factors, together with the additional protective measures taken by our tenants in response to and following the COVID-19 pandemic, our tenants are continuing to experience increased operating costs at their facilities. Our tenants are also experiencing labor shortages resulting in reduced admissions and higher operating costs. At a portfolio wide level, occupancy levels at our seniors housing facilities, comprising our ALFs and ILFs, are continuing to show signs of recovery following the onset of the COVID-19 pandemic, although they have not yet fully normalized to pre-pandemic levels. Within our SNFs, occupancy levels have continued to improve since their trough in January 2021 and are reaching pre-COVID occupancy levels for most of our tenants.
As a result of impacts experienced by our tenants since the onset of the COVID-19 pandemic, the ability of some of our tenants to meet their financial obligations to us in full has been negatively impacted. See “Impairment of Real Estate Assets, Assets Held for Sale and Asset Sales” below. During the three and twelve months ended December 31, 2023, we collected 100.0% and 97.7% of contractual rents due from our operators excluding cash deposits, respectively. From time to time in the past, we have taken actions to reposition one or more properties with a replacement tenant or sell the property and, in certain cases, we have also restructured tenants’ long-term obligations. In the event our tenants are unable to satisfy their obligations to
us and we are unable to effect these actions on terms that are as favorable to us as those currently in place, our rental income would be adversely impacted and we may incur additional expenses or obligations and be required to recognize additional impairment charges.
For more information regarding the potential impact of public health crises, including COVID-19, and macroeconomic conditions on our business, see “Risk Factors” in Item 1A of this report.
SNF Reimbursement Rates
OnIn July 29, 2022, the2023, The Centers for Medicare and Medicaid Services (“CMS”) issued a final rule that will increase the aggregate netapproved its payment by 2.7%rate update to SNF reimbursements for fiscal year 2023. CMS estimates that the aggregate impact of the payment policies in the final rule will result in an2024, which commenced October 1, 2023, and includes a net increase of 4.0%, or approximately $904 million$1.4 billion, in Medicare Part A payments to SNFs in fiscal year 2023 comparedSNFs. This increase is expected to fiscal year 2022. The payment rates became effective on October 1, 2022.
Impairment of Real Estate Assets, Assets Held for Sale, and Asset Sales
In connection with our ongoing review and monitoringpartially offset some of our investment portfoliotenants’ higher operating costs.
On September 1, 2023, CMS issued proposed rules regarding minimum staffing requirements and increased inspections at nursing homes in order to establish comprehensive nurse staffing requirements. The proposed rule consists of three core staffing proposals: (1) minimum nurse staffing standards of 0.55 hours per resident day for registered nurses and 2.45 hours of care from a nurse aid per resident per day; (2) a requirement to have a registered nurse onsite 24 hours a day, seven days a week; and (3) enhanced facility assessment requirements. The proposed rule also includes a staggered implementation approach and possible hardship exemptions for select facilities. Comments on the performanceproposed rule had to be submitted by November 6, 2023. It is uncertain when the proposed rules will be finalized and become effective, what the ultimate scope and timing of the staffing requirements will be thereunder, and whether any such requirements will be accompanied by additional funding to offset any increased costs associated with meeting these requirements for our operators. Depending on the ultimate level of staffing required, an unfunded mandate to increase staff may have a material and adverse impact on the financial condition of our tenants, during the first quarter of 2022, we determined to pursue the sale of 27 properties and the repurposing of three properties, representing an aggregate of approximately 10% of contractual cash rent as of March 31, 2022. As of March 31, 2022, we determined that these 27 properties met the criteria to be classified as assets held for sale. During the year ended December 31, 2022, we recognized an aggregate impairment charge of $79.1 million, of which $45.0 million related to 12 facilities that have been sold, $18.0 million related to 10 facilities that were classified as held for saletenants.
On October 13, 2023, California Senate Bill No. 525 (“SB 525”) was signed into law, requiring a substantial increase in the first quarterminimum wage for workers operating in certain health care facilities. As a result of 2022 and reclassifiedSB 525, certain health care facilities (including licensed skilled nursing facilities) operating in California are required to held for use inincrease the third and fourth quarters of 2022, $14.4 million related to five facilities that were held for sale as of December 31, 2022, and $1.7 million related to one facility that was held for use during the year. For properties classified as held for sale, the impairment charges were recognized to write down the properties to the lowerwages of their carrying valuecovered health care employees to at least $21 per hour from June 1, 2024 to May 31, 2026, $22 or their aggregate fair value, less estimated costs$23 per hour (depending on facility type) from June 1, 2026 to sell. For properties classified as held for use, the impairment charges were recognized to write down the properties to their fair value.
Following the asset salesMay 31, 2028, and held for sale reclassifications discussed below, five properties continued to meet the criteria to be classified as held for sale as of December 31, 2022. As of December 31, 2022, the real estate assets comprising the remaining five properties classified as held for sale had an aggregate carrying value of $12.3 million.
Asset Sales and Held for Sale Reclassifications
During the first quarter of 2022, we determined that one ALF that was classified as held for sale at December 31, 2021 no longer met the held for sale criteria. We reclassified this ALF’s carrying value of $4.8 million out of assets held for sale and recorded catch-up depreciation of approximately $0.1 million during the year ended December 31, 2022.
During the first quarter of 2022, we closed on the sale of one SNF consisting of 83 beds located in Washington with a carrying value of $0.8 million, for net sales proceeds of $1.0 million. During the year ended December 31, 2022, we recorded a gain of $0.2 million in connection with the sale.
During the third quarter of 2022, we determined that one ALF, with a carrying value of $4.9 million, that was classified as held for sale at$25 per hour after June 30, 2022 no longer met the held for sale criteria. We reclassified this ALF out of assets held for sale at its fair value at the date of the decision not to sell of approximately $4.9 million.
During the third quarter of 2022, we closed on the sale of six SNFs and one multi-service campus, operated by
affiliates of Trio Healthcare Holdings, LLC (“Trio”), consisting of 708 beds located in Ohio for net proceeds of $32.8 million. In connection with the sale, we provided affiliates of the purchaser of the properties with a $7.0 million term loan that bears interest at 8.5% and has a maturity date of September 30, 2025. We also provided a $5.0 million bridge loan to four individuals that bore interest at 8.5% and was subsequently paid off during the fourth quarter of 2022. Prior to their sale, the seven properties had been classified as held for sale, with a carrying value of $46.9 million. During the year ended December 31, 2022, we recorded a loss of $2.1 million in connection with the sale.
During the fourth quarter of 2022, we closed on the sale of five ALFs, operated by affiliates of Noble VA Holdings, LLC (“Noble”), consisting of 301 beds located in Virginia for net proceeds of $11.0 million. Prior to their sale, the five properties had been classified as held for sale, with a carrying value of $12.7 million. During the year ended December 31, 2022, we recorded a loss of $1.7 million in connection with the sale.
During the fourth quarter of 2022, we determined that nine ALFs, with a carrying value of $50.8 million, that were classified as held for sale at September 30, 2022, no longer met the held for sale criteria. We reclassified the nine ALFs out of assets held for sale at their fair value at the date of the decision not to sell of approximately $47.8 million.
During the first quarter of 2023, we closed on the sale of one ALF, with a carrying value of $3.3 million, which approximated the net sales proceeds received. The facility was classified as held for sale at December 31, 2022.
Impairment of Assets Held For Use
During the second quarter of 2022, we recognized an impairment charge of $1.7 million related to one SNF. We wrote down its carrying value of $2.8 million to its estimated fair value of $1.1 million.
Portfolio Activity
During the year ended 2022, two leases we entered into with Landmark Recovery of Maryland, LLC (“Landmark Maryland”) and Landmark Recovery of Florida, LLC (“Landmark Florida”) commenced. In connection with the leases, we are repurposing two existing ALFs (previously leased to affiliates of Noble Senior Services) as behavioral health treatment centers that will be operated by Landmark Maryland and Landmark Florida, respectively. Rent under the leases will commence 12 to 18 months following commencement of the lease term or, if earlier, upon Landmark Maryland and Landmark Florida obtaining all licensure, permits, and other required regulatory authorizations with respect to operating the facility. The leases will expire on the 20th anniversary of the rent commencement date and both contain one 10-year renewal option and CPI-based rent escalators. See Note 3, Real Estate Investments, Net in the Notes to consolidated financial statements for additional information.
Recent Investments
FromThe following table summarizes the Company’s acquisitions from January 1, 20222023 through February 9, 2023, we acquired one SNF and one multi-service campus for approxima8, 2024 (dollars in thousands): | | | | | | | | | | | | | | | | | | | | | | | |
| Type of Property | Purchase Price(1) | | Initial Annual Cash Rent(2) | | Number of Properties | | Number of Beds/Units(3) |
Skilled nursing(4) | $ | 169,181 | | | $ | 13,764 | | | 10 | | | 1,256 | |
| Multi-service campuses | 25,276 | | | 1,916 | | | 1 | | | 168 | |
Assisted living(5) | 50,354 | | | 4,517 | | | 5 | | | 327 | |
| Total | $ | 244,811 | | | $ | 20,197 | | | 16 | | | 1,751 | |
(1)tely $21.9 million, whichPurchase price includes capitalized acquisition costs. These acquisitions are expected to generate initial
(2)Initial annual cash revenuesrent represents initial cash rent for the first twelve months excluding the impact of approximately $2.1 million and an initial blended yieldstraight-line rent or rent abatement in the first one to three months, if applicable.
(3)The number of approximately 9.4%. Sbeds/units includes operating beds at acquisition date.
(4)eeIncludes three SNFs held through joint ventures. See Note 3,Real Estate Investments, Netin the Notes to consolidated financial statements, and Note 11, Variable Interest Entities for additional information.
In September 2022, we extended(5)Includes on ALF held through a $24.9 million term loan as part of a larger, multi-tranche real estate secured term loan facility to a skilled nursing real estate owner. The secured term loan was structured with an “A” and a “B” tranche (with the payments on the “B” tranche being subordinate to the “A” tranche pursuant to the terms of a written agreement between the lenders). Our $24.9 million secured term loan constituted the entirety of the “B” tranche with its payments subordinated accordingly. The secured term loan is primarily secured by four skilled nursing facilitijoint venture. See Note 14, es operated by an operator in the Southeast. The “B” tranche Subsequent Eventssecured term loan is set to mature on September 8, 2025, with two one-year extension options and may (subject to certain restrictions) be prepaid in whole or in part before the maturity date, for an exit fee ranging from 1% to 3% of the loan plus unpaid interest payments; provided, however, that no exit fee is payable in connection with portions of the loan being refinanced pursuant to a loan (or loans) provided by or insured by the United States Department of Housing and Urban Development, Federal Housing Administration, or a similar governmental authority. The “B” tranche secured term loan provides for an earnout advance of $4.7 million if certain conditions are met. The “B” tranche secured term loan bears interest at a rate based on term secured overnight financing rate (“SOFR”), calculated as a fraction, with the numerator being the difference between (i) the monthly payment of interest of term SOFR plus a 4.50% spread and (ii) the amount of such monthly payment of interest of term SOFR plus a 2.85% spread, and with the denominator being the average daily balance of the outstanding principal amount during the applicable month, with such fraction expressed as a percentage and annualized, with a term SOFR floor of 1.00% and less a subservicing fee of 100% over 9.00%. The “B” tranche secured term loan requires monthly interest payments.
In August 2022, we extended a $22.3 million term loan as part of a larger, multi-tranche real estate secured term loan facility to a skilled nursing real estate owner. The secured term loan was structured with an “A” and a “B” tranche (with the payments on the “B” tranche being subordinate to the “A” tranche pursuant to the terms of a written agreement between the lenders). Our $22.3 million secured term loan constituted the entirety of the “B” tranche with its payments subordinated accordingly. The secured term loan is primarily secured by five skilled nursing facilities, four of which will be operated by an existing operator and one of which will be operated by a large, regional skilled nursing operator. The “B” tranche secured term loan is set to mature on August 1, 2025, with two one-year extension options and may (subject to certain restrictions) be prepaid in whole or in part before the maturity date for an exit fee ranging from 2% to 3% of the loan plus unpaid interest payments; provided, however, that no exit fee is payable in connection with portions of the loan being refinanced pursuant to a loan (or loans) provided by or insured by the United States Department of Housing and Urban Development, Federal Housing Administration, or a similar governmental authority. The “B” tranche secured term loan bears interest at a rate based on term SOFR, calculated as a fraction, with the numerator being the difference between (i) the monthly payment of interest of term SOFR plus a 4.25% spread and (ii) the amount of such monthly payment of interest of term SOFR plus a 2.75% spread, and with the denominator being the average daily balance of the outstanding principal amount during the applicable month, with such fraction expressed as a percentage and annualized, with a term SOFR floor of 1.00% and less a subservicing fee of 50% over 8.25%. The “B” tranche secured term loan requires monthly interest payments.additional information.
In June 2022, we extended a $75.0 million term loan to a skilled nursingThe following table summarizes other real estate owner as part of a larger, multi-tranche, senior secured term loan facility. The senior secured term loan was structured with an “A” tranche, a “B” tranche, and a “C” tranche (with the “C” tranche being the most subordinate). Our $75.0 million term loan constituted the entirety of the “C” tranche with its payments subordinated accordingly. The senior secured term loan facility is secured by an 18-facility skilled nursing portfolio in the Mid-Atlantic region, to be operated by a large, regional skilled nursing operator. In connection with the senior secured term loan facility and the borrower’s acquisition of the skilled nursing portfolio, we also extended to the borrower group a $25.0 million mezzanine loan. The “C” tranche term loan bears interest at 8.5%, less a servicing fee equal to the positive difference, if any, between the lesser of the contractual interest payment and actual payment of interest maderelated investments, by the borrower and a hypotheticalCompany from January 1, 2023 through February 8, 2024 (dollars in thousands): | | | | | | | | | | | | | | | | | | | | | | | | | | |
| Investment Type | Investment | | Annual Initial Interest Income(1) | | Number of Properties | | Number of Beds/Units(2) | |
| Mortgage secured loans receivable | $ | 51,584 | | | $ | 4,806 | | | 9 | | | 772 | | |
| Mezzanine loans receivable | 52,165 | | | 7,119 | | | N/A | | N/A | |
| Preferred equity | 1,782 | | | 267 | | | N/A | | N/A | |
| Total | $ | 105,531 | | | $ | 12,192 | | | 9 | | | 772 | | |
(1)Represents annualized acquisition-date interest payment at a rate of 8.25%, resulting in an effective interest rate of 8.375%. The ”C” tranche term loan is set to matureincome on June 30, 2027 and may (subject to certain restrictions) be prepaid in whole or in part before the maturity date for an exit fee ranging from 1% to 3% of the loan plus unpaid interest payments through the end of the month of prepayment; provided, however, that no exit fee is payable in connection with portions of the loan being refinanced pursuant to a loan (or loans) provided by or insured by the United States Department of Housing and Urban Development, Federal Housing Administration, or a similar governmental authority. The mezzanine loan bears interest at 11% and isany mortgage secured by a pledge of membership interests in an up-tier affiliate of the borrower group. The mezzanine loan is set to mature on June 30, 2032, and may (subject to certain restrictions) be prepaid in whole or in part before the maturity date, commencing on June 30, 2029, for an exit fee ranging from 1% to 3% of the loan plus unpaid interest payments through the date of prepayment. The “C” tranche term loanloans receivable and mezzanine loan both require monthlyloans, less subservicing fees, if applicable. For floating rate loans, interest payments.income has been calculated using the benchmark rate floor.
(2)The number of beds/units includes operating beds at the investment date.
At-The-Market Offering of Common Stock
On March 10, 2020,February 24, 2023, we entered into an equity distribution agreement to issue and sell, from time to time, up to $500.0 million in aggregate offering price of our common stock through an “at-the-market” equity offering program (the “Previous ATM Program”). On September 15, 2023, we terminated the Previous ATM Program and entered into a new equity distribution agreement to issue and sell, from time to time, up to $500.0 million in aggregate offering price of our common stock through an “at-the-market” equity offering program (the “New ATM Program” and together with the Previous ATM Program, the “ATM Program”). In addition to the issuance and sale of shares of our common stock, we may also enter into one or more forward sales agreements (each, an “ATM forward contract”) with sales agents for the sale of shares of our common stock under the ATM Program. There were no outstanding ATM forward contracts that had not settled as of December 31, 2023.
The following table summarizestables summarize the ATM Program activity (or activity under any predecessor at-the-market equity offering programs) for the year ended December 31, 20222023 (in thousands, except per share amounts).
| | | | | | | | |
| | For the Year Ended |
| | December 31, 20222023 |
| Number of shares | | 2,40530,869 | |
| Average sales price per share | | $ | 20.0020.86 | |
Gross proceeds(1) | | $ | 48,100643,802 | |
(1) Total gross proceeds is before $0.6$8.3 million of commissions paid to the sales agents and forward adjustments during the year ended December 31, 20222023, under the ATM Program.
As of December 31, 2022,2023, we had $428.4$274.1 million available for future issuances under the ATM Program.
Impairment of Real Estate Assets, Assets Held for Sale, and Asset Sales
Impairment of Real Estate Assets
During the year ended December 31, 2023, we recognized aggregate impairment charges of $36.3 million, of which $26.8 million related to properties held for sale, $8.0 million related to properties held for investment, and $1.5 million related to properties that were sold.
Asset Sales and Held for Sale Reclassifications
The following table summarizes our dispositions for the twelve months ended December 31, 2023 (dollars in thousands):
| | | | | | | | | | | |
| | | Twelve Months Ended December 31, |
| | | | | 2023 | | |
| Number of facilities | | | | | 5 | | |
| Net sales proceeds | | | | | $ | 18,313 | | | |
| Net carrying value | | | | | 16,095 | | | |
| Net gain on sale | | | | | $ | 2,218 | | | |
The following table summarizes our assets held for sale activity for the periods presented (dollars in thousands):
| | | | | | | | | | | | | |
| Net Carrying Value | | Number of Facilities | | |
| December 31, 2022 | $ | 12,291 | | | 5 | | |
| Additions to assets held for sale | 47,114 | | | 14 | | | |
| Assets sold | (16,095) | | | (5) | | | |
| Impairment of real estate held for sale | (28,299) | | | — | | | |
| | | | | |
December 31, 2023(1) | $ | 15,011 | | | 14 | | | |
(1)Includes two facilities sold subsequent to December 31, 2023.
Subsequent to December 31, 2023, we closed on the sale of one SNF and one ALF with an aggregate carrying value of $1.0 million, which approximated the net sales proceeds received. These facilities were classified as held for sale as of December 31, 2023.
Results of Operations
Operating Results
Our primary business consists of acquiring, developing, financing and owning real property to be leased to third party tenants in the healthcare sector.
Year Ended December 31, 20222023 Compared to Year Ended December 31, 20212022 | | | | | Year Ended December 31, | | Increase
(Decrease) | | Percentage
Difference |
| | | | Year Ended December 31, | | Increase
(Decrease) | | Percentage
Difference |
| | | 2022 | | 2021 | |
| | | (dollars in thousands) | (dollars in thousands) |
| Revenues: | Revenues: | |
| Rental income | Rental income | $ | 187,506 | | | $ | 190,195 | | | $ | (2,689) | | | (1) | % |
| Rental income | |
| Rental income | | $ | 198,599 | | | $ | 187,506 | | | $ | 11,093 | | | 6 | % |
| | Interest and other income | Interest and other income | 8,626 | | | 2,156 | | | 6,470 | | | 300 | % |
| Interest and other income | |
| Interest and other income | | 19,171 | | | 8,626 | | | 10,545 | | | 122 | % |
| Expenses: | Expenses: | |
| Depreciation and amortization | |
| Depreciation and amortization | |
| Depreciation and amortization | Depreciation and amortization | 50,316 | | | 55,340 | | | (5,024) | | | (9) | % | 51,199 | | | 50,316 | | 50,316 | | | 883 | | 883 | | | 2 | | 2 | % |
| Interest expense | Interest expense | 30,008 | | | 23,677 | | | 6,331 | | | 27 | % | Interest expense | 40,883 | | | 30,008 | | 30,008 | | | 10,875 | | 10,875 | | | 36 | | 36 | % |
| | Property taxes | Property taxes | 4,333 | | | 3,574 | | | 759 | | | 21 | % |
| Property taxes | |
| Property taxes | | 6,170 | | | 4,333 | | | 1,837 | | | 42 | % |
| | Impairment of real estate investments | |
| Impairment of real estate investments | |
| Impairment of real estate investments | Impairment of real estate investments | 79,062 | | | — | | | 79,062 | | | * | 36,301 | | | 79,062 | | 79,062 | | | (42,761) | | (42,761) | | | (54) | | (54) | % |
| | Provision for loan losses, net | Provision for loan losses, net | 3,844 | | | — | | | 3,844 | | | * |
| Provision for loan losses, net | |
| Provision for loan losses, net | | — | | | 3,844 | | | (3,844) | | | (100) | % |
| Property operating expenses | Property operating expenses | 5,039 | | | — | | | 5,039 | | | * | Property operating expenses | 3,423 | | | 5,039 | | 5,039 | | | (1,616) | | (1,616) | | | (32) | | (32) | % |
| General and administrative | General and administrative | 20,165 | | | 26,874 | | | (6,709) | | | (25) | % | General and administrative | 21,805 | | | 20,165 | | 20,165 | | | 1,640 | | 1,640 | | | 8 | | 8 | % |
| Other loss: | |
| Loss on extinguishment of debt | — | | | (10,827) | | | 10,827 | | | (100) | % |
| Loss on sale of real estate, net | (3,769) | | | (77) | | | (3,692) | | | * |
| Unrealized loss on other real estate related investments | (7,102) | | | — | | | (7,102) | | | * |
| Other (loss) income: | |
| | Gain (loss) on sale of real estate, net | |
| | Gain (loss) on sale of real estate, net | |
| | Gain (loss) on sale of real estate, net | | 2,218 | | | (3,769) | | | 5,987 | | | (159) | % |
| Unrealized loss on other real estate related investments, net | | Unrealized loss on other real estate related investments, net | (6,485) | | | (7,102) | | | 617 | | | (9) | % |
| Net loss attributable to noncontrolling interests | |
| Net loss attributable to noncontrolling interests | |
| Net loss attributable to noncontrolling interests | |
| Net loss attributable to noncontrolling interests | | (13) | | | — | | | (13) | | | * |
•Not meaningful
Rental income. Rental income decreasedincreased by $2.7$11.1 million as detailed below:
| | Year Ended | |
| | Year Ended | |
| (in thousands) | |
| (in thousands) | |
| (in thousands) | (in thousands) | | December 31, 2022 | | December 31, 2021 | | Increase/(Decrease) | | December 31, 2023 | | December 31, 2022 | | Increase/(Decrease) |
| Contractual cash rent | Contractual cash rent | | $ | 186,131 | | | $ | 186,501 | | | $ | (370) | |
| Tenant reimbursements | Tenant reimbursements | | 2,775 | | | 3,599 | | | (824) | |
Total contractual rent[1] | | 188,906 | | | 190,100 | | | (1,194) | |
| Total contractual rent | |
| Straight-line rent | Straight-line rent | | 17 | | | 32 | | | (15) | |
Adjustment for collectibility[2] | | (1,417) | | | — | | | (1,417) | |
| Below market lease | |
| Adjustment for collectibility | |
| | Lease termination revenue | | — | | | 63 | | | (63) | |
| Total change in rental income | | $ | 187,506 | | | $ | 190,195 | | | $ | (2,689) | |
| | Total amount in rental income | |
| | Total amount in rental income | |
| | Total amount in rental income | |
[1]
Includes
Total contractual rent includes initial contractual cash rent and tenant reimbursements, as adjusted for applicable rental escalators and rent increases due to capital expenditures funded by the Company.us. For tenants on a cash basis, this represents the lesser of the amount that would be recognized on a straight-line basis or cash that has been received. Total contractual cash rent decreasedincreased by $1.2$9.3 million due to an increase of $9.1 million in contractual cash rent from real estate investments made after January 1, 2022, an increase of $5.7 million from increases in rental rates for our existing tenants and a $10.6$2.7 million increase in tenant reimbursements, partially offset by a $7.8 million decrease in rental income related to certain tenants on a cash basis method of accounting and a $0.8$0.4 million decrease in tenant reimbursements, partially offset by an increase of $5.9 million in contractual cash rent from real estate investments made after January 1, 2021 and $4.3 million from increases in rental rates for our existing tenants.
[2]due to dispositions. During the year ended December 31, 2022, the Company wrote off $1.4 million of uncollectible rent.
Interest and other income. The $6.5$10.5 million, or 300%122%, increase in interest and other income is primarily due to an increase of $6.7$10.3 million related to the origination of loans receivable subsequent to January 1, 2022, an increase of $1.3 million in June, Augustinterest income on money market funds and September 2022an increase of $0.6 million related to prepayment penalties, partially offset by a
decrease of $0.2$1.4 million related to repayments of other loans.loans receivable and a decrease of $0.3 million related to a loan origination fee during the year ended December 31, 2022. See above under “Recent Developments” for additional information on the origination of loans receivable.
Depreciation and amortization. Depreciation and amortization expense decreased $5.0increased $0.9 million, or 9%2%, for the year ended December 31, 20222023 to $50.3$51.2 million compared to $55.3$50.3 million for the year ended December 31, 2021.2022. The $5.0$0.9 million decreaseincrease in depreciation and amortization was primarily due to a $5.0an increase of $4.0 million decrease from assets soldrelated to new real estate investments and classified ascapital improvements made after January 1, 2022 and an increase of $1.1 million related to properties reclassified to held for sale andinvestment during the year ended December 31, 2022, partially offset by a decrease in depreciation of $2.8 million due to assets becoming fully depreciated after January 1, 2021, partially offset by an increase in depreciation2022 and amortization of $2.8a $1.4 million related to new real estate investmentsdecrease from assets sold and capital improvements made after January 1, 2021.classified as held for sale.
Interest expense. Interest expense increased by $6.3$10.9 million as detailed below:
| | | | | | | | |
| | Change in interest expense for the year ended December 31, 20222023 compared to the year ended December 31, 20212022 |
| | (in thousands) |
| Increases to interest expense due to: | |
Issuance of the 2028 senior unsecured notes - June 17, 2021 | | $ | 7,110 | |
| Increase in interest rates for the senior unsecured term loan | | $ | 3,3706,826 | |
Increase in outstanding borrowing amount for the unsecured revolving facility, net | | 2,095 | |
| Increase in interest rates for the unsecured revolving credit facility | | 1,5915,275 | |
| Decrease in outstanding borrowing amount for the unsecured revolving facility, net | | (1,607) | |
| Other changes in interest expense | | 43381 | |
Total increaseschange to interest expense | | 14,209 | |
Decreases to interest expense due to: | | |
Redemption of the prior senior notes - July 1, 2021 | | (7,878) | |
Total decreases to interest expense | | (7,878) | |
Total change in interest expense | | $ | 6,33110,875 | |
| | |
| | |
| | |
| | |
Property taxes. Property taxes increased $0.8$1.8 million, or 21%42%, for the year ended December 31, 20222023 compared to December 31, 2021.2022. The increase was primarily due to a $0.6$1.4 million increase in property taxes due to new real estate investments made after January 1, 2021,2022, a $0.2$0.9 million increase due to property taxes expected to be paid directly by us as a result of certain assets being designated as held for sale, a $0.4 million increase in property taxes due to existing operators that no longer make direct tax payments and an increase of $0.2 million of property taxes due to reassessments and increased effective tax rates, partially offset by a decrease of $1.0 million related to two non-operational properties at December 31,sold after January 1, 2022 and a decrease of $0.1 million increase in property taxes due to the transfer of certain properties to new operators in January 2021 that do not make direct tax payments, partially offset by a decrease of $0.1 million of property taxes due to reassessments and decreased effective tax rates.payments.
Impairment of real estate investments. During the twelve months ended December 31, 2023, we recognized aggregate impairment charges of $36.3 million, of which $26.8 million related to properties held for sale, $8.0 million related to properties held for investment, and $1.5 million related to properties that were sold. During the year ended December 31, 2022, we recognized an aggregate impairment chargecharges of $79.1 million, of which $14.4 million related to properties held for sale, $19.7 million related to properties held for investment, and $45.0 million related to 12 facilities that have been sold, $18.0 million related to 10 facilitiesproperties that were classified as held for sale in the first quarter of 2022 and reclassified to held for use in the third and fourth quarters of 2022, $14.4 million related to five facilities that were held for sale as of December 31, 2022, and $1.7 million related to one facility that was held for use during the year.sold. See above under “Recent Developments” for additional information. No impairment charges were recognized during the year ended December 31, 2021.
Provision for loan losses, net. During the year ended December 31, 2022, we recorded a $4.6 million expected credit loss related to two other loans receivable that were placed on non-accrual status, partially offset by a $0.8 million recovery related to one other loan receivable that was previously written off. No provision for loan losses was recognized during the year ended December 31, 2021.2023.
Property operating expenses. During the yearyears ended December 31, 2023 and 2022, we recognized $3.4 million and $5.0 million, respectively, of property operating expenses related to assets we plan to sell or repurpose, re-tenant, or have sold. No similar expenses were incurred during the year ended December 31, 2021.
General and administrative expense. General and administrative expense decreasedincreased by $6.7$1.6 million as detailed below:
| | Year Ended | |
| | Year Ended | |
| (in thousands) | |
| (in thousands) | |
| (in thousands) | (in thousands) | | December 31, 2022 | | December 31, 2021 | | Increase/(Decrease) | | December 31, 2023 | | December 31, 2022 | | Increase/(Decrease) |
| Cash compensation | Cash compensation | | $ | 6,107 | | | $ | 5,364 | | | $ | 743 | |
Share-based compensation[1] | | 5,758 | | | 10,832 | | | (5,074) | |
| Incentive compensation | Incentive compensation | | 3,550 | | | 4,900 | | | (1,350) | |
| Share-based compensation | |
| Professional services | Professional services | | 1,897 | | | 1,601 | | | 296 | |
| Other administrative expense | Other administrative expense | | 923 | | | 915 | | | 8 | |
| Taxes and insurance | Taxes and insurance | | 897 | | | 843 | | | 54 | |
| Non-routine transaction costs | | 6 | | | 1,424 | | | (1,418) | |
| | Other expenses | |
| Other expenses | |
| Other expenses | Other expenses | | 1,027 | | | 995 | | | 32 | |
| Total change in general and administrative expense | Total change in general and administrative expense | | $ | 20,165 | | | $ | 26,874 | | | $ | (6,709) | |
[1] Share-based compensation decreased $5.1 million for the year ended December 31, 2022 compared to December 31, 2021. The decrease is primarily due to accelerated vesting of awards for one executive in the fourth quarter of 2021 in connection with his retirement.
Loss on extinguishment of debt. During the year ended December 31, 2021, we recorded a $10.8 million loss on extinguishment of debt, including a prepayment penalty of $7.9 million and a $2.9 million write-off of deferred financing costs associated with the redemption of the prior senior notes. No loss on extinguishment of debt was recognized during the year ended December 31, 2022.
LossGain (loss) on sale of real estate, net. During the year ended December 31, 2023, we recorded a $2.3 million gain on sale of real estate related to the sale of 2 ALFs and one SNF, partially offset by a $0.1 million loss on sale of real estate related to the sale of two ALFs. During the year ended December 31, 2022, we recorded a $3.8 million loss on sale of real estate related to the sale of six SNFs, five ALFs and one multi-service campus and a $0.2 million loss on sale of real estate related to the sale of a land parcel, partially offset by a $0.2 million gain on sale of real estate related to the sale of one SNF.During the year ended December 31, 2021, we recorded a $0.2 million loss on sale of real estate related to the sale of one SNF, partially offset by a $0.1 million gain on sale of real estate related to the sale of a land parcel adjacent to one of our SNFs.
Unrealized loss on other real estate related investments, net. During the year ended December 31, 2023, we recorded an unrealized loss of $8.1 million on our secured and mezzanine loans receivable due to rising interest rates and a $0.3 million loss due to a loan origination fee paid, partially offset by unrealized gains of $0.7 million due to a decrease in projected forward interest rates and a reversal of a previously recognized unrealized loss of $1.2 million related to the repayment of one mezzanine loan receivable and the partial repayment of one mortgage loan receivable. During the year ended December 31, 2022, we recorded a $7.1 million unrealized loss on three mortgageour secured loans receivable and two mezzanine loans receivable. The unrealized loss iswas due to rising interest rates. No unrealized losses were recognized during the year ended December 31, 2021.
Year Ended December 31, 20212022 Compared to Year Ended December 31, 20202021
For discussion related to the results of operations and changes in financial condition for fiscal 20212022 compared to fiscal 2020,2021, refer to Part II, Item 7, “Management’s Discussion and Analysis of Financial Condition and Results of Operations” in our fiscal 20212022 Annual Report on Form 10-K, which was filed with the SEC on February 16, 2022.9, 2023.
Liquidity and Capital Resources
To qualify as a REIT for federal income tax purposes, we are required to distribute at least 90% of our REIT taxable income, determined without regard to the dividends paid deduction and excluding any net capital gains, to our stockholders on an annual basis. Accordingly, we intend to make, but are not contractually bound to make, regular quarterly dividends to common stockholders from cash flow from operating activities. All such dividends are at the discretion of our board of directors.
Our short-term liquidity requirements consist primarily of operating and interest expenses directly associated with our properties, including:
•interest expense and scheduled debt maturities on outstanding indebtedness;
•general and administrative expenses;
•dividend plans;
•operating lease obligations; and
•capital expenditures for improvements to our properties.
Our long-term liquidity needs consist primarily of funds necessary to pay for acquisitions and other investments (including mortgage and mezzanine loan originations), capital expenditures, and scheduled debt maturities. We intend to invest in and/or develop additional healthcare and seniors housing properties as suitable opportunities arise and so long as adequate sources of financing are available. We expect that future investments in and/or development of properties, including any
improvements or renovations of current or newly-acquired properties, will depend on and will be financed by, in whole or in part, our existing cash, borrowings available to us under the Second Amended Credit Facility (as defined below), future borrowings or the proceeds from sales of shares of our common stock pursuant to our ATM Program or additional issuances of
common stock or other securities. In addition, we may seek financing from U.S. government agencies, including through Fannie Mae and the U.S. Department of Housing and Urban Development, in appropriate circumstances in connection with acquisitions and refinancing of existing mortgage loans.
We believe that our expected operating cash flow from rent collections and interest payments on our other real estate related investments,and borrowings under our Second Amended Credit Facility, together with our cash balance of $13.2$294.4 million, available borrowing capacity of $475.0$600.0 million under the Revolving Facility (as defined below), and availability of $274.1 million under the ATM Program, each at December 31, 2022,2023, will be sufficient to meet ongoing debt service requirements, dividend plans, operating lease obligations, capital expenditures, working capital requirements and other needs for at least the next 12 months. We expect to meet our long-term liquidity needs with cash flows from operations and financing arrangements. While we are currently pursuing the sale, re-tenanting or repurposing of certain of our assets in connection with our ongoing review and monitoring of our investment portfolio, as described under “Recent Developments” above, we currently do not expect to sell any of our properties to meet liquidity needs, although we may do so in the future. Our quarterly cash dividend any share repurchases under our Repurchase Program (as defined below) and any failure of our operators to pay rent or of our borrowers to make interest or principal payments may impact our available capital resources.
On March 20, 2020, our board of directors authorized a share repurchase program to repurchase up to $150.0 million of outstanding shares of our common stock (the “Repurchase Program”). Repurchases under the Repurchase Program, which expires on March 31, 2023, may be made through open market purchases, privately negotiated transactions, structured or derivative transactions, including accelerated share repurchase transactions, or other methods of acquiring shares, in each case subject to market conditions and at such times as shall be permitted by applicable securities laws and determined by management. Repurchases under the Repurchase Program may also be made pursuant to a plan adopted under Rule 10b5-1 promulgated under the Exchange Act. We expect to finance any share repurchases under the Repurchase Program using available cash and may also use short-term borrowings under the Revolving Facility. We did not repurchase any shares of common stock under the Repurchase Program during the year ended December 31, 2022. The Repurchase Program may be modified, discontinued or suspended at any time.
We have filed an automatic shelf registration statement with the U.S. Securities and Exchange Commission that expires in March 2023, which will allowFebruary 2026 and at or prior to such time we expect to file a new shelf registration statement. The shelf registration statement allows us or certain of our subsidiaries, as applicable, to offer and sell shares of common stock, preferred stock, warrants, rights, units and debt securities through underwriters, dealers or agents or directly to purchasers, in one or more offerings on a continuous or delayed basis, in amounts, at prices and on terms we determine at the time of the offering. On September 15, 2023, we entered into the New ATM Program. In addition to the issuance and sale of shares of our common stock, we may also enter into one or more ATM forward contracts with sales agents for the sale of shares of our common stock under the ATM Program. See “At-The-Market Offering of Common Stock” for information regarding activity under the ATM Program.
Although we are subject to restrictions on our ability to incur indebtedness, we expect that we will be able to refinance existing indebtedness or incur additional indebtedness for acquisitions or other purposes, if needed. However, there can be no assurance that we will be able to refinance our indebtedness, incur additional indebtedness or access additional sources of capital, such as by issuing common stock or other debt or equity securities, on terms that are acceptable to us or at all.
We currently are in compliance with all debt covenants on our outstanding indebtedness.
Cash Flows
The following table presents selected data from our consolidated statements of cash flows for the years presented:
| | | | | | | | | | | | | |
| | Year Ended December 31, | | |
| | 2022 | | 2021 | | |
| | (dollars in thousands) |
| Net cash provided by operating activities | $ | 144,415 | | | $ | 156,871 | | | |
| Net cash used in investing activities | (127,400) | | | (192,633) | | | |
| Net cash (used in) provided by financing activities | (23,732) | | | 36,738 | | | |
| Net (decrease) increase in cash and cash equivalents | (6,717) | | | 976 | | | |
| Cash and cash equivalents at beginning of period | 19,895 | | | 18,919 | | | |
| Cash and cash equivalents at end of period | $ | 13,178 | | | $ | 19,895 | | | |
| | | | | | | | | | | | | |
| | Year Ended December 31, | | |
| | 2023 | | 2022 | | |
| | (dollars in thousands) |
| Net cash provided by operating activities | $ | 154,767 | | | $ | 144,415 | | | |
| Net cash used in investing activities | (267,815) | | | (127,400) | | | |
| Net cash provided by (used in) financing activities | 394,318 | | | (23,732) | | | |
| Net increase (decrease) in cash and cash equivalents | 281,270 | | | (6,717) | | | |
| Cash and cash equivalents as of the beginning of period | 13,178 | | | 19,895 | | | |
| Cash and cash equivalents as of the end of period | $ | 294,448 | | | $ | 13,178 | | | |
Year Ended December 31, 20222023 Compared to Year Ended December 31, 20212022
Net cash provided by operating activities for the year ended December 31, 20222023 was $144.4$154.8 million compared to $156.9$144.4 million for the year ended December 31, 2021, a decrease2022, an increase of $12.5$10.4 million. Operating cash inflows are derived primarily from the rental payments received under our lease agreements, including as a result of new investments, and interest payments received on our other real estate related investments. Operating cash outflows consist primarily of interest expense on our borrowings and general and administrative expenses. The net decreaseincrease of $12.5$10.4 million in cash provided by operating activities for the year ended December 31, 2022 is primarily due to a decreasean increase in rental income received, an increase in cash paid for interest expenseincome received on our other real estate related investments, and an increasea decrease in cash paid for operating expenses related to assets we plan to sell, have sold, or repurpose, partially offset by an increase in cash paid for interest income received on our otherexpense.
Cash used in investing activities for the year ended December 31, 2023 was primarily comprised of $297.9 million in acquisitions of real estate and investments in real estate related investments.
investments and other loans receivable, $11.0 million of purchases of equipment, furniture and fixtures and improvements to real estate, and $1.8 million in preferred equity investments, partially offset by $26.5 million of payments received on real estate related investments and other loans receivable and $16.3 million in net proceeds from real estate sales. Cash used in investing activities for the year ended December 31, 2022 was primarily comprised of $171.6 million in acquisitions of real estate and investments in real estate related investments and other loans receivable and $7.3 million of purchases of and improvements to, equipment, furniture and fixtures and improvements to real estate, partially offset by $6.3 million of payments received from our other loans receivable and $45.1 million in net proceeds from real estate sales. Cash used in investing
Our cash flows provided by financing activities for the year ended December 31, 2021 was2023 were primarily comprised of $194.0$634.4 million of net proceeds from the issuance of common stock under the ATM Program and $1.9 million in acquisitions of real estate and investments in real estate related investments and other loans receivable and $6.0 million of purchases of, and improvements to, equipment, furniture and fixtures and real estate,net contributions from noncontrolling interests, partially offset by $0.4 million of payments received from our other loans receivable and $7.0$125.0 million in net proceeds from real estate sales.
payments under our Revolving Credit Facility (as defined below), $115.5 million in dividends paid and $1.5 million in net settlement adjustment on restricted stock. Our cash flows used in financing activities for the year ended December 31, 2022 were primarily comprised of $106.1 million in dividends paid, $5.4 million in payments of deferred financing costs and a $4.5 million net settlement adjustment on restricted stock, partially offset by $47.2 million of net proceeds from the issuance of common stock under the Prior ATM Program and $45.0 million in net borrowings under our Second Amended Credit Facility (as defined below). Our cash flows provided by financing activities for the year ended December 31, 2021 were primarily comprised of $393.8 million of net proceeds from the issuance of the Notes, $30.0 million in net borrowings under our Prior Credit Agreement (as defined below) and $22.9 million of net proceeds from the issuance of common stock under the ATM Program, partially offset by $307.9 million of payments to redeem our prior senior notes, $100.8 million in dividends paid, and a $1.3 million net settlement adjustment on restricted stock.Revolving Facility.
Year Ended December 31, 20212022 Compared to Year Ended December 31, 20202021
For discussion related to the cash flows for fiscal 20212022 compared to fiscal 2020,2021, refer to Part II, Item 7, “Management’s Discussion and Analysis of Financial Condition and Results of Operations” in our fiscal 20212022 Annual Report on Form 10-K, which was filed with the SEC on February 16, 2022.9, 2023.
Material Cash Requirements
Our material cash requirements from known contractual and other obligations include:
3.875% Senior Unsecured Notes due 2028
On June 17, 2021, our wholly owned subsidiary, CTR Partnership, L.P. (the “Operating Partnership”), and its wholly owned subsidiary, CareTrust Capital Corp. (together with the Operating Partnership, the “Issuers”), completed a private
offering of $400.0 million aggregate principal amount of 3.875% Senior Notes due 2028 (the “Notes”). The Notes mature on June 30, 2028. The Notes accrue interest at a rate of 3.875% per annum payable semiannually in arrears on June 30 and December 30 of each year, commencing on December 30, 2021. The obligations under the Notes are guaranteed, jointly and severally, on an unsecured basis, by us and all of our subsidiaries (other than the Issuers) that guarantee obligations under the Second Amended Credit Facility (as defined below). As of December 31, 2022,2023, we were in compliance with all applicable financial covenants under the indenture governing the Notes. See Note 7, Debt, to our consolidated financial statements included in this report for further information about the Notes.
Unsecured Revolving Credit Facility and Term Loan
On December 16, 2022, we, together with certain of our subsidiaries, entered into a second amended and restated credit and guaranty agreement with KeyBank National Association, as administrative agent, an issuing bank and swingline lender (the(as amended from time to time, the “Second Amended Credit Agreement”). The Operating Partnership is the borrower under the Second Amended Credit Agreement, and the obligations thereunder are guaranteed, jointly and severally, on an unsecured basis, by us and certainsubstantially all of our subsidiaries. The Second Amended Credit Agreement, which amends and restates our amended and restated credit and guaranty agreement, dated as of February 8, 2019 (as amended, the “Prior Credit Agreement”) provides for: (i) an unsecured revolving credit facility (the “Revolving Facility”) with revolving commitments in an aggregate principal amount of $600.0 million, including a letter of credit subfacility for 10% of the then available revolving commitments and a swingline loan subfacility for 10% of the then available revolving commitments and (ii) the continuation of the unsecured term loan credit facility which was previously extended under the Prior Credit Agreement (the “Term Loan” and together with the Revolving Facility, the “Second Amended Credit Facility”) in an aggregate principal amount of $200.0 million. Future borrowings under the Second Amended Credit Facility will be used for working capital purposes, for capital expenditures, to fund acquisitions and for general corporate purposes.
On October 10, 2023, we entered into the First Amendment to the Second Amended Credit Agreement with KeyBank National Association (the “First Amendment”). The First Amendment restates the definition of Consolidated Total Asset Value
to include net proceeds from at-the-market forward commitments executed but not yet closed as of the relevant date as if such proceeds had actually been received.
As of December 31, 2022,2023, we had $200.0$200.0 million outstanding under the Term Loan and $125.0 millionno borrowings outstanding under the Revolving Facility. The Revolving Facility has a maturity date of February 9, 2027, and includes, at our sole discretion, two, six-month extension options. The Term Loan has a maturity date of February 8, 2026.
The interest rates applicable to loans under the Revolving Facility are, at the Operating Partnership’s option, equal to either a base rate plus a margin ranging from 0.10% to 0.55% per annum or Adjusted Term SOFR or Adjusted Daily Simple SOFR (each as defined in the Second Amended Credit Agreement) plus a margin ranging from 1.10% to 1.55% per annum based on the debt to asset value ratio of the Company and our consolidated subsidiaries (subject to decrease at the Operating Partnership’s election if we obtain certain specified investment grade ratings on our senior long-term unsecured debt). The interest rates applicable to loans under the Term Loan are, at the Operating Partnership’s option, equal to either a base rate plus a margin ranging from 0.50% to 1.20% per annum or Adjusted Term SOFR or Adjusted Daily Simple SOFR plus a margin ranging from 1.50% to 2.20% per annum based on the debt to asset value ratio of the Company and our consolidated subsidiaries (subject to decrease at the Operating Partnership’s election if we obtain certain specified investment grade ratings on our senior long-term unsecured debt). In addition, the Operating Partnership will pay a facility fee on the revolving commitments under the Revolving Facility ranging from 0.15% to 0.35% per annum, based on the debt to asset value ratio of the Company and our consolidated subsidiaries (unless we obtain certain specified investment grade ratings on our senior long-term unsecured debt and the Operating Partnership elects to decrease the applicable margin as described above, in which case the Operating Partnership will pay a facility fee on the revolving commitments ranging from 0.125% to 0.30% per annum based off the credit ratings of our senior long-term unsecured debt).
As of December 31, 2022,2023, we were in compliance with all applicable financial covenants under the Second Amended Credit Agreement. See Note 7, Debt, to our consolidated financial statements included in this report for further information about the Second Amended Credit Agreement.
Capital Expenditures
As of December 31, 2022,2023, we had committed to fund expansions, construction, and capital improvements and ESG incentives at certain triple-net leased facilities totalitotng $15.7aling $9.2 million, of which $2.7$2.4 million is ssubjectubject to rent increase at the time of funding. We expect to fund the capital expenditures in the next one to two years. See Note 11,12, Commitments and Contingencies, to our consolidated financial statements included in this report for further information regarding our obligation to finance certain capital expenditures under our triple-net leases.
Dividend Plans
We are required to pay dividends in order to maintain our REIT status, and we expect to make quarterly dividend payments in cash with the annual dividend amount no less than 90% of our annual REIT taxable income, determined without regard to the dividends paid deduction and excluding any net capital gains. See Note 8, Equity, to our consolidated financial
statements included in this report for a summary of the cash dividends per share of our common stock declared by our board of directors for 2023, 2022 2021 and 2020.2021.
Critical Accounting Estimates
The preparation of financial statements in conformity with GAAP accounting principles generally accepted in the United States (“GAAP”) requires management to make estimates and assumptions that affect the reported amounts of assets and liabilities and disclosure of contingent assets and liabilities at the date of the financial statements and the reported amounts of revenue and expenses during the reporting periods. Management believes that the assumptions and estimates used in preparation of the underlying consolidated financial statements are reasonable. Actual results, however, could differ from those estimates and assumptions.
Certain accounting policiesAccounting estimates are considereddeemed critical if they involve a significant level of estimation uncertainty and have had or are reasonably likely to be critical accounting policies. Critical accounting policies are those policies that require management to make significant estimates and/or assumptions about matters that are uncertain at the time the estimates and/or assumptions are made or where we are required to make significant judgments and assumptions with respect to the practical application of accounting principles in our business operations. Critical accounting policies are by definition those policies that are material to our financial statements and for which the impact of changes in estimates, assumptions, and judgments could have a material impact toon our financial statements.
The followingcondition or results of operations. Below is a summary of the critical accounting policies discussion reflects what we believe are the most significant estimates assumptions, and judgments used in the preparation of our consolidated financial statements. This discussion of our critical accounting policies is intended to supplement the description of our accounting policies in the footnotes to our consolidated financial statements and to provide additional insight into the information used by management when evaluating significant estimates, assumptions, and judgments. For a discussion of our significant accounting policies, see Note 2, Summary of Significant Accounting Policies, to our consolidated financial statements included in this report.
Real Estate Acquisition Valuation. In accordance with Accounting Standards Codification (“ASC”) 805, Business Combinations, our acquisitions of real estate investments generally do not meet the definition of a business, and are treated as asset acquisitions. The assets acquired and liabilities assumed are measured at their acquisition date relative fair values. Acquisition costs are capitalized as incurred. We allocate the acquisition costs to the tangible assets, identifiable intangible assets/liabilities and assumed liabilities on a relative fair value basis. Purchase price allocations contain uncertainties because they require management to make significant estimates and assumptions and to apply judgment to allocate the purchase price of real estate acquired among its components. We assess fair value based on available market information, such as capitalization and discount rates, comparable sale transactions and relevant per square foot or unit cost information. A real estate asset’s fair value may be determined utilizing cash flow projections that incorporate such market information. Estimates of future cash flows are based on a number of factors including historical operating results, known and anticipated trends, as well as market and economic conditions. The fair value of land is derived from comparable sales of land within the same submarket and/or region. The fair value of buildings and improvements and integral equipment, furniture and fixtures considers the value of the property as if it was vacant as well as replacement costs, depreciation factors, and other relevant market information. The use of different assumptions in these fair value inputs could significantly affect the reported amounts of the allocation of the acquisition on a relative fair value basis and the related depreciation expense recorded for such assets. If actual results are materially different than the assumptions used to determine fair value of the assets acquired and liabilities assumed, it is possible that adjustments to the carrying values of such assets and liabilities will have a material impact on our financial position and results of operations. Furthermore, if actual results are not consistent with estimates or assumptions, we may be exposed to an impairment charge that could materially adversely impact our financial position and results of operations. We have not materially changed the assumptions used in the analysis during the year ended December 31, 2022.
Impairment of Long-Lived Assets. At each reporting period, we evaluate our real estate investments held for use for potential impairment whenever events or changes in circumstances indicate that the carrying amount of the assets may not be
recoverable. The judgment regarding the existence of impairment indicators, used to determine if an impairment assessment is necessary, is based on factors such as, but not limited to, market conditions, operator performance and legal structure. If indicators of impairment are present, we evaluate the carrying value of the related real estate investments in relation to the future undiscounted cash flows of the underlying facilities. The most significant inputs to the undiscounted cash flows include, but are not limited to, historical and projected facility level financial results, a lease coverage ratio, the intended hold period by us, and a terminal capitalization rate. The analysis is also significantly impacted by determining the lowest level of cash flows, which generally would be at the master lease level of cash flows. Provisions for impairment losses related to long-lived assets are recognized when expected future undiscounted cash flows are determined to be less than the carrying values of the assets. The impairment is measured as the excess of carrying value over fair value.
the real estate investment is based on current market conditions and considers matters such as the forecasted operating cash flows, lease coverage ratios, capitalization rates, and, where applicable, terms of recent lease agreements or the results of negotiations with prospective tenants. We classify our real estate investments as held for sale when the applicable criteria have been met, which includes a formal plan to sell the properties that is expected to be completed within one year, among other criteria. Upon designation as held for sale, we write down the excess of the carrying value over the estimated fair value less costs to sell, resulting in an impairment of the real estate investments, if necessary, and cease depreciation. The fair value of the assets held for sale is based on estimated sales prices, which are considered to be Level 3 measurements within the fair value hierarchy. Estimated sales prices are determined using a market approach (comparable sales model), which relies on certain assumptions by management, including: (i) comparable market transactions, (ii) estimated prices per unit, and (iii) binding agreements for sales and non-binding offers to purchase from unrelated third-parties. There are inherent uncertainties in making these assumptions.
If circumstances arise that previously were considered unlikely and, as a result, we decide not to sell a real estate investment previously classified as held for sale or otherwise no longer meets the held for sale criteria, the respective assets are reclassified as real estate investments held for use. A real estate investment that is reclassified is measured and recorded individually at the lower of (a) its carrying amount before the real estate investment was classified as held for sale, adjusted for any depreciation expense that would have been recognized had the real estate investment been continuously classified as held for use, or (b) the fair value at the date of the decision not to sell or change in circumstances that led to the real estate investment no longer meeting the criteria of held for sale. The fair value of the real estate investment is based on current market conditions and considers matters such asdetermined in a similar manner to the forecasted operating cash flows, lease coverage ratios, capitalization rates, and, where applicable, terms of recent lease agreements or the results of negotiations with prospective tenants.fair value determination for real estate investments held for use described above.
Our ability to accurately estimate future cash flows and estimate and allocate fair values impacts the timing and recognition of impairments. While we believe our assumptions are reasonable, changes in these assumptions may have a material impact on financial results. Given the ongoing impacts of COVID-19,current macroeconomic events, the projected cash flows that we use to assess fair value for purposes of impairment testing are subject to greater uncertainty than normal. If in the future we reduce our estimate of cash flow projections, we may need to impair some of theseour real estate assets. We have not materially changed the assumptions used in the analysis during the year ended December 31, 2022.2023.
Revenue Recognition. We recognize lease revenue in accordance with ASC 842, Leases. See Note 2, Summary of Significant Accounting Policies, in the Notes to Consolidated Financial Statements for further detail.Our assessment of collectibility of tenant receivables includes a binary assessment of whether or not substantially all of the amounts due under a tenant’s lease agreement are probable of collection. This assessment involves significant judgment by management and considers the operator’s performance and anticipated trends, payment history, and the existence and creditworthiness of guarantees, among other factors, in making this determination. For such leases that are deemed probable of collection, revenue continues to be recorded on a straight-line basis over the lease term, if applicable. For such leases that are deemed not probable of collection, revenue is recorded as the lesser of (i) the amount which would be recognized on a straight-line basis or (ii) cash that has been received from the tenant, with any tenant and deferred rent receivable balances charged as a direct write-off against rental income in the period of the change in the collectibility determination. Management’s judgement can impact the timing of write-offs and recovery adjustments. We did not materially change the assumptions used in the analysis during the year ended December 31, 2022.2023.
Fair Value of Other Real Estate Related Investments. We have elected the fair value option for our other real estate related investments for which such election is permitted, as provided for under ASC 825, Financial Instruments (“ASC 825”). For financial instruments that are traded in an "active market," the best measure of fair value is the quoted market price. In cases where market-observable data is not available, the data used for the measurement must reflect assumptions that market participants would use in pricing the asset or liability (including adjustments that market participants demand for the risk associated with the unobservable data or the model used to determine fair value). We have concluded to use a present value technique, a discounted cash flow model, to determine fair value.
The determination of estimated fair value of our other real estate related investments requires the use of both macroeconomic and microeconomic assumptions and/or inputs, which are generally based on current market and economic conditions, such as changes in the risk-free or benchmark rate and changes attributable to instrument-specific credit risk (e.g., changes in credit spread associated with the instrument). Changes in market and/or economic conditions could have a significant adverse effect on the estimated fair value of our financial instruments. Changes to assumptions, including assumed benchmark rates and credit spreads, may significantly impact the estimated fair value of our investments.
Because of the inherent uncertainty of valuation, the estimated fair value of our financial instruments may differ significantly from the values that would have been used had a ready market for the financial instruments existed, and the differences could be material to our consolidated financial statements.
Impact of Inflation
Our rental income in future years will be impacted by changes in inflation. Almost all of our triple-net lease agreements, including the Ensign leases, provide for an annual rent escalator based on the percentage change in the Consumer Price Index (but not less than zero), subject to maximum fixed percentages.
ITEM 7A. Quantitative and Qualitative Disclosures About Market Risk
Our primary market risk exposure is interest rate risk with respect to our variable rate indebtedness.
Our Second Amended Credit Agreement provides for: (i) an unsecured revolving credit facility (the “Revolving Facility”) with revolving commitments in an aggregate principal amount of $600.0 million, including a letter of credit subfacility for 10% of the then available revolving commitments and a swingline loan subfacility for 10% of the then available revolving commitments and (ii) an unsecured term loan credit facility (the “Term Loan”) in an aggregate principal amount of $200.0 million from a syndicate of banks and other financial institutions.
The interest rates applicable to loans under the Revolving Facility are, at the Operating Partnership’s option, equal to either a base rate plus a margin ranging from 0.10% to 0.55% per annum or Adjusted Term SOFR or Adjusted Daily Simple SOFR (each as defined in the Second Amended Credit Agreement) plus a margin ranging from 1.10% to 1.55% per annum based on the debt to asset value ratio of the Company and our consolidated subsidiaries (subject to decrease at the Operating Partnership’s election if we obtain certain specified investment grade ratings on our senior long-term unsecured debt). The interest rates applicable to loans under the Term Loan are, at the Operating Partnership’s option, equal to either a base rate plus a margin ranging from 0.50% to 1.20% per annum or Adjusted Term SOFR or Adjusted Daily Simple SOFR plus a margin ranging from 1.50% to 2.20% per annum based on the debt to asset value ratio of the Company and our consolidated subsidiaries (subject to decrease at the Operating Partnership’s election if we obtain certain specified investment grade ratings on our senior long-term unsecuredunsecured debt). As of December 31, 2022,2023, we had a $200.0 million Term Loan outstanding and there was $125.0 million outstanding no borrowings outstanding under the Revolving Facility.
Based on our outstanding debt balance as of December 31, 20222023 described above and the interest rates applicable to our outstanding debt at December 31, 2022,2023, assuming a 100 basis point increase in the interest rates related to our variable rate debt, interest expense would have increased approximately $3.3$2.0 million for the year ended December 31, 2022.2023.
An increase in interest rates could make the financing of any acquisition by us more costly as well as increase the costs of our variable rate debt obligations. Rising interest rates could also limit our ability to refinance our debt when it matures or cause us to pay higher interest rates upon refinancing and increase interest expense on refinanced indebtedness. Increased inflation may also have a pronounced negative impact on the interest expense we pay in connection with our outstanding indebtedness, as these costs could increase at a rate higher than our rents.
We may, in the future, manage, or hedge, interest rate risks related to our borrowings by means of interest rate swap agreements. However, the REIT provisions of the Code substantially limit our ability to hedge our assets and liabilities. See “Risk Factors - Risks Related to Our Status as a REIT - Complying with REIT requirements may limit our ability to hedge effectively and may cause us to incur tax liabilities.” As of December 31, 2022,2023, we had no swap agreements to hedge our interest rate risks. We also expect to manage our exposure to interest rate risk by maintaining a mix of fixed and variable rates for our indebtedness.
ITEM 8. Financial Statements and Supplementary Data
See the Index to Consolidated Financial Statements on page F-1 of this report.
ITEM 9. Changes in and Disagreements with Accountants on Accounting and Financial Disclosures
None.
ITEM 9A. Controls and Procedures
Disclosure Controls and Procedures
We maintain disclosure controls and procedures (as such term is defined in Rules 13a-15(e) and 15d-15(e) under the Exchange Act) that are designed to ensure that information required to be disclosed in our reports under the Exchange Act is processed, recorded, summarized and reported within the time periods specified in the SEC’s rules and regulations and that such information is accumulated and communicated to management, including our Chief Executive Officer and Chief Financial Officer, as appropriate, to allow for timely decisions regarding required disclosure. In designing and evaluating the disclosure
controls and procedures, management recognizes that any controls and procedures, no matter how well designed and operated, can provide only reasonable assurance of achieving the desired control objectives, and management is required to apply its judgment in evaluating the cost-benefit relationship of possible controls and procedures.
As of December 31, 2022,2023, we carried out an evaluation, under the supervision and with the participation of management, including our Chief Executive Officer and Chief Financial Officer, regarding the effectiveness of our disclosure controls and procedures. Based on the foregoing, our Chief Executive Officer and Chief Financial Officer concluded that our disclosure controls and procedures were effective as of December 31, 2022.2023.
Management’s Annual Report on Internal Control over Financial Reporting
Our management is responsible for establishing and maintaining adequate internal control over financial reporting (as defined in Rules 13a-15(f) and 15d-15(f) of the Exchange Act) to provide reasonable assurance regarding the reliability of our financial reporting and the preparation of financial statements for external purposes in accordance with generally accepted accounting principles. Internal control over financial reporting includes those policies and procedures that (i) pertain to the maintenance of records that in reasonable detail accurately and fairly reflect the transactions and dispositions of our assets; (ii) provide reasonable assurance that the transactions are recorded as necessary to permit preparation of financial statements in accordance with generally accepted accounting principles, and that our receipts and expenditures are being made only in accordance with authorizations of our management and our directors; and (iii) provide reasonable assurance regarding prevention or timely detection of unauthorized acquisition, use or disposition of our assets that could have a material effect on the financial statements.
We carried out an evaluation, under the supervision and with the participation of our management, including our Chief Executive Officer and Chief Financial Officer, regarding the effectiveness of our internal control over financial reporting using the criteria set forth by the Committee of Sponsoring Organizations of the Treadway Commission (COSO) in Internal Control - Integrated Framework (2013). Based on this evaluation, our management concluded that our internal control over financial reporting was effective as of December 31, 2022.2023.
Changes in Internal Control over Financial Reporting
There has been no change in our internal control over financial reporting (as such term is defined in Rules 13a-15(f) and 15d-15(f) under the Exchange Act) that occurred during the quarter ended December 31, 2022,2023, that has materially affected, or is reasonably likely to materially affect, our internal control over financial reporting.
Attestation Report of the Independent Registered Public Accounting Firm
The effectiveness of our internal control over financial reporting as of December 31, 20222023 has been audited by Deloitte & Touche LLP, an independent registered public accounting firm, as stated in their report which is included herein.
REPORT OF INDEPENDENT REGISTERED PUBLIC ACCOUNTING FIRM
To the stockholders and the Board of Directors of CareTrust REIT, Inc.
Opinion on Internal Control over Financial Reporting
We have audited the internal control over financial reporting of CareTrust REIT, Inc. and subsidiaries (the “Company”) as of December 31, 2022,2023, based on criteria established in Internal Control — Integrated Framework (2013) issued by the Committee of Sponsoring Organizations of the Treadway Commission (“COSO”)(COSO). In our opinion, the Company maintained, in all material respects, effective internal control over financial reporting as of December 31, 2022,2023, based on criteria established in Internal Control — Integrated Framework (2013) issued by COSO.
We have also audited, in accordance with the standards of the Public Company Accounting Oversight Board (United States) (PCAOB), the consolidated financial statements as of and for the year ended December 31, 2022,2023, of the Company and our report dated February 9, 2023,8, 2024, expressed an unqualified opinion on those financial statements.
Basis for Opinion
The Company’s management is responsible for maintaining effective internal control over financial reporting and for its assessment of the effectiveness of internal control over financial reporting, included in the accompanying Management’s Annual Report on Internal Control over Financial Reporting. Our responsibility is to express an opinion on the Company’s internal control over financial reporting based on our audit. We are a public accounting firm registered with the PCAOB and are required to be independent with respect to the Company in accordance with the U.S. federal securities laws and the applicable rules and regulations of the Securities and Exchange Commission and the PCAOB.
We conducted our audit in accordance with the standards of the PCAOB. Those standards require that we plan and perform the audit to obtain reasonable assurance about whether effective internal control over financial reporting was maintained in all material respects. Our audit included obtaining an understanding of internal control over financial reporting, assessing the risk that a material weakness exists, testing and evaluating the design and operating effectiveness of internal control based on the assessed risk, and performing such other procedures as we considered necessary in the circumstances. We believe that our audit provides a reasonable basis for our opinion.
Definition and Limitations of Internal Control over Financial Reporting
A company’s internal control over financial reporting is a process designed to provide reasonable assurance regarding the reliability of financial reporting and the preparation of financial statements for external purposes in accordance with generally accepted accounting principles. A company’s internal control over financial reporting includes those policies and procedures that (1) pertain to the maintenance of records that, in reasonable detail, accurately and fairly reflect the transactions and dispositions of the assets of the company; (2) provide reasonable assurance that transactions are recorded as necessary to permit preparation of financial statements in accordance with generally accepted accounting principles, and that receipts and expenditures of the company are being made only in accordance with authorizations of management and directors of the company; and (3) provide reasonable assurance regarding prevention or timely detection of unauthorized acquisition, use, or disposition of the company’s assets that could have a material effect on the financial statements.
Because of its inherent limitations, internal control over financial reporting may not prevent or detect misstatements. Also, projections of any evaluation of effectiveness to future periods are subject to the risk that controls may become inadequate because of changes in conditions, or that the degree of compliance with the policies or procedures may deteriorate.
/s/ DELOITTEDeloitte & TOUCHETouche LLP
Costa Mesa, California
February 9, 20238, 2024
ITEM 9B. Other Information
Not applicable.Insider Trading Arrangements
None.
ITEM 9C. Disclosure Regarding Foreign Jurisdictions That Prevent Inspections
Not applicable.
PART III
ITEM 10. Directors, Executive Officers and Corporate Governance
The information required under Item 10 is incorporated herein by reference to our definitive proxy statement to be filed with the SEC within 120 days after the end of our fiscal year ended December 31, 20222023 in connection with our 20232024 Annual Meeting of Stockholders.
Code of Conduct and Ethics
We have adopted a code of business conduct and ethics that applies to all employees, including employees of our subsidiaries, as well as each member of our Board of Directors. The code of business conduct and ethics is available at our website at www.caretrustreit.com under the Investors-Corporate GovernanceInvestors-Governance section. We intend to satisfy any disclosure requirement under applicable rules of the Securities and Exchange Commission or the New York Stock Exchange regarding an amendment to, or waiver from, a provision of this code of business conduct and ethics by posting such information on our website, at the address specified above.
ITEM 11. Executive Compensation
The information required under Item 11 is incorporated herein by reference to our definitive proxy statement to be filed with the SEC within 120 days after the end of our fiscal year ended December 31, 20222023 in connection with our 20232024 Annual Meeting of Stockholders.
ITEM 12. Security Ownership of Certain Beneficial Owners and Management and Related Stockholder Matters
The information required under Item 12 is incorporated herein by reference to our definitive proxy statement to be filed with the SEC within 120 days after the end of our fiscal year ended December 31, 20222023 in connection with our 20232024 Annual Meeting of Stockholders.
ITEM 13. Certain Relationships and Related Transactions, and Director Independence
The information required under Item 13 is incorporated herein by reference to our definitive proxy statement to be filed with the SEC within 120 days after the end of our fiscal year ended December 31, 20222023 in connection with our 20232024 Annual Meeting of Stockholders.
ITEM 14. Principal Accountant Fees and Services
The information required under Item 14 is incorporated herein by reference to our definitive proxy statement to be filed with the SEC within 120 days after the end of our fiscal year ended December 31, 20222023 in connection with our 20232024 Annual Meeting of Stockholders.
PART IV
ITEM 15. Exhibit and Financial Statement Schedules | | | | | |
| (a)(1) | Financial Statements |
| |
| | See Index to Consolidated Financial Statements on page F-1 of this report. |
| |
| (a)(2) | Financial Statement Schedules |
| |
| | Schedule III: Real Estate Assets and Accumulated Depreciation |
| |
| Schedule IV: Mortgage Loans on Real Estate |
| |
| | Note: All other schedules have been omitted because the required information is presented in the financial statements and the related notes or because the schedules are not applicable. |
| |
| (a)(3) | Exhibits |
| |
| |
| |
| |
| |
| |
| |
| Indenture, dated as of June 17, 2021, among CTR Partnership, L.P. and CareTrust Capital Corp., as Issuers, CareTrust REIT, Inc., the other guarantors named therein, and Wells Fargo Bank, National Association, as Trustee (incorporated by reference to Exhibit 4.1 to the CareTrust REIT, Inc.’s Current Report on Form 8-K, filed on June 17, 2021). |
| |
| |
| |
| |
| |
| |
| |
| |
| |
| |
| |
| |
| |
| Second Amended and Restated Credit and Guaranty Agreement, dated as of December 16, 2022 by and among CTR Partnership, L.P., as borrower, CareTrust REIT, Inc., as guarantor, CareTrust GP, LLC and the other guarantors named therein and KeyBank National Association, as administrative agent, an issuing lender and swingline lender and the other parties thereto (incorporated by reference to Exhibit 10.1 to CareTrust REIT, Inc.’s Current Report on Form 8-K filed on December 19, 2022). |
| |
| |
| |
| |
| |
| |
| |
| |
| | | | | |
| |
| |
| |
| |
| |
| |
| |
| |
| |
| |
| |
| |
| |
| |
| |
| |
| |
| |
| |
| |
| |
| |
| *101.INS | Inline XBRL Instance Document - the instance document does not appear in the Interactive Data File because its XBRL tags are embedded within the Inline XBRL document |
| |
| *101.SCH | XBRL Taxonomy Extension Schema Document |
| |
| *101.CAL | XBRL Taxonomy Extension Calculation Linkbase Document |
| |
| *101.DEF | XBRL Taxonomy Extension Definition Linkbase Document |
| |
| *101.LAB | XBRL Taxonomy Extension Label Linkbase Document |
| |
| *101.PRE | XBRL Taxonomy Extension Presentation Linkbase Document |
| |
| *104 | Cover Page Interactive Data File (formatted as inline XBRL and contained in Exhibit 101) |
| |
* Filed herewith.
** Furnished herewith.
+ Management contract or compensatory plan or arrangement.
ITEM 16. Form 10-K Summary
None.
SIGNATURESBasis for Opinion
PursuantThe Company’s management is responsible for maintaining effective internal control over financial reporting and for its assessment of the effectiveness of internal control over financial reporting, included in the accompanying Management’s Annual Report on Internal Control over Financial Reporting. Our responsibility is to express an opinion on the Company’s internal control over financial reporting based on our audit. We are a public accounting firm registered with the PCAOB and are required to be independent with respect to the requirements of Section 13 or 15(d)Company in accordance with the U.S. federal securities laws and the applicable rules and regulations of the Securities and Exchange ActCommission and the PCAOB.
We conducted our audit in accordance with the standards of 1934, the registrant has duly caused this reportPCAOB. Those standards require that we plan and perform the audit to be signedobtain reasonable assurance about whether effective internal control over financial reporting was maintained in all material respects. Our audit included obtaining an understanding of internal control over financial reporting, assessing the risk that a material weakness exists, testing and evaluating the design and operating effectiveness of internal control based on its behalf by the undersigned, thereunto duly authorized.assessed risk, and performing such other procedures as we considered necessary in the circumstances. We believe that our audit provides a reasonable basis for our opinion.
| | | | | |
CARETRUST REIT, INC. |
| |
By: | /S/ DAVID M. SEDGWICK
|
| David M. Sedgwick |
| President and Chief Executive Officer |
|
Dated: February 9, 2023 |
PursuantDefinition and Limitations of Internal Control over Financial Reporting
A company’s internal control over financial reporting is a process designed to provide reasonable assurance regarding the reliability of financial reporting and the preparation of financial statements for external purposes in accordance with generally accepted accounting principles. A company’s internal control over financial reporting includes those policies and procedures that (1) pertain to the
requirementsmaintenance of records that, in reasonable detail, accurately and fairly reflect the transactions and dispositions of the
Securities Exchange Act of 1934, this report has been signed below by the following persons on behalfassets of the
registrantcompany; (2) provide reasonable assurance that transactions are recorded as necessary to permit preparation of financial statements in accordance with generally accepted accounting principles, and
that receipts and expenditures of the company are being made only in
accordance with authorizations of management and directors of the
capacitiescompany; and
(3) provide reasonable assurance regarding prevention or timely detection of unauthorized acquisition, use, or disposition of the company’s assets that could have a material effect on the
dates indicated. | | | | | | | | | | | | | | |
Name
| | Title | | Date
|
| | | | |
/s/ DAVID M. SEDGWICK | | President and Chief Executive Officer (Principal Executive Officer) | | February 9, 2023 |
David M. Sedgwick | | | | |
/s/ WILLIAM M. WAGNER | | Chief Financial Officer and Treasurer (Principal Financial Officer and Principal Accounting Officer) | | February 9, 2023 |
William M. Wagner | | | | |
/s/ DIANA LAING | | Director | | February 9, 2023 |
Diana Laing | | | | |
/s/ ANNE OLSON | | Director | | February 9, 2023 |
Anne Olson | | | | |
/s/ SPENCER PLUMB | | Director | | February 9, 2023 |
Spencer Plumb | | | | |
/s/ CAREINA WILLIAMS | | Director | | February 9, 2023 |
Careina Williams | | | | |
| | | | |
| | | | |
financial statements. Because of its inherent limitations, internal control over financial reporting may not prevent or detect misstatements. Also, projections of any evaluation of effectiveness to future periods are subject to the risk that controls may become inadequate because of changes in conditions, or that the degree of compliance with the policies or procedures may deteriorate.
/s/ Deloitte & Touche LLP
Costa Mesa, California
February 8, 2024
ITEM 9B.Other Information
Insider Trading Arrangements
None.
ITEM 9C.Disclosure Regarding Foreign Jurisdictions That Prevent Inspections
Not applicable.
PART III
ITEM 10.Directors, Executive Officers and Corporate Governance
The information required under Item 10 is incorporated herein by reference to our definitive proxy statement to be filed with the SEC within 120 days after the end of our fiscal year ended December 31, 2023 in connection with our 2024 Annual Meeting of Stockholders.
Code of Conduct and Ethics
We have adopted a code of business conduct and ethics that applies to all employees, including employees of our subsidiaries, as well as each member of our Board of Directors. The code of business conduct and ethics is available at our website at www.caretrustreit.com under the Investors-Governance section. We intend to satisfy any disclosure requirement under applicable rules of the Securities and Exchange Commission or the New York Stock Exchange regarding an amendment to, or waiver from, a provision of this code of business conduct and ethics by posting such information on our website, at the address specified above.
ITEM 11.Executive Compensation
The information required under Item 11 is incorporated herein by reference to our definitive proxy statement to be filed with the SEC within 120 days after the end of our fiscal year ended December 31, 2023 in connection with our 2024 Annual Meeting of Stockholders.
ITEM 12.Security Ownership of Certain Beneficial Owners and Management and Related Stockholder Matters
The information required under Item 12 is incorporated herein by reference to our definitive proxy statement to be filed with the SEC within 120 days after the end of our fiscal year ended December 31, 2023 in connection with our 2024 Annual Meeting of Stockholders.
ITEM 13. Certain Relationships and Related Transactions, and Director Independence
The information required under Item 13 is incorporated herein by reference to our definitive proxy statement to be filed with the SEC within 120 days after the end of our fiscal year ended December 31, 2023 in connection with our 2024 Annual Meeting of Stockholders.
ITEM 14.Principal Accountant Fees and Services
The information required under Item 14 is incorporated herein by reference to our definitive proxy statement to be filed with the SEC within 120 days after the end of our fiscal year ended December 31, 2023 in connection with our 2024 Annual Meeting of Stockholders.
INDEX TO CONSOLIDATED FINANCIAL STATEMENTSPART IV
| | | | | |
| |
| Page
|
Report of Independent Registered Public Accounting Firm (PCAOB ID No. 34) with respect to CareTrust REIT, Inc. | |
Consolidated Balance Sheets as of December 31, 2022 and 2021 | |
Consolidated Statements of Operations for the years ended December 31, 2022, 2021 and 2020 | |
Consolidated Statements of Equity for the years ended December 31, 2022, 2021 and 2020 | |
Consolidated Statements of Cash Flows for the years ended December 31, 2022, 2021 and 2020 | |
Notes to Consolidated Financial Statements | |
| |
Schedule III: Real Estate Assets and Accumulated Depreciation | |
Schedule IV: Mortgage Loans on Real Estate | |
REPORT OF INDEPENDENT REGISTERED PUBLIC ACCOUNTING FIRMITEM 15.Exhibit and Financial Statement Schedules | | | | | |
| (a)(1) | Financial Statements |
| |
| See Index to Consolidated Financial Statements on page F-1 of this report. |
| |
| (a)(2) | Financial Statement Schedules |
| |
| Schedule III: Real Estate Assets and Accumulated Depreciation |
| |
| Schedule IV: Mortgage Loans on Real Estate |
| |
| Note: All other schedules have been omitted because the required information is presented in the financial statements and the related notes or because the schedules are not applicable. |
| |
| (a)(3) | Exhibits |
| |
| |
| |
| |
| |
| |
| |
| Indenture, dated as of June 17, 2021, among CTR Partnership, L.P. and CareTrust Capital Corp., as Issuers, CareTrust REIT, Inc., the other guarantors named therein, and Wells Fargo Bank, National Association, as Trustee (incorporated by reference to Exhibit 4.1 to the CareTrust REIT, Inc.’s Current Report on Form 8-K, filed on June 17, 2021). |
| |
| |
| |
| |
| |
| |
| |
| |
| |
| |
| |
| |
| |
| Second Amended and Restated Credit and Guaranty Agreement, dated as of December 16, 2022 by and among CTR Partnership, L.P., as borrower, CareTrust REIT, Inc., as guarantor, CareTrust GP, LLC and the other guarantors named therein and KeyBank National Association, as administrative agent, an issuing lender and swingline lender and the other parties thereto (incorporated by reference to Exhibit 10.1 to CareTrust REIT, Inc.’s Current Report on Form 8-K filed on December 19, 2022). |
| |
| |
| |
| |
| |
| |
| |
| |
| | | | | |
| |
| |
| |
| |
| |
| |
| |
| |
| |
| |
| |
| |
| |
| |
| |
| |
| |
| |
| |
| |
| |
| |
| |
| |
| |
| *101.INS | Inline XBRL Instance Document - the instance document does not appear in the Interactive Data File because its XBRL tags are embedded within the Inline XBRL document |
| |
| *101.SCH | XBRL Taxonomy Extension Schema Document |
| |
| *101.CAL | XBRL Taxonomy Extension Calculation Linkbase Document |
| |
| *101.DEF | XBRL Taxonomy Extension Definition Linkbase Document |
| |
| *101.LAB | XBRL Taxonomy Extension Label Linkbase Document |
| |
| *101.PRE | XBRL Taxonomy Extension Presentation Linkbase Document |
| |
| *104 | Cover Page Interactive Data File (formatted as inline XBRL and contained in Exhibit 101) |
| |
* Filed herewith.
** Furnished herewith.
+ Management contract or compensatory plan or arrangement.
ITEM 16. Form 10-K Summary
None.
To the stockholders and the Board of Directors of CareTrust REIT, Inc.
Opinion on the Financial Statements
We have audited the accompanying consolidated balance sheets of CareTrust REIT, Inc. and subsidiaries (the "Company") as of December 31, 2022 and 2021, the related consolidated statements of operations, equity, and cash flows, for each of the three years in the period ended December 31, 2022, and the related notes and the schedules listed in the Index at Item 15 (collectively referred to as the "financial statements"). In our opinion, the financial statements present fairly, in all material respects, the financial position of the Company as of December 31, 2022 and 2021, and the results of its operations and its cash flows for each of the three years in the period ended December 31, 2022, in conformity with accounting principles generally accepted in the United States of America.
We have also audited, in accordance with the standards of the Public Company Accounting Oversight Board (United States) (PCAOB), the Company's internal control over financial reporting as of December 31, 2022, based on criteria established in Internal Control — Integrated Framework (2013) issued by the Committee of Sponsoring Organizations of the Treadway Commission and our report dated February 9, 2023, expressed an unqualified opinion on the Company's internal control over financial reporting.
Basis for Opinion
The Company’s management is responsible for maintaining effective internal control over financial reporting and for its assessment of the effectiveness of internal control over financial reporting, included in the accompanying Management’s Annual Report on Internal Control over Financial Reporting. Our responsibility is to express an opinion on the Company’s internal control over financial reporting based on our audit. We are a public accounting firm registered with the PCAOB and are required to be independent with respect to the Company in accordance with the U.S. federal securities laws and the applicable rules and regulations of the Securities and Exchange Commission and the PCAOB.
We conducted our audit in accordance with the standards of the PCAOB. Those standards require that we plan and perform the audit to obtain reasonable assurance about whether effective internal control over financial reporting was maintained in all material respects. Our audit included obtaining an understanding of internal control over financial reporting, assessing the risk that a material weakness exists, testing and evaluating the design and operating effectiveness of internal control based on the assessed risk, and performing such other procedures as we considered necessary in the circumstances. We believe that our audit provides a reasonable basis for our opinion.
Definition and Limitations of Internal Control over Financial Reporting
A company’s internal control over financial reporting is a process designed to provide reasonable assurance regarding the reliability of financial reporting and the preparation of financial statements for external purposes in accordance with generally accepted accounting principles. A company’s internal control over financial reporting includes those policies and procedures that (1) pertain to the maintenance of records that, in reasonable detail, accurately and fairly reflect the transactions and dispositions of the assets of the company; (2) provide reasonable assurance that transactions are recorded as necessary to permit preparation of financial statements in accordance with generally accepted accounting principles, and that receipts and expenditures of the company are being made only in accordance with authorizations of management and directors of the company; and (3) provide reasonable assurance regarding prevention or timely detection of unauthorized acquisition, use, or disposition of the company’s assets that could have a material effect on the financial statements.
Because of its inherent limitations, internal control over financial reporting may not prevent or detect misstatements. Also, projections of any evaluation of effectiveness to future periods are subject to the risk that controls may become inadequate because of changes in conditions, or that the degree of compliance with the policies or procedures may deteriorate.
/s/ Deloitte & Touche LLP
Costa Mesa, California
February 8, 2024
ITEM 9B.Other Information
Insider Trading Arrangements
None.
ITEM 9C.Disclosure Regarding Foreign Jurisdictions That Prevent Inspections
Not applicable.
PART III
ITEM 10.Directors, Executive Officers and Corporate Governance
The information required under Item 10 is incorporated herein by reference to our definitive proxy statement to be filed with the SEC within 120 days after the end of our fiscal year ended December 31, 2023 in connection with our 2024 Annual Meeting of Stockholders.
Code of Conduct and Ethics
We have adopted a code of business conduct and ethics that applies to all employees, including employees of our subsidiaries, as well as each member of our Board of Directors. The code of business conduct and ethics is available at our website at www.caretrustreit.com under the Investors-Governance section. We intend to satisfy any disclosure requirement under applicable rules of the Securities and Exchange Commission or the New York Stock Exchange regarding an amendment to, or waiver from, a provision of this code of business conduct and ethics by posting such information on our website, at the address specified above.
ITEM 11.Executive Compensation
The information required under Item 11 is incorporated herein by reference to our definitive proxy statement to be filed with the SEC within 120 days after the end of our fiscal year ended December 31, 2023 in connection with our 2024 Annual Meeting of Stockholders.
ITEM 12.Security Ownership of Certain Beneficial Owners and Management and Related Stockholder Matters
The information required under Item 12 is incorporated herein by reference to our definitive proxy statement to be filed with the SEC within 120 days after the end of our fiscal year ended December 31, 2023 in connection with our 2024 Annual Meeting of Stockholders.
ITEM 13. Certain Relationships and Related Transactions, and Director Independence
The information required under Item 13 is incorporated herein by reference to our definitive proxy statement to be filed with the SEC within 120 days after the end of our fiscal year ended December 31, 2023 in connection with our 2024 Annual Meeting of Stockholders.
ITEM 14.Principal Accountant Fees and Services
The information required under Item 14 is incorporated herein by reference to our definitive proxy statement to be filed with the SEC within 120 days after the end of our fiscal year ended December 31, 2023 in connection with our 2024 Annual Meeting of Stockholders.
PART IV
ITEM 15.Exhibit and Financial Statement Schedules | | | | | |
| (a)(1) | Financial Statements |
| |
| See Index to Consolidated Financial Statements on page F-1 of this report. |
| |
| (a)(2) | Financial Statement Schedules |
| |
| Schedule III: Real Estate Assets and Accumulated Depreciation |
| |
| Schedule IV: Mortgage Loans on Real Estate |
| |
| Note: All other schedules have been omitted because the required information is presented in the financial statements and the related notes or because the schedules are not applicable. |
| |
| (a)(3) | Exhibits |
| |
| |
| |
| |
| |
| |
| |
| Indenture, dated as of June 17, 2021, among CTR Partnership, L.P. and CareTrust Capital Corp., as Issuers, CareTrust REIT, Inc., the other guarantors named therein, and Wells Fargo Bank, National Association, as Trustee (incorporated by reference to Exhibit 4.1 to the CareTrust REIT, Inc.’s Current Report on Form 8-K, filed on June 17, 2021). |
| |
| |
| |
| |
| |
| |
| |
| |
| |
| |
| |
| |
| |
| Second Amended and Restated Credit and Guaranty Agreement, dated as of December 16, 2022 by and among CTR Partnership, L.P., as borrower, CareTrust REIT, Inc., as guarantor, CareTrust GP, LLC and the other guarantors named therein and KeyBank National Association, as administrative agent, an issuing lender and swingline lender and the other parties thereto (incorporated by reference to Exhibit 10.1 to CareTrust REIT, Inc.’s Current Report on Form 8-K filed on December 19, 2022). |
| |
| |
| |
| |
| |
| |
| |
| |
| | | | | |
| |
| |
| |
| |
| |
| |
| |
| |
| |
| |
| |
| |
| |
| |
| |
| |
| |
| |
| |
| |
| |
| |
| |
| |
| |
| *101.INS | Inline XBRL Instance Document - the instance document does not appear in the Interactive Data File because its XBRL tags are embedded within the Inline XBRL document |
| |
| *101.SCH | XBRL Taxonomy Extension Schema Document |
| |
| *101.CAL | XBRL Taxonomy Extension Calculation Linkbase Document |
| |
| *101.DEF | XBRL Taxonomy Extension Definition Linkbase Document |
| |
| *101.LAB | XBRL Taxonomy Extension Label Linkbase Document |
| |
| *101.PRE | XBRL Taxonomy Extension Presentation Linkbase Document |
| |
| *104 | Cover Page Interactive Data File (formatted as inline XBRL and contained in Exhibit 101) |
| |
* Filed herewith.
** Furnished herewith.
+ Management contract or compensatory plan or arrangement.
ITEM 16. Form 10-K Summary
None.
SIGNATURES
Pursuant to the requirements of Section 13 or 15(d) of the Securities Exchange Act of 1934, the registrant has duly caused this report to be signed on its behalf by the undersigned, thereunto duly authorized.
| | | | | |
| CARETRUST REIT, INC. |
| |
| By: | /S/ DAVID M. SEDGWICK |
| David M. Sedgwick |
| President and Chief Executive Officer |
|
| Dated: February 8, 2024 |
Pursuant to the requirements of the Securities Exchange Act of 1934, this report has been signed below by the following persons on behalf of the registrant and in the capacities and on the dates indicated. | | | | | | | | | | | | | | |
Name | | Title | | Date |
| | | | |
| /s/ DAVID M. SEDGWICK | | President and Chief Executive Officer (Principal Executive Officer) | | February 8, 2024 |
| David M. Sedgwick | | | | |
| /s/ WILLIAM M. WAGNER | | Chief Financial Officer and Treasurer (Principal Financial Officer and Principal Accounting Officer) | | February 8, 2024 |
| William M. Wagner | | | | |
| /s/ DIANA LAING | | Director | | February 8, 2024 |
| Diana Laing | | | | |
| /s/ ANNE OLSON | | Director | | February 8, 2024 |
| Anne Olson | | | | |
| /s/ SPENCER PLUMB | | Director | | February 8, 2024 |
| Spencer Plumb | | | | |
| /s/ CAREINA WILLIAMS | | Director | | February 8, 2024 |
| Careina Williams | | | | |
| | | | |
| | | | |
INDEX TO CONSOLIDATED FINANCIAL STATEMENTS
| | | | | |
| |
| Page |
| Report of Independent Registered Public Accounting Firm (PCAOB ID No. 34) with respect to CareTrust REIT, Inc. | |
| Consolidated Balance Sheets as of December 31, 2023 and 2022 | |
| Consolidated Statements of Operations for the years ended December 31, 2023, 2022 and 2021 | |
| Consolidated Statements of Equity for the years ended December 31, 2023, 2022 and 2021 | |
| Consolidated Statements of Cash Flows for the years ended December 31, 2023, 2022 and 2021 | |
| Notes to Consolidated Financial Statements | |
| |
| Schedule III: Real Estate Assets and Accumulated Depreciation | |
| Schedule IV: Mortgage Loans on Real Estate | |
REPORT OF INDEPENDENT REGISTERED PUBLIC ACCOUNTING FIRM
To the stockholders and the Board of Directors of CareTrust REIT, Inc.
Opinion on the Financial Statements
We have audited the accompanying consolidated balance sheets of CareTrust REIT, Inc. and subsidiaries (the "Company") as of December 31, 2023 and 2022, the related consolidated statements of operations, equity, and cash flows, for each of the three years in the period ended December 31, 2023, and the related notes and the schedules listed in the Index at Item 15 (collectively referred to as the "financial statements"). In our opinion, the financial statements present fairly, in all material respects, the financial position of the Company as of December 31, 2023 and 2022, and the results of its operations and its cash flows for each of the three years in the period ended December 31, 2023, in conformity with accounting principles generally accepted in the United States of America.
We have also audited, in accordance with the standards of the Public Company Accounting Oversight Board (United States) (PCAOB), the Company's internal control over financial reporting as of December 31, 2023, based on criteria established in Internal Control — Integrated Framework (2013) issued by the Committee of Sponsoring Organizations of the Treadway Commission and our report dated February 8, 2024, expressed an unqualified opinion on the Company's internal control over financial reporting.
Basis for Opinion
These financial statements are the responsibility of the Company's management. Our responsibility is to express an opinion on the Company's financial statements based on our audits. We are a public accounting firm registered with the PCAOB and are required to be independent with respect to the Company in accordance with the U.S. federal securities laws and the applicable rules and regulations of the Securities and Exchange Commission and the PCAOB.
We conducted our audits in accordance with the standards of the PCAOB. Those standards require that we plan and perform the audit to obtain reasonable assurance about whether the financial statements are free of material misstatement, whether due to error or fraud. Our audits included performing procedures to assess the risks of material misstatement of the financial statements, whether due to error or fraud, and performing procedures that respond to those risks. Such procedures included examining, on a test basis, evidence regarding the amounts and disclosures in the financial statements. Our audits also included evaluating the accounting principles used and significant estimates made by management, as well as evaluating the overall presentation of the financial statements. We believe that our audits provide a reasonable basis for our opinion.
Critical Audit Matter
The critical audit matter communicated below is a matter arising from the current-period audit of the financial statements that was communicated or required to be communicated to the audit committee and that (1) relates to accounts or disclosures that are material to the financial statements and (2) involved our especially challenging, subjective, or complex judgments. The communication of critical audit matters does not alter in any way our opinion on the financial statements, taken as a whole, and we are not, by communicating the critical audit matter below, providing a separate opinion on the critical audit matter or on the accounts or disclosures to which it relates.
Impairment of Real Estate Investments, Assets Held for Sale, Net and Asset Sales — Refer to Notes 2 and 4 to the financial statements
Critical Audit Matter Description
The Company classifies its real estate investments as held for sale when the applicable criteria have been met, which includes a formal plan to sell the properties that is expected to be completed within one year, among other criteria. Upon designation as held for sale, the Company writes down the excess of the carrying value over the estimated fair value less costs to sell, resulting in an impairment of the real estate investments, if necessary.
If circumstances arise that previously were considered unlikely and, as a result, the Company decides not to sell a real estate investment previously classified as held for sale or otherwise no longer meets the held for sale criteria, the respective assets are reclassified as real estate investments held for use. A real estate investment that is reclassified is measured and recorded individually at the lower of (a) its carrying amount before the real estate investment was classified as held for sale, adjusted for any depreciation expense that would have been recognized had the real estate investment been continuously classified as held for use, or (b) the fair value at the date of the decision not to sell or change in circumstances that led to the real estate investment no longer meeting the criteria of held for sale.
The fair value of the assets held for sale is based on a market approach using estimated sales prices (comparable sales model), which relies on certain assumptions by management, including: (i) comparable market transactions, (ii) estimated prices per unit, and (iii) binding agreements for sales and non-binding offers to purchase from unrelated third-parties. The fair value of assets reclassified as real estate investments held for use is based on an income approach using current market conditions and considers matters such as the forecasted operating cash flows, lease coverage ratios, capitalization rates, and, where applicable, terms of recent lease agreements or the results of negotiations with prospective tenants. There are inherent uncertainties in making these assumptions.
We identified the impairment of real estate investments held for sale as a critical audit matter because of the significant estimates and assumptions management makes to determine the fair value of real estate investments held for sale and real estate investments reclassified from held for sale to held for use.sale. This required
a high degree of auditor judgment and an increased extent of effort, including the need to involve our fair value specialists, when performing audit procedures to evaluate the reasonableness of management’s determinationestimate of fair value.
As of December 31, 2022,2023, the Company had real estate investments held for sale of $12.3$15.0 million, after taking annet of impairment loss of $14.4 million. During the year ended December 31, 2022, the Company reclassified real estate investments from held for sale to held for use of $57.4 million, after taking an impairment loss of $18.0$26.8 million.
How the Critical Audit Matter Was Addressed in the Audit
Our audit procedures related to the significant inputs to the fair value of real estate investments held for sale and real estate investments reclassified from held for sale to held for use included the following, among others:
•We tested the effectiveness of controls over management’s evaluation of balance sheet classification and determination of fair value for real estate investments held for sale and real estate investments reclassified to real estate investments held for use.sale.
•We evaluatedassessed the reasonableness of the (1) valuation methodology;methodology used and (2) the concluded real estate investment fair value by independently obtaining sales comparison data, capitalization rates, and market rents and developing a range of independentwhile also engaging in discussions with management to understand portfolio-specific factors impacting the Company’s fair value estimates and comparing our estimates to those used by management.determination.
•We used the assistance of our fair value specialists in obtaining relevant market data, where necessary.
•We considered the properties disposed in the period and subsequent period to evaluate if the retrospective review provides any indication of error or bias in the fair value estimates.
•Read and considered terms of executed arrangements and evidence regarding terms for arrangements in the process of negotiation at or near the valuation date.
•We held discussions with management to understand individual real estate investment specific factors that impacted the Company’s fair value determination.
/s/ DELOITTEDeloitte & TOUCHETouche LLP
Costa Mesa, California
February 9, 20238, 2024
We have served as the Company's auditor since 2019.
CARETRUST REIT, INC.
CONSOLIDATED BALANCE SHEETS
(in thousands, except share and per share amounts) | | December 31, |
| 2022 | | 2021 |
| December 31, | | | December 31, |
| 2023 | | | 2023 | | 2022 |
| Assets: | Assets: | |
| Real estate investments, net | Real estate investments, net | $ | 1,421,410 | | | $ | 1,589,971 | |
| Other real estate related investments, at fair value (including accrued interest of $1,320 as of December 31, 2022 and $155 as of December 31, 2021) | 156,368 | | | 15,155 | |
| Real estate investments, net | |
| Real estate investments, net | |
| Real estate investments, net | |
| Real estate investments, net | |
| Real estate investments, net | |
| Real estate investments, net | |
| Real estate investments, net | |
| Real estate investments, net | |
| Other real estate related investments (including accrued interest of $1,727 and $1,320 as of December 31, 2023 and 2022, respectively) | |
| Assets held for sale, net | Assets held for sale, net | 12,291 | | | 4,835 | |
| Cash and cash equivalents | Cash and cash equivalents | 13,178 | | | 19,895 | |
| Accounts and other receivables | Accounts and other receivables | 416 | | | 2,418 | |
| Prepaid expenses and other assets, net | Prepaid expenses and other assets, net | 11,690 | | | 7,512 | |
| Deferred financing costs, net | Deferred financing costs, net | 5,428 | | | 1,062 | |
| Total assets | Total assets | $ | 1,620,781 | | | $ | 1,640,848 | |
| Liabilities and Equity: | Liabilities and Equity: | | | |
| Senior unsecured notes payable, net | Senior unsecured notes payable, net | $ | 395,150 | | | $ | 394,262 | |
| Senior unsecured notes payable, net | |
| Senior unsecured notes payable, net | |
| Senior unsecured term loan, net | Senior unsecured term loan, net | 199,348 | | | 199,136 | |
| Unsecured revolving credit facility | Unsecured revolving credit facility | 125,000 | | | 80,000 | |
| Accounts payable, accrued liabilities and deferred rent liabilities | Accounts payable, accrued liabilities and deferred rent liabilities | 24,360 | | | 25,408 | |
| Dividends payable | Dividends payable | 27,550 | | | 26,285 | |
| Total liabilities | Total liabilities | 771,408 | | | 725,091 | |
| Commitments and contingencies (Note 11) | | | |
| Commitments and contingencies (Note 12) | | Commitments and contingencies (Note 12) | | | |
| Equity: | Equity: | |
| Preferred stock, $0.01 par value; 100,000,000 shares authorized, no shares issued and outstanding as of December 31, 2022 and 2021 | — | | | — | |
| Common stock, $0.01 par value; 500,000,000 shares authorized, 99,010,112 and 96,296,673 shares issued and outstanding as of December 31, 2022 and 2021, respectively | 990 | | | 963 | |
| Preferred stock, $0.01 par value; 100,000,000 shares authorized, no shares issued and outstanding as of December 31, 2023 and 2022 | |
| Preferred stock, $0.01 par value; 100,000,000 shares authorized, no shares issued and outstanding as of December 31, 2023 and 2022 | |
| Preferred stock, $0.01 par value; 100,000,000 shares authorized, no shares issued and outstanding as of December 31, 2023 and 2022 | |
| Common stock, $0.01 par value; 500,000,000 shares authorized, 129,992,796 and 99,010,112 shares issued and outstanding as of December 31, 2023 and 2022, respectively | |
| Additional paid-in capital | Additional paid-in capital | 1,245,337 | | | 1,196,839 | |
| Cumulative distributions in excess of earnings | Cumulative distributions in excess of earnings | (396,954) | | | (282,045) | |
| Total stockholders' equity | |
| Noncontrolling interests | |
| Total equity | Total equity | 849,373 | | | 915,757 | |
| Total liabilities and equity | Total liabilities and equity | $ | 1,620,781 | | | $ | 1,640,848 | |
See accompanying notes to consolidated financial statements.
CARETRUST REIT, INC.
CONSOLIDATED STATEMENTS OF OPERATIONS
(in thousands, except per share amounts)
| | | | Year Ended December 31, | | Year Ended December 31, |
| | | 2022 | | 2021 | | 2020 | | 2023 | | 2022 | | 2021 |
| Revenues: | Revenues: | | | | | |
| Rental income | Rental income | $ | 187,506 | | | $ | 190,195 | | | $ | 173,612 | |
| Rental income | |
| Rental income | |
| | Independent living facilities | — | | | — | | | 2,077 | |
| | Interest and other income | |
| | Interest and other income | |
| | Interest and other income | Interest and other income | 8,626 | | | 2,156 | | | 2,643 | |
| Total revenues | Total revenues | 196,132 | | | 192,351 | | | 178,332 | |
| Expenses: | Expenses: | | | | | |
| Depreciation and amortization | Depreciation and amortization | 50,316 | | | 55,340 | | | 52,760 | |
| Depreciation and amortization | |
| Depreciation and amortization | |
| Interest expense | Interest expense | 30,008 | | | 23,677 | | | 23,661 | |
| | Property taxes | Property taxes | 4,333 | | | 3,574 | | | 2,836 | |
| Independent living facilities | — | | | — | | | 1,869 | |
| Property taxes | |
| Property taxes | |
| | Impairment of real estate investments | |
| Impairment of real estate investments | |
| Impairment of real estate investments | Impairment of real estate investments | 79,062 | | | — | | | — | |
| | Provision for loan losses, net | |
| Provision for loan losses, net | |
| Provision for loan losses, net | Provision for loan losses, net | 3,844 | | | — | | | — | |
| Property operating expenses | Property operating expenses | 5,039 | | | — | | | — | |
| | General and administrative | General and administrative | 20,165 | | | 26,874 | | | 16,302 | |
| General and administrative | |
| General and administrative | |
| Total expenses | Total expenses | 192,767 | | | 109,465 | | | 97,428 | |
| Other loss: | Other loss: | | | | | |
| Loss on extinguishment of debt | Loss on extinguishment of debt | — | | | (10,827) | | | — | |
| Loss on sale of real estate, net | (3,769) | | | (77) | | | (37) | |
| Loss on extinguishment of debt | |
| Loss on extinguishment of debt | |
| Gain (loss) on sale of real estate, net | |
| | Unrealized loss on other real estate related investments | (7,102) | | | — | | | — | |
| Unrealized loss on other real estate related investments, net | |
| Unrealized loss on other real estate related investments, net | |
| Unrealized loss on other real estate related investments, net | |
| Total other loss | Total other loss | (10,871) | | | (10,904) | | | (37) | |
| Net (loss) income | $ | (7,506) | | | $ | 71,982 | | | $ | 80,867 | |
| (Loss) earnings per common share: | | | | | |
| Net income (loss) | |
| Net loss attributable to noncontrolling interests | |
| Net income (loss) attributable to CareTrust REIT, Inc. | |
| Earnings (loss) per common share attributable to CareTrust REIT, Inc: | |
| Basic | |
| Basic | |
| Basic | Basic | $ | (0.08) | | | $ | 0.74 | | | $ | 0.85 | |
| Diluted | Diluted | $ | (0.08) | | | $ | 0.74 | | | $ | 0.85 | |
| Weighted-average number of common shares: | Weighted-average number of common shares: | | | | | |
| Basic | Basic | 96,703 | | | 96,017 | | | 95,200 | |
| Basic | |
| Basic | |
| Diluted | Diluted | 96,703 | | | 96,092 | | | 95,207 | |
See accompanying notes to consolidated financial statements.
CARETRUST REIT, INC.
CONSOLIDATED STATEMENTS OF EQUITY
(in thousands, except share and per share amounts)
| | | | Common Stock | | Additional
Paid-in
Capital | | Cumulative
Distributions
in Excess
of Earnings | | | Total
Equity | | Common Stock | | Additional
Paid-in
Capital | | Cumulative
Distributions
in Excess
of Earnings | | Total Stockholders’ Equity | | Noncontrolling Interests | | Total
Equity |
| Shares | | Amount | | Total
Equity |
| | | Balance as of December 31, 2019 | 95,103,270 | | | $ | 951 | | | $ | 1,162,990 | | | $ | (236,350) | | | | $ | 927,591 | |
| Issuance of common stock, net | — | | | — | | | (404) | | | — | | | | (404) | |
| Vesting of restricted common stock, net of shares withheld for employee taxes | 112,527 | | | 1 | | | (1,996) | | | — | | | | (1,995) | |
| Amortization of stock-based compensation | — | | | — | | | 3,812 | | | — | | | | 3,812 | |
| Common dividends ($1.00 per share) | — | | | — | | | — | | | (95,729) | | | | (95,729) | |
| Net income | — | | | — | | | — | | | 80,867 | | | | 80,867 | |
| Balance as of December 31, 2020 | |
| | Balance as of December 31, 2020 | |
| | Balance as of December 31, 2020 | Balance as of December 31, 2020 | 95,215,797 | | | 952 | | | 1,164,402 | | | (251,212) | | | | 914,142 | |
| Issuance of common stock, net | Issuance of common stock, net | 990,000 | | | 10 | | | 22,936 | | | — | | | | 22,946 | |
| Vesting of restricted common stock, net of shares withheld for employee taxes | Vesting of restricted common stock, net of shares withheld for employee taxes | 90,876 | | | 1 | | | (1,331) | | | — | | | | (1,330) | |
| Amortization of stock-based compensation | Amortization of stock-based compensation | — | | | — | | | 10,832 | | | — | | | | 10,832 | |
| Common dividends ($1.06 per share) | Common dividends ($1.06 per share) | — | | | — | | | — | | | (102,815) | | | | (102,815) | |
| Net income | Net income | — | | | — | | | — | | | 71,982 | | | | 71,982 | |
| Balance as of December 31, 2021 | Balance as of December 31, 2021 | 96,296,673 | | | 963 | | | 1,196,839 | | | (282,045) | | | | 915,757 | |
| Issuance of common stock, net | Issuance of common stock, net | 2,405,000 | | | 24 | | | 47,212 | | | — | | | | 47,236 | |
| Vesting of restricted common stock, net of shares withheld for employee taxes | Vesting of restricted common stock, net of shares withheld for employee taxes | 308,439 | | | 3 | | | (4,472) | | | — | | | | (4,469) | |
| Amortization of stock-based compensation | Amortization of stock-based compensation | — | | | — | | | 5,758 | | | — | | | | 5,758 | |
| Common dividends ($1.10 per share) | Common dividends ($1.10 per share) | — | | | — | | | — | | | (107,403) | | | | (107,403) | |
| Net loss | Net loss | — | | | — | | | — | | | (7,506) | | | | (7,506) | |
| Balance as of December 31, 2022 | Balance as of December 31, 2022 | 99,010,112 | | | $ | 990 | | | $ | 1,245,337 | | | $ | (396,954) | | | | $ | 849,373 | |
| Issuance of common stock, net | |
| Vesting of restricted common stock, net of shares withheld for employee taxes | |
| Amortization of stock-based compensation | |
| Common dividends ($1.12 per share) | |
| Distributions to noncontrolling interests | |
| Contributions from noncontrolling interests | |
| Net income (loss) | |
| Balance as of December 31, 2023 | |
See accompanying notes to consolidated financial statements.
CARETRUST REIT, INC.
CONSOLIDATED STATEMENTS OF CASH FLOWS
(in thousands) | | | | Year Ended December 31, | | Year Ended December 31, |
| | | 2022 | | 2021 | | 2020 | | 2023 | | 2022 | | 2021 |
| Cash flows from operating activities: | Cash flows from operating activities: | | | | | |
| Net (loss) income | $ | (7,506) | | | $ | 71,982 | | | $ | 80,867 | |
| Adjustments to reconcile net (loss) income to net cash provided by operating activities: | |
| Net income (loss) | |
| Net income (loss) | |
| Net income (loss) | |
| Adjustments to reconcile net income (loss) to net cash provided by operating activities: | |
| Depreciation and amortization (including below-market ground leases) | |
| Depreciation and amortization (including below-market ground leases) | |
| Depreciation and amortization (including below-market ground leases) | Depreciation and amortization (including below-market ground leases) | 50,378 | | | 55,394 | | | 52,819 | |
| Amortization of deferred financing costs | Amortization of deferred financing costs | 2,095 | | | 2,052 | | | 1,950 | |
| Loss on extinguishment of debt | Loss on extinguishment of debt | — | | | 10,827 | | | — | |
| Unrealized loss on other real estate related investments | 7,102 | | | — | | | — | |
| Unrealized losses on other real estate related investments, net | |
| Amortization of stock-based compensation | Amortization of stock-based compensation | 5,758 | | | 10,832 | | | 3,790 | |
| Straight-line rental income | Straight-line rental income | (17) | | | (32) | | | (77) | |
| Amortization of below market rent | |
| Adjustment for collectibility of rental income | Adjustment for collectibility of rental income | 1,417 | | | — | | | — | |
| Noncash interest income | Noncash interest income | (1,165) | | | (155) | | | — | |
| Loss on sale of real estate, net | 3,769 | | | 77 | | | 37 | |
| Interest income distribution from other real estate investment | — | | | — | | | 1,346 | |
| (Gain) loss on sale of real estate, net | |
| | Impairment of real estate investments | |
| | Impairment of real estate investments | |
| | Impairment of real estate investments | Impairment of real estate investments | 79,062 | | | — | | | — | |
| Provision for loan losses, net | Provision for loan losses, net | 3,844 | | | — | | | — | |
| Change in operating assets and liabilities: | Change in operating assets and liabilities: | |
| Accounts and other receivables | Accounts and other receivables | 604 | | | (562) | | | 825 | |
| Accounts and other receivables | |
| Accounts and other receivables | |
| | Prepaid expenses and other assets, net | |
| Prepaid expenses and other assets, net | |
| Prepaid expenses and other assets, net | Prepaid expenses and other assets, net | 123 | | | 399 | | | 387 | |
| Accounts payable, accrued liabilities and deferred rent liabilities | Accounts payable, accrued liabilities and deferred rent liabilities | (1,049) | | | 6,057 | | | 3,791 | |
| Net cash provided by operating activities | Net cash provided by operating activities | 144,415 | | | 156,871 | | | 145,735 | |
| Cash flows from investing activities: | Cash flows from investing activities: | | | | | |
| Acquisitions of real estate, net of deposits applied | Acquisitions of real estate, net of deposits applied | (21,915) | | | (192,718) | | | (89,650) | |
| Acquisitions of real estate, net of deposits applied | |
| Acquisitions of real estate, net of deposits applied | |
| Purchases of equipment, furniture and fixtures and improvements to real estate | Purchases of equipment, furniture and fixtures and improvements to real estate | (7,292) | | | (6,013) | | | (8,297) | |
| | Preferred equity investments | |
| Preferred equity investments | |
| Preferred equity investments | |
| Investment in real estate related investments and other loans receivable | |
| Principal payments received on real estate related investments and other loans receivable | |
| | Investment in real estate related investments and other loans receivable | (149,650) | | | (1,253) | | | (30,498) | |
| Principal payments received on other loans receivable | 6,308 | | | 393 | | | 80,928 | |
| Repayment of other real estate investment | — | | | — | | | 2,327 | |
| Escrow deposits for potential acquisitions of real estate | |
| Escrow deposits for potential acquisitions of real estate | |
| Escrow deposits for potential acquisitions of real estate | Escrow deposits for potential acquisitions of real estate | — | | | — | | | (3,000) | |
| Net proceeds from sales of real estate | Net proceeds from sales of real estate | 45,149 | | | 6,958 | | | 6,608 | |
| Net cash used in investing activities | Net cash used in investing activities | (127,400) | | | (192,633) | | | (41,582) | |
| Cash flows from financing activities: | Cash flows from financing activities: | | | | | |
| Proceeds from (costs paid for) the issuance of common stock, net | 47,236 | | | 22,946 | | | (404) | |
| Proceeds from the issuance of common stock, net | |
| Proceeds from the issuance of common stock, net | |
| Proceeds from the issuance of common stock, net | |
| Proceeds from the issuance of senior unsecured notes payable | Proceeds from the issuance of senior unsecured notes payable | — | | | 400,000 | | | — | |
| | Borrowings under unsecured revolving credit facility | Borrowings under unsecured revolving credit facility | 160,000 | | | 220,000 | | | 65,000 | |
| Borrowings under unsecured revolving credit facility | |
| Borrowings under unsecured revolving credit facility | |
| Payments on senior unsecured notes payable | Payments on senior unsecured notes payable | — | | | (300,000) | | | — | |
| | Payments on unsecured revolving credit facility | |
| Payments on unsecured revolving credit facility | |
| Payments on unsecured revolving credit facility | Payments on unsecured revolving credit facility | (115,000) | | | (190,000) | | | (75,000) | |
| | Payments on debt extinguishment and deferred financing costs | Payments on debt extinguishment and deferred financing costs | (5,361) | | | (14,095) | | | — | |
| | Payments on debt extinguishment and deferred financing costs | |
| | Payments on debt extinguishment and deferred financing costs | |
| Net-settle adjustment on restricted stock | Net-settle adjustment on restricted stock | (4,469) | | | (1,331) | | | (1,996) | |
| Dividends paid on common stock | Dividends paid on common stock | (106,138) | | | (100,782) | | | (93,161) | |
| Net cash (used in) provided by financing activities | (23,732) | | | 36,738 | | | (105,561) | |
| Net (decrease) increase in cash and cash equivalents | (6,717) | | | 976 | | | (1,408) | |
| Contributions from noncontrolling interests | |
| Distributions to noncontrolling interests | |
| Net cash provided by (used in) financing activities | |
| Net increase (decrease) in cash and cash equivalents | |
| Cash and cash equivalents as of the beginning of period | Cash and cash equivalents as of the beginning of period | 19,895 | | | 18,919 | | | 20,327 | |
| Cash and cash equivalents as of the end of period | Cash and cash equivalents as of the end of period | $ | 13,178 | | | $ | 19,895 | | | $ | 18,919 | |
| Supplemental disclosures of cash flow information: | Supplemental disclosures of cash flow information: | | | | | |
| Interest paid | Interest paid | $ | 25,912 | | | $ | 22,838 | | | $ | 21,691 | |
| Interest paid | |
| Interest paid | |
| Supplemental schedule of noncash investing and financing activities: | Supplemental schedule of noncash investing and financing activities: | | | | | |
| Increase in dividends payable | |
| Increase in dividends payable | |
| Increase in dividends payable | Increase in dividends payable | $ | 1,265 | | | $ | 2,033 | | | $ | 2,568 | |
| Right-of-use asset obtained in exchange for new operating lease obligation | Right-of-use asset obtained in exchange for new operating lease obligation | $ | — | | | $ | — | | | $ | 599 | |
| | Transfer of pre-acquisition costs to acquired assets | Transfer of pre-acquisition costs to acquired assets | $ | 7 | | | $ | 358 | | | $ | 168 | |
| Transfer of pre-acquisition costs to acquired assets | |
| Transfer of pre-acquisition costs to acquired assets | |
| | Sale of real estate settled with notes receivable | Sale of real estate settled with notes receivable | $ | 12,000 | | | $ | — | | | $ | 32,400 | |
| | Sale of real estate settled with notes receivable | |
| | Sale of real estate settled with notes receivable | |
See accompanying notes to consolidated financial statements.
CARETRUST REIT, INC.
NOTES TO CONSOLIDATED FINANCIAL STATEMENTS
1. ORGANIZATION
Description of Business—CareTrust REIT, Inc.’s (“CareTrust REIT” or the “Company”) primary business consists of acquiring, financing, developing and owning real property to be leased to third-party tenants in the healthcare sector. As of December 31, 2022,2023, the Company owned directly or through a joint venture and leased to independent operators, 216226 skilled nursing facilities (“SNFs”), multi-service campuses, assisted living facilities (“ALFs”) and independent living facilities (“ILFs”) consisting of 22,83123,928 operational beds and units located in 28 states with the highest concentration of properties by rental income located in California Texas, Louisiana, Idaho and Arizona.Texas. As of December 31, 2022,2023, the Company also had other real estate related investments consisting of threeone preferred equity investment, eight real estate secured loans receivable and twoone mezzanine loansloan receivable with a carrying value of $156.4$180.4 million.
COVID-19—The COVID-19 pandemic has had and may continue to have an adverse impact on the economy generally and the Company’s business, results of operations and financial condition. The duration and extent of the COVID-19 pandemic’s effect on the Company’s operational and financial performance, and the operational and financial performance of the Company’s tenants, will depend on future developments, which are highly uncertain and cannot be predicted at this time, including resurgences of COVID-19 or outbreaks of other highly infectious diseases. The adverse impact of the COVID-19 pandemic on the Company’s business, results of operations and financial condition could be material.
2. SUMMARY OF SIGNIFICANT ACCOUNTING POLICIES
Basis of Presentation—The accompanying consolidated financial statements of the Company reflect, for all periods presented, the historical financial position, results of operations and cash flows of the Company and its wholly-owned subsidiaries prepared in accordance with accounting principles generally accepted in the United States (“GAAP”).
Consolidation—The accompanying consolidated financial statements include the accounts of CareTrust REIT, its wholly-owned subsidiaries, and variable interest entities (“VIEs”) over which the Company exercises control. All intercompany transactions and account balances within the Company have been eliminated.eliminated, and net earnings are reduced by the portion of net earnings attributable to noncontrolling interests.
Variable Interest Entities—The Company is required to continually evaluate its VIE relationships and consolidate these entities when it is determined to be the primary beneficiary of their operations. A VIE is broadly defined as an entity where either: (i) the equity investment at risk is insufficient to finance that entity’s activities without additional subordinated financial support, (ii) substantially all of an entity’s activities either involve or are conducted on behalf of an investor that has disproportionately few voting rights, or (iii) the equity investors as a group lack any of the following: (a) the power through voting or similar rights to direct the activities of an entity that most significantly impact the entity’s economic performance, (b) the obligation to absorb the expected losses of an entity, or (c) the right to receive the expected residual returns of an entity. Criterion (iii) above is generally applied to limited partnerships and similarly structured entities by assessing whether a simple majority of the limited partners hold substantive rights to participate in the significant decisions of the entity or have the ability to remove the decision maker or liquidate the entity without cause. If neither of those criteria are met, the entity is a VIE.
The designation of an entity as a VIE is reassessed upon certain events, including, but not limited to: (i) a change to the contractual arrangements of the entity or in the ability of a party to exercise its participation or kick-out rights, (ii) a change to the capitalization structure of the entity, or (iii) acquisitions or sales of interests that constitute a change in control.
A variable interest holder is considered to be the primary beneficiary of a VIE if it has the power to direct the activities of a VIE that most significantly impact the entity’s economic performance and has the obligation to absorb losses of, or the right to receive benefits from, the entity that could potentially be significant to the VIE. The Company qualitatively assesses whether it is (or is not) the primary beneficiary of a VIE. The Company’s consideration of various factors include, but is not limited to, which activities most significantly impact the entity’s economic performance and the ability to direct those activities, its form of ownership interest, its representation on the VIE’s governing body, the size and seniority of its investment, its ability and the rights of other investors to participate in policy making decisions, its ability to manage its ownership interest relative to the other interest holders, and its ability to replace the VIE manager and/or liquidate the entity.
For any investment in a joint venture that is not considered to be VIE, the Company would evaluate the type of ownership rights held by limited partner(s) that may preclude consolidation by the majority interest holder. The assessment of limited partners’ rights and their impact on the control of a joint venture should be made at inception of the joint venture and continually reassessed. See Note 11, Variable Interest Entities, for additional information.
CARETRUST REIT, INC.
NOTES TO CONSOLIDATED FINANCIAL STATEMENTS
Noncontrolling Interests—The Company presents the portion of any equity that the Company does not own in entities that the Company controls (and thus consolidates) as noncontrolling interests and classifies those interests as a component of consolidated equity, separate from stockholders' equity, on the Company’s consolidated balance sheets. For consolidated joint ventures, the Company allocates net income or loss utilizing the hypothetical liquidation at book value method, in which the Company allocates income or loss based on the change in each unitholders’ claim on the net assets of the joint venture partners at period end after adjusting for any distributions or contributions made during such period. The Company includes net income (loss) attributable to the noncontrolling interests in net income (loss) in the consolidated statements of operations.
Lessor Accounting—The Company recognizes lease revenue in accordance with Accounting Standards Codification (“ASC”) 842, Leases. The Company’s lease agreements typically contain annual escalators based on the percentage change in the Consumer Price Index which are accounted for as variable lease payments in the period in which the change occurs. For lease agreements that contain fixed rent escalators, the Company generally recognizes lease revenue on a straight-line basis of accounting. The Company generates revenues primarily by leasing healthcare-related properties to healthcare operators in triple-net lease arrangements, under which the tenant is solely responsible for the costs related to the property. Tenant reimbursements related to property taxes and insurance paid by the lessee directly to a third party on behalf of a lessor are required to be excluded from variable payments and from recognition in the lessor’s statements of operations. Otherwise, tenant recoveries for taxes and insurance are classified as additional rental revenues recognized by the lessor on a gross basis in its statements of operations.
The Company’s assessment of collectibility of its tenant receivables includes a binary assessment of whether or not substantially all of the amounts due under a tenant’s lease agreement are probable of collection. The Company considers the operator’s performance and anticipated trends, payment history, and the existence and creditworthiness of guarantees, among other factors, in making this determination. For such leases that are deemed probable of collection, revenue continues to be recorded on a straight-line basis over the lease term, if applicable. For such leases that are deemed not probable of collection, revenue is recorded as the lesser of (i) the amount which would be recognized on a straight-line basis or (ii) cash that has been received from the tenant, with any tenant and deferred rent receivable balances charged as a direct write-off against rental income in the period of the change in the collectibility determination. Such write-offs and recoveries are recorded as decreases or increases through rental income on the Company’s consolidated statements of operations. For the yearyears ended December 31, 2022, the Company did not record any recovery adjustments2023 and wrote-off $1.4 million of rental income. For the year ended December 31, 2021, the Company did not record any recovery adjustments or write-off adjustments to rental income. For the year ended December 31, 2020,2022, the Company recordeddid not record any recovery adjustments of $1.0and wrote-off $1.4 million and did not recognize any write-off adjustments toof rental income. See Note 3, Real Estate Investments, Net for further detail.
Estimates and Assumptions—The preparation of financial statements in conformity with GAAP requires management to make estimates and assumptions that affect the reported amounts of assets and liabilities and disclosure of contingent assets and liabilities at the date of the financial statements and the reported amounts of revenue and expenses during the reporting periods. Management believes that the assumptions and estimates used in preparation of the underlying consolidated financial statements are reasonable. Actual results, however, could differ from those estimates and assumptions.
CARETRUST REIT, INC.
NOTES TO CONSOLIDATED FINANCIAL STATEMENTS
Real Estate Acquisition Valuation— In accordance with ASC 805, Business Combinations, the Company’s acquisitions of real estate investments generally do not meet the definition of a business, and are treated as asset acquisitions. The assets acquired and liabilities assumed are measured at their acquisition date relative fair values. Acquisition costs are capitalized as incurred. The Company allocates the acquisition costs to the tangible assets, identifiable intangible assets/liabilities and assumed liabilities on a relative fair value basis. The Company assesses fair value based on available market information, such as capitalization and discount rates, comparable sale transactions and relevant per square foot or unit cost information. A real estate asset’s fair value may be determined utilizing cash flow projections that incorporate such market information. Estimates of future cash flows are based on a number of factors including historical operating results, known and anticipated trends, as well as market and economic conditions. The fair value of tangible assets of an acquired property is based on the value of the property as if it is vacant.
The Company recognizes acquired “above or below market” leases at their fair value (for asset acquisitions) using discount rates which reflect the risks associated with the leases acquired. The fair value is based on the present value of the difference between (i) the contractual amounts due pursuant to each in-place lease and (ii) management’s estimate of fair market lease rates for each in-place lease, generally measured over a period equal to the remaining term of the lease for above market leases and the initial term plus the extended term for any leases with renewal options that are reasonably certain to be exercised. Other intangible assets acquired include amounts for in-place lease values that are based on an evaluation of the
CARETRUST REIT, INC.
NOTES TO CONSOLIDATED FINANCIAL STATEMENTS
specific characteristics of each property and the acquired tenant lease(s). Factors considered include estimates of carrying costs during hypothetical expected lease-up periods, market conditions, and costs to execute similar leases. In estimating carrying costs, the Company includes estimates of lost rents at market rates during the hypothetical expected lease-up periods, which are dependent on local market conditions and expected trends. In estimating costs to execute similar leases, the Company considers leasing commissions, legal, and other related costs. As of December 31, 2023, the Company had gross below market lease liabilities of $7.3 million, accumulated amortization of $0.4 million and a weighted average remaining amortization period of 3 years.
Impairment of Long-Lived Assets—At each reporting period, the Company evaluates its real estate investments held for use for potential impairment whenever events or changes in circumstances indicate that the carrying amount of the assets may not be recoverable. The judgment regarding the existence of impairment indicators, used to determine if an impairment assessment is necessary, is based on factors such as, but not limited to, market conditions, operator performance and legal structure. If indicators of impairment are present, the Company evaluates the carrying value of the related real estate investments in relation to the future undiscounted cash flows of the underlying facilities. The most significant inputs to the undiscounted cash flows include, but are not limited to, historical and projected facility level financial results, a lease coverage ratio, the intended hold period by the Company, and a terminal capitalization rate. The analysis is also significantly impacted by determining the lowest level of cash flows, which generally would be at the master lease level of cash flows. Provisions for impairment losses related to long-lived assets are recognized when expected future undiscounted cash flows are determined to be less than the carrying values of the assets. The impairment is measured as the excess of carrying value over fair value. All impairments are taken as a period cost at that time, and depreciation is adjusted going forward to reflect the new value assigned to the asset.
The Company classifies its real estate investments as held for sale when the applicable criteria have been met, which includes a formal plan to sell the properties that is expected to be completed within one year, among other criteria. Upon designation as held for sale, the Company writes down the excess of the carrying value over the estimated fair value less costs to sell, resulting in an impairment of the real estate investments, if necessary, and ceases depreciation.
In the event of impairment, the fair value of the real estate investment is based on current market conditions and considers matters such as the forecasted operating cash flows, lease coverage ratios, capitalization rates, comparable sales data, and, where applicable, contracts or the results of negotiations with purchasers or prospective purchasers.
If circumstances arise that previously were considered unlikely and, as a result, the Company decides not to sell a real estate investment previously classified as held for sale or otherwise no longer meets the held for sale criteria, the respective assets are reclassified as real estate investments held for use. A real estate investment that is reclassified is measured and recorded individually at the lower of (a) its carrying amount before the real estate investment was classified as held for sale, adjusted for any depreciation expense that would have been recognized had the real estate investment been continuously classified as held for use, or (b) the fair value at the date of the decision not to sell or change in circumstances that led to the real estate investment no longer meeting the criteria of held for sale.
The Company’s ability to accurately estimate future cash flows and estimate and allocate fair values impacts the timing and recognition of impairments. While the Company believes its assumptions are reasonable, changes in these assumptions may have a material impact on financial results.
For the yearyears ended December 31, 2023 and 2022, the Company recorded an impairment charge of $36.3 million and $79.1 million.million, respectively. See Note 4, Impairment of Real Estate Investments, Asset Held For Sale, Net and Asset Sales, for additional information.
Other Real Estate Related Investments—Included in other real estate related investments on the Company’s consolidated balance sheets at December 31, 2022,2023, are threeone preferred equity investment, eight real estate secured loans receivable and two mezzanine loans receivable. Included in other real estate related investments on the Company’s consolidated balance sheets at December 31, 2021, is one mezzanine loan receivable. The Company elected the fair value option for all other real estate related investments.secured and mezzanine loans receivable. Instruments for which the fair value option has been elected are measured at fair value on a recurring basis with changes in fair value recognized in other income (loss) on the consolidated statements of operations. Fair value was estimated using an internal valuation model that considered the expected future cash flows of the investment, the underlying collateral value, market
CARETRUST REIT, INC.
NOTES TO CONSOLIDATED FINANCIAL STATEMENTS
interest rates and other credit enhancements. Interest income is recognized as earned within interest and other income in the consolidated statements of operations. The preferred equity investment is accounted for at unpaid principal balance, plus accrued return, net of reserves. The Company recognizes return income on a monthly basis based on the
CARETRUST REIT, INC.
NOTES TO CONSOLIDATED FINANCIAL STATEMENTS
outstanding investment including any accrued and unpaid return, to the extent there is outside contributed equity or cumulative earnings from operations. As the preferred member of the joint venture, the Company is not entitled to share in the joint venture’s earnings or losses. Rather, the Company is entitled to receive a preferred return, which is deferred if the cash flow of the joint venture is insufficient to pay all of the accrued preferred return. The unpaid accrued preferred return is added to the balance of the preferred equity investment up to the estimated economic outcome assuming a hypothetical liquidation of the book value of the joint venture. Any unpaid accrued preferred return, whether recorded or unrecorded by the Company, will be repaid upon redemption or as available cash flow is distributed from the joint venture.
Prepaid expenses and other assets—Prepaid expenses and other assets consist of prepaid expenses, deposits, pre-acquisition costs and other loans receivable. During the year ended December 31, 2022, the Company determined that the remaining contractual obligations under two other loans receivable were not collectible and recorded a $4.6 million expected credit loss, net of a loan loss recovery of $0.8 million related to a loan previously written-off. The Company did not record an expected credit loss or recovery during the year ended December 31, 2023. Expected credit losses and recoveries are recorded in provision for loan losses, net in the consolidated statements of operations.
The Company’s other loans receivable are reflected at amortized cost, net of an allowance for credit loss, on the accompanying consolidated balance sheets. The amortized cost of a loan receivable is the outstanding unpaid principal balance, net of unamortized discounts, costs and fees directly associated with the origination of the loan.
Income Taxes—The Company has elected to be taxed as a real estate investment trust (“REIT”) under the Internal Revenue Code of 1986, as amended (the “Code”). The Company believes it has been organized and has operated, and the Company intends to continue to operate, in a manner to qualify for taxation as a REIT under the Code. To qualify as a REIT, the Company must meet certain organizational and operational requirements, including a requirement to distribute to its stockholders at least 90% of the Company’s annual REIT taxable income (computed without regard to the dividends paid deduction or net capital gain and which does not necessarily equal net income as calculated in accordance with GAAP). As a REIT, the Company generally will not be subject to federal income tax to the extent it distributes as qualifying dividends all of its REIT taxable income to its stockholders. If the Company fails to qualify as a REIT in any taxable year, it will be subject to federal income tax on its taxable income at regular corporate income tax rates and generally will not be permitted to qualify for treatment as a REIT for federal income tax purposes for the four taxable years following the year during which qualification is lost unless the Internal Revenue Service grants the Company relief under certain statutory provisions.
Real Estate Depreciation and Amortization—Real estate costs related to the acquisition and improvement of properties are capitalized and amortized over the expected useful life of the asset on a straight-line basis. Repair and maintenance costs are charged to expense as incurred and significant replacements and betterments are capitalized. Repair and maintenance costs include all costs that do not extend the useful life of the real estate asset. The Company considers the period of future benefit of an asset to determine its appropriate useful life. Expenditures for tenant improvements are capitalized and amortized over the shorter of the tenant’s lease term or expected useful life. The Company anticipates the estimated useful lives of its assets by class to be generally as follows: | | | | | | | | |
| Building | | 25-40 years |
| Building improvements | | 10-25 years |
| Tenant improvements | | Shorter of lease term or expected useful life |
| Integral equipment, furniture and fixtures | | 5 years |
| Identified intangible assets | | Shorter of lease term or expected useful life |
Cash and Cash Equivalents—Cash and cash equivalents consist of bank term deposits and money market funds with original maturities of three months or less at time of purchase and therefore approximate fair value. The fair value of these investments is determined based on “Level 1” inputs, which consist of unadjusted quoted prices in active markets that are accessible at the measurement date for identical, unrestricted assets. The Company places its cash and cash equivalents with high credit quality financial institutions.
The Company’s cash and cash equivalents balance periodically exceeds federally insurable limits. The Company monitors the cash balances in its operating accounts and adjusts the cash balances as appropriate; however, these cash balances could be impacted if the underlying financial institutions fail or are subject to other adverse conditions in the financial markets. To date, the Company has experienced no loss or lack of access to cash in its operating accounts.
CARETRUST REIT, INC.
NOTES TO CONSOLIDATED FINANCIAL STATEMENTS
Deferred Financing Costs—External costs incurred from placement of the Company’s debt are capitalized and amortized on a straight-line basis over the terms of the related borrowings, which approximates the effective interest method. For senior unsecured notes payable and the senior unsecured term loan, deferred financing costs are netted against the outstanding debt amounts on the consolidated balance sheets. For the unsecured revolving credit facility, deferred financing costs are included in assets on the Company’s consolidated balance sheets. Amortization of deferred financing costs is
CARETRUST REIT, INC.
NOTES TO CONSOLIDATED FINANCIAL STATEMENTS
classified as interest expense in the consolidated statements of operations. Accumulated amortization of deferred financing costs was $2.5$4.8 million and $8.0$2.5 million at December 31, 2023 and 2022, and 2021, respectively.
When financings are terminated, unamortized deferred financing costs, as well as charges incurred for the termination, are expensed at the time the termination is made. Gains and losses from the extinguishment of debt are presented within other income (loss) in the Company’s consolidated statements of operations. During the year ended December 31, 2021, the Company recorded a loss on extinguishment of debt of $10.8 million. See Note 7, Debt, for further detail.
Stock-Based Compensation—The Company accounts for share-based payment awards in accordance with ASC 718, Compensation – Stock Compensation (“ASC 718”). ASC 718 requires all entities to apply a fair value-based measurement method in accounting for share-based payment transactions with directors, officers and employees. The Company measures and recognizes compensation expense for all share-based payment awards made to directors, officers and employees based on the grant date fair value, amortized over the requisite service period of the award.award. Compensation expense for awards with performance-based vesting conditions is recognized based upon the probability that the performance target will be met. Compensation expense for awards with market-based vesting conditions is recognized based upon the estimated number of awards to be earned and is recognized provided that the requisite service is rendered, regardless of when, if ever, the market condition is satisfied. Forfeitures of stock-based awards are recognized as they occur. Net income (loss) income reflects stock-based compensation expense of $5.2 million, $5.8 million $10.8 million and $3.8$10.8 million for the years ended December 31, 2023, 2022 2021 and 2020,2021, respectively.
Concentration of Credit Risk—The Company is subject to concentrations of credit risk consisting primarily of operating leases on its owned properties. See Note 12,13, Concentration of Risk, for a discussion of major operator concentration.
Segment Disclosures —The Company is subject to disclosures about segments of an enterprise and related information in accordance with ASC 280, Segment Reporting. The Company has one reportable segment consisting of investments in healthcare-related real estate assets.
Earnings Per Share—The Company calculates earnings per share (“EPS”) in accordance with ASC 260, Earnings Per Share. Basic EPS is computed by dividing net income applicable to common stock by the weighted-average number of common shares outstanding during the period. Diluted EPS reflects the additional dilution for all potentially-dilutive securities.
Beds, Units, Occupancy and Other Measures—Beds, units, occupancy and other non-financial measures used to describe real estate investments included in these Notes to the consolidated financial statements are presented on an unaudited basis and are not subject to audit by the independent registered public accounting firm in accordance with the standards of the Public Company Accounting Oversight Board.
Recent Accounting Pronouncements— In March 2020,On November 27, 2023, the Financial Accounting Standards Board (“FASB”) issued Accounting Standards Update (“ASU”) No. 2020-04,2023-07, Reference Rate ReformSegment Reporting (Topic 848) - Facilitation of the Effects of Reference Rate Reform on Financial Reporting280): Improvements to Reportable Segment Disclosures (“ASU 2020-04”2023-07”), which provides optional relief to applying reference rate reform to contracts, hedging relationships,improve reportable segment disclosure requirements, primarily through enhanced disclosures about significant segment expenses. The guidance is effective for fiscal years beginning after December 15, 2023 and other transactions that referenceinterim periods within fiscal years beginning after December 15, 2024. Early adoption is permitted. The Company is still evaluating its adoption timeline and the London Interbank Offered Rate (“LIBOR”). For U.S. Dollar LIBOR, the overnight, one-month, three-month, six-month and one-year LIBOR rates will be discontinued in June 2023, while other U.S. Dollar LIBOR rates were discontinued at the end of 2021. The amendments in this update were effective immediately and could have been applied through December 31, 2022. On December 21, 2022, the FASB issued ASU 2022-06 to defer the sunset date of ASC 848 to December 31, 2024. During the year ended December 31, 2022, the Company adopted ASU 2020-04. Adoption of this ASU did not have a material impact on the Company’s consolidated financial statements.its disclosures.
CARETRUST REIT, INC.
NOTES TO CONSOLIDATED FINANCIAL STATEMENTS
3. REAL ESTATE INVESTMENTS, NET
The following table summarizes the Company’s investment in owned properties, and properties held in consolidated joint ventures, held for use at December 31, 20222023 and 20212022 (dollars in thousands):
| | December 31, 2022 | | December 31, 2021 |
| December 31, 2023 | | | December 31, 2023 | | December 31, 2022 |
| Land | Land | $ | 238,738 | | | $ | 251,787 | |
| Buildings and improvements | Buildings and improvements | 1,483,133 | | | 1,622,019 | |
| Integral equipment, furniture and fixtures | Integral equipment, furniture and fixtures | 97,199 | | | 104,722 | |
| Identified intangible assets | Identified intangible assets | 2,832 | | | 1,257 | |
| | Real estate investments | Real estate investments | 1,821,902 | | | 1,979,785 | |
| Real estate investments | |
| Real estate investments | |
| Accumulated depreciation and amortization | Accumulated depreciation and amortization | (400,492) | | | (389,814) | |
| Real estate investments, net | Real estate investments, net | $ | 1,421,410 | | | $ | 1,589,971 | |
As of December 31, 2022,2023, 94 of the Company’s 216226 facilities were leased to subsidiaries of The Ensign Group, Inc. (“Ensign”) on a triple-net basis under multiple long-term leases (each, an “Ensign Master Lease” and, collectively, the “Ensign Master Leases”) which commenced on June 1, 2014 and were subsequently modified on October 1, 2019, June 1, 2021, August 1, 2021, March 1, 2022 and April 1, 2022.modified. The obligations under the Ensign Master Leases are guaranteed by Ensign. A default by any subsidiary of Ensign with regard to any facility leased pursuant to an Ensign Master Lease will result in a default under all of the Ensign Master Leases. As of December 31, 2022,2023, annualized contractual rental income from the Ensign Master Leases was $62.3$63.8 million and is escalated annually, in June, by an amount equal to the product of (1) the lesser of the percentage change in the Consumer Price Index (“CPI”) (but not less than zero) or 2.5%, and (2) the prior year’s rent. In addition to rent, the subsidiaries of Ensign that are tenants under the Ensign Master Leases are solely responsible for the costs related to the leased properties (including property taxes, insurance, and maintenance and repair costs). During the year ended December 31, 2020, the Company acquired four additional facilities leased to subsidiaries of Ensign on a triple-net basis under two separate master lease agreements, each of which contains a purchase option. As of December 31, 2022,2023, annualized contractual rental income from the four additional Ensign facilities was $3.9$4.0 million and is escalated annually, in December, by an amount equal to the product of (1) the lesser of the percentage change in the CPI (but not less than zero) or 2.5%, and (2) the prior year’s rent. In addition to rent, the subsidiaries of Ensign that are tenants under the four additional facilities are solely responsible for the costs related to the leased properties (including property taxes, insurance, and maintenance and repair costs). The obligations under the lease agreements for the four additional facilities are guaranteed by Ensign but do not contain cross-default provisions with the Ensign Master Leases. See below under “Lease Amendments”Amendments and Terminations” for further detail on Ensign lease amendments. Ensign provides a guaranty for properties leased to The Pennant Group, Inc. (“Pennant”) under the Pennant Master Lease (defined below), which represent $7.3 million of total annualized contractual rental income as of December 31, 2023.
As of December 31, 2022,2023, 15 of the Company’s facilities were leased to subsidiaries of Priority Management Group (“PMG”) on a triple-net basis under one long-term lease (the “PMG Master Lease”). The PMG Master Lease commenced on December 1, 2016, and provides an initial term of fifteen years, with two five-year renewal options. As of December 31, 2022,2023, annualized contractual rental income from the PMG Master Lease was $30.2$31.2 million and is escalated annually by an amount equal to the product of (1) the lesser of the percentage change in the CPI (but not less than zero) or 3.0%, and (2) the prior year’s rent. In addition to rent, the subsidiaries of PMG that are tenants under the PMG Master Lease are solely responsible for the costs related to the leased properties (including property taxes, insurance, and maintenance and repair costs).
As of December 31, 2022, 1032023, 108 of the Company’s 216226 facilities were leased to various other operators under triple-net leases. All of these leases contain annual escalators based on the percentage change in the CPI (but not less than zero), some of which are subject to a cap, or fixed rent escalators. During the second and third quarters of 2022, the Company entered into triple-net lease agreements for two of the Company’s 216226 facilities which are being repurposed to behavioral health facilities with rent commencing 12 to 18 months following lease commencement.facilities. Two of the Company’s 216226 facilities are non-operational and are leased under a shortlong term lease with an expected remaining term of less than one yearrent commencing 12 months following lease commencement. In addition, as of December 31, 2022.2023, the master lease for one of the Company’s 226 facilities was terminated and the facility is non-operational while undergoing renovations. See below under “Lease Amendments and Terminations” for further detail. As of December 31, 2022, five2023, 14 facilities were held for sale. See Note 4, Impairment of Real Estate Investments, Assets Held for Sale, Net and Asset Sales for additional information.
CARETRUST REIT, INC.
NOTES TO CONSOLIDATED FINANCIAL STATEMENTS
As of December 31, 2022,2023, the Company’s total future contractual minimum rental income for all of its tenants, excluding operating expense reimbursements, assets held for sale and assets being repurposed, was as follows (dollars in thousands): | | Year | Year | Amount | Year | Amount |
| 2023 | $ | 190,704 | |
| 2024 | 2024 | 190,463 | |
| 2025 | 2025 | 190,621 | |
| 2026 | 2026 | 190,727 | |
| 2027 | 2027 | 187,719 | |
| 2028 | |
| | Thereafter | Thereafter | 984,665 | |
| $ | 1,934,899 | |
| Thereafter | |
| Thereafter | |
| $ | |
Tenant Purchase Options
Certain of the Company’s operators hold purchase options allowing them to acquire properties they currently lease from the Company. A summary of these purchase options is presented below (dollars in thousands): | | Asset Type | Properties | | Lease Expiration | Next Option Open Date(1) | | Option Type(2) | Current Cash Rent(3) |
Asset Type(1) | | Asset Type(1) | Properties | | Lease Expiration | Option Period Open Date(2) | | Option Type(3) | Current Cash Rent(4) |
| | | SNF | SNF | 11 | | November 2030 | 1/1/2023 | (4) | B | 5,092 | |
| | SNF | |
| | SNF | SNF | 1 | | March 2029 | 4/1/2022 | (5) | A / B(6) | 805 | |
| SNF / Campus | SNF / Campus | 2 | | October 2032 | 1/1/2023 | (4) | A | 1,097 | |
| SNF | SNF | 4 | | November 2034 | 12/1/2024 | (5) | A | 3,891 | |
|
(1)Excludes a purchase option on an 11 building SNF portfolio classified as held for sale as of December 31, 2023 and representing $5.1 million of current cash rent. Tenant is currently not eligible to elect the option.
(2)The Company has not received notice of exercise for the option periods that are currently open.
(2) (3)Option type includes:
A - Fixed base price.
B - Fixed capitalization rate on lease revenue.
(3) (4)Based on annualized cash revenue for contracts in place atas of December 31, 2022.2023.
(4) Option window is open for six months.
(5)Option window is open until the expiration of the lease term.
(6)Option window is open for six months from the option period open date.
(7)Purchase option reflects two option types.
(8)Excludes one property classified as held for sale as of December 31, 2023 and subsequently sold in the first quarter of 2024.
Rental Income
The following table summarizes components of the Company’s rental income (dollars in thousands): | | For the Year Ended December 31, |
| 2022 | | 2021 | | 2020 |
| For the Year Ended December 31, | | | For the Year Ended December 31, |
| 2023 | | | 2023 | | 2022 | | 2021 |
| Rental Income | Rental Income | | | | | |
Contractual rent due(1) | Contractual rent due(1) | $ | 188,906 | | | $ | 190,100 | | | $ | 171,309 | |
Contractual rent due(1) | |
Contractual rent due(1) | |
| Straight-line rent | Straight-line rent | 17 | | | 32 | | | 77 | |
| Amortization of below-market lease intangible | |
Adjustment for collectibility(2) | Adjustment for collectibility(2) | (1,417) | | | — | | | — | |
Recoveries(3) | — | | | — | | | 1,047 | |
Lease termination revenue(4) | — | | | 63 | | | 1,179 | |
| Lease termination revenue(3) | |
Lease termination revenue(3) | |
Lease termination revenue(3) | |
| Total | Total | $ | 187,506 | | | $ | 190,195 | | | $ | 173,612 | |
(1)Includes initial cash rent and tenant operating expense reimbursements, as adjusted for applicable rental escalators and rent increases due to capital expenditures funded by the Company. For tenants on a cash basis, this represents the lesser of the amount that would be recognized on a straight-line basis or cash that has been received. Tenant operating expense reimbursements for the years ended December 31, 2023, 2022 and 2021 were $5.5 million, $2.8 million, and $3.6 million, respectively.
(2)During the year ended December 31, 2022, and in accordance with ASC 842, the Company evaluated the collectibility of lease payments through maturity and determined that it was not probable that the Company would collect substantially all of the contractual obligations from five existing and former operators. As such, the Company reversed $0.7 million of operating expense reimbursements, $0.2 million of contractual rent and $0.5 million of straight-line rent during the year ended December 31, 2022. If lease payments are subsequently deemed probable of collection, the Company will reestablish the receivable which will result in an increase in rental income for such recoveries.
(3)DuringIn connection with the year ended December 31, 2020, the Company recovered $1.0 million in rental income relatedagreement to affiliates ofterminate its lease agreements with Metron Integrated Health Systems (“Metron”) that was previously written off.and to sell the facilities to a third-party, the Company received certain lease termination payments from Metron.
CARETRUST REIT, INC.
NOTES TO CONSOLIDATED FINANCIAL STATEMENTS
(4)In connection with the agreement to terminate its lease agreements with Metron and to sell the facilities to a third-party, the Company received certain lease termination payments from Metron. During the years ended December 31, 2021 and 2020, the Company recognized approximately $0.1 million and $1.2 million in lease termination revenue, respectively.
Recent Real Estate Acquisitions
The following table summarizes the Company’s acquisitions for the years ended December 31, 2023, 2022 2021 and 20202021 (dollar amounts in thousands): | | Type of Property | Type of Property | Purchase Price(1) | | Initial Annual Cash Rent | | Number of Properties | | Number of Beds/Units(2) | Type of Property | Purchase Price(1) | | Initial Annual Cash Rent(2) | | Number of Properties | | Number of Beds/Units(3) |
| December 31, 2023 | |
Skilled nursing(4) (5) | |
Skilled nursing(4) (5) | |
Skilled nursing(4) (5) | |
Multi-service campuses(5) | |
| Assisted living | |
| Total | |
| December 31, 2022 | December 31, 2022 | | | | | | | |
| Skilled nursing | |
| Skilled nursing | |
| Skilled nursing | Skilled nursing | $ | 8,918 | | | $ | 815 | | | 1 | | | 135 | |
| Multi-service campuses | Multi-service campuses | 13,003 | | | 1,235 | | | 1 | | | 130 | |
| | Total | Total | $ | 21,921 | | | $ | 2,050 | | | 2 | | | 265 | |
| Total | |
| Total | |
| December 31, 2021 | December 31, 2021 | | | | | | | |
| Skilled nursing | |
| Skilled nursing | |
| Skilled nursing | Skilled nursing | $ | 57,973 | | | $ | 4,499 | | (3) | 4 | | | 509 | |
| Multi-service campuses | Multi-service campuses | 125,708 | | | 8,604 | | (4) | 4 | | | 640 | |
| Assisted living | Assisted living | 12,395 | | | — | | (5) | 2 | | | 98 | |
| Total | Total | $ | 196,076 | | | $ | 13,103 | | | 10 | | | 1,247 | |
| December 31, 2020 | | | | | | | |
| Skilled nursing | $ | 75,545 | | | $ | 6,453 | | | 6 | | | 715 | |
| Multi-service campuses | 6,876 | | | 555 | | | 1 | | | 184 | |
| Assisted living | 7,396 | | | 590 | | | 1 | | | 62 | |
| Total | $ | 89,817 | | | $ | 7,598 | | | 8 | | | 961 | |
(1)Purchase price includes capitalized acquisition costs.
(2) The number of beds/units includes operating beds at acquisition date.
(3) Initial annual cash rent represents initial cash rent for the first twelve months excluding anythe impact of straight-line rent.rent or rent abatement in the first one to three months, if applicable.
(3)The number of beds/units includes operating beds at acquisition date.
(4)Includes three SNFs held through joint ventures. See Note 11, Variable Interest Entities, for additional information. One SNF is currently leased under a short-term lease and a new long-term lease has been entered into with one of the Company’s existing operators and it is expected that this lease will become effective once regulatory approval is obtained. Initial annual cash rent does not consider a rent deferral of $420,000 in the first year upon commencement of the long-term lease to be repaid in 15 installments beginning in year 2. The two other SNFs held through a joint venture are under separate leases with an initial annual rent of $2.0 million. The leases provide for a rent reset in which the joint venture may propose rent, capped at 10% of gross revenues, effective January 1, 2027. If the proposed rent reset is not accepted, the joint venture has the option to replace the current tenant.
(5)One acquisition including three SNFs and one multi-service campus provides for annual fixed increases from $6.8 million in year one to $7.6 million in year two and $8.9 million in year three.
(6)Initial annual cash rent represents the first twelve months of rent upon commencement of the Company’s long-term net leases, which occurred during the three months ended June 30, 2021, upon the tenant’s receipt of licensing approval and increases to $9.4 million in the second year with CPI-based annual escalators thereafter.
(5) (7)Initial annual cash rent is zero until transfer of operations upon receipt of licensing approval.
Lease Amendments and Terminations
New Embassy Lease and Hillstone Lease Amendment and Termination. Effective January 1, 2024, the Company entered into a new triple-net master lease with Embassy Healthcare Holdings, Inc. (“Embassy”) with respect to one multi-service campus, formerly leased to an affiliate of Hillstone Healthcare, Inc. (“Hillstone”). The Embassy lease had an initial term at the date of the lease of approximately 10 years with two five-year renewal options and CPI-based rent escalators. Annual cash rent under the lease is approximately $0.6 million and the master lease provides Embassy with a partial rent abatement until required authorizations with respect to the ALF portion of the facility are obtained and occupancy levels reach a certain percentage.
On March 24, 2023, the Company amended its master lease with affiliates of Hillstone. In connection with the lease amendment, the Company agreed to defer rent of approximately $0.7 million for 12 months from December 2022 through November 2023 to be repaid as a percentage of adjusted gross revenues of one underlying facility, as defined in the amended lease, beginning January 1, 2025, until deferred rent has been paid in full. On December 31, 2023, the Company terminated its master lease with Hillstone. Annual cash rent under the Hillstone master lease prior to lease termination was approximately $1.3 million. Hillstone paid a lease termination fee of approximately $0.8 million to cover unpaid contractual rent.
CARETRUST REIT, INC.
NOTES TO CONSOLIDATED FINANCIAL STATEMENTS
Noble NJ Lease Termination and New Ridgeline NJ Lease. On October 24, 2023, the Company entered into a new master lease (the “Ridgeline NJ Lease”) with affiliates of Ridgeline Properties, LLC (“Ridgeline”) to lease two ALFs in New Jersey which were non-operational and under a short-term lease (the “Noble NJ Lease”) which was terminated in connection with the Ridgeline NJ Lease. The Ridgeline NJ Lease had an initial term at the date of the lease of approximately 10 years from the facility opening date, which is expected to occur in the second quarter of 2024 upon final regulatory approval and final licensing of both facilities, with two five-year renewal options and CPI-based escalators. Annual cash rent under the Ridgeline NJ Lease is approximately $1.0 million beginning on the first day of the second lease year.
Premier Termination and Amended Ridgeline Lease. Effective September 1, 2023, six ALFs in Michigan and North Carolina were removed from the master lease with affiliates of Premier Senior Living, LLC (“Premier”) and the Company terminated the Premier master lease. Annual cash rent under the Premier master lease prior to lease termination was approximately $2.7 million. In connection with the lease termination, the Company amended its existing triple-net master lease with affiliates of Ridgeline with respect to the six ALFs. The Ridgeline lease had a remaining term at the date of the lease amendment of approximately 15 years with two five-year renewal options and CPI-based rent escalators. Annual cash rent under the amended lease increased by approximately $2.7 million. The amended lease provides for $0.2 million in rent abatement and a $0.2 million rent deferral to be repaid beginning in December 2024.
Amended Pennant Lease. On July 6, 2023, the Company amended its master lease with affiliates of Pennant (the “Pennant Master Lease”). In connection with the lease amendment, the Company extended the initial lease term. The Pennant Master Lease, as amended, had a remaining term at the date of amendment of approximately 15 years, with two five-year renewal options and CPI-based rent escalators. Annual cash rent under the amended Pennant Master Lease remained unchanged.
Amended Momentum Lease. On April 1, 2023, the Company acquired one SNF. In connection with the acquisition, the Company amended its existing triple-net master lease with affiliates of Momentum Skilled Services (“Momentum”) to include the one SNF and extended the initial lease term. The Momentum master lease, as amended, had a remaining term at the date of amendment of approximately 15 years, with two five-year renewal options and CPI-based rent escalators. Annual cash rent under the amended lease increased by approximately $1.0 million.
Noble VA Lease Termination and New Pennant Lease. Effective March 16, 2023, two ALFs in Wisconsin were removed from a master lease with affiliates of Noble VA Holdings (“Noble VA”) and the Company terminated the applicable Noble VA master lease. Annual cash rent under the applicable Noble VA master lease prior to lease termination was approximately $2.3 million. In connection with the lease termination, the Company entered into a new lease (the “New Pennant Lease”) with Pennant with respect to the two ALFs. The New Pennant Lease had an initial term at the date of the lease of approximately 15 years with two five-year renewal options and CPI-based rent escalators. Annual cash rent under the new lease was approximately $0.8 million and the master lease provides Pennant with three months deferred rent to be repaid before the expiration or termination of the lease.
Noble Partial Lease Termination and New Landmark Leases. In June and August of 2022, one ALF in Florida and one ALF in Maryland were removed from a master lease with affiliates of Noble Senior Services (“Noble”) and the Company amended the applicable Noble master lease to reflect the removal of the two ALFs. Annual cash rent under the applicable Noble master lease decreased by approximately $1.1 million. In connection with the partial lease termination, the Company entered into a lease with Landmark Recovery of Maryland, LLC and Landmark Recovery of Florida, LLC ( collectively(collectively “Landmark”) to repurpose the facilities to behavioral health treatment centers. Rent under the leases will commence 12 - 18 months following commencement of the lease term or, if earlier, upon Landmark obtaining all licensure, permits, and other required regulatory authorizations with respect to operating the facility. The leases will expire on the 20th anniversary of the rent commencement date and both contain one 10-year renewal option and CPI-based rent escalators.
Pennant Partial Lease Termination and Amended Ensign Master Leases. On April 1, 2022, operations at two ALFs in California and Washington operated by affiliates of The Pennant Group, Inc. (“Pennant”) were transferred to affiliates of The Ensign Group, Inc. (“Ensign”).Ensign. In connection with the transfers, the Company amended the Pennant master leaseMaster Lease to reflect the removal of the two ALFs and amended two existing Ensign Master Leases to include the two ALFs. The applicable Ensign Master Leases, as amended, had a remaining term at the date of amendment of approximately five years and 16 years, respectively, both with three five-year renewal options and CPI-based rent escalators. Annual cash rent under each of the two applicable Ensign Master Leases, as amended, increased by approximately $0.4 million and annual cash rent under the Pennant master lease,Master Lease, as amended, decreased by $0.8 million.
CARETRUST REIT, INC.
NOTES TO CONSOLIDATED FINANCIAL STATEMENTS
On March 1, 2022, operations at one ALF in Arizona operated by affiliates of Pennant were transferred to affiliates of Ensign. In connection with the transfer, the Company amended the Pennant master leaseMaster Lease to reflect the removal of the ALF and amended an existing Ensign Master Lease to include the one ALF. The applicable Ensign Master Lease, as amended, had a remaining term at the date of amendment of approximately 11 years, with two five-year renewal options and CPI-based rent escalators. Annual cash rent under the applicable Ensign Master Lease, as amended, increased by approximately $0.3 million and annual cash rent under the Pennant master lease,Master Lease, as amended, decreased by the same amount.
Amended Eduro Master Lease. On February 1, 2022, the Company acquired one SNF. In conjunction with the acquisition, the Company amended its existing triple-net master lease with affiliates of Eduro Healthcare, LLC (“Eduro”) to include the one SNF and extended the initial lease term. The Eduro master lease, as amended, had a remaining term at the date of amendment of approximately 12 years, with two five-year renewal options and CPI-based rent escalators. Annual cash rent under the Eduro master lease, as amended, increased by approximately $0.8 million.
Amended WLC Master Lease. On March 1, 2022, the Company acquired one multi-service campus. In conjunction with the acquisition, the Company amended its existing triple-net master lease with affiliates of WLC Management Firm, LLC (“WLC”) to include the one multi-service campus. The WLC master lease, as amended, had a remaining term at the date of amendment of approximately 12 years, with two five-year renewal options and CPI-based rent escalators. Annual cash rent under the WLC master lease, as amended, increased by approximately $1.2 million.
Amended Noble Master Leases and New Noble NJ Master Lease. During the three months ended September 30, 2021, the Company did not collect a portion of rent from affiliates of Noble Senior Services and Noble VA Holdings, LLC (collectively, “Noble”). On September 23, 2021, the Company amended its two existing triple-net master leases with Noble. The lease amendment granted a deferral for a total of $1.8 million of unpaid base rent, which represented approximately 4% of the Company’s total contractual base rent for the three months ended September 30, 2021. In connection with its agreement to the rent deferral, the Company also entered into a purchase agreement with Noble to acquire two assisted living facilities owned by Noble. The lease amendment required the deferred rent, as well as all contractual rent for the fourth quarter of 2021, to be paid in full upon the closing of the purchase of the two facilities. The Company closed on the acquisition of the two facilities in December 2021 and the deferred rent, as well as all contractual rent for the fourth quarter of 2021, was paid in full. The two facilities are currentlywere leased back to Noble under a short-term lease agreement while the Company pursuespursued other tenants for the long-term.
Amended Ensign Master Lease. On August 1, 2021, the Company acquired two skilled nursing facilities. The facilities were leased to affiliates of Ensign. In conjunction with the acquisition of the two facilities, the Company amended and extended the initial term of an existing Ensign Master Lease to include the two skilled nursing facilities. The Ensign Master Lease, as amended, had a remaining term at the date of amendment of approximately 17 years, with three five-year renewal options and CPI-based rent escalators. Annual cash rent under the amended lease increased by approximately $2.2 million, with GAAP rent increasing by $2.5 million due to a $5.0 million prepayment of rent made at closing, which is being amortized on a straight-line basis over the remaining lease term.
Five Oaks Lease Termination and Amended Ensign Master Lease. On June 1, 2021, operating affiliates of Ensign acquired certain operations and assets of Five Oaks Healthcare, LLC (“Five Oaks”) under an agreement with Five Oaks. The agreement granted Ensign the right to occupy and operate four of the Company’s skilled nursing facilities in Washington that were previously being operated by Five Oaks. In conjunction with consenting to the transfer, the Company terminated the existing Five Oaks master lease, and amended and extended the term of an existing triple-net master lease with Ensign to include the four skilled nursing facilities. The Ensign lease, as amended, had a remaining term at the date of amendment of approximately 15 years, with three five-year renewal options and CPI-based rent escalators. Annual cash rent under the terminated Five Oaks master lease was approximately $2.6 million, and annual cash rent under the amended Ensign lease increased by the same amount.
CARETRUST REIT, INC.
NOTES TO CONSOLIDATED FINANCIAL STATEMENTS
Premier Partial Lease Termination and Amended Noble VA Master Lease. On March 10, 2021 and July 1, 2021, two assisted living facilities in Wisconsin operated by affiliates of Premier Senior Living, LLC (“Premier”) were transferred to affiliates of Noble VA Holdings, LLC (“Noble VA”).VA. In connection with the transfer, the Company partially terminated the Premier master lease and amended the existing triple-net master lease with Noble VA to include the two assisted living facilities. The Noble VA master lease, as amended, had a remaining term at the date of amendment of approximately 13 years, with two five-year renewal options and CPI-based rent escalators. Initial annual cash rent under the amended Noble VA master lease increased by approximately $1.3 million on March 10, 2021 and approximately $1.0 million on July 1, 2021 and annual cash rent under the partially terminated Premier master lease decreased by approximately the same amount. See above under “Amended Noble Master Leases and New Noble NJ Master Lease” for additional information regarding the Company’s leases with Noble.
Twenty/20“Noble VA Lease Termination and New Noble VA Master Lease. On December 1, 2020, five assisted living facilities in Virginia operated by Twenty/20 Management, Inc. (“Twenty/20”) were transferred to affiliates of Noble VA. In connection with the transfer, the Company entered into a new triple-net master lease with Noble VA. The lease had an initial term of approximately 14 years as of December 1, 2020, with two five-year renewal optionsPennant Lease” and CPI-based rent escalators. Initial annual cash rent under the new lease is approximately $3.2 million. See above under “Amended Noble Master Leases and New Noble NJ Master Lease” for additional information regarding the Company’s leases with Noble.
4. IMPAIRMENT OF REAL ESTATE INVESTMENTS, ASSETS HELD FOR SALE, NET AND ASSET SALES
In connection withImpairment of Real Estate Investments Held for Sale
During the Company’s ongoing review and monitoring of its investment portfolio and the performance of its tenants, during the first quarter of 2022,year ended December 31, 2023, the Company determinedrecognized aggregate impairment charges of $36.3 million, of which $26.8 million related to pursue the sale of 27 properties and the repurposing of three properties representing an aggregate of approximately 10% of contractual cash rent as of March 31, 2022. As of March 31, 2022, the Company determined that these 27 properties met the criteria to be classified as assets held for sale.sale, $8.0 million related to properties held for investment, and $1.5 million related to properties that were sold. During the year ended December 31, 2022, the Company recognized an aggregate impairment chargecharges of $79.1 million, of which $14.4 million related to properties held for sale, $19.7 million related to properties held for investment, and $45.0 million related to 12 facilities that have been sold, $18.0 million related to 10 facilitiesproperties that were sold. These charges are reported in impairment of real estate investments in the consolidated statements of operations. During the year ended December 31, 2021, the Company did not recognize any impairment charges.
As of December 31, 2023, there were 14 facilities classified as held for sale, in the first quarterall of 2022 and reclassifiedwhich have been marked down to held for use in the third and fourth quarters of 2022, $14.4 million related to five facilities that were held for sale as of December 31, 2022, and $1.7 million related to one facility that was held for use during the year. For properties classified as held for sale, the impairment charges were recognized to write down the properties to the lower of their carrying value or their aggregate fair value less estimated costs to sell. For properties classified as held for use, the impairment charges were recognized to write down the properties to their fair value.
Following the asset sales and held for sale reclassifications discussed below, five properties continued to meet the criteria to be classified as held for sale as of December 31, 2022. As of December 31, 2022, the real estate comprising the remaining five properties classified as held for sale had an aggregate carrying value of $12.3 million.
The fair valuevalues of the assets held for sale waswere based on estimated sales prices, which are considered to be Level 3 measurements within the fair value hierarchy. Estimated sales prices were determined using a market approach (comparable sales model), which relies on certain assumptions by management, including: (i) comparable market transactions, (ii) estimated prices per unit, and (iii) binding agreements for sales and non-binding offers to purchase from unrelated third-parties. There are inherent uncertainties in making these assumptions. For the Company’s impairment calculations on assets held for sale during the twelve months ended December 31, 2023, the Company’s fair value estimates primarily relied on a market approach and utilized prices per unit ranging from $8,000 to $85,000, with a weighted average price per unit of $20,000. For the Company’s impairment calculations on assets held for sale during the twelve months ended December 31, 2022, the Company’s fair value estimates primarily relied on a market approach and utilized prices per unit ranging from $20,000 to $85,000, with a weighted average price per unit of $55,000.
Asset Sales andImpairment of Real Estate Investments Held for Sale ReclassificationsInvestment
During the first quarter of 2022, the Company determined that one ALF that was classified as held for sale at December 31, 2021 no longer met the held for sale criteria. The Company reclassified this ALF’s carrying value of $4.8 million out of assets held for sale and recorded catch-up depreciation of approximately $0.1 million during the year ended December 31, 2022.
During the first quarter of 2022,2023, the Company closed on the salerecognized an impairment charge of $8.0 million related to one SNF, operated by affiliates of Cascadia Healthcare, LLC (“Cascadia”), consisting of 83 beds located in Washington with aSNF. The Company wrote down its carrying value of $0.8$8.7 million forto its estimated fair value of $0.7 million, which is included in real estate investments, net sales proceedson the Company’s consolidated balance sheets. The fair value of $1.0 million. the asset was based on comparable market transactions and considered Level 3 measurements within the fair value hierarchy. For the Company’s impairment calculation, the Company’s fair value estimates primarily relied on a market approach and utilized prices per unit of $7,000.
During the year ended December 31, 2022, the Company recordedrecognized an impairment charge of $1.7 million related to one SNF. The Company wrote down its carrying value of $2.8 million to its estimated fair value of $1.1 million, which is included in real estate investments, net on the Company’s condensed consolidated balance sheets. The fair value of the asset was based on comparable market transactions and considered Level 3 measurements within the fair value hierarchy. For the Company’s impairment calculation, the Company’s fair value estimates primarily relied on a gainmarket approach and utilized prices per unit of $0.2 million in connection with the sale. There was no rent reduction under the Cascadia master lease in connection with the sale.
CARETRUST REIT, INC.
NOTES TO CONSOLIDATED FINANCIAL STATEMENTS
$20,000.During the third quarter of 2022, the Company determined that one ALF, with a carrying value of $4.9 million, that was classified as held for sale at June 30, 2022 no longer met the held for sale criteria. The Company reclassified this ALF out of assets held for sale at its fair value at the date of the decision not to sell of approximately $4.9 million, or a weighted average
CARETRUST REIT, INC.
NOTES TO CONSOLIDATED FINANCIAL STATEMENTS
price per unit of $125,000.
During the third quarter of 2022, the Company closed on the sale of six SNFs and one multi-service campus, operated by affiliates of Trio Healthcare Holdings, LLC (“Trio”), consisting of 708 beds located in Ohio for net proceeds of $32.8 million. In connection with the sale, the Company provided affiliates of the purchaser of the properties with a $7.0 million term loan that bears interest at 8.5% and has a maturity date of September 30, 2025. The Company also provided a $5.0 million bridge loan to four individuals that bore interest at 8.5% and was subsequently repaid during the fourth quarter of 2022. Prior to their sale, the seven properties were classified as held for sale, with a carrying value of $46.9 million. During the year ended December 31, 2022, the Company recorded a loss of $2.1recognized approximately $1.4 million in connection with the sale.
During the fourth quarter of 2022, the Company closed on the sale of five ALFs, operated by affiliates of Noble VA Holdings, LLC (“Noble”), consisting of 301 beds located in Virginia for net proceeds of $11.0 million. Priorimpairment charges related to their sale, the five properties had been classified as held for sale at September 30, 2022, with a carrying value of $12.7 million. During the year ended December 31, 2022, the Company recorded a loss of $1.7 million in connection with the sale.
During the fourth quarter of 2022, the Company determined that nine ALFs, with a carrying value of $50.8 million, that were classified as held for sale at September 30, 2022, no longer met the held for sale criteria. The Company reclassified the nine ALFs out of assets held for sale at their fair value at the date of the decision not to sell of approximately $47.8 million.
During the year ended December 31, 2022, the Company recognized approximately $16.6 million in impairment charges related to these nine ALFs. The fair value of assets reclassified as real estate investments held for use was based on an income approach using current market conditions and considers matters such as the forecasted operating cash flows, lease coverage ratios, capitalization rates, and, where applicable, terms of recent lease agreements or the results of negotiations with prospective tenants, which are considered to be Level 3 measurements within the fair value hierarchy. There are inherent uncertainties in making these assumptions. For the Company’s impairment calculations, the Company’s fair value estimates primarily relied on an income approach. When utilizing an income approach, assumptions include, but are not limited to, terminal capitalization rates ranging from 7.5% to 8.75% and discount rates ranging from 8.5% to 9.75%.
Impairment of AssetsAsset Sales and Held For Usefor Sale Reclassifications
DuringThe following table summarizes the second quarter ofCompany’s dispositions for the years ended December 31, 2023, 2022 the Company recognized an impairment charge of $1.7 million related to one SNF. The Company wrote down itsand 2021 (dollars in thousands):
| | | | | | | | | | | | | | | | | | | | | |
| | | Twelve Months Ended December 31, |
| | | | | 2023 | | 2022(1) | | 2021(1) |
| Number of facilities | | | | | 5 | | 13 | | 1 |
Net sales proceeds(2) | | | | | $ | 18,313 | | | $ | 57,149 | | | $ | 7,178 | |
| Net carrying value | | | | | 16,095 | | | 60,918 | | | 7,255 | |
| Net gain (loss) on sale | | | | | $ | 2,218 | | | $ | (3,769) | | | $ | (77) | |
(1)Net sales proceeds, net carrying value and net gain (loss) on sale also reflect a land parcel that was sold in each of $2.8 million to its estimated fair value of $1.1 million,the years ended December 31, 2022 and 2021, which is not included in real estate investments, net onthe number of facilities.
(2)Net sales proceeds includes $2 million of seller financing in connection with the sale of one ALF in June 2023. Net sales proceeds includes $12 million of seller financing in connection with the sale of six SNFs and one multi-service campus in September 2022.
The following table summarizes the Company’s consolidated balance sheets. The fair value ofassets held for sale activity for the asset was based on comparable market transactions. For the Company’s impairment calculation, the Company’s fair value estimates primarily relied on a market approach and utilized prices per unit of $20,000.year ended December 31, 2023 (dollars in thousands):
| | | | | | | | | | | | | |
| Net Carrying Value | | Number of Facilities | | |
| | | | | |
| | | | | |
| | | | | |
| | | | | |
| | | | | |
| December 31, 2022 | $ | 12,291 | | | 5 | | |
| Additions to assets held for sale | 47,114 | | | 14 | | | |
| Assets sold | (16,095) | | | (5) | | | |
| Impairment of real estate held for sale | (28,299) | | | — | | | |
| | | | | |
| December 31, 2023 | $ | 15,011 | | | 14 | | | |
CARETRUST REIT, INC.
NOTES TO CONSOLIDATED FINANCIAL STATEMENTS
5. OTHER REAL ESTATE RELATED AND OTHER INVESTMENTS
As of December 31, 20222023 and 20212022, the Company’s other real estate related investments, at fair value, consisted of the following (dollar amounts in thousands):
| | | | | | | | | | | | | | | | | | | | | | | | | | | | | | | | |
| | | | | | | | As of December 31, 2022 |
| Investment | Facility Count and Type | Principal Balance as of December 31, 2022 | | Book Value as of December 31, 2022 | | Book Value as of December 31, 2021 | | Weighted Average Contractual Interest Rate | | Maturity Date |
| Senior mortgage secured loan receivable | 18 SNF/Campus | $ | 75,000 | | | $ | 72,543 | | | $ | — | | | 8.4 | % | (1) | 6/30/2027 |
| Mortgage secured loan receivable | 5 SNF | 22,250 | | | 21,345 | | | — | | | 10.2 | % | (2) | 8/1/2025 |
| Mortgage secured loan receivable | 4 SNF | 24,900 | | | 23,796 | | | — | | | 9.0 | % | (2) | 9/8/2025 |
| Mezzanine loan receivable | 9 SNF | 15,000 | | | 14,672 | | | 15,155 | | | 12.0 | % | | 11/30/2025 |
| Mezzanine loan receivable | 18 SNF/Campus | 25,000 | | | 24,012 | | | — | | | 11.0 | % | | 6/30/2032 |
| Total | | $ | 162,150 | | | $ | 156,368 | | | $ | 15,155 | | | | | |
| | | | | | | | | | | | | | | | | | | | | | | | | | | | | | | | |
| | | | | | | | As of December 31, 2023 |
| Investment | Facility Count and Type | Principal Balance as of December 31, 2023 | | Fair Value as of December 31, 2023 | | Fair Value as of December 31, 2022 | | Weighted Average Contractual Interest Rate | | Maturity Date |
| | | | | | | | | | |
| Mortgage secured loans receivable | 30 SNF, 3 ALF, 2 Campus & ILF | $ | 165,197 | | | $ | 156,769 | | | $ | 117,684 | | | 8.9 | % | (1), (2) | 5/31/2024 - 6/29/2033 |
| Mezzanine loans receivable | 18 SNF/Campus | 25,000 | | | 21,799 | | | 38,684 | | | 11.0 | % | | 6/30/2032 |
| Total | | $ | 190,197 | | | $ | 178,568 | | | $ | 156,368 | | | | | |
(1) Rate isRates are net of subservicing fee.fee, if applicable.
(2) TermTwo mortgage secured loans receivable use term secured overnight financing rate (“SOFR”). Term SOFR used as of December 31, 20222023 was 4.33%5.35%. Rates are net of subservicing fees.
The following table summarizes the Company’s other real estate related investments activity for the yearyears ended December 31, 2023, 2022, and 2021 (dollars in thousands):
| | For the Year Ended December 31, |
| 2022 | | 2021 |
| | For the Year Ended December 31, | | | | For the Year Ended December 31, |
| | 2023 | | | | 2023 | | 2022 | | 2021 |
| Origination of other real estate related investments | Origination of other real estate related investments | | $ | 147,150 | | | $ | — | |
| Accrued interest, net | Accrued interest, net | | 1,165 | | | 155 | |
| Unrealized loss on other real estate related investments | | (7,102) | | | — | |
| Unrealized loss on other real estate related investments, net | |
| Prepayments of other real estate related investments | |
| Net increase in other real estate related investments, at fair value | Net increase in other real estate related investments, at fair value | | $ | 141,213 | | | $ | 155 | |
2023 Other Real Estate Related Investment Transactions
On December 15, 2023, a partial payment of $10.5 million was made on one $22.3 million mortgage loan receivable. See below under “2022 Other Real Estate Related Investment Transactions” for further detail. On March 30, 2023, one $15.0 million mezzanine loan was prepaid in full. The $15.0 million mezzanine loan was originated in 2020 for nine skilled nursing facilities secured by membership interests in the borrower, with an annual interest rate of 12%.
On November 29, 2023, the Company extended a $6.3 million mortgage loan to an assisted living real estate owner. The mortgage loan is secured by one ALF and bears interest at a rate of 9.9%. The mortgage loan is set to mature on June 1, 2026, with two six-month extension options and may (subject to certain restrictions) be prepaid in whole before the maturity date for an exit fee of 2% of the loan plus unpaid interest payments; provided, however, that no exit fee is payable in connection with the loan being refinanced pursuant to a loan (or loans) provided by Fannie Mae, Freddie Mac, Federal Housing Administration, or a similar governmental authority. The Company elected the fair value option for the mortgage loan.
On September 29, 2023, the Company extended a $3.6 million mortgage loan as part of a larger, multi-tranche real estate secured term loan facility to a skilled nursing real estate owner. The secured term loan was structured with an “A” and a “B” tranche (with the payments on the “B” tranche being subordinate to the “A” tranche pursuant to the terms of a written agreement between the lenders). The Company’s $3.6 million secured mortgage loan constituted the entirety of the “B” tranche with its payments subordinated accordingly and bears interest at a rate of 12.0%. The mortgage loan is secured by three SNFs. The mortgage loan is set to mature on September 29, 2026, with two six-month extension options and may (subject to certain restrictions) be prepaid in whole before the maturity date for an exit fee ranging from 0% to 2% of any proposed financing in connection with the loan being refinanced by the U.S. Department of Housing and Urban Development (“HUD”). The Company elected the fair value option for the mortgage loan.
CARETRUST REIT, INC.
NOTES TO CONSOLIDATED FINANCIAL STATEMENTS
On July 17, 2023, the Company extended a $15.7 million mortgage loan to a skilled nursing real estate owner. The mortgage loan is secured by two SNFs and bears interest at a rate of 9.0%. The mortgage loan is set to mature on August 1, 2028, with one five-year extension option and may (subject to certain restrictions) be prepaid in whole before the maturity date for an exit fee ranging from 2% to 3% of the loan plus unpaid interest payments; provided, however, that no exit fee is payable in connection with the loan being refinanced pursuant to a loan (or loans) provided by Fannie Mae, Freddie Mac, Federal Housing Administration, or a similar governmental authority. The Company elected the fair value option for the mortgage loan.
On June 29, 2023, the Company extended a $26.0 million mortgage loan to a skilled nursing real estate owner. The mortgage loan is secured by one SNF campus and one ILF and bears interest at a rate of 9.0%. The mortgage loan is set to mature on June 29, 2033 and may (subject to certain restrictions) be prepaid in whole before the maturity date for an exit fee ranging from 0% to 3% of the loan plus unpaid interest payments. The Company elected the fair value option for the mortgage loan.
On June 1, 2023, the Company closed on the sale of one ALF. In connection with the sale, the Company provided affiliates of the purchaser of the properties with a $2.0 million mortgage loan which bears interest at a rate of 9.0%. The mortgage loan is secured by the ALF and is set to mature on May 31, 2024. The mortgage loan has a one-year extension option and may be prepaid in whole before the maturity date. The Company elected the fair value option for the mortgage loan.
2022 Other Real Estate Related Investment Transactions
In September 2022, the Company extended a $24.9 million term loan as part of a larger, multi-tranche real estate secured term loan facility to a skilled nursing real estate owner. The secured term loan was structured with an “A” and a “B” tranche (with the payments on the “B” tranche being subordinate to the “A” tranche pursuant to the terms of a written agreement between the lenders). The Company’s $24.9 million secured term loan constituted the entirety of the “B” tranche with its payments subordinated accordingly. The secured term loan is primarily secured by four skilled nursing facilitiesfacilities operated by an operator in the Southeast. The “B” tranche secured term loan is set to mature on September 8, 2025, with two one-year extension options and maymay (subject to certain restrictions) be prepaid in whole or in part before the maturity date for an exit fee ranging from 1% to 3% of the loan plus unpaid interest payments; provided, however, that no exit fee is payable in connection with portions of the loan being refinanced pursuant to a loan (or loans) provided by or insured by the United States Department of Housing and Urban Development, Federal Housing Administration, or a similar governmental authority. The “B” tranche secured term loan provides for an earnout advance of $4.7 million if certain conditions are met. The "B" tranche secured term loan bears interest at a rate based on term SOFR, calculated as a fraction, with the numerator being the difference between (i) the monthly payment of interest of term SOFR plus a 4.50% spread and (ii) the amount of such monthly payment of interest of term SOFR plus a 2.85% spread, and with the denominator being the average daily balance of the outstanding principal amount during the applicable month, with such fraction expressed as a percentage and annualized, with a term SOFR floor of 1.0% and less a subservicing fee of 100% over 9.00%. The “B” tranche secured term loan requires monthly interest payments. The Company elected the fair value option for the “B” tranche secured term loan.
CARETRUST REIT, INC.
NOTES TO CONSOLIDATED FINANCIAL STATEMENTS
In August 2022, the Company extended a $22.3 million term loan as part of a larger, multi-tranche real estate secured term loan facility to a skilled nursing real estate owner. The secured term loan was structured with an “A” and a “B” tranche (with the payments on the “B” tranche being subordinate to the “A” tranche pursuant to the terms of a written agreement between the lenders). The Company’s $22.3 million secured term loan constituted the entirety of the “B” tranche with its payments subordinated accordingly. The secured term loan is primarily secured by five skilled nursing facilities, four of which are operated by an existing operatoroperator and one of which is operatedoperated by a large, regional skilled nursing operator. The “B” tranche secured term loan is set to mature on August 1, 2025, with two one-year extension options and may (subject to certain restrictions) be prepaid in whole or in part before the maturity date for an exitexit fee ranging from 2% to 3% of the loan plus unpaid interest payments; provided, however, that no exit fee is payable in connection with portions of the loan being refinanced pursuant to a loan (or loans) provided by or insured by the United States Department of Housing and Urban Development,HUD, Federal Housing Administration, or a similar governmental authority. The "B" tranche secured term loan bears interest at a rate based on term secured overnight financing rate, calculated as a fraction, with the numerator being the difference between (i) the monthly payment of interest of term SOFR plus a 4.25% spread and (ii) the amount of such monthly payment of interest of term SOFR plus a 2.75% spread, and with the denominator being the average daily balance of the outstanding principal amount during the applicable month, with such fraction expressed as a percentage and annualized, with a term SOFR floor of 1.0% and less a subservicing fee of 50% over 8.25%. The “B” tranche secured term loan requires monthly interest payments. The Company elected the fair value option for the “B” tranche secured term loan. In December 2023, in accordance with the terms and conditions set forth in the loan agreement, the borrower elected to cause one of the skilled nursing facilities to be released from the loan, and in connection with the same, the borrower partially prepaid the loan in the amount of $10.5 million.
In June 2022, the Company extended a $75.0 million term loan to a skilled nursing real estate owner as part of a larger, multi-tranche, senior secured term loan facility. The senior secured term loan was structured with an “A” tranche, a “B” tranche, and a “C” tranche (with the “C” tranche being the most subordinate). The Company’s $75.0 million term loan constituted the entirety of the “C” tranche with its payments subordinated accordingly. The senior secured term loan facility is secured by an 18-facility skilled nursing portfolio in the Mid-Atlantic region, operated by a large, regional skilled nursing operator. In connection with the senior secured term loan facility and the borrower’s acquisition of the skilled nursing portfolio, the Company also extended to the borrower group a $25.0 million mezzanine loan. The “C” tranche of the senior secured term loan bears interest at 8.5%, less a servicing fee equal to the positive difference, if any, between the lesser of the contractual interest payment and actual payment of interest made by the borrower and a hypothetical interest payment at a rate of 8.25%, resulting in an effective interest rate of 8.375%. The “C” tranche senior secured term loan is set to mature on June 30, 2027 and may (subject to certain restrictions) be prepaid in whole or in part before the maturity date for an exit fee ranging from 1% to 3% of the loan plus unpaid interest payments through the end of the month of prepayment; provided, however, that no exit fee is payable in connection with portions of the loan being refinanced pursuant to a loan (or loans) provided by or insured by the United States Department of Housing and Urban Development,HUD, Federal Housing Administration, or a similar governmental authority. The mezzanine loan bears interest at 11% and is secured by a pledge of membership interests in an up-tier affiliate of the borrower group. The mezzanine loan is set to mature on June 30, 2032, and may (subject to certain restrictions) be prepaid in whole or in part before the maturity date, commencing on June 30, 2029, for an exit fee ranging from 1% to 3% of the loan plus unpaid interest payments through the date of prepayment. The “C” tranche senior secured term loan and mezzanine loan both require monthly interest payments. The Company elected the fair value option for both the “C” tranche term loan and the mezzanine loan.
The fair value option is elected on an instrument by instrument basis and must be applied to an entire instrument and is irrevocable once elected. The Company’s primary purpose in electing the fair value option for these instruments was to align with management’s view of the underlying economics of the loans and the manner in which they are managed.
Preferred Equity Investment
In December 2023, the Company completed a $1.8 million preferred equity investment in E3 Acquisition, LLC, which owns the borrowers under the $3.6 million mortgage loan noted above under “2023 Other Real Estate Related Investment Transactions.” The preferred equity investment yields a return of 15% calculated on the outstanding carrying value of the investment. The preferred equity investment is expected to be repaid with proceeds from the refinancing of the Company’s $3.6 million mortgage loan with HUD, provided, however, that if the repayment occurs sooner than 15 months from the investment date, the Company will receive the amount had the preferred equity investment remained outstanding for the full 15 months.
CARETRUST REIT, INC.
NOTES TO CONSOLIDATED FINANCIAL STATEMENTS
Other Loans Receivables
As of December 31, 20222023 and 2021,2022, the Company’s other loans receivable, included in prepaid expenses and other assets, net on the Company’s consolidated balance sheets, consisted of the following (dollars in thousands):
| | | | | | | | | | | | | | | | | | | | | | | | | | | | | | | | |
| | | | | | | | As of December 31, 2022 |
| Investment | | Principal Balance as of December 31, 2022 | | Book Value as of December 31, 2022 | | Book Value as of December 31, 2021 | | Weighted Average Contractual Interest Rate | | Maturity Date |
| Other loans receivable | | $ | 9,596 | | | $ | 9,600 | | | $ | 3,161 | | | 8.5 | % | | 9/1/2023 - 9/30/2025 |
| Expected credit loss | | — | | | (2,094) | | | — | | | | | |
| Total | | $ | 9,596 | | | $ | 7,506 | | | $ | 3,161 | | | | | |
CARETRUST REIT, INC.
NOTES TO CONSOLIDATED FINANCIAL STATEMENTS
| | | | | | | | | | | | | | | | | | | | | | | | | | | | | | | | |
| | | | | | | | As of December 31, 2023 |
| Investment | | Principal Balance as of December 31, 2023 | | Book Value as of December 31, 2023 | | Book Value as of December 31, 2022 | | Weighted Average Contractual Interest Rate | | Maturity Date |
| Other loans receivable | | $ | 17,094 | | | $ | 17,156 | | | $ | 9,600 | | | 8.8 | % | | 6/30/2024 - 5/31/2026 |
| Expected credit loss | | — | | | (2,094) | | | (2,094) | | | | | |
| Total | | $ | 17,094 | | | $ | 15,062 | | | $ | 7,506 | | | | | |
The following table summarizes the Company’s other loans receivable activity for the yearyears ended December 31, 20222023, 2022 and 2021 (dollars in thousands):
| | For the Year Ended December 31, |
| 2022 | | 2021 |
| | For the Year Ended December 31, | | | | For the Year Ended December 31, |
| | 2023 | | | | 2023 | | 2022 | | 2021 |
| Origination of loans receivable | Origination of loans receivable | | $ | 14,500 | | | $ | 1,253 | |
| Principal payments | Principal payments | | (6,307) | | | (393) | |
| Accrued interest, net | Accrued interest, net | | (4) | | | (6) | |
| Provision for loan losses, net | Provision for loan losses, net | | (3,844) | | | — | |
| | Net increase in other loans receivable | Net increase in other loans receivable | | $ | 4,345 | | | $ | 854 | |
| Net increase in other loans receivable | |
| Net increase in other loans receivable | |
Expected credit losses and recoveries are recorded in provision for loan losses, net in the consolidated statements of operations. During the year ended December 31, 2022, the Company recorded a $4.6 million expected credit loss related to two other loans receivable that werehave been placed on non-accrual status, including an unfunded loan commitment of $0.4 million, net of a loan loss recovery of $0.8 million related to a loan previously written-off. During the year ended December 31, 2022, the Company fully reserved and wrote-off $2.5 million, related to one other loan receivable, in connection with the sale of six SNFs and one multi-service campus. As ofDuring the years ended December 31, 2023 and 2021, the Company had no additional expected credit loss and did not consider any loan receivable investments to be impaired.
The following table summarizes the interest and other income recognized from the Company’s loans receivable and other investments during the years ended December 31, 2023, 2022 2021 and 20202021 (dollar amounts in thousands):
| | | | | | | | | | | | | | | | | | | | |
| | For Year Ended December 31, |
| Investment | | 2022 | | 2021 | | 2020 |
| Mortgage secured loans receivable | | $ | 4,853 | | | $ | — | | | $ | 2,044 | |
| Mezzanine loans receivable | | 3,489 | | | 1,825 | | | 305 | |
| | | | | | |
Preferred equity investments(1) | | — | | | — | | | 24 | |
| Other | | 284 | | | 331 | | | 270 | |
| Total | | $ | 8,626 | | | $ | 2,156 | | | $ | 2,643 | |
(1) As of December 31, 2022 and 2021, the Company had no preferred equity investments. | | | | | | | | | | | | | | | | | | | | |
| | For the Year Ended December 31, |
| Investment | | 2023 | | 2022 | | 2021 |
| Mortgage secured loans receivable | | $ | 13,329 | | | $ | 4,853 | | | $ | — | |
| Mezzanine loans receivable | | 3,683 | | | 3,489 | | | 1,825 | |
| | | | | | |
| Preferred equity investments | | 18 | | | — | | | — | |
| Other loans receivable | | 847 | | | 284 | | | 331 | |
| Other | | 1,294 | | | — | | | — | |
| Total | | $ | 19,171 | | | $ | 8,626 | | | $ | 2,156 | |
6. FAIR VALUE MEASUREMENTS
The Company determines fair value based on quoted prices when available or through the use of alternative approaches, such as discounting the expected cash flows using market interest rates commensurate with the credit quality and duration of the investment. GAAP guidance defines three levels of inputs that may be used to measure fair value:
CARETRUST REIT, INC.
NOTES TO CONSOLIDATED FINANCIAL STATEMENTS
Level 1 – Quoted prices in active markets for identical assets and liabilities that the reporting entity has the ability to access at the measurement date.
Level 2 – Inputs other than quoted prices included within Level 1 that are observable for the asset or liability or can be corroborated with observable market data for substantially the entire contractual term of the asset or liability.
Level 3 – Unobservable inputs reflect the entity’s own assumptions about the assumptions that market participants would use in the pricing of the asset or liability and are consequently not based on market activity, but rather through particular valuation techniques.
The determination of where an asset or liability falls in the hierarchy requires significant judgment and considers factors specific to the asset or liability. In instances where the determination of the fair value measurement is based on inputs from different levels of the fair value hierarchy, the level in the fair value hierarchy within which the entire fair value measurement falls is based on the lowest level input that is significant to the fair value measurement in its entirety. The Company evaluates its hierarchy disclosures each quarter and, depending on various factors, it is possible that an asset or liability may be classified differently from quarter to quarter. Changes in the type of inputs may result in a reclassification for certain assets. The Company does not expect that changes in classifications between levels will be frequent.
CARETRUST REIT, INC.
NOTES TO CONSOLIDATED FINANCIAL STATEMENTS
Items Measured at Fair Value on a Recurring Basis
The following table presents information about the Company’s assets and liabilities measured at fair value on a recurring basis as of December 31, 20222023 and 2021,2022, aggregated by the level in the fair value hierarchy within which those instruments fall (dollars in thousands): | | Level 1 | | | Level 1 | | Level 2 | | Level 3 | | Balance as of December 31, 2023 |
| Assets: | |
| Mortgage secured loans receivable | |
| Mortgage secured loans receivable | |
| Mortgage secured loans receivable | |
| Mezzanine loan receivable | |
| Total | |
| | Level 1 | | Level 2 | | Level 3 | | Balance as of December 31, 2022 |
| Level 1 | |
| Level 1 | |
| Level 1 | | | Level 2 | | Level 3 | | Balance as of December 31, 2022 |
| Assets: | Assets: | | | | | | | |
| Mortgage secured loans receivable | |
| Mortgage secured loans receivable | |
| Mortgage secured loans receivable | Mortgage secured loans receivable | $ | — | | | $ | — | | | $ | 117,684 | | | $ | 117,684 | |
| Mezzanine loans receivable | Mezzanine loans receivable | — | | | — | | | 38,684 | | | 38,684 | |
| Total | Total | $ | — | | | $ | — | | | $ | 156,368 | | | $ | 156,368 | |
| | Level 1 | | Level 2 | | Level 3 | | Balance as of December 31, 2021 |
| Assets: | | | | | | | |
| Mezzanine loan receivable | $ | — | | | $ | — | | | $ | 15,155 | | | $ | 15,155 | |
The following table details the Company’s assets measured at fair value on a recurring basis using Level 3 inputs (dollars in thousands):
| | | | | | | | | | | |
| Investments in Real Estate Secured Loans | | Investments in Mezzanine Loans |
| Balance at December 31, 2021 | $ | — | | | $ | 15,155 | |
| Loan originations | 122,150 | | | 25,000 | |
| Accrued interest, net | 928 | | | 237 | |
| Unrealized loss on other real estate related investments | (5,394) | | | (1,708) | |
| Balance as of December 31, 2022 | $ | 117,684 | | | $ | 38,684 | |
| | | | | | | | | | | |
| Investments in Real Estate Secured Loans | | Investments in Mezzanine Loans |
| Balance at December 31, 2022 | $ | 117,684 | | | $ | 38,684 | |
| Loan originations | 53,834 | | | — | |
| Accrued interest, net | 543 | | | (155) | |
| Unrealized losses on other real estate related investments, net | (4,755) | | | (1,730) | |
| Repayments | (10,537) | | | (15,000) | |
| Balance as of December 31, 2023 | $ | 156,769 | | | $ | 21,799 | |
Real estate secured and mezzanine loans receivable: The fair value of the secured and mezzanine loans receivables were estimated using an internal valuation model that considered the expected future cash flows of the investment, the underlying collateral value, market interest rates and other credit enhancements. As such, the Company classifies each instrument as Level 3 due to the significant unobservable inputs used in determining market interest rates for investments with similar terms. During the year ended December 31, 2023, the Company recorded an unrealized loss of $8.1 million on the Company’s secured and mezzanine loans receivable due to rising interest rates and a $0.3 million loss due to a loan origination fee paid, partially offset by unrealized gains of $0.7 million due to a decrease in projected forward interest rates and a reversal
CARETRUST REIT, INC.
NOTES TO CONSOLIDATED FINANCIAL STATEMENTS
of a previously recognized unrealized loss of $1.2 million related to the repayment of one mezzanine loan receivable and partial repayment of one mortgage loan receivable. During the year ended December 31, 2022, the Company recorded an unrealized loss of $7.1 million on the Company’s secured and mezzanine loans receivable due to rising interest rates. Future changes in market interest rates or collateral value could materially impact the estimated discounted cash flows that are used to determine the fair value of the secured and mezzanine loans receivable. As of December 31, 20222023 and 2021,2022, the Company did not have any loans that were 90 days or more past due.
The following table shows the quantitative information about unobservable inputs related to the Level 3 fair value measurements comprising the investments in secured and mezzanine loans receivables as of December 31, 20222023:
| | | | | | | | | | | | | | | | | | | | | | | |
| Type | Book Value as of December 31, 20222023 | | Valuation Technique | | Unobservable Inputs | | Range |
| Mortgage secured loans receivable | $ | 117,684156,769 | | | Discounted cash flow | | Discount Rate | | 9%10% - 13%15% |
Mezzanine loansloan receivable | 38,68421,799 | | | Discounted cash flow | | Discount Rate | | 12% - 14%15% |
For the year ended December 31, 2022,2023, there were no classification changes in assets and liabilities with Level 3 inputs in the fair value hierarchy.
Items Measured at Fair Value on a Non-Recurring Basis
Real Estate Investments: The Company performs quarterly impairment review procedures, primarily through continuous monitoring of events and changes in circumstances that could indicate the carrying value of its real estate assets may not be recoverable. The Company estimates fair values using Level 3 inputs and uses a combined income and market approach. Specifically, the fair value of the real estate investment is based on current market conditions and considers matters such as the forecasted operating cash flows, lease coverage ratios, capitalization rates, comparable sales data, and, where applicable, contracts or the results of negotiations with purchasers or prospective purchasers. For the years ended December 31, 2023 and 2022, the Company recorded impairment charges of $36.3 million and $79.1 million, respectively. For the year ended December 31, 2022, the
CARETRUST REIT, INC.
NOTES TO CONSOLIDATED FINANCIAL STATEMENTS
Company recorded an impairment charge of $79.1 million. For the years ended December 31, 2021, and 2020, there were no real estate assets deemed to be impaired. See Note 4, Impairments of Real Estate Investments, Assets Held for Sale, Net and Asset Sales, for additional information.
Items Disclosed at Fair Value
Considerable judgment is necessary to estimate the fair value disclosure of financial instruments. The estimates of fair value presented herein are not necessarily indicative of the amounts that could be realized upon disposition of the financial instruments. A summary of the face values,value, carrying amount and fair value of the Notes (as defined in Note 7, Debt, below) as of December 31, 20222023 and 20212022 using Level 2 inputs is as follows (dollars in thousands):
| | | | December 31, 2022 | | December 31, 2021 | | | | December 31, 2023 | | December 31, 2022 |
| Face
Value | | Carrying
Amount | | Fair
Value | | Face
Value | | Carrying
Amount | | Fair
Value |
| Level | | | Level | | Face
Value | | Carrying
Amount | | Fair
Value | | Face
Value | | Carrying
Amount | | Fair
Value |
| Financial assets: | |
| Preferred equity investment | |
| Preferred equity investment | |
| Preferred equity investment | |
| Financial liabilities: | Financial liabilities: | | | | | | | | | | | |
| Senior unsecured notes payable | Senior unsecured notes payable | $ | 400,000 | | | $ | 395,150 | | | $ | 345,036 | | | $ | 400,000 | | | $ | 394,262 | | | $ | 410,500 | |
| Senior unsecured notes payable | |
| Senior unsecured notes payable | |
|
Cash and cash equivalents, accounts and other receivables, accounts payable, and accrued liabilities: The carrying values for these instruments approximate their fair values due to the short-term nature of these instruments.
Preferred equity investments: The fair value of the preferred equity investment was estimated using an internal valuation model that considered the expected future cash flows of the investment, the underlying collateral value, market interest rates and other credit enhancements. The Company utilized discount rates ranging from 14% to 16% with a weighted average of 15% in its fair value calculation. As such, the Company classifies these instruments as Level 3.
Senior unsecured notes payable: The fair value of the Notes was determined using third-party quotes derived from orderly trades.
CARETRUST REIT, INC.
NOTES TO CONSOLIDATED FINANCIAL STATEMENTS
Unsecured revolving credit facility and senior unsecured term loan: The fair values approximate their carrying values as the interest rates are variable and approximate prevailing market interest rates and spreads for similar debt arrangements.
7. DEBT
The following table summarizes the balance of the Company’s indebtedness as of December 31, 2023 and 2022 and 2021 (in(dollars in thousands): | | December 31, 2022 | | December 31, 2021 |
| Principal | Deferred | Carrying | | Principal | Deferred | Carrying |
| Amount | Loan Fees | Amount | | Amount | Loan Fees | Amount |
| December 31, 2023 | | | December 31, 2023 | | December 31, 2022 |
| Principal | | | Principal | Deferred | Carrying | | Principal | Deferred | Carrying |
| Amount | | | Amount | Loan Fees | Amount | | Amount | Loan Fees | Amount |
| Senior unsecured notes payable | Senior unsecured notes payable | $ | 400,000 | | $ | (4,850) | | $ | 395,150 | | | $ | 400,000 | | $ | (5,738) | | $ | 394,262 | |
| | Senior unsecured term loan | Senior unsecured term loan | 200,000 | | (652) | | 199,348 | | | 200,000 | | (864) | | 199,136 | |
| Unsecured revolving credit facility | 125,000 | | — | | 125,000 | | | 80,000 | | — | | 80,000 | |
| $ | 725,000 | | $ | (5,502) | | $ | 719,498 | | | $ | 680,000 | | $ | (6,602) | | $ | 673,398 | |
| Senior unsecured term loan | |
| Senior unsecured term loan | |
Unsecured revolving credit facility(1) | |
| $ | |
(1)Deferred financing fees are included in deferred financing costs, net on the balance sheet, and not reflected as a reduction to the unsecured revolving credit facility.
Senior Unsecured Notes Payable
2028 Senior Notes. On June 17, 2021, the Company’s wholly owned subsidiary, CTR Partnership, L.P. (the “Operating Partnership”), and its wholly owned subsidiary, CareTrust Capital Corp. (together with the Operating Partnership, the “Issuers”) completed a private offering of $400.0 million aggregate principal amount of 3.875% Senior Notes due 2028 (the “Notes”) to persons reasonably believed to be qualified institutional buyers pursuant to Rule 144A and to non-U.S. persons outside the United States in reliance on Regulation S under the Securities Act of 1933, as amended. The Notes were issued at par, resulting in gross proceeds of $400.0 million and net proceeds of approximately $393.8 million after deducting underwriting fees and other offering expenses. The Notes mature on June 30, 2028. The Notes accrue interest at a rate of 3.875% per annum payable semiannually in arrears on June 30 and December 30 of each year, commencing on December 30, 2021.
The Issuers may redeem some or all of the Notes at any time prior to March 30, 2028 at a price equal to 100% of the principal amount of the Notes redeemed plus accrued and unpaid interest on the Notes, if any, to, but not including, the redemption date, plus a “make-whole” premium. At any time on or after March 30, 2028, the Issuers may redeem some or all of the Notes at a redemption price equal to 100% of the principal amount of the Notes redeemed plus accrued interest on the Notes, if any, to, but not including, the redemption date. In addition, at any time on or prior to June 30, 2024, up to 40% of the
CARETRUST REIT, INC.
NOTES TO CONSOLIDATED FINANCIAL STATEMENTS
aggregate principal amount of the Notes may be redeemed with the net proceeds of certain equity offerings at a redemption price of 103.875% of the aggregate principal amount of Notes to be redeemed plus accrued and unpaid interest on the Notes, if any, to, but not including, the redemption date. If certain changes of control of the Company occur, the Issuers will be required to make an offer to holders of the Notes to repurchase their Notes at a price of 101% of their principal amount plus accrued and unpaid interest, if any, to, but not including, the repurchase date.
The obligations under the Notes are fully and unconditionally guaranteed, jointly and severally, on an unsecured basis, by the Company and all of CareTrust’s existing and future subsidiaries (other than the Issuers) that guarantee obligations under the Amended Credit Facility (as defined below); provided, however, that such guarantees are subject to automatic release under certain customary circumstances.
The indenture governing the Notes contains customary covenants such as limiting the ability of the Company and its restricted subsidiaries to: incur or guarantee additional indebtedness; incur or guarantee secured indebtedness; pay dividends or distributions on, or redeem or repurchase, capital stock; make certain investments or other restricted payments; sell assets; enter into transactions with affiliates; merge or consolidate or sell all or substantially all of their assets; and create restrictions on the ability of the Issuers and their restricted subsidiaries to pay dividends or other amounts to the Issuers. The indenture governing the Notes also requires the Company and its restricted subsidiaries to maintain a specified ratio of unencumbered assets to unsecured indebtedness. These covenants are subject to a number of important and significant limitations, qualifications and exceptions. The indenture governing the Notes also contains customary events of default.
CARETRUST REIT, INC.
NOTES TO CONSOLIDATED FINANCIAL STATEMENTS
As of December 31, 2022,2023, the Company was in compliance with all applicable financial covenants under the indenture governing the Notes.
2025 Senior Notes. On May 10, 2017, the Issuers completed an underwritten public offering of $300.0 million aggregate principal amount of 5.25% Senior Notes due 2025 (the “2025 Notes”). The 2025 Notes were issued at par, resulting in gross proceeds of $300.0 million and net proceeds of approximately $294.0 million after deducting underwriting fees and other offering expenses. The 2025 Notes were scheduled to mature on June 1, 2025 and bore interest at a rate of 5.25% per year. Interest on the 2025 Notes was payable on June 1 and December 1 of each year. On July 1, 2021 (the “Redemption Date”), the Issuers redeemed all $300.0 million aggregate principal amount of the 2025 Notes at a redemption price equal to 102.625% of the principal amount of the 2025 Notes, plus accrued and unpaid interest thereon up to, but not including, the Redemption Date. During the year ended December 31 2021, the Company recorded a loss on extinguishment of debt of $10.8 million in the consolidated statements of operations, including a prepayment penalty of $7.9 million and a $2.9 million write-off of deferred financing costs associated with the redemption of the 2025 Notes.
Unsecured Revolving Credit Facility and Term Loan
On December 16, 2022, the Operating Partnership, as the borrower, the Company, as guarantor, CareTrust GP, LLC, and certain of the Operating Partnership’s wholly owned subsidiaries, entered into a second amended and restated credit and guaranty agreement with KeyBank National Association, as administrative agent, an issuing bank and swingline lender (the( as amended from time to time, the “Second Amended Credit Agreement”). The Second Amended Credit Agreement, which amends and restates the Company’s amended and restated credit and guaranty agreement, dated as of February 8, 2019 (as amended, the “Prior Credit Agreement”) provides for: (i) an unsecured revolving credit facility (the “Revolving Facility”) with revolving commitments in an aggregate principal amount of $600.0 million, including a letter of credit subfacility for 10% of the then available revolving commitments and a swingline loan subfacility for 10% of the then available revolving commitments and (ii) the continuation of the unsecured term loan credit facility which was previously extended under the Prior Credit Agreement (the “Term Loan” and together with the Revolving Facility, the “Second Amended Credit Facility”) in an aggregate principal amount of $200.0 million. Future borrowings under the Second Amended Credit Facility will be used for working capital purposes, for capital expenditures, to fund acquisitions and for general corporate purposes.
On October 10, 2023, the Operating Partnership, the Company, CareTrust GP, LLC, certain of the Operating Partnership’s wholly owned subsidiaries and KeyBank National Association entered into the First Amendment to the Second Amended Credit Agreement (the “First Amendment”). The First Amendment restates the definition of Consolidated Total Asset Value to include net proceeds from at-the-market forward commitments executed but not yet closed as of the relevant date as if such proceeds had actually been received.
The interest rates applicable to loans under the Revolving Facility are, at the Operating Partnership’s option, equal to either a base rate plus a margin ranging from 0.10% to 0.55% per annum or Adjusted Term SOFR or Adjusted Daily Simple SOFR (each as defined in the Second Amended Credit Agreement) plus a margin ranging from 1.10% to 1.55% per annum based on the debt to asset value ratio of the Company and its consolidated subsidiaries (subject to decrease at the Operating Partnership’s election if the Company obtains certain specified investment grade ratings on its senior long-term unsecured debt). The interest rates applicable to loans under the Term Loan are, at the Operating Partnership’s option, equal to either a base rate plus a margin ranging from 0.50% to 1.20% per annum or Adjusted Term SOFR or Adjusted Daily Simple SOFR plus a margin ranging from 1.50% to 2.20% per annum based on the debt to asset value ratio of the Company and its consolidated
CARETRUST REIT, INC.
NOTES TO CONSOLIDATED FINANCIAL STATEMENTS
subsidiaries (subject to decrease at the Operating Partnership’s election if the Company obtains certain specified investment grade ratings on its senior long-term unsecured debt). In addition, the Operating Partnership will pay a facility fee on the revolving commitments under the Revolving Facility ranging from 0.15% to 0.35% per annum, based on the debt to asset value ratio of the Company and its consolidated subsidiaries (unless the Company obtains certain specified investment grade ratings on its senior long-term unsecured debt and the Operating Partnership elects to decrease the applicable margin as described above, in which case the Operating Partnership will pay a facility fee on the revolving commitments ranging from 0.125% to 0.30% per annum based on the credit ratings of the Company’s senior long-term unsecured debt). As of December 31, 2022,2023, the Operating Partnership had $200.0 million of borrowings outstanding under the Term Loan and $125.0 millionno borrowings outstanding under the Revolving Facility.
The Revolving Facility has a maturity date of February 9, 2027, and includes, at the sole discretion of the Operating Partnership, two six-month extension options. The Term Loan has a maturity date of February 8, 2026.
CARETRUST REIT, INC.
NOTES TO CONSOLIDATED FINANCIAL STATEMENTS
The Second Amended Credit Facility is guaranteed, jointly and severally, by the Company and its wholly owned subsidiaries that are party to the Second Amended Credit Agreement (other than the Operating Partnership). The Second Amended Credit Agreement contains customary covenants that, among other things, restrict, subject to certain exceptions, the ability of the Company and its subsidiaries to grant liens on their assets, incur indebtedness, sell assets, make investments, engage in acquisitions, mergers or consolidations, amend organizational documents and pay certain dividends and other restricted payments. The Second Amended Credit Agreement requires the Company to comply with financial maintenance covenants to be tested quarterly, consisting of a maximum debt to asset value ratio, a minimum fixed charge coverage ratio, a minimum tangible net worth, a maximum cash distributions to operating income ratio, a maximum secured debt to asset value ratio, a maximum secured recourse debt to asset value ratio, a maximum unsecured debt to unencumbered properties asset value ratio, a minimum unsecured interest coverage ratio and a minimum rent coverage ratio. The Second Amended Credit Agreement also contains certain customary events of default, including the failure to make timely payments under the Second Amended Credit Facility or other material indebtedness, the failure to satisfy certain covenants (including the financial maintenance covenants), the occurrence of change of control and specified events of bankruptcy and insolvency.
As of December 31, 2022,2023, the Company was in compliance with all applicable financial covenants under the Second Amended Credit Agreement.
Schedule of Debt Maturities
As of December 31, 2022,2023, the Company’s debt maturities were (dollars in thousands): | | Year | Year | Amount | Year | Amount |
| 2023 | $ | — | |
| 2024 | 2024 | — | |
| 2025 | 2025 | — | |
| 2026 | 2026 | 200,000 | |
| 2027 | 2027 | 125,000 | |
| 2028 | |
| Thereafter | Thereafter | 400,000 | |
| | | $ | 725,000 | |
8. EQUITY
Common Stock
At-The-Market Offering—On March 10, 2020,February 24, 2023, the Company entered into an equity distribution agreement to issue and sell, from time to time, up to $500.0 million in aggregate offering price of its common stock through an “at-the-market” equity offering program (the “Previous ATM Program”). On September 15, 2023, the Company terminated the Previous ATM Program and entered into a new equity distribution agreement to issue and sell, from time to time, up to $500.0 million in aggregate offering price of its common stock through an “at-the-market” equity offering program (the “New ATM Program” and together with the Previous ATM Program, the “ATM Program”), which expires in March 2023.. In addition to the issuance and sale of shares of its common stock, the Company may also enter into one or more forward sales agreements (each, an “ATM forward contract”) with sales agents for the sale of the Company’s shares of common stock under the ATM Program.
CARETRUST REIT, INC.
NOTES TO CONSOLIDATED FINANCIAL STATEMENTS
The Company expects to fully physically settle forward equity sales by delivery of shares of common stock to the forward purchaser and receive cash proceeds upon one or more settlement dates, which are typically a one-year term, at the Company’s discretion, prior to the final settlement date, at which time the Company expects to receive aggregate net cash proceeds at settlement equal to the number of shares sold on a forward basis multiplied by the relevant forward price per share. The weighted average forward sale price that the Company expects to receive upon physical settlement will be subject to adjustment for (i) a floating interest rate factor equal to a specified daily rate less a spread, (ii) the forward purchaser’s stock borrowing costs and (iii) scheduled dividends through the settlement. There waswere no outstanding ATM forward contracts that had not settled as of December 31, 2023.
The following tables summarize ATM Program activity (or activity under any predecessor at-the-market equity offering programs) for the
yearyears ended December 31,
2020. The following table summarizes ATM Program activity for the years ended December 31,2023, 2022 and 2021 (in thousands, except per share amounts):
| | | | | | | | | | | | | |
| For the Year Ended December 31, |
| 2022 | | 2021 | | |
| Number of shares | 2,405 | | | 990 | | | |
| Average sales price per share | $ | 20.00 | | | $ | 23.74 | | | |
Gross proceeds(1) | $ | 48,100 | | | $ | 23,505 | | | |
| | | | | | | | | | | | | | | | | |
| For the Year Ended December 31, |
| 2023 | | 2022 | | 2021 |
| Number of shares | 30,869 | | | 2,405 | | | 990 | |
| Average sales price per share | $ | 20.86 | | | $ | 20.00 | | | $ | 23.74 | |
Gross proceeds(1) | $ | 643,802 | | | $ | 48,100 | | | $ | 23,505 | |
(1)Total gross proceeds is before $8.3 million, $0.6 million, and $0.3 million of commissions paid to the sales agents and forward adjustments during the yearyears ended December 31, 2023, 2022 and 2021, respectively, under the ATM Program. In addition, total gross proceeds is before other costs related to the ATM Program.
As of December 31, 2022,2023, the Company had $428.4$274.1 million available for future issuances under the ATM Program.
Share Repurchase Program — On March 20, 2020, the Company’s Board of Directors authorized a share repurchase program up to $150.0 million of outstanding shares of the Company’s common stock (the “Repurchase Program”). Repurchases under the Repurchase Program, which expires on March 31, 2023, may be made through open market purchases, privately negotiated transactions, structured or derivative transactions, including accelerated share repurchase transactions, or other methods of acquiring shares, in each case subject to market conditions and at such times as shall be permitted by applicable securities laws and determined by management. Repurchases under the Repurchase Program may also be made pursuant to a plan adopted under Rule 10b5-1 promulgated under the Exchange Act. The Company expects to finance any share repurchases under the Repurchase Program using available cash and may also use short-term borrowings under the Revolving Facility. The Company did not repurchase any shares of common stock under the Repurchase Program during the years ended December 31, 2022, 2021 and 2020. The Repurchase Program may be modified, discontinued or suspended at any time.
Dividends on Common Stock — The following table summarizes the cash dividends per share of common stock declared by the Company’s Boardboard of Directorsdirectors for 2023, 2022 2021 and 20202021 (dollars in thousands, except per share amounts): | | | For the Three Months Ended | | | | For the Three Months Ended |
| 2023 | | 2023 | | March 31, | | June 30, | | September 30, | | December 31, |
| Dividends declared per share | |
| Dividends payment date | | Dividends payment date | | April 14, 2023 | | July 14, 2023 | | October 13, 2023 | | January 12, 2024 |
Dividends payable as of record date[1] | |
| Dividends record date | | Dividends record date | | March 31, 2023 | | June 30, 2023 | | September 29, 2023 | | December 29, 2023 |
| | For the Three Months Ended |
| 2022 | 2022 | | March 31, | | June 30, | | September 30, | | December 31, |
| 2022 | |
| 2022 | |
| Dividends declared per share | |
| Dividends declared per share | |
| Dividends declared per share | Dividends declared per share | | $ | 0.275 | | | $ | 0.275 | | | $ | 0.275 | | | $ | 0.275 | |
| Dividends payment date | Dividends payment date | | April 15, 2022 | | July 15, 2022 | | October 14, 2022 | | January 13, 2023 | Dividends payment date | | April 15, 2022 | | July 15, 2022 | | October 14, 2022 | | January 13, 2023 |
Dividends payable as of record date[1] | Dividends payable as of record date[1] | | $ | 26,691 | | | $ | 26,683 | | | $ | 26,683 | | | $ | 27,386 | |
| Dividends record date | Dividends record date | | March 31, 2022 | | June 30, 2022 | | September 30, 2022 | | December 30, 2022 | Dividends record date | | March 31, 2022 | | June 30, 2022 | | September 30, 2022 | | December 30, 2022 |
| | 2021 | 2021 | |
| 2021 | |
| 2021 | |
| Dividends declared per share | |
| Dividends declared per share | |
| Dividends declared per share | Dividends declared per share | | $ | 0.265 | | | $ | 0.265 | | | $ | 0.265 | | | $ | 0.265 | |
| Dividends payment date | Dividends payment date | | April 15, 2021 | | July 15, 2021 | | October 15, 2021 | | January 14, 2022 | Dividends payment date | | April 15, 2021 | | July 15, 2021 | | October 15, 2021 | | January 14, 2022 |
Dividends payable as of record date[1] | Dividends payable as of record date[1] | | $ | 25,633 | | | $ | 25,714 | | | $ | 25,714 | | | $ | 25,755 | |
| Dividends record date | Dividends record date | | March 31, 2021 | | June 30, 2021 | | September 30, 2021 | | December 31, 2021 | Dividends record date | | March 31, 2021 | | June 30, 2021 | | September 30, 2021 | | December 31, 2021 |
| | 2020 | |
| Dividends declared per share | | $ | 0.25 | | | $ | 0.25 | | | $ | 0.25 | | | $ | 0.25 | |
| Dividends payment date | | April 15, 2020 | | July 15, 2020 | | October 15, 2020 | | January 15, 2021 |
Dividends payable as of record date[1] | | $ | 23,931 | | | $ | 23,931 | | | $ | 23,934 | | | $ | 23,933 | |
| Dividends record date | | March 31, 2020 | | June 30, 2020 | | September 30, 2020 | | December 31, 2020 |
(1)Dividends payable includes dividends on performance stock awards that will be paid if and when the shares subject to such awards vest.vest if deemed probable of meeting their performance condition.
CARETRUST REIT, INC.
NOTES TO CONSOLIDATED FINANCIAL STATEMENTS
9. STOCK-BASED COMPENSATION
All stock-based awards are subject to the terms of the CareTrust REIT, Inc. and CTR Partnership, L.P. Incentive Award Plan (the “Plan”). The Plan provides for the granting of stock-based compensation, including stock options, restricted stock, performance awards, restricted stock units, relative total stockholder return-based stock awards and other incentive awards to officers, employees and directors in connection with their employment with or services provided to the Company. Under the Plan, 5,000,000 shares have been authorized for awards.
Under the Plan, restricted stock awards (“RSAs”) vest in equal annual installments beginning on the first anniversary of the grant date over a three year period for the RSAs granted in 2022 and 2021after 2020 and a four year period for the RSAs granted in 2020. RSAs granted to non-employee members of the Boardboard of Directorsdirectors (“Board Awards”) vest in full on the earlier to occur of the Company’s next Annual Meeting of Stockholders or one year. Performance stock awards (“PSA”PSAs”) granted are subject to both time and performance based conditions and vest over a one-to three year period for PSAs granted in 2021 and over a one-to-four year period for PSAs granted in 2020. The amount of such PSAs that will ultimately vest is dependent on the Company’s Normalized Funds from Operations (“NFFO”) per share, as defined by the Compensation Committee, meeting or exceeding a specified per share amount for the applicable vesting period. Relative total shareholder return units (“TSR Units”) granted in 2022 andsince 2021 are subject to both time and market based conditions and cliff vest after a three-year period. The amount of such market awards that will ultimately vest is dependent on the Company’s total shareholder return (“TSR”) performance relative to a custom TSR peer group consisting of other publicly traded healthcare REITs and will range from 0% to 200% of the TSR Units initially granted. The RSAs, PSAs, and Board Awards are valued on the date of grant based on the closing price of the Company’s common stock, while the TSR Units are valued on the date of grant using a Monte Carlo valuation model. The vesting of certain awards may accelerate, as defined in the grant agreement, upon retirement, a change in control or other events.
The following table summarizes the status of the restricted stock award and performance award activity for the year ended December 31, 2022:2023: | | Shares | | Weighted Average Share Price |
| Unvested balance at December 31, 2021 | 891,333 | | | $ | 20.91 | |
| Shares | | | Shares | | Weighted Average Share Price |
| Unvested balance at December 31, 2022 | |
| Granted: | Granted: | |
| RSAs | |
| RSAs | |
| RSAs | RSAs | 159,663 | | | 19.56 | |
| | Board Awards | Board Awards | 25,992 | | | 16.93 | |
| Board Awards | |
| Board Awards | |
| Vested | Vested | (501,479) | | | 20.60 | |
| Forfeited | Forfeited | (1,900) | | | 21.50 | |
| Unvested balance at December 31, 2022 | 573,609 | | | $ | 20.63 | |
| Unvested balance at December 31, 2023 | |
As of December 31, 2022,2023, the weighted-average remaining vesting period of such awards was 1.91.7 years.
The following table summarizes the Company’s RSA, PSARSAs and Board AwardAwards grants during the year ended December 31, 20222023 (dollars in thousands, except per share amounts):
| | Grants | | Vested |
| Shares | | Weighted Average Share Price | | Grant Date Fair Value | | Shares | | Vest Date Fair Value |
During year ended December 31, 2022(1) | | | | | | | | | |
| Grants | | | Grants | | Vested |
| Shares | | | Shares | | Weighted Average Share Price | | Grant Date Fair Value | | Shares | | Vest Date Fair Value |
During year ended December 31, 2023(1) | |
| RSAs | |
| RSAs | |
| RSAs | RSAs | 159,663 | | | $ | 19.56 | | | $ | 3,123 | | | 263,568 | | | $ | 5,020 | |
| PSAs | PSAs | — | | | — | | | — | | | 217,645 | | | 4,134 | |
| Board Awards | Board Awards | 25,992 | | | 16.93 | | | 440 | | | 20,266 | | | 346 | |
(1)The Compensation Committee granted annual awards for 20232024 in December 2022.2023.
CARETRUST REIT, INC.
NOTES TO CONSOLIDATED FINANCIAL STATEMENTS
The following table summarizes the Company’s RSA, PSA and Board Award grants during the years ended December 31, 20212022 and 20202021 (dollars in thousands, except per share amounts):
| | Grants | | | Grants |
| Shares | | | Shares | | Weighted Average Share Price | | Grant Date Fair Value |
During year ended December 31, 2022(1) | |
| RSAs | |
| RSAs | |
| RSAs | |
| | Grants |
| Shares | | Weighted Average Share Price | | Grant Date Fair Value |
During year ended December 31, 2021(1) | | | | | |
| Board Awards | |
| Board Awards | |
| Board Awards | |
During year ended December 31, 2021(2) | |
| RSAs | |
| RSAs | |
| RSAs | RSAs | 394,863 | | | $ | 21.92 | | | $ | 8,654 | |
| PSAs | PSAs | 108,414 | | | 22.48 | | | 2,437 | |
| Board Awards | Board Awards | 20,266 | | | 24.18 | | | 490 | |
| During year ended December 31, 2020 | |
| RSAs | 134,790 | | | $ | 19.68 | | | $ | 2,653 | |
| PSAs | 107,790 | | | 19.06 | | | 2,054 | |
| Board Awards | 27,611 | | | 16.48 | | | 455 | |
(1)The Compensation Committee granted annual awards for 2023 in December 2022.
(2)In 2021, the Compensation Committee changed the structure of the grants that resulted in two long-term equity incentive awards being granted to the Company’s named executive officers in 2021. The Compensation Committee also granted annual awards for 2022 in December 2021.
The fair value of the TSR Units is estimated on the date of the grant using a Monte Carlo valuation model. The risk-free rate is based on the U.S. Treasury yield curve in effect at the grant date for the expected performance period. Expected volatility is based on historical volatility for the most recent weighted average period ending on the grant date for the Company and the selected TSR peer group, and is calculated on a daily basis. The following table reflects the weighted-average key assumptions used in this valuation for awards granted during the yearyears ended December 31, 2023, 2022 and 2021:
| | For the Year Ended December 31, 2022 | | For the Year Ended December 31, 2021 | |
| For the Year Ended December 31, 2023 | | | For the Year Ended December 31, 2023 | | For the Year Ended December 31, 2022 | | For the Year Ended December 31, 2021 |
| Risk-free interest rate | Risk-free interest rate | 3.91 | % | | 0.60 | % | | Risk-free interest rate | 4.08 | % | | 3.91 | % | | 0.60 | % |
| Expected stock price volatility | Expected stock price volatility | 52.90 | % | | 52.42 | % | | Expected stock price volatility | 26.44 | % | | 52.90 | % | | 52.42 | % |
| Expected service period | Expected service period | 3.04 years | | 2.93 years | | Expected service period | 3.04 years | | 3.04 years | | 2.93 years |
| Expected dividend yield (assuming full reinvestment) | Expected dividend yield (assuming full reinvestment) | — | % | | — | % | | Expected dividend yield (assuming full reinvestment) | — | % | | — | % | | — | % |
| Fair value per share at date of grant | Fair value per share at date of grant | $ | 26.53 | | | $ | 29.10 | | |
|
The total fair value of the TSR Units granted during the yearyears ended December 31, 2023, 2022 and 2021 was $2.9 million, $2.5 million and $5.3 million, respectively.
The following table summarizes the stock-based compensation expense recognized (dollars in thousands): | | | | | | | | | | | | | | | | | |
| | For Year Ended December 31, |
| | 2022 | | 2021 | | 2020 |
| Stock-based compensation expense | $ | 5,758 | | | $ | 10,832 | | | $ | 3,790 | |
| | | | | | | | | | | | | | | | | |
| | For Year Ended December 31, |
| | 2023 | | 2022 | | 2021 |
| Stock-based compensation expense | $ | 5,153 | | | $ | 5,758 | | | $ | 10,832 | |
As of December 31, 2022,2023, there was $11.610.4 million of unamortized stock-based compensation expense related to the unvested RSAs, PSAs, Board Awards, and TSR Units.
CARETRUST REIT, INC.
NOTES TO CONSOLIDATED FINANCIAL STATEMENTS
10. EARNINGS (LOSS) EARNINGS PER COMMON SHARE
The following table presents the calculation of basic and diluted earnings (loss) earnings per common share attributable to CareTrust REIT, Inc. (“EPS”) for the Company’s common stock for the years ended December 31, 2023, 2022 2021 and 2020,2021, and reconciles the weighted-average common shares outstanding used in the calculation of basic EPS to the weighted-average common shares outstanding used in the calculation of diluted EPS for the years ended December 31, 2023, 2022 2021 and 20202021 (amounts in thousands, except per share amounts):
| | | | Year Ended December 31, | | Year Ended December 31, |
| | | 2022 | | 2021 | | 2020 | | 2023 | | 2022 | | 2021 |
| Numerator: | Numerator: | | | | | |
| Net (loss) income | $ | (7,506) | | | $ | 71,982 | | | $ | 80,867 | |
| Net income (loss) attributable to CareTrust REIT, Inc. | |
| Net income (loss) attributable to CareTrust REIT, Inc. | |
| Net income (loss) attributable to CareTrust REIT, Inc. | |
| Less: Net income allocated to participating securities | Less: Net income allocated to participating securities | (440) | | | (507) | | | (298) | |
| Numerator for basic and diluted earnings available to common stockholders | Numerator for basic and diluted earnings available to common stockholders | $ | (7,946) | | | $ | 71,475 | | | $ | 80,569 | |
| Denominator: | Denominator: | | | | | |
| Weighted-average basic common shares outstanding | Weighted-average basic common shares outstanding | 96,703 | | | 96,017 | | | 95,200 | |
| Dilutive performance stock awards | — | | | 75 | | | 7 | |
| Weighted-average basic common shares outstanding | |
| Weighted-average basic common shares outstanding | |
| Dilutive potential common shares - performance stock awards | |
| Dilutive potential common shares - forward equity agreements | |
| Weighted-average diluted common shares outstanding | Weighted-average diluted common shares outstanding | 96,703 | | | 96,092 | | | 95,207 | |
| | (Loss) earnings per common share, basic | $ | (0.08) | | | $ | 0.74 | | | $ | 0.85 | |
| (Loss) earnings per common share, diluted | $ | (0.08) | | | $ | 0.74 | | | $ | 0.85 | |
| Antidilutive unvested restricted stock awards, total shareholder units and performance awards excluded from the computation | 744 | | | 591 | | | 296 | |
| Earnings (loss) per common share attributable to CareTrust REIT, Inc., basic | |
| Earnings (loss) per common share attributable to CareTrust REIT, Inc., basic | |
| Earnings (loss) per common share attributable to CareTrust REIT, Inc., basic | |
| Earnings (loss) per common share attributable to CareTrust REIT, Inc., diluted | |
| Antidilutive unvested restricted stock awards, total shareholder units, performance awards, and forward equity shares excluded from the computation | |
CARETRUST REIT, INC.
NOTES TO CONSOLIDATED FINANCIAL STATEMENTS
11. VARIABLE INTEREST ENTITIES
Noncontrolling Interests—The Company has entered into ventures with unrelated third parties to own real estate and has concluded that such ventures are VIEs. As the Company exercises power over and receives economic benefits from the VIEs, the Company is considered the primary beneficiary and consolidates the VIEs.
In August 2023, the Company entered into a joint venture (“JV”), pursuant to which the Company contributed $2.4 million into the JV, that was used to satisfy a deposit on a potential real estate acquisition.
In September 2023, the Company entered into a JV, pursuant to which the Company contributed $25.5 million into the JV that purchased one SNF located in California for $26.1 million. The JV partner contributed the remaining $0.6 million of equity.
In October 2023, the Company entered into a JV, pursuant to which the Company contributed $34.3 million into the JV that purchased two SNFs located in California for $35.1 million. The JV partner contributed the remaining $0.8 million of equity.
Pursuant to the Company’s JVs, the Company typically contributes 97.5% of the JVs total investment amount and the Company receives 100% of the preferred equity interest in the JV in exchange for 95% of that total investment and a 50% common equity interest in the JV in exchange for the remaining 2.5% of that investment. The JV partner contributes the remaining 2.5% of the JVs total investment amount in exchange for a 50% common ownership interest in the JV.
Total assets and total liabilities on the Company’s consolidated balance sheets include VIE assets and liabilities as follows (in thousands):
| | | | | | | |
| December 31, 2023 | | |
| Assets: | | | |
| | | |
| | | |
| | | |
| | | |
| | | |
| | | |
| Real estate investments, net | $ | 68,106 | | | |
| Prepaid and other assets | 2,800 | | | |
| Total assets | 70,906 | | | |
| Liabilities: | | | |
| Accounts payable, accrued liabilities and deferred rent liabilities | 7,239 | | | |
| Total liabilities | $ | 7,239 | | | |
CARETRUST REIT, INC.
NOTES TO CONSOLIDATED FINANCIAL STATEMENTS
12. COMMITMENTS AND CONTINGENCIES
The Company and its subsidiaries are and may become from time to time a party to various claims and lawsuits arising in the ordinary course of business, which are not individually or in the aggregate anticipated to have a material adverse effect on the Company’s results of operations, financial condition or cash flows. Claims and lawsuits may include matters involving general or professional liability asserted against the Company’s tenants, which are the responsibility of the Company’s tenants and for which the Company is entitled to be indemnified by its tenants under the insurance and indemnification provisions in the applicable leases.
In the normal course of business, the Company enters into various commitments, typically consisting of funding of capital expenditures and short-term working capital loans to existing tenants while they await licensure and certification or are conducting turnaround work in one or more of the Company’s properties.
Capital expenditures for each property leased under the Company’s triple-net leases are generally the responsibility of the tenant, except that, for the facilities leased tounder certain master lease agreements, with certain subsidiaries of Ensign under the Ensign Master Leases, and Pennant, under which the tenant will have an option to require the Company to finance certain capital expenditures up to an aggregate of 20% of itsthe Company’s initial investment in such property, subject to a corresponding rent increase at the time of funding. For the Company’s other triple-net master leases, the tenants also have the option to request capital expenditure funding that would generally be subject to a corresponding rent increase at the time of funding, which are subject to tenant compliance with the conditions to the Company’s approval and funding of their requests. The Company has also provided select tenants with strategic capital for facility upkeep and modernization. The Company’s Tenant Code of Conduct and Corporate Responsibility policy (the “Tenant ESG Program”) provides eligible triple-net tenants of the Company with monetary inducements to make sustainable improvements to the Company’s properties. Incentive options include a wide variety of opportunities for tenants to upgrade everything from energy and environmental systems to water-saving landscaping and more. The Company’s board of directors has authorized annual allocations of up to $500,000 to fund the Tenant ESG Program.
The table below summarizes the Company’s existing, known commitments and contingencies as of December 31, 2023 (in thousands):
| | | | | | | | | | | |
| | | | | | | Remaining Commitment |
Capital expenditures(1) | | | | | | | $ | 9,206 | |
Mortgage loans(2) | | | | | | | 4,700 | |
| | | | | | | |
| | | | | | | $ | 13,906 | |
(1)As of December 31, 2022,2023, the Company had committed to fund expansions, construction, and capital improvements and ESG incentives at certain triple-net leased facilities totaling $15.7$9.2 million, of which $2.7$2.4 million is subject to rent increase at the time of funding.
(2)One mortgage loan includes an earnout advance upon satisfaction of certain conditions.
12.13. CONCENTRATION OF RISK
Concentrations of credit risk arise when one or more tenants, operators, or obligors related to the Company’s investments are engaged in similar business activities or activities in the same geographic region, or have similar economic features that would cause their ability to meet contractual obligations, including those to the Company, to be similarly affected by changes in economic conditions.
CARETRUST REIT, INC.
NOTES TO CONSOLIDATED FINANCIAL STATEMENTS
Major operator concentration – The Company has operators from which it derived 10% or more of its rental revenue for the years ended December 31, 2023, 2022 2021 and 2020.2021. The following table sets forth information regarding the Company’s major operators as of December 31, 2023, 2022 2021 and 2020:2021:
| | | | | Number of Facilities | | Number of Beds/Units | | Percentage of Total Revenue(1) | | | Number of Facilities | | Number of Beds/Units | | Percentage of Total Revenue |
Operator(2) | | SNF | | Campus | | ALF/ILF | | SNF | | Campus | | ALF/ILF | |
| December 31, 2022 | | | | | | | | | | | | | | |
Operator(1) | |
December 31, 2023(2) | |
December 31, 2023(2) | |
December 31, 2023(2) | |
| Ensign | |
| Ensign | |
| Ensign | Ensign | | 83 | | | 8 | | 7 | | | 8,741 | | | 997 | | 661 | | | 35 | % | | 83 | | | 8 | | 8 | | 7 | | | 8,738 | | 8,738 | | | 997 | | 997 | | 661 | | | 32 | | 32 | % |
| PMG | PMG | | 13 | | | 2 | | — | | | 1,742 | | | 402 | | — | | | 16 | % | PMG | | 13 | | | 2 | | 2 | | — | | | 1,742 | | 1,742 | | | 402 | | 402 | | — | | | 14 | | 14 | % |
| | December 31, 2021 | |
December 31, 2022(3) | |
December 31, 2022(3) | |
December 31, 2022(3) | |
| Ensign | |
| Ensign | |
| Ensign | Ensign | | 83 | | | 8 | | 4 | | | 8,756 | | | 997 | | | 395 | | | 32 | % | | 83 | | | 8 | | 8 | | 7 | | | 8,741 | | 8,741 | | | 997 | | 997 | | | 661 | | 661 | | | 35 | | 35 | % |
| PMG | PMG | | 13 | | | 2 | | — | | | 1,742 | | | 402 | | | — | | | 15 | % | PMG | | 13 | | | 2 | | 2 | | — | | | 1,742 | | 1,742 | | | 402 | | 402 | | | — | | — | | | 16 | | 16 | % |
| | December 31, 2020 | |
December 31, 2021(3) | |
December 31, 2021(3) | |
December 31, 2021(3) | |
| Ensign | |
| Ensign | |
| Ensign | Ensign | | 77 | | | 8 | | 4 | | | 8,129 | | | 1,027 | | | 390 | | | 32 | % | | 83 | | | 8 | | 8 | | 4 | | | 8,756 | | 8,756 | | | 997 | | 997 | | | 395 | | 395 | | | 32 | | 32 | % |
| PMG | PMG | | 13 | | | 2 | | — | | | 1,742 | | | 403 | | | — | | | 16 | % | PMG | | 13 | | | 2 | | 2 | | — | | | 1,742 | | 1,742 | | | 402 | | 402 | | | — | | — | | | 15 | | 15 | % |
(1) The Company’s rental income, exclusive of operating expense reimbursements.
(2) See Note 3, Real Estate Investments, Net, for further information regarding Ensign and PMG. Ensign is subject to the registration and reporting requirements of the SEC and is required to file with the SEC annual reports containing audited financial information and quarterly reports containing unaudited financial information. Ensign’s financial statements, as filed with the SEC, can be found at http://www.sec.gov. The Company has not verified this information through an independent investigation or otherwise.
(2)The Company’s rental income and interest income on other real estate related investments, exclusive of operating expense reimbursements and adjustments for collectibility.
(3)The Company’s rental income, exclusive of operating expense reimbursements and adjustments for collectibility.
Major geographic concentration – The following table provides information regarding the Company’s concentrations with respect to certain states, from which the Company derived 10% or more of its rental revenue for the year ended December 31, 2023, 2022 and 2021:
| | | | | Number of Facilities | | Number of Beds/Units | | Percentage of Total Revenue(1) | | | Number of Facilities | | Number of Beds/Units | | Percentage of Total Revenue |
| State | State | | SNF | | Campus | | ALF/ILF | | SNF | | Campus | | ALF/ILF | |
| December 31, 2022 | | | | | | | | | | | | | | |
December 31, 2023(1) | |
December 31, 2023(1) | |
December 31, 2023(1) | |
| CA | |
| CA | |
| CA | CA | | 27 | | | 8 | | 5 | | | 3,048 | | | 1,359 | | | 437 | | | 26 | % | | 40 | | | 9 | | 9 | | 8 | | | 4,615 | | 4,615 | | | 1,527 | | 1,527 | | | 656 | | 656 | | | 28 | | 28 | % |
| TX | TX | | 38 | | | 3 | | 3 | | | 4,849 | | | 536 | | 242 | | | 22 | % | TX | | 40 | | | 3 | | 3 | | 2 | | | 5,123 | | 5,123 | | | 536 | | 536 | | 212 | | | 21 | | 21 | % |
| | December 31, 2021 | |
December 31, 2022(2) | |
December 31, 2022(2) | |
December 31, 2022(2) | |
| CA | |
| CA | |
| CA | CA | | 27 | | | 8 | | 5 | | | 3,048 | | | 1,359 | | | 449 | | | 25 | % | | 27 | | | 8 | | 8 | | 5 | | | 3,048 | | 3,048 | | | 1,359 | | 1,359 | | | 437 | | 437 | | | 26 | | 26 | % |
| TX | TX | | 37 | | | 3 | | 3 | | | 4,694 | | | 536 | | | 242 | | | 20 | % | TX | | 38 | | | 3 | | 3 | | 3 | | | 4,849 | | 4,849 | | | 536 | | 536 | | | 242 | | 242 | | | 22 | | 22 | % |
| December 31, 2021(2) | |
December 31, 2021(2) | |
December 31, 2021(2) | |
| CA | |
| CA | |
| CA | | | 27 | | | 8 | | 5 | | | 3,048 | | | 1,359 | | | 449 | | | 25 | % |
| TX | | TX | | 37 | | | 3 | | 3 | | | 4,694 | | | 536 | | | 242 | | | 20 | % |
(1) TheBased on the Company’s rental income and interest income on other real estate related investments, exclusive of operating expense reimbursements and adjustments for collectibility.
(2)Based on the Company’s rental income, exclusive of operating expense reimbursementsreimbursements and adjustments for collectibility.
13.14. SUBSEQUENT EVENTS
The Company evaluates subsequent events in accordance with ASC 855, Subsequent Events. The Company evaluates subsequent events up until the date the consolidated financial statements are issued.
CARETRUST REIT, INC.
NOTES TO CONSOLIDATED FINANCIAL STATEMENTS
Recent Asset SaleAcquisitions and Investments
On January 13,3, 2024, the Company contributed $10.7 million into a JV that purchased one ALF located in California for $11.0 million. In exchange, the Company holds 100% of the preferred equity interests in the JV and 50% of the common equity interest in the JV. The JV partner contributed the remaining $0.3 million of the total investment in exchange for 50% of the common equity interest in the JV. The new lease has an initial term of approximately 10 years, with four five-year renewal options and 2% fixed rent escalators beginning in year 3. Annual cash rent under the lease is approximately $1.0 million.
On January 25, 2024, the Company extended a $9.8 million mezzanine loan to a skilled nursing real estate owner in connection with a portfolio of ten SNFs located in Missouri. The mezzanine loan is secured by a pledge of membership interests in an affiliate of the borrower. The loan bears interest at term SOFR plus 8.75%, with a term SOFR floor of 6%, payable monthly and net of a 0.75% subservicing fee. Commencing on February 1, 2026, monthly principal payments shall be due. The mezzanine loan is set to mature on July 25, 2027, with two six-month extension options and may (subject to certain restrictions) be prepaid in whole before the maturity date for an exit fee ranging from 1% to 2% of the loan plus unpaid interest payments equal to 24 months (less the amount of monthly interest payments made by the borrower through the date of prepayment).
On February 1, 2024, the Company extended a $7.4 million mezzanine loan to a skilled nursing real estate owner for one SNF located in California. The mezzanine loan is secured by a pledge of membership interests in an affiliate of the borrower. The loan bears interest at 11.5%, payable monthly. The mezzanine loan is set to mature on January 31, 2029 and may (subject to certain limited exceptions) not be prepaid prior to the date that is 18 months following the loan closing.
On February 2, 2024, the Company extended a $35.0 million mezzanine loan to a skilled nursing real estate owner in connection with 15 SNFs located in Virginia. The mezzanine loan is secured by a pledge of membership interests in an affiliate of the borrower. The loan bears interest at term SOFR plus 8.75%, with a term SOFR floor of 6%, payable monthly and net of a 0.75% subservicing fee. Commencing on February 2, 2026, monthly principal payments shall be due. The mezzanine loan is set to mature on August 1, 2027, with two six-month extension options and may (subject to certain restrictions) be prepaid in whole before the maturity date for an exit fee ranging from 1% to 2% of the loan plus unpaid interest payments equal to 18 months (less the amount of monthly interest payments made by the borrower through the date of prepayment).
New Lease Agreement
Effective January 1, 2024, in connection with the December 31, 2023 Hillstone lease termination, one multi-service campus was removed from the Hillstone master lease. In connection with the lease termination, the Company entered into a new lease with Embassy Healthcare Holdings, Inc. (“Embassy”) with respect to the one multi-service campus. The Embassy lease had an initial term at the date of the lease of approximately 10 years with two five-year renewal options and CPI-based rent escalators. Annual cash rent under the lease is approximately $0.6 million and the master lease provides Embassy with a partial rent abatement until required authorizations with respect to the ALF portion of the facility are obtained and occupancy levels reach a certain percentage.
Asset Sales
Subsequent to December 31, 2023, the Company closed on the sale of one SNF and one ALF consisting of 105 beds located in Florida with aan aggregate carrying value of $3.3$1.0 million, which approximated the net sales proceeds received. The facility was classified as held for sale as of December 31, 2022.
SCHEDULE III
REAL ESTATE ASSETS AND ACCUMULATED DEPRECIATION
DECEMBER 31, 20222023
(dollars in thousands)
| | Initial Cost to Company | | Costs Capitalized Since Acquisition | | Gross Carrying Value | |
| | | | | | | | Initial Cost to Company | |
| | | | | | | | Initial Cost to Company | |
| | | | | | | | Initial Cost to Company | |
| Description | |
| Description | |
| Description | Description | | Facility | | Location | | Encum. | | Land | | Building
Improvs. | | Improvs. | | | | Land | | Building
Improvs. | | Total (1) | | Accum. Depr. | | Const./Ren. Date | | Acq.
Date | | Facility | | Location | | Encum. | | Land | | Building
Improvs. | | Improvs. | | | | Land | | Building
Improvs. | | Total (1) | | Accum. Depr. | | Const./Ren. Date | | Acq.
Date |
| Skilled Nursing Properties: | Skilled Nursing Properties: | | | | | | | | | | | | | | | | | | | | | | | | | | |
| Ensign Highland LLC | |
| Ensign Highland LLC | |
| Ensign Highland LLC | Ensign Highland LLC | | Highland Manor | | Phoenix, AZ | | $ | — | | | $ | 257 | | | $ | 976 | | | $ | 926 | | | | | $ | 257 | | | $ | 1,902 | | | $ | 2,159 | | | $ | (1,479) | | | 2013 | | 2000 | | Highland Manor | | Phoenix, AZ | | $ | — | | | $ | | $ | 257 | | | $ | | $ | 976 | | | $ | | $ | 926 | | | | | $ | | | | $ | 257 | | | $ | | $ | 1,902 | | | $ | | $ | 2,159 | | | $ | | $ | (1,549) | | | 2013 | | 2013 | | 2000 |
| Meadowbrook Health Associates LLC | Meadowbrook Health Associates LLC | | Sabino Canyon | | Tucson, AZ | | — | | | 425 | | | 3,716 | | | 1,940 | | | | | 425 | | | 5,656 | | | 6,081 | | | (3,505) | | | 2012 | | 2000 | Meadowbrook Health Associates LLC | | Sabino Canyon | | Tucson, AZ | | — | | | 425 | | 425 | | | 3,716 | | 3,716 | | | 1,940 | | 1,940 | | | | | 425 | | | | 425 | | | 5,656 | | 5,656 | | | 6,081 | | 6,081 | | | (3,700) | | (3,700) | | | 2012 | | 2012 | | 2000 |
| Terrace Holdings AZ LLC | Terrace Holdings AZ LLC | | Desert Terrace | | Phoenix, AZ | | — | | | 113 | | | 504 | | | 971 | | | | | 113 | | | 1,475 | | | 1,588 | | | (1,026) | | | 2004 | | 2002 | Terrace Holdings AZ LLC | | Desert Terrace | | Phoenix, AZ | | — | | | 113 | | 113 | | | 504 | | 504 | | | 971 | | 971 | | | | | 113 | | | | 113 | | | 1,475 | | 1,475 | | | 1,588 | | 1,588 | | | (1,103) | | (1,103) | | | 2004 | | 2004 | | 2002 |
| Rillito Holdings LLC | Rillito Holdings LLC | | Catalina | | Tucson, AZ | | — | | | 471 | | | 2,041 | | | 3,055 | | | | | 471 | | | 5,096 | | | 5,567 | | | (3,562) | | | 2013 | | 2003 | Rillito Holdings LLC | | Catalina | | Tucson, AZ | | — | | | 471 | | 471 | | | 2,041 | | 2,041 | | | 3,055 | | 3,055 | | | | | 471 | | | | 471 | | | 5,096 | | 5,096 | | | 5,567 | | 5,567 | | | (3,826) | | (3,826) | | | 2013 | | 2013 | | 2003 |
| Valley Health Holdings LLC | Valley Health Holdings LLC | | North Mountain | | Phoenix, AZ | | — | | | 629 | | | 5,154 | | | 1,519 | | | | | 629 | | | 6,673 | | | 7,302 | | | (4,357) | | | 2009 | | 2004 | Valley Health Holdings LLC | | North Mountain | | Phoenix, AZ | | — | | | 629 | | 629 | | | 5,154 | | 5,154 | | | 1,519 | | 1,519 | | | | | 629 | | | | 629 | | | 6,673 | | 6,673 | | | 7,302 | | 7,302 | | | (4,630) | | (4,630) | | | 2009 | | 2009 | | 2004 |
| Cedar Avenue Holdings LLC | Cedar Avenue Holdings LLC | | Upland | | Upland, CA | | — | | | 2,812 | | | 3,919 | | | 1,994 | | | | | 2,812 | | | 5,913 | | | 8,725 | | | (3,865) | | | 2011 | | 2005 | Cedar Avenue Holdings LLC | | Upland | | Upland, CA | | — | | | 2,812 | | 2,812 | | | 3,919 | | 3,919 | | | 1,994 | | 1,994 | | | | | 2,812 | | | | 2,812 | | | 5,913 | | 5,913 | | | 8,725 | | 8,725 | | | (4,054) | | (4,054) | | | 2011 | | 2011 | | 2005 |
| Granada Investments LLC | Granada Investments LLC | | Camarillo | | Camarillo, CA | | — | | | 3,526 | | | 2,827 | | | 1,522 | | | | | 3,526 | | | 4,349 | | | 7,875 | | | (2,965) | | | 2010 | | 2005 | Granada Investments LLC | | Camarillo | | Camarillo, CA | | — | | | 3,526 | | 3,526 | | | 2,827 | | 2,827 | | | 1,522 | | 1,522 | | | | | 3,526 | | | | 3,526 | | | 4,349 | | 4,349 | | | 7,875 | | 7,875 | | | (3,150) | | (3,150) | | | 2010 | | 2010 | | 2005 |
| Plaza Health Holdings LLC | Plaza Health Holdings LLC | | Park Manor | | Walla Walla, WA | | — | | | 450 | | | 5,566 | | | 1,055 | | | | | 450 | | | 6,621 | | | 7,071 | | | (4,407) | | | 2009 | | 2006 | Plaza Health Holdings LLC | | Park Manor | | Walla Walla, WA | | — | | | 450 | | 450 | | | 5,566 | | 5,566 | | | 1,055 | | 1,055 | | | | | 450 | | | | 450 | | | 6,621 | | 6,621 | | | 7,071 | | 7,071 | | | (4,660) | | (4,660) | | | 2009 | | 2009 | | 2006 |
| Mountainview Communitycare LLC | Mountainview Communitycare LLC | | Park View Gardens | | Santa Rosa, CA | | — | | | 931 | | | 2,612 | | | 653 | | | | | 931 | | | 3,265 | | | 4,196 | | | (2,317) | | | 1963 | | 2006 | Mountainview Communitycare LLC | | Park View Gardens | | Santa Rosa, CA | | — | | | 931 | | 931 | | | 2,612 | | 2,612 | | | 653 | | 653 | | | | | 931 | | | | 931 | | | 3,265 | | 3,265 | | | 4,196 | | 4,196 | | | (2,434) | | (2,434) | | | 1963 | | 1963 | | 2006 |
| CM Health Holdings LLC | CM Health Holdings LLC | | Carmel Mountain | | San Diego, CA | | — | | | 3,028 | | | 3,119 | | | 2,071 | | | | | 3,028 | | | 5,190 | | | 8,218 | | | (3,381) | | | 2012 | | 2006 | CM Health Holdings LLC | | Carmel Mountain | | San Diego, CA | | — | | | 3,028 | | 3,028 | | | 3,119 | | 3,119 | | | 2,071 | | 2,071 | | | | | 3,028 | | | | 3,028 | | | 5,190 | | 5,190 | | | 8,218 | | 8,218 | | | (3,571) | | (3,571) | | | 2012 | | 2012 | | 2006 |
| Polk Health Holdings LLC | Polk Health Holdings LLC | | Timberwood | | Livingston, TX | | — | | | 60 | | | 4,391 | | | 1,167 | | | | | 60 | | | 5,558 | | | 5,618 | | | (3,522) | | | 2009 | | 2006 | Polk Health Holdings LLC | | Timberwood | | Livingston, TX | | — | | | 60 | | 60 | | | 4,391 | | 4,391 | | | 1,167 | | 1,167 | | | | | 60 | | | | 60 | | | 5,558 | | 5,558 | | | 5,618 | | 5,618 | | | (3,722) | | (3,722) | | | 2009 | | 2009 | | 2006 |
| Snohomish Health Holdings LLC | Snohomish Health Holdings LLC | | Emerald Hills | | Lynnwood, WA | | — | | | 741 | | | 1,663 | | | 1,998 | | | | | 741 | | | 3,661 | | | 4,402 | | | (2,854) | | | 2009 | | 2006 | Snohomish Health Holdings LLC | | Emerald Hills | | Lynnwood, WA | | — | | | 741 | | 741 | | | 1,663 | | 1,663 | | | 1,998 | | 1,998 | | | | | 741 | | | | 741 | | | 3,661 | | 3,661 | | | 4,402 | | 4,402 | | | (2,986) | | (2,986) | | | 2009 | | 2009 | | 2006 |
| Cherry Health Holdings LLC | Cherry Health Holdings LLC | | Pacific Care | | Hoquiam, WA | | — | | | 171 | | | 1,828 | | | 2,038 | | | | | 171 | | | 3,866 | | | 4,037 | | | (2,951) | | | 2010 | | 2006 | Cherry Health Holdings LLC | | Pacific Care | | Hoquiam, WA | | — | | | 171 | | 171 | | | 1,828 | | 1,828 | | | 2,038 | | 2,038 | | | | | 171 | | | | 171 | | | 3,866 | | 3,866 | | | 4,037 | | 4,037 | | | (3,163) | | (3,163) | | | 2010 | | 2010 | | 2006 |
| Golfview Holdings LLC | Golfview Holdings LLC | | Cambridge SNF | | Richmond, TX | | — | | | 1,105 | | | 3,110 | | | 1,067 | | | | | 1,105 | | | 4,177 | | | 5,282 | | | (2,554) | | | 2007 | | 2006 | Golfview Holdings LLC | | Cambridge SNF | | Richmond, TX | | — | | | 1,105 | | 1,105 | | | 3,110 | | 3,110 | | | 1,067 | | 1,067 | | | | | 1,105 | | | | 1,105 | | | 4,177 | | 4,177 | | | 5,282 | | 5,282 | | | (2,704) | | (2,704) | | | 2007 | | 2007 | | 2006 |
| Tenth East Holdings LLC | Tenth East Holdings LLC | | Arlington Hills | | Salt Lake City, UT | | — | | | 332 | | | 2,426 | | | 2,507 | | | | | 332 | | | 4,933 | | | 5,265 | | | (3,618) | | | 2013 | | 2006 | Tenth East Holdings LLC | | Arlington Hills | | Salt Lake City, UT | | — | | | 332 | | 332 | | | 2,426 | | 2,426 | | | 2,507 | | 2,507 | | | | | 332 | | | | 332 | | | 4,933 | | 4,933 | | | 5,265 | | 5,265 | | | (3,872) | | (3,872) | | | 2013 | | 2013 | | 2006 |
| Trinity Mill Holdings LLC | Trinity Mill Holdings LLC | | Carrollton | | Carrollton, TX | | — | | | 664 | | | 2,294 | | | 902 | | | | | 664 | | | 3,196 | | | 3,860 | | | (2,551) | | | 2007 | | 2006 | Trinity Mill Holdings LLC | | Carrollton | | Carrollton, TX | | — | | | 664 | | 664 | | | 2,294 | | 2,294 | | | 902 | | 902 | | | | | 664 | | | | 664 | | | 3,196 | | 3,196 | | | 3,860 | | 3,860 | | | (2,670) | | (2,670) | | | 2007 | | 2007 | | 2006 |
| Cottonwood Health Holdings LLC | Cottonwood Health Holdings LLC | | Holladay | | Salt Lake City, UT | | — | | | 965 | | | 2,070 | | | 958 | | | | | 965 | | | 3,028 | | | 3,993 | | | (2,578) | | | 2008 | | 2007 | Cottonwood Health Holdings LLC | | Holladay | | Salt Lake City, UT | | — | | | 965 | | 965 | | | 2,070 | | 2,070 | | | 958 | | 958 | | | | | 965 | | | | 965 | | | 3,028 | | 3,028 | | | 3,993 | | 3,993 | | | (2,706) | | (2,706) | | | 2008 | | 2008 | | 2007 |
| Verde Villa Holdings LLC | Verde Villa Holdings LLC | | Lake Village | | Lewisville, TX | | — | | | 600 | | | 1,890 | | | 470 | | | | | 600 | | | 2,360 | | | 2,960 | | | (1,645) | | | 2011 | | 2007 | Verde Villa Holdings LLC | | Lake Village | | Lewisville, TX | | — | | | 600 | | 600 | | | 1,890 | | 1,890 | | | 470 | | 470 | | | | | 600 | | | | 600 | | | 2,360 | | 2,360 | | | 2,960 | | 2,960 | | | (1,745) | | (1,745) | | | 2011 | | 2011 | | 2007 |
| Mesquite Health Holdings LLC | Mesquite Health Holdings LLC | | Willow Bend | | Mesquite, TX | | — | | | 470 | | | 1,715 | | | 8,632 | | | | | 441 | | | 10,376 | | | 10,817 | | | (8,270) | | | 2012 | | 2007 | Mesquite Health Holdings LLC | | Willow Bend | | Mesquite, TX | | — | | | 470 | | 470 | | | 1,715 | | 1,715 | | | 8,632 | | 8,632 | | | | | 441 | | | | 441 | | | 10,376 | | 10,376 | | | 10,817 | | 10,817 | | | (8,813) | | (8,813) | | | 2012 | | 2012 | | 2007 |
| Arrow Tree Health Holdings LLC | Arrow Tree Health Holdings LLC | | Arbor Glen | | Glendora, CA | | — | | | 2,165 | | | 1,105 | | | 324 | | | | | 2,165 | | | 1,429 | | | 3,594 | | | (1,149) | | | 1965 | | 2007 | Arrow Tree Health Holdings LLC | | Arbor Glen | | Glendora, CA | | — | | | 2,165 | | 2,165 | | | 1,105 | | 1,105 | | | 324 | | 324 | | | | | 2,165 | | | | 2,165 | | | 1,429 | | 1,429 | | | 3,594 | | 3,594 | | | (1,214) | | (1,214) | | | 1965 | | 1965 | | 2007 |
| Fort Street Health Holdings LLC | Fort Street Health Holdings LLC | | Draper | | Draper, UT | | — | | | 443 | | | 2,394 | | | 759 | | | | | 443 | | | 3,153 | | | 3,596 | | | (1,839) | | | 2008 | | 2007 | Fort Street Health Holdings LLC | | Draper | | Draper, UT | | — | | | 443 | | 443 | | | 2,394 | | 2,394 | | | 759 | | 759 | | | | | 443 | | | | 443 | | | 3,153 | | 3,153 | | | 3,596 | | 3,596 | | | (1,945) | | (1,945) | | | 2008 | | 2008 | | 2007 |
| Trousdale Health Holdings LLC | Trousdale Health Holdings LLC | | Brookfield | | Downey, CA | | — | | | 1,415 | | | 1,841 | | | 1,861 | | | | | 1,415 | | | 3,702 | | | 5,117 | | | (2,393) | | | 2013 | | 2007 | Trousdale Health Holdings LLC | | Brookfield | | Downey, CA | | — | | | 1,415 | | 1,415 | | | 1,841 | | 1,841 | | | 1,861 | | 1,861 | | | | | 1,415 | | | | 1,415 | | | 3,702 | | 3,702 | | | 5,117 | | 5,117 | | | (2,554) | | (2,554) | | | 2013 | | 2013 | | 2007 |
| Ensign Bellflower LLC | Ensign Bellflower LLC | | Rose Villa | | Bellflower, CA | | — | | | 937 | | | 1,168 | | | 357 | | | | | 937 | | | 1,525 | | | 2,462 | | | (1,039) | | | 2009 | | 2007 | Ensign Bellflower LLC | | Rose Villa | | Bellflower, CA | | — | | | 937 | | 937 | | | 1,168 | | 1,168 | | | 357 | | 357 | | | | | 937 | | | | 937 | | | 1,525 | | 1,525 | | | 2,462 | | 2,462 | | | (1,096) | | (1,096) | | | 2009 | | 2009 | | 2007 |
| RB Heights Health Holdings LLC | RB Heights Health Holdings LLC | | Osborn | | Scottsdale, AZ | | — | | | 2,007 | | | 2,793 | | | 1,762 | | | | | 2,007 | | | 4,555 | | | 6,562 | | | (2,885) | | | 2009 | | 2008 | RB Heights Health Holdings LLC | | Osborn | | Scottsdale, AZ | | — | | | 2,007 | | 2,007 | | | 2,793 | | 2,793 | | | 1,762 | | 1,762 | | | | | 2,007 | | | | 2,007 | | | 4,555 | | 4,555 | | | 6,562 | | 6,562 | | | (3,036) | | (3,036) | | | 2009 | | 2009 | | 2008 |
| San Corrine Health Holdings LLC | San Corrine Health Holdings LLC | | Salado Creek | | San Antonio, TX | | — | | | 310 | | | 2,090 | | | 719 | | | | | 310 | | | 2,809 | | | 3,119 | | | (1,587) | | | 2005 | | 2008 | San Corrine Health Holdings LLC | | Salado Creek | | San Antonio, TX | | — | | | 310 | | 310 | | | 2,090 | | 2,090 | | | 719 | | 719 | | | | | 310 | | | | 310 | | | 2,809 | | 2,809 | | | 3,119 | | 3,119 | | | (1,648) | | (1,648) | | | 2005 | | 2005 | | 2008 |
| Temple Health Holdings LLC | Temple Health Holdings LLC | | Wellington | | Temple, TX | | — | | | 529 | | | 2,207 | | | 1,163 | | | | | 529 | | | 3,370 | | | 3,899 | | | (2,058) | | | 2008 | | 2008 | Temple Health Holdings LLC | | Wellington | | Temple, TX | | — | | | 529 | | 529 | | | 2,207 | | 2,207 | | | 1,163 | | 1,163 | | | | | 529 | | | | 529 | | | 3,370 | | 3,370 | | | 3,899 | | 3,899 | | | (2,181) | | (2,181) | | | 2008 | | 2008 |
| Anson Health Holdings LLC | Anson Health Holdings LLC | | Northern Oaks | | Abilene, TX | | — | | | 369 | | | 3,220 | | | 1,725 | | | | | 369 | | | 4,945 | | | 5,314 | | | (2,925) | | | 2012 | | 2008 | Anson Health Holdings LLC | | Northern Oaks | | Abilene, TX | | — | | | 369 | | 369 | | | 3,220 | | 3,220 | | | 1,725 | | 1,725 | | | | | 369 | | | | 369 | | | 4,945 | | 4,945 | | | 5,314 | | 5,314 | | | (3,108) | | (3,108) | | | 2012 | | 2012 | | 2008 |
| Willits Health Holdings LLC | Willits Health Holdings LLC | | Northbrook | | Willits, CA | | — | | | 490 | | | 1,231 | | | 500 | | | | | 490 | | | 1,731 | | | 2,221 | | | (1,018) | | | 2011 | | 2008 | Willits Health Holdings LLC | | Northbrook | | Willits, CA | | — | | | 490 | | 490 | | | 1,231 | | 1,231 | | | 500 | | 500 | | | | | 490 | | | | 490 | | | 1,731 | | 1,731 | | | 2,221 | | 2,221 | | | (1,078) | | (1,078) | | | 2011 | | 2011 | | 2008 |
| Lufkin Health Holdings LLC | Lufkin Health Holdings LLC | | Southland | | Lufkin, TX | | — | | | 467 | | | 4,644 | | | 782 | | | | | 467 | | | 5,426 | | | 5,893 | | | (1,926) | | | 1988 | | 2009 | Lufkin Health Holdings LLC | | Southland | | Lufkin, TX | | — | | | 467 | | 467 | | | 4,644 | | 4,644 | | | 782 | | 782 | | | | | 467 | | | | 467 | | | 5,426 | | 5,426 | | | 5,893 | | 5,893 | | | (2,063) | | (2,063) | | | 1988 | | 1988 | | 2009 |
| Lowell Health Holdings LLC | Lowell Health Holdings LLC | | Littleton | | Littleton, CO | | — | | | 217 | | | 856 | | | 1,735 | | | | | 217 | | | 2,591 | | | 2,808 | | | (1,694) | | | 2012 | | 2009 | Lowell Health Holdings LLC | | Littleton | | Littleton, CO | | — | | | 217 | | 217 | | | 856 | | 856 | | | 1,735 | | 1,735 | | | | | 217 | | | | 217 | | | 2,591 | | 2,591 | | | 2,808 | | 2,808 | | | (1,815) | | (1,815) | | | 2012 | | 2012 | | 2009 |
| Jefferson Ralston Holdings LLC | Jefferson Ralston Holdings LLC | | Arvada | | Arvada, CO | | — | | | 280 | | | 1,230 | | | 834 | | | | | 280 | | | 2,064 | | | 2,344 | | | (1,082) | | | 2012 | | 2009 | Jefferson Ralston Holdings LLC | | Arvada | | Arvada, CO | | — | | | 280 | | 280 | | | 1,230 | | 1,230 | | | 834 | | 834 | | | | | 280 | | | | 280 | | | 2,064 | | 2,064 | | | 2,344 | | 2,344 | | | (1,159) | | (1,159) | | | 2012 | | 2012 | | 2009 |
| Lafayette Health Holdings LLC | | Lafayette Health Holdings LLC | | Julia Temple | | Englewood, CO | | — | | | 1,607 | | | 4,222 | | | 6,195 | | | | | 1,607 | | | 10,417 | | | 12,024 | | | (6,529) | | | 2012 | | 2009 |
SCHEDULE III
REAL ESTATE ASSETS AND ACCUMULATED DEPRECIATION
DECEMBER 31, 20222023
(dollars in thousands)
| | Lafayette Health Holdings LLC | | Julia Temple | | Englewood, CO | | — | | | 1,607 | | | 4,222 | | | 6,195 | | | | | 1,607 | | | 10,417 | | | 12,024 | | | (6,030) | | | 2012 | | 2009 |
| Hillendahl Health Holdings LLC | |
| Hillendahl Health Holdings LLC | |
| Hillendahl Health Holdings LLC | Hillendahl Health Holdings LLC | | Golden Acres | | Dallas, TX | | — | | | 2,133 | | | 11,977 | | | 1,421 | | | | | 2,133 | | | 13,398 | | | 15,531 | | | (6,543) | | | 1984 | | 2009 | | Golden Acres | | Dallas, TX | | — | | | 2,133 | | 2,133 | | | 11,977 | | 11,977 | | | 1,421 | | 1,421 | | | | | 2,133 | | | | 2,133 | | | 13,398 | | 13,398 | | | 15,531 | | 15,531 | | | (7,046) | | (7,046) | | | 1984 | | 1984 | | 2009 |
| Price Health Holdings LLC | Price Health Holdings LLC | | Pinnacle | | Price, UT | | — | | | 193 | | | 2,209 | | | 849 | | | | | 193 | | | 3,058 | | | 3,251 | | | (1,316) | | | 2012 | | 2009 | Price Health Holdings LLC | | Pinnacle | | Price, UT | | — | | | 193 | | 193 | | | 2,209 | | 2,209 | | | 849 | | 849 | | | | | 193 | | | | 193 | | | 3,058 | | 3,058 | | | 3,251 | | 3,251 | | | (1,418) | | (1,418) | | | 2012 | | 2012 | | 2009 |
| Silver Lake Health Holdings LLC | Silver Lake Health Holdings LLC | | Provo | | Provo, UT | | — | | | 2,051 | | | 8,362 | | | 2,011 | | | | | 2,051 | | | 10,373 | | | 12,424 | | | (3,766) | | | 2011 | | 2009 | Silver Lake Health Holdings LLC | | Provo | | Provo, UT | | — | | | 2,051 | | 2,051 | | | 8,362 | | 8,362 | | | 2,011 | | 2,011 | | | | | 2,051 | | | | 2,051 | | | 10,373 | | 10,373 | | | 12,424 | | 12,424 | | | (4,037) | | (4,037) | | | 2011 | | 2011 | | 2009 |
| Jordan Health Properties LLC | Jordan Health Properties LLC | | Copper Ridge | | West Jordan, UT | | — | | | 2,671 | | | 4,244 | | | 1,507 | | | | | 2,671 | | | 5,751 | | | 8,422 | | | (2,186) | | | 2013 | | 2009 | Jordan Health Properties LLC | | Copper Ridge | | West Jordan, UT | | — | | | 2,671 | | 2,671 | | | 4,244 | | 4,244 | | | 1,507 | | 1,507 | | | | | 2,671 | | | | 2,671 | | | 5,751 | | 5,751 | | | 8,422 | | 8,422 | | | (2,353) | | (2,353) | | | 2013 | | 2013 | | 2009 |
| Regal Road Health Holdings LLC | Regal Road Health Holdings LLC | | Sunview | | Youngstown, AZ | | — | | | 767 | | | 4,648 | | | 155 | | | | | 193 | | | 5,377 | | | 5,570 | | | (2,423) | | | 2012 | | 2009 | Regal Road Health Holdings LLC | | Sunview | | Youngstown, AZ | | — | | | 767 | | 767 | | | 4,648 | | 4,648 | | | 155 | | 155 | | | | | 193 | | | | 193 | | | 5,377 | | 5,377 | | | 5,570 | | 5,570 | | | (2,587) | | (2,587) | | | 2012 | | 2012 | | 2009 |
| Paredes Health Holdings LLC | Paredes Health Holdings LLC | | Alta Vista | | Brownsville, TX | | — | | | 373 | | | 1,354 | | | 190 | | | | | 373 | | | 1,544 | | | 1,917 | | | (548) | | | 1969 | | 2009 | Paredes Health Holdings LLC | | Alta Vista | | Brownsville, TX | | — | | | 373 | | 373 | | | 1,354 | | 1,354 | | | 190 | | 190 | | | | | 373 | | | | 373 | | | 1,544 | | 1,544 | | | 1,917 | | 1,917 | | | (589) | | (589) | | | 1969 | | 1969 | | 2009 |
| Expressway Health Holdings LLC | Expressway Health Holdings LLC | | Veranda | | Harlingen, TX | | — | | | 90 | | | 675 | | | 430 | | | | | 90 | | | 1,105 | | | 1,195 | | | (548) | | | 2011 | | 2009 | Expressway Health Holdings LLC | | Veranda | | Harlingen, TX | | — | | | 90 | | 90 | | | 675 | | 675 | | | 430 | | 430 | | | | | 90 | | | | 90 | | | 1,105 | | 1,105 | | | 1,195 | | 1,195 | | | (594) | | (594) | | | 2011 | | 2011 | | 2009 |
| Rio Grande Health Holdings LLC | Rio Grande Health Holdings LLC | | Grand Terrace | | McAllen, TX | | — | | | 642 | | | 1,085 | | | 870 | | | | | 642 | | | 1,955 | | | 2,597 | | | (1,139) | | | 2012 | | 2009 | Rio Grande Health Holdings LLC | | Grand Terrace | | McAllen, TX | | — | | | 642 | | 642 | | | 1,085 | | 1,085 | | | 870 | | 870 | | | | | 642 | | | | 642 | | | 1,955 | | 1,955 | | | 2,597 | | 2,597 | | | (1,214) | | (1,214) | | | 2012 | | 2012 | | 2009 |
| Fifth East Holdings LLC | Fifth East Holdings LLC | | Paramount | | Salt Lake City, UT | | — | | | 345 | | | 2,464 | | | 1,065 | | | | | 345 | | | 3,529 | | | 3,874 | | | (1,600) | | | 2011 | | 2009 | Fifth East Holdings LLC | | Paramount | | Salt Lake City, UT | | — | | | 345 | | 345 | | | 2,464 | | 2,464 | | | 1,065 | | 1,065 | | | | | 345 | | | | 345 | | | 3,529 | | 3,529 | | | 3,874 | | 3,874 | | | (1,720) | | (1,720) | | | 2011 | | 2011 | | 2009 |
| Emmett Healthcare Holdings LLC | Emmett Healthcare Holdings LLC | | River's Edge | | Emmet, ID | | — | | | 591 | | | 2,383 | | | 69 | | | | | 591 | | | 2,452 | | | 3,043 | | | (948) | | | 1972 | | 2010 | Emmett Healthcare Holdings LLC | | River's Edge | | Emmet, ID | | — | | | 591 | | 591 | | | 2,383 | | 2,383 | | | 69 | | 69 | | | | | 591 | | | | 591 | | | 2,452 | | 2,452 | | | 3,043 | | 3,043 | | | (1,018) | | (1,018) | | | 1972 | | 1972 | | 2010 |
| Burley Healthcare Holdings LLC | Burley Healthcare Holdings LLC | | Parke View | | Burley, ID | | — | | | 250 | | | 4,004 | | | 424 | | | | | 250 | | | 4,428 | | | 4,678 | | | (1,855) | | | 2011 | | 2010 | Burley Healthcare Holdings LLC | | Parke View | | Burley, ID | | — | | | 250 | | 250 | | | 4,004 | | 4,004 | | | 424 | | 424 | | | | | 250 | | | | 250 | | | 4,428 | | 4,428 | | | 4,678 | | 4,678 | | | (1,986) | | (1,986) | | | 2011 | | 2011 | | 2010 |
| Josey Ranch Healthcare Holdings LLC | Josey Ranch Healthcare Holdings LLC | | Heritage Gardens | | Carrollton, TX | | — | | | 1,382 | | | 2,293 | | | 478 | | | | | 1,382 | | | 2,771 | | | 4,153 | | | (1,117) | | | 1996 | | 2010 | Josey Ranch Healthcare Holdings LLC | | Heritage Gardens | | Carrollton, TX | | — | | | 1,382 | | 1,382 | | | 2,293 | | 2,293 | | | 478 | | 478 | | | | | 1,382 | | | | 1,382 | | | 2,771 | | 2,771 | | | 4,153 | | 4,153 | | | (1,206) | | (1,206) | | | 1996 | | 1996 | | 2010 |
| Everglades Health Holdings LLC | Everglades Health Holdings LLC | | Victoria Ventura | | Ventura, CA | | — | | | 1,847 | | | 5,377 | | | 682 | | | | | 1,847 | | | 6,059 | | | 7,906 | | | (1,916) | | | 1990 | | 2011 | Everglades Health Holdings LLC | | Victoria Ventura | | Ventura, CA | | — | | | 1,847 | | 1,847 | | | 5,377 | | 5,377 | | | 682 | | 682 | | | | | 1,847 | | | | 1,847 | | | 6,059 | | 6,059 | | | 7,906 | | 7,906 | | | (2,033) | | (2,033) | | | 1990 | | 1990 | | 2011 |
| Irving Health Holdings LLC | Irving Health Holdings LLC | | Beatrice Manor | | Beatrice, NE | | — | | | 60 | | | 2,931 | | | 245 | | | | | 60 | | | 3,176 | | | 3,236 | | | (1,277) | | | 2011 | | 2011 | Irving Health Holdings LLC | | Beatrice Manor | | Beatrice, NE | | — | | | 60 | | 60 | | | 2,931 | | 2,931 | | | 245 | | 245 | | | | | 60 | | | | 60 | | | 3,176 | | 3,176 | | | 3,236 | | 3,236 | | | (1,374) | | (1,374) | | | 2011 | | 2011 |
| Falls City Health Holdings LLC | Falls City Health Holdings LLC | | Careage Estates of Falls City | | Falls City, NE | | — | | | 170 | | | 2,141 | | | 82 | | | | | 170 | | | 2,223 | | | 2,393 | | | (822) | | | 1972 | | 2011 | Falls City Health Holdings LLC | | Careage Estates of Falls City | | Falls City, NE | | — | | | 170 | | 170 | | | 2,141 | | 2,141 | | | 82 | | 82 | | | | | 170 | | | | 170 | | | 2,223 | | 2,223 | | | 2,393 | | 2,393 | | | (895) | | (895) | | | 1972 | | 1972 | | 2011 |
| Gillette Park Health Holdings LLC | Gillette Park Health Holdings LLC | | Careage of Cherokee | | Cherokee, IA | | — | | | 163 | | | 1,491 | | | 12 | | | | | 163 | | | 1,503 | | | 1,666 | | | (697) | | | 1967 | | 2011 | Gillette Park Health Holdings LLC | | Careage of Cherokee | | Cherokee, IA | | — | | | 163 | | 163 | | | 1,491 | | 1,491 | | | 12 | | 12 | | | | | 163 | | | | 163 | | | 1,503 | | 1,503 | | | 1,666 | | 1,666 | | | (757) | | (757) | | | 1967 | | 1967 | | 2011 |
| Gazebo Park Health Holdings LLC | Gazebo Park Health Holdings LLC | | Careage of Clarion | | Clarion, IA | | — | | | 80 | | | 2,541 | | | 97 | | | | | 80 | | | 2,638 | | | 2,718 | | | (1,264) | | | 1978 | | 2011 | Gazebo Park Health Holdings LLC | | Careage of Clarion | | Clarion, IA | | — | | | 80 | | 80 | | | 2,541 | | 2,541 | | | 97 | | 97 | | | | | 80 | | | | 80 | | | 2,638 | | 2,638 | | | 2,718 | | 2,718 | | | (1,366) | | (1,366) | | | 1978 | | 1978 | | 2011 |
| Oleson Park Health Holdings LLC | Oleson Park Health Holdings LLC | | Careage of Ft. Dodge | | Ft. Dodge, IA | | — | | | 90 | | | 2,341 | | | 759 | | | | | 90 | | | 3,100 | | | 3,190 | | | (1,862) | | | 2012 | | 2011 | Oleson Park Health Holdings LLC | | Careage of Ft. Dodge | | Ft. Dodge, IA | | — | | | 90 | | 90 | | | 2,341 | | 2,341 | | | 759 | | 759 | | | | | 90 | | | | 90 | | | 3,100 | | 3,100 | | | 3,190 | | 3,190 | | | (2,025) | | (2,025) | | | 2012 | | 2012 | | 2011 |
| Arapahoe Health Holdings LLC | Arapahoe Health Holdings LLC | | Oceanview | | Texas City, TX | | — | | | 158 | | | 4,810 | | | 759 | | | | | 128 | | | 5,599 | | | 5,727 | | | (2,459) | | | 2012 | | 2011 | Arapahoe Health Holdings LLC | | Oceanview | | Texas City, TX | | — | | | 158 | | 158 | | | 4,810 | | 4,810 | | | 759 | | 759 | | | | | 128 | | | | 128 | | | 5,599 | | 5,599 | | | 5,727 | | 5,727 | | | (2,659) | | (2,659) | | | 2012 | | 2012 | | 2011 |
| Dixie Health Holdings LLC | Dixie Health Holdings LLC | | Hurricane | | Hurricane, UT | | — | | | 487 | | | 1,978 | | | 98 | | | | | 487 | | | 2,076 | | | 2,563 | | | (639) | | | 1978 | | 2011 | Dixie Health Holdings LLC | | Hurricane | | Hurricane, UT | | — | | | 487 | | 487 | | | 1,978 | | 1,978 | | | 98 | | 98 | | | | | 487 | | | | 487 | | | 2,076 | | 2,076 | | | 2,563 | | 2,563 | | | (696) | | (696) | | | 1978 | | 1978 | | 2011 |
| Memorial Health Holdings LLC | Memorial Health Holdings LLC | | Pocatello | | Pocatello, ID | | — | | | 537 | | | 2,138 | | | 698 | | | | | 537 | | | 2,836 | | | 3,373 | | | (1,292) | | | 2007 | | 2011 | Memorial Health Holdings LLC | | Pocatello | | Pocatello, ID | | — | | | 537 | | 537 | | | 2,138 | | 2,138 | | | 698 | | 698 | | | | | 537 | | | | 537 | | | 2,836 | | 2,836 | | | 3,373 | | 3,373 | | | (1,398) | | (1,398) | | | 2007 | | 2007 | | 2011 |
| Bogardus Health Holdings LLC | Bogardus Health Holdings LLC | | Whittier East | | Whittier, CA | | — | | | 1,425 | | | 5,307 | | | 1,079 | | | | | 1,425 | | | 6,386 | | | 7,811 | | | (2,674) | | | 2011 | | 2011 | Bogardus Health Holdings LLC | | Whittier East | | Whittier, CA | | — | | | 1,425 | | 1,425 | | | 5,307 | | 5,307 | | | 1,079 | | 1,079 | | | | | 1,425 | | | | 1,425 | | | 6,386 | | 6,386 | | | 7,811 | | 7,811 | | | (2,879) | | (2,879) | | | 2011 | | 2011 |
| South Dora Health Holdings LLC | South Dora Health Holdings LLC | | Ukiah | | Ukiah, CA | | — | | | 297 | | | 2,087 | | | 1,621 | | | | | 297 | | | 3,708 | | | 4,005 | | | (2,261) | | | 2013 | | 2011 | South Dora Health Holdings LLC | | Ukiah | | Ukiah, CA | | — | | | 297 | | 297 | | | 2,087 | | 2,087 | | | 1,621 | | 1,621 | | | | | 297 | | | | 297 | | | 3,708 | | 3,708 | | | 4,005 | | 4,005 | | | (2,334) | | (2,334) | | | 2013 | | 2013 | | 2011 |
| Silverada Health Holdings LLC | Silverada Health Holdings LLC | | Rosewood | | Reno, NV | | — | | | 1,012 | | | 3,282 | | | 103 | | | | | 1,012 | | | 3,385 | | | 4,397 | | | (981) | | | 1970 | | 2011 | Silverada Health Holdings LLC | | Rosewood | | Reno, NV | | — | | | 1,012 | | 1,012 | | | 3,282 | | 3,282 | | | 103 | | 103 | | | | | 1,012 | | | | 1,012 | | | 3,385 | | 3,385 | | | 4,397 | | 4,397 | | | (1,070) | | (1,070) | | | 1970 | | 1970 | | 2011 |
| Orem Health Holdings LLC | Orem Health Holdings LLC | | Orem | | Orem, UT | | — | | | 1,689 | | | 3,896 | | | 3,235 | | | | | 1,689 | | | 7,131 | | | 8,820 | | | (3,509) | | | 2011 | | 2011 | Orem Health Holdings LLC | | Orem | | Orem, UT | | — | | | 1,689 | | 1,689 | | | 3,896 | | 3,896 | | | 3,235 | | 3,235 | | | | | 1,689 | | | | 1,689 | | | 7,131 | | 7,131 | | | 8,820 | | 8,820 | | | (3,791) | | (3,791) | | | 2011 | | 2011 |
| Wisteria Health Holdings | Wisteria Health Holdings | | Wisteria | | Abilene, TX | | 746 | | | 9,903 | | | 290 | | | | | 746 | | | 10,193 | | | 10,939 | | | (2,641) | | | Wisteria Health Holdings | | Wisteria | | Abilene, TX | | — | | | 746 | | 746 | | | 9,903 | | 9,903 | | | 290 | | 290 | | | | | 746 | | | | 746 | | | 10,193 | | 10,193 | | | 10,939 | | 10,939 | | | (2,826) | | (2,826) | | | 2008 | | 2008 | | 2011 |
| Renee Avenue Health Holdings LLC | Renee Avenue Health Holdings LLC | | Monte Vista | | Pocatello, ID | | — | | | 180 | | | 2,481 | | | 966 | | | | | 180 | | | 3,447 | | | 3,627 | | | (1,516) | | | 2013 | | 2012 | Renee Avenue Health Holdings LLC | | Monte Vista | | Pocatello, ID | | — | | | 180 | | 180 | | | 2,481 | | 2,481 | | | 966 | | 966 | | | | | 180 | | | | 180 | | | 3,447 | | 3,447 | | | 3,627 | | 3,627 | | | (1,664) | | (1,664) | | | 2013 | | 2013 | | 2012 |
| Stillhouse Health Holdings LLC | Stillhouse Health Holdings LLC | | Stillhouse | | Paris, TX | | — | | | 129 | | | 7,139 | | | 6 | | | | | 129 | | | 7,145 | | | 7,274 | | | (1,331) | | | 2009 | | 2012 | Stillhouse Health Holdings LLC | | Stillhouse | | Paris, TX | | — | | | 129 | | 129 | | | 7,139 | | 7,139 | | | 6 | | 6 | | | | | 129 | | | | 129 | | | 7,145 | | 7,145 | | | 7,274 | | 7,274 | | | (1,456) | | (1,456) | | | 2009 | | 2009 | | 2012 |
| Fig Street Health Holdings LLC | Fig Street Health Holdings LLC | | Palomar Vista | | Escondido, CA | | — | | | 329 | | | 2,653 | | | 1,094 | | | | | 329 | | | 3,747 | | | 4,076 | | | (1,820) | | | 2007 | | 2012 | Fig Street Health Holdings LLC | | Palomar Vista | | Escondido, CA | | — | | | 329 | | 329 | | | 2,653 | | 2,653 | | | 1,094 | | 1,094 | | | | | 329 | | | | 329 | | | 3,747 | | 3,747 | | | 4,076 | | 4,076 | | | (1,914) | | (1,914) | | | 2007 | | 2007 | | 2012 |
| Lowell Lake Health Holdings LLC | Lowell Lake Health Holdings LLC | | Owyhee | | Owyhee, ID | | — | | | 49 | | | 1,554 | | | 29 | | | | | 49 | | | 1,583 | | | 1,632 | | | (387) | | | 1990 | | 2012 | Lowell Lake Health Holdings LLC | | Owyhee | | Owyhee, ID | | — | | | 49 | | 49 | | | 1,554 | | 1,554 | | | 29 | | 29 | | | | | 49 | | | | 49 | | | 1,583 | | 1,583 | | | 1,632 | | 1,632 | | | (423) | | (423) | | | 1990 | | 1990 | | 2012 |
| Queensway Health Holdings LLC | Queensway Health Holdings LLC | | Atlantic Memorial | | Long Beach, CA | | — | | | 999 | | | 4,237 | | | 2,331 | | | | | 999 | | | 6,568 | | | 7,567 | | | (3,106) | | | 2008 | | 2012 | Queensway Health Holdings LLC | | Atlantic Memorial | | Long Beach, CA | | — | | | 999 | | 999 | | | 4,237 | | 4,237 | | | 2,331 | | 2,331 | | | | | 999 | | | | 999 | | | 6,568 | | 6,568 | | | 7,567 | | 7,567 | | | (3,211) | | (3,211) | | | 2008 | | 2008 | | 2012 |
| Long Beach Health Associates LLC | Long Beach Health Associates LLC | | Shoreline | | Long Beach, CA | | — | | | 1,285 | | | 2,343 | | | 2,172 | | | | | 1,285 | | | 4,515 | | | 5,800 | | | (2,258) | | | 2013 | | 2012 | Long Beach Health Associates LLC | | Shoreline | | Long Beach, CA | | — | | | 1,285 | | 1,285 | | | 2,343 | | 2,343 | | | 2,172 | | 2,172 | | | | | 1,285 | | | | 1,285 | | | 4,515 | | 4,515 | | | 5,800 | | 5,800 | | | (2,415) | | (2,415) | | | 2013 | | 2013 | | 2012 |
| Kings Court Health Holdings LLC | Kings Court Health Holdings LLC | | Richland Hills | | Ft. Worth, TX | | — | | | 193 | | | 2,311 | | | 318 | | | | | 193 | | | 2,629 | | | 2,822 | | | (789) | | | 1965 | | 2012 | Kings Court Health Holdings LLC | | Richland Hills | | Ft. Worth, TX | | — | | | 193 | | 193 | | | 2,311 | | 2,311 | | | 318 | | 318 | | | | | 193 | | | | 193 | | | 2,629 | | 2,629 | | | 2,822 | | 2,822 | | | (866) | | (866) | | | 1965 | | 1965 | | 2012 |
| 51st Avenue Health Holdings LLC | 51st Avenue Health Holdings LLC | | Legacy | | Amarillo, TX | | — | | | 340 | | | 3,925 | | | 32 | | | | | 340 | | | 3,957 | | | 4,297 | | | (1,124) | | | 1970 | | 2013 | 51st Avenue Health Holdings LLC | | Legacy | | Amarillo, TX | | — | | | 340 | | 340 | | | 3,925 | | 3,925 | | | 32 | | 32 | | | | | 340 | | | | 340 | | | 3,957 | | 3,957 | | | 4,297 | | 4,297 | | | (1,238) | | (1,238) | | | 1970 | | 1970 | | 2013 |
| Ives Health Holdings LLC | Ives Health Holdings LLC | | San Marcos | | San Marcos, TX | | — | | | 371 | | | 2,951 | | | 274 | | | | | 371 | | | 3,225 | | | 3,596 | | | (882) | | | 1972 | | 2013 | Ives Health Holdings LLC | | San Marcos | | San Marcos, TX | | — | | | 371 | | 371 | | | 2,951 | | 2,951 | | | 274 | | 274 | | | | | 371 | | | | 371 | | | 3,225 | | 3,225 | | | 3,596 | | 3,596 | | | (974) | | (974) | | | 1972 | | 1972 | | 2013 |
| Guadalupe Health Holdings LLC | Guadalupe Health Holdings LLC | | The Courtyard (Victoria East) | | Victoria, TX | | — | | | 80 | | | 2,391 | | | 15 | | | | | 80 | | | 2,406 | | | 2,486 | | | (532) | | | 2013 | | 2013 | Guadalupe Health Holdings LLC | | The Courtyard (Victoria East) | | Victoria, TX | | — | | | 80 | | 80 | | | 2,391 | | 2,391 | | | 15 | | 15 | | | | | 80 | | | | 80 | | | 2,406 | | 2,406 | | | 2,486 | | 2,486 | | | (587) | | (587) | | | 2013 | | 2013 |
| 49th Street Health Holdings LLC | | 49th Street Health Holdings LLC | | Omaha | | Omaha, NE | | — | | | 129 | | | 2,418 | | | 24 | | | | | 129 | | | 2,442 | | | 2,571 | | | (875) | | | 1960 | | 2013 |
| Willows Health Holdings LLC | | Willows Health Holdings LLC | | Cascade Vista | | Redmond, WA | | — | | | 1,388 | | | 2,982 | | | 202 | | | | | 1,388 | | | 3,184 | | | 4,572 | | | (1,244) | | | 1970 | | 2013 |
| Tulalip Bay Health Holdings LLC | | Tulalip Bay Health Holdings LLC | | Mountain View | | Marysville, WA | | — | | | 1,722 | | | 2,642 | | | (980) | | | | | 742 | | | 2,642 | | | 3,384 | | | (925) | | | 1966 | | 2013 |
SCHEDULE III
REAL ESTATE ASSETS AND ACCUMULATED DEPRECIATION
DECEMBER 31, 20222023
(dollars in thousands)
| | 49th Street Health Holdings LLC | | Omaha | | Omaha, NE | | — | | | 129 | | | 2,418 | | | 24 | | | | | 129 | | | 2,442 | | | 2,571 | | | (793) | | | 1960 | | 2013 |
| Willows Health Holdings LLC | | Cascade Vista | | Redmond, WA | | — | | | 1,388 | | | 2,982 | | | 202 | | | | | 1,388 | | | 3,184 | | | 4,572 | | | (1,134) | | | 1970 | | 2013 |
| Tulalip Bay Health Holdings LLC | | Mountain View | | Marysville, WA | | — | | | 1,722 | | | 2,642 | | | (980) | | | | | 742 | | | 2,642 | | | 3,384 | | | (837) | | | 1966 | | 2013 |
| Sky Holdings AZ LLC | |
| Sky Holdings AZ LLC | |
| Sky Holdings AZ LLC | Sky Holdings AZ LLC | | Bella Vita Health and Rehabilitation Center | | Glendale, AZ | | — | | | 228 | | | 1,124 | | | 1,380 | | | | | 228 | | | 2,504 | | | 2,731 | | | (1,927) | | | 2004 | | 2002 | | Bella Vita Health and Rehabilitation Center | | Glendale, AZ | | — | | | 228 | | 228 | | | 1,124 | | 1,124 | | | 1,380 | | 1,380 | | | | | 228 | | | | 228 | | | 2,504 | | 2,504 | | | 2,732 | | 2,732 | | | (2,021) | | (2,021) | | | 2004 | | 2004 | | 2002 |
| Lemon River Holdings LLC | Lemon River Holdings LLC | | Plymouth Tower | | Riverside, CA | | — | | | 152 | | | 357 | | | 1,493 | | | | | 152 | | | 1,850 | | | 2,002 | | | (1,403) | | | 2012 | | 2009 | Lemon River Holdings LLC | | Plymouth Tower | | Riverside, CA | | — | | | 152 | | 152 | | | 357 | | 357 | | | 1,493 | | 1,493 | | | | | 152 | | | | 152 | | | 1,850 | | 1,850 | | | 2,002 | | 2,002 | | | (1,510) | | (1,510) | | | 2012 | | 2012 | | 2009 |
| CTR Partnership, L.P. | CTR Partnership, L.P. | | Bethany Rehabilitation Center | | Lakewood, CO | | — | | | 1,668 | | | 15,375 | | | 56 | | | | | 1,668 | | | 15,431 | | | 17,099 | | | (3,058) | | | 1989 | | 2015 | CTR Partnership, L.P. | | Bethany Rehabilitation Center | | Lakewood, CO | | — | | | 1,668 | | 1,668 | | | 15,375 | | 15,375 | | | 61 | | 61 | | | | | 1,668 | | | | 1,668 | | | 15,436 | | 15,436 | | | 17,104 | | 17,104 | | | (3,445) | | (3,445) | | | 1989 | | 1989 | | 2015 |
| CTR Partnership, L.P. | CTR Partnership, L.P. | | Mira Vista Care Center | | Mount Vernon, WA | | — | | | 1,601 | | | 7,425 | | | — | | | | | 1,601 | | | 7,425 | | | 9,026 | | | (1,439) | | | 1989 | | 2015 | CTR Partnership, L.P. | | Mira Vista Care Center | | Mount Vernon, WA | | — | | | 1,601 | | 1,601 | | | 7,425 | | 7,425 | | | — | | — | | | | | 1,601 | | | | 1,601 | | | 7,425 | | 7,425 | | | 9,026 | | 9,026 | | | (1,624) | | (1,624) | | | 1989 | | 1989 | | 2015 |
| CTR Partnership, L.P. | CTR Partnership, L.P. | | Shoreline Health and Rehabilitation Center | | Shoreline, WA | | — | | | 1,462 | | | 5,034 | | | — | | | | | 1,462 | | | 5,034 | | | 6,496 | | | (954) | | | 1987 | | 2015 | CTR Partnership, L.P. | | Shoreline Health and Rehabilitation Center | | Shoreline, WA | | — | | | 1,462 | | 1,462 | | | 5,034 | | 5,034 | | | — | | — | | | | | 1,462 | | | | 1,462 | | | 5,034 | | 5,034 | | | 6,496 | | 6,496 | | | (1,080) | | (1,080) | | | 1987 | | 1987 | | 2015 |
| | CTR Partnership, L.P. | |
| | CTR Partnership, L.P. | CTR Partnership, L.P. | | Shamrock Nursing and Rehabilitation Center | | Dublin, GA | | — | | | 251 | | | 7,855 | | | — | | | | | 251 | | | 7,855 | | | 8,106 | | | (1,473) | | | 2010 | | 2015 |
| | CTR Partnership, L.P. | CTR Partnership, L.P. | | Premier Estates of Cincinnati-Riverview | | Cincinnati, OH | | — | | | 833 | | | 18,086 | | | 792 | | | | | 833 | | | 18,878 | | | 19,711 | | | (3,408) | | | 1992 | | 2015 | | Premier Estates of Cincinnati-Riverview | | Cincinnati, OH | | — | | | 833 | | 833 | | | 18,086 | | 18,086 | | | 792 | | 792 | | | | | 833 | | | | 833 | | | 18,878 | | 18,878 | | | 19,711 | | 19,711 | | | (3,936) | | (3,936) | | | 1992 | | 1992 | | 2015 |
| | CTR Partnership, L.P. | CTR Partnership, L.P. | | West Cove Care & Rehabilitation Center | | Toledo, OH | | — | | | 93 | | | 10,365 | | | 88 | | | | | 93 | | | 10,453 | | | 10,546 | | | (1,879) | | | 2007 | | 2015 |
| | CTR Partnership, L.P. | |
| | | CTR Partnership, L.P. | | | West Cove Care & Rehabilitation Center | | Toledo, OH | | — | | | 93 | | | 10,365 | | | 811 | | | | | 6 | | | 1,185 | | | 1,191 | | | — | | | 2007 | | 2015 |
| | CTR Partnership, L.P. | |
| | CTR Partnership, L.P. | |
| | CTR Partnership, L.P. | | | Shaw Mountain at Cascadia | | Boise, ID | | — | | | 1,801 | | | 6,572 | | | 395 | | | | | 1,801 | | | 6,967 | | | 8,768 | | | (1,520) | | | 1989 | | 2016 |
| | CTR Partnership, L.P. | CTR Partnership, L.P. | | Casa de Paz | | Sioux City, IA | | — | | | 119 | | | 7,727 | | | — | | | | | 119 | | | 7,727 | | | 7,846 | | | (1,336) | | | 1974 | | 2016 |
| CTR Partnership, L.P. | CTR Partnership, L.P. | | Denison Care Center | | Denison, IA | | — | | | 96 | | | 2,784 | | | — | | | | | 96 | | | 2,784 | | | 2,880 | | | (481) | | | 2015 | | 2016 |
| CTR Partnership, L.P. | CTR Partnership, L.P. | | Garden View Care Center | | Shenandoah, IA | | — | | | 105 | | | 3,179 | | | — | | | | | 105 | | | 3,179 | | | 3,284 | | | (550) | | | 2013 | | 2016 | | Arbor Nursing Center | | Lodi, CA | | — | | | 768 | | 768 | | | 10,712 | | 10,712 | | | — | | — | | | | | 768 | | | | 768 | | | 10,712 | | 10,712 | | | 11,480 | | 11,480 | | | (1,986) | | (1,986) | | | 1982 | | 1982 | | 2016 |
| CTR Partnership, L.P. | CTR Partnership, L.P. | | Grandview Health Care Center | | Dayton, IA | | — | | | 39 | | | 1,167 | | | — | | | | | 39 | | | 1,167 | | | 1,206 | | | (202) | | | 2014 | | 2016 | CTR Partnership, L.P. | | Broadmoor Medical Lodge | | Rockwall, TX | | — | | | 1,232 | | 1,232 | | | 22,152 | | 22,152 | | | — | | — | | | | | 1,232 | | | | 1,232 | | | 22,152 | | 22,152 | | | 23,384 | | 23,384 | | | (3,924) | | (3,924) | | | 1984 | | 1984 | | 2016 |
| CTR Partnership, L.P. | CTR Partnership, L.P. | | Grundy Care Center | | Grundy Center, IA | | — | | | 65 | | | 1,935 | | | — | | | | | 65 | | | 1,935 | | | 2,000 | | | (335) | | | 2011 | | 2016 | CTR Partnership, L.P. | | Decatur Medical Lodge | | Decatur, TX | | — | | | 990 | | 990 | | | 24,909 | | 24,909 | | | — | | — | | | | | 990 | | | | 990 | | | 24,909 | | 24,909 | | | 25,899 | | 25,899 | | | (4,411) | | (4,411) | | | 2013 | | 2013 | | 2016 |
| CTR Partnership, L.P. | CTR Partnership, L.P. | | Iowa City Rehab and Health Care Center | | Iowa City, IA | | — | | | 522 | | | 5,690 | | | — | | | | | 522 | | | 5,690 | | | 6,212 | | | (984) | | | 2014 | | 2016 | CTR Partnership, L.P. | | Royse City Medical Lodge | | Royse City, TX | | — | | | 606 | | 606 | | | 14,660 | | 14,660 | | | — | | — | | | | | 606 | | | | 606 | | | 14,660 | | 14,660 | | | 15,266 | | 15,266 | | | (2,596) | | (2,596) | | | 2009 | | 2009 | | 2016 |
| CTR Partnership, L.P. | CTR Partnership, L.P. | | Lenox Care Center | | Lenox, IA | | — | | | 31 | | | 1,915 | | | — | | | | | 31 | | | 1,915 | | | 1,946 | | | (331) | | | 2012 | | 2016 | CTR Partnership, L.P. | | Saline Care Nursing & Rehabilitation Center | | Harrisburg, IL | | — | | | 1,022 | | 1,022 | | | 5,713 | | 5,713 | | | — | | — | | | | | 1,022 | | | | 1,022 | | | 5,713 | | 5,713 | | | 6,735 | | 6,735 | | | (976) | | (976) | | | 2009 | | 2009 | | 2017 |
| CTR Partnership, L.P. | CTR Partnership, L.P. | | Osage | | Osage, IA | | — | | | 126 | | | 2,255 | | | — | | | | | 126 | | | 2,255 | | | 2,381 | | | (390) | | | 2014 | | 2016 | CTR Partnership, L.P. | | Carrier Mills Nursing & Rehabilitation Center | | Carrier Mills, IL | | — | | | 775 | | 775 | | | 8,377 | | 8,377 | | | — | | — | | | | | 775 | | | | 775 | | | 8,377 | | 8,377 | | | 9,152 | | 9,152 | | | (1,431) | | (1,431) | | | 1968 | | 1968 | | 2017 |
| CTR Partnership, L.P. | CTR Partnership, L.P. | | Pleasant Acres Care Center | | Hull, IA | | — | | | 189 | | | 2,544 | | | — | | | | | 189 | | | 2,544 | | | 2,733 | | | (440) | | | 2014 | | 2016 | CTR Partnership, L.P. | | StoneBridge Nursing & Rehabilitation Center | | Benton, IL | | — | | | 439 | | 439 | | | 3,475 | | 3,475 | | | — | | — | | | | | 439 | | | | 439 | | | 3,475 | | 3,475 | | | 3,914 | | 3,914 | | | (594) | | (594) | | | 2014 | | 2014 | | 2017 |
| CTR Partnership, L.P. | CTR Partnership, L.P. | | Cedar Falls Health Care Center | | Cedar Falls, IA | | — | | | 324 | | | 4,366 | | | — | | | | | 324 | | | 4,366 | | | 4,690 | | | (737) | | | 2015 | | 2016 | CTR Partnership, L.P. | | DuQuoin Nursing & Rehabilitation Center | | DuQuoin, IL | | — | | | 511 | | 511 | | | 3,662 | | 3,662 | | | — | | — | | | | | 511 | | | | 511 | | | 3,662 | | 3,662 | | | 4,173 | | 4,173 | | | (626) | | (626) | | | 2014 | | 2014 | | 2017 |
| CTR Partnership, L.P. | CTR Partnership, L.P. | | Premier Estates of Highlands | | Norwood, OH | | — | | | 364 | | | 2,199 | | | 623 | | | | | 143 | | | 943 | | | 1,086 | | | (22) | | | 2012 | | 2016 | CTR Partnership, L.P. | | Pinckneyville Nursing & Rehabilitation Center | | Pinckneyville, IL | | — | | | 406 | | 406 | | | 3,411 | | 3,411 | | | — | | — | | | | | 406 | | | | 406 | | | 3,411 | | 3,411 | | | 3,817 | | 3,817 | | | (583) | | (583) | | | 2014 | | 2014 | | 2017 |
| CTR Partnership, L.P. | CTR Partnership, L.P. | | Shaw Mountain at Cascadia | | Boise, ID | | — | | | 1,801 | | | 6,572 | | | 395 | | | | | 1,801 | | | 6,967 | | | 8,768 | | | (1,316) | | | 1989 | | 2016 | CTR Partnership, L.P. | | Wellspring Health and Rehabilitation of Cascadia | | Nampa, ID | | — | | | 775 | | 775 | | | 5,044 | | 5,044 | | | 336 | | 336 | | | | | 775 | | | | 775 | | | 5,380 | | 5,380 | | | 6,155 | | 6,155 | | | (869) | | (869) | | | 2011 | | 2011 | | 2017 |
| CTR Partnership, L.P. | CTR Partnership, L.P. | | The Oaks | | Petaluma, CA | | — | | | 3,646 | | | 2,873 | | | 110 | | | | | 3,646 | | | 2,983 | | | 6,629 | | | (519) | | | 2015 | | 2016 | CTR Partnership, L.P. | | The Rio at Fox Hollow | | Brownsville, TX | | — | | | 1,178 | | 1,178 | | | 12,059 | | 12,059 | | | — | | — | | | | | 1,178 | | | | 1,178 | | | 12,059 | | 12,059 | | | 13,237 | | 13,237 | | | (1,985) | | (1,985) | | | 2016 | | 2016 | | 2017 |
| CTR Partnership, L.P. | CTR Partnership, L.P. | | Arbor Nursing Center | | Lodi, CA | | — | | | 768 | | | 10,712 | | | — | | | | | 768 | | | 10,712 | | | 11,480 | | | (1,718) | | | 1982 | | 2016 | CTR Partnership, L.P. | | The Rio at Cabezon | | Albuquerque, NM | | — | | | 2,055 | | 2,055 | | | 9,749 | | 9,749 | | | — | | — | | | | | 2,055 | | | | 2,055 | | | 9,749 | | 9,749 | | | 11,804 | | 11,804 | | | (1,605) | | (1,605) | | | 2016 | | 2016 | | 2017 |
| CTR Partnership, L.P. | CTR Partnership, L.P. | | Broadmoor Medical Lodge | | Rockwall, TX | | — | | | 1,232 | | | 22,152 | | | — | | | | | 1,232 | | | 22,152 | | | 23,384 | | | (3,370) | | | 1984 | | 2016 | CTR Partnership, L.P. | | Eldorado Rehab & Healthcare | | Eldorado, IL | | — | | | 940 | | 940 | | | 2,093 | | 2,093 | | | — | | — | | | | | 940 | | | | 940 | | | 2,093 | | 2,093 | | | 3,033 | | 3,033 | | | (340) | | (340) | | | 1993 | | 1993 | | 2017 |
| CTR Partnership, L.P. | CTR Partnership, L.P. | | Decatur Medical Lodge | | Decatur, TX | | — | | | 990 | | | 24,909 | | | — | | | | | 990 | | | 24,909 | | | 25,899 | | | (3,788) | | | 2013 | | 2016 | CTR Partnership, L.P. | | Secora Health and Rehabilitation of Cascadia | | Portland, OR | | — | | | 1,481 | | 1,481 | | | 2,216 | | 2,216 | | | 110 | | 110 | | | | | 1,481 | | | | 1,481 | | | 2,326 | | 2,326 | | | 3,807 | | 3,807 | | | (369) | | (369) | | | 2012 | | 2012 | | 2017 |
| CTR Partnership, L.P. | CTR Partnership, L.P. | | Royse City Medical Lodge | | Royse City, TX | | — | | | 606 | | | 14,660 | | | — | | | | | 606 | | | 14,660 | | | 15,266 | | | (2,230) | | | 2009 | | 2016 | CTR Partnership, L.P. | | Mountain Valley | | Kellogg, ID | | — | | | 916 | | 916 | | | 7,874 | | 7,874 | | | — | | — | | | | | 916 | | | | 916 | | | 7,874 | | 7,874 | | | 8,790 | | 8,790 | | | (1,247) | | (1,247) | | | 1971 | | 1971 | | 2017 |
| CTR Partnership, L.P. | CTR Partnership, L.P. | | Saline Care Nursing & Rehabilitation Center | | Harrisburg, IL | | — | | | 1,022 | | | 5,713 | | | — | | | | | 1,022 | | | 5,713 | | | 6,735 | | | (833) | | | 2009 | | 2017 | CTR Partnership, L.P. | | Caldwell Care | | Caldwell, ID | | — | | | 906 | | 906 | | | 7,020 | | 7,020 | | | 516 | | 516 | | | | | 906 | | | | 906 | | | 7,536 | | 7,536 | | | 8,442 | | 8,442 | | | (1,155) | | (1,155) | | | 1947 | | 1947 | | 2017 |
| CTR Partnership, L.P. | CTR Partnership, L.P. | | Carrier Mills Nursing & Rehabilitation Center | | Carrier Mills, IL | | — | | | 775 | | | 8,377 | | | — | | | | | 775 | | | 8,377 | | | 9,152 | | | (1,222) | | | 1968 | | 2017 | CTR Partnership, L.P. | | Canyon West | | Caldwell, ID | | — | | | 312 | | 312 | | | 10,410 | | 10,410 | | | 461 | | 461 | | | | | 312 | | | | 312 | | | 10,871 | | 10,871 | | | 11,183 | | 11,183 | | | (1,687) | | (1,687) | | | 1969 | | 1969 | | 2017 |
| CTR Partnership, L.P. | CTR Partnership, L.P. | | StoneBridge Nursing & Rehabilitation Center | | Benton, IL | | — | | | 439 | | | 3,475 | | | — | | | | | 439 | | | 3,475 | | | 3,914 | | | (507) | | | 2014 | | 2017 | CTR Partnership, L.P. | | Lewiston Health and Rehabilitation | | Lewiston, ID | | — | | | 625 | | 625 | | | 12,087 | | 12,087 | | | 215 | | 215 | | | | | 625 | | | | 625 | | | 12,302 | | 12,302 | | | 12,927 | | 12,927 | | | (1,907) | | (1,907) | | | 1964 | | 1964 | | 2017 |
| CTR Partnership, L.P. | CTR Partnership, L.P. | | DuQuoin Nursing & Rehabilitation Center | | DuQuoin, IL | | — | | | 511 | | | 3,662 | | | — | | | | | 511 | | | 3,662 | | | 4,173 | | | (534) | | | 2014 | | 2017 | CTR Partnership, L.P. | | The Orchards | | Nampa, ID | | — | | | 785 | | 785 | | | 8,923 | | 8,923 | | | 272 | | 272 | | | | | 785 | | | | 785 | | | 9,195 | | 9,195 | | | 9,980 | | 9,980 | | | (1,417) | | (1,417) | | | 1958 | | 1958 | | 2017 |
| CTR Partnership, L.P. | | CTR Partnership, L.P. | | Weiser Care | | Weiser, ID | | — | | | 80 | | | 4,419 | | | 389 | | | | | 80 | | | 4,808 | | | 4,888 | | | (723) | | | 1964 | | 2017 |
| CTR Partnership, L.P. | | CTR Partnership, L.P. | | Aspen Park | | Moscow, ID | | — | | | 698 | | | 5,092 | | | 274 | | | | | 698 | | | 5,366 | | | 6,064 | | | (875) | | | 1965 | | 2017 |
| CTR Partnership, L.P. | | CTR Partnership, L.P. | | Ridgmar Medical Lodge | | Fort Worth, TX | | — | | | 681 | | | 6,587 | | | 1,256 | | | | | 681 | | | 7,843 | | | 8,524 | | | (1,447) | | | 2006 | | 2017 |
| CTR Partnership, L.P. | | CTR Partnership, L.P. | | Mansfield Medical Lodge | | Mansfield, TX | | — | | | 607 | | | 4,801 | | | 1,073 | | | | | 607 | | | 5,874 | | | 6,481 | | | (1,077) | | | 2006 | | 2017 |
| CTR Partnership, L.P. | | CTR Partnership, L.P. | | Grapevine Medical Lodge | | Grapevine, TX | | — | | | 1,602 | | | 4,536 | | | 891 | | | | | 1,602 | | | 5,427 | | | 7,029 | | | (1,004) | | | 2006 | | 2017 |
|
SCHEDULE III
REAL ESTATE ASSETS AND ACCUMULATED DEPRECIATION
DECEMBER 31, 20222023
(dollars in thousands)
| | CTR Partnership, L.P. | CTR Partnership, L.P. | | Pinckneyville Nursing & Rehabilitation Center | | Pinckneyville, IL | | — | | | 406 | | | 3,411 | | | — | | | | | 406 | | | 3,411 | | | 3,817 | | | (497) | | | 2014 | | 2017 |
| CTR Partnership, L.P. | CTR Partnership, L.P. | | Wellspring Health and Rehabilitation of Cascadia | | Nampa, ID | | — | | | 775 | | | 5,044 | | | 121 | | | | | 775 | | | 5,165 | | | 5,940 | | | (715) | | | 2011 | | 2017 |
| CTR Partnership, L.P. | | The Rio at Fox Hollow | | Brownsville, TX | | — | | | 1,178 | | | 12,059 | | | — | | | | | 1,178 | | | 12,059 | | | 13,237 | | | (1,683) | | | 2016 | | 2017 |
| CTR Partnership, L.P. | | The Rio at Cabezon | | Albuquerque, NM | | — | | | 2,055 | | | 9,749 | | | — | | | | | 2,055 | | | 9,749 | | | 11,804 | | | (1,361) | | | 2016 | | 2017 |
| CTR Partnership, L.P. | | Eldorado Rehab & Healthcare | | Eldorado, IL | | — | | | 940 | | | 2,093 | | | — | | | | | 940 | | | 2,093 | | | 3,033 | | | (288) | | | 1993 | | 2017 |
| CTR Partnership, L.P. | | Secora Health and Rehabilitation of Cascadia | | Portland, OR | | — | | | 1,481 | | | 2,216 | | | 110 | | | | | 1,481 | | | 2,326 | | | 3,807 | | | (305) | | | 2012 | | 2017 |
| CTR Partnership, L.P. | | Mountain Valley | | Kellogg, ID | | — | | | 916 | | | 7,874 | | | — | | | | | 916 | | | 7,874 | | | 8,790 | | | (1,050) | | | 1971 | | 2017 |
| CTR Partnership, L.P. | | Caldwell Care | | Caldwell, ID | | — | | | 906 | | | 7,020 | | | 516 | | | | | 906 | | | 7,536 | | | 8,442 | | | (936) | | | 1947 | | 2017 |
| CTR Partnership, L.P. | | Canyon West | | Caldwell, ID | | — | | | 312 | | | 10,410 | | | 461 | | | | | 312 | | | 10,871 | | | 11,183 | | | (1,388) | | | 1969 | | 2017 |
| CTR Partnership, L.P. | | Lewiston Health and Rehabilitation | | Lewiston, ID | | — | | | 625 | | | 12,087 | | | 200 | | | | | 625 | | | 12,287 | | | 12,912 | | | (1,586) | | | 1964 | | 2017 |
| CTR Partnership, L.P. | | The Orchards | | Nampa, ID | | — | | | 785 | | | 8,923 | | | 116 | | | | | 785 | | | 9,039 | | | 9,824 | | | (1,171) | | | 1958 | | 2017 |
| CTR Partnership, L.P. | | Weiser Care | | Weiser, ID | | — | | | 80 | | | 4,419 | | | 30 | | | | | 80 | | | 4,449 | | | 4,529 | | | (580) | | | 1964 | | 2017 |
| CTR Partnership, L.P. | | Aspen Park | | Moscow, ID | | — | | | 698 | | | 5,092 | | | 274 | | | | | 698 | | | 5,366 | | | 6,064 | | | (729) | | | 1965 | | 2017 |
| CTR Partnership, L.P. | | Ridgmar Medical Lodge | | Fort Worth, TX | | — | | | 681 | | | 6,587 | | | 1,256 | | | | | 681 | | | 7,843 | | | 8,524 | | | (1,198) | | | 2006 | | 2017 |
| CTR Partnership, L.P. | | Mansfield Medical Lodge | | Mansfield, TX | | — | | | 607 | | | 4,801 | | | 1,073 | | | | | 607 | | | 5,874 | | | 6,481 | | | (889) | | | 2006 | | 2017 |
| CTR Partnership, L.P. | | Grapevine Medical Lodge | | Grapevine, TX | | — | | | 1,602 | | | 4,536 | | | 891 | | | | | 1,602 | | | 5,427 | | | 7,029 | | | (832) | | | 2006 | | 2017 |
| | CTR Partnership, L.P. | CTR Partnership, L.P. | | The Oaks at Lakewood | | Tacoma, WA | | — | | | 1,001 | | | 1,779 | | | — | | | | | 1,001 | | | 1,779 | | | 2,780 | | | (233) | | | 1989 | | 2017 | | The Oaks at Lakewood | | Tacoma, WA | | — | | | 1,001 | | 1,001 | | | 1,779 | | 1,779 | | | — | | — | | | | | 1,001 | | | | 1,001 | | | 1,779 | | 1,779 | | | 2,780 | | 2,780 | | | (278) | | (278) | | | 1989 | | 1989 | | 2017 |
| CTR Partnership, L.P. | CTR Partnership, L.P. | | The Oaks at Timberline | | Vancouver, WA | | — | | | 446 | | | 869 | | | — | | | | | 446 | | | 869 | | | 1,315 | | | (114) | | | 1972 | | 2017 | CTR Partnership, L.P. | | The Oaks at Timberline | | Vancouver, WA | | — | | | 446 | | 446 | | | 869 | | 869 | | | — | | — | | | | | 446 | | | | 446 | | | 869 | | 869 | | | 1,315 | | 1,315 | | | (136) | | (136) | | | 1972 | | 1972 | | 2017 |
| CTR Partnership, L.P. | CTR Partnership, L.P. | | Providence Waterman Nursing Center | | San Bernardino, CA | | — | | | 3,831 | | | 19,791 | | | — | | | | | 3,831 | | | 19,791 | | | 23,622 | | | (2,598) | | | 1967 | | 2017 | CTR Partnership, L.P. | | Providence Waterman Nursing Center | | San Bernardino, CA | | — | | | 3,831 | | 3,831 | | | 19,791 | | 19,791 | | | — | | — | | | | | 3,831 | | | | 3,831 | | | 19,791 | | 19,791 | | | 23,622 | | 23,622 | | | (3,092) | | (3,092) | | | 1967 | | 1967 | | 2017 |
| CTR Partnership, L.P. | CTR Partnership, L.P. | | Providence Orange Tree | | Riverside, CA | | — | | | 2,897 | | | 14,700 | | | 345 | | | | | 2,897 | | | 15,045 | | | 17,942 | | | (1,975) | | | 1969 | | 2017 | CTR Partnership, L.P. | | Providence Orange Tree | | Riverside, CA | | — | | | 2,897 | | 2,897 | | | 14,700 | | 14,700 | | | 345 | | 345 | | | | | 2,897 | | | | 2,897 | | | 15,045 | | 15,045 | | | 17,942 | | 17,942 | | | (2,366) | | (2,366) | | | 1969 | | 1969 | | 2017 |
| CTR Partnership, L.P. | CTR Partnership, L.P. | | Providence Ontario | | Ontario, CA | | — | | | 4,204 | | | 21,880 | | | — | | | | | 4,204 | | | 21,880 | | | 26,084 | | | (2,872) | | | 1980 | | 2017 | CTR Partnership, L.P. | | Providence Ontario | | Ontario, CA | | — | | | 4,204 | | 4,204 | | | 21,880 | | 21,880 | | | — | | — | | | | | 4,204 | | | | 4,204 | | | 21,880 | | 21,880 | | | 26,084 | | 26,084 | | | (3,419) | | (3,419) | | | 1980 | | 1980 | | 2017 |
| CTR Partnership, L.P. | CTR Partnership, L.P. | | Greenville Nursing & Rehabilitation Center | | Greenville, IL | | — | | | 188 | | | 3,972 | | | — | | | | | 188 | | | 3,972 | | | 4,160 | | | (603) | | | 1973 | | 2017 | CTR Partnership, L.P. | | Greenville Nursing & Rehabilitation Center | | Greenville, IL | | — | | | 188 | | 188 | | | 3,972 | | 3,972 | | | — | | — | | | | | 188 | | | | 188 | | | 3,972 | | 3,972 | | | 4,160 | | 4,160 | | | (721) | | (721) | | | 1973 | | 1973 | | 2017 |
| CTR Partnership, L.P. | CTR Partnership, L.P. | | Copper Ridge Health and Rehabilitation Center | | Butte, MT | | — | | | 220 | | | 4,974 | | | 39 | | | | | 220 | | | 5,013 | | | 5,233 | | | (675) | | | 2010 | | 2018 | CTR Partnership, L.P. | | Copper Ridge Health and Rehabilitation Center | | Butte, MT | | — | | | 220 | | 220 | | | 4,974 | | 4,974 | | | 39 | | 39 | | | | | 220 | | | | 220 | | | 5,013 | | 5,013 | | | 5,233 | | 5,233 | | | (814) | | (814) | | | 2010 | | 2010 | | 2018 |
| | CTR Partnership, L.P. | CTR Partnership, L.P. | | Prairie Heights Healthcare Center | | Aberdeen, SD | | — | | | 1,372 | | | 7,491 | | | — | | | | | 1,372 | | | 7,491 | | | 8,863 | | | (925) | | | 1965 | | 2018 |
| | CTR Partnership, L.P. | |
| | CTR Partnership, L.P. | | | Prairie Heights Healthcare Center | | Aberdeen, SD | | — | | | 1,372 | | | 7,491 | | | — | | | | | 1,372 | | | 7,491 | | | 8,863 | | | (1,133) | | | 1965 | | 2018 |
| CTR Partnership, L.P. | CTR Partnership, L.P. | | The Meadows on University | | Fargo, ND | | — | | | 989 | | | 3,275 | | | — | | | | | 989 | | | 3,275 | | | 4,264 | | | (378) | | | 1966 | | 2018 | CTR Partnership, L.P. | | The Meadows on University | | Fargo, ND | | — | | | 989 | | 989 | | | 3,275 | | 3,275 | | | — | | — | | | | | 989 | | | | 989 | | | 3,275 | | 3,275 | | | 4,264 | | 4,264 | | | (468) | | (468) | | | 1966 | | 1966 | | 2018 |
| | CTR Partnership, L.P. | CTR Partnership, L.P. | | The Suites - Parker | | Parker, CO | | — | | | 1,178 | | | 17,857 | | | — | | | | | 1,178 | | | 17,857 | | | 19,035 | | | (1,865) | | | 2012 | | 2018 |
| CTR Partnership, L.P. | CTR Partnership, L.P. | | Huntington Park Nursing Center | | Huntington Park, CA | | — | | | 3,131 | | | 8,876 | | | 299 | | | | | 3,131 | | | 9,175 | | | 12,306 | | | (976) | | | 1955 | | 2019 |
| CTR Partnership, L.P. | CTR Partnership, L.P. | | Shoreline Care Center | | Oxnard, CA | | — | | | 1,699 | | | 9,004 | | | — | | | | | 1,699 | | | 9,004 | | | 10,703 | | | (905) | | | 1962 | | 2019 | | The Suites - Parker | | Parker, CO | | — | | | 1,178 | | 1,178 | | | 17,857 | | 17,857 | | | — | | — | | | | | 1,178 | | | | 1,178 | | | 17,857 | | 17,857 | | | 19,035 | | 19,035 | | | (2,322) | | (2,322) | | | 2012 | | 2012 | | 2018 |
| CTR Partnership, L.P. | CTR Partnership, L.P. | | Downey Care Center | | Downey, CA | | — | | | 2,502 | | | 6,141 | | | — | | | | | 2,502 | | | 6,141 | | | 8,643 | | | (619) | | | 1967 | | 2019 | CTR Partnership, L.P. | | Huntington Park Nursing Center | | Huntington Park, CA | | — | | | 3,131 | | 3,131 | | | 8,876 | | 8,876 | | | 299 | | 299 | | | | | 3,131 | | | | 3,131 | | | 9,175 | | 9,175 | | | 12,306 | | 12,306 | | | (1,232) | | (1,232) | | | 1955 | | 1955 | | 2019 |
| CTR Partnership, L.P. | CTR Partnership, L.P. | | Courtyard Healthcare Center | | Davis, CA | | — | | | 2,351 | | | 9,256 | | | — | | | | | 2,351 | | | 9,256 | | | 11,607 | | | (949) | | | 1969 | | 2019 | CTR Partnership, L.P. | | Shoreline Care Center | | Oxnard, CA | | — | | | 1,699 | | 1,699 | | | 9,004 | | 9,004 | | | — | | — | | | | | 1,699 | | | | 1,699 | | | 9,004 | | 9,004 | | | 10,703 | | 10,703 | | | (1,136) | | (1,136) | | | 1962 | | 1962 | | 2019 |
| CTR Partnership, L.P. | | CTR Partnership, L.P. | | Downey Care Center | | Downey, CA | | — | | | 2,502 | | | 6,141 | | | — | | | | | 2,502 | | | 6,141 | | | 8,643 | | | (776) | | | 1967 | | 2019 |
| CTR Partnership, L.P. | | CTR Partnership, L.P. | | Courtyard Healthcare Center | | Davis, CA | | — | | | 2,351 | | | 9,256 | | | — | | | | | 2,351 | | | 9,256 | | | 11,607 | | | (1,191) | | | 1969 | | 2019 |
| Gulf Coast Buyer 1 LLC | Gulf Coast Buyer 1 LLC | | Alpine Skilled Nursing and Rehabilitation | | Ruston, LA | | — | | | 2,688 | | | 23,825 | | | — | | | | | 2,688 | | | 23,825 | | | 26,513 | | | (2,357) | | | 2014 | | 2019 | Gulf Coast Buyer 1 LLC | | Alpine Skilled Nursing and Rehabilitation | | Ruston, LA | | — | | | 2,688 | | 2,688 | | | 23,825 | | 23,825 | | | — | | — | | | | | 2,688 | | | | 2,688 | | | 23,825 | | 23,825 | | | 26,513 | | 26,513 | | | (2,985) | | (2,985) | | | 2014 | | 2014 | | 2019 |
| Gulf Coast Buyer 1 LLC | Gulf Coast Buyer 1 LLC | | The Bradford Skilled Nursing and Rehabilitation | | Shreveport, LA | | — | | | 3,758 | | | 21,325 | | | 17 | | | | | 3,758 | | | 21,342 | | | 25,100 | | | (2,127) | | | 1980 | | 2019 | Gulf Coast Buyer 1 LLC | | The Bradford Skilled Nursing and Rehabilitation | | Shreveport, LA | | — | | | 3,758 | | 3,758 | | | 21,325 | | 21,325 | | | 17 | | 17 | | | | | 3,758 | | | | 3,758 | | | 21,342 | | 21,342 | | | 25,100 | | 25,100 | | | (2,694) | | (2,694) | | | 1980 | | 1980 | | 2019 |
| Gulf Coast Buyer 1 LLC | | Gulf Coast Buyer 1 LLC | | Colonial Oaks Skilled Nursing and Rehabilitation | | Bossier City, LA | | — | | | 1,635 | | | 21,180 | | | — | | | | | 1,635 | | | 21,180 | | | 22,815 | | | (2,591) | | | 2013 | | 2019 |
| Gulf Coast Buyer 1 LLC | | Gulf Coast Buyer 1 LLC | | The Guest House Skilled Nursing and Rehabilitation | | Shreveport, LA | | — | | | 3,437 | | | 20,889 | | | 2,845 | | | | | 3,437 | | | 23,734 | | | 27,171 | | | (2,992) | | | 2006 | | 2019 |
| Gulf Coast Buyer 1 LLC | | Gulf Coast Buyer 1 LLC | | Pilgrim Manor Skilled Nursing and Rehabilitation | | Bossier City, LA | | — | | | 2,979 | | | 24,617 | | | 1,978 | | | | | 2,979 | | | 26,595 | | | 29,574 | | | (3,082) | | | 2008 | | 2019 |
| Gulf Coast Buyer 1 LLC | | Gulf Coast Buyer 1 LLC | | Shreveport Manor Skilled Nursing and Rehabilitation | | Shreveport, LA | | — | | | 676 | | | 10,238 | | | 602 | | | | | 676 | | | 10,840 | | | 11,516 | | | (1,350) | | | 2008 | | 2019 |
| Gulf Coast Buyer 1 LLC | | Gulf Coast Buyer 1 LLC | | Booker T. Washington Skilled Nursing and Rehabilitation | | Shreveport, LA | | — | | | 2,452 | | | 9,148 | | | 113 | | | | | 2,452 | | | 9,261 | | | 11,713 | | | (1,221) | | | 2013 | | 2019 |
| Gulf Coast Buyer 1 LLC | | Gulf Coast Buyer 1 LLC | | Legacy West Rehabilitation and Healthcare | | Corsicana, TX | | — | | | 120 | | | 6,682 | | | 436 | | | | | 120 | | | 7,118 | | | 7,238 | | | (1,004) | | | 2002 | | 2019 |
| Gulf Coast Buyer 1 LLC | | Gulf Coast Buyer 1 LLC | | Legacy at Jacksonville | | Jacksonville, TX | | — | | | 173 | | | 7,481 | | | 127 | | | | | 173 | | | 7,608 | | | 7,781 | | | (1,025) | | | 2006 | | 2019 |
| Gulf Coast Buyer 1 LLC | | Gulf Coast Buyer 1 LLC | | Pecan Tree Rehabilitation and Healthcare | | Gainesville, TX | | — | | | 219 | | | 10,097 | | | 255 | | | | | 219 | | | 10,352 | | | 10,571 | | | (1,356) | | | 1990 | | 2019 |
| Lakewest SNF Realty, LLC | | Lakewest SNF Realty, LLC | | Lakewest Rehabilitation and Skilled Care | | Dallas, TX | | — | | | — | | | 6,905 | | | — | | | | | — | | | 6,905 | | | 6,905 | | | (901) | | | 2011 | | 2019 |
| CTR Partnership, L.P. | | CTR Partnership, L.P. | | Cascadia of Nampa | | Nampa, ID | | — | | | 880 | | | 14,117 | | | — | | | | | 880 | | | 14,117 | | | 14,997 | | | (1,719) | | | 2017 | | 2019 |
| CTR Partnership, L.P. | | CTR Partnership, L.P. | | Valley Skilled Nursing | | Modesto, CA | | — | | | 798 | | | 7,671 | | | — | | | | | 798 | | | 7,671 | | | 8,469 | | | (845) | | | 2016 | | 2019 |
| CTR Partnership, L.P. | | CTR Partnership, L.P. | | Cascadia of Boise | | Boise, ID | | — | | | 1,597 | | | 15,692 | | | — | | | | | 1,597 | | | 15,692 | | | 17,289 | | | (1,647) | | | 2018 | | 2020 |
| CTR Partnership, L.P. | | CTR Partnership, L.P. | | Cooney Healthcare and Rehabilitation | | Helena, MT | | — | | | 867 | | | 7,431 | | | 20 | | | | | 867 | | | 7,451 | | | 8,318 | | | (656) | | | 1984 | | 2020 |
SCHEDULE III
REAL ESTATE ASSETS AND ACCUMULATED DEPRECIATION
DECEMBER 31, 20222023
(dollars in thousands)
| | Gulf Coast Buyer 1 LLC | | Colonial Oaks Skilled Nursing and Rehabilitation | | Bossier City, LA | | — | | | 1,635 | | | 21,180 | | | — | | | | | 1,635 | | | 21,180 | | | 22,815 | | | (2,045) | | | 2013 | | 2019 |
| Gulf Coast Buyer 1 LLC | | The Guest House Skilled Nursing and Rehabilitation | | Shreveport, LA | | — | | | 3,437 | | | 20,889 | | | 2,845 | | | | | 3,437 | | | 23,734 | | | 27,171 | | | (2,160) | | | 2006 | | 2019 |
| Gulf Coast Buyer 1 LLC | | Pilgrim Manor Skilled Nursing and Rehabilitation | | Bossier City, LA | | — | | | 2,979 | | | 24,617 | | | 2,100 | | | | | 2,979 | | | 26,717 | | | 29,696 | | | (2,407) | | | 2008 | | 2019 |
| Gulf Coast Buyer 1 LLC | | Shreveport Manor Skilled Nursing and Rehabilitation | | Shreveport, LA | | — | | | 676 | | | 10,238 | | | 361 | | | | | 676 | | | 10,599 | | | 11,275 | | | (1,058) | | | 2008 | | 2019 |
| Gulf Coast Buyer 1 LLC | | Booker T. Washington Skilled Nursing and Rehabilitation | | Shreveport, LA | | — | | | 2,452 | | | 9,148 | | | 113 | | | | | 2,452 | | | 9,261 | | | 11,713 | | | (963) | | | 2013 | | 2019 |
| Gulf Coast Buyer 1 LLC | | Legacy West Rehabilitation and Healthcare | | Corsicana, TX | | — | | | 120 | | | 6,682 | | | 436 | | | | | 120 | | | 7,118 | | | 7,238 | | | (782) | | | 2002 | | 2019 |
| Gulf Coast Buyer 1 LLC | | Legacy at Jacksonville | | Jacksonville, TX | | — | | | 173 | | | 7,481 | | | 127 | | | | | 173 | | | 7,608 | | | 7,781 | | | (806) | | | 2006 | | 2019 |
| Gulf Coast Buyer 1 LLC | | Pecan Tree Rehabilitation and Healthcare | | Gainesville, TX | | — | | | 219 | | | 10,097 | | | 255 | | | | | 219 | | | 10,352 | | | 10,571 | | | (1,064) | | | 1990 | | 2019 |
| Lakewest SNF Realty, LLC | | Lakewest Rehabilitation and Skilled Care | | Dallas, TX | | — | | | — | | | 6,905 | | | — | | | | | — | | | 6,905 | | | 6,905 | | | (708) | | | 2011 | | 2019 |
| CTR Partnership, L.P. | | Cascadia of Nampa | | Nampa, ID | | — | | | 880 | | | 14,117 | | | — | | | | | 880 | | | 14,117 | | | 14,997 | | | (1,344) | | | 2017 | | 2019 |
| CTR Partnership, L.P. | | Valley Skilled Nursing | | Modesto, CA | | — | | | 798 | | | 7,671 | | | — | | | | | 798 | | | 7,671 | | | 8,469 | | | (647) | | | 2016 | | 2019 |
| CTR Partnership, L.P. | CTR Partnership, L.P. | | Cascadia of Boise | | Boise, ID | | — | | | 1,597 | | | 15,692 | | | — | | | | | 1,597 | | | 15,692 | | | 17,289 | | | (1,235) | | | 2018 | | 2020 |
| CTR Partnership, L.P. | CTR Partnership, L.P. | | Cooney Healthcare and Rehabilitation | | Helena, MT | | — | | | 867 | | | 7,431 | | | 20 | | | | | 867 | | | 7,451 | | | 8,318 | | | (458) | | | 1984 | | 2020 |
| CTR Partnership, L.P. | CTR Partnership, L.P. | | Elkhorn Healthcare and Rehabilitation | | Clancy, MT | | — | | | 183 | | | 7,380 | | | 430 | | | | | 183 | | | 7,810 | | | 7,993 | | | (465) | | | 1960 | | 2020 | | Elkhorn Healthcare and Rehabilitation | | Clancy, MT | | — | | | 183 | | 183 | | | 7,380 | | 7,380 | | | 504 | | 504 | | | | | 183 | | | | 183 | | | 7,884 | | 7,884 | | | 8,067 | | 8,067 | | | (700) | | (700) | | | 1960 | | 1960 | | 2020 |
| CTR Partnership, L.P. | CTR Partnership, L.P. | | Beacon Harbor Healthcare and Rehabilitation | | Rockwall, TX | | — | | | 1,295 | | | 17,069 | | | — | | | | | 1,295 | | | 17,069 | | | 18,364 | | | (989) | | | 1996 | | 2020 | CTR Partnership, L.P. | | Beacon Harbor Healthcare and Rehabilitation | | Rockwall, TX | | — | | | 1,295 | | 1,295 | | | 17,069 | | 17,069 | | | — | | — | | | | | 1,295 | | | | 1,295 | | | 17,069 | | 17,069 | | | 18,364 | | 18,364 | | | (1,446) | | (1,446) | | | 1996 | | 1996 | | 2020 |
| CTR Partnership, L.P. | CTR Partnership, L.P. | | Pleasant Manor Healthcare and Rehabilitation | | Waxahachie, TX | | — | | | 629 | | | 7,433 | | | — | | | | | 629 | | | 7,433 | | | 8,062 | | | (434) | | | 1972 | | 2020 | CTR Partnership, L.P. | | Pleasant Manor Healthcare and Rehabilitation | | Waxahachie, TX | | — | | | 629 | | 629 | | | 7,433 | | 7,433 | | | — | | — | | | | | 629 | | | | 629 | | | 7,433 | | 7,433 | | | 8,062 | | 8,062 | | | (635) | | (635) | | | 1972 | | 1972 | | 2020 |
| CTR Partnership, L.P. | CTR Partnership, L.P. | | Rowlett Health and Rehabilitation Center | | Rowlett, TX | | — | | | 1,036 | | | 10,516 | | | — | | | | | 1,036 | | | 10,516 | | | 11,552 | | | (606) | | | 1990 | | 2020 | CTR Partnership, L.P. | | Rowlett Health and Rehabilitation Center | | Rowlett, TX | | — | | | 1,036 | | 1,036 | | | 10,516 | | 10,516 | | | — | | — | | | | | 1,036 | | | | 1,036 | | | 10,516 | | 10,516 | | | 11,552 | | 11,552 | | | (886) | | (886) | | | 1990 | | 1990 | | 2020 |
| 160 North Patterson Avenue, LLC | 160 North Patterson Avenue, LLC | | Buena Vista Care Center | | Goleta, CA | | — | | | 7,987 | | | 7,237 | | | — | | | | | 7,987 | | | 7,237 | | | 15,224 | | | (351) | | | 1967 | | 2021 | 160 North Patterson Avenue, LLC | | Buena Vista Care Center | | Goleta, CA | | — | | | 7,987 | | 7,987 | | | 7,237 | | 7,237 | | | — | | — | | | | | 7,987 | | | | 7,987 | | | 7,237 | | 7,237 | | | 15,224 | | 15,224 | | | (543) | | (543) | | | 1967 | | 1967 | | 2021 |
| CTR Partnership, L.P. | CTR Partnership, L.P. | | El Centro Post-Acute Care | | El Centro, CA | | — | | | 1,283 | | | 8,133 | | | 135 | | | | | 1,283 | | | 8,268 | | | 9,551 | | | (367) | | | 1962 | | 2021 | CTR Partnership, L.P. | | El Centro Post-Acute Care | | El Centro, CA | | — | | | 1,283 | | 1,283 | | | 8,133 | | 8,133 | | | 135 | | 135 | | | | | 1,283 | | | | 1,283 | | | 8,268 | | 8,268 | | | 9,551 | | 9,551 | | | (594) | | (594) | | | 1962 | | 1962 | | 2021 |
| CTR Partnership, L.P. | CTR Partnership, L.P. | | Sedona Trace Health and Wellness | | Austin, TX | | — | | | 3,282 | | | 12,763 | | | — | | | | | 3,282 | | | 12,763 | | | 16,045 | | | (507) | | | 2017 | | 2021 | CTR Partnership, L.P. | | Sedona Trace Health and Wellness | | Austin, TX | | — | | | 3,282 | | 3,282 | | | 12,763 | | 12,763 | | | — | | — | | | | | 3,282 | | | | 3,282 | | | 12,763 | | 12,763 | | | 16,045 | | 16,045 | | | (865) | | (865) | | | 2017 | | 2017 | | 2021 |
| CTR Partnership, L.P. | CTR Partnership, L.P. | | Cedar Pointe Health and Wellness Suites | | Cedar Park, TX | | — | | | 3,325 | | | 11,738 | | | — | | | | | 3,325 | | | 11,738 | | | 15,063 | | | (461) | | | 2017 | | 2021 | CTR Partnership, L.P. | | Cedar Pointe Health and Wellness Suites | | Cedar Park, TX | | — | | | 3,325 | | 3,325 | | | 11,738 | | 11,738 | | | — | | — | | | | | 3,325 | | | | 3,325 | | | 11,738 | | 11,738 | | | 15,063 | | 15,063 | | | (786) | | (786) | | | 2017 | | 2017 | | 2021 |
| CTR Partnership, L.P. | CTR Partnership, L.P. | | Ennis Care Center | | Ennis,TX | | — | | | 568 | | | 8,055 | | | — | | | | | 568 | | | 8,055 | | | 8,623 | | | (201) | | | 1982 | | 2022 | CTR Partnership, L.P. | | Ennis Care Center | | Ennis,TX | | — | | | 568 | | 568 | | | 8,055 | | 8,055 | | | — | | — | | | | | 568 | | | | 568 | | | 8,055 | | 8,055 | | | 8,623 | | 8,623 | | | (421) | | (421) | | | 1982 | | 1982 | | 2022 |
| — | | | 157,842 | | | 947,010 | | | 97,380 | | | | | 156,008 | | | 1,044,124 | | | 1,200,131 | | | (246,446) | | |
| CTR Partnership, L.P. | | CTR Partnership, L.P. | | Park Bend Rehabilitation and Healthcare Center | | Burleson, TX | | — | | | 1,877 | | | 6,616 | | | 717 | | | | | 1,877 | | | 7,333 | | | 9,210 | | | (148) | | | 1988 | | 2023 |
| CTR Partnership, L.P. | | CTR Partnership, L.P. | | Prairie Ridge Health and Rehabiliation | | Overland Park , KS | | — | | | 1,301 | | | 5,025 | | | — | | | | | 1,301 | | | 5,025 | | | 6,326 | | | (104) | | | 1987 | | 2023 |
| CTR Partnership, L.P. | | CTR Partnership, L.P. | | Spalding Post Acute | | Griffin , GA | | — | | | 680 | | | 11,044 | | | — | | | | | 680 | | | 11,044 | | | 11,724 | | | (209) | | | 2022 | | 2023 |
| CTR Partnership, L.P. | | CTR Partnership, L.P. | | Casa Azul Skilled Nursing and Rehabilitation | | Katy , TX | | — | | | 3,413 | | | 10,451 | | | — | | | | | 3,413 | | | 10,451 | | | 13,864 | | | (165) | | | 2005 | | 2023 |
| 8665 La Mesa Boulevard, LLC | | 8665 La Mesa Boulevard, LLC | | Community Convalescent Hospital of La Mesa | | La Mesa , CA | | — | | | 5,346 | | | 21,528 | | | — | | | | | 5,346 | | | 21,528 | | | 26,874 | | | (321) | | | 1968 | | 2023 |
| 7039 Alonda Boulevard, LLC | | 7039 Alonda Boulevard, LLC | | Paramount Meadows Nursing Center | | Paramount , CA | | — | | | 3,640 | | | 15,380 | | | — | | | | | 3,640 | | | 15,380 | | | 19,020 | | | (230) | | | 1969 | | 2023 |
| 10625 Leffingwell Road, LLC | | 10625 Leffingwell Road, LLC | | Norwalk Meadows Nursing Center | | Norwalk , CA | | — | | | 4,932 | | | 14,229 | | | — | | | | | 4,932 | | | 14,229 | | | 19,161 | | | (216) | | | 1964 | | 2023 |
| 247 E. Bobier Drive, LLC | | 247 E. Bobier Drive, LLC | | La Fuente Post Acute | | Vista , CA | | — | | | 4,882 | | | 20,793 | | | — | | | | | 4,882 | | | 20,793 | | | 25,675 | | | (187) | | | 1990 | | 2023 |
| Capitola 1935 Realty LLC | | Capitola 1935 Realty LLC | | Pacific Coast Manor | | Capitola , CA | | — | | | 5,231 | | | 16,321 | | | — | | | | | 5,231 | | | 16,321 | | | 21,552 | | | (70) | | | 1964 | | 2023 |
| Morgan Hills Realty LLC | | Morgan Hills Realty LLC | | Pacific Hills Manor | | Morgan Hill , CA | | — | | | 3,239 | | | 14,418 | | | — | | | | | 3,239 | | | 14,418 | | | 17,657 | | | (64) | | | 2014 | | 2023 |
| | | | | | — | |
| Multi-Service Campus Properties: | Multi-Service Campus Properties: | | | | | | | | | | | | | | | | | | | |
| Multi-Service Campus Properties: | |
| Multi-Service Campus Properties: | |
| Ensign Southland LLC | |
| Ensign Southland LLC | |
| Ensign Southland LLC | Ensign Southland LLC | | Southland Care | | Norwalk, CA | | — | | | 966 | | | 5,082 | | | 2,213 | | | | | 966 | | | 7,295 | | | 8,261 | | | (5,864) | | | 2011 | | 1999 | | Southland Care | | Norwalk, CA | | — | | | 966 | | 966 | | | 5,082 | | 5,082 | | | 2,213 | | 2,213 | | | | | 966 | | | | 966 | | | 7,295 | | 7,295 | | | 8,261 | | 8,261 | | | (6,116) | | (6,116) | | | 2011 | | 2011 | | 1999 |
| Mission CCRC LLC | Mission CCRC LLC | | St. Joseph's Villa | | Salt Lake City, UT | | — | | | 1,962 | | | 11,035 | | | 464 | | | | | 1,962 | | | 11,499 | | | 13,461 | | | (3,932) | | | 1994 | | 2011 | Mission CCRC LLC | | St. Joseph's Villa | | Salt Lake City, UT | | — | | | 1,962 | | 1,962 | | | 11,035 | | 11,035 | | | 464 | | 464 | | | | | 1,962 | | | | 1,962 | | | 11,499 | | 11,499 | | | 13,461 | | 13,461 | | | (4,221) | | (4,221) | | | 1994 | | 1994 | | 2011 |
| Wayne Health Holdings LLC | Wayne Health Holdings LLC | | Careage of Wayne | | Wayne, NE | | — | | | 130 | | | 3,061 | | | 122 | | | | | 130 | | | 3,183 | | | 3,313 | | | (1,202) | | | 1978 | | 2011 | Wayne Health Holdings LLC | | Careage of Wayne | | Wayne, NE | | — | | | 130 | | 130 | | | 3,061 | | 3,061 | | | 122 | | 122 | | | | | 130 | | | | 130 | | | 3,183 | | 3,183 | | | 3,313 | | 3,313 | | | (1,302) | | (1,302) | | | 1978 | | 1978 | | 2011 |
| 4th Street Holdings LLC | 4th Street Holdings LLC | | West Bend Care Center | | West Bend, IA | | — | | | 180 | | | 3,352 | | | — | | | | | 180 | | | 3,352 | | | 3,532 | | | (1,199) | | | 2006 | | 2011 | 4th Street Holdings LLC | | West Bend Care Center | | West Bend, IA | | — | | | 180 | | 180 | | | 3,352 | | 3,352 | | | — | | — | | | | | 180 | | | | 180 | | | 3,352 | | 3,352 | | | 3,532 | | 3,532 | | | (1,304) | | (1,304) | | | 2006 | | 2006 | | 2011 |
| Big Sioux River Health Holdings LLC | | Big Sioux River Health Holdings LLC | | Hillcrest Health | | Hawarden, IA | | — | | | 110 | | | 3,522 | | | 75 | | | | | 110 | | | 3,597 | | | 3,707 | | | (1,317) | | | 1974 | | 2011 |
| Prairie Health Holdings LLC | | Prairie Health Holdings LLC | | Colonial Manor of Randolph | | Randolph, NE | | — | | | 130 | | | 1,571 | | | 22 | | | | | 130 | | | 1,593 | | | 1,723 | | | (998) | | | 2011 |
| Salmon River Health Holdings LLC | | Salmon River Health Holdings LLC | | Discovery Care Center | | Salmon, ID | | — | | | 168 | | | 2,496 | | | — | | | | | 168 | | | 2,496 | | | 2,664 | | | (712) | | | 2012 |
| | CTR Partnership, L.P. | |
| CTR Partnership, L.P. | |
| CTR Partnership, L.P. | | | Liberty Nursing Center of Willard | | Willard, OH | | — | | | 144 | | | 11,097 | | | 50 | | | | | 144 | | | 11,147 | | | 11,291 | | | (2,324) | | | 1985 | | 2015 |
| CTR Partnership, L.P. | | CTR Partnership, L.P. | | Premier Estates of Middletown/Premier Retirement Estates of Middletown | | Middletown, OH | | — | | | 990 | | | 7,484 | | | 380 | | | | | 990 | | | 7,864 | | | 8,854 | | | (1,676) | | | 1985 | | 2015 |
SCHEDULE III
REAL ESTATE ASSETS AND ACCUMULATED DEPRECIATION
DECEMBER 31, 20222023
(dollars in thousands)
| | Big Sioux River Health Holdings LLC | | Hillcrest Health | | Hawarden, IA | | — | | | 110 | | | 3,522 | | | 75 | | | | | 110 | | | 3,597 | | | 3,707 | | | (1,211) | | | 1974 | | 2011 |
| Prairie Health Holdings LLC | | Colonial Manor of Randolph | | Randolph, NE | | — | | | 130 | | | 1,571 | | | 22 | | | | | 130 | | | 1,593 | | | 1,723 | | | (918) | | | 2011 | | 2011 |
| Salmon River Health Holdings LLC | | Discovery Care Center | | Salmon, ID | | — | | | 168 | | | 2,496 | | | — | | | | | 168 | | | 2,496 | | | 2,664 | | | (650) | | | 2012 | | 2012 |
| | CTR Partnership, L.P. | CTR Partnership, L.P. | | Liberty Nursing Center of Willard | | Willard, OH | | — | | | 144 | | | 11,097 | | | 50 | | | | | 144 | | | 11,147 | | | 11,291 | | | (2,042) | | | 1985 | | 2015 |
| CTR Partnership, L.P. | CTR Partnership, L.P. | | Premier Estates of Middletown/Premier Retirement Estates of Middletown | | Middletown, OH | | — | | | 990 | | | 7,484 | | | 380 | | | | | 990 | | | 7,864 | | | 8,854 | | | (1,451) | | | 1985 | | 2015 |
| CTR Partnership, L.P. | CTR Partnership, L.P. | | Premier Estates of Norwood Towers/Premier Retirement Estates of Norwood Towers | | Norwood, OH | | — | | | 1,316 | | | 10,071 | | | 1,021 | | | | | 1,316 | | | 11,092 | | | 12,408 | | | (1,875) | | | 1991 | | 2016 | | Premier Estates of Norwood Towers/Premier Retirement Estates of Norwood Towers | | Norwood, OH | | — | | | 1,316 | | 1,316 | | | 10,071 | | 10,071 | | | 1,021 | | 1,021 | | | | | 1,316 | | | | 1,316 | | | 11,092 | | 11,092 | | | 12,408 | | 12,408 | | | (2,216) | | (2,216) | | | 1991 | | 1991 | | 2016 |
| CTR Partnership, L.P. | CTR Partnership, L.P. | | Turlock Nursing and Rehabilitation Center | | Turlock, CA | | — | | | 1,258 | | | 16,526 | | | — | | | | | 1,258 | | | 16,526 | | | 17,784 | | | (2,651) | | | 1986 | | 2016 | CTR Partnership, L.P. | | Turlock Nursing and Rehabilitation Center | | Turlock, CA | | — | | | 1,258 | | 1,258 | | | 16,526 | | 16,526 | | | — | | — | | | | | 1,258 | | | | 1,258 | | | 16,526 | | 16,526 | | | 17,784 | | 17,784 | | | (3,064) | | (3,064) | | | 1986 | | 1986 | | 2016 |
| CTR Partnership, L.P. | CTR Partnership, L.P. | | Bridgeport Medical Lodge | | Bridgeport, TX | | — | | | 980 | | | 27,917 | | | — | | | | | 980 | | | 27,917 | | | 28,897 | | | (4,246) | | | 2014 | | 2016 | CTR Partnership, L.P. | | Bridgeport Medical Lodge | | Bridgeport, TX | | — | | | 980 | | 980 | | | 27,917 | | 27,917 | | | — | | — | | | | | 980 | | | | 980 | | | 27,917 | | 27,917 | | | 28,897 | | 28,897 | | | (4,944) | | (4,944) | | | 2014 | | 2014 | | 2016 |
| CTR Partnership, L.P. | CTR Partnership, L.P. | | The Villas at Saratoga | | Saratoga, CA | | — | | | 8,709 | | | 9,736 | | | 1,397 | | | | | 8,709 | | | 11,133 | | | 19,842 | | | (1,399) | | | 2004 | | 2018 | CTR Partnership, L.P. | | The Villas at Saratoga | | Saratoga, CA | | — | | | 8,709 | | 8,709 | | | 9,736 | | 9,736 | | | 1,397 | | 1,397 | | | | | 8,709 | | | | 8,709 | | | 11,133 | | 11,133 | | | 19,842 | | 19,842 | | | (1,789) | | (1,789) | | | 2004 | | 2004 | | 2018 |
| CTR Partnership, L.P. | CTR Partnership, L.P. | | Madison Park Healthcare | | Huntington, WV | | — | | | 601 | | | 6,385 | | | — | | | | | 601 | | | 6,385 | | | 6,986 | | | (691) | | | 1924 | | 2018 | CTR Partnership, L.P. | | Madison Park Healthcare | | Huntington, WV | | — | | | 601 | | 601 | | | 6,385 | | 6,385 | | | — | | — | | | | | 601 | | | | 601 | | | 6,385 | | 6,385 | | | 6,986 | | 6,986 | | | (856) | | (856) | | | 1924 | | 1924 | | 2018 |
| CTR Partnership, L.P. | CTR Partnership, L.P. | | Oakview Heights Nursing & Rehabilitation Center | | Mt. Carmel, IL | | — | | | 298 | | | 8,393 | | | — | | | | | 298 | | | 8,393 | | | 8,691 | | | (930) | | | 2004 | | 2019 | CTR Partnership, L.P. | | Oakview Heights Nursing & Rehabilitation Center | | Mt. Carmel, IL | | — | | | 298 | | 298 | | | 8,393 | | 8,393 | | | — | | — | | | | | 298 | | | | 298 | | | 8,393 | | 8,393 | | | 8,691 | | 8,691 | | | (1,167) | | (1,167) | | | 2004 | | 2004 | | 2019 |
| Gulf Coast Buyer 1 LLC | Gulf Coast Buyer 1 LLC | | Spring Lake Skilled Nursing and Rehabilitation | | Shreveport, LA | | — | | | 3,217 | | | 21,195 | | | 2,729 | | | | | 3,217 | | | 23,924 | | | 27,141 | | | (2,490) | | | 2008 | | 2019 | Gulf Coast Buyer 1 LLC | | Spring Lake Skilled Nursing and Rehabilitation | | Shreveport, LA | | — | | | 3,217 | | 3,217 | | | 21,195 | | 21,195 | | | 2,729 | | 2,729 | | | | | 3,217 | | | | 3,217 | | | 23,924 | | 23,924 | | | 27,141 | | 27,141 | | | (3,313) | | (3,313) | | | 2008 | | 2008 | | 2019 |
| Gulf Coast Buyer 1 LLC | Gulf Coast Buyer 1 LLC | | The Village at Heritage Oaks | | Corsicana, TX | | — | | | 143 | | | 11,429 | | | 482 | | | | | 143 | | | 11,911 | | | 12,054 | | | (1,266) | | | 2007 | | 2019 | Gulf Coast Buyer 1 LLC | | The Village at Heritage Oaks | | Corsicana, TX | | — | | | 143 | | 143 | | | 11,429 | | 11,429 | | | 482 | | 482 | | | | | 143 | | | | 143 | | | 11,911 | | 11,911 | | | 12,054 | | 12,054 | | | (1,619) | | (1,619) | | | 2007 | | 2007 | | 2019 |
| CTR Partnership, L.P. | CTR Partnership, L.P. | | City Creek Post-Acute and Assisted Living | | Sacramento, CA | | — | | | 3,980 | | | 10,106 | | | 1,488 | | | | | 3,980 | | | 11,594 | | | 15,574 | | | (1,075) | | | 1990 | | 2019 | CTR Partnership, L.P. | | City Creek Post-Acute and Assisted Living | | Sacramento, CA | | — | | | 3,980 | | 3,980 | | | 10,106 | | 10,106 | | | 1,488 | | 1,488 | | | | | 3,980 | | | | 3,980 | | | 11,594 | | 11,594 | | | 15,574 | | 15,574 | | | (1,494) | | (1,494) | | | 1990 | | 1990 | | 2019 |
| CTR Partnership, L.P. | CTR Partnership, L.P. | | Crestwood Health and Rehabilitation Center | | Wills Point, TX | | — | | | 143 | | | 6,075 | | | — | | | | | 143 | | | 6,075 | | | 6,218 | | | (368) | | | 1980 | | 2020 | CTR Partnership, L.P. | | Crestwood Health and Rehabilitation Center | | Wills Point, TX | | — | | | 143 | | 143 | | | 6,075 | | 6,075 | | | — | | — | | | | | 143 | | | | 143 | | | 6,075 | | 6,075 | | | 6,218 | | 6,218 | | | (538) | | (538) | | | 1980 | | 1980 | | 2020 |
| Northshore Healthcare Holdings LLC | Northshore Healthcare Holdings LLC | | San Juan Capistrano Senior Living | | San Juan Capistrano, CA | | — | | | 11,176 | | | 25,298 | | | — | | | | | 11,176 | | | 25,298 | | | 36,474 | | | (1,205) | | | 1999 | | 2021 | Northshore Healthcare Holdings LLC | | San Juan Capistrano Senior Living | | San Juan Capistrano, CA | | — | | | 11,176 | | 11,176 | | | 25,298 | | 25,298 | | | 350 | | 350 | | | | | 11,176 | | | | 11,176 | | | 25,648 | | 25,648 | | | 36,824 | | 36,824 | | | (1,923) | | (1,923) | | | 1999 | | 1999 | | 2021 |
| Northshore Healthcare Holdings LLC | Northshore Healthcare Holdings LLC | | Camarillo Senior Living | | Camarillo, CA | | — | | | 7,516 | | | 30,552 | | | — | | | | | 7,516 | | | 30,552 | | | 38,068 | | | (1,441) | | | 2000 | | 2021 | Northshore Healthcare Holdings LLC | | Camarillo Senior Living | | Camarillo, CA | | — | | | 7,516 | | 7,516 | | | 30,552 | | 30,552 | | | — | | — | | | | | 7,516 | | | | 7,516 | | | 30,552 | | 30,552 | | | 38,068 | | 38,068 | | | (2,227) | | (2,227) | | | 2000 | | 2000 | | 2021 |
| Northshore Healthcare Holdings LLC | Northshore Healthcare Holdings LLC | | Bayshire Carlsbad | | Carlsbad, CA | | — | | | 7,398 | | | 19,714 | | | — | | | | | 7,398 | | | 19,714 | | | 27,112 | | | (944) | | | 1999 | | 2021 | Northshore Healthcare Holdings LLC | | Bayshire Carlsbad | | Carlsbad, CA | | — | | | 7,398 | | 7,398 | | | 19,714 | | 19,714 | | | — | | — | | | | | 7,398 | | | | 7,398 | | | 19,714 | | 19,714 | | | 27,112 | | 27,112 | | | (1,459) | | (1,459) | | | 1999 | | 1999 | | 2021 |
| Northshore Healthcare Holdings LLC | Northshore Healthcare Holdings LLC | | Bayshire Rancho Mirage | | Rancho Mirage, CA | | — | | | 4,024 | | | 16,790 | | | — | | | | | 4,024 | | | 16,790 | | | 20,814 | | | (820) | | | 2000 | | 2021 | Northshore Healthcare Holdings LLC | | Bayshire Rancho Mirage | | Rancho Mirage, CA | | — | | | 4,024 | | 4,024 | | | 16,790 | | 16,790 | | | — | | — | | | | | 4,024 | | | | 4,024 | | | 16,790 | | 16,790 | | | 20,814 | | 20,814 | | | (1,267) | | (1,267) | | | 2000 | | 2000 | | 2021 |
| CTR Partnership, L.P. | CTR Partnership, L.P. | | Imboden Creek Living Center | | Decatur, IL | | — | | | 131 | | | 12,499 | | | 81 | | | | | 131 | | | 12,580 | | | 12,711 | | | (289) | | | 2003 | | 2022 | CTR Partnership, L.P. | | Imboden Creek Living Center | | Decatur, IL | | — | | | 131 | | 131 | | | 12,499 | | 12,499 | | | 91 | | 91 | | | | | 131 | | | | 131 | | | 12,590 | | 12,590 | | | 12,721 | | 12,721 | | | (644) | | (644) | | | 2003 | | 2003 | | 2022 |
| — | | | 55,670 | | | 281,386 | | | 10,524 | | | | | 55,670 | | | 291,910 | | | 347,580 | | | (40,159) | | |
| 4075 54th Street, LLC | | 4075 54th Street, LLC | | Jacob Healthcare Center | | San Diego , CA | | — | | | 4,949 | | | 20,227 | | | — | | | | | 4,949 | | | 20,227 | | | 25,176 | | | (308) | | | 1994 | | 2023 |
| | | | | | — | |
| Assisted and Independent Living Properties: | Assisted and Independent Living Properties: | | | | | | | | | | | | | | | | | | | |
| Assisted and Independent Living Properties: | |
| Assisted and Independent Living Properties: | |
| Avenue N Holdings LLC | |
| Avenue N Holdings LLC | |
| Avenue N Holdings LLC | Avenue N Holdings LLC | | Cambridge ALF | | Rosenburg, TX | | — | | | 124 | | | 2,301 | | | 392 | | | | | 124 | | | 2,693 | | | 2,817 | | | (1,533) | | | 2007 | | 2006 | | Cambridge ALF | | Rosenburg, TX | | — | | | 124 | | 124 | | | 2,301 | | 2,301 | | | 392 | | 392 | | | | | 124 | | | | 124 | | | 2,693 | | 2,693 | | | 2,817 | | 2,817 | | | (1,613) | | (1,613) | | | 2007 | | 2007 | | 2006 |
| Moenium Holdings LLC | Moenium Holdings LLC | | Grand Court | | Mesa, AZ | | — | | | 1,893 | | | 5,268 | | | 1,210 | | | | | 1,893 | | | 6,478 | | | 8,371 | | | (3,888) | | | 1986 | | 2007 | Moenium Holdings LLC | | Grand Court | | Mesa, AZ | | — | | | 1,893 | | 1,893 | | | 5,268 | | 5,268 | | | 1,210 | | 1,210 | | | | | 1,893 | | | | 1,893 | | | 6,478 | | 6,478 | | | 8,371 | | 8,371 | | | (4,100) | | (4,100) | | | 1986 | | 1986 | | 2007 |
| Lafayette Health Holdings LLC | Lafayette Health Holdings LLC | | Chateau Des Mons | | Englewood, CO | | — | | | 420 | | | 1,160 | | | 189 | | | | | 420 | | | 1,349 | | | 1,769 | | | (508) | | | 2011 | | 2009 | Lafayette Health Holdings LLC | | Chateau Des Mons | | Englewood, CO | | — | | | 420 | | 420 | | | 1,160 | | 1,160 | | | 189 | | 189 | | | | | 420 | | | | 420 | | | 1,349 | | 1,349 | | | 1,769 | | 1,769 | | | (546) | | (546) | | | 2011 | | 2011 | | 2009 |
| Expo Park Health Holdings LLC | Expo Park Health Holdings LLC | | Canterbury Gardens | | Aurora, CO | | — | | | 570 | | | 1,692 | | | 248 | | | | | 570 | | | 1,940 | | | 2,510 | | | (1,022) | | | 1986 | | 2010 | Expo Park Health Holdings LLC | | Canterbury Gardens | | Aurora, CO | | — | | | 570 | | 570 | | | 1,692 | | 1,692 | | | 248 | | 248 | | | | | 570 | | | | 570 | | | 1,940 | | 1,940 | | | 2,510 | | 2,510 | | | (1,102) | | (1,102) | | | 1986 | | 1986 | | 2010 |
| Wisteria Health Holdings LLC | Wisteria Health Holdings LLC | | Wisteria IND | | Abilene, TX | | — | | | 244 | | | 3,241 | | | 81 | | | | | 244 | | | 3,322 | | | 3,566 | | | (1,860) | | | 2008 | | 2011 | Wisteria Health Holdings LLC | | Wisteria IND | | Abilene, TX | | — | | | 244 | | 244 | | | 3,241 | | 3,241 | | | 81 | | 81 | | | | | 244 | | | | 244 | | | 3,322 | | 3,322 | | | 3,566 | | 3,566 | | | (2,045) | | (2,045) | | | 2008 | | 2008 | | 2011 |
| Everglades Health Holdings LLC | Everglades Health Holdings LLC | | Lexington | | Ventura, CA | | — | | | 1,542 | | | 4,012 | | | 113 | | | | | 1,542 | | | 4,125 | | | 5,667 | | | (1,059) | | | 1990 | | 2011 | Everglades Health Holdings LLC | | Lexington | | Ventura, CA | | — | | | 1,542 | | 1,542 | | | 4,012 | | 4,012 | | | 113 | | 113 | | | | | 1,542 | | | | 1,542 | | | 4,125 | | 4,125 | | | 5,667 | | 5,667 | | | (1,141) | | (1,141) | | | 1990 | | 1990 | | 2011 |
| Flamingo Health Holdings LLC | Flamingo Health Holdings LLC | | Desert Springs ALF | | Las Vegas, NV | | — | | | 908 | | | 4,767 | | | 281 | | | | | 908 | | | 5,048 | | | 5,956 | | | (3,022) | | | 1986 | | 2011 | Flamingo Health Holdings LLC | | Desert Springs ALF | | Las Vegas, NV | | — | | | 908 | | 908 | | | 4,767 | | 4,767 | | | 281 | | 281 | | | | | 908 | | | | 908 | | | 5,048 | | 5,048 | | | 5,956 | | 5,956 | | | (3,267) | | (3,267) | | | 1986 | | 1986 | | 2011 |
| 18th Place Health Holdings LLC | 18th Place Health Holdings LLC | | Rose Court | | Phoenix, AZ | | — | | | 1,011 | | | 2,053 | | | 490 | | | | | 1,011 | | | 2,543 | | | 3,554 | | | (1,142) | | | 1974 | | 2011 | 18th Place Health Holdings LLC | | Rose Court | | Phoenix, AZ | | — | | | 1,011 | | 1,011 | | | 2,053 | | 2,053 | | | 490 | | 490 | | | | | 1,011 | | | | 1,011 | | | 2,543 | | 2,543 | | | 3,554 | | 3,554 | | | (1,238) | | (1,238) | | | 1974 | | 1974 | | 2011 |
| Boardwalk Health Holdings LLC | Boardwalk Health Holdings LLC | | Park Place | | Reno, NV | | — | | | 367 | | | 1,633 | | | 52 | | | | | 367 | | | 1,685 | | | 2,052 | | | (625) | | | 1993 | | 2012 | Boardwalk Health Holdings LLC | | Park Place | | Reno, NV | | — | | | 367 | | 367 | | | 1,633 | | 1,633 | | | 52 | | 52 | | | | | 367 | | | | 367 | | | 1,685 | | 1,685 | | | 2,052 | | 2,052 | | | (679) | | (679) | | | 1993 | | 1993 | | 2012 |
| Willows Health Holdings LLC | | Willows Health Holdings LLC | | Cascade Plaza | | Redmond, WA | | — | | | 2,835 | | | 3,784 | | | 395 | | | | | 2,835 | | | 4,179 | | | 7,014 | | | (1,648) | | | 2013 |
| Lockwood Health Holdings LLC | | Lockwood Health Holdings LLC | | Santa Maria | | Santa Maria, CA | | — | | | 1,792 | | | 2,253 | | | 585 | | | | | 1,792 | | | 2,838 | | | 4,630 | | | (1,707) | | | 1967 | | 2013 |
| Saratoga Health Holdings LLC | | Saratoga Health Holdings LLC | | Lake Ridge | | Orem, UT | | — | | | 444 | | | 2,265 | | | 176 | | | | | 444 | | | 2,441 | | | 2,885 | | | (630) | | | 1995 | | 2013 |
| Sky Holdings AZ LLC | | Sky Holdings AZ LLC | | Desert Sky Assisted Living | | Glendale, AZ | | — | | | 61 | | | 304 | | | 372 | | | | | 61 | | | 676 | | | 737 | | | (546) | | | 2004 | | 2002 |
| Lemon River Holdings LLC | | Lemon River Holdings LLC | | The Grove Assisted Living | | Riverside, CA | | — | | | 342 | | | 802 | | | 3,360 | | | | | 342 | | | 4,162 | | | 4,504 | | | (3,397) | | | 2012 | | 2009 |
| Mission CCRC LLC | | Mission CCRC LLC | | St. Joseph's Villa IND | | Salt Lake City, UT | | — | | | 411 | | | 2,312 | | | 258 | | | | | 411 | | | 2,570 | | | 2,981 | | | (1,947) | | | 1994 | | 2011 |
| CTR Partnership, L.P. | | CTR Partnership, L.P. | | Prelude Cottages of Woodbury | | Woodbury, MN | | — | | | 430 | | | 6,714 | | | 289 | | | | | 430 | | | 7,003 | | | 7,433 | | | (1,539) | | | 2011 | | 2014 |
|
SCHEDULE III
REAL ESTATE ASSETS AND ACCUMULATED DEPRECIATION
DECEMBER 31, 20222023
(dollars in thousands)
| | Willows Health Holdings LLC | | Cascade Plaza | | Redmond, WA | | — | | | 2,835 | | | 3,784 | | | 395 | | | | | 2,835 | | | 4,179 | | | 7,014 | | | (1,500) | | | 2013 | | 2013 |
| Lockwood Health Holdings LLC | | Santa Maria | | Santa Maria, CA | | — | | | 1,792 | | | 2,253 | | | 585 | | | | | 1,792 | | | 2,838 | | | 4,630 | | | (1,560) | | | 1967 | | 2013 |
| Saratoga Health Holdings LLC | | Lake Ridge | | Orem, UT | | — | | | 444 | | | 2,265 | | | 176 | | | | | 444 | | | 2,441 | | | 2,885 | | | (576) | | | 1995 | | 2013 |
| Sky Holdings AZ LLC | | Desert Sky Assisted Living | | Glendale, AZ | | — | | | 61 | | | 304 | | | 372 | | | | | 61 | | | 676 | | | 738 | | | (520) | | | 2004 | | 2002 |
| Lemon River Holdings LLC | | The Grove Assisted Living | | Riverside, CA | | — | | | 342 | | | 802 | | | 3,360 | | | | | 342 | | | 4,162 | | | 4,504 | | | (3,156) | | | 2012 | | 2009 |
| Mission CCRC LLC | | St. Joseph's Villa IND | | Salt Lake City, UT | | — | | | 411 | | | 2,312 | | | 258 | | | | | 411 | | | 2,570 | | | 2,981 | | | (1,778) | | | 1994 | | 2011 |
| CTR Partnership, L.P. | | Prelude Cottages of Woodbury | | Woodbury, MN | | — | | | 430 | | | 6,714 | | | 76 | | | | | 430 | | | 6,790 | | | 7,220 | | | (1,352) | | | 2011 | | 2014 |
| | CTR Partnership, L.P. | CTR Partnership, L.P. | | Lamplight Inn of West Allis | | West Allis, WI | | — | | | 97 | | | 6,102 | | | 106 | | | | | 77 | | | 4,181 | | | 4,258 | | | — | | | 2013 | | 2016 |
| | CTR Partnership, L.P. | |
| CTR Partnership, L.P. | CTR Partnership, L.P. | | Fort Myers Assisted Living | | Fort Myers, FL | | — | | | 1,489 | | | 3,531 | | | 1,006 | | | | | 1,489 | | | 4,537 | | | 6,026 | | | (712) | | | 1980 | | 2016 | | Fort Myers Assisted Living | | Fort Myers, FL | | — | | | 1,489 | | 1,489 | | | 3,531 | | 3,531 | | | 5,864 | | 5,864 | | | | | 1,489 | | | | 1,489 | | | 9,395 | | 9,395 | | | 10,884 | | 10,884 | | | (869) | | (869) | | | 2023 | | 2023 | | 2016 |
| | CTR Partnership, L.P. | CTR Partnership, L.P. | | Croatan Village | | New Bern, NC | | — | | | 312 | | | 6,919 | | | — | | | | | 301 | | | 5,663 | | | 5,964 | | | — | | | 2010 | | 2016 |
| CTR Partnership, L.P. | CTR Partnership, L.P. | | Countryside Village | | Pikeville, NC | | — | | | 131 | | | 4,157 | | | — | | | | | 125 | | | 3,402 | | | 3,527 | | | — | | | 2011 | | 2016 |
| CTR Partnership, L.P. | CTR Partnership, L.P. | | The Pines of Clarkston | | Village of Clarkston, MI | | — | | | 603 | | | 9,326 | | | — | | | | | 522 | | | 5,329 | | | 5,851 | | | — | | | 2010 | | 2016 | | Croatan Village | | New Bern, NC | | — | | | 312 | | 312 | | | 6,919 | | 6,919 | | | 155 | | 155 | | | | | 299 | | | | 299 | | | 5,820 | | 5,820 | | | 6,119 | | 6,119 | | | (172) | | (172) | | | 2010 | | 2010 | | 2016 |
| CTR Partnership, L.P. | CTR Partnership, L.P. | | The Pines of Goodrich | | Goodrich, MI | | — | | | 241 | | | 4,112 | | | 459 | | | | | 207 | | | 3,862 | | | 4,069 | | | — | | | 2014 | | 2016 | CTR Partnership, L.P. | | Countryside Village | | Pikeville, NC | | — | | | 131 | | 131 | | | 4,157 | | 4,157 | | | — | | — | | | | | 125 | | | | 125 | | | 3,404 | | 3,404 | | | 3,529 | | 3,529 | | | (102) | | (102) | | | 2011 | | 2011 | | 2016 |
| CTR Partnership, L.P. | CTR Partnership, L.P. | | The Pines of Burton | | Burton, MI | | — | | | 492 | | | 9,199 | | | — | | | | | 426 | | | 7,751 | | | 8,177 | | | — | | | 2014 | | 2016 | CTR Partnership, L.P. | | The Pines of Clarkston | | Village of Clarkston, MI | | — | | | 603 | | 603 | | | 9,326 | | 9,326 | | | 6 | | 6 | | | | | 523 | | | | 523 | | | 5,334 | | 5,334 | | | 5,857 | | 5,857 | | | (160) | | (160) | | | 2010 | | 2010 | | 2016 |
| CTR Partnership, L.P. | CTR Partnership, L.P. | | The Pines of Lapeer | | Lapeer, MI | | — | | | 302 | | | 5,773 | | | — | | | | | 261 | | | 4,066 | | | 4,327 | | | — | | | 2008 | | 2016 | CTR Partnership, L.P. | | The Pines of Goodrich | | Goodrich, MI | | — | | | 241 | | 241 | | | 4,112 | | 4,112 | | | 923 | | 923 | | | | | 207 | | | | 207 | | | 4,327 | | 4,327 | | | 4,534 | | 4,534 | | | (122) | | (122) | | | 2014 | | 2014 | | 2016 |
| CTR Partnership, L.P. | CTR Partnership, L.P. | | Arbor Place | | Lodi, CA | | — | | | 392 | | | 3,605 | | | — | | | | | 392 | | | 3,605 | | | 3,997 | | | (578) | | | 1984 | | 2016 | CTR Partnership, L.P. | | The Pines of Burton | | Burton, MI | | — | | | 492 | | 492 | | | 9,199 | | 9,199 | | | 93 | | 93 | | | | | 426 | | | | 426 | | | 7,843 | | 7,843 | | | 8,269 | | 8,269 | | | (237) | | (237) | | | 2014 | | 2014 | | 2016 |
| CTR Partnership, L.P. | CTR Partnership, L.P. | | Applewood of Brookfield | | Brookfield, WI | | — | | | 493 | | | 14,002 | | | 39 | | | | | 241 | | | 6,026 | | | 6,267 | | | — | | | 2013 | | 2017 | CTR Partnership, L.P. | | The Pines of Lapeer | | Lapeer, MI | | — | | | 302 | | 302 | | | 5,773 | | 5,773 | | | — | | — | | | | | 261 | | | | 261 | | | 4,066 | | 4,066 | | | 4,327 | | 4,327 | | | (122) | | (122) | | | 2008 | | 2008 | | 2016 |
| CTR Partnership, L.P. | CTR Partnership, L.P. | | Applewood of New Berlin | | New Berlin, WI | | — | | | 356 | | | 10,812 | | | — | | | | | 190 | | | 5,033 | | | 5,223 | | | — | | | 2016 | | 2017 | CTR Partnership, L.P. | | Arbor Place | | Lodi, CA | | — | | | 392 | | 392 | | | 3,605 | | 3,605 | | | — | | — | | | | | 392 | | | | 392 | | | 3,605 | | 3,605 | | | 3,997 | | 3,997 | | | (668) | | (668) | | | 1984 | | 1984 | | 2016 |
| CTR Partnership, L.P. | | CTR Partnership, L.P. | | Applewood of Brookfield | | Brookfield, WI | | — | | | 493 | | | 14,002 | | | 44 | | | | | 242 | | | 6,030 | | | 6,272 | | | (178) | | | 2013 | | 2017 |
| CTR Partnership, L.P. | | CTR Partnership, L.P. | | Applewood of New Berlin | | New Berlin, WI | | — | | | 356 | | | 10,812 | | | 50 | | | | | 189 | | | 5,083 | | | 5,272 | | | (148) | | | 2016 | | 2017 |
| | CTR Partnership, L.P. | |
| CTR Partnership, L.P. | |
| CTR Partnership, L.P. | | | Memory Care Cottages in White Bear Lake | | White Bear Lake, MN | | — | | | 1,611 | | | 5,633 | | | — | | | | | 1,611 | | | 5,633 | | | 7,244 | | | (915) | | | 2016 | | 2017 |
| | | CTR Partnership, L.P. | CTR Partnership, L.P. | | Memory Care Cottages in White Bear Lake | | White Bear Lake, MN | | — | | | 1,611 | | | 5,633 | | | — | | | | | 1,611 | | | 5,633 | | | 7,244 | | | (775) | | | 2016 | | 2017 |
| | | CTR Partnership, L.P. | |
| | CTR Partnership, L.P. | CTR Partnership, L.P. | | Vista Del Lago | | Escondido, CA | | — | | | 4,362 | | | 7,997 | | | — | | | | | 4,362 | | | 7,997 | | | 12,359 | | | (698) | | | 2015 | | 2019 | | Vista Del Lago | | Escondido, CA | | — | | | 4,362 | | 4,362 | | | 7,997 | | 7,997 | | | — | | — | | | | | 4,362 | | | | 4,362 | | | 7,997 | | 7,997 | | | 12,359 | | 12,359 | | | (908) | | (908) | | | 2015 | | 2015 | | 2019 |
| CTR Partnership, L.P. | CTR Partnership, L.P. | | Inn at Barton Creek | | Bountiful, UT | | — | | | 2,480 | | | 4,804 | | | 15 | | | | | 2,480 | | | 4,819 | | | 7,299 | | | (380) | | | 1999 | | 2020 | CTR Partnership, L.P. | | Inn at Barton Creek | | Bountiful, UT | | — | | | 2,480 | | 2,480 | | | 4,804 | | 4,804 | | | 15 | | 15 | | | | | 2,480 | | | | 2,480 | | | 4,819 | | 4,819 | | | 7,299 | | 7,299 | | | (510) | | (510) | | | 1999 | | 1999 | | 2020 |
| CTR Partnership, L.P. | CTR Partnership, L.P. | | Bridgeton Essentia Neighborhood | | Bridgeton, NJ | | — | | | 245 | | | 5,795 | | | — | | | | | 190 | | | 4,510 | | | 4,700 | | | (33) | | | 2021 | | 2021 | CTR Partnership, L.P. | | Bridgeton Essentia Neighborhood | | Bridgeton, NJ | | — | | | 245 | | 245 | | | 5,795 | | 5,795 | | | — | | — | | | | | 190 | | | | 190 | | | 4,509 | | 4,509 | | | 4,699 | | 4,699 | | | (166) | | (166) | | | 2021 | | 2021 |
| CTR Partnership, L.P. | CTR Partnership, L.P. | | Rio Grande Essentia Neighborhood | | Rio Grande, NJ | | — | | | 224 | | | 5,652 | | | — | | | | | 224 | | | 5,652 | | | 5,876 | | | (169) | | | 2021 | | 2021 | CTR Partnership, L.P. | | Rio Grande Essentia Neighborhood | | Rio Grande, NJ | | — | | | 224 | | 224 | | | 5,652 | | 5,652 | | | — | | — | | | | | 224 | | | | 224 | | | 5,652 | | 5,652 | | | 5,876 | | 5,876 | | | (325) | | (325) | | | 2021 | | 2021 |
| — | | | 27,224 | | | 155,677 | | | 10,345 | | | | | 26,492 | | | 139,044 | | | 165,537 | | | (29,108) | | |
| — | | | $ | 241,304 | | | $ | 1,392,128 | | | $ | 118,249 | | | | | $ | 238,738 | | | $ | 1,483,133 | | | $ | 1,721,871 | | | $ | (315,914) | | |
| CTR Partnership, L.P. | | CTR Partnership, L.P. | | Chapters Living of Northwest Chicago | | Bartlett , IL | | — | | | 1,964 | | | 5,650 | | | — | | | | | 1,964 | | | 5,650 | | | 7,614 | | | (106) | | | 2017 | | 2023 |
| CTR Partnership, L.P. | | CTR Partnership, L.P. | | Chapters Living of Elmhurst | | Elmhurst , IL | | — | | | 2,852 | | | 7,348 | | | — | | | | | 2,852 | | | 7,348 | | | 10,200 | | | (135) | | | 2017 | | 2023 |
| CTR Partnership, L.P. | | CTR Partnership, L.P. | | The Ridge at Lansing | | Lansing , MI | | — | | | 888 | | | 9,871 | | | — | | | | | 888 | | | 9,871 | | | 10,759 | | | (163) | | | 2018 | | 2023 |
| CTR Partnership, L.P. | | CTR Partnership, L.P. | | The Ridge at Beavercreek | | Beavercreek , OH | | — | | | 1,165 | | | 8,616 | | | — | | | | | 1,165 | | | 8,616 | | | 9,781 | | | (140) | | | 2018 | | 2023 |
| | | | | | — | |
| | | | | | — | |
| | | | | | — | |
| | | | | | — | |
(1) The aggregate cost of real estate for federal income tax purposes was $1.71.9 billion.
SCHEDULE III
REAL ESTATE ASSETS AND ACCUMULATED DEPRECIATION
DECEMBER 31, 20222023
(dollars in thousands)
| | | | | Year Ended December 31, | | | Year Ended December 31, |
| Real estate: | Real estate: | | 2022 | | 2021 | | 2020 | Real estate: | | 2023 | | 2022 | | 2021 |
| Balance at the beginning of the period | Balance at the beginning of the period | | $ | 1,873,806 | | | $ | 1,683,205 | | | $ | 1,605,081 | |
| Acquisitions | Acquisitions | | 21,252 | | | 190,133 | | | 84,630 | |
| Improvements | Improvements | | 5,896 | | | 4,521 | | | 7,223 | |
| | Impairment | Impairment | | (29,803) | | | — | | | — | |
| Impairment | |
| Impairment | |
| Sales and/or transfers to assets held for sale, net | Sales and/or transfers to assets held for sale, net | | (149,280) | | | (4,053) | | | (13,729) | |
| Balance at the end of the period | Balance at the end of the period | | $ | 1,721,871 | | | $ | 1,873,806 | | | $ | 1,683,205 | |
| Accumulated depreciation: | Accumulated depreciation: | | | | | | |
| Balance at the beginning of the period | |
| Balance at the beginning of the period | |
| Balance at the beginning of the period | Balance at the beginning of the period | | $ | (304,785) | | | $ | (259,803) | | | $ | (220,359) | |
| Depreciation expense | Depreciation expense | | (42,131) | | | (45,498) | | | (41,914) | |
| Impairment | Impairment | | 10,232 | | | — | | | — | |
| Sales and/or transfers to assets held for sale, net | Sales and/or transfers to assets held for sale, net | | 20,770 | | | 516 | | | 2,470 | |
| Balance at the end of the period | Balance at the end of the period | | $ | (315,914) | | | $ | (304,785) | | | $ | (259,803) | |
SCHEDULE IV
MORTGAGE LOANS ON REAL ESTATE
DECEMBER 31, 20222023
(dollars in thousands)
| | Description | Description | | Contractual Interest Rate | | Maturity Date | | Periodic Payment Terms | | Prior Liens | | Principal Balance | | Book Value (1) | | Carrying Amount of Loans Subject to Delinquent Principal or Interest | Description | | Contractual Interest Rate | | Maturity Date | | Periodic Payment Terms | | Prior Liens | | Principal Balance | | Book Value (1) | | Carrying Amount of Loans Subject to Delinquent Principal or Interest |
| | Mortgage Secured Loans: | Mortgage Secured Loans: | |
| Mortgage Secured Loans: | |
| Mortgage Secured Loans: | |
| West Virginia (18 SNF facilities) | West Virginia (18 SNF facilities) | | 8.4 | % | | 2027 | | (3) | | $ | 482,000 | | (4) | $ | 75,000 | | | $ | 72,543 | | | N/A |
| California (5 SNF facilities) | | 10.2 | % | (2) | 2025 | | (3) | | 53,400 | | (5) | 22,250 | | | 21,345 | | | N/A |
| West Virginia (18 SNF facilities) | |
| West Virginia (18 SNF facilities) | | | 8.4 | % | | 2027 | | (3) | | $ | 482,000 | | (4) | $ | 75,000 | | | $ | 68,913 | | | N/A |
| California (4 SNF facilities) | | California (4 SNF facilities) | | 10.7 | % | (2) | 2025 | | (3) | | 28,112 | | (5) | 11,713 | | | 11,501 | | | N/A |
| Georgia (4 SNF facilities) | Georgia (4 SNF facilities) | | 9.0 | % | (2) | 2025 | | (3) | | 72,700 | | (5) | 24,900 | | | 23,796 | | | N/A | Georgia (4 SNF facilities) | | 9.0 | % | (2) | 2025 | | (3) | | 72,700 | | (5) | (5) | 24,900 | | | 22,962 | | 22,962 | | | N/A | | N/A |
| Florida (2 SNF facilities) | | Florida (2 SNF facilities) | | 9.0 | % | | 2028 | | (3) | | — | | | 15,727 | | | 15,399 | | | N/A |
| California (3 SNF facilities) | | California (3 SNF facilities) | | 12.0 | % | | 2026 | | (3) | | 30,294 | | (6) | 3,564 | | | 3,439 | | | N/A |
| Indiana (1 ALF facility) | | Indiana (1 ALF facility) | | 9.0 | % | | 2024 | | (3) | | — | | | 2,000 | | | 2,016 | | | N/A |
| California (2 SNF Campus & ILF facility) | | California (2 SNF Campus & ILF facility) | | 9.0 | % | | 2033 | | (3) | | — | | | 25,993 | | | 26,194 | | | N/A |
| California (1 ALF facility) | | California (1 ALF facility) | | 9.9 | % | | 2026 | | (3) | | — | | | 6,300 | | | 6,345 | | | N/A |
| Mezzanine Loans: | Mezzanine Loans: | |
| West Virginia (18 SNF facilities) | West Virginia (18 SNF facilities) | | 11.0 | % | | 2032 | | (3) | | 557,000 | | (4) | 25,000 | | | 24,012 | | | N/A |
| Virginia (9 SNF facilities) | | 12.0 | % | | 2025 | | (3) | | 114,309 | | (6) | 15,000 | | | 14,672 | | | N/A |
| $ | 1,279,409 | | | $ | 162,150 | | | $ | 156,368 | | |
| West Virginia (18 SNF facilities) | |
| West Virginia (18 SNF facilities) | | | 11.0 | % | | 2032 | | (3) | | 557,000 | | (4) | 25,000 | | | 21,799 | | | N/A |
| | | | | | | | $ | |
(1) The aggregate cost for federal income tax purposes was $162.2$190.2 million as of December 31, 2022.2023.
(2)Interest rates are variable and represent the rate in effect as of December 31, 2022.2023.
(3)Interest is due monthly, and principal is due at the maturity date.
(4)The secured term loan was structured with an “A” tranche, a “B” tranche, and a “C” tranche, with the “C” tranche being the most subordinate. The Company’s loan constituted the entirety of the “C” tranche. The Company also extended a mezzanine loan to the borrower group. Accordingly, the amounts of the prior liens at December 31, 20222023 are estimated.
(5)The secured term loan was structured with an “A” and a “B” tranche, with the “B” tranche being subordinate to the “A” tranche pursuant to the terms of a written agreement between the lenders. The Company’s loan constituted the entirety of the “B” tranche. Accordingly, the amounts of the prior liens at December 31, 20222023 are estimated.
(6)The first mortgage loans on these properties are not held by the Company. Accordingly, the amounts of the prior liens at December 31, 20222023 are estimated.
SCHEDULE IV
MORTGAGE LOANS ON REAL ESTATE
DECEMBER 31, 2023
(dollars in thousands)
Changes in mortgage secured and mezzanine loans are summarized as follows (in thousands):
| | Year Ended December 31, |
| 2022 | | 2021 | | 2020 |
| | Year Ended December 31, | | | | Year Ended December 31, |
| | 2023 | | | | 2023 | | 2022 | | 2021 |
| | Balance at beginning of period | Balance at beginning of period | | $ | 15,155 | | | $ | 15,000 | | | $ | 29,500 | |
| Balance at beginning of period | |
| Balance at beginning of period | |
| Additions during period: | Additions during period: | |
| | New mortgage and mezzanine loans | |
| | New mortgage and mezzanine loans | |
| | New mortgage and mezzanine loans | New mortgage and mezzanine loans | | 147,150 | | | — | | | 61,258 | |
| Interest income added to principal | Interest income added to principal | | 1,165 | | | 155 | | | — | |
| Deductions during period: | Deductions during period: | |
| Paydowns/Repayments | Paydowns/Repayments | | — | | | — | | | (75,758) | |
| Unrealized loss | | (7,102) | | |
| Paydowns/Repayments | |
| Paydowns/Repayments | |
| Unrealized losses, net | |
| Balance at end of period | Balance at end of period | | $ | 156,368 | | | $ | 15,155 | | | $ | 15,000 | |