UNITED STATES
SECURITIES AND EXCHANGE COMMISSION
Washington, D.C. 20549
FORM 10-K
(Mark One)
| | | | | |
| ☒ | ANNUAL REPORT PURSUANT TO SECTION 13 OR 15(d) OF THE SECURITIES EXCHANGE ACT OF 1934 |
For the fiscal year ended December 31, 20212023
OR
| | | | | |
| ☐ | TRANSITION REPORT PURSUANT TO SECTION 13 OR 15(d) OF THE SECURITIES EXCHANGE ACT OF 1934 |
For the transition period from to
Commission File No. 001-36876
BABCOCK & WILCOX ENTERPRISES, INC.
(Exact name of registrant as specified in its charter)
| | | | | | | | |
| Delaware | | 47-2783641 |
| (State or other Jurisdiction of Incorporation or Organization) | | (I.R.S. Employer Identification No.) |
|
| 1200 East Market Street, Suite 650 | | |
| Akron, Ohio | | 44305 |
| (Address of Principal Executive Offices) | | (Zip Code) |
Registrant's Telephone Number, Including Area Code: (330) 753-4511
Securities registered pursuant to Section 12(b) of the Act:
| | | | | | | | |
| Title of each class | Trading Symbol(s) | Name of each exchange on which registered |
| Common Stock, $0.01 par value | BW | New York Stock Exchange |
| 8.125% Senior Notes due 2026 | BWSN | New York Stock Exchange |
| 6.50% Senior Notes due 2026 | BWNB | New York Stock Exchange |
| 7.75% Series A Cumulative Perpetual Preferred Stock | BW PRA | New York Stock Exchange |
Indicate by check mark if the registrant is a well-known seasoned issuer, as defined in Rule 405 of the Securities
Yes ☐ No ☒
Indicate by check mark if the registrant is not required to file reports pursuant to Section 13 or Section 15(d) of the Act.
Yes ☐ No ☒
Indicate by check mark whether the registrant (1) has filed all reports required to be filed by Section 13 or 15(d) of the Securities Exchange Act of 1934 during the preceding 12 months (or for such shorter period that the registrant was required to file such reports), and (2) has been subject to such filing requirements for the past 90 days. Yes ☒ No ☐
Indicate by check mark whether the registrant has submitted electronically every Interactive Data File required to be submitted pursuant to Rule 405 of Regulation S-T (§232.405 of this chapter) during the preceding 12 months (or for such shorter period that the registrant was required to submit such files). Yes ☒ No ☐
Indicate by check mark whether the registrant is a large accelerated filer, an accelerated filer, a non-accelerated filer, a smaller reporting company, or an emerging growth company. See the definitions of "large accelerated filer," "accelerated filer," "smaller reporting company," and "emerging growth company" in Rule 12b-2 of the Exchange Act.
| | | | | | | | | | | | | | | | | | | | |
| Large accelerated filer | | ☐ | | Accelerated filer | | ☒ |
| | | |
| Non-accelerated filer | | ☐ | | Smaller reporting company | | ☒☐ |
| | | | | | |
| | | | Emerging growth company | | ☐ |
If an emerging growth company, indicate by check mark if the registrant has elected not to use the extended transition period for complying with any new or revised financial accounting standards provided pursuant to Section 13(a) of the Exchange Act. ☐
Indicate by check mark whether the registrant has filed a report on and attestation to its management’s assessment of the effectiveness of its internal control over financial reporting under Section 404(b) of the Sarbanes-Oxley Act (15 U.S.C. 7262(b)) by the registered public accounting firm that prepared or issued its audit report. ☒
If securities are registered pursuant to Section 12(b) of the Act, indicate by check mark whether the financial statements of the registrant included in the filing reflect the correction of an error to previously issued financial statements. ☐
Indicate by check mark whether any of those error corrections are restatements that required a recovery analysis of incentive-based compensation received by any of the registrant's executive officers during the relevant recovery period pursuant to § 240.10D-1(b). ☐
Indicate by check mark whether the registrant is a shell company (as defined in Rule 12b-2 of the Exchange Act).
Yes ☐ No ☒
The aggregate market value of the registrant's common stock held by non-affiliates of the registrant on the last business day of the registrant's most recently completed second fiscal quarter (based on the closing sales price on the New York Stock Exchange on June 30, 2021)2023) was approximately $386.2 millionapproxima.tely $328.9 million.
The number of shares of the registrant's common stock outstanding at February 25, 2022March 8, 2024 was 86,334,082.89,480,435.
DOCUMENTS INCORPORATED BY REFERENCE
In accordance with General Instruction G(3) of Form 10-K, certain information required by Part III hereof will either be incorporated into this Form 10-K by reference to our Definitive Proxy Statement for our Annual Meeting of Shareholders filed within 120 days of December 31, 20212023 or will be included in an amendment to this Form 10-K filed within 120 days of December 31, 2021.
Definitions
In this Annual Report on Form 10-K, or this “Annual Report”, unless the context otherwise indicates, “B&W,” “we,” “us,” “our” or the “Company” mean Babcock & Wilcox Enterprises, Inc. and its consolidated subsidiaries. Unless otherwise noted, discussion of our business and results of operations in this Annual Report on Form 10-K refers to our continuing operations.
| | | | | | | | |
| Abbreviation or acronym | | Term |
| 2021 Plan | | Babcock & Wilcox Enterprises, Inc. 2021 Long-Term Incentive Plan |
| 6.50% Senior Notes | | 6.50% Senior Notes due December 31, 2026 issued by Babcock & Wilcox Enterprises, Inc. in 2021 |
| 8.125% Senior Notes | | 8.125% Senior Notes due February 28, 2026 issued by Babcock & Wilcox Enterprises, Inc. in 2021 |
| Amended Revolving Credit Agreement | | Amended Revolving Credit Agreement with PNC |
| AOCI | | Accumulated Other Comprehensive Income (loss) |
| ASC | | Accounting Standards Codification |
| ASU | | Accounting Standards Update |
| B&W Chanute | | Babcock & Wilcox Chanute, LLC, formerly known as Optimus Industries, LLC |
| B&W Renewable A/S | | Babcock & Wilcox Renewable Service A/S, formerly known as VODA A/S |
| B&W Solar | | Babcock & Wilcox Solar Energy, Inc., formerly known as Fosler Construction Company, Inc. |
| B. Riley | | B. Riley Financial, Inc and its affiliates, a related party |
| | |
| | |
| | |
| | |
| | |
| BWX or BWXT | | BWX Technologies, Inc., NYSE Ticker "BWXT" |
| | |
| | |
| | |
| | |
| | |
| | |
| | |
| Debt Documents | | Collectively, the Revolving Credit Agreement, Letter of Credit Agreement and Reimbursement Agreement |
| Debt Facilities | | The facilities available under the Debt Documents |
| | |
| DTAs | | Deferred Tax Assets |
| EBITDA | | Earnings before interest, taxes, depreciation and amortization |
| | |
| Exchange Act | | The Securities Exchange Act of 1934, as amended |
| | |
| FASB | | Financial Accounting Standards Board |
| | |
| FPS | | Fossil Power Systems, Inc. |
| GAAP | | Generally Accepted Accounting Principles in the United States of America |
| | |
| | |
| Hamon | | Hamon Research-Cottrell, Inc., a subsidiary of Hamon Holdings Corporation |
| Hamon Holdings | | Hamon Holdings Corporation, parent company of Hamon Research-Cottrell, Inc. |
| IRC | | U.S. Internal Revenue Code of 1986, as amended |
| | |
| Letter of Credit Agreement | | Letter of Credit agreement with PNC |
| LIBOR | | London Interbank Offered Rate |
| | |
| | |
| MTM | | Mark-to-Market |
| | |
| NOL | | Net operating losses |
| | |
| | |
| NYSE | | New York Stock Exchange |
| | |
| | |
| | |
| PNC | | PNC Bank, National Association |
| | |
| | |
| | |
| | |
| | |
| SEC | | United States Securities and Exchange Commission |
| | |
| SG&A | | Selling, general and administrative expenses |
| SOFR | | The Secured Overnight Financing Rate |
| | |
| | |
| | |
| | |
| | |
| | |
| | |
PART I
***** Cautionary Statement Concerning Forward-Looking Information *****
This Annual Report on Form 10-K, including Management's Discussion and Analysis of Financial Condition and Results of Operations, contains forward-looking statements within the meaning of Section 27A of the Securities Act of 1933 and Section 21E of the Securities Exchange Act of 1934. All statements other than statements of historical or current fact
included in this Annual Report are forward-looking statements. These forward-looking statements are made based upon detailed assumptions and reflect management's current expectations and beliefs. While we believe that these assumptions underlying the forward-looking statements are reasonable, forward-looking statements are subject to uncertainties and factors relating to our operations and business environment that are difficult to predict and may be beyond our control. Such uncertainties and factors may cause actual results to differ materially from those expressed or implied by the forward-looking statements. You should not place undue reliance on these statements. Forward-looking statements include words such as “expect,” “intend,” “plan,” “likely,” “seek,” “believe,” “project,” “forecast,” “target,” “goal,” “potential,” “estimate,” “may,” “might,” “will,” “would,” “should,” “could,” “can,” “have,” “due,” “anticipate,” “assume,” “contemplate,” “continue” and other words and terms of similar meaning in connection with any discussion of the timing or nature of future operational performance or other events.
These forward-looking statements are based on management’s current expectations and involve a number of risks and uncertainties, including, among other things, the impact of COVID-19 on us and the capital markets and global economic climate generally; our ability to integrate acquired businesses and the impact of those acquired businesses on our cash flows, results of operations and financial condition, including our recent acquisitions of Fosler Construction Company Inc., VODA A/S, Fossil Power Systems, Inc., and Optimus Industries, LLC; our recognition of any asset impairments as a result of any decline in the value of our assets or our efforts to dispose of any assets in the future; our ability to obtain and maintain sufficient financing to provide liquidity to meet our business objectives, surety bonds, letters of credit and similar financing; our ability to comply with the requirements of, and to service the indebtedness under, our debt facility agreements; our ability to pay dividends on our 7.75% Series A Cumulative Perpetual Preferred Stock; our ability to make interest payments on our 8.125% senior notes due 2026 and our 6.50% notes due 2026; the highly competitive nature of our businesses and our ability to win work, including identified project opportunities in our pipeline; general economic and business conditions, including changes in interest rates and currency exchange rates; cancellations of and adjustments to backlog and the resulting impact from using backlog as an indicator of future earnings; our ability to perform contracts on time and on budget, in accordance with the schedules and terms established by the applicable contracts with customers; failure by third-party subcontractors, partners or suppliers to perform their obligations on time and as specified; our ability to successfully resolve claims by vendors for goods and services provided and claims by customers for items under warranty; our ability to realize anticipated savings and operational benefits from our restructuring plans, and other cost savings initiatives; our ability to successfully address productivity and schedule issues in our B&W Renewable, B&W Environmental and B&W Thermal segments; our ability to successfully partner with third parties to win and execute contracts within our B&W Environmental, B&W Renewable and B&W Thermal segments; changes in our effective tax rate and tax positions, including any limitation on our ability to use our net operating loss carryforwards and other tax assets; our ability to successfully manage research and development projects and costs, including our efforts to successfully develop and commercialize new technologies and products; the operating risks normally incident to our lines of business, including professional liability, product liability, warranty and other claims against us; difficulties we may encounter in obtaining regulatory or other necessary permits or approvals; changes in actuarial assumptions and market fluctuations that affect our net pension liabilities and income; our ability to successfully compete with current and future competitors; our ability to negotiate and maintain good relationships with labor unions; changes in pension and medical expenses associated with our retirement benefit programs; social, political, competitive and economic situations in foreign countries where we do business or seek new business. These factors also include the cautionary statements included in this report and the risk factors set forth under Part I, Item 1A of this Annual Report.
These forward-looking statements are made based upon detailed assumptions and reflect management’s current expectations and beliefs. While we believe that these assumptions underlying the forward-looking statements are reasonable, we caution that it is very difficult to predict the impact of known factors, and it is impossible for us to anticipate all factors that could affect actual results.
The forward-looking statements included herein are made only as of the date hereof. We undertake no obligation to publicly update or revise any forward-looking statement as a result of new information, future events, or otherwise, except as required by law.
SUMMARY RISK FACTORS
Our business is subject to varying degrees of risk and uncertainty. Investors should consider the risks and uncertainties summarized below, as well as the full discussion of risks and uncertainties discussed in Part I, Item 1A, “Risk Factors” of this Annual Report on Form 10-K.Report. The summary below is provided for ease of reference, is not intended to reflect a complete explanation of
relevant risks and uncertainties and should be read together with the more detailed description of these risks and uncertainties in Part I, Item 1A, “Risk Factors” of this Annual Report on Form 10-K.Report. Additional risks not presently known to us or that we currently deem immaterial may also affect us. If any of these risks occur, our business, financial condition, results of operations or cash flows could be materially and adversely affected, and, as a result, the trading price for our common stock could decline.
Our business is subject to the following principal risks and uncertainties:
•Our business, financial condition and results of operations, and those ofraises substantial doubt as to our customers, suppliers and vendors, haveability to continue as a going concern, which we believe has been and continuealleviated by actions taken to be, adversely affected by COVID-19 outbreak and may be adversely affected by other similar outbreaks;address our liquidity needs.
•We are subject to risks associated with contractual pricing in our industry, including the risk that, if our actual costs exceed the costs we estimate on our fixed-price contracts, our profitability will decline, and we may suffer losses;
•Disputes with customers withunder long-term contracts could adversely affect our financial condition;
•Our contractual performance may be affected by third parties' and subcontractors' failure to meet schedule, quality and other requirements in our contracts, which could increase our costs, scope or, technical difficulty or in extreme cases, impede our ability to meet contractual requirements;
•A material disruption at one of our manufacturing facilities or a third-party manufacturing facility that we have engaged could adversely affect our ability to generate sales and result in increased costs;
•If our co-venturers fail to perform their contractual obligations on a contract or if we fail to coordinate effectively with our co-venturers, we could be exposed to legal liability, damage to reputation, reduced profit, or liquidity challenges;
•Our growth strategy includes strategic acquisitions, which we may not be able to consummate or successfully integrate;
•Our evaluation of strategic alternatives for certain businesses and non-core assets may not result in a successful transaction;
•Our backlog is subject to unexpected adjustments and cancellations and may not be a reliable indicator of future revenues or earnings;
•Our our inability to deliver our backlog on time could affect our future sales and profitability, and our relationships with our customers;
•Our operations are subject to operatingvarious risks, which could expose us to potentially significant professional liability, product liability, warranty and other claims. Our insurance coverage may be inadequate to cover all of our significant risks, our insurers may deny coverage of material losses we incur, or we may be unable to obtain additional insurance coverage in the future, any of which could adversely affect our profitability and overall financial condition;
•We may not be able to compete successfully against current and future competitors;
•If we fail to develop new products, or customers do not accept our new products,them, our business could be adversely affected;
•Our business, financial condition and results of operations, and those of our customers, suppliers and vendors, have been, and could continue to be, adversely affected by public health crises, including a pandemic;
•We derive substantial revenues from electric power generating companies and other steam-using industries, including coal-fired power plants in particular. Demand for our products and services depends on spending in these historically cyclical industries. Additionally, legislative and regulatory developments relating to clean air legislation are affecting industry plans for spending on coal-fired power plants within the United States and elsewhere;
•Demand for our products and services is vulnerable to macroeconomic downturns and industry conditions;
•Supply chain issues, including shortages of adequate component supply that increase our costs or cause delays in our ability to fulfill orders, and our failure to estimate customer demand properly may result could have an adverse impact on our business and operating results and our relationships with customers;
•Our abilityThe financial and other covenants in our debt agreements may adversely affect us;
•We must refinance our 8.125% Notes due 2026 and 6.50% Notes due 2026 prior to maintaintheir maturity;
•Maintaining adequate bonding and letter of credit capacity is necessary for us to successfully complete, bid on, win and wincomplete various contracts;
•Our evaluation of strategic alternatives for certain businesses and non-core assets may not be successful;
•Our total assets include goodwill and other indefinite-lived intangible assets. If we determine these have become impaired, our business, financial condition and results of operations could be materially adversely affected;
•We are exposed to credit risk and may incur losses as a result of such exposure;
•The transition away from LIBOR may negative impact our operating results;
•The financial and other covenants in our debt agreements may adversely affect us;
•A disruption in, or failure of our information technology systems, including those related to cybersecurity, could adversely affect our business operations and financial performance;
•Privacy and information security laws are complex, and if we fail to comply with applicable laws, regulations and standards, or if we fail to properly maintain the integrity of our data, protect our proprietary rights to our systems or defend against cybersecurity attacks, we may be subject to government or private actions due to privacy and securitybreaches;
breaches, any of which could have a material adverse effect on our business, financial condition and results of operations or materially harm our reputation;
•We rely on intellectual property law and confidentiality agreements to protect our intellectual property. We also rely on intellectual property we license from third parties. Our failure to protect our intellectual property rights, or our inability to obtain or renew licenses to use intellectual property of third parties, could adversely affect our business;
•We are subject to current and future government regulations that may adversely affect our future operations;
•Our business and our customers' businesses are required to obtain, and to comply with, national, state and local government permits and approvals;
•Our operations are subject to various environmental laws and legislation that may become more stringent in the future;
•Our operations involve the handling, transportation and disposal of hazardous materials, and environmental laws and regulations and civil liability for contamination of the environment or related personal injuries may result in increases in our operating costs and capital expenditures and decreases in our earnings and cash flows;
•Our business may be affected by new sanctions and export controls targeting Russia and other responses to Russia's invasion of Ukraine.Ukraine;
•We could be adversely affected by violations of the United States Foreign Corrupt Practices Act, the UK Anti-Bribery Act or other anti-bribery laws;
•Our international operations are subject to political, economic and other uncertainties not generally encountered in our domestic operations;
•International uncertainties and fluctuationsFluctuations in the value of foreign currencies could harm our profitability;
•Uncertainty over global tariffs, or the financial impact of tariffs, may negatively affect our results;
•The market price and trading volume of our common stock may be volatile;
•Substantial sales, or the perception of sales, of our common stock by us or certain of our existing shareholders could cause our stock price to decline and future issuances may dilute our common shareholders' ownership in the Company;ownership;
•B. Riley has significant influence over us;
•We do not currently pay regular dividends on our common stock, so holders of our common stock may not receive funds without selling their shares of our common stock;
•We may issue preferred stock that could dilute the voting power or reduce the value of our common stock;
•Provisions in our corporate documents and Delaware law could delay or prevent a change in control of the Company,us, even if that change may be considered beneficial by some shareholders;
•We are subjectPotential indemnification liabilities to continuing contingentBWXT pursuant to the master separation agreement could materially adversely affect us;
•In connection with our separation from BWXT, BWXT has agreed to indemnify us for certain liabilities. However, there can be no assurance that the indemnity will be sufficient to insure us against the full amount of such liabilities, of BWXT followingor that BWXT's ability to satisfy its indemnification obligation will not be impaired in the spin-off;future;
•We could be subject to changes in tax rates or tax law, adoption of new regulations, changing interpretations of existing law or exposure to additional tax liabilities in excess of accrued amounts that could adversely affect our financial position;
•Our ability to use net operating losses (“NOLs”)NOL and certain tax credits to reduce future tax payments could be further limited if we experience an additional “ownership change”;
•Our business could be harmed if we fail to maintain effective internal control over financial reporting;
•Our reported financial results may be adversely affected by new accounting pronouncements or changes in existing accounting standards and practices, which could result in volatility in our results of operations;
•The loss of the services of one or more of our key personnel, or our failure to attract, recruit, motivate, and retain qualified personnel in the future, could disrupt our business and harm our results of operations;
•We outsource certain business processes to third-party vendors and have certain business relationships that subject us to risks, including disruptions in business which could increase our costs;
•Negotiations with labor unions and possible work stoppages and other labor problems could divert management's attention and disrupt operations. In addition, new collective bargaining agreements or amendments to existing agreements could increase our labor costs and operating expenses;
•Pension and medical expenses associated with our retirement benefit plans may fluctuate significantly depending on a number of factors, and we may be required to contribute cash to meet underfunded pension obligations; and,
•Natural disasters or other events beyond our control, such as war, armed conflicts or terrorist attacks could adversely affect our business.
WEBSITE REFERENCES
In this Annual Report on Form 10-K, we make references to our website at www.babcock.com.References to our website through this Form 10-K are provided for convenience only and the content on our website does not constitute a part of, and shall not be deemed incorporated by reference into, this Annual Report on Form 10-K.
ITEM 1. Business
In this Annual Report on Form 10-K, or this “Annual Report”, unless the context otherwise indicates, “B&W,” “we,” “us,” “our” or the “Company” mean Babcock & Wilcox Enterprises, Inc. and its consolidated subsidiaries.
B&W isWe are a growing, globally-focused renewable, environmental and thermal technologies provider with over 150155 years of experience providing diversified energy and emissions control solutions to a broad range of industrial, electrical utility,
municipal and other customers. B&W’sOur innovative products and services are organized into three market-facing segments. Our reportable segments are:are as follows:
•Babcock & Wilcox Renewable: Cost-effectiveOur innovative hydrogen generation technology (BrightLoopTM) supports global climate goals including the decarbonization of industrial and utility steam and power producers. BrightLoopTM offers significant advantages over other hydrogen generation technologies as it generates competitively priced hydrogen from a wide range of fuels (including solid fuels such as biomass and coal) with a high rate of carbon captured resulting in low (or even negative) carbon intensity hydrogen. We also offer best-in-class technologies for efficient and environmentally sustainable power and heat generation, including waste-to-energy, solar construction and installation, biomass energyoxygen-fired biomass-to-energy (OxyBrightTM), and black liquor systems for the pulp and paper industry. B&W’sOur leading waste-to-energy technologies support a circular economy, diverting waste from landfills to use for power generation and replacing fossil fuels,or district heating, while recovering metals and reducing emissions. To date, we have installed approximately 500 waste-to-energy and biomass-to-energy units at more than 300 facilities in approximately 30 countries which serve a wide variety of utility, waste management, municipality and investment firm customers.
•Babcock & Wilcox Environmental: AOur full suite of best-in-class emissions control and environmental technology solutions for utility, waste to energy, biomass,waste-to-energy, biomass-to-energy, carbon black, and industrial steam generation applications supports environmental stewardship around the world. B&W’sOur broad experience includes systems for cooling, ash handling, particulate control, nitrogen oxidesoxide and sulfur dioxidesdioxide removal, chemical loopingdioxin and furan control, carbon dioxide capture, mercury control as well as other acid gas and pollutant control. Our ClimateBrightTM family of products including SolveBrightTM, OxyBrightTM, BrightLoopTM and BrightGenTM, places us at the forefront of hydrogen production and carbon dioxide capturing technologies and development with many of the aforementioned products already commercially available and others ready for carbon control, and mercury control.commercial deployment.
•Babcock & Wilcox Thermal: SteamOur vast installed base of steam generation equipment aftermarket parts, construction, maintenance and field services for plantsrelated auxiliaries spans the globe and includes customers in thea variety of end markets including power generation, oil and gas, and industrial sectors. B&W has an extensive global base of installed equipment for utilities and general industrial applications including refining, petrochemical, food processing,and beverage, metals and others.
On September 30, 2021, we acquired a 60% controlling ownership stake in Illinois-based solar energy contractor Fosler Construction Company Inc. (“Fosler Construction”) for approximately $27.2 million in cash plus contingent consideration of up to $10 million, valued at $8.8 million. Fosler Construction provides commercial, industrialmining, and utility-scale solar services and owns two community solar projects in Illinois being developed under the Illinois Solar for All program. Fosler Construction was founded in 1998 and employs approximately 120 people. It has a strong track record of successfully completing solar projects profitably with union labor and has aligned its model with a growing number of renewable project incentives in the U.S.others. We believe Fosler Construction is positioned to capitalize on the high-growth solar market in the U.S. and that the acquisition aligns with B&W’s aggressive growth and expansion of our clean and renewable energy businesses. Fosler Construction is reported as part of our B&W Renewable segment, and operates under the name Fosler Solar, a Babcock & Wilcox company.
On November 30, 2021, we acquired 100% ownership of VODA A/S (“VODA”) through our wholly-owned subsidiary, B&W PGG Luxembourg Finance SARL for approximately $32.9 million. VODA is a Denmark-based multi-brandprovide aftermarket parts, construction, maintenance, engineered upgrades and field services provider, focusing on energy-producing incineration plants including waste-to-energy, biomass-to-energy or other fuels, providing service, engineering services, spare partsfor our installed base as well as general outage supportthe installed base of other OEMs; the substantial and management. VODA has extensive experiencestable cash flows generated from these businesses helps to fund our investments in incineration technology, boiler and pressure parts, SRO, automation, and performance optimization. VODA employs approximately 65 people mainly in Denmark and Sweden. We believe VODA will solidifynew clean energy initiatives. In addition to our platform for our renewable service business in Europe and that the acquisition aligns with B&W’s aggressive growth and expansion of our clean and renewable energy businesses. VODA is reported as part of our B&W Renewable segment. We plan to form B&W Renewable Services to integrate VODA and our waste-to-energy and biomass aftermarket services businesses.
On February 1, 2022,offerings, we acquired 100% ownership of Fossil Power Systems, Inc. for approximately $59.1 million, excluding working capital adjustments. Fossil Power Systems, Inc., is a leading designer and manufacturer of hydrogen, natural gas and renewable pulp and paper combustion equipment including ignitors, plant controls and safetyalso provide complete steam generation systems based in Dartmouth, Nova Scotia, Canada. Fossil Power Systems, Inc. will initially be reported as part of our B&W Thermal segment.
On February 28, 2022, we acquired 100% ownership of Optimus Industries, LLC for approximately $19 million, excluding working capital adjustments. Optimus designs and manufactures waste heat recovery products for use in power generation, petrochemical, and process industries , including package boilers, watertube and firetube waste heat boilers, economizers, superheaters, waste heat recovery equipment and sulfuric acid plantsother boilers to medium and is based in Tulsa, Oklahoma and Chanute, Kansas. Optimus Industries, LLC will be reported as partheavy industrial customers. Our unique range of offerings, coupled with the strength of our B&W Thermal segment.
Our business depends significantly on the capital, operations and maintenance expenditures of global electric power generating companies, including renewable and thermal powered heat generation industries and industrial facilities with environmental compliance policy requirements. Several factors may influence these expenditures, including:
•climate change initiatives promoting environmental policies including renewable energy options utilizing waste-to-energy or biomass to meet legislative requirements and clean energy portfolio standards in the United States, European,Europe, Middle East and Asian markets;Asia;
•regulations requiring environmental improvements in various industries and global markets;
•expectations regarding future governmental requirements to further limit or reduce greenhouse gas and other emissions in the United States, Europe and other international climate change sensitive countries;
•prices for electricity, along with the cost of production and distribution, including the cost of fuels, within the United States, Europe, Middle East and Asian countries;Asia;
•demand for electricity and other end products of steam-generating facilities;
•level of capacity utilization at operating power plants and other industrial usesusers of steam production;
•maintenance and upkeep requirements at operating power plants, including to combataddress the accumulated effects of usage;
•overall strength of the industrial industry; and
•ability of electric power generating companies and other steam users to raise capital.capital; and
•the impact of geopolitical conflicts, including the ongoing conflicts in Ukraine and the Middle East.
Customer demand is heavily affected by the variations in our customers’ business cycles and by the overall economies and energy, environmental and noise abatement needs of the countries in which they operate.
Market Update
COVID-19
In December 2019, a novel strain of coronavirus, COVID-19, was identified in Wuhan, China and subsequently spread globally. This global pandemic has disrupted business operations, including global supply chains, trade, commerce, financial and credit markets, and daily life throughout the world. Our business has been, andManagement continues to be, adversely impacted byadapt to macroeconomic conditions, including the measures takenimpacts from inflation, higher interest rates and restrictions imposedforeign exchange rate volatility, geopolitical conflicts (including the ongoing conflicts in Ukraine and the countriesMiddle East) and global shipping and supply chain disruptions that continued to have an impact during 2023. In certain instances, these situations have resulted in which we operate and by local governments and others to control the spread of this virus. These measures and restrictions have varied widely and have been subject to significant changes from time to time depending on changes in the severity of the virus in these countries and localities. These restrictions, including curtailment of travel and other activity, negatively impact our ability to conduct business.
Disruption to our global supply chains from COVID-19 has included impacts to the manufacturing, supply, distribution, transportation and delivery of our products. We could also see significant disruptions of the operations of our logistics, service providers, delays in shipments and negative impacts to pricing of certain of our products. Disruptionscost increases and delays in our supply chains as a result of the COVID-19 pandemicor disruptions that have had, and could adverselycontinue to have, an adverse impact on our ability to meet our customers’ demands. Additionally,We continue to actively monitor the prioritizationimpact of shipmentsthese market conditions on current and future periods and actively manage costs and our liquidity position to provide additional flexibility while still supporting our customers and their specific needs. The duration and scope of certain products as a result of the pandemic could cause delays in the shipment or delivery ofthese conditions cannot be predicted, and therefore, any anticipated negative financial impact on our products. Such disruptions could result in reduced sales.operating results cannot be reasonably estimated.
The volatility and variability of the virus has limited our ability to forecast the impact of the virus on our customers and our business. The ongoing impact of COVID-19, including new strains such as the delta and omicron variants, has resulted in the reimposition of certain restrictions and may lead to other restrictions being implemented in response to efforts to reduce the spread of the virus. These varying and changing events have caused many of the projects we had anticipated would begin in 2021 to be delayed into 2022 and potentially beyond. Many customers and projects require B&W's employees to travel to customer and project worksites. Certain customers and significant projects are located in areas where travel restrictions have been imposed, certain customers have closed or reduced on-site activities, and timelines for completion of certain projects have, as noted above, been extended into 2022 and beyond. Additionally, out of concern for our employees, even where restrictions permit employees to return to our offices and worksites, we incurred additional costs to protect our employees and advised those who are uncomfortable returning to worksites due to the pandemic that they are not required to do so for an indefinite period of time. The resulting uncertainty concerning, among other things, the spread and economic impact of the virus has also caused significant volatility and, at times, illiquidity in global equity and credit markets. The full extent of the impact of COVID-19 and its variants on our operational and financial performance will depend on future developments, including the ultimate duration and spread of the pandemic and related actions taken by the U.S. government, state and local government officials, and international governments to prevent outbreaks, as well as the availability, effectiveness and acceptance of COVID-19 vaccinations in the U.S. and abroad, all of which are uncertain, out of our control, and cannot be predicted.
Equity Capital Activities
For information regarding our equity activities, see Note 16 to the Consolidated Financial Statements included in Part II, Item 9 of this Annual Report.
On February 12, 2021, we completed a public offering of 29,487,180 shares of our common stock for net proceeds of $163.0 million, inclusive of 3,846,154 shares issued to B. Riley Securities, Inc., a related party.
Debt Capital Activities
On May 7, 2021, we completed a public offering of 4,000,000 shares ofFor information regarding our 7.75% Series A Cumulative Perpetual Preferred Stock (the “Preferred Stock”) at an offering price of $25.00 per share for net proceeds of approximately $95.7 million after deducting underwriting discounts and commissions but before expenses.
On May 26, 2021, we completed the additional sale of 444,700 shares of our Preferred Stock, related to offering described above, at an offering price of $25.00 per share for net proceeds of approximately $10.7 million after deducting underwriting fees and commissions.
On June 1, 2021, the Company and B. Riley, a related party, entered into an agreement pursuant to which we (i) issued B. Riley 2,916,880 shares of our Preferred Stock, representing an exchange price of $25.00 per share and paid $0.4 million in cash, and (ii) paid $0.9 million in cash to B. Riley for accrued interest due, in exchange for a deemed prepayment of $73.3 million of our then-existing term loans with B. Riley.
On July 7, 2021, we entered into a sales agreement with B. Riley Securities, Inc., a related party, in connection with the offer and sale of our Preferred Stock with an aggregate offering price of up to $76 million to or through B. Riley Securities, Inc. The Preferred Stock has the same terms (other than date of issuance and first dividend), has the same CUSIP number and is fungible with the Preferred Stock issued on May 7, 2021. As of December 31, 2021, we sold $7.7 million aggregate amount of Preferred Stock for $7.7 million net proceeds after commission and fees related to the July 7, 2021 sales agreement.
For further information,debt activities, see Note 1715 to the Consolidated Financial Statements included in Part II, Item 8 of this Annual Report.
Debt Capital Activities
8.125% Senior Notes
On February 12, 2021, we completed a public offering of $125.0 million aggregate principal amount of our 8.125% senior notes due 2026 (the “8.125% Senior Notes”). At the completion of the offering, we received net proceeds of approximately $120.0 million after deducting underwriting discounts, commissions, and before expenses.
In addition to the public offering, we issued $35.0 million of 8.125% Senior Notes to B. Riley Financial, Inc., a related party, in exchange for a deemed prepayment of our existing Last Out Term Loan Tranche A-3 in a concurrent private offering.
On March 31, 2021, we entered into a sales agreement with B. Riley Securities, Inc., a related party, in which we may sell to or through B. Riley Securities, Inc., from time to time, additional 8.125% Senior Notes up to an aggregate principal amount of $150.0 million of 8.125% Senior Notes. The 8.125% Senior Notes have the same terms as (other than date of issuance), form a single series of debt securities with and have the same CUSIP number and be fungible with, the 8.125% Senior Notes issued February 12, 2021, as described above.
As of December 31, 2021, the Company has sold $26.2 million aggregate principal amount of 8.125% Senior Notes under the sales agreement disclosed above for $26.6 million of net proceeds after commissions and fees.
The 8.125% Senior Notes are senior unsecured obligations of the Company and rank equally in right of payment with all of the Company’s other existing and future senior unsecured and unsubordinated indebtedness. The 8.125% Senior Notes bear interest at the rate of 8.125% per annum. Interest on the 8.125% Senior Notes is payable quarterly in arrears on January 31, April 30, July 31 and October 31 of each year, commencing on April 30, 2021. The 8.125% Senior Notes mature on February 28, 2026.
6.50% Senior Notes.
On December 13, 2021, we completed an underwritten public offering of $140 million aggregate principal amount of 6.50% senior notes due 2026 (the “6.50% Senior Notes”). On December 28, 2021, we received a notice that the Underwriters had elected to exercise their overallotment option for an additional $11.4 million in aggregate principal amount of the 6.50% Senior Notes. The Company closed the overallotment option on December 30, 2021. As of the closing of the overallotment option, a total of $151.4 million in aggregate principal amount of the 6.50% Senior Notes have been sold. The net proceeds
from the offering, including the 6.50% Senior Notes purchased pursuant to the overallotment option, after deducting the Underwriters’ discount and the estimated offering expenses payable by the Company, were approximately $145.0 million.
The public offering of our 6.50% Senior Notes was conducted pursuant to an underwriting agreement dated December 8, 2021, between us and B. Riley Securities, Inc., an affiliate of B. Riley, a related party, as representative of several underwriters.
The 6.50% Senior Notes are senior unsecured obligations of the Company and rank equally in right of payment with all of the Company’s other existing and future senior unsecured and unsubordinated indebtedness. The 6.50% Senior Notes are effectively subordinated in right of payment to all of the Company’s existing and future secured indebtedness and structurally subordinated to all existing and future indebtedness of the Company’s subsidiaries, including trade payables. The 6.50% Senior Notes bear interest at the rate of 6.50% per annum. Interest on the 6.50% Senior Notes is payable quarterly in arrears on March 31, June 30, September 30 and December 31 of each year, commencing on March 31, 2022. The 6.50% Senior Notes will mature on December 31, 2026.
For further information, see Note 14 to the Consolidated Financial Statements included in Part II, Item 8 of this Annual Report.
Contracts
We execute our contracts through a variety of methods, including fixed-price, cost-plus, target price cost incentive, cost-reimbursable or some combination of these methods. Contracts are usually awarded through a competitive bid process. Factors that customers may consider include price, technical capabilities of equipment and personnel, plant or equipment availability, efficiency, safety record and reputation.
Fixed-price contracts are for a fixed selling price to cover all costs and any profit element for a defined scope of work. Fixed-price contracts entail more risk to us because they require us to predetermine both the quantities of work to be performed and the costs associated with executing the work.
We have contracts that extend beyond one year. Most of our long-term contracts have provisions for progress payments. We attempt to cover anticipated increases in labor, material and service costs of our long-term contracts either through an estimate of such changes, which is reflected in the original price, or through risk-sharing mechanisms, such as escalation or
price adjustments for items such as labor and commodity prices. In the event of a contract deferral or cancellation without cause, we generally would be entitled to recover costs incurred, settlement expenses and profit on work completed prior to deferral or termination. Significant or numerous cancellations could adversely affect our business, financial condition,position, results of operations and cash flows.
From time to time, we partner with other companies to meet the needs of our customers, which can result in project-related joint venture entities or other contractual arrangements. While we carefully select our partners in these arrangements, they can subject us to risks that we may not be able to fully control and may include joint and several liability.
We generally recognize our contract revenues and related costs over time using the cost-to-cost input method that uses costs incurred to date relative to total estimated costs at completion to measure progress toward satisfying our performance obligations. Accordingly, we review contractual sales price and cost estimates regularly as the work progresses and reflect adjustments in profit proportionate to the percentage-of-completion in the period when we revise those estimates. To the extent that these adjustments result in a reduction or an elimination of previously reported profits with respect to a contract, we would recognize a charge against current earnings, which could be material.
See further description of risks related to our contractingcustomer contracts inRisks Related to Our Operations in Part I, Item 1A of this Annual Report.
Our arrangements with customers frequently require us to provide letters of credit, bid and performance bonds or guarantees to secure bids or performance under contracts, which may involve providingcontracts. Inability to secure such cash collateral or other contract security that we may not be able to provide.preclude us from entering into certain customer arrangements.
Other sales, such as parts and certain aftermarket service activities, are not in the form of long-term contracts, and we recognize revenues as goods are delivered and work is performed. See further discussion in Note 56 to the Consolidated Financial Statements included in Part II, Item 8 of this Annual Report.
Foreign Operations
Our operations in Denmark including through our recent acquisition of VODA, provide comprehensive services to companies in the waste-to-energy and biomass to energybiomass-to-energy sector of the power generation market, currently primarily in Europe. Our operations in Italy provide custom-engineered comprehensive wet and dry cooling solutions and aftermarket parts and services to the power generation industry including natural gas-fired and renewable energy power plants, as well as downstream oil and gas, petrochemical and other industrial end markets in Europe, the Middle East and the Americas. Our operations in Scotland primarily provide boiler cleaning technologies and systems primarilymainly to Europe.European markets. Our Canadian operations serve the Canadian industrial power, oil production and electric utility markets. We have manufacturing facilities in Mexico to serve global markets.
The functional currency of our foreign operating entities is not the United States dollar, and as a result, we are subject to exchange rate fluctuations that impact our financial position, results of operations and cash flows. WeAlthough we do not currently engage in currency hedging activities to limit the risks of currency fluctuations, we evaluate opportunities to engage in hedging in order to limit the risks of currency fluctuations.
For additional information on the geographic distribution of our revenues, see Note 45 to the Consolidated Financial Statements included in Part II, Item 8 of this Annual Report.
Competition
With over 150155 years of experience, we have a competitive advantage in our experience and technical capability to reliably convert a wide range of fuels to steam. We have supplied highly-engineered energy and environmental equipment in more than 90 countries. Our strong, installed base around the globe also yields competitive advantages, although our markets are highly competitive and price sensitive. We compete with a number of domestic and foreign companies specializing in power generation, environmental control equipment, and cooling systems and services. Each segment’s primary competitors are summarized as follows:
| | | | | | | | |
| B&W Renewable segment | B&W Environmental segment | B&W Thermal segment |
CNIM GroupAndritz AG | HamonAker Carbon Capture ASA | GEAZCO Inc.(1)
|
| Hitachi Zosen Corporation | Enexio | MH Power Systems(1)
|
Martin | SeagullDurr Group | Babcock Power Inc.(1) |
Keppel SeghersLtd. | PaharpurElessent Clean Technologies Inc. | Clyde Bergemann Power Group |
| MARTIN GmbH | ENEXIO Management GmbH | Doosan Corporation(1) |
ValmetSteinmuller Engineering GmbH | EvapcoEVAPCO, Inc. | Clyde BergemannEnerfab, Inc. |
AndritzValmet Oyj | SPG DryPaharpur Cooling Towers Ltd. | EnerfabGeneral Electric Company(1)
|
Steinmuller | Radscan AB | TEI ConstructionMitsubishi Power, Ltd.(1)
|
| LABSeagull Environmental Technologies, Inc. | | APComPower
| Southern Environmental, Inc | | Azco, Inc. |
(1) GE, MH Power Systems, Babcock Power &Inc., Doosan Corporation, General Electric Company and Mitsubishi Power, Ltd. are also considered primary competitors of the B&W Environmental Segment.
Across each of our segments, we also compete with a variety of engineering and construction companies related to installation of steam generating systems and environmental control equipment; specialized industrial equipment; and other suppliers of replacement parts, repair and alteration services and other services required to retrofit and maintain existing steam generating systems. The primary bases of competition are price, technical capabilities, quality, timeliness of performance, breadth of products and services and willingness to accept contract risks.
Raw Materials and Suppliers
Our operations use raw materials such as carbon and alloy steels in various forms and components and accessories for assembly, which are available from numerous sources. We generally purchase these raw materials and components as needed for individual contracts. We do not depend on a single source of supply for any significant raw materials. Although shortages of some raw materials have existed from time to time, no serious shortage exists at the present time.presently exists.
Human Capital Resources
Human Capital Management
At December 31, 2021,2023, we had approximately 1,8002,250 employees worldwide, of which approximately 1,7502,200 were full-time. Approximately 400450 of our hourly employees are union-affiliated, covered by four union agreements related to active facilities in Mexico, the United States, the United Kingdom, and Canada. We successfully renegotiated twoone union contractscontract in 20212023 and have onethree that will expire in early 2023.2024. We consider our relationships with our employees and unions to be in good standing.
Workforce Engagement
We believe an engaged global workforce is critical to our success as we work to profitably grow our business as a leading supplier of clean and sustainable energy solutions.
B&W is known for having a dedicated, long-tenured workforce and for having some of the best, most experienced employees in the industries we serve. Our ability to attract and retain this exceptional talent requires a commitment to open communication about the company’sour business, strategy and results with our employees and a globally diverse, inclusive and supportive workplace that provides opportunities for growth and career development. It also requires programs that enhance employees’ overall work experience. We have implemented the Responsible and Flexible Workplace Program (“ReFlex”) in the U.S. that
provides employees with flexibility in where they work and we have various work-from-home policies across many of our global operations. While COVID-19 has continued to impact life throughout the world, our employees have remained diligent, customer focused and resilient, and progressive employment programs like ReFlex have provided us with an important competitive advantage. They allow us to keep our facilities running, deliver on our projects and ensure our customers’ needs are met, while also safeguarding the safety and health of our employees. Through ReFlex, our employees have needed flexibility and autonomy in how they work, particularly during these unprecedented times.allowing us to deliver on our projects and ensure our customers' needs are met.
Compensation and Benefits
We also believe it is important to provide competitive compensation and benefits programs for our employees. In addition to salaries, we offer the following benefits, among others, which vary by employee level and by the country where the employees are located:
•bonuses,bonuses;
•stock awards,awards;
•retirement programs (including pension and savings plans),;
•health savings and flexible spending accounts,accounts;
•paid time off,off;
•paid parental leave,leave;
•disability programs,programs; and
•and employee assistance programs.
Core Values
At B&W, our values of safety, ethics, quality, integrity, respect and agility are at the foundation of our business, and we are focused on efficiently ingraining new employees into that culture, whether they join through the normal recruiting and hiring process, or as we have grown our company through strategic acquisitions. We also believe in the importance of being a good corporate citizen, providing and supporting opportunities for our employees to make a positive impact in the communities where they live and work.
Our Board of Directors is actively engaged with our workforce practices and policies, and regularly receives updates and provides input on key culture topics, including employee engagement, employee development and succession planning.
Patents and Patent Licenses
We currently hold a large number of United States and foreign patents and have various patent applications pending. We have acquired patents and technology licenses and granted technology licenses to others when we have considered it advantageous
for us to do so. Although in the aggregate our patents and licenses are important to us, we do not regard any single patent or license or group of related patents or licenses as critical or essential to our business as a whole. In general, we depend on our technological capabilities and the application thereof, rather than patents and licenses, in the conduct of our various businesses.
Research and Development Activities
Our research and development activities improve our products through innovations to reduce the cost of our products to make them more competitive and through innovations to reduce performance risk of our products to better meet our customer expectations. Research and development costs are expensed as incurred.
Permits and Licenses
We are required by various governmental and quasi-governmental agencies to obtain certain permits, licenses and certificates with respect to our operations. The kinds of permits, licenses and certificates required in our operations depend upon a number of factors. We are not aware of any material noncompliance and believe our operations and certifications are currently in compliance with all relevant permits, licenses and certifications.
Environmental
We have been identified as a potentially responsible party at various cleanup sites under the Comprehensive Environmental Response, Compensation and Liability Act of 1980, as amended (“CERCLA”("CERCLA"). CERCLA and other environmental laws can impose liability for the entire cost of cleanup on any of the potentially responsible parties, regardless of fault or the
lawfulness of the original conduct. Generally, however, where there are multiple responsible parties, a final allocation of costs is made based on the amount and type of wastes disposed of by each party and the number of financially viable parties, although this may not be the case with respect to any particular site. We have not been determined to be a major contributor of wastes to any of these sites. On the basis of our relative contribution of waste to each site, we expect our share of the ultimate liability for the various sites will not have a material adverse effect on our consolidated financial condition,position, results of operations or cash flows in any given year.
Government Regulations
We are subject to a variety of laws and regulations in the United States and other countries that involve matters central to our business, including those relating to:
•the construction and manufacture of renewable, environmental and thermal products;
•clean air and other environmental protection legislation;
•taxation of domestic and foreign earnings;
•tariffs, duties, or trade sanctions and other trade barriers imposed by foreign countries that restrict or prohibit business transactions in certain markets;
•user privacy, security, data protection, content, and online-payment services;
•intellectual property;
•transactions in or with foreign countries or officials; and
•use of local employees and suppliers.
Compliance with such regulations has not had a material effect on our capital expenditures, results of operations or competitive position to date. For further discussion, see Part I, Item 1A, “Risk Factors” of this Annual Report on Form 10-K.
Available Information
Our website address is www.babcock.com. We make available through the Investor section of this website under “Financial Information,” free of charge, our annual reports on Form 10-K, quarterly reports on Form 10-Q, current reports on Form 8-K, our proxy statement, statements of beneficial ownership of securities on Forms 3, 4 and 5 and amendments to those reports as soon as reasonably practicable after we electronically file those materials with, or furnish those materials to the Securities and Exchange Commission (the “SEC”).SEC. In addition, the SEC maintains a website at www.sec.gov that contains reports, proxy and annual reports, and other information regarding issuers that file electronically with the SEC. We have also posted on our website our: Corporate Governance Principles; Code of Business Conduct; Code of Ethics for our Chief Executive Officer and Senior Financial Officers; Related Party Transactions Policy; Management, Board Members and Independent Director Contact Information; Amended and Restated By-laws; charters for the Audit & Finance, Governance, Compensation, and
Compensation Related Party Transactions Committees of our Board; and our Modern Slavery Transparency Statement. We are not including the information contained in our website as part of or incorporating it by reference into this Annual Report.
Item 1A. Risk Factors
You should carefully consider each of the following risks and all of the other information contained in this Annual Report. If any of these risks develop into actual or expected events, our business, financial condition, results of operations or cash flows could be materially and adversely affected, and, as a result, the trading price of our common stock could decline.
The risks discussed below are not the only ones facing our business but do represent those risks that we believe are material to us. Additional risks and uncertainties not presently known to us or that we currently deem immaterial may also harm our business. Please read the cautionary notice regarding forward-looking statements under the heading “Cautionary Statement Concerning Forward-Looking Information.”
Risks Related to Our Business, Operations and Strategy
Our business, financial condition and results of operations, and those ofraises substantial doubt as to our customers, suppliers and vendors, haveability to continue as a going concern, which we believe has been and continuealleviated by actions taken to be, adversely affected by the global COVID-19 outbreak and may be adversely affected by other similar outbreaks.address our liquidity needs.
WhenOur Consolidated Financial Statements have been prepared assuming that we will continue to operate as a pandemic or outbreakgoing concern, which contemplates the realization of an infectious disease occurs, our business, financial conditionassets and resultsthe satisfaction of operations may be adversely affected. In December 2019, a novel strain of coronavirus, COVID-19, was identified in Wuhan, China and subsequently spread globally. The ongoing impact of COVID-19, including new strains such as the delta and omicron variants, has resultedliabilities in the reimpositionnormal course of certain restrictionsbusiness. Since December 2022, we have entered into a number of amendments and may lead to other restrictions being implemented in response to efforts to reduce the spread of the virus. This global pandemic has disrupted business operations, global supply chain logistics, trade, commerce, financial and credit markets, and daily life throughout the world. Our business has been, and continues to be, adversely impacted by the measures taken and restrictions imposed in the countries in which we operate and by local governments and others to control the spread of this virus. These measures and restrictions have varied widely and have been subject to significant changes from time to time depending on the changes in the severity of the virus in these countries and localities. These restrictions, including travel and curtailment of other activity, negatively impact our ability to conduct business. The volatility and variability of the virus has limited our ability to forecast the impact of the virus on our customers and our business. These varying and changing events have caused many of the projects we had anticipated would begin in 2021 to be delayed into 2022 and potentially beyond. Many customers and projects require B&W's employees to travel to customer and project worksites. Certain customers and significant projects are located in areas where travel restrictions have been imposed, certain customers have closed or reduced on-site activities, and timelines for completion of certain projects have, as noted above, been extended into 2022 and beyond. Additionally, out of concern for our employees, even where restrictions permit employees to returnwaivers to our offices and worksites, we have incurred additional costsDebt Facilities to, protect our employees as well as, advising those who are uncomfortable returning to worksites due to the pandemic that they are not required to do so for an indefinite period of time. The resulting uncertainty concerning, among other things, the spreadprovide relief or waiver under certain financial and economic impactother covenants and to waive certain events of the virus has also caused significant volatility and, at times, illiquidity in global equity and credit markets. The full extent of the impact of COVID-19 and its variants on our operational and financial performance will depend on future developments, including the ultimate duration and spread of the pandemic and related actions taken by the U.S. government, state and local government officials, and international governments to prevent outbreaks, as well as the availability, effectiveness and acceptance of COVID-19 vaccinations in the U.S. and abroad, all of which are uncertain, out of our control, and cannot be predicted.
This outbreak, and any outbreak of a contagious disease or any other adverse public health developments in countries where we operate, could have material and adverse effects on our business, financial condition and results of operations. These effects could include, among others, delays in the construction of new projects or the delay of maintenance on existing products provided to our customers, as well as disruptions or restrictions on our employees’ ability to travel to necessary worksites, including as a result of the temporary closure of our facilities or the facilities of our customers, suppliers, vendors or projects. Further, our suppliers and vendors may be adversely impacted, which may impair their ability to satisfy their contractual obligations to us and our customers. In addition, any outbreak may result in a widespread health crisis that could adversely affect the economies and financial markets of many countries, resulting in an economic downturn or recession that could affect demand for our products or our ability to obtain financing for our business or projects.
The ultimate effectAlthough we currently have approximately $5.0 available to borrow under our new Credit Agreement with Axos Bank (as discussed in Note 25 to the Consolidated Financial Statements included in Part II, Item 8 of the COVID-19 outbreakthis Report), we expect that we will require additional financing to fund working capital to continue as a going concern. Accordingly, there is substantial doubt about our ability to continue as a going concern. We have taken, or any other outbreakplan to take, certain actions to address our liquidity needs. Based on our business, financial conditionability to raise funds through such actions, we have concluded that it is probable we will have sufficient capital to meet our operating, debt service and operations will depend heavily oncapital requirements for the future developments, which are highly uncertain and cannot be predicted with confidence, including the duration of the outbreak, new information that may emerge concerning the severity of the virus and the actions takennext twelve months. Failure to contain the virus or treat its impact, among others. In particular, the actual and threatened spread of the virus could have a material adverse effect on the global economy and may negatively impact financial markets in the future, including the trading price ofeffectively execute our common stock, could cause continued interest rate volatility and movements that could make obtaining financing or refinancing our debt obligations more challenging or more expensive, could continue to limit the ability of our personnel to travel to service the needs of our customersplans, as well as limiting the abilitydelays or disruptions in these plans due to circumstances outside of our suppliers and vendors to travel to service our business, and could result in any threatened areas to be subject to quarantine and shelter-in-place orders among other restrictions. Any of these developmentscontrol, could have a materialan adverse effect on our business, liquidity, capital resources and financial position, results and may result in our inabilityof operations and/or ability to continue operatingas a going concern. If we become unable to continue as a going concern, we may have to liquidate our assets and the values we receive for our assets in liquidation or require us to reorganizedissolution could be significantly lower than the values reflected in our company in its entirety, including through bankruptcy proceedings.Consolidated Financial Statements.
We are subject to risks associated with contractual pricing in our industry, including the risk that, if our actual costs exceed the costs we estimate on our fixed-price contracts, our profitability will decline, and we may suffer losses.
We are engaged in a highly competitive industry, and we have priced a number of our contracts on a fixed-price basis. Our actual costs could exceed our projections. We attempt to cover the increased costs ofassociated with anticipated changes in labor, material and service costs of long-term contracts, either through estimates of cost increases, which are reflected in the original contract price, or through price escalation clauses. Despite these attempts, the cost and gross profit we realize on a fixed-price contract could vary materially from the estimated amounts because of supplier, contractor and subcontractor performance, changes in job conditions, variations in labor and equipment productivity and increases in the cost of labor and raw materials, particularly steel, over the term of the contract. These variations and the risks generally inherent in our industry may result in actual revenues or costs being different from those we originally estimated and may result in reduced profitability or losses on contracts. Some of these risks include:
•difficulties encountered on our large-scale contracts related to the procurement of materials or due to schedule disruptions, equipment performance failures, engineering and design complexity, unforeseen site conditions, rejection clauses in customer contracts or other factors that may result in additional costs to us, reductions in revenue, claims or disputes;
•our inability to obtain compensation for additional work we perform or expenses we incur as a result of our customers or subcontractors providing deficient design or engineering information or equipment or materials;
•requirements to pay liquidated damages upon our failure to meet schedule or performance requirements of our contracts; and
•difficulties in engaging third-party subcontractors, equipment manufacturers or materials suppliers or failures by third-party subcontractors, equipment manufacturers or materials suppliers to perform could result in contract delays and cause us to incur additional costs.
In prior years, we have experienced these risks with several large loss contracts in our B&W Renewable and B&W Environmental segments, which resulted in significant losses for our operations, impaired our liquidity position and had previously resulted in substantial doubt regarding whether we would be able to continue to operate as a going concern. If we were to experience these risks again in the future, our business, results of operations, financial conditionposition and liquidity may be materially and adversely affected.
Disputes with customers with long-term contracts could adversely affect our financial condition.
We routinely enter into long-term contracts with customers. Under long-term contracts, we may incur capital expenditures or other costs at the beginning of the contract that we expect to recoup through the life of the contract. Some of these contracts provide for advance payments to assist us in covering these costs and expenses. A dispute with a customer during the life of a long-term contract could impact our ability to receive payments or otherwise recoup incurred costs and expenses.
Our contractual performance may be affected by third parties’ and subcontractors’ failure to meet schedule, quality and other requirements onin our contracts, which could increase our costs, scope, or technical difficulty or in extreme cases, limit our ability to meet contractual requirements.
We conduct significant portions of our business by engaging in long-term contracts related to highly complex, customized equipment or facilities for electrical generation, industrial processes, and/or environmental compliance. The complexity of
these contracts generally necessitates the participation of others, including third-party suppliers, subcontractors, equipment or part manufacturers, partner companies, other companies with whom we do not have contractual relationships, customers, financing organizations, regulators and others. Our reliance on these parties subjects us to the risk of customer dissatisfaction with the quality or performance of the products or services we sell due to supplier or subcontractor failure. Third-party
supplier and subcontractor business interruptions could include but are not limited to, interruptions to business operations due to a pandemic or other health crises, work stoppages, union negotiations, other labor disputes and payment disputes. Current or future economic conditions could also impact the ability of suppliers and subcontractors to access credit and, thus, impair their ability to provide us quality products, materials, or services in a timely manner, or at all.
While we endeavor to limit our liability to matters within our control, not all scenarios can be foreseen, and we may become subject to the risk of others’ performance that may or may not be within our control or influence. Delays, changes or failures of others, including third-party suppliers and subcontractors, could subject us to additional costs, delays, technical specification changes, contractual penalties or other matters for which we may be unable to obtain compensation, or compensation may not be sufficient. In extreme cases, the direct or indirect effects of such matters may cause us to be unable to fulfill our contractual requirements.
A material disruption at one of our manufacturing facilities or a third-party manufacturing facility that we have engaged could adversely affect our ability to generate sales and result in increased costs.
Our financial performance could be adversely affected due to our inability to meet customer demand for our products or services in the event of a material disruption at one of our significant manufacturing or services facilities. Equipment failures, natural disasters, power outages, fires, explosions, terrorism, adverse weather conditions, labor disputes or other influences could create a material disruption. Interruptions to production could increase our cost of sales, harm our reputation and adversely affect our ability to attract or retain our customers. Our business continuity plans may not be sufficient to address disruptions attributable to such risks. Any interruption in production capability could require us to make substantial capital expenditures to remedy the situation, which could adversely affect our financial conditionposition and results of operations.
If our co-venturers fail to perform their contractual obligations on a contract or if we fail to coordinate effectively with our co-venturers, we could be exposed to legal liability, loss of reputation, reduced profit, or liquidity challenges.
We often perform contracts jointly with third parties or execute contracts with partners through joint ventures or other contractual arrangements. For example, we enter into contracting consortia and other contractual arrangements to bid for and perform jointly on large contracts. We may not be able to control the actions of our partners in these arrangements, and influence over the actions of our partners and the contractual outcomes may be limited. Success on these joint contracts depends in part on whether our co-venturers fulfill their contractual obligations satisfactorily. If any one or more of these third parties fail to perform their contractual obligations satisfactorily, we may be required to make additional investments and provide added services in order to compensate for that failure. If we are unable to adequately address any performance issues when and if required, customers may exercise their rights to terminate a joint contract, exposing us to legal liability, damage to our reputation, reduced profit or liquidity challenges.
For example, our joint venture partner for a renewable energy plant in the United Kingdom entered into administration (similar to filing for bankruptcy in the U.S.) in late February 2018. Accordingly, we were required to take over the civil scope of the renewable energy plant project, which resulted in significant delays and materially increased our costs on the project.
Our collaborative arrangements also involve risks that participating parties may disagree on business decisions and strategies. These disagreements could result in delays, additional costs and risks of litigation. In these arrangements, we sometimes have joint and several liabilities with our partners, and we cannot be certain that our partners will be able to satisfy any potential liability that could arise. Our inability to successfully maintain existing collaborative relationships or enter into new collaborative arrangements could have a material adverse effect on our results of operations.
Our growth strategy includes strategic acquisitions, which we may not be able to consummate or successfully integrate.
We have made acquisitions to grow our business, enhance our global market position and broaden our industrial tools product offerings and intend to continue to make these acquisitions. Our ability to successfully execute acquisitions will be impacted by factors including the availability of financing on terms acceptable to us, the potential reduction of our ability or willingness to incur debt to fund acquisitions due to COVID-19 impacts onmacroeconomic conditions, our financial results, the reluctancewillingness of target companies to sell, in current markets, our ability to identify acquisition candidates that meet our valuation parameters and
increased competition for acquisitions.
The success of any acquisition, as well as our ability to realize their anticipated benefits, depends in large part on our ability to successfully integrate each business. The process of integrating acquired businesses into our existing operations also may result in unforeseen operating difficulties and may require additional financial resources and attention from management that would otherwise be available for the ongoing development or expansion of our existing operations. Although we expect to successfully integrate any acquired businesses, the integration process can be complex and time consuming. If we fail to successfully integrate an acquisition, we may not achieve the desired net benefit in the timeframe planned andor we may not realize the planned benefits from our acquisitions. Failure to effectively execute our acquisition strategy or successfully integrate the acquired businesses could have an adverse effect on our competitive position, reputation, financial condition, results of operations, cash flows and liquidity.
On September 30, 2021, we acquired a 60% controlling ownership stake in Illinois-based solar energy contractor Fosler Construction Company Inc. (“Fosler Construction”). On November 30, 2021, we acquired 100% ownership of VODA A/S (“VODA”). On February 1, 2022, we acquired 100% ownership of Fossil Power Systems, Inc.. On February 28, 2022, we acquired 100% ownership of Optimus Industries, LLC.. The success of these acquisitions, as well as our ability to realize their anticipated benefits, depends in large part on our ability to successfully integrate each business. This integration is complex and time consuming, and failure to successfully integrate either business may prevent us from achieving the anticipated benefits of the acquisitions. Potential difficulties we may encounter as part of the integration process
include (i) the inability to successfully integrate transportation networks; (ii) complexities and unanticipated issues associated with integrating the businesses’ complex systems, technologies and operating procedures; (iii) integrating workforces while maintaining focus on achieving strategic initiatives; (iv) potential unknown liabilities and unforeseen increased or new expenses; (v) the possibility of faulty assumptions underlying expectations regarding the integration process; and (vi) the inability to improve on historical operating results.
Failure to effectively execute our acquisition strategy or successfully integrate the acquired businesses could have an adverse effect on our competitive position, reputation, financial condition, results of operations, cash flows and liquidity.
Our evaluation of strategic alternatives for certain businesses and non-core assets may not result in a successful transaction.
We continue to evaluate strategic alternatives for our business lines and assets to improve our capital structure, such as the decision in the third quarter of 2023 to sell B&W Solar. There can be no assurance that these ongoing strategic evaluations will result in the identification or consummation of any transaction. We may incur substantial expenses associated with identifying and evaluating potential strategic alternatives. The process of exploring strategic alternatives may be time consuming and disruptive to our business operations, and if we are unable to effectively manage the process, our business, financial condition and results of operations could be adversely affected. We cannot assure that any potential transaction or other strategic alternative, if identified, evaluated and consummated, will prove to be beneficial to shareholders and that the process of identifying, evaluating and consummating any potential transaction or other strategic alternative will not adversely impact our business, financial condition or results of operations. Any potential transaction would be dependent upon a number of factors that may be beyond our control, including, among other factors, market conditions, industry trends, the interest of third parties in our business, the availability of financing to potential buyers on reasonable terms, and the consent of our lenders.
In addition, while this strategic evaluation continues, we are exposed to risks and uncertainties, including potential difficulties in retaining and attracting key employees, distraction of our management from other important business activities, and potential difficulties in establishing and maintaining relationships with customers, suppliers, lenders, sureties and other third parties, all of which could harm our business.
Our backlog is subject to unexpected adjustments and cancellations and may not be a reliable indicator of future revenues or earnings.earnings; our inability to deliver our backlog on time could affect our future sales and profitability, and our relationships with our customers.
Our backlog was $530.5 million as of December 31, 2023 and $549.1 million at December 31, 2022. Our ability to meet customer delivery schedules for our backlog is dependent on a number of factors including, but not limited to, access to the raw materials required for production, an adequately trained and capable workforce, project engineering expertise for certain large projects, sufficient manufacturing plant capacity, available subcontractors and appropriate planning and scheduling of manufacturing resources. There can be no assurance that the revenues projected in our backlog will be realized or, if realized, will result in profits. Because of contract cancellations or changes in scope andand/or schedule, we cannot predict with certainty when or if backlog will be performed. In addition, even where a contract proceeds as scheduled, it is possible that contracted parties may default and fail to pay amounts owed to us or poor contract performance could increase the cost associated with a contract. Our failure to deliver in accordance with customer expectations may result in damage to existing customer relationships and result in the loss of future business. Delays, suspensions, cancellations, payment defaults, scope changes and poor contract execution could materially reduce or eliminate the revenues and profits that we actually realize from contracts in backlog.
Reductions in our backlog due to cancellation or modification by a customer or for other reasons may adversely affect, potentially to a material extent, the revenues and earnings we actually receive from contracts included in our backlog. Many of the contracts in our backlog provide for cancellation fees in the event customers cancel contracts. These cancellation fees usually provide for reimbursement of our out-of-pocket costs, revenues for work performed prior to cancellation and a varying percentage of the profits we would have realized had the contract been completed. However, we typically have no contractual right upon cancellation to the total revenues reflected in our backlog. Contracts may remain in our backlog for extended periods of time. If we experience significant contract terminations, suspensions or scope adjustments to contracts reflected in our backlog, our financial condition, results of operations and cash flows may be adversely impacted.
Our inability to deliver our backlog on time could affect our future sales and profitability, and our relationships with our customers.
Our backlog was $639 million at December 31, 2021 and $535 million at December 31, 2020. Our ability to meet customer delivery schedules for our backlog is dependent on a number of factors including, but not limited to, access to the raw materials required for production, an adequately trained and capable workforce, project engineering expertise for certain large projects, sufficient internal manufacturing plant capacity, available subcontractors and appropriate planning and scheduling of manufacturing resources. Our failure to deliver in accordance with customer expectations may result in damage to existing customer relationships and result in the loss of future business. Failure to deliver backlog in accordance with expectations could negatively impact our financial performance and cause adverse changes in the market price of our common stock.
Our operations are subject to operatingvarious risks, which could expose us to potentially significant professional liability, product liability, warranty and other claims. Our insurance coverage may not be inadequate to cover all of our significant risks, our insurers may deny coverage of material losses we incur, or we may be unable to obtain additional insurance coverage in the future, any of which could adversely affect our profitability and overall financial condition.
We engineer, construct and perform services in, and provide products for, large industrial facilities where accidents or system failures can have significant consequences. Risks inherent in our operations include:
•accidents resulting in injury or the loss of life or property;
•environmental or toxic tort claims, including delayed manifestation claims for personal injury or loss of life;
•pollution or other environmental mishaps;
•adverse weather conditions;
•mechanical failures;
•property losses;
•business interruption due to political action or other reasons; and
•labor stoppages.
Any accident or failure at a site where we have provided products or services could result in significant professional liability, product liability, warranty and other claims against us, regardless of whether our products or services caused the incident. We have been, and in the future, we may be, named as defendants in lawsuits asserting large claims as a result of litigation arising from events such as those listed above. Such claims may damage our reputation, regardless of whether we are ultimately deemed responsible.
We endeavor to identify and obtain in established markets insurance agreements to cover significant risks and liabilities. Insurance against some of the risks inherent in our operations is either unavailable or available only at rates or on terms that we consider uneconomical. Also, catastrophic events customarily result in decreased coverage limits, more limited coverage, additional exclusions in coverage, increased premium costs and increased deductibles and self-insured retentions. Risks that we have frequently found difficult to cost-effectively insure against include, but are not limited to, business interruption, including interruptions related to health crises and other global events, property losses from wind, flood and earthquake events, war and confiscation or seizure of property in some areas of the world, pollution liability, liabilities related to occupational health exposures (including asbestos), the failure, misuse or unavailability of our information systems, the failure of security measures designed to protect our information systems from cybersecurity threats, and liability related to risk of loss of our work in progress and customer-owned materials in our care, custody and control. Depending on competitive conditions and other factors, we endeavor to obtain contractual protection against uninsured risks from our customers. When obtained, such contractual indemnification protection may not be as broad as we desire or may not be supported by adequate insurance maintained by the customer. Such insurance or contractual indemnity protection may not be sufficient or effective under all circumstances or against all hazards to which we may be subject. A successful claim for which we are not insured or for which we are underinsured could have a material adverse effect on us. Additionally, disputes with insurance carriers over coverage may affect the timing of cash flows and, if litigation with the carrier becomes necessary, an outcome unfavorable to us may have a material adverse effect on our results of operations. Moreover, certain accidents or failures, including accidents resulting in bodily injury or harm, could disqualify us from continuing business with customers, and any losses arising thereby may not be covered by insurance or other indemnification.
Our wholly-owned captive insurance subsidiary provides workers' compensation, employer's liability, commercial general liability, professional liability and automotive liability insurance to support our operations. We may also have business reasons in the future to have our insurance subsidiary accept other risks which we cannot or do not wish to transfer to outside insurance companies. These risks may be considerable in any given year or cumulatively. Our insurance subsidiary has not provided significant amounts of insurance to unrelated parties. Claims as a result of our operations could adversely impact the ability of our insurance subsidiary to respond to all claims presented.
Additionally, upon the February 22, 2006 effectiveness of the settlement relating to the Chapter 11 proceedings involving several of our subsidiaries, most of our subsidiaries contributed substantial insurance rights to the asbestos personal injury trust, including rights to (1) certain pre-1979 primary and excess insurance coverages and (2) certain of our 1979-1986 excess insurance coverage. These insurance rights provided coverage for, among other things, asbestos and other personal injury claims, subject to the terms and conditions of the policies. The contribution of these insurance rights was made in exchange for the agreement on the part of the representatives of the asbestos claimants, including the representative of future claimants, to the entry of a permanent injunction, pursuant to Section 524(g) of the United States Bankruptcy Code, to channel to the asbestos trust all asbestos-related claims against our subsidiaries and former subsidiaries arising out of, resulting from or attributable to their operations, and the implementation of related releases and indemnification provisions protecting those
subsidiaries and their affiliates from future liability for such claims. Although we are not aware of any significant, unresolved claims against our subsidiaries and former subsidiaries that are not subject to the channeling injunction and that relate to the periods during which such excess insurance coverage related, with the contribution of these insurance rights to the asbestos personal injury trust, it is possible that we could have underinsured or uninsured exposure for non-derivative asbestos claims or other personal injury or other claims that would have been insured under these coverages had the insurance rights not been contributed to the asbestos personal injury trust.
We may not be able to compete successfully against current and future competitors.
Some of our competitors or potential competitors have greater financial or other resources than we have and in some cases are government supported. Our operations may be adversely affected if our current competitors or new market entrants introduce new products or services with better features, performance, prices or other characteristics than those of our products and services. Furthermore, we operate in industries where capital investment is critical. We may not be able to obtain as much purchasing and borrowing leverage and access to capital for investment as other companies, which may impair our ability to compete against competitors or potential competitors.
If we fail to develop new products, or customers do not accept our new products,them, our business could be adversely affected.
Our ability to develop innovative new products can affect our competitive position and often requires the investment of significant resources. Difficulties or delays in research, development, production or commercialization of new products, or failure to gain market acceptance of new products and technologies, may reduce future sales and adversely affect our competitive position. There can be no assurance that we will have sufficient resources to make such investments, that we will be able to make the technological advances necessary to maintain competitive advantages or that we can recover major research and development expenses. If we fail to make innovations, launch products with quality problems, experience development cost overruns, or the market does not accept our new products, then our financial condition, results of operations, cash flows and liquidity could be adversely affected.
Our business, financial condition and results of operations, and those of our customers, suppliers and vendors, have been, and could continue to be, adversely affected by public health crises, including a pandemic.
Our business has been, and could in the future be, adversely impacted by public health crises, including viral outbreaks such as a pandemic. Measures taken to control the spread of infectious disease, including mandatory closures, work-from-home orders and social distancing protocols vary widely and have in the past been subject to significant changes depending on circumstances outside of our control, including changes in the severity of outbreaks in impacted countries and localities. Any such restrictions, including limitations on travel and curtailment of other activity could negatively impact our ability to conduct business. Furthermore, disruptions in our supply chain, could negatively impact our ability to secure raw materials and supplies, which could result in increased costs and the loss of sales and customers. The duration and scope of a pandemic or any other future public health crisis cannot be predicted, and therefore, any anticipated negative financial impact to our operating results cannot be reasonably estimated.
Risks Related to Our Industry
We derive substantial revenues from electric power generating companies and other steam-using industries, including coal-fired power plants in particular. Demand for our products and services depends on spending in these historically cyclical industries. Additionally, recent legislative and regulatory developments relating to clean air legislation are affecting industry plans for spending on coal-fired power plants within the United States and elsewhere.
The demand for power generation products and services depends primarily on the spending of electric power generating companies and other steam-using industries and expenditures by original equipment manufacturers. These expenditures are influenced by such factors including, but not limited to:
•prices for electricity, along with the cost of production and distribution;
•prices for natural resources such as coal and natural gas;
•demand for electricity and other end products of steam-generating facilities;
•availability of other sources of electricity or other end products;
•requirements of environmental legislation and regulations, including potential requirements applicable to carbon dioxide emissions;
•investments in renewable energy sources and technology;
•impact of potential regional, state, national and/or global requirements to significantly limit or reduce greenhouse gas emissions in the future;
•level of capacity utilization and associated operations and maintenance expenditures of power generating companies and other steam-using facilities;
•requirements for maintenance and upkeep at operating power plants and other steam-using facilities to combat the accumulated effects of wear and tear;
•ability of electric generating companies and other steam users to raise capital; and
•relative prices of fuels used in boilers, compared to prices for fuels used in gas turbines and other alternative forms of generation.
We estimate that 47%45%, 43%38% and 45%47% of our consolidated revenues in 2021, 20202023, 2022 and 2019,2021 respectively, were related to coal-fired power plants. The abundant availability of natural gas in great supply has caused from time to time, in part, low prices for natural gas in the United
States, which has led to more demand for natural gas relative to energy derived from coal. A material decline in spending by electric power generating companies and other steam-using industries on coal-fired power plants over a sustained period of time could materially and adversely affect the demand for our power generation products and services and, therefore, our financial condition, results of operations and cash flows. Coal-fired power plants have been scrutinized by environmental groups and government regulators over the emissions of potentially harmful pollutants.pollutants and the disposal of waste ash from the combustion process. This scrutiny and other economic incentives including tax advantages, have promoted the growth of nuclear, wind, solar and solarnuclear power, among others, and a decline in cost of renewable power plant components and power storage. The recent economic environment and uncertainty concerning new environmental legislation or replacement rules or regulations in the United States and elsewhere has caused many of our major customers, principally electric utilities, to delay making substantial expenditures for new plants, and delay upgrades to existing power plants.
Demand for our products and services is vulnerable to macroeconomic downturns and industry conditions.
Demand for our products and services has been, and we expect that demand will continue to be, subject to significant fluctuations due to a variety of factors beyond our control, including macroeconomic and industry conditions. These factors include,conditions, including but are not limited to, the cyclical nature of the industries we serve, inflation, geopolitical issues, the availability and cost of credit, volatile oil and natural gas prices, low business and consumer confidence, high unemployment levels and energy conservation measures.
Unfavorable macroeconomic conditions may lead customers to delay, curtail or cancel proposed or existing contracts, which may decrease the overall demand for our products and services and adversely affect our results of operations.
In addition, our customers may find it more difficult to raise capital in the future due to limitations on the availability of credit, increases in interest rates and other factors affecting the federal, municipal and corporate credit markets. Also, our customers may demand more favorable pricing terms and find it increasingly difficult to timely pay invoices for our products and services, which would impact our future cash flows and liquidity. Inflation or significant changes in interest rates could reduce the demand for our products and services. Any inability to timely collect our invoices may lead to an increase in our borrowing requirements, our accounts receivable and potentially to increased write-offs of uncollectible invoices. If the economy weakens, or customer spending declines, then our backlog, revenues, net income and overall financial condition could deteriorate.
Supply chain issues, including shortages of adequate component supply that increase our costs or cause delays in our ability to fulfill orders, andand/or our failure to estimate customer demand properly may result could have an adverse impact on our business and operating results and our relationships with customers.
We are reliantrely on our supply chain for components and raw materials to manufacture our products and provide services to our customers, and this reliancesupplier underperformance could have an adverse impact on our business and operating results. A reduction or interruption in supply, including disruptions due to a pandemic, geopolitical conflicts (including the COVID-19 pandemic,ongoing conflicts in Ukraine and the Middle East), a significant natural disaster, shortages in global freight capacity, significant increases in the price of critical components and raw materials, a failure to appropriately forecast or adjust our requirements for components or raw materials based on our business needs or volatility in demand for our products could materially adversely affect our business, operating results, and financial condition and could materially damage customer relationships. Our vendors also may be unable to meet our demand, significantly increase lead times for deliveries or impose significant price increases we are unable to offset through alternate sources of supply, price increases to our customers or increased productivity in our operations.
Our operations use raw materials in various forms and components and accessories for assembly, which are available from numerous sources. We generally purchase these raw materials and components as-needed for individual contracts. We do not depend on a single source of supply for any significant raw materials. Although no serious shortage exists at the presentthis time, growth or volatility in the global economy may exacerbate pressures on us and our suppliers, which could affect our operating and financial results.
Risks Related to Our Liquidity and Capital ResourcesFinancial Condition
The financial and other covenants in our debt agreements may adversely affect us.
Our Debt Facilities contain financial and other restrictive covenants. These covenants could limit our financial and operating flexibility as well as our ability to plan for and react to market conditions, meet our capital needs and support our strategic priorities and initiatives should we take on additional indebtedness for acquisition or other strategic objectives. Our failure to comply with these covenants also could result in events of default which, if not cured or waived, could require us to repay indebtedness before its due date, and we may not have the financial resources or otherwise be able to arrange alternative financing to do so. Our compliance with the covenants of our Debt Facilities may be adversely affected by severe market contractions or disruptions to the extent they reduce our earnings for a prolonged period and we are not able to reduce our debt levels or cost structure accordingly. Any event that requires us to repay any of our debt before it is due could require us to borrow additional amounts at unfavorable borrowing terms, cause a significant reduction in our liquidity and impair our ability to pay amounts due on our indebtedness. Moreover, if we are required to repay any of our debt before it becomes due, we may be unable to borrow additional amounts or otherwise obtain the cash necessary to repay that debt, when due, which could have a material adverse effect on our business, financial condition and liquidity.
We must refinance our 8.125% Notes due 2026 and 6.50% Notes due 2026 prior to their maturity.
As described in Note 15 to the Consolidated Financial Statements included in Part II, Item 8 of this Annual Report, during 2021, we completed offerings of $151.2 million aggregate principal amount of our 8.125% senior notes due 2026 (“8.125% Senior Notes”) and $151.4 million aggregate principal amount of our 6.50% senior notes due in 2026 (the “6.50% Senior Notes” and, together with the 8.125% Senior Notes, the “Notes Due 2026”). In addition to the completed sales, we issued $35.0 million of the 8.125% Senior Notes to B. Riley, a related party, in exchange for a deemed prepayment of our then-existing Last Out Term Loan Tranche A-3. Depending on our future financial condition and results of operations, we may be unable to refinance our Notes Due 2026 on or prior to their maturity or at all.
In January 2024, we entered into a Credit Agreement with Axos Bank, as described in Note 25 to the Consolidated Financial Statements included in Part II, Item 8 of this Annual Report. The maturity date of the Credit Agreement is January 18, 2027, provided that if as of August 30, 2025, the Notes Due 2026 have not been refinanced pursuant to a Permitted Refinancing, as defined in the Credit Agreement, or the maturity date of all of the Notes Due 2026 has not been otherwise extended to a date on or after July 18, 2027, then the maturity date of the Credit Agreement is August 30, 2025.
There can be no assurance that our efforts to improve our financial position will be successful or that we will be able to obtain additional capital in the future on commercially reasonable terms or at all. If we are unable to refinance our Notes Due 2026 on commercially reasonable terms or at all, it may materially and adversely affect our reputation, liquidity, business, financial condition or results of operations, we may breach our obligations under either of the Notes Due 2026 and it may be necessary for us to reorganize, including through bankruptcy proceedings.
Maintaining adequate bonding and letter of credit capacity is necessary for us to successfully complete, bid on, win and wincomplete various contracts.
In line with industry practice, we are often required to post standby letters of credit and surety bonds to support contractual obligations to customers as well as other obligations. The aggregate value of all such letters of credit and bank guarantees outside of our Letter of Credit Agreement as of December 31, 2023, was $39.4 million. The aggregate value of the outstanding letters of credit provided under the Letter of Credit Agreement backstopping letters of credit or bank guarantees was $21.7 million as of December 31, 2023. Of the outstanding letters of credit issued under the Letter of Credit Agreement, $54.0 million are subject to foreign currency revaluation. We have also posted surety bonds to support contractual obligations to customers relating to certain contracts. We, and certain of our subsidiaries, have jointly executed general agreements of indemnity in favor of surety underwriters relating to surety bonds those underwriters issue in support of some of our contracting activity. As of December 31, 2023, bonds issued and outstanding under these arrangements in support of contracts totaled approximately $141.7 million. The aggregate value of the letters of credit backstopping surety bonds was
$16.8 million. These letters of credit and bonds generally indemnify customers should we fail to perform our obligations under the applicable contracts. If a letter of credit or bond is required for a particular contract and we are unable to obtain it due to insufficient liquidity or other reasons, we will not be able to pursue that contract, or we could default on contracts that are underway or that have been awarded.awarded or are underway. We utilize bonding facilities, but, as is typically the case, the issuance of bonds under each of those facilities is at the surety’s sole discretion. Moreover, due to events that affect the insurance and bonding and credit markets generally, bonding and letters of credit may be more difficult to obtain in the future or may only be available at significant additional cost. Our inability to obtain or maintain adequate letters of credit and bonding and, as a result, to bid on new work could have a material adverse effect on our business, financial condition and results of operations. The aggregate value of all such letters of credit and bank guarantees outside of our Letter of Credit Agreement as of December 31, 2021 was $52.8 million. The aggregate value of the outstanding letters of credit provided under the Letter of Credit Agreement backstopping letters of credit or bank guarantees was $35.5 million as of December 31, 2021. Of the outstanding letters of credit issued under the Letter of Credit Agreement, $51.5 million are subject to foreign currency revaluation.
We have also posted surety bonds to support contractual obligations to customers relating to certain contracts. We utilize bonding facilities to support such obligations, but the issuance of bonds under those facilities is typically at the surety's discretion. These bonds generally indemnify customers should we fail to perform our obligations under the applicable contracts. We, and certain of our subsidiaries, have jointly executed general agreements of indemnity in favor of surety underwriters relating to surety bonds those underwriters issue in support of some of our contracting activity. As of December 31, 2021, bonds issued and outstanding under these arrangements in support of contracts totaled approximately $188.3 million. The aggregate value of the letters of credit backstopping surety bonds was $13.1 million.
Our ability to obtain and maintain sufficient capacity under our debt facilitiesDebt Facilities is essential to allow us to support the issuance of letters of credit, bank guarantees and surety bonds. Without sufficient capacity, our ability to support contract security requirements in the future will be diminished.
Our evaluation of strategic alternatives for certain businesses and non-core assets may not be successful.
We continue to evaluate strategic alternatives for our business lines and assets to improve the Company's capital structure. There can be no assurance that these ongoing strategic evaluations will result in the identification or consummation of any transaction. We may incur substantial expenses associated with identifying and evaluating potential strategic alternatives. The process of exploring strategic alternatives may be time consuming and disruptive to our business operations, and if we are unable to effectively manage the process, our business, financial condition and results of operations could be adversely affected. We cannot assure that any potential transaction or other strategic alternative, if identified, evaluated and consummated, will prove to be beneficial to shareholders and that the process of identifying, evaluating and consummating any potential transaction or other strategic alternative will not adversely impact our business, financial condition or results of operations. Any potential transaction would be dependent upon a number of factors that may be beyond our control, including, among other factors, market conditions, industry trends, the interest of third parties in our business, the availability of financing to potential buyers on reasonable terms, and the consent of our lenders.
In addition, while this strategic evaluation continues, we are exposed to risks and uncertainties, including potential difficulties in retaining and attracting key employees, distraction of our management from other important business activities, and potential difficulties in establishing and maintaining relationships with customers, suppliers, lenders, sureties and other third parties, all of which could harm our business.
Our total assets include goodwill and other indefinite-lived intangible assets. If we determine these have become impaired, our business, financial condition and results of operations could be materially adversely affected.
Goodwill represents the excess of cost over the fair market value of net assets acquired in business combinations. Indefinite-lived intangibles are comprised of certain trademarks and tradenames. AtAs of December 31, 2021,2023, goodwill and other indefinite-lived intangible assets totaled $160.3$147.6 million. We review goodwill and other intangible assets at least annually for impairment and any excess in carrying value over the estimated fair value is charged to the Consolidated Statement of
Operations. No indicators of goodwill impairment were identified for our reporting units at the measurement date, other than for B&W Solar. We recorded a goodwill impairment of $56.6 million in the third quarter of 2023, largely due to continued underperformance and the decision to sell B&W Solar and classify it as a discontinued operation in the Consolidated Financial Statements. Future impairment may result from, among other things, deterioration in the performance of an acquired business or product line, adverse market conditions and changes in the competitive landscape, adverse changes in applicable laws or regulations, including changes that restrict the activities of an acquired business or product line, and a variety of other circumstances. If the value of our business were to decline, or if we were to determine that we were unable to recognize an amount in connection with any proposed disposition in excess of the carrying value of any disposed asset, we may be required to recognize impairments for one or more of our assets that may adversely impact our business, financial condition and results of operations.
We are exposed to credit risk and may incur losses as a result of such exposure.
We conduct our business by obtaining orders that generate cash flows in the form of advances, contract progress payments and final balancespayments in accordance with the underlying contractual terms. We are thus exposed to potential losses resulting from contractual counterparties' failure to meet their obligations. As a result, the failure by customers to meet their payment obligations or a mereto delay in making those payments, which could reduce our liquidity and increase the need to resort to other sources of financing, with possible adverse effects on our business, financial condition, results of operations and cash flows. In some cases, we have joint and several liability with consortium partners in our projects and we may be subject to additional losses if our partners are unable to meet their contractual obligations.
In addition, the deterioration of macroeconomic conditions or negative trends in the global credit markets could have a negative impact on relationships with customers and our ability to collect on trade receivables, with possible adverse effects on our business, financial condition, results of operations and cash flows.
The transition away from LIBOR may negatively impact our operating results.
LIBOR, the London interbank offered rate, is the interest rate benchmark used as a reference rate on our variable rate debt. On March 5, 2021, the United Kingdom’s Financial Conduct Authority, which regulates LIBOR, and administrator, ICE Benchmark Administration, announced that the publication of one-week and two-month USD LIBOR maturities and the non-USD LIBOR maturities will cease immediately after December 31, 2021, with the publication of overnight, one-, three-, six-, and 12-month USD LIBOR ceasing immediately after June 30, 2023. The United States Federal Reserve also issued a statement advising banks to stop new USD LIBOR issuances by the end of 2021.
At this time, no consensus exists as to what rate or rates will become accepted alternatives to LIBOR, although the U.S. Federal Reserve, in connection with the Alternative Reference Rates Committee, a steering committee comprised of large U.S. financial institutions, is considering replacing U.S. dollar LIBOR with the Secured Overnight Financing Rate (“SOFR”). In addition, recent New York state legislation effectively codified the use of SOFR as the alternative to LIBOR in the absence of another chosen replacement rate, which may affect contracts governed by New York state law. SOFR is calculated based on short-term repurchase agreements, backed by Treasury securities. SOFR is observed and backward looking, which stands in contrast with LIBOR under the current methodology, which is an estimated forward-looking rate and relies, to some degree, on the expert judgment of submitting panel members. Given the inherent differences between LIBOR and SOFR or any other alternative benchmark rate that may be established, there are many uncertainties regarding a transition from LIBOR, including, but not limited to, the need to amend all debt instruments with LIBOR as the referenced rate and how this will impact our cost of variable rate debt. We will also need to consider any new contracts and whether they should reference an alternative benchmark rate or include suggested fallback language, as published by the Alternative Reference Rates Committee. The consequences of these developments with respect to LIBOR cannot be entirely predicted and span multiple future periods but could result in an increase in the cost of our variable rate debt which may be detrimental to our financial position or operating results.
As of December 31, 2021, no borrowings have occurred under the Revolving Credit Agreement which are currently subject to changes in LIBOR. Our senior notes have fixed interest rates and are not subject to changes in LIBOR or other benchmarks.
The financial and other covenants in our debt agreements may adversely affect us.
Our Debt Facilities contain financial and other restrictive covenants. These covenants could limit our financial and operating flexibility as well as our ability to plan for and react to market conditions, meet our capital needs and support our strategic priorities and initiatives should we take on additional indebtedness for acquisition or other strategic objectives. Our failure to comply with these covenants also could result in events of default which, if not cured or waived, could require us to repay
indebtedness before its due date, and we may not have the financial resources or otherwise be able to arrange alternative financing to do so. Our compliance with the covenants of our Debt Facilities may be adversely affected by severe market contractions or disruptions, such as those caused by the COVID-19 pandemic, to the extent they reduce our earnings for a prolonged period and we are not able to reduce our debt levels or cost structure accordingly. Any event that requires us to repay any of our debt before it is due could require us to borrow additional amounts at unfavorable borrowing terms, cause a significant reduction in our liquidity and impair our ability to pay amounts due on our indebtedness. Moreover, if we are required to repay any of our debt before it becomes due, we may be unable to borrow additional amounts or otherwise obtain the cash necessary to repay that debt, when due, which could have a material adverse effect on our business, financial condition and liquidity.
Risks Related to Intellectual Property and Information Security
A disruption in, or failure of our information technology systems, including those related to cybersecurity, could adversely affect our business operations and financial performance.
We rely on information technology networks and systems, including the Internet, to process, transmit and store electronic sensitive and confidential information, to manage and support a variety of business processes and activities and to comply with regulatory, legal and tax requirements. While we maintain some of our critical information technology systems, we are also dependent on third parties to provide important information technology services relating to, among other things, human resources, electronic communications and certain finance functions.
We face various threats to our information technology networks and systems, including cyber threats, ransomware attacks, phishing attacks, threats to the physical security of our facilities and infrastructure from natural or man-made incidents or disasters, and threats from insider and terrorist acts, as well as the potential for business disruptions associated with these threats. We have been, and will likely continue to be, subject to cyber-based attackscybersecurity threats and other attempts to threaten our information technology systems and the software we sell.systems. A cyber-based attackcybersecurity incident could include attempts to gain unauthorized access to our proprietary information and personal data that we process and maintain, attacks from malicious third parties using sophisticated, targeted methods to circumvent firewalls, encryption and other security defenses, including hacking, fraud, phishing scams or other forms of deception. Although we utilize a combination of tailored and industry standard security measures and technology to monitor and mitigate these threats, we cannot guarantee that these measures and technology will be sufficient to prevent current and future threats to our information technology networks and systems from materializing. Furthermore, we may have little or no oversight with respect toinput into security measures employed by third-party service providers, which maycould ultimately prove to be ineffective at countering threats.a vector of a cybersecurity threat or cybersecurity incident.
If these information systems are damaged, intruded upon, attacked, shutdown or cease to function properly, whether by misconfiguration, planned upgrades, force majeure events, telecommunication failures, hardware or software beak-insmalware or viruses, or other cybersecurity incidents and our business continuity plans do not resolvemitigate the issues in a timely manner, the services we provide to customers, the value of our investment in research and development efforts and other intellectual property, our product sales, our ability to comply with regulations related to information contained on our information technology networks and systems, our financial condition, results of operations and stock price may be materially and adversely affected, and we could experience delays in reporting our financial results. In addition, there is a risk of business interruption, litigation with third parties, reputational damage from leakagesecurity breaches involves personal data or loss of confidential information or the software we selluse being compromised, and increased cybersecurity protection and remediation costs due to the increasing sophistication and proliferation of threats. The costs related to cyber or other security threats or disruptions may not be fully insured or indemnified by other means.
To address risks to our information technology systems, we continue to invest in our systems and training of companyour personnel. As required,necessary, we replace and/or upgrade financial, human resources and other information technology systems. These activities subject us to inherent costs and risks associated with replacing and updating these systems, including potential disruption of our internal control structure, substantial capital expenditures, demands on management time and other risks of delays or difficulties in transitioning to new systems or of integrating new systems into our current systems. Our systems implementations and upgrades may not result in productivity improvements at the levels anticipated, or at all. In addition, the implementation of new technology systems may cause disruptions in our business operations. Such disruption and any other information technology system disruptions, and our ability to mitigate those disruptions, if not anticipated and appropriately mitigated, could have a material adverse effect on our financial condition, results of operations and stock price.
Privacy and information security laws are complex, and if we fail to comply with applicable laws, regulations and standards, or if we fail to properly maintain the integrity of our data, protect our proprietary rights to our systems or defend against cybersecurity attacks, we may be subject to government or private actions due to privacy and security breaches, any of which could have a material adverse effect on our business, financial condition and results of operations or materially harm our reputation.breaches.
We are subject to a variety of laws and regulations in the United States and other countries that involve matters central to our business, including user privacy, security, rights of publicity, data protection, content, intellectual property, distribution, electronic contracts and other communications, competition, protection of minors, consumer protection, taxation, and online-payment services. These laws can be particularly restrictive in countries outside the United States. Both in the United States and abroad, these laws and regulations constantly evolve and remain subject to significant change.evolve. In addition, the application and interpretation of these laws and regulations are often uncertain, particularly in the new and rapidly evolving industry in which we operate. Because we store, process, and use data, some of which contains personal information, we are subject to complex and evolving federal, state, and foreign laws and regulations regarding privacy, data protection, content, and other matters. Many of these laws and regulations are subject to change and uncertain interpretation, andwhich could result in investigations, claims, changes to our business practices, increased cost of operations, and declines in user growth, retention, or engagement,reputational damage, any of which could seriously harm our business.
Several proposals have been adopted or are currently pending before federal, state, and foreign legislative and regulatory bodies that could significantly affect our business. The General Data Protection Regulation, or GDPR, in the European Union, which went into effect on May 25, 2018, placed new data protection obligations and restrictions on organizations.organizations, including restrictions on the cross-border transfer of information. Similar obligations and restrictions exist under United Kingdom data protection law, including the UK GDPR and the UK Data Protection Act. If we are not compliant with GDPR or UK GDPR requirements, we may be subject to significant fines and our business may be seriously harmed. We are certified under and currently rely upon the EU-U.S. Data Privacy Framework ("EU-U.S. DPF") and/or the UK Extension of the EU-U.S. DPF, as well as certain approved forms of data protection agreements, called Standard Contractual Clauses, for
data transfers from EU and UK to the US. These transfer mechanisms may be subject to challenge or invalidation, which may restrict the transfer of personal data which could impact our operations and increase our costs.
In addition, the California Consumer Privacy Act went into effect in January 2020, with a lookback to January 2019, and the California Privacy Rights Act placed additional requirements on the handling of personal data, including employee data. Similar laws have passed in Virginia, Connecticut, Utah and Colorado, and have been enacted or proposed in other states and at the federal level, reflecting a trend toward more stringent privacy legislation in the United States.
We rely on intellectual property law and confidentiality agreements to protect our intellectual property. We also rely on intellectual property we license from third parties. Our failure to protect our intellectual property rights, or our inability to obtain or renew licenses to use intellectual property of third parties, could adversely affect our business.
Our success depends, in part, on our ability to protect our proprietary information and other intellectual property. Our intellectual property could be stolen, challenged, invalidated, circumvented or rendered unenforceable. In addition, effective intellectual property protection may be limited or unavailable in some foreign countries where we operate.
Our failure to protect our intellectual property rights may result in the loss of valuable technologies or adversely affect our competitive business position. We rely significantly on proprietary technology, information, processes and know-how that are not subject to patent or copyright protection. We seek to protect this information through trade secret or confidentiality agreements with our employees, consultants, subcontractors or other parties, as well as through other security measures. These agreements and security measures may be inadequate to deter or prevent misappropriation of our confidential information. In the event of an infringement of our intellectual property rights, a breach of a confidentiality agreement or divulgence of proprietary information, we may not have adequate legal remedies to protect our intellectual property. Litigation to determine the scope of intellectual property rights, even if ultimately successful, could be costly and could divert management's attention away from other aspects of our business. In addition, our trade secrets may otherwise become known or be independently developed by competitors.
In some instances, we have augmented our technology base by licensing the proprietary intellectual property of third parties. In the future, we may not be able to obtain necessary licenses on commercially reasonable terms, which could have a material adverse effect on our operations.
Risks Related to Government Regulation
We are subject to government regulations that may adversely affect our future operations.
Many aspects of our operations and properties are affected by political developments and are subject to both domestic and foreign governmental regulations, including those relating to:
•the construction and manufacture of renewable, environmental and thermal products;
•clean air and other environmental protection legislation;
•taxation of domestic and foreign earnings;
•tariffs, duties, or trade sanctions and other trade barriers imposed by foreign countries that restrict or prohibit business transactions in certain markets;markets or in certain goods;
•user privacy, security, data protection, content, and online-payment services;
•intellectual property;
•transactions in or with foreign countries or officials; and
•use of local employees and suppliers.
In addition, a substantial portion of the demand for our products and services is from electric power generating companies and other steam-using customers. The demand for power generation products and services can be influenced by governmental legislation setting requirements for utilities related to operations, emissions and environmental impacts. The legislative process is unpredictable and includes a platform that continuously seeks to increase the restrictions on power producers. Potential legislation limiting emissions from power plants, including carbon dioxide, could affect our markets and the demand for our products and services related to power generation.
We cannot determine the extent to which our future operations and earnings may be affected by new legislation, new regulations or changes in existing regulations.regulations, but it could be material.
Our business and our customers’ businesses are required to obtain, and to comply with, national, state and local government permits and approvals.
Our business and our customers’ businesses are required to obtain, and to comply with, national, state and local government permits and approvals. Any of these permits or approvals may be subject to denial, revocation or modification under various circumstances. Failure to obtain or comply with the conditions of permits or approvals may adversely affect our operations by temporarily suspending our activities or curtailing our work and may subject us to penalties and other sanctions. Although existing licenses are routinely renewed by various regulators, renewal could be denied or jeopardized by various factors, including, but not limited to:
•failure to comply with environmental and safety laws and regulations or permit conditions;
•local community, political or other opposition;
•executive action; and
•legislative action.
In addition, if new environmental legislation or regulations are enacted or implemented, or existing laws or regulations are amended or are interpreted or enforced differently or if new environmental legislation or regulations are enacted or implemented, we or our customers may be also required to obtain additional operating permits or approvals. Our inability or our customers' inabilitySee "Risks Related to obtain, and to comply with, the permits and approvals requiredEnvironmental Regulation" below for our business could have a material adverse effect on us.further information.
Risks Related to Environmental Regulation
Our operations are subject to various environmental laws and legislation that may become more stringent in the future.
Our operations and properties are subject to a wide variety of increasingly complex and stringent foreign, federal, state and local environmental laws and regulations, including those governing discharges into the air and water, the handling and disposal of solid and hazardous wastes, the remediation of soil and groundwater contaminated by hazardous substances and the health and safety of employees. Sanctions for noncompliance may include revocation of permits, corrective action orders, administrative or civil penalties and criminal prosecution. Some environmental laws provide for strict, joint and several liability for remediation of spills and other releases of hazardous substances, as well as damage to natural resources. In addition, companies may be subject to claims alleging personal injury or property damage as a result of alleged exposure to hazardous substances. Such laws and regulations may also expose us to liability for the conduct of or conditions caused by others or for our acts that were in compliance with all applicable laws at the time such acts were performed.
We cannot predict all of the environmental requirements or circumstances that will exist in the future but anticipate that environmental control and protection standards will become increasingly stringent and costly. Based on our experience to date, we do not currently anticipate any material adverse effect on our business or financial condition as a result of future compliance with existing environmental laws and regulations. However, future events, such as changes in existing laws and regulations or their interpretation, more vigorous enforcement policies of regulatory agencies or stricter or different interpretations of existing laws and regulations, may require additional expenditures by us, which may be material. Accordingly, we can provide no assurance that we will not incur significant environmental compliance costs in the future.
Our operations involve the handling, transportation and disposal of hazardous materials, and environmental laws and regulations and civil liability for contamination of the environment or related personal injuries may result in increases in our operating costs and capital expenditures and decreases in our earnings and cash flows.
Our operations involve the handling, transportation and disposal of hazardous materials. Failure to properly handle these materials could pose a health risk to humans or wildlife and could cause personal injury and property damage (including environmental contamination). If an accident were to occur, its severity could be significantly affected by the volume of the materials and the speed of corrective action taken by emergency response personnel, as well as other factors beyond our control, such as weather and wind conditions. Actions taken in response to an accident could result in significant costs.
Governmental requirements relating to the protection of the environment, including solid waste management, air quality, water quality and cleanup of contaminated sites, have in the past had a substantial impact on our operations. These requirements are complex and subject to frequent change. In some cases, they can impose liability for the entire cost of cleanup on any responsible party without regard to negligence or fault and impose liability on us for the conduct of others or conditions others have caused, or for our acts that complied with all applicable requirements when we performed them. Our compliance with amended, new or more stringent requirements, stricter interpretations of existing requirements or the future discovery of contamination may require us to make material expenditures or subject us to liabilities that we currently do not
anticipate. Such expenditures and liabilities may adversely affect our business, financial condition, results of operations and cash flows. In addition, some of our operations and the operations of predecessor owners of some of our properties have exposed us to civil claims by third parties for liability resulting from alleged contamination of the environment or personal injuries caused by releases of hazardous substances into the environment.
In our contracts, we seek to protect ourselves from liability associated with accidents, but there can be no assurance that such contractual limitations on liability will be effective in all cases or that our or our customers' insurance will cover all the liabilities we have assumed under those contracts. The costs of defending against a claim arising out of a contamination incident or precautionary evacuation, and any damages awarded as a result of such a claim, could adversely affect our results of operations and financial condition.
We maintain insurance coverage as part of our overall risk management strategy and due to requirements to maintain specific coverage in our financing agreements and in many of our contracts. These policies do not protect us against all liabilities associated with accidents or for unrelated claims. In addition, comparable insurance may not continue to be available to us in the future at acceptable prices, or at all.
Risks Related to Our International Operations
Our business may also be affected by new sanctions and export controls targeting Russia and other responses to Russia's invasion of Ukraine.
As a result of Russia's invasion of Ukraine, the United States, the United Kingdom and the European Union governments, among others, have developed coordinated sanctions and export-controlexport control measure packages.
Based on the public statements to date, these packages may include:
•comprehensive financial sanctions against Russian banks (including SWIFT cut off);
•additional designations of Russian individuals with significant business interests and government connections;
•designations of individuals and entities involved in Russian military activities;
•enhanced export controls and trade sanctions targeting Russia's import of certain goods; and
•closure of airspace to Russian aircraft.
Moreover, as the invasion of UkraineRussia-Ukraine conflict continues, there can be no certainty regarding whether such governments or other governments will impose additional sanctions, export-controlsexport controls or other economic or military measures against Russia.
We do not currently have contracts directly with Russian entities or businesses and we currently do not doconduct business in Russia directly. We believe the Company’sour only involvement with Russia or Russian-entities, involves sales of our products by a wholly-owned Italian subsidiary of the Company to non-Russian counterparties who may resell our products to Russian entities or perform services in Russia using our products. The economic sanctions and export-control measures and the
ongoing invasion of Ukraine could impact our subsidiary’s rights and responsibilities under the contracts and could result in potential losses to the Company.us.
The impact of the invasion of Ukraine,Russia-Ukraine conflict, including economic sanctions and export controls or additional war or military conflict, as well as potential responses to them by Russia, is currently unknown and they could adversely affect our business, supply chain, partners or customers. In addition, the continuation of the invasion of Ukraine by RussiaRussia-Ukraine conflict could lead to other disruptions, instability and volatility in global markets and industries that could negatively impact our operations.
We could be adversely affected by violations of the United States Foreign Corrupt Practices Act, the UK Anti-Bribery Act or other anti-bribery laws.
The United StatesU.S. Foreign Corrupt Practices Act (the “FCPA”) generally prohibits companies and their intermediaries from making improper payments to non-United States government officials. Our training program, audit process and policies mandate compliance with the FCPA, the UK Anti-Bribery Act (the “UK Act”) and other anti-bribery laws. We operate in some parts of the world that have experienced governmental corruption to some degree, and, in some circumstances, strict compliance with anti-bribery laws may conflict with local customs and practices. If we are found to be liable for violations of the FCPA, the UK Act or other anti-bribery laws (either due to our own acts or our inadvertence, or due to the acts or inadvertence of others, including agents, promoters or employees of our joint ventures), we could suffer from civil and criminal penalties or other sanctions.
Our international operations are subject to political, economic and other uncertainties not generally encountered in our domestic operations.
We derive a substantial portion of our revenues from international operations, and we intend to continue to expand our international presence and customer base as part of our growth strategy. Our revenues from sales to customers located outside of the United StatesU.S. represented approximately 40%49%, 45%46% and 46%41% of total revenues for the years ended December 31, 2021, 20202023, 2022 and 2019,2021, respectively. Operating in international markets requires significant resources and management attention and subjects us to political, economic and regulatory risks that are not generally encountered in our United StatesU.S. operations. These include, but are not limited to:
•risks of war, terrorism and civil unrest;
•expropriation, confiscation or nationalization of our assets;
•renegotiation or nullification of our existing contracts;
•changing political conditions and changing laws and policies affecting trade and investment;
•overlap of different tax structures;
•risk of changes in foreign currency exchange rates; and
•tariffs, price controls and trade agreements and disputes.
Various foreign jurisdictions have laws limiting the right and ability of foreign subsidiaries and joint ventures to pay dividends and remit earnings to affiliated companies. Our international operations sometimes face the additional risks of fluctuating currency values, hard currency shortages and controls of foreign currency exchange. If we continue to expand our business globally, our success will depend, in part, on our ability to anticipate and effectively manage these and other risks. These and other factors may have a material impact on our international operations or our business as a whole.
International uncertainties and fluctuationsFluctuations in the value of foreign currencies could harm our profitability.
We have international operations primarily in Europe, Canada, and Mexico. For the year ended December 31, 2021,2023, international operations accounted for approximately 40%49% of our total revenues. Our significant international subsidiaries may have sales and cost of sales in different currencies as well as other transactions that are denominated in currencies other than their functional currency. WeAlthough we do not currently engage in currency hedging activities, we evaluate opportunities to engage in hedging in order to limit the risks of currency fluctuations. Consequently, fluctuations in foreign currencies could have a negative impact on the profitability of our global operations, which would harm our financial results and cash flows.
Uncertainty over global tariffs, or the financial impact of tariffs, may negatively affect our results.
Changes in U.S. domestic and global tariff frameworks have increased our costs of producing goods, particularly in connection with imports used in our renewable business and resulted in additional risks to our supply chain. We have developed and implemented strategies to mitigate previously implemented and, in some cases, proposed tariff increases, but there is no assurance we will be able to continue to mitigate prolonged tariffs.
Further, uncertainties about future tariff changes could result in mitigation actions that prove to be ineffective or detrimental to our business.
Risks Related to Ownership of Our Common Stock
The market price and trading volume of our common stock may be volatile.
The market price of our common stock could fluctuate significantly in future periods due to a number of factors, many of which are beyond our control, including, but not limited to:
•fluctuations in our quarterly or annual earnings or those of other companies in our industry;
•failuresfailure of our operating results to meet the estimates of securities analysts or the expectations of our shareholders orshareholders;
•securities analysts' changes by securities analysts in their estimates of our future earnings;
•announcements by us or our customers, suppliers or competitors;
•the depth and liquidity of the market for our common stock;
•changes in laws or regulations that adversely affect our industry or us;
•changes in accounting standards, policies, guidance, interpretations or principles;
•general economic, industry and stock market conditions;
•future sales of our common stock by our shareholders;
•the concentration of ownership of our common stock;
•future issuances of our common stock by us;
•our ability to pay dividends in the future; and
•the other risk factors set forth under Part I, Item 1A and other parts of this Annual Report.
Substantial sales, or the perception of sales, of our common stock by us or certain of our existing shareholders could cause our stock price to decline and future issuances may dilute our common shareholders' ownership in the Company.ownership.
Sales of a substantial number of shares of our common stock in the public market, or the perception that these sales might occur, could depress the market price of our common stock and could impair our ability to raise capital through the sale of additional equity securities. As of December 31, 2021,2023, we had an aggregate of approximately 86.389.4 million shares of common stock outstanding, approximately 25.127.4 million shares of which were held by B. Riley not including approximately 1.5 million shares of our common stock issuable upon exercise of the warrants held by B. Riley. We entered into a registration rights agreement with B. Riley and other shareholdershareholders on April 30, 2019, pursuant to which B. Riley has customary demand and piggyback registration rights for all shares of our common stock they beneficially own. We filed a resale shelf registration statement on behalf of the shareholders party to the registration rights agreement permitting the resale of approximately 25.6 million shares of our common stock that were issued to B. Riley and the other shareholders party thereto. We aremay also be required to register for resale any additional shares of our common stock that B. Riley may acquire in the future.
Any sales of substantial amounts of our common stock, or the perception that these sales might occur, could lower the market price of our common stock and impede our ability to raise capital through the issuance of equity securities. Any sales, or perception of sales, by our existing shareholders could also impact the perception of shareholder support for us. which could in turn negatively affect our customer and supplier relationships. Further, if we were to issue additional equity securities (or securities convertible into or exchangeable or exercisable for equity securities) to raise additional capital, our shareholders' ownership interests in the Companyus will be diluted and the value of our common stock may be reduced.
B. Riley has significant influence over us.
As of December 31, 20212023, B. Riley controls approximately 30.3%30.7% of the voting power represented by our common stock. B. Riley currently has the right to nominate three membersone member of our board of directors pursuant to the investor rights agreement we entered into with them on April 30, 2019. The investor rights agreement also provides pre-emptive rights to B. Riley with respect to certain future issuances of our equity securities. The services of our Chief Executive Officer, who also serves as our Chairman of the Board, are provided to us by B. Riley pursuant to a consulting agreement. As a result of these arrangements, B. Riley has significant influence over our management and policies and over all matters requiring shareholder approval, including the election of directors, amendment of our certificate of incorporation and approval of significant corporate transactions. Further, ifIf B. Riley were to act together with other shareholders on any matter presented for shareholder approval, they could have the ability to control the outcome of that matter. B. Riley can take actions that have the effect of delaying or preventing a change of control of us or discouraging others from making tender offers for our shares, which could prevent shareholders from receiving a premium for their shares. These actions may be taken even if other shareholders oppose them. In addition, the concentration of voting
power with B. Riley may have an adverse effect on the price of our common stock, and the interests of B. Riley may not be consistent with the interests of our other shareholders.
We do not currently pay regular dividends on our common stock, so holders of our common stock may not receive funds without selling their shares of our common stock.
We have no current intent to pay a regular dividend on our common stock. Our board of directors will determine the payment of future dividends on our common stock, if any, and the amount of any dividends in light of applicable law, contractual restrictions limiting our ability to pay dividends, our earnings and cash flows, our capital requirements, our financial condition, and other factors our board of directors deems relevant. Accordingly, our shareholders may have to sell some or all of their shares of our common stock in order to generate cash flow from their investment.
We may issue preferred stock that could dilute the voting power or reduce the value of our common stock.
Our certificate of incorporation authorizes us to issue, without the approval of our shareholders, one or more classes or series of preferred stock having such designation, powers, preferences and relative, participating, optional and other special rights, including preferences over our common stock respecting dividends and distributions, as our board of directors generally may determine. The terms of one or more classes or series of preferred stock could dilute the voting power or reduce the value of our common stock. For example, we could grant holders of preferred stock the right to elect some number of our directors in all events or on the happening of specified events or the right to veto specified transactions. Similarly, the repurchase or redemption rights or liquidation preferences we could assign to holders of preferred stock could affect the residual value of the common stock.
In the year ending December 31, 2021, we issued 7.7 million shares of our 7.75% Series A Cumulative Perpetual Preferred Stock.
Provisions in our corporate documents and Delaware law could delay or prevent a change in control of the Company,us, even if that change may be considered beneficial by some shareholders.
The existence of some provisions of our certificate of incorporation and bylaws and Delaware law could discourage, delay or prevent a change in control of the Companyus that a shareholder may consider favorable.
In addition, we are subject to Section 203 of the Delaware General Corporation Law, which may have an anti-takeover effect with respect to transactions not approved in advance by our board of directors, including discouraging takeover attempts that might result in a premium over the market price for shares of our common stock.
We believe these provisions protect our shareholders from coercive or otherwise unfair takeover tactics by requiring potential acquirorsacquirers to negotiate with our board of directors and by providing our board of directors with more time to assess any acquisition proposal and are not intended to make the Companyus immune from takeovers. However, these provisions apply even if the offer may be considered beneficial by some shareholders and could delay or prevent an acquisition that our board of directors determines is in the best interests of the Companyus and our shareholders.
Risks Relating to ourthe 2015 Spin-Off from our Former Parent
We are subject to continuing contingent liabilities of BWXT following the spin-off.
We completed a spin-off from The Babcock & Wilcox Company (now known as BWX Technologies, Inc., or “BWXT”), on June 30, 2015 to become a separate publicly traded company, and BWXT did not retain any ownership interest in the Company. As a result of the spin-off, there are several significant areas where the liabilities of BWXT may become our obligations. For example, under the Internal Revenue Code ("Code") and the related rules and regulations, each corporation that was a member of BWXT consolidated tax reporting group during any taxable period or portion of any taxable period ending on or before the completion of the spin-off is jointly and severally liable for the federal income tax liability of the entire consolidated tax reporting group for that taxable period. We entered into a tax sharing agreement with BWXT in connection with the spin-off that allocates the responsibility for prior period taxes of BWXT consolidated tax reporting group between us and BWXT and its subsidiaries. However, if BWXT were unable to pay, we could be required to pay the entire amount of such taxes. Other provisions of law establish similar liability for other matters, including laws governing tax-qualified pension plans as well as other contingent liabilities. The other contingent liabilities include personal injury claims or
environmental liabilities related to BWXT's historical nuclear operations. For example, BWXT has agreed to indemnify us for personal injury claims and environmental liabilities associated with radioactive materials related to the operation, remediation, and/or decommissioning of two former nuclear fuel processing facilities located in the Borough of Apollo and Parks Township, Pennsylvania. To the extent insurance providers and third-party indemnitors do not cover those liabilities, and BWXT was unable to pay, we could be required to pay for them.
The spin-off could result in substantial tax liability.
The spin-off was conditioned on BWXT's receipt of an opinion of counsel, in form and substance satisfactory to BWXT, substantially to the effect that, for United States federal income tax purposes, the spin-off qualifies under Section 355 of the Code, and certain transactions related to the spin-off qualify under Sections 355 and/or 368 of the Code. The opinion relied on, among other things, various assumptions and representations as to factual matters made by BWXT and us which, if inaccurate or incomplete in any material respect, would jeopardize the conclusions reached by such counsel in its opinion. The opinion is not binding on the IRS or the courts, and there can be no assurance that the IRS or the courts will not challenge the conclusions stated in the opinion or that any such challenge would not prevail.
We are not aware of any facts or circumstances that would cause the assumptions or representations that were relied on in the opinion to be inaccurate or incomplete in any material respect. If, notwithstanding receipt of the opinion, the spin-off was determined not to qualify under Section 355 of the Code, each United States holder of BWXT common stock who received shares of our common stock in the spin-off would generally be treated as receiving a taxable distribution of property in an amount equal to the fair market value of the shares of our common stock received. In addition, if certain related preparatory transactions were to fail to qualify for tax-free treatment, they would be treated as taxable asset sales and/or distributions.
Under the terms of the tax sharing agreement we entered into in connection with the spin-off, we are generally responsible for all taxes attributable to us or any of our subsidiaries, whether accruing before, on or after the date of the spin-off. We and BWXT generally share responsibility for all taxes imposed on us or BWXT and its subsidiaries in the event the spin-off and/or certain related preparatory transactions were to fail to qualify for tax-free treatment. However, if the spin-off and/or certain related preparatory transactions were to fail to qualify for tax-free treatment because of actions or failures to act by us or BWXT, we or BWXT, respectively would be responsible for all such taxes. Our liabilities under the tax sharing agreement could have a material adverse effect on us. At this time, we cannot precisely quantify the amount of liabilities we may have under the tax sharing agreement and there can be no assurances as to their final amounts.
Under some circumstances, we could be liable for any resulting adverse tax consequences from engaging in certain significant strategic or capital raising transactions.
Even if the spin-off otherwise qualifies as a tax-free distribution under Section 355 of the Code, the spin-off and certain related transactions may result in significant United States federal income tax liabilities to us under Section 355(e) and other applicable provisions of the Code if 50% or more of BWXT's stock or our stock (in each case, by vote or value) is treated as having been acquired, directly or indirectly, by one or more persons as part of a plan (or series of related transactions) that includes the spin-off. The process for determining whether an acquisition triggering those provisions has occurred is complex, inherently factual and subject to interpretation of the facts and circumstances of a particular case.
Under the terms of the tax sharing agreement we entered into in connection with the spin-off, BWXT generally is liable for any such tax liabilities. However, we are required to indemnify BWXT against any such tax liabilities that result from actions taken or failures to act by us. As a result of these rules and contractual provisions, we may be unable to engage in certain strategic or capital raising transactions that our shareholders might consider favorable, or to structure potential transactions in the manner most favorable to us, without certain adverse tax consequences.
Potential indemnification liabilities to BWXT pursuant to the master separation agreement could materially adversely affect the Company.us.
The master separation agreement with BWXT provides for, among other things, the principal corporate transactions required to effectaffect the spin-off, certain conditions to the spin-off and provisions governing the relationship between us and BWXT with respect to and resulting from the spin-off. Among other things, the master separation agreement provides for indemnification obligations designed to make us financially responsible for substantially all liabilities that may exist relating to our business activities, whether incurred prior to or after the spin-off, as well as those obligations of BWXT assumed by us pursuant to the
master separation agreement. If we are required to indemnify BWXT under the circumstances set forth in the master separation agreement, we may be subject to substantial liabilities.
In connection with our separation from BWXT, BWXT has agreed to indemnify us for certain liabilities. However, there can be no assurance that the indemnity will be sufficient to insure us against the full amount of such liabilities, or that BWXT's ability to satisfy its indemnification obligation will not be impaired in the future.
Pursuant to the master separation agreement, BWXT has agreed to indemnify us for certain liabilities. However, third parties could seek to hold us responsible for any of the liabilities that BWXT agreed to retain, and there can be no assurance that the indemnity from BWXT will be sufficient to protect us against the full amount of such liabilities, or that BWXT will be able to fully satisfy its indemnification obligations. Moreover, even if we ultimately succeed in recovering from BWXT any amounts for which we are held liable, we may be temporarily required to bear these losses.
General Risk Factors
Our reported financial results may be adversely affected by new accounting pronouncements or changes in existing accounting standards and practices, which could result in volatility in our results of operations.
We prepare our financial statements in conformity with accounting principles generally accepted in the U.S. These accounting principles are subjectRisks Relating to interpretation or changes by the FASB and the SEC. New accounting pronouncements and varying interpretations of accounting standards and practices have occurred in the past and are expected to occur in the future. New accounting pronouncements or a change in the interpretation of existing accounting standards or practices may have a significant effect on our reported financial results and may even affect our reporting of transactions completed before the change is announced or effective.
Any difficulties in adopting or implementing any new accounting standard could result in our failure to meet our financial reporting obligations, which could result in regulatory discipline and harm investors’ confidence in us. Finally, if we were to change our critical accounting estimates, our operating results could be significantly affected.Tax Matters
We could be subject to changes in tax rates or tax law, adoption of new regulations, changing interpretations of existing law or exposure to additional tax liabilities in excess of accrued amounts that could adversely affect our financial position.
We are subject to income taxes in the United States and numerous foreign jurisdictions. A change in tax laws, treaties or regulations, or in their interpretation, in any country in which we operate could result in a higher tax rate on our earnings, which could have a material impact on our earnings and cash flows from operations. Tax reform legislation enacted in December of 2017 has made substantial changes to United States tax law, including a reduction in the corporate tax rate, a limitation on deductibility of interest expense, a limitation on the use of net operating losses to offset future taxable income, the allowance of immediate expensing of capital expenditures and the transition of U.S. international taxation from a worldwide tax system to a more generally territorial system, and a one-time transition tax on the mandatory deemed repatriation of foreign earnings. Generally, future changes in applicable U.S. or foreign tax laws and regulations, or their interpretation and application could have an adverse effect on our business, financial conditions and results of operations.
Significant judgment is required in determining our worldwide provision for income taxes. In the ordinary course of our business, there are many transactions and calculations where the ultimate tax determination is uncertain, and we are regularly subject to audit by tax authorities. Although we believe that our tax estimates and tax positions are reasonable, they could be materially affected by many factors including the final outcome of tax audits and related litigation, the introduction of new tax accounting standards, legislation, regulations and related interpretations, our global mix of earnings, the ability to realize deferred tax assets and changes in uncertain tax positions. A significant increase in our effective tax rate could have a material adverse effect on our profitability and liquidity.
Our ability to use net operating losses (“NOLs”)NOL and certain tax credits to reduce future tax payments could be further limited if we experience an additional “ownership change”.
Some or all of the Company'sour deferred tax assets, consisting primarily of NOLs and interest carryforwards that are not currently deductible for tax purposes, could expire unused if we are unable to generate sufficient taxable income in the future to take advantage of them or if we enter into transactions that limit our right to use them, which includes transactions that result in an “ownership change” under Section 382 of the Code.
Sections 382 and 383 of the CodeIRC limits for U.S. federal income tax purposes, the annual use of NOL carryforwards, disallowed interest carryforwards and tax credit carryforwards, respectively, following an ownership change. Under Section 382 of the Code,IRC, a company has undergone an ownership change if shareholders owning at least 5% of the company have increased their collective holdings by more than 50% during the prior three-year period. Based on information that is publicly available, the Companywe determined that a Section 382 ownership change occurred onin July 23, 2019 as a result of the Equitization Transactions. If the Company experienceswe experience subsequent ownership changes, certain NOL carryforwards (including previously disallowed interest carryforwards) may be subject to more than one section 382 limitation.
General Risk Factors
Our business could be harmed if we fail to maintain effective internal control over financial reporting.
As discussed in Part II, Item 9A. of this Annual Report, we identified certain material weaknesses as of December 31, 2023 in three components of internal control based on criteria established in the 2013 Internal Control–Integrated Framework issued by the Committee of Sponsoring Organizations of the Treadway Commission.
Due to the existence of these material weaknesses, we concluded that our internal control over financial reporting was not effective as of December 31, 2023. While we do not believe that these material weaknesses have impacted the accuracy or reporting of our consolidated financial results, until these material weaknesses are remediated, or should new material weaknesses arise or be discovered in the future, there is a reasonable possibility that a material misstatement of our interim or annual financial statements will not be prevented or detected on a timely basis. In addition, we may experience delays in satisfying our reporting obligations to comply with SEC rules and regulations, which could result in investigations and sanctions by regulatory authorities. Any of these could adversely affect our business and the value of our common stock, and we may be unable to maintain compliance with NYSE listing standards.
Our reported financial results may be adversely affected by new accounting pronouncements or changes in existing accounting standards and practices, which could result in volatility in our results of operations.
We prepare our financial statements in conformity with accounting principles generally accepted in the U.S. These accounting principles are subject to interpretation or changes by the FASB and the SEC. New accounting pronouncements and varying interpretations of accounting standards and practices have occurred in the past and are expected to occur in the future. New accounting pronouncements or a change in the interpretation of existing accounting standards or practices may have a significant effect on our reported financial results and may even affect our reporting of transactions completed before the change is announced or effective.
Any difficulties in adopting or implementing any new accounting standard could result in our failure to meet our financial reporting obligations, which could result in regulatory discipline and harm investors’ confidence in us. Finally, if we were to change our critical accounting estimates, our operating results could be significantly affected.
The loss of the services of one or more of our key personnel, or our failure to attract, recruit, motivate, and retain qualified personnel in the future, could disrupt our business and harm our results of operations.
We depend on the skills, working relationships, and continued services of key personnel, including our management team and others throughout our organization. We are also dependent on our ability to attract and retain qualified personnel, for whom we compete with other companies both inside and outside our industry. Our business, financial condition or results of operations may be adversely impacted by the unexpected loss of any of our management team or other key personnel, or more generally if we fail to attract, recruit, motivate and retain qualified personnel.
We outsource certain business processes to third-party vendors and have certain business relationships that subject us to risks, including disruptions in business which could increase our costs.
We outsource some of our business processes to third-party vendors. We make a diligent effort to ensure that all providers of these outsourced services are observing proper internal control practices; however, there are no guarantees that failures will not occur. Failure of third parties to provide adequate services or our inability to arrange for alternative providers on favorable terms in a timely manner could disrupt our business, increase our costs or otherwise adversely affect our business and our financial results.
Negotiations with labor unions and possible work stoppages and other labor problems could divert management's attention and disrupt operations. In addition, new collective bargaining agreements or amendments to existing agreements could increase our labor costs and operating expenses.
A significant number of our employees are members of labor unions. If we are unable to negotiate acceptable new contracts with our unions from time to time, we could experience strikes or other work stoppages by the affected employees. If any such strikes, protests or other work stoppages were to occur, we could experience a significant disruption of operations. In addition, negotiations with unions could divert management's attention. New union contracts could result in increased operating costs, as a result of higher wages or benefit expenses, for both union and nonunion employees. If nonunion employees were to unionize, we could experience higher ongoing labor costs.
Pension and medical expenses associated with our retirement benefit plans may fluctuate significantly depending on a number of factors, and we may be required to contribute cash to meet underfunded pension obligations.
A substantial portion of our current and retired employee population is covered by pension and postretirement benefit plans, the costs and funding requirements of which depend on our various assumptions, including estimates of rates of return on benefit-related assets, discount rates for future payment obligations, rates of future cost growth, mortality assumptions and trends for future costs. VariancesActual results that vary unfavorably from these estimates could have a material adverse effect on us. Our policy to recognize these variances annually through mark to market accounting could result in volatility in our results of operations, which could be material. The funding obligations for the Company’sour pension plans are impacted by the performance of the financial markets, particularly the equity markets, and interest rates. If the financial markets do not provide the long-term returns that are expected, or discount rates increase the present value of liabilities, the Companywe could be required to make larger contributions.
As of December 31, 2021,2023, our defined benefit pension and postretirement benefit plans were underfunded by approximately $174.9 $164.6 million. In addition, certain of these postretirement benefit plans were collectively bargained, and our ability to curtail or change thethe benefits provided may be impacted by contractual provisions set forth in the relevant union agreements and other plan documents. We also participate in various multi-employer pension plans in the United States and Canada under union and industry agreements that generally provide defined benefits to employees covered by collective bargaining agreements. Absent an applicable exemption, a contributor to a United States multi-employer plan is liable, upon termination
or withdrawal from a plan, for its proportionate share of the plan's underfunded vested liability. Funding requirements for benefit obligations of these multi-employer pension plans are subject to certain regulatory requirements, and we may be required to make cash contributions which may be material to one or more of these plans to satisfy certain underfunded benefit obligations. See Note 1314 to the Consolidated Financial Statements included in Part II, Item 8 of this Annual Report for additional information regarding our pension and postretirement benefit plan obligations.
Natural disasters or other events beyond our control, such as war, armed conflicts or terrorist attacks could adversely affect our business.
Matters outside of our control could adversely affect demand for or supply of our products or disrupt our facilities, systems or projects, which could interrupt operational processes and performance on our contracts and adversely impact our ability to manufacture our products and provide services and support to our customers. Insurance for such matters may be unavailable or insufficient. Such matters could include natural disasters, such as earthquakes, tsunamis, hurricanes, floods, tornadoes, war, armed conflicts, or terrorist attacks, among others. We operate facilities in areas of the world that are exposed to such risks, which could be general in nature or targeted at us or our markets.
Item 1B. Unresolved Staff Comments
None
Item 1C. Cybersecurity
Cybersecurity risk management and strategy
Our cybersecurity risk management program is integrated into our enterprise risk management processes, and is informed by recognized cybersecurity industry frameworks and standards, including the National Institute of Standards and Technology. We use these frameworks, together with information collected from internal assessments, to develop policies for use of our information systems and assets (for example, B&W business information and information resources such as computers and workstations), access to specific intellectual property or technologies, and protection of personal information. We protect these information assets through industry-standard techniques, such as multi-factor authentication and malware defenses. We also work with internal stakeholders to integrate foundational cybersecurity principles throughout our operations, including employment of multiple layers of cybersecurity defenses, restricted access based on business need, and integrity of our business information.
We have implemented a risk-based approach to our cybersecurity processes, inclusive of risks associated with our use of third-party IT service providers, which considers the sensitivity and volume of the relevant data, the potential effects on third parties and individuals and the needs of our business in determining what risk mitigation, remediation or prevention actions are appropriate.
In addition, cybersecurity considerations affect the selection and oversight of our third-party service providers. We perform due diligence on third parties that have access to our most critical systems, data or facilities that house such systems or data, and establish contractual terms and oversight to manage and reduce the risks associated with such third-party vendors. Such contractual terms include requirements to provide notification of cyber incidents involving our systems or data and requirements to provide industry-accepted disclosures, such as SOC 2 Type II reports, on a regular basis.
We utilize several cybersecurity processes, technologies, and controls to aid in our efforts to assess, identify, and manage material risks from cybersecurity threats, and to protect against, detect and respond to cybersecurity incidents (as defined in Item 106(a) of Regulation S-K), including, among others, the following:
•maintain a global Security Operations Center to support visibility to cybersecurity incidents in real time;
•require all salaried employees to complete an annual cybersecurity training program where specific threats and scenarios are highlighted based on our analysis of current risks to the organization;
•provide regular cybersecurity awareness and confidential information protection training and conduct phishing email simulations for employees and contractors with access to corporate email systems to enhance awareness and responsiveness to such possible threats;
•maintain a Cybersecurity Incident Response Plan, which provides a framework for handling cybersecurity incidents based on, among other factors, the potential severity of the incident and facilitates cross-functional coordination of our response to such incidents, should they occur;
•maintain cybersecurity insurance and regularly review our policy and levels of coverage based on current risks;
•monitor emerging data protection and cybersecurity laws, and implement changes to our processes and systems designed to comply, and through policy, practice and contract (as applicable) require employees, as well as third parties who provide services on our behalf, to treat customer information and data with care;
•conduct several cyber-specific penetration tests per year; and
•engage consultants and other third parties, as appropriate, in connection with our cybersecurity practices.
Governance of cybersecurity risk management
The Board of Directors, as a whole, has oversight responsibility for our strategic and operational risks. Management is responsible for day-to-day assessment and management of cybersecurity risks. The IT Steering Committee, comprised of a cross-functional group of our executive management, leads management's oversight of the IT function, including IT risk management. Our Director of IT has primary oversight of material risks from cybersecurity threats. Our Director of IT has 20 years of experience across various software engineering, IT security and compliance, business and management roles, including serving as the Director of Engineering Applications and Data Management, leading the development and implementation of information technology strategies and roadmaps for Digital and Engineering applications group. The Director of IT is supported by our Director of IT Security and Compliance, who has more than 10 years of experience in information technology and IT security.
Our Director of IT and Director of IT Security and Compliance assess our cybersecurity readiness through internal assessment tools as well as third-party control tests, vulnerability assessments, audits and evaluation against industry standards. We have governance and compliance structures that are designed to elevate potential threats or vulnerabilities relating to cybersecurity to our Director of IT and IT Steering Committee. We also employ various defensive and continuous monitoring techniques using recognized industry frameworks and cybersecurity standards.
Our Director of IT meets with the IT Steering Committee monthly to review our information technology systems and discuss key cybersecurity risks. In addition, quarterly the Director of IT reviews our entire risk management program, which includes cybersecurity risks, with Executive management and the Board of Directors.
Material cybersecurity risks, threats & incidents
To date, we do not believe that risks from cybersecurity threats, including as a result of any previous cybersecurity incidents have materially affected or are reasonably likely to materially affect us, including our business strategy, results of operations or financial position. However, there can be no guarantee that we will not be the subject of future threats or incidents and we can give no assurance that we have detected all cybersecurity incidents or cybersecurity threats. Additional information on cybersecurity risks we face can be found in Item 1A, Risk Factors, which should be read in conjunction with the foregoing information.
Item 2. Properties
The following table provides the primary segment, location and general use of each of our principal properties that we own or lease atas of December 31, 2021.2023. | | | | | | | | |
| Business Segment and Location | Principal Use | Owned/Leased
(Lease Expiration) |
| B&W Renewable segment | | |
Copenhagen, Denmark | Administrative office | Leased (2023) |
| Esbjerg, Denmark | Manufacturing facility / administrative office | Owned |
Vejen,Taastrup, Denmark | Administrative office | Leased (2022)(2029) |
| Freeport, Illinois | Administrative office | Leased (2026) |
| B&W Environmental segment | | |
| Paruzzaro, Italy | Administrative officesoffice | Leased (2024)(2027) |
| Ding Xiang, Xin Zhou, Shan Xi, China | Manufacturing facility | Leased (2023)(2025) |
| B&W Thermal segment | | |
| Akron, Ohio | Administrative officesoffice | Leased (2034) |
| Lancaster, Ohio | Manufacturing facility | Leased (2041) |
| Copley, Ohio | Warehouse / service center | Leased (2033) |
| Dumbarton, Scotland | Manufacturing facility | Owned |
| Guadalupe, NL, Mexico | Manufacturing facility | Leased (2024) |
| Cambridge, Ontario, Canada | Administrative office / warehouse | Leased (2024) |
| Dartmouth, Nova Scotia, Canada | Manufacturing facility | Leased (2029) |
| Tucker, Georgia | Administrative office | Leased (2028) |
| Chanute, Kansas | Manufacturing facility | Leased (2043) |
We believe that our major properties are adequate for our present needs and, as supplemented by planned improvements and construction, expect them to remain adequate for the foreseeable future.
Item 3. Legal Proceedings
For information regarding ongoing investigations and litigation, see Note 2221 to the Consolidated Financial Statements included in Part II, Item 8 of this Annual Report, which we incorporate by reference into this Item.
Item 4. Mine Safety Disclosures.
Not Applicable.
Not Applicable.
PART II
Item 5. Market for Registrant's Common Equity Related Stockholder Matters and Issuer Purchases of Equity Securities
Our common stock is traded on the New York Stock Exchange under the symbol BW.
As of January 31, 2022, there were approximately 950February 29, 2024, we had 845 stockholders of record holders of our common stock.
See Part III, Item 12 of this Annual Report for information about our equity compensation plans. In accordance with the provisions of the employee benefit plans, the Company acquired the followingwe can acquire shares in connection with the vesting of employee restricted stock that require us to withhold shares to satisfy employee statutory income tax withholding obligations. The following table identifies the numberWe did not repurchase any of common shares and average price per share for each monthour equity securities during the quarter ended December 31, 2021. The Company does2023. We do not have a general share repurchase program at this time. | | | | | | | | | | | | | | |
| (data in whole amounts) | | | | |
| Period | Total number of shares acquired (1) | Average price per share | Total number of shares purchased as part of
publicly announced plans or programs | Approximate dollar value of shares that may yet be
purchased under the plans or programs |
| October 2021 | — | | $ | — | | — | | $ | — | |
| November 2021 | 13,150 | | $ | 6.21 | | — | | $ | — | |
| December 2021 | — | | $ | — | | — | | $ | — | |
| Total | 13,150 | | $ | 6.21 | | — | | $ | — | |
(1) Acquired shares are recorded in treasury stock in our Consolidated Balance Sheets.
The following graph provides a comparison of our cumulative total shareholder return over five years through December 31, 20212023 to the return of the S&P 500, the Russell 2000 and our custom peer group.
(1)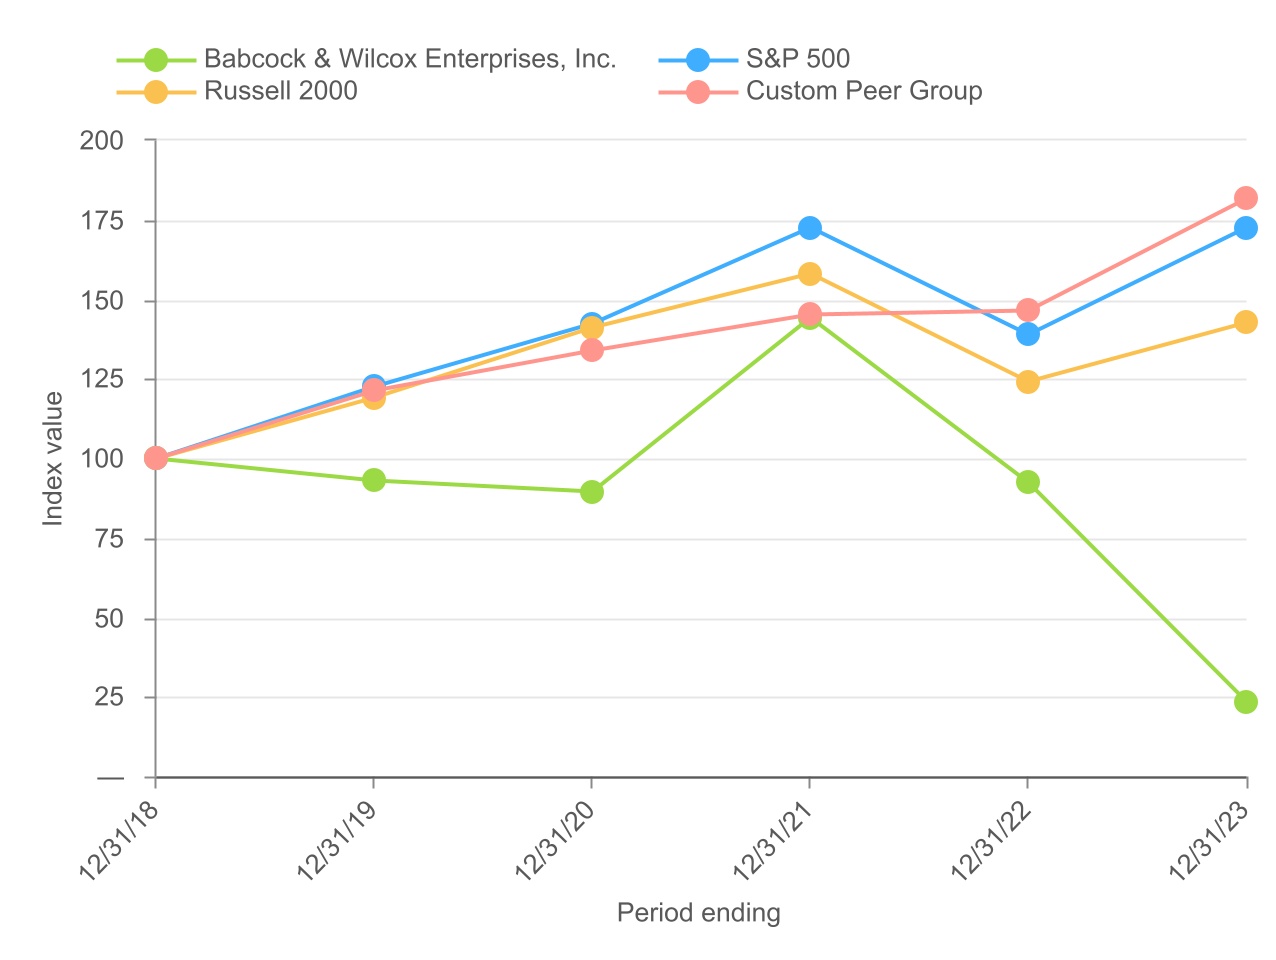
Assumes initial investment of $100 on December 31, 2016. 2018.
The peer group used for the comparison above is comprised of the following companies:
| | | | | | | | |
| AMETEK, Inc. | Curtiss-Wright Corp. | Idex Corp. |
CECO Environmental Corp. | Dycom Industries, Inc. | MasTec, Inc. |
Chart Industries Inc.CECO Environmental Corp. | Enerpac Tool Group Corp. | Primoris Services Corp.Corporation |
CIRCOR Int.Chart Industries, Inc. | Flowserve Corp.Enviri Corporation | SPX Corp.Technologies, Inc. |
Crane Co.Company | Harsco Corp.Flowserve Corporation | Tetra Tech, Inc. |
| Curtiss-Wright Corporation | Idex Corporation | |
Unregistered Sales of Equity Securities
On June 1, 2021, the Company and B. Riley, a related party, entered into an agreement pursuant to which we (i) issued B. Riley 2,916,880 shares of our Preferred Stock, representing an exchange price of $25.00 per share and paid $0.4 million in cash, and (ii) paid $0.9 million in cash to B. Riley for accrued interest due, in exchange for a deemed prepayment of $73.3 million of our then existing term loans with B. Riley under the Company’s prior A&R Credit Agreement (the “A&R Credit Agreement”). The shares of Preferred Stock issued to B. Riley in the exchange were offered pursuant to the exemption from registration under the Securities Act in Rule 506 of Regulation D under Section 4(a)(2) thereof.
Item 6. [Reserved]
Item 7. Management's Discussion and Analysis of Financial Condition and Results of Operations
You should read theThe following discussion of our financial conditionposition and results of operations should be read in conjunction with the financial statements and the notes thereto included in Consolidated Financial Statements underand Supplemental Data in Item 18 within this Annual Report. The following discussion contains forward-looking statements that reflect our plans, estimates, and beliefs. Our actual results could differ materially from those discussed in the forward-looking statements. See Cautionary Statement Concerning Forward-Looking Information.
The following discussion includes a comparison of Results of Operations and Liquidity and Capital Resources for the years ended December 31, 2023 and 2022. We have also included a comparison of the Results of Operations for the years ended December 31, 2022 and 2021 in the B&W Renewable Segment discussion below as this is the only segment impacted by the discontinued operations. For additional comparison of the years ended December 31, 2022 and 2021, see Management’s Discussion and Analysis of Financial Condition and Results of Operations in Part II, Item 7 of our Annual Report on Form 10-K for the fiscal year ended December 31, 2022 as filed on March 16, 2023. Our consolidated financial statements are prepared in conformity with GAAP. Our discussion of the financial results include non-GAAP measures (e.g., foreign currency impact, EBITDA, Adjusted EBITDA) to provide additional information concerning our financial results that we believe is useful to the readers of our financial statements in the assessment of our performance and operating trends.
BUSINESS OVERVIEW
B&W is
We are a growing, globally-focused renewable, environmental and thermal technologies provider with over 150155 years of experience providing diversified energy and emissions control solutions to a broad range of industrial, electrical utility, municipal and other customers. B&W’sOur innovative products and services are organized into three market-facing segments. Our reportable segments are as follows:
•Babcock & Wilcox Renewable:Renewable: Our innovative hydrogen generation technology (BrightLoopTM) supports global climate goals including the decarbonization of industrial and utility steam and power producers. BrightLoopTM Cost-effectiveoffers significant advantages over other hydrogen generation technologies as it generates competitively priced hydrogen from a wide range of fuels (including solid fuels such as biomass and coal) with a high rate of carbon captured resulting in low (or even negative) carbon intensity hydrogen. We also offer best-in-class technologies for efficient and environmentally sustainable power and heat generation, including waste-to-energy, solar construction and installation, biomass energyoxygen-fired biomass-to-energy (OxyBrightTM), and black liquor systems for the pulp and paper industry. B&W’sOur leading waste-to-energy technologies support a circular economy, diverting waste from landfills to use for power generation and replacing fossil fuels,or district heating, while recovering metals and reducing emissions.To date, we have installed approximately 500 waste-to-energy and biomass-to-energy units at more than 300 facilities in approximately 30 countries which serve a wide variety of utility, waste management, municipality and investment firm customers.
•Babcock & Wilcox Environmental:Environmental A: Our full suite of best-in-class emissions control and environmental technology solutions for utility, waste to energy, biomass,waste-to-energy, biomass-to-energy, carbon black, and industrial steam generation applications supports environmental stewardship around the world. B&W’sOur broad experience includes systems for cooling, ash handling, particulate control, nitrogen oxidesoxide and sulfur dioxidesdioxide removal, chemical loopingdioxin and furan control, carbon dioxide capture, mercury control as well as other acid gas and pollutant control. Our ClimateBrightTM family of products including SolveBrightTM, OxyBrightTM, BrightLoopTM and BrightGenTM, places us at the forefront of hydrogen production and carbon dioxide capturing technologies and development with many of the aforementioned products already commercially available and others ready for commercial deployment. We believe these technologies position us to compete in the bioenergy with carbon control,capture and mercury control.sequestration market. Our portfolio of clean power production solutions continues to evolve to reach customers at all stages of their energy transition.
•Babcock & Wilcox Thermal: SteamOur vast installed base of steam generation equipment aftermarket parts, construction, maintenance and field services for plantsrelated auxiliaries spans the globe and includes customers in thea variety of end markets including power generation, oil and gas, petrochemical, food and industrial sectors. B&W has an extensive globalbeverage, metals and mining, and others. We provide aftermarket parts, construction, maintenance, engineered upgrades and field services for our installed base as well as the installed base of installed equipment for utilitiesother OEMs; the substantial and generalstable cash flows generated from these businesses helps to fund our investments in new clean energy initiatives. In addition to our aftermarket offerings, we also provide complete steam generation systems including package boilers, watertube and firetube waste heat boilers, and other boilers to medium and heavy industrial applications including refining, petrochemical, food processing, metalscustomers. Our unique range of offerings, coupled with the strength of our brand, provides a competitive advantage in existing and others.emerging markets.
On September 30, 2021,In July 2022, we acquired certain assets of Hamon Holdings through a 60% controlling ownership stakecompetitive sale process, in Illinois-based solar energy contractor Fosler Construction Companywhich B. Riley Securities, Inc. (“Fosler Construction”), a related party, was Hamon Holdings’ investment banker and advisor through a Chapter 11 363 Asset Sale. We were the successful bidder for certain assets of one of those subsidiaries, Hamon, a major provider of air pollution control technology, for approximately $27.2 million$2.9 million.
In February 2022, we acquired 100% ownership of B&W Chanute, formerly known as Optimus Industries, LLC, for approximately $19.2 million. B&W Chanute designs and manufactures waste heat recovery products for use in cash plus contingent consideration of up to $10 million, valued at $8.8 million. Fosler Construction provides commercial, industrialpower generation, petrochemical, and utility-scale solar servicesprocess industries, including package boilers, watertube and owns two community solar projectsfiretube waste heat boilers, economizers, superheaters, waste heat recovery equipment and units for sulfuric acid plants and is based in Illinois being developed under the Illinois Solar for All program. Fosler Construction was founded in 1998Tulsa, Oklahoma and employs approximately 120 people. It has a strong track record of successfully completing solar projects profitably with union labor and has aligned its model with a growing number of renewable project incentives in the U.S. We believe Fosler Construction is positioned to capitalize on the high-growth solar market in the U.S. and that the acquisition aligns withChanute, Kansas. B&W’s aggressive growth and expansion of our clean and renewable energy businesses. Fosler Construction&W Chanute is reported as part of our B&W Renewable segment, and operates under the name Fosler Solar, a Babcock & Wilcox company.Thermal segment.
On November 30, 2021, we acquired 100% ownership of VODA A/S (“VODA”) through our wholly-owned subsidiary, B&W PGG Luxembourg Finance SARL, for approximately $32.9 million. VODA is a Denmark-based multi-brand aftermarket parts and services provider, focusing on energy-producing incineration plants including waste-to-energy, biomass-to-energy or other fuels, providing service, engineering services, spare parts as well as general outage support and management. VODA has extensive experience in incineration technology, boiler and pressure parts, SRO, automation, and performance optimization. VODA employs approximately 65 people mainly in Denmark and Sweden. We believe VODA will solidify our platform for our renewable service business in Europe and that the acquisition aligns with B&W’s aggressive growth and expansion of our clean and renewable energy businesses. VODA is reported as part of our B&W Renewable segment. We plan to form B&W Renewable Services to integrate VODA and our waste-to-energy and biomass aftermarket services businesses.
OnIn February 1, 2022, we acquired 100% ownership of Fossil Power Systems, Inc.FPS for approximately $59.1 million, excluding working capital adjustments. Fossil Power Systems, Inc.,$59.2 million. FPS is a leading designer and manufacturer of hydrogen, natural gas and renewable pulp and paper combustion equipment including ignitors, plant controls and safety systems based in Dartmouth, Nova Scotia, Canada. Fossil Power Systems, Inc. will initially be reported as part of our B&W Thermal segment.
On February 28, 2022, we acquired 100% ownership of Optimus Industries, LLC for approximately $19 million, excluding working capital adjustments. Optimus designs and manufactures waste heat recovery products for use in power generation, petrochemical, and process industries , including package boilers, watertube and firetube waste heat boilers, economizers, superheaters, waste heat recovery equipment and sulfuric acid plants andFPS is based in Tulsa, Oklahoma and Chanute, Kansas. Optimus Industries, LLC will be reported as part of our B&W Thermal segment.
Our business depends significantly on the capital and operations and maintenance expenditures of global electric power generating companies, including renewable and thermal powered heat generation industries, and industrial facilities with environmental compliance policy requirements. Several factors may influence these expenditures, including:
•climate change initiatives promoting environmental policies which includeincluding renewable energy options utilizing waste-to-energy or biomass to meet legislative requirements and clean energy portfolio standards in the United States, European, Middle East and Asian markets;
•requirements fordevelopment of a hydrogen-based economy;
•regulations requiring environmental improvements in various global markets;
•expectation ofexpectations regarding future governmental requirements to further limit or reduce greenhouse gas and other emissions in the United States, Europe and other international climate change sensitive countries;
•prices for electricity, along with the cost of production and distribution including the cost of fuels within the United States, Europe, Middle East and Asian based countries;
•demand for electricity and other end products of steam-generating facilities;
•level of capacity utilization at operating power plants and other industrial uses of steam production;
•requirements for maintenance and upkeep requirements at operating power plants, including to combat the accumulated effects of usage;
•overall strength of the industrial industry; and
•ability of electric power generating companies and other steam users to raise capital.
Customer demand is heavily affected by the variations in our customers' business cycles, power demand in their operating territories, and by the overall economies and energy, environmental and noise abatement needs of the countries in which they
operate.
We have manufacturing facilities in Mexico, the United States, Denmark, Scotlandthe United Kingdom and China. Many aspects of our operations and properties could be affected by political developments, including the ongoing Russia-Ukraine conflict, environmental regulations and operating risks. These and other factors may have a material impact on our international and domestic operations or our business as a whole.
Through our restructuring efforts, we continue to make significant progress to make our cost structure more variable and to reduce costs. We expect our cost saving measures to continue to translate to bottom-line results, with top-line growth driven by opportunities for our core technologies and support services across the B&W Renewable, B&W Environmental and B&W
Thermal segments globally.
We expect to continue to explore other cost saving initiatives to improve cash generation and evaluate additional non-core asset sales to continue to strengthen our liquidity. There are or will be important factors that could cause our actual results to differ materially from those indicated in these statements. If one or more events related to these or other risks or uncertaintiesuncertainty materialize, or if our underlying assumptions prove to be incorrect, actual results may differ materially from what we anticipate.
In addition, we continue to evaluate further dispositions, opportunities for additional cost savings and opportunities for subcontractor recoveries and other claims where appropriate and available. If the value of our business was to decline, or if we were to determine that we were unable to recognize an amount in connection with any proposed disposition in excess of the carrying value of any disposed asset, we may be required to recognize impairments for one or more of our assets that may adversely impact our business, financial condition and results of operations.
Market Update
Management continues to adapt to macroeconomic conditions, including the impacts from inflation, higher interest rates and foreign exchange rate volatility, geopolitical conflicts (including the ongoing conflicts in Ukraine and the Middle East) and global shipping and supply chain disruptions that continued to have an impact during 2023. In certain instances, these situations have resulted in cost increases and delays or disruptions that have had, and could continue to have, an adverse impact on our ability to meet customers’ demands. We continue to actively monitor the impact of these market conditions on current and future periods and actively manage costs and our liquidity position to provide additional flexibility while still supporting our customers and their specific needs. The duration and scope of these conditions cannot be predicted, and therefore, any anticipated negative financial impact on our operating results cannot be reasonably estimated.
Discontinued Operations
During the third quarter of 2023, we committed to a plan to sell our B&W Solar business resulting in a significant change that would impact our operations. As of September 30, 2023, we met all of the criteria for the assets and liabilities of this business, formerly part of our B&W Renewable segment, to be accounted for as held for sale. In addition, we also determined that the operations of the B&W Solar business qualified as a discontinued operation, primarily based upon its significance to our current and historic operating losses. The decision to sell the B&W Solar business, along with the significant increase in estimated costs to complete the B&W Solar loss contracts, resulted in a triggering event that required us to immediately perform certain valuations. Certain trade accounts receivable and contract assets were determined to be uncollectible, resulting in charges of $17.6 million. For goodwill, we performed a quantitative assessment using the income approach (discounted cash flows). The income approach uses the disposal group's estimated future cash flows, discounted at the weighted-average cost of capital of a hypothetical third-party buyer to account for uncertainties within the projections. The income approach also uses assumptions based on the disposal group's estimated revenue growth, operating margin, and working capital turnover. As a result of this impairment test, we recognized an impairment of $56.6 million, or the entire balance of goodwill associated with B&W Solar. These charges have been included in Loss from discontinued operations, net of tax in the Consolidated Statements of Operations. The impairment charges and additional contract losses during the year ended December 31, 2023 totaled $56.6 million and $44.1 million, respectively. B&W Solar had accrued loss contracts totaling $7.1 million at December 31, 2023.
RESULTS OF OPERATIONS–YEARS ENDED DECEMBER 31, 2021, 20202023 AND 2019
2022
Components of Our Results of Operations
Revenue
Our revenue is the total amount of income generated by our business and consists primarily of income from our renewable, environmental and thermal technology solutions and services we provide to a broad range of industrial, electric utility and other customers.
Revenue from our operations is assessed based on our three market-facing segments, Babcock & Wilcoxsegments. B&W Renewable, Babcock & WilcoxB&W Environmental and Babcock & WilcoxB&W Thermal.
Operating Incomeincome
Operating income consists primarily of our revenue minus costs and expenses, including cost of operations, SG&A and advisory fees and settlement costs.
Net Income(loss) income
Net (loss) income consists primarily of operating income minus other income and expenses, including interest income,expense, foreign exchange, and expense related to our benefit plans.plans, and provision for income taxes.
Consolidated Results of Operations
The following discussion of our consolidated and business segment results of operations includes a discussion of adjusted EBITDA, which when used on a consolidated basis is a non-GAAP financial measure. Adjusted EBITDA differs from net (loss) income, the most directly comparable measure calculated in accordance with generally accepted accounting principles (“GAAP”). A reconciliation of net income (loss), the most directly comparable GAAP measure, to adjusted EBITDA is included in “Non-GAAP Financial Measures” below.GAAP. Management believes that this financial measure is useful to investors because it excludes certain expenses, allowing investors to more easily compare our financialoperating performance period to period.
| | | | | | | | | | | | | | | | | | | | | | | | |
| | | Year ended December 31, |
| (in thousands) | | | | | | | 2021 | | 2020 | | 2019 | |
| Revenues: | | | | | | | | | | | | |
| B&W Renewable segment | | | | | | | $ | 156,800 | | | $ | 156,187 | | | $ | 205,551 | | |
| B&W Environmental segment | | | | | | | 133,826 | | | 107,968 | | | 275,635 | | |
| B&W Thermal segment | | | | | | | 433,329 | | | 304,968 | | | 409,744 | | |
| Eliminations | | | | | | | (592) | | | (2,806) | | | (31,819) | | |
| | | | | | | $ | 723,363 | | | $ | 566,317 | | | $ | 859,111 | | |
| | | | | | | | | | | | | | | | | | | | | | | | |
| | | Year ended December 31, |
| (in thousands) | | | | | | | 2021 | | 2020 | | 2019 | |
| Adjusted EBITDA | | | | | | | | | | | | |
B&W Renewable segment (1) | | | | | | | $ | 23,219 | | | $ | 24,957 | | | $ | 1,617 | | |
| B&W Environmental segment | | | | | | | 11,773 | | | 3,503 | | | 12,553 | | |
| B&W Thermal segment | | | | | | | 49,143 | | | 36,052 | | | 52,235 | | |
| Corporate | | | | | | | (12,467) | | | (14,425) | | | (17,579) | | |
| Research and development costs | | | | | | | (1,093) | | | (4,379) | | | (2,861) | | |
| | | | | | | $ | 70,575 | | | $ | 45,708 | | | $ | 45,965 | | |
A reconciliation of net (loss) income to adjusted (1)EBITDA Adjusted EBITDA for 2020 includes a $26 million non-recurring loss recovery related to certain historical EPC loss contracts.is included in “Non-GAAP Financial Measures” below.
| | | | | | | | | | | | | | | | | | | | |
| | | Year ended December 31, |
| (in thousands) | | | | | | | 2023 | | 2022 | | | |
| Revenues: | | | | | | | | | | | | |
| B&W Renewable segment | | | | | | | $ | 318,605 | | | $ | 288,673 | | | | |
| B&W Environmental segment | | | | | | | 202,927 | | | 154,393 | | | | |
| B&W Thermal segment | | | | | | | 499,216 | | | 415,104 | | | | |
| Eliminations | | | | | | | (21,394) | | | (10,252) | | | | |
| | | | | | | $ | 999,354 | | | $ | 847,918 | | | | |
20212023 vs 20202022 Consolidated Results
Revenues increased by $157.0151.4 million to $723.4$999.4 million in 20212023 as compared to $566.3$847.9 million in 2020, 2022, primarily attributable to a higher levelincreased revenue of activity$79.4 million in our Thermalglobal renewable parts and Environmental segments which were both adversely impactedservices business, increased revenue of $30.0 million at SPIG, our Air Cooled Condenser business in Italy, and $55.0 million due to a large new construction project in 2023, partially offset by COVID-19a slight decline in the prior year and the acquisitions of Fosler Construction and VODA in our Renewable segment. Segment specific changes are discussed in further detail in the sections belowservice projects.
NetOperating income (loss) increased by $41.8$17.6 million to $31.5from $2.3 million in 2021 as compared2022 to $(10.3) million. Operating income (loss) increased $22.6 million to $20.8$19.9 million in 2021 as compared to $(1.7) million in 2020. The increase is2023, primarily due to the revenue increase described above, contributionsincreased gross margin of $37.2 million from the Fosler Constructionhigher revenues and VODA acquisitionsa reduction of $7.6 million in advisory fees and the recognition of a settlement from a subcontractor to reimburse the Company for project costs related to three of the Renewable EPC loss
contracts as described in Note 5 to the Consolidated Financial Statements included in Part II, Item 8 of this Annual Report. These increases were also2023, partially offset by the non-recurring loss recoveryhigher SG&A expenses of $26.0$10.0 million recognized in the prior year under an October 10, 2020 settlement agreement with an insurer in connection with five of the six European B&W Renewable EPC loss contracts, as described in Note 5 to the Consolidated Financial Statements included in Part II, Item 8 of this Annual Report. Restructuring expenses, advisory fees, research and development, depreciation and amortization expense, pension and other postretirement benefit plans, foreign exchange, income taxes and gains (losses) on dispositions are discussed in further detail in the sections below.
2020 vs 2019 Consolidated Results
Revenues decreased by $292.8 million to $566.3$4.6 million in 2020 as compared to $859.1product development costs associated with BrightLoopTM. Additionally, there was a loss on the sale of an asset of $8.7 million in 2019. Revenues for each of our segments have been adversely impacted by COVID-19, including the postponement and delay of several projects due to COVID-19. In addition to the impacts of COVID-19, revenue was also impacted by segment specific changes which are discussed2022 that did not recur in further detail in the sections below.2023.
Net loss improved $118.7from continuing operations increased by $58.6 million to $(10.3)$78.6 million in 20202023 from $(129.0)$20.0 million in 2019. Operating losses improved $27.62022, primarily attributable to a $75.0 million swing in benefit plans cost from a $37.5 million benefit in 2022 to $(1.7)a $37.5 million expense in 2020 from $(29.4) million in 2019, primarily due to the insurance loss recovery of $26.0 million and a lower level of losses on the EPC loss contracts, partially2023, offset slightly by the divestiture of Loibl and the impacts of COVID-19 in the B&W Renewable segment, as well as a decline in volume in the B&W Environmental and B&W Thermal segments related primarily to COVID-19. increased operating income described aboveRestructuring expenses, advisory fees, research and development, depreciation and amortization expense, pension and other postretirement benefit plans, foreign exchange, income taxes and gains (losses) on dispositions are discussed in further detail in the sections below..
Year-over-year comparisons of our results from net income (loss) were also impacted by:
•$4.9 million, $11.8 million and $11.7 million of restructuring costs were recognized in 2021, 2020 and 2019, respectively, and are more fully described in Note 12 to the Consolidated Financial Statements included in Part II, Item 8 of this Annual Report.
•$2.7 million, $4.4 million and $9.1 million of financial advisory service fees were recognized in 2021, 2020 and 2019, respectively. Financial advisory service fees are included in advisory fees and settlement costs in our Consolidated Statement of Operations.
•$5.5 million, $6.4 million and $11.8 million of legal and other advisory fees were recognized in 2021, 2020 and 2019, respectively. These fees are related to the contract settlement and liquidity planning and are included in advisory fees and settlement costs in our Consolidated Statement of Operations.
•$6.5 million, $(6.2) million and $(4.0) million of gain (loss) on debt extinguishment in 2021, 2020 and 2019, respectively.
•$1.8 million, $0.1 million and $3.6 million of loss on sale of business in 2021, 2020 and 2019, respectively.
•$15.5 million, $(23.2) million and $8.8 million of actuarially determined mark to market (“MTM”) gains (losses) on our pension and other post-retirement benefits in 2021, 2020 and 2019, respectively. MTM losses are further described in Note 13 to the Consolidated Financial Statements included in Part II, Item 8 of this Annual Report.
•$4.9 million, $2.1 million and $0.5 million of litigation legal costs were recognized in 2021, 2020 and 2019, respectively. These fees are included in advisory fees and settlement costs in our Consolidated Statement of Operations.
•$6.6 million of settlement cost was recognized in 2019 in connection with an additional European waste-to-energy EPC contract, for which notice to proceed was not given and the contract was not started and is included in advisory fees and settlement costs in our Consolidated Statement of Operations.
•$4.8 million of costs related to completed and potential acquisitions were recognized in 2021. These costs are included in selling, general and administrative expenses in our Consolidated Statement of Operations.
Bookings and Backlog
Bookings and backlog are our measuremeasures of remaining performance obligations under our sales contracts. Management believes these metrics provide investors, lenders and other users of our financial statements with a leading indicator of future revenues. It is possible that our methodology for determining bookings and backlog may not be comparable to methods used by other companies.
We generally include expected revenue from contracts in our backlog when we receive written confirmation from our customers authorizing the performance of work and committing the customers to payment for work performed. Backlog may not be indicative of future operating results, and contracts in our backlog may be canceled, modified or otherwise altered by customers. Backlog can vary significantly from period to period, particularly when large new buildnew-build conversions projects or operations and maintenance contracts are booked because they may be fulfilled over multiple years. Because we operate globally, our backlog is also affected by changes in foreign currencies each period. We do not include orders of our unconsolidated joint ventures in backlog.
Bookings represent changes to the backlog. Bookings include additions from bookingrelated to new business or increases in project scope, subtractions fromdue to customer cancellations or modifications,reductions in project scope, changes in estimates of liquidated damages that affect selling price and revaluation of backlog denominated in foreign currency. We believe comparing bookings on a quarterly basis or for periods less than one year is less meaningful than for longer periods, and that shorter-term changes in bookings may not necessarily indicate a material trend.
| | | | | | | | | | | | | | | |
| | | Year ended December 31, |
| (In approximate millions) | | | | | 2021 | | 2020 |
B&W Renewable(1) | | | | | $ | 294 | | | $ | 116 | |
| B&W Environmental | | | | | 148 | | | 147 | |
| B&W Thermal | | | | | 337 | | | 390 | |
| Other/eliminations | | | | | — | | | (8) | |
| Bookings | | | | | $ | 779 | | | $ | 645 | |
(1) B&W Renewable bookings includes the revaluation of backlog denominated in currency other than U.S. dollars. The foreign exchange impact on B&W Renewable bookings in the years ended December 31, 2021 and 2020 was $15.0 million and $(14.7) million, respectively. | | | | | | | | | | | | | | | |
| | | Year ended December 31, |
| (In millions) | | | | | 2023 | | 2022 |
| B&W Renewable | | | | | $ | 256.0 | | | $ | 166.4 | |
| B&W Environmental | | | | | 222.1 | | | 176.0 | |
| B&W Thermal | | | | | 409.9 | | | 516.0 | |
| Other/eliminations | | | | | (9.7) | | | — | |
| Bookings | | | | | $ | 878.3 | | | $ | 858.4 | |
Our backlog as of December 31, 20212023 and 20202022 was as follows:
| | As of December 31, |
| (In approximate millions) | 2021 | | 2020 |
| As of December 31, | | | As of December 31, |
| (In millions) | | (In millions) | 2023 | | 2022 |
B&W Renewable(1) | B&W Renewable(1) | $ | 394 | | | $ | 208 | |
| B&W Environmental | B&W Environmental | 123 | | | 106 | |
| B&W Thermal | B&W Thermal | 126 | | | 226 | |
| Other/eliminations | Other/eliminations | (4) | | | (5) | |
| Backlog | Backlog | $ | 639 | | | $ | 535 | |
(1) B&W Renewable backlog has been adjusted downward $114 million and $122 million at December 31, 2021, includes $149.1 million related2023 and 2022, respectively, to long-term operation and maintenanceremove O&M contracts for renewable energy plants, with remaining durations extending until 2034. Generally, such contracts have a duration of 10-20 years and include options to extend.that are recognized as disposed.
Of the backlog atas of December 31, 2021,2023, we expect to recognize revenues as follows:
| | (In approximate millions) | 2022 | 2023 | Thereafter | Total |
| (In millions) | | (In millions) | 2024 | 2025 | Thereafter | Total |
| B&W Renewable | B&W Renewable | $ | 204 | | $ | 56 | | $ | 134 | | $ | 394 | |
| B&W Environmental | B&W Environmental | 89 | | 11 | | 23 | | 123 | |
| B&W Thermal | B&W Thermal | 108 | | 15 | | 3 | | 126 | |
| Other/eliminations | Other/eliminations | (4) | | | — | | (4) | |
| Expected revenue from backlog | Expected revenue from backlog | $ | 397 | | $ | 82 | | $ | 160 | | $ | 639 | |
Non-GAAP Financial Measures
We use non-GAAP financial measures internally to evaluate our performance and in making financial and operational decisions. When viewed in conjunction with GAAP results and the accompanying reconciliation, we believe that the
presentation of these measures provides investors with greater transparency and a greater understanding of factors affecting our financial position and results of operations than GAAP measures alone. The presentation of non-GAAP financial measures should not be considered in isolation or as a substitute for the related financial results prepared in accordance with GAAP.
The following discussion of our business segment results of operations includes a discussion of adjusted EBITDA. Adjusted EBITDA differs from the most directly comparable measure calculated in accordance with GAAP. A reconciliation of net loss, the most directly comparable GAAP measure, to adjusted EBITDA is included below. Management believes that this financial measure is useful to investors because it excludes certain expenses, allowing investors to more easily compare our financial performance period to period. When viewed in conjunction with GAAP results and the accompanying reconciliation in Note 5 to the Consolidated Financial Statements, we believe the presentation of adjusted EBITDA provides investors with greater transparency and a greater understanding of factors affecting our financial position and results of operations than GAAP measures alone.
Adjusted EBITDA on a consolidated basis is a non-GAAP metric defined as the sum of the adjusted EBITDA for each of the segments, further adjusted for corporate allocations and research and development costs. At a segment level, the adjusted EBITDA presented belowin this report is consistent with the way the Company'sour chief operating decision maker reviews the results of operations and makes strategic decisions about the business and is calculated as earnings before interest, tax, depreciation and amortization adjusted for items such as gains or losses on asset sales,arising from the sale of non-income producing assets, net pension benefits, restructuring costs,activities, impairments, gains and losses on debt extinguishment, legal and settlement costs, costs related to financial consulting, research and development costs, costs and operating income from contracts in disposal, and other costs that may not be directly controllable by segment management and are not allocated to the segment. We present consolidated adjusted EBITDA because we believe it is useful to investors to help facilitate comparisons of the ongoing, operating performance before corporate overhead and other expenses not attributable to the operating performance of our revenue generating segments.
The Company uses
| | | | | | | | | | | | | | | | | | | |
| | | Year ended December 31, |
| (in thousands) | | | | | 2023 | | 2022 | | |
| Net loss | | | | | $ | (196,971) | | | $ | (26,584) | | | |
| Loss from discontinued operations, net of tax | | | | | (118,338) | | | (6,596) | | | |
| Loss from continuing operations | | | | | (78,633) | | | (19,988) | | | |
| Interest expense, net | | | | | 48,703 | | | 44,220 | | | |
| Income tax expense | | | | | 8,481 | | | 11,059 | | | |
| Depreciation & amortization | | | | | 19,990 | | | 21,628 | | | |
| EBITDA | | | | | (1,459) | | | 56,919 | | | |
| | | | | | | | | |
| Benefit plans, net | | | | | 37,505 | | | (37,528) | | | |
| Loss (gain) on asset sales, net | | | | | 57 | | | (2,539) | | | |
| | | | | | | | | |
| Stock compensation | | | | | 7,121 | | | 8,654 | | | |
| Restructuring activities and business services transition costs | | | | | 5,663 | | | 8,474 | | | |
| Advisory fees for settlement costs and liquidity planning | | | | | 1,107 | | | 1,509 | | | |
| Settlement and related legal (recoveries) costs | | | | | (1,474) | | | 10,734 | | | |
| Acquisition pursuit and related costs | | | | | 827 | | | 5,504 | | | |
| Product development | | | | | 9,023 | | | 4,100 | | | |
| Foreign exchange | | | | | 2,507 | | | 582 | | | |
| Financial advisory services | | | | | — | | | 1,424 | | | |
| | | | | | | | | |
| | | | | | | | | |
| | | | | | | | | |
| | | | | | | | | |
| Contract disposal | | | | | 8,550 | | | 2,976 | | | |
| Letter of credit fees | | | | | 7,702 | | | 5,204 | | | |
| Other - net | | | | | 2,002 | | | 1,496 | | | |
| | | | | | | | | |
Adjusted EBITDA (1) | | | | | $ | 79,131 | | | $ | 67,509 | | | |
adjusted EBITDA internally to evaluate its performance and in making financial and operational decisions. When viewed in conjunction with GAAP results and the accompanying reconciliation in Note 4 to the Consolidated Financial Statements, the Company believes that its presentation of adjusted EBITDA provides investors with greater transparency and a greater understanding of factors affecting its financial condition and results of operations than GAAP measures alone. As previously disclosed, the Company changed its reportable segments in 2020 and has recast prior period results to account for this change.Additionally, the Company redefined its definition of adjusted EBITDA to eliminate the effects of certain items including the loss from a non-strategic business, interest on letters of credit included in cost of operations and loss on business held for sale. Prior period results have been revised to conform with the revised definition and present separate reconciling items in our reconciliation.
| | | | | | | | | | | | | | | | | | | | | |
| | | Year ended December 31, |
| (in thousands) | | | | | 2021 | | 2020 | | 2019 |
| Net income (loss) | | | | | $ | 31,538 | | | $ | (10,297) | | | $ | (129,039) | |
| Interest expense | | | | | 41,359 | | | 60,713 | | | 95,266 | |
| Income tax (benefit) expense | | | | | (2,224) | | | 8,179 | | | 5,286 | |
| Depreciation & amortization | | | | | 18,337 | | | 16,805 | | | 23,605 | |
| EBITDA | | | | | 89,010 | | | 75,400 | | | (4,882) | |
| | | | | | | | | |
| Benefit plans, net | | | | | (48,142) | | | (5,600) | | | (22,800) | |
| Gain on sales, net | | | | | (13,984) | | | (3,155) | | | (339) | |
| (Gain) loss on debt extinguishment | | | | | (6,530) | | | 6,194 | | | 3,969 | |
| Stock compensation | | | | | 10,476 | | | 4,587 | | | 3,376 | |
| Restructuring activities and business services transition costs | | | | | 10,726 | | | 11,849 | | | 11,707 | |
| Advisory fees for settlement costs and liquidity planning | | | | | 5,480 | | | 6,357 | | | 11,824 | |
| Litigation legal costs | | | | | 4,894 | | | 2,137 | | | 475 | |
| Acquisition pursuit and related costs | | | | | 4,841 | | | — | | | — | |
Product development (1) | | | | | 4,713 | | | — | | | — | |
| Foreign exchange | | | | | 4,294 | | | (58,799) | | | 16,602 | |
| Financial advisory services | | | | | 2,709 | | | 4,384 | | | 9,069 | |
| Other - net | | | | | 1,489 | | | 1,128 | | | (285) | |
| Loss from business held for sale | | | | | 483 | | | 467 | | | 5,850 | |
| Loss from a non-strategic business | | | | | 116 | | | 2,559 | | | 5,518 | |
Settlement cost to exit contract (2) | | | | | — | | | — | | | 6,575 | |
| Income from discontinued operations | | | | | — | | | (1,800) | | | (694) | |
Adjusted EBITDA (3) | | | | | $ | 70,575 | | | $ | 45,708 | | | $ | 45,965 | |
(1)Costs associated with development of commercially viable products that are ready to go to market.
(2) In March 2019, we entered into a settlement in connection with an additional B&W Renewable waste-to-energy EPC contract, for which notice to proceed was not given and the contract was not started. The settlement eliminated our obligations to act, and our risk related to acting, as the prime EPC should the project have moved forward.
(3) Adjusted EBITDA for the twelve monthsyear ended December 31, 20202022 includes a $26$6.2 million non-recurring loss recoverygain on sale related to certain historical EPC loss contracts in the third quarter.development rights of a renewable energy project.
| | | | | | | | | | | | | | | | | | | | | |
| | | Year ended December 31, |
| (in thousands) | | | | | 2021 | | 2020 | | 2019 |
| Adjusted EBITDA | | | | | | | | | |
B&W Renewable segment (1) | | | | | $ | 23,219 | | | $ | 24,957 | | | $ | 1,617 | |
| B&W Environmental segment | | | | | 11,773 | | | 3,503 | | | 12,553 | |
| B&W Thermal segment | | | | | 49,143 | | | 36,052 | | | 52,235 | |
| Corporate | | | | | (12,467) | | | (14,425) | | | (17,579) | |
| Research and development benefit (costs) | | | | | (1,093) | | | (4,379) | | | (2,861) | |
| | | | | $ | 70,575 | | | $ | 45,708 | | | $ | 45,965 | |
(1)Adjusted EBITDA for the twelve months ended December 31, 2020 includes a $26 million non-recurring loss recovery related to certain historical EPC loss contracts in the third quarter.
| | | | | | | | | | | | | | | |
| | | Year ended December 31, |
| (in thousands) | | | | | 2023 | | 2022 |
Adjusted EBITDA(1) | | | | | | | |
B&W Renewable segment (2) | | | | | $ | 22,586 | | | $ | 21,227 | |
| B&W Environmental segment | | | | | 15,277 | | | 9,787 | |
| B&W Thermal segment | | | | | 66,653 | | | 56,291 | |
| Corporate | | | | | (21,374) | | | (16,477) | |
| Research and development | | | | | (4,011) | | | (3,319) | |
| | | | | $ | 79,131 | | | $ | 67,509 | |
(1) See above for reconciliation of Net loss to Adjusted EBITDA. (2) Adjusted EBITDA in the Renewable segment in 2022 includes a $6.2 million non-recurring gain on sale related to development rights of a renewable energy project. |
B&W Renewable Segment Results
| | | | | | | | | | | | | | | | | | | | | | | | | | | | | | | | | | | | | | | | | |
| | | Year ended December 31, | | Year ended December 31, |
| (in thousands) | | | | | | | 2021 | | 2020 | | $ Change | | 2020 | | 2019 | | $ Change |
| Revenues | | | | | | | $ | 156,800 | | | $ | 156,187 | | | $ | 613 | | | $ | 156,187 | | | $ | 205,551 | | | $ | (49,364) | |
| Adjusted EBITDA | | | | | | | $ | 23,219 | | | $ | 24,957 | | | $ | (1,738) | | | $ | 24,957 | | | $ | 1,617 | | | $ | 23,340 | |
2021 vs 2020 results
Revenues in the B&W Renewable segment increased $0.6 million, to $156.8 million in 2021 compared to $156.2 million in 2020. The increase in revenue is primarily due to the acquisitions of Fosler Construction and VODA on September 30, 2021 and November 30, 2021, respectively, and higher part sales offset by the timing of a large project order slipping into early 2022.
Adjusted EBITDA in the B&W Renewable segment decreased $1.7 million, to $23.2 million in 2021 compared to $25.0 million in 2020. The decrease is primarily due to the non-recurring loss recovery of $26.0 million recognized in 2020 under an October 10, 2020 settlement agreement with an insurer in connection with five of the six European B&W Renewable EPC loss contracts offset by higher revenue volume and the acquisitions of Fosler Construction and VODA, as described above, in addition to recognition of a settlement from a subcontractor to reimburse the Company for project costs related to three of the Renewable EPC loss contracts as described in as described in Note 5 to the Consolidated Financial Statements included in Part II, Item 8 of this Annual Report.
2020 vs 2019 results
Revenues in the B&W Renewable segment decreased 24%, or $49.4 million to $156.2 million in 2020 compared to $205.6 million in 2019. The reduction in revenue is due to the advanced completion of activities on the European B&W Renewable EPC loss contracts in the prior year as well as new anticipated activities being deferred due to COVID-19, partially offset by a higher level of activities on two operations and maintenance contracts in the U.K. which followed the turnover of the EPC loss contracts to the customers. Additionally, the reduction in revenue partially relates to the divestiture of Loibl, a materials handling business in Germany that generated revenues of approximately $14.3 million in 2019.
Adjusted EBITDA in the B&W Renewable segment improved $23.3 million to $25.0 million in 2020 compared to $1.6 million in 2019. The improvement is primarily due to the loss recovery of $26.0 million recognized in 2020 under an October 10, 2020 settlement agreement with an insurer in connection with five of the six European B&W Renewable EPC loss contracts. In addition the B&W Renewable segment incurred lower costs in 2020 to complete the six European B&W Renewable EPC loss contracts which included $3.7 million and $6.9 million in net losses, including warranty in 2020 and 2019, respectively. The Adjusted EBITDA improvement was also partially offset by the divestiture of Loibl and lower volume.
B&W Environmental Segment Results
| | | | | | | | | | | | | | | | | | | | | | | | | | | | | | | | | | | | | | | | | |
| | | Year ended December 31, | | Year ended December 31, |
| (In thousands) | | | | | | | 2021 | | 2020 | | $ Change | | 2020 | | 2019 | | $ Change |
| Revenues | | | | | | | $ | 133,826 | | | $ | 107,968 | | | $ | 25,858 | | | $ | 107,968 | | | $ | 275,635 | | | $ | (167,667) | |
| Adjusted EBITDA | | | | | | | $ | 11,773 | | | $ | 3,503 | | | $ | 8,270 | | | $ | 3,503 | | | $ | 12,553 | | | $ | (9,050) | |
2021 vs 2020 results
Revenues in the B&W Environmental segment increased 24%, or $25.9 million to $133.8 million in 2021 compared to $108.0 million in 2020. The increase is primarily driven by the postponement of several new projects in the prior year due to COVID-19 which have since resumed in addition to higher overall volume in our ASH project business.
Adjusted EBITDA in the B&W Environmental segment was $11.8 million in 2021 compared to $3.5 million in 2020. The increase is driven primarily by higher volume, as described above.
2020 vs 2019 results
Revenues in the B&W Environmental segment decreased 61%, or $167.7 million, to $108.0 million in 2020 from $275.6 million in 2019. The decrease is primarily due to the completion of large construction projects in the prior year and a lower level of activity primarily due to the postponement of new projects by several customers as a result of COVID-19. B&W Environmental’s two significant legacy loss contracts, generated revenues of $4.1 million and $18.8 million in 2020 and 2019, respectively.
Adjusted EBITDA in the B&W Environmental segment decreased $9.1 million to $3.5 million in 2020 compared to $12.6 million in 2019. The decline is primarily attributable to the impacts of lower volume, the effects of which were partially offset by a lower percentage of overhead being allocated to the segment that were not previously allocated to other segments.
B&W Thermal Segment Results
| | | | | | | | | | | | | | | | | | | | | | | | | | | | | | | | | | | | | | | | | |
| | | Year ended December 31, | | Year ended December 31, |
| (In thousands) | | | | | | | 2021 | | 2020 | | $ Change | | 2020 | | 2019 | | $ Change |
| Revenues | | | | | | | $ | 433,329 | | | $ | 304,968 | | | $ | 128,361 | | | $ | 304,968 | | | $ | 409,744 | | | $ | (104,776) | |
| Adjusted EBITDA | | | | | | | $ | 49,143 | | | $ | 36,052 | | | $ | 13,091 | | | $ | 36,052 | | | $ | 52,235 | | | $ | (16,183) | |
2021 vs 2020 results
Revenues in the B&W Thermal segment increased 42%, or $128.4 million, to $433.3 million in 2021 compared to $305.0 million generated in 2020. The revenue increase is attributable to a higher level of activity on construction projects, an increase in volume in our package boilers and parts business and the adverse impacts of COVID-19 which significantly impacted prior year revenues, as described below.
Adjusted EBITDA in the B&W Thermal segment increased $13.1 million to $49.1 million in 2021 compared to $36.1 million in 2020, which is mainly attributable to the increase in volume as described above and continued cost savings and restructuring initiatives benefiting the current year.
2020 vs 2019 results
Revenues in the B&W Thermal segment decreased 26%, or $104.8 million, to $305.0 million in 2020 compared to $409.7 million in 2019. The revenue decrease is attributable to the completion of large construction projects in the prior year in addition to the adverse impacts of COVID-19 resulting in lower parts, construction, package boilers and international service orders.
Adjusted EBITDA in the B&W Thermal segment decreased 31%, or $16.2 million, to $36.1 million in 2020 compared to $52.2 million in 2019, primarily attributable to lower volume of project activity and a higher percentage of overhead being
allocated to the segment that was previously allocated to other segments, the effects of which were partially offset by favorable product mix and a full period of cost savings and restructuring initiatives benefiting the 2020 year.
Corporate
Corporate costs in adjusted EBITDA include SG&A expenses that are not allocated to the reportable segments. These costs include, among others, certain executive, compliance, strategic, reporting and legal expenses associated with governance of the total organization and being an SEC registrant. Corporate costs decreased $2.0expenses not allocated to the reportable segments totaled $21.4 million to $12.5and $16.5 million in yearthe years ended December 31, 2021 as compared to $14.4 million incurred in the year ended December 31, 2020.2023 and 2022, respectively. The decreaseincrease is primarily due to an increase in the allocation of corporate costshigher expenses related to the reporting segments, lower personnel costs and audit and director fees partially offset by an increase in the bonus expense of $1.0 million. Corporate costs decreased $3.2 million to $14.4 million in the year ended December 31, 2020 as compared to $17.6 million in the year ended December 31, 2019, primarily due to decreased bonus costs recognized for the year ended December 31, 2020.
other consulting services and insurance.
Advisory Fees and Settlement Costs
Advisory fees and settlement costs increased $0.2 million to $13.1 million in the year ended December 31, 2021 as compared to $12.9 million in the corresponding period of 2020. The change is primarily due to increased use of external consultants in 2021. Advisory fees and settlement costs decreased by $15.1 million to $12.9 million in the year ended December 31, 2020 as compared to $27.9 million in the year ended December 31, 2019, primarily due to settlement costs to exit a certain B&W Renewable EPC contract in the first quarter of 2019 and also due to reduced use of external consultants in 2020 as the Company staffed certain positions internally.
Research and Developmentdevelopment
Our research and development activities are focused on improving our products through innovations to reduce their cost and make them more competitive, as well as toimprove competitiveness, reduce performance risk of our products to better meet our and our customers’ expectations. Research and development (benefit) expenses totaled $1.6 million, $4.4$4.0 million and $2.9$3.3 million in the years ended December 31, 2021, 20202023 and 2019,2022, respectively. The change resulted primarily from timing of specific research and development efforts and the recognition of approximately $0.9 million in 2021 related to certain credits.
Restructuring
Restructuring actions across our business units and corporate functions resulted in $4.9 million, $11.8 million and $11.7 million of expense in the years ended December 31, 2021, 2020 and 2019, respectively. The charges primarily consist of severance related to actions taken, including as part of the Company’s strategic, market-focused organizational and re-branding initiatives.
Transition Costs
Transition costs across our corporate and business functions resulted in $5.9 million of expense in the year ended December 31, 2021. These charges primarily result from non-recurring actions taken to outsource certain tasks to offshore service providers or to transfer administrative and compliance tasks to global service providers as part of our strategic efforts to reduce future selling, general and administrative costs. Transition costs are included in selling, general and administrative expenses in our Consolidated Statement of Operations,
Depreciation and Amortization
Depreciation expense was $9.7 million, $11.3 million and $19.3 million in the years ended December 31, 2021, 2020 and 2019, respectively. In December 2019, we consolidated all of our Barberton and most of our Copley, Ohio operations into new, leased office space in Akron, Ohio and $4.9 million of accelerated depreciation was recognized during the year ended December 31, 2019.
Amortization expense was $8.6 million, $5.5 million and $4.3 million in the year ended December 31, 2021, 2020, and 2019, respectively.
Pension and Other Postretirement Benefit Plans
We recognize benefits from our defined benefit and other postretirement benefit plans based on actuarial calculations primarily because our expected return on assets is greater than our service cost. Service cost is low because our plan benefits are frozen except for a small number of hourly participants. Pension benefits (includes defined benefit and other postretirement benefits plans) before MTM were $32.7 million, $28.8$0.5 million and $14.0$29.8 million infor the years ended December 31, 2021, 20202023 and 2019,2022, respectively.
Our pension costs also include MTM adjustments from time to time and are primarily a result of changes in the discount rate, curtailments and settlements. Any MTM charge or gain should not be considered to be representative of future MTM adjustments as such events are not currently predicted and are in each case subject to market conditions and actuarial assumptions as of the date of the event giving rise to the MTM adjustment. Total MTM adjustments for our pensiondefined benefit and other postretirement benefits plans were gainsan expense of $15.3 million for the twelve months ended months ended December 31, 2021. Total MTM adjustments for our other postretirement benefit plans were gains of $0.2 million during the twelve months ended December 31, 2021. Pension benefits, excluding MTM adjustments of a loss of $23.2$38.0 million and a gainbenefit of $8.8$7.7 million were $28.8 million and $14.0 million infor the years ended December 31, 20202023 and 2019,2022, respectively.
The following sensitivity analysis reflects the impact of a 25 basis point change in the assumed discount rate and return on assets on our pension plan obligations and expense for the year ended December 31, 2021:
| | | | | | | | |
| (In millions) | 0.25% increase | 0.25% decrease |
Discount rate: | | |
Effect on ongoing net periodic benefit cost (1) | $ | (28.0) | | $ | 29.3 | |
| Effect on projected benefit obligation | (31.0) | | 32.8 | |
| Return on assets: | | |
| Effect on ongoing net periodic benefit cost | (2.6) | | 2.6 | |
(1) Excludes effect of annual MTM adjustment.
A 25 basis point change in the assumed discount rate and return on assets would have no meaningful impact on our other postretirement benefit plan obligations and expense for the year ended December 31, 2021 individually or in the aggregate, excluding the impact of any annual MTM adjustments we record annually.
Refer to Note 1314 to the Consolidated Financial Statements for further information regarding our pension and other postretirement plans.
Loss (gain) on asset sales, net
We, at times, will sell or dispose of certain assets that are unrelated to our current or future operations. Therefore, we believe it is useful to exclude these gains and losses from our non-GAAP financial measures in order to highlight the performance of the continuing business. Loss (gain) on asset sales, net totaled $0.1 million and $(2.5) million in the years ended December 31, 2023 and 2022, respectively.
Stock compensation
The grant date fair value of stock compensation varies based on the derived stock price at the time of grant, valuation methodologies, subjective assumptions, and reward types. This may make the impact of this form of compensation on our current financial results difficult to compare to previous and future periods. Therefore, we believe it is useful to exclude stock-based compensation from our non-GAAP financial measures in order to highlight the performance of the business and to be consistent with the way many investors evaluate our performance and compare our operating results to peer companies.
Expenses related to restricted stock units are recorded at the Corporate level and are recognized on a straight-line basis over a 3-year vesting period, except for market-based restricted stock units which are recognized over a derived service period.
Stock compensation was $7.1 million and $8.7 million for the years ended December 31, 2023 and 2022, respectively.
Restructuring activities and business services transition costs
Restructuring activities and business services transition actions across our business units and corporate functions resulted in expense of $5.7 million and $8.5 million in the years ended December 31, 2023 and 2022, respectively. The restructuring charges primarily consist of severance and related costs associated with non-recurring actions taken to transform our operations with impacts on employees and facilities used in our businesses. Business services transition costs relate to new technology implementation, expected to provide future benefit and are included in Selling, general and administrative expenses in the Consolidated Statement of Operations.
Advisory fees for settlement costs and liquidity planning
Advisory fees decreased to $1.1 million in the year ended December 31, 2023 as compared to $1.5 million in 2022. The change is primarily due to decreased use of external consultants, especially in liquidity planning as that work ended in early 2023.
Settlement and related legal (recoveries) costs
Settlement costs decreased from $10.7 million in the year ended December 31, 2022 to recoveries of $(1.5) million in the year ended December 31, 2023. See Note 21 for more detail.
Acquisition pursuit and related costs
Acquisition pursuit and related costs expenses totaled $0.8 million and $5.5 million in the year ended December 31, 2023 and 2022, respectively. The decrease is a result of less activity in 2023, when compared to 2022.
Product development
Our product development activities include expenses that relate to sales, marketing, and other business development expenses for our products and services still under development and not yet widely available. Product development expenses totaled $9.0 million and $4.1 million in the year ended December 31, 2023 and 2022, respectively. The increase resulted primarily from timing of specific research and increased development efforts and activities related to our BrightLoopTM commercialization efforts and to further develop our ClimateBrightTM portfolio. Management excludes these expenses from adjusted EBITDA as they often may not correlate to revenue or other operations occurring in the current period.
Foreign Exchangeexchange
We translate assets and liabilities of our foreign operations into United StatesU.S. dollars at current exchange rates, and we translate items in our statementthe Consolidated Statements of operationsOperations at average exchange rates for the periods presented. We record adjustments resulting from the translation of foreign currency financial statements as a component of accumulated other comprehensive income (loss).loss. We report foreign currency transaction gains and losses in the Consolidated Statements of Operations.
Foreign exchange was a gain/(loss)net loss of $(4.3) million, $58.8$2.5 million and $(16.6)$0.6 million for the years ended December 31, 2021, 2020,2023 and 2019,2022, respectively. Foreign exchange gains and losses are primarily related to unhedged intercompany loans denominated in European currencies to fund foreign operations. Foreign exchange gains in 2020 were primarily driven by a weakening U.S. dollar compared to the underlying European currencies and changes in intercompany loan balances denominated in Danish Krone that averaged over $500 million throughout the year. The 2020 loan balances denominated in Danish Krone were converted to equity in 2020.
Income Taxes
| | | | | | | | | | | | | | | | | | | | | | | |
| | | Year ended December 31, |
| (In thousands, except for percentages) | | | | | | | 2021 | | 2020 | | 2019 |
| Income (loss) before income taxes | | | | | | | $ | 29,314 | | | $ | (3,918) | | | $ | (124,447) | |
| Income tax expense (benefit) | | | | | | | $ | (2,224) | | | $ | 8,179 | | | $ | 5,286 | |
| Effective tax rate | | | | | | | (7.6) | % | | (208.8) | % | | (4.2) | % |
Financial advisory services
We used no financial advisory services in 2023. Financial advisory services were $1.4 million for the year ended December 31, 2022.
Contract disposal
We are in the process of exiting our only remaining fixed fee operational and maintenance ("O&M") contract in our Renewable segment. A similar contract was exited as of December 31, 2022. Losses related to this contract totaled $8.6 million and $3.0 million in the years ended December 31, 2023 and 2022, respectively. We believe it is useful to exclude the impact of this contract on our operating results as well as our backlog in order to highlight the performance of the ongoing business.
Letter of credit fees
Letter of credit fees included in Cost of operations were $7.7 million and $5.2 million for the years ended December 31, 2023 and 2022, respectively. Letter of credit fees are routinely incurred in the course of executing customer contracts. A portion of the fees are included in the contract prices with our customers. These amounts represent performance guarantees akin to insurance that are not passed along to our customers and are excluded from adjusted EBITDA as they do not reflect the performance of the business.
B&W Renewable Segment Results
| | | | | | | | | | | | | | | | | | | | | | | | | | | | | |
| | | Year ended December 31, | |
| (in thousands) | | | | | | | 2023 | | 2022 | | $ Change | | | | | | |
| Revenues | | | | | | | $ | 318,605 | | | $ | 288,673 | | | $ | 29,932 | | | | | | | |
| Adjusted EBITDA | | | | | | | $ | 22,586 | | | $ | 21,227 | | | $ | 1,359 | | | | | | | |
2023 vs 2022 results
Revenues in the B&W Renewable segment increased $29.9 million, to $318.6 million in 2023 compared to $288.7 million in 2022, which is primarily the result of increased revenue of $29.5 million in our European Renewable parts and services business as we continue to expand globally.
Adjusted EBITDA in the B&W Renewable segment increased $1.4 million, to $22.6 million in 2023 compared to $21.2 million in 2022. This is primarily attributable to the increased volume in our European Renewable parts and services business, partially offset by a $6.2 million gain on sale related to the development rights of a future renewable energy project that was sold in the prior year.
| | | | | | | | | | | | | | | | | | | | | | | |
| | | Year ended December 31, |
| (in thousands) | | | | | | | 2022 | | 2021 | | $ Change |
| Revenues | | | | | | | $ | 288,673 | | | $ | 144,310 | | | $ | 144,363 | |
| Adjusted EBITDA | | | | | | | $ | 21,227 | | | $ | 19,826 | | | $ | 1,401 | |
2022 vs 2021 results
Revenues in the B&W Renewable segment increased $144.4 million, to $288.7 million in 2022 compared to $144.3 million in 2021, which is primarily due to higher volumes of new-build projects and a full year of revenue from the B&W Renewable Services A/S acquisition that closed on November 30, 2021.
Adjusted EBITDA in the B&W Renewable segment increased $1.4 million, to $21.2 million in 2022 compared to $19.8 million in 2021, which is primarily due to the higher revenue volume from the new-build projects, partially offset by higher SG&A expenses in 2022.
B&W Environmental Segment Results
| | | | | | | | | | | | | | | | | | | | | | | | | | | | | |
| | | Year ended December 31, | |
| (In thousands) | | | | | | | 2023 | | 2022 | | $ Change | | | | | | |
| Revenues | | | | | | | $ | 202,927 | | | $ | 154,393 | | | $ | 48,534 | | | | | | | |
| Adjusted EBITDA | | | | | | | $ | 15,277 | | | $ | 9,787 | | | $ | 5,490 | | | | | | | |
2023 vs 2022 results
Revenues in the B&W Environmental segment increased $48.5 million to $202.9 million in 2023 compared to $154.4 million in 2022. The increase is primarily driven by increased revenue of $30.0 million in SPIG, our Air Cooled Condenser business in Italy, as we continue to grow that business outside of Europe and an increase in revenue of $19.0 million in our ash handling business.
Adjusted EBITDA in the B&W Environmental segment was $15.3 million in December 31, 2023 compared to $9.8 million in 2022. The change is primarily driven by higher volume, as described above.
B&W Thermal Segment Results
| | | | | | | | | | | | | | | | | | | | | | | | | | | | | |
| | | Year ended December 31, | |
| (In thousands) | | | | | | | 2023 | | 2022 | | $ Change | | | | | | |
| Revenues | | | | | | | $ | 499,216 | | | $ | 415,104 | | | $ | 84,112 | | | | | | | |
| Adjusted EBITDA | | | | | | | $ | 66,653 | | | $ | 56,291 | | | $ | 10,362 | | | | | | | |
2023 vs 2022 results
Revenues in the B&W Thermal segment increased $84.1 million, to $499.2 million in the year ended December 31, 2023 compared to $415.1 million generated in 2022. The increase is driven by $55.0 million in revenue from a large new construction project and increased revenue of $49.9 million in our parts business, partially offset by a decline in service projects of $13.4 million due to a project being completed in 2022.
Adjusted EBITDA in the B&W Thermal segment increased $10.4 million to $66.7 million in 2023 compared to $56.3 million in 2022. The increase is the result of the large new construction project and increased volume in our parts business described above.
Other Expenses Impacting Operating Results
Interest Expense
Interest expense in our Consolidated Financial Statements consisted of the following components:
| | | | | | | | | | | | | | | | | |
| | | Year ended December 31, |
| (in thousands) | | | | | 2023 | | 2022 | | |
| Components associated with borrowings from: | | | | | | | | | |
| Senior notes | | | | | $ | 25,601 | | | $ | 24,962 | | | |
| | | | | | | | | |
| | | | | | | | | |
| | | | | | | | | |
| U.S. Revolving Credit Facility | | | | | 1,494 | | | — | | | |
| | | | | 27,095 | | | 24,962 | | | |
| Components associated with amortization or accretion of: | | | | | | | | | |
| Revolving Credit Agreement | | | | | 4,643 | | | 4,400 | | | |
| Senior notes | | | | | 2,525 | | | 2,612 | | | |
| | | | | | | | | |
| | | | | | | | | |
| | | | | | | | | |
| | | | | | | | | |
| | | | | 7,168 | | | 7,012 | | | |
| | | | | | | | | |
| Components associated with interest from: | | | | | | | | | |
| Lease liabilities | | | | | 2,235 | | | 2,372 | | | |
| Letter of Credit fees and interest | | | | | 10,955 | | | 8,424 | | | |
| Other interest expense | | | | | 2,442 | | | 2,091 | | | |
| | | | | 15,632 | | | 12,887 | | | |
| | | | | | | | | |
| Total interest expense | | | | | $ | 49,895 | | | $ | 44,861 | | | |
The increase in interest expense in 2023, when compared to 2022 is driven by higher utilization of the revolver as well as increased incremental fees on letters of credit.
Income Taxes
| | | | | | | | | | | | | | | | | | | |
| | | Year ended December 31, |
| (In thousands, except for percentages) | | | | | | | 2023 | | 2022 | | |
| Loss from continuing operations before income tax expense | | | | | | | (70,152) | | | (8,929) | | | |
| Income tax expense | | | | | | | 8,481 | | | 11,059 | | | |
| Effective tax rate | | | | | | | (12.1) | % | | (123.9) | % | | |
Our effective tax rate in 2021 reflects a valuation allowance against deferred tax assets in jurisdictions other than Mexico, Canada, Brazil, Finland, Germany, Thailand, the Philippines, Indonesia, the United Kingdom, Sweden and certain United States state jurisdictions.
The decreasechange in our income tax expense in 20212023 compared to 20202022 is primarily attributable to a $8.7 million reductionprior year increase in the valuation allowance onof $5.6 million related to net operating losses and temporary deductible benefits in certain states that are now expected to be recovered.states.
The increase in our income tax expense in 2020 compared to 2019 is primarily attributable to additional income in our profitable foreign subsidiaries, additional foreign withholding taxes incurred on cross-border transactions, and a $1.1 million deferred tax liability related to unremitted earnings of certain foreign subsidiaries.
Liquidity and Capital Resources
Liquidity
Our primary liquidity requirements include debt service, funding dividends on preferred stock and working capital needs. We fund our liquidity requirements primarily through cash generated from operations, external sources of financing, including our recent revolving credit agreement,Credit Agreement with Axos Bank and senior notes, and equity offerings, including our Preferred Stock, each of which are described below and in the Notes to ourthe Consolidated Financial Statements included in Part II, Item 8 of this Annual Report in further detail along with other sources of liquidity.detail.
During 2021, we executed the following actions:
•We have recurring operating losses primarily due to losses recognized on February 12, 2021, we received gross proceeds of approximately $172.5 million after closing a public offering of our common stock in which 29,487,180 shares of common stock were issued, inclusive of 3,846,154 shares issued to B. Riley Securities, Inc., a related party, as representative of several underwriters in the common stock offering. Net proceeds received were approximately $163.0 million after deducting underwriting discounts and commissions, but before expenses;
•on February 12, 2021, we received gross proceeds of approximately $125.0 million after completing an issuance of our $125.0 million aggregate principal amount of 8.125% Senior Notes, in a public offering through B. Riley Securities, Inc., a related party, as representative of several underwriters in the senior notes offering. Net proceeds received were approximately $120.0 million after deducting underwriting discounts and commissions, but before expenses;
•on March 15, 2021, we completed the sale of certain fixed assets for the Copley, Ohio location for $4.0 million, received $3.3 million of net cash proceeds after adjustments and recognized a gain on sale of $1.9 million. In conjunction with the sale, we executed a leaseback agreement commencing March 16, 2021 and expiring on March 31, 2033;
•in May 2021, we completed a public offering of our Preferred Stock, in which we ultimately issued an aggregate 4,444,700 shares of our Preferred Stock, at an offering price of $25.00 per share for net proceeds of approximately $106.4 million after deducting underwriting discounts, commissions but before expenses, asB&W Solar loss contracts described in Note 17 to the Consolidated Financial Statements included in Part II, Item 8 of this Annual Report;
•in June 2021, we issued 2,916,880 shares of our Preferred Stock and paid $0.4 million in cash to B. Riley, a related party, in exchange for a deemed prepayment of $73.3 million of our then-existing Tranche A-3 term loan and paid $0.9 million in cash for accrued interest due to B. Riley, as described in Note 15 to the Consolidated Financial Statements included in Part II, Item 8 of this Annual Report. As a result of such deemed prepayment, the total amount outstanding under our Last Out Term Loans was reduced to zero;
•on June 30, 2021, September 30, 2021 and December 31, 2021, we paid dividends on our outstanding Preferred Stock totaling $1.7 million, $3.7 million and $3.7 million, respectively, as described in Note 17 to the Consolidated Financial Statements included in Part II, Item 8 of this Annual Report;
•on June 30, 2021, we entered into a Revolving Credit Agreement (the “Revolving Credit Agreement��) with PNC Bank, National Association, as administrative agent (“PNC”) and swing loan lender which provides for an up to $50.0 million asset-based revolving credit facility, including a $15 million letter of credit sublimit and a $5 million swingline sublimit. In addition, we entered into a Letter of Credit Agreement (the “Letter of Credit Agreement”) with PNC, pursuant to which PNC has agreed to issue up to $110 million in letters of credit secured in part by cash collateral provided by an affiliate of MSD Partners, MSD PCOF Partners XLV, LLC (“MSD”). Lastly, we entered into a Reimbursement Agreement (the “Reimbursement Agreement”) with MSD, as administrative agent, and the cash collateral providers from time to time party thereto, pursuant to which we shall reimburse MSD and any other
cash collateral provider to the extent the up to $110 million of cash collateral provided by MSD and any other cash collateral provider to secure the Letter of Credit Agreement is drawn to satisfy draws on letters of credit, as described in Note 16 to the Consolidated Financial Statements included in Part II, Item 8 of this Annual Report;
•in August 2021, we completed the sale of certain real property assets at our Lancaster, Ohio location for $18.9 million. We received $15.8 million of net proceeds after adjustments and expenses and recognized a gain on sale of $13.9 million. In conjunction with the sale, we executed a leaseback agreement commencing August 13, 2021 and expiring on August 31, 2041;
•on September 30, 2021, we acquired a 60% controlling ownership stake in Illinois-based solar energy contractor Fosler Construction Company Inc. (“Fosler Construction”) for approximately $27.2 million in cash plus contingent consideration arrangement, initially valued at $8.8 million, with a maximum value up to $10.0 million if a certain revenue target is achieved in 2022;
•on November 30, 2021, we acquired 100% ownership of VODA A/S (“VODA”) for approximately $32.9 million;
•on December 13, 2021, we completed a public offering of $140.0 million aggregate principal amount of our 6.50% senior notes due 2026 (the “6.50% Senior Notes”) and a subsequent exercise of $11.4 million aggregate principal of our 6.50% senior notes due 2026 by the underwriters was completed on December 30, 2021. At the completion of the offering and exercise, we received net proceeds of approximately $145.8 million after deducting underwriting discounts, commissions, and before expenses;
•as of December 31, 2021, we issued additional shares of our Preferred Stock for $7.7 million net proceeds under the sales agreement as described in Note 17 to the Consolidated Financial Statements included in Part II, Item 8 of this Annual Report;
•as of December 31, 2021, we issued an additional $26.2 million aggregate principal amount of 8.125% Senior Notes for $26.6 million net proceeds under the March 31, 2021 sales agreement as described in Note 14 to the Consolidated Financial Statements included in Part II, Item 8 of this Annual Report;
•on February 1, 2022, we acquired 100% ownership of Fossil Power Systems, Inc. for approximately $59.1 million, excluding working capital adjustments as described in Note 26 to the Consolidated Financial Statements included in Part II, Item 8 of this Annual Report;
•on February 28, 2022, we acquired 100% ownership of Optimus Industries, LLC for approximately $19 million, excluding working capital adjustments as described in Note 26 to the Consolidated Financial Statements included in Part II, Item 8 of this Annual Report.
See Note 14, Note 15, Note 16, Note 17, Note 18 and Note 264 to the Consolidated Financial Statements included in Part II, Item 8 of this Annual Report as well as increased selling, general and administrative expenses and higher debt service costs. Our net cash used in operating activities was $42.3 million and $30.6 million for additional informationthe years ended December 31, 2023 and December 31, 2022. Our assessment of our ability to fund future operations is inherently subjective, judgment-based and susceptible to change based on future events. Currently, with existing cash on hand and available liquidity, we are projecting insufficient liquidity to fund operations through one year
following the date that this Annual Report is issued. These conditions and events raise substantial doubt about our external sources of financing and equity offerings.ability to continue as a going concern.
As part of the Company’s ongoingIn response to the impactconditions, we are currently evaluating different strategies to obtain the required funding for future operations. We have taken or plan to take all or some combination of the COVID-19 pandemic on its business, the Company continuesfollowing actions, and continue to take a number of cash conservation and cost reduction measures which include:evaluate other actions:
•utilizing optionsinitiated the sale process of one of our non-strategic businesses;
•filed for government loans and programs ina waiver of required minimum contributions to the U.S. Plan, that if granted, would reduce cash funding requirements in 2024 and abroadwould increase contributions annually over the subsequent five-year period. We cannot provide any assurances that are appropriate and available;such waiver will be granted;
•initiated the sale process of several non-core real estate assets;
•plan to sell common shares pursuant to our At-The-Market Offering; and,
•deferring the remaining $20.9 millionconsidering alternative measures to manage cash flow, such as suspension of the estimated Pension Plan contribution paymentsdividend on our Preferred Stock.
Based on our ability to raise funds through the actions noted above and our Cash and cash equivalents as of $45.6 millionDecember 31, 2023, we have concluded that it is probable that such proceeds would have been due during 2021, in accordance withprovide sufficient liquidity to fund operations for the American Rescue Plan Actnext twelve months following the date of 2021 (the “ARPA relief plan”) signed into law in March 2021.this Annual Report. As a result, it is probable that our plans alleviate the substantial doubt about our ability to continue as a going concern.
Cash and Cash Flows
AtAs of December 31, 2021,2023, our unrestricted cash and cash equivalents, and restricted cash totaled $224.9$71.4 million and we had total debt of $340.3$379.5 million as well as $191.7 million of gross preferred stock outstanding. Our foreign business locations held $42.1$44.4 million of our total unrestricted cash and cash equivalents, atand restricted cash as of December 31, 2021.2023. In general, our foreign cash balances are not available to fund our U.S. operations unless the funds are repatriated or used to repay intercompany loans made from the U.S. to foreign entities, which could expose us to taxes we presently have not made a provision for in our results of operations. We presently have no plans to repatriate these funds to the U.S. In addition, we had $0.4$0.6 million of restricted cash atas of December 31, 20212023 related to collateral for certain letters of credit.
Cash used in operations was $111.2$42.3 million in the year ended December 31, 2021,2023, which is primarily attributable to the $60.8current year net loss, including discontinued operations, of $197.0 million, reductionpartially offset by $137.7 million in pension, postretirementnon-cash expense arising from goodwill impairment, adjustments to prior service pensions, depreciation and employee benefit liabilitiesamortization and a $62.2 million net decrease in operating cash outflows associated with changes in working capital. In the year ended December 31, 2020, cashstock-based compensation expenses. Cash used in operations was $40.8 million which is primarily the result of the change in accounts payable.
Cash flows from investing activities used net cash of $33.5$30.6 million in the year ended December 31, 2021,2022, which is primarily attributable to the net loss, including discontinued operations, of $26.6 million.
Cash flows used in investing activities totaled $7.9 million in the year ended December 31, 2023, primarily due to the acquisition of business of $55.3 million and $6.7$9.8 million of capital expenditures, partially offset by net proceeds from transactions in available-for-sale securities of $2.0 million. Cash flows used in investing activities totaled $68.8 million in the year ended December 31, 2022, primarily due to business acquisitions of $64.9 million and $13.2 million of capital expenditures, partially offset by proceeds from the sale of business and assets of $25.4$5.5 million and net sales and maturities of available-for-sale securities of $3.4 million. In
Cash flows provided by financing activities was $8.6 million during the year ended December 31, 2020, cash flows from investing activities provided net cash of $2.2 million,2023, primarily related to $8.0net borrowings of $25.9 million, from the settlement of remaining escrows associated with the sale of Palm Beach Resource Recovery Corporation and the MEGTEC and Universal businesses,partially offset by the net change in available-for-sale securitiespayments of preferred stock dividends of $11.1 million and $8.2 millionpayment of capital expenditures.
holdback funds related to an acquisition of $2.8 million. Cash flows fromused in financing activities provided net cash of $302.8$11.2 million induring the year ended December 31, 2021,2022, primarily related to therepayments of debt of $16.9 million and payments of preferred stock dividends of $14.9 million, partially offset by combined borrowings on loans payable, issuance of common stock, senior notes and preferred stock offset by$75.4 millionproceeds from sale-leaseback transactions of repayments of the Last Out Term Loans, a $164.3 million net reduction on the prior U.S. Revolving Credit Facility and $24.6 million of financing fees. Cash flows from financing activities provided net cash of $44.1 million in the year ended December 31, 2020, primarily related to $70.0 million face value borrowings from the Last Out Term Loans offset by $14.7 million of net repayments from the prior U.S. Revolving Credit Facility and $10.6 million of financing fees.$27.4 million.
Debt and Credit Facilities
As described in the NotesNote 15 to our Consolidated Financial Statements included in Part II, Item 8 of this Annual Report, on June 30, 2021, we entered intoherein, at December 31, 2023, our debt facilities include the Reimbursement Agreement, Revolving Credit Agreement and Letter of Credit Agreement (collectively, the “Debt Documents” and the facilities thereunder, the “Debt Facilities”). TheOur obligations of the Company under each of the Debt Facilities arewere guaranteed by certain of our existing and future domestic and foreign subsidiaries of the Company.subsidiaries. B. Riley, a related party, has provided a guaranty of payment with regard to the Company’sour obligations under the Reimbursement Agreement. The Company expects to useWe used the proceeds and letter of credit availability under the Debt Facilities for working capital purposes and general corporate purposes, including to backstop or replace certainpurposes. The Debt Facilities mature on June 30, 2025. For the year ended December 31, 2023, we had average daily borrowings of $14.2 million, and had
a maximum daily amount outstanding of $34.9 million. Usage under the Letter of Credit Agreement consisted of $15.9 million of financial letters of credit issued under our previous A&R Credit Agreement, for which commitments were terminated, all loans were repaid and all outstanding and undrawn$70.0 million of performance letters of credit were collateralized on June 30, 2021.at December 31, 2023.
Last Out Term Loans
Effective with the new debt facilities the Company entered into on June 30, 2021, as describedAs discussed in Note 1625 to the Consolidated Financial Statements included in Part II, Item 8 of this Annual Report, in January 2024, we entered into a new Credit Agreement with Axos Bank. This agreement substantially replaces the Companyexisting Reimbursement Agreement, Revolving Credit Agreement and Letter of Credit Agreement. B. Riley, a related party, has no remaining Last Out Term Loans and noprovided a guaranty of payment with regard to our obligations under the Credit Agreement. For further borrowings thereunder are available.
The Company recognized a loss on debt extinguishment of $6.2 million for the year ended December 31, 2020, primarily representing the unamortized value of the original issuance discount and feesdiscussion on the Tranche A-3 Last Out Term Loan.
Seenew agreement, see Note 15 to the Consolidated Financial Statements included in Part II, Item 8 of this Annual Report for additional information on our Last Out Term Loans.
A&R Credit Agreement
As described above, the A&R Credit Agreement commitments were terminated, all loans were repaid and all outstanding and undrawn letters of credit were collateralized on June 30, 2021. The Company recognized a gain on debt extinguishment of $6.5 million for the year ended December 31, 2021, primarily representing the write-off of accrued revolver fees of $11.3 million offset by the unamortized deferred financing fees of $4.8 million related to the prior A&R Credit Agreement.25.
Letters of Credit, Bank Guarantees and Surety Bonds
Certain of our subsidiaries, that are primarily outside of the United States, have credit arrangements with various commercial banks and other financial institutions for the issuance of letters of credit and bank guarantees in association with contracting activity. The aggregate value of all such letters of credit and bank guarantees outside of our Letter of Credit Agreement as of December 31, 20212023 was $52.8$39.4 million. The aggregate value of the outstanding letters of credit provided under the Letter of Credit Agreement backstopping letters of credit or bank guarantees was $35.5$21.7 million as of December 31, 2021.2023. Of the outstanding letters of credit issued under the Letter of Credit Agreement, $51.5$54.0 million are subject to foreign currency revaluation.
We have also posted surety bonds to support contractual obligations to customers relating to certain contracts. We utilize bonding facilities to support such obligations, but the issuance of bonds under those facilities is typically at the surety's discretion. These bonds generally indemnify customers should we fail to perform our obligations under theour applicable
contracts. We, and certain of our subsidiaries, have jointly executed general agreements of indemnity in favor of surety underwriters relating to surety bonds thosethe underwriters issue in support of some of our contracting activity. As of December 31, 2021,2023, bonds issued and outstanding under these arrangements in support of contracts totaled approximately $188.3$141.7 million. The aggregate value of the letters of credit backstopping surety bonds was $13.1$16.8 million.
Our ability to obtain and maintain sufficient capacity under our new Debt Facilitiescurrent debt facilities is essential to allow us to support the issuance of letters of credit, bank guarantees and surety bonds. Without sufficient capacity, our ability to support contract security requirements in the future will be diminished.
Other Indebtedness - Loans Payable
During the year ended December 31, 2021, our Denmark subsidiary received three unsecured interest-free loans totaling $3.3 million under a local government loan program related to COVID-19. The loans of $0.8 million, $1.6 million and $0.9 million are payable in April 2022, May 2022 and May 2023, respectively. The loan payable in May 2023 is included in long term loans payables in our Consolidated Balance Sheets.
As of December 31, 2021,2023, we had loans payable of $41.6 million, net of debt issuance costs of $0.5 million, of which $6.2 million is classified as a result of our recent acquisition of a 60% controlling ownership stake in Fosler Construction Company Inc. (“Fosler Construction”)current, and $35.4 million as described in Note 26 tolong-term loans payable on the Consolidated Financial Statements includedBalance Sheet. Included in Part II, Item 8these amounts, we had approximately $12.3 million, net of this Annual Report, Fosler Construction has two loans totaling $8.3 million. Both loans have a variable interest rate with a minimum ratedebt issuance costs of 6% and are due June 30, 2022. Fosler Construction also has loans primarily for vehicles and equipment totaling $0.7$0.5 million, at December 31, 2021. The vehicle and equipment loans are included in long term loans payables in our Consolidated Balance Sheets.related to sale-leaseback financing transactions.
Off-Balance Sheet Arrangements
The Company doesWe do not have any off-balance sheet arrangements that have, or are reasonably expected to have, a material current or future effect on its financial condition, results of operations, liquidity, capital expenditures or capital resources atas of December 31, 2021.
2023.
CRITICAL ACCOUNTING POLICIES AND ESTIMATES
The Consolidated Financial Statements included in Part II, Item 8 of this Annual Report are prepared in accordance with accounting principles generally accepted in the United States. Preparing financial statements requires management to make estimates and assumptions that affect the reported amounts of assets, liabilities, revenues and expenses. These estimates and assumptions are affected by management’s application of accounting policies. We believe the following are our most critical accounting policies that we apply in the preparation of our consolidated financial statements. These policies require our most difficult, subjective and complex judgments, often as a result of the need to make estimates of matters that are inherently uncertain.
Contracts and revenue recognition
A significant portion of our revenue is recognized over time using the cost-to-cost input method, which involves significant estimates. This method of revenue recognition uses costs incurred to dateincurred-to-date relative to total estimated costs at completion to measure progress toward satisfying our performance obligations. Incurred cost represents work performed, which corresponds with, and thereby best depicts, the transfer of control to the customer. Contract costs include labor, material, overhead warranty and when appropriate, SG&Awarranty expenses. Variable consideration in these contracts includes estimates of liquidated damages,contract modifications, contractual bonuses and penalties, and contract modifications.liquidated damages.
We review contract pricerevenue and cost estimates each reporting period as the work progresses and reflect adjustments proportionate to the costs incurred to dateincurred-to-date relative to total estimated costs at completion in income in the period when those estimates are revised. These changes in estimates can be material. For all contracts, if a current estimate of total contract cost indicates a loss on a contract, the projected contract loss is recognized in full through the statementConsolidated Statements of operationsOperations and an accrual for the estimated loss on the uncompleted contract is included in otherOther accrued liabilities in the Consolidated Balance Sheets. In addition, when we determine that an uncompleted contract will not be completed on-timeon time and the contract has liquidated damages provisions, we recognize the estimated liquidated damages we will incur and record them as a reduction of the estimated selling price in the period the change in estimate occurs. Losses accrued in advance of the completion of a contract are included in otherOther accrued liabilities in our Consolidated Balance Sheets.
Contract modifications are routine in the performance of our contracts. Contracts are often modified to account for changes in the contract specifications or requirements. In most instances, contract modifications are for goods or services that are not distinct and, therefore, are accounted for as part of the existing contract, with cumulative adjustment to revenue.
We recognize claims receivable in contract revenues for extra work or changes in scope of work to the extent of costs incurred when we believe we have an enforceable right to the modification or claim and the amount can be reasonably estimated reliably, and its realization is probable. In evaluating these criteria, we consider the contractual/legal basis for enforcing the claim, the cause of any additional costs incurred and whether those costs are identifiable or otherwise determinable, the nature and reasonableness of those costs, the objective evidence available to support the amount of the claim, and our relevant history with the counter-partycounterparty that supports our expectations about their willingness and ability to pay for the additional cost along with a reasonable margin. In our Consolidated Balance Sheets, claimsClaims receivable at December 31, 20212023 and December 31, 2020 were2022 was not significant.significant in the Consolidated Financial Statements.
Our revenue recognition policies, assumptions, changes in estimates and significant loss contracts are described in greater detail in Note 2 to the Consolidated Financial Statements included in Part II, Item 8 of this Annual Report.
Business Combinations
Assets acquired and liabilities assumed in a business combination are recognized and measured based on their estimated fair valuesvalue at the acquisition date, while the acquisition-related costs are expensed as incurred. Any excess of the purchase consideration when compared to the fair value of the net tangible and intangible assets acquired, if any, is recorded as goodwill. We engagedengage valuation specialists to assist with the determination of the fair value of assets acquired, liabilities assumed, non-controlling interest, and goodwill, if any, for the acquisitions.any acquisition. If the initial accounting for the business combination is incomplete by the end of the reporting period in which the acquisition occurs, an estimate will be recorded. Subsequent to the acquisition date,reporting period, and not later than one year from the acquisition date, we will record any material adjustments to the initial estimate based on new information obtained that would have existed as of the date of the acquisition. Any adjustment that arises from information obtained that did not exist as of the date of the acquisition will be recorded in the period the adjustment arises. See Note 262 to the Consolidated Financial Statements included in Part II, Item 8 of this Annual Report for further discussion.
Assets and Liabilities Held for Sale and Discontinued Operations
Assets and liabilities classified as held for sale are reported at the lower of their carrying value or fair value less costs to sell. Depreciation and amortization of assets ceases upon designation as held for sale. Discontinued operations comprise activities that were disposed of, discontinued or held for sale at the end of the period, represent a separate major line of business that can be clearly distinguished for operational and financial reporting purposes and represent a strategic business shift having a major effect on our operations and financial results according to ASC 205, Presentation of Financial Statements. We have
included all of the revenues and expenses for the B&W Solar business as discontinued operations in the Consolidated Statements of Operations and all assets and liabilities as held for sale in the Consolidated Balance Sheets.
Goodwill
Goodwill is generally recorded as a result of a business combination and represents the excess of the consideration transferred over the fair value of the assets acquired and liabilities assumed. We perform testing of goodwill for impairment annually on October 1 or when impairment indicators are present. In assessing goodwill for impairment, we follow ASC 350, Intangibles – Goodwill and Other, which permits a qualitative assessment of whether it is more likely than not that the fair value of the reporting unit is less than its carrying amount including goodwill. If the qualitative assessment determines that it is not more likely than not that the fair value of a reporting unit is less than its carrying amount, including goodwill, then no impairment is determined to exist for the reporting unit. However, if the qualitative assessment determines that it is more likely than not that the fair value of the reporting unit is less than its carrying amount, including goodwill, or we choose not to perform the qualitative assessment, then we compare the fair value of that reporting unit with its carrying amount, including goodwill, in a quantitative assessment. If the carrying amount of a reporting unit exceeds its fair value, goodwill is considered impaired with the impairment loss measured as the excess of the reporting unit’s carrying amount, including goodwill, over its fair value. The estimated fair value of the reporting unit is derived based on valuation techniques we believe market participants would use for each of the reporting units.
Warrantyexpenses
We accruerecord estimated expense included in costCost of operations on our in the Consolidated Statements of Operations to satisfy contractual warranty requirements when we recognize the associated revenues on the related contracts. In addition, we record specific provisions or reductionsadjustments when we expect the actual warranty costs to significantly differ from the accruedinitial estimates. Factors that impact our estimate of warranty costs include prior history of warranty claims and our estimatesestimate of future costs of materials and labor. Such changes could have a material effect on our consolidated financial condition,position, results of operations and cash flows. See Note 1112 to the Consolidated Financial Statements included in Part II, Item 8 of this Annual Report for further discussion.
Loss contingencies
We estimate liabilities for loss contingencies when it is probable that a liability has been incurred and the amount of loss is reasonably estimable. We provide disclosure when there is a reasonable possibility that the ultimate loss will exceed the recorded provision or if such probable loss is not reasonably estimable. We are currently involved in some significant litigation. See Note 2221 to the Consolidated Financial Statements included in Part II, Item 8 of this Annual Report for a discussion of this litigation. As disclosed, we have accrued estimates of the probable losses associated with these matters; however, these matters are typically resolved over long periods of time and are often difficult to estimate due to the possibility of multiple actions by third parties. Therefore, it is possible that future earnings could be affected by changes in our estimates related to these matters.
Income taxes
Income tax expense for federal, foreign, state, and local income taxes isare calculated on taxable income based on the income tax law in effect at the latest balance sheet date and includes the cumulative effect of any changes in tax rates from those used previously in determining deferred tax assets and liabilities. We record a valuation allowance to reduce our deferred tax assets to the amount that is more likely than not to be realized. We assess the need for valuation allowances on a quarterly
basis. In determining the need for a valuation allowance, we consider relevant positive and negative evidence, including carryback potential, reversals of taxable temporary differences, future taxable income, and tax-planning strategies. As of December 31, 2021,2023, we have a valuation allowance on our deferred tax assets in substantially all jurisdictions, as we do not believe it is more likely than not that the deferred tax assets will be realized.
For those tax positions where it is more likely than not that a tax benefit will be sustained,realized, we have recorded the largest amount of tax benefit with a greater than 50% likelihood of being realized upon ultimate settlement with a taxing authority that has full knowledge of all relevant information. For those income tax positions where it is not more likely than not that a tax benefit will be sustained,realized, no tax benefit has been recognized in our consolidated financial statements.the Consolidated Financial Statements. We record interest and penalties (net of any applicable tax benefit) related to income taxes as a component of provision for income taxes on ourin the Consolidated Statements of Operations.
Item 7A. Quantitative and Qualitative Disclosures About Market Risk
Our exposure to market risk from changes in interest rates relates primarily to our cash equivalents and our investment portfolio, which primarily consists of investments in U.S. government obligations and highly liquid money market instruments denominated in U.S. dollars. We are averse to principal loss and seek to ensure the safety and preservation of our invested funds by limiting default risk, market risk and reinvestment risk. Our investments are classified as available-for-sale.
We have operations in many foreign locations, and as a result, our financial results could be significantly affected by factors such as changes in foreign currency exchange (“FX”) rates or weak economic conditions in those foreign markets.markets since the functional currency of our foreign entities is not the U.S. dollar. Foreign currency transaction gains and losses on intercompany loans that are not designated as permanent loans are recorded in earnings. Our primary foreign currency exposures are Danish krone, British pound, Euro, Canadian dollar, Mexican peso,and Chinese yuan. If the balances of these intercompany loans atas of December 31, 20212023 were to remain constant, a 100 basis point change in FXforeign currency exchange rates would impact our earnings by an estimated $0.8$0.2 million per year.
ITEM 8. Consolidated Financial Statements and Supplemental Data
REPORT OF INDEPENDENT REGISTERED PUBLIC ACCOUNTING FIRM
To the Stockholders and the Board of Directors of Babcock & Wilcox Enterprises, Inc.:
Opinion on the Financial Statements
We have audited the accompanying consolidated balance sheets of Babcock & Wilcox Enterprises, Inc. and subsidiaries (the "Company") as of December 31, 20212023 and 2020,2022, the related consolidated statements of operations, comprehensive (loss) income, (loss), stockholders' equity, (deficit), and cash flows, for each of the three years in the period ended December 31, 2021,2023, and the related notes and the schedule listed in the Index at Item 15 (collectively referred to as the "financial statements"). In our opinion, the financial statements present fairly, in all material respects, the financial position of the Company as of December 31, 20212023 and 2020,2022, and the results of its operations and its cash flows for each of the three years in the period ended December 31, 2021,2023, in conformity with accounting principles generally accepted in the United States of America.
We have also audited, in accordance with the standards of the Public Company Accounting Oversight Board (UnitedUnited States) (PCAOB), the Company's internal control over financial reporting as of December 31, 2021,2023, based on criteria established in Internal Control — Integrated Framework (2013) issued by the Committee of Sponsoring Organizations of the Treadway Commission and our report dated March 8, 2022,15, 2024, expressed an unqualifiedadverse opinion on the Company's internal control over financial reporting.
Change in Accounting Principle
As discussed in Notes 2 and 6 toreporting because of the consolidated financial statements, the Company elected to change its method of accounting for certain inventories from the last-in, first-out (“LIFO”) cost method to the first-in, first-out (“FIFO”) cost method which has been retrospectively applied to the consolidated financial statements as of December 31, 2020 and 2019.material weaknesses.
Basis for Opinion
These financial statements are the responsibility of the Company's management. Our responsibility is to express an opinion on the Company's financial statements based on our audits. We are a public accounting firm registered with the PCAOB and are required to be independent with respect to the Company in accordance with the U.S. federal securities laws and the applicable rules and regulations of the Securities and Exchange Commission and the PCAOB.
We conducted our audits in accordance with the standards of the PCAOB. Those standards require that we plan and perform the audit to obtain reasonable assurance about whether the financial statements are free of material misstatement, whether due to error or fraud. Our audits included performing procedures to assess the risks of material misstatement of the financial statements, whether due to error or fraud, and performing procedures that respond to those risks. Such procedures included examining, on a test basis, evidence regarding the amounts and disclosures in the financial statements. Our audits also included evaluating the accounting principles used and significant estimates made by management, as well as evaluating the overall presentation of the financial statements. We believe that our audits provide a reasonable basis for our opinion.
Critical Audit Matter
The critical audit matter communicated below is a matter arising from the current-period audit of the financial statements that was communicated or required to be communicated to the audit committee and that (1) relates to accounts or disclosures that are material to the financial statements and (2) involved our especially challenging, subjective, or complex judgments. The
communication of critical audit matters does not alter in any way our opinion on the financial statements, taken as a whole, and we are not, by communicating the critical audit matter below, providing a separate opinion on the critical audit matter or on the accounts or disclosures to which it relates.
Revenue Recognition and Contracts – Refer to Notes 2 and 56 to the financial statements
Critical Audit Matter Description
The Company recognizes fixed price long-term contract revenue over the contract term (“over time”) as the work progresses, either as products are produced or as services are rendered, because transfer of control to the customer occurs over time. Substantially all of the Company’s fixed price long-term contracts represent a single performance obligation as the interdependent nature of the goods and services provided prevents them from being separately identifiable within the contract. Revenue recognized over time primarily relates to customized, engineered solutions and construction services from all three of the Company’s segments. Typically, revenue is recognized over time using the cost-to-cost input method that uses costs incurred to date relative to total estimated costs at completion to measure progress toward satisfying the Company’s performance obligations. The accounting for these contracts involves judgment, particularly as it relates to the process of estimating total costs and profit for the performance obligation. Revenue from fixed price long term contracts for products and services transferred to customercustomers over time accounted for 81%77% of Company revenue for the year ended December 31, 2021.2023.
We identified revenue on certain fixed price long-term contracts as a critical audit matter because of the judgments necessary for management to estimate total costs and profit for the performance obligations used to recognize revenue for fixed price long-term contracts. This required extensive audit effort due to the volume and complexity of fixed price long-term contracts and required a high degree of auditor judgment when performing audit procedures to audit management’s estimates of total costs and profit and evaluating the results of those procedures.
How the Critical Audit Matter Was Addressed in the Audit
Our audit procedures related to management’s estimates of total costs and profit for the performance obligations used to recognize revenue for certain fixed price long-term contracts included the following, among others:
•We selected a sample of fixed price long-term contracts performed over time and performed the following:
–Evaluated whether the fixed price contracts were properly included in management’s calculation of fixed price long-term contract revenue based on the terms and conditions of each contract, including whether continuous transfer of control to the customer occurred as progress was made toward fulfilling the performance obligation.
–Compared the transaction prices to the consideration expected to be received based on current rights and obligations under the contracts and any modifications that were agreed upon with the customers.
–Tested management’s identification of distinct performance obligations by evaluating whether the underlying goods, services, or both were highly interdependent and interrelated.
–Tested the accuracy and completeness of the costs incurred to date for the performance obligation.
–With the assistance of our capital projects specialists we evaluated the estimates of total cost and profit for the performance obligation by:
–Comparing costs incurred to date to the costs which management estimated to be incurred to date.
–Evaluating management’s ability to achieve the estimates of total cost and profit by performing corroborating inquiries with the Company’s project managers and engineers, and comparing the estimates to management’s work plans, engineering specifications, and supplier contracts.
–Comparing management’s estimates for the selected contracts to costs and profits of similar performance obligations, when applicable.
–Performing multiple live and virtual project site visits
–Tested the mathematical accuracy of management’s calculation of revenue for the performance obligation.
–Tested management’s retrospective review of each contract’s revenue to determine whether revenue is accurately recognized during the period under audit.
•Evaluated the Company’s disclosures related to revenue recognition and contracts to assess their conformity with the applicable accounting standards.
/s/ DELOITTEDeloitte & TOUCHETouche LLP
Cleveland, Ohio
March 8, 2022
We have served as the Company's auditor since 2014.
BABCOCK & WILCOX ENTERPRISES, INC.
CONSOLIDATED STATEMENTS OF OPERATIONS
| | | | | | | | | | | | | | | | | | | | | |
| | | Year ended December 31, |
| (in thousands, except per share amounts) | | | | | 2021 | | 2020* | | 2019* |
| Revenues | | | | | $ | 723,363 | | | $ | 566,317 | | | $ | 859,111 | |
| Costs and expenses: | | | | | | | | | |
| Cost of operations | | | | | 543,835 | | | 400,465 | | | 698,853 | |
| Selling, general and administrative expenses | | | | | 154,897 | | | 141,746 | | | 151,069 | |
| Advisory fees and settlement costs | | | | | 13,083 | | | 12,878 | | | 27,943 | |
| Restructuring activities | | | | | 4,869 | | | 11,849 | | | 11,707 | |
| Research and development costs | | | | | 1,595 | | | 4,379 | | | 2,861 | |
| Gain on asset disposals, net | | | | | (15,737) | | | (3,263) | | | (3,940) | |
| Total costs and expenses | | | | | 702,542 | | | 568,054 | | | 888,493 | |
| Operating income (loss) | | | | | 20,821 | | | (1,737) | | | (29,382) | |
| Other income (expense): | | | | | | | | | |
| Interest expense | | | | | (39,393) | | | (59,796) | | | (94,901) | |
| Interest income | | | | | 531 | | | 646 | | | 923 | |
| Gain (loss) on debt extinguishment | | | | | 6,530 | | | (6,194) | | | (3,969) | |
| Loss on sale of business | | | | | (1,753) | | | (108) | | | (3,601) | |
| Benefit plans, net | | | | | 48,142 | | | 5,600 | | | 22,800 | |
| Foreign exchange | | | | | (4,294) | | | 58,799 | | | (16,602) | |
| Other – net | | | | | (1,270) | | | (1,128) | | | 285 | |
| Total other income (expense) | | | | | 8,493 | | | (2,181) | | | (95,065) | |
| Income (loss) before income tax expense | | | | | 29,314 | | | (3,918) | | | (124,447) | |
| Income tax (benefit) expense | | | | | (2,224) | | | 8,179 | | | 5,286 | |
| Income (loss) from continuing operations | | | | | 31,538 | | | (12,097) | | | (129,733) | |
| Income from discontinued operations, net of tax | | | | | — | | | 1,800 | | | 694 | |
| Net income (loss) | | | | | 31,538 | | | (10,297) | | | (129,039) | |
| Net (income) loss attributable to non-controlling interest | | | | | (644) | | | (21) | | | 7,065 | |
| Net income (loss) attributable to stockholders | | | | | 30,894 | | | (10,318) | | | (121,974) | |
| Less: Dividend on Series A preferred stock | | | | | 9,127 | | | — | | | — | |
| Net income (loss) attributable to stockholders of common stock | | | | | $ | 21,767 | | | $ | (10,318) | | | $ | (121,974) | |
| | | | | | | | | |
| Basic income (loss) per share | | | | | | | | | |
| Continuing operations | | | | | $ | 0.26 | | | $ | (0.25) | | | $ | (3.89) | |
| Discontinued operations | | | | | — | | | 0.04 | | | 0.02 | |
| Basic income (loss) per share | | | | | $ | 0.26 | | | $ | (0.21) | | | $ | (3.87) | |
| Diluted income (loss) per share | | | | | | | | | |
| Continuing operations | | | | | $ | 0.26 | | | $ | (0.25) | | | $ | (3.89) | |
| Discontinued operations | | | | | — | | | 0.04 | | | 0.02 | |
| Diluted income (loss) per share | | | | | $ | 0.26 | | | $ | (0.21) | | | $ | (3.87) | |
| Shares used in the computation of income (loss) per share: | | | | | | | | | |
| Basic | | | | | 82,391 | | | 48,710 | | | 31,514 | |
| Diluted | | | | | 83,580 | | | 48,710 | | | 31,514 | |
*Year ended December 31, 2020 and 2019 amounts have been adjusted to reflect the change in inventory accounting method, as described in Notes 2 and 6 to the Consolidated Financial Statements. | | | | | | | | | | | | | | | | | | | | | |
| | | Year ended December 31, |
| (in thousands, except per share amounts) | | | | | 2023 | | 2022 | | 2021 |
| Revenues | | | | | $ | 999,354 | | | $ | 847,918 | | | $ | 710,873 | |
| Costs and expenses: | | | | | | | | | |
| Cost of operations | | | | | 775,267 | | | 660,981 | | | 535,825 | |
| Selling, general and administrative expenses | | | | | 190,521 | | | 180,548 | | | 151,764 | |
| | | | | | | | | |
| Advisory fees and settlement costs | | | | | 944 | | | 8,532 | | | 13,083 | |
| Restructuring activities | | | | | 4,222 | | | 560 | | | 4,869 | |
| Research and development costs | | | | | 8,444 | | | 3,805 | | | 1,595 | |
| Loss (gain) on asset disposals, net | | | | | 57 | | | (8,777) | | | (15,685) | |
| Total costs and expenses | | | | | 979,455 | | | 845,649 | | | 691,451 | |
| | | | | | | | | |
| Operating income | | | | | 19,899 | | | 2,269 | | | 19,422 | |
| Other (expense) income: | | | | | | | | | |
| Interest expense | | | | | (49,895) | | | (44,861) | | | (39,523) | |
| Interest income | | | | | 1,192 | | | 641 | | | 531 | |
| Gain on debt extinguishment | | | | | — | | | — | | | 6,530 | |
| Loss on sale of business | | | | | — | | | — | | | (1,753) | |
| Benefit plans, net | | | | | (37,505) | | | 37,528 | | | 48,142 | |
| Foreign exchange | | | | | (2,507) | | | (582) | | | (4,294) | |
| Other expense – net | | | | | (1,336) | | | (3,924) | | | (1,770) | |
| Total other (expense) income | | | | | (90,051) | | | (11,198) | | | 7,863 | |
| (Loss) income from continuing operations before income tax expense (benefit) | | | | | (70,152) | | | (8,929) | | | 27,285 | |
| Income tax expense (benefit) | | | | | 8,481 | | | 11,059 | | | (2,028) | |
| (Loss) income from continuing operations | | | | | (78,633) | | | (19,988) | | | 29,313 | |
| (Loss) income from discontinued operations, net of tax | | | | | (118,338) | | | (6,596) | | | 2,225 | |
| Net (loss) income | | | | | (196,971) | | | (26,584) | | | 31,538 | |
| Net (income) loss attributable to non-controlling interest | | | | | (237) | | | 3,723 | | | (644) | |
| Net (loss) income attributable to stockholders | | | | | $ | (197,208) | | | (22,861) | | | 30,894 | |
| Less: Dividends on Series A preferred stock | | | | | 14,858 | | | 14,860 | | | 9,127 | |
| Net (loss) income attributable to stockholders of common stock | | | | | $ | (212,066) | | | $ | (37,721) | | | $ | 21,767 | |
| | | | | | | | | |
| Basic (loss) income per share | | | | | | | | | |
| Continuing operations | | | | | $ | (1.05) | | | $ | (0.35) | | | $ | 0.23 | |
| Discontinued operations | | | | | (1.33) | | | (0.08) | | | 0.03 | |
| Basic (loss) income per share | | | | | $ | (2.38) | | | $ | (0.43) | | | $ | 0.26 | |
| Diluted (loss) income per share | | | | | | | | | |
| Continuing operations | | | | | (1.05) | | | (0.35) | | | 0.23 | |
| Discontinued operations | | | | | (1.33) | | | (0.08) | | | 0.03 | |
| Diluted (loss) income per share | | | | | $ | (2.38) | | | $ | (0.43) | | | $ | 0.26 | |
| Shares used in the computation of (loss) income per share: | | | | | | | | | |
| Basic | | | | | 89,011 | | | 88,256 | | | 82,391 | |
| Diluted | | | | | 89,011 | | | 88,256 | | | 83,580 | |
See accompanying notes to Consolidated Financial Statements.
BABCOCK & WILCOX ENTERPRISES, INC.
CONSOLIDATED STATEMENTS OF COMPREHENSIVE (LOSS) INCOME (LOSS)
| | | | | | | | | | | | | | | | | | | | | |
| | | Year ended December 31, |
| (in thousands) | | | | | 2021 | | 2020 | | 2019 |
| Net income (loss) | | | | | $ | 31,538 | | | $ | (10,297) | | | $ | (129,039) | |
| Other comprehensive income (loss): | | | | | | | | | |
| Currency translation adjustments (CTA) | | | | | (3,412) | | | $ | (53,318) | | | 13,401 | |
| | | | | | | | | |
| Reclassification of CTA to net income (loss) | | | | | (4,512) | | | — | | | 3,176 | |
| | | | | | | | | |
| Derivative financial instruments: | | | | | | | | | |
| Unrealized gains on derivative financial instruments | | | | | — | | | — | | | (1,367) | |
| Derivative financial instrument losses reclassified into net loss | | | | | — | | | — | | | 202 | |
| Derivative financial instruments reclassified to advanced billings on contracts | | | | | — | | | — | | | (197) | |
| | | | | | | | | |
| Benefit obligations: | | | | | | | | | |
| Pension and post retirement adjustments, net of tax | | | | | 1,492 | | | (998) | | | (1,857) | |
| | | | | | | | | |
| Other comprehensive (loss) income | | | | | (6,432) | | | (54,316) | | | 13,358 | |
| Total comprehensive income (loss) | | | | | 25,106 | | | (64,613) | | | (115,681) | |
| Comprehensive (loss) income attributable to non-controlling interest | | | | | (595) | | | (29) | | | 7,140 | |
| Comprehensive income (loss) attributable to stockholders | | | | | $ | 24,511 | | | $ | (64,642) | | | $ | (108,541) | |
| | | | | | | | | | | | | | | | | | | | | |
| | | Year ended December 31, |
| (in thousands) | | | | | 2023 | | 2022 | | 2021 |
| Net (loss) income | | | | | $ | (196,971) | | | $ | (26,584) | | | 31,538 | |
| Other comprehensive (loss) income: | | | | | | | | | |
| Currency translation adjustments ("CTA") | | | | | 5,555 | | | (14,834) | | | (3,412) | |
| | | | | | | | | |
| Reclassification of CTA to net loss | | | | | — | | | — | | | (4,512) | |
| | | | | | | | | |
| Benefit obligations: | | | | | | | | | |
| Pension and post retirement adjustments, net of tax | | | | | 870 | | | 870 | | | 1,492 | |
| | | | | | | | | |
| Other comprehensive loss | | | | | 6,425 | | | (13,964) | | | (6,432) | |
| Total comprehensive (loss) income | | | | | (190,546) | | | (40,548) | | | 25,106 | |
| Comprehensive (income) loss attributable to non-controlling interest | | | | | (127) | | | 3,852 | | | (595) | |
| Comprehensive (loss) income attributable to stockholders | | | | | $ | (190,673) | | | $ | (36,696) | | | $ | 24,511 | |
See accompanying notes to Consolidated Financial Statements.
BABCOCK & WILCOX ENTERPRISES, INC.
CONSOLIDATED BALANCE SHEETS
| | | | | | | | | | | |
| (in thousands, except per share amount) | December 31, 2021 | | December 31,
2020* |
| Cash and cash equivalents | $ | 224,874 | | | $ | 57,338 | |
| Restricted cash and cash equivalents | 1,841 | | | 10,085 | |
| Accounts receivable – trade, net | 132,068 | | | 128,317 | |
| Accounts receivable – other | 34,553 | | | 35,442 | |
| Contracts in progress | 80,176 | | | 59,308 | |
| Inventories | 79,527 | | | 74,446 | |
| Other current assets | 29,395 | | | 26,421 | |
| Current assets held for sale | — | | | 4,728 | |
| Total current assets | 582,434 | | | 396,085 | |
| Net property, plant and equipment, and finance lease | 85,627 | | | 85,078 | |
| Goodwill | 116,462 | | | 47,363 | |
| Intangible assets | 43,795 | | | 23,908 | |
| Right-of-use assets | 30,163 | | | 10,814 | |
| Other assets | 54,784 | | | 24,673 | |
| Non-current assets held for sale | — | | | 11,156 | |
| Total assets | $ | 913,265 | | | $ | 599,077 | |
| | | |
| Accounts payable | $ | 85,929 | | | $ | 73,481 | |
| Accrued employee benefits | 12,989 | | | 13,906 | |
| Advance billings on contracts | 68,380 | | | 64,002 | |
| Accrued warranty expense | 12,925 | | | 25,399 | |
| Financing lease liabilities | 2,445 | | | 886 | |
| Operating lease liabilities | 3,950 | | | 3,995 | |
| Other accrued liabilities | 54,385 | | | 80,858 | |
| Loans payable | 12,380 | | | — | |
| Current liabilities held for sale | — | | | 8,305 | |
| Total current liabilities | 253,383 | | | 270,832 | |
| Senior notes | 326,366 | | | — | |
| Long term loans payable | 1,543 | | | — | |
| Last out term loans | — | | | 183,330 | |
| Revolving credit facilities | — | | | 164,300 | |
| Pension and other accumulated postretirement benefit liabilities | 182,730 | | | 252,292 | |
| Non-current finance lease liabilities | 29,369 | | | 29,690 | |
| Non-current operating lease liabilities | 26,685 | | | 7,031 | |
| Other non-current liabilities | 34,567 | | | 22,579 | |
| Total liabilities | 854,643 | | | 930,054 | |
| Commitments and contingencies | 0 | | 0 |
| Stockholders' equity (deficit): | | | |
| Preferred stock, par value $0.01 per share, authorized shares of 20,000; issued and outstanding shares of 7,669 and 0 at December 31, 2021 and 2020, respectively | 77 | | | — | |
| Common stock, par value $0.01 per share, authorized shares of 500,000; issued and outstanding shares of 86,286 and 54,452 at December 31, 2021 and 2020, respectively | 5,110 | | | 4,784 | |
| Capital in excess of par value | 1,518,872 | | | 1,164,436 | |
| Treasury stock at cost, 1,525 and 718 shares at December 31, 2021 and 2020, respectively | (110,934) | | | (105,990) | |
| Accumulated deficit | (1,321,154) | | | (1,342,921) | |
| Accumulated other comprehensive loss | (58,822) | | | (52,390) | |
| Stockholders' equity (deficit) attributable to shareholders | 33,149 | | | (332,081) | |
| Non-controlling interest | 25,473 | | | 1,104 | |
| Total stockholders' equity (deficit) | 58,622 | | | (330,977) | |
| Total liabilities and stockholders' equity (deficit) | $ | 913,265 | | | $ | 599,077 | |
*Year ended December 31, 2020 amounts have been adjusted to reflect the change in inventory accounting method, as described in Notes 2 and 6 to the Consolidated Financial Statements. | | | | | | | | | | | |
| December 31, |
| (in thousands, except per share amount) | 2023 | | 2022 |
| Cash and cash equivalents | $ | 65,304 | | | $ | 76,238 | |
| Current restricted cash and cash equivalents | 5,737 | | | 15,335 | |
| Accounts receivable – trade, net | 144,016 | | | 158,360 | |
| Accounts receivable – other | 36,179 | | | 38,500 | |
| Contracts in progress | 90,054 | | | 118,180 | |
| Inventories, net | 113,890 | | | 102,636 | |
| Other current assets | 23,918 | | | 27,002 | |
| Current assets held for sale | 18,495 | | | 21,362 | |
| Total current assets | 497,593 | | | 557,613 | |
| Net property, plant and equipment and finance leases | 78,369 | | | 84,887 | |
| Goodwill | 101,956 | | | 100,437 | |
| Intangible assets, net | 45,627 | | | 51,564 | |
| Right-of-use assets | 28,192 | | | 28,362 | |
| Long-term restricted cash | 297 | | | 21,397 | |
| Deferred tax assets | 2,105 | | | 2,002 | |
| Other assets | 21,559 | | | 27,414 | |
| Non-current assets held for sale | — | | | 68,013 | |
| Total assets | $ | 775,698 | | | $ | 941,689 | |
| | | |
| Accounts payable | 127,491 | | | 131,221 | |
| Accrued employee benefits | 10,797 | | | 12,509 | |
| Advance billings on contracts | 81,098 | | | 130,945 | |
| Accrued warranty expense | 7,634 | | | 9,568 | |
| Financing lease liabilities | 1,367 | | | 1,180 | |
| Operating lease liabilities | 3,932 | | | 3,498 | |
| Other accrued liabilities | 68,090 | | | 54,035 | |
| Loans payable | 6,174 | | | 3,827 | |
| Current liabilities held for sale | 43,614 | | | 24,751 | |
| Total current liabilities | 350,197 | | | 371,534 | |
| Senior notes | 337,869 | | | 335,498 | |
| Long term loans payable | 35,442 | | | 13,197 | |
| | | |
| | | |
| Pension and other accumulated postretirement benefit liabilities | 172,911 | | | 136,176 | |
| Non-current finance lease liabilities | 26,206 | | | 27,482 | |
| Non-current operating lease liabilities | 25,350 | | | 25,588 | |
| Deferred tax liabilities | 12,991 | | | 12,056 | |
| Other non-current liabilities | 15,082 | | | 16,596 | |
| Non-current liabilities held for sale | — | | | 5,651 | |
| | | |
| Total liabilities | 976,048 | | | 943,778 | |
| Commitments and contingencies | | | |
| Stockholders' deficit: | | | |
| Preferred stock, par value $0.01 per share, authorized shares of 20,000; issued and outstanding shares of 7,669 at both December 31, 2023 and 2022 | 77 | | | 77 | |
| Common stock, par value $0.01 per share, authorized shares of 500,000; issued and outstanding shares of 89,449 and 88,700 at December 31, 2023 and 2022, respectively | 5,148 | | | 5,138 | |
| Capital in excess of par value | 1,546,281 | | | 1,537,625 | |
| Treasury stock at cost, 2,139 and 1,868 shares at December 31, 2023 and 2022, respectively | (115,164) | | | (113,753) | |
| Accumulated deficit | (1,570,942) | | | (1,358,875) | |
| Accumulated other comprehensive loss | (66,361) | | | (72,786) | |
| Stockholders' deficit attributable to shareholders | (200,961) | | | (2,574) | |
| Non-controlling interest | 611 | | | 485 | |
| Total stockholders' deficit | (200,350) | | | (2,089) | |
| Total liabilities and stockholders' deficit | $ | 775,698 | | | $ | 941,689 | |
See accompanying notes to Consolidated Financial Statements.
BABCOCK & WILCOX ENTERPRISES, INC.
CONSOLIDATED STATEMENTSTATEMENTS OF STOCKHOLDERS' (DEFICIT) EQUITY (DEFICIT)
| | | | | | | | | | | | | | | | | | | | | | | | | | | | | | | | | | | | | | | | | | | | | | | | | | | | | | | | | | | |
| Common Stock | | Preferred Stock | | Capital In
Excess of
Par Value | | Treasury Stock | | Accumulated Deficit | | Accumulated
Other
Comprehensive
Loss | | Non-controlling
Interest | | Total
Stockholders’
Equity (Deficit) |
| (in thousands, except share and per share amounts) | Shares | | Par
Value | | Shares | | Par
Value | | | | | | |
| Balance at December 31, 2020 | 54,452 | | | $ | 4,784 | | | — | | | $ | — | | | $ | 1,164,436 | | | $ | (105,990) | | | $ | (1,342,921) | | | $ | (52,390) | | | $ | 1,104 | | | $ | (330,977) | |
| Net income | — | | | — | | | — | | | — | | | — | | | — | | | 30,894 | | | — | | | 644 | | | 31,538 | |
| Currency translation adjustments | — | | | — | | | — | | | — | | | — | | | — | | | — | | | (7,924) | | | (49) | | | (7,973) | |
| Pension and postretirement adjustments, net of tax | — | | | — | | | — | | | — | | | — | | | — | | | — | | | 1,492 | | | — | | | 1,492 | |
| Stock-based compensation charges | 2,347 | | | 31 | | | — | | | — | | | 7,770 | | | (4,944) | | | — | | | — | | | — | | | 2,857 | |
| Common stock offering | 29,487 | | | 295 | | | — | | | — | | | 160,546 | | | — | | | — | | | — | | | — | | | 160,841 | |
| Preferred stock offering, net | — | | | — | | | 4,752 | | | 48 | | | 113,227 | | | — | | | — | | | — | | | — | | | 113,275 | |
| Equitized Last Out Term Loan principal payment | — | | | — | | | 2,917 | | | 29 | | | 72,893 | | | — | | | — | | | — | | | — | | | 72,922 | |
| Dividends to preferred stockholders | — | | | — | | | — | | | — | | | — | | | — | | | (9,127) | | | — | | | — | | | (9,127) | |
| Non-controlling interest from acquisition | — | | | — | | | — | | | — | | | — | | | — | | | — | | | — | | | 23,996 | | | 23,996 | |
| Dividends to non-controlling interest | — | | | — | | | — | | | — | | | — | | | — | | | — | | | — | | | (222) | | | (222) | |
| Balance at December 31, 2021 | 86,286 | | | $ | 5,110 | | | 7,669 | | | $ | 77 | | | $ | 1,518,872 | | | $ | (110,934) | | | $ | (1,321,154) | | | $ | (58,822) | | | $ | 25,473 | | | $ | 58,622 | |
| Net loss | — | | | — | | | — | | | — | | | — | | | — | | | (22,861) | | | — | | | (3,723) | | | (26,584) | |
| Currency translation adjustments | — | | | — | | | — | | | — | | | — | | | — | | | — | | | (14,834) | | | (129) | | | (14,963) | |
| Pension and postretirement adjustments, net of tax | — | | | — | | | — | | | — | | | — | | | — | | | — | | | 870 | | | — | | | 870 | |
| Stock-based compensation charges | 2,414 | | | 28 | | | — | | | — | | | 9,949 | | | (2,819) | | | — | | | — | | | — | | | 7,158 | |
| Purchase of Babcock & Wilcox Solar and SPIG non-controlling interest | — | | | — | | | — | | | — | | | 8,804 | | | — | | | — | | | — | | | (20,735) | | | (11,931) | |
| | | | | | | | | | | | | | | | | | | |
| | | | | | | | | | | | | | | | | | | |
| Dividends to preferred stockholders | — | | | — | | | — | | | — | | | — | | | — | | | (14,860) | | | — | | | — | | | (14,860) | |
| | | | | | | | | | | | | | | | | | | |
| Dividends to non-controlling interest | — | | | — | | | — | | | — | | | — | | | — | | | — | | | — | | | (401) | | | (401) | |
| Balance at December 31, 2022 | 88,700 | | | $ | 5,138 | | | 7,669 | | | $ | 77 | | | $ | 1,537,625 | | | $ | (113,753) | | | $ | (1,358,875) | | | $ | (72,786) | | | $ | 485 | | | $ | (2,089) | |
| Net loss | — | | | — | | | — | | | — | | | — | | | — | | | (197,208) | | | — | | | 237 | | | (196,971) | |
| Currency translation adjustments | — | | | — | | | — | | | — | | | — | | | — | | | — | | | 5,555 | | | (110) | | | 5,445 | |
| | | | | | | | | | | | | | | | | | | |
| Pension and postretirement adjustments, net of tax | — | | | — | | | — | | | — | | | — | | | — | | | — | | | 870 | | | — | | | 870 | |
| Stock-based compensation charges | 749 | | | 10 | | | — | | | — | | | 8,656 | | | (1,411) | | | — | | | — | | | — | | | 7,255 | |
| Dividends to preferred stockholders | — | | | — | | | — | | | — | | | — | | | — | | | (14,859) | | | — | | | — | | | (14,859) | |
| | | | | | | | | | | | | | | | | | | |
| | | | | | | | | | | | | | | | | | | |
| | | | | | | | | | | | | | | | | | | |
| | | | | | | | | | | | | | | | | | | |
| Dividends to non-controlling interest | — | | | — | | | — | | | — | | | — | | | — | | | — | | | — | | | (1) | | | (1) | |
| | | | | | | | | | | | | | | | | | | |
| | | | | | | | | | | | | | | | | | | |
| | | | | | | | | | | | | | | | | | | |
| Balance at December 31, 2023 | 89,449 | | | $ | 5,148 | | | 7,669 | | | $ | 77 | | | $ | 1,546,281 | | | $ | (115,164) | | | $ | (1,570,942) | | | $ | (66,361) | | | $ | 611 | | | $ | (200,350) | |
| | | | | | | | | | | | | | | | | | | |
| | | | | | | | | | | | | | | | | | | |
| | | | | | | | | | | | | | | | | | | | | | | | | | | | | | | | | | | | | | | | | | | | | | | | | | | | | | | | | | | |
| Common Stock | | Preferred Stock | | Capital In
Excess of
Par Value | | Treasury Stock | | Accumulated Deficit | | Accumulated
Other
Comprehensive
Loss | | Non-controlling
Interest | | Total
Stockholders’
Equity (Deficit) |
| (in thousands, except share and per share amounts) | Shares | | Par
Value | | Shares | | Par
Value | | | | | | |
| Balance at December 31, 2018 (As reported) | 16,879 | | | $ | 1,748 | | | — | | | $ | — | | | $ | 1,047,062 | | | $ | (105,590) | | | $ | (1,217,914) | | | $ | (11,432) | | | $ | 8,829 | | | $ | (277,297) | |
| Inventory accounting method change* | — | | | — | | | — | | | — | | | — | | | — | | | 7,285 | | | — | | | — | | | 7,285 | |
| Balance at December 31, 2018 | 16,879 | | | 1,748 | | | — | | | — | | | 1,047,062 | | | (105,590) | | | (1,210,629) | | | (11,432) | | | 8,829 | | | (270,012) | |
| Net loss | — | | | — | | | — | | | — | | | — | | | — | | | (121,974) | | | — | | | (7,065) | | | (129,039) | |
| Currency translation adjustments | — | | | — | | | — | | | — | | | — | | | — | | | — | | | 16,577 | | | (75) | | | 16,502 | |
| Derivative financial instruments | — | | | — | | | — | | | — | | | — | | | — | | | — | | | (1,362) | | | — | | | (1,362) | |
| Pension and post retirement adjustments, net of tax | — | | | — | | | — | | | — | | | — | | | — | | | — | | | (1,857) | | | — | | | (1,857) | |
| Stock-based compensation charges | 108 | | | 12 | | | — | | | — | | | 3,072 | | | (117) | | | — | | | — | | | — | | | 2,967 | |
| Rights offering, net | 13,922 | | | 1,392 | | | — | | | — | | | 39,544 | | | — | | | — | | | — | | | — | | | 40,936 | |
| Last Out Term Loan principal value exchanged for common stock | 15,465 | | | 1,547 | | | — | | | — | | | 44,848 | | | — | | | — | | | — | | | — | | | 46,395 | |
| Issuance of beneficial conversion option of Last Out Term Loan Tranche A-3 | — | | | — | | | — | | | — | | | 2,022 | | | — | | | — | | | — | | | — | | | 2,022 | |
| Warrants | — | | | — | | | — | | | — | | | 6,066 | | | — | | | — | | | — | | | — | | | 6,066 | |
| Dividends to non-controlling interest | — | | | — | | | — | | | — | | | — | | | — | | | — | | | — | | | (272) | | | (272) | |
| Balance at December 31, 2019 | 46,374 | | | 4,699 | | | — | | | $ | — | | | $ | 1,142,614 | | | $ | (105,707) | | | $ | (1,332,603) | | | $ | 1,926 | | | $ | 1,417 | | | $ | (287,654) | |
| Net (loss) income | — | | | — | | | — | | | — | | | — | | | — | | | (10,318) | | | — | | | 21 | | | (10,297) | |
| Currency translation adjustments | — | | | — | | | — | | | — | | | — | | | — | | | — | | | (53,318) | | | 8 | | | (53,310) | |
| Pension and post retirement adjustments, net of tax | — | | | — | | | — | | | — | | | — | | | — | | | — | | | (998) | | | — | | | (998) | |
| Stock-based compensation charges | 460 | | | 9 | | | — | | | — | | | 4,548 | | | (283) | | | — | | | — | | | — | | | 4,274 | |
| Equitized guarantee fee payment | 1,713 | | | 17 | | | — | | | — | | | 3,883 | | | — | | | — | | | — | | | — | | | 3,900 | |
| Equitized Last Out Term Loan principal payment | 5,905 | | | 59 | | | — | | | — | | | 13,391 | | | — | | | — | | | — | | | — | | | 13,450 | |
| Dividends to non-controlling interest | — | | | — | | | — | | | — | | | — | | | — | | | — | | | — | | | (342) | | | (342) | |
| Balance at December 31, 2020 | 54,452 | | | $ | 4,784 | | | — | | | $ | — | | | $ | 1,164,436 | | | $ | (105,990) | | | $ | (1,342,921) | | | $ | (52,390) | | | $ | 1,104 | | | $ | (330,977) | |
| Net income | — | | | — | | | — | | | — | | | — | | | — | | | 30,894 | | | — | | | 644 | | | 31,538 | |
| Currency translation adjustments | — | | | — | | | — | | | — | | | — | | | — | | | — | | | (7,924) | | | (49) | | | (7,973) | |
| Pension and post retirement adjustments, net of tax | — | | | — | | | — | | | — | | | — | | | — | | | — | | | 1,492 | | | — | | | 1,492 | |
| Stock-based compensation charges | 2,347 | | | 31 | | | — | | | — | | | 7,770 | | | (4,944) | | | — | | | — | | | — | | | 2,857 | |
| Common stock offering | 29,487 | | | 295 | | | — | | | — | | | 160,546 | | | — | | | — | | | — | | | — | | | 160,841 | |
| Preferred stock offering, net | — | | | — | | | 4,752 | | | 48 | | | 113,227 | | | — | | | — | | | — | | | — | | | 113,275 | |
| Equitized Last Out Term Loan principal payment | — | | | — | | | 2,917 | | | 29 | | | 72,893 | | | — | | | — | | | — | | | — | | | 72,922 | |
| Dividends to preferred stockholders | — | | | — | | | — | | | — | | | — | | | — | | | (9,127) | | | — | | | — | | | (9,127) | |
| Non-controlling interest from acquisition | — | | | — | | | — | | | — | | | — | | | — | | | — | | | — | | | 23,996 | | | 23,996 | |
| Dividends to non-controlling interest | — | | | — | | | — | | | — | | | — | | | — | | | — | | | — | | | (222) | | | (222) | |
| Balance at December 31, 2021 | 86,286 | | | $ | 5,110 | | | 7,669 | | | $ | 77 | | | $ | 1,518,872 | | | $ | (110,934) | | | $ | (1,321,154) | | | $ | (58,822) | | | $ | 25,473 | | | $ | 58,622 | |
*Amount reflects the change in inventory accounting method, as described in Notes 2 and 6 to the Consolidated Financial Statements
See accompanying notes to Consolidated Financial Statements.
BABCOCK & WILCOX ENTERPRISES, INC.
CONSOLIDATED STATEMENTS OF CASH FLOWS
| | Year ended December 31, |
| Year ended December 31, | | | Year ended December 31, |
| (in thousands) | (in thousands) | 2021 | | 2020 | | 2019 | (in thousands) | 2023 | | 2022 | | 2021 |
| Cash flows from operating activities: | Cash flows from operating activities: | | | | | |
| Net income (loss) | $ | 31,538 | | | $ | (10,297) | | | $ | (129,039) | |
| Adjustments to reconcile net loss to net cash used in operating activities: | |
| | Net (loss) income from continuing operations | |
| | Net (loss) income from continuing operations | |
| | Net (loss) income from continuing operations | |
| Net (loss) income from discontinued operations | |
| Net (loss) income | |
| Adjustments to reconcile net (loss) income to net cash used in operating activities: | |
| Depreciation and amortization of long-lived assets | Depreciation and amortization of long-lived assets | 18,337 | | | 16,805 | | | 23,605 | |
| Depreciation and amortization of long-lived assets | |
| Depreciation and amortization of long-lived assets | |
| Goodwill impairment | |
| Change in fair value of contingent consideration | |
| Amortization of deferred financing costs and debt discount | Amortization of deferred financing costs and debt discount | 7,918 | | | 16,743 | | | 61,181 | |
| Amortization of guaranty fee | Amortization of guaranty fee | 1,832 | | | 1,159 | | | — | |
| Non-cash operating lease expense | Non-cash operating lease expense | 4,154 | | | 4,765 | | | 5,356 | |
| Loss on sale of business | Loss on sale of business | 1,753 | | | 108 | | | 3,601 | |
| (Gain) loss on debt extinguishment | (6,530) | | | 6,194 | | | 3,969 | |
| Gain on asset disposals | (15,737) | | | (3,262) | | | (3,940) | |
| Gain on debt extinguishment | |
| Loss (gain) on asset disposals | |
| (Benefit from) provision for deferred income taxes, including valuation allowances | (Benefit from) provision for deferred income taxes, including valuation allowances | (7,745) | | | 1,791 | | | (855) | |
| Mark to market, prior service cost amortization for pension and postretirement plans | Mark to market, prior service cost amortization for pension and postretirement plans | (15,512) | | | 22,156 | | | (10,661) | |
| Stock-based compensation, net of associated income taxes | Stock-based compensation, net of associated income taxes | 7,801 | | | 4,557 | | | 3,084 | |
| Equitized non-cash interest expense | — | | | 13,450 | | | — | |
| | Foreign exchange | |
| Foreign exchange | |
| Foreign exchange | Foreign exchange | 4,294 | | | (58,799) | | | 16,602 | |
| Changes in assets and liabilities: | Changes in assets and liabilities: | |
| Accounts receivable | |
| Accounts receivable | |
| Accounts receivable | Accounts receivable | 225 | | | 21,673 | | | 63,914 | |
| Contracts in progress | Contracts in progress | (20,099) | | | 35,850 | | | 48,492 | |
| Advance billings on contracts | Advance billings on contracts | 1,641 | | | (13,057) | | | (71,268) | |
| Inventories | Inventories | (3,047) | | | (4,084) | | | (4,141) | |
| Income taxes | Income taxes | (2,142) | | | (2,425) | | | 1,273 | |
| Accounts payable | Accounts payable | 7,080 | | | (42,001) | | | (80,459) | |
| Accrued and other current liabilities | Accrued and other current liabilities | (47,768) | | | 9,146 | | | (23,101) | |
| Accrued contract loss | Accrued contract loss | (204) | | | (5,557) | | | (50,654) | |
| Pension liabilities, accrued postretirement benefits and employee benefits | Pension liabilities, accrued postretirement benefits and employee benefits | (60,760) | | | (37,223) | | | (16,346) | |
| Other, net | Other, net | (18,225) | | | (18,498) | | | (16,930) | |
| Net cash used in operating activities | Net cash used in operating activities | (111,196) | | | (40,806) | | | (176,317) | |
| Cash flows from investing activities: | Cash flows from investing activities: | | | | | |
| Purchase of property, plant and equipment | Purchase of property, plant and equipment | (6,679) | | | (8,230) | | | (3,804) | |
| Purchase of property, plant and equipment | |
| Purchase of property, plant and equipment | |
| Acquisition of business, net of cash acquired | Acquisition of business, net of cash acquired | (55,341) | | | — | | | — | |
| Proceeds from sale of business and assets, net | Proceeds from sale of business and assets, net | 25,390 | | | 8,000 | | | 7,445 | |
| Purchases of available-for-sale securities | Purchases of available-for-sale securities | (12,605) | | | (29,068) | | | (8,914) | |
| Sales and maturities of available-for-sale securities | Sales and maturities of available-for-sale securities | 15,694 | | | 26,563 | | | 11,547 | |
| Other, net | Other, net | — | | | 4,954 | | | 2,505 | |
| Net cash (used in) from investing activities | (33,541) | | | 2,219 | | | 8,779 | |
| Net cash used in investing activities | |
| | Year ended December 31, | |
| (in thousands) | |
| (in thousands) | |
| (in thousands) | |
| Cash flows from financing activities: | |
| Cash flows from financing activities: | |
| Cash flows from financing activities: | |
| Issuance of senior notes | |
| Issuance of senior notes | |
| Issuance of senior notes | |
| Borrowings on loan payable | |
| Borrowings on loan payable | |
| Borrowings on loan payable | |
| Repayments on loan payable | |
| Repayments on loan payable | |
| Repayments on loan payable | |
| Payment of holdback funds from acquisition | |
| Payment of holdback funds from acquisition | |
| Payment of holdback funds from acquisition | |
| Proceeds from sale-leaseback financing transactions | |
| Proceeds from sale-leaseback financing transactions | |
| Proceeds from sale-leaseback financing transactions | |
| Finance lease payments | |
| Finance lease payments | |
| Finance lease payments | |
| | Repayments under last out term loans | |
| | Repayments under last out term loans | |
| | Repayments under last out term loans | |
| Borrowings under U.S. revolving credit facility | |
| Borrowings under U.S. revolving credit facility | |
| Borrowings under U.S. revolving credit facility | |
| Repayments of U.S. revolving credit facility | |
| Repayments of U.S. revolving credit facility | |
| Repayments of U.S. revolving credit facility | |
| | Issuance of preferred stock, net | |
| | Issuance of preferred stock, net | |
| | Issuance of preferred stock, net | |
| Payment of preferred stock dividends | |
| Payment of preferred stock dividends | |
| Payment of preferred stock dividends | |
| Shares of common stock returned to treasury stock | |
| Shares of common stock returned to treasury stock | |
| Shares of common stock returned to treasury stock | |
| Proceeds from rights offering | |
| Proceeds from rights offering | |
| Proceeds from rights offering | |
| Costs related to rights offering | |
| Costs related to rights offering | |
| Costs related to rights offering | |
| Issuance of common stock, net | |
| Issuance of common stock, net | |
| Issuance of common stock, net | |
| Debt issuance costs | |
| Debt issuance costs | |
| Debt issuance costs | |
| Other, net | |
| Other, net | |
| Other, net | |
| Net cash from (used in) financing activities | |
| Net cash from (used in) financing activities | |
| Net cash from (used in) financing activities | |
| Effects of exchange rate changes on cash | |
| Effects of exchange rate changes on cash | |
| Effects of exchange rate changes on cash | |
| Net (decrease) increase in cash, cash equivalents and restricted cash | |
| Net (decrease) increase in cash, cash equivalents and restricted cash | |
| Net (decrease) increase in cash, cash equivalents and restricted cash | |
| Cash, cash equivalents and restricted cash, beginning of period | |
| Cash, cash equivalents and restricted cash, beginning of period | |
| Cash, cash equivalents and restricted cash, beginning of period | |
| Cash, cash equivalents and restricted cash at end of period | |
| Cash, cash equivalents and restricted cash at end of period | |
| Cash, cash equivalents and restricted cash at end of period | |
| | Schedule of cash, cash equivalents and restricted cash: | |
| | Schedule of cash, cash equivalents and restricted cash: | |
| | Schedule of cash, cash equivalents and restricted cash: | |
Cash and cash equivalents(1) | |
Cash and cash equivalents(1) | |
Cash and cash equivalents(1) | |
| Current restricted cash | |
| Current restricted cash | |
| Current restricted cash | |
| Long-term restricted cash | |
| Long-term restricted cash | |
| Long-term restricted cash | |
| Cash, cash equivalents and restricted cash at end of period | |
| Cash, cash equivalents and restricted cash at end of period | |
| Cash, cash equivalents and restricted cash at end of period | |
| | Income taxes paid, net | |
| | Income taxes paid, net | |
| | Income taxes paid, net | |
| Interest paid | |
| Interest paid | |
| Interest paid | |
| (1) Includes cash held at discontinued operations of $0.03 million, $0.49 million and $0.00 million at December 31, 2023, 2022 and 2021, respectively. | |
| (1) Includes cash held at discontinued operations of $0.03 million, $0.49 million and $0.00 million at December 31, 2023, 2022 and 2021, respectively. | |
| (1) Includes cash held at discontinued operations of $0.03 million, $0.49 million and $0.00 million at December 31, 2023, 2022 and 2021, respectively. | |
| | | Year ended December 31, |
| (in thousands) | 2021 | | 2020 | | 2019 |
| Cash flows from financing activities: | | | | | |
| Issuance of senior notes | 303,324 | | | — | | | — | |
| Borrowings on loan payable | 7,145 | | | — | | | — | |
| Repayments on loan payable | (846) | | | — | | | — | |
| Borrowings under last out term loans | — | | | 70,000 | | | 151,350 | |
| Repayments under last out term loans | (75,408) | | | — | | | (41,766) | |
| Borrowings under U.S. revolving credit facility | 14,500 | | | 158,900 | | | 291,600 | |
| Repayments of U.S. revolving credit facility | (178,800) | | | (173,600) | | | (257,500) | |
| Repayments under our foreign revolving credit facilities | — | | | — | | | (605) | |
| Issuance of preferred stock, net | 113,275 | | | — | | | — | |
| Payment of preferred stock dividends | (9,127) | | | — | | | — | |
| Shares of common stock returned to treasury stock | (4,944) | | | (283) | | | (117) | |
| Proceeds from rights offering | — | | | — | | | 40,376 | |
| Costs related to rights offering | — | | | — | | | (832) | |
| Issuance of common stock, net | 160,841 | | | — | | | 1,392 | |
| Debt issuance costs | (24,560) | | | (10,590) | | | (16,619) | |
| Other, net | (2,588) | | | (329) | | | (261) | |
| Net cash from financing activities | 302,812 | | | 44,098 | | | 167,018 | |
| Effects of exchange rate changes on cash | 1,217 | | | 4,971 | | | (2,818) | |
| Net increase (decrease) in cash, cash equivalents and restricted cash | 159,292 | | | 10,482 | | | (3,338) | |
| Cash, cash equivalents and restricted cash, beginning of period | 67,423 | | | 56,941 | | | 60,279 | |
| Cash, cash equivalents and restricted cash, end of period | $ | 226,715 | | | $ | 67,423 | | | $ | 56,941 | |
|
See accompanying notes to Consolidated Financial Statements.
BABCOCK & WILCOX ENTERPRISES, INC.
NOTES TO CONSOLIDATED FINANCIAL STATEMENTS
DECEMBER 31, 20212023
NOTE 1 – BASIS OF PRESENTATION
The Consolidated Financial Statements of Babcock & Wilcox Enterprises, Inc. (“B&W,” “management,” “we,” “us,” “our” or the “Company”) have been prepared in accordance with accounting principles generally accepted in the United States (“GAAP”).GAAP. We have eliminated all intercompany transactions and accounts. We present the notesUnless otherwise noted, discussion of our business and results of operations in this Annual Report on Form 10-K refers to our continuing operations.
Liquidity and Going Concern
The accompanying Consolidated Financial Statements onhave been prepared in accordance with GAAP applicable to a going concern, which contemplates the basisrealization of continuing operations, unless otherwise stated.assets and the satisfaction of liabilities in the normal course of business.
COVID-19We have recurring operating losses primarily due to losses recognized on B&W Solar loss contracts described in Note 4 to the Consolidated Financial Statements as well as increased selling, general and administrative expenses and higher debt service costs. Our net cash used in operating activities was $42.3 million and $30.6 million for the years ended December 31, 2023 and December 31, 2022. Our assessment of our ability to fund future operations is inherently subjective, judgment-based and susceptible to change based on future events. Currently, with existing cash on hand and available liquidity, we are projecting insufficient liquidity to fund operations through one year following the date that this Annual Report is issued. These conditions and events raise substantial doubt about our ability to continue as a going concern.
In response to the conditions, we are currently evaluating different strategies to obtain the required funding for future operations. We have taken or plan to take all or some combination of the following actions, and continue to evaluate other actions:
•initiated the sale process of one of our non-strategic businesses;
•filed for a waiver of required minimum contributions to the U.S. Plan, that if granted, would reduce cash funding requirements in 2024 and would increase contributions annually over the subsequent five-year period. We cannot provide any assurances that such waiver will be granted;
•initiated the sale process of several non-core real estate assets;
•plan to sell common shares pursuant to our At-The-Market Offering; and,
•considering alternative measures to manage cash flow, such as suspension of the dividend on our Preferred Stock.
Based on our ability to raise funds through the actions noted above and our Cash and cash equivalents as of December 2019,31, 2023, we have concluded that it is probable that such proceeds would provide sufficient liquidity to fund operations for the next twelve months following the date of this Annual Report. As a novel strainresult, it is probable that our plans alleviate the substantial doubt about our ability to continue as a going concern.
Operations
Our operations are assessed based on three reportable market-facing segments as part of coronavirus, COVID-19, was identified in Wuhan, Chinaour strategic, market-focused organizational and subsequently spread globally. This global pandemic has disrupted business operations,re-branding initiative to accelerate growth and provide stakeholders improved visibility into its renewable and environmental growth platforms. Our reportable segments are as follows:
•Babcock & Wilcox Renewable: Technologies for efficient and environmentally sustainable power and heat generation, including global supply chains, trade, commerce, financialwaste-to-energy, biomass-to-energy and credit markets,black liquor systems for the pulp and daily life throughoutpaper industry. Our technologies support a circular economy, diverting waste from landfills to use for power generation and replacing fossil fuels, while recovering metals and reducing emissions.
•Babcock & Wilcox Environmental: A full suite of emissions control and environmental technology solutions for utility, waste-to-energy, biomass-to-energy, carbon black, and industrial steam generation applications around the world. Our business has been,broad experience includes systems for cooling, ash handling, particulate control, nitrogen oxides and continues to be, adversely impacted by the measures takensulfur dioxides removal, chemical looping for carbon control, and restrictions imposedmercury control.
•Babcock & Wilcox Thermal: Steam generation equipment, aftermarket parts, construction, maintenance and field services for plants in the countries in which we operatepower generation, oil and by local governmentsgas, and others to control the spreadindustrial sectors. We have an extensive global base of this virus. These measuresinstalled equipment for utilities and restrictions have varied widelygeneral industrial applications including refining, petrochemical, food processing, metals and have been subject to significant changes from time to time depending on changes in the severity of the virus in these countries and localities. These restrictions, including curtailment of travel and other activity, negatively impact our ability to conduct business.others.
Disruption toFor financial information about our global supply changes from COVID-19 has included impactssegments see Note 5 to the manufacturing, supply, distribution, transportation and delivery of our products. We could also see significant disruptions of the operations of our logistics, service providers, delays in shipments and negative impacts to pricing of certain of our products. Disruptions and delays in our supply chains as a result of the COVID-19 pandemic could adversely our ability to meet our customers’ demands. Additionally, the prioritization of shipments of certain products as a result of the pandemic could cause delays in the shipment or delivery of our products. Such disruptions could result in reduced sales.Consolidated Financial Statements.
The volatility and variability of the virus has limited our ability to forecast the impact of the virus on our customers and our business. The ongoing impact of COVID-19, including new strains such as the delta and omicron variants, has resulted in the reimposition of certain restrictions and may lead to other restrictions being implemented in response to efforts to reduce the spread of the virus. These varying and changing events have caused many of the projects we had anticipated would begin in 2020 to be delayed into the 2022 and beyond. Many customers and projects require B&W's employees to travel to customer and project worksites. Certain customers and significant projects are located in areas where travel restrictions have been imposed, certain customers have closed or reduced on-site activities, and timelines for completion of certain projects have, as noted above, been extended into 2022 and beyond. Additionally, out of concern for our employees, even where restrictions permit employees to return to our offices and worksites, we incurred additional costs to protect our employees and advised those who are uncomfortable returning to worksites due to the pandemic that they are not required to do so for an indefinite period of time. The resulting uncertainty concerning, among other things, the spread and economic impact of the virus has also caused significant volatility and, at times, illiquidity in global equity and credit markets. The full extent of the impact of COVID-19 and its variants on our operational and financial performance will depend on future developments, including the ultimate duration and spread of the pandemic and related actions taken by the U.S. government, state and local government officials, and international governments to prevent outbreaks, as well as the availability, effectiveness and acceptance of COVID-19 vaccinations in the U.S. and abroad, all of which are uncertain, out of our control, and cannot be predicted.
NOTE 2 – SIGNIFICANT ACCOUNTING POLICIES
Reportable segments
Our operations are assessed based on 3 reportable market-facing segments as part of the Company's strategic, market-focused organizational and re-branding initiative to accelerate growth and provide stakeholders improved visibility into our renewable and environmental growth platforms. Our reportable segments are as follows:
•Babcock & Wilcox Renewable: Cost-effective technologies for efficient and environmentally sustainable power and heat generation, including waste-to-energy, solar construction and installation, biomass energy and black liquor systems for the pulp and paper industry. B&W’s leading technologies support a circular economy, diverting waste from landfills to use for power generation and replacing fossil fuels, while recovering metals and reducing emissions.
•Babcock & Wilcox Environmental: A full suite of best-in-class emissions control and environmental technology solutions for utility, waste to energy, biomass, carbon black, and industrial steam generation applications around the world. B&W’s broad experience includes systems for cooling, ash handling, particulate control, nitrogen oxides and sulfur dioxides removal, chemical looping for carbon control, and mercury control.
•Babcock & Wilcox Thermal: Steam generation equipment, aftermarket parts, construction, maintenance and field services for plants in the power generation, oil and gas, and industrial sectors. B&W has an extensive global base of installed equipment for utilities and general industrial applications including refining, petrochemical, food processing, metals and others..
For financial information about our segments see Note 4 to our Consolidated Financial Statements.
Use of estimates
We use estimates and assumptions to prepare ourthe Consolidated Financial Statements in conformity with GAAP. SomeOur long-term contracts, warranty obligations, valuation of our more significant estimates include our estimate of costs to complete long-term construction contracts, estimates associated with assessing whether goodwill, intangible assets, and other long-lived assets, are impaired, estimates of costs to be incurred to satisfy contractual warranty requirements, estimates of the value of acquired intangible and tangible assets, estimates associated with the realizability of deferredbusiness combinations, tax assets, and estimates we make in selecting assumptions related to the valuations of our pension and postretirement plans, includingcontingencies and litigation require the selectionuse of our discount rates, mortalityvarious management estimates and expected rates of return on our pension plan assets.assumptions. These estimates and assumptions affect the amounts we report in ourthe Consolidated Financial Statements and accompanying notes. Our actual results could differ from these estimates. Variances could resultManagement reviews our estimates on an on-going basis. Changes in a material effect on our financial conditionfacts and circumstances may alter such estimates and affect results of operations and financial position in future periods.
Earnings per share
Cash and cash equivalents and restricted cash
Cash equivalents are highly liquid investments, with maturities of three months or less at the time of purchase. We have computed earnings per common share on the basis of the weighted average number of common shares,record cash and where dilutive, common sharecash equivalents outstanding during the indicated periods. The weighted average shares usedas current or long-term restricted when we are unable to calculate basicfreely use such cash and diluted earnings per share reflect the bonus elementcash equivalents for the 2019 Rights Offering on July 23, 2019 and the one-for-10 reverse stock split on July 24, 2019. We have a number of forms of stock-based compensation, including incentive and non-qualified stock options, restricted stock, restricted stock units, performance shares, and performance units, subject to satisfaction of specific performance goals. We include the shares applicable to these plans in dilutive earnings per share when related performance criteria have been met. The computation of basic and diluted earnings per share is included in Note 3.general operating purposes.
Investments
Trade accounts receivable and allowance for credit loss
Our investments primarily relateTrade accounts receivable are recorded at the point control transfers to customers and represent the amount of consideration we expect to receive in exchange for goods and services transferred and do not bear interest. We establish provisions for expected lifetime losses on accounts receivable at the time the receivable is recorded based on historical experience, customer credit quality and forecasted economic conditions. We regularly review our wholly owned insurance subsidiary. We classify investments availableaccounts receivable balances and the allowance for current operations in the Consolidated Balance Sheets as current assets, while we classify investments held for long-term purposes as non-current assets. Wecredit loss and establish or adjust the amortized cost of debt securities for amortization of premiums and accretion of discounts to maturity. That amortization is included in interest income. We include realized gains and losses on our investments in other - net in our Consolidated Statements of Operations. The cost of securities sold is based onallowance as necessary using the specific identification method. We include interest on securities in interest income.
Foreign currency translation
We translate assets and liabilities of our foreign operations into U.S. dollars at current exchange rates, and we translate items in our statement of operations at average exchange ratesAllowance for the periods presented. We record adjustments resulting from the translation of foreign currency financial statements as a component of accumulated other comprehensive income (loss). We report foreign currency transaction gains and losses in income. We have included a transaction (loss) gain of $(4.3) million, $58.8credit loss was $11.0 million and $(16.6)$12.7 million in the years endedat December 31, 2021, 2020,2023 and 2019, respectively, in foreign exchange in our Consolidated Statements of Operations. These foreign exchange net gains2022, respectively. Bad debt amounts charged to selling, general and losses are primarily related to transaction gains or losses from unhedged intercompany loans when the loan is denominated in a currency different than the participating entity's functional currency.
Revenue recognition
A performance obligation is a contractual promise to transfer a distinct good or service to the customer. A contract's transaction price is allocated to each distinct performance obligationadministrative expenses were $2.0 million, $0.2 million and is recognized as revenue when (point in time) or as (over time) the performance obligation is satisfied.
Revenue from goods and services transferred to customers at a point in time, which includes certain aftermarket parts and services, accounted for 19%, 29% and 21% of our revenue$0.3 million for the years ended December 31, 2023, 2022, and 2021, 2020, and 2019, respectively. Revenue on these contracts is recognized when the customer obtains control of the asset, which is generally upon shipment or delivery and acceptance by the customer. Standard commercial payment terms generally apply to these sales.
Revenue from products and services transferred to customers over time accounted for 81%, 71% and 79% of our revenue for the years ended years ended December 31, 2021, 2020, and 2019, respectively. Revenue recognized over time primarily relates to customized, engineered solutions and construction services. Typically, revenue is recognized over time using the cost-to-cost input method that uses costs incurred to date relative to total estimated costs at completion to measure progress toward satisfying our performance obligations. Incurred cost represents work performed, which corresponds with, and thereby best depicts, the transfer of control to the customer. Contract costs include labor, material, overhead and, when appropriate, SG&A expenses. Variable consideration in these contracts includes estimates of liquidated damages, contractual bonuses and penalties, and contract modifications. Substantially all of our revenue recognized over time under the cost-to-cost input method contains a single performance obligation as the interdependent nature of the goods and services provided prevents them from being separately identifiable within the contract. Generally, we try to structure contract milestones to mirror our expected cash outflows over the course of the contract; however, the timing of milestone receipts can greatly affect our overall cash position. Refer to Note 4 for our disaggregation of revenue by product line.
As of December 31, 2021, we have estimated the costs to complete of all our in-process contracts in order to estimate revenues using a cost-to-cost input method. However, it is possible that current estimates could change due to unforeseen events, which could result in adjustments to overall contract costs. The risk on fixed-priced contracts is that revenue from the customer does not cover increases in our costs. It is possible that current estimates could materially change for various reasons, including, but not limited to, fluctuations in forecasted labor productivity, transportation, fluctuations in foreign exchange rates or steel and other raw material prices. Increases in costs on our fixed-price contracts could have a material adverse impact on our consolidated financial condition, results of operations and cash flows. Alternatively, reductions in overall contract costs at completion could materially improve our consolidated financial condition, results of operations and cash flows. Variations from estimated contract performance could result in material adjustments to operating results for any fiscal quarter or year.
Contract modifications are routine in the performance of our contracts. Contracts are often modified to account for changes in the contract specifications or requirements. In most instances, contract modifications are for goods or services that are not distinct and, therefore, are accounted for as part of the existing contract, with cumulative adjustment to revenue.
We recognize accrued claims in contract revenues for extra work or changes in scope of work to the extent of costs incurred when we believe we have an enforceable right to the modification or claim and the amount can be estimated reliably, and its realization is probable. In evaluating these criteria, we consider the contractual/legal basis for enforcing the claim, the cause of any additional costs incurred and whether those costs are identifiable or otherwise determinable, the nature and reasonableness of those costs, the objective evidence available to support the amount of the claim, and our relevant history
with the counter-party that supports our expectations about their willingness and ability to pay for the additional cost along with a reasonable margin.
We generally recognize sales commissions in equal proportion as revenue is recognized. Our sales agreements are structured such that commissions are only payable upon receipt of payment, thus a capitalized asset at contract inception has not been recorded for sales commission as a liability has not been incurred at that point.
Contract balances
Contracts in progress, a current asset in ourthe Consolidated Balance Sheets, includes revenues and related costs, so recorded, plus accumulated contract costs that exceed amounts invoiced to customers under the terms of the contracts. Advance billings, a current liability in ourthe Consolidated Balance Sheets, includes advance billingsamounts on contracts invoices that exceed accumulated contract costs and revenues and costs recognized under the cost-to-cost input method. Those balances are classified as current based on the life cycle of the associated contracts. Most long-term contracts contain provisions for progress payments. Our unbilled receivablesUnbilled revenues do not contain an allowance for credit losses as we expectthe expectation to invoice customers and the collection ofcollect all amounts for unbilled revenuesdue is deemed probable. We review contract price and cost estimates each reporting period as the work progresses and reflect adjustments proportionate to the costs incurred to date relative to total estimated costs at completion in income in the period when those estimates are revised. For all contracts, if a current estimate of total contract cost indicates a loss on a contract, the projected contract loss is recognized in full through the statementConsolidated Statements of operationsOperations and an accrual for the estimated loss on the uncompleted contract is includedrecorded in otherOther accrued liabilities in the Consolidated Balance Sheets. In addition, when we determine that an uncompleted contract will not be completed on-timeon time and the contract has liquidated damages provisions, we recognize the estimated liquidated damages at the most likely amount we will incur and record them as a reduction of the estimated selling price in the period the change in estimate occurs. Losses accrued in advance of the completion of a contractThese amounts are included in otherOther accrued liabilities in ourthe Consolidated Balance Sheets.
Warranty expense
Inventories
Inventories are carried at the lower of cost or net realizable value on the first-in, first-out basis ("FIFO") or weighted-average cost basis. The FIFO basis at December 31, 2023 applied to approximately 54% of inventory and is used across all segments. The weighted-average cost basis at December 31, 2023 applied to approximately 46% of inventory and is used in the B&W Thermal Segment. The obsolete inventory reserve was $8.5 million and $7.2 million as of December 31, 2023 and 2022, respectively. The components of inventories can be found in Note 7 to the Consolidated Financial Statements.
Property, plant and equipment
We accrueProperty, plant and equipment are recorded at depreciated cost, less any impairment provisions. Property, plant and equipment are depreciated using the straight-line method over estimated economic useful lives of eight to 33 years for buildings and three to 28 years for machinery and equipment. Depreciation expense included in cost of operations on our Consolidated Statements of Operations to satisfy contractual warranty requirements when we recognize the associated revenues on the related contracts, or in the case of a loss contract, the full amount of the estimated warranty costs is accrued when the contract becomes a loss contract. In addition, we record specific provisions or reductions where we expect the actual warranty costs to significantly differ from the accrued estimates. Such changes could have a material effect on our consolidated financial condition, results of operations and cash flows.
Research and development
Our research and development activities are related to improving our products through innovations to reduce the cost of our products to make them more competitive and through innovations to reduce performance risk of our products to better meet our and our customers' expectations.Research and development activities totaled $1.6was $10.3 million, $4.4$10.5 million and $2.9$9.6 million infor the years ended December 31, 2023, 2022 and 2021, 2020,respectively. The costs of maintenance, repairs and 2019, respectively.renewals that do not materially prolong the useful life of an asset are expensed as incurred.
Advertising expenseProperty, plant and equipment are reviewed for impairment whenever events or changes in circumstances indicate that the carrying amount may not be recoverable. An impairment loss is recognized when the carrying amount of an asset exceeds the estimated undiscounted future cash flows expected to result from the use of the asset and its eventual disposition. The amount of the impairment loss recorded is calculated by the excess of the asset carrying amount over its fair value. Fair value is generally determined using a discounted cash flow analysis. Our estimates of cash flow may differ from actual cash flow due to, among other things, technological changes, economic conditions or changes in operating performance. Any changes in such factors may result in future asset impairments and negatively affect our financial position and results of operations.
Goodwill
Advertising
Goodwill is generally recorded as a result of a business combination and represents the excess of purchase price over the fair value of the tangible and identifiable net assets acquired. We perform impairment testing of goodwill annually on October 1 or if we determine that impairment indicators are present. In assessing goodwill for impairment, we follow ASC 350, Intangibles – Goodwill and Other, which permits a qualitative assessment of whether it is more likely than not that the fair value of the reporting unit is less than its carrying amount, including goodwill. If the qualitative assessment determines that it is not more likely than not that the fair value of a reporting unit is less than its carrying amount, including goodwill, then no impairment is determined to exist for the reporting unit. However, if the qualitative assessment determines that it is more likely than not that the fair value of the reporting unit is less than its carrying amount, including goodwill, or we choose not to perform the qualitative assessment, then we compare the fair value of that reporting unit with its carrying amount, including goodwill, in a quantitative assessment. If the carrying amount of a reporting unit exceeds its fair value, goodwill is considered impaired with the impairment loss measured as the excess of the reporting unit’s carrying amount, including goodwill, over its fair value. The estimated fair value of the reporting unit is derived based on valuation techniques we believe market participants would use for each of the reporting units.
Intangible assets
Intangible assets are recognized at fair value when acquired, generally as a result of a business combination. Intangible assets with definite lives are amortized to operating expense using the straight-line method over their estimated useful lives and tested for impairment when events or changes in circumstances indicate that their carrying amounts may not be recoverable. Intangible assets with indefinite lives are not amortized and are subject to impairment testing at least annually or in interim periods when impairment indicators are present. We may elect to perform a qualitative assessment when testing indefinite lived intangible assets for impairment to determine whether events or circumstances affecting significant inputs related to the most recent quantitative evaluation have occurred, indicating that it is more likely than not that the indefinite lived intangible asset is impaired. Otherwise, we test indefinite-lived intangible assets for impairment by determining the fair value of the indefinite-lived intangible asset and comparing the fair value to its carrying amount. If the carrying amount of the intangible asset exceeds its fair value, an impairment is recognized for the amount of the difference.
Leases
We determine if an arrangement is a lease at inception. Operating leases are included in Right-of-use (“ROU”) assets, Operating lease liabilities and Non-current operating lease liabilities in the Consolidated Balance Sheets. Finance leases are included in Net property, plant and equipment and finance leases, Other accrued liabilities and Other non-current finance liabilities in the Consolidated Balance Sheets. Lease liabilities are recognized based on the present value of the future minimum lease payments over the lease term at commencement date. Since substantially all of our leases do not provide an implicit rate, the incremental borrowing rate based on the information available at lease commencement date is used to determine the present value of future payments. Our incremental borrowing rate is estimated to approximate the interest rate on a collateralized basis with similar terms and payments, and in economic environments where the leased asset is located. The ROU assets also include any prepaid lease payments made and initial direct costs incurred and exclude lease incentives. Our lease terms may include options to extend or terminate the lease, which are recognized when it is reasonably certain that
the option will be exercised. Lease expense for minimum lease payments is recognized on a straight-line basis over the lease term. Leases with an initial term of 12 months or less are not recorded in the Consolidated Balance Sheets.
For leases beginning in 2019 and later, we account for lease components (e.g., fixed payments including rent) together with the non-lease components (e.g., common-area maintenance costs) as a single lease component for all classes of underlying assets.
Income taxes
Income tax expense for federal, foreign, state and local income taxes are calculated on taxable income based on the income tax law in effect at the latest balance sheet date and includes the cumulative effect of any changes in tax rates from those used previously in determining deferred tax assets and liabilities. We record a valuation allowance to reduce deferred tax assets to the amount that is more likely than not to be realized. For those tax positions where it is more likely than not that a tax benefit will be sustained, we have recorded the amount of tax benefit with a greater than 50% likelihood of being realized upon ultimate settlement with a taxing authority that has full knowledge of all relevant information. For those income tax positions where it is not more likely than not that a tax benefit will be sustained, no tax benefit has been recognized in the Consolidated Financial Statements. We record interest and penalties (net of any applicable tax benefit) related to income taxes as a component of Income tax expense in the Consolidated Statements of Operations.
Assets and liabilities held for sale and discontinued operations
We classify assets and liabilities as held for sale ("disposal group") when Management, with approval from the Board of Directors, commits to a plan to sell the disposal group, the sale is probable within one year, and the disposal group is available for immediate sale in its present condition. We also consider whether an active program to locate a buyer has been initiated, whether the disposal group is marketed actively for sale at a price that is reasonable in relation to its current fair value, and whether actions required to complete the plan indicate that it is unlikely that significant changes to the plan will be made or that the plan will be withdrawn. We test for impairment when we classify a disposal group as held for sale in the following order. First, we evaluate for impairment all assets other than goodwill. Next, we evaluate goodwill, and finally the disposal group in its entirety. An impairment charge is recognized when incurredthe carrying value of the disposal group exceeds the estimated fair value, less costs to sell. We also cease depreciation and is included in selling, generalamortization for assets classified as held for sale. When a decision to sell represents a strategic shift impacting our operations and administrative expenses on ourfinancial results, the disposal group and related operations are reported as discontinued operations. For further discussion see Note 4 to the Consolidated Statements of Operations. Advertising expenses in the years ended December 31, 2021, 2020, and 2019 were not significant.Financial Statements.
Pension plans and postretirement benefits
We sponsor various defined benefit pension and postretirement plans covering certain employees of our U.S., Canadian and U.K. subsidiaries. Wesubsidiaries and use actuarial valuations to calculate the cost and benefit obligations of our pension and postretirement benefits. The actuarial valuations use significant assumptions in the determination of our benefit cost and obligations, including assumptions regarding discount rates, expected returns on plan assets, mortality and health care cost trends.
We determine ourthe discount rate based on a review of published financial data and discussions with our actuary regarding rates of return on high-quality, fixed-income investments currently available and expected to be available during the period to maturity of our pension and postretirement plan obligations. We use an alternative spot rate method for discounting the benefit obligation rather than a single equivalent discount rate because it more accurately applies each year's spot rates to the projected cash flows.
The components of benefit cost related to service cost, interest cost, expected return on plan assets and prior service cost amortization are recorded on a quarterly basis based on actuarial assumptions. In the fourth quarter of each year, or as interim remeasurements are required, we recognize net actuarial gains andor losses into earnings as a component of net periodic benefit cost (mark to market (“MTM”)(MTM pension adjustment). Recognized net actuarial gains and losses consist primarily of our reported actuarial gains and losses and the difference between the actual return on plan assets and the expected return on plan assets.
We recognize the funded status of each plan as either an asset or a liability in the Consolidated Balance Sheets. The funded status is the difference between the fair value of plan assets and the present value of itsthe benefit obligation, determined on a plan-by-plan basis. See Note 1314 to the Consolidated Financial Statements for a detailed description of our plan assets.pension plans and postretirement benefits.
Income taxes
Earnings per share
Income tax expense for federal, foreign, state and local income taxes are calculated on taxable income basedWe have computed earnings per common share on the income tax lawbasis of the weighted average number of common shares, and, where dilutive, common share equivalents, outstanding during the indicated periods. We have a number of forms of stock-based compensation, including incentive and non-qualified stock options, restricted stock, restricted stock units, performance shares and performance units, subject to satisfaction of specific performance goals. We include the shares applicable to these plans in effect at the latest balance sheet datedilutive earnings per share when related performance criteria have been met. The computation of basic and includes the cumulative effect of any changesdiluted earnings per share is included in tax rates from those used previously in determining deferred tax assets and liabilities. We record a valuation allowance to reduce our deferred tax assetsNote 3 to the amount that is more likely than not to be realized. For those tax positions where it is more likely than not that a tax benefit will be sustained, we have recorded the largest amount of tax benefit with a greater than 50% likelihood of being realized upon ultimate settlement with a taxing authority that has full knowledge of all relevant information. For those income tax positions where it is not more likely than not that a tax benefit will be sustained, no tax benefit has been recognized in our Consolidated Financial Statements. We record interest and penalties (net of any applicable tax benefit) related to income taxes as a component of income tax expense on our Consolidated Statements of Operations.
Cash and cash equivalents and restricted cash
Revenue recognition
Our cash equivalents are highly liquid investments, with maturities of three monthsA performance obligation is a contractual promise to transfer a distinct good or lessservice to the customer. A contract's transaction price is allocated to each distinct performance obligation and is recognized as revenue when we purchase them. We record cash and cash equivalents(point in time) or as restricted when we are unable to freely use such cash and cash equivalents for our general operating purposes.(over time) the performance obligation is satisfied.
Trade accounts receivableRevenue from goods and allowanceservices transferred to customers at a point in time, which includes certain aftermarket parts and services, accounted for doubtful accounts
Our trade accounts receivable balance is stated at the amount owed by our customers, net of allowances for estimated uncollectible balances. We maintain allowances for doubtful accounts for estimated losses expected to result from the inability23%, 21% and 20% of our customers to make required payments. These estimates are based on management's evaluation of the ability of customers to make payments, with emphasis on historical remittance experience, known customer financial difficulties, the age of receivable balances and any other known factors specific to a receivable. Accounts receivable are charged to the allowance when it is determined they are no longer collectible. Our allowance for doubtful accounts was $11.9 million and $17.2 million at December 31, 2021 and 2020, respectively. Amounts charged to selling, general and administrative expenses were $(0.1) million, $(0.2) million and $0.2 millionrevenue for the years ended December 31, 2023, 2022, and 2021, 2020,respectively. Revenue on these contracts is recognized when the customer obtains control of the asset, which is generally upon shipment or delivery and 2019, respectively.acceptance by the customer. Standard commercial payment terms generally apply to these sales.
Inventories
We carryRevenue from products and services transferred to customers over time accounted for 77%, 79% and 80% of our inventories at the lower of cost or net realizable value. We determine cost on the first-in, first-out basis. During the fourth quarter of 2021, the Company voluntarily changed its method of accounting for certain domestic inventory previously valued by the LIFO method to the FIFO method. The cumulative effect of this change on periods presented prior to 2019 resulted in an increase in retained earnings of $7.3 million at December 31, 2018. The impact on earnings was a decrease of $0.1 million and an increase of $0.4 million for the years ending December 31, 2020 and 2019, respectively. The FIFO method of accounting for inventory is preferable because it more closely matches the physical inventory flow, better reflects the current value of inventories on our Consolidated Balance Sheets, improves our financial reporting by having a consistent method across the organization, and increases comparability with certain peers of the Company. Our obsolete
inventory reserve was $6.5 million and $7.1 million at December 31, 2021 and 2020, respectively. The components of inventories can be found in Note 6.
Property, plant and equipment
We carry our property, plant and equipment at depreciated cost, less any impairment provisions. We depreciate our property, plant and equipment using the straight-line method over estimated economic useful lives of eight to 33 years for buildings and three to 28 years for machinery and equipment. Our depreciation expense was $9.7 million, $11.3 million and $19.3 millionrevenue for the years ended December 31, 2023, 2022, and 2021, 2020,respectively. Revenue recognized over time primarily relates to customized, engineered solutions and 2019, respectively. We expenseconstruction services. Typically, revenue is recognized over time using the cost-to-cost input method that uses costs incurred to date relative to total estimated costs at completion to measure progress toward satisfying our performance obligations. Incurred cost represents work performed, which corresponds with, and thereby best depicts, the transfer of maintenance, repairscontrol to the customer. Contract costs include labor, material, overhead and, renewals that do not materially prolongwhen appropriate, SG&A expenses. Variable consideration in these contracts includes estimates of contractual bonuses and penalties, contract modifications and liquidated damages. Substantially all of our revenue recognized over time under the useful lifecost-to-cost input method contains a single performance obligation as the interdependent nature of an asset asthe goods and services provided prevents them from being separately identifiable within the contract. Generally, we incur them.try to structure contract milestones to mirror its expected cash outflows over the course of the contract; however, the timing of milestone receipts can greatly affect the overall cash position. Refer to Note 5 to the Consolidated Financial Statements for details of disaggregation of revenue by segment.
Property, plantAs of December 31, 2023, we have estimated the costs to complete of all in-process contracts in order to estimate revenues using a cost-to-cost input method. However, it is possible that current estimates could change in the future due to unforeseen events, which could result in adjustments to overall contract costs. The risk on fixed-priced contracts is that revenue from the customer does not cover unplanned cost increases. It is possible that current estimates could materially change for various reasons, including, but not limited to, fluctuations in forecasted labor productivity, transportation, foreign exchange rates or steel and equipment amountsother raw material prices. Increases in costs on our fixed-price contracts could have a material adverse impact on our consolidated financial position, results of operations and cash flows. Alternatively, reductions in overall contract costs at completion could materially improve our consolidated financial position, results of operations and cash flows. Variations from estimated contract performance could result in material adjustments to operating results for any fiscal period.
Contract modifications are reviewedroutine in the performance of our contracts. Contracts are often modified to account for impairment whenever eventschanges in the contract specifications or requirements. In most instances, contract modifications are for goods or services that are not distinct and, therefore, are accounted for as part of the existing contract, with cumulative adjustment to revenue.
We recognize accrued claims in contract revenues for additional work or changes in circumstances indicate that the carrying amountscope of an asset, or asset group, may not be recoverable. An impairment loss would be recognized whenwork to the carrying amountextent of an asset exceeds the estimated undiscounted future cash flows expected to result from the use of the asset and its eventual disposition. The amount of the impairment loss to be recorded is calculated by the excess of the asset carrying value over its fair value. Fair value is generally determined using a discounted cash flow analysis. Our estimates of cash flow may differ from actual cash flow due to, among other things, technological changes, economic conditions or changes in operating performance. Any changes in such factors may negatively affect our business and result in future asset impairments.
Investments in consolidated entities
SPIG maintains a 60% ownership interest in a joint venture entity, which is consolidated into the B&W Environmental segment results.
On September 30, 2021, we acquired a 60% controlling ownership interest in Illinois-based solar energy contractor Fosler Construction Company Inc. (“Fosler Construction”). See Note 26 for further information on this acquisition.
Goodwill
Goodwill represents the excess of the cost of our acquired businesses over the fair value of the net assets acquired. We perform testing of goodwill for impairment annually on October 1st or when impairment indicators are present. We may elect to perform a qualitative testcosts incurred when we believe that there is substantially in excess fair value over carrying value based on our most recent quantitative assessment, adjusted for relevant events and circumstances that could affect fair value duringwe have an enforceable right to the current year. If we conclude based on this assessment that it is more likely than not that the reporting unit is not impaired, we do not perform a quantitative impairment test. In all other circumstances, we perform a quantitative impairment test to identify potential goodwill impairment and measuremodification or claim, the amount can be reasonably estimated and its realization is probable. In evaluating these criteria, we consider the contractual/legal basis for enforcing the claim, the cause of any goodwill impairment. Goodwill impairment tests recognize impairment foradditional costs incurred and whether those costs are identifiable or otherwise determinable, the amount thatnature and reasonableness of those costs, the carrying value of a reporting unit exceeds its fair value upobjective evidence available to the remaining amount of goodwill.
Intangible assets
Intangible assets are recognized at fair value when acquired. Intangible assets with definite lives are amortized to operating expense using the straight-line method over their estimated useful lives and tested for impairment when events or changes in circumstances indicate that their carrying amounts may not be recoverable. Intangible assets with indefinite lives are not amortized and are subject to impairment testing at least annually or in interim periods when impairment indicators are present. We may elect to perform a qualitative assessment when testing indefinite lived intangible assets for impairment to determine whether events or circumstances affecting significant inputs related to the most recent quantitative evaluation have occurred, indicating that it is more likely than not that the indefinite lived intangible asset is impaired. Otherwise, we test indefinite lived intangible assets for impairment by determining the fair value of the indefinite lived intangible asset and comparing the fair value of the intangible asset to its carrying amount. If the carrying amount of the intangible asset exceeds its fair value, we recognize impairment forsupport the amount of the difference.
Accountingclaim, and the relevant history with the counterparty that supports expectations about their willingness and ability to pay for Leases
We determine if an arrangement isthe additional cost along with a lease at inception. Operating leases are included in right-of-use (“ROU”) assets, operatinglease liabilities and non-current operating lease liabilities in the Consolidated Balance Sheets. Finance leases are included in net property, plant and equipment, and finance lease, otheraccrued liabilities and other non-current financereasonable margin.
liabilities
We generally recognize sales commissions in equal proportion as revenue is recognized. Our sales agreements are structured such that commissions are only payable upon receipt of payment, thus no amount is recorded at contract inception as a liability has not been incurred at that point.
Warranty expense
We record an estimated expense in Cost of operations in the Consolidated Balance Sheets. Lease liabilities are recognized basedStatements of Operations to satisfy contractual warranty requirements when we recognize the associated revenues on the present valuerelated contracts, or in the case of a loss contract, the full amount of the future minimum lease payments over the lease term at commencement date. As substantially all of our leases do not provide an implicit rate, we use our incremental borrowing rate based on the information available at lease commencement date in determining the present value of future payments. Our incremental borrowing rate is estimated to approximate the interest rate on a collateralized basis with similar terms and payments, and in economic environments where the leased asset is located. The ROU assets also include any prepaid lease payments made and initial directwarranty costs incurred and excludes lease incentives. Our lease terms may include options to extend or terminate the lease, which we recognize when it is reasonably certain that we will exercise that option. Lease expense for minimum lease payments is recognized when the contract becomes a loss contract. In addition, we record specific adjustments when we expect the actual warranty costs to significantly differ from the initial estimates. Such changes could have a material effect on a straight-line basis over the lease term. Leases with an initial termour consolidated financial position, results of 12 months or less are not recorded on the balance sheet.operations and cash flows.
For leases beginning in 2019 and later, we account for lease components (e.g., fixed payments including rent) together with the non-lease components (e.g., common-area maintenance costs) as a single lease component for all classes of underlying assets.
Derivative financial instruments
Derivative assets and liabilities usually consist of FX forward contracts. Where applicable, the value of these derivative assets and liabilities is computed by discounting the projected future cash flow amounts to present value using market-based observable inputs, including FX forward and spot rates, interest rates and counterparty performance risk adjustments. As of December 31, 2021, we do not hold any derivative assets or liabilities.
Self-insurance
We have a wholly owned insurance subsidiary that provides employer's liability, general and automotive liability and workers' compensation insurance and, from time to time, builder's risk insurance (within certain limits) to our companies. We may also, in the future, have this insurance subsidiary accept other risks that we cannot or do not wish to transfer to outside insurance companies. Included in other non-current liabilities on our Consolidated Balance Sheets are reserves for self-insurance totaling $9.3 million and $11.6 million as of December 31, 2021 and 2020, respectively.
Loss contingencies
We estimate liabilities for loss contingencies when it is probable that a liability has been incurred and the amount of loss is reasonably estimable. We provide disclosureDisclosures are provided when there is a reasonable possibility that the ultimate loss will exceed the recorded provision or if such probable loss is not reasonably estimable. We currently are currently involved in some significant litigation, as discussed in Note 22. Our losses21 to the Consolidated Financial Statements. These matters are typically resolved over long periods of time and are often difficult to assess and estimate due to, among other reasons, the possibility of multiple actions by third parties; the attribution of damages, if any, among multiple defendants; plaintiffs in most cases involving personal injury claims do not specify the amount of damages claimed; the discovery process may take multiple years to complete; during the litigation process, it is common to have multiple complex unresolved procedural and substantive issues; the potential availability of insurance and indemnity coverages; the wide-ranging outcomes reached in similar cases, including the variety of damages awarded; the likelihood of settlements for de minimis amounts prior to trial; the likelihood of success at trial; and the likelihood of success on appeal.
Consequently, it is possible future earnings could be affected by changes in our assessmentsassessment of the probability that a loss has been incurred in a material pending litigation against us and/or changes in our estimates related to such matters.
Loss recoveries
We recognize lossLoss recoveries are recognized and provide disclosuresdisclosed only when receipt of the recovery is probable and we are able tocan be reasonably estimate the amount of the recovery. Our loss recoveriesestimated. These matters are typically resolved over long periods of time and are often difficult to assess and estimate due to, among other reasons, the possibility of multiple actions by third parties, multiple complex unresolved procedural and substantive issues; the wide-ranging outcomes reached in similar cases, including the variety of losses incurred. Consequently, it is possible future earnings could be affected by changes in our assessmentsassessment of the probability that a loss recovery has been recognized and/or changes in our estimates related to such matters. See Note 5 for discussions regarding the project contract cost recovery recognized in 2021 and the non-recurring loss recovery in 2020.
Research and development
Research and development activities are related to improving our products through innovations to reduce cost and increase competitiveness and/or improve performance to better meet customers' expectations.Research and development expenses totaled $8.4 million, $3.8 million, and $1.6 million in the years ended December 31, 2023, 2022 and 2021, respectively.
Contingent consideration
The fair valuesvalue of earn-out arrangements are included as part of the purchase price of the acquired companies on their respective acquisition dates. For each transaction, we estimate the fair value of contingent earn-out payments as part of the initial purchase price and record the estimated fair value of contingent consideration as a liability in otherOther non-current liabilities on our in the Consolidated Balance Sheets.
We review and re-assessreassess the estimated fair value of contingent consideration on a quarterly basis, and the updated fair value could differ materially from the initial estimates. Changes in the estimated fair value of our contingent earn-out liabilities related to the time component of the present value calculation are reported in interestInterest expense on our in the Consolidated Statements of Operations. Adjustments to the estimated fair value related to changes in all other unobservable inputs are reported in operating income (loss) on ourOther - net in the Consolidated Statements of Operations.
Self-insurance
We have wholly owned insurance subsidiary that provides employer's liability, general and automotive liability and workers' compensation insurance and, from time to time, builder's risk insurance (within certain limits) to our operating companies. We may also, in the future, have this insurance subsidiary accept other risks that we cannot or do not wish to transfer to outside insurance companies. Included in Other non-current liabilities in the Consolidated Balance Sheets are reserves for self-insurance totaling $8.0 million and $8.3 million as of December 31, 2023 and 2022, respectively.
Stock-based compensation
The fair value of equity-classified awards, such as restricted stock, performance shares and stock options, is determined on the date of grant and is not remeasured. The fair value of liability-classified awards, such as cash-settled stock appreciation rights, restricted stock units and performance units, is determined on the date of grant and is remeasured at the end of each reporting period through the date of settlement. Fair values for restricted stock, restricted stock units, performance shares and performance units are determined using the closing price of our common stock on the date of grant. Fair values for stock options are determined using a Black-Scholes option-pricing model (“Black-Scholes”).model. For performance shares or units that contain a Relative Total Shareholder Return vesting criteria and for stock appreciation rights, we utilize a Monte Carlo simulation to determine the fair value, which determines the probability of satisfying the market condition included in the award. The determination of the fair value of a share-based payment award using an option-pricing model or a Monte Carlo simulation requires the input of significant assumptions, such as the expected life of the award and stock price volatility.
We recognize expense for all stock-based awards granted on a straight-line basis over the requisite service periods of the awards, which is generally equivalent to the vesting term. For liability-classified awards, changes in fair value are recognized through cumulative catch-ups each period. Excess tax benefits on stock-based compensation should beare classified along with other income tax cash flows as an operating activity. These excess tax benefits result from tax deductions in excess of the cumulative compensation expense recognized for options exercised and other equity-classified awards. See Note 2019 to the Consolidated Financial Statements for further discussion of stock-based compensation.
Foreign currency translation
We translate assets and liabilities of our foreign operations into U.S. dollars at current exchange rates, and translate items in the Consolidated Statements of Operations at average exchange rates for the periods presented. We record adjustments resulting from the translation of foreign currency amounts as a component of Accumulated Other Comprehensive Loss. We report foreign currency transaction gains (losses) in income. We have included transaction losses of $2.5 million, $0.6 million and $4.3 million in the years ended December 31, 2023, 2022 and 2021, respectively, in Foreign exchange in the Consolidated Statements of Operations. These foreign exchange net gains and losses are primarily related to transaction gains or losses from unhedged intercompany loans when the loan is denominated in a currency different than the participating entity's functional currency.
Recently adopted accounting standards
We adopted the following accounting standardstandards during the year ended December 31, 2021:2023:
Effective January 1,In October 2021, we adoptedthe FASB issued ASU 2019-12,2021-08, Income TaxesBusiness Combinations (Topic 740)805): Simplifying the Accounting for Income Taxes.Contract Assets and Contract Liabilities from Contracts with Customers. The amendmentsamendment in this update simplifyprovides an exception to fair value measurement for contract assets and contract liabilities (i.e., deferred revenue) acquired in a business combination. As a result, contract assets and contract liabilities will be recognized and measured by the accounting for income taxes by removing exceptions related to the incremental approach for intra-period tax allocation, certain deferred tax liabilities, and the general methodology for calculating income taxesacquirer in an interim period.accordance with ASC 606, Revenue from Contracts with Customers. The amendment also provides simplification related to accounting for franchise (or similar) tax, evaluating the tax basis step up of goodwill, allocation of consolidated current and deferred tax expense, reflection of the impact of enacted tax law or rate changesimproves consistency in annual effective tax rate calculationsrevenue recognition in the interimpost-acquisition period that includes enactment date, and other minor codification improvements.for acquired contracts as compared to contracts entered into after the business combination. The impact of adopting this standard on our consolidated financial statementsthe Consolidated Financial Statements was immaterial.
In March 2021,November 2018, the FASB issued ASU 2021-01,2018-19, Reference Rate Reform (Topic 848): Scope. Codification Improvements to Topic 326: Financial Instruments - Credit Losses.The amendments in this update clarify that certain optional expedients and exceptions in Topic 848 for contract modifications and hedge accounting apply to derivatives that are affected by the discounting transition. This update is an amendment to the new credit losses standard, ASU 2020-04,2016-13, Reference Rate ReformFinancial Instruments—Credit Losses (Topic 848)326): FacilitationMeasurement of the Effects of Reference Rate Reform ofCredit Losses on Financial Reporting, Instrumentswhich, that was issued in March 2020June 2016 and provides optional expedients and exceptions for applying generally accepted accounting principles to contracts, hedging relationships, and other transactions affected by reference rate reform if certain criteriaclarifies that operating lease receivables are met.not within the scope of Topic 326. The amendments in the updates apply only to contracts, hedging relationships, and other transactions that reference LIBOR or another reference rate expected to be discontinued because of reference rate reform. The expedients and exceptions provided by the updates do not apply to contract modifications made and hedging relationships entered into or evaluated after December 31, 2022, except for hedging relationships existing as of December 31, 2022, that an entity has elected certain optional expedients for and that are retained through the end of the hedging relationship. As of December 31, 2021, we have not yet elected any optional expedients provided in the standard. We will applynew credit losses standard changes the accounting relieffor credit losses for certain instruments. The new measurement approach is based on expected losses, commonly referred to as relevant contractthe current expected credit loss ("CECL") model, and hedge accounting relationship modifications are made during the reference rate reform transition period. The impact of this standard on our consolidatedapplies to financial statements was immaterial.assets measured at amortized cost, including loans,
held-to-maturity debt securities, net investment in leases, and reinsurance and trade receivables, as well as certain off-balance sheet credit exposures, such as loan commitments. The standard also changes the impairment model for available-for-sale debt securities. The provisions of this standard will primarily impact the allowance for credit loss on our trade receivables and contracts in progress. The impact of adopting this standard on the Consolidated Financial Statements was immaterial.
New accounting standards to be adopted
We consider the applicability and impact of all issued ASUs. Recently issued ASUs that are not considered were assessed and determined to be not applicable in the current reporting period. New accounting standards not yet adopted that could affect the Consolidated Financial Statements in the future are summarized as follows:
In May 2021,October 2023, the FASB issued ASU 2021-04,2023-06, Earnings Per Share (Topic 260), Debt-Modifications and Extinguishments (Subtopic 470-50), Compensation-Stock Compensation (Topic 718), and Derivatives and Hedging-ContractsDisclosure Improvements: Codification Amendments in Equity's Own Equity (Subtopic 815-40): Issuer's Accounting for Certain Modifications or Exchanges of Freestanding Equity-Classified Written Call Options (a consensus of the FASB Emerging Issues Task Force). The amendments in this update affect all entities that issue freestanding written call options that are classified in equity. Specifically, the amendments affect those entities when a freestanding equity-classified written call option is modified or exchanged and remains equity classified after the modification or exchange. The amendments that relateResponse to the recognitionSEC's Disclosure Update and measurement of EPS for certain modifications or exchanges of freestanding equity-classified written call options affect entities that present EPS in accordance with the guidance in Earnings Per Share (Topic 260)Simplification Initiative. The amendments in this update do not applynew guidance is intended to modifications or exchangesalign U.S. GAAP and SEC requirements while facilitating the application of financial instruments that are within the scopeU.S. GAAP for all entities. The effective date of another Topic. ThatASU 2023-06 depends on (1) whether an entity is accounting for those instruments continues to bealready subject to the SEC's current disclosure requirements in other Topics. Theand (2) whether and, if so, when the SEC removed related requirements from its regulations. For entities that are already subject to the SEC's current disclosure requirements, the effective date for each amendment will be the date on which the SEC's removal of that related disclosure requirement from Regulation S-X or Regulation S-K becomes effective, with early adoption prohibited. If the SEC has not removed the related requirements from its regulations by June 30, 2027, the amendments in this update domade by ASU 2023-06 will be removed from the Codification and will not affect a holder’s accountingbecome effective for freestanding call options. The update is applicable to B&W as we have previously issued freestanding written call options. As of December 31, 2021, these options remain unexercised and we will applyany entity. We are currently evaluating the accounting standard as freestanding written call options are modified or exchanged. The impact of this standard on our consolidated financial statements was immaterial.the Consolidated Financial Statements.
In November 2023, the FASB issued ASU 2023-07, Segment Reporting (Topic 280): Improvements to Reportable Segment Disclosures, which requires a public entity to disclose significant segment expenses and other segment items in interim and annual periods and expands the ASC 280 disclosure requirements for interim periods. The ASU also explicitly requires public entities with a single reportable segment to provide all segment disclosures under ASC 280, including the new disclosures under the ASU. ASU 2023-07 is effective for fiscal years beginning after December 15, 2023 and interim periods within fiscal years beginning after December 15, 2024. Early adoption is permitted. We are currently evaluating the impact of this standard on the Consolidated Financial Statements.
In December 2023, the FASB issued ASU 2023-09, Income Taxes (Topic 740): Improvements to Income Tax Disclosures, which requires disclosure of specific categories in the effective tax rate reconciliation and additional information for reconciling items that meet a quantitative threshold. The standard is intended to benefit investors by providing more detailed income tax disclosures to assess how an entity's operations and related tax risks and tax planning and operational opportunities affect its tax rate and prospects for future cash flows. ASU 2023-09 is effective for annual periods beginning after December 15, 2024. Early adoption is permitted. Adoption of the standard will only impact the income tax disclosures and is not expected to be material to the Consolidated Financial Statements.
NOTE 3 –3– EARNINGS PER SHARE
The following table sets forth the computation of basic and diluted (loss) earnings (loss) per share of our common stock, net of non-controlling interest and dividends on preferred stock:
| | | | | | | | | | | | | | | | | | | | | |
| | | Year ended December 31, |
| (in thousands, except per share amounts) | | | | | 2021 | | 2020 | | 2019 |
| Income (loss) from continuing operations attributable to stockholders of common stock | | | | | $ | 21,767 | | | $ | (12,118) | | | $ | (122,668) | |
| Income from discontinued operations attributable to stockholders of common stock, net of tax | | | | | — | | | 1,800 | | | 694 | |
| Net income (loss) attributable to stockholders of common stock | | | | | $ | 21,767 | | | $ | (10,318) | | | $ | (121,974) | |
| | | | | | | | | |
| Weighted average shares used to calculate basic income (loss) per share | | | | | 82,391 | | | 48,710 | | | 31,514 | |
| Dilutive effect of stock options, restricted stock and performance units | | | | | 1,189 | | | — | | | — | |
| Weighted average shares used to calculate diluted income (loss) per share | | | | | 83,580 | | | 48,710 | | | 31,514 | |
| | | | | | | | | |
| Basic income (loss) per share | | | | | | | | | |
| Continuing operations | | | | | $ | 0.26 | | | $ | (0.25) | | | $ | (3.89) | |
| Discontinued operations | | | | | — | | | 0.04 | | | 0.02 | |
| Basic income (loss) per share | | | | | $ | 0.26 | | | $ | (0.21) | | | $ | (3.87) | |
| | | | | | | | | |
| Diluted income (loss) per share | | | | | | | | | |
| Continuing operations | | | | | $ | 0.26 | | | $ | (0.25) | | | $ | (3.89) | |
| Discontinued operations | | | | | — | | | 0.04 | | | 0.02 | |
| Diluted income (loss) per share | | | | | $ | 0.26 | | | $ | (0.21) | | | $ | (3.87) | |
| | | | | | | | | | | | | | | | | | | | | |
| | | Year ended December 31, |
| (in thousands, except per share amounts) | | | | | 2023 | | 2022 | | 2021 |
| (Loss) income from continuing operations | | | | | $ | (78,633) | | | $ | (19,988) | | | $ | 29,313 | |
| Net (income) loss attributable to non-controlling interest | | | | | (237) | | | 3,723 | | | (644) | |
| Less: Dividend on Series A preferred stock | | | | | 14,858 | | | 14,860 | | | 9,127 | |
| (Loss) income from continuing operations attributable to stockholders of common stock | | | | | (93,728) | | | (31,125) | | | 19,542 | |
| (Loss) income from discontinued operations, net of tax | | | | | (118,338) | | | (6,596) | | | 2,225 | |
| Net (loss) income attributable to stockholders of common stock | | | | | (212,066) | | | (37,721) | | | 21,767 | |
| | | | | | | | | |
| Weighted average shares used to calculate basic (loss) income per share | | | | | 89,011 | | | 88,256 | | | 82,391 | |
| Dilutive effect of stock options, restricted stock and performance units | | | | | — | | | — | | | 1,189 | |
| Weighted average shares used to calculate diluted (loss) income per share | | | | | 89,011 | | | 88,256 | | | 83,580 | |
| | | | | | | | | |
| Basic (loss) earnings per share | | | | | | | | | |
| Continuing operations | | | | | $ | (1.05) | | | $ | (0.35) | | | $ | 0.23 | |
| Discontinued operations | | | | | (1.33) | | | (0.08) | | | 0.03 | |
| Basic (loss) earnings per share | | | | | $ | (2.38) | | | $ | (0.43) | | | $ | 0.26 | |
| | | | | | | | | |
| Diluted (loss) earnings per share | | | | | | | | | |
| Continuing operations | | | | | $ | (1.05) | | | $ | (0.35) | | | $ | 0.23 | |
| Discontinued operations | | | | | (1.33) | | | (0.08) | | | 0.03 | |
| Diluted (loss) earnings per share | | | | | $ | (2.38) | | | $ | (0.43) | | | $ | 0.26 | |
Because we incurred a net loss in the years ended December 31, 2020 and 2019 basicBasic and diluted shares are the same.same in the years ended December 31, 2023 and 2022 because we incurred a loss in each of those years.
If we had net income in the years ended December 31, 20202023 and 20192022, diluted shares would include an additional 610.9 thousand0.3 million and 150.0 thousand0.7 million shares, respectively.
We excluded 2.3 million, 2.1 million and 0.3 million, 1.3 million, and 0.3 million shares related to stock options from the diluted share calculation for the years ended December 31, 2021, 2020,2023, 2022 and 20192021 respectively, because their effect would have been anti-dilutive.
NOTE 4 – ASSETS AND LIABILITIES HELD FOR SALE AND DISCONTINUED OPERATIONS
During the third quarter of 2023, we committed to a plan to sell our B&W Solar business resulting in a significant change that would impact our operations. As of September 30, 2023, we met all of the criteria for the assets and liabilities of this business, formerly part of our B&W Renewable segment, to be accounted for as held for sale. In addition, we also determined that the operations of the B&W Solar business qualified as a discontinued operation, primarily based upon its significance to our current and historic operating losses. The decision to sell the B&W Solar business, along with the significant increase in estimated costs to complete the B&W Solar loss contracts, resulted in a triggering event that required us to immediately perform certain valuations. Certain trade accounts receivable and contract assets were determined to be uncollectible, resulting in charges of $17.6 million. For goodwill, we performed a quantitative assessment using the income approach (discounted cash flows). The income approach uses the disposal group's estimated future cash flows, discounted at
the weighted-average cost of capital of a hypothetical third-party buyer to account for uncertainties within the projections. The income approach also uses assumptions based on the disposal group's estimated revenue growth, operating margin, and working capital turnover. As a result of this impairment test, we recognized an impairment of $56.6 million, or the entire balance of goodwill associated with B&W Solar. We then compared the remaining carrying amount of the disposal group with its fair value and determined that the carrying amount approximated the fair value and no further impairment of the disposal group was required. These charges have been included in Loss from discontinued operations, net of tax in the Consolidated Statements of Operations.
The following table summarizes the operating results of the disposal group included in discontinued operations on the Consolidated Statements of Operations:
| | | | | | | | | | | | | | | | | | | | |
| | Year ended December 31, |
| (in thousands) | | 2023 | | 2022 | | 2021 |
| Revenues | | $ | 34,725 | | | $ | 41,897 | | | $ | 12,490 | |
| | | | | | |
| Cost of operations | | 80,794 | | | 43,211 | | | 8,010 | |
Selling general and administrative expenses(1) | | 15,168 | | | (2,029) | | | 3,133 | |
| | | | | | |
| Loss (gain) on asset disposals, net | | 143 | | | (59) | | | (52) | |
| Goodwill impairment | | 56,556 | | | 7,224 | | | — | |
| | | | | | |
| Total costs and expenses | | 152,661 | | | 48,347 | | | 11,091 | |
| Operating (loss) income | | (117,936) | | | (6,450) | | | 1,399 | |
| | | | | | |
| | | | | | |
| | | | | | |
| | | | | | |
| Other (expense) income | | (402) | | | (146) | | | 630 | |
| | | | | | |
| (Loss) income from discontinued operations before tax | | (118,338) | | | (6,596) | | | 2,029 | |
| | | | | | |
| Benefit from income taxes | | — | | | — | | | (196) | |
| (Loss) income from discontinued operations, net of tax | | $ | (118,338) | | | $ | (6,596) | | | $ | 2,225 | |
| | | | | | |
(1) General and administrative expenses in 2022 includes a $9.6 million gain related to the change in fair value of contingent consideration. |
| | |
Results from Discontinued Operations
(Loss) income from discontinued operations, net of tax, totaled $(118.3) million, $(6.6) million and $2.2 million during the years ended December 31, 2023, 2022 and 2021, respectively. The losses in 2023 and 2022 were driven by goodwill impairment of $56.6 million and $7.2 million, respectively. Also included in the losses were $44.1 million and $13.2 million in losses from changes in estimated costs to complete twenty-eight and thirteen loss contracts during the years ended December 31, 2023 and 2022, respectively. There were no contracts in a loss position as of December 31, 2021. As of December 31, 2023 and 2022, other current liabilities included $7.1 million and $2.9 million in accrued contract losses on B&W Solar loss contracts, respectively.
The following table provides the major classes of assets and liabilities of the disposal group included in assets held for sale and liabilities held for sale in the Consolidated Balance Sheets:
| | | | | | | | | | | |
| (in thousands) | December 31, 2023 | | December 31, 2022 |
| Cash | $ | 31 | | | $ | 490 | |
| Contracts in progress | 4,538 | | | 16,759 | |
| | | |
| Accounts receivable - trade | 3,272 | | | 4,111 | |
| | | |
| Other assets, net | 62 | | | 2 | |
| | | |
| | | |
| Total current assets | 7,903 | | | 21,362 | |
| | | |
| Net property, plant and equipment and finance leases | 2,683 | | | 1,476 | |
| Intangible assets, net | 7,833 | | | 8,729 | |
| Goodwill | — | | | 56,556 | |
| | | |
| Right-of-use assets | 76 | | | 1,077 | |
| Other non-current assets, net | — | | | 175 | |
| Total non-current assets | 10,592 | | | 68,013 | |
| Total assets of disposal group | $ | 18,495 | | | $ | 89,375 | |
| | | |
| Loans payable, current | $ | 502 | | | $ | — | |
| Operating lease liabilities, current | 23 | | | 97 | |
| Accounts payable | 26,298 | | | 7,938 | |
| Accrued employee benefits | 231 | | | 24 | |
| Advance billings on contracts | 5,961 | | | 2,484 | |
| Accrued warranty expense | 1,078 | | | — | |
| Other current liabilities | 8,101 | | | 14,208 | |
| Total current liabilities | 42,194 | | | 24,751 | |
| | | |
| Loans payable, net of current portion | 1,308 | | | 464 | |
| Non-current operating lease liabilities | — | | | 995 | |
| Other non-current liabilities | 112 | | | 4,192 | |
| Total non-current liabilities | 1,420 | | | 5,651 | |
| Total liabilities of disposal group | $ | 43,614 | | | $ | 30,402 | |
| | | |
| Reported as: | | | |
| Current assets of discontinued operations | $ | 18,495 | | | $ | 21,362 | |
| Non-current assets of discontinued operations | — | | | 68,013 | |
| Total assets of discontinued operations | $ | 18,495 | | | $ | 89,375 | |
| | | |
| Current liabilities of discontinued operations | $ | 43,614 | | | $ | 24,751 | |
| Non-current liabilities of discontinued operations | — | | | 5,651 | |
| Total liabilities of discontinued operations | $ | 43,614 | | | $ | 30,402 | |
| | | |
| | | |
| | | |
The significant components included in our Consolidated Statements of Cash Flows for the discontinued operations are as follows:
| | | | | | | | | | | | | | | | | |
| Year ended December 31, |
| (in thousands) | 2023 | | 2022 | | 2021 |
| Depreciation and amortization of long-lived assets | $ | 952 | | | $ | 2,448 | | | $ | 1,739 | |
| Goodwill impairment | 56,556 | | | 7,224 | | | — | |
| | | | | |
| Change in fair value of contingent consideration | — | | | (9,567) | | | |
| | | | | |
| Changes in operating assets and liabilities: | | | | | |
| | | | | |
| Contracts in progress | 12,673 | | | 1,064 | | | (3,887) | |
| Accounts payable | 18,360 | | | 1,549 | | | 4,291 | |
| | | | | |
| | | | | |
| Purchase of property, plant and equipment | (1,857) | | | (1,929) | | | (1,547) | |
| | | | | |
Contracts
During 2022, we determined that our B&W Solar reporting unit had projects located in the United States that existed at the time B&W Solar was acquired on September 30, 2021 that generated losses due to the status of certain construction activities existing at acquisition date, not adequately disclosed in the sales agreement and not recognized in the financial records of the seller. As a result, we recorded an increase in goodwill of $14.4 million, primarily resulting from the recognition of $14.1 million of accrued liabilities and $0.4 million of warranty accruals in conjunction with the finalization of purchase accounting as measurement period adjustments, which was finalized in 2022. We have submitted insurance claims to recover a portion of these losses. During the years ended December 31, 2023 and 2022, additional B&W Solar projects became loss contracts, and as such, we recorded $16.1 million and $13.2 million, respectively, in net losses related to the additional B&W Solar loss contracts.
The following represents the components of B&W Solar contracts in progress and advance billings on contracts included in discontinued operations:
Changes in Contract Estimates
During each of the years ended December 31, 2023 and 2022 B&W Solar recognized changes in estimated gross profit related to long-term contracts accounted for on the over time basis, which are summarized below. There were no changes in contract estimates in 2021, see below for a summary of changes:
| | | | | | | | | | | |
| Year ended December 31, |
| (in thousands) | 2023 | | 2022 |
| Increases in gross profit for changes in estimates | $ | 163 | | | $ | — | |
| Decreases in gross profit for changes in estimates | (44,315) | | | (13,154) | |
| Net changes in gross profit for changes in estimates | $ | (44,152) | | | $ | (13,154) | |
Backlog
During the year ended December 31, 2023, B&W Solar had total bookings of $99.3 million. On December 31, 2023, B&W Solar had $99.0 million of remaining performance obligations, which we also refer to as total backlog. We expect to recognize substantially all of our remaining performance obligations as revenue prior to December 31, 2024.
NOTE 45 – SEGMENT REPORTING
Our operations are assessed based on 3three reportable segments as described in Note 2. Revenues exclude eliminations of revenues generated from sales to other segments or to other product lines within the segment.1. An analysis of our operations by segment is as follows:
| | | Year ended December 31, |
| | | Year ended December 31, | |
| | | Year ended December 31, | |
| | | Year ended December 31, | |
| (in thousands) | (in thousands) | | 2021 | | 2020 | | 2019 | (in thousands) | | | | | 2023 | | 2022 | | 2021 |
| Revenues: | Revenues: | | | | | | |
| B&W Renewable segment | B&W Renewable segment | | |
| B&W Renewable segment | |
| B&W Renewable segment | |
| B&W Renewable | B&W Renewable | | $ | 83,639 | | | $ | 89,790 | | | $ | 94,119 | |
| B&W Renewable | |
| B&W Renewable | |
| B&W Renewable Services | |
| Vølund | Vølund | | 60,671 | | | 66,397 | | | 111,432 | |
| Fosler | | 12,490 | | | — | | | — | |
| | | 156,800 | | | 156,187 | | | 205,551 | |
| | | | | 318,605 | |
| | | | | 318,605 | |
| | | | | 318,605 | |
| B&W Environmental segment | B&W Environmental segment | | | | | | |
| B&W Environmental | |
| B&W Environmental | |
| B&W Environmental | B&W Environmental | | 58,262 | | | 45,186 | | | 184,477 | |
| SPIG | SPIG | | 55,615 | | | 52,341 | | | 80,729 | |
| GMAB | GMAB | | 19,949 | | | 10,441 | | | 10,429 | |
| | 133,826 | | | 107,968 | | | 275,635 | |
| | | | | 202,927 | |
| B&W Thermal segment | B&W Thermal segment | | | | | | |
| B&W Thermal | B&W Thermal | | 433,329 | | | 304,968 | | | 409,744 | |
| | 433,329 | | | 304,968 | | | 409,744 | |
| B&W Thermal | |
| B&W Thermal | |
| | | | | 499,216 | |
| | Eliminations | Eliminations | | (592) | | | (2,806) | | | (31,819) | |
| Eliminations | |
| Eliminations | |
| Total Revenues | Total Revenues | | $ | 723,363 | | | $ | 566,317 | | | $ | 859,111 | |
The presentation ofAt a segment level, the components of our adjusted EBITDA in the tablepresented below is consistent with the waymanner in which our chief operating decision maker ("CODM") reviews the results of our operations and makes strategic decisions about our business. Itemsthe business and is calculated as earnings before interest, tax, depreciation and amortization adjusted for items such as gains or losses on asset sales,arising from the sale of non-income producing assets, net pension benefits, restructuring costs,activities, impairments, gains and losses on debt extinguishment, legal and settlement costs, costs related to financial consulting, research and development costs, costs and operating income from contracts being terminated, and other costs that may not be directly controllable by segment management and are not allocated to the segments.
segment. The following table is provided to reconcile our segment performance metrics to loss before income tax expense.
Adjusted EBITDA for each segment is presented below with a reconciliation from net income (loss).
| | | | | | | | | | | | | | | | | | | | | |
| | | Year ended December 31, |
| (in thousands) | | | | | 2021 | | 2020 | | 2019 |
| Net income (loss) | | | | | $ | 31,538 | | | $ | (10,297) | | | $ | (129,039) | |
| Interest expense | | | | | 41,359 | | | 60,713 | | | 95,266 | |
| Income tax (benefit) expense | | | | | (2,224) | | | 8,179 | | | 5,286 | |
| Depreciation & amortization | | | | | 18,337 | | | 16,805 | | | 23,605 | |
| EBITDA | | | | | 89,010 | | | 75,400 | | | (4,882) | |
| | | | | | | | | |
| Benefit plans, net | | | | | (48,142) | | | (5,600) | | | (22,800) | |
| Gain on sales, net | | | | | (13,984) | | | (3,155) | | | (339) | |
| (Gain) loss on debt extinguishment | | | | | (6,530) | | | 6,194 | | | 3,969 | |
| Stock compensation | | | | | 10,476 | | | 4,587 | | | 3,376 | |
| Restructuring activities and business services transition costs | | | | | 10,726 | | | 11,849 | | | 11,707 | |
| Advisory fees for settlement costs and liquidity planning | | | | | 5,480 | | | 6,357 | | | 11,824 | |
| Litigation legal costs | | | | | 4,894 | | | 2,137 | | | 475 | |
| Acquisition pursuit and related costs | | | | | 4,841 | | | — | | | — | |
Product development (1) | | | | | 4,713 | | | — | | | — | |
| Foreign exchange | | | | | 4,294 | | | (58,799) | | | 16,602 | |
| Financial advisory services | | | | | 2,709 | | | 4,384 | | | 9,069 | |
| Other - net | | | | | 1,489 | | | 1,128 | | | (285) | |
| Loss from business held for sale | | | | | 483 | | | 467 | | | 5,850 | |
| Loss from a non-strategic business | | | | | 116 | | | 2,559 | | | 5,518 | |
Settlement cost to exit contract (2) | | | | | — | | | — | | | 6,575 | |
| Income from discontinued operations | | | | | — | | | (1,800) | | | (694) | |
Adjusted EBITDA (3) | | | | | $ | 70,575 | | | $ | 45,708 | | | $ | 45,965 | |
(1) Costs associated with development of commercially viable products that are ready to go to market.
(2)In March 2019, we entered into a settlement in connection with an additional B&W Renewable waste-to-energy EPC contract, for which notice to proceed was not given and the contract was not started. The settlement eliminated our obligations to act, and our risk related to acting, as the prime EPC should the project have moved forward.
(3))Adjusted EBITDA for the twelve months ended December 31, 2020 includes a $26 million non-recurring loss recovery related to certain historical EPC loss contracts in the third quarter.
| | | Year ended December 31, |
| | | Year ended December 31, | |
| | | Year ended December 31, | |
| | | Year ended December 31, | |
| (in thousands) | (in thousands) | | 2021 | | 2020 | | 2019 | (in thousands) | | | | | 2023 | | 2022 | | 2021 |
| Adjusted EBITDA | Adjusted EBITDA | | | | | | |
B&W Renewable segment (1) | B&W Renewable segment (1) | | $ | 23,219 | | | $ | 24,957 | | | $ | 1,617 | |
B&W Renewable segment (1) | |
B&W Renewable segment (1) | |
| B&W Environmental segment | B&W Environmental segment | | 11,773 | | | 3,503 | | | 12,553 | |
| B&W Thermal segment | B&W Thermal segment | | 49,143 | | | 36,052 | | | 52,235 | |
| Corporate | | (12,467) | | | (14,425) | | | (17,579) | |
| Research and development benefit (costs) | | (1,093) | | | (4,379) | | | (2,861) | |
| | | $ | 70,575 | | | $ | 45,708 | | | $ | 45,965 | |
|
(1) Adjusted EBITDA in our Renewable segment for the twelve monthsyear ended December 31, 20202022 includes a $26$6.2 million non-recurring loss recoverygain on sale related to certain historical EPC loss contracts in the third quarter.development rights of a future renewable energy project.
We do not separately identify or report our assets by segment as our chief operating decision makerthe CODM does not consider assets by segment to be a critical measure by which performance is measured.
A reconciliation of Adjusted EBITDA by segment to (Loss) income from continuing operations before income tax expense (benefit) is as follows:
| | | | | | | | | | | | | | | | | | | | |
| | Year ended December 31, |
| (in thousands) | | 2023 | | 2022 | | 2021 |
| | | | | | |
| B&W Renewable segment - Adjusted EBITDA | | $ | 22,586 | | | $ | 21,227 | | | $ | 19,826 | |
| B&W Environmental segment - Adjusted EBITDA | | 15,277 | | | 9,787 | | | 11,773 | |
| B&W Thermal segment - Adjusted EBITDA | | 66,653 | | | 56,291 | | | 49,143 | |
| Corporate | | (21,374) | | | (16,477) | | | (12,467) | |
| Research and development | | (4,011) | | | (3,319) | | | (1,093) | |
| Interest expense | | (48,703) | | | (44,220) | | | (38,992) | |
| Depreciation & amortization | | (19,990) | | | (21,628) | | | (16,291) | |
| Benefit plans, net | | (37,505) | | | 37,528 | | | 48,142 | |
| Gain on sales, net | | (57) | | | 2,539 | | | 13,932 | |
| Settlement and related legal recoveries (costs) | | 1,474 | | | (10,734) | | | (4,894) | |
| Advisory fees for settlement costs and liquidity planning | | (1,107) | | | (1,509) | | | (5,480) | |
| Stock compensation | | (7,121) | | | (8,654) | | | (10,476) | |
| Restructuring expense and business services transition | | (5,663) | | | (8,474) | | | (10,726) | |
| Acquisition pursuit and related costs | | (827) | | | (5,504) | | | (4,841) | |
| Product development | | (9,023) | | | (4,100) | | | (4,713) | |
| Foreign exchange | | (2,507) | | | (582) | | | (4,294) | |
| Gain on debt extinguishment | | — | | | — | | | 6,530 | |
| Financial advisory services | | — | | | (1,424) | | | (2,709) | |
| Contract disposal | | (8,550) | | | (2,976) | | | — | |
| Inventory step-up price adjustment | | — | | | — | | | (483) | |
| | | | | | |
| Letter of credit fees | | (7,702) | | | (5,204) | | | (1,578) | |
| Other-net | | (2,002) | | | (1,496) | | | (3,024) | |
| (Loss) income from continuing operations before income tax expense (benefit) | | $ | (70,152) | | | $ | (8,929) | | | $ | 27,285 | |
We estimate that 47%45%, 43%38% and 45%47% of our consolidated revenues in 2021, 2020,2023, 2022, and 2019,2021, respectively, were related to coal-fired power plants. The availability of natural gas in great supply has caused, in part, low prices for natural gas in the United States, which has led to more demand for natural gas relative to energy derived from coal. A material decline in spending by electric power generating companies and other steam-using industries on coal-fired power plants over a sustained period of time could materially and adversely affect the demand for our power generation products and services and, therefore, our financial condition, results of operations and cash flows. Coal-fired power plants have been scrutinized by environmental groups and government regulators over the emissions of potentially harmful pollutants. This scrutiny and other economic incentives including tax advantages, have promoted the growth of nuclear, wind, solar and solarnuclear power, among others, and a decline in cost of renewable power plant components and power storage. The recent economic environment and uncertainty concerning new environmental legislation or replacement rules or regulations in the United States and elsewhere has caused many of our major customers, principally electric utilities, to delay making substantial expenditures for new plants, and to delay upgrades to existing power plants.
Information about our consolidated operations in different geographic areasareas:
| | | | | | | | | | | | | | | | | |
| Year ended December 31, |
| (in thousands) | 2021 | | 2020 | | 2019 |
REVENUES (1) | | | | | |
| United States | $ | 431,540 | | | $ | 310,958 | | | $ | 460,484 | |
| Canada | 48,206 | | | 43,936 | | | 113,660 | |
| Denmark | 30,310 | | | 28,590 | | | 27,311 | |
| United Kingdom | 26,722 | | | 25,811 | | | 54,347 | |
| Sweden | 22,391 | | | 11,430 | | | 18,789 | |
| Israel | 14,110 | | | 1,635 | | | 635 | |
| Saudi Arabia | 12,529 | | | 9,545 | | | 5,243 | |
| Hong Kong | 11,056 | | | 4,490 | | | 4,524 | |
| China | 10,028 | | | 8,461 | | | 18,430 | |
| Finland | 6,310 | | | 6,606 | | | 14,118 | |
| South Korea | 3,961 | | | 4,050 | | | 14,443 | |
| Indonesia | 1,853 | | | 19,644 | | | 16,739 | |
| Aggregate of all other countries, each with less than $10 million in revenues | 104,347 | | | 91,161 | | | 110,388 | |
| $ | 723,363 | | | $ | 566,317 | | | $ | 859,111 | |
| | | | | | | | | | | | | | | | | |
| Year ended December 31, |
| (in thousands) | 2023 | | 2022 | | 2021 |
REVENUES (1) | | | | | |
| United States | $ | 505,078 | | | $ | 456,534 | | | $ | 419,050 | |
| Canada | 90,612 | | | 83,727 | | | 48,206 | |
| United Kingdom | 82,745 | | | 30,223 | | | 26,722 | |
| Denmark | 58,191 | | | 50,857 | | | 30,310 | |
| Sweden | 36,088 | | | 35,303 | | | 22,391 | |
| Saudi Arabia | 23,103 | | | 21,428 | | | 12,529 | |
| China | 20,358 | | | 25,890 | | | 10,028 | |
| Brazil | 16,959 | | | 15,049 | | | 3,946 | |
| Indonesia | 16,011 | | | 11,724 | | | 1,853 | |
| South Korea | 15,059 | | | 6,032 | | | 3,961 | |
| Greece | 13,018 | | | 71 | | | 253 | |
| Taiwan | 12,478 | | | 12,433 | | | 5,776 | |
| Belgium | 10,837 | | | 2,624 | | | 3,045 | |
| France | 9,696 | | | 12,555 | | | 4,539 | |
| Israel | 1,290 | | | 3,082 | | | 14,110 | |
| Hong Kong | 9 | | | 896 | | | 11,056 | |
| Aggregate of all other countries, each with less than $10 million in revenues | 87,822 | | | 79,490 | | | 93,098 | |
| $ | 999,354 | | | $ | 847,918 | | | $ | 710,873 | |
(1) We allocate geographic revenues based on the location of the customer's operations.
| | Year ended December 31, |
| Year ended December 31, | |
| Year ended December 31, | |
| Year ended December 31, | |
| (in thousands) | (in thousands) | 2021 | | 2020 | | 2019 |
| NET PROPERTY, PLANT AND EQUIPMENT, AND FINANCE LEASE | | | | | |
| NET PROPERTY, PLANT AND EQUIPMENT AND FINANCE LEASES | |
| NET PROPERTY, PLANT AND EQUIPMENT AND FINANCE LEASES | |
| NET PROPERTY, PLANT AND EQUIPMENT AND FINANCE LEASES | |
| United States | |
| United States | |
| United States | United States | $ | 52,516 | | | $ | 46,734 | | | $ | 61,111 | |
| Mexico | Mexico | 17,071 | | | 18,173 | | | 19,241 | |
| Mexico | |
| Mexico | |
| Denmark | |
| Denmark | |
| Denmark | Denmark | 6,573 | | | 7,327 | | | 6,801 | |
| United Kingdom | United Kingdom | 5,722 | | | 5,274 | | | 5,469 | |
| United Kingdom | |
| United Kingdom | |
| Italy | |
| Italy | |
| Italy | Italy | 1,565 | | | 1,881 | | | 2,172 | |
| Aggregate of all other countries | Aggregate of all other countries | 2,180 | | | 5,689 | | | 2,259 | |
| $ | 85,627 | | | $ | 85,078 | | | $ | 97,053 | |
| Aggregate of all other countries | |
| Aggregate of all other countries | |
| $ | |
| $ | |
| $ | |
NOTE 56 – REVENUE RECOGNITION AND CONTRACTS
Revenue Recognition
We generate the vast majority of our revenues from the supply of, and aftermarket services for, steam-generating, environmental and auxiliary equipment. We also earn revenue from the supply of custom-engineered cooling systems for
steam applications along with related aftermarket services. Our revenue recognition accounting policy is described in more detail in Note 2.
Contract Balances
The following represents the components of our contractsContracts in progress and advanceAdvance billings on contracts included in ourthe Consolidated Balance Sheets:
| | (in thousands) | (in thousands) | December 31, 2021 | | December 31, 2020 | | $ Change | | % Change | (in thousands) | December 31, 2023 | | December 31, 2022 | | $ Change | | % Change |
| Contract assets - included in contracts in progress: | Contract assets - included in contracts in progress: | | | | | | | |
| Costs incurred less costs of revenue recognized | |
| Costs incurred less costs of revenue recognized | |
| Costs incurred less costs of revenue recognized | Costs incurred less costs of revenue recognized | $ | 35,939 | | | $ | 25,888 | | | $ | 10,051 | | | 39 | % | $ | 37,556 | | | $ | | $ | 62,662 | | | $ | | $ | (25,106) | | | (40) | | (40) | % |
| Revenues recognized less billings to customers | Revenues recognized less billings to customers | 44,237 | | | 33,420 | | | 10,817 | | | 32 | % | Revenues recognized less billings to customers | 52,498 | | | 55,518 | | 55,518 | | | (3,020) | | (3,020) | | | (5) | | (5) | % |
| Contracts in progress | Contracts in progress | $ | 80,176 | | | $ | 59,308 | | | $ | 20,868 | | | 35 | % | Contracts in progress | $ | 90,054 | | | $ | | $ | 118,180 | | | $ | | $ | (28,126) | | | (24) | | (24) | % |
| Contract liabilities - included in advance billings on contracts: | Contract liabilities - included in advance billings on contracts: | | | | | | | |
| Billings to customers less revenues recognized | Billings to customers less revenues recognized | $ | 68,615 | | | $ | 61,884 | | | $ | 6,731 | | | 11 | % |
| Billings to customers less revenues recognized | |
| Billings to customers less revenues recognized | | $ | 76,032 | | | $ | 111,159 | | | $ | (35,127) | | | (32) | % |
| Costs of revenue recognized less cost incurred | Costs of revenue recognized less cost incurred | (235) | | | 2,118 | | | (2,353) | | | (111) | % | Costs of revenue recognized less cost incurred | 5,066 | | | 19,786 | | 19,786 | | | (14,720) | | (14,720) | | | (74) | | (74) | % |
| Advance billings on contracts | Advance billings on contracts | $ | 68,380 | | | $ | 64,002 | | | $ | 4,378 | | | 7 | % | Advance billings on contracts | $ | 81,098 | | | $ | | $ | 130,945 | | | $ | | $ | (49,847) | | | (38) | | (38) | % |
| | Net contract balance | Net contract balance | $ | 11,796 | | | $ | (4,694) | | | $ | 16,490 | | | (351) | % |
| Net contract balance | |
| Net contract balance | | $ | 8,956 | | | $ | (12,765) | | | $ | 21,721 | | | 170 | % |
| | Accrued contract losses | Accrued contract losses | $ | 378 | | | $ | 582 | | | $ | (204) | | | (35) | % |
| Accrued contract losses | |
| Accrued contract losses | | $ | 522 | | | $ | 180 | | | $ | 342 | | | 190 | % |
The following amounts represent retainage on contracts:
| | (in thousands) | (in thousands) | December 31, 2021 | | December 31, 2020 | | $ Change | | % Change | (in thousands) | December 31, 2023 | | December 31, 2022 | | $ Change | | % Change |
| Retainage expected to be collected within one year | Retainage expected to be collected within one year | $ | 2,575 | | | $ | 2,969 | | | $ | (394) | | | (13) | % | Retainage expected to be collected within one year | $ | 2,584 | | | $ | | $ | 3,076 | | | $ | | $ | (492) | | | (16) | | (16) | % |
| Retainage expected to be collected after one year | Retainage expected to be collected after one year | 1,591 | | | 632 | | | 959 | | | 152 | % | Retainage expected to be collected after one year | 1,466 | | | 786 | | 786 | | | 680 | | 680 | | | 87 | | 87 | % |
| Total retainage | Total retainage | $ | 4,166 | | | $ | 3,601 | | | $ | 565 | | | 16 | % | Total retainage | $ | 4,050 | | | $ | | $ | 3,862 | | | $ | | $ | 188 | | | 5 | | 5 | % |
We have included retainageRetainage expected to be collected in 20222024 is included in accountsAccounts receivable – trade, net in ourthe Consolidated Balance Sheets. Retainage expected to be collected after one year areis included in otherOther assets in ourthe Consolidated Balance Sheets. Of theAll long-term retainage at December 31, 2021, we anticipate collecting $1.6 million in 2023.2023 is expected to be collected by the end of 2025.
Backlog
OnAt December 31, 20212023 we had $639.0$644.5 million of remaining performance obligations, including $114.0 million of performance obligations associated with O&M contracts being exited, which weare also referreferred to as total backlog. We expect to recognize approximately 62.2%69%, 12.8%14% and 25.0%17% of ourits remaining performance obligations as revenue in 2022, 20232024, 2025 and thereafter, respectively.
Changes in Contract Estimates
In the years ended December 31, 2021, 20202023, 2022 and 20192021 we recognized changes in estimated gross profit related to long-term contracts accounted for on the over time basis, which are summarized as follows:
| | | | | | | | | | | | | | | | | | | | | |
| | | Year ended December 31, |
| (in thousands) | | | | | 2021 | | 2020 | | 2019 |
Increases in gross profit for changes in estimates for over time contracts (1) | | | | | $ | 16,042 | | | $ | 43,597 | | | $ | 34,622 | |
| Decreases in gross profit for changes in estimates for over time contracts | | | | | (6,531) | | | (17,480) | | | (50,050) | |
| Net changes in gross profit for changes in estimates for over time contracts | | | | | $ | 9,511 | | | $ | 26,117 | | | $ | (15,428) | |
| | | | | | | | | | | | | | | | | | | | | |
| | | Year ended December 31, |
| (in thousands) | | | | | 2023 | | 2022 | | 2021 |
| Increases in gross profit for changes in estimates | | | | | $ | 11,356 | | | $ | 15,067 | | | $ | 16,042 | |
| Decreases in gross profit for changes in estimates | | | | | (10,407) | | | (8,586) | | | (6,531) | |
| Net changes in gross profit for changes in estimates | | | | | $ | 949 | | | $ | 6,481 | | | $ | 9,511 | |
(1)
Loss Contracts from Continuing Operations
Increases in gross profits for changes in estimates for over time contracts reflects a non-recurring loss recovery of $26.0 million in
During the year ended December 31, 2020.2023, we recorded $3.9 million in net losses from changes in estimated costs to complete eight B&W Thermal contracts in loss positions.
B&W Renewable EPC Loss Contracts
We had 6 B&W Renewable EPC contracts for renewable energy facilities in Europe that were loss contracts at December 31, 2017. The scope of these EPC (Engineer, Procure and Construct) contracts extended beyond our core technology, products and services. In addition to these loss contracts, we have one remaining extended scope contract in our Babcock & Wilcox Renewable segment which turned into a loss contract in the fourth quarter of 2019.
NaN of the 6 contracts were 100% complete and the remaining 1 contract was nearly 100% complete at December 31, 2021, with only limited warranty obligations remaining, and all have been turned over to the customers. In the years ended December 31, 2021 and 2020, we recorded $42 thousand in net gains and $3.7 million in net losses, respectively, inclusive of warranty expense as described in Note 11, resulting from changes in the estimated revenues and costs to complete those contracts. All liquidated damages associated with these 6 contracts have been settled and paid as of December 31, 2020.
In October 2020, we entered into a settlement agreement with an insurer under which we received a settlement of $26.0 million to settle claims in connection with 5 of 6 European B&W Renewable EPC loss contracts disclosed above. We recognized this non-recurring loss recovery of $26.0 million as a reduction of our cost of operations in our Consolidated Statements of Operation s in 2020.
During 2021, the Company settled a dispute with a subcontractor for project costs related to 3 of the Renewable EPC loss contracts described above. Accordingly, we recognized this settlement as a reduction of our cost of operations in our Consolidated Statements of Operations and recorded the receivable in accounts receivable - other in our Consolidated Balance Sheets at December 31, 2021 and in the Table above.
The Company, as a normal part of its ongoing business operations, is continuing to pursue other additional potential claims and recoveries from subcontractors and others where appropriate and available.
B&W Environmental Loss Contracts
At December 31, 2021, the B&W Environmental segment had 2 significant loss contracts of which both contracts were nearly 100% complete. In the year ended December 31, 2021 our estimated loss on these contracts improved by $0.4 million. In the twelve months ended December 31, 2020 and 2019, we recognized $1.3 million and $5.6 million, respectively, of additional charges on these contracts.
NOTE 67 – INVENTORIES,
Inventories are stated at the lower of cost or net realizable value. During the fourth quarter of 2021, the Company voluntarily changed its method of accounting for certain domestic inventory previously valued by the LIFO method to the FIFO method. The cumulative effect of this change on periods presented prior to 2019 resulted in an increase in retained earnings of $7.3 million at December 31, 2018. The impact on earnings was a decrease of $0.1 million and an increase of $0.4 million for the years ending December 31, 2020 and 2019, respectively. The FIFO method of accounting for inventory is preferable because it more closely matches the physical inventory flow, better reflects the current value of inventories on our Consolidated
Balance Sheets, improves our financial reporting by having a consistent method across the organization, and increases comparability with certain peers of the Company.
The components of inventoriesInventories, net included in the Consolidated Balance Sheets are as follows:
| | (in thousands) | (in thousands) | December 31, 2021 | | December 31, 2020 (1) | (in thousands) | December 31, 2023 | | December 31, 2022 |
| Raw materials and supplies | Raw materials and supplies | $ | 56,352 | | | $ | 53,944 | |
| Work in progress | Work in progress | 5,723 | | | 8,195 | |
| Finished goods | Finished goods | 17,452 | | | 12,307 | |
| Total inventories | $ | 79,527 | | | $ | 74,446 | |
| Total inventories, net | |
(1) December 31, 2020 amounts have been revised to reflect the change in inventory accounting method, as described above.
As a result of the retrospective application of this change in accounting method, the following financial statement line items within the accompanying financial statements were adjusted, as follows:
| | | | | | | | | | | | | | | | | | | | | | | | | | | | | | | | | | | |
| December 31, 2021 | | December 31, 2020 |
| (in thousands) | As Computed Under LIFO | | As Reported Under FIFO | | Effect
of Change | | As Computed Under LIFO | | As Reported Under FIFO | | Effect
of Change |
| Consolidated Balance Sheets | | | | | | | | | | |
| Inventories | $ | 72,242 | | | $ | 79,527 | | | $ | 7,285 | | | $ | 67,161 | | | $ | 74,446 | | | $ | 7,285 | |
| Accumulated deficit | (1,328,439) | | | (1,321,154) | | | 7,285 | | | (1,350,206) | | | (1,342,921) | | | 7,285 | |
NOTE 7 8– PROPERTY, PLANT & EQUIPMENT &AND FINANCE LEASELEASES
Property, plant and equipment less accumulated depreciation is as follows:The following table indicates the carrying value of each of the major classes of depreciable assets in the Consolidated Balance Sheets:
| | (in thousands) | (in thousands) | December 31, 2021 | | December 31, 2020 | (in thousands) | December 31, 2023 | | December 31, 2022 |
| Land | Land | $ | 1,489 | | | $ | 1,584 | |
| Buildings | Buildings | 31,895 | | | 34,207 | |
| Machinery and equipment | Machinery and equipment | 144,325 | | | 151,399 | |
| Property under construction | Property under construction | 12,480 | | | 5,336 | |
| 190,189 | | | 192,526 | |
| 203,920 | |
| Less accumulated depreciation | Less accumulated depreciation | 133,137 | | | 135,925 | |
| Net property, plant and equipment | Net property, plant and equipment | 57,052 | | | 56,601 | |
| Finance lease | Finance lease | 34,159 | | | 30,551 | |
| Less finance lease accumulated amortization | Less finance lease accumulated amortization | 5,584 | | | 2,074 | |
| Net property, plant and equipment, and finance lease | $ | 85,627 | | | $ | 85,078 | |
| Net property, plant and equipment and finance leases | |
NOTE 89 - GOODWILL
The following summarizes the changes in the net carrying amount of goodwill as of December 31, 2021:
| | | | | | | | | | | | | | | | | | | | | | | |
| (in thousands) | B&W
Renewable | | B&W Environmental | | B&W
Thermal | | Total |
| Balance at December 31, 2020 | $ | 10,211 | | | $ | 5,673 | | | $ | 31,479 | | | $ | 47,363 | |
Addition - Fosler Construction(1) | 51,979 | | | — | | | — | | | 51,979 | |
Addition - VODA(1) | 17,176 | | | — | | | — | | | 17,176 | |
| Currency translation adjustments | (9) | | | (6) | | | (41) | | | (56) | |
| Balance at December 31, 2021 | $ | 79,357 | | | $ | 5,667 | | | $ | 31,438 | | | $ | 116,462 | |
(1) As described in Note 26, we are in the process of completing the purchase price allocation associated with the Fosler Construction and VODA acquisitions and as a result, the provisional measurements of goodwill associated with these acquisitions are subject to change.
Consolidated Balance Sheets:
Goodwill is tested for impairment annually and when impairment indicators exist. No impairment indicators were identified during the year ended December 31, 2021. | | | | | | | | | | | | | | | | | | | | | | | |
| (in thousands) | B&W
Renewable | | B&W Environmental | | B&W
Thermal | | Total |
| Goodwill | $ | 75,468 | | | $ | 79,825 | | | $ | 69,587 | | | $ | 224,880 | |
| Accumulated impairment losses | (49,965) | | | (74,478) | | | — | | | (124,443) | |
| Balance at December 31, 2022 | $ | 25,503 | | | $ | 5,347 | | | $ | 69,587 | | | $ | 100,437 | |
| | | | | | | |
| | | | | | | |
| | | | | | | |
| Currency translation adjustments | 302 | | | 290 | | | 927 | | | 1,519 | |
| Balance at December 31, 2023 | $ | 25,805 | | | $ | 5,637 | | | $ | 70,514 | | | $ | 101,956 | |
| | | | | | | |
In conductingGoodwill represents the annual impairment test for goodwill,excess of the Company has the option to first assess qualitative factors to determine whether it is more likely than notconsideration transferred over the fair value of anynet assets, including identifiable intangible assets, at the acquisition date. Goodwill is assessed for impairment annually on October 1 or more frequently if events or changes in circumstances indicate a potential impairment exists (a "triggering event").
The annual quantitative assessment was performed using a combination of the income approach (discounted cash flows), the market approach and the guideline transaction method. The income approach uses the reporting unit is less than its carrying amount. Ifunit’s estimated future cash flows, discounted at the Company electsweighted-average cost of capital of a hypothetical third-party buyer to perform a qualitative assessmentaccount for uncertainties within the projections. The income approach uses assumptions based on the reporting unit’s estimated revenue growth, operating margin, and determines an impairment is more likely than not, the Company is required to perform a quantitative impairment test. Otherwise, no further analysis is required. Alternatively, the Company may elect to proceed directlyworking capital turnover. The market approach estimates fair value by applying cash flow multiples to the reporting unit’s operating performance. The multiples are derived from comparable publicly traded companies with similar characteristics to the reporting unit. The guideline transaction method estimates fair value by applying recent observed transaction multiples from transactions involving companies with similar characteristics to the reporting unit’s business. The fair market value calculated in the quantitative impairment test.assessment exceeded the carrying amount of the reporting units by a range of 9% to 142% at October 1, 2023. One of our reporting units, Babcock & Wilcox Construction Company, which is a component of the B&W Thermal segment, has a negative carrying amount at December 31, 2023. There is goodwill of $8.9 million allocated to Babcock & Wilcox Construction Company at December 31, 2023.
During the annual goodwill impairment testing asfourth quarter of October 1, 2021,2023, we identified factors that indicated a triggering event had occurred, mainly due to the Company elected to performdecrease in the common stock price during the quarter. We performed a quantitative impairment test. No impairment charges were recorded as a resultqualitative assessment in accordance with ASC 350 and, in conjunction with the results of the quantitative testing performed.
annual assessment, concluded that no impairment of goodwill exists for any reporting unit at December 31, 2023.
NOTE 910 – INTANGIBLE ASSETS
Our intangibleIntangible assets are as follows:
| | (in thousands) | (in thousands) | December 31, 2021 | | December 31, 2020 | (in thousands) | December 31, 2023 | | December 31, 2022 |
Definite-lived intangible assets(1) | | | |
| Definite-lived intangible assets | |
| Customer relationships | |
| Customer relationships | |
| Customer relationships | Customer relationships | $ | 46,903 | | | $ | 24,862 | |
| Unpatented technology | Unpatented technology | 15,410 | | | 15,713 | |
| Patented technology | Patented technology | 3,103 | | | 2,642 | |
| Tradename | 12,747 | | | 13,088 | |
| Acquired backlog | 3,100 | | | — | |
| Trade names | |
| | All other | |
| All other | |
| All other | All other | 9,319 | | | 9,262 | |
| Gross value of definite-lived intangible assets | Gross value of definite-lived intangible assets | 90,582 | | | 65,567 | |
| Customer relationships amortization | Customer relationships amortization | (20,800) | | | (19,537) | |
| Unpatented technology amortization | Unpatented technology amortization | (8,313) | | | (6,751) | |
| Patented technology amortization | Patented technology amortization | (2,729) | | | (2,593) | |
| Tradename amortization | (5,425) | | | (4,831) | |
| Acquired backlog | (1,620) | | | — | |
| Trade names amortization | |
| | All other amortization | |
| All other amortization | |
| All other amortization | All other amortization | (9,205) | | | (9,252) | |
| Accumulated amortization | Accumulated amortization | (48,092) | | | (42,964) | |
| Net definite-lived intangible assets | Net definite-lived intangible assets | $ | 42,490 | | | $ | 22,603 | |
| Indefinite-lived intangible assets | Indefinite-lived intangible assets | | | |
| Trademarks and trade names | $ | 1,305 | | | $ | 1,305 | |
| Trademarks | |
| Trademarks | |
| Trademarks | |
| Total intangible assets, net | Total intangible assets, net | $ | 43,795 | | | $ | 23,908 | |
(1) As described in Note 26, we are in the process of completing the purchase price allocation associated with the Fosler Construction and VODA acquisitions and as a result, the increase in intangible assets associated with these acquisitions are subject to change.
The following summarizes the changes in the carrying amount of intangible assets:
| | Year ended December 31, |
| Year ended December 31, | | | Year ended December 31, |
| (in thousands) | (in thousands) | 2021 | | 2020 | (in thousands) | 2023 | | 2022 |
| Balance at beginning of period | Balance at beginning of period | $ | 23,908 | | | $ | 25,300 | |
Business acquisitions and adjustments(1) | 26,583 | | | — | |
| Business acquisitions and adjustments | |
| Amortization expense | Amortization expense | (5,128) | | | (3,406) | |
| Currency translation adjustments | Currency translation adjustments | (1,568) | | | 2,014 | |
| Balance at end of the period | Balance at end of the period | $ | 43,795 | | | $ | 23,908 | |
(1) As described in Note 26, we are in the process of completing the purchase price allocation associated with the Fosler Construction and VODA acquisitions and as a result, the increase in amortization expense associated with these acquisitions are subject to change.
Amortization of intangible assets is included in costCost of operations and SG&A in ourthe Consolidated Statement of Operations but is not allocated to segment results.
Definite-lived intangible assets are assessed for impairment on an interim basis when impairment indicators exist. During the fourth quarter of 2023, we identified factors that indicated a triggering event had occurred, mainly due to the decrease in the common stock price during the quarter. We performed a quantitative assessment in accordance with ASC 360 and concluded that no impairment of intangible assets exists at December 31, 2023.
Estimated future intangible asset amortization expense, including the preliminary amortization expense resulting from the acquisitions of Fosler Construction and VODA, during the year ended December 31, 20212023 is as follows (in thousands):
| | | | | |
| Amortization Expense(1) |
Year ending December 31, 2022 | 6,759 | |
Year ending December 31, 2023 | 5,382 | |
YearTwelve months ending December 31, 2024 | 5,300 $ | 7,558 | |
YearTwelve months ending December 31, 2025 | 4,4806,685 | |
YearTwelve months ending December 31, 2026 | 3,2565,530 | |
| Twelve months ending December 31, 2027 | 4,916 | |
| Twelve months ending December 31, 2028 | 4,633 | |
| Thereafter | 17,31314,775 | |
(1) As described in Note 26, we are in the process of completing the purchase price allocation associated with the Fosler Construction and VODA acquisitions and as a result, the estimated future intangible asset amortization expense associated with these acquisitions are subject to change.
As of December 31, 2021 and 2020, the B&W Vølund asset group had $0.7 million and $0.5 million of identifiable intangible assets, net of accumulated amortization, respectively.
As of December 31, 2021 and 2020, the B&W SPIG asset group had $16.6 million and $21.1 million of identifiable intangible assets, net of accumulated amortization, respectively.
See Note 26 for intangible assets identified in conjunction with the acquisitions of Fosler Construction and VODA, which are subject to change pending the finalization of the purchase price allocation associated with these acquisitions.
NOTE 1011 – LEASES
CertainDuring the year ended December 31, 2022, we sold certain real property assets for our Copley, Ohio location were sold on March 15, 2021, as described in Note 26. In conjunctionand then entered into leaseback agreements with the buyers for each sale we executed a leaseback agreement commencing March 16, 2021 and expiring on March 31, 2033. Thetransaction. We accounted for these sale-leasebacks as financing transactions with the purchasers of the assets in accordance with ASC 842 as the lease isagreements were all deemed to be finance leases. We concluded the lease agreements met the qualifications to be classified as an operating lease with total future minimum payments duringfinance leases due to the initial termsignificance of the present value of the lease payments, using the appropriate individual discount rate to reflect our incremental borrowing rates, compared to the fair value of approximately $5.6 millionthe leased property as of December 31, 2021. An incremental borrowing ratethe lease commencement dates.
Finance lease classification indicates that control of 7.71% was usedthe related property has not transferred to determine the right-of-use (the "ROU") asset.buyer/lessor, and as such, these transactions were deemed to be failed sale-leasebacks and were accounted for as financing arrangements. As a result of December 31, 2021, a $3.5 million ROU asset is recordedthis determination, the proceeds from the buyer/lessor are viewed to have been received in rightthe form of use assets hypothetical loans with corresponding liabilitiesits leased property considered to be collateral. The hypothetical loans are payable as principal and interest in the form of $3.8 million“lease payments” to the buyer/lessors. As such, the property will remain in other accrued liabilities and other non-current operating liabilities in ourthe Consolidated Balance Sheets as Net property, plant, equipment and finance leases until the leases end. We will depreciate the assets over the shorter of their respective economic lives or lease term. No gains or losses were recognized related to the transactions under U.S. GAAP for the year ended December 31, 2021.2022 for the following transactions:
CertainIn December 2022, we sold certain real property assets at our Chanute, Kansas location for our Lancaster, Ohio location were sold on August 13, 2021, as described$8.4 million in Note 26. In conjunction with the sale, we executedproceeds and then simultaneously entered into a leaseback agreement commencing August 13, 2021 and expiring on August 31, 2041.with the buyer of the property. The lease is classified as an operating leasehas a 20 year term, with total future minimum payments duringtwo renewal options of ten years each. Under the initial termterms of the lease agreement, our initial basic rent is approximately $0.7 million per year with annual increases of approximately $36.6 million as of December 31, 2021. An incremental borrowing rate of 8.215% was used to determine2.25% throughout the ROU asset. We recorded a $19.4 million ROU asset in right of use assets and corresponding liabilities of $19.5 million in other accrued liabilities and other non-current operating liabilities in our Consolidated Balance Sheets as of December 31, 2021.
In conjunction with our acquisition of Fosler Construction, as described in Note 26, we assumed 2 leases classified as operating leases with total future minimum payments during the remaining termlife of the leases of approximately $1.5 million. As of December 31, 2021, a $1.1 million ROU asset is recorded in right-of-use assets with corresponding liabilities of $1.1 million in operatingagreement. We concluded the lease liabilities and non-current operating lease liabilities in our Consolidated Balance Sheets. As of December 31, 2021, there was 1 leaseagreement met the qualifications to be classified as a finance lease with total future minimum payments duringdue to the remaining termsignificance of the leasespresent value of approximately $1.5 million. Anthe lease payments, using a discount rate that reflects our incremental borrowing rate, compared to the fair value of 6.65%the leased property as of the lease commencement date. At December 31, 2023, the carrying value of the financing liability was used to determine$8.5 million, which is net of debt issuance costs of $0.6 million and is recorded in Long-term loans payable in the ROU asset. We recorded a $0.7 million ROU asset in net property, plant and equipment, and finance lease and corresponding liabilities of $0.7 million in otheraccrued liabilities and other non-current finance liabilities in our Consolidated Balance Sheets as of December 31, 2021.Sheets. The
monthly lease payments are split between a reduction of principal and interest expense using the effective interest rate method.
In November 2022, we sold certain real property assets at our Monterey, Mexico location for $1.4 million in proceeds and then simultaneously entered into a leaseback agreement with the buyer of the property. The lease has a four year term with payments of approximately $0.4 million per year. We concluded the lease agreement met the qualifications to be classified as a finance lease due to the significance of the present value of the lease payments, using a discount rate that reflects our incremental borrowing rate, compared to the fair value of the leased property as of the lease commencement date. At December 31, 2023, the carrying value of the financing liability was $1.0 million in Loans payable in the Consolidated Balance Sheets. The monthly lease payments are split between a reduction of principal and interest expense using the effective interest rate method.
In October 2022, We sold a corporate aircraft for $3.4 million in proceeds and then simultaneously entered into a leaseback agreement with the buyer of the property. The lease has a two year term with payments of approximately $62 thousand per month through July 2024 with a final payment of $2.3 million in August 2024 at the expiration of the lease. We concluded the lease agreement met the qualifications to be classified as a finance lease due to the significance of the present value of the lease payments, using a discount rate that reflects our incremental borrowing rate, compared to the fair value of the leased property as of the lease commencement date. At December 31, 2023, the carrying value of the financing liability was $2.6 million, which is recorded in Loans payable in the Consolidated Balance Sheets. The monthly lease payments are split between a reduction of principal and interest expense using the effective interest rate method.
The remaining future cash payments related to the aggregate financing liabilities for each year ending December 31 are as follows:
| | | | | |
| 2024 | $ | 3,800 | |
| 2025 | 1,137 | |
| 2026 | 1,122 | |
| 2027 | 782 | |
| 2028 | 800 | |
| Thereafter | 13,331 | |
| Total minimum liability requirements | $ | 20,972 | |
| Imputed interest | (8,151) | |
| Total | $ | 12,821 | |
The components of lease expense included on ourin the Consolidated Statements of Operations wereare as follows:
| | | Year ended December 31, |
| | | | Year ended December 31, | |
| | | | Year ended December 31, | |
| | | | Year ended December 31, | |
| (in thousands) | (in thousands) | Classification | | 2021 | | 2020 | | 2019 | (in thousands) | Classification | | | | | 2023 | | 2022 | | 2021 |
| Operating lease expense: | Operating lease expense: | | | | | | | |
| Operating lease expense | |
| Operating lease expense | |
| Operating lease expense | Operating lease expense | Selling, general and administrative expenses | | $ | 4,974 | | | $ | 5,736 | | | $ | 6,624 | |
| Operating lease expense | Operating lease expense | Cost of operations | | 1,077 | | | — | | | — | |
| Short-term lease expense | Short-term lease expense | Selling, general and administrative expenses | | $ | 3,541 | | | $ | 1,960 | | | $ | 6,575 | |
Variable lease expense (1) | Variable lease expense (1) | Selling, general and administrative expenses | | 385 | | | 1,973 | | | 2,349 | |
| Total operating lease expense | Total operating lease expense | | | $ | 9,977 | | | $ | 9,669 | | | $ | 15,548 | |
| | Finance lease expense: | Finance lease expense: | | | |
| Finance lease expense: | |
| Finance lease expense: | |
| Amortization of right-of-use assets | |
| Amortization of right-of-use assets | |
| Amortization of right-of-use assets | Amortization of right-of-use assets | Cost of operations | | $ | 3,510 | | | $ | 2,061 | | | $ | 13 | |
| Interest on lease liabilities | Interest on lease liabilities | Interest expense | | 2,502 | | | 2,452 | | | 14 | |
| Total finance lease expense | Total finance lease expense | | | $ | 6,012 | | | $ | 4,513 | | | $ | 27 | |
| Sublease income (2) | Sublease income (2) | Other – net | | $ | (86) | | | $ | (86) | | | $ | (67) | |
Sublease income (2) | |
Sublease income (2) | |
| Net lease cost | Net lease cost | | | $ | 15,903 | | | $ | 14,096 | | | $ | 15,508 | |
(1) Variable lease expense primarily consists of common area maintenance expenses paid directly to lessors of real estate leases.
(2) Sublease income excludes rental income from owned properties, which is not material.
Other information related to leases is as follows:
| | | | | | | | | | | | | | | | | |
| Year ended December 31, |
| (in thousands) | 2021 | | 2020 | | 2019 |
| Cash paid for amounts included in the measurement of lease liabilities: | | | | | |
| Operating cash flows from operating leases | $ | 5,614 | | | $ | 5,603 | | | $ | 6,578 | |
| Operating cash flows from finance leases | 2,502 | | | 2,452 | | | 14 | |
| Financing cash flows from finance leases | 2,366 | | | (13) | | | (12) | |
| | | | | | | | | | | | | | | | | |
| Year ended December 31, |
| (in thousands) | 2023 | | 2022 | | 2021 |
| Cash paid for amounts included in the measurement of lease liabilities: | | | | | |
| Operating cash flows - operating leases | $ | 6,467 | | | $ | 6,725 | | | $ | 5,580 | |
| Operating cash flows - finance leases | 2,235 | | | 2,371 | | | 2,502 | |
| Financing cash flows - finance leases | 1,195 | | | 2,435 | | | 2,366 | |
| | (in thousands) | (in thousands) | December 31, 2021 | | December 31, 2020 | (in thousands) | December 31, 2023 | | December 31, 2022 |
| Right-of-use assets obtained in exchange for lease liabilities: | Right-of-use assets obtained in exchange for lease liabilities: | | | |
| Operating leases | Operating leases | $ | 24,886 | | | $ | 2,629 | |
| Operating leases | |
| Operating leases | |
| Finance leases | Finance leases | $ | 3,608 | | | $ | 146 | |
| | Weighted-average remaining lease term: | Weighted-average remaining lease term: | |
| Weighted-average remaining lease term: | |
| Weighted-average remaining lease term: | |
| Operating leases (in years) | |
| Operating leases (in years) | |
| Operating leases (in years) | Operating leases (in years) | 13.6 | | 3.1 | 12.2 | | 13.2 |
| Finance leases (in years) | Finance leases (in years) | 12.7 | | 13.9 | Finance leases (in years) | 11.0 | | 12.0 |
| Weighted-average discount rate: | Weighted-average discount rate: | |
| Operating leases | Operating leases | 8.24 | % | | 9.26 | % |
| Operating leases | |
| Operating leases | | 8.3 | % | | 8.3 | % |
| Finance leases | Finance leases | 7.93 | % | | 8.00 | % | Finance leases | 8.0 | % | | 8.0 | % |
Amounts relating to leases wereare presented on ourin the Consolidated Balance Sheets in the following line items:
| | (in thousands) | (in thousands) | |
| Assets: | |
| Assets: | |
| Assets: | Assets: | Classification | December 31, 2021 | | December 31, 2020 | Classification | December 31, 2023 | | December 31, 2022 |
| Operating lease assets | Operating lease assets | Right-of-use assets | $ | 30,163 | | | $ | 10,814 | |
| Finance lease assets | Finance lease assets | Net property, plant and equipment, and finance lease | 28,575 | | | 28,477 | |
| Total non-current lease assets | Total non-current lease assets | | $ | 58,738 | | | $ | 39,291 | |
| | Liabilities: | Liabilities: | |
| Liabilities: | |
| Liabilities: | |
| Current | Current | |
| Current | |
| Current | |
| Operating lease liabilities | |
| Operating lease liabilities | |
| Operating lease liabilities | Operating lease liabilities | Operating lease liabilities | $ | 3,950 | | | $ | 3,995 | |
| Finance lease liabilities | Finance lease liabilities | Financing lease liabilities | 2,445 | | | 886 | |
| Non-current | Non-current | |
| Operating lease liabilities | Operating lease liabilities | Non-current operating lease liabilities | 26,685 | | | 7,031 | |
| Operating lease liabilities | |
| Operating lease liabilities | |
| Finance lease liabilities | Finance lease liabilities | Non-current finance lease liabilities | 29,369 | | | 29,690 | |
| Total lease liabilities | Total lease liabilities | | $ | 62,449 | | | $ | 41,602 | |
Future minimum lease payments required including the future minimum lease payments resulting from the September 30, 2021 acquisition of Fosler Construction, under non-cancellable leases as of December 31, 2021 were2023 are as follows: | | | | | | | | | | | | | | | | | |
| (in thousands) | Operating Leases | | Finance Leases | | Total |
| 2022 | $ | 6,209 | | | $ | 4,833 | | | $ | 11,042 | |
| 2023 | 4,975 | | | 3,459 | | | 8,434 | |
| 2024 | 3,889 | | | 3,525 | | | 7,414 | |
| 2025 | 2,890 | | | 3,552 | | | 6,442 | |
| 2026 | 2,548 | | | 3,623 | | | 6,171 | |
| Thereafter | 32,264 | | | 32,481 | | | 64,745 | |
| Total | $ | 52,775 | | | $ | 51,473 | | | $ | 104,248 | |
| Less imputed interest | (22,140) | | | (19,659) | | | (41,799) | |
| Lease liability | $ | 30,635 | | | $ | 31,814 | | | $ | 62,449 | |
| | | | | | | | | | | | | | | | | |
| (in thousands) | Operating Leases | | Finance Leases | | Total |
| 2024 | $ | 6,085 | | | $ | 3,501 | | | $ | 9,586 | |
| 2025 | 4,781 | | | 3,527 | | | 8,308 | |
| 2026 | 4,021 | | | 3,597 | | | 7,618 | |
| 2027 | 3,342 | | | 3,660 | | | 7,002 | |
| 2028 | 2,748 | | | 3,715 | | | 6,463 | |
| Thereafter | 27,101 | | | 23,866 | | | 50,967 | |
| Total | $ | 48,078 | | | $ | 41,866 | | | $ | 89,944 | |
| Less imputed interest | (18,796) | | | (14,293) | | | (33,089) | |
| Lease liability | $ | 29,282 | | | $ | 27,573 | | | $ | 56,855 | |
NOTE 11 –12– ACCRUED WARRANTY EXPENSE
We may offer assurance type warranties on products and services we sell.sold to customers. Changes in the carrying amount of our accrued warranty expense are as follows:
| | Year ended December 31, |
| Year ended December 31, | | | Year ended December 31, |
| (in thousands) | (in thousands) | 2021 | | 2020 | (in thousands) | 2023 | | 2022 |
| Balance at beginning of period | Balance at beginning of period | $ | 25,399 | | | $ | 33,376 | |
| Additions | Additions | 7,470 | | | 11,912 | |
| Expirations and other changes | Expirations and other changes | (7,808) | | | (8,391) | |
| Payments | Payments | (12,206) | | | (13,916) | |
| Translation and other | Translation and other | 70 | | | 2,418 | |
| Balance at end of period | Balance at end of period | $ | 12,925 | | | $ | 25,399 | |
We accruerecord estimated expense included in costCost of operations on our in the Consolidated Statements of Operations to satisfy contractual warranty requirements when we recognize the associated revenues on the related contracts, or in the case of a loss contract, the full amount of the estimated warranty costs is accruedrecorded when the contract becomes a loss contract. In addition, we record
record specific provisions or reductions whereadjustments when we expect the actual warranty costs to significantly differ from the accruedinitial estimates. Such changes could have a material effect on our consolidated financial condition,position, results of operations and cash flows.
NOTE 1213 – RESTRUCTURING ACTIVITIES
The CompanyWe incurred restructuring charges in 2021, 20202023, 2022 and 2019.2021. The charges primarily consist of severance and related costs toassociated with non-recurring actions taken including as part of the Company’s strategic, market-focused organizationalto transform our operations with impacts on employees and re-branding initiative.facilities used in our businesses. During 2021, and 2020, these charges also include actions taken to address the impact of COVID-19 on our business.
The following tables summarizes the restructuring activity incurred by segment:
| | Year ended December 31, |
| 2021 |
| Year ended December 31, | | | Year ended December 31, |
| 2023 | | | 2023 |
| (in thousands) | (in thousands) | Total | Severance and related costs | Other (1) | (in thousands) | Total | Severance and related costs | Other |
| B&W Renewable segment | B&W Renewable segment | $ | 1,876 | | $ | 1,732 | | $ | 144 | |
| B&W Environmental segment | B&W Environmental segment | 430 | | 360 | | 70 | |
| B&W Thermal segment | B&W Thermal segment | 2,207 | | 1,734 | | 473 | |
| Corporate | Corporate | 356 | | 213 | | 143 | |
| $ | |
| | $ | 4,869 | | $ | 4,039 | | $ | 830 | |
| Cumulative costs to date | $ | 45,183 | | 37,252 | | 7,931 | |
|
(1) Other amounts consist primarily of exit, relocation, COVID-19 related and other costs.
| | Year ended December 31, |
| 2020 |
| Year ended December 31, | | | Year ended December 31, |
| 2022 | | | 2022 |
| (in thousands) | (in thousands) | Total | Severance and related costs | Other (1) | (in thousands) | Total | Severance and related costs | Other |
| B&W Renewable segment | B&W Renewable segment | $ | 5,926 | | $ | 4,537 | | $ | 1,389 | |
| B&W Environmental segment | B&W Environmental segment | 745 | | 293 | | 452 | |
| B&W Thermal segment | B&W Thermal segment | 4,725 | | 1,962 | | 2,763 | |
| Corporate | Corporate | 453 | | (52) | | 505 | |
| $ | 11,849 | | $ | 6,740 | | $ | 5,109 | |
| $ | |
(1) Other amounts consist primarily of exit, relocation, COVID-19 related and other costs.
| | Year ended December 31, |
| 2019 |
| Year ended December 31, | | | Year ended December 31, |
| 2021 | | | 2021 |
| (in thousands) | (in thousands) | Total | Severance and related costs | Other (1) | (in thousands) | Total | Severance and related costs | Other |
| B&W Renewable segment | B&W Renewable segment | $ | 2,233 | | $ | 2,176 | | $ | 57 | |
| B&W Environmental segment | B&W Environmental segment | 2,000 | | 1,888 | | 112 | |
| B&W Thermal segment | B&W Thermal segment | 3,040 | | 2,791 | | 249 | |
| Corporate | Corporate | 4,434 | | 3,566 | | 868 | |
| $ | 11,707 | | $ | 10,421 | | $ | 1,286 | |
| $ | |
(1) Other amounts consist primarily of exit, relocation and other costs.
Restructuring liabilities primarily related to severance payments are included in otherOther accrued liabilitieson ourin the Consolidated Balance Sheets. Activity related to the restructuring liabilities is as follows:
| | | Year ended December 31, |
| | | | Year ended December 31, | |
| | | | Year ended December 31, | |
| | | | Year ended December 31, | |
| (in thousands) | (in thousands) | | 2021 | | 2020 | (in thousands) | | | | | | | 2023 | | 2022 |
Balance at beginning of period | Balance at beginning of period | | $ | 8,146 | | | $ | 5,359 | |
| Restructuring expense | Restructuring expense | | 4,869 | | | 11,849 | |
| Payments | Payments | | (6,454) | | | (9,062) | |
| Balance at end of period | Balance at end of period | | $ | 6,561 | | | $ | 8,146 | |
The payments shown above for the years ended December 31, 2021 and 2020 relate primarily to severance. Accrued restructuring liabilities at December 31, 2021 and 2020 relate primarily to employee termination benefits.
NOTE 1314 – PENSION PLANS AND OTHER POSTRETIREMENT BENEFITS
We have historically provided defined benefit retirement benefits to domestic employees under the Retirement Plan for Employees of Babcock & Wilcox Commercial Operations (the “U.S. Plan”"U.S. Plan"), a noncontributory plan. As of 2006, the U.S. Plan was closed to new salaried plan entrants. Effective December 31, 2015, benefit accruals for those salaried employees covered by, and continuing to accrue service and salary adjusted benefits under the U.S. Plan, ceased. As of December 31, 2021,2023, and 2020, approximately 732022, 68 and 8572 hourly union employees continue to accrue benefits under the U.S. Plan for the respective years.
Effective January 1, 2012, a defined contribution component was adopted applicable to Babcock & Wilcox Canada, Ltd. (the “Canadian Plans”"Canadian Plans"). Any employee with less than two years of continuous service as of December 31, 2011 was required to enroll in the defined contribution component of the Canadian Plans as of January 1, 2012 or upon the completion of 6 months of continuous service, whichever iswas later. These and future employees willare not be eligible to enroll in the defined benefit component of the Canadian Plans. In 2014,Effective January 1, 2015, benefit accruals under certain hourly Canadian pension plans were ceased with an effective date of January 1, 2015.ceased. As part of the spin-off transaction, we split the Canadian defined benefit plans from BWXT, which was completed in 2017. We did not present these plans as multi-employer plans because our portion was separately identifiable, and we were able to assess the assets, liabilities and periodic expense in the same manner as if it were a separate plan in each period.
We also sponsor the Diamond Power Specialty Limited Retirement Benefits Plan (the “U.K. Plan”"U.K. Plan") through oura subsidiary. BenefitEffective November 30, 2015, benefit accruals under this plan ceased effective November 30, 2015.ceased. We have accounted for the GMP equalizationGuaranteed Minimum Pension Equalization following the U.K. High Court ruling during the fourth quarter of 2018 by recording prior service cost in accumulated other comprehensive income that will be amortized through net periodic pension cost over 15 years, ending December 31, 2033.
We do not provide retirement benefits to certain non-resident alien employees of foreign subsidiaries. Retirement benefits for salaried employees who accrue benefits in a defined benefit plan are based on final average compensation and years of service, while benefits for hourly paid employees are based on a flat benefit rate and years of service. Our funding policy is to fund the plans as recommended by the respective plan actuaries and in accordance with the Employee Retirement Income Security Act of 1974, as amended, or other applicable law. Funding provisions under the Pension Protection Act accelerate funding requirements to ensure full funding of benefits accrued.
We make available other benefits which includeincluding postretirement health care and life insurance benefits to certain salaried and union retirees based on their union contracts, and on a limited basis, to future retirees.
Obligations and funded status | | Pension Benefits
Year Ended December 31, | Other Benefits
Year Ended December 31, |
| Pension Benefits
Year Ended December 31, | | | Pension Benefits
Year Ended December 31, | Other Benefits
Year Ended December 31, |
| (in thousands) | (in thousands) | 2021 | 2020 | 2021 | 2020 | (in thousands) | 2023 | 2022 | 2023 | 2022 |
| Change in benefit obligation: | Change in benefit obligation: | |
| Benefit obligation at beginning of period | |
| Benefit obligation at beginning of period | |
| Benefit obligation at beginning of period | Benefit obligation at beginning of period | $ | 1,284,019 | | $ | 1,218,968 | | $ | 11,802 | | $ | 12,134 | |
| Service cost | Service cost | 781 | | 792 | | 22 | | 19 | |
| Interest cost | Interest cost | 22,559 | | 33,267 | | 145 | | 288 | |
| Plan participants’ contributions | Plan participants’ contributions | — | | — | | 155 | | 160 | |
| Amendments | 676 | | — | | — | | — | |
| Actuarial (gain) loss | (28,815) | | 108,623 | | (153) | | 478 | |
| Actuarial loss (gain) | |
| Foreign currency exchange rate changes | Foreign currency exchange rate changes | 165 | | 1,615 | | 3 | | 33 | |
| Benefits paid | Benefits paid | (79,540) | | (79,246) | | (1,602) | | (1,310) | |
| Benefit obligation at end of period | Benefit obligation at end of period | $ | 1,199,845 | | $ | 1,284,019 | | $ | 10,372 | | $ | 11,802 | |
| Change in plan assets: | Change in plan assets: | |
| Fair value of plan assets at beginning of period | |
| Fair value of plan assets at beginning of period | |
| Fair value of plan assets at beginning of period | Fair value of plan assets at beginning of period | $ | 1,047,646 | | $ | 974,117 | | $ | — | | $ | — | |
| Actual return on plan assets | Actual return on plan assets | 42,954 | | 148,100 | | — | | — | |
| Employer contribution | Employer contribution | 26,158 | | 2,892 | | 1,447 | | 1,150 | |
| Plan participants' contributions | Plan participants' contributions | — | | — | | 155 | | 160 | |
| Foreign currency exchange rate changes | Foreign currency exchange rate changes | 17 | | 1,783 | | — | | — | |
| Benefits paid | Benefits paid | (79,540) | | (79,246) | | (1,602) | | (1,310) | |
| Fair value of plan assets at the end of period | Fair value of plan assets at the end of period | 1,037,235 | | 1,047,646 | | — | | — | |
| Funded status | Funded status | $ | (162,610) | | $ | (236,373) | | $ | (10,372) | | $ | (11,802) | |
| | Amounts recognized in the balance sheet consist of: | Amounts recognized in the balance sheet consist of: | |
| Amounts recognized in the balance sheet consist of: | |
| Amounts recognized in the balance sheet consist of: | |
| Accrued employee benefits | |
| Accrued employee benefits | |
| Accrued employee benefits | Accrued employee benefits | $ | (1,162) | | $ | (1,163) | | $ | (1,297) | | $ | (1,399) | |
| Accumulated postretirement benefit obligation | Accumulated postretirement benefit obligation | — | | — | | (9,075) | | (10,403) | |
| Pension liability | Pension liability | (173,655) | | (241,889) | | — | | — | |
| Prepaid pension | Prepaid pension | 12,207 | | 6,679 | | — | | — | |
| Accrued benefit liability, net | Accrued benefit liability, net | $ | (162,610) | | $ | (236,373) | | $ | (10,372) | | $ | (11,802) | |
| | Amount recognized in accumulated comprehensive income (before taxes): | Amount recognized in accumulated comprehensive income (before taxes): | |
| Amount recognized in accumulated comprehensive income (before taxes): | |
| Amount recognized in accumulated comprehensive income (before taxes): | |
| Prior service cost | |
| Prior service cost | |
| Prior service cost | Prior service cost | $ | 1,146 | | $ | 557 | | $ | 2,355 | | $ | 3,046 | |
| | Supplemental information: | Supplemental information: | |
| Supplemental information: | |
| Supplemental information: | |
| Plans with accumulated benefit obligation in excess of plan assets | Plans with accumulated benefit obligation in excess of plan assets | |
| Plans with accumulated benefit obligation in excess of plan assets | |
| Plans with accumulated benefit obligation in excess of plan assets | |
| Projected benefit obligation | |
| Projected benefit obligation | |
| Projected benefit obligation | Projected benefit obligation | $ | 1,141,706 | | $ | 1,219,129 | | $ | — | | $ | — | |
| Accumulated benefit obligation | Accumulated benefit obligation | $ | 1,141,706 | | $ | 1,219,129 | | $ | 10,372 | | $ | 11,802 | |
| Fair value of plan assets | Fair value of plan assets | $ | 966,889 | | $ | 976,078 | | $ | — | | $ | — | |
| Plans with plan assets in excess of accumulated benefit obligation | Plans with plan assets in excess of accumulated benefit obligation | |
| Projected benefit obligation | Projected benefit obligation | $ | 58,139 | | $ | 64,890 | | $ | — | | $ | — | |
| Projected benefit obligation | |
| Projected benefit obligation | |
| Accumulated benefit obligation | Accumulated benefit obligation | $ | 58,139 | | $ | 64,890 | | $ | — | | $ | — | |
| Fair value of plan assets | Fair value of plan assets | $ | 70,346 | | $ | 71,568 | | $ | — | | $ | — | |
Components of net periodic benefit cost (benefit) included in net (loss) income (loss) are as follows:
| | Pension Benefits | | Other Benefits |
| Year ended December 31, | | Year ended December 31, |
| Pension Benefits | | | Pension Benefits | | Other Benefits |
| Year ended December 31, | | | Year ended December 31, |
| (in thousands) | (in thousands) | 2021 | | 2020 | | 2019 | | 2021 | | 2020 | | 2019 | (in thousands) | 2023 | | 2022 | | 2021 | | 2023 | | 2022 | | 2021 |
| Interest cost | Interest cost | $ | 22,559 | | | $ | 33,267 | | | $ | 43,312 | | | $ | 145 | | | $ | 288 | | | $ | 424 | |
| Expected return on plan assets | Expected return on plan assets | (56,154) | | | (61,322) | | | (55,717) | | | — | | | — | | | — | |
| Amortization of prior service cost (credit) | 97 | | | 97 | | | 142 | | | 691 | | | (1,084) | | | (2,157) | |
| Recognized net actuarial (gain) loss | (15,327) | | | 22,676 | | | (7,603) | | | (153) | | | 478 | | | (1,201) | |
| Amortization of prior service cost | |
| Recognized net actuarial loss (gain) | |
Benefit plans, net (1) | Benefit plans, net (1) | (48,825) | | | (5,282) | | | (19,866) | | | 683 | | | (318) | | | (2,934) | |
Service cost included in COS (2) | Service cost included in COS (2) | 781 | | | 792 | | | 778 | | | 22 | | | 19 | | | 15 | |
| Net periodic benefit cost (benefit) | Net periodic benefit cost (benefit) | $ | (48,044) | | | $ | (4,490) | | | $ | (19,088) | | | $ | 705 | | | $ | (299) | | | $ | (2,919) | |
(1) Benefit plans, net,, which is presented separately in our Consolidated Statements of Operations, is not allocated to the segments.
(2) Service cost related to a small group of active participants is presented within costCost of operations in ourthe Consolidated Statement of Operations and is allocated to the B&W Thermal segment.
Recognized net actuarial gainloss (gain) consists primarily of our reported actuarial loss/gain and the difference between the actual return on plan assets and the expected return on plan assets. Total net mark to market (“MTM”)MTM adjustments for our pension and other postretirement benefit plans were losses (gains) losses of $(15.5)$38.0 million, $23.2$(7.7) million and $(8.8)$(15.5) million in the years ended, December 31, 2021, 20202023, 2022 and 2019,2021, respectively. The recognized net actuarial loss (gain) loss was recorded in benefitBenefit plans, net in ourthe Consolidated Statements of Operations.
Assumptions | | | | Pension Benefits | | Other Benefits | | Pension Benefits | | Other Benefits |
| Year ended December 31, | | Year ended December 31, |
| Year ended December 31, | | | Year ended December 31, |
| | | 2021 | 2020 | 2019 | | 2021 | 2020 | 2019 | | 2023 | 2022 | 2021 | | 2023 | 2022 | 2021 |
| Weighted average assumptions used to determine net periodic benefit obligations: | Weighted average assumptions used to determine net periodic benefit obligations: | | | |
| Comparative single equivalent discount rate | |
| Comparative single equivalent discount rate | |
| Comparative single equivalent discount rate | Comparative single equivalent discount rate | 2.81% | 2.50% | 3.25% | | 2.50% | 1.97% | 2.99% | 5.02% | 5.35% | 2.81% | | 4.94% | 5.28% | 2.50% |
| Rate of compensation increase | Rate of compensation increase | 0.07% | 0.08% | 0.07% | | — | Rate of compensation increase | 0.07% | 0.06% | 0.07% | | — | — |
| Weighted average assumptions used to determine net periodic benefit cost: | Weighted average assumptions used to determine net periodic benefit cost: | |
| Comparative single equivalent discount rate | Comparative single equivalent discount rate | 2.52% | 3.23% | 4.28% | | 2.50% | 1.97% | 2.99% |
| Comparative single equivalent discount rate | |
| Comparative single equivalent discount rate | | 5.39% | 2.88% | 2.52% | | 4.94% | 5.28% | 2.50% |
| Expected return on plan assets | Expected return on plan assets | 5.76% | 6.63% | 6.66% | | — | Expected return on plan assets | 6.37% | 5.90% | 5.76% | | — | — |
| Rate of compensation increase | Rate of compensation increase | 0.07% | 0.08% | 0.07% | | — | Rate of compensation increase | 0.07% | 0.06% | 0.07% | | — | — |
The expected rate of return on plan assets is based on the long-term expected returns for the investment mix of assets currently in the portfolio. In setting this rate, we use a building-block approach. Historic real return trends for the various asset classes in the plan's portfolio are combined with anticipated future market conditions to estimate the real rate of return for each asset class. These rates are then adjusted for anticipated future inflation to determine estimated nominal rates of return for each asset class. The expected rate of return on plan assets is determined to be the weighted average of the nominal returns based on the weightings of the asset classes within the total asset portfolio. We use an expected return on plan assets assumption of 6%6.5% for the majority of our pension plan assets (approximately 93% of our total pension assets at December 31, 2021)2023).
Sensitivity
The following sensitivity analysis reflects the impact of a 25 basis point change in the assumed discount rate and return on assets on our pension plan obligations and expense for the year ended December 31, 2023:
| | | | | | | | |
| (In millions) | 0.25% increase | 0.25% decrease |
Discount rate: | | |
Effect on ongoing net periodic benefit cost (1) | $ | (18.6) | | $ | 19.3 | |
| Effect on projected benefit obligation | (20.1) | | 20.9 | |
| Return on assets: | | |
| Effect on ongoing net periodic benefit cost | (1.8) | | 1.8 | |
(1) Excludes effect of annual MTM adjustment.
A 25 basis point change in the assumed discount rate and return on assets would have no meaningful impact on our other postretirement benefit plan obligations and expense for the year ended December 31, 2023 individually or in the aggregate, excluding the impact of any annual MTM adjustments we record annually.
Investment goals
The overall investment strategy of the pension trusts is to achieve long-term growth of principal, while avoiding excessive risk and to minimize the probability of loss of principal over the long term. The specific investment goals that have beenwe set
for the pension trusts in the aggregate are (1) to ensure that plan liabilities are met when due and (2) to achieve an investment return on trust assets consistent with a reasonable level of risk.
Allocations to each asset class for both domestic and foreign plans are reviewed periodically and rebalanced, if appropriate, to assure the continued relevance of the goals, objectives and strategies. The pension trusts for both our domestic and foreign plans employ a professional investment advisor and a number of professional investment managers whose individual benchmarks are, in the aggregate, consistent with the plans' overall investment objectives. The goals of each investment manager are (1) to meet (in the case of passive accounts) or exceed (for actively managed accounts) the benchmark selected and agreed upon by the manager and the trust and (2) to display an overall level of risk in its portfolio that is consistent with the risk associated with the agreed upon benchmark.
The investment performance of total portfolios, as well as asset class components, is periodically measured against commonly accepted benchmarks, including the individual investment manager benchmarks. In evaluating investment manager performance, consideration is also given to personnel, strategy, research capabilities, organizational and business matters, adherence to discipline and other qualitative factors that may impact the ability to achieve desired investment results.
Domestic plans:We sponsor the U.S. Plan, which is a domestic defined benefit plan. The assets of this plan are held by the Trustee in The Babcock & Wilcox Company Master Trust (the “Master Trust”"Master Trust"). For the years ended December 31, 20212023 and 2020,2022, the investment return on domestic plan assets of the Master Trust (net of deductions for management fees) was approximately 4.25%4.1% and 17%(17.5)%, respectively.
The following is a summary of the asset allocations for the Master Trust by asset category: | | Year ended December 31, |
| 2021 | 2020 |
| Year ended December 31, | | | Year ended December 31, |
| 2023 | | | 2023 | 2022 |
| Asset category: | Asset category: | |
| Commingled and mutual funds | — | % | 41 | % |
| United States government securities | |
| United States government securities | |
| United States government securities | United States government securities | 17 | % | 16 | % | 16 | % | 12 | % |
| Corporate stocks | Corporate stocks | 8 | % | 5 | % | Corporate stocks | 2 | % | 6 | % |
| Private credit | | Private credit | 39 | % | — | % |
| Venture capital | Venture capital | 40 | % | 18 | % | Venture capital | — | % | 42 | % |
| Hedge funds | Hedge funds | 30 | % | 13 | % | Hedge funds | 32 | % | 27 | % |
| Cash and accrued items | 5 | % | 7 | % |
| Cash and cash equivalents | | Cash and cash equivalents | 11 | % | 13 | % |
The target asset allocation for the Master Trust as of December 31, 20212023 and 2022 was 50% of alternative, liquid credit and direct lending funds, 20% of fixed income securities, and 30% of equity and other investments. As of December 31, 2020, the target allocation was 54% of alternative, liquid credit and direct lending funds, 22% of fixed income securities, and 24% of equity and other investments. We routinely reassess the target asset allocation with a goal of better aligning the timing of expected cash flows from those assets to the anticipated timing of benefit payments.
Foreign plans: We sponsor various plansthe Canadian Plans and the U.K. Plan through certain of our foreign subsidiaries. These plans are the Canadian Plans and the U.K. Plan. The combined weighted average asset allocations of these plans by asset category were as follows: | | | | | | | | |
| Year ended December 31, |
| 2021 | 2020 |
| Asset category: | | |
| Commingled and mutual funds | 30 | % | 35 | % |
| Fixed income | 67 | % | 62 | % |
| Other | 3 | % | 3 | % |
| | | | | | | | |
| Year ended December 31, |
| 2023 | 2022 |
| Asset category: | | |
| Commingled and mutual funds | 23 | % | 24 | % |
| Fixed income | 76 | % | 72 | % |
| Other | 1 | % | 4 | % |
The target allocation for 20212023 for the foreign plans, by asset class, is as follows: | | | | | | | | |
| Canadian
Plans | U.K. Plan |
| Asset class: | | |
| United States equity | 25 | % | 3 | % |
| Global equity | 25 | % | 4 | % |
| Fixed income and other | 50 | % | 93 | % |
Fair value of plan assets
See Note 2422 for a detailed description of fair value measurements and the hierarchy established for valuation inputs. In accordance with Subtopic 820-10,ASC 820, Fair Value Measurement and Disclosures,, certain investments that are measured at fair value using the net asset value ("NAV") per share practical expedient have not been classified in the fair value hierarchy. The investments that are measured at fair value using NAV per share included in the tables below are intended to permit reconciliation of the fair value hierarchy to the fair value of plan assets at the end of each period, which is presented in the first table above titled “obligations“Obligations and funded status”. The following is a summary of total investments forof our plans measured at fair value:
| | | | | | | | | | | | | | |
| (in thousands) | Year ended December 31, 2021 | Level 1 | Level 2 | Level 3 |
| Commingled and mutual funds | $ | 22,261 | | $ | — | | $ | 22,261 | | $ | — | |
| United States government securities | 167,328 | | 167,328 | | — | | — | |
| Fixed income | 65,370 | | 15,196 | | 47,309 | | 2,865 | |
| Equity | 80,299 | | 74,888 | | 5,243 | | 168 | |
| Venture capital | 236,730 | | — | | — | | 236,730 | |
| Hedge fund | 80,711 | | — | | — | | 80,711 | |
| Cash and accrued items | 30,130 | | 30,130 | | — | | — | |
| Investments measured at fair value | $ | 682,829 | | $ | 287,542 | | $ | 74,813 | | $ | 320,474 | |
| Investments measured at net asset value | 349,798 | | | | |
| Pending trades | 4,608 | | | | |
| Total pension and other postretirement benefit assets | $ | 1,037,235 | | | | |
| | | | | | | | | | | | | | |
| (in thousands) | Year ended December 31, 2023 | Level 1 | Level 2 | Level 3 |
| Commingled and mutual funds | $ | 11,168 | | $ | — | | $ | 11,168 | | $ | — | |
| United States government securities | 106,232 | | 106,232 | | — | | — | |
| Fixed income | 65,821 | | 10,689 | | 36,305 | | 18,827 | |
| Equity | 13,472 | | 13,090 | | — | | 382 | |
| Private credit | 235,198 | | — | | — | | 235,198 | |
| Private equity | 4,176 | | — | | — | | 4,176 | |
| Hedge fund | 85,363 | | — | | — | | 85,363 | |
| Cash and accrued items | 43,634 | | 43,634 | | — | | — | |
| Investments measured at fair value | $ | 565,064 | | $ | 173,645 | | $ | 47,473 | | $ | 343,946 | |
| Investments measured at net asset value | 165,689 | | | | |
| Pending trades | (153) | | | | |
| Total pension and other postretirement benefit assets | $ | 730,600 | | | | |
| | | | | | | | | | | | | | |
| (in thousands) | Year ended December 31, 2022 | Level 1 | Level 2 | Level 3 |
| Commingled and mutual funds | $ | 12,020 | | $ | — | | $ | 12,020 | | $ | — | |
| United States government securities | 83,948 | | 83,948 | | — | | — | |
| Fixed income | 53,258 | | 13,191 | | 32,548 | | 7,519 | |
| Equity | 41,313 | | 41,137 | | — | | 176 | |
| Venture capital | 250,344 | | — | | — | | 250,344 | |
| Hedge fund | 83,439 | | — | | — | | 83,439 | |
| Cash and accrued items | 76,257 | | 76,257 | | — | | — | |
| Investments measured at fair value | $ | 600,579 | | $ | 214,533 | | $ | 44,568 | | $ | 341,478 | |
| Investments measured at net asset value | 171,441 | | | | |
| Pending trades | (1,097) | | | | |
| Total pension and other postretirement benefit assets | $ | 770,923 | | | | |
| | | | | | | | | | | | | | |
| (in thousands) | Year ended December 31, 2020 | Level 1 | Level 2 | Level 3 |
| Commingled and mutual funds | $ | 429,101 | | $ | 402,935 | | $ | 26,166 | | $ | — | |
| United States government securities | 160,488 | | 160,488 | | — | | — | |
| Fixed income | 44,604 | | — | | 44,604 | | — | |
| Equity | 45,539 | | 45,539 | | — | | — | |
| Venture capital | 56,719 | | — | | — | | 56,719 | |
| Cash and accrued items | 69,822 | | 69,822 | | — | | — | |
| Investments measured at fair value | $ | 806,273 | | $ | 678,784 | | $ | 70,770 | | $ | 56,719 | |
| Investments measured at net asset value | 241,568 | | | | |
| Pending trades | (195) | | | | |
| Total pension and other postretirement benefit assets | $ | 1,047,646 | | | | |
Expected cash flows | | Domestic Plans | | Foreign Plans |
| Domestic Plans | | | Domestic Plans | | Foreign Plans |
| (in thousands) | (in thousands) | Pension
Benefits | Other
Benefits | | Pension
Benefits | Other
Benefits | (in thousands) | Pension
Benefits | Other
Benefits | | Pension
Benefits | Other
Benefits |
| Expected employer contributions to trusts of defined benefit plans: | Expected employer contributions to trusts of defined benefit plans: | Expected employer contributions to trusts of defined benefit plans: |
| 2022 | $ | 2,751 | | $ | 1,148 | | | $ | 1,047 | | $ | 152 | |
| 2024 | |
Expected benefit payments (1): | Expected benefit payments (1): | |
| 2022 | 74,866 | | 1,148 | | | 2,721 | | 152 | |
| 2023 | 74,326 | | 1,053 | | | 2,720 | | 143 | |
| 2024 | |
| 2024 | |
| 2024 | 2024 | 73,639 | | 962 | | | 2,733 | | 132 | |
| 2025 | 2025 | 72,676 | | 877 | | | 2,846 | | 121 | |
| 2026 | 2026 | 71,502 | | 796 | | | 2,919 | | 114 | |
| 2027-2031 | 333,824 | | 2,935 | | | 15,124 | | 413 | |
| 2027 | |
| 2028 | |
| 2029-2033 | |
We made contributions to our pension and other postretirement benefit plans totaling $27.6$2.4 million and $4.0$5.2 million during the years ended December 31, 20212023 and 2020. Contributions made during the year ended December 31, 2021 includes $0.4 million of interest as required per the CARES Act that was signed into law on March 27, 2020.
In accordance with the American Rescue Plan Act of 2021, we elected to defer $20.9 million of the estimated Pension Plan contribution payments of $45.6 million that would have been due during 2021.2022, respectively.
Defined contribution plans
We provide benefits under The B&W Thrift Plan (the “Thrift Plan”"Thrift Plan")., after minimum service requirements are met. The Thrift Plan generally provides for matching employer contributions. Employer matching contributions are typically made in cash. Amounts charged to expense for employer contributions under the Thrift Plan total approximately $4.0 million and $3.1 million in the years ended December 31, 2023 and 2022, respectively. There were no employer contributions for the year ended December 31, 2021. Beginning in April 2020 and continuing through December 31, 2021, as part of the Company's response to the impact of the COVID-19 pandemic on its business, the Company suspended its 401(k) company match for U.S. employees. The Company resumed its employer contributions beginning in 2022 inclusive of a one-time profit sharing contribution for the 2021 plan year equal to 0.75% of the eligible employees' base pay. Employer matching contributions are typically made in cash. Amounts charged to expense for employer contributions under the Thrift Plan totaled approximately $0.0 million, $1.0 million and $3.1 million in the years ended December 31, 2021, 2020 and 2019, respectively.
Also, our salaried Canadian employees are provided witheligible to participate in a defined contribution plan.plan, after minimum service requirements are met. The amount charged to expense for employer contributions was approximately $0.3 million $0.3 million and $0.3 million in each of the years ended December 31, 2021, 20202023, 2022 and 2019, respectively.2021.
Multi-employer plans
One of our subsidiaries in the B&W Thermal segment contributes to various multi-employer plans. The plans generally provide defined benefits to substantially all unionized workers in this subsidiary. The following table summarizes our contributions to multi-employer plans for the years covered by this report:ended December 31, 2023, 2022 and 2021:
| | | | | | | | | | | | | | | | | | | | | | | | | | | | | | | | | | | | | | | | | | | | | | | |
| Pension Fund | | EIN/PIN | Pension Protection
Act Zone Status | FIP/RP Status
Pending/
Implemented | Contributions | Surcharge Imposed | Expiration Date
of Collective
Bargaining
Agreement |
|
| 2021 | | 2020 | | 2019 |
| 2021 | | 2020 | | 2019 | (in millions) |
| Boilermaker-Blacksmith National Pension Trust | | 48-6168020/ 001 | Yellow | | Yellow | | Red | Yes | $ | 16.6 | | | $ | 4.0 | | | $ | 7.5 | | No | Described
Below |
| All other | | | | | | | | | 2.2 | | | 0.9 | | | 4.9 | | | |
| | | | | | | | | $ | 18.8 | | | $ | 4.9 | | | $ | 12.4 | | | |
| | | | | | | | | | | | | | | | | | | | | | | | | | | | | | | | | | | | | | | | | | | | | | | |
| (in millions) | | | Pension Protection
Act Zone Status | FIP/RP Status
Pending/
Implemented | Contributions | Surcharge Imposed | Expiration Date
Of Collective
Bargaining
Agreement |
| | |
| Pension Fund | | EIN/PIN | 2023 | | 2022 | | 2021 | 2023 | | 2022 | | 2021 |
| Boilermaker-Blacksmith National Pension Trust | | 48-6168020/ 001 | Red | | Yellow | | Yellow | Yes | $ | 13.4 | | | $ | 8.0 | | | $ | 16.6 | | No | Described
Below |
| All other | | | | | | | | | 1.2 | | | 1.0 | | | 2.2 | | | |
| | | | | | | | | $ | 14.6 | | | $ | 9.0 | | | $ | 18.8 | | | |
| | | | | | | | | | | | | | | |
Our collective bargaining agreements with the Boilermaker-Blacksmith National Pension Trust (the “Boilermaker Plan”("Boilermaker Plan") is under a National Maintenance Agreement platform which is evergreen in terms of expiration. However, the agreement allows for termination by either party with a 90-day written notice. Our contributions to the Boilermaker Plan constitute less than 5% of
total contributions to the Boilermaker Plan. All other contributions expense for all periods included in this reportabove represents multiple amounts to various plans that, individually, are deemed to be insignificant.
NOTE 15- DEBT AND CREDIT FACILITIES
NOTE 14 – 2021 SENIOR NOTES OFFERINGS8.125%Senior Notes
8.125% Senior Notes
On February 12,During 2021, we completed a public offeringsales of $125.0$151.2 million aggregate principal amount of our 8.125% senior notes due 2026 (the “8.125% Senior Notes”)Notes for net proceeds of approximately $120.0$146.6 million.
In addition to the public offering,completed sales, we issued $35.0 million of the 8.125% Senior Notes to B. Riley Financial, Inc., a related party, in exchange for a deemed prepayment of our existingthen-existing Last Out Term Loan Tranche A-3A-3. The 8.125% Senior Notes bear interest at the rate of 8.125% per annum, payable quarterly in a concurrent private offering.arrears on January 31, April 30, July 31 and October 31 of each year. The 8.125% Senior Notes mature on February 28, 2026.
OnIn March 31, 2021, we entered into a sales agreement with B. Riley Securities, Inc., a related party, in which we may sell to or through B. Riley Securities, Inc., from time to time, additional 8.125% Senior Notes up to an aggregate principal amount of $150.0 million. The 8.125% Senior Notes have the same terms as (other than date of issuance), form a single series of debt securities with and have the same CUSIP number and beare fungible with the initial 8.125% Senior Notes issuance in 2021. During the year ended December 31, 2022, we sold $6.8 million aggregate principal of the 8.125% Senior Notes issued February 12, 2021, as described above.
As of December 31, 2021, the Company has sold $26.2 million aggregate principal amount of 8.125% Senior Notes under thethis sales agreement for $26.6$6.7 million of net proceeds.
The 8.125% Senior Notes are senior unsecured obligations of the Company and rank equally in right of payment with all of the Company’sour other existing and future senior unsecured and unsubordinated indebtedness.
6.50%Senior Notes
During 2021, we completed sales of $151.4 million aggregate principal amount of our 6.50% Senior Notes for net proceeds of $145.8 million. The 8.125%6.50% Senior Notes bear interest at the rate of 8.125%6.50% per annum. Interest on the 8.125% Senior Notes isannum, payable quarterly in arrears on JanuaryMarch 31, AprilJune 30, July 31September 30 and OctoberDecember 31 of each year, commencing on April 30, 2021.year. The 8.125%6.50% Senior Notes mature on February 28,December 31, 2026.
6.50% Senior Notes.
On December 13, 2021, we completed a public offering of $140.0 million aggregate principal amount of our 6.50% senior notes due 2026 (the “6.50% Senior Notes”) and a subsequent exercise of $11.4 million aggregate principal of our 6.50% senior notes due 2026 by the underwriters was completed on December 30, 2021. At the completion of the offerings, we received net proceeds of approximately $145.8 million.
The public offering of our 6.50% Senior Notes was conducted pursuant to an underwriting agreement dated December 8, 2021, between us and B. Riley Securities, Inc., an affiliate of B. Riley, a related party, as representative of several underwriters.
The 6.50% Senior Notes are senior unsecured obligations of the Company and rank equally in right of payment with all of the Company’sour other existing and future senior unsecured and unsubordinated indebtedness. The 6.50% Senior Notes are effectively subordinated in right of payment to all of the Company’sour existing and future secured indebtedness and structurally subordinated to all existing and future indebtedness of the Company’sour subsidiaries, including trade payables. The 6.50% Senior Notes bear interest at the rate of 6.50% per annum. Interest on the 6.50% Senior Notes is payable quarterly in arrears on March 31, June 30, September 30 and December 31 of each year, commencing on March 31, 2022. The 6.50% Senior Notes will mature on December 31, 2026.
The components of the Company'sour senior notes at December 31, 20212023 are as follows:
| | Senior Notes |
| Senior Notes | | | Senior Notes |
| (in thousands) | (in thousands) | 8.125% | | 6.50% | | Total | (in thousands) | 8.125% | | 6.50% | | Total |
| Senior notes due 2026 | Senior notes due 2026 | $ | 186,219 | | | $ | 151,440 | | | $ | 337,659 | |
| Unamortized deferred financing costs | Unamortized deferred financing costs | (5,269) | | | (6,604) | | | (11,873) | |
| Unamortized premium | Unamortized premium | 580 | | | — | | | 580 | |
| Net debt balance | Net debt balance | $ | 181,530 | | | $ | 144,836 | | | $ | 326,366 | |
NOTE 15
– LAST OUT TERM LOANS
Revolving Debt
Effective with the new debt facilities the Company entered into onIn June 30, 2021, as described in Note 16 below, the Company has no remaining Last Out Term Loans and no further borrowings thereunder are available. The Last Out Term Loan activity is described as follows:
| | | | | | | | | | | | | | | | | | | | | | | |
| Last Out Term Loan Tranche |
| (in thousands) | A-3 | | A-4 | | A-6 | | Total |
| Balance at December 31, 2020 | $ | 113,330 | | | $ | 30,000 | | | $ | 40,000 | | | $ | 183,330 | |
| Payments in cash | (40,408) | | | (30,000) | | | (5,000) | | | (75,408) | |
| Exchange for Preferred Stock | (72,922) | | | — | | | — | | | (72,922) | |
| Exchange for 8.125% Senior Notes | — | | | — | | | (35,000) | | | (35,000) | |
| Balance at December 31, 2021 | $ | — | | | $ | — | | | $ | — | | | $ | — | |
NOTE 16 – REVOLVING DEBT
Debt Facilities
On June 30, 2021, we entered into a Revolving Credit Agreement (the “Revolving Credit Agreement”) with PNC Bank, National Association ("PNC"), as administrative agent (“PNC”) and a letter of credit agreement (the “Letter of Credit Agreement”) with PNC, pursuant to which PNC agreed to issue up to $110$110.0 million in letters of credit that is secured in part by cash collateral provided by an affiliate of MSD Partners, MSD PCOF Partners XLV, LLC (“MSD”), as well as a reimbursement, guaranty and security agreement with MSD, as administrative agent, and the cash collateral providers from time to time party thereto, along with certain of our subsidiaries as guarantors, pursuant to which we are obligated to reimburse MSD and any other cash collateral provider to the extent the cash collateral provided by MSD and any other cash collateral provider to secure the
Letter of Credit Agreement is drawn to satisfy draws on letters of credit (the “Reimbursement Agreement” and collectively with the Revolving Credit Agreement and Letter of Credit Agreement, the “Debt Documents” and the facilities thereunder, the “Debt Facilities”). TheOur obligations of the Company under each of the Debt Facilities arewere guaranteed by certain of our existing and future domestic and foreign subsidiaries of the Company.subsidiaries. B. Riley, Financial, Inc. (“B. Riley”), a related party, has provided a guaranty of payment with regard to the Company’sour obligations under the Reimbursement Agreement, as described below. The Company expects to useAgreement. We used the proceeds and letter of credit availability under the Debt Facilities for working capital purposes and general corporate purposes, including to backstop or replace certain letters of credit issued
under our previous A&R Credit Agreement, dated as of May 14, 2020 (as amended, restated or otherwise modified from time to time), by and among the Company, as borrower, Bank of America, N.A., as administrative agent, the lenders and the other parties from time to time party thereto, which was repaid and commitments thereunder terminated as of June 30, 2021.purposes. The Revolving Credit Agreement maturesDebt Facilities mature on June 30, 2025. As ofAt December 31, 2021, no2023, we had $27.0 million outstanding in revolving debt. For the year ended December 31, 2023, we had average daily borrowings have occurredof $14.2 million and a maximum daily amount outstanding of $34.9 million under the Revolving Credit Agreement and underAgreement. Under the Letter of Credit Agreement, usage consisted of $16.4$15.9 million of financial letters of credit and $90.4$70.0 million of performance letters of credit.credit at December 31, 2023.
EachAt inception of the Debt Facilities, has a maturity date of June 30, 2025. Thethe interest rates applicable under the Revolving Credit Agreement float at a rate per annum equal to either (i) a base rate plus 2.0% or (ii) 11- or 3 month3-month reserve-adjusted LIBOR rate plus 3.0%. The interest rates applicable to the Reimbursement Agreement float at a rate per annum equal to either (i) a base rate plus 6.50% or (ii) 11- or 3 month3-month reserve-adjusted LIBOR plus 7.50%. Under theThe Letter of Credit Agreement the Company is required to pay letter of creditrequires fees on outstanding letters of credit equal to (i) administrative fees of 0.75% and (ii) fronting fees of 0.25%. Under theThe Revolving Credit Agreement the Company is required to pay letter of creditrequires fees on outstanding letters of credit equal to (i) letter of credit commitment fees of 3.0% and (ii) letter of credit fronting fees of 0.25%. Under each of the RevolvingLetter of Credit Agreement and the Letter ofRevolving Credit Agreement, we are required to pay a facility fee equal to 0.375% per annum of the unused portion of the RevolvingLetter of Credit Agreement or the Letter ofRevolving Credit Agreement, respectively. The Company isCertain of these terms have been amended as described in the following paragraphs.
We are permitted to prepay all or any portion of the loans under the Revolving Credit Agreement prior to maturity without premium or penalty. Prepayments under the Reimbursement Agreement shall beare subject to a prepayment fee of 2.25% in the first year after closing, 2.0% in the second year after closing and 1.25% in the third year after closing with no prepayment fee payable thereafter.
The Company has We have mandatory prepayment obligations under the Reimbursement Agreement upon the receipt of proceeds from certain dispositions or casualty or condemnation events. The Revolving Credit Agreement and Letter of Credit Agreement require mandatory prepayments to the extent of an over-advance.
The obligations under the Debt Facilities are secured by substantially all assets of the Company and each of the guarantors, in each case subject to inter-creditor arrangements. As noted above, the obligations under the Letter of Credit Facility are also secured by the cash collateral provided by MSD and any other cash collateral provider thereunder.
The Debt Documents contain certain representations and warranties, affirmative covenants, negative covenants and conditions that are customarily required for similar financings. TheAt inception, the Debt Documents require the Companyus to comply with certain financial maintenance covenants, including a quarterly fixed charge coverage test of not less than 1.00 to 1.00, a quarterly senior net leverage ratio test of not greater than 2.50 to 1.00, a non-guarantor cash repatriation covenant not to exceed $35$35.0 million at any one time, a minimum liquidity covenant of at least $30.0 million at all times, a current ratio of not less than 1.25 to 1.00, and an annual cap on maintenance capital expenditures of $7.5 million. The Debt Documents also contain customary events of default (subject, in certain instances, to specified grace periods) including, but not limited to, the failure to make payments of interest or premium, if any, on, or principal under the respective facility, the failure to comply with certain covenants and agreements specified in the applicable Debt Agreement,debt agreement, defaults in respect of certain other indebtedness and certain events of insolvency. If any event of default occurs, the principal, premium, if any, interest and any other monetary obligations on all the then outstandingthen-outstanding amounts under the Debt DocumentsFacilities may become due and payable immediately. Certain of these covenants and terms have been amended as described in the following paragraphs.
In June 2021, in connection with the Company’sour entry into the Debt Documents, on June 30, 2021,Facilities, B. Riley, a related party, entered into a Guaranty Agreementguaranty agreement in favor of MSD, in its capacity as administrative agent under the Reimbursement Agreement, for the ratable benefit of MSD, the cash collateral providers and each co-agent or sub-agent appointed by MSD from time to time (the “B. Riley Guaranty”). The B. Riley Guaranty provides for the guarantee of all of the Company’sour obligations under the Reimbursement Agreement. The B. Riley Guaranty is enforceable in certain circumstances, including, among others, certain events of default and the acceleration of the Company’sour obligations under the Reimbursement Agreement. Under a fee letter with B. Riley, the Companywe agreed to pay B. Riley $0.9 million per annum in connection with the B. Riley Guaranty. The CompanyWe entered into a reimbursement agreement with B. Riley governing the Company’sour obligation to reimburse B. Riley to the extent the B. Riley Guaranty is called upon by the agent or lenders under the Reimbursement Agreement.
As ofIn November 2022 we executed an amendment to our Reimbursement Agreement with MSD which modified certain financial maintenance covenants for future periods beginning with the fiscal quarter ending on December 31, 2021,2022. The Fixed Charge Coverage Ratio was amended to 0.55 to 1.0 for the fiscal quarter ending December 31, 2022, 0.65 to 1.00 for
the fiscal quarter ending March 31, 2023, 0.80 to 1.00 for the fiscal quarter ending June 30, 2023, 1.15 to 1.00 for the fiscal quarter ending September 30, 2023 and 1.25 to 1.00 for the fiscal quarter ending December 31, 2023 and thereafter. The Senior Net Leverage Ratio was amended to 2.00 to 1.00 for the fiscal quarter ending December 31, 2022, 1.75 to 1.00 for the fiscal quarter ending March 31, 2023, 1.60 to 1.00 for the fiscal quarter ending June 30, 2023, and 1.50 to 1.00 for the fiscal quarter ending September 30, 2023 and thereafter. In addition, the interest rates applicable to the Reimbursement Agreement float at a subsidiary has borrowed $1.5 million against a $2.5 million line of credit. The interest rate on the line of credit is 5.5% per annum and matures on January 30, 2022. Subsequentare equal to either (i) the base rate plus 9.0% or (ii) 1 or 3-month reserve-adjusted SOFR plus 10.0%. The amendment also establishes minimum cash flow covenants, as defined, for the fiscal quarter ending December 31, 2021,2022 of $20.0 million and $25.0 million for the subsidiary entered into a new $3.5fiscal year 2023 and each fiscal year thereafter. In addition, we executed an amendment to our Revolving Credit Agreement with PNC which modified the calculation of the Fixed Charge Coverage Ratio for the fiscal quarters ending December 31, 2022, March 31, 2023 and June 30, 2023. The calculation of the Fixed Charge Coverage ratio for the fiscal quarter ending September 30, 2023 and thereafter will revert to the original calculation as stated in the original Debt Documents. In December 2022, we also deposited $10.0 million linewith PNC for Letter of credit with a maturity date of January 30, 2023.Credit collateral to enable MSD to reduce their collateral requirement by $10.0 million.
A&RIn March 2023, we, with certain of our subsidiaries as guarantors, certain lenders from time to time party to the Revolving Credit Agreement, and PNC, as administrative agent and swing loan lender to the Revolving Credit, Guaranty and Security Agreement, dated as of June 30, 2021, as amended (the “Amended Revolving Credit Agreement”), entered into the Second Amendment, Waiver and Consent to the Amended Revolving Credit Agreement (the “Second Amended Revolving Credit Agreement”). The Second Amended Revolving Credit Agreement amends the terms of the Amended Revolving Credit Agreement to (i) waive the senior net leverage ratio test for purposes of enacting a Permitted Restricted Payment on Preferred Shares (each as defined in the Second Amended Revolving Credit Agreement) to be made on March 31, 2023; and (ii) replace the use of LIBOR with Term SOFR throughout.
In May 2023, we entered into Amendment No. 3 to the Revolving Credit Agreement which allowed us to exclude certain expenses from the calculation of EBITDA under the Revolving Credit Agreement, including for purposes of determining compliance with certain financial covenants thereunder.
In June 2023, we entered into Amendment No. 4 to the Revolving Credit Agreement, whichincreased the limit of aggregate amount of all unrestricted cash and cash equivalents permitted to draw on the Amended Revolving Credit Agreement from $30.0 million to $40.0 million.
In November 2023, we entered into Amendment No. 3 to the Reimbursement Agreement (the “Third Amended Reimbursement Agreement”), which modified certain financial maintenance covenants for future periods beginning with the fiscal quarter ended on September 30, 2023. The Fixed Charge Coverage Ratio was amended to 1.05 to 1.0 for the fiscal quarters ending September 30, 2023 and December 31, 2023, 1.15 to 1.0 for the fiscal quarters ending March 31, 2024 and June 30, 2024, 1.05 to 1.0 for the fiscal quarter ending September 30, 2024, 1.1 to 1.0 for the fiscal quarter ending December 31, 2024, and 1.25 to 1.0 for the fiscal quarter ending March 31, 2025 and thereafter. The Senior Net Leverage Ratio condition to payment of dividends on preferred equity was amended to 1.46 to 1.0 for the fiscal quarter ending September 30, 2023, 1.3 to 1.0 for the fiscal quarter ending December 31, 2023 and 1.25 to 1.0 for all fiscal quarters thereafter. The Third Amended Reimbursement Agreement also imposes a leverage condition to the payment of dividends on preferred equity, which requires the Company to provide a quality of earnings report and pay a $1.0 million fee to MSD prior to paying a dividend for the fiscal quarter ending December 31, 2023. The Third Amended Reimbursement Agreement also amends the minimum cash flow covenants set forth in the Reimbursement Agreement to $10.0 million for the fiscal quarter ending December 31, 2023 and $25.0 million for the fiscal year 2024 and each fiscal year thereafter. The interest rates applicable to the Third Amended Reimbursement Agreement float at a rate per annum equal to SOFR plus 10% through December 31, 2023, SOFR plus 11% from January 1, 2024 through June 30, 2024 and will increase by 50 basis points as of the first day of each fiscal quarter thereafter. The size of the Cash Collateral Facility under the Third Amended Reimbursement Agreement stepped down to $100.0 million following the receipt of a PNC consent (as defined in the Third Amended Reimbursement Agreement), and will step down further to $90.0 million upon reduction in outstanding letters of credit to $90.0 million or less.
In March 2024, we entered into Amendment No. 4 to the Reimbursement Agreement (the "Fourth Amended Reimbursement Agreement"), which modified certain financial maintenance covenants for future periods beginning with the fiscal quarter ended on December 31, 2023. The Fixed Charge Coverage Ratio was amended to 0.93 to 1.0 for the fiscal quarter ending December 31, 2023, 0.82 to 1.0 for the fiscal quarter ending March 31, 2024, 0.90 to 1.0 for the fiscal quarter ending June 30, 2024, 0.95 to 1.0 for the fiscal quarter ending September 30, 2024, 1.1 to 1.0 for the fiscal quarter ending December 31, 2024, and 1.25 to 1.0 for the fiscal quarter ending March 31, 2025 and thereafter. The Senior Net Leverage Ratio condition to
payment of any Permitted Restricted Payments, as defined in the Fourth Amended Reimbursement Agreement, was amended to 1.45 to 1.0 for the four quarter fiscal measurement period ending as of December 31, 2023 and 1.25 to 1.0 thereafter. The Fourth Amended Reimbursement Agreement also amends the minimum cash flow covenants set forth in the Reimbursement Agreement to no less than $10.0 million as of December 31, 2023 (for the preceding fiscal quarter), no less than $15.0 million as of December 31, 2024 (for the preceding fiscal year), and no less than $25.0 million as of December 31 of each fiscal year thereafter. The Applicable Margin with respect to Delayed Draw Term Loans and Cash Collateral Commitment Fees will increase by an additional 0.50% on each of April 30, 2024, July 1, 2024, October 1, 2024, January 1, 2025 and April 1, 2025 in each case if the Obligations are in excess of $15 million on the applicable date.
As described above, the A&Rdiscussed in Note 25, in January 2024, we entered into a new Credit Agreement commitments were terminated, all loans were repaidwith Axos Bank. This agreement substantially replaces the existing Reimbursement Agreement, Revolving Credit Agreement and all outstanding and undrawn lettersLetter of credit were collateralizedCredit Agreement. B. Riley, a related party, has provided a guaranty of payment with regard to our obligations under the Credit Agreement. For further discussion on June 30, 2021. The Company recognized a gain on debt extinguishment of $6.5 million in the year ended December 31, 2021, primarily representing the write-off of accrued revolver fees of $11.3 million offset by the unamortized deferred financing fees of $4.8 million related to the prior A&R Credit Agreement.new agreement, see Note 25.
Other Letters of Credit, Bank Guaranteescredit, bank guarantees and Surety Bondssurety bonds
Certain of our subsidiaries, that are primarily outside of the United States, have credit arrangements with various commercial banks and other financial institutions for the issuance of letters of credit and bank guarantees in association with contracting activity. The aggregate value of all such letters of credit and bank guarantees outside of ourthe Letter of Credit Agreement as of December 31, 20212023, was $52.8$39.4 million. The aggregate value of the outstanding letters of credit provided under the Letter of Credit Agreement backstopping letters of credit or bank guarantees was $35.5$21.7 million as of December 31, 2021.2023. Of the outstanding letters of credit issued under the Letter of Credit Agreement, $51.5$54.0 million are subject to foreign currency revaluation.
We have also posted surety bonds to support contractual obligations to customers relating to certain contracts. We utilize bonding facilities to support such obligations, but the issuance of bonds under those facilities is typically at the surety's discretion. These bonds generally indemnify customers should we fail to perform our obligations under theour applicable contracts. We, and certain of our subsidiaries, have jointly executed general agreements of indemnity in favor of surety underwriters relating to surety bonds thosethe underwriters issue in support of some of our contracting activity. As of December 31, 2021,2023, bonds issued and outstanding under these arrangements in support of our contracts totaled approximately $188.3$141.7 million. The aggregate value of the letters of credit backstopping surety bonds was $13.1$16.8 million.
Our ability to obtain and maintain sufficient capacity under our new Debt Facilitiescurrent debt facilities is essential to allow us to support the issuance of letters of credit, bank guarantees and surety bonds. Without sufficient capacity, our ability to support contract security requirements in the future will be diminished.
Other Indebtedness - Loans Payable
As of December 31, 2021,2023, we had Loans payable of $41.6 million, net of debt issuance costs of $0.5 million, of which $6.2 million is classified as current and $35.4 million as long-term loans payable in the Consolidated Balance Sheets. Included in these amounts, we had approximately $12.3 million, net of debt issuance costs of $0.5 million, related to sale-leaseback financing transactions.
At December 31, 2022, our Denmark subsidiary has 3an unsecured interest free loans totaling $3.3interest-free loan of $0.8 million under a local government loan program related to COVID-19. The loans of $0.8 million, $1.6 million and $0.9 million are payableCOVID-19 that was repaid in April 2022, May 2022 and May 2023, respectively. The loan payable in May 2023 is included in2023.
long term loans payables in our Consolidated Balance Sheets.
As of December 31, 2021, as a result of our recent acquisition of a 60% controlling ownership stake in Fosler Construction Company Inc. (“Fosler Construction”) as described in Note 26, Fosler Construction has 2 loans totaling $8.3 million. Both loans have a variable interest rate with a minimum rate of 6% and are due June 30, 2022. Fosler Construction also has loans primarily for vehicles and equipment totaling $0.7 million at December 31, 2021. The vehicle and equipment loans are included in long term loans payables in our Consolidated Balance Sheets.
NOTE 1716 – PREFERREDCAPITAL STOCK
Common Stock
In May 2022, our stockholders, upon the recommendation of our Board of Directors, approved an amendment to the Babcock & Wilcox Enterprises, Inc 2021 Long-Term Incentive Plan. The Plan Amendment became effective upon such stockholder approval. The Plan Amendment increased the total number of shares of our common stock authorized for award grants under the 2021 Plan from 1,250,000 shares to 5,250,000 shares. The 2021 Plan replaced our Amended and Restated 2015 Long-Term Incentive Plan. In addition to the 5,250,000 shares available for award grant purposes under the 2021 Plan as described above, any shares of our common stock underlying any outstanding award granted under the 2015 Plan that, following May 20, 2021, expires, or is terminated, surrendered, or forfeited for any reason without issuance of such shares shall also be available for the grant of new awards under the 2021 Plan.
In February 2021, we completed a public offering of our common stock pursuant to the Underwriting Agreement dated February 9, 2021, between us and B. Riley Securities, Inc., as representative of the underwriters. At the closing, we issued to the public 29,487,180 shares of our common stock for gross proceeds of $172.5 million. We received net proceeds of $163.0 million after deducting underwriting discounts and commissions, but before expenses.
Preferred Stock
In May 2021, we completed a public offering of our 7.75% Series A Cumulative Perpetual Preferred Stock (the "Preferred Stock") pursuant to an underwriting agreement (the “Underwriting Agreement”) between us and B. Riley Securities, Inc..Inc. At the closing, we issued to the public 4,444,700.004,444,700 shares of our Preferred Stock, at an offering price of $25.00 per share for net proceeds of approximately $106.4 million after deducting underwriting discounts and commissions, but before expenses. The Preferred Stock has a par value of $0.01 per share, and is perpetual and has no maturity date.not subject to mandatory redemption or any sinking fund. The Preferred Stock has a cumulative cash dividend, when and as if declared by our Board of Directors, at a rate of 7.75% (equivalent to $1.9375) per year on the liquidation preference amount of $25.00 per share and payable quarterly in arrears.
The Preferred Stock ranks, as to dividend rights and rights as to the distribution of assets upon our liquidation, dissolution or winding-up: (1) senior to all classes or series of our common stock and to all other capital stock issued by us expressly designated as ranking junior to the Preferred Stock; (2) on parity with any future class or series of our capital stock expressly designated as ranking on parity with the Preferred Stock; (3) junior to any future class or series of our capital stock expressly designated as ranking senior to the Preferred Stock; and (4) junior to all our existing and future indebtedness.
The Preferred Stock has no stated maturity and is not subject to mandatory redemption or any sinking fund. We will pay cumulative cash dividends on the Preferred Stock when, as and if declared by our Board of Directors, only out of funds legally available for payment of dividends. Dividends on the Preferred Stock will accrue on the stated amount of $25.00 per share of the Preferred Stock at a rate per annum equal to 7.75% (equivalent to $1.9375 per year), payable quarterly in arrears. Dividends on the Preferred Stock declared by our Board of Directors will be payable quarterly in arrears on March 31, June 30, September 30 and December 31 of each year.
DuringIn June 2021, the Company's Board of Directors approved dividends totaling $9.1 million.. There are no cumulative undeclared dividends of the Preferred Stock at December 31, 2021.
On June 1, 2021, the Company and B. Riley, a related party,we entered into an exchange agreement (the “Exchange Agreement”)with B. Riley, pursuant to which we (i) issued B. Riley 2,916,880 shares of our Preferred Stock, representing an exchange price of $25.00 per share and paid $0.4 million in cash, and (ii) paid $0.9 million in cash to B. Riley for accrued interest due, in exchange for a deemed prepayment of $73.3 million of our then existing term loans with B. Riley under the Company’sour prior A&R Credit Agreement.
OnIn July 7, 2021, we entered into a sales agreement with B. Riley Securities, Inc., a related party, in connection withfor the offer and to or through B. Riley Securities, Inc., from time to time,sale of additional shares of Preferred Stock, from time to time, up to an aggregate amount of $76.0 million of Preferred Stock. The Preferred Stock will havehas the same terms and have the same CUSIP number and beis fungible with the Preferred Stock issued during May 2021. As of December 31,During 2021, the Companywe sold $0.3 million shares, or $7.7 million aggregate principal amount of Preferred Stock for $7.7 million net proceeds.
proceeds under this sales agreement.
NOTE 18 – COMMON STOCK
On February 12, 2021, we completed a public offering of our common stock pursuantThe Preferred Stock ranks, as to an underwriting agreement dated February 9, 2021, between usdividend rights and B. Riley Securities, Inc.,rights as representative of the several underwriters. At the closing, we issued to the public 29,487,180 sharesdistribution of assets upon our liquidation, dissolution or winding-up: (1) senior to all classes or series of our common stock and received net proceedsto all other capital stock issued by it expressly designated as ranking junior to the Preferred Stock; (2) on parity with any future class or series of approximately $163.0 million after deducting underwriting discountsour capital stock expressly designated as ranking on parity with the Preferred Stock; (3) junior to any future class or series of our capital stock expressly designated as ranking senior to the Preferred Stock; and commissions, but before expenses. The net proceeds(4) junior to all of the offering were used to make a prepayment toward the balance outstanding under our U.S. Revolving Credit Facilityexisting and permanently reduce the commitments under our senior secured credit facilities.future indebtedness.
On May 20, 2021, atDuring the 2021 annual meeting of stockholders of the Company, the stockholders of the Company, upon the recommendation of the Company’stwelve months ending December 31, 2023, our Board of Directors approved the Babcock & Wilcox Enterprises, Inc. 2021 Long-Term Incentive Plan. The 2021 Plan became effective upon such stockholder approval. The maximum number of sharesdividends totaling $14.9 million to holders of the Company’s common stock that may be issued or transferred pursuant to awards underPreferred Stock. There were no cumulative undeclared dividends of the 2021 Plan equals: (1) 1,250,000 shares, plus (2) the number of any shares subject to awards granted under the Company’s AmendedPreferred Stock at December 31, 2023, and Restated 2015 Long-Term Incentive Plan (the “2015 Plan”) and outstandingall declared dividends have been paid as of May 20, 2021 which expire, or are terminated, surrendered, or forfeited for any reason without issuance of such shares (including for outstanding performance share awards to the extent they are earned at less than maximum). No new awards may be granted under the 2015 Plan. As of May 20, 2021 (immediately prior to the stockholder approval of the 2021 Plan), the total number of shares of our common stock subject to outstanding awards granted under the 2015 Plan was 2,007,152 shares.January 2, 2024.
NOTE 17– ACCUMULATED OTHER COMPREHENSIVE LOSS
Gains and losses deferred in AOCI are generally reclassified and recognized in the Consolidated Statements of Operations once they are realized. The changes in the components of AOCI, net of tax, for December 31, 2023, 2022, and 2021 were as follows:
| | | | | | | | | | | | | |
| | | | | |
| (in thousands) | Currency translation
loss | | Net unrecognized loss
related to benefit plans
(net of tax) | Total | |
| | | | | |
| Balance at December 31, 2020 | $ | (47,575) | | | $ | (4,815) | | $ | (52,390) | | |
| Other comprehensive income before reclassifications | (3,412) | | | 676 | | (2,736) | | |
| Amounts reclassified from AOCI to net income | (4,512) | | | 816 | | (3,696) | | |
| Net other comprehensive income | (7,924) | | | 1,492 | | (6,432) | | |
| Balance at December 31, 2021 | $ | (55,499) | | | $ | (3,323) | | $ | (58,822) | | |
| Other comprehensive loss before reclassifications | (14,834) | | | — | | (14,834) | | |
| Amounts reclassified from AOCI to net income | — | | | 870 | | 870 | | |
| Net other comprehensive income (loss) | (14,834) | | | 870 | | (13,964) | | |
| Balance at December 31, 2022 | $ | (70,333) | | | $ | (2,453) | | $ | (72,786) | | |
| Other comprehensive income before reclassifications | 5,555 | | | — | | 5,555 | | |
| Amounts reclassified from AOCI to net income | — | | | 870 | | 870 | | |
| Net other comprehensive income | 5,555 | | | 870 | | 6,425 | | |
| Balance at December 31, 2023 | $ | (64,778) | | | $ | (1,583) | | $ | (66,361) | | |
| | | | | |
| | | | | |
| | | | | |
| | | | | |
| | | | | |
| | | | | |
| | | | | |
| | | | | |
| | | | | |
| | | | | |
| | | | | |
| | | | | |
| | | | | |
The amounts reclassified out of AOCI by component and the affected Consolidated Statements of Operations line items are as follows (in thousands):
| | | | | | | | | | | | | | | | | | | | | | | | |
| AOCI component | Line items in the Consolidated Statements of Operations affected by reclassifications from AOCI | | | Year ended December 31, |
| | | | 2023 | | 2022 | | 2021 |
| Release of currency translation adjustment with the sale of business | Loss on sale of business | | | | | $ | — | | | $ | — | | | $ | 4,512 | |
| | | | | | | | | | |
| Pension and post retirement adjustments, net of tax | Benefit plans, net | | | | | (870) | | | (870) | | | (816) | |
| Net (loss) income | | | | | $ | (870) | | | $ | (870) | | | $ | 3,696 | |
NOTE 1918 –INTEREST EXPENSE AND SUPPLEMENTAL CASH FLOW INFORMATION
Interest expense in ourthe Consolidated Financial Statements consisted of the following components:
| | | Year ended December 31, |
| | | Year ended December 31, | |
| | | Year ended December 31, | |
| | | Year ended December 31, | |
| (in thousands) | (in thousands) | | 2021 | | 2020 | | 2019 | (in thousands) | | | | | 2023 | | 2022 | | 2021 |
| Components associated with borrowings from: | Components associated with borrowings from: | | | | | | |
| Senior notes | Senior notes | | $ | 13,273 | | | $ | — | | | $ | — | |
| Last Out Term Loans - cash interest | | 4,349 | | | 6,140 | | | 11,207 | |
| Last Out Term Loans - equitized interest | | — | | | 13,450 | | | — | |
| Last Out Term Loans - paid-in-kind interest | | — | | | — | | | 5,964 | |
| Senior notes | |
| Senior notes | |
| Last Out Term Loans | |
| | U.S. Revolving Credit Facility | U.S. Revolving Credit Facility | | 1,416 | | | 13,988 | | | 15,639 | |
| | | 19,038 | | | 33,578 | | | 32,810 | |
| U.S. Revolving Credit Facility | |
| | U.S. Revolving Credit Facility | |
| | | | | 27,095 | |
| Components associated with amortization or accretion of: | Components associated with amortization or accretion of: | | |
| Revolving Credit Agreement | | 2,735 | | | — | | | — | |
| Senior notes | | 2,510 | | | — | | | — | |
| Last Out Term Loans - discount and financing fees | | — | | | 3,183 | | | 10,580 | |
| Deferred fees on Revolving Credit Agreement | |
| Deferred fees on Revolving Credit Agreement | |
| Deferred fees on Revolving Credit Agreement | |
| Deferred fees on Senior notes | |
| | U.S. Revolving Credit Facility - deferred financing fees and commitment fees | U.S. Revolving Credit Facility - deferred financing fees and commitment fees | | 5,995 | | | 14,811 | | | 31,567 | |
| U.S. Revolving Credit Facility - contingent consent fee for Amendment 16 | | — | | | — | | | 13,879 | |
| U.S. Revolving Credit Facility - deferred ticking fee for Amendment 16 | | — | | | 1,660 | | | 5,064 | |
| U.S. Revolving Credit Facility - deferred financing fees and commitment fees | |
| U.S. Revolving Credit Facility - deferred financing fees and commitment fees | |
| | | 11,240 | | | 19,654 | | | 61,090 | |
| | | | | | 7,168 | |
| | | | | | 7,168 | |
| | | | | | 7,168 | |
| | Components associated with interest from: | |
| Components associated with interest from: | |
| Components associated with interest from: | Components associated with interest from: | | |
| Lease liabilities | Lease liabilities | | 2,502 | | | 2,452 | | | 14 | |
| Lease liabilities | |
| Lease liabilities | |
| Letter of Credit fees and interest | |
| Other interest expense | Other interest expense | | 6,613 | | | 4,112 | | | 987 | |
| | 9,115 | | | 6,564 | | | 1,001 | |
| | | | | 15,632 | |
| | Total interest expense | Total interest expense | | $ | 39,393 | | | $ | 59,796 | | | $ | 94,901 | |
| Total interest expense | |
| Total interest expense | |
The following table provides a reconciliation of cash and cash equivalents and current and long-term restricted cash reportingreported within the Consolidated Balance Sheets and in the Consolidated Statements of Cash Flows:
| | December 31, | | | December 31, |
| (in thousands) | (in thousands) | December 31, 2021 | | December 31, 2020 | | December 31, 2019 | (in thousands) | 2023 | | 2022 | | 2021 |
| Held by foreign entities | Held by foreign entities | $ | 42,070 | | | $ | 38,726 | | | $ | 38,921 | |
| Held by U.S. entities | Held by U.S. entities | 182,804 | | | 18,612 | | | 4,851 | |
| Cash and cash equivalents | Cash and cash equivalents | 224,874 | | | 57,338 | | | 43,772 | |
| | Reinsurance reserve requirements | Reinsurance reserve requirements | 443 | | | 4,551 | | | 9,318 | |
| Reinsurance reserve requirements | |
| Reinsurance reserve requirements | |
| Restricted foreign accounts | Restricted foreign accounts | — | | | 2,869 | | | 3,851 | |
Project indemnity collateral (1) | |
| Bank guarantee collateral | Bank guarantee collateral | 997 | | | 2,665 | | | — | |
Letters of credit collateral | Letters of credit collateral | 401 | | | — | | | — | |
Hold-back for acquisition purchase price (3) | |
Escrow for long-term project (4) | |
| Restricted cash and cash equivalents | Restricted cash and cash equivalents | 1,841 | | | 10,085 | | | 13,169 | |
| Total cash, cash equivalents and restricted cash shown in the Consolidated Statements of Cash Flows | $ | 226,715 | | | $ | 67,423 | | | $ | 56,941 | |
Total Cash, cash equivalents and restricted cash shown in the Consolidated Statements of Cash Flows(5) | |
(2) We paid an additional $10.0 million in December, 2022 for letter of credit collateral which is reflected in Long-term restricted cash in the Consolidated Balance Sheets. This amount was released in 2023 in association with our refinancing with PNC.
(3)The purchase price for FPS was $59.2 million, including a hold-back of $5.9 million which is included in Current restricted cash and cash equivalents and Other accrued liabilities in the Consolidated Balance Sheets. The hold-back is being held in escrow for potential payment of up to the maximum amount twenty-four months from the February 1, 2022 date of acquisition if the conditions are met. We paid $2.9 million of this holdback during 2023, and the remaining amount in February 2024.
(4) In January 2022, we funded $11.4 million in an escrow account as security to ensure project performance. This cash was released in 2023.
(5) Includes cash held at discontinued operations of $0.03 million, $0.49 million and $0.00 million at December 31, 2023, 2022 and 2021, respectively.
The following cash activity is presented as a supplement to ourthe Consolidated Statements of Cash Flows and is included in Net cash used in activities:activities:
| | | | | | | | | | | | | | | | | |
| Year ended December 31, |
| (in thousands) | 2021 | | 2020 | | 2019 |
| Income tax payments, net | $ | 4,991 | | | $ | 6,960 | | | $ | 3,873 | |
| | | | | |
| Interest payments - 8.125% Senior Notes due 2026 | 10,451 | | | — | | | — | |
| Interest payments on our U.S. Revolving Credit Facility | 5,979 | | | 11,675 | | | 14,715 | |
| Interest payments on our Last Out Term Loans | 3,804 | | | 6,140 | | | 12,220 | |
| Total cash paid for interest | $ | 20,234 | | | $ | 17,815 | | | $ | 26,935 | |
| | | | | | | | | | | | | | | | | |
| Year ended December 31, |
| (in thousands) | 2023 | | 2022 | | 2021 |
| Income tax payments, net | $ | 6,731 | | | $ | 7,950 | | | $ | 4,991 | |
| | | | | |
| | | | | |
| | | | | |
| | | | | |
| | | | | |
Cash paid for interest(1) | $ | 23,067 | | | $ | 25,673 | | | $ | 20,234 | |
| | | | | |
(1) Excludes amounts paid for Letter of Credit fees | | | | | |
NOTE 20–19 – STOCK-BASED COMPENSATION
Stock options
There were no stock options awarded in 2021.2023. The following table summarizes activity for outstanding stock options for the year ended December 31, 2021:2023:
| | (share data in thousands) | (share data in thousands) | Number of shares | Weighted-average
exercise price | Weighted-average
remaining
contractual term
(in years) | Aggregate
intrinsic value
(in thousands) | (share data in thousands) | Number of shares | Weighted-average
exercise price | Weighted-average
remaining
contractual term
(in years) | Aggregate
intrinsic value
(in thousands) |
| Outstanding at beginning of period | Outstanding at beginning of period | 340 | | $ | 107.84 | | |
| Granted | Granted | — | | — | | |
| Granted | |
| Granted | |
| Exercised | |
| Exercised | |
| Exercised | Exercised | — | | — | | |
| Cancelled/expired/forfeited | Cancelled/expired/forfeited | (52) | | 138.73 | | |
| Cancelled/expired/forfeited | |
| Cancelled/expired/forfeited | |
| Outstanding at end of period | |
| Outstanding at end of period | |
| Outstanding at end of period | Outstanding at end of period | 288 | | $ | 121.59 | | 4.39 | $ | — | |
| Exercisable at end of period | Exercisable at end of period | 288 | | $ | 121.59 | | 4.39 | $ | — | |
The aggregate intrinsic value included in the table above represents the total pretax intrinsic value that would have been received by the option holders had all option holders exercised their options on December 31, 2021.2023. The intrinsic value is calculated as the total number of option shares multiplied by the difference between the closing price of our common stock on the last trading day of the period and the exercise price of the options. This amount changes based on the price of our common stock. If zero is shown, the closing price of our common stock at December 31, 2023 is lower than the exercise price for all options.
Restricted stock units
Non-vested restricted stock units activity for the year ended December 31, 2021 was2023 is as follows: | | (share data in thousands) | (share data in thousands) | Number of shares | Weighted-average grant date fair value | (share data in thousands) | Number of shares | Weighted-average grant date fair value |
| Non-vested at beginning of period | Non-vested at beginning of period | 2,490 | | $ | 3.77 | |
| Granted | Granted | 1,102 | | 7.69 | |
| Vested | Vested | (1,715) | | 9.44 | |
| Cancelled/forfeited | Cancelled/forfeited | (73) | | 3.71 | |
| Non-vested at end of period | Non-vested at end of period | 1,804 | | $ | 5.79 | |
As of December 31, 2021,2023, total compensation expense not yet recognized related to non-vested restricted stock units was $5.5$6.9 million and the weighted-average period in which the expense is expected to be recognized is 1.7 years.
Restricted stock units with market conditions
In July 2022, we granted market-based RSUs to certain members of management. The number of market-based RSUs granted was 0.96 million. The RSUs will vest if our closing stock price on the NYSE is equal to or higher than the Stock Price Goal of $12.00 per share during the performance period, which expires on the 5th anniversary of the Grant Date. The $6.70 grant date fair value per market-based RSU was determined using a Monte Carlo simulation approach. Compensation expense for awards with market conditions is recognized over the derived service period using cost of equity as the drift rate in the simulation for estimating the dividend service period and is not reversed if the market condition is not met.
We used the following assumptions to determine the fair value of the restricted stock units with market conditions as of the grant date:
Performance-based restricted stock units | | | | | |
| |
| |
| Risk free interest rate | 2.7 | % |
| Volatility | 59.0 | % |
| Cost of equity | 17.4 | % |
| Performance period | 5 years |
| Derived service period | 0.78 years |
Performance-based restrictedRestricted stock units with market conditions activity for the year ended December 31, 20212023 was as follows: | | | | | | | | |
| (share data in thousands) | Number of shares | Weighted-average grant date fair value |
| Non-vested at beginning of period | 1,275 | | $ | 2.50 | |
| Exercised | (1,275) | | 2.50 | |
| Non-vested at end of period | — | | $ | — | |
Performance-based, cash settled units
Cash-settled performance units activity for the year ended December 31, 2021 was as follows: | | (share data in thousands) | (share data in thousands) | Number of shares | | Weighted-average grant date fair value | (share data in thousands) | Number of shares | | Weighted-average grant date fair value |
| Non-vested at beginning of period | Non-vested at beginning of period | 2 | | | $ | 140.30 | |
| Granted | Granted | — | | | — | |
| Vested | — | | | — | |
| Exercised | |
| Cancelled/forfeited | Cancelled/forfeited | (2) | | | 140.30 | |
| Non-vested at end of period | Non-vested at end of period | — | | | $ | — | |
Stock Appreciation Rights
In December 2018, we granted stock appreciation rights to certain employees (“("Employee SARs”SARs") and to a non-employee related party, BRPI Executive Consulting, LLC (“("Non-employee SARs”SARs"). The Employee SARs and Non-employee SARs both expire ten years after the grant date and primarily vest 100% upon completion after the required years of service. Upon vesting, the Employee SARs and Non-employee SARs may be exercised within 10 business days following the end of any calendar quarter during which the volume weighted average share price is greater than the share price goal. Upon exercise of the SARs, holders receive a cash-settled payment equal to the number of SARs that are being exercised multiplied by the difference between the stock price on the date of exercise minus the SARs base price. Employee SARs were issued under the Fourth Amended and Restated 2015 LTIP, and Non-employee SARs were issued under a Non-employee SARs agreement. The liability method was used to recognize the accrued compensation expense with cumulatively adjusted revaluations to the then current fair value at each reporting date through final settlement.
We used the following assumptions to determine the fair value of the SARs granted to employees and non-employee as of December 31 20212023 and 2020:2022: | | Year ended December 31, |
| December 31, | | | December 31, |
| | | 2021 | | 2020 | | 2023 | | 2022 |
| Risk-free interest rate | Risk-free interest rate | 1.44 | % | | 0.74 | % | Risk-free interest rate | 3.80 | % | | 4.00 | % |
| Expected volatility | Expected volatility | 53 | % | | 50 | % | Expected volatility | 57 | % | | 59 | % |
| Expected life in years | Expected life in years | 6.49 | | 7.72 | Expected life in years | 4.75 | | 5.65 |
| Suboptimal exercise factor | Suboptimal exercise factor | 2.0x | | 2.0x | Suboptimal exercise factor | 2.0x | | 2.0x |
In making these assumptions, we based estimated volatility on the historical returns of the Company'sour stock price and selected guideline companies. We based risk-free rates on the corresponding U.S. Treasury spot rates for the expected duration at the date of grant, which we convert to a continuously compounded rate. We relied upon a suboptimal exercise factor, representing the ratio of the base price to the stock price at the time of exercise, to account for potential early exercise prior to the expiration of the contractual term. With consideration to the executive level of the SARs holders, a suboptimal exercise multiple of 2.0x was selected. Subject to vesting conditions, should the stock price achieve a value of 2.0x above the base price, we assume the holders will exercise prior to the expiration of the contractual term of the SARs. The expected term for the SARs is an output of ourthe valuation model in estimating the time period that the SARs are expected to remain unexercised. OurThe valuation model assumes the holders will exercise their SARs prior to the expiration of the contractual term of the SARs.
As of December 31, 2021,2023, the SARSSARs are fully vested and their total intrinsic value is $7.0$1.6 million.
NOTE 2120 – PROVISION FOR INCOME TAXES
Income (loss)(Loss) income from continuing operations before income taxes includestax expense (benefit) is comprised of the following: | | Year ended December 31, |
| Year ended December 31, | | | Year ended December 31, |
| (in thousands) | (in thousands) | 2021 | | 2020 | | 2019 | (in thousands) | 2023 | | 2022 | | 2021 |
| United States | United States | $ | 30,655 | | | $ | (65,591) | | | $ | (64,610) | |
| Other than the United States | Other than the United States | (1,341) | | | 61,673 | | | (59,837) | |
| Income (loss) before income tax expense | $ | 29,314 | | | $ | (3,918) | | | $ | (124,447) | |
| (Loss) income from continuing operations before income tax expense (benefit) | |
Significant components of the provision for income taxes from continuing operations are as follows:
| | Year ended December 31, |
| Year ended December 31, | | | Year ended December 31, |
| (in thousands) | (in thousands) | 2021 | | 2020 | | 2019 | (in thousands) | 2023 | | 2022 | | 2021 |
| Current: | Current: | | | | | |
Federal (1) | 1,760 | | | $ | (21) | | | $ | 534 | |
| Federal | |
| Federal | |
| Federal | |
| State | State | (141) | | | 246 | | | 454 | |
| Foreign | Foreign | 4,649 | | | 3,737 | | | 3,705 | |
| Total current provision | Total current provision | 6,268 | | | 3,962 | | | 4,693 | |
| Deferred: | Deferred: | | | | | |
Federal (2) | (103) | | | 1,084 | | | (257) | |
State (3) | (8,772) | | | — | | | — | |
| Federal | |
| Federal | |
| Federal | |
State (1) (2) | |
| Foreign | Foreign | 383 | | | 3,133 | | | 850 | |
| Total deferred provision | Total deferred provision | (8,492) | | | 4,217 | | | 593 | |
| Provision for income taxes | Provision for income taxes | $ | (2,224) | | | $ | 8,179 | | | $ | 5,286 | |
(1)The 2020 amount reflects a benefit of $0.6 million offsetting tax expense of $0.6 million in discontinued operations pursuant to the guidance in paragraph 740-20-45-7 that requires all components, including discontinued operations, be considered when determining the tax benefit from a loss from continuing operations. The 2021 amount reflects estimated withholding taxes on the divestiture of Diamond Power Machine (Hubei) Co.
(2) The 2020 amount reflects $1.1 million of deferred tax expense as a result of the change in indefinite reinvestment assertion related to certain foreign subsidiaries.
(3) The 2021 amount reflects aan $8.7 million of deferred tax benefit primarily attributable to a reduction in the valuation allowance on net operating losses and temporary deductible benefits in certain states that are now expected to be recovered.
(2) The 2022 amount is primarily attributable to deferred tax expense associated with nontaxable mark-to-market pension gains in certain states where temporary deductible benefits are expected to be recovered, changes in enacted statutory income tax rates, and changes in apportionment relating to project mix.
The provision for income taxes attributable to continuing operations differs from the amount computed by applying the statutory federal income tax rate to income (loss) before the provision (benefit) for income taxes.
The sources and tax effects of the differences are as follows:
| | | | | | | | | | | | | | | | | |
| Year ended December 31, |
| (in thousands) | 2021 | | 2020 | | 2019 |
| Income tax benefit at federal statutory rate | $ | 6,156 | | | $ | (823) | | | $ | (26,134) | |
| State and local income taxes | 1,054 | | | 346 | | | 3,205 | |
| Foreign rate differential | 132 | | | 2,422 | | | 2,053 | |
Intra-entity debt restructuring (1) | — | | | 2,908 | | | — | |
| Deferred taxes - change in tax rate | (564) | | | 8,512 | | | 9,799 | |
| Non-deductible (non-taxable) items | (122) | | | 1,963 | | | 4,190 | |
| Tax credits | (34) | | | (2,939) | | | 144 | |
| Valuation allowances | (13,136) | | | (17,498) | | | 56,254 | |
| Luxembourg impairment of investments | — | | | (30,603) | | | (65,848) | |
| Effect of DPMH sale | (1,090) | | | — | | | — | |
| Accrual adjustments | — | | | 405 | | | (995) | |
| Unrecognized tax benefits | 150 | | | 37,387 | | | (271) | |
| Withholding taxes | 3,881 | | | 1,416 | | | 1,331 | |
| Change in indefinite reinvestment assertion | (15) | | | 1,084 | | | — | |
| Disallowed interest deductions | 1,010 | | | 11,155 | | | 11,009 | |
| Return to provision and prior year true-up | 556 | | | (7,855) | | | 9,875 | |
| Other | (202) | | | 299 | | | 674 | |
| Income tax (benefit) expense | $ | (2,224) | | | $ | 8,179 | | | $ | 5,286 | |
(1) The 2020 amount reflects a restructuring of intercompany debt that resulted in the reduction of certain foreign net operating loss carryforwards. | | | | | | | | | | | | | | | | | |
| Year ended December 31, |
| (in thousands) | 2023 | | 2022 | | 2021 |
| Income tax benefit at federal statutory rate | $ | (14,732) | | | $ | (1,875) | | | $ | 5,730 | |
| State and local income taxes | (555) | | | 985 | | | 983 | |
| Foreign rate differential | 677 | | | 313 | | | 132 | |
| | | | | |
| Deferred taxes - change in tax rate | 1,244 | | | 1,217 | | | (564) | |
| Non-deductible (non-taxable) items | 822 | | | 330 | | | (122) | |
| Tax credits | 1,834 | | | 1,876 | | | 252 | |
| Valuation allowances | 14,500 | | | 14,131 | | | (13,136) | |
| | | | | |
| Effect of DPMH sale | — | | | — | | | (1,090) | |
| | | | | |
| Unrecognized tax benefits | — | | | 10 | | | 150 | |
| Withholding taxes | 1,195 | | | 1,382 | | | 3,882 | |
| Change in indefinite reinvestment assertion | 278 | | | 163 | | | (15) | |
| Disallowed interest deductions | — | | | — | | | 1,010 | |
| Return to provision and prior year true-up | 3,800 | | | (7,544) | | | 960 | |
| Other | (582) | | | 71 | | | (200) | |
| | | | | |
| Income tax expense (benefit) | $ | 8,481 | | | $ | 11,059 | | | $ | (2,028) | |
Deferred income taxes reflect the tax effects of differences between the financial and tax bases of assets and liabilities.
Significant components of deferred tax assets and liabilities are as follows:
| | Year ended December 31, |
| Year ended December 31, | | | Year ended December 31, |
| (in thousands) | (in thousands) | 2021 | | 2020 | (in thousands) | 2023 | | 2022 |
| Deferred tax assets: | Deferred tax assets: | | | |
| Pension liability | Pension liability | $ | 41,520 | | | $ | 50,849 | |
| Other accruals | 10,683 | | | 12,989 | |
| Pension liability | |
| Pension liability | |
| Accruals | |
| Long-term contracts | Long-term contracts | — | | | 1,121 | |
| Net operating loss carryforward | Net operating loss carryforward | 401,750 | | | 399,321 | |
| State net operating loss carry forward | State net operating loss carry forward | 23,705 | | | 23,956 | |
| Interest limitation carryforward | Interest limitation carryforward | 41,104 | | | 38,539 | |
| Foreign tax credit carryforward | Foreign tax credit carryforward | 5,381 | | | 7,312 | |
| Other tax credits | Other tax credits | 5,336 | | | 3,270 | |
| Lease liability | Lease liability | 15,455 | | | — | |
| Capitalized R&D | |
| Property, plant and equipment | |
| Other | Other | 4,810 | | | 8,478 | |
| Total deferred tax assets | Total deferred tax assets | $ | 549,744 | | | $ | 545,835 | |
| Valuation allowance for deferred tax assets | Valuation allowance for deferred tax assets | (512,803) | | | (536,251) | |
| Total deferred tax assets, net | Total deferred tax assets, net | $ | 36,941 | | | $ | 9,584 | |
| | Deferred tax liabilities: | Deferred tax liabilities: | |
| Deferred tax liabilities: | |
| Deferred tax liabilities: | |
| Property, plant and equipment | |
| Property, plant and equipment | |
| Property, plant and equipment | Property, plant and equipment | $ | 1,653 | | | $ | 2,763 | |
| Right of use assets | Right of use assets | 14,574 | | | — | |
| Long-term contracts | 7,045 | | | — | |
| | Unremitted earnings | |
| Unremitted earnings | |
| Unremitted earnings | Unremitted earnings | 1,069 | | | 1,084 | |
| Intangibles | Intangibles | 13,999 | | | 9,449 | |
| Total deferred tax liabilities | Total deferred tax liabilities | 38,340 | | | 13,296 | |
| Net deferred tax liabilities | Net deferred tax liabilities | $ | (1,399) | | | $ | (3,712) | |
At December 31, 2021, the Company has2023 we have foreign net operating loss (NOL)NOL carryforward DTAsdeferred tax assets ("DTAs") of approximately $357.8$357.4 million available to offset future taxable income in certain foreign jurisdictions. Of these foreign NOL carryforwards, $187.6$155.6 million do not expire. The remaining foreign NOLs will expire between 20222024 and 2037.2040.
AsAt December 31, 2021, the Company has2023, we have U.S. federal NOL carryforward DTAs of approximately $43.9$61.7 million. Of this amount, $20.7$20.0 million will expire in 2036 and 2037. The remaining amount of U.S. NOL carryforward does not expire. A portion of the net operating loss carryforward is limited under CodeIRC Section 382. Approximately $19.7$38.2 million of our U.S. federal NOL carryforward is not subject to the CodeIRC Section 382 limitation.
At December 31, 2021, the Company has2023, we have state NOL carryforward DTAs of $23.7$20.5 million available to offset future taxable income in various jurisdictions. Of this amount, $23.3$20.0 million will expire between 20222024 and 2041.2042.
At December 31, 2021,the Company has2023, we have foreign tax credit carryforwards of $5.4$3.0 million. These carryforwards will expire between 20222024 and 2028.2026.
At December 31, 2021, the Company has2023, we have valuation allowances of $512.8$551.9 million for deferred tax assets, which we expect will not be realized through carrybacks,carry-backs, reversals of existing taxable temporary differences, estimates of future taxable income or tax-planning strategies. Deferred tax assets are evaluated for realizability under ASC 740, considering all positive and negative evidence. At December 31, 2021,2023, our weighting of positive and negative evidence included an assessment of historical income by jurisdiction adjusted for nonrecurring items, as well as an evaluation of other qualitative factors such as the length and magnitude of pretax losses. The valuation allowances may be reversed in the future if sufficient positive evidence exists.
Any reversal of our valuation allowance could be material to the income or loss for the period in which our assessment changes.
The net change during the year in the total valuation allowance is as follows:
| | Year ended December 31, |
| Year ended December 31, | | | Year ended December 31, |
| (in thousands) | (in thousands) | 2021 | | 2020 | (in thousands) | 2023 | | 2022 |
| Balance at beginning of period | Balance at beginning of period | $ | (536,251) | | | $ | (539,791) | |
| Charges to costs and expenses | 13,136 | | | 17,498 | |
Charges to costs and expenses(1) | |
| Charges to other accounts | Charges to other accounts | 10,312 | | | (13,958) | |
| Balance at end of period | Balance at end of period | $ | (512,803) | | | $ | (536,251) | |
(1) Includes $14.5 million from loss on continuing operations and $13.7 million from loss on discontinued operations. | | (1) Includes $14.5 million from loss on continuing operations and $13.7 million from loss on discontinued operations. |
Sections 382 and 383 of the CodeIRC limits, for U.S. federal income tax purposes, the annual use of NOL carryforwards (including previously disallowed interest carryforwards) and tax credit carryforwards, respectively, following an ownership change. Under CodeIRC Section 382, a company has undergone an ownership change occurs if shareholders owning at least 5% of the companyour common stock have increased their collective holdings by more than 50% during the prior three-year period. Based on information that is publicly available, the Companywe determined that a Section 382 ownership change occurred onin July 23, 2019. As a result of this change in ownership, the Companywe estimated that the future utilization of our federal NOLs (and certain credits and previously disallowed interest deductions) will become limited to approximately $1.2 million annually ($0.3 million tax effected) The Company maintainsWe maintain a full valuation allowance on the majority of its U.S. deferred tax assets, including the deferred tax assets associated with the federal NOLs, credits and disallowed interest carryforwards.
Undistributed earnings of certain foreign subsidiaries amounted to approximately $308.7$184.8 million. The CompanyWe no longer intendsintend to assert indefinite reinvestment with respect to withholding taxes of $1.1$1.5 million that could be assessed on the repatriation of $11.3$13.3 million in undistributed earnings. The Company continuesWe continue to assert indefinite reinvestment in the remaining $297.4$171.5 million of existing earnings that are not expected to be distributed in the future. Upon repatriation of those earnings, in the form of dividends or otherwise, the Companywe would be subject to withholding taxes payable to various foreign countries. The Company expectsWe expect to take the 100% dividends received deduction to offset any US federal taxable income on the undistributed earnings. Withholding taxes of approximately $1.6$2.7 million would be payable upon remittance of these previously unremitted earnings.
We recognize the benefit of a tax position when we conclude that a tax position, based solely on its technical merits, is more-likely-than-not to be sustained upon examination. A recognized tax benefit is measured as the largest amount of benefit, on a cumulative probability basis, which is more likely-than-not to be realized upon settlement. Changes in recognition or measurement are reflected in the period in which the change in judgment occurs.
Below is a tabular rollforwardroll-forward of the beginning and ending aggregate unrecognized tax benefits:benefits on a continuing operations basis:
| | Year ended December 31, | | | Year ended December 31, |
| (in thousands) | | (in thousands) | 2023 | | 2022 | | 2021 |
| Balance at beginning of period | |
| | Increases based on tax positions taken in prior years | |
| Increases based on tax positions taken in prior years | |
| Increases based on tax positions taken in prior years | |
| Decreases based on tax positions taken in prior years | |
| | | Year ended December 31, |
| (in thousands) | 2021 | | 2020 | | 2019 |
| Balance at beginning of period | $ | 39,013 | | | $ | 1,229 | | | $ | 1,500 | |
| Increases based on tax positions taken in the current year | — | | | 37,900 | | | 29 | |
| Increases based on tax positions taken in prior years | 242 | | | — | | | 27 | |
| Decreases based on tax positions taken in prior years | — | | | (29) | | | (223) | |
| Decreases due to settlements with tax authorities | — | | | — | | | — | |
| Decreases due to lapse of applicable statute of limitation | — | | | (87) | | | (104) | |
| CTA/Translation | |
| | CTA/Translation | |
| | CTA/Translation | CTA/Translation | (2,807) | | | — | | | — | |
| Balance at end of period | Balance at end of period | $ | 36,448 | | | $ | 39,013 | | | $ | 1,229 | |
Unrecognized tax benefits of $0.7$3.0 million would, if recognized, impact the effective tax rate. The remaining balance of unrecognized tax benefits relates to deferred tax assets that, if recognized, would require a full valuation allowance. It is not expected that the amount of unrecognized tax benefits will change significantly during the next 12 months. We recognize interest and penalties related to unrecognized tax benefits in our provision for income taxes; however, such amounts are not significant to any period presented.
Tax years 20152016 through 20202022 remain open to assessment by the United States Internal Revenue Service and various state and international tax authorities. We do not have any returns under examination for years prior to 2014. The United States
Internal Revenue Service has completed examinations of the federal tax returns of our former parent, BWXT, through 2014, and all matters arising from such examinations have been resolved.
NOTE 2221 – CONTINGENCIES
Litigation Relating to Boiler Installation and Supply Contract
On December 27, 2019, a complaint was filed against Babcock & Wilcoxus by P.H. Glatfelter Company (“Glatfelter”) in the United States District Court for the Middle District of Pennsylvania, Case No. 1:19-cv-02215-JPW, alleging claims of breach of contract, fraud, negligent misrepresentation, promissory estoppel and unjust enrichment (the “Glatfelter Litigation”). The complaint alleges damages in excess of $58.9 million. On March 16, 2020 we filed a motion to dismiss, and on December 14, 2020 the court issued its order dismissing the fraud and negligent misrepresentation claims. On January 11, 2021, we filed an answer and a counterclaim for breach of contract, seeking damages in excess of $2.9 million. On November 30, 2022, we and Glatfelter each filed cross-motions for summary judgment. On June 21, 2023, the court granted our motion in part, dismissing Glatfelter’s promissory estoppel and unjust enrichment claims, dismissing Babcock & Wilcox Enterprises, Inc. entirely (Glatfelter's remaining claim is asserted against The Babcock & Wilcox Company), and finding that in the event that parties’ contract is found to be valid, Plaintiffs’ claims for damages will be subject to the contractual cap on liability (defined as the $11.7 million purchase price, subject to certain adjustments). On January 11, 2021, we filed our answer, and a counterclaimdenied Glatfelter’s motion for breach of contract, seeking damagessummary judgment. The case is set for trial in excess of $2.9 million.March 2024. We intend to continue to vigorously litigate the action. However, given the preliminary stage ofuncertainty inherent in the litigation, it is too early to determine if the outcome of the Glatfelter Litigation will have a material adverse impact on our consolidated financial condition,position, results of operations or cash flows.
SEC Investigation
As the Company previously disclosed, the U.S. SEC ('SEC") had been conducting a formal investigation of the Company, focusing on the accounting charges and related matters involving the Company's B&W Renewable segment from 2015-2019. On October 20,2021, the SEC informed the Company that the staff does not intend to recommend any enforcement action against the Company.
Stockholder Derivative and Class Action Litigation
On April 14, 2020, a putative B&W stockholder (“Plaintiff”) filed a derivative and class action complaint against certain of the Company’sour directors (current and former), executives and significant stockholders (“Defendants”(collectively, “Defendants”) and the CompanyB&W (as a nominal defendant). The action was filed in the Delaware Court of Chancery and is captioned Parker v. Avril, et al., C.A. No. 2020-0280-PAF ("Stockholder Litigation"(the “Stockholder Litigation”). Plaintiff alleges that Defendants, among other things, did not properly discharge their fiduciary duties in connection with the 2019 rights offering and related transactions. The case is currently in discovery. We believe that
On June 10, 2022, after pursuing private mediation, the outcome ofparties to the Stockholder Litigation reached a settlement agreement in principle to resolve the Stockholder Litigation. That settlement agreement includes (i) certain corporate governance changes that B&W is willing to implement in the future, (ii) a total payment of $9.5 million, and (iii) other customary terms and conditions. All attorney’s fees, administration costs, and expenses associated with the settlement of this matter will not have a material adverse impactbe deducted from the total payment amount, other than the cost of notice, which will be borne by B&W. Of the total settlement amount, B&W will pay $4.75 million on behalf of B. Riley Financial, Inc. and Vintage Capital Management, LLC, pursuant to existing contractual indemnification obligations to settle Plaintiff’s direct claims asserted against these entities. This $4.75 million, after the deduction of attorney’s fees and the customary settlement costs and expenses described above, will be paid to our consolidated financial condition, resultsshareholders, excluding any Defendant in the Stockholder Litigation. The remaining $4.75 million of operations or cash flows, netthe total settlement amount, after the deduction of anyattorney’s fees and the customary settlement costs and expenses described above, will be paid to B&W from insurance coverage.proceeds and the contribution of certain other parties to the Stockholder Litigation to settle the derivative claims asserted by Plaintiff on behalf of B&W.
On July 14, 2023, the Court issued an order approving the settlement as fair and reasonable and in the best interests of the Plaintiff, the certified class, B&W, and our stockholders and entered the order and final judgment dismissing the case with prejudice. The settlement resolved all claims that have been, could have been, could now be, or in the future could, can, or might be asserted in the Stockholder Litigation.
Russian Invasion of Ukraine
We do not currently have contracts directly with Russian entities or businesses and we currently do not doconduct business in Russia directly. We believe the Company’sthat our only involvement with Russia, or Russian-entities,Russian entities, involves sales of our products in the amount of approximately $3.1 million by a wholly-owned Italian subsidiary of the Company to non-Russian counterparties who may resell our products to Russian entities or perform services in Russia using our products. We have implemented a restricted party screening process completed by a third party to monitor compliance with trade restrictions. The economic sanctions and export-control measures and the ongoing invasion of Ukraine could impact our subsidiary’s rights and responsibilities under the contracts and could result in potential losses to the Company.losses.
Other
Due to the nature of our business, we are, from time to time, we are involved in routine litigation or subject to disputes or claims related to our business activities, including, among other things: performance or warranty-related matters under our customer and supplier contracts and other business arrangements; and workers' compensation, premises liability and other claims. Based on our prior experience, except as disclosed above, we do not expect that any of these other litigation proceedings, disputes and claims will have a material adverse effect on our consolidated financial condition,position, results of operations or cash flows.
NOTE 23 – COMPREHENSIVE INCOME
Gains and losses deferred in accumulated other comprehensive income (loss) ("AOCI") are generally reclassified and recognized in the Consolidated Statements of Operations once they are realized. The changes in the components of AOCI, net of tax, for the years ended of 2021, 2020, and 2019 were as follows:
| | | | | | | | | | | | | | |
| (in thousands) | Currency translation
loss | Net unrealized gain (loss) on derivative instruments | Net unrecognized loss
related to benefit plans
(net of tax) | Total |
| Balance at December 31, 2018 | $ | (10,834) | | $ | 1,362 | | $ | (1,960) | | $ | (11,432) | |
| Other comprehensive income (loss) before reclassifications | 13,401 | | (1,367) | | — | | 12,034 | |
| Reclassified from AOCI to net income (loss) | 3,176 | | 202 | | (1,857) | | 1,521 | |
| Amounts reclassified from AOCI to advanced billings on contracts | — | | (197) | | — | | (197) | |
| Net other comprehensive (loss) income | 16,577 | | (1,362) | | (1,857) | | 13,358 | |
| Balance at December 31, 2019 | $ | 5,743 | | $ | — | | $ | (3,817) | | $ | 1,926 | |
| Other comprehensive loss before reclassifications | (53,318) | | — | | — | | (53,318) | |
| Reclassified from AOCI to net income (loss) | — | | — | | (998) | | (998) | |
| Net other comprehensive (loss) income | (53,318) | | — | | (998) | | (54,316) | |
| Balance at December 31, 2020 | $ | (47,575) | | $ | — | | $ | (4,815) | | $ | (52,390) | |
| Other comprehensive income (loss) before reclassifications | (3,412) | | — | | 676 | | (2,736) | |
| Reclassified from AOCI to net income (loss) | (4,512) | | — | | 816 | | (3,696) | |
| Net other comprehensive income (loss) | (7,924) | | — | | 1,492 | | (6,432) | |
| Balance at December 31, 2021 | $ | (55,499) | | $ | — | | $ | (3,323) | | $ | (58,822) | |
The amounts reclassified out of AOCI by component and the affected Consolidated Statements of Operations line items are as follows (in thousands):
| | | | | | | | | | | | | | | | | | | | | | | | |
| AOCI component | Line items in the Consolidated Statements of Operations affected by reclassifications from AOCI | | | Year ended December 31, |
| | | | 2021 | | 2020 | | 2019 |
| Release of currency translation adjustment with the sale of business | Loss on sale of business | | | | | $ | 4,512 | | | $ | — | | | $ | (3,176) | |
| Derivative financial instruments | Other – net | | | | | — | | | — | | | (202) | |
| Pension and post retirement adjustments, net of tax | Benefit plans, net | | | | | (816) | | | 998 | | | 1,857 | |
| Net (loss) income | | | | | $ | 3,696 | | | $ | 998 | | | $ | (1,521) | |
NOTE 24 –22– FAIR VALUE MEASUREMENTS
The following tables summarize our financial assets and liabilities carried at fair value, all of which were valued from readily available prices or using inputs based upon quoted prices for similar instruments in active markets (known as "Level 1" and "Level 2" inputs, respectively, in the fair value hierarchy established by the FASB Topic,ASC 820, Fair Value Measurements and Disclosures).
| | | | | | | | | | | | |
| (in thousands) | | | | |
| Available-for-sale securities | December 31, 2021 | Level 1 | Level 2 | |
| Corporate notes and bonds | $ | 9,477 | | $ | 9,477 | | $ | — | | |
| Mutual funds | 714 | | — | | 714 | | |
| United States Government and agency securities | 2,017 | | 2,017 | | — | | |
| Total fair value of available-for-sale securities | $ | 12,208 | | $ | 11,494 | | $ | 714 | | |
| | | | | | | | | | | | |
| (in thousands) | | | | |
| Available-for-sale securities | December 31, 2020 | Level 1 | Level 2 | |
| Corporate notes and bonds | $ | 6,139 | | $ | 6,139 | | $ | — | | |
| Mutual funds | 636 | | — | | 636 | | |
| Corporate Stocks | 4,168 | | 4,168 | | — | | |
| United States Government and agency securities | 4,365 | | 4,365 | | — | | |
| Total fair value of available-for-sale securities | $ | 15,308 | | $ | 14,672 | | $ | 636 | | |
Available-For-Sale Debt Securities
| | | | | | | | | | | | |
| (in thousands) | | | | |
| December 31, 2023 | Level 1 | Level 2 | |
| Corporate notes and bonds | $ | 3,144 | | $ | 3,144 | | $ | — | | |
| Mutual funds | 3 | | — | | 3 | | |
| United States government and agency securities | 3,906 | | 3,906 | | — | | |
| Total fair value of available-for-sale securities | $ | 7,053 | | $ | 7,050 | | $ | 3 | | |
| | | | | | | | | | | | |
| (in thousands) | | | | |
| December 31, 2022 | Level 1 | Level 2 | |
| Corporate notes and bonds | $ | 4,154 | | $ | 4,154 | | $ | — | | |
| Mutual funds | 612 | | — | | 612 | | |
| United States government and agency securities | 4,023 | | 4,023 | | — | | |
| Total fair value of available-for-sale securities | $ | 8,789 | | $ | 8,177 | | $ | 612 | | |
Our investments in available-for-sale debt securities are presented in otherOther assets on our in the Consolidated Balance Sheets with contractual maturities ranging from 0-5 years.
Senior Notes
See Note 14 above for a discussion of our recent offerings of senior notes. The fair value of the senior notes is based on readily available quoted market prices as of December 31, 2021.2023.
| | (in thousands) | (in thousands) | December 31, 2021 | |
| (in thousands) | |
| (in thousands) | |
| Senior Notes | Senior Notes | Carrying Value | Estimated Fair Value | |
| 8.125% Senior Notes due 2026 ('BWSN') | $ | 186,219 | | $ | 195,250 | | |
| 6.50% Senior Notes due 2026 ('BWNB') | $ | 151,440 | | $ | 150,229 | | |
| Senior Notes | |
| Senior Notes | |
| 8.125% Senior Notes due 2026 ('"BWSN") | |
| 8.125% Senior Notes due 2026 ('"BWSN") | |
| 8.125% Senior Notes due 2026 ('"BWSN") | |
| 6.50% Senior Notes due 2026 ("BWNB") | |
| 6.50% Senior Notes due 2026 ("BWNB") | |
| 6.50% Senior Notes due 2026 ("BWNB") | |
Other Financial Instruments
We used the following methods and assumptions in estimating our fair value disclosures for our other financial instruments:
•◦Cash and cash equivalents and restrictedRestricted cash and cash equivalents. The carrying amounts that we have been reported in the accompanying Consolidated Balance Sheets for cashCash and cash equivalents and restrictedRestricted cash and cash equivalents approximate their fair values due to their highly liquid nature.
•◦Last Out Term Loans and Revolving Debtdebt. We base the fair valuesvalue of debt instruments on quoted market prices. Where quoted prices are not available, we base the fair valuesvalue on Level 2 inputs such as the present value of future cash flows discounted at estimated borrowing rates for similar debt instruments or on estimated prices based on current yields for debt issues of similar quality and terms. The fair value of our Last Out Term Loans andthe Revolving Debt approximated theirits carrying valueamount at December 31, 2020.2023.
•Warrants. The fair value of the warrants was established using the Black-Scholes option pricing model value approach.
•Contingent consideration: In connection with the Fosler Construction Company acquisition, the Company agreed to pay contingent consideration based on the achievement of targeted revenue thresholds for the year ended December 31, 2022. The range of undiscounted amounts the Company could be required to pay under the contingent consideration arrangement is between $0.0 million and $10.0 million. As of December 31, 2021, the fair value of the contingent earn-out liability is $9.2 millions and is classified as a component of other non-current liabilities in the Company's Consolidated Balance Sheets. The fair value measurement of the contingent consideration related to the Fosler Construction Company acquisition was categorized as a Level 3 liability, as the measurement amount is based primarily on significant inputs not observable in the markets. The Company evaluates the fair value of contingent consideration and the corresponding liability each reporting period using an option pricing framework. The Company estimates projections during the earn-out period and volatility within the option pricing model captures variability in the potential pay-out. The analysis considers a discount rate applicable to the underlying projections and the risk of the Company paying the future liability.
NOTE 2523 – RELATED PARTY TRANSACTIONS
The Company believes itWe believe transactions with related parties were conducted on terms equivalent to those prevailing in an arm's length transaction.
Transactions with B. Riley
Based on its Schedule 13D filings with the SEC, B. Riley beneficially owns 30.3% approximately 30.7% of ourthe Company's outstanding common stock as of December 31, 2021.2023. B. Riley currently has the right to nominate one member of our Board of Directors pursuant to the investor rights agreement we entered into with B. Riley in April 2019. The investor rights agreement also provides pre-emptive rights to B. Riley with respect to certain future issuances of our equity securities.
B. Riley was party to the Last Out Term Loans under our prior A&R Credit Agreement, asAs described in Note 15.25, in January 2024 in connection with the our entry into the Axos Credit Agreement, we entered into a guaranty agreement and a fee and reimbursement agreement with B. Riley.
We entered into an agreement with BRPI Executive Consulting, LLC, an affiliate of B. Riley, onin November 19, 2018 and amended the agreement onin November 9, 2020 and December 2023 to retain the services of Mr. KennyKenneth Young, to serve as our Chief Executive Officer until December 31, 2023,2028, unless terminated by either party with thirty days written notice. Under this agreement, payments are $0.75 million per annum, paid monthly. Subject to the achievement of certain performance objectives as determined by the Compensation Committee of theour Board of Directors, a bonus or bonuses may also be earned and payable to BRPI Executive Consulting, LLC. In
As described in Note 21, in June 2019,2022, after pursuing private mediation, the parties to the Stockholder Litigation reached a settlement agreement that was approved by the court in July 2023 which included a $9.5 million settlement amount, under which we granted a totalpaid $4.75 million on behalf of $2.0B. Riley and Vintage Capital Management, LLC pursuant to existing contractual indemnification obligations to settle Plaintiff’s direct claims asserted against these entities. This $4.75 million, after the deduction of attorney’s fees and customary settlement costs and expenses, will be paid to our shareholders, excluding any Defendant in cash bonuses to BRPI Executive Consulting LLC for Mr. Young's performance and services.the Stockholder Litigation.
Total fees associated with B. Riley related to the Last Out Term Loans and services of Mr. Kenny Young, both as described above, were $0.8 million, $7.4 million and $12.4 million for the twelve months ended December 31, 2021, 2020 and 2019, respectively.
On November 13, 2020 we entered into an agreement with B. Riley Principal Merger Corp. II,In July 2022, BRF Investments, LLC, an affiliate of B. Riley, exercised 1,541,667 warrants to purchase 200,0001,541,666 shares of Class Aour common stock at a price per share of Eos Energy Storage LLC for an aggregate purchase price of $2.0 million. The shares were sold in January 2021 for which the Company recognized net proceeds of $4.5 million.
The public offering of our 8.125% Senior Notes in February 2021, as described in Note 14, was conducted$0.01 pursuant to an underwritingthe terms of the warrant agreement dated February 10, 2021, between us and B. Riley Securities, Inc., an affiliate of B. Riley, as representative of several underwriters. At the closing date on February 12, 2021, we paid B. Riley Securities, Inc. $5.2 million for underwriting fees and other transaction cost related to the 8.125% Senior Notes offering.
The public offering of our common stock, as described in Note 18, was conducted pursuant to an underwriting agreement dated February 9, 2021, between us and B. Riley Securities, Inc., as representative of the several underwriters. Also on February 12, 2021, we paid B. Riley Securities, Inc. $9.5 million for underwriting fees and other transaction costs related to the offering.
On February 12, 2021, the Company and B. Riley entered into the Exchange Agreement pursuant to which we agreed to issue to B. Riley $35.0 million aggregate principal amount of 8.125% Senior Notes in exchange for a deemed prepayment of $35.0 million of our existing Tranche A term loan with B. Riley Financial in the Exchange, as described in Note 14July 23, 2019.
On March 31, 2021,
In July 2022, we entered into a sales agreement withparticipated in the sale process of Hamon Holdings in which B. Riley Securities, Inc., a related party, in which we may sell, from time to time, up to an aggregated principal amount of $150.0 million of 8.125% Senior Notes due 2026 to or through B. Riley Securities, Inc., as described in Note 14. As of December 31, 2021, we paid B. Riley Securities, Inc. $0.5 million for underwriting fees and other transaction costs related to the offering.
The public offering of our 7.75% Series A Cumulative Perpetual Preferred Stock, as described in Note 17, was conducted pursuant to an underwriting agreement dated May 4, 2021, between us and B. Riley Securities, Inc., as representative of several underwriters. At the closing date on May 2021, we paid B. Riley Securities, Inc. $4.3 million for underwriting fees and other transaction cost related to the Preferred Stock offering.
On May 26, 2021, we completed the additional sale of 444,700 shares of our Preferred Stock, related to the grant to the underwriters, as described in Note 17, and paid B. Riley Securities, Inc. $0.4 million for underwriting fees in conjunction with the transaction.
On June 1, 2021, we issued 2,916,880 shares of the Company’s 7.75% Series A Cumulative Perpetual Preferred Stock and paid $0.4 million in cash due to B. Riley, a related party, in exchange for a deemed prepayment of $73.3 million of our then existing Last Out Term Loans and paid $0.9 million in cash for accrued interest, as described in Note 17.
On June 30, 2021, we entered into new Debt Facilities, as described in Note 16. In connection with the Company’s entry into the Debt Facilities, B. Riley Financial, Inc.,Inc, an affiliate of B. Riley, has providedwas engaged as Hamon Holdings’ investment banker and to serve as advisor to Hamon Holdings through a guarantyChapter 11 363 Asset Sale of payment with regard toHamon Holdings’ entire United States business or potential carve-out of any of its four main subsidiaries. We were a successful bidder for the Company’s obligations under the Reimbursement Agreement, as describe in Note 16. Underassets of one of those subsidiaries, Hamon, a fee letter with B. Riley, the Company shall pay B. Riley $0.9 million per annum in connection with the B. Riley Guaranty.major provider of air pollution control technology, for approximately $2.9 million.
On July 7, 2021, we entered into a sales agreement with B. Riley Securities, Inc., a related party, in which we may sell, from time to time, up to an aggregated principal amount of $76 million of Preferred Stock to or through B. Riley Securities, Inc., as described in Note 17. As of December 31, 2021, we paid B. Riley Securities, Inc. $0.2 million for underwriting fees and other transaction costs related to the offering.
The public offering of our 6.50% Senior Notes inIn December 2021, as described in Note 14, was conducted pursuant to an underwriting agreement dated December 8, 2021, between us and B. Riley Securities, Inc., an affiliate of B. Riley, as representative of several underwriters. At the closing date on December 13, 2021, we paid B. Riley Securities, Inc. $5.5 million for underwriting fees and other transaction cost related to the 6.50% Senior Notes offering.
On December 17, 2021, B. Riley Financial, Inc. entered into a General Agreement of Indemnity (the "Indemnity Agreement"), between us and AXA-XL and or its affiliated associated and subsidiary companies (collectively the “Surety”). Pursuant to the terms of the Indemnity Agreement, B. Riley will indemnify the Surety for losses the Surety may incur as a result of providing a payment and performance bond in an aggregate amount not to exceed €30.0 million in connection with our proposed performance on a specified project. In consideration of B. Riley's execution of the Indemnity Agreement we paid B. Riley a fee of $1.7 million following the issuance of the bond by the Surety, which represents approximately 5.0% of the bonded obligations, to be amortized over the term of the agreement.
OnIn December 28, 2021, we received a notice that the underwriterspublic offering of theour 6.50% Senior Notes, hadas described in Note 15, was conducted pursuant to an underwriting agreement between us and B. Riley Securities, Inc., an affiliate of B. Riley, as representative of several underwriters. The underwriters also elected to exercise their overallotment option for an additional $11.4 million in aggregate principal amount of the 6.50% Senior Notes. At the closing date on December 30, 2021, weWe paid B. Riley Securities, Inc. $0.5a total of $6.0 million for underwriting fees and other transaction cost related to the 6.50% Senior Notes overallotment.offering and overallotment option.
TransactionsIn June 2021, we entered into new Debt Facilities, as described in Note 15. In connection with Vintage Capital Management, LLCthe entry into the Debt Facilities, B. Riley provided a guaranty of payment with regard to our obligations under the Reimbursement Agreement, as described in Note 15. Under a fee letter with B. Riley, we are obligated to pay B. Riley $0.9 million per annum in connection with the B. Riley Guaranty.
On March 26,In May 2021, Vintagethe public offering of our 7.75% Series A Cumulative Perpetual Preferred Stock ("Preferred Stock"), as described in Note 16, was conducted pursuant to an underwriting agreement between us and B. Riley Securities, Inc., an affiliate of B. Riley, as representative of several underwriters. At the closing date in May 2021, we paid B. Riley Securities, Inc. $4.3 million for underwriting fees and other transaction costs related to the Preferred Stock offering.
In May 2021, we completed the additional sale of 444,700 shares of our Preferred Stock, related to the grant to the underwriters, as described in Note 16, and paid B. Riley Securities, Inc., an affiliate of B. Riley, $0.4 million for underwriting fees in conjunction with the transaction.
In June 2021, we issued 2,916,880 shares of our 7.75% Series A Cumulative Perpetual Preferred Stock and paid $0.4 million in cash due to B. Riley, in exchange for a transactiondeemed prepayment of $73.3 million of our then-existing Last Out Term Loans and paid $0.9 million in cash for accrued interest, as described in Note 16.
In July 2021, we entered into a sales agreement with B. Riley Securities, Inc., an affiliate of B. Riley, pursuant to which we may sell, from time to time, up to an aggregate principal amount of $76.0 million of our Preferred Stock to or through B. Riley Securities, Inc., as described in Note 14. We have paid B. Riley Securities, Inc. $0.2 million for underwriting fees and other transaction costs related to the offering.
In February 2021, the public offering of our 8.125% Senior Notes, as described in Note 15, was conducted pursuant to an Underwriting agreement between us and B. Riley Securities, Inc., an affiliate of B. Riley, as representative of several underwriters. At the closing date, we paid B. Riley Securities, Inc. $5.2 million for underwriting fees and other transaction costs related to the 8.125% Senior Notes offering.
In February 2021, we entered into an Exchange Agreement with B. Riley pursuant to which we agreed to purchase from Vintage, and Vintage agreed to sellissue to B. Riley all 10,720,785 shares$35.0 million aggregate principal amount of 8.125% Senior Notes in exchange for a deemed prepayment of $35.0 million of our existing Tranche A term loan with B. Riley, as described in Note 15.
In March 2021, we entered into a sales agreement with B. Riley Securities, Inc., an affiliate of B. Riley, pursuant to which we may sell, from time to time, up to an aggregated principal amount of $150.0 million of 8.125% Senior Notes due 2026 to or through B. Riley Securities, Inc., as described in Note 15. We have paid B. Riley Securities, Inc. a total of $0.5 million for underwriting fees and other transaction costs related to the sales agreement.
In February 2021, the public offering of our common stock, owned by Vintage.
Based on its Schedule 13D filings, Vintage beneficially owns 0% of our outstanding common stock as described in Note 16, was conducted pursuant to an underwriting agreement between us and B. Riley Securities, Inc., an affiliate of December 31, 2021.
NOTE 26 – ACQUISITIONS, ASSETS HELD FOR SALE, DIVESTITURES AND DISCONTINUED OPERATIONS
Acquisitions
Fosler Constructionunderwriters. We paid B. Riley Securities, Inc. $9.5 million for underwriting fees and other transaction costs related to the offering.
On September 30,In November 2020, we entered into an agreement with B. Riley Principal merger Corp. II, an affiliate of B. Riley, to purchase 200,000 shares of Class A common stock of Eos Energy Storage LLC for an aggregate purchase price of $2.0 million. The shares were sold in January 2021 we acquired a 60% controlling ownership stake in Illinois-based solar energy contractor Fosler Construction Company Inc. (“Fosler Construction”). Fosler Construction provides commercial, industrial and utility-scale solar services and owns 2 community solar projects in Illinois being developed under the Illinois Solar for All program. Fosler Construction was founded in 1998 and employs approximately 120 people with a track recordnet proceeds of successfully completing solar projects profitably with union labor and aligning its model with a growing number of renewable project incentives in the U.S. We believe Fosler Construction is positioned to capitalize on the high-growth solar market in the U.S. and that the acquisition aligns with B&W’s aggressive growth and expansion of our clean and renewable energy businesses. Fosler Construction is reported as part of our B&W Renewable segment, and will operate under the name Fosler Solar, a Babcock and Wilcox company.
The total fair value of consideration for the acquisition is $36.0 millions, including $27.2 million in cash plus $8.8 million in estimated fair value of the contingent consideration arrangement. In connection with the acquisition, the Company agreed to pay contingent consideration based on the achievement of targeted revenue thresholds for the year ended December 31, 2022. The range of undiscounted amounts the Company could be required to pay under the contingent consideration arrangement is between $0.0 million and $10.0$4.5 million.
We estimated fair values primarily using the discounted cash flow method at September 30, 2021 for the preliminary allocation of consideration to the assets acquired and liabilities assumed. During the measurement period, we will continue to obtain information to assist in finalizing the fair value of assets acquired and liabilities assumed, which may differ materially from these preliminary estimates. If we determine any measurement period adjustments are material, we will apply those adjustments, including any related impacts to net income, in the reporting period in which the adjustments are determined.
VODA
On November 30, 2021, we acquired 100% ownership of VODA A/S (“VODA”) through our wholly-owned subsidiary, B&W PGG Luxembourg Finance SARL, for approximately $32.9 million. VODA is a Denmark-based multi-brand aftermarket parts and services provider, focusing on energy-producing incineration plants including waste-to-energy, biomass-to-energy or other fuels, providing service, engineering services, spare parts as well as general outage support and management. VODA has extensive experience in incineration technology, boiler and pressure parts, SRO, automation, and performance optimization. VODA employs approximately 65 people mainly in Denmark and Sweden. We believe VODA will solidify our platform for our renewable service business in Europe and that the acquisition aligns with B&W’s aggressive growth and expansion of our clean and renewable energy businesses. VODA is reported as part of our B&W Renewable segment. We plan to form B&W Renewable Services to integrate VODA and our waste-to-energy and biomass aftermarket services businesses.
The provisional measurements noted in the table below are preliminary and subject to modification in the future. The preliminary purchase price allocation to assets acquired and liabilities assumed in the acquisitions were:
| | | | | | | | | | | | | | | | | |
| Purchase Price Allocation at September 30, 2021 | Purchase Price Allocation Adjustments since September 30, 2021 (3) | Purchase Price Allocation at December 31, 2021 | | Purchase Price Allocation at December 31, 2021 |
| (in thousands) | Fosler Construction | | VODA |
| Cash | $ | — | | $ | — | | $ | — | | | $ | 4,737 | |
| Accounts receivable | 1,904 | | 121 | | 2,025 | | | 5,654 | |
| Contracts in progress | 1,363 | | (158) | | 1,205 | | | 258 | |
| Other current assets | 1,137 | | (835) | | 302 | | | 825 | |
| Property, plant and equipment | 9,527 | | (14) | | 9,513 | | | 253 | |
Goodwill(1) | 43,230 | | 8,749 | | 51,979 | | | 17,176 | |
| Other assets | 17,497 | | (4,600) | | 12,897 | | | 14,321 | |
| Right of use assets | 1,093 | | — | | 1,093 | | | 433 | |
| Debt | (7,625) | | — | | (7,625) | | | — | |
| Current liabilities | (5,073) | | (390) | | (5,463) | | | (5,181) | |
| Advance billings on contracts | (1,557) | | 238 | | (1,319) | | | (2,036) | |
| Non-current lease liabilities | (1,730) | | — | | (1,730) | | | (302) | |
| Other non-current liabilities | (4,112) | | 1,218 | | (2,894) | | | (3,264) | |
Non-controlling interest(2) | (22,262) | | (1,734) | | (23,996) | | | — | |
| Net acquisition cost | $ | 33,392 | | $ | 2,595 | | $ | 35,987 | | | $ | 32,874 | |
(1) Goodwill is calculated as the excess of the purchase price over the net assets acquired. With respect to the Fosler Construction acquisition, goodwill represents Fosler's ability to significantly expand EPC and O&M services among new customers across the U.S. by leveraging B&W's access to capital and geographic reach. With respect to the VODA acquisition, goodwill represents VODA's ability to significantly expand within the aftermarket parts and services industries by leveraging B&W's access to capital and existing platform within the renewable service market. Goodwill is not expected to be deductible for U.S federal income tax purposes.
(2) The fair value of the non-controlling interest was derived based on the fair value of the 60% controlling interest acquired by B&W. The transaction price paid by B&W reflects a Level 2 input involving an observable transaction involving an ownership interest in Fosler Construction. Also, as described above, a portion of the purchase consideration relates to the contingent consideration.
(3) Our preliminary purchase price allocation changed due to additional information and further analysis.
Intangible assets are included in other assets above and consists of the following:
| | | | | | | | | | | | | | | | | |
| Fosler Construction | | VODA |
| (in thousands) | Estimated Acquisition Date Fair Value | Weighted Average Estimated Useful Life | | Estimated Acquisition Date Fair Value | Weighted Average Estimated Useful Life |
| Customer Relationships | 9,400 | | 12 years | | 13,855 | | 11 years |
| Tradename | — | | — | | | 228 | | 3 years |
| Backlog | 3,100 | | 5 months | | — | | — | |
Total intangible assets(1) | $ | 12,500 | | | | $ | 14,083 | | |
(1) Intangible assets were valued using the income approach, which includes significant assumptions around future revenue growth, profitability, discount rates and customer attrition. Such assumptions are classified as level 3 inputs within the fair value hierarchy.
The Company incurred approximately $0.7 million and $0.4 million of costs related to the acquisitions of VODA and Fosler Construction, respectively, which were recorded as a component of our operating expenses in our Consolidated Statement of Operations for 2021.NOTE 24 – ACQUISITIONS AND DIVESTITURES
Acquisitions - Subsequent Event
OnFossil Power Systems
In February 1, 2022, we acquired 100% ownership of Fossil Power Systems, Inc, (“FPS”)FPS for approximately $59.1$59.2 million. The consideration paid included a hold-back of $5.9 million, excluding working capital adjustments. payable twenty-four months from the date of the acquisition if certain conditions of the purchase agreement are met and is recorded on the Consolidated Balance Sheets in Restricted cash and cash equivalents and Other accrued liabilities. Of the $5.9 million hold-back, $2.8 million was paid during the year ended December 31, 2023.
FPS is a leading designer and manufacturer of hydrogen, natural gas and renewable pulp and paper combustion equipment including ignitors, plant controls and safety systems based in Dartmouth, Nova Scotia, Canada.Canada and is reported as part of the B&W Thermal segment.
We finalized the purchase price allocation during the first quarter of 2023 using the discounted cash flow method for the assets acquired and liabilities assumed. The impact of the finalization was immaterial.
On
B&W Chanute
In February 28, 2022, we acquired 100% ownership of Optimus Industries, LLCB&W Chanute for approximately $19 million, excluding working capital adjustments. Optimus$19.2 million. B&W Chanute, designs and manufactures waste heat recovery products for use in power generation, petrochemical, and process industries, , including package boilers, watertube and firetube waste heat boilers, economizers, superheaters, waste heat recovery equipment and units for sulfuric acid plants and is based in Chanute, Kansas and Tulsa, Oklahoma andOklahoma. B&W Chanute Kansas. Optimus Industries, LLC will beis reported as part of ourthe B&W Thermal segment.
Assets HeldWe finalized the purchase price allocation during the first quarter of 2023 using the discounted cash flow method for Salethe assets acquired and liabilities assumed. The impact of the finalization was immaterial.
Hamon
Certain real propertyIn July 2022, we acquired certain assets of Hamon Holdings through a competitive sale process, in which B. Riley Securities, Inc. was Hamon Holding's investment banker and advisor through a Chapter 11 363 Asset Sale. We were the successful bidder for the Copley, Ohio location werecertain assets of one of those subsidiaries, Hamon, a major provider of air pollution control technology, for approximately $2.9 million.
Divestitures
In June 2022, we sold on March 15, 2021development rights related to a future renewable energy project for $4.0 million. We received $3.3 million of net proceeds after adjustments and recognized a gain on sale of $1.9$8.0 million. In conjunction with the sale, we executedrecognized a leaseback agreement commencing March 16, 2021 and expiring$6.2 million gain on March 31, 2033. These assets were treated as assets held for sale on oursale. We have $5.1 million in outstanding receivables related to the transaction recorded within Accounts receivable – other in the Consolidated Balance Sheets as ofat December 31, 2020.2023.
Certain real property assets for the Lancaster, Ohio location were sold onin August 13, 2021 for $18.9 million. We received $15.8 million of net proceeds after adjustments and expenses and recognized a gain on sale of $13.9 million. In conjunction with the sale, we executed a leaseback agreement commencing August 13, 2021 and expiringwhich expires on August 31, 2041. These assets were treated as assets held for sale on our Consolidated Balance Sheets as of December 31, 2020.
Certain real property assets at the Copley, Ohio location were sold in March 2021 for $4.0 million. We received $3.3 million of net proceeds after adjustments and recognized a gain on sale of $1.9 million. In December 2019,conjunction with the sale, we determined thatexecuted a small business within the B&W Thermal segment met the criteria to be classified as held for sale. At Decemberleaseback agreement commencing which expires on March 31, 2020, the carrying value of the net assets planned to be sold approximated the estimated fair value less costs to sell. Refer to Divestitures below as this sale closed March 5, 2021.
The following table summarizes the carrying value of the assets and liabilities held for sale at December 31, 2020:
| | | | | | |
(in thousands) | | December 31, 2020 |
Accounts receivable – trade, net | | $ | 2,103 | |
Accounts receivable – other | | 86 | |
Contracts in progress | | 458 | |
Inventories | | 1,676 | |
Other current assets | | 405 | |
Current assets held for sale | | 4,728 | |
| | |
Net property, plant and equipment | | 10,365 | |
Intangible assets | | 759 | |
Right-of-use-asset | | 32 | |
Non-current assets held for sale | | 11,156 | |
| | |
Total assets held for sale | | $ | 15,884 | |
| | |
Accounts payable | | $ | 5,211 | |
Accrued employee benefits | | 178 | |
Advance billings on contracts | | 370 | |
Accrued warranty expense | | 466 | |
Operating lease liabilities | | 32 | |
Other accrued liabilities | | 2,048 | |
Current liabilities held for sale | | 8,305 | |
| | |
Total liabilities held for sale | | $ | 8,305 | |
Divestitures2033.
EffectiveIn March 5, 2021, we sold all of the issued and outstanding capital stock of Diamond Power Machine (Hubei) Co., Inc, for $2.8 million. We received $2.0 million in gross proceeds before expenses and recorded an $0.8 million favorable contract asset for the amortization period from March 8, 2021that was amortized through December 31, 2023. For the twelve months ended December 31, 2021, we recognized a $1.8 million pre-tax loss, inclusive of the recognition of $4.5 million of currency translation adjustment, on the sale of the business and after consideration of certain working capital adjustments that are in dispute. Additional adjustments may be necessary as this is finalized.
On March 17, 2020, we fully settled the remaining escrow associated with the sale of PBRRC and received $4.5 million in cash.
Discontinued Operations
On April 6, 2020, we fully settled the remaining escrow associated with the sale of the MEGTEC and Universal businesses and received $3.5 million in cash.
NOTE 27 – NEW ACCOUNTING STANDARDS25 - SUBSEQUENT EVENT
We adoptedentered into a credit agreement on January 18, 2024, with certain of our subsidiaries as guarantors, the following accounting standard during the year ended December 31, 2021:lenders party thereto from time to time and Axos Bank ("Axos"), as administrative agent, swingline lender and letter of credit issuer (the "Credit Agreement").
Effective January 1, 2021 we adopted ASU 2019-12, Income Taxes (Topic 740): SimplifyingThe Credit Agreement provides for an up to $150.0 million asset-based revolving credit facility (with availability subject to a borrowing base calculation) ("Credit Facility"), including a $100.0 million letter of credit sublimit. Our obligations under the AccountingCredit Agreement are guaranteed by certain of our domestic and foreign subsidiaries. B. Riley has provided a guaranty of payment with regard to our obligations under the Credit Agreement, as further described below. We expect to use the proceeds and letter of credit availability under the Credit Agreement to (i) pay off our current revolving credit facility with PNC, (ii) provide for Income Taxes. The amendments in this update simplifyworking capital needs, (iii) provide cash collateral to secure letters of credit to be issued under the accountingCredit Agreement, and (iv) provide for income taxes by removing exceptions related to the incremental approach for intra-period tax allocation, certain deferred tax liabilities, and the general methodology for calculating income taxes in an interim period. The amendment also provides simplification related to accounting for franchise (or similar) tax, evaluating the tax basis step up of goodwill, allocation of consolidated current and deferred tax expense, reflection of the impact of enacted tax law or rate changes in annual effective tax rate calculations in the interim period that includes enactment date, and other minor codification improvements. The impact of this standard on our consolidated financial statements was immaterial.corporate purposes.
In March 2021,The Credit Agreement has a maturity date of (i) January 18, 2027, or (ii) if our 8.125% Senior Notes and 6.50% Senior Notes are not refinanced by August 30, 2025 or the FASB issued ASU 2021-01, Referencematurity date has not otherwise been extended to a date at least 6 months beyond the Credit Facility maturity, August 30, 2025. The interest rates applicable under the Credit Agreement are: (i) with respect to SOFR Loans, (a) SOFR plus 5.25% if the outstanding principal amount of loans is equal to or less than $100.0 million or (b) SOFR plus 4.00% if the outstanding principal amount of loans is equal to or greater than $100.0 million; (ii) with respect to Base Rate Reform (Topic 848): Scope. The amendments in this update clarify that certain optional expedientsLoans, the greater of (a) the Federal Funds Rate plus 2.00% plus the Applicable Margin, (b) the prime rate as designated by Axos plus the Applicable Margin, and exceptions in Topic 848 for contract modifications(c) Daily Simple SOFR plus 1.00% plus the Applicable Margin; and hedge accounting apply(iii) with respect to derivatives that are affected by the discounting transition. This update is an amendment to ASU 2020-04, Reference Rate Reform (Topic 848): Facilitation ofdefault rate under the Effects of Reference Rate Reform of Financial Reporting, which was issued in March 2020 and provides optional expedients and exceptions for applying generally accepted accounting principles to contracts, hedging relationships, and other transactions affected by referenceCredit Agreement, the then-existing interest rate reform if certain criteria are met. The amendments in the updates apply only to contracts, hedging relationships, and other transactions that reference LIBOR or another reference rate expected to be discontinued because of reference rate reform. The expedients and exceptions provided by the updates do not apply to contract modifications made and hedging relationships entered into or evaluated after December 31, 2022, except for hedging relationships existing as of December 31, 2022, that an entity has elected certain optional expedients for and that are retained through the end of the hedging relationship. As of December 31, 2021, we have not yet elected any optional expedients provided in the standard. We will apply the accounting relief as relevant contract and hedge accounting relationship modifications are made during the reference rate reform transition period. We do not expect the standard to have a material impact on our consolidated financial statements.plus 2.00%.
In May 2021,connection with the FASB issued ASU 2021-04, Earnings Per Share (Topic 260), Debt-ModificationsCredit Agreement, we are required to pay (i) an origination fee equal to $1.5 million, (ii) a commitment fee equal to 0.50% per annum multiplied by the positive difference by which the Aggregate Revolving Commitments exceed the Total Revolving Outstandings, subject to adjustment, (iii) a facility fee equal to the Applicable Margin for SOFR Loans multiplied by the positive difference by which the actual daily amount of L/C Obligations the Administrative Agent is then holding Specified Cash Collateral exceeds the actual daily Outstanding Amount of Revolving Loans, and Extinguishments (Subtopic 470-50), Compensation-Stock Compensation (Topic 718), and Derivatives and Hedging-Contracts in Equity's Own Equity (Subtopic 815-40): Issuer's Accounting for Certain Modifications(iv) a collateral monitoring fee of $1,000 per month. We are permitted to prepay all or Exchanges of Freestanding Equity-Classified Written Call Options (a consensusany portion of the FASB Emerging Issues Task Force). The amendments in this update affect all entities that issue freestanding written call options that are classified in equity. Specifically,loans under the amendments affect those entities when a freestanding equity-classified written call option is modified or exchanged and remains equity classified after the modification or exchange. The amendments that relateCredit Agreement prior to the recognition and measurement of EPS for certain modifications or exchanges of freestanding equity-classified written call options affect entities that present EPS in accordance with the guidance in Earnings Per Share (Topic 260). The amendments in this update do not apply to modifications or exchanges of financial instruments that are within the scope of another Topic. That is, accounting for those instruments continues to bematurity subject to the requirementspayment of an early termination fee. The Credit Agreement requires mandatory prepayments under certain circumstances, including in other Topics. The amendments in this update do not affect a holder’s accounting for freestanding call options. The update is applicable to B&W as we have previously issued freestanding written call options. Asthe event of December 31, 2021, these options remain unexercised and we will apply the accounting standard as freestanding written call options are modified or exchanged. We do not expect the standard to have a material impact on our consolidated financial statements.an over-advance.
The obligations under the Credit Agreement are secured by substantially all assets of B&W and each of the guarantors, in each case subject to intercreditor arrangements. The Credit Agreement contains certain representations and warranties, affirmative covenants, negative covenants and conditions that are customarily required for similar financings. The Credit Agreement requires us to comply with certain financial maintenance covenants, including a quarterly fixed charge coverage test, a quarterly total net leverage ratio test, a cash repatriation covenant, a minimum liquidity covenant, an annual cap on maintenance capital expenditures and a limit on unrestricted cash. The Credit Agreement also contains customary events of default (subject, in certain instances, to specified grace periods) including, but not limited to, the failure to make payments of interest or premium, if any, on, or principal under the Credit Agreement, the failure to comply with certain covenants and agreements specified in the Credit Agreement, defaults in respect of certain other indebtedness, and certain events of insolvency. If any event of default occurs, Axos may declare the principal, premium, if any, interest and any other monetary obligations on all the then outstanding amounts under the Credit Agreement may become due and payable immediately.
In connection with the our entry into the Credit Agreement, we entered into with B. Riley (i) a guaranty agreement in favor of (a) Axos, in its capacity as administrative agent under the Credit Agreement, for the ratable benefit of the Secured Parties and (b) such Secured Parties (the “B. Riley Guaranty”) and (ii) a fee and reimbursement agreement, made by B. Riley and accepted and agreed to by the Company (the “B. Riley Fee Agreement”). The B. Riley Guaranty provides for the guarantee of all of our obligations under the Credit Agreement. The B. Riley Guaranty is enforceable in certain circumstances, including, among others, certain events of default and the acceleration of our obligations under the Credit Agreement. The B. Riley Fee Agreement provides, among other things, for an annual fee to be paid to B. Riley by us in an annual amount equal to 2.00% of Aggregate Revolving Commitments under the Credit Agreement (or approximately $3 million) as consideration for B. Riley’s agreements and commitments under the B. Riley Guaranty. The B. Riley Fee Agreement also requires us to reimburse B. Riley to the extent the B. Riley Guaranty is called upon by the agent or lenders under the Credit Agreement and requires
New accounting standards not yet adopted that could affect our Consolidated Financial Statements inus to execute a junior secured promissory note with respect to the future are summarizedsame within 60 days after the execution of the B. Riley Fee Agreement (or such other date as follows:B. Riley may agree to).
In October 2021,On March 15 2024, we entered into Amendment No. 4 to the FASB issued ASU 2021-08, Business Combinations (Topic 805): AccountingReimbursement Agreement (the "Fourth Amended Reimbursement Agreement"), which modified certain financial maintenance covenants for Contract Assetsfuture periods beginning with the fiscal quarter ended on December 31, 2023. The Fixed Charge Coverage Ratio was amended to 0.93 to 1.0 for the fiscal quarter ending December 31, 2023, 0.82 to 1.0 for the fiscal quarter ending March 31, 2024, 0.90 to 1.0 for the fiscal quarter ending June 30, 2024, 0.95 to 1.0 for the fiscal quarter ending September 30, 2024, 1.1 to 1.0 for the fiscal quarter ending December 31, 2024, and Contract Liabilities from Contracts with Customers. 1.25 to 1.0 for the fiscal quarter ending March 31, 2025 and thereafter. The amendment in this update provides an exceptionSenior Net Leverage Ratio condition to fair value measurement for contract assets and contract liabilities (i.e., deferred revenue) acquired in a business combination. As a result, contract assets and contract liabilities will be recognized and measured by the acquirer in accordance with ASC 606, Revenue from Contracts with Customers. The amendment also improves consistency in revenue recognitionpayment of any Permitted Restricted Payments, as defined in the post-acquisitionFourth Amended Reimbursement Agreement, was amended to 1.45 to 1.0 for the four quarter fiscal measurement period for acquired contractsending as comparedof December 31, 2023 and 1.25 to contracts entered into after1.0 thereafter. The Fourth Amended Reimbursement Agreement also amends the business combination.minimum cash flow covenants set forth in the Reimbursement Agreement to no less than $10.0 million as of December 31, 2023 (for the preceding fiscal quarter), no less than $15.0 million as of December 31, 2024 (for the preceding fiscal year), and no less than $25.0 million as of December 31 of each fiscal year thereafter. The amendment in this update is effective for public business entities in January 2023; all other entities haveApplicable Margin with respect to Delayed Draw Term Loans and Cash Collateral Commitment Fees will increase by an additional year to adopt. Early adoption is permitted; however,0.50% on each of April 30, 2024, July 1, 2024, October 1, 2024, January 1, 2025 and April 1, 2025 in each case if the new guidance is adoptedObligations are in an interim period, it is required to be applied retrospectively to all business combinations withinexcess of $15 million on the year of adoption. This amendment is effective for fiscal years beginning after December 15, 2022, including interim periods within those fiscal years. We are currently evaluating the impact of the standard on our consolidated financial statements.
In August 2020, the FASB issued ASU 2020-06, Debt – Debt with Conversion and Other Options (Subtopic 470-20) and Derivatives and Hedging – Contracts in Entity’s Own Equity (Subtopic 815 – 40). The amendments in this update simplify the accounting for certain financial instruments with characteristics of liabilities and equity, including convertible instruments and contracts on an entity’s own equity by removing major separation models required under current U.S. GAAP. The amendments also improve the consistency of diluted earnings per share calculations. The amendments in this update are effective for public business entities that meet the definition of an SEC filer, excluding entities eligible to be smaller reporting companies as defined by the SEC, for fiscal years beginning after December 15, 2021, including interim periods within those fiscal years. For all other entities, the amendments are effective for fiscal years beginning after December 15, 2023, including interim periods within those fiscal years. Early adoption is permitted, but no earlier than fiscal years beginning after December 15, 2020, including interim periods within those fiscal years. We are currently evaluating the impact of the standard on our consolidated financial statements.
In November 2018, the FASB issued ASU 2018-19, Codification Improvements to Topic 326: Financial Instruments - Credit Losses. This update is an amendment to the new credit losses standard, ASU 2016-13, Financial Instruments—Credit Losses (Topic 326): Measurement of Credit Losses on Financial Instruments, that was issued in June 2016 and clarifies that operating lease receivables are not within the scope of Topic 326. The new credit losses standard changes the accounting for credit losses for certain instruments. The new measurement approach is based on expected losses, commonly referred to as the current expected credit loss (CECL) model, and applies to financial assets measured at amortized cost, including loans, held-to-maturity debt securities, net investment in leases, and reinsurance and trade receivables, as well as certain off-balance sheet credit exposures, such as loan commitments. The standard also changes the impairment model for available-for-sale debt securities. The provisions of this standard will primarily impact the allowance for doubtful accounts on our trade receivables, contracts in progress, and potentially our impairment model for available-for-sale debt securities (to the extent we have any upon adoption). For public, smaller reporting companies, this standard is effective for fiscal years beginning after December 15, 2022, including interim periods within those fiscal years. We are currently evaluating the impact of both standards on our consolidated financial statements.applicable date.
Item 9. Changes in and Disagreements with Accountants on Accounting and Financial Disclosure
None
Item 9A. Controls and Procedures
Evaluation of Disclosure Controls and Procedures
As of the end of the period covered by this report, the Company's management, with the participation of our Chief Executive Officer and the Chief Financial Officer, haswe have evaluated the effectiveness of the design and operation of our disclosure controls and procedures (as that term is defined inas promulgated by Rules 13a-15(e) and 15d-15(e) adopted by the Securities and Exchange Commission under the Securities Exchange Act under the supervision and with the participation of 1934, as amended (the "Exchange Act")). Our disclosure controlsmanagement, including our Chief Executive Officer and procedures, by their nature, can provide only reasonable assurance regarding the control objectives. It should be noted that the design of any system of disclosure controls and procedures is based in part upon various assumptions about the likelihood of future events, and we cannot assure that any design will succeed in achieving its stated goals under all potential future conditions, regardless of how remote.
Chief Financial Officer. Based on thethis evaluation, referred to above, our Chief Executive Officer and Chief Financial Officer concluded that the design and operation of our disclosure controls and procedures arewere not effective as of December 31, 2021 to provide reasonable assurance2023 because of the material weaknesses in internal controls over financial reporting described below.
Notwithstanding the conclusion by our Chief Executive Officer and Chief Financial Officer that information required to be disclosed by usour disclosure controls and procedures as of December 31, 2023 were not effective, our management, including our Chief Executive Officer and Chief Financial Officer, has concluded that our Consolidated Balance Sheets as of December 31, 2023 and 2022, and the related Consolidated Statements of Operations, Comprehensive (Loss) Income, Stockholders' (Deficit) Equity and Cash Flows for each of the years in the reports that we file or submit underthree-year period ended December 31, 2023, present fairly, in all material respects, our financial position, results of operations and cash flows for the Exchange Act is recorded, processed, summarized and reported within the time periods specifiedpresented in the rules and forms of the Securities and
Exchange Commission, and such information is accumulated and communicated to management as appropriate to allow timely decisions regarding disclosure.this Annual Report on Form 10-K, in conformity with GAAP.
Management's Report on Internal Control Over Financial Reporting
B&W'sOur management is responsible for establishing and maintaining adequate internal control over financial reporting (asas defined in Rules 13a-15(f) and 15d-15(f) underof the Securities Exchange Act of 1934, as amended). Our internal control over financial reporting includes, among other things, policies and procedures for conducting business, information systems for processing transactions and an internal audit department. Mechanisms are in place to monitor the effectiveness of our internal control over financial reporting and actions are taken to remediate identified internal control deficiencies. Our procedures for financial reporting include the involvement of senior management, our Audit and Finance Committee and our staff of financial and legal professionals.Act. Our financial reporting process and associated internal controls were designed to provide reasonable assurance to management and the Board of Directors regarding the reliability of financial reporting and the preparation of our Consolidated Financial Statements for external reporting in accordance with accounting principles generally accepted in the United States of America.
On September 30, 2021, we acquired a 60% controlling ownership in Fosler Construction and on November 30, 2021, we acquired 100% ownership of VODA, as described in Note 26 of the Consolidated Financial Statements in Part I of this report. In accordance with the SEC’s general guidance that an assessment of a recently acquired business may be omitted from our internal control over financial reporting scope in the year of acquisition we excluded the acquired businesses from management’s report on internal control over financial reporting.GAAP.
Management, with the participation of our principal executiveChief Executive Officer and financial officers,Chief Financial Officer, assessed the effectiveness of our internal control over financial reporting as of December 31, 2021.2023. Management based its assessment on criteria established in Internal Control–Integrated Framework issued by the Committee of Sponsoring Organizations of the Treadway Commission (2013 framework)("2013 Framework"). BecauseBased on this assessment, management has concluded, based on the existence of its inherent limitations,the material weaknesses described below, that we did not maintain effective internal control over financial reporting.
A material weakness is a systemdeficiency, or a combination of deficiencies, in internal control over financial reporting can provide onlysuch that there is a reasonable assurance as to its effectiveness and maypossibility that a material misstatement of our annual or interim financial statements will not preventbe prevented or detect misstatements. Further, because of changing conditions, effectiveness of internaldetected on a timely basis.
We have determined certain control over financial reporting may vary over time. Based on our assessment, management has concluded that B&W's internal control over financial reporting was effective at the reasonable assurance level described abovedeficiencies exist as of December 31, 2021.
2023 in three components of internal control based on criteria established in the 2013 Framework, as follows:
Attestation ReportControl Environment
We did not maintain an effective control environment based on the criteria established in the 2013 Framework and identified deficiencies in the principles associated with the Control Environment component of Independent Registered Public Accounting Firmthe 2013 Framework that constitute material weaknesses, either individually or in the aggregate. Specifically, we failed to maintain a sufficient complement of qualified technical accounting and financial reporting personnel to perform control activities, including those involving complex and/or non-routine transactions. Further, we failed to adequately train our employees timely on business processes and controls and failed to hold personnel accountable for internal control responsibilities. The control deficiencies noted above contributed to control deficiencies in the control activities and monitoring components of the 2013 Framework.
Control Activities
We did not maintain effective control activities based on the criteria established in the 2013 Framework and identified deficiencies in the principles associated with the Control Activities component of the 2013 Framework that constitute material weaknesses, either individually or in the aggregate. Specifically, processes and/or controls regarding the preparation and independent review of account reconciliations, including in the area of contract accounting, or related financial statement analysis prepared in conformity with GAAP were not performed or were not performed timely. We did not maintain effective control activities over complex and/or non-routine transactions. Additionally, we did not have sufficient control activities designed and implemented to restrict technology access rights to a level commensurate with job responsibilities for certain authorized users. We did not maintain control activities over user access to technology at one international component. We did not maintain control activities to ensure that appropriate segregation of duties is maintained. Further, our control activities over the review and approval of manual journal entries were not designed and implemented to be performed at an appropriate level of detail or by appropriate individuals within the corporate accounting function.
Monitoring
We did not maintain effective monitoring activities based on the criteria established in the 2013 Framework and identified deficiencies in the principles associated with the Monitoring component of the 2013 Framework that constitute material weaknesses, either individually or in the aggregate. Specifically, we did not develop and perform ongoing evaluations to ascertain whether the components of internal control were present and functioning. Further, we did not monitor the transition of control activities during employee changes.
The material weaknesses described above contributed to accounting errors identified and corrected throughout 2023 and contributed to the potential for there to have been material accounting errors in substantially all financial statement account balances and disclosures that would not have been prevented or detected on a timely basis.
Our independent registered public accounting firm, Deloitte & Touche LLP, who audited the Consolidated Financial Statements included in this Annual Report on Form 10-K issued an adverse opinion on the effectiveness of our internal control over financial reporting as of December 31, 2021 has been audited byreporting. Deloitte & Touche LLP, our independent registered public accounting firm, as stated in theirLLP's report which is included herein.
Remediation Plan
We are committed to maintaining strong internal control over financial reporting. In response to the material weaknesses described above, management, with the oversight of the Audit and Finance Committee of the Board of Directors, is taking comprehensive actions to remediate the above material weaknesses. Our remediation plan includes the following:
•hired and are continuing to hire professionals with the appropriate skills to perform control activities, including those involving complex and/or non-routine transactions;
•augmented our internal resources by employing several consultants with deep experience in Item 8, Financial Statementsaccounting and Supplementary Data underfinancial reporting and we plan to continue to utilize these resources until we add personnel to our staff mentioned above;
•developing and providing incremental training to the heading “Reportaccounting and financial reporting team;
•designing and implementing additional and/or enhanced controls in the areas of Independent Registered Public Accounting Firm,”account reconciliations, contract accounting, financial statement analysis prepared in conformity with GAAP and is incorporated herein by reference.manual journal entries;
•designing and implementing controls to address the identification, accounting, review and reporting of complex and/or non-routine transactions;
•enhancing controls over user access to restrict technology access rights to authorized users to a level commensurate with job responsibilities, including performing user access reviews more frequently and at a greater level of precision;
•enhancing controls over segregation of duties;
•with the guidance and participation of our internal audit function, we are developing a monitoring program to:
◦evaluate and assess whether controls are present and functioning in a timely manner; and,
◦hold individuals accountable for their internal control responsibilities.
The material weaknesses will not be considered remediated until the new and redesigned controls operate for a sufficient period of time and management has concluded, through testing, that these controls are operating effectively. We believe the above measures will remediate the control deficiencies identified and strengthen our internal control over financial reporting. As we continue to evaluate and work to remediate the control deficiencies that gave rise to the material weaknesses, we may determine that additional measures or time are required to address the control deficiencies or that we need to modify or otherwise adjust the remediation measures described above. We will continue to assess the effectiveness of our remediation efforts in connection with our evaluation of our internal control over financial reporting.
Changes in Internal Control Over Financial Reporting
ThereOther than described above, there were no changes in our internal control over financial reporting during the yearquarter ended December 31, 20212023 that have materially affected, or are reasonably likely to materially affect, our internal control over financial reporting. We have not experienced any material impact to our internal controls over financial reporting, despite the fact that some of our team members are working remotely in response to the COVID-19 pandemic. In addition, during 2021, the Company outsourced certain support functions to external service providers of which some were still in transition as of December 31, 2021. We are continually monitoring and assessing these situations on our internal controls to ensure their operating effectiveness.
REPORT OF INDEPENDENT REGISTERED PUBLIC ACCOUNTING FIRM
To the Stockholders and the Board of Directors of Babcock & Wilcox Enterprises, Inc.:
Opinion on Internal Control over Financial Reporting
We have audited the internal control over financial reporting of Babcock & Wilcox Enterprises, Inc. and subsidiaries (the “Company”) as of December 31, 2021,2023, based on criteria established in Internal Control — Integrated Framework (2013) issued by the Committee of Sponsoring Organizations of the Treadway Commission (COSO). In our opinion, because of the effect of the material weaknesses identified below on the achievement of the objectives of the control criteria, the Company has not maintained in
all material respects, effective internal control over financial reporting as of December 31, 2021,2023, based on criteria established in Internal Control — Integrated Framework (2013) issued by COSO.
We have also audited, in accordance with the standards of the Public Company Accounting Oversight Board (United States) (PCAOB), the consolidated financial statements as of and for the year ended December 31, 2021,2023, of the Company and our report dated March 8, 202215, 2024, expressed an unqualified opinion on those financial statements and included an explanatory paragraph regarding the Company’s change in accounting principle.statements.
As described in Item 9A, management excluded from its assessment the internal control over financial reporting at Fosler Construction Company Inc. and VODA A/S, which were acquired on September 30, 2021, and November 30, 2021, respectively, and whose financial statements constitute approximately 14% of total assets and 2% of revenues of the consolidated financial statement amounts as of and for the year ended December 31, 2021. Accordingly, our audit did not include the internal control over financial reporting at these acquired entities.
Basis for Opinion
The Company’s management is responsible for maintaining effective internal control over financial reporting and for its assessment of the effectiveness of internal control over financial reporting, included in the accompanying Item 9A. Our responsibility is to express an opinion on the Company’s internal control over financial reporting based on our audit. We are a public accounting firm registered with the PCAOB and are required to be independent with respect to the Company in accordance with the U.S. federal securities laws and the applicable rules and regulations of the Securities and Exchange Commission and the PCAOB.
We conducted our audit in accordance with the standards of the PCAOB. Those standards require that we plan and perform the audit to obtain reasonable assurance about whether effective internal control over financial reporting was maintained in all material respects. Our audit included obtaining an understanding of internal control over financial reporting, assessing the risk that a material weakness exists, testing and evaluating the design and operating effectiveness of internal control based on the assessed risk, and performing such other procedures as we considered necessary in the circumstances. We believe that our audit provides a reasonable basis for our opinion.
Definition and Limitations of Internal Control over Financial Reporting
A company’s internal control over financial reporting is a process designed to provide reasonable assurance regarding the reliability of financial reporting and the preparation of financial statements for external purposes in accordance with generally accepted accounting principles. A company’s internal control over financial reporting includes those policies and procedures that (1) pertain to the maintenance of records that, in reasonable detail, accurately and fairly reflect the transactions and dispositions of the assets of the company; (2) provide reasonable assurance that transactions are recorded as necessary to
permit preparation of financial statements in accordance with generally accepted accounting principles, and that receipts and expenditures of the company are being made only in accordance with authorizations of management and directors of the company; and (3) provide reasonable assurance regarding prevention or timely detection of unauthorized acquisition, use, or disposition of the company’s assets that could have a material effect on the financial statements.
Because of its inherent limitations, internal control over financial reporting may not prevent or detect misstatements. Also, projections of any evaluation of effectiveness to future periods are subject to the risk that controls may become inadequate because of changes in conditions, or that the degree of compliance with the policies or procedures may deteriorate.
Material Weaknesses
A material weakness is a deficiency, or a combination of deficiencies, in internal control over financial reporting, such that there is a reasonable possibility that a material misstatement of the company’s annual or interim financial statements will not be prevented or detected on a timely basis. The following control deficiencies constitute material weaknesses, either individually or in the aggregate and are included in management's assessment:
Control Environment
The Company did not maintain an effective control environment based on the criteria established in the 2013 Framework and identified deficiencies in the principles associates with the control environment of the 2013 Framework that constitute material weaknesses, either individually or in the aggregate.Specifically, the Company failed to maintain a sufficient complement of qualified technical accounting and financial reporting personnel to perform control activities, including those involving complex and/or non-routine transactions.Further, the Company failed to adequately train their employees timely on business processes and controls and failed to hold personnel accountable for internal control responsibilities.
Control Activities
The Company did not maintain effective control activities based on the criteria established in the 2013 Framework and identified deficiencies in the principles associates with the control activities of the 2013 Framework that constitute material weaknesses, either individually or in the aggregate.Specifically, processes and/or controls regarding the preparation and independent review of account reconciliations, including in the area of contract accounting, or related financial statement analysis prepared in conformity with GAAP were not performed or were not performed timely.The Company did not maintain effective control activities over complex and/or non-routine transactions. Additionally, the Company did not have sufficient control activities designed and implemented to restrict technology access rights to a level commensurate with job responsibilities for certain authorized users. The Company did not maintain control activities over user access to technology at one international component. The Company did not maintain control activities to ensure that appropriate segregation of duties is maintained. Further, control activities over the review and approval of manual journal entries were not designed and implemented to be performed at the appropriate level of detail or by appropriate individuals within the corporate accounting function.
Monitoring
The Company did not design and implement effective monitoring activities based on the criteria established in the 2013 Framework and identified deficiencies in the principles associates with the monitoring of the 2013 Framework that constitute material weaknesses, either individually or in the aggregate. Specifically, the Company did not develop and perform ongoing evaluations to ascertain whether the components of internal control were present and functioning. Further, the Company did not monitor the transition of control activities during employee changes.
These material weaknesses were considered in determining the nature, timing, and extent of audit tests applied in our audit of the consolidated financial statements as of and for the year ended December 31, 2023, of the Company, and this report does not affect our report on such financial statements.
/s/ Deloitte & Touche LLP
Cleveland, Ohio
March 8, 202215, 2024
Item 9B. Other Information
OnAs discussed in Note 25 to the Consolidated Financial Statements included in Part II, Item 8 of this Annual Report, on March 2, 2022, our Board15 2024, we entered into Amendment No. 4 to the Reimbursement Agreement (the "Fourth Amended Reimbursement Agreement"), which modified certain financial maintenance covenants for future periods beginning with the fiscal quarter ended on December 31, 2023. The Fixed Charge Coverage Ratio was amended to 0.93 to 1.0 for the fiscal quarter ending December 31, 2023, 0.82 to 1.0 for the fiscal quarter ending March 31, 2024, 0.90 to 1.0 for the fiscal quarter ending June 30, 2024, 0.95 to 1.0 for the fiscal quarter ending September 30, 2024, 1.1 to 1.0 for the fiscal quarter ending December 31, 2024, and 1.25 to 1.0 for the fiscal quarter ending March 31, 2025 and thereafter. The Senior Net Leverage Ratio condition to payment of Directors approvedany Permitted Restricted Payments, as defined in the Fourth Amended Reimbursement Agreement, was amended to 1.45 to 1.0 for the four quarter fiscal measurement period ending as of December 31, 2023 and 1.25 to 1.0 thereafter. The Fourth Amended Reimbursement Agreement also amends the minimum cash flow covenants set forth in the Reimbursement Agreement to no less than $10.0 million as of December 31, 2023 (for the preceding fiscal quarter), no less than $15.0 million as of December 31, 2024 (for the preceding fiscal year), and no less than $25.0 million as of December 31 of each fiscal year thereafter. The Applicable Margin with respect to Delayed Draw Term Loans and Cash Collateral Commitment Fees will increase by an additional 0.50% on each of April 30, 2024, July 1, 2024, October 1, 2024, January 1, 2025 and April 1, 2025 in each case if the Obligations are in excess of $15 million on the applicable date.
We paid an amendment fee of $0.4 million to our Amended and Restated Bylaws of Babcock & Wilcox Enterprises, Inc. (the “Amendment”). Pursuant to such amendment, the entirety of Section 2.10(e) was deleted. As a resultMSD in consideration of the Amendment, our Bylaws no longer include an age limitation for members of our Board of Directors.Fourth Amended Reimbursement Agreement. The effective dateforegoing description is qualified in its entirety by the complete text of the Amendment is March 2, 2022. A complete copy of the Bylaws reflecting the AmendmentFourth Amended Reimbursement Agreement, which is attached to this Annual Report on Form 10-K as Exhibit 3.4.
10.68.
PART III
Item 9C. Disclosure Regarding Foreign Jurisdictions that Prevent Inspections
Not Applicable
PART III
Item 10. Directors, Executive Officers and Corporate Governance
The information required to be furnished by this item with respect to directors is incorporated by reference to the material appearing under the heading “Election of Directors”will be set forth in the Proxy Statement for our 20212024 Annual Meeting of Stockholders. The information required by this item with respect to compliance with section 16(a) of the Securities and Exchange Act of 1934, as amended, is incorporated by reference to the material appearingStockholders under the heading “Sectionheadings "Election of Directors," "Section 16(a) Beneficial Ownership Compliance” inCompliance," and the Proxy Statement for our 2022 Annual Meeting of Stockholders. The information required by this item with respect to the Audit Committee"Director Independence" and Audit"Audit and Finance Committee financial experts is incorporated by reference to the material appearing in the “Director Independence” and “Audit and Finance Committee”Committee" sections under the heading “Corporate"Corporate Governance –Board- Board of Directors and Its Committees” inCommittees" and is incorporated herein by reference and made a part hereof from the Proxy Statement for our 2021 Annual Meeting of Stockholders.Statement.
We have adopted a Code of Business Conduct that applies to all our directors, officers, and employees. Additionally, as a supplement to the Code of Business Conduct, we maintain a Code of Ethics for the Chief Executive Officer and Senior Financial Officers that applies to our employeesChief Executive Officer, Chief Financial Officer, Treasurer and directors, including, specifically, our chief executive officer, our chief financial officer, our chief accounting officer, and our other executive officers.persons performing similar functions. Our codeCode of Business Conduct satisfies the requirements for a “code of ethics” within the meaning of SEC rules. A copy of the codeCode of Business Conduct is posted on our web site, www.babcock.com under “Investor Relations“Investors – Corporate Governance – Highlights.Governance.” We intend to disclose promptly on our website any amendments to, or waivers of, the code covering our chief executive officer, chief financial officer and chief accounting officer.
EXECUTIVE OFFICERS
Our executive officers and their ages as of March 1, 2022,2024, are as follows: | | | | | | | | |
| Name | Age | Position |
| Kenneth Young | 5860 | Chairman and Chief Executive Officer |
| Louis Salamone | 7577 | Executive Vice President, Chief Financial Officer and Chief Accounting Officer |
| Jimmy B. Morgan | 5355 | Executive Vice President and Chief Operating Officer |
| John J. Dziewisz | 5658 | Executive Vice President, General Counsel and Corporate Secretary |
| Chris Riker | 41 | Senior Vice President, Thermal |
Kenneth Young has served as our Chief Executive Officer since November 2018 and as the Chairman of our Board of Directors since September 2020. Mr. Young also serves as the President of B. Riley, Financial, Inc. (“B. Riley”), a provider of collaborative financial services and solutions, since July 2018, and as Chief Executive Officer of B. Riley’s subsidiary, B. Riley Principal Investments, since October 2016. From August 2008 to March 2016, Mr. Young served as the President and Chief Executive
Officer of Lightbridge Communications Corporation (f/k/a LCC International, Inc.), a provider of integrated end-to-end solutions for wireless voice and data communications networks. Mr. Young hasformerly served as a member of the boards of directors of Globalstar, Inc. since 2015,, Orion Energy Systems, Inc. since 2017,, Liberty Tax, Inc. since 2018 and bebe stores, inc. since 2018. Mr. Young previously served, as a member of the boards of directors ofwell as B. Riley from 2015 to 2016 and Standard Diversified Opportunities Inc. from 2015 to 2017.
Louis Salamone has served as our Executive Vice President, Chief Financial Officer and Chief Accounting Officer since August 2019. Before that, Mr. Salamone served as our Chief Financial Officer since February 2019. Prior to that, Mr. Salamone served as the Company'sour Executive Vice President of Finance since November 2018. Mr. Salamone also served as an advisor to MDx Diagnostics, LLC, a provider of medical devices, from December 2017 until February 2019. From April 2013 until December 2017, Mr. Salamone served as Chief Financial Officer of CityMD, an urgent care provider. Prior to joining CityMD, Mr. Salamone was Vice President and Chief Financial Officer of OpenPeak Inc., a provider of mobile cybersecurity solutions, from April 2009 until March 2013, and Executive Vice President and Chief Financial Officer of LCC, from June 2006 until April 2009.
Jimmy B. Morgan has served as Chief Operating Officer of The Babcock & Wilcox Company since August 2020 and was additionally named Executive Vice President onin January 1, 2022. . He has also served as Managing Director of our Babcock & Wilcox Vølund subsidiary since March 2020.subsidiary. Previously, Mr. Morgan served as our Senior Vice President, Babcock & Wilcox from January 2019 to August 2020. From December 2016 until January 2019, Mr. Morgan served as Senior Vice President, Renewable,with responsibility for the company’s Babcock & Wilcox Vølund subsidiary and for Babcock & Wilcox’s operations and maintenance services businesses. From August 2016 to December 2016, he served as Senior Vice President, Operations. He was Vice President, Operations from May 2016 to August 2016 and was Vice President and General Manager of Babcock & Wilcox Construction Co., Inc. from February 2016 to May 2016. Before joining Babcock & Wilcox, he was President of Allied Technical Resources, Inc., a technical staffing company, from September 2013 to January 2016. Previous positions included serving as Chief Operating Officer with BHI Energy, Vice President of Installation and Modification Services with Westinghouse Electric Company, and as Managing Director for AREVA T&D. He began his career with Duke Energy.
John J. Dziewisz served as our Executive Vice President and General Counsel since January 2022 and as our Senior Vice President and Corporate Secretary since February 1, 2020. He was additionally named Executive Vice President on January 1, 2022 and the Company’s General Counsel on January 27, 2022.He also serves as the Company’sour Chief Compliance Officer. Previously, Mr. Dziewisz served as the General Counsel of The Babcock & Wilcox Company from February 2020 to January 2022, as well as our Vice President, Assistant General Counsel & Chief Compliance Officer from January 2019 to February 2020. From June 2013 until January 2019, Mr. Dziewisz served as Assistant General Counsel, Operations & Intellectual Property. From June 2005 until June 2013, Mr. Dziewisz served as Managing Attorney with the Company.Attorney. Mr. Dziewisz joined the Companyus in 1997.
Chris Riker has served as Senior Vice President, Thermal since August 2022 with responsibility for our global thermal energy business. He has also served as Senior Vice President, Global Parts and Service from 2018 to 2022, where he led us worldwide parts and services business, and Vice President, Industrial Steam Generation from 2016 to 2018 where he had responsibility over package boiler, pulp and paper and petrochemical businesses. Prior to that, he led the Finance organization for former Global Services segment after serving as Controller for Diamond Power International, Inc. subsidiary. Chris first joined Babcock & Wilcox in the role of Manager of Internal Audit in 2010 after serving as a consultant with KPMG, LLP.
Item 11. Executive Compensation
The information required by this item is incorporated by reference to the material appearing under the headings “Compensation of Directors” and “Compensation of Executive Officers” in the Proxy Statement for our 20222024 Annual Meeting of Stockholders.Stockholders
Item 12. Security Ownership of Certain Beneficial Owners and Management and Related Stockholder Matters
The following table provides information on our equity compensation plans as of December 31, 2021:2023:
| | | | | |
| (share data in thousands) | |
| Equity Compensation Plan Information |
| Plan Category | Equity compensation plans approved by security holders |
| Number of securities to be issued upon exercise of outstanding options and rights | 2,0931,086 |
| Weighted-average exercise price of outstanding options and rights | $19.117.35 |
| Number of securities remaining available for future issuance | 3263,952 |
The other information required by this item is incorporated by reference to the material appearing under the headings “Security Ownership of Directors and Executive Officers” andheading “Security Ownership of Certain Beneficial Owners”Owners and Management” in the Proxy Statement for our 20222024 Annual Meeting of Stockholders.
Item 13. Certain Relationships and Related Transactions, and Director Independence
Information required by this item is incorporated by reference to the material appearing under the headings “Corporate Governance – Director Independence” and “Certain Relationships and Related Transactions” in the Proxy Statement for our 2022 Annual Meeting of Stockholders.
Item 14. Principal Accountant Fees and Services
The information about aggregate fees billed to us by our principal accountant, Deloitte & Touche LLP (PCAOB ID No. 34) will be presented under the caption "Ratification of Appointment of Independent Registered Public Accounting Firm for Year Ending December 31, 2022”2024” in the Proxy Statement for our 20222024 Annual Meeting of Stockholders.
PART IV
Item 15. Exhibits, Financial Statement Schedules
a) The following documents are filed as part of this Annual Report on Form 10-K:
1) Financial Statements—the consolidated financial statements of Babcock & Wilcox Enterprises, Inc. and its consolidated subsidiaries are included in Part II, Item 8 of this Annual Report on Form 10-K.
2) Exhibits—the exhibit index listed in the exhibit index below are filed with, or incorporated by reference in, this Annual Report on Form 10-K.
EXHIBIT INDEX
| | | | | | | | |
| | Master Separation Agreement, dated as of June 8, 2015, between The Babcock & Wilcox Company and Babcock & Wilcox Enterprises, Inc. (incorporated by reference to Exhibit 2.1 to the Babcock & Wilcox Enterprises, Inc. Quarterly Report on Form 10-Q for the quarter ended June 30, 2015 (File No. 001-36876)). |
| | |
| | Restated Certificate of Incorporation (incorporated by reference to Exhibit 3.1 to the Babcock & Wilcox Enterprises, Inc. Quarterly Report on Form 10-Q for the quarter ended June 30, 2015 (File No. 001-36876)). |
| | |
| | Certificate of Amendment of the Restated Certificate of Incorporation (incorporated by reference to Exhibit 3.1 to the Babcock & Wilcox Enterprises, Inc. Current Report on Form 8-K filed on June 17, 2019 (File No. 001-36876)). |
| | |
| | Certificate of Amendment of the Restated Certificate of Incorporation, as amended (incorporated by reference to Exhibit 3.1 to the Babcock & Wilcox Enterprises, Inc. Current Report on Form 8-K filed on July 24, 2019 (File No. 001-36876)). |
| | |
| | | | | | | | |
| | Certificate of Amendment of Amended and Restated Certificate of Incorporation(incorporated by reference to Exhibit 3.1 to the Babcock & Wilcox Enterprises, Inc. Current Report on Form 8-K filed on May 23, 2023 (File No. 001-36876)).
|
| | |
| | Amended and Restated Bylaws of the Babcock & Wilcox Enterprises, Inc. (incorporated by reference to Exhibit 3.4 to the Babcock & Wilcox Enterprises, Inc. Annual Report on Form 10-K for the year ended December 31, 2021 (File No. 001-36876)). |
| | |
| | Certificate of Designations with respect to the 7.75% Series A Cumulative Perpetual Preferred Stock, dated May 6, 2021, filed with the Secretary of State of Delaware and effective on May 6, 2021 (incorporated by reference to Exhibit 3.4 to the Babcock & Wilcox Enterprises, Inc. Form 8-A filed on May 7, 2021 (File No. 001-36876)). |
| | |
| | Certificate of Increase in Number of Shares of 7.75% Series A Cumulative Perpetual Preferred Stock, dated June 1, 2021 (incorporated by reference to Exhibit 3.1 to the Babcock & Wilcox Enterprises, Inc. Current Report on Form 8-K filed on July 7, 2021 (File No. 001-36876)). |
| | |
| | Description of Securities Registered Pursuant to Section 12 of the Securities Exchange Act of 1934 (incorporated by reference to Exhibit 4.2 of the Babcock & Wilcox Enterprises, Inc. Annual Report on Form 10-K for the year ended December 31, 2019 (File No. 001-36876)). |
| | |
| | Indenture dated February 12, 2021 (incorporated by reference to Exhibit 4.1 to the Babcock & Wilcox Enterprises, Inc. Current Report on Form 8-K filed on February 12, 2021 (File No. 001-36876)). |
| | |
| | First Supplemental Indenture dated February 12, 2021 (incorporated by reference to Exhibit 4.2 to the Babcock & Wilcox Enterprises, Inc. Current Report on Form 8-K filed on February 12, 2021 (File No. 001-36876)). |
| | Second Supplemental Indenture dated December 13, 2021 (incorporated by reference to Exhibit 4.3 to the Babcock & Wilcox Enterprises, Inc. Current Report on Form 8-K filed on December 14, 2021 (File No. 001-36876)). |
| | |
| | Form of 8.125% Senior Note Due 2026 (included in Exhibit 4.4) |
| | |
| | Form of 6.50%% Senior Note Due 2026 (included in Exhibit 4.5) |
| | |
| | Form of Certificate representing 7.75% Series A Cumulative Perpetual Preferred Stock (incorporated by reference to Exhibit 4.1 to the Babcock & Wilcox Enterprises, Inc. Form 8-A filed on May 7, 2021 (File No. 001-36876)). |
| | |
| | | | | | | | |
| | Tax Sharing Agreement, dated as of June 8, 2015, by and between The Babcock & Wilcox Company and Babcock & Wilcox Enterprises, Inc. (incorporated by reference to Exhibit 10.1 to the Babcock & Wilcox Enterprises, Inc. Quarterly Report on Form 10-Q for the quarter ended June 30, 2015 (File No. 001-36876)). |
| | |
| | Employee Matters Agreement, dated as of June 8, 2015, by and between The Babcock & Wilcox Company and Babcock & Wilcox Enterprises, Inc. (incorporated by reference to Exhibit 10.2 to the Babcock & Wilcox Enterprises, Inc. Quarterly Report on Form 10-Q for the quarter ended June 30, 2015 (File No. 001-36876)). |
| | |
| | Transition Services Agreement, dated as of June 8, 2015, between The Babcock & Wilcox Company, as service provider, and Babcock & Wilcox Enterprises, Inc., as service receiver (incorporated by reference to Exhibit 10.3 to the Babcock & Wilcox Enterprises, Inc. Quarterly Report on Form 10-Q for the quarter ended June 30, 2015 (File No. 001-36876)). |
| | |
| | Transition Services Agreement, dated as of June 8, 2015, between Babcock & Wilcox Enterprises, Inc., as service provider, and The Babcock & Wilcox Company, as service receiver (incorporated by reference to Exhibit 10.4 to the Babcock & Wilcox Enterprises, Inc. Quarterly Report on Form 10-Q for the quarter ended June 30, 2015 (File No. 001-36876)). |
| | |
| | Assumption and Loss Allocation Agreement, dated as of June 19, 2015, by and among ACE American Insurance Company and the Ace Affiliates (as defined therein), Babcock & Wilcox Enterprises, Inc. and The Babcock & Wilcox Company (incorporated by reference to Exhibit 10.5 to the Babcock & Wilcox Enterprises, Inc. Quarterly Report on Form 10-Q for the quarter ended June 30, 2015 (File No. 001-36876)). |
| | |
| | Reinsurance Novation and Assumption Agreement, dated as of June 19, 2015, by and among ACE American Insurance Company and the Ace Affiliates (as defined therein), Creole Insurance Company and Dampkraft Insurance Company (incorporated by reference to Exhibit 10.6 to the Babcock & Wilcox Enterprises, Inc. Quarterly Report on Form 10-Q for the quarter ended June 30, 2015 (File No. 001-36876)). |
| | |
| | Novation and Assumption Agreement, dated as of June 19, 2015, by and among The Babcock & Wilcox Company, Babcock & Wilcox Enterprises, Inc., Dampkraft Insurance Company and Creole Insurance Company (incorporated by reference to Exhibit 10.7 to the Babcock & Wilcox Enterprises, Inc. Quarterly Report on Form 10-Q for the quarter ended June 30, 2015 (File No. 001-36876)). |
| | |
| | | | | | | | |
| | Babcock & Wilcox Enterprises, Inc. Amended and Restated 2015 Long-Term Incentive Plan (Amended and Restated as of June 14, 2019) (incorporated by reference to Appendix G to the Babcock & Wilcox Enterprises, Inc. Definitive Proxy Statement filed with the Securities and Exchange Commission on May 13, 2019). |
| | |
| | Babcock & Wilcox Enterprises, Inc. 2021 Long-Term Incentive Plan (incorporated by reference to the Babcock & Wilcox Enterprises, Inc. Current Report on Form 8-K filed on May 26, 2021 (File No. 001-36876)). |
| | |
| | Babcock & Wilcox Enterprises, Inc. Executive Incentive Compensation Plan (incorporated by reference to Exhibit 10.9 to the Babcock & Wilcox Enterprises, Inc. Quarterly Report on Form 10-Q for the quarter ended June 30, 2015 (File No. 001-36876)). |
| | |
| | Babcock & Wilcox Enterprises, Inc. Management Incentive Compensation Plan (incorporated by reference to Exhibit 10.10 to the Babcock & Wilcox Enterprises, Inc. Quarterly Report on Form 10-Q for the quarter ended June 30, 2015 (File No. 001-36876)). |
| | |
| | Supplemental Executive Retirement Plan of Babcock & Wilcox Enterprises, Inc. (incorporated by reference to Exhibit 10.11 to the Babcock & Wilcox Enterprises, Inc. Quarterly Report on Form 10-Q for the quarter ended June 30, 2015 (File No. 001-36876)). |
| | |
| | Babcock & Wilcox Enterprises, Inc. Defined Contribution Restoration Plan (incorporated by reference to Exhibit 10.12 to the Babcock & Wilcox Enterprises, Inc. Quarterly Report on Form 10-Q for the quarter ended June 30, 2015 (File No. 001-36876)). |
| | |
| | Intellectual Property Agreement, dated as of June 26, 2015, between Babcock & Wilcox Power Generation Group, Inc. and BWXT Foreign Holdings, LLC (incorporated by reference to Exhibit 10.13 to the Babcock & Wilcox Enterprises, Inc. Quarterly Report on Form 10-Q for the quarter ended June 30, 2015 (File No. 001-36876)). |
| | |
| | Intellectual Property Agreement, dated as of June 27, 2015, between Babcock & Wilcox Technology, Inc. and Babcock & Wilcox Investment Company (incorporated by reference to Exhibit 10.14 to the Babcock & Wilcox Enterprises, Inc. Quarterly Report on Form 10-Q for the quarter ended June 30, 2015 (File No. 001-36876)). |
| | |
| | Intellectual Property Agreement, dated as of May 29, 2015, between Babcock & Wilcox Canada Ltd. and B&W PGG Canada Corp. (incorporated by reference to Exhibit 10.15 to the Babcock & Wilcox Enterprises, Inc. Quarterly Report on Form 10-Q for the quarter ended June 30, 2015 (File No. 001-36876)). |
| | |
| | | | | | | | |
| | Intellectual Property Agreement, dated as of May 29, 2015, between Babcock & Wilcox mPower,Power, Inc. and Babcock & Wilcox Power Generation Group, Inc. (incorporated by reference to Exhibit 10.16 to the Babcock & Wilcox Enterprises, Inc. Quarterly Report on Form 10-Q for the quarter ended June 30, 2015 (File No. 001-36876)). |
| | |
| | Intellectual Property Agreement, dated as of June 26, 2015, between The Babcock & Wilcox Company and Babcock & Wilcox Enterprises, Inc. (incorporated by reference to Exhibit 10.17 to the Babcock & Wilcox Enterprises, Inc. Quarterly Report on Form 10-Q for the quarter ended June 30, 2015 (File No. 001-36876)). |
| | |
| | Form of Change-in-Control Agreement, by and between Babcock & Wilcox Enterprises, Inc. and certain officers for officers elected prior to August 4, 2016 (incorporated by reference to Exhibit 10.1 to the Babcock & Wilcox Enterprises, Inc. Quarterly Report on Form 10-Q for the quarter ended September 30, 2016 (File No. 001-36876)). |
| | |
| | Form of Restricted Stock Grant Agreement (Spin-off Award) (incorporated by reference to Exhibit 10.1 to the Babcock & Wilcox Enterprises, Inc. Quarterly Report on Form 10-Q for the quarter ended September 30, 2015 (File No. 001-36876)). |
| | |
| | Form of Restricted Stock Units Grant Agreement (incorporated by reference to Exhibit 10.2 to the Babcock & Wilcox Enterprises, Inc. Quarterly Report on Form 10-Q for the quarter ended September 30, 2015 (File No. 001-36876)). |
| | |
| | Form of Stock Option Grant Agreement (incorporated by reference to Exhibit 10.3 to the Babcock & Wilcox Enterprises, Inc. Quarterly Report on Form 10-Q for the quarter ended September 30, 2015 (File No. 001-36876)). |
| | |
| | Form of Performance Restricted Stock Unit Agreement (incorporated by reference to Exhibit 10.23 to the Babcock & Wilcox Enterprises, Inc. Annual Report on Form 10-K for the year ended December 31, 2015 (File No. 001-36876)). |
| | |
| | Form of Director and Officer Indemnification Agreement (incorporated by reference to Exhibit 10.24 to the Babcock & Wilcox Enterprises, Inc. Annual Report on Form 10-K for the year ended December 31, 2015 (File No. 001-36876)). |
| | |
| | | | | | | | |
| | Form of Change-in-Control Agreement, by and between Babcock & Wilcox Enterprises, Inc. and certain officers for officers elected on or after August 4, 2016 (incorporated by reference to Exhibit 10.2 to the Babcock & Wilcox Enterprises, Inc. Quarterly Report on Form 10-Q for the quarter ended September 30, 2016 (File No. 001-36876)). |
| | |
| | Form of Performance Unit Award Grant Agreement (Cash Settled) (incorporated by reference to Exhibit 10.1 to the Babcock & Wilcox Enterprises, Inc. Quarterly Report on Form 10-Q for the quarter ended June 30, 2017 (File No. 001-36876)). |
| | |
| | Form of Special Restricted Stock Unit Award Grant Agreement (incorporated by reference to Exhibit 10.2 to the Babcock & Wilcox Enterprises, Inc. Quarterly Report on Form 10-Q for the quarter ended June 30, 2017 (File No. 001-36876)). |
| | |
| | Babcock & Wilcox Enterprises, Inc., Severance Plan, as revised effective June 1, 2018 (incorporated by reference to the Babcock & Wilcox Enterprises, Inc. Quarterly Report on Form 10-Q for the quarter ended June 30, 2018 (File No. 001-36876)). |
| | |
| | Consulting Agreement dated November 19, 2018 between Babcock & Wilcox Enterprises, Inc., and BRPI Executive Consulting (incorporated by reference to Exhibit 10.49 of the Babcock & Wilcox Enterprises, Inc. Annual Report on Form 10-K for the year ended December 31, 2018 (File No. 001-36876)). |
| | |
| | Executive Employment Agreement dated November 19, 2018 between Babcock & Wilcox Enterprises, Inc. and Louis Salamone (incorporated by reference to Exhibit 10.50 of the Babcock & Wilcox Enterprises, Inc. Annual Report on Form 10-K for the year ended December 31, 2018 (File No. 001-36876)). |
| | |
| | Executive Employment Agreement dated November 19, 2018 between Babcock & Wilcox Enterprises, Inc. and Henry Bartoli, as amended (incorporated by reference to Exhibit 10.30 of the Babcock & Wilcox Enterprises, Inc. Annual Report on Form 10-K for the year ended December 31, 2019 (File No. 001-36876)). |
| | |
| | Form of Stock Appreciation Right Award Grant Agreement (incorporated by reference to Exhibit 10.52 of the Babcock & Wilcox Enterprises, Inc. Annual Report on Form 10-K for the year ended December 31, 2018 (File No. 001-36876)). |
| | |
| | Credit Agreement, dated as of May 11, 2015, among Babcock & Wilcox Enterprises, Inc., as the borrower, Bank of America, N.A., as Administrative Agent, and the Other Lenders Party Thereto (incorporated by reference to Exhibit 10.18 to the Babcock & Wilcox Enterprises, Inc. Quarterly Report on Form 10-Q for the quarter ended June 30, 2015 (File No. 001-36876)). |
| | |
| | | | | | | | |
| | Amendment No. 1 dated June 10, 2016 to Credit Agreement, dated May 11, 2015, among Babcock & Wilcox Enterprises, Inc., as the Borrower, Bank of America, N.A., as Administrative Agent, and the other Lenders party thereto (incorporated by reference to Exhibit 10.1 to the Babcock & Wilcox Enterprises, Inc. Quarterly Report on Form 10-Q for the quarter ended June 30, 2016 (File No. 001-36876)). |
| | |
| | Amendment No. 2 dated February 24, 2017 to Credit Agreement, dated May 11, 2015, among Babcock & Wilcox Enterprises, Inc., as the Borrower, Bank of America, N.A., as Administrative Agent, and the other Lenders party thereto (incorporated by reference to Exhibit 10.1 to the Babcock & Wilcox Enterprises, Inc. Quarterly Report on Form 10-Q for the quarter ended March 31, 2017 (File No. 001-36876)). |
| | |
| | Amendment No. 3 dated August 9, 2017, to Credit Agreement dated May 11, 2015, among Babcock & Wilcox Enterprises, Inc., as the Borrower, Bank of America, N.A., as administrative Agent and Lender, and the other Lenders party thereto (incorporated by reference to Exhibit 10.1 to the Babcock & Wilcox Enterprises, Inc. Quarterly Report on Form 10-Q for the quarter ended September 30, 2017 (File No. 001-36876)). |
| | |
| | Amendment No. 4 dated September 30, 2017, to Credit Agreement dated May 11, 2015, among Babcock & Wilcox Enterprises, Inc., as the Borrower, Bank of America, N.A., as administrative Agent and Lender, and the other Lenders party thereto (incorporated by reference to Exhibit 10.3 to the Babcock & Wilcox Enterprises, Inc. Quarterly Report on Form 10-Q for the quarter ended September 30, 2017 (File No. 001-36876)). |
| | |
| | Amendment No. 5 dated March 1, 2018, to Credit Agreement, dated as of May 11, 2015, among Babcock & Wilcox Enterprises, Inc., as the borrower, Bank of America, N.A., as Administrative Agent, and the other lenders party thereto (incorporated by reference to the Babcock & Wilcox Enterprises, Inc. Current Report on Form 8-K filed March 5, 2018 (File No. 001-36876)). |
| | |
| | Amendment No. 6 dated April 10, 2018, to Credit Agreement, dated as of May 11, 2015, among Babcock & Wilcox Enterprises, Inc., as the borrower, Bank of America, N.A., as Administrative Agent, and the other lenders party thereto (incorporated by reference to the Babcock & Wilcox Enterprises, Inc. Current Report on Form 8-K filed April 11, 2018 (File No. 001-36876)). |
| | |
| | Consent and Amendment No. 7 dated May 31, 2018, to Credit Agreement, dated as of May 11, 2015, among Babcock & Wilcox Enterprises, Inc., as the borrower, Bank of America, N.A., as Administrative Agent, and the other lenders party thereto (incorporated by reference to the Babcock & Wilcox Enterprises, Inc. Quarterly Report on Form 10-Q for the quarter ended June 30, 2018 (File No. 001-36876)). |
| | |
| | Amendment No. 8 dated August 9, 2018, to Credit Agreement, dated as of May 11, 2015, among Babcock & Wilcox Enterprises, Inc., as the borrower, Bank of America, N.A., as Administrative Agent, and the other lenders party thereto (incorporated by reference to the Babcock & Wilcox Enterprises, Inc. Current Report on Form 8-K filed August 13, 2018 (File No. 001-36876)). |
| | |
| | Amendment No. 9 dated September 14, 2018, to Credit Agreement, dated as of May 11, 2015, among Babcock & Wilcox Enterprises, Inc., as the borrower, Bank of America, N.A., as Administrative Agent, and the other lenders party thereto (incorporated by reference to the Babcock & Wilcox Enterprises, Inc. Quarterly Report on Form 10-Q for the quarter ended September 30, 2018 (File No. 001-36876)). |
| | |
| | Amendment No. 10 dated September 28, 2018, to Credit Agreement, dated as of May 11, 2015, among Babcock & Wilcox Enterprises, Inc., as the borrower, Bank of America, N.A., as Administrative Agent, and the other lenders party thereto (incorporated by reference to the Babcock & Wilcox Enterprises, Inc. Quarterly Report on Form 10-Q for the quarter ended September 30, 2018 (File No. 001-36876)). |
| | |
| | Amendment No. 11 dated October 4, 2018, to Credit Agreement, dated as of May 11, 2015, among Babcock & Wilcox Enterprises, Inc., as the borrower, Bank of America, N.A., as Administrative Agent, and the other lenders party thereto (incorporated by reference to the Babcock & Wilcox Enterprises, Inc. Quarterly Report on Form 10-Q for the quarter ended September 30, 2018 (File No. 001-36876)). |
| | |
| | Amendment No. 12 dated October 31, 2018, to Credit Agreement, dated as of May 11, 2015, among Babcock & Wilcox Enterprises, Inc., as the borrower, Bank of America, N.A., as Administrative Agent, and the other lenders party thereto (incorporated by reference to the Babcock & Wilcox Enterprises, Inc. Quarterly Report on Form 10-Q for the quarter ended September 30, 2018 (File No. 001-36876)). |
| | |
| | Amendment No. 13 dated December 31, 2018, to Credit Agreement, dated as of May 11, 2015, among Babcock & Wilcox Enterprises, Inc., as the borrower, Bank of America, N.A., as Administrative Agent, and the other lenders party thereto (incorporated by reference to Exhibit 10.47 of the Babcock & Wilcox Enterprises, Inc. Annual Report on Form 10-K for the year ended December 31, 2018 (File No. 001-36876)). |
| | |
| | Amendment No. 14 dated January 15, 2019 to Credit Agreement, dated as of May 11, 2015, among Babcock & Wilcox Enterprises, Inc., as the borrower, Bank of America, N.A., as Administrative Agent, and the other lenders party thereto (incorporated by reference to Exhibit 10.48 of the Babcock & Wilcox Enterprises, Inc. Annual Report on Form 10-K for the year ended December 31, 2018 (File No. 001-36876)). |
| | |
| | | | | | | | |
| | Amendment No. 15 and Limited Waiver dated March 19, 2019 to Credit Agreement, dated as of May 11, 2015, among Babcock & Wilcox Enterprises, Inc., as the borrower, Bank of America, N.A., as Administrative Agent, and the other lenders party thereto (incorporated by reference to Exhibit 10.53 of the Babcock & Wilcox Enterprises, Inc. Annual Report on Form 10-K for the year ended December 31, 2018 (File No. 001-36876)). |
| | |
| | Amendment No. 16, dated April 5, 2019, to Credit Agreement, dated as of May 11, 2015, among Babcock & Wilcox Enterprises, Inc., as the borrower, Bank of America, N.A., as Administrative Agent, and the other lenders party thereto (incorporated by reference to Exhibit 10.1 to the Babcock & Wilcox Enterprises, Inc. Current Report on Form 8-K filed on April 5, 2019 (File No. 001-36876)). |
| | |
| | Amendment No. 17, dated August 7, 2019, to Credit Agreement, dated as of May 11, 2015, among Babcock & Wilcox Enterprises, Inc., as the borrower, Bank of America, N.A., as Administrative Agent, and the other lenders party thereto (incorporated by reference to Exhibit 10.49 of the Babcock & Wilcox Enterprises, Inc. Annual Report on Form 10-K for the year ended December 31, 2019 (File No. 001-36876)). |
| | |
| | Amendment No. 18, dated December 31, 2019, to Credit Agreement, dated as of May 11, 2015, among Babcock & Wilcox Enterprises, Inc., as the borrower, Bank of America, N.A., as Administrative Agent, and the other lenders party thereto (incorporated by reference to Exhibit 10.50 of the Babcock & Wilcox Enterprises, Inc. Annual Report on Form 10-K for the year ended December 31, 2019 (File No. 001-36876)). |
| | |
| | Amendment No. 19, dated January 17, 2020, to Credit Agreement, dated as of May 11, 2015, among Babcock & Wilcox Enterprises, Inc., as the borrower, Bank of America, N.A., as Administrative Agent, and the other lenders party thereto (incorporated by reference to Exhibit 10.51 of the Babcock & Wilcox Enterprises, Inc. Annual Report on Form 10-K for the year ended December 31, 2019 (File No. 001-36876)). |
| | |
| | Amendment No. 20, dated January 31, 2020, to Credit Agreement, dated as of May 11, 2015, among Babcock & Wilcox Enterprises, Inc., as the borrower, Bank of America, N.A., as Administrative Agent, and the other lenders party thereto (incorporated by reference to Exhibit 10.52 of the Babcock & Wilcox Enterprises, Inc. Annual Report on Form 10-K for the year ended December 31, 2019 (File No. 001-36876)). |
| | |
| | Investor Rights Agreement, dated as of April 30, 2019, by and among Babcock & Wilcox Enterprises, Inc., B. Riley FBR, Inc. and Vintage Capital Management, LLC (incorporated by reference to Exhibit 10.4 of the Babcock & Wilcox Enterprises, Inc. Quarterly Report on Form 10-Q for the quarter ended June 30, 2019 (File No. 001-36876)). |
| | |
| | Registration Rights Agreement, dated as of April 30, 2019, by and among Babcock & Wilcox Enterprises, Inc., and certain investors party thereto (incorporated by reference to Exhibit 10.5 of the Babcock & Wilcox Enterprises, Inc. Quarterly Report on Form 10-Q for the quarter ended June 30, 2019 (File No. 001-36876)). |
| | |
| | Form of 2019 Restricted Stock Units Director Grant Agreement (incorporated by reference to Exhibit 10.1 to the Babcock & Wilcox Enterprises, Inc. Quarterly Report on Form 10-Q for the quarter ended September 30, 2019 (File No. 001-36876)). |
| | |
| | First Amendment to the Babcock & Wilcox Enterprises, Inc. Defined Contribution Restoration Plan. (incorporated by reference to Exhibit 10.56 of the Babcock & Wilcox Enterprises, Inc. Annual Report on Form 10-K for the year ended December 31, 2019 (File No. 001-36876)). |
| | |
| | Backstop Commitment Letter, dated January 31, 2020, between Babcock & Wilcox Enterprises, Inc. and B. Riley Financial, Inc. (incorporated by reference to Exhibit 10.2 to the Babcock & Wilcox Enterprises, Inc. Current Report on Form 8-K filed on February 3, 2020 (File No. 001-36876)). |
| | |
| | Amendment No. 21, dated March 27, 2020, to Credit Agreement, dated as of May 11, 2015, among Babcock & Wilcox Enterprises, Inc., as the borrower, Bank of America, N.A., as Administrative Agent, and the other lenders party thereto (incorporated by reference to Exhibit 10.58 of the Babcock & Wilcox Enterprises, Inc. Annual Report on Form 10-K for the year ended December 31, 2019 (File No. 001-36876)). |
| | |
| | Amendment and Restatement Agreement (attaching the Amended and Restated Credit Agreement), dated as of May 14, 2020, among Babcock & Wilcox Enterprises, Inc., as the borrower, Bank of America, N.A., as Administrative Agent, and the other lenders party thereto (incorporated by reference to Exhibit 10.1 of the Babcock & Wilcox Enterprises, Inc. Current Report on Form 8-K filed May 15, 2020 (File No. 001-36876)). |
| | |
| | Form of 2021 Long-Term Cash Incentive Award Grant Agreement (incorporated by reference to Exhibit 10.10 to the Babcock & Wilcox Enterprises, Inc. Quarterly Report on Form 10-Q for the quarter ended September 30, 2020 (File No. 001-36876)). |
| | |
| | | | | | | | |
| | Amendment No. 1 to Amended and Restated Credit Agreement, dated as of October 30, 2020, among Babcock & Wilcox Enterprises, Inc., as the borrower, Bank of America, N.A., as Administrative Agent, and the other lenders party thereto (incorporated by reference to Exhibit 10.1 of the Babcock & Wilcox Enterprises, Inc. Current Report on Form 8-K filed November 5, 2020 (File No. 001-36876)). |
| | |
| | | | | | | | |
| | Second Amendment to Executive Services Agreement between Babcock & Wilcox Enterprises, Inc. and BRPI Executive Consulting, LLC dated November 9, 2020 (incorporated by reference to Exhibit 10.1 of the Babcock & Wilcox Enterprises, Inc. Current Report on Form 8-K filed November 10, 2020 (File No. 001-36876)). |
| | Third Amendment to the Executive Services Agreement between Babcock & Wilcox Enterprises, Inc. and BRPI Executive Consulting, LLC dated November 19, 2018, made and entered into as of December 29, 2023, filed herein. |
| | |
| | Third Amendment to Executive Employment Agreement between Babcock & Wilcox Enterprises, Inc. and Henry Bartoli dated November 5, 2020 (incorporated by reference to Exhibit 10.2 of the Babcock & Wilcox Enterprises, Inc. Current Report on Form 8-K filed November 10, 2020 (File No. 001-36876)). |
| | |
| | Consultant Agreement by and between The Babcock & Wilcox Company Inc. and Henry Bartoli effective as of January 1, 2021 (incorporated by reference to Exhibit 10.3 of the Babcock & Wilcox Enterprises, Inc. Current Report on Form 8-K filed November 10, 2020 (File No. 001-36876)). |
| | |
| | Second Amendment to the Consulting Agreement between The Babcock & Wilcox Company and Henry Bartoli dated November 5, 2020, and is effective as of January 1, 2024, filed herein. |
| | |
| | Severance and Release of Claims Agreement made between The Babcock & Wilcox Company and its parent, subsidiary, related and affiliated entities, and Joseph Buckler, signed and dated November 20, 2023, filed herein. |
| | |
| | Settlement Agreement between Babcock & Wilcox Volund A/S and XL Insurance Company SE dated October 10, 2020 (incorporated by reference to Exhibit 10.65 of the Babcock & Wilcox Enterprises, Inc. Annual Report on Form 10-K for the year ended December 31, 2020 (File No. 001-36876)). |
| | |
| | Exchange Agreement by and between Babcock & Wilcox Enterprises Inc. and B. Riley Financial, Inc. dated February 12, 2021 (incorporated by reference to Exhibit 1.3 to the Babcock & Wilcox Enterprises, Inc. Current Report on Form 8-K filed on February 12, 2021 (File No. 001-36876)). |
| | |
| | Amendment No. 2 to Amended and Restated Credit Agreement by and between Babcock and& Wilcox Enterprises Inc. and Bank of America, N.A., as Administrative Agent, dated February 8, 2021 (incorporated by reference to Exhibit 10.1 to the Babcock & Wilcox Enterprises, Inc. Current Report on Form 8-K filed on February 12, 2021 (File No. 001-36876)). |
| | |
| | Amendment No. 3 to Amended and Restated Credit Agreement by and between Babcock and& Wilcox Enterprises Inc. and Bank of America, N.A., as Administrative Agent, dated March 4 2021 (incorporated by reference to Exhibit 10.68 of the Babcock & Wilcox Enterprises, Inc. Annual Report on Form 10-K for the year ended December 31, 2020 (File No. 001-36876)). |
| | |
| | Amendment No. 4 to Amended and Restated Credit Agreement by and between Babcock and& Wilcox Enterprises Inc. and Bank of America, N.A., as Administrative Agent, dated March 26, 2021 (incorporated by reference to Exhibit 10.1 to the Babcock & Wilcox Enterprises, Inc. Current Report on Form 8-K filed on April 1, 2021 (File No. 001-36876)). |
| | |
| | Amendment No. 5 to Amended and Restated Credit Agreement dated May 10, 2021 (incorporated by reference to the Babcock & Wilcox Enterprises, Inc. Current Report on Form 8-K filed on May 13, 2021 (File No. 001-36876)). |
| | |
| | Revolving Credit, Guaranty and Security Agreement, dated as of June 30, 2021, by and among Babcock & Wilcox Enterprises, Inc. and PNC Bank, National Association, as administrative agent, lender and swing loan lender (incorporated by reference to the Babcock & Wilcox Enterprises, Inc. Current Report on Form 8-K filed on July 7, 2021 (File No. 001-36876)). |
| | |
| | Letter of Credit Issuance and Reimbursement and Guaranty Agreement, dated as of June 30, 2021, by and among Babcock & Wilcox Enterprises, Inc. and PNC Bank, National Association, as issuer (incorporated by reference to the Babcock & Wilcox Enterprises, Inc. Current Report on Form 8-K filed on July 7, 2021 (File No. 001-36876)) |
| | |
| | Reimbursement, Guaranty and Security Agreement, dated as of June 30, 2021, by and among Babcock & Wilcox Enterprises, Inc. and MSD PCOF Partners XLV, LLC, as administrative agent (incorporated by reference to the Babcock & Wilcox Enterprises, Inc. Current Report on Form 8-K filed on July 7, 2021 (File No. 001-36876)). |
| | |
| | | | | | | | |
| | Guaranty Agreement, dated as of June 30, 2021, by B. Riley Financial, Inc. in favor of MSD PCOF Partners XLV, LLC, as administrative agent (incorporated by reference to the Babcock & Wilcox Enterprises, Inc. Current Report on Form 8-K filed on July 7, 2021 (File No. 001-36876)). |
| | |
| | LIFO Preferability LetterAmendment No. 1 to Revolving Credit, Guaranty and Security Agreement, dated as of August 8, 2022, by and among Babcock & Wilcox Enterprises, Inc. and PNC Bank, National Association, as administrative agent, lender and swing loan lender, filed on Form 10-Q/A (File No. 001-36876). |
| | |
| | Amendment No. 1 to Reimbursement, Guaranty and Security Agreement, dated as of August 8, 2022, by and among Babcock & Wilcox Enterprises, Inc. and MSD PCOF Partners XLV, LLC, as administrative agent, filed on Form 10-Q/A (File No. 001-36876). |
| | |
| | Amendment No. 2 to Reimbursement, Guaranty and Security Agreement, dated as of November 8, 2022, by and among Babcock & Wilcox Enterprises, Inc. and MSD PCOF Partners XLV, LLC, as administrative agent, filed on Form 10-K (File No. 001-36876). |
| | |
| | Amendment No. 2 to Revolving Credit, Guaranty and Security Agreement, dated as of March 14, 2023, by and among Babcock & Wilcox Enterprises, Inc. and PNC Bank, National Association, as administrative agent, lender and swing loan lender, filed on Form 10-K (File No. 001-36876). |
| | |
| | Second Amendment to Letter of Credit Issuance and Reimbursement and Guaranty Agreement; Partial Release of Cash Collateral; and Agreement Regarding Revolving Credit, Guaranty and Security Agreement, dated as of November 30, 2023, filed herein. |
| | |
| | Credit Agreement among Babcock & Wilcox Enterprises, Inc. and Axos Bank, dated as of January 18, 2024, filed herein. |
| | |
| | Security and Pledge Agreement among Babcock & Wilcox Enterprises, Inc., and Axos Bank, dated as of January 18, 2024, filed herein. |
| | |
| | Fee Letter (Supplement to the Credit Agreement) among Babcock & Wilcox Enterprises, Inc., and Axos Bank, dated January 18, 2024, filed herein. |
| | |
| | Guaranty by B. Riley Financial, Inc. in favor of Axos Bank, in its capacity as administrative agent for the Secured Parties (as defined in the Credit Agreement) dated January 18, 2024, filed herein. |
| | |
| | Fee and Reimbursement Agreement Babcock & Wilcox Enterprises, Inc. and B. Riley Financial, Inc., dated as of January 18, 2024, filed herein. |
| | |
| | Fourth Amendment to Reimbursement Security Agreement and Consent Letter by and among Babcock & Wilcox Enterprises, Inc., MSD PCOF Partners XLV, LLC and B. Riley Financial, Inc., dated March 15, 2024, filed herein. |
| | |
| | Significant Subsidiaries of the Registrant. |
| | |
| | Consent of Deloitte & Touche LLP. |
| | |
| | Rule 13a-14(a)/15d-14(a) certification of Chief Executive Officer. |
| |
| | Rule 13a-14(a)/15d-14(a) certification of Chief Financial Officer. |
| |
| | Section 1350 certification of Chief Executive Officer. |
| |
| | Section 1350 certification of Chief Financial Officer. |
| |
| | | | | | | | |
| 101.SCH | | XBRL Taxonomy Extension Schema Document. |
| |
| 101.CAL | | XBRL Taxonomy Extension Calculation Linkbase Document. |
| |
| 101.LAB | | XBRL Taxonomy Extension Label Linkbase Document. |
| |
| 101.PRE | | XBRL Taxonomy Extension Presentation Linkbase Document. |
| | |
| 101.DEF | | XBRL Taxonomy Extension Definition Linkbase Document. |
| | |
| 104 | | Cover Page Interactive Data File (embedded within the inline XBRL document) |
* Certain schedules and exhibits to this agreement have been omitted pursuant to Item 601(b)(2) of Regulation S-K. A copy of any omitted schedule and/or exhibit will be furnished to the SEC upon request.
† Management contract or compensatory plan or arrangement.
‡ The Company has omitted certain information contained in this exhibit pursuant to Rule 601(b)(10) of Regulation S-K. The omitted information is not material and, if publicly disclosed, would likely cause competitive harm to the Company.
SCHEDULE II
BABCOCK & WILCOX ENTERPRISES, INC.
SCHEDULE II - VALUATION AND QUALIFYING ACCOUNTS
Allowance for Doubtful Accounts | | Year ended December 31, |
| Year ended December 31, | | | Year ended December 31, |
| (in thousands) | (in thousands) | 2021 | 2020 | (in thousands) | 2023 | 2022 |
| Balance at beginning of period | Balance at beginning of period | $ | 17,222 | | $ | 25,071 | |
| Charges to costs and expenses | Charges to costs and expenses | 262 | | (1,044) | |
| Deductions | Deductions | (4,207) | | (6,783) | |
| Currency translation adjustments and other | Currency translation adjustments and other | (1,449) | | (22) | |
| Balance at end of period | Balance at end of period | $ | 11,828 | | $ | 17,222 | |
Inventory Reserves | | Year ended December 31, |
| Year ended December 31, | | | Year ended December 31, |
| (in thousands) | (in thousands) | 2021 | 2020 * | (in thousands) | 2023 | 2022 |
| Balance at beginning of period | Balance at beginning of period | $ | 7,078 | | $ | 6,880 | |
| Charges to costs and expenses | Charges to costs and expenses | (655) | | 769 | |
| Deductions | Deductions | 14 | | (867) | |
| Currency translation adjustments and other | Currency translation adjustments and other | 97 | | 296 | |
| Balance at end of period | Balance at end of period | $ | 6,534 | | $ | 7,078 | |
* December 31, 2020 balance at beginning of period amount has been adjusted to reflect the change in inventory accounting method, as described in Notes 2 and 6 to the Consolidated Financial Statements included in Part II, Item 8 of this Annual Report.
Item 16. Form 10-K Summary
None.
SIGNATURES
Pursuant to the requirements of the Section 13 or 15(d) of Securities Exchange Act of 1934, the registrant has duly caused this report to be signed on its behalf by the undersigned, thereunto duly authorized.
| | | | | | | | |
| | BABCOCK & WILCOX ENTERPRISES, INC. |
| | |
March 8, 202215, 2024 | By: | /s/ Kenneth M. Young |
| | Kenneth M. Young |
| | Chairman and Chief Executive Officer |
Pursuant to the requirements of the Securities Exchange Act of 1934, this report has been signed below by the following persons on behalf of the registrant and in the capacities and on the dates indicated.
| | | | | | | | |
| Signature | | Title |
| |
| /s/ Kenneth M. Young | | Chairman and Chief Executive Officer
(Principal Executive Officer) |
| Kenneth M. Young | |
| |
| /s/ Louis Salamone | | Executive Vice President, Chief Financial Officer and Chief Accounting Officer (Principal Financial and Accounting Officer and Duly Authorized Representative) |
| Louis Salamone | |
| | |
| /s/ Henry E. Bartoli | | Director |
| Henry E. Bartoli | |
| | |
| /s/ Alan B. Howe | | Director |
| Alan B. Howe | |
| | |
| /s/Philip D. Moeller | | Director |
| Philip D. Moeller | |
| | |
| /s/ Rebecca Stahl | | Director |
| Rebecca Stahl | |
| | |
| /s/ Joseph A. Tato | | Director |
| Joseph A. Tato | |
| | |
| /s/ Dr. Naomi L. Boness | | Director |
| Dr. Naomi L. Boness | |
March 8, 202215, 2024