| | | | | | | | | | | | | | | | | | | | |
| UNITED STATES | |
| SECURITIES AND EXCHANGE COMMISSION | |
| Washington, D.C. 20549 | |
FORM 10-K
| | | | | | | | | | | | | | | | | | | | |
| ☒ | ANNUAL REPORT PURSUANT TO SECTION 13 OR 15(d) OF THE SECURITIES EXCHANGE ACT OF 1934 | |
For the fiscal year ended December 31, 20212023
| | | | | | | | | | | | | | | | | | | | |
| ☐ | TRANSITION REPORT PURSUANT TO SECTION 13 OR 15(d) OF THE SECURITIES EXCHANGE ACT OF 1934 | |
For the transition period from ________________ to ________________
Commission File Number: 001-38082
| | | | | | | | | | | | | | | | | | | | |
| | |
| KKR Real Estate Finance Trust Inc. | |
| (Exact name of registrant as specified in its charter) | |
| Maryland | | | | 47-2009094 | |
| (State or other jurisdiction of incorporation or organization) | | | | (I.R.S. Employer Identification No.) | |
| | | | | | | | | | | | | | | | | | | | | | | | | | | | | |
| 30 Hudson Yards, | Suite 7500 | New York, | NY | | | | 10001 | |
| (Address of principal executive offices) | | | | (Zip Code) | |
(212) 750-8300
| | | | | | | | | | | | | | | | | | | | |
| (Registrant’s telephone number, including area code) | |
| | | | | | | | | | | | | | | | | | | | |
| Securities registered pursuant to Section 12(b) of the Act: | |
| Title of each class | | Trading Symbol(s) | | Name of each exchange on which registered | |
| Common stock, par value $0.01 per share | | KREF | | New York Stock Exchange | |
| 6.50% Series A Cumulative Redeemable Preferred Stock, | | KREF PRA | | New York Stock Exchange | |
| par value $0.01 per share | | | | | |
Securities registered pursuant to Section 12(g) of the Act: None
Indicate by check mark if the registrant is a well-known seasoned issuer, as defined in Rule 405 of the Securities Act. ☒ Yes ☐ No
Indicate by check mark if the registrant is not required to file reports pursuant to Section 13 or Section 15(d) of the Act. ☐ Yes ☒ No
Indicate by check mark whether the registrant (1) has filed all reports required to be filed by Section 13 or 15(d) of the Securities Exchange Act of 1934 during the preceding 12 months (or for such shorter period that the registrant was required to file such reports), and (2) has been subject to such filing requirements for the past 90 days. ☒ Yes ☐ No
Indicate by check mark whether the registrant has submitted electronically every Interactive Data File required to be submitted pursuant to Rule 405 of Regulation S-T during the preceding 12 months (or for such shorter period that the registrant was required to submit such files). ☒ Yes ☐ No
Indicate by check mark whether the registrant is a large accelerated filer, an accelerated filer, a non-accelerated filer, a smaller reporting company or an emerging growth company. See the definitions of "large accelerated filer," "accelerated filer," "smaller reporting company" and "emerging growth company" in Rule 12b-2 of the Exchange Act.
Large accelerated filer ☒Accelerated filer ☐
Non-accelerated filer ☐Smaller reporting company ☐
Emerging growth company ☐
If an emerging growth company, indicate by check mark if the registrant has elected not to use the extended transition period for complying with any new or revised financial accounting standards provided pursuant to Section 13(a) of the Exchange Act. ☐
Indicate by check mark whether the registrant has filed a report on and attestation to its management’s assessment of the effectiveness of its internal control over financial reporting under Section 404(b) of the Sarbanes-Oxley Act (15 U.S.C. 7262(b)) by the registered public accounting firm that prepared or issued its audit report. ☒
If securities are registered pursuant to Section 12(b) of the Act, indicate by check mark whether the financial statements of the registrant included in the filing reflect the correction of an error to previously issued financial statements. ☐
Indicate by check mark whether any of those error corrections are restatements that required a recovery analysis of incentive-based compensation received by any of the registrant’s executive officers during the relevant recovery period pursuant to § 240.10D-1(b). ☐
Indicate by check mark whether the registrant is a shell company (as defined in Rule 12b-2 of the Exchange Act). ☐ Yes ☒ No
The aggregate market value of the registrant's common stock held by non-affiliates was approximately $880.0$708.9 million as of June 30, 20212023 (the last business day of the registrant's most recently completed second fiscal quarter) based on the closing sale price on the New York Stock Exchange on that date.
The number of shares of the registrant's common stock, par value $0.01 per share, outstanding as of February 3, 20222, 2024 was 61,370,732.69,313,860.
DOCUMENTS INCORPORATED BY REFERENCE
Portions of the definitive proxy statement to be filed with the Securities and Exchange Commission (“SEC”) pursuant to Regulation 14A relating to the registrant’s 20222024 Annual Meeting of Stockholders will be incorporated by reference in this Form 10-K in response to Items 10, 11, 12, 13 and 14 of Part III. The definitive proxy statement will be filed with the SEC no later than 120 days after the registrant’s fiscal year end.
KKR REAL ESTATE FINANCE TRUST INC.
FORM 10-K
FOR THE YEAR ENDED DECEMBER 31, 20212023
INDEX
CAUTIONARY NOTE REGARDING FORWARD-LOOKING STATEMENTS
This Annual Report on Form 10-K contains forward-looking statements within the meaning of Section 27A of the Securities Act of 1933, as amended (the "Securities“Securities Act”), and Section 21E of the Securities Exchange Act of 1934, as amended (the “Exchange Act”), which reflect our current views with respect to, among other things, our operations and financial performance. You can identify these forward-looking statements by the use of words such as "outlook," "believe," "expect," "potential," "continue," "may," "should," "seek," "approximately," "predict," "intend," "will," "plan," "estimate," "anticipate,"“outlook,” “believe,” “expect,” “potential,” “continue,” “may,” “should,” “seek,” “approximately,” “predict,” “intend,” “will,” “plan,” “estimate,” “anticipate,” the negative version of these words, other comparable words or other statements that do not relate strictly to historical or factual matters. By their nature, forward-looking statements speak only as of the date they are made, are not statements of historical fact or guarantees of future performance and are subject to risks, uncertainties, assumptions or changes in circumstances that are difficult to predict or quantify, in particular due to the uncertainties created by the COVID-19 pandemic, including the projected impact of COVID-19 on our business, financial performance and operating results.quantify. Our expectations, beliefs and projections are expressed in good faith and we believe there is a reasonable basis for them. However, there can be no assurance that management'smanagement’s expectations, beliefs and projections will result or be achieved and actual results may vary materially from what is expressed in or indicated by the forward-looking statements.
SUMMARY OF MATERIAL RISKS
There are a number of risks, uncertainties and other important factors that could cause our actual results to differ materially from the forward-looking statements contained in this Annual Report on Form 10-K. Such risks, uncertainties and other important factors include, among others, the risks, uncertainties and factors set forth under Part I, Item 1A. "Risk Factors" in this Annual Report on Form 10-K.Such risks and uncertainties include, but are not limited to, the following:
•how widely utilized COVID-19 vaccines will be, whether they will be effective in preventing the spread of COVID-19 (including its variant strains), and their impact on the ultimate severity and duration of the COVID-19 pandemic;
•actions that may be taken by governmental authorities to contain the COVID-19 outbreak or to treat its impact;
•the potential negative impacts of COVID-19 on the global economy and on our loan portfolio, financial condition and business operations;
•adverse developments in the availability of desirable investment opportunities whether they are due to competition, regulation or otherwise;
•the general political, economic and competitive conditions in the United States and in any foreign jurisdictions in which we invest;
•the level and volatility of prevailing interest rates and credit spreads, including as a result of the planned discontinuance of LIBOR and the transition to alternative reference rates;
•adverse changes in the real estate and real estate capital markets;
•difficulty or delays in redeploying the proceeds from repayments of our existing investments;
•general volatility of the securities markets in which we participate;
•changes in our business, investment strategies or target assets;
•deterioration in the performance of the properties securing our investments that may cause deterioration in the performance of our investments and, potentially, principal losses to us;
•acts of God such as hurricanes, earthquakes and other natural disasters, pandemics such as COVID-19, acts of war and/or terrorism and other events that may cause unanticipated and uninsured performance declines and/or losses to us or the owners and operators of the real estate securing our investments;
•the adequacy of collateral securing our investments and declines in the fair value of our investments;
•difficulty in obtaining financing or raising capital;
•difficulty in successfully managing our growth, including integrating new assets into our existing systems;
•reductions in the yield on our investments and increases in the cost of our financing;
•defaults by borrowers in paying debt service on outstanding indebtedness;
•the availability of qualified personnel and our relationship with our Manager;
•subsidiaries of KKR & Co. Inc. have significant influence over us and KKR's interests may conflict with those of our stockholders in the future;
•the cost of operating our platform, including, but not limited to, the cost of operating a real estate investment platform;
•adverse legislative or regulatory developments;
•our qualification as a real estate investment trust ("REIT") for U.S. federal income tax purposes and our exclusion from registration under the Investment Company Act of 1940, as amended (the "Investment Company Act"); and
•authoritative accounting principles generally accepted in the United States of America ("GAAP") or policy changes from such standard-setting bodies such as the Financial Accounting Standards Board (the "FASB"), the Securities and Exchange Commission (the "SEC"), the Internal Revenue Service, the New York Stock Exchange and other authorities that we are subject to, as well as their counterparts in any foreign jurisdictions where we might do business.
There may be othermany factors that may cause our actual results to differ materially from the forward-looking statements, including factors set forth under Part I, Item 1A. "Risk Factors" and Part I, Item 7. "Management's Discussion and Analysis of Financial Condition and Results of Operations" in this Form 10-K, as such factors may be updated from time to time in our other periodic filings with the SEC, which are accessible on the SEC's website at www.sec.gov and on the investor relations section of our website at www.kkrreit.com. You should evaluate all forward-looking statements made in this Form 10-K in the context of these risks and uncertainties.
We caution you that the risks, uncertainties and other factors referenced abovebelow may not contain all of the risks, uncertainties and other factors that are important to you. In addition, we cannot assure you that we will realize the results, benefits or developments that we expect or anticipate or, even if substantially realized, that they will result in the consequences or affect us or our business in the way expected. All forward-looking statements in this Form 10-K apply only as of the date made and are expressly qualified in their entirety by the cautionary statements included in this Form 10-K and in other filings we make with the SEC. We undertake no obligation to publicly update or revise any forward-looking statements to reflect subsequent events or circumstances, except as required by law.
Except where the context requires otherwise, the terms "Company," "we," "us," "our" and "KREF" refer to KKR Real Estate Finance Trust Inc., a Maryland corporation, and its subsidiaries; "Manager" refers to KKR Real Estate Finance Manager LLC, a Delaware limited liability company, our external manager; and "KKR" refers to KKR & Co. Inc., a Delaware corporation, and its subsidiaries.
SUMMARY OF MATERIAL RISKS
The following is a summary of the risk factors associated with investing in our securities. You should read this summary together with a more detailed description of these risks in the "Risk Factors" section of this report and in other filings that we make from time to time with the SEC.
•the general political, economic, competitive, and other conditions in the United States and in any foreign jurisdictions in which we invest and their impact on our loan portfolio, financial condition and business operations;
•fluctuations in interest rates and credit spreads could reduce our ability to generate income on our loans and other investments, which could lead to a significant decrease in our results of operations, cash flows and the market value of our investments and could materially impair our ability to pay distributions to our stockholders;
•adverse developments in the real estate and real estate capital markets could negatively impact our performance;
•adverse legislative or regulatory developments, including with respect to tax laws, securities laws, and the laws governing financial and lending institutions;
•adverse developments in the availability of attractive loan and other investment opportunities whether they are due to competition, regulation or otherwise, could adversely affect our results of operations;
•global economic trends and economic conditions, including heightened inflation, slower growth or recession, changes to fiscal and monetary policy, higher interest rates, labor shortages, currency fluctuations and challenges in global supply chains;
•events giving rise to increases in our current expected credit loss reserve;
•reduced demand for office, multifamily or retail space, including as a result of the COVID-19 pandemic and/or hybrid work schedules which allow work from remote locations other than the employer's office premises;
•our results of operations, financial condition, liquidity position, and business could be adversely impacted affected if we experience (i) difficulty accessing financing or raising capital, including due to a significant dislocation in or shut-down of the capital markets, (ii) a reduction in the yield on our investments, (iii) an increase in the cost of our financing, (iv) an inability to borrow incremental amounts or an obligation to repay amounts under our financing arrangements, or (v) defaults by borrowers in paying debt service on outstanding loans;
•deterioration in the performance of the properties securing our investments that may cause deterioration in the performance of our investments, adversely impact certain of our financing arrangements and our liquidity, risks in collection of contractual interest payments, and potentially, principal losses to us;
•difficulty or delays in redeploying the proceeds from repayments of our existing investments may cause our financial performance to decline;
•acts of God such as hurricanes, earthquakes and other natural disasters, pandemics such as COVID-19, acts of war and/or terrorism and other events that may cause unanticipated and uninsured performance declines and/or losses to us or the owners and operators of the real estate securing our investments;
•increased competition from entities engaged in mortgage lending and/or investing in our target assets;
•conflicts with KKR and its affiliates, including our Manager, could result in decisions that are not in the best interests of our stockholders;
•we are dependent on our Manager and its access to KKR’s investment professionals and resources. We may not find a suitable replacement for the Manager if the Management Agreement is terminated, or if key personnel leave the employment of KKR or otherwise become unavailable to us.
•our qualification as a real estate investment trust ("REIT") for U.S. federal income tax purposes and our exclusion from registration under the Investment Company Act of 1940, as amended (the "Investment Company Act"); and
•authoritative accounting principles generally accepted in the United States of America ("GAAP") or policy changes from such standard-setting bodies such as the Financial Accounting Standards Board (the "FASB"), the Securities and Exchange Commission (the "SEC"), the Internal Revenue Service, the New York Stock Exchange and other authorities that we are subject to, as well as their counterparts in any foreign jurisdictions where we might do business.
PART I.
ITEM 1. BUSINESS
Our Company
KREF is a real estate finance company that focuses primarily on originating and acquiring transitional senior loans secured by institutional-quality commercial real estate ("CRE") properties that are owned and operated by experienced and well-capitalized sponsors and located in liquidtop markets with strong underlying fundamentals. Our target assets also include mezzanine loans, preferred equity and other debt-oriented instruments with these characteristics. Our investment objective is capital preservation and the generation of attractive risk-adjusted returns for our stockholders over the long term, primarily through dividends.
We began our investment activities in October 2014 with an initial commitment of $400.0 million from KKR. We raised an additional $438.1 million in equity commitments from third-party investors and certain current and former employees of, and consultants to, KKR that brought our total committed capital base to $838.1 million, which was fully drawn prior to our initial public offering ("IPO") that generated net proceeds of $225.9 million on May 5, 2017. We had a common book value of $1,188.9$1,077.0 million as of December 31, 20212023 and established a diversified investment portfolio which totaled $6,791.5$7,752.3 million, consisting primarily of performing senior and mezzanine commercial real estate loans.
We are organized as a holding company externally managed by our Manager, an indirect subsidiary of KKR, & Co. Inc., and operate our business primarily through various subsidiaries in a single segment that originates, acquires, and finances our target assets.
We conduct our operations as a REIT for federal income tax purposes while operating our business in a manner that allows us to maintain an exclusion from registration under the Investment Company Act of 1940, as amended, (the "Investment Company Act"). We generally will not be subject to U.S. federal income taxes on the portion of our annual net taxable income that we distribute to stockholders if we maintain our qualification as a REIT.
We are traded on the NYSE under the symbol “KREF.” We were incorporated in Maryland on October 2, 2014, and our principal executive offices are located at 30 Hudson Yards, New York, New York.
Our Manager and KKR
We are externally managed by our Manager, an indirect wholly owned subsidiary of KKR, a leading global investment firm that offers alternative asset management as well as capital markets and insurance solutions, with aan over 45-year history of leadership, innovation and investment excellence. KKR manages multiple alternative asset classes includingsponsors investment funds that invest in private equity, energy, infrastructure,credit and real estate,assets, and credit, withas strategic manager partnershipspartners that manage hedge funds. KKR is listed on the NYSE (NYSE: KKR) and reported $470.6$552.8 billion of assets under management ("AUM") as of December 31, 2021.2023. KKR's "One-Firm" culture encourages collaboration and leveraging resources and relationships across KKR to help find creative solutions for clients seeking capital and strategic partnerships. We believe our Manager's relationship with KKR and its differentiated global investment management platform provides us with significant advantages in sourcing, evaluating, underwriting and managing our investments.
In connection with the performance of its duties, our Manager benefits from the resources, relationships and expertise of KKR's real estate group ("KKR Real Estate"), which provides equity and debt capital across a variety of real estate sectors and strategies. Established in 2011 under the leadership of Ralph F. Rosenberg, Global Head of KKR Real Estate and Chairman of our board of directors, KKR Real Estate had $40.5over $68 billion of AUM as of December 31, 2021.2023. Mr. Rosenberg, who has over 35 years of real estate equity and debt transactions experience, is supported at KKR Real Estate by a team of approximately 135 150 dedicated investment and assetasset/portfolio management professionals across twelve16 offices globally. We believe that KKR Real Estate's global relationships with property owners, managers, lenders, brokers and advisors and real-time knowledge derived from its broadly diversified real estate holdings provide our Manager with access to sourcing channels as well as operational and strategic insights to help our Manager evaluate and monitor individual investment opportunities. Additionally, our Manager leverages the proprietary information available to us through KKR's global investment platforms to conduct thorough underwriting and due diligence and develop a deeper understanding of the opportunities, risks and challenges of the investments that we review. Further, our Manager benefits from KKR Capital Markets,KKR's capital markets team, comprised of a team over 65 investmentof approximately 70 professionals that advise KKR's investment teams and portfolio companies on executing equity and debt capital markets solutions.
Our Manager is led by an experienced team of senior real estate investment professionals, including Matthew A. Salem, our Chief Executive Officer, and W. Patrick Mattson, our President and Chief Operating Officer, who each has over 25 years of CRE experience. Our Manager's senior leadership team is supported by over 5056 other investment professionals with significant expertise in executing our investment strategy. Our Manager's investment committee, which is comprised of Ralph Rosenberg, KKR’s Global Head of Real Estate and Chairman of our board of directors, Chris Lee, HeadCo-President of KKR'sKKR Real Estate Americas and Vice Chairman of our board of directors, Matt Salem, Head of KKR’s Real Estate Credit and Chief Executive Officer of KREF, Patrick Mattson, Chief Operating Officer of KKR’s Real Estate Credit and President and Chief Operating Officer of KREF, Ms.Joel Traut, Partner & Head of Originations, Jenny Box, Co-Head of KKR’s Special Situations, Billy Butcher, Chief Operating OfficerCo-President of KKR's GlobalKKR Real Estate, Roger Morales, Head of KKR's Real Estate Acquisitions Americas and Justin Pattner, Head of KKR's Real Estate Equity Americas, advises and consults with our Manager and its investment professionals with respect to our investment strategy, portfolio construction, financing and investment guidelines and risk management and approves all of our investments.
Our Investment Strategy
Our investment strategy is to originate or acquire transitional senior loans collateralized by institutional-quality CRE assets that are owned and operated by experienced and well-capitalized sponsors and located in liquidtop markets with strong underlying fundamentals. We also intend to invest in mezzanine loans, preferred equity and other debt-oriented instruments with these characteristics. Through our Manager, we have access to KKR's integrated, global real estate investment platform and its established sourcing, underwriting and structuring capabilities to develop our own view on value and evaluate and structure credit risk from an owner's and a lender's perspective. In addition, we believe that we benefit from our access to KKR's global network and real estate and other investment holdings, which provide our Manager with access to information and market data that is not available to many of our competitors. In many instances, we are able to make investments where we believe we have a sourcing, underwriting or execution advantage by leveraging the KKR brand, industry knowledge and proprietary relationships.
We pursue opportunities for which we believe that we are lending at a substantial discount to our Manager's view of intrinsic real estate value, which our Manager substantiates through an independent assessment of value. We also seek investment opportunities where there is the potential to increase the value of the underlying loan collateral through improving property management or implementing strategic capital improvement initiatives, and as such, focus on lending to sponsors with histories of successful execution in their respective asset classes or markets. Additionally, we endeavor to make loans with covenants and structural features that align the incentives of us and our borrowers to the extent that the operating performance of the underlying collateral deteriorates.
Our financing strategy and investment process are discussed in more detail in "Our Financing Strategy" and "Investment Guidelines" below.
Our Target Assets
Our target assets primarily include transitional senior loans, as well as mezzanine loans, preferred equity and other debt-oriented investments:
•Senior Loans—We focus on originating and acquiring senior loans that are secured by CRE properties and evidenced by a first-priority mortgage. The loans may vary in duration, bear interest at a fixed or floating rate and amortize, and typically require a balloon payment of principal at maturity, but are typically anticipated to be floating rate and shorter-term duration. These investments may include whole loans or pari passu participations within such senior loans.
•Mezzanine Loans—We may syndicate senior participations in our originated senior loans to other investors and retain a subordinated debt position for our portfolio, typically a mezzanine loan. We may also directly originate or acquire mezzanine loans. These are loans (including pari passu participations in such loans) made to the owner of a mortgage borrower and secured by a pledge of equity interests in the mortgage borrower. These loans are subordinate to a senior loan, but senior to the owner's equity. These loans may be tranched into senior and junior mezzanine loans, with the junior mezzanine lenders secured by a pledge of the equity interests in the more senior mezzanine borrower. The mezzanine lender typically has different rights as compared to the more senior lenders, including the right to cure defaults under the senior loan and any senior mezzanine loan and purchase the senior loan and any senior mezzanine loan, in each case under certain circumstances following a default on the senior loan. Following a default on a mezzanine loan, and subject to negotiated terms with the mortgage lender or other mezzanine lenders, the mezzanine
lender generally has the right to foreclose on its equity interest and become the owner of the property, directly or indirectly, subject to the lien of the senior loan and any other debt senior to it including any outstanding senior mezzanine loans.
•Preferred Equity—We may make investments that are subordinate to any mortgage or mezzanine loan, but senior to the common equity of the mortgage borrower or owner of a mortgage borrower, as applicable. Preferred equity investments typically pay a preferred return from the investment's cash flow rather than interest payments and often have the right for such preferred return to accrue if there is insufficient cash flow for current payment. These interests are not secured by the underlying real estate, but upon the occurrence of a default, the preferred equity provider typically has the right to effect a change of control with respect to the ownership of the property.
•CMBS B-Pieces (New Issue)—We may also make investments that consist generally of below investment-grade bonds comprising some or all of the BB-rated, B-rated and unrated tranches of a CMBS securitization pool. The underlying loans are typically aggregated into a pool and sold as securities to different investors. Under the pooling and servicing agreements that govern these pools, the loans are administered by a trustee and servicers, who act on behalf of all investors and distribute the underlying cash flows to the different classes of securities in accordance with their seniority. The below-investment grade securities that comprise each CMBS B-Piece have generally in the past been acquired in aggregate. Due to their first loss position, these investments are typically offered at a discount to par. These investments typically carry a 10-year weighted average life due to prepayment restrictions on the underlying loans. We generally intend to hold these investments through maturity, but may, from time to time, opportunistically sell positions should liquidity become available or be required. Under the risk retention rules under the Dodd-Frank Wall Street Reform and Consumer Protection Act (the "Dodd-Frank Act") that went into effect in December 2016, CMBS B-Piece investments may also include BBB-rated securities and are subject to certain additional restrictions that, among other things, prohibit hedging CMBS B-Pieces or selling CMBS B-Pieces for a period of at least five years from the date the investment was made. We currently hold CMBS B-Piece investments indirectly through our investment in an aggregator vehicle alongside KKR Real Estate Credit Opportunity Partners L.P. ("RECOP I"), a KKR-managed investment fund. See Part II, Item 7. "Management's Discussion and Analysis of Financial Condition and Results of Operations—Our Portfolio."
•Other Real Estate Securities—We may make investments in real estate that take the form of CMBS (other than CMBS B-Pieces) or Collateralized Loan Obligations ("CLO") that are collateralized by pools of real estate debt instruments, often senior loans. We may also acquire the debt securities of other REITs or other entities engaged in real estate operating or financing activities, but generally not for the purpose of exercising control over such entities.
Our Portfolio
We began operations in October 2014 and have established a portfolio of diversified investments, consisting primarily of performing senior and mezzanine loans. Our aggregate investment portfolio totaled $6,791.5 million$7.8 billion as of December 31, 2021,2023, which is primarily comprised of $6,677.2 million$7.6 billion of total outstanding principal of senior and mezzanine CRE loans, a $78.6$158.6 million net investment in real estate owned assetassets (“REO”), and a $35.7 million investment in CMBS B-Pieces (indirectly-owned through RECOP I). We believe our current portfolio, comprised of target assets representative of our investment philosophy, validates our ability to execute on our stated market opportunity and investment strategy, including lending against high-quality real estate in liquidtop markets with strong fundamentals to experienced and well-capitalized sponsors. Since our IPO, we have continued to execute on our primary investment strategy of originating floating-rate transitional senior loans and, as we continue to scale our portfolio, we expect that our originations will continue to be heavily weighted toward floating-rate loans. We expect the majority of our future investment activity to focus on originating floating-rate senior loans that we finance with our repurchase facilities and non-mark-to-market financing including term lending arrangements, asset based financing and collateralized loan obligations. In addition, we originate floating-rate loans for which we syndicate a senior position and retain a subordinated interest for our portfolio. As of December 31, 2021,2023, all of our investments were located in the United States.
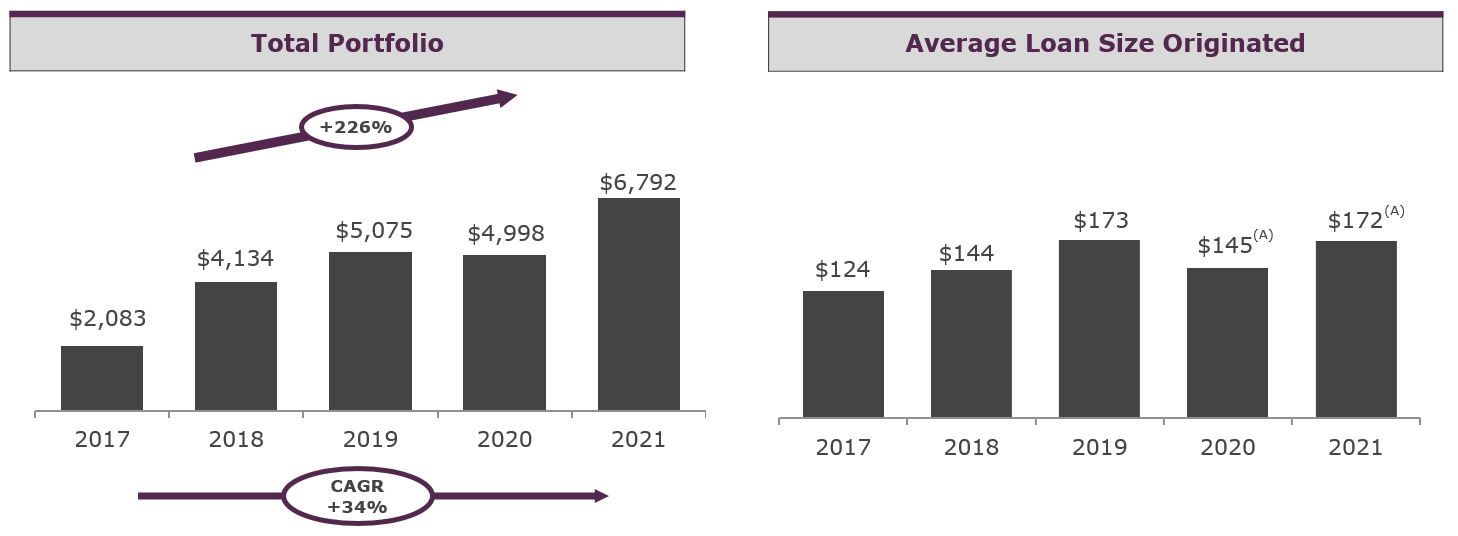
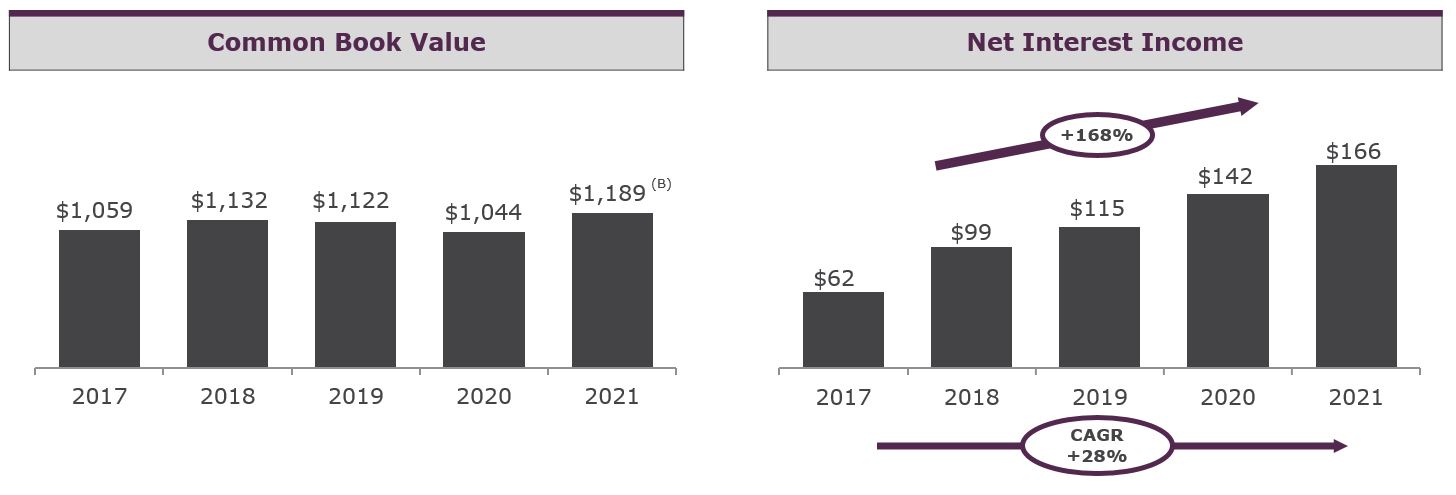
The following charts illustrate the growth insize of our portfolio average loan size originated, net interest income and common book value, as well as therelated compound annual growth rate ("CAGR"), and common book value, over the years ended December 2017, 2018, 2019, 202031, 2023 and 2021the preceding four years (dollars in millions):
(A) The average committed loan size, net of amounts committed by KKR affiliates, was $130.9 million and $91.8 million for the years ended December 31, 2021 and 2020, respectively.
(B) Common book value as of December 31, 2021 was net2023 includes the impact of$23.7 million a CECL allowance.allowance of $212.5 million.
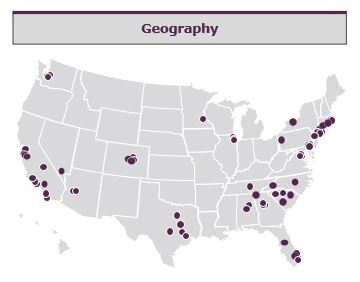
The map below illustrates the geographic distribution of the properties securing our loan portfolio as of December 31, 2021:
2023:
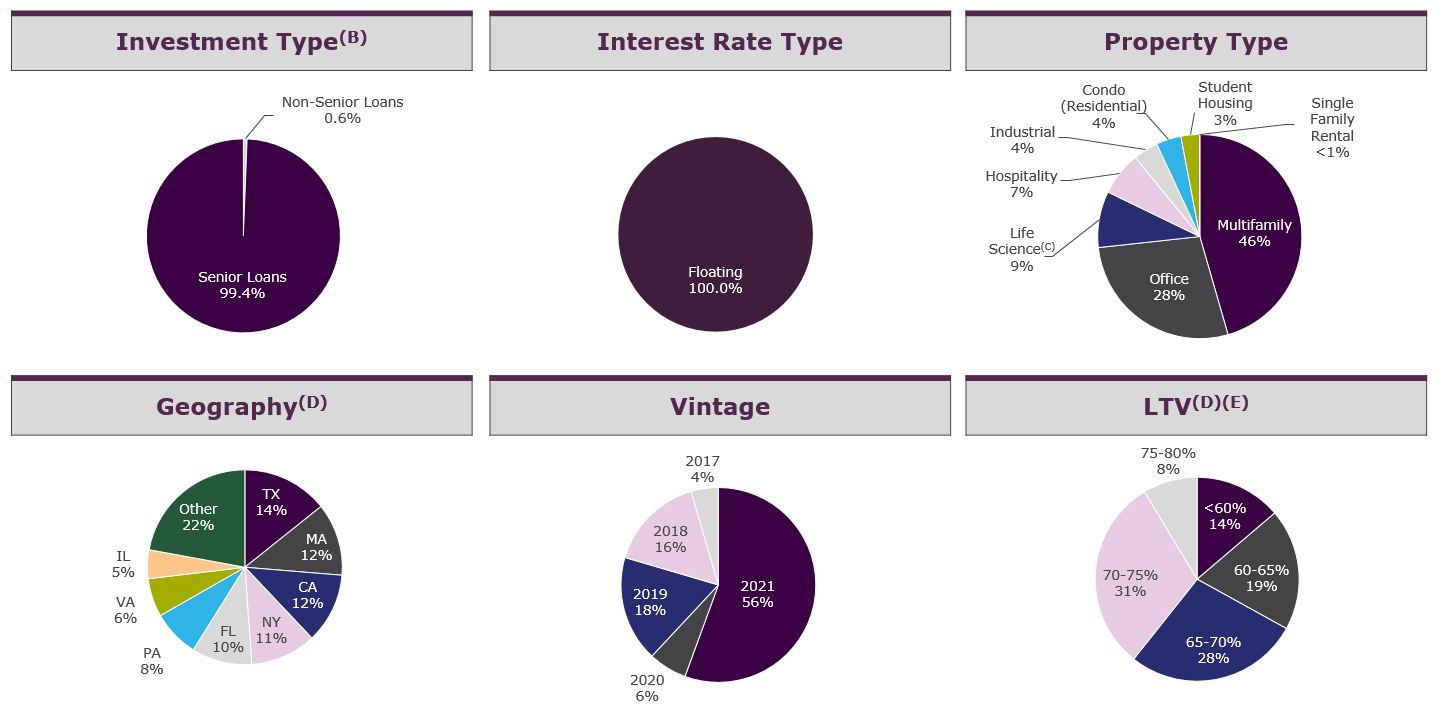
The following charts illustrate the diversification of our loan portfolio(A), based on type of investment, interest rate, underlying property type, geographic location, vintage and loan to value ("LTV") as of December 31, 2021:2023:
The charts above are based on total outstanding principal amountloan exposure of our senior, mezzanine andcommercial real estate corporate loans. Includes junior participations in our originated senior loans for which we have syndicated the senior participations and retained the junior participations for our portfolio, and excludes pari passu and vertical loan participations.
(A) Excludes: (i) one REO retail asset on one defaulted loan with net carrying value of $78.6158.6 million as of December 31, 2021,, (ii) CMBS B-Piece investments held through RECOP I, an equity method investment and (iii) one impaired mezzanine loan(iii) fully written off risk-rated 5 loans with ana combined outstanding principal balance of $5.5 million that was fully written off.$45.5 million.
(B) Senior loans include senior mortgages and similar credit quality loans, including related contiguous junior participations in senior loans where we have financed a loan with structural leverage through the non-recourse sale of a corresponding first mortgage.
(C) We classify a loan as life science if more than 50% of the gross leasable area is leased to, or will be converted to, life science-related space.
(D) Excludes one real estate corporate loan to a multifamily operator with an outstanding principal amount of $41.1 millionOther property type includes Condo (Residential) (2%), representing 0.6% of our commercial real estate loans, at December 31, 2021.Self-Storage (2%), Student Housing (1%) and Single Family Rental (1%).
(E) LTV is generally based on the initial loan amount divided by the as-is appraised value as of the date the loan was originated or by the current principal amount as of the date of the most recent as-is appraised value. Weighted average LTV includes non-consolidated senior interests and excludes risk-rated 5 loans.
Our senior loans as of December 31, 2023 had a weighted average LTV of 68% as of December 31, 2021,66%, and we have focused our portfolio on senior positions in the capital structure where the sponsor has meaningful cash or imputed equity subordinated to our position to provide what we believe is downside protection in the event of credit impairment at the asset level.
For additional information regarding our portfolio as of December 31, 2021,2023, see Part II, Item 7. "Management's Discussion and Analysis of Financial Condition and Results of Operations."
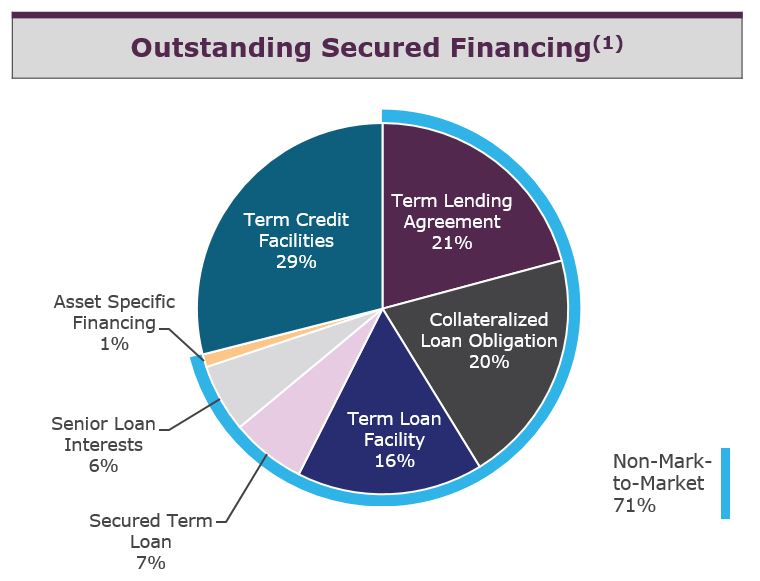
Our Financing Strategy
We raise capital through offerings of our equity and debt securities to fund future investments. In addition, as part of our portfolio financing strategy, we may use both direct and structural leverage. Our use of direct leverage includes the utilization of repurchase facilities, term lending arrangements, asset based financing, collateralized loan obligations, secured term loan and revolving credit agreements. Term lending arrangements, asset based financing and collateralized loan obligations provide us with Non-Mark-to-Market financing sources, which reduces our exposure to market fluctuations. These Non-Mark-to-Market financing sources, which represented 71%76% of our total portfoliosecured financing as of December 31, 2021,2023, are not subject to credit or capital markets mark-to-market provisions. The remaining 29% 24% of our secured borrowings, which is primarily comprised of three master repurchase agreements, are only subject to credit marks. In addition, we may use structural leverage by syndicating senior mortgage interests in our originated senior loans to other investors and create a subordinated interest that we retain for our portfolio. When utilizing structural leverage, our retained interest is generally a mezzanine loan, secured by a pledge of
100% of the equity ownership interests in the owner of the real property and is generally not subject to recourse. Our retained interest when utilizing structural leverage is subordinate to the lien of the third-party lender that owns the senior interest.
During the year ended and as of December 31, 2021,2023, we:
•ClosedExtended a $1.3 billion managed collateralized loan obligation ("CLO") with a two-year reinvestment period providing $1.1 billion of non-mark financing equating to an 84.25% advance rate$600.0 million master repurchase agreement and a weighted average cost of capital of L+1.30% before transaction costs, and concurrently, fully repaid the outstanding notes under our 2018 CLO,$500.0 million warehouse facility maturity date to March 2026
•Entered intoUpsized a $500.0$240.0 million term lendingmaster repurchase agreement with a third-party financial institution, which provides asset-based financing on a Non-Mark-to-Market basis with matched term up to five years,$400.0 million and extended the final maturity date to December 2027
•Refinanced and upsized our then existing $297.8Repaid $143.8 million secured term loan by $52.2 million add-on, for an aggregate principal amountconvertible notes in cash
•Had no corporate debt or final facility maturities due until the first quarter of $350.0 million due September 2027, which was issued at par. The new secured term loan bears interest at L+3.50% and is subject to a LIBOR floor of 0.50%, which is an aggregate improvement of 1.75%.2026
As a result, our Non-Mark-to-Market financing is $3.8was $4.8 billion as of December 31, 2021,2023, representing 71%76% of our total outstanding portfoliosecured financing.
The following table details our outstanding financing arrangements as of December 31, 20212023 (amounts in thousands):
| | | | | | | | | | | | | | | | |
| | Portfolio Financing Outstanding Principal Balance | | Maximum Capacity | | |
| Master repurchase agreements | | $ | 1,554,808 | | | $ | 1,840,000 | | | |
| Term loan financing | | 870,458 | | | 1,000,000 | | | |
| Term lending agreements | | 1,117,627 | | | 1,171,625 | | | |
| Collateralized loan obligation | | 1,095,250 | | | 1,095,250 | | | |
| Warehouse facility | | — | | | 500,000 | | | |
| Secured term loan | | 350,000 | | | 350,000 | | | |
| Asset specific financing | | 60,000 | | | 300,000 | | | |
| Revolving credit agreement | | 135,000 | | | 335,000 | | | |
| Non-consolidated senior interests | | 318,634 | | | 318,634 | | | |
| Total portfolio financing | | $ | 5,501,777 | | | $ | 6,910,509 | | | |
| | | | | | | | | | | | | | |
| | Portfolio Financing Outstanding Principal Balance | | Maximum Capacity |
| Master repurchase agreements | | $ | 1,477,227 | | | $ | 2,000,000 | |
| Collateralized loan obligation | | 1,942,750 | | | 1,942,750 | |
| Term lending agreements | | 1,329,390 | | | 1,977,399 | |
| Term loan facility | | 561,377 | | | 1,000,000 | |
| Asset specific financing | | 266,072 | | | 490,625 | |
| Warehouse facility | | — | | | 500,000 | |
| Secured term loan | | 343,000 | | | 343,000 | |
| Revolving credit agreement | | 160,000 | | | 610,000 | |
| Non-consolidated senior interests | | 188,611 | | | 188,611 | |
| Total portfolio financing | | $ | 6,268,427 | | | $ | 9,052,385 | |
The following chart illustrates our progress in diversifying our financing sources and expanding our non-mark-to-market financing sources to reduce our exposure to market volatility:
(1) Based on outstanding faceprincipal amount of secured financing, facilities and excludes convertible notes and Revolver.including non-consolidated senior interests, that resulted from non-recourse sales of senior loan interest in loans we originated
Financing Risk Management
The amount of leverage employed on our assets will depend on our Manager's assessment of the credit, liquidity, price volatility and other risks of those assets and the financing counterparties and availability of particular types of financing at any given time.
We plan to maintain leverage levels appropriate to our specific portfolio. On average, we are targeting a leverage ratio on our senior loans between 3.5 and 4.0-to-1 on a debt to equity basis, as compared toAs of December 31, 2023, our total leverage ratio of 3.7-to-1 as of December 31, 2021. was 4.2-to-1. We will endeavor to match the terms and indices of our assets and liabilities and will also seek to minimize the risks associated with mark-to-market and recourse borrowing.
Investment Guidelines
Under the management agreement with our Manager, our Manager is required to manage our business in accordance with certain investment guidelines, which include:
•seeking to invest our capital in a broad range of investments in or relating to CRE debt;
•not making investments that would cause us to fail to qualify as a REIT for U.S. federal income tax purposes;
•not making investments that would cause us or any of our subsidiaries to be required to be registered as an investment company under the Investment Company Act;
•allowing allocation of investment opportunities sourced by our Manager to one or more KKR funds advised by our Manager or its affiliates in addition to us, in accordance with the allocation policy then in effect, as applied by our Manager in a fair and equitable manner;
•prior to the deployment of capital into investments, causing our capital to be invested in any short-term investments in money market funds, bank accounts, overnight repurchase agreements with primary federal reserve bank dealers collateralized by direct U.S. government obligations and other instruments or investments reasonably determined by our Manager to be of high quality; and
•investing not more than 25% of our "equity" in any individual investment without the approval of a majority of our board of directors or a duly constituted committee of our board of directors (it being understood, however, that for purposes of the foregoing concentration limit, in the case of any investment that is comprised (whether through a structured investment vehicle or other arrangement) of securities, instruments or assets of multiple portfolio issuers, such investment for purposes of the foregoing limitation will be deemed to be multiple investments in such underlying securities, instruments and assets and not such particular vehicle, product or other arrangement in which they are aggregated).
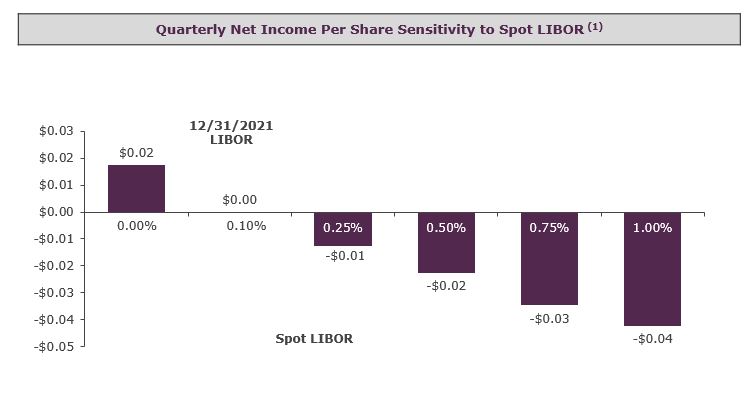
Impact of Interest Rate Environment
Generally, our business model is such that rising interest rates will result in an increase to our net income, while declining interest rates will decrease our net income. Our net interest income currently benefits from in-the-money LIBOR floors in our loan portfolio, which benefit is expected to initially decrease as LIBOR increases. There can be no assurance that we will continue to utilize LIBOR floors. As of December 31, 2021, 98.3%2023, 99.0% of our loans by total investment portfolioloan exposure earned a floating rate of interest indexed to one-month LIBOR, and of those investments that were financed, all were financed with liabilities that pay a floating rate of interest indexed to one-month LIBOR.Term SOFR.
Additionally, floating-rate senior loans typically have lower interest rate sensitivity and less susceptibility to price declines than fixed-rate investments when short-term rates rise. As a result, we believe that our investment strategy, which is primarily focused on originating or acquiring LIBOR-basedfloating-rate senior loans, strategically positions our portfolio to earn attractive risk-adjusted yields in a rising interest rate environment. In a rising interest environment, our interest income on our current portfolio will initially decline due to in-the-money LIBOR floors on 70% of our portfolio, and is then expected to increase as rates go higher or such loans get repaid/refinanced.increase. In a declining interest rate environment, our interest income generally decreasesis expected to decrease as LIBOR decreases;index rates decrease; in certain circumstances, however, LIBORrate floors relating to our loan portfolio may offset some
of the impact from declining rates. As of December 31, 2021, approximately 54% of our loan portfolio by current principal amount outstanding had a LIBOR floor in place of 0.25% or higher, with a weighted average floor of 0.74%.
With respect to our fixed-rate CMBS portfolio indirectly held through an equity method investment, rising interest rates could have a negative effect on the value of the securities in our portfolio. Such CMBS securities are purchased at a substantial discount to their faceprincipal amount and are much more sensitive to changes in the underlying credit of the securities and credit
spreads than to fluctuations in interest rates. However, an increase in long-term rates, with other factors held constant, may have a negative impact on the market value of the CMBS portfolio.
The following chart illustrates the sensitivity of our net interest income to changes in LIBORTerm SOFR on a per weighted average diluted common share basis:
(1) Assumes loans are drawn up to maximum approved advance rate based on current principal amount outstanding as of December 31, 2021.
For a further discussion, see Part II, Item 7. "Management's Discussion and Analysis of Financial Condition and Results of Operations—Quantitative and Qualitative Disclosures About Market Risk—Interest Rate Risk."
TheOn March 5, 2021, the Financial Conduct Authority of the U.K. (the “FCA”), which regulates LIBOR, announced (the “FCA Announcement”) that all relevant LIBOR tenors relevant to us willwould cease to be published or willwould no longer be representative after June 30, 2023. WithinThe FCA Announcement coincided with the March 5, 2021 announcement of LIBOR’s administrator, the ICE Benchmark Administration Limited (the “IBA”), indicating that, as a result of not having access to input data necessary to calculate relevant LIBOR tenors on a representative basis after June 30, 2023, the IBA would have to cease publication of such LIBOR tenors immediately after the last publication on June 30, 2023. Further, on March 15, 2022, the Consolidated Appropriations Act of 2022, which includes the Adjustable Interest Rate (LIBOR) Act, was signed into law in the United States,States. This legislation established a uniform benchmark replacement process for financial contracts maturing after June 30, 2023 that do not contain clearly defined or practicable fallback provisions. The legislation also created a safe harbor that shields lenders from litigation if they choose to utilize a replacement rate recommended by the Board of Governors of the Federal Reserve.
The Federal Reserve, in conjunction with the Alternative Reference Rate Committee, a committee convened by the Federal Reserve that includes major market participants, has identified the Secured Overnight Financing Rate, or SOFR, a newan index calculated by short-term repurchase agreements, backed by Treasury securities, as its preferred alternative rate for LIBOR. There are significant differences between LIBOR and SOFR, such as LIBOR being an unsecured lending rate while SOFR is a secured lending rate. If our LIBOR-based borrowings are converted torate, and SOFR theis an overnight rate while LIBOR reflects term rates at different maturities. The differences between LIBOR and SOFR, plus the recommended spread adjustment, could result in higher interest costs for us, which could have a material adverse effect on our operating results. We had no assets or liabilities
As of December 31, 2023, our floating-rate loan portfolio and financing arrangements were all indexed to SOFR as of December 31, 2021. We are monitoring the developments with respect to the phasing out of LIBOR and are working with our lenders and borrowers to minimize the impact of any LIBOR transition on our financial condition and results of operations. For a further discussion, see Part I, Item 1A. “Risk Factors—Risks Related to Our Financing and Hedging—Changes in the method for determining LIBOR or the elimination of LIBOR may affect the value of the financial obligations to be held or issued by us that are linked to LIBOR and could affect our results of operations or financial condition.”
Taxation of the Company
We elected to be treated as a REIT for U.S. federal income tax purposes commencing with our taxable year ended December 31, 2014 and expect to continue to operate so as to qualify as a REIT. So long as we qualify as a REIT, we generally will not be subject to U.S. federal income tax on net taxable income that we distribute annually to our stockholders. In order to qualify as a REIT for U.S. federal income tax purposes, we must continually satisfy tests concerning, among other things, the real estate qualification of sources of our income, the composition and values of our assets, the amounts we distribute to our stockholders and the diversity of ownership of our stock. In order to comply with REIT requirements, we may need to forego otherwise attractive opportunities and limit our expansion opportunities and limit the manner in which we conduct our operations.
See Part I, Item 1A. "Risk Factors—Risks Related to our REIT Status and Certain Other Tax Considerations."
Competition
We are engaged in a competitive business. In our lending and investing activities, we compete for opportunities with a variety of institutional lenders and investors, including other REITs, specialty finance companies, public and private funds (including funds that KKR or its affiliates may sponsor, advise and/or manage), commercial and investment banks, commercial finance and insurance companies and other financial institutions. Several other REITs have raised, or are expected to raise, significant amounts of capital, and may have investment objectives that overlap with ours, which may create additional competition for lending and investment opportunities. Some competitors may have a lower cost of funds and access to funding sources that are not available to us. Many of our competitors are not subject to the operating constraints associated with REIT rule compliance or maintenance of an exclusion from registration under the Investment Company Act. In addition, some of our competitors may have higher risk tolerances or different risk assessments, which could allow them to consider a wider variety of loans and investments, offer more attractive pricing or other terms and establish more relationships than us. Furthermore, competition for originations of and investments in our target assets may lead to the yields of such assets decreasing, which may further limit our ability to generate satisfactory returns.
In addition, changes in the financial regulatory regime could decrease the current restrictions on banks and other financial institutions and allow them to compete with us for investment opportunities that were previously not available to them. See Part I, Item 1A. "Risk Factors—Risks Related to Our Company—Changes in laws or regulations governing our operations, changes in the interpretation thereof or newly enacted laws or regulations and any failure by us to comply with these laws or regulations, could require changes to certain of our business practices, negatively impact our operations, cash flow or financial condition, impose additional costs on us, subject us to increased competition or otherwise adversely affect our business."
We believe access to our Manager's and KKR's professionals and their industry expertise and relationships provide us with competitive advantages in assessing risks and determining appropriate pricing for potential investments. We believe these relationships will enable us to compete more effectively for attractive investment opportunities. However, we may not be able to achieve our business goals or expectations due to the competitive risks that we face. For additional information concerning these competitive risks, see Part I, Item 1A. "Risk Factors—Risks Related to Our Lending and Investment Activities—We operate in a competitive market for lending and investment opportunities, and competition may limit our ability to originate or acquire desirable loans and investments or dispose of assets we target and could also affect the yields of these assets and have a material adverse effect on our business, financial condition and results of operations."
Human Capital
We do not have any employees. We are externally managed by our Manager pursuant to the management agreement between our Manager and us. Our executive officers are employees of our Manager or one or more of its affiliates. See "Our Manager and KKR."
Additional Information Available
Our website address is www.kkrreit.com. Information on our website is not incorporated by reference herein and is not a part of this Annual Report on Form 10-K. We make available free of charge on our website or provide a link on our website to our Annual Report on Form 10-K, Quarterly Reports on Form 10-Q and Current Reports on Form 8-K, and any amendments to those reports filed or furnished pursuant to Section 13(a) or 15(d) of the Exchange Act, as soon as reasonably practicable after
those reports are electronically filed with, or furnished to, the SEC. To access these filings, go to the “Investor Relations” page on our website, then click on “SEC Filings”. Our SEC filings are also available to the public from the SEC’s internet site at http://www.sec.gov. From time to time, we may use our website at www.kkrreit.com as a channel of distribution of material information. Financial and other material information regarding our company is routinely posted and accessible on our website. In addition, you may automatically receive e-mail alerts and other information about our company by enrolling your e-mail address by visiting the “E-mail Alerts” section of the “Investor Relations” page on our website.
ITEM 1A. RISK FACTORS
The following risks could materially and adversely affect our business, financial condition, and results of operations, and the trading price of our common stock could decline. These risk factors do not identify all risks that we face, and our operations could also be affected by factors that are not presently known to us or that we currently consider to be immaterial to our operations. Due to risks and uncertainties, known and unknown, our past financial results may not be a reliable indicator of future performance, and historical trends should not be used to anticipate results or trends in future periods. Refer also to the other information set forth in this Annual Report on Form 10-K, including “Management’s Discussion and Analysis of Financial Condition and Results of Operations” and our financial statements and the related notes thereto.
Risks Related to the COVID-19 Pandemic
The ongoing COVID-19, pandemic has caused severe disruptions in the U.S. and global economy and to our business, and may have an adverse impact on our performance and results of operations.
The ongoing COVID-19 pandemic continues to adversely impact global commercial activity and has contributed to significant volatility in financial markets. During 2020, the COVID-19 pandemic created disruption in global supply chains, contributed to increased inflation, increased rates of unemployment and adversely impacted many industries, including industries related to the collateral underlying certain of our loans. The impact of the outbreak has been rapidly evolving around the globe, with several countries, at various times, taking drastic measures to limit the spread of the virus by instituting quarantines or lockdowns, imposing travel restrictions and limiting operations of non-essential offices and retail centers.
In 2021, the global economy, with certain setbacks, began reopening, and wider distribution of vaccines will likely encourage greater economic activity. However, wide disparities in vaccination rates, continued vaccine hesitancy and vaccine effectiveness on certain variants, combined with the emergence of COVID-19 variants and surges in COVID-19 cases, could trigger the reinstatement of restrictions, including mandatory business shut-downs, travel restrictions, reduced business operations and social distancing requirements, which could dampen or delay any economic recovery and could materially and adversely affect our results and financial condition. In addition, the COVID-19 pandemic continues to disrupt global supply chains, has caused labor shortages and has added broad inflationary pressures, which has a potential negative impact on our borrowers’ ability to execute on their business plans and potentially their ability to perform under the terms of their loan obligations. Although we have observed signs of economic recovery and are generally encouraged by the response of our borrowers, we cannot predict the time required for a widespread sustainable economic recovery to take hold, particularly as some newer strains of the virus appear to have had increased transmissibility and may complicate treatment and vaccination programs.
Accordingly, the scale and scope of the COVID-19 pandemic may continue to heighten a number of potential adverse effects on our business, financial performance, operating results, cash flows and/or financial condition described in this report, which may be material and affect us in ways we cannot foresee at this time. Although it is impossible to predict with certainty the potential full magnitude of the business and economic ramifications of the pandemic, COVID-19 has impacted, and may further impact, our business in various ways, including but not limited to:
•the inability of our borrowers’ tenants to pay rent on their leases or our borrowers’ inability to re-lease space that becomes vacant, which inability, if extreme, could cause our borrowers to default on their loans and could cause us to: (i) no longer be able to pay dividends at our current rates or at all in order to preserve liquidity and (ii) be unable to meet our debt obligations to lenders or satisfy our debt covenants, which could cause us to have to sell our investments or refinance debt on unattractive terms;
•a severe disruption and instability in the global financial markets or deteriorations in credit and financing conditions may affect our ability to access capital necessary to fund our investments at attractive interest rates, or at all, and may adversely affect the valuation of financial assets and liabilities, any of which could affect have a material adverse effect on our business, financial condition, results of operations and cash flows;
•uncertainties created by the COVID-19 pandemic may make it difficult to estimate provisions for loan losses;
•deterioration in the performance of the properties securing our investments that may cause deterioration in the performance of our investments and, potentially, principal losses to us;
•difficulty or delays in redeploying the proceeds from repayments of our existing investments;
•provisions in our current and future financing agreements may require us to provide additional collateral or pay down debt;
•economic and market conditions affecting the value of our financial instruments and the value of particular assets and liabilities; and
•fluctuations in equity market prices, interest rates and credit spreads limiting our ability to raise or deploy capital on a timely basis and affecting our overall liquidity.
In addition, the COVID-19 pandemic may adversely impact our business and financial condition in other areas, including:
•an inability to operate or review potential investments in affected areas as a result of quarantines, restrictions on travel, “shelter in place” rules, restrictions on types of businesses that may continue to operate and/or restrictions on types of construction projects that may continue;
•delays in responsiveness by borrowers and other third parties in other matters arising in the ordinary course of business due to their prioritization of matters relating to COVID-19;
•some of our borrowers and/or their tenants operate in industries that have been materially impacted by COVID-19, including but not limited to healthcare, travel, entertainment, hospitality, senior living and retail industries. Such persons may face continued operational and financial hardships resulting from the spread of COVID-19 and related governmental measures, such as the closure of stores, restrictions on travel, quarantines or stay-at-home orders. For example, with respect to retail properties in our loan portfolio, individual non-essential stores have been, and may continue to be, closed for an extended period of time or only open certain hours of the day. Certain office and industrial properties in our loan portfolio have been negatively impacted by similar impacts on the businesses of our borrowers and their tenants and may continue to be impacted by tenant bankruptcies and defaults. Multifamily properties in our loan portfolio have been impacted by declining household incomes and wealth, which may result in delinquencies or vacancies. While many government-imposed restrictions have been lifted since the onset of the pandemic, if the disruptions caused by COVID-19 continue and such restrictions are re-imposed, the businesses of borrowers and/or their tenants could continue to suffer materially or become insolvent, which would adversely affect our business;
•the long-term impact on the market for office properties in the event a significant number of businesses determine to continue to utilize large-scale work-from-home policies as the COVID-19 pandemic continues and thereafter;
•remote working by our Manager’s and/or its affiliate’s employees could strain our technology resources and introduce operational risks, including heightened cybersecurity risk. Remote working environments may be less secure and more susceptible to hacking attacks, including phishing and social engineering attempts that seek to exploit the COVID-19 pandemic; and
•COVID-19 presents a significant threat to our Manager’s and/or its affiliate’s employees’ well-being and morale, and we may experience potential loss of productivity or a delay in the roll out of certain strategic plans.
Because the properties securing our loan portfolio are located in the United States, COVID-19 will impact such loans and operating results of our borrowers to the extent that its continued spread within the United States reduces occupancy, increases the cost of operation, results in limited hours or necessitates the closure of such properties. In addition, the imposition of governmental measures, such as quarantines, states of emergencies, restrictions on travel, stay-at-home orders, and other measures taken to curb the spread of COVID-19 may negatively impact the ability of our borrowers to continue to obtain necessary goods and services or provide adequate staffing, which may also adversely affect our loans and operating results.
We maintain a robust asset management relationship with our borrowers and have utilized these relationships to proactively address the potential impacts of the COVID-19 pandemic on our loans secured by properties experiencing cash flow pressure, most significantly hospitality and retail assets. Some of our borrowers have indicated that due to the impact of the COVID-19 pandemic, they will be unable to timely execute their business plans, have had to temporarily close their businesses, or have experienced other negative business consequences and have requested temporary interest deferral or forbearance, or other modifications of their loans. Accordingly, discussions we have had with our borrowers have addressed potential near-term defensive loan modifications, which could include repurposing of reserves, temporary deferrals of interest, or performance test or covenant waivers on loans collateralized by assets directly impacted by the COVID-19 pandemic, and which would generally
be coupled with an additional equity commitment and/or guaranty from sponsors. The pandemic may result in more frequent modifications of our loans in the future and instances of default or foreclosure on assets underlying our loans.
Given the ongoing nature of the outbreak, at this time we cannot reasonably estimate the magnitude of the ultimate impact that COVID-19 will have on our business, financial performance and operating results. We believe COVID-19’s adverse impact on our business, financial performance and operating results will in part be significantly driven by a number of factors that we are unable to predict or control, including, for example: the severity and duration of the pandemic; the distribution and acceptance of vaccines and their impact on the timing and speed of economic recovery; the spread of new variants of the virus; the pandemic’s impact on the U.S. and global economies, including concerns regarding additional surges of the pandemic or the expansion of the economic impact thereof as a result of certain jurisdictions “re-opening” or otherwise lifting certain restrictions prematurely; the availability of U.S. federal, state, local or non-U.S. funding programs aimed at supporting the economy during the COVID-19 pandemic, including uncertainties regarding the potential implementation of new or extended programs; the timing, scope and effectiveness of additional governmental responses to the pandemic; and the negative impact on our financing sources, vendors and other business partners that may indirectly adversely affect us. The prolonged duration and impact of the COVID-19 pandemic could materially disrupt our business operations and negatively impact our business, financial performance and operating results.
Risks Related to Our Lending and Investment Activities
We operate in a competitive market for lending and investment opportunities, and competition may limit our ability to originate or acquire desirable loans and investments or dispose of assets we target and could also affect the yields of these assets and have a material adverse effect on our business, financial condition and results of operations.
A number of entities compete with us to make the types of loans and investments we seek to originate or acquire. Our profitability depends, in large part, on our ability to originate or acquire target assets on attractive terms. In originating or acquiring target assets, we compete with a variety of institutional lenders and investors, including other REITs, specialty finance companies, public and private funds (including funds thatsponsored, advised and/or managed by KKR or its affiliates may in the future sponsor, advise and/or manage)affiliates), commercial and investment banks, commercial finance and insurance companies and other financial institutions. Several other REITs have raised, or are expected to raise, significant amounts of capital, and may have investment objectives that overlap with ours, which may create additional competition for lending and investment opportunities. Some competitors may have a lower cost of funds and access to funding sources that are not available to us, such as the U.S. government. Many of our competitors are not subject to the operating constraints associated with REIT rule compliance or maintenance of an exclusion from registration under the Investment Company Act. In addition, some of our competitors may have higher risk tolerances or different risk assessments, which could allow them to consider a wider variety of loans and investments, offer more attractive pricing or other terms and establish more relationships than us. Furthermore, competition for originations of and investments in our target assets may lead to the yields of such assets decreasing, which may further limit our ability to generate satisfactory returns. In addition, changes in the financial regulatory regime could decrease the current restrictions on banks and other financial institutions and allow them to compete with us for investment opportunities that were previously not available to them. See “Risks Related to Our Company—Changes in laws or regulations governing our operations, changes in the interpretation thereof or newly enacted laws or regulations and any failure by us to comply with these laws or regulations, could require changes to certain of our business practices, negatively impact our operations, cash flow or financial condition, impose additional costs on us, subject us to increased competition or otherwise adversely affect our business” below.
As a result of this competition, desirable loans and investments in our target assets may be limited in the future and we may not be able to take advantage of attractive lending and investment opportunities from time to time. We can provide no assurance that we will be able to identify and originate loans or make investments that are consistent with our investment objectives. We cannot assure you that the competitive pressures we face will not have a material adverse effect on our business, financial condition and results of operations.
In addition, our investment strategy with respect to certain types of investments may depend, in part, on our ability to enter into satisfactory relationships with joint ventures, operating partners and/or strategic co-investors. There can be no assurance that current relationships with such parties will continue (whether on currently applicable terms or otherwise) or that we will be able to establish relationships with other such persons in the future if desired and on terms favorable to us.
Our loans and investments expose us to risks associated with debt-oriented real estate investments generally.
We seek to invest primarily in debt investments in or relating to real estate assets. Any deteriorationDeterioration of real estate fundamentals generally, and in the United States in particular, could negatively impact our performance, increasehas increased the default risk applicable to
borrowers, and/or makeand made it relatively more difficult for us to generate attractive risk-adjusted returns.returns and comtinue to negatively impact our performance. Changes in general economic conditions including as a result of the COVID-19 pandemic, will affecthave affected the creditworthiness of borrowers and/orand the value of underlying real estate collateral relating to our investmentsinvestments. Such changes and have included and/or may in the future include economic and/or market fluctuations, increases in remote working arrangements, changes in environmental, zoning and other laws, casualty or condemnation losses, regulatory limitations on rents, or moratoriums against tenant evictions or foreclosures, decreases in property values, changes in the appeal of properties to tenants, (including due to the impact of COVID-19 on how tenants and workers can safely and efficiently use commercial space), changes in supply and demand of real estate products, fluctuations in real estate fundamentals (including average occupancy and room rates for hotel properties), energy and supply shortages, various uninsured or uninsurable risks, natural
disasters, terrorism, acts of war, outbreaks of pandemic or contagious diseases such as COVID-19, changes in government regulations (such as rent control), political and legislative uncertainty, changes in monetary policy, changes in real property tax rates and operating expenses, changes in interest rates, changes in the availability of debt financing and/or mortgage funds which may render the sale or refinancing of properties difficult or impracticable, increased mortgage defaults, increases in borrowing rates, escalating global trade tensions, the conflict between Russia and Ukraine, deteriorating geopolitical conditions in the Middle East, the adoption or expansion of economic sanctions or trade restrictions, negative developments in the economy that depress travel activity, adverse changes in demand and/or real estate values generally and other factors that are beyond our control. In addition, our investments may be exposed to new or increased risks and liabilities associated with global climate change, such as increased frequency or intensity of adverse weather and natural disasters, which could negatively impact our and our borrowers' businesses and the value of the properties securing our investments.
We cannot predict the degree to which economic conditions generally, and the conditions for real estate debt investing in particular, will improve or decline. Any future declines in the performance of the U.S. and global economies or in the real estate debt markets could have a material adverse effect on our business, financial condition, and results of operations.
Fluctuations in interest rates and credit spreads could reduce our ability to generate income on our loans and other investments, which could lead to a significant decrease in our results of operations, cash flows and the market value of our investments and could materially impair our ability to pay distributions to our stockholders.
Our primary interest rate exposures relate to the yield on our loans and other investments and the financing cost of our debt, as well as any interest rate swaps that we may utilize for hedging purposes. Changes in interest rates and credit spreads will affect our net income from loans and other investments, which is the difference between the interest and related income earned on interest-earning investments and the interest and related expense incurred in financing these investments. As of December 31, 2021, 98.3% of2023, our total investmentsfloating-rate loan portfolio earned a floating rate of interestand financing arrangements were all indexed to one-month USD LIBOR.Term SOFR. In a declining interest rate environment, our interest income generally decreases as LIBOR decreases.index rates decrease. Also, in a declining interest rate environment, the value of our fixed-rate investments may increase and if interest rates were to increase, the value of these fixed-rate investments may fall; however, the interest income generated by these fixed-rate investments would not be affected by market interest rates. The interest rates we pay under our current financing facilities are floating rate.floating-rate. Accordingly, our interest expense will generally increase as interest rates increase and decrease as interest rates decrease. Generally, the composition of our investments is such that rising interest rates will increase our net income, while declining interest rates will decrease our net income. However, LIBORrate floors relating to our floating ratefloating-rate loans may offset some of the impact from declining rates. Our net interest income currently benefits from in-the-money LIBOR floors in our loan portfolio, however that benefit is initially expected to decrease as LIBOR increases. There can be no assurance that we will continue to utilize LIBORrate floors.
In recent years, interest rates had remained at relatively low levels on a historical basis. However, since January 2022, in light of increasing inflation, the U.S. Federal Reserve increased interest rates eleven times. These increases have increased our borrowers interest payments, and adversely affected commercial real estate property values, and could result in higher borrower default rates.
Notwithstanding the current period of relatively high interest rates, the U.S. Federal Reserve has indicated that it may decrease interest rates in 2024. In a period of declining interest rates, our interest income on floating-rate investments would generally decrease, while any decrease in the interest we are charged on our floating-rate debt may be subject to floors and may not compensate for such decrease in interest income. However, rate floors relating to our loan portfolio may offset some of the impact from declining rates. In addition, interest we are charged on our fixed-rate debt would not change. Any such scenario could adversely affect our results of operations and financial condition.
Our operating results depend, in part, on differences between the income earned on our investments, net of credit losses, and our financing costs. The yields we earn on our floating-rate assets and our borrowing costs tend to move in the same direction in response to changes in interest rates. However, one can rise or fall faster than the other, causing our net interest margin to expand or contract. In addition, we could experience reductions in the yield on our investments and an increase in the cost of our financing. Although we seek to match the terms of our liabilities to the expected lives of loans that we acquire or originate, circumstances may arise in which our liabilities are shorter in duration than our assets, resulting in their adjusting faster in response to changes in interest rates. For any period during which our investments are not match-funded, the income earned on such investments may respond more slowly to interest rate fluctuations than the cost of our borrowings. Consequently, changes in interest rates, particularly short-term interest rates, may immediately and significantly decrease our results of operations and cash flows and the market value of our investments. Interest rate and credit spread fluctuations resulting in our interest and related expense exceeding interest and related income would result in operating losses for us, and any such reduction in our net interest income could materially impair our ability to pay distributions to our stockholders. Changes in the level of interest rates and credit spreads may also affect our ability to make loans or investments and the value of our loans and investments.
Furthermore, increases in interest rates and/or credit spreads may negatively affect demand for loans and could result in higher borrower default rates, while decreases in interest rates and/or credit spreads may decrease our interest income on floating-rate investments and may lead to a higher prepayment rates on our loans.
We may not have control over certain of our loans and investments.
Our ability to manage our portfolio of loans and investments may be limited by the form in which they are made. In certain situations, we may:
•acquire investments subject to rights of senior classes, special servicers or collateral managers under intercreditor, servicing agreements or securitization documents;
•pledge our investments as collateral for financing arrangements;
•acquire only a minority and/or a non-controlling participation in an underlying investment;
•co-invest with others through partnerships, joint ventures or other entities, thereby acquiring non-controlling interests; or
•rely on independent third-party management or servicing with respect to the management of an asset.
Therefore, we may not be able to exercise control over all aspects of our loans or investments. Such financial assets may involve risks not present in investments where senior creditors, junior creditors, servicers or third-party controlling investors are not involved. Our rights to control the process following a borrower default may be subject to the rights of senior or junior creditors or servicers whose interests may not be aligned with ours. A partner or co-venturer may have financial difficulties resulting in a negative impact on such asset, may have economic or business interests or goals that are inconsistent with ours, or may be in a position to take action contrary to our investment objectives. In addition, we will generally pay all or a portion of the expenses relating to our joint ventures and we may, in certain circumstances, be liable for the actions of our partners or co-venturers.
CRE-related investments that are secured, directly or indirectly, by real property are subject to delinquency, foreclosure and loss, which could result in losses to us.
CRE debt instruments (e.g., mortgages, mezzanine loans and preferred equity) that are secured by commercial property are subject to risks of delinquency and foreclosure and risks of loss that are greater than similar risks associated with loans made on the security of single-family residential property. The ability of a borrower to repay a loan secured by an income-producing property typically is dependent primarily upon the successful operation of the property rather than upon the existence of independent income or assets of the borrower. If the net operating income of the property is reduced, the borrower’s ability to repay the loan may be impaired. Net operating income of an income-producing property can be affected by, among other things:
•tenant mix and tenant bankruptcies;
•success of tenant businesses;
•property management decisions, including with respect to capital improvements, particularly in older building structures;
•property location and condition;
•competition from other properties offering the same or similar services;
•changes in laws that increase operating expenses or limit rents that may be charged;
•any liabilities relating to environmental matters at the property;
•changes in global, national, regional or local economic conditions and/or specific industry segments;
•increases in remote working arrangements and the subsequent effect on demand for CRE;
•global trade disruption, supply chain issues, significant introduction of trade barriers and bilateral trade frictions;
•labor shortages and increasing wages;
•higher inflation rates;
•declines in global, national, regional or local real estate values;
•declines in global, national, regional or local rental or occupancy rates;
•changes in interest rates and in the state of the credit and securitization markets and the debt and equity capital markets, including diminished availability or lack of debt financing for CRE;
•changes in real estate tax rates and other operating expenses;
•changes in governmental rules, regulations and fiscal policies, including environmental legislation, income tax regulations and other tax legislation;
•outbreaks of contagious or pandemic diseases, including COVID-19;
•acts of God, natural disasters, climate change related risks, terrorism, social unrest and civil disturbances, which may decrease the availability of or increase the cost of insurance or result in uninsured losses; and
•adverse changes in zoning laws.
In addition, we are exposed to the risk of judicial proceedings with our borrowers and entities in which we invest, including bankruptcy or other litigation, as a strategy to avoid foreclosure or enforcement of other rights by us as a lender or investor. In the event that any of the properties or entities underlying or collateralizing our loans or investments experiences any of the foregoing events or occurrences, the value of, and return on, such investments could decline and could adversely affect our results of operations and financial condition.
Loans on properties in transition will involve a greater risk of loss than conventional mortgage loans.
We primarily invest in transitional loans to borrowers who are typically seeking short-term capital to be used in an acquisition or rehabilitation of a property. The typical borrower under a transitional loan has usually identified an undervalued asset that has been under-managed and/or is located in a recovering market. If the market in which the asset is located fails to improve according to the borrower’s projections, or if the borrower fails to improve the quality of the asset’s management and/or the value of the asset, the borrower may not receive a sufficient return on the asset to satisfy the transitional loan, and we bear the risk that we may not recover some or all of our investment.
Furthermore, the renovation, refurbishment or expansion of a property by a borrower involves risks of cost overruns and noncompletion. Estimates of the costs of improvements to bring an acquired property up to standards established for the market position intended for that property may prove inaccurate. Other risks may include rehabilitation costs exceeding original estimates, possibly making a project uneconomical, environmental risks, delays in legal and other approvals (e.g., for condominiums) and rehabilitation and subsequent leasing of the property not being completed on schedule. If such renovation is not completed in a timely manner, or if it costs more than expected, the borrower may experience a prolonged reduction of net operating income and may not be able to make payments on our investment on a timely basis or at all, which could result in significant losses.
In addition, borrowers usually use the proceeds of a conventional mortgage to repay a transitional loan. Transitional loans therefore are subject to risks of a borrower’s inability to obtain permanent financing to repay the transitional loan.loan and to the broader availability of conventional mortgages at amenable rates. In the event of any default under transitional loans that may be held by us, we bear the risk of loss of principal and non-payment of interest and fees to the extent of any deficiency between the value of the mortgage collateral and the principal amount and unpaid interest of the transitional loan. To the extent we suffer such losses with respect to these transitional loans, it could adversely affect our results of operations and financial condition.
Prepayment rates may adversely affect the value of our portfolio of assets.
Generally, our borrowers may repay their loans prior to their stated final maturities. In periods of declining interest rates and/or credit spreads, prepayment rates on loans generally increase. If general interest rates and credit spreads decline at the same time, the proceeds of such prepayments received during such periods are likely to be reinvested by us in assets yielding less than the yields on the assets that were prepaid. We may not be able to reinvest the principal repaid at the same or higher yield of the original investment. Conversely, in periods of rising interest rates, prepayment rates are likely to decrease and the number of our borrowers who exercise extension options, which could extend beyond the term of certain secured financing agreements we use to finance our loan investments, is likely to increase. This could have a negative impact on our results of operations, and in some situations, we may be forced to sell assets to maintain adequate liquidity, which could cause us to incur losses.
In addition, the value of our assets may be affected by prepayment rates on loans. If we originate or acquire mortgage-related securities or a pool of mortgage securities, we anticipate that the underlying mortgages will prepay at a projected rate generating an expected yield. If we purchase assets at a premium to par value, when borrowers prepay their loans faster than expected, the corresponding prepayments on the mortgage-related securities may reduce the expected yield on such securities because we will have to amortize the related premium on an accelerated basis. Conversely, if we purchase assets at a discount to par value, when borrowers prepay their loans slower than expected, the decrease in corresponding prepayments on
the mortgage-related securities may reduce the expected yield on such securities because we will not be able to accrete the related discount as quickly as originally anticipated. In addition, as a result of the risk of prepayment, the market value of the prepaid assets may benefit less than other fixed income securities from declining interest rates.
Prepayment rates on loans may be affected by a number of factors including, but not limited to, the then-current level of interest rates and credit spreads, fluctuations in asset values, the availability of mortgage credit, the relative economic vitality of the area in which the related properties are located, the servicing of the loans, possible changes in tax laws, other opportunities for investment, and other economic, social, geographic, demographic and legal factors and other factors beyond our control. Consequently, such prepayment rates cannot be predicted with certainty and no strategy can completely insulate us from prepayment or other such risks. If prepayment rates exceed our expectations, we may have greater difficulty in redeploying the proceeds into new investment opportunities, which may significantly increase our cash balance and exacerbate the risks related to our cash management strategy. For further discussion of the risks related to capital deployment, see “Difficulty in redeploying the proceeds from repayments of our existing loans and investments may cause our financial performance and returns to investors to suffer” below.
Our loans often contain call protection provisions that require a certain minimum amount of interest due to us regardless of when the loan is repaid. These include prepayment fees expressed as a percentage of the unpaid principal balance, or the amount of foregone net interest income due us from the date of repayment through a date that is frequently 12 or 18 months after the origination date. Loans that are outstanding beyond the end of the call protection or yield maintenance period can be repaid with no prepayment fees or penalties. The absence of call protection provisions may expose us to the risk of early repayment of loans, and the inability to redeploy capital accretively.
Difficulty in redeploying the proceeds from repayments of our existing loans and investments may cause our financial performance and returns to investors to suffer.
As our loans and investments are repaid, we may redeploy the proceeds we receive into new loans and investments, repay borrowings under our credit facilities, pay dividends to our stockholders or repurchase outstanding shares of our common stock. It is possible that we will fail to identify reinvestment options that would provide returns or a risk profile that is comparable to the asset that was repaid. If we fail to redeploy the proceeds we receive from repayment of a loan in equivalent or better alternatives in a timely manner, our financial performance and returns to investors could suffer.
In light of our investment strategy and the need to be able to invest capital quickly to capitalize on potential investment opportunities, we may from time to time maintain cash pending deployment into investments, which may at times be significant. Such cash may be held in an account of ours for the benefit of stockholders or may be invested in money market accounts or other similar temporary investments. While the duration of such holding period is expected to be relatively short, in the event we are unable to find suitable investments, such cash positions may be maintained for longer periods. It is not anticipated that the temporary investment of such cash into money market accounts or other similar temporary investments pending deployment into investments will generate significant interest, and such low interest payments on the temporarily invested cash may adversely affect our financial performance and returns to investors.
In addition, we have also invested in CMBS, and may from time to time invest in CMBS and CRE CLO securities as part of our short-term cash management strategy. Subordinate interests such as CMBS, CRE CLO securities and similar structured finance investments generally are not actively traded and are relatively illiquid investments. Volatility in CMBS and CRE CLO trading markets may cause the value of these investments to decline. In addition, if the underlying mortgage portfolio has been overvalued by the originator, or if the values subsequently decline and, as a result, less collateral value is available to satisfy interest and principal payments and any other fees in connection with the trust or other conduit arrangement for such securities, we may incur significant losses. For further discussion of the risks related to such investments, see “Our investments in CMBS and other similarly structured finance investments, as well as those we structure, sponsor or arrange, would pose additional risks, including the risks of the securitization process, the risk that we will not be able to recover some or all of our
investment, the possibility that the CMBS market will be significantly affected by current or future regulation and the risk that we will not be able to hedge or transfer our CMBS B-Piece investments for a significant period of time” below.
The due diligence process that our Manager undertakes in regard to investment opportunities may not reveal all facts that may be relevant in connection with an investment and if our Manager incorrectly evaluates the risks of our investments, we may experience losses.
Before making investments for us, our Manager conducts due diligence that it deems reasonable and appropriate based on the facts and circumstances relevant to each potential investment. When conducting due diligence, our Manager may be required to evaluate a number of important and complexissues, including but not limited to those relating to business, financial, tax, accounting, environmental, social & corporate governance ("ESG"), technology, cybersecurity, legal, regulatory and legal issues.macroeconomic trends. The nature and scope of our Manager’s ESG diligence, if any, will vary based on the investment opportunity, but may include a review of, among other things: energy management, air and water pollution, land contamination, diversity, human rights, employee health and safety, accounting standards and bribery and corruption. Outside consultants, legal advisors, accountants and investment banks may be involved in the due diligence process in varying degrees depending on the type of potential investment. Selecting and evaluating material ESG factors is subjective by nature, and there is no guarantee that the criteria utilized or judgment exercised by our Manager or a third-party ESG specialist (if any) will reflect the beliefs, values, internal policies or preferred practices of any particular investor or align with the beliefs or values or preferred practices of other asset managers or with market trends. The materiality of ESG risks and impacts on an individual potential investment or portfolio as a whole are dependent on many factors, including the relevant industry, country, asset class and investment style.
Our Manager’s loss estimates based on its due diligence process may not prove accurate, as actual results may vary from estimates. If our Manager underestimates the asset-level losses relative to the price we pay for a particular investment, we may experience losses with respect to such investment. Moreover, investment analyses and decisions by our Manager may frequently be required to be undertaken on an expedited basis to take advantage of investment opportunities. In such cases, the information available to our Manager at the time of making an investment decision may be limited, and it may not have access to detailed information regarding such investment. Further, certain considerations covered by our Manager’s diligence, such as ESG, are continuously evolving, including from an assessment, regulatory and compliance standpoint, and our Manager may not accurately or fully anticipate such evolution. Therefore, we cannot assure you that our Manager will have knowledge of all circumstances that may adversely affect such investment.
In addition, it is difficult for real estate debt investors in certain circumstances to receive full transparency with respect to underlying investments because transactions are often effectuated on an indirect basis through pools or conduit vehicles rather than directly with the borrower. Loan structures or the terms of investments may make it difficult for us to monitor and evaluate investments. Therefore, we cannot assure you that our Manager will have knowledge of all information that may adversely affect such investment.
CMBS B-Pieces, mezzanine loans, preferred equity and other investments that are subordinated or otherwise junior in an issuer’s capital structure and that involve privately negotiated structures expose us to greater risk of loss.
We invest in debt instruments (including, indirectly through RECOP I, in CMBS B-Pieces) and may invest in preferred equity that are subordinated or otherwise junior in an issuer’s capital structure and that involve privately negotiated structures. Our investments in subordinated debt and mezzanine tranches of a borrower’s capital structure and our remedies with respect thereto, including the ability to foreclose on any collateral securing such investments, are subject to the rights of any senior creditors and, to the extent applicable, contractual intercreditor and/or participation agreement provisions. Significant losses related to such loans or investments could adversely affect our results of operations and financial condition.
Investments in subordinated debt involve greater credit risk of default than the senior classes of the issue or series. As a result, with respect to our investments in CMBS B-Pieces, mezzanine loans and other subordinated debt, we would potentially receive
payments or interest distributions after, and must bear the effects of losses or defaults on the senior debt (including underlying senior loans, senior mezzanine loans, B-Notes, preferred equity or senior CMBS bonds, as applicable) before, the holders of other more senior tranches of debt instruments with respect to such issuer. As the terms of such loans and investments are subject to contractual relationships among lenders, co-lending agents and others, they can vary significantly in their structural characteristics and other risks.
Mezzanine loans are by their nature structurally subordinated to more senior property-level financings. If a borrower defaults on our mezzanine loan or on debt senior to our loan, or if the borrower is in bankruptcy, our mezzanine loan will be satisfied only after the property-level debt and other senior debt is paid in full. In addition, mezzanine loans may have higher loan-to-value ratios than conventional mortgage loans, resulting in less equity in the property and increasing the risk of loss of principal. As a result, a partial loss in the value of the underlying collateral can result in a total loss of the value of the mezzanine loan. Moreover, even if we are able to foreclose on the underlying collateral following a default on a mezzanine loan, we would be substituted for the defaulting borrower and, to the extent income generated on the underlying property is insufficient to meet outstanding debt obligations on the property, may need to commit substantial additional capital and/or deliver a replacement guarantee by a creditworthy entity, which could include us, to stabilize the property and prevent additional defaults to lenders with existing liens on the property. Significant losses related to our mezzanine loans and our indirect CMBS B-Piece investments wouldcould result in operating losses for us and may limit our ability to make distributions to
our stockholders.
Investments in preferred equity involve a greater risk of loss than conventional debt financing due to a variety of factors, including their non-collateralized nature and subordinated ranking to other loans and liabilities of the entity in which such preferred equity is held. Accordingly, if the issuer defaults on our investment, we would only be able to proceed against such entity in accordance with the terms of the preferred equity, and not against any property owned by such entity. Furthermore, in the event of bankruptcy or foreclosure, we would only be able to recoup our investment after all lenders to, and other creditors of, such entity are paid in full. As a result, we may lose all or a significant part of our investment, which could result in significant losses.
In addition, our investments in senior loans may be effectively subordinated to the extent we borrow under a warehouse loan (which can be in the form of a repurchase agreement) or similar facility and pledge the senior loan as collateral. Under these arrangements, the lender has a right to repayment of the borrowed amount before we can collect on the value of the senior loan, and therefore if the value of the pledged senior loan decreases below the amount we have borrowed, we would experience a loss.
Investments may be concentrated in terms of geography, asset types and sponsors, which could subject us to increased risk of loss.
We are not required to observe specific diversification criteria, except as may be set forth in the investment guidelines adopted by our board of directors. Therefore, our investments in our target assets may at times be concentrated in certain property types that may be subject to higher risk of default or foreclosure, or secured by properties concentrated in a limited number of geographic locations.
To the extent that our assets are concentrated in any one region, sponsor or type of asset, economic and business downturns generally relating to such type of asset, sponsor or region may result in defaults on a number of our investments within a short time period, which could adversely affect our results of operations and financial condition. In addition, because of asset concentrations, even modest changes in the value of the underlying real estate assets could have a significant impact on the value of our investment. As a result of any high levels of concentration, any adverse economic, political, climate-related or other conditions that
disproportionately affects those geographic areas or asset classes could have a magnified adverse effect on our results of operations and financial condition, and the value of our stockholders’ investments could vary more widely than if we invested in a more diverse portfolio of loans.
Our investment strategy may be changed without stockholder consent.
While we primarily seek to make real estate-related debt investments, our Manager may otherwise implement on our behalf strategies or discretionary approaches it believes from time to time may be best suited to prevailing market conditions in furtherance of that purpose, subject to the supervision and direction of our board of directors and the limitations set forth in our organizational documents and governing agreements. There can be no assurance that our Manager will be successful in implementing any particular investment strategy. Our Manager may change our investment strategy or asset allocation at any time without the consent of stockholders, which could result in our Manager making investments that are different from, and possibly riskier than, the investments described in this Annual Report on Form 10-K. A change in our investment strategy may
also increase our exposure to interest rate and real estate market fluctuations and could adversely affect our results of operations and financial condition.
Our investments in CMBS and other similarly structured finance investments, as well as those we structure, sponsor or arrange, would pose additional risks, including the risks of the securitization process, the risk that we will not be able to recover some or all of our investment, the possibility that the CMBS market will be significantly affected by current or future regulation and the risk that we will not be able to hedge or transfer our CMBS B-Piece investments for a significant period of time.
We have invested and may from time to time invest in pools or tranches of CMBS and other similar securities. The collateral underlying CMBS generally consists of commercial mortgages or real property that have a multifamily or commercial use, such as retail space, office buildings, warehouse property and hotels. CMBS have been issued in a variety of issuances, with varying structures including senior and subordinated classes. Our investments in CMBS are subject to losses. In general, losses on a mortgaged property securing a senior loan included in a securitization will be borne first by the equity holder of the property, then by a cash reserve fund or letter of credit, if any, then by the holder of a mezzanine loan or B-Note, if any, then by the “first loss” subordinated security holder (generally, the B-Piece buyer) and then by the holder of a higher-rated security. In the event of default and the exhaustion of any equity support, reserve fund, letter of credit, mezzanine loans or B-Notes, and any classes of securities junior to those in which we invest, we will not be able to recover some or all of our investment in the securities we purchase. There can be no assurance that our CMBS underwriting practices will yield their desired results and there can be no assurance that we will be able to effectively achieve our investment objective or that projected returns will be achieved.
In addition, the CMBS market may be significantly affected by current or future regulation. The risk retention rules under the Dodd-Frank Act, which generally require a sponsor of a CMBS transaction to retain, directly or indirectly, at least 5% of the credit risk of the securitized assets collateralizing the CMBS, went into effect in December 2016. The impact of these current and future requirements on the CMBS securitization market generally are uncertain and may result in many CMBS market participants ceasing origination of and investment in CMBS, a lack of liquidity in the CMBS market and increased costs in CMBS transactions. As a result, there may be little or no CMBS investment opportunities available to us and any opportunities that are available may be less attractive than CMBS opportunities prior to the effectiveness of the risk retention rules. The rules may also negatively affect the market value of our current CMBS holdings as well as the larger commercial real estate debt markets.
If we invest in a CMBS B-Piece because a sponsor of a CMBS utilizes us as an eligible third-party purchaser to satisfy the risk retention rules under the Dodd-Frank Act, we will be required to meet certain conditions, including holding the related CMBS B-Piece, without transferring or hedging the CMBS B-Piece, for a significant period of time (at least five years), which could prevent us from mitigating losses on the CMBS B-Piece. Even if we seek to transfer the CMBS B-Piece after five years, any subsequent purchaser of the CMBS B-Piece will be required to satisfy the same conditions that we were required to satisfy when we acquired the interest from the CMBS sponsor. Accordingly, no assurance can be given that any secondary market liquidity will exist for such CMBS B-Pieces.
We currently have and expect to make our CMBS B-Piece investments indirectly through our investment in an aggregator vehicle alongside RECOP I, a KKR-managed investment fund. See “Risks Related to Our Relationship with Our Manager and Its Affiliates—There are various conflicts of interest in our relationship with KKR, including with our Manager and in the allocation of investment opportunities to KKR investment vehicles and us, which could result in decisions that are not in the best interests of our stockholders” and Part II, Item 7. “Management’s Discussion and Analysis of Financial Condition and Results of Operations—Our Portfolio.”
Any credit ratings assigned to our investments or to us will be subject to ongoing evaluations and revisions and we cannot assure you that those ratings will not be downgraded.
Some of our investments may be rated by rating agencies. Any credit ratings onassigned to our investments or to us are subject to ongoing evaluation by credit rating agencies, and we cannot assure you that any such ratings will not be downgraded or withdrawn by a rating agency in the future if, in its judgment, circumstances warrant. If rating agencies assign a lower-than-expected rating or reduce or withdraw, or indicate that they may reduce or withdraw, their ratings of our investments in the future, the value and liquidity of our investments could significantly decline, which would adversely affect the value of our investment portfolio and could result in losses upon disposition or the failure of borrowers to satisfy their debt service obligations to us.
Further, any downgrade of the Company’s credit ratings by any of credit agencies that cover our debt may make it more difficult and costly for us to access capital. Our credit rating has been downgraded in the past and there can be no assurances that our credit ratings will not be downgraded in the future, whether as a result of deteriorating general economic conditions, failure to successfully implement our operating strategy or the adverse impact on our results of operations or liquidity position of any of the above, or otherwise.
We have in the past, and may in the future, need to foreclose on certain of the loans we originate or acquire, which could result in losses that harm our results of operations and financial condition.
We may find it necessary or desirable to foreclose on certain of the loans we originate or acquire, have acquired and may in the future further acquire through foreclosure or deed-in-lieu of foreclosure, the ownership of property securing our loans, and the foreclosure process may be lengthy and expensive. If we foreclose on an asset, we may take title to the property securing that asset, and if we do not or cannot sell the property, we would then come to own and operate it as “real estate owned.” For example, in the fourth quarter of 2021, we took title to the retail property securing one senior loan with a principal balance and net carrying value of $109.6 million and $69.3 million, respectively.owned”. Owning and operating real property involves risks that are different (and in many ways more significant) than the risks faced in owning a loan secured by that property. The costs associated with operating and redeveloping the property, including any operating shortfalls and significant capital expenditures, could materially and adversely affect our results of operations, financial condition and liquidity. In addition, at such time that we elect to sell such property, the liquidation proceeds upon sale of the underlying real estate may not be sufficient to recover our cost basis, resulting in a loss to us. Furthermore, any costs or delays involved in the maintenance or liquidation of the underlying property will further reduce the net proceeds and, thus, increase the loss.
Whether or not we have participated in the negotiation of the terms of any such loans, we cannot assure you as to the adequacy of the protection of the terms of the applicable loan, including the validity or enforceability of the loan and the maintenance of the anticipated priority and perfection of the applicable security interests. Furthermore, claims may be asserted by lenders or borrowers that might interfere with enforcement of our rights. Borrowers may resist foreclosure actions by asserting numerous claims, counterclaims and defenses against us, including, without limitation, lender liability claims and defenses, even when the assertions may have no basis in fact, in an effort to prolong the foreclosure action and seek to force the lender into a modification of the loan or a favorable buy-out of the borrower’s position in the loan. In some states, foreclosure actions can take several years or more to litigate. At any time prior to or during the foreclosure proceedings, the borrower may file for bankruptcy, which would have the effect of staying the foreclosure actions and further delaying the foreclosure process and potentially resulting in a reduction or discharge of a borrower’s debt. Foreclosure may create a negative public perception of the related property, resulting in a diminution of its value.
Even if we are successful in foreclosing on a loan, the liquidation proceeds upon sale of the underlying real estate may not be sufficient to recover our cost basis in the loan, resulting in a loss to us. Furthermore, any costs or delays involved in the foreclosure of the loan or a liquidation of the underlying property will further reduce the net sale proceeds and, therefore, increase any such losses to us.
We may also be subject to environmental liabilities arising from such properties acquired in the foreclosure process. Under various U.S. federal, state and local laws, an owner or operator of real property may become liable for the costs of removal of certain hazardous substances released on its property. These laws often impose liability without regard to whether the owner or operator knew of, or was responsible for, the release of such hazardous substances. If we assume ownership of any properties underlying our loans, the presence of hazardous substances on a property may adversely affect our ability to sell the property and we may incur substantial remediation costs. As a result, the discovery of material environmental liabilities attached to such properties could materially and adversely affect us.
We may be subject to lender liability claims, and if we are held liable under such claims, we could be subject to losses.
In recent years, a number of judicial decisions have upheld the right of borrowers to sue lending institutions on the basis of various evolving legal theories, collectively termed “lender liability.” Generally, lender liability is founded on the premise that a lender has either violated a duty, whether implied or contractual, of good faith and fair dealing owed to the borrower or has assumed a degree of control over the borrower resulting in the creation of a fiduciary duty owed to the borrower or its other creditors or stockholders. No assurance can be given that such claims will not arise or that we will not be subject to significant liability if a claim of this type did arise.
Any distressed loans or investments we make, or loans and investments that later become distressed, may subject us to losses and other risks relating to bankruptcy proceedings.
While our investment strategy focuses primarily on investments in “performing” real estate-related interests, our investment program may include making distressed investments from time to time (e.g., investments in defaulted, out-of-favor or distressed loans and debt securities) or may involve investments that become “non-performing” following our origination or acquisition thereof. Certain of our investments may, therefore, include specific securities of companies that typically are highly leveraged, with significant burdens on cash flow and, therefore, involve a high degree of risk of substantial or total losses on our investments and in certain circumstances, may become subject to certain additional potential liabilities that may exceed the value of our original investment therein. For example, under certain circumstances, a lender who has inappropriately exercised control over the management and policies of a debtor may have its claims subordinated or disallowed or may be found liable for damages suffered by parties as a result of such actions.
During an economic downturn or recession, securities of financially troubled or operationally troubled issuers are more likely to go into default than securities of other issuers. Securities of financially troubled issuers and operationally troubled issuers are less liquid and more volatile than securities of companies not experiencing financial difficulties. The market prices of such securities are subject to erratic and abrupt market movements and the spread between bid and ask prices may be greater than normally expected. Investment in the securities of financially troubled issuers and operationally troubled issuers involves a high degree of credit and market risk.
In certain limited cases (e.g., in connection with a workout, restructuring and/or foreclosing proceedings involving one or more of our debt investments), the success of our investment strategy with respect thereto will depend, in part, on our ability to effectuate loan modifications and/or restructures.restructures and improve the operations of our borrower entities. The activity of identifying and implementing any such restructuring programs entails a high degree of uncertainty. There can be no assurance that we will be able to successfully identify and implement such restructuring programs. Further, such modifications and/or restructuring may entail, among other things, a substantial reduction in the interest rate and a substantial write-offwrite-offs of the principal of such loan, debt securities or other interests. However, even if a restructuring were successfully accomplished, a risk exists that, upon maturity of such real estate loan, debt securities or other interests replacement “takeout” financing will not be available.
These financial difficulties may never be overcome and may cause borrowers to become subject to bankruptcy or other similar administrative and operating proceedings. There is a possibility that we may incur substantial or total losses on our investments and in certain circumstances, become subject to certain additional potential liabilities that may exceed the value of our original investment therein. For example, under certain circumstances, a lender who has inappropriately exercised control over the management and policies of a debtor may have its claims subordinated or disallowed or may be found liable for damages suffered by parties as a result of such actions. In any reorganization or liquidation proceeding relating to our investments, we may lose our entire investment, may be required to accept cash or securities with a value less than our original investment and/or may be required to accept payment over an extended period of time. In addition, under certain circumstances, payments to us and distributions by us to the stockholders may be reclaimed if any such payment or distribution is later determined to have been a fraudulent conveyance, preferential payment or similar transaction under applicable bankruptcy and insolvency laws. Furthermore, bankruptcy laws and similar laws applicable to administrative proceedings may delay our ability to realize value on collateral for loan positions held by us or may adversely affect the priority of such loans through doctrines such as equitable subordination or may result in a restructure of the debt through principles such as the “cramdown” provisions of the bankruptcy laws.
A prolonged economic slowdown, a lengthy or severe recession or declining real estate values could impair our investments and harm our operations.
We believe the risks associated with our business will be more severe during periods of economic slowdown or recession if these periods are accompanied by declining real estate values. Declining real estate values will likely reduce the level of new mortgage and other real estate‑related loan originations since borrowers often use appreciation in the value of their existing properties to support the purchase or investment in additional properties. Borrowers may also be less able to pay principal and interest on our loans if the value of real estate weakens. Further, declining real estate values significantly increase the likelihood that we will incur losses on its loans in the event of default because the value of our collateral may be insufficient to cover its cost on the loan. Any sustained period of increased payment delinquencies, foreclosures or losses could adversely affect our Manager’s ability to invest in, sell and securitize loans, which would materially and adversely affect our results of operations, financial condition, liquidity and business and our ability to pay dividends to stockholders.
adversely affecting regional and even global economic conditions and markets. For example, concerns about the fiscal stability and growth prospects of certain European countries in the last economic downturn had a negative impact on most economies of the Eurozone and global markets. More recently, Russia’s invasion of Ukraine has disrupted energy prices and the movement of goods in Europe resulting in rising energy costs and inflation more generally, particularly in Europe. The occurrence of similar crises in the future could cause increased volatility in the economies and financial markets of countries throughout a region, or even globally. Additionally, global trade disruption, significant introductions of trade barriers and bilateral trade frictions, including due to war or other hostilities, together with any future downturns in the global economy resulting therefrom, could adversely affect our performance.
We may experience a decline in the fair value of our assets.
A decline in the fair value of our assets may require us to recognize an “other-than-temporary” impairment or write-offwrite-offs against such assets under GAAP if we were to determine that, with respect to any assets in unrealized loss positions, we do not have the ability and intent to hold such assets to maturity or for a period of time sufficient to allow for recovery to the original acquisition cost of such assets. If such a determination were to be made, we would recognize unrealized losses through earnings and write-offwrite-offs the amortized cost of such assets to a new cost basis, based on the fair value of such assets on the date they are considered to be other-than-temporarily impaired. Such impairment charges reflect non-cash losses at the time of recognition; subsequent disposition or sale of such assets could further affect our future losses or gains, as they are based on the difference between the sale price received and adjusted amortized cost of such assets at the time of sale. If we experience a decline in the fair value of our assets, it could adversely affect our results of operations and financial condition.
Some of our portfolio investments may be recorded at fair value and, as a result, there will be uncertainty as to the value of these investments.
Some or all of our portfolio investments may be in the form of positions or securities that are not publicly traded and are recorded at their estimated fair value. The fair value of investments that are not publicly traded may not be readily determinable. Our Manager will determine the fair value of these investments at fair value which may include unobservable inputs. Because such valuations are subjective, the fair value of certain of our assets may fluctuate over short periods of time and our Manager’s determinations of fair value may differ materially from the values that would have been used if a ready market for these securities existed. Our results of operations and financial condition could be adversely affected if our Manager’s determinations regarding the fair value of these investments were materially higher than the values that we ultimately realize upon their disposal.
We may invest in derivative instruments, which would subject us to increased risk of loss.
Subject to maintaining our qualification as a REIT, we may also invest in, or use as part of our investment strategy, certain derivative instruments, including swaps, futures, forwards and options. Generally, a derivative is a financial contract the value of which depends upon, or is derived from, the value of an underlying asset, reference rate or index and may relate to individual debt or equity instruments, interest rates, currencies or currency exchange rates, commodities, related indices or other assets. The gross returns to be exchanged or swapped between the parties under a derivative instrument are generally calculated with respect to a “notional amount,” which may be significantly greater than the amount of cash or assets required to establish or maintain the derivative position. Accordingly, trading in derivative instruments can result in large amounts of leverage, which may magnify the gains and losses experienced by us in respect of derivative instruments and may result in a loss of capital that is more exaggerated than would have resulted from an investment that did not involve the use of leverage inherent in the derivative contract.
While the judicious use of derivative instruments can be beneficial, such instruments involve risks different from, and, in certain cases, greater than, the risks presented by more traditional investments. Many of the derivative instruments used by us will be privately negotiated in over-the-counter (“OTC”) markets. Such derivatives are highly specialized instruments that require investment techniques and risk analyses different from those associated with equities and bonds. The use of derivative instruments also requires an understanding not only of the underlying asset, reference rate or index but also of the derivative itself, without the benefit of observing the performance of the derivative under all possible market conditions. The use of derivative instruments may also require us to sell or purchase portfolio securities at inopportune times or for prices below or above the current market values, may limit the amount of appreciation we can realize on an investment or may cause us to hold a security that it might otherwise want to sell. We may also have to defer closing out certain derivative positions to avoid adverse tax consequences and there may be situations in which derivative instruments are not elected that result in losses greater than if such instruments had been used. Furthermore, amounts paid by us as premiums and cash or other assets held in margin
accounts with respect to our derivative instruments would not be available to us for other investment purposes, which may result in lost opportunities for gain.
Investing in derivative instruments may present various additional market and counterparty-related risks including, but not limited to:
•Lack of Liquidity: Derivative instruments, especially when purchased in large amounts, may not be liquid in all circumstances, so that in volatile markets we may not be able to close out a position without incurring a loss. Although both OTC and exchange-traded derivative markets may experience the lack of liquidity, OTC non-
standardizednon-standardized derivative transactions are generally less liquid than exchange-traded instruments, particularly because participants in OTC markets are not required to make continuous markets in the contracts they trade.
•Volatility: The prices of derivative instruments, including swaps, futures, forwards and options, are highly volatile and such instruments may subject us to significant losses. The value of such derivatives also depends upon the price of the underlying asset, reference rate or index, which may also be subject to volatility. In addition, actual or implied daily limits on price fluctuations and speculative position limits on the exchanges or OTC markets in which we may conduct our transactions in derivative instruments may prevent prompt liquidation of positions, subjecting us to the potential of greater losses. Derivative instruments that may be purchased or sold by us may include instruments not traded on an exchange. The risk of nonperformance by the obligor on such an instrument may be greater and the ease with which we can dispose of or enter into closing transactions with respect to such an instrument may be less than in the case of an exchange-traded instrument. In addition, significant disparities may exist between “bid” and “asked” prices for derivative instruments that are traded OTC and not on an exchange. Such OTC derivatives are also typically not subject to the same type of investor protections or governmental regulation as exchange traded instruments.
•Imperfect Correlation: When used for hedging purposes, an imperfect or variable degree of correlation between price movements of the derivative instrument and the underlying asset, reference rate or index sought to be hedged may prevent us from achieving the intended hedging effect or expose us to the risk of loss. The imperfect correlation between the value of a derivative and the underlying assets may result in losses on the derivative transaction that are greater than the gain in the value of the underlying assets in our portfolio.
•Valuation Risk: The derivative instruments used by us may be difficult to value or involve the risk of mispricing or improper valuation, especially where the markets for such derivatives instruments are illiquid and/or such derivatives involve complex structures, or where there is imperfect correlation between the value of the derivative instrument and the underlying asset, reference rate or index.
•Counterparty Risk: Derivative instruments also involve exposure to counterparty risk, since contract performance depends in part on the financial condition of the counterparty. See “—Risks“Risks Related to Our Financing and Hedging —We willmay be subject to counterparty risk associated with any hedging activities.”
Additionally, our Manager may cause us to take advantage of investment opportunities with respect to derivative instruments that are neither presently contemplated nor currently available, but which may be developed in the future, to the extent such opportunities are both consistent with our investment objectives and legally permissible. Any such investments may expose us to unique and presently indeterminate risks, the impact of which may not be capable of determination until such instruments are developed and/or our Manager determines to make such an investment on our behalf.
Transactions denominated in foreign currencies may subject us to foreign currency risks.
Although we have not done so to date, we may originate, invest in or acquire assets denominated in foreign currencies, which may expose us to foreign currency risk. As a result, a change in foreign currency exchange rates may have an adverse impact on the valuation of our assets, as well as our income and distributions. Any such changes in foreign currency exchange rates may impact the measurement of such assets or income for the purposes of the REIT tests and may affect the amounts available for payment of dividends on our common stock. See “Risks Related to Our REIT Status and Certain Other Tax Considerations.”
Loans or investments involving international real estate-related assets are subject to special risks that we may not manage effectively, which could have a material adverse effect on our results of operations and our ability to make distributions to our stockholders.
Our investment guidelines permit investments in non-U.S. assets, subject to the same guidelines as investments in U.S. assets. To the extent that we invest in non-U.S. real estate-related assets, we may be subject to certain risks associated with international investments generally, including, among others:
•currency exchange matters, including fluctuations in currency exchange rates and costs associated with conversion of investment principal and income from one currency to another;
•less developed or efficient financial markets than in the United States, which may lead to potential price volatility and relative illiquidity;
•the burdens of complying with international regulatory requirements and prohibitions that differ between jurisdictions;
•changes in laws or clarifications to existing laws that could impact our tax treaty positions, which could adversely impact the returns on our investments;
•a less developed legal or regulatory environment, differences in the legal and regulatory environment or enhanced legal and regulatory compliance;
•political hostility to investments by foreign investors;
•higher inflation rates;
•higher transaction costs;
•difficulty enforcing contractual obligations;
•fewer investor protections;
•war or other hostilities;
•potentially adverse tax consequences; or
•other economic and political risks.risks, including potential exchange control regulations and restrictions on our non-U.S. investments and repatriation of profits from investments or of capital invested, the risks of political, economic or social instability, the possibility of expropriation or confiscatory taxation and adverse economic or political developments.
If any of the foregoing risks were to materialize, they could adversely affect our results of operations and financial condition.
The lack of liquidity in certain of our target assets may adversely affect our business.
The illiquidity of some or all of our investments may make it difficult for us to sell such investments if the need or desire arises. In addition, certain of our investments may become less liquid after investment as a result of periods of delinquencies, defaults or turbulent market conditions, which may make it more difficult for us to dispose of such assets at advantageous times or in a timely manner. Moreover, many of our investments will not be registered under the relevant securities laws, resulting in prohibitions on their transfer, sale, pledge or their disposition except in transactions that are exempt from registration requirements or are otherwise in accordance with such laws. As a result, many of our investments are expected to be illiquid, and if we are required to liquidate all or a portion of our portfolio quickly, we may realize significantly less than the value at which we previously recorded our investments. Further, we may face other restrictions on our ability to liquidate an investment to the extent that we or our Manager has or could be attributed as having material, non-public information regarding such business entity. As a result, our ability to vary our portfolio in response to changes in economic or other conditions may be relatively limited, which could adversely affect our results of operations and financial condition.
We have utilized and may utilize in the future non-recourse long-term securitizations to finance our loans and investments, which may expose us to risks that could result in losses.
We have utilized and may utilize in the future, non-recourse securitizations of certain of our portfolio investments to generate cash for funding new loans and investments and other purposes. These transactions generally involve us creating a special-purpose vehicle, contributing a pool of our assets to the entity, and selling interests in the entity on a non-recourse basis to purchasers (whom we would expect to be willing to accept a lower interest rate to invest in investment-grade loan pools). We would expect to retain all or a portion of the equity and potentially other tranches in the securitized pool of loans or investments. In addition, we have retained in the past and may in the future retain a pari passu participation in the securitized pool of loans.
Prior to any such financing, we may use short-term facilities to finance the acquisition of securities until a sufficient quantity of investments had been accumulated, at which time we would refinance these facilities through a securitization, such as a CMBS, or issuance of CLOs, or the private placement of loan participations or other long-term financing. As a result, we would be subject to the risk that we would not be able to acquire, during the period that our short-term facilities are available, a sufficient amount of eligible investments to maximize the efficiency of a CMBS, CLO or private placement issuance. We also would be subject to the risk that we would not be able to obtain short-term credit facilities or would not be able to renew any short-term credit facilities after they expire should we find it necessary to extend our short-term credit facilities to allow more time to seek
and acquire the necessary eligible investments for a long-term financing. The inability to consummate securitizations of our portfolio to finance our loans and investments on a long-term basis could require us to seek other forms of potentially less attractive financing or to liquidate assets at an inopportune time or price, which could adversely affect our performance and our ability to grow our business. Moreover, conditions in the capital markets which we are currently experiencing, including volatility and disruption in the capital and credit markets, may not permit a non-recourse securitization at any particular time or may make the issuance of any such securitization less attractive to us even when we do have sufficient eligible assets. We may also suffer losses if the value of the mortgage loans we acquire declines prior to securitization. Declines in the value of a mortgage loan can be due to, among other things, changes in interest rates and changes in the credit quality of the loan. In addition, we may suffer a loss due to the incurrence of transaction costs related to executing these transactions. To the extent that we incur a loss executing or participating in future securitizations for the reasons described above or for other reasons, it could materially and adversely impact our business and financial condition.
In addition, the securitization of our portfolio might magnify our exposure to losses because any equity interest we retain in the issuing entity would be subordinate to the notes issued to investors and we would, therefore, absorb all of the losses sustained with respect to a securitized pool of assets before the owners of the notes experience any losses. The inability to securitize our portfolio may hurt our performance and our ability to grow our business. At the same time, the securitization of our loans or investments might expose us to losses, as the residual loans or investments in which we do not sell interests will tend to be riskier and more likely to generate losses. Moreover, the Dodd-Frank Act contains a risk retention requirement for all asset-backed securities, which requires both public and private securitizers to retain not less than 5% of the credit risk of the assets collateralizing any asset-backed security issuance. Significant restrictions exist, and additional restrictions may be added in the future, regarding who may hold risk retention interests, the structure of the entities that hold risk retention interests and when and how such risk retention interests may be transferred. Therefore such risk retention interests will generally be illiquid. As a result of the risk retention requirements, we have and may in the future be required to purchase and retain certain interests in a securitization into which we sell mortgage loans and/or when we act as issuer, may be required to sell certain interests in a securitization at prices below levels that such interests have historically yielded and/or may be required to enter into certain arrangements related to risk retention that we have not historically been required to enter into. Accordingly, the risk retention rules may increase our potential liabilities and/or reduce our potential profits in connection with securitization of mortgage loans. It is likely, therefore, that these risk retention rules will increase the administrative and operational costs of asset securitizations.
All of our assets may be subject to recourse.
All of our assets, including any investments made by us and any funds held by us, may be available to satisfy all of our liabilities and other obligations. If we become subject to a liability, parties seeking to have the liability satisfied may have recourse to our assets generally and not be limited to any particular asset, such as the asset representing the investment giving rise to the liability.
Accounting rules for certain of our transactions are highly complex and involve significant judgment and assumptions, which could impact our ability to timely prepare consolidated financial statements.
Accounting rules for current expected credit losses, transfers of financial assets, securitization transactions, consolidation of VIEs and other aspects of our operations are highly complex and involve significant judgment and assumptions. These complexities could lead to a delay in preparation of financial information and the delivery of this information to our stockholders. Changes in accounting interpretations or assumptions could also impact our consolidated financial statements and our ability to timely prepare our consolidated financial statements. Our inability to timely prepare our consolidated financial statements in the future would likely have a significant adverse effect on our stock price.
Provisions for credit losses are difficult to estimate.
Our provision for credit losses is evaluated on a quarterly basis. The determination of our provision for credit losses requires us to make certain estimates and judgments, which may be difficult to determine. Our estimates and judgments are based on a number of factors, including projected cash flow from the collateral securing our loans, debt structure, including the availability of reserves and recourse guarantees, likelihood of repayment in full at the maturity of a loan, potential for refinancing and expected market discount rates for varying property types, all of which remain uncertain and are subjective. Our estimates and judgments may not be correct and, therefore, our results of operations and financial condition could be severely impacted.
In addition, on January 1, 2020, we adopted Accounting Standards Update 2016-13, “Financial Instruments—Credit Losses, Measurement of Credit Losses on Financial Instruments (Topic 326),” which replaced the “incurred loss” model for
recognizing credit losses with an “expected loss” model referred to as the Current Expected Credit Loss model, or CECL. Under the CECL model, we are required to present certain financial assets carried at amortized cost, such as loans held for investment, at the net amount expected to be collected. The measurement of expected credit losses is based on information about past events, including historical experience, current conditions, and reasonable and supportable forecasts that affect the collectability of the reported amount. This measurement will take place at the time the financial asset is first added to the balance sheet and updated quarterly thereafter. This differs significantly from the “incurred loss” model previously required under GAAP, which delayed recognition until it was probable a loss has been incurred. Accordingly, the adoption of the CECL model has materially affected, and will continue to materially affect, how we determine our allowance for loan losses and could require us to significantly increase our allowance and recognize provisions for credit losses earlier in the lending cycle. Moreover, the CECL model may create more volatility in the level of our allowance for credit losses. If we are required to materially increase our level of allowance for credit losses for any reason, such increase could adversely affect our business, financial condition and results of operations.
There are increased risks involved with our construction lending activities.
We have invested and may invest in mortgage loans and mezzanine loans in which the underlying real property was under construction, which may expose us to increased lending risks. Construction lending generally is considered to involve a higher degree of risk of non-payment and loss than other types of lending due to a variety of factors, including the difficulties in estimating construction costs and anticipating construction delays (or governmental shut-downs of construction activity) and, generally, the dependency on timely, successful completion and the lease-up and commencement of operations post-completion. In addition, since such loans generally entail greater risk than mortgage loans collateralized by income-producing property, we may need to increase our allowance for loan losses in the future to account for the likely increase in probable incurred credit losses associated with such loans. Further, as the lender under a construction loan, we may be obligated to fund all or a significant portion of the loan at one or more future dates. We may not have the funds available at such future date(s) to meet our funding obligations under the loan. In that event, we would likely be in breach of the loan unless we are able to raise the funds from alternative sources, which we may not be able to achieve on favorable terms or at all.
If a borrower fails to complete the construction of a project or experiences cost overruns, there could be adverse consequences associated with the loan, including a decline in the value of the property securing the loan, a borrower claim against us for failure to perform under the loan documents if we choose to stop funding, increased costs to the borrower that the borrower is unable to pay, a bankruptcy filing by the borrower, and abandonment by the borrower of the collateral for the loan.
Insurance on loans and real estate securities collateral may not cover all losses.
There are certain types of losses, generally of a catastrophic nature, such as earthquakes, floods, hurricanes, terrorism or acts of war, which may be uninsurable or not economically insurable. Inflation, changes in building codes and ordinances, environmental considerations and other factors also might result in insurance proceeds insufficient to repair or replace a property if it is damaged or destroyed. Under these circumstances, the insurance proceeds received with respect to a property relating to one of our investments might not be adequate to restore our economic position with respect to our investment. Any uninsured loss could result in the corresponding nonperformance of or loss on our investment related to such property.
Risks Related to Our Financing and Hedging
Our indebtedness may subject us to increased risk of loss and could adversely affect our results of operations and financial condition.
We currently have outstanding indebtedness and, subject to market conditions and availability, we may incur a significant amount of additional debt through bank credit facilities (including term loans and revolving facilities), warehouse facilities and structured financing arrangements, public and private debt issuances (including through securitizations) and derivative instruments, in addition to transaction or asset-specific funding arrangements and additional repurchase agreements. We may also issue debt or equity securities to fund our growth. The percentage of leverage we employ will vary depending on our available capital, our ability to obtain and access financing arrangements with lenders, the type of asset we are funding, whether the financing is recourse or non-recourse, debt restrictions contained in those financing arrangements and the lenders’ and rating agencies’ estimate of the stability of our investment portfolio’s cash flow. We may significantly increase the amount of leverage we utilize at any time without approval of our board of directors. In addition, we may leverage individual assets at substantially higher levels. Incurring substantial debt could subject us to many risks that, if realized, would materially and adversely affect us, including the risk that:
•our cash flow from operations may be insufficient to make required payments of principal of and interest on our debt or we may fail to comply with covenants contained in our debt agreements, which is likely to result in (1)(i) acceleration of such debt (and any other debt containing a cross-default or cross-acceleration provision), which we then may be unable to repay from internal funds or to refinance on favorable terms, or at all, (2)(ii) our inability to borrow undrawn amounts under our financing arrangements, even if we are current in payments on borrowings under those arrangements, which would result in a decrease in our liquidity, and/or (3)(iii) the loss of some or all of our collateral assets to foreclosure or sale;
•our debt may increase our vulnerability to adverse economic and industry conditions with no assurance that investment yields will increase in an amount sufficient to offset the higher financing costs;
•we may be required to dedicate a substantial portion of our cash flow from operations to payments on our debt, thereby reducing funds available for operations, future business opportunities, stockholder distributions or other purposes; and
•we may not be able to refinance any debt that matures prior to the maturity (or realization) of an underlying investment it was used to finance on favorable terms or at all.
There can be no assurance that a leveraging strategy will be successful, and such strategy may subject us to increased risk of loss and could adversely affect our results of operations and financial condition.
We leverage certain of our target assets, which may adversely affect our return on our investments and may reduce cash available for distribution.
We leverage certain of our target assets through borrowings under our repurchase agreements. Leverage can enhance our potential returns but can also exacerbate losses. The return on our investments and cash available for distribution to stockholders may be reduced if market conditions cause the cost of our financing to increase relative to the income that can be derived from the assets acquired, which could adversely affect the price of our common stock. In addition, our debt service
payments will reduce cash flow available for distributions to stockholders. As a borrower, we are also subject to the risk that we may not be able to meet our debt service obligations. To the extent that we cannot meet our debt service obligations, we risk the loss of some or all of our assets to foreclosure or sale to satisfy our debt obligations.
The utilization of any of our repurchase facilities is subject to the pre-approval of the lender.
We utilize repurchase agreements to finance the purchase of certain investments. In order for us to borrow funds under a repurchase agreement, our lender must have the right to review the potential assets for which we are seeking financing and approve such assets in its sole discretion. Accordingly, we may be unable to obtain the consent of a lender to finance an investment and alternate sources of financing for such asset may not exist.
Our master repurchase agreements impose, and additional lending facilities may impose, restrictive covenants, which would restrict our flexibility to determine our operating policies and investment strategy and to conduct our business.
We borrow funds under master repurchase agreements with various counterparties. The documents that govern these master repurchase agreements and the related guarantees contain, and additional lending facilities may contain, customary affirmative and negative covenants, including financial covenants applicable to us that may restrict our flexibility to determine our operating policies and investment strategy. In particular, our master repurchase agreements require us to maintain a certain amount of cash or set aside assets sufficient to maintain a specified liquidity position that would allow us to satisfy our collateral obligations. As a result, we may not be able to leverage our assets as fully as we would otherwise choose, which could reduce our return on assets. If we are unable to meet these collateral obligations, our financial condition and prospects could deteriorate rapidly. If we fail to meet or satisfy any of these covenants, we would be in default under these agreements, and our lenders could elect to declare outstanding amounts due and payable, terminate their commitments, require the posting of additional collateral and enforce their interests against existing collateral. We may also be subject to cross-default and acceleration rights in our other debt facilities. Further, this could also make it difficult for us to satisfy the requirements necessary to maintain our qualification as a REIT for U.S. federal income tax purposes or to maintain our exclusion from registration under the Investment Company Act. Our master repurchase agreements also grant certain consent rights to the lenders thereunder which give them the right to consent to certain modifications to the pledged collateral. This could limit our ability to manage a pledged investment in a way that we think would provide the best outcome for our stockholders.
These types of financing arrangements also involve the risk that the market value of the assets pledged or sold by us to the provider of the financing may decline in value, in which case the lender or counterparty may require us to provide additional collateral or lead to margin calls that may require us to repay all or a portion of the funds advanced. We may not have the funds available to repay our debt at that time, which would likely result in defaults unless we are able to raise the funds from alternative sources including by selling assets at a time when we might not otherwise choose to do so, which we may not be able to achieve on favorable terms or at all. Posting additional margin would reduce our cash available to make other, higher yielding investments (thereby decreasing our return on equity). If we cannot meet these requirements, the lender or counterparty could accelerate our indebtedness, increase the interest rate on advanced funds and terminate our ability to borrow funds from it, which could materially and adversely affect our financial condition and ability to implement our investment strategy. In the case of repurchase transactions, if the value of the underlying security has declined as of the end of that term, or if we default on our obligations under the repurchase agreement, we will likely incur a loss on our repurchase transactions.
We depend on, or may in the future depend on, repurchase agreements, bank credit facilities, warehouse facilities and structured financing arrangements, public and private debt issuances (including through securitizations) and derivative instruments, in addition to transaction or asset-specific funding arrangements and other sources of financing to execute our business plan, and our inability to access funding could have a material adverse effect on our results of operations, financial condition and business.
Our ability to fund our investments may be impacted by our ability to secure bank credit facilities (including term loans and revolving facilities), warehouse facilities and structured financing arrangements, public and private debt issuances (including through securitizations) and derivative instruments, in addition to transaction or asset-specific funding arrangements and additional repurchase agreements on acceptable terms. We may also rely on short-term financing that would be especially exposed to changes in availability. Our access to sources of financing will depend upon a number of factors, over which we have little or no control, including:
•general economic or market conditions;
•the market’s view of the quality of our assets;
•the market’s perception of our growth potential;
•our current and potential future earnings and cash distributions; and
•the market price of the shares of our common stock.
We may need to periodically access the capital markets to raise cash to fund new investments. Unfavorable economic or capital market conditionsconditions may increase our funding costs, limit our access to the capital markets or couldor result in a decision by our potential lenders not to extend credit. An inability to successfully access the capital markets could limit our ability to grow our business and fully execute our business strategy and could decrease our earnings and liquidity. In addition, any dislocation or weakness
in the capital and credit markets could adversely affect our lenders and could cause one or more of our lenders to be unwilling or unable to provide us with financing or to increase the costs of that financing. In addition, as regulatory capital requirements imposed on our lenders are increased, they may be required to limit, or increase the cost of, financing they provide to us. In general, this could potentially increase our financing costs and reduce our liquidity or require us to sell assets at an inopportune time or price. Further, as the lender to our borrowers, we may be obligated to fund all or a significant portion of a loan we have agreed to at one or more future dates. If we are unable to access funding, we may not have the funds available at such future date(s) to meet our funding obligations under a loan. In that event, we would likely be in breach of our agreement under such loan. We cannot provide any assurance that we will be able to obtain any such financing on favorable terms or at all.
Interest rate fluctuations could increase our financing costs, which could lead to a significant decrease in our results of operations, cash flows and the market value of our investments.
To the extent that our financing costs are determined by reference to floating rates, such as LIBORSOFR or a Treasury index, the amount of such costs will depend on the level and movement of interest rates. InterestIn recent years, interest rates havehad remained at relatively low levels on a historical basis andbasis. However, since January 2022, in light of increasing inflation, the U.S. Federal Reserve maintained the federal funds target range at 0.0% to 0.25% for much of 2021. There can be no assurance, however, that the Federal Reserve will not raisehas increased interest rates in 2022, and any such increase could adversely affect our results of operations and financial condition as described below.eleven times. In a period of rising interest rates, our interest expense on floating-rate debt would increase, while any additional interest income we earn on our floating-rate investments may be subject to caps and may not compensate for such increase in interest expense. Specifically, in a rising interest environment, our interest income on our current portfolio will initially decline due to in-the-money LIBOR floors on 70% of our portfolio as of December 31, 2021, then is expected to increase as such loans get repaid/refinanced.increase. At the same time, the interest income we earn on our fixed-rate investments would not change, the duration and weighted average life of our fixed-rate investments would increase and the market value of our fixed-rate investments would decrease. Similarly,Notwithstanding the current period of relatively high interest rates, the U.S. Federal Reserve has indicated that it may decrease in interest rates in 2024. In a period of declining interest rates, our interest income on floating-rate investments would generally decrease, while any decrease in the interest we are charged on our floating-rate debt may be subject to floors and may not compensate for such decrease in interest income, however, LIBORincome. However, rate floors relating to our loan portfolio may offset some of the impact from declining rates. In addition, interest we are charged on our fixed-rate debt would not change. Any such scenario could adversely affect our results of operations and financial condition.
Changes in the method for determining LIBOR or the elimination of LIBORWe may affect the value of the financial obligations to be held or issued by us that are linked to LIBOR and could affect our results of operations or financial condition.
On March 5, 2021, the Financial Conduct Authority of the U.K. (the “FCA”), which regulates LIBOR, announced (the “FCA Announcement”) that all LIBOR tenors relevant to us will cease to be published or will no longer be representative after June 30, 2023. The FCA Announcement coincides with the March 5, 2021 announcement of LIBOR’s administrator, the ICE Benchmark Administration Limited (the “IBA”), indicating that, as a result of not having access to input data necessary to calculate LIBOR tenors relevant to us on a representative basis after June 30, 2023, the IBA would have to cease publication of such LIBOR tenors immediately after the last publication on June 30, 2023. The United States Federal Reserve has also advised banks to cease entering into new contracts that use USD LIBOR as a reference rate. The Federal Reserve, in conjunction with the Alternative Reference Rate Committee, a committee convened by the Federal Reserve that includes major market participants, has identified the Secured Overnight Financing Rate, or SOFR, a new index calculated by short-term repurchase agreements, backed by Treasury securities, as its preferred alternative rate for LIBOR. There are significant differences between LIBOR and SOFR, such as LIBOR being an unsecured lending rate while SOFR is a secured lending rate, and SOFR is an overnight rate while LIBOR reflects term rates at different maturities. If our LIBOR-based borrowings are converted to SOFR, the differences between LIBOR and SOFR, and potential margin adjustments in connection with the transition, could result in higher interest costs for us, which could have a material adverse effect on our operating results. Although SOFR is the ARRC’s recommended replacement rate, it is also possible that lenders may instead choose alternative replacement rates that may differ from LIBOR in ways similar to SOFR or in other ways that would result in higher interest costs for us. We cannot predict the
effect of the decision not to sustain LIBOR, or the potential transition to SOFR or another alternative reference rate as LIBOR’s replacement.
As of December 31, 2021, 100.0% of our loans by principal balance earned a floating rate of interest indexed to LIBOR, and 100.0% of our outstanding financing arrangements (excluding convertible notes) bear interest indexed to LIBOR. All of these arrangements provide procedures for determining an alternative base rate in the event that LIBOR is discontinued. Regardless, there can be no assurances as to what alternative base rates may be and whether such base rate will be more or less favorable than LIBOR and any other unforeseen impacts of the potential discontinuation of LIBOR. Any changes, reforms or replacements relating to LIBOR could increase our interest expense and could have an adverse impact on the market for or value of any LIBOR-linked securities, loans, derivatives and other financial obligations or extensions of credit held by or due to us or on our overall financial condition or results of operations. In addition, there could be a mismatch between the timing of adjusting the floating base rate from LIBOR to an alternative base rate upon the discontinuation of LIBOR, between our financing arrangements and our loan investments, which may have an immediate and significant adverse impact on our results of operations and cash flows and the market value of our investments. We are monitoring the developments with respect to the potential phasing out of LIBOR and are working with our lenders and borrowers to minimize the impact of any LIBOR transition on our financial condition and results of operations, but can provide no assurances regarding the impact of the discontinuation of LIBOR.
We are subject to counterparty risk associated with our debt obligations.
Our counterparties for critical financial relationships may include both domestic and international financial institutions. These institutions could be severely impacted by credit market turmoil, changes in legislation, allegations of civil or criminal wrongdoing and may as a result experience financial or other pressures. In addition, if a lender or counterparty files for bankruptcy or becomes insolvent, our borrowings under financing agreements with them may become subject to bankruptcy or insolvency proceedings, thus depriving us, at least temporarily, of the benefit of these assets. Such an event could restrict our access to financing and increase our cost of capital. If any of our counterparties were to limit or cease operation, it could lead to financial losses for us.
We may utilize a wide variety of derivative financial instruments for risk management purposes, the use of which may entail greater than ordinary investment risks.
While not anticipated to be a meaningful component of our investment strategy, we may, subject to maintaining our qualification as a REIT, utilize a wide variety of derivative financial instruments for risk management purposes, the use of which is a highly specialized activity that may entail greater than ordinary investment risks. Any such hedging transactions may not be effective in mitigating risk in all market conditions or against all types of risk (including unidentified or unanticipated risks), thereby resulting in losses to us. Engaging in hedging transactions may result in a poorer overall performance for us than if we had not engaged in any such hedging transaction, and our Manager may not be able to effectively hedge against, or accurately anticipate, certain risks that may adversely affect our investment portfolio. In addition, our investment portfolio will always be exposed to certain risks that cannot be fully or effectively hedged, such as credit risk relating both to particular securities and counterparties.
Hedging against interest rate or currency exposure may adversely affect our earnings, which could reduce our cash available for distribution to stockholders.
Subject to maintaining our qualification as a REIT, we may pursue various hedging strategies to seek to reduce our exposure to adverse changes in interest rates and fluctuations in currencies. Our hedging activity willmay vary in scope based on the level and volatility of interest rates, exchange rates, the type of assets held and other changing market conditions. Interest rate and currency hedging may fail to protect or could adversely affect us because, among other things:
•interest rate, currency and/or credit hedging can be expensive and may result in us generating less net income;
•available interest rate or currency rate hedges may not correspond directly with the interest rate or currency risk for which protection is sought;
•due to a credit loss, prepayment or asset sale, the duration of the hedge may not match the duration of the related asset or liability;
•the amount of income that a REIT may earn from hedging transactions (other than hedging transactions that satisfy certain requirements of the Internal Revenue Code of 1986, as amended (the “Code”) or that are done
through a taxable REIT subsidiary) to offset interest rate losses is limited by U.S. federal income tax provisions governing REITs;
•the hedging counterparty owing money in the hedging transaction may default on its obligation to pay;
•the credit quality of the hedging counterparty owing money on the hedge may be downgraded to such an extent that it impairs our ability to sell or assign our side of the hedging transaction;
•we may fail to recalculate, readjust and execute hedges in an efficient manner; and
•legal, tax and regulatory changes could occur and may adversely affect our ability to pursue hedging strategies and/or increase the costs of implementing such strategies.
Any hedging activity in which we engage may materially and adversely affect our results of operations and cash flows. Therefore, while we may enter into such transactions seeking to reduce risks, unanticipated changes in interest rates, credit spreads or currencies may result in poorer overall investment performance than if we had not engaged in any such hedging transactions. In addition, the degree of correlation between price movements of the instruments used in a hedging strategy and price movements in the portfolio positions or liabilities being hedged may vary materially. Moreover, for a variety of reasons, we may not seek to establish a perfect correlation between such hedging instruments and the portfolio positions or liabilities being hedged. Any such imperfect correlation may prevent us from achieving the intended hedge and expose us to risk of loss.
In addition, some hedging instruments involve additional risk because they are not traded on regulated exchanges, guaranteed by an exchange or its clearing house, or regulated by any U.S. or foreign governmental authorities. Consequently, we cannot assure you that a liquid secondary market will exist for hedging instruments purchased or sold, and we may be required to maintain a position until exercise or expiration, which could result in significant losses. In addition, certain regulatory requirements with respect to derivatives, including record keeping, financial responsibility or segregation of customer funds and positions are still under development and could impact our hedging transactions and how we and our counterparty must manage such transactions.
We aremay be subject to counterparty risk associated with any hedging activities.
We aremay be subject to credit risk with respect to the counterparties to derivative contracts (whether a clearing corporation in the case of exchange-traded instruments or to our hedge counterparty in the case of OTC instruments). If a counterparty becomes bankrupt or otherwise fails to perform its obligations under a derivative contract due to financial difficulties, we may experience significant delays in obtaining any recovery under the derivative contract in a dissolution, assignment for the benefit of creditors, liquidation, winding-up, bankruptcy, or other analogous proceeding. In the event of the insolvency of a counterparty to a derivative transaction, the derivative transaction would typically be terminated at its fair market value. If we are owed this fair market value in the termination of the derivative transaction and our claim is unsecured, we will be treated as a general creditor of such counterparty, and will not have any claim with respect to the underlying security. We may obtain only a limited recovery or may obtain no recovery in such circumstances. In addition, the business failure of a hedging counterparty with whom we enter into a hedging transaction will most likely result in its default, which may result in the loss of unrealized profits and force us to cover our commitments, if any, at the then current market price.
Currently, certain categories of interest rate and credit default swaps are subject to mandatory clearing, and more are expected to be cleared in the future. The counterparty risk for cleared derivatives is generally lower than for uncleared OTC derivative transactions because generally a clearing organization becomes substituted for each counterparty to a cleared derivative contract and, in effect, guarantees the parties’ performance under the contract as each party to a trade looks only to the clearing house for performance of financial obligations. However, there can be no assurance that a clearing house, or its members, will satisfy
the clearing house’s obligations to us. Counterparty risk with respect to certain exchange-traded and OTC derivatives may be further complicated by recently enacted U.S. financial reform legislation.
We may enter into hedging transactions that could expose us to contingent liabilities in the future.
Subject to maintaining our qualification as a REIT, part of our investment strategy may involve entering into hedging transactions that could require us to fund cash payments in certain circumstances (such as the early termination of the hedging instrument caused by an event of default or other early termination event, or the decision by a counterparty to request margin securities it is contractually owed under the terms of the hedging instrument). The amount due with respect to an early termination would generally be equal to the unrealized loss of such open transaction positions with the respective counterparty and could also include other fees and charges. These economic losses will be reflected in our results of operations, and our
ability to fund these obligations will depend on the liquidity of our assets and access to capital at the time, and the need to fund these obligations could adversely affect our results of operations and financial condition.
If we enter into certain hedging transactions or otherwise invest in certain derivative instruments, failure to obtain and maintain an exemption from being regulated as a commodity pool operator by our Manager could subject us to additional regulation and compliance requirements which could materially adversely affect our business and financial condition.
The Commodity Exchange Act of 1936, as amended, and rules promulgated thereunder (the “CFTC(“CFTC Rules”) by the U.S. Commodity Futures Trading Commission (the “CFTC”(“CFTC”) establish a comprehensive regulatory framework for certain derivative instruments, including swaps, futures and foreign exchange derivatives (“Regulated CFTC Instruments”). Under this regulatory framework, mortgage real estate investment trusts (“mREITs”) that trade in Regulated CFTC Instruments are considered “commodity pools” and the operators of such mREITs would be considered “commodity pool operators” (“CPOs”). Absent an exemption, a CPO of an mREIT must register with the CFTC and become subject to CFTC Rules applicable to registered CPOs, including with respect to disclosure, reporting, recordkeeping and business conduct in respect of the mREIT. We may from time to time, directly or indirectly, invest in Regulated CFTC Instruments, which may subject us to oversight by the CFTC.
Our Manager has qualified for the exemption from the CPO registration requirement in respect of our company pursuant to the no-action relief issued by the CFTC staff to operators of qualifying mREITs and has filed a notice of exemption with the CFTC. Our Manager qualifies for the exemption in respect of our company on the basis that we identify as a “mortgage REIT” for U.S. federal income tax purposes and our trading in Regulated CFTC Instruments does not exceed a certain de minimis threshold identified in the no-action relief. Subject to any amendments to CFTC Rules or the position of the CFTC staff, including the continuing availability of the mREIT no-action relief, our Manager will seek to either comply with CFTC Rules without relying on any exemption from CPO registration or rely on other exemptions (which may prevent us from trading in Regulated CFTC Instruments in order to satisfy the conditions for the relevant exemption).
The CFTC has substantial enforcement power with respect to violations of the laws over which it has jurisdiction, including anti-fraud and anti-manipulation provisions. Among other things, the CFTC may suspend or revoke the registration of a person who fails to comply, prohibit such a person from trading or doing business with registered entities, impose civil money penalties, require restitution and seek fines or imprisonment for criminal violations. Additionally, a private right of action exists against those who violate the laws over which the CFTC has jurisdiction or who willfully aid, abet, counsel, induce or procure a violation of those laws. In the event we fail to receive interpretive relief from the CFTC on this matter, are unable to claim an exemption from registration and fail to comply with the regulatory requirements of these new rules, we may be unable to use certain types of hedging instruments or we may be subject to significant fines, penalties and other civil or governmental actions or proceedings, any of which could adversely affect our results of operations and financial condition.
Risks Related to Our Relationship with Our Manager and Its Affiliates
We depend on our Manager and its personnel for our success. We may not find a suitable replacement for our Manager if the management agreement is terminated, or if key personnel cease to be employed by our Manager and its affiliates or otherwise become unavailable to us.
We do not have any employees and are externally managed and advised by our Manager, an indirect subsidiary of KKR. Our Manager has significant discretion as to the implementation of our investment and operating policies and strategies. Accordingly, our success depends on the efforts, experience, diligence, skill and network of business contacts of the officers and key personnel of our Manager and its affiliates. Our Manager is managed by senior professionals of KKR Real Estate. These individuals evaluate, negotiate, execute and monitor our loans and investments and advise us regarding maintenance of our qualification as a REIT and exclusion from registration under the Investment Company Act; therefore, our success will
depend on their skill and management expertise and continued service with our Manager and its affiliates.affiliates.Our operating results are dependent upon, among other things, the availability of, as well as our Manager’s ability to identify, structure, consummate, leverage, manage and realize returns on our investments. We cannot assure you that our Manager will be successful in identifying and consummating investments that satisfy our rate of return objectives or that such investments, once made, will perform as anticipated. Furthermore, there is increasing competition among financial sponsors, investment banks and other real estate debt investors for hiring and retaining qualified investment professionals and there can be no assurance that such professionals will continue to be associated with us, our Manager or its affiliates or that any replacements will perform well. The departure of any of the officers or key personnel of our Manager and its affiliates could have a material adverse effect on our performance. In addition, pursuant to the terms of our management agreement, our Manager retains, for and on our behalf and at our expense, the services of certain other persons and firms as our Manager deems necessary or advisable in connection with managing our operations. We expect that certain of these providers will include affiliates of KKR and its portfolio companies as we expand our business and leverage service providers to manage our growth.
In addition, we can offer no assurance that our Manager will remain our investment manager or that we will continue to have access to our Manager’s officers and key personnel. The current term of the management agreement extends to December 31, 20222024 and will be automatically renewed for additional one-year terms thereafter; provided, however, that our Manager may
terminate the management agreement annually upon 180 days’ prior notice. If the management agreement is terminated and no suitable replacement is found to manage us, we may not be able to execute our business plan.
Termination of the management agreement would be costly.
Termination of the management agreement without cause will be difficult and costly. The management agreement may be terminated upon the affirmative vote of at least two-thirds of our independent directors, based upon our determination that (1) our Manager's performance is unsatisfactory performance by our Manager thatand is materially detrimental to us and our subsidiaries taken as a whole or (2) our determination that the management fee and incentive fee payable to our Manager are not fair, subject to our Manager’s right to prevent any termination due to unfair fees by accepting a reduction of management and/or incentive fees agreed to by at least two-thirds of our independent directors. We must provide our Manager 180 days’ written notice of any termination. Additionally, upon such a termination, or if we materially breach the management agreement and our Manager terminates the management agreement, the management agreement provides that we will pay our Manager a termination fee equal to three times the sum of the average annual management fee and the average annual incentive fee, in each case earned by our Manager during the 24-month period immediately preceding the most recently completed calendar quarter prior to the date of termination. These provisions increase the cost to us of terminating the management agreement and adversely affect our ability to terminate the management agreement without cause.
Our Manager’s liability is limited under the management agreement and we have agreed to indemnify our Manager against certain liabilities.
Pursuant to the management agreement, our Manager does not assume any responsibility other than to render the services called for thereunder in good faith and is not responsible for any action of our board of directors in following or declining to follow any advice or recommendations of our Manager, including as set forth in the investment guidelines of the management agreement. Our Manager maintains a contractual as opposed to a fiduciary relationship with us. Under the terms of the management agreement, our Manager and its affiliates and their respective directors, officers, employees, managers, trustees, control persons, partners, equityholders and stockholders are not liable to us, our directors, stockholders or any subsidiary of ours, or their directors, officers, employees or stockholders for any acts or omissions performed in accordance with and pursuant to the management agreement, whether by or through attempted piercing of the corporate veil, by or through a claim, by the enforcement of any judgment or assessment or by any legal or equitable proceeding, or by virtue of any statute, regulation or other applicable law, or otherwise, except by reason of acts or omissions constituting bad faith, willful misconduct, gross negligence, or reckless disregard of their duties under the management agreement.
We have agreed to indemnify our Manager and its affiliates and their respective directors, officers, employees and stockholders with respect to all expenses, losses, damages, liabilities, demands, charges and claims arising from acts or omissions of our Manager not constituting bad faith, fraud, willful misconduct, gross negligence, or reckless disregard of duties, performed or not performed in good faith in accordance with and pursuant to the management agreement. As a result, we could experience poor performance or losses for which our Manager would not be liable.
The historical returns generated by funds managed by affiliates of our Manager should not be considered indicative of our future results or of any returns expected on an investment in shares of our common stock.
The past performance of vehicles and funds advised by affiliates of our Manager, as well as KKR’s and its affiliates’ other investment funds, vehicles and accounts, is not predictive of our performance, in particular because the investment objectives of such other funds, vehicles and accounts differ from our investment objectives. Investors should not assume that they will experience returns, if any, comparable to those experienced by investors in such vehicles. Moreover, we and the other vehicles advised by affiliates of our Manager are different in several respects, including:
•asset or instrument types targeted may differ;
•our use of leverage and hedging strategies may differ;
•our fee structures differ;
•we may not acquire or sell assets at similar times; and
•the other vehicles advised by affiliates of our Manager have operated under market conditions that may differ materially from market conditions that will exist at the time we make investments.
Our Manager’s fee structure may not create proper incentives or may induce our Manager and its affiliates to make certain loans or investments, including speculative investments, which increase the risk of our loan and investment portfolio.
We pay our Manager base management fees regardless of the performance of our portfolio. Our Manager’s entitlement to base management fees, which are not based upon performance metrics or goals, might reduce its incentive to devote its time and effort to seeking loans and investments that provide attractive risk-adjusted returns for our portfolio. Because the base management fees are also based in part on our outstanding equity, our Manager may also be incentivized to advance strategies that increase our equity, and there may be circumstances where increasing our equity will not optimize the returns for our stockholders. Consequently, we are required to pay our Manager base management fees in a particular period despite experiencing a net loss or a decline in the value of our portfolio during that period.
In addition, ourOur Manager has the ability to earn incentive fees each quarter based on our earnings, which may create an incentive for our Manager to invest in assets with higher yield potential, which are generally riskier or more speculative, or sell an asset prematurely for a gain, in an effort to increase our short-term net income and thereby increase the incentive fees to which it is entitled. In addition, we are required to reimburse our Manager or its affiliates for documented costs and expenses incurred by it and its affiliates on our behalf, except those specifically required to be borne by our Manager under our Management Agreement. Accordingly, to the extent that our Manager retains other parties to provide services to us, expenses allocable to us will increase. If our interests and those of our Manager are not aligned, the execution of our business plan and our results of operations could be adversely affected, which could adversely affect our results of operations and financial condition.
There are various conflicts of interest in our relationship with KKR, including with our Manager and in the allocation of investment opportunities to KKR investment vehicles and us, which could result in decisions that are not in the best interests of our stockholders.
As of December 31, 2021,2023, KKR and its affiliates beneficially owned shares of our common stock providing them with an aggregate 23.2%aggregate 14.4% of the total voting power of our company. ByBy virtue of KKR’s stock ownership, KKR has the power to significantly influence our business and affairs and is able to influence the outcome of matters required to be submitted to stockholders for approval, including the election of our directors, amendments to our charter, mergers or sales of assets. In addition, we are managed by our Manager, a KKR affiliate, and our executive officers are employees of our Manager or one or more of its affiliates. Our Bylaws provide that, so long as our Manager or any of its affiliates serve as our manager, in order for an individual to be qualified to be nominated for election as a director or to serve as a director, the nominee together with all other individuals nominated for election and any individuals who will continue to serve as a director after such election must include at least one individual that is or was designated by KKR Group Holdings L.P. (successor to KKR Fund Holdings L.P.).
There is no guarantee that the policies and procedures adopted by us, the terms and conditions of the management agreement or the policies and procedures adopted by our Manager, KKR and their affiliates, will enable us to identify, adequately address or mitigate these conflicts of interest.
Some examples of conflicts of interest that may arise by virtue of our relationship with our Manager and KKR include:
•Fees and expenses. KKR may earn fees and/or other compensation from us, our holding vehicles and other entities through which we invest, and, in connection with equity investments made by us, if any, entities in which we invest (“portfolio entities”). In particular, KKR has in the past and may in the future act as underwriter or placement agent in connection with an offering of securities or instruments by us and other entities in which we invest and may also provide syndication services to such entities, including in respect of co-investments in transactions in which we participate. The fee potential inherent in a particular investment or transaction could be viewed as an incentive for our Manager to seek to refer, allocate or recommend an investment or transaction to us. In addition, we or our portfolio entities may engage consultants, including KKR Capstone, a group of entities that are not KKR affiliates or subsidiaries but operate under several consulting agreements with KKR, and our Manager’s network of senior advisors, industry advisors and real estate consultants. We will directly bear, or indirectly bear through portfolio entities, the cost of operating and consulting services provided by these consultants. While our Manager believes that the fees, reimbursable expenses and other compensation paid to these consultants are reasonable and generally at market rates for the relevant activities, such compensation is not negotiated at arm’s length and from time to time may be in excess of fees, reimbursable expenses or other compensation that may be charged by comparable third parties. In addition, we may provide loans or otherwise invest alongside one or more KKR investment vehicles or with KKR (investing for their own account) and other co-investors. We and KKR investment vehicles may also pursue similar real estate credit investment strategies. Our Manager and KKR will determine, in their sole discretion, the appropriate allocation of investment-related expenses, including broken deal expenses incurred in respect of unconsummated investments and expenses more generally relating to a particular investment strategy, among the funds, vehicles and accounts participating or that would have participated in such investments or that otherwise participate in the relevant investment strategy, as
applicable, which may result in us bearing more or less of these expenses than other participants or potential participants in the relevant investments.
•KKR’s investment advisory and proprietary activities.KKR may make strategic investments or enter into transactions for operational funding purposes, which, in each case, will be investments or transactions that are not offered to us, and also may make opportunistic investments pursuant to investment strategies that mirror, or are similar to in whole or in part, investment strategies implemented by us and KKR on behalf of itself and KKR investment vehicles. For example, in February 2021, KKR acquired Global Atlantic Financial Group Limited (“Global Atlantic”), a leading retirement and life insurance company with over $103.1 billion of adjusted invested assets as of September 30, 2021.company. Therefore, KKR and its affiliates (including Global Atlantic) may compete with, and have interests adverse to us. The existence of KKR, its affiliates and KKR investment vehicles investing in the same or similar investments that may be made by us could, among other adverse consequences, affect the terms of loans and other investments pursued by us and the demand for such financing. In such circumstances, KKR’s interest in maximizing the investment return of its proprietary entities creates a conflict of interest in that our Manager may be motivated to allocate more attractive investments to the proprietary entities under its management and allocate less attractive investments to us. Similarly, KKR may be motivated to allocate scarce investment opportunities to the proprietary entities under its management rather than to us. In the case of KKR’s allocation of investment opportunities between us and Global Atlantic, for example, we will continue to be KKR's primary vehicle for transitional senior loans, receiving first priority with respect to those investments, which have been our primary target asset since our IPO, while Global Atlantic will receive priority with respect to stabilized senior loan opportunities. Additionally, KKR has in the past given and is expected to continue to give advice or take action (including entering into short sales or other “opposite way trading” activities) with respect to the investments held by, and transactions of, KKR investment vehicles or proprietary entities of KKR that are different from or otherwise inconsistent with, the advice given or timing or nature of any action taken with respect to the investments held by us and our transactions. Additionally, the investment programs employed by KKR for KKR investment vehicles or proprietary entities of KKR could conflict with the transactions and strategies employed by our Manager in managing our company. Where our company, proprietary entities of KKR and KKR investment vehicles have provided financing to the same borrower, their interests may be in conflict irrespective of whether their investments are at different levels of the capital structure.
•Other KKR activities.Conflicts of interest may arise in allocating time, services or resources among our investment activities, KKR investment vehicles, KKR, other entities affiliated with KKR and the senior officers of KKR. Although members of the KKR Real Estate team intend to devote such time as may be necessary to conduct our business affairs in an appropriate manner, our Manager and KKR will continue to devote the resources necessary to manage the investment activities of KKR, KKR investment vehicles, other entities affiliated with
KKR and the executives of KKR and, therefore, conflicts may arise in the allocation of time, services and resources. KKR is not precluded from conducting activities unrelated to us. In addition, KKR may expand the range of services that it provides over time. Except as and to the extent expressly provided in the management agreement with our Manager, our Manager and KKR will not be restricted in the scope of their business or in the performance of any such services (whether now offered or undertaken in the future) even if such activities could give rise to conflicts of interest.
•No assurance of ability to participate in investment opportunities. As indicated above, certain KKR investment vehicles, including any seed investments, do and may in the future pursue the same investment opportunities as us. Subject to our organizational documents and governing agreements, KKR has sole discretion to determine the manner in which investment opportunities are allocated between us, KKR and KKR investment vehicles. This allocation presents inherent conflicts of interest where demand exceeds available supply. As a result, our share of investment opportunities may be materially affected by competition from KKR investment vehicles and from proprietary entities of KKR. The conflicts inherent in making such allocation decisions may not always be resolved to our advantage. Generally, and subject to our organizational documents and governing agreements, our Manager will allocate investment opportunities between us and KKR investment vehicles in a manner that is consistent with an allocation methodology established by our Manager reasonably designed to help ensure allocations of opportunities are made over time on a fair and equitable basis. However, we will not necessarily have any priority in respect of any category of investments, and the allocation of investment opportunities in accordance with our Manager’s allocation methodology may result in us being allocated less than a pro rata share of an investment opportunity or none of such opportunity. For example, on January 10, 2017 we made a $40.0 million commitment to an aggregator vehicle alongside RECOP I, a KKR-managed investment fund. During the aggregator vehicle’s investment period, investment opportunities available to KKR that fall within the
primary investment strategy of acquiring newly issued CMBS B-Pieces will be shared pro rata between such aggregator vehicle and another KKR aggregator vehicle based on capital commitments. In respect of investments that are within the vehicles’ investment objective but outside the primary investment strategy that are suitable for us or other KKR investment vehicles, KKR will allocate such opportunities among the aggregators, us and such other KKR investment vehicles in their sole discretion. For more information, see Part II, Item 7. “Management’s Discussion and Analysis of Financial Condition and Results of Operations—Our Portfolio.” In addition, certain KKR investment vehicles have priority investment rights to certain investment opportunities that may be suitable for us, and such vehicles with priority investment rights could be established by KKR in the future. These include, but are not limited to, KKR’s special situations, mezzanine and real estate funds.
•Duties owed to KKR investment vehicles. KKR, including our Manager, may structure an investment as a result of which one or more KKR investment vehicles are offered the opportunity to participate in the same or separate debt tranche of an investment allocated to us. As advisor to such KKR investment vehicles, KKR, including our Manager, may owe a fiduciary or other duty to the KKR investment vehicles and may face a conflict of interest in respect of the advice they give to, or the decisions made with regard to, us and such KKR investment vehicles.
•Co-investments. We may co-invest together with KKR investment vehicles and/or KKR proprietary balance sheet entities in some or all of our investment opportunities. KKR may also offer co-investment opportunities to vehicles in which KKR personnel, non-employee consultants and other associated persons of KKR or any of its affiliate entities may invest and to third-party co-investors. In such circumstances, the size of the investment opportunity otherwise available to us may be less than it would otherwise have been, and we may participate in such opportunities on different and potentially less favorable economic terms than such parties if our Manager deems such participation as being otherwise in our best interests. Furthermore, when KKR proprietary entities or KKR investment vehicles have interests or requirements that do not align with our interests, including differing liquidity needs or desired investment horizons, conflicts may arise in the manner in which any voting or control rights are exercised with respect to the relevant investment, potentially resulting in an adverse impact on us. Generally, such transactions are not required to be presented to our board of directors for approval, and there can be no assurances that any conflicts will be resolved in our favor.
•Investments in which KKR and/or KKR investment vehicles have a different principal interest. Without the approval of KKR’s global conflicts and compliance committee, we will not acquire a controlling interest in any class or tranche of debt securities of any borrower in which KKR or any KKR investment vehicle has a pre-existing controlling equity interest (excluding any investments shared by us and such parties upon initial investment or any related follow-on investment). However, in circumstances where KKR’s global conflicts and compliance committee approves a transaction of this type, approval by our board of directors is generally not
required, and our interests and those of KKR or such KKR investment vehicle may not always be aligned, which may give rise to actual or potential conflicts of interest and actions taken for us may be adverse to KKR or such KKR investment vehicle, or vice versa.
•Competing interests; allocation of resources. KKR may make investments on behalf of itself and/or KKR investment vehicles that are competitive with our investments. In providing advice and recommendations to, or with respect to, such investments and in dealing in such investments on behalf of such KKR investment vehicles or KKR, to the extent permitted by law, KKR will not take into consideration our interests or our Manager’s investments. Accordingly, such advice, recommendations and dealings may result in adverse consequences to us and our investments. Conflicts of interest may also arise with respect to the allocation of our Manager’s time and resources between our investments and other investments. In addition, conflicts of interest may arise where KKR personnel and non-employee consultants serve as directors or interim executives of, or otherwise are associated with, our portfolio entities (e.g., if the entity is in financial difficulty) or entities that are competitors of certain of our portfolio entities.
•Information sharing. Although we have leveraged, and plan to continue to leverage KKR’s firm-wide resources to help source, conduct due diligence on, structure, syndicate and create value for our investments, the information-sharing policies and procedures of KKR relating to confidential information and the information barrier between the public and private side of KKR, as well as certain legal and contractual and tax constraints, could significantly limit our ability to do so. In addition, in providing services in respect of our investments and other investments, our Manager may come into possession of information that it is prohibited from acting on (including on our behalf) or disclosing as a result of applicable confidentiality requirements or applicable law, even though such action or disclosure would be in our interests. Furthermore, to the extent not restricted by
confidentiality requirements or applicable law, KKR may apply experience and information gained in providing services to our investments to provide services to competing investments of KKR investment vehicles, which may have adverse consequences for us or our investments.
•Other affiliate transactions.We may borrow money from multiple lenders, including KKR. Although our Manager will approve such transactions only on terms, including the consideration to be paid, that are determined by our Manager in good faith to be appropriate for us, it is possible that the interests of such affiliated lender could be in conflict with ours and the interests of our stockholders. KKR may also, on our behalf, effect transactions, including transactions in the secondary markets where KKR is also acting as a broker or other advisor on the other side of the same transaction. Notwithstanding that KKR may not receive commissions from such agency cross-transactions, it may nonetheless have a potential conflict of interest with respect to us and the other parties to those transactions to the extent it receives commissions or other compensation from such other parties.
•KKR stakes in third-party hedge fund managers. KKR has stakes in third-party hedge fund managers. Funds and accounts managed by such third-party managers and underlying portfolio funds and accounts may invest in securities or other financial instruments of companies in which we may also have an interest, or in competitors of ours or our investments. Actions taken by any of these third-party hedge fund managers in respect of any of the foregoing may adversely impact our company.
•Transactions with any KKR fund or affiliate. Pursuant to the terms of the management agreement, and subject to applicable law, our Manager will not consummate on our behalf any transaction that involves (i) the sale of any investment to or (ii) the acquisition of any investment from KKR, any KKR fund or any of their affiliates unless such transaction (A) is on terms no less favorable to us than could have been obtained on an arm’s length basis from an unrelated third party and (B) has been approved in advance by a majority of our independent directors. Although our Manager will seek to resolve any conflicts of interest in a fair and equitable manner in accordance with the allocation policy and its prevailing policies and procedures with respect to conflicts resolution among KKR funds generally, only those transactions set forth in this paragraph will be required to be presented for approval by the independent directors.
•Management agreement.The management agreement was negotiated between related parties and its terms, including fees payable to our Manager, may not be as favorable to us as if they had been negotiated with an unaffiliated third party. In addition, we may choose not to enforce, or to enforce less vigorously, our rights under the management agreement because of our desire to maintain an ongoing relationship with our Manager.
•Service providers. Certain advisors and other service providers, or their affiliates (including accountants, administrators, lenders, bankers, brokers, attorneys, consultants and investment or commercial banking firms), to us and our investments may also provide goods or services to or have business, personal, political, financial or other relationships with KKR (including our Manager). Such advisors and service providers may be investors in KKR investment vehicles, sources of investment opportunities for KKR, our company or KKR investment vehicles or may otherwise be co-investors with or counterparties to transactions involving the foregoing. These relationships may influence our Manager in deciding whether to select or recommend such a service provider to perform services for us or a borrower (the cost of which will generally be borne directly or indirectly by us or such borrower, as applicable).
Our Manager manages our portfolio pursuant to very broad investment guidelines and is not required to seek the approval of our board of directors for each investment, financing, asset allocation or hedging decision made by it, which may result in riskier loans and investments and which could adversely affect our results of operations and financial condition.
Our Manager is authorized to follow very broad investment guidelines that provide it with broad discretion over investment, financing, asset allocation and hedging decisions. Our board of directors will periodically review our investment guidelines and our loan and investment portfolio but will not, and will not be required to, review and approve in advance all of our proposed loans and investments or our Manager’s financing, asset allocation or hedging decisions. In addition, in conducting periodic reviews, our directors may rely primarily on information provided to them by our Manager or its affiliates. Subject to maintaining our REIT qualification and our exclusion from registration under the Investment Company Act, our Manager has significant latitude within the broad investment guidelines in determining the types of loans and investments it makes for us, and how such loans and investments are financed or hedged, which could result in investment returns that are substantially below expectations or that result in losses, which could adversely affect our results of operations and financial condition.
We do not own the KKR name, but we will use it as part of our corporate name pursuant to a license agreement with KKR. Use of the name by other parties or the termination of our license agreement may harm our business.
We entered into a license agreement with KKR pursuant to which it granted us a fully paid-up, royalty-free, non-exclusive license to use the name “KKR Real Estate Finance Trust Inc.” and the ticker symbol “KREF”. Under this agreement, we have a right to use this name and ticker symbol for so long as our Manager (or another affiliate of KKR) serves as our Manager pursuant to the management agreement and our Manager (or another managing entity) remains an affiliate of KKR under the license agreement. The license agreement may also be earlier terminated by either party as a result of certain breaches or for convenience upon 90 days’ prior written notice. KKR and its affiliates retain the right to continue using the “KKR” name. We are also unable to preclude KKR and its affiliates from licensing or transferring ownership of the “KKR” name to third parties, some of whom may compete with us. Consequently, we are unable to prevent any damage to goodwill that may occur as a result of the activities of KKR or others. Furthermore, in the event that the license agreement is terminated, we will be required to change our name and ticker symbol and cease using the “KKR” name. Any of these events could disrupt our recognition in the marketplace, damage any goodwill we may have generated and otherwise harm our business.
Legal and Regulatory Risks
State licensing requirements will cause us to incur expenses and our failure to be properly licensed may have a material adverse effect on us and our operations.
Nonbank companies are generally required to hold licenses in a number of U.S. states to conduct lending activities. State licensing statutes vary from state to state and prescribe or impose various recordkeeping requirements; restrictions on loan origination and servicing practices, including limits on finance charges and the type, amount and manner of charging fees; disclosure requirements; requirements that licensees submit to periodic examination; surety bond and minimum specified net worth requirements; periodic financial reporting requirements; notification requirements for changes in principal officers, stock ownership or corporate control; restrictions on advertising; and requirements that loan forms be submitted for review. Obtaining and maintaining licenses will cause us to incur expenses and failure to be properly licensed under state law or otherwise may have a material adverse effect on us and our operations.
Maintaining an exclusion from registration under the Investment Company Act imposes significant limits on our operations. Your investment return may be reduced if we are required to register as an investment company under the Investment Company Act.
We currently conduct, and intend to continue to conduct, our operations so that we are not required to register as an investment company under the Investment Company Act. We believe we are not an investment company under Section 3(a)(1)(A) of the Investment Company Act because we do not engage primarily, or hold ourselves out as being engaged primarily, in the business of investing, reinvesting or trading in securities. In addition, we intend to conduct our operations so that we do not come within the definition of an investment company under Section 3(a)(1)(C) of the Investment Company Act because less than 40% of our total assets (exclusive of U.S. government securities and cash items) on an unconsolidated basis will consist of “investment securities” (the “40% test”). Excluded from the term “investment securities” (as defined in the Investment Company Act) are securities issued by majority-owned subsidiaries that are themselves not investment companies and are not relying on the exclusion from the definition of investment company set forth in Section 3(c)(1) or Section 3(c)(7) of the Investment Company Act. Our interests in wholly-owned or majority-owned subsidiaries that qualify for the exclusion pursuant to Section 3(c)(5)(C), as described below,or Rule 3a-7, each as described below, or another exclusionexemption or exceptionexclusion under the Investment Company Act (otherother than Section 3(c)(1) or Section 3(c)(7) thereof),thereof, do not constitute “investment securities.”
To maintain an exclusion from registration as an investment company, the securities issued to us by any wholly-owned or majority-owned subsidiaries that we may form in the future that are excluded from the definition of investment company under Section 3(c)(1) or Section 3(c)(7) of the Investment Company Act, together with any other investment securities we may own, may not have a value in excess of 40% of the value of our total assets on an unconsolidated basis (exclusive of U.S. government securities and cash items). We will monitor our holdings to ensure ongoing compliance with this 40% test, but there can be no assurance that we will be able to maintain an exclusion from registration as an investment company. The 40% test limits the types of businesses in which we may engage through our subsidiaries. In addition, the assets we and our subsidiaries may originate or acquire are limited by the provisions of the Investment Company Act and the rules and regulations promulgated under the Investment Company Act, which may adversely affect our business.
We hold our assets primarily through direct or indirect wholly-owned or majority-owned subsidiaries, certain of which are excluded from the definition of investment company pursuant to Section 3(c)(5)(C) of the Investment Company Act. To qualify for the exclusion pursuant to Section 3(c)(5)(C) based on positions set forth by the staff of the SEC, each such subsidiary generally is required to hold at least (i) 55% of its assets in “qualifying” real estate assets and (ii) at least 80% of its assets in
“qualifying” “qualifying” real estate assets and real estate-related assets. "Qualifying” real estate assets for this purpose include senior loans, certain B-Notes and certain mezzanine loans that satisfy various conditions as set forth in SEC staff no-action letters and other guidance, and other assets that the SEC staff in various no-action letters and other guidance has determined are the functional equivalent of senior loans for the purposes of the Investment Company Act. We treat as real estate-related assets B-Notes and mezzanine loans that do not satisfy the conditions set forth in the relevant SEC staff no-action letters and other guidance, and debt and equity securities of companies primarily engaged in real estate businesses. Unless a relevant SEC staff no-action letter or other guidance applies, we expect to treat preferred equity interests as real estate-related assets. The SEC has not published guidance with respect to the treatment of CMBS for purposes of the Section 3(c)(5)(C) exclusion. Unless the SEC or its staff issues guidance with respect to CMBS, we intend to treat CMBS as a real estate-related asset. These no-action positions are based on specific factual situations that may be substantially different from the factual situations we and our subsidiaries may face, and a number of these no-action positions were issued more than twenty years ago. There may be no guidance from the SEC staff that applies directly to our factual situations and as a result we may have to apply SEC staff guidance that relates to other factual situations by analogy. No assurance can be given that the SEC or its staff will concur with our classification of our assets. In addition, the SEC or its staff may, in the future, issue further guidance that may require us to re-classify our assets for purposes of the Investment Company Act, including for purposes of our subsidiaries’ compliance with the exclusion provided in Section 3(c)(5)(C) of the Investment Company Act. There is no guarantee that we will be able to adjust our assets in the manner required to maintain an exclusion from registration under the Investment Company Act and any adjustment in our strategy or assets could have a material adverse effect on us.
Certain of our subsidiaries rely on the exclusion from the definition of investment company set forth in Rule 3a-7 under the Investment Company Act. We refer to these subsidiaries as our “CLO subsidiaries.” Rule 3a-7 under the Investment Company Act is available to certain structured financing vehicles that are engaged in the business of holding financial assets that, by their terms, convert into cash within a finite time period and that issue fixed income securities entitling holders to receive payments that depend primarily on the cash flows from these assets, provided that, among other things, the structured finance vehicle does not engage in certain portfolio management practices resembling those employed by management investment companies (e.g., mutual funds). Accordingly, each of these CLO subsidiaries is subject to an indenture (or similar transaction documents) that contains specific guidelines and restrictions limiting the discretion of the CLO subsidiary and its collateral manager, if
applicable. In particular, these guidelines and restrictions prohibit the CLO subsidiary from acquiring and disposing of assets primarily for the purpose of recognizing gains or decreasing losses resulting from market value changes. Thus, a CLO subsidiary cannot acquire or dispose of assets primarily to enhance returns to the owner of the equity in the CLO subsidiary; however, subject to this limitation, sales and purchases of assets may be made so long as doing so does not violate guidelines contained in the CLO subsidiary’s relevant transaction documents. A CLO subsidiary generally can, for example, sell an asset if the collateral manager believes that its credit characteristic qualifies it as an impaired asset, subject to fulfilling the requirements set forth in Rule 3a-7 under the Investment Company Act and the CLO subsidiary’s relevant transaction documents. As a result of these restrictions, our CLO subsidiaries may suffer losses on their assets and we may suffer losses on our investments in those CLO subsidiaries.
As a consequence of our seeking to maintain an exclusion from registration under the Investment Company Act on an ongoing basis, we and/or our subsidiaries may be restricted from making certain investments or may structure investments in a manner that would be less advantageous to us than would be the case in the absence of such requirements. In particular, a change in the value of any of our assets could negatively affect our ability to maintain an exclusion from registration under the Investment Company Act and cause the need for a restructuring of our investment portfolio. For example, these restrictions may limit our and our subsidiaries’ ability to invest directly in mortgage-backed securities that represent less than the entire ownership in a pool of senior loans, debt and equity tranches of securitizations and certain asset-backed securities, non-controlling equity interests in real estate companies or in assets not related to real estate; however, we and our subsidiaries may invest in such securities to a certain extent. In addition, seeking to maintain an exclusion from registration under the Investment Company Act may cause us and/or our subsidiaries to acquire or hold additional assets that we might not otherwise have acquired or held or dispose of investments that we and/or our subsidiaries might not have otherwise disposed of, which could result in higher costs or lower proceeds to us than we would have paid or received if we were not seeking to comply with such requirements. Thus, maintaining an exclusion from registration under the Investment Company Act may hinder our ability to operate solely on the basis of maximizing profits.
We will determine whether an entity is a majority-owned subsidiary of our company. The Investment Company Act defines a majority-owned subsidiary of a person as a company 50% or more of the outstanding voting securities of which are owned by such person, or by another company which is a majority-owned subsidiary of such person. The Investment Company Act defines voting securities as any security presently entitling the owner or holder thereof to vote for the election of directors of a company. We treat entities in which we own at least a majority of the outstanding voting securities as majority-owned subsidiaries for purposes of the 40% test. We have not requested that the SEC or its staff approve our treatment of any entity as a majority-owned subsidiary, and neither has done so. If the SEC or its staff were to disagree with our treatment of one or more subsidiary entities as majority-owned subsidiaries, we may need to adjust our strategy and our assets in order to continue to pass the 40% test. Any adjustment in our strategy or assets could have a material adverse effect on us.
We classify our assets for purposes of certain of our subsidiaries’ Section 3(c)(5)(C) exclusion from the Investment Company Act based upon no-action positions taken by the SEC staff and interpretive guidance provided by the SEC and its staff. Based on such guidance, to qualify for the exclusion pursuant to Section 3(c)(5)(C), each such subsidiary generally is required to hold at least (i) 55% of its assets in “qualifying” real estate assets and (ii) 80% of its assets in “qualifying” real estate assets and real estate-related assets. “Qualifying” real estate assets for this purpose include senior loans, certain B-Notes and certain mezzanine loans that satisfy various conditions as set forth in SEC staff no-action letters and other guidance, and other assets that the SEC staff in various no-action letters and other guidance has determined are the functional equivalent of senior loans for the
purposes of the Investment Company Act. We treat as real estate-related assets B-Notes and mezzanine loans that do not satisfy the conditions set forth in the relevant SEC staff no-action letters and other guidance, and debt and equity securities of companies primarily engaged in real estate businesses. Unless a relevant SEC no action letter or other guidance applies, we expect to treat preferred equity interests as real estate-related assets. The SEC has not published guidance with respect to the treatment of CMBS for purposes of the Section 3(c)(5)(C) exclusion. Unless the SEC or its staff issues guidance with respect to CMBS, we intend to treat CMBS as a real estate-related asset. These no-action positions are based on specific factual situations that may be substantially different from the factual situations we and our subsidiaries may face, and a number of these no-action positions were issued more than twenty years ago. There may be no guidance from the SEC staff that applies directly to our factual situations and as a result we may have to apply SEC staff guidance that relates to other factual situations by analogy. No assurance can be given that the SEC or its staff will concur with our classification of our assets. In addition, the SEC or its staff may, in the future, issue further guidance that may require us to re-classify our assets for purposes of the Investment Company Act, including for purposes of our subsidiaries’ compliance with the exclusion provided in Section 3(c)(5)(C) of the Investment Company Act. There is no guarantee that we will be able to adjust our assets in the manner required to maintain an exclusion from registration under the Investment Company Act and any adjustment in our strategy or assets could have a material adverse effect on us.
SEC staff no-action positions are based on specific factual situations that may be substantially different from the factual situations we and our subsidiaries may face, and a number of the no-action positions relevant to our business were issued more than twenty years ago. There may be no guidance from the SEC staff that applies directly to our factual situations and as a result we may have to apply SEC staff guidance that relates to other factual situations by analogy. No assurance can be given that the SEC or its staff will concur with our classification of our assets. In addition, the SEC or its staff may, in the future, issue further guidance that may require us to re-classify our assets for purposes of the Investment Company Act, including for purposes of our subsidiaries’ compliance with the exclusion provided in Section 3(c)(5)(C) of, or Rule 3a-7 under, the Investment Company Act. There is no guarantee that we will be able to adjust our assets in the manner required to maintain an exclusion from registration under the Investment Company Act and any adjustment in our strategy or assets could have a material adverse effect on us.
To the extent that the SEC or its staff provide new specific guidance regarding any of the matters bearing upon the definition of investment company and the exemptions or exclusions to that definition, we may be required to adjust our strategy accordingly. Any additional guidance from the SEC or its staff could provide additional flexibility to us, or it could further inhibit our ability to pursue the strategies we have chosen.
There can be no assurance that we and our subsidiaries willwould be able to successfully avoid operating as an unregistered investment company. If it were established that we were an unregistered investment company, there would be a risk that we would be subject to monetary penalties and injunctive relief in an action brought by the SEC, that we would be unable to enforce contracts with third parties, that third parties could seek to obtain rescission of transactions undertaken during the period it was established that we were an unregistered investment company, and that we would be subject to limitations on corporate leverage that would have an adverse impact on our investment returns.company.
If we were required to register as an investment company under the Investment Company Act, we would become subject to substantial regulation with respect to our capital structure (including our ability to use borrowings)borrowings or corporate leverage, which would have an adverse impact on our investment returns), management, operations, transactions with affiliated persons (as defined in the Investment Company Act) and portfolio composition, including disclosure requirements and restrictions with respect to diversification and industry concentration and other matters. Compliance with the Investment Company Act would, accordingly, limit our ability to make certain investments and require us to significantly restructure our business plan, which could materially adversely affect our ability to pay distributions to our stockholders.
Changes in laws or regulations governing our operations, changes in the interpretation thereof or newly enacted laws or regulations and any failure by us to comply with these laws or regulations, could require changes to certain of our business practices, negatively impact our operations, cash flow or financial condition, impose additional costs on us, subject us to increased competition or otherwise adversely affect our business.
The laws and regulations governing our operations, as well as their interpretation, may change from time to time, and new laws and regulations may be enacted. Accordingly, any change in these laws or regulations, changes in their interpretation, or newly enacted laws or regulations and any failure by us to comply with these laws or regulations, could require changes to certain of our business practices, negatively impact our operations, cash flow or financial condition, impose additional costs on us or otherwise adversely affect our business. For example, from time to time the market for real estate debt transactions has been adversely affected by a decrease in the availability of senior and subordinated financing for transactions, in part in response to regulatory pressures on providers of financing to reduce or eliminate their exposure to such transactions. Furthermore, if
regulatory capital requirements-whether under the Dodd-Frank Act, Basel III (i.e., the framework for a comprehensive set of capital and liquidity standards for internationally active banking organizations, which was adopted in June 2011 by the Basel Committee on Banking Supervision, an international body comprised of senior representatives of bank supervisory authorities and central banks from 27 countries, including the United States) or other regulatory action-are imposed on private lenders that provide us with funds, or were to be imposed on us, they or we may be required to limit, or increase the cost of, financing they provide to us or that we provide to others. Among other things, this could potentially increase our financing costs, reduce our ability to originate or acquire loans and reduce our liquidity or require us to sell assets at an inopportune time or price.
Various laws and regulations currently exist that restrict the investment activities of banks and certain other financial institutions but do not apply to us, which we believe creates opportunities for us to participate in certain investments that are not available to these more regulated institutions. Any deregulation of the financial industry, including by amending the Dodd-Frank Act, may decrease the restrictions on banks and other financial institutions and would create more competition for investment opportunities that were previously not available to the financial industry. For example, in 2018, a bill was signed into law that eased the regulation and oversight of certain banks under the Dodd-Frank Act. See “—Risks“Risks Related to Our Lending and Investment Activities—We operate in a competitive market for lending and investment opportunities, and competition may limit our ability to originate or acquire desirable loans and investments or dispose of assets we target and could also affect the yields of these assets and have a material adverse effect on our business, financial condition and results of operations.” Efforts by the current administration could have further impacts on our industry if previously enacted laws are amended or if new legislative or regulatory reforms are adopted. In addition, the change in administration has led and will lead to leadership changes at a number of U.S. federal regulatory agencies with oversight over the U.S. financial services industry. This poses uncertainty with respect to such agencies’ policy priorities and may lead to increased regulatory enforcement activity in the financial services industry. Although there is a substantial lack of clarity regarding the likelihood, timing and details of potential changes or reforms by the new administration and U.S. Congress, such changes or reforms may impose additional costs on our current or future investments, require the attention of senior management or result in other limitations on our business or investments. We are unable to predict at this time the effect of any such reforms.
ThereIn recent years, there has been increasing commentary amongst regulators and intergovernmental institutions on the role of nonbank institutions in providing credit and, particularly, so-called “shadow banking,” a term generally taken to refer to credit intermediation involving entities and activities outside the regulated banking system. For example, in August 2013, the Financial Stability Board has issued a policy framework for strengthening oversight and regulation of “shadow banking” entities. The report outlined initial steps to define the scope of the shadow banking system and proposed general governing principles for a monitoring and regulatory framework. A number of other regulators, such as the Federal Reserve, and international organizations, such as the International Organization of Securities Commissions, are studying the shadow banking system. At this time, itIt is too earlynot possible to assess whether any rules or regulations will be proposed or to what extent any finalized rules or regulations will have on the nonbank lending market. If rules or regulations were to extend to us or our affiliates the regulatory and supervisory requirements, such as capital and liquidity standards, currently applicable to banks, then the regulatory and operating costs associated therewith could adversely impact the implementation of our investment strategy and our returns. In an extreme eventuality, it is possible that such regulations could render the continued operation of our company unviable.
In the United States, the process established by the Dodd-Frank Act for designation of systemically important nonbank firms has provided a means for ensuring that the perimeter of prudential regulation can be extended as appropriate to cover large shadow banking institutions. The Dodd-Frank Act established the Financial Stability Oversight Council (the “FSOC”), which is comprised of representatives of all the major U.S. financial regulators, to act as the financial system’s systemic risk regulator. The FSOC has the authority to review the activities of nonbank financial companies predominantly engaged in financial activities and designate those companies as “systematically important financial institutions” (“SIFIs”) for supervision by the Federal Reserve. Such designation is applicable to companies where material distress or failure could pose risk to the financial stability of the United States. On December 18, 2014, the FSOC released a notice seeking public comment on the potential risks posed by aspects of the asset management industry, including whether asset management products and activities may pose potential risks to the U.S. financial system in the areas of liquidity and redemptions, leverage, operational functions, and resolution, or in other areas. On April 18, 2016, the FSOC released an update on its multi-year review of asset management products and activities and created an interagency working group to assess potential risks associated with certain leveraged funds. On December 4, 2019, the FSOC issued final guidance regarding the FSOC’s procedures for designating nonbank financial companies as SIFIs. This guidance implemented a number of reforms to the FSOC’s prior SIFI designation approach by shifting from an “entity-based” approach to an “activities-based” approach whereby the FSOC will primarily focus on regulating activities that pose systematic risk to the financial stability of the United States, rather than designations of individual firms. Under the guidance, designation of a nonbank financial company as a SIFI would only occur if the FSOC determined that the expected benefits justify the expected costs of the designation. While the impact of this guidance cannot be known at this time, increased regulation of nonbank credit extension could negatively impact our operations, cash flows or financial condition, impose additional costs on us, intensify the regulatory supervision of us or otherwise adversely affect our business.
Changes in laws or regulations governing the operations of borrowers could affect our returns with respect to those borrowers.
Government counterparties or agencies may have the discretion to change or increase regulation of a borrower’s operations, or implement laws or regulations affecting a borrower’s operations, separate from any contractual rights it may have. A borrower
could also be materially and adversely affected as a result of statutory or regulatory changes or judicial or administrative interpretations of existing laws and regulations that impose more comprehensive or stringent requirements on such company. Governments have considerable discretion in implementing regulations, for example, the possible imposition or increase of taxes on income earned by a borrower or gains recognized by us on our investment in such borrower, that could impact a borrower’s business as well as our return on our investment with respect to such borrower. Changes in government rules, regulations and fiscal policies, including increases in property taxes, changes in zoning laws and increasing costs to comply with environmental law could increase operating expenses for our borrowers. Likewise, changes in rent control or rent stabilization laws or other residential landlord/tenant laws could result in lower revenue growth or significant unanticipated expenditures for our borrowers. For example, in 2016, voters in Mountain View, California passed a referendum that limits rent increases on existing tenants (but not on new move-ins) in communities built before 1995. These initiatives and any other future enactments of rent control or rent stabilization laws or other laws regulating multifamily housing may reduce our borrowers’ rental revenues or increase their operating costs. Such laws and regulations may limit our borrowers’ ability to charge market rents, increase rents, evict tenants or recover increases in their operating costs, which may, in turn, impact our return on our investment with respect to such borrowers.
The impacts of climate-related initiatives atClimate change, climate change-related initiative and regulation and the U.S. federalincreased focus on environmental, social and state levels remain uncertain at this time but could result in increased operating costs for usgovernance issues, may adversely affect our business and financial results and damage our borrowers.reputation.
Government authoritiesRecently, there has been growing concern from advocacy groups, government agencies and various interest groups are promoting laws andthe general public over the effects of climate change on the environment. Transition risks, such as government restrictions, standards or regulations that could limitintended to reduce greenhouse gas or GHG, emissions due to concerns over contributions toand potential climate change. The United States Environmental Protection Agency, or EPA, has moved to regulate GHG emissions using its existing authority under the Clean Air Act. Moreover, certain statechange impacts, are emerging and regional programs are being implemented to require reductions in GHG emissions. Any additional taxation or regulation of energy use, including as a result of (i) the regulations that EPA has proposed or may proposeincrease in the future (ii) state programsin the form of restrictions or additional requirements on the development of commercial real estate. Such restrictions and regulations,requirements could increase our costs or (iii) renewed GHG legislative effortsrequire additional technology and capital investment by future Congresses,our borrowers, which could resultadversely affect our results of operations. This is a particular concern in increased operatingthe western and northeastern United States, where some of the most extensive and stringent environmental laws and building construction standards in the U.S. have been enacted, and where we have properties securing our investment portfolio.
Additionally, ESG and other sustainability matters and our response to these matters could harm our business, including in areas such as diversity, equity and inclusion, human rights, climate change and environmental stewardship, support for local communities, corporate governance and transparency and considering ESG factors in our investment processes. Increasing governmental, investor and societal attention to ESG matters, including expanding mandatory and voluntary reporting, diligence, and disclosure on topics such as climate change, human capital, labor and risk oversight, could expand the nature,
scope, and complexity of matters that we are required to control, assess and report. These factors may alter the environment in which we do business and may increase the ongoing costs for usof compliance and adversely impact our results of operations and cash flows. If we are unable to adequately address such ESG matters or we or our borrowers. Anyborrowers fail or are perceived to fail to comply with all laws, regulations, policies and related interpretations, it could negatively impact our reputation and our business results.
Further, significant physical effects of climate change including extreme weather events such increased costs couldas hurricanes or floods, can also have an adverse impact on certain of our borrowers’ properties. As the financial conditioneffects of climate change increase, we expect the frequency and impact of weather and climate related events and conditions to increase as well. While the geographic distribution of our portfolio somewhat limits our physical climate risk, some physical risk is inherent in the properties of our borrowers, particularly in certain borrowers’ locations and their abilityin the unknown potential for extreme weather or other events that could occur related to meet their loan obligations to us.climate change.
We are subject to risks from litigation filed by or against us.
Legal or governmental proceedings brought by or on behalf of third parties may adversely affect our financial results. Our investment activities may include activities that are hostile in nature and will subject it to the risks of becoming involved in such proceedings. The expense of defending claims against us and paying any amounts pursuant to settlements or judgments would be borne by us and would reduce net assets. Our Manager will be indemnified by us in connection with such proceedings, subject to certain conditions. Similarly, we may from time to time institute legal proceedings on behalf of ourselves or others, the ultimate outcome of which could cause us to incur substantial damages and expenses, which could have a material adverse effect on our business.
The obligations associated with being a public company require significant resources and attention from our Manager’s senior management team.
As a public company with listed equity securities, we must comply with laws, regulations and requirements, including the requirements of the Exchange Act, certain corporate governance provisions of the Sarbanes-Oxley Act of 2002 (the “Sarbanes-Oxley Act”), related regulations of the SEC and requirements of the NYSE, with which we were not required to comply as a private company. The Exchange Act requires that we file annual, quarterly and current reports with respect to our business and financial condition. The Sarbanes-Oxley Act requires, among other things, that we establish and maintain effective internal controls and procedures for financial reporting. These reporting and other obligations place significant demands on our Manager’s senior management team, administrative, operational and accounting resources and cause us to incur significant expenses. We may need to upgrade our systems or create new systems, implement additional financial and other controls, reporting systems and procedures, and create or outsource an internal audit function. If we are unable to accomplish these objectives in a timely and effective fashion, our ability to comply with the financial reporting requirements and other rules that apply to reporting companies could be impaired.
If we are unable to implement and maintain effective internal controls over financial reporting in the future, investors may lose confidence in the accuracy and completeness of our financial reports and the market price of our common stock may be negatively affected.
As a public company, we are required to maintain internal controls over financial reporting and to report any material weaknesses in such internal controls. In addition, we are required to furnish a report by management on the effectiveness of our
internal controls over financial reporting, pursuant to Section 404 of the Sarbanes-Oxley Act. Once we are no longer an emerging growth company, ourOur independent registered public accounting firm will beis required to formally attest to the effectiveness of our internal controls over financial reporting on an annual basis. The process of designing, implementing and testing the internal controls over financial reporting required to comply with this obligation is time consuming, costly and complicated. If we identify material weaknesses in our internal controls over financial reporting, if we are unable to comply with the requirements of Section 404 of the Sarbanes-Oxley Act in a timely manner or to assert that our internal controls over financial reporting is effective or if once we are no longer an emerging growth company, our independent registered public accounting firm is unable to express an opinion as to the effectiveness of our internal controls over financial reporting, investors may lose confidence in the accuracy and completeness of our financial reports and the market price of our common stock could be negatively affected. We could also become subject to investigations by the stock exchange on which our securities are listed, the SEC or other regulatory authorities, which could require additional financial and management resources.
Risks Related to Our REIT Status and Certain Other Tax Considerations
If we do not maintain our qualification as a REIT, we will be subject to tax as a regular corporation and could face a substantial tax liability.
We expect to continue to operate so as to qualify as a REIT under the Code. However, qualification as a REIT involves the application of highly technical and complex Code provisions for which only a limited number of judicial or administrative interpretations exist. Our continued qualification as a REIT will depend on our continuing ability to meet various requirements concerning, among other things, our sources of income, the nature of our investments, the amounts we distribute to our stockholders and the ownership of our stock. We also own interests in entities that have elected to be taxed as REITs. If any such entity were to fail to qualify as a REIT, it could negatively impact our ability to satisfy the REIT requirements. Notwithstanding the availability of cure provisions in the Code, various compliance requirements could be failed and could jeopardize our REIT status. Furthermore, new tax legislation, administrative guidance or court decisions, in each instance potentially with retroactive effect, could make it more difficult or impossible for us to continue to qualify as a REIT. If we fail to qualify as a REIT in any tax year, then:
•we would be taxed as a regular domestic corporation, which under current law, among other things, means being unable to deduct distributions to stockholders in computing taxable income and being subject to U.S. federal income tax on taxable income at regular corporate income tax rates;
•any resulting tax liability could be substantial and could have a material adverse effect on our book value;
•unless we were entitled to relief under applicable statutory provisions, we would be required to pay taxes as described above, and thus, our cash available for distribution to stockholders would be reduced for each of the years during which we do not qualify as a REIT and for which we had taxable income; and
•we generally would not be eligible to elect to be taxed as a REIT for the subsequent four full taxable years.
Even if we maintain our qualification as a REIT, we may incur tax liabilities that would reduce our cash available for distribution to stockholders.
Even if we maintain our qualification as a REIT, we may become subject to U.S. federal income taxes and related state and local taxes, and foreign taxes. For example, net income from the sale of properties that are “dealer” properties sold by a REIT (a “prohibited transaction” under the Code) will be subject to a 100% tax. Our distributions may not be sufficient to avoid excise taxes applicable to REITs. Similarly, if we were to fail an income or asset test (and did not lose our REIT status because such failure was due to reasonable cause and not willful neglect), we would have to pay a penalty tax, which could be material. We also may decide to retain net capital gain we earn from the sale or other disposition of our investments and pay income tax directly on such income. In that event, our stockholders would be treated as if they earned that income and paid the tax on it directly. However, stockholders that are tax-exempt, such as charities or qualified pension plans, would have no benefit from their deemed payment of such tax liability unless they file U.S. federal income tax returns and seek a refund of such tax on such return. We also may be subject to state and local or foreign taxes on our income or property, including franchise, payroll, mortgage recording and transfer taxes, either directly or at the level of the other companies through which we indirectly own assets. For example, our domestic taxable REIT subsidiaries are subject to full U.S. federal, state, local and foreign corporate-level income taxes. Any taxes we pay directly or indirectly will reduce our cash available for distribution to stockholders.
Complying with REIT requirements may cause us to forego otherwise attractive opportunities and limit our expansion opportunities.
In order to qualify as a REIT for U.S. federal income tax purposes, we must continually satisfy tests concerning, among other things, our sources of income, the nature of our investments in real estate and related assets, the amounts we distribute to our stockholders and the ownership of our stock. We may also be required to make distributions to stockholders at disadvantageous times or when we do not have funds readily available for distribution.distribution, requiring us to borrow funds or sell a portion of our investments at disadvantageous prices. Thus, compliance with REIT requirements may hinder our ability to operate solely on the basis of maximizing profits.
Complying with REIT requirements may force us to liquidate or restructure otherwise attractive investments.
In order to qualify as a REIT, we must also ensure that at the end of each calendar quarter, at least 75% of the value of our assets consists of cash, cash items, government securities and qualified REIT real estate assets. The remainder of our investments in securities cannot include more than 10% of the outstanding voting securities of any one issuer or 10% of the total value of the outstanding securities of any one issuer unless we and such issuer jointly elect for such issuer to be treated as a taxable REIT subsidiary under the Code. The total value of all of our investments in taxable REIT subsidiaries cannot exceed 20% of the value of our total assets. In addition, no more than 5% of the value of our assets can consist of the securities of any one issuer other than a taxable REIT subsidiary, and no more than 25% of our assets can consist of debt of “publicly offered” REITs (i.e., REITs that are required to file annual and periodic reports with the SEC under the Exchange Act) that is not secured by real property or interests in real property. If we fail to comply with these requirements, we must dispose of a portion of our assets or otherwise come into compliance within 30 days after the end of the calendar quarter in order to avoid losing our REIT status and suffering adverse tax consequences. As a result, we may be required to liquidate or restructure otherwise attractive investments. These actions could have the effect of reducing our income and amounts available for distribution to our stockholders.
Complying with REIT requirements may limit our ability to hedge effectively and may cause us to incur tax liabilities.
The REIT provisions of the Code substantially limit our ability to hedge liabilities and assets. Any income from a properly identified hedging transaction we enter into to manage risk of interest rate changes with respect to borrowings made or to be made to acquire or carry real estate assets or to manage risk of currency fluctuations with respect to our REIT qualifying income, or to offset any such hedging transaction, does not constitute “gross income” for purposes of the 75% or 95% gross income tests that we must satisfy in order to maintain our qualification as a REIT. To the extent that we enter into other types of hedging transactions, the income from those transactions is likely to be treated as non-qualifying income for purposes of both of these gross income tests. As a result of these rules, we intend to limit our use of advantageous hedging techniques or implement those hedges through a taxable REIT subsidiary. This could increase the cost of our hedging activities because our taxable REIT subsidiaries would be subject to tax on gains or expose us to greater risks associated with changes in interest rates than we would otherwise want to bear. In addition, losses in our taxable REIT subsidiaries generally will not provide any tax benefit, except for being carried forward against future taxable income in the taxable REIT subsidiaries.
Our charter does not permit any person (including certain entities treated as individuals for this purpose) to own more than 9.8% of any class or series of our outstanding capital stock, and attempts to acquire shares of any class or series of our capital stock in excess of this 9.8% limit would not be effective without an exemption from those prohibitions by our board of directors.
To maintain our qualification as a REIT, not more than 50% in value of our outstanding capital stock may be owned, directly or indirectly, by five or fewer individuals (as defined in the Code to include certain entities). Our charter provides that no person may beneficially or constructively own more than 9.8% in value or in number of shares, whichever is more restrictive, of any class or series of our outstanding capital stock, provided that KKR and certain of its affiliates are excluded from this limitation. Our board of directors, in its sole discretion, may exempt (prospectively or retroactively) a person from this limitation if it obtains such representations, covenants and undertakings as it deems appropriate to conclude that granting the exemption will not cause us to lose our status as a REIT. The constructive ownership rules under the Code and our charter are complex and may cause shares of our outstanding stock owned by a group of related individuals or entities to be deemed to be constructively owned by one individual. As a result, the acquisition of less than 9.8% of any class or series of our outstanding capital stock by an individual or entity could cause an individual to own constructively in excess of 9.8% of such class or series of our outstanding capital stock, and thus violate the ownership limit. Any attempted transfer of our capital stock that, if effective, would result in a violation of the ownership limit, will cause the number of shares causing the violation to automatically be transferred to a trust for the exclusive benefit of one or more charitable beneficiaries designated by us and the intended transferee will acquire no rights in the shares. Despite these restrictions, it is possible that there could be five or fewer
individuals who own more than 50% in value of our outstanding capital stock, which could cause us to fail to continue to qualify as a REIT. In addition, there can be no assurance that our board of directors, as permitted in our charter, will not decrease this ownership limit in the future (provided, however, that a decreased stock ownership limit will not be effective for any person whose ownership of our stock is in excess of the decreased ownership limit until such person’s ownership percentage of our stock equals or falls below the decreased ownership limit).
The ownership limit could have the effect of discouraging a takeover or other transaction in which holders of our common stock might receive a premium for their shares over the then prevailing market price or which holders might believe to be otherwise in their best interests (and even if such change in control would not reasonably jeopardize our REIT status). The exemptions to
the ownership limit granted to date may limit our board of directors’ power to increase the ownership limit or grant further exemptions in the future.
We may choose to make distributions in the form of shares of our own stock, in which case stockholders may be required to pay income taxes without receiving any cash dividends.
In connection with our qualification as a REIT, we are required to annually distribute to our stockholders at least 90% of our REIT taxable income (which does not equal net income, as calculated in accordance with GAAP), determined without regard to the deduction for dividends paid and excluding net capital gain. To satisfy this requirement, we may make distributions that are payable in cash and/or shares of our common stock at the election of each stockholder. As a publicly offered REIT, as long as at least 20% of the total dividend is available in cash and certain other requirements are satisfied, the IRS will treat the stock distribution as a dividend (to the extent applicable rules treat such distribution as being made out of our earnings and profits). Pursuant to recently releasedThis threshold has been temporarily reduced in the past and may be reduced in the future by IRS guidance, this threshold is reduced from 20% to 10% for distributions declared by a publicly offered REIT on or after November 1, 2021 and on or before June 30, 2022.guidance. Taxable stockholders receiving such distributions will be required to include the full amount of such distributions as ordinary dividend income to the extent of our current or accumulated earnings and profits, as determined for U.S. federal income tax purposes. As a result, U.S. holders may be required to pay income taxes with respect to such distributions in excess of the cash portion of the distribution received. Accordingly, U.S. holders receiving a distribution of our shares may be required to sell shares received in such distribution or may be required to sell other stock or assets owned by them, at a time that may be disadvantageous, in order to satisfy any tax imposed on such distribution. If a U.S. holder sells the stock that it receives as part of the distribution in order to pay this tax, the sales proceeds may be less than the amount it must include in income with respect to the distribution, depending on the value of our shares at the time of the sale. Furthermore, with respect to certain non-U.S. holders, we may be required to withhold U.S. tax with respect to such distribution, including in respect of all or a portion of such distribution that is payable in stock, by withholding or disposing of part of the shares included in such distribution and using the proceeds of such disposition to satisfy the withholding tax imposed. In addition, if a significant number of our stockholders determine to sell shares of our common stock in order to pay taxes owed on dividend income, such sale may put downward pressure on the market price of our common stock.
Dividends payable by REITs do not qualify for the reduced tax rates available for some dividends.
Under current law, the maximum U.S. federal income tax rate applicable to qualified dividend income payable to certain non-corporate U.S. holders is 20%. Dividends payable by REITs, however, generally are not eligible for the reduced qualified dividend rates. For taxable years beginning before January 1, 2026, however, non-corporate taxpayers may deduct up to 20% of certain pass-through business income, including “qualified REIT dividends” (generally, dividends received by a REIT shareholder that are not designated as capital gain dividends or qualified dividend income), subject to certain limitations, resulting in an effective maximum U.S. federal income tax rate of 29.6% on such income. Although the reduced U.S. federal income tax rate applicable to qualified dividend income does not adversely affect the taxation of REITs or dividends payable by REITs, the more favorable rates applicable to regular corporate qualified dividends and the reduced corporate tax rate could cause certain non-corporate investors to perceive investments in REITs to be relatively less attractive than investments in the stocks of non-REIT corporations that pay dividends, which could adversely affect the value of the shares of REITs, including our common stock.
Our taxable income may be greater than our cash flow available for distribution, including as a result of our investments in certain debt instruments, causing us to recognize “phantom income” for U.S. federal income tax purposes, and certain modifications of debt instruments by us could cause the modified debt to not qualify as a good REIT asset, thereby jeopardizing our REIT qualification.
To qualify as a REIT, we generally must distribute annually to our stockholders at least 90% of our net taxable income, determined without regard to the dividends-paid deduction and excluding net capital gains. We will be subject to regular
corporate income taxes on any undistributed REIT taxable income each year, including net capital gains. Additionally, we will be subject to a 4% nondeductible excise tax on any amount by which distributions paid by us in any calendar year are less than the sum of 85% of our ordinary income, 95% of our capital gain net income and 100% of our undistributed income from previous years.
Our taxable income may substantially exceed our net income as determined based on GAAP, or differences in timing between the recognition of taxable income and the actual receipt of cash may occur. For example, we may acquire assets, including debt securities requiring us to accrue OIDoriginal issue discount or recognize market discount income, that generate taxable income in excess of economic income or in advance of the corresponding cash flow from the assets referred to as “phantom income.” In addition, if a borrower with respect to a particular debt instrument encounters financial difficulty rendering it unable to pay
stated interest as due, we may nonetheless be required to continue to recognize the unpaid interest as taxable income with the effect that we will recognize income but will not have a corresponding amount of cash available for distribution to our stockholders. Finally, we may be required under the terms of indebtedness that we incur to use cash received from interest payments to make principal payments on that indebtedness, with the effect of recognizing income but not having a corresponding amount of cash available for distribution to our stockholders. Also, in certain circumstances, our ability to deduct interest expenses for U.S. federal income tax purposes may be limited.
As a result of the foregoing, we may generate less cash flow than taxable income in a particular year and find it difficult or impossible to meet the REIT distribution requirements in certain circumstances. In such circumstances, we may be required to (a) sell assets in adverse market conditions, (b) borrow on unfavorable terms, (c) distribute amounts that would otherwise be used for future acquisitions or used to repay debt, or (d) make a taxable distribution of our common stock as part of a distribution in which stockholders may elect to receive shares of our common stock or (subject to a limit measured as a percentage of the total distribution) cash, in order to comply with the REIT distribution requirements.
We may agree to modify the terms of distressed and other debt instruments that we hold. If the amendments to the outstanding debt are “significant modifications” under the applicable U.S. Treasury regulations, the modified debt may be considered to have been reissued to us in a debt-for-debt taxable exchange with the borrower. In certain circumstances, this deemed reissuance may prevent the modified debt from qualifying as a good REIT asset if the underlying security has declined in value and could cause us to recognize income to the extent the principal amount of the modified debt exceeds our adjusted tax basis in the unmodified debt.
The failure of a mezzanine loan to qualify as a real estate asset could adversely affect our ability to qualify as a REIT.
We originate and acquire mezzanine loans, for which the IRS has provided a safe harbor but not rules of substantive law. Pursuant to the safe harbor, if a mezzanine loan meets certain requirements, it will be treated by the IRS as a real estate asset for purposes of the REIT asset tests, and interest derived from the mezzanine loan will be treated as qualifying mortgage interest for purposes of the REIT 75% income test. Our mezzanine loans may not meet all of the requirements of this safe harbor. In the event we own a mezzanine loan that does not meet the safe harbor, the IRS could challenge such loan’s treatment as a real estate asset for purposes of the REIT asset and income tests and, if such a challenge were sustained, we could fail to qualify as a REIT, unless we are able to qualify for a statutory REIT “savings” provision, which may require us to pay a significant penalty tax to maintain our REIT qualification.
Our investments in certain loans may require us to make estimates about the fair value of real property improvements that may be challenged by the IRS.
We have invested and may invest in mortgage loans and mezzanine loans in which the underlying real property was under construction. Such mortgage loans (and mezzanine loans, to the extent they are otherwise qualifying) generally will be treated as real estate assets for purposes of the REIT asset tests, and interest derived from such loans will be treated as qualifying mortgage interest for purposes of the REIT 75% income test, provided that the “loan value” of the real property securing the loan is equal to or greater than the highest outstanding principal amount of the loan during any taxable year. With respect to construction loans, the value of the real property securing the loan is the fair value of the land plus the reasonably estimated cost of improvements or developments (other than personal property) that secure the loan and that are to be constructed from the proceeds of the loan. The IRS could challenge our estimates as to the loan value of the real property associated with such construction loans. If such a challenge were sustained and all or a portion of the loan was not treated as a real estate asset, we could fail to qualify as a REIT, unless we are able to qualify for a statutory REIT “savings” provision, which may require us to pay a significant penalty tax to maintain our REIT qualification.
We may fail to qualify as a REIT if the IRS successfully challenges our characterization for U.S. federal income tax purposes of our mezzanine loans or preferred equity investments.
We have invested and may invest in the future in preferred equity investments and mezzanine loans. There is limited case law and administrative guidance addressing whether instruments similar to our mezzanine loans and preferred equity investments will be treated as equity or debt for U.S. federal income tax purposes. We typically do not anticipate obtaining private letter rulings from the IRS or opinions of counsel on the characterization of those investments for U.S. federal income tax purposes. If the IRS successfully recharacterizes a mezzanine loan or preferred equity investment as equity for U.S. federal income tax purposes, we would be treated as owning the assets held by the partnership or limited liability company that issued the security and we would be treated as receiving our proportionate share of the income of that entity. If that partnership or limited liability company owned nonqualifying assets or earned nonqualifying income, we may not be able to satisfy all of the REIT income or
asset tests. Alternatively, if we are treating a mezzanine loan or preferred equity investment as equity for U.S. federal income tax purposes and the IRS successfully recharacterizes the investment as debt, then that investment may be treated as a nonqualifying asset for purposes of the 75% asset test and as producing nonqualifying income for 75% gross income test. In addition, such an investment may be subject to the 10% value test and the 5% asset tests. Accordingly, we could fail to qualify as a REIT if the IRS successfully challenges our characterization of our mezzanine loans or preferred equity investments for U.S. federal income tax purposes unless we are able to qualify for a statutory REIT “savings” provision, which may require us to pay a significant penalty tax to maintain our REIT qualification.
The tax on prohibited transactions will limit our ability to engage in transactions, including certain methods of securitizing or syndicating mortgage loans that would be treated as sales for U.S. federal income tax purposes.
A REIT’s net income from prohibited transactions is subject to a 100% tax with no offset for losses. In general, prohibited transactions are sales or other dispositions of property, other than foreclosure property, but including mortgage loans, held primarily for sale to customers in the ordinary course of business. We might be subject to this tax if we dispose of, securitize or syndicate loans in a manner that was treated as a sale of the loans, if we frequently buy and sell securities in a manner that is treated as dealer activity with respect to such securities for U.S. federal income tax purposes. Therefore, in order to avoid the prohibited transactions tax, we may choose to engage in certain sales of assets through a taxable REIT subsidiary and not at the REIT level, and may limit the structures we utilize for our securitization transactions, even though the sales or structures might otherwise be beneficial to us.
The failure of assets subject to repurchase agreements to qualify as real estate assets could adversely affect our ability to qualify as a REIT.
We have entered into financing arrangements that are structured as sale and repurchase agreements pursuant to which we nominally sell certain of our assets to a counterparty and simultaneously enter into an agreement to repurchase these assets at a later date in exchange for a purchase price. Economically, these agreements are financings that are secured by the assets sold pursuant thereto. We believe that we are treated for REIT asset and income test purposes as the owner of the assets that are the subject of such sale and repurchase agreements notwithstanding that such agreements may transfer record ownership of the assets to the counterparty during the term of the agreement. It is possible, however, that the IRS could assert that we do not own the assets during the term of the related sale and repurchase agreement, in which case we could fail to qualify as a REIT.
Liquidation of assets may jeopardize our REIT qualification.
To qualify as a REIT, we must comply with requirements regarding our assets and our sources of income. If we are compelled to liquidate our investments to repay obligations to our lenders, we may be unable to comply with these requirements, ultimately jeopardizing our qualification as a REIT, or we may be subject to a 100% tax on any resultant gain if we sell assets that are treated as dealer property or inventory.
Certain financing activities may subject us to U.S. federal income tax and could have negative tax consequences for our stockholders.
We may enter into securitization transactions and other financing transactions that could result in us, or a portion of our assets, being treated as a taxable mortgage pool for U.S. federal income tax purposes. If we enter into such a transaction in the future, we could be taxable at the highest corporate income tax rate on a portion of the income arising from a taxable mortgage pool, referred to as “excess inclusion income,” that is allocable to the percentage of our shares held in record name by disqualified organizations (generally tax-exempt entities that are exempt from the tax on unrelated business taxable income, such as state
pension plans and charitable remainder trusts and government entities). In that case, we could reduce distributions to such stockholders by the amount of tax paid by us that is attributable to such stockholder’s ownership.
If we were to realize excess inclusion income, IRS guidance indicates that the excess inclusion income would be allocated among our stockholders in proportion to the dividends paid. Excess inclusion income cannot be offset by losses of a stockholder. If the stockholder is a tax-exempt entity and not a disqualified organization, then this income would be fully taxable as unrelated business taxable income under Section 512 of the Code. If the stockholder is a foreign person, it would be subject to U.S. federal income tax at the maximum tax rate and withholding will be required on this income without reduction or exemption pursuant to any otherwise applicable income tax treaty.
Our qualification as a REIT may be dependent on the accuracy of legal opinions or advice rendered or given or statements by the issuers of assets that we acquire, and the inaccuracy of any such opinions, advice or statements may adversely affect our REIT qualification and result in significant corporate-level tax.
When purchasing securities, we may rely on opinions or advice of counsel for the issuer of such securities, or statements made in related offering documents, for purposes of determining whether such securities represent debt or equity securities for U.S. federal income tax purposes, the value of such securities, and also to what extent those securities constitute qualified real estate assets for purposes of the REIT asset tests and produce income that qualifies under the 75% gross income test. The inaccuracy of any such opinions, advice or statements may adversely affect our ability to qualify as a REIT and result in significant corporate-level tax.
Any taxable REIT subsidiaries owned by us are subject to corporate-level taxes and our dealings with our taxable REIT subsidiaries may be subject to 100% excise tax.
A REIT may own up to 100% of the stock of one or more taxable REIT subsidiaries. Both the subsidiary and the REIT must jointly elect to treat the subsidiary as a taxable REIT subsidiary. A corporation of which a taxable REIT subsidiary directly or indirectly owns more than 35% of the voting power or value of the stock will automatically be treated as a taxable REIT subsidiary. Overall, no more than 20% of the gross value of a REIT’s assets may consist of stock or securities of one or more taxable REIT subsidiaries. The value of our interests in and, therefore, the amount of assets held in a taxable REIT subsidiary may also be restricted by our need to qualify for an exclusion from regulation as an investment company under the Investment Company Act. A taxable REIT subsidiary will pay U.S. federal, state and local income tax at regular corporate rates on any income that it earns. In addition, the taxable REIT subsidiary rules limit the deductibility of amounts paid or accrued by a taxable REIT subsidiary to its parent REIT to assure that the taxable REIT subsidiary is subject to an appropriate level of corporate taxation. The rules also impose a 100% excise tax on certain transactions between a taxable REIT subsidiary and its parent REIT that are not conducted on an arm’s length basis.
Domestic taxable REIT subsidiaries that we own or may form will pay U.S. federal, state and local income tax on their taxable income, and their after-tax net income will be available for distribution to us but will not be required to be distributed to us, unless necessary to maintain our REIT qualification. In certain circumstances, the ability of our taxable REIT subsidiaries to deduct interest expenses for U.S. federal income tax purposes may be limited. While we plan to monitor the aggregate value of the securities of our taxable REIT subsidiaries and intend to conduct our affairs so that such securities will represent less than 20% of the value of our total assets, there can be no assurance that we will be able to comply with the taxable REIT subsidiary limitation or avoid the application of the 100% excise tax discussed above in all market conditions.
Failure of our subsidiary REIT to qualify as a REIT could adversely impact our ability to qualify as a REIT.
We indirectly own an interest in an entity that has elected to be taxed as a REIT under the U.S. federal income tax laws, and may own interests in additional entities that elect to be taxed as REITs in the future (together, “Subsidiary REITs”). Subsidiary REITs are subject to the various REIT qualification requirements that are applicable to us. If any Subsidiary REIT were to fail to qualify as a REIT, then (i) that Subsidiary REIT would become subject to regular U.S. federal, state, and local corporate income tax, (ii) our interest in such Subsidiary REIT would cease to be a qualifying asset for purposes of the REIT asset tests, and (iii) it is possible that we would fail certain of the REIT asset tests, in which event we also would fail to maintain our qualification as a REIT unless we could avail ourselves of certain relief provisions. While we believe that the our Subsidiary REIT has qualified as a REIT under the Code, we have joined the Subsidiary REIT in filing a “protective” taxable REIT subsidiary election under Section 856(l) of the Code. We cannot assure you that such “protective” taxable REIT subsidiary elections would be effective to avoid adverse consequences to us. Moreover, even if the “protective” election were to be effective, the Subsidiary REIT would be subject to regular corporate income tax, and we cannot assure you that we would not fail to satisfy the requirement that not more than 20% of the value of our total assets may be represented by the securities of one or more taxable REIT subsidiaries.
We may be subject to adverse legislative or regulatory tax changes that could increase our tax liability, reduce our operating flexibility and reduce the price of our common stock.
The present U.S. federal income tax treatment of REITs may be modified, possibly with retroactive effect, by legislative, judicial, or administrative action at any time, which could affect the U.S. federal income tax treatment of an investment in us. The U.S. federal income tax rules dealing with REITs constantly are under review by persons involved in the legislative process, the IRS, and the U.S. Treasury, which results in statutory changes as well as frequent revisions to regulations and interpretations. Several recent proposals have been made that would make substantial changes to theWe cannot predict when or if any new U.S. federal income tax laws generally. We cannot predict whetherlaw, regulation or administrative interpretation,
or any of these proposed changesamendment to any existing U.S. federal income tax law, regulation or administrative interpretation, will be adopted, promulgated or become law.effective and any such law, regulation or interpretation may take effect retroactively. Future revisions in the U.S. federal tax laws and interpretations thereof could affect or cause us to change our investments and commitments and affect the tax considerations of an investment in us.
Any such revisions could have an adverse effect on an investment in our shares or on the market value or the resale potential of our assets. You are urged to consult with your tax advisor with respect to the impact of such revisions on your investment in our shares and the status of legislative, regulatory or administrative developments and proposals and their potential effect on an investment in our shares.
On August 16, 2022, President Biden signed into law the Inflation Reduction Act of 2022, or the IRA. The IRA includes numerous tax provisions that impact corporations, including the implementation of a corporate alternative minimum tax as well as a 1% excise tax on certain stock repurchases and economically similar transactions. However, REITs are excluded from the definition of an “applicable corporation” and therefore are not subject to the corporate alternative minimum tax. Additionally, the 1% excise tax specifically does not apply to stock repurchases by REITs. Any taxable REIT subsidiaries of ours operate as standalone corporations and therefore could be adversely affected by the IRA. We will continue to analyze and monitor the application of the IRA to our business; however, the effect of these changes on the value of our assets, shares of our common stock or market conditions generally, is uncertain.
Although REITs generally receive certain tax advantages compared to entities taxed as regular corporations, it is possible that future legislation would result in a REIT having fewer tax advantages, and it could become more advantageous for a company that invests in real estate to elect to be treated for U.S. federal income tax purposes as a corporation. Our charter provides our board of directors with the power, under certain circumstances, to revoke or otherwise terminate our REIT election and cause us to be taxed as a regular corporation, without the vote of our stockholders. Our board of directors has duties to us and could only cause such changes in our tax treatment if it determines in good faith that such changes are in our best interest.
Structural, Organizational and Operational Risks
Operational risks, including the risk of cyberattacks, may disrupt our business, result in losses or limit our growth.
We rely heavily on KKR’s financial, accounting, communications and other data processing systems. Such systems may fail to operate properly or become disabled as a result of tampering or a breach of the network security systems or otherwise. In addition, such systems are from time to time subject to cyberattacks. Breachescyberattacks, which may continue to increase in sophistication and frequency in the future. Attacks of our network security systems and those of KKR, our affiliates and service providers could involve, and in some instances have in the past involved, attacks that are intended to obtain unauthorized access to our proprietary information or personal identifying information of our stockholders, destroy data or disable, degrade or sabotage our systems, or divert or otherwise steal funds, often through the introduction of "phishing" attempts and other forms of social engineering, computer viruses cyberattacks and other meansmalicious code.
Our information and technology systems as well as those of KKR, its portfolio entities and other related parties, such as service providers, may be vulnerable to damage or interruption from cybersecurity breaches, computer viruses or other malicious code, network failures, computer and telecommunication failures, infiltration by unauthorized persons and other security breaches, usage errors by their respective professionals or service providers, power, communications or other service outages and catastrophic events such as fires, tornadoes, floods, hurricanes and earthquakes. Cyberattacks, ransomware and other security threats could originate from a wide variety of sources, including cyber criminals, nation state hackers, hacktivists and other unknown third parties outside the firm. Cyberattacks and other security threats could also originate from the malicious or accidental acts of insiders. There has been an increase in the frequency and sophistication of the cyber and security threats KKR faces, with attacks ranging from those common to businesses generally to those that are more advanced and persistent, which may target KKR because KKR holds a significant amount of confidential and sensitive information about its and our investors, its portfolio companies and potential investments. As a result, we and KKR may face a heightened risk of a security breach or disruption with respect to this information. If successful, these types of attacks on our or KKR’s network or other systems could have a material adverse effect on our business and results of operations, due to, among other things, the loss of investor or proprietary data, interruptions or delays in the operation of our business and damage to our reputation. There can be no assurance that measures KKR takes to ensure the integrity of its systems will provide protection, especially because cyberattack techniques used change frequently or are not recognized until successful.
If unauthorized parties gain access to such information and technology systems, they may be able to steal, publish, delete or modify private and sensitive information, including nonpublic personal information related to shareholders (and their beneficial
owners) and material nonpublic information. Although we and KKR have implemented, and our service providers may implement, various measures to manage risks relating to these types of events, such systems could prove to be inadequate and, if compromised, could become inoperable for extended periods of time, cease to function properly or fail to adequately secure private information. Neither we nor KKR control the cyber security plans and systems put in place by third party service providers, and such third party service providers may have limited indemnification obligations to KKR and us, each of which could be negatively impacted as a result. Breaches such as those involving covertly introduced malware, impersonation of authorized users and industrial or other espionage may not be identified even with sophisticated prevention and detection systems, potentially resulting in further harm and preventing them from being addressed appropriately. The failure of these systems or of disaster recovery plans for any reason could cause significant interruptions in KKR’s, its affiliates’ or our operations and result in a failure to maintain the security, confidentiality or privacy of sensitive data, including personal information relating to shareholders, material nonpublic information and the intellectual property and trade secrets and other sensitive information in the possession of KKR and us. We and our Manager’s employees have beenKKR could be required to make a significant investment to remedy the effects of any such failures, harm to their reputations, legal claims that they and expecttheir respective affiliates may be subjected to, continue to be the targetregulatory action or enforcement arising out of fraudulent calls, emailsapplicable privacy and other forms of activities. laws, adverse publicity and other events that may affect their business and financial performance.
The costs related to cyber or other security threats or disruptions may not be fully insured or indemnified by other means. In addition, cybersecurity has become a top priority for regulators around the world,world. In addition, cybersecurity has become a top priority for regulators around the world. The SEC recently proposed amendments to its rules related to cybersecurity risk management, strategy, governance, and someincident reporting, and many jurisdictions in which we and KKR operate have, or are considering adopting, laws and regulations relating to data privacy, cybersecurity and protection of personal information, including the General Data Protection Regulation in the European Union that went into effect in May 2018 and the California Consumer Privacy Act that became effective on January 1, 2020 and is being amended by the California Privacy Rights Act, which became effective on January 1, 2023. Virginia, Colorado, Utah and Connecticut recently enacted similar data privacy legislation that will go into effect in 2023. Some jurisdictions have also enacted laws requiring companies to notify individuals of data security breaches involving certain types of personal data. Breaches in security, whether malicious in nature or through inadvertent transmittal or other loss of data, could potentially jeopardize our or KKR’s, its employees’, or our investors’ or counterparties’ confidential, proprietary and other information processed and stored in, and transmitted through, our or KKR’s computer systems and networks, or otherwise cause interruptions or malfunctions in our or KKR’s, its employees’, or our investors’, our counterparties’ or third parties’ operations, which could result in significant losses, increased costs, disruption of our business, liability to our investors and other counterparties, regulatory intervention or reputational damage.
Furthermore, if we or KKR fail to comply with the relevant laws and regulations or fail to provide the appropriate regulatory or other notifications of a breach in a timely manner, it could result in regulatory investigations and penalties, which could lead to negative publicity and may cause our investors or KKR’s fund investors and clients to lose confidence in the effectiveness of our or KKR’s security measures. Although KKR takes various measures to ensure the integrity of such systems, there can be no assurance that these measures will provide protection. If such systems are compromised, do not operate properly or are disabled, or if we fail to comply with the relevant laws and regulations, we could suffer financial loss, a disruption of our businesses, liability to investors, regulatory intervention or reputational damage. Generally, our Manager will not be liable for losses incurred due to the failure of any such systems.
In addition, we are highly dependent on information systems and technology. Our information systems and technology may not continue to be able to accommodate our growth, and the cost of maintaining such systems may increase from its current level.
Such a failure to accommodate growth, or an increase in costs related to such information systems, could have a material adverse effect on us.
Furthermore, we depend on our headquarters in New York City, where most of our Manager’s personnel are located, for the continued operation of our business. A disaster or a disruption in the infrastructure that supports our business, including a disruption involving electronic communications or other services used by us or third parties with whom we conduct business, or directly affecting our headquarters, could have a material adverse impact on our ability to continue to operate our business without interruption. KKR’s disaster recovery programs may not be sufficient to mitigate the harm that may result from such a disaster or disruption. In addition, insurance and other safeguards might only partially reimburse us for our losses, if at all.
Finally, we rely on third-party service providers for certain aspects of our business, including for certain information systems, technology and administration. Any interruption or deterioration in the performance of these third parties or failures of their
information systems and technology could impair the quality of our operations and could affect our reputation and hence adversely affect our business.
KKR has significant influence over us and its interests may conflict with ours or those of our stockholders in the future.
As of December 31, 2021,2023, KKR and its affiliates beneficially owned shares of our common stock providing them with an aggregate 23.2%14.4% of the total voting power of our company. By virtue of KKR’s stock ownership and voting power, KKR has the power to significantly influence our business and affairs and is able to influence the outcome of matters required to be submitted to stockholders for approval, including the election of our directors, amendments to our charter, mergers or sales of assets. The influence exerted by KKR over our business and affairs might not be consistent with the interests of some or all of our stockholders. In addition, the concentration of ownership in our officers or directors or stockholders associated with them may have the effect of delaying or preventing a change in control of our company, including transactions that would be in the best interests of our stockholders and would result in receipt of a premium to the price of our shares of common stock (and even if such change in control would not reasonably jeopardize our qualification as a REIT), and might negatively affect the market price of our common stock.
Provisions of our charter and bylaws and Maryland law may deter takeover attempts, which may limit the opportunity of our stockholders to sell their shares at a favorable price.
Some of the provisions of Maryland law and our charter and bylaws discussed below could make it more difficult for a third party to acquire us, even if doing so might be beneficial to our stockholders by providing them with the opportunity to sell their shares at a premium to the then current market price.
Issuance of stock without stockholder approval. Our charter authorizes our board of directors, without stockholder approval, to authorize the issuance of up to 300,000,000 shares of common stock and up to 50,000,000 shares of preferred stock. As of December 31, 2021 and February 3, 2022, 6,900,000 shares and 13,110,0002023, 13,160,000 shares of preferred stock are classified as 6.50% Series A Cumulative Redeemable Preferred Stock respectively.and one share of preferred stock is classified as special non-voting preferred stock. Our charter also authorizes our board of directors, without stockholder approval, to classify or reclassify any unissued shares of common stock and preferred stock into other classes or series of stock and to amend our charter to increase or decrease the aggregate number of shares of stock or the number of shares of stock of any class or series that are authorized by the charter to be issued. Preferred stock may be issued in one or more classes or series, the terms of which may be determined by our board of directors without further action by stockholders. Prior to issuance of any such class or series, our board of directors will set the terms of any such class or series, including the preferences, conversion or other rights, voting powers, restrictions, limitations as to dividends or other distributions, qualifications and terms and conditions of redemption. The issuance of any preferred stock could materially adversely affect the rights of holders of common stock and, therefore, could reduce the value of the common stock. In addition, specific rights granted to future holders of our preferred stock could be used to restrict our ability to merge with, or sell assets to, a third party. The power of our board of directors to cause us to issue preferred stock could, in certain circumstances, make it more difficult, delay, discourage, prevent or make it more costly to acquire or effect a change in control thereby preservingunder circumstances that otherwise could provide the holders of shares of our common stock with the opportunity to realize a premium over the then current stockholders’ control.market price.
Advance notice bylaw. Our bylaws contain advance notice procedures for the introduction by a stockholder of new business and the nomination of directors by a stockholder. These provisions could, in certain circumstances, discourage proxy contests and make it more difficult for you and other stockholders to elect stockholder-nominated directors and to propose and, consequently, approve stockholder proposals opposed by management.
Maryland takeover statutes. The Maryland Business Combination Act could delay or prevent an unsolicited takeover of us. The statute substantially restricts the power of third parties who acquire, or seek to acquire, control of us without the approval of our board of directors to complete mergers and other business combinations even if such transaction would be beneficial to stockholders. “Business combinations” between such a third-party acquirer or its affiliate and us are prohibited for five years after the most recent date on which the acquirer becomes an “interested stockholder.” An “interested stockholder” is defined as any person who beneficially owns 10% or more of the voting power of our outstanding voting stock or an affiliate or associate of ours who, at any time within the two-year period immediately prior to the date in question, was the beneficial owner of 10% or more of the voting power of our then outstanding stock. If our board of directors approved in advance the transaction that would otherwise give rise to the acquirer attaining such status, the acquirer would not become an interested stockholder and, as a result, it could enter into a business combination with us. Our board of directors may, however, provide that its approval is subject to compliance, at or after the time of approval, with any terms and conditions determined by it. Even after the lapse of the five-year prohibition period, any business combination with an interested stockholder must be recommended by our board of directors and approved by the affirmative vote of at least:
•80% of the votes entitled to be cast by stockholders; and
•two-thirds of the votes entitled to be cast by stockholders other than the interested stockholder and affiliates and associates thereof.
The super-majority vote requirements do not apply if, among other considerations, the transaction complies with a minimum price and form of consideration requirements prescribed by the statute. The statute permits various exemptions from its provisions, including business combinations that are exempted by the board of directors prior to the time that an interested stockholder becomes an interested stockholder. Our board of directors has by resolution exempted business combinations between us and any other person, provided that such business combination is first approved by our board of directors.
The Maryland Control Share Acquisition Act of the Maryland General Corporation Law provides that a holder of control shares of a Maryland corporation acquired in a control share acquisition has no voting rights with respect to the control shares except to the extent approved by a vote of two-thirds of the votes entitled to be cast on the matter. Shares owned by the acquiror, by officers or by employees who are directors of the corporation are excluded from shares entitled to vote on the matter. Control shares are voting shares of stock that, if aggregated with all other shares of stock owned by the acquiror or in respect of which the acquiror is able to exercise or direct the exercise of voting power (except solely by virtue of a revocable proxy), would entitle the acquiror to exercise voting power in electing directors within one of the following ranges of voting power:
•one-tenth or more but less than one-third;
•one-third or more but less than a majority; or
•a majority or more of all voting power.
Control shares do not include shares the acquiror is then entitled to vote as a result of having previously obtained stockholder approval or shares acquired directly from the corporation. A control share acquisition means the acquisition of issued and outstanding control shares, subject to certain exceptions.
A person who has made or proposes to make a control share acquisition may compel the board of directors of the corporation to call a special meeting of stockholders to be held within 50 days of demand to consider the voting rights of the shares. The right to compel the calling of a special meeting is subject to the satisfaction of certain conditions, including an undertaking to pay the expenses of the meeting. If no request for a meeting is made, the corporation may itself present the question at any stockholders meeting.
If voting rights are not approved at the meeting or if the acquiror does not deliver an acquiring person statement as required by the statute, then the corporation may, subject to certain limitations and conditions, redeem for fair value any or all of the control shares, except those for which voting rights have previously been approved. Fair value is determined, without regard to the absence of voting rights for the control shares, as of the date of any meeting of stockholders at which the voting rights of the shares are considered and not approved or, if no meeting is held, as of the date of the last control share acquisition by the acquiror. If voting rights for control shares are approved at a stockholders meeting and the acquiror becomes entitled to exercise or direct the exercise of a majority of the voting power, all other stockholders may exercise appraisal rights. The fair value of the shares as determined for purposes of appraisal rights may not be less than the highest price per share paid by the acquiror in the control share acquisition.
The control share acquisition statute does not apply to (a) shares acquired in a merger, consolidation or share exchange if the corporation is a party to the transaction or (b) acquisitions approved or exempted by the charter or bylaws of the corporation.
Our bylaws contain a provision exempting any acquisition of our stock by any person from the foregoing provisions on control shares, which may be amended by our board of directors. In the event that our bylaws are amended to modify or eliminate this provision, acquisitions of our common stock may constitute a control share acquisition.
The Maryland Unsolicited Takeovers Act (“MUTA”) permits the board of directors of a Maryland corporation with at least three independent directors and a class of stock registered under the Exchange Act, without stockholder approval and notwithstanding any contrary provision in its charter or bylaws, to implement certain takeover defenses, including adopting a classified board, increasing the vote required to remove a director or providing that each vacancy on the board of directors may be filled only by a majority of the remaining directors in office, even if the remaining directors do not constitute a quorum. These provisions could have the effect of limiting or precluding a third party from making an unsolicited acquisition proposal
for our company or of delaying, deferring or preventing a change in control under circumstances that otherwise could provide the holders of shares of our common stock with the opportunity to realize a premium over the then current market price. Our
charter contains a provision whereby we have elected to be subject to the provisions of MUTA relating to the filling of vacancies on our board of directors.
In addition, our charter includes certain limitations on the ownership and transfer of our common stock. See “Risks Related to Our REIT Status and Certain Other Tax Items—Considerations—Our charter does not permit any person (including certain entities treated as individuals for this purpose) to own more than 9.8% of any class or series of our outstanding capital stock, and attempts to acquire shares of any class or series of our capital stock in excess of this 9.8% limit would not be effective without a prioran exemption from those prohibitions by our board of directors.”
Our rights and the rights of our stockholders to take action against our directors and officers are limited, which could limit your recourse in the event of actions not in your best interests.
Our charter limits the liability of our present and former directors and officers to us and our stockholders for money damages to the maximum extent permitted by Maryland law. Under Maryland law, our present and former directors and officers will not have any liability to us and our stockholders for money damages other than liability resulting from:
•actual receipt of an improper benefit or profit in money, property or services; or
•active and deliberate dishonesty by the director or officer that was established by a final judgment as being material to the cause of action adjudicated.
Our charter and bylaws require us to indemnify our present and former directors and officers to the maximum extent permitted by Maryland law, in the defense of any proceeding to which he or she is made, or threatened to be made, a party by reason of his or her service to us. In addition, we may be obligated to pay or reimburse the defense costs incurred by our present and former directors and officers without requiring a preliminary determination of their ultimate entitlement to indemnification.
Our charter contains provisions that make removal of our directors difficult, which could make it difficult for our stockholders to effect changes to our management.
Our charter provides that, subject to the rights of any series of preferred stock, a director may be removed only for cause upon the affirmative vote of at least two-thirds of the votes entitled to be cast generally in the election of directors. Under our charter, cause means conviction of a felony or a final judgment of a court of competent jurisdiction holding that a director caused demonstrable, material harm to our company through bad faith or active and deliberate dishonesty. Vacancies may be filled only by a majority of the remaining directors in office, even if less than a quorum. These requirements make it more difficult to change our management by removing and replacing directors and may prevent a change in control of our company that is in the best interests of our stockholders.
Our charter contains provisions that are designed to reduce or eliminate duties of KKR and its affiliates and our directors with respect to corporate opportunities and competitive activities.
Our charter contains provisions designed to reduce or eliminate duties of KKR and its affiliates and of our directors or any person our directors control to refrain from competing with us or to present to us business opportunities that otherwise may exist in the absence of such charter provisions. Under our charter, KKR and its affiliates and our directors or any person our directors control will not be obligated to present to us opportunities unless those opportunities are expressly offered to such person in his or her capacity as a director or officer of our company and those persons will be able to engage in competing activities without any restriction imposed as a result of KKR’s or its affiliates’ status as a stockholder or KKR affiliates’ status as officers or directors of our company.
We have not established a minimum distribution payment level and we cannot assure you of our ability to pay distributions in the future.
We are generally required to distribute to our stockholders at least 90% of our REIT taxable income, determined without regard to the deduction for dividends paid and excluding net capital gain, each year for us to qualify as a REIT under the Code, which requirement we currently intend to satisfy through quarterly distributions of at least 90% of our net taxable income in such year, subject to certain adjustments. Although we intend to make regular quarterly distributions to holders of our common stock and we currently expect to distribute at least 90% of our net taxable income to our stockholders on an annual basis, we have not
established a minimum distribution payment level and our ability to pay distributions may be adversely affected by a number of factors, including the risk factors described in this Annual Report on Form 10-K. Any distributions we make to our
stockholders will be at the discretion of our board of directors and will depend on our earnings, financial condition, liquidity, debt covenants, maintenance of our REIT qualification, applicable law and such other factors as our board of directors may deem relevant from time to time. We believe that a change in any one of the following factors could adversely affect our results of operations and impair our ability to pay distributions at current levels or at all to our stockholders:
•our ability to make profitable investments;
•margin calls or other expenses that reduce our cash flow;
•defaults in our asset portfolio or decreases in the value of our portfolio;
•the impact of declining interest rates on our net interest income; and
•the fact that anticipated operating expense levels may not prove accurate, as actual results may vary from estimates.
As a result, no assurance can be given that the level of any distributions we make to our stockholders will achieve a market yield or increase or even be maintained over time, any of which could materially and adversely affect the market price of our common stock. We may use net operating losses, to the extent available and subject to certain limitations, carried forward to offset future net taxable income, and therefore reduce our dividend requirements. In addition, some of our distributions may include a return of capital, which would reduce the amount of capital available to operate our business.
In addition, distributions that we make to our stockholders will generally be taxable to our stockholders as ordinary income. REIT dividends (other than capital gain dividends) received by non-corporate stockholders may be eligible for a 20% reduction. However, a portion of our distributions may be designated by us as long-term capital gains to the extent that they are attributable to capital gain income recognized by us or may constitute a return of capital to the extent that they exceed our earnings and profits as determined for U.S. federal income tax purposes. A return of capital is not taxable, but has the effect of reducing the basis of a stockholder’s investment in our common stock.
ITEM 1B. UNRESOLVED STAFF COMMENTS
None.
ITEM 1C. CYBERSECURITY
KREF is externally managed by our Manager. As an indirect subsidiary of KKR, our Manager is subject to and participates in KKR’s processes for assessing, identifying, and managing risks from cybersecurity threats, as detailed below.
KKR has a Chief Information Security Officer (the “KKR CISO”), who leads an information security team (the “KKR information security team”) that is responsible for information security at KKR’s asset management business, including its cybersecurity strategy and program, which includes, among other things, annual employee training about cybersecurity risks and new employee onboarding about KKR’s security policies. The KKR information security team’s mandates can be broadly grouped into three categories: (i) operations and engineering, (ii) threat detection and response and (iii) governance.
The KKR information security team members have a variety of relevant skill sets and expertise. For example, prior to joining KKR, KKR’s CISO was the CISO at another large financial institution where he was responsible for their global information security program. KKR’s CISO also has prior experience in various information security roles, including security architecture, application security, engineering and operations. He holds a Bachelor of Science in computer science from the New York University Polytechnic School of Engineering, is a Certified Information Systems Security Professional (CISSP) and holds a Series 99 – Operations Professional Exam certification. In addition, KKR information security team members have various backgrounds in information security, including in financial services and critical infrastructure, and the team maintains various levels of certifications – including CISSP, GIAC security operations certification, certified information security manager, and other certifications focused on specific technologies.
The KKR CISO chairs the technology and information security risk committee for KKR’s asset management business, which consists of employees from the KKR’s technology group and other groups, including risk, legal and compliance. The technology and information security risk committee is responsible for overseeing the cybersecurity risk environment for KKR’s asset management business, which includes identifying and monitoring KKR’s technology risks, including those related to
information security, business disruption, fraud and privacy related risks, and also promoting cybersecurity awareness at the firm.
Periodically, at least annually, KKR’s CISO and/or other members of the KKR information security team will present to the KREF audit committee on various topics relating to KKR's technology risks, including KKR’s cybersecurity program (including the results of cybersecurity table top exercises), cybersecurity issues (including those relating to data protection, insider threats, regulatory changes, and geopolitical cyber threat management), and risk management (including the results of periodic technology audits). For a discussion of how risks from cybersecurity threats affect KREF’s business, see “Part 1. Item 1A. Risk Factors – Structural, Organizational and Operational Risks – Operational risks, including the risk of cyberattacks, may disrupt our business, result in losses or limit our growth” in this Annual Report on Form 10-K.
Cybersecurity Risk Management and Strategy
KKR’s asset management business has a cybersecurity incident response plan as a key component of its cybersecurity program, which is generally incorporated as part of KKR’s enterprise risk management program. The KKR CISO and KKR’s Chief Compliance Officer co-chair a cybersecurity incident response team (“KKR CIRT”), which aims to manage and mitigate the impact of cybersecurity breach events at KKR’s asset management business, including those arising from third-party service providers, including but not limited to, those providers that have access to KKR’s customer and employee data. Members of the KKR CIRT include members of the firm’s legal, technology, risk, public affairs, fundraising and finance groups. KREF has established a notification decision framework to determine when the KKR CIRT will provide notifications regarding certain cybersecurity incidents, with different severity thresholds triggering notifications to different recipient groups, including members of KREF management, and the KREF audit committee.
The KKR information security team undertakes a variety of measures to monitor and manage the cybersecurity risks of KKR’s asset management business. For example, the KKR information security team monitors KKR’s technology infrastructure with tools designed to detect suspicious behavior. KKR’s technology platforms and applications are designed to enable it to monitor user and network behavior at KKR’s asset management business, identify threats using certain analytics, and mitigate attacks across various layers of the enterprise. The KKR information security team conducts regular internal and external audits with third-party cybersecurity experts to identify and evaluate potential weaknesses in its cybersecurity systems. Some of these third-party monitoring functions continue throughout the year while other third-party security experts are periodically retained to audit specific areas of the cybersecurity program. In addition, the KKR information security team conducts periodic phishing simulations, and they also conduct periodic employee training on KKR’s security policies and controls and provide other security trainings as part of new employee onboarding. Additionally, the KKR CIRT conducts periodic tabletop exercises simulating a cybersecurity breach at KKR.
As of the date of this filing, we do not believe that our business strategy, results of operations or financial conditions have been materially affected by any cybersecurity incidents for the reporting period covered by this report. However, institutions like us, as well as our employees, service providers and other third parties, have experienced information security and cybersecurity attacks in the past and will likely continue to be the target of increasingly cyber actors. For a discussion of how risks from cybersecurity threats affect KREF’s business, see “Part 1. Item 1A. Risk Factors – Structural, Organizational and Operational Risks – Operational risks, including the risk of cyberattacks, may disrupt our business, result in losses or limit our growth” in this Annual Report on Form 10-K.
ITEM 2. PROPERTIES
Our principal executive offices are located at 30 Hudson Yards, New York, New York. We do not own any real property. We consider these facilities to be suitable and adequate for the management and operations of our business.
ITEM 3. LEGAL PROCEEDINGS
From time to time, we may be involvedThe section entitled “Litigation” appearing in various claims and legal actions arisingNote 13 of our consolidated financial statements included in the ordinary course of business. As of December 31, 2021, we were not involved in any material legal proceedings.this Form 10-K is incorporated herein by reference.
ITEM 4. MINE SAFETY DISCLOSURES
Not applicable.
PART II.
ITEM 5. MARKET FOR REGISTRANT'S COMMON EQUITY, AND RELATED STOCKHOLDER MATTERS AND ISSUER PURCHASES OF EQUITY SECURITIES
On May 5, 2017, our common stock began trading on the NYSE under the symbol “KREF.“KREF.” AsAs of February 3, 2022, there2, 2024, there were 2520 holders of record of our common stock. This does not include the number of stockholders that hold shares in “street name” through banks or broker-dealers.
Dividends
We intend to make regular quarterly distributions to holders of our common stock. U.S. federal income tax law generally requires that a REIT distribute annually at least 90% of its REIT taxable income, determined without regard to the deduction for dividends paid and excluding net capital gains, and that it pay tax at regular corporate rates to the extent that it annually distributes less than 100% of its REIT taxable income, as adjusted.
Any distributions we make to our stockholders will be at the discretion of our board of directors and will depend on our earnings, financial condition, liquidity, debt covenants, maintenance of our REIT qualification, applicable law and such other factors as our board of directors may deem relevant from time to time. Our earnings, financial condition and liquidity will be affected by various factors, including the net interest and other income from our portfolio, our operating expenses and any other expenditures. Based on current market conditions, macroeconomic factors, and the status of our loan portfolio, we reduced our common stock dividend for the first quarter of 2024 to $0.25 per share. This level should support coverage of the dividend with operating earnings from our performing loan portfolio, while simultaneously managing our REO assets, as well as expectations for future interest rate reductions.
To the extent that in respect of any calendar year, cash available for distribution is less than our REIT taxable income, determined without regard to the deduction for dividends paid and excluding net capital gain, we could be required to sell assets or borrow funds to make cash distributions or make a portion of the required distribution in the form of a taxable stock distribution or distribution of debt securities. For more information regarding risk factors that could materially adversely affect our actual results of operations, see Part I. Item IA. “Risk Factors.”Factors”.
The following table sets forth the dividends declared on our common stock during each calendar quarter for 20212023 and 2020:2022:
| | | | | | | | | | | | | | | | | | | | | |
| Declaration Date | | Record Date | | Payment Date | | Per Share |
| 20212023 | | | | | | |
| March 15, 202117, 2023 | | March 31, 20212023 | | April 15, 202114, 2023 | | $ | 0.43 | |
| June 15, 20212023 | | June 30, 20212023 | | July 15, 202114, 2023 | | 0.43 | |
| September 15, 20212023 | | September 30, 202129, 2023 | | October 15, 202113, 2023 | | 0.43 | |
| December 14, 202115, 2023 | | December 31, 202129, 2023 | | January 14, 202212, 2024 | | 0.43 | |
| 20202022 | | | | | | |
| March 16, 202015, 2022 | | March 31, 20202022 | | April 15, 20202022 | | $ | 0.43 | |
| June 15, 20202022 | | June 30, 20202022 | | July 15, 20202022 | | 0.43 | |
| September 15, 202013, 2022 | | September 30, 20202022 | | October 15, 202014, 2022 | | 0.43 | |
| December 15, 202013, 2022 | | December 31, 202030, 2022 | | January 15, 202113, 2023 | | 0.43 | |
| | | | | | | |
| | | | | | | |
| | | | | | | |
| | | | | | | |
| | | | | | | |
Stockholder Return Performance
The following graph is a comparison of the cumulative total stockholder return on shares of our common stock, the Russell 2000 Index (the “Russell 2000”), and the Bloomberg REIT Mortgage Index, a published industry index, from May 5, 2017 (the date our common stock began trading on the NYSE)December 31, 2018 to December 31, 2021.2023. The graph assumes that $100 was invested on May 5, 2017December 31, 2018 in our common stock, the Russell 2000 and the Bloomberg REIT Mortgage Index and that all dividends were reinvested without the payment of any commissions. There can be no assurance that the performance of our shares will continue in line with the same or similar trends depicted in the graph below.
Total Return Performance
| | | Period Ending |
| 5/5/2017 | | 12/31/2017 | | 12/31/2018 | | 12/31/2019 | | 12/31/2020 | | 12/31/2021 | |
| | Period Ended | | | | Period Ended |
| | 12/31/2018 | | | | 12/31/2018 | | 12/31/2019 | | 12/31/2020 | | 12/31/2021 | | 12/31/2022 | | 12/31/2023 |
| KKR Real Estate Finance Trust, Inc. | KKR Real Estate Finance Trust, Inc. | | 100.0 | | | 102.3 | | | 106.4 | | | 123.8 | | | 120.5 | | | 152.2 | | |
| Russell 2000 | Russell 2000 | | 100.0 | | | 111.6 | | | 99.3 | | | 124.6 | | | 149.4 | | | 171.5 | | | Russell 2000 | | 100.0 | | | 125.5 | | 125.5 | | | 150.5 | | 150.5 | | | 172.7 | | 172.7 | | | 137.4 | | 137.4 | | 160.6 |
| Bloomberg REIT Mortgage Index | Bloomberg REIT Mortgage Index | | 100.0 | | | 107.8 | | | 105.9 | | | 129.3 | | | 100.6 | | | 118.3 | | | Bloomberg REIT Mortgage Index | | 100.0 | | | 123.6 | | 123.6 | | | 96.2 | | 96.2 | | | 113.1 | | 113.1 | | | 85.5 | | 85.5 | | 97.9 |
Equity Compensation Plan Information
The following table summarizes information, as of December 31, 2021,2023, relating to our equity compensation plans pursuant to which shares of our common stock or other equity securities may be granted from time to time:
| | Plan Category | Plan Category | | Number of securities to be issued upon exercise of outstanding options, warrants, and rights(1) | | Weighted-average exercise price of outstanding options, warrants and rights(2) | | Number of securities remaining available for future issuance under equity compensation plans (excluding securities reflected in column 1) | Plan Category | | Number of securities to be issued upon exercise of outstanding options, warrants, and rights(1) | | Weighted-average exercise price of outstanding options, warrants and rights(2) | | Number of securities remaining available for future issuance under equity compensation plans (excluding securities reflected in column 1) |
| Equity compensation plans approved by security holders | Equity compensation plans approved by security holders | | 808,330 | | | $ | — | | | 2,708,199 | |
| Equity compensation plans not approved by security holders | Equity compensation plans not approved by security holders | | — | | | — | | | — | |
| Total | Total | | 808,330 | | | $ | — | | | 2,708,199 | |
(1) Reflects the aggregate number of equity-based awards granted under our Amended and Restated KKR Real Estate Finance Trust Inc. 2016 Omnibus Incentive Plan that remained outstanding as of December 31, 2021.2023. All of these awards were in the form of restricted stock units.
(2) Restricted stock units are not exercisable for consideration.
Issuer Purchases of Equity Securities
Under the Company’s current share repurchase program, which was announced on June 15, 2020 and has no expiration date, the Company may repurchase up to $100.0 million of its common stock beginning July 1, 2020, of which up to $50.0 million may be repurchased under a pre-set trading plan meeting the requirements of Rule 10b5-1 under the Exchange Act that provides for repurchases of common stock when the market price per share is below book value per share (calculated in accordance with GAAP as of the end of the most recent quarterly period for which financial statements are available), and the remaining $50.0 million may be used for repurchases in the open market, pursuant to pre-set trading plans meeting the requirements of Rule 10b5-1 under the Exchange Act, in privately negotiated transactions or otherwise. The timing, manner, price and amount of any common stock repurchases will be determined by the Company in its discretion and will depend on a variety of factors, including legal requirements, price, liquidity and economic considerations, and market conditions. The program does not require the Company to repurchase any specific number of shares of common stock,stock. The program does not have an expiration date and the program may be suspended, extended, modified or discontinued at any time.
We did not repurchase any shares of our common stock during the year ended December 31, 2021.2023.
ITEM 6. RESERVED
ITEM 7. MANAGEMENT'S DISCUSSION AND ANALYSIS OF FINANCIAL CONDITION AND RESULTS OF OPERATIONS
The following discussion should be read in conjunction with the consolidated financial statements and notes thereto appearing elsewhere in this Annual Report on Form 10-K. The historical consolidated financial data below reflects the historical results and financial position of KREF. In addition, this discussion and analysis contains forward-looking statements and involves numerous risks and uncertainties, including those described under “Cautionary Note Regarding Forward-Looking Statements," and Part I, Item 1A. "Risk Factors" in this Annual Report on Form 10-K. Actual results may differ materially from those contained in any forward-looking statements.
Introduction
KKR Real Estate Finance Trust Inc. is a real estate finance company that focuses primarily on originating and acquiring senior loans secured by CRE assets. We are externally managed by KKR Real Estate Finance Manager LLC, an indirect subsidiary of KKR, and are a REIT traded on the NYSE under the symbol “KREF.” We are headquartered in New York City.
We conduct our operations as a REIT for U.S. federal income tax purposes. We generally will not be subject to U.S. federal income taxes on our taxable income to the extent that we annually distribute at least 90% of our net taxable income to stockholders and maintain our qualification as a REIT. We also operate our business in a manner that permits us to maintain an exclusion from registration under the Investment Company Act. We are organized as a holding company and conduct our business primarily through our various subsidiaries.
20212023 Highlights
Operating Results:
•Net IncomeLoss Attributable to Common Stockholders of $125.6$53.9 million,, or $2.21$(0.78) per diluted share of common stock a 130% increase over 2020 on a per share basis.
•Distributable Earnings of $92.4$57.6 million,, or $1.63$0.83 per diluted share of commoncommon stock net of $32.9 million, or ($0.58) per diluted share, of realized losses on loan write-offs.
•Declared dividends of $1.72 per common share. The fourth quarter dividend of $0.43$0.43 per common share produced an annualized yield of 8.26%13.00% on our closing stock price as of December 31, 2021.2023
•Based on current market conditions, macroeconomic factors, and the status of our loan portfolio, we reduced our common stock dividend for the first quarter of 2024 to $0.25 per share. This level should support coverage of the dividend with operating earnings from our performing loan portfolio, while simultaneously managing our REO assets, as well as expectations for future interest rate reductions.
Investment Activity:
•OriginatedFunded $684.3 million for loans closed in previous years and funded a record $4.8 billion and $3.6 billion, respectively, relating to 37 floating-rate loans. Total originations for 2021 represented a 428% and 56% increase over 2020 and 2019 originations, respectively.received loan repayments of $766.6 million
•Current funded$7.6 billion predominantly senior loan portfolio of $6.7 billion is 100% performing, 100%99% floating rate with a weighted average LTVunlevered all-in-yield of 68%9.0% as of December 31, 2021.2023
•TookMultifamily and industrial assets represent 55% of loan portfolio
•In December, we took title to the collateral of one defaulted senior retailoffice loan with an outstanding principal balance and net carrying value of $109.6$149.8 million and $69.3(after a $6.0 million respectively.partial repayment). Accordingly, we recognized an $8.2a $58.7 million, GAAP gain from reversal of the allowance for credit losses and recognized a $32.1 millionor ($0.85) per diluted share, realized loss on write-off through distributable earnings.was recognized
Portfolio Financing:
•Non-mark-to-market financing is $3.8$4.8 billion as of December 31, 2021,2023, representing 71%76% of our total outstanding portfoliosecured financing.
•ClosedExtended a $1.3 billion managed CLO with two-year reinvestment period providing $1.1 billion of non-mark financing equating$600.0 million master repurchase agreement and a $500.0 million warehouse facility maturity date to an 84.25% advance rate, at a weighted average cost of capital of L+1.30% before transaction costs. Concurrently, fully repaid the outstanding notes under our 2018 CLO.March 2026
•Completed repricing of $297.8Upsized a $240.0 million existing secured term loanmaster repurchase agreement to $400.0 million and a $52.2 million add-on, for an aggregate principal amount of $350.0 million due September 2027. The new secured term loan bears interest at L+3.50% and is subjectextended the final maturity date to a LIBOR floor of 0.50%, which is an aggregate improvement of 1.75%.
•Entered into a new $500.0 million term lending agreement, which provides asset-based financing on a non-mark-to-market basis with matched-term up to five years.
Capital Markets Activity:
•Issued 6,900,000 shares of 6.5% Series A Cumulative Redeemable Preferred Stock (the “Series A Preferred Stock”), at a liquidation price of $25.00 per share, and received net proceeds of $167.1 million.Repaid $143.8 million convertible notes in cash
•Completed an accretive underwritten public offeringHad no corporate debt or final facility maturities due until the first quarter of 5,547,361 common shares at $21.76 per share, less applicable transaction costs, resulting in $120.4 million of net proceeds. The offering was $0.22 per share accretive to book value per share.
•Our common book value was $1,188.9 million, or $19.37 per common share, as of December 31, 2021, representing seven consecutive quarters of book value accretion.2026
Recent Developments
In January 2022, we issued an additional 6,210,000 shares of 6.5% Series A Preferred Stock, which included the exercise of the underwriters' option to purchase additional shares of Series A Preferred Stock, and received net proceeds after underwriting discount and commission of $151.2 million.
In February 2022, we priced a $1.0 billion managed multifamily CLO (“KREF 2022-FL3”) expected to close on or around February 10, 2022, subject to customary closing conditions. KREF 2022-FL3 will provide us with match-term financing on a non-mark-to-market and non-recourse basis, and features a two-year reinvestment period with an 84.75% advance rate at a weighted average running cost of capital of Term SOFR plus 1.71%, before transaction costs.
Key Financial Measures and Indicators
As a real estate finance company, we believe the key financial measures and indicators for our business are earnings per share, dividends declared, Distributable Earnings and book value per share.
Earnings (Loss) Per Share and Dividends Declared
The following table sets forth the calculation of basic and diluted net income (loss) per share and dividends declared per share (amounts in thousands, except share and per share data):
| | | | | | | | | | | | | | | | | | | | |
| | Three Months Ended December 31, | | Year Ended December 31, |
| | 2021 | | 2021 | | 2020 |
| Net income attributable to common stockholders | | $ | 35,198 | | | $ | 125,635 | | | $ | 53,553 | |
| Weighted-average number of shares of common stock outstanding | | | | | | |
| Basic | | 59,364,672 | | 56,571,200 | | 55,985,014 |
| Diluted | | 59,453,264 | | 56,783,388 | | 56,057,237 |
| Net income per share, basic | | $ | 0.59 | | | $ | 2.22 | | | $ | 0.96 | |
| Net income per share, diluted | | $ | 0.59 | | | $ | 2.21 | | | $ | 0.96 | |
| Dividends declared per share | | $ | 0.43 | | | $ | 1.72 | | | $ | 1.72 | |
| | | | | | | | | | | | | | | | | | | | |
| | Three Months Ended December 31, | | Year Ended December 31, |
| | 2023 | | 2023 | | 2022 |
| Net income (loss) attributable to common stockholders | | $ | (18,738) | | | $ | (53,919) | | | $ | 15,371 | |
| Weighted-average number of shares of common stock outstanding, basic and diluted | | 69,384,309 | | 69,180,039 | | 67,553,578 |
| | | | | | |
| | | | | | |
| Net income (loss) per share, basic and diluted | | $ | (0.27) | | | $ | (0.78) | | | $ | 0.23 | |
| | | | | | |
| Dividends declared per share | | $ | 0.43 | | | $ | 1.72 | | | $ | 1.72 | |
Distributable Earnings
Distributable Earnings, a measure that is not prepared in accordance with GAAP, is a key indicator of our ability to generate sufficient income to pay our quarterly dividends and in determining the amount of such dividends, which is the primary focus of yield/income investors who comprise a significant portion of our investor base. Accordingly, we believe providing Distributable Earnings on a supplemental basis to our net income as determined in accordance with GAAP is helpful to our stockholders in assessing the overall performance of our business.
We define Distributable Earnings as net income (loss) attributable to our stockholders or, without duplication, owners of our subsidiaries, computed in accordance with GAAP, including realized losses not otherwise included in GAAP net income (loss) and excluding (i) non-cash equity compensation expense, (ii) depreciation and amortization, (iii) any unrealized gains or losses or other similar non-cash items that are included in net income for the applicable reporting period, regardless of whether such items are included in other comprehensive income or loss, or in net income, and (iv) one-time events pursuant to changes in GAAP and certain material non-cash income or expense items agreed upon after discussions between our Manager and our board of directors and after approval by a majority of our independent directors. The exclusion of depreciation and amortization from the calculation of Distributable Earnings only applies to debt investments related to real estate to the extent we foreclose upon the property or properties underlying such debt investments.
While Distributable Earnings excludes the impact of our unrealized current provision for (reversal of) credit losses, any loan losses are charged off and realized through Distributable Earnings when deemed non-recoverable. Non-recoverability is generally determined (i) upon the resolution of a loan (i.e. when the loan is repaid, fully or partially, or, in the case of foreclosure, when the underlying asset is sold), or (ii) with respect to any amountif, in our determination, it is nearly certain that all amounts due under anya loan when such amount is determined towill not be non-collectible.collected.
Distributable Earnings should not be considered as a substitute for GAAP net income or taxable income. We caution readers that our methodology for calculating Distributable Earnings may differ from the methodologies employed by other REITs to calculate the same or similar supplemental performance measures, and as a result, our reported Distributable Earnings may not be comparable to similar measures presented by other REITs.
We also use Distributable Earnings (before incentive compensation payable to our Manager) to determine the management and incentive compensation we pay our Manager. For its services to KREF, our Manager is entitled to a quarterly management fee equal to the greater of $62,500 or 0.375% of a weighted average adjusted equity and quarterly incentive compensation equal to 20.0% of the excess of (a) the trailing 12-month Distributable Earnings (before incentive compensation payable to our Manager) over (b) 7.0% of the trailing 12-month weighted average adjusted equity(1) (“Hurdle Rate”), less incentive compensation KREF already paid to the Manager with respect to the first three calendar quarters of such trailing 12-month period. The quarterly incentive compensation is calculated and paid in arrears with a three-month lag.
(1) For purposes of calculating incentive compensation under our Management Agreement, adjusted equity excludes: (i) the effects of equity issued that provides for fixed distributions or other debt characteristics and (ii) the unrealized provision for (reversal of) credit losses.
The following table provides a reconciliation of GAAP net income attributable to common stockholders to Distributable Earnings (amounts in thousands, except share and per share data):
| | | Three Months Ended December 31, | | Year Ended December 31, |
| | 2021 | | 2021 | | 2020 |
| | Three Months Ended December 31, | | | | Three Months Ended December 31, | | Year Ended December 31, |
| | 2023 | | | | 2023 | | 2023 | | 2022 |
| Net Income (Loss) Attributable to Common Stockholders | Net Income (Loss) Attributable to Common Stockholders | | $ | 35,198 | | | $ | 125,635 | | | $ | 53,553 | |
| Adjustments | Adjustments | |
| Non-cash equity compensation expense | Non-cash equity compensation expense | | 1,413 | | | 7,428 | | | 5,676 | |
Unrealized (gains) or losses(A) | | 1,463 | | | 1,059 | | | 4,036 | |
| Non-cash equity compensation expense | |
| Non-cash equity compensation expense | |
| Unrealized (gains) or losses, net | |
| Provision for (reversal of) credit losses, net | Provision for (reversal of) credit losses, net | | (3,077) | | | (4,059) | | | 50,344 | |
| Non-cash convertible notes discount amortization | |
Loan write-offs(B)(A) | Loan write-offs(B)(A) | | (32,905) | | | (32,905) | | | (4,650) | |
| Gain on redemption of non-voting manager units | | (5,126) | | | (5,126) | | | — | |
| Non-cash convertible notes discount amortization | | 91 | | | 361 | | | 362 | |
| Distributable Earnings | | $ | (2,943) | | | $ | 92,393 | | | $ | 109,321 | |
| Distributable Earnings (Loss) | |
| Weighted average number of shares of common stock outstanding | Weighted average number of shares of common stock outstanding | | | | | | |
| Basic | | 59,364,672 | | 56,571,200 | | 55,985,014 |
Diluted(C) | | 59,364,672 | | 56,783,388 | | 56,057,237 |
| Distributable Earnings per Diluted Weighted Average Share | | $ | (0.05) | | | $ | 1.63 | | | $ | 1.95 | |
| Basic and Diluted | |
| Basic and Diluted | |
| Basic and Diluted | | | 69,384,309 | | 69,180,039 | | 67,553,578 |
| | Distributable Earnings (Loss) per Diluted Weighted Average Share | |
| Distributable Earnings (Loss) per Diluted Weighted Average Share | |
| Distributable Earnings (Loss) per Diluted Weighted Average Share | |
(A) Includes $2.5Includes a $58.7 million $3.3 million and $0.2 million non-cash redemption value adjustmentwrite-off of our Special Non-Voting Preferred Stock, and ($1.1) million, ($2.2) million and $3.9 milliona defaulted senior loan upon deed-in-lieu of unrealized mark-to-market adjustment to our RECOP I's underlying CMBS investments forforeclosure during the three months ended ended December 31, 2021, 2023, and for the years ended December 31, 2021 and 2020, respectively.
(B) Includes $32.1a $15.0 million write-off onof a subordinated loan during the three months ended September 30, 2023. Includes a $25.0 million partial write-off of a defaulted senior retail loan which we took title of the underlying property and $0.9 million write-off of the remaining balance on an impaired mezzanine retail loan during the year ended December 31, 2021. Includes $4.7 million write-off on a $5.5 million mezzanine retail loan, which was 5-rated and put on non-accrual status, during the year ended December 31, 2020.2022.
(C) Includes zero, 212,188 and 72,223 dilutive restricted stock units for the three months ended December 31, 2021 and for the years ended December 31, 2021 and 2020, respectively.
Book Value per Share
We believe that book value per share is helpful to stockholders in evaluating the growth of our company as we have scaled our equity capital base and continue to invest in our target assets. The following table calculates our book value per share of common stock (amounts in thousands, except share and per share data):
| | Year Ended December 31, | |
| 2021 | | 2020 | |
| | Year Ended December 31, | |
| | Year Ended December 31, | |
| | Year Ended December 31, | |
| | 2023 | |
| | 2023 | |
| | 2023 | |
| KKR Real Estate Finance Trust Inc. stockholders' equity | |
| KKR Real Estate Finance Trust Inc. stockholders' equity | |
| KKR Real Estate Finance Trust Inc. stockholders' equity | KKR Real Estate Finance Trust Inc. stockholders' equity | | $ | 1,361,434 | | | $ | 1,043,554 | | |
| Series A preferred stock (liquidation preference of $25.00 per share) | Series A preferred stock (liquidation preference of $25.00 per share) | | (172,500) | | | — | | |
| Series A preferred stock (liquidation preference of $25.00 per share) | |
| Series A preferred stock (liquidation preference of $25.00 per share) | |
| Common stockholders' equity | |
| Common stockholders' equity | |
| Common stockholders' equity | Common stockholders' equity | | $ | 1,188,934 | | | $ | 1,043,554 | | |
| Shares of common stock issued and outstanding at period end | Shares of common stock issued and outstanding at period end | | 61,370,732 | | | 55,619,428 | | |
| Book value per share of common stock | | $ | 19.37 | | | $ | 18.76 | | |
| Shares of common stock issued and outstanding at period end | |
| Shares of common stock issued and outstanding at period end | |
| Add: Deferred stock units | |
| Add: Deferred stock units | |
| Add: Deferred stock units | |
| Total shares outstanding at period end | |
| Total shares outstanding at period end | |
| Total shares outstanding at period end | |
| Book value per share | |
| Book value per share | |
| Book value per share | |
Book value as of December 31, 20212023 included the impact of an estimated CECL credit loss allowance of $23.7$212.5 million, or ($0.39)3.06) per common share. See Note 2 — Summary of Significant Accounting Policies, to our consolidated financial statements included in this Form 10-K for detailed discussion of allowance for credit losses.
Book value as of December 31, 2020 included a cumulative non-cash redemption value adjustment (since issuance of the Special Non-Voting Preferred Stock, or "SNVPS"), which decreased our book value by$1.9 million, or ($0.03) per common share. On October 1, 2021, the KKR Member exercised its Call Option to redeem the non-voting units in our Manager, including the non-voting manager units held by us. Accordingly, we received a cash call amount of $5.1 million and concurrently redeemed the SNVPS, which resulted in a net book value accretion of $1.9 million, or $0.03 per common share, during the year ended December 31, 2021, thus eliminating the cumulative negative impact of the SNVPS on our book value. See Note 11 — Equity, to our consolidated financial statements included in this Form 10-K for detailed discussion of the SNVPS.
Our Portfolio
We have established a $6,791.5$7,752.3 million portfolio of diversified investments, consisting primarily of performing senior and mezzanine commercial real estate loans as of December 31, 2021.2023.
Our loan portfolio is 100.0% performing as of December 31, 2021. During the year ended December 31, 2021 and the month ended January 31, 2022,2023, we collected 97.3% and 100.0% 97.6% of interest payments due on our loan portfolio, respectively.portfolio. As of December 31, 2021,2023, the average risk rating of our loan portfolio was 2.9 (Average Risk),3.2, weighted by total loan exposure. As of December 31, 2021, 94.1% of our loans, based on total loan exposure, was risk-rated 3 or better. As of December 31, 2021,2023, the average loan commitment in our portfolio was $130.5$121.6 million and multifamily and officeindustrial loans comprised 74%55% of our loan portfolio, while hospitality loans comprised 7% of the portfolio.
In addition, to our loan portfolio, as of December 31, 2021, as a result of taking title to the collateral of one defaulted senior retail loan,loans, we owned one REO assetassets with a net carrying value of $78.6$158.6 million,, comprised of the fair value of the acquired retail propertyproperties and the capitalized transactionredevelopment costs, as of December 31, 2021. This property is held for investment and2023. These properties are reflected on our consolidated balance sheets at its estimated fair value at the time of acquisition plus related acquisition costs.Consolidated Balance Sheet.
Since our IPO, we have continued to execute on our primary investment strategy of originating floating-rate transitional senior loans and, as we continue to scale our loan portfolio, we expect that our originations will continue to be heavily weighted toward floating-rate loans. As of December 31, 2021, 100.0%2023, 99% of our loans by total loan exposure earned a floating rate of interest and approximately 54% of our portfolio was subject to a LIBOR floor of at least 0.25%, with a weighted average floor of 0.74%.interest. We expect the majoritymajority of our future investment activity to focus on originating floating-rate senior loans that we finance with our repurchase and other financing facilities, with a secondary focus on originating floating-rate loans for which we syndicate a senior position and retain a subordinated interest for our portfolio. As of December 31, 2021,2023, all of our investments were located in the United States.
The following charts illustrate the diversification and composition of our loan portfolio(A), based on type of investment, interest rate, underlying property type, geographic location, vintage and LTV as of December 31, 2021:2023:
The charts above are based on total outstanding principal amountloan exposure of our commercial real estate loans.
(A) Excludes: (i) one REO retail asset on a defaulted loan with net carrying value of $78.6$158.6 million as of December 31, 2021,, (ii) CMBS B-Piece investments held through RECOP I, an equity method investment and (iii) one impaired mezzanine loan(iii) fully written off risk-rated 5 loans with ana combined outstanding principal balance of $5.5 million that was fully written off.$45.5 million.
(B) Senior loans include senior mortgages and similar credit quality loans, including related contiguous junior participations in senior loans where we have financed a loan with structural leverage through the non-recourse sale of a corresponding first mortgage.
(C) We classify a loan as life science if more than 50% of the gross leasable area is leased to, or will be converted to, life science-relatedscience-related space.
(D) Excludes one real estate corporate loan to a multifamily operator with an outstanding principal amount of $41.1 million, representing 0.6% of our commercial real estate loans as of December 31, 2021.
(E) LTV is generally based on the initial loan amount divided by the as-is appraised value as of the date the loan was originated or by the current principal amount as of the date of the most recent as-is appraised value.(D) "Other" property type includes Condo (Residential) (2%), Self-Storage (2%), Student Housing (1%) and Single Family Rental (1%).
The following table details our quarterly loan activity (dollars in thousands):
| | | | | | | | | | | | | | | | | | | | | | | | | | | | | | | | | | | | | | | | | | |
| | Three Months Ended | | Year Ended |
| | March 31, 2021 | | June 30, 2021 | | September 30, 2021 | | December 31, 2021 | | December 31, 2021 | | December 31, 2020 | | | | |
| Loan originations | | $ | 534,500 | | | $ | 967,108 | | | $ | 1,536,993 | | | $ | 1,804,897 | | | $ | 4,843,498 | | | $ | 917,851 | | | | | |
Loan fundings(A) | | $ | 575,826 | | | $ | 558,387 | | | $ | 1,142,969 | | | $ | 1,680,890 | | | $ | 3,958,072 | | | $ | 961,455 | | | | | |
Loan repayments/syndications(B) | | (244,348) | | | (270,980) | | | (934,899) | | | (679,749) | | | (2,129,976) | | | (1,042,864) | | | | | |
| Net fundings | | 331,478 | | | 287,407 | | | 208,070 | | | 1,001,141 | | | 1,828,096 | | | (81,409) | | | | | |
| PIK interest | | 845 | | | 458 | | | 373 | | | 418 | | | 2,094 | | | 4,231 | | | | | |
| Write-off | | — | | | — | | | — | | | (32,905) | | | (32,905) | | | (4,650) | | | | | |
| Transfer to REO | | — | | | — | | | — | | | (77,516) | | | (77,516) | | | — | | | | | |
| Total activity | | $ | 332,323 | | | $ | 287,865 | | | $ | 208,443 | | | $ | 891,138 | | | $ | 1,719,769 | | | $ | (81,828) | | | | | |
(A) Includes initial funding of new loans and additional fundings made under existing loans.
(B) Excludes $150.5 million, $150.5 million and $79.9 million of proceeds from senior note syndications during the three months ended March 31, 2021 and the years ended December 31, 2021 and 2020, respectively.
The following table details overall statistics for our loan portfolio as of December 31, 2021 (dollars in thousands):
| | | | | | | | | | | | | | | | | | | | | | | | | | |
| | | | Total Loan Exposure(A) |
| | Balance Sheet Portfolio | | Total Loan Portfolio | | Floating Rate Loans | | Fixed Rate Loans |
| Number of loans | | 63 | | 62 | | 62 | | — |
| Principal balance | | $ | 6,364,105 | | $ | 6,677,239 | | $ | 6,677,239 | | $ | — |
| Amortized cost | | $ | 6,316,733 | | $ | 6,635,366 | | $ | 6,635,366 | | $ | — |
Unfunded loan commitments(B) | | $ | 1,367,880 | | $ | 1,367,880 | | $ | 1,367,880 | | $ | — |
Weighted-average cash coupon(C) | | 4.1 | % | | L + 3.3 | % | | L + 3.3 | % | | n.a. |
Weighted-average all-in yield(C) | | 4.4 | % | | L + 3.6 | % | | L + 3.6 | % | | n.a. |
Weighted-average maximum maturity (years)(D) | | 3.6 | | 3.6 | | 3.6 | | n.a. |
LTV(E) | | 68 | % | | 68 | % | | 68 | % | | n.a. |
(A) In certain instances, we finance our loans through the non-recourse sale of a senior interest that is not included in our consolidated financial statements. Total loan exposure includes the entire loan we originated and financed and excludes one impaired mezzanine loan with an outstanding principal of $5.5 million that was fully written off.
(B) Unfunded commitments will primarily be funded to finance property improvements and renovations or lease-related expenditures by the borrowers. These future commitments will be funded over the term of each loan, subject in certain cases to an expiration date.
(C) As of December 31, 2021, 100.0% of floating rate loans by principal balance are indexed to one-month USD LIBOR. In addition to cash coupon, all-in yield includes the amortization of deferred origination fees, loan origination costs and purchase discounts. Cash coupon and all-in yield for the total portfolio assume applicable floating benchmark rates as of December 31, 2021. L = the greater of one-month USD LIBOR; spot rate of 0.10%, and the applicable contractual LIBOR floor, included in portfolio-wide averages represented as fixed rates. Does not factor in prepayment fee income that might be earned upon prepayment.
(D) Maximum maturity assumes all extension options are exercised by the borrower; however, our loans may be repaid prior to such date. As of December 31, 2021, based on total loan exposure, 65.4% of our loans were subject to yield maintenance or other prepayment restrictions and 34.6% were open to repayment by the borrower without penalty.
(E) LTV is generally based on the initial loan amount divided by the as-is appraised value as of the date the loan was originated or by the current principal amount as of the date of the most recent as-is appraised value. Weighted average LTV includes non-consolidated senior interests and excludes one real estate corporaterisk-rated 5 loans.
The following table details our quarterly loan activity (dollars in thousands):
| | | | | | | | | | | | | | | | | | | | | | | | | | | | | | | | | | | | | | |
| | Three Months Ended | | Year Ended December 31, |
| | December 31, 2023 | | September 30, 2023 | | June 30, 2023 | | March 31, 2023 | | 2023 | | 2022 |
| Loan originations | | $ | — | | | $ | — | | | $ | — | | | $ | — | | | $ | — | | | $ | 2,705,900 | |
Loan fundings(A) | | $ | 138,655 | | | $ | 164,882 | | | $ | 177,162 | | | $ | 203,612 | | | $ | 684,311 | | | $ | 2,469,378 | |
Loan repayments(B) | | (188,106) | | | (152,301) | | | (339,288) | | | (86,928) | | | (766,623) | | | (1,323,011) | |
| Net fundings | | (49,451) | | | 12,581 | | | (162,126) | | | 116,684 | | | (82,312) | | | 1,146,367 | |
| PIK interest | | — | | | — | | | — | | | — | | | — | | | 1,870 | |
Write-offs(C) | | (58,706) | | | (15,000) | | | — | | | — | | | (73,706) | | | (25,000) | |
| Transfer to REO | | (86,422) | | | — | | | — | | | — | | | (86,422) | | | — | |
| Total activity | | $ | (194,579) | | | $ | (2,419) | | | $ | (162,126) | | | $ | 116,684 | | | $ | (242,440) | | | $ | 1,123,237 | |
(A) Includes initial funding of new loans and additional fundings made under existing loans.
(B) Includes $4.7 million of cost recovery interest applied as a reduction to loan principal during the three months ended December 31, 2023.
(C) Includes a multifamily operator with an outstanding principal$58.7 million write-off on a defaulted senior loan upon deed-in-lieu of foreclosure during the three months ended December 31, 2023, and a $15.0 million write-off of a subordinated loan during the three months ended September 30, 2023. Includes a $25.0 million partial write-off of a defaulted senior loan during the year ended December 31, 2022.
$41.1 million
The following table details overall statistics for our loan portfolio as of December 31, 2021.2023 (dollars in thousands):
| | | | | | | | | | | | | | | | | | | | | | | | | | |
| | | | Total Loan Exposure(A)(B) |
| | Balance Sheet Portfolio(A) | | Total Loan Portfolio | | Floating Rate Loans | | Fixed Rate Loans(C) |
| Number of loans | | 69 | | 69 | | 69 | | — |
| Principal balance | | $ | 7,369,425 | | | $ | 7,558,036 | | | $ | 7,480,579 | | | $ | 77,457 | |
| Amortized cost | | $ | 7,343,548 | | | $ | 7,532,159 | | | $ | 7,458,989 | | | $ | 73,170 | |
Unfunded loan commitments(D) | | $ | 816,400 | | | $ | 816,428 | | | $ | 809,484 | | | $ | 6,943 | |
Weighted average cash coupon(E) | | 8.7 | % | | 8.7 | % | | S + 3.4% | | * |
Weighted average all-in yield(E) | | 9.0 | % | | 9.0 | % | | S + 3.6% | | * |
Weighted average maximum maturity (years)(F) | | 2.7 | | 2.7 | | 2.7 | | 1.6 |
LTV(G) | | 66 | % | | 66 | % | | 66 | % | | n/a |
* Rounds to zero
(A) Excludes fully written off risk-rated 5 loans with a combined outstanding principal balance of $45.5 million.
(B) In certain instances, we finance our loans through the non-recourse sale of a senior interest that is not included in our consolidated financial statements. Total loan exposure includes the entire loan we originated and financed.
(C) Represents mezzanine notes with commitments of $79.4 million and $5.0 million, respectively, accompanying two senior loans. $77.5 million of loan principal was funded, of which $74.4 million was placed on nonaccrual status, as of December 31, 2023. The remaining $3.1 million funded principal earned a fixed interest rate of 10.0% as of December 31, 2023. Refer to Note 3 to our consolidated financial statements for additional information.
(D) Unfunded commitments will primarily be funded to finance property improvements and renovations or lease-related expenditures by the borrowers. These future commitments will be funded over the term of each loan, subject in certain cases to an expiration date.
(E) In addition to cash coupon, all-in yield includes the amortization of deferred origination fees, loan origination costs and purchase discounts. The calculations of weighted average cash coupon and all-in yield excludes loans accounted for under the cost recovery method.
(F) Maximum maturity assumes all extension options are exercised by the borrower; however, our loans may be repaid prior to such date. As of December 31, 2023, based on total loan exposure, 13.3% of our loans were subject to yield maintenance or other prepayment restrictions and 86.7% were open to repayment by the borrower without penalty.
(G) LTV is generally based on the initial loan amount divided by the as-is appraised value as of the date the loan was originated or by the current principal amount as of the date of the most recent as-is appraised value. Weighted average LTV includes non-consolidated senior interests and excludes risk-rated 5 loans.
The table below sets forth additional information relating to our portfolio as of December 31, 20212023 (dollars in millions):
| | Investment(A) | | Location | | Property Type | | Investment Date | | Total Whole Loan(B) | | Committed Principal Amount(B) | | Current Principal Amount | | Net Equity(C) | | Coupon(D)(E) | | Max Remaining Term (Years)(D)(F) | | Loan Per SF / Unit / Key | | LTV(D)(G) | | Risk Rating |
| Senior Loans(I) | | | | | | | | | | | | | | | | | | |
| Investment(A) | | | Investment(A) | | Location | | Property Type | | Investment Date | | Total Whole Loan(B) | | Committed Principal Amount(B) | | Current Principal Amount | | Net Equity(C) | | Coupon(D)(E) | | Max Remaining Term (Years)(D)(F) | | Loan Per SF / Unit / Key(G) | | LTV(D)(H) | | Risk Rating |
| Senior Loans(I) | |
| 1 | |
| 1 | |
| 1 | 1 | Senior Loan | | Arlington, VA | | Multifamily | | 9/30/2021 | | $ | 381.0 | | | $ | 381.0 | | | $ | 352.9 | | | $ | 78.8 | | | L + 3.2 | | 4.8 | | | $ 317,965 / unit | | 69 | % | | 3 | Senior Loan | | Arlington, VA | | Multifamily | | 9/30/2021 | | $ | 381.0 | | | $ | | $ | 381.0 | | | $ | | $ | 369.0 | | | $ | | $ | 74.1 | | | + | | + | 3.3 | | 2.8 | | | $332,439 / unit | | $332,439 / unit | | 69 | % | | 3 |
| 2 | 2 | Senior Loan | | Bellevue, WA | | Office | | 9/13/2021 | | 520.8 | | | 260.4 | | | 61.0 | | | 26.4 | | | L + 3.6 | | 5.3 | | | $ 200 / SF | | 63 | | | 3 | 2 | Senior Loan | | Boston, MA | | Life Science | | 8/3/2022 | | 312.5 | | | 312.5 | | 312.5 | | | 195.4 | | 195.4 | | | 27.3 | | 27.3 | | | + | | + | 4.2 | | 3.6 | | | $747 / SF | | $747 / SF | | 56 | | | 3 | | 3 |
| 3 | 3 | Senior Loan | | Los Angeles, CA | | Multifamily | | 2/19/2021 | | 260.0 | | | 260.0 | | | 249.7 | | | 50.8 | | | L + 3.6 | | 4.2 | | | $ 465,874 / unit | | 68 | | | 3 | 3 | Senior Loan | | Bellevue, WA | | Office | | 9/13/2021 | | 520.8 | | | 260.4 | | 260.4 | | | 182.5 | | 182.5 | | | 47.7 | | 47.7 | | | + | | + | 3.7 | | 3.3 | | | $855 / SF | | $855 / SF | | 63 | | | 3 | | 3 |
| 4 | 4 | Senior Loan | | Boston, MA | | Life Science | | 5/24/2018 | | 250.5 | | | 250.5 | | | 243.6 | | | 55.4 | | | L + 3.2 | | 2.0 | | | $ 521 / SF | | 53 | | | 1 | 4 | Senior Loan | | Various | | Industrial | | 4/28/2022 | | 504.5 | | | 252.3 | | 252.3 | | | 252.3 | | 252.3 | | | 50.6 | | 50.6 | | | + | | + | 2.7 | | 3.4 | | | $98 / SF | | $98 / SF | | 64 | | | 3 | | 3 |
| 5 | 5 | Senior Loan | | Mountain View, CA | | Office | | 7/14/2021 | | 362.8 | | | 250.0 | | | 184.1 | | | 45.9 | | | L + 3.3 | | 4.6 | | | $ 599 / SF | | 73 | | | 3 | 5 | Senior Loan | | Mountain View, CA | | Office | | 7/14/2021 | | 362.8 | | | 250.0 | | 250.0 | | | 200.9 | | 200.9 | | | 118.5 | | 118.5 | | | + | | + | 3.4 | | 2.6 | | | $654 / SF | | $654 / SF | | n.a. | | 5 |
| 6 | 6 | Senior Loan | | New York, NY | | Condo (Residential) | | 12/20/2018 | | 234.5 | | | 234.5 | | | 210.7 | | | 40.0 | | | L + 3.6 | | 2.0 | | | $ 1,316 / SF | | 71 | | | 4 | 6 | Senior Loan | | Bronx, NY | | Industrial | | 8/27/2021 | | 381.2 | | | 228.7 | | 228.7 | | | 198.9 | | 198.9 | | | 43.0 | | 43.0 | | | + | | + | 4.2 | | 2.7 | | | $277 / SF | | $277 / SF | | 52 | | | 3 | | 3 |
| 7 | 7 | Senior Loan | | Bronx, NY | | Industrial | | 8/27/2021 | | 381.2 | | | 228.7 | | | 97.5 | | | 95.8 | | | L + 4.1 | | 4.7 | | | $ 118 / SF | | 52 | | | 3 | 7 | Senior Loan | | Los Angeles, CA | | Multifamily | | 2/19/2021 | | 220.0 | | | 220.0 | | 220.0 | | | 220.0 | | 220.0 | | | 33.9 | | 33.9 | | | + | | + | 2.9 | | 2.2 | | | $410,430 / unit | | $410,430 / unit | | 68 | | | 3 | | 3 |
| 8 | 8 | Senior Loan | | Various | | Multifamily | | 5/31/2019 | | 216.5 | | | 216.5 | | | 215.3 | | | 37.7 | | | L + 3.1 | | 2.4 | | | $ 201,206 / unit | | 74 | | | 3 | 8 | Senior Loan | | Various | | Multifamily | | 5/31/2019 | | 206.5 | | | 206.5 | | 206.5 | | | 206.5 | | 206.5 | | | 41.9 | | 41.9 | | | + | | + | 4.0 | | 1.4 | | | $192,991 / unit | | $192,991 / unit | | 74 | | | 3 | | 3 |
| 9 | 9 | Senior Loan(J) | | Various | | Industrial | | 6/30/2021 | | 425.0 | | | 212.5 | | | 3.7 | | | 1.0 | | | L + 5.4 | | 4.5 | | | $ 8 / SF | | 74 | | | 3 | 9 | Senior Loan | | Minneapolis, MN | | Office | | 11/13/2017 | | 199.4 | | | 199.4 | | 199.4 | | | 194.4 | | 194.4 | | | 89.0 | | 89.0 | | | + | | + | 2.3 | | 1.5 | | | $182 / SF | | $182 / SF | | n.a. | | 5 |
| 10 | 10 | Senior Loan | | Minneapolis, MN | | Office | | 11/13/2017 | | 194.4 | | | 194.4 | | | 194.4 | | | 32.8 | | | L + 3.8 | | 0.9 | | | $ 179 / SF | | 65 | | | 2 | 10 | Senior Loan | | Various | | Industrial | | 6/15/2022 | | 375.5 | | | 187.8 | | 187.8 | | | 173.3 | | 173.3 | | | 37.7 | | 37.7 | | | + | | + | 2.9 | | 3.5 | | | $125 / SF | | $125 / SF | | 50 | | | 3 | | 3 |
| 11 | 11 | Senior Loan | | Washington, D.C. | | Office | | 11/9/2021 | | 187.7 | | | 187.7 | | | 111.9 | | | 26.7 | | | L + 3.3 | | 4.9 | | | $ 321 / SF | | 55 | | | 3 | 11 | Senior Loan | | Boston, MA | | Office | | 2/4/2021 | | 375.0 | | | 187.5 | | 187.5 | | | 187.5 | | 187.5 | | | 37.5 | | 37.5 | | | + | | + | 3.4 | | 2.1 | | | $506 / SF | | $506 / SF | | 71 | | | 4 | | 4 |
| 12 | 12 | Senior Loan | | Boston, MA | | Office | | 2/4/2021 | | 375.0 | | | 187.5 | | | 187.5 | | | 37.4 | | | L + 3.3 | | 4.1 | | | $ 506 / SF | | 71 | | | 3 | 12 | Senior Loan | | The Woodlands, TX | | Hospitality | | 9/15/2021 | | 183.3 | | | 183.3 | | 183.3 | | | 180.9 | | 180.9 | | | 33.0 | | 33.0 | | | + | | + | 4.3 | | 2.8 | | | $199,015 / key | | $199,015 / key | | 64 | | | 3 | | 3 |
| 13 | 13 | Senior Loan | | Chicago, IL | | Multifamily | | 6/6/2019 | | 186.0 | | | 186.0 | | | 179.5 | | | 32.4 | | | L + 3.6 | | 2.4 | | | $ 364,837 / unit | | 72 | | | 3 | 13 | Senior Loan | | Washington, D.C. | | Office | | 11/9/2021 | | 181.0 | | | 181.0 | | 181.0 | | | 163.4 | | 163.4 | | | 54.8 | | 54.8 | | | + | | + | 2.9 | | 3.9 | | | $458 / SF | | $458 / SF | | 55 | | | 3 | | 3 |
| 14 | 14 | Senior Loan | | The Woodlands, TX | | Hospitality | | 9/15/2021 | | 183.3 | | | 183.3 | | | 168.3 | | | 29.8 | | | L + 4.2 | | 4.8 | | | $ 185,155 / key | | 64 | | | 3 | 14 | Senior Loan(J) | | Washington, D.C. | | Office | | 12/20/2019 | | 175.5 | | | 175.5 | | 175.5 | | | 173.4 | | 173.4 | | | 83.4 | | 83.4 | | | + | | + | 3.5 | | 1.0 | | | $848 / SF | | $848 / SF | | 58 | | | 3 | | 3 |
| 15 | 15 | Senior Loan | | Philadelphia, PA | | Office | | 4/11/2019 | | 182.6 | | | 182.6 | | | 156.9 | | | 24.6 | | | L + 2.6 | | 2.4 | | | $ 219 / SF | | 68 | | | 3 | 15 | Senior Loan | | West Palm Beach, FL | | Multifamily | | 12/29/2021 | | 171.5 | | | 171.5 | | 171.5 | | | 170.9 | | 170.9 | | | 26.1 | | 26.1 | | | + | | + | 2.8 | | 3.0 | | | $210,456 / unit | | $210,456 / unit | | 73 | | | 3 | | 3 |
| 16 | 16 | Senior Loan | | Washington, D.C. | | Office | | 12/20/2019 | | 175.5 | | | 175.5 | | | 119.7 | | | 36.5 | | | L + 3.4 | | 3.0 | | | $ 586 / SF | | 58 | | | 3 | 16 | Senior Loan | | Various | | Self-Storage | | 12/21/2022 | | 336.6 | | | 168.3 | | 168.3 | | | 129.6 | | 129.6 | | | 26.1 | | 26.1 | | | + | | + | 3.8 | | 4.0 | | | $19,498 / unit | | $19,498 / unit | | 64 | | | 3 | | 3 |
| 17 | 17 | Senior Loan | | West Palm Beach, FL | | Multifamily | | 12/29/2021 | | 171.5 | | | 171.5 | | | 169.2 | | | 70.6 | | | L + 2.7 | | 5.0 | | | $ 208,405 / unit | | 73 | | | 3 | 17 | Senior Loan | | Boston, MA | | Life Science | | 4/27/2021 | | 332.3 | | | 166.2 | | 166.2 | | | 161.1 | | 161.1 | | | 31.5 | | 31.5 | | | + | | + | 3.7 | | 2.4 | | | $669 / SF | | $669 / SF | | 66 | | | 3 | | 3 |
| 18 | 18 | Senior Loan | | Chicago, IL | | Office | | 7/15/2019 | | 170.0 | | | 170.0 | | | 136.6 | | | 25.9 | | | L + 3.3 | | 2.6 | | | $ 131 / SF | | 59 | | | 3 | 18 | Senior Loan(J) | | New York, NY | | Condo (Residential) | | 12/20/2018 | | 151.3 | | | 151.3 | | 151.3 | | | 149.9 | | 149.9 | | | 55.6 | | 55.6 | | | + | | + | 3.7 | | — | | | $2,498,416 / unit | | $2,498,416 / unit | | 69 | | | 3 | | 3 |
| 19 | 19 | Senior Loan | | Boston, MA | | Life Science | | 4/27/2021 | | 332.3 | | | 166.2 | | | 123.1 | | | 33.3 | | | L + 3.6 | | 4.4 | | | $ 511 / SF | | 66 | | | 3 | 19 | Senior Loan | | Plano, TX | | Office | | 2/6/2020 | | 150.7 | | | 150.7 | | 150.7 | | | 150.7 | | 150.7 | | | 23.3 | | 23.3 | | | + | | + | 2.8 | | 1.1 | | | $208 / SF | | $208 / SF | | 64 | | | 3 | | 3 |
| 20 | 20 | Senior Loan | | Philadelphia, PA | | Office | | 6/19/2018 | | 165.0 | | | 165.0 | | | 165.0 | | | 72.1 | | | L + 2.5 | | 1.5 | | | $ 169 / SF | | 71 | | | 3 | 20 | Senior Loan | | Redwood City, CA | | Life Science | | 9/30/2022 | | 580.7 | | | 145.2 | | 145.2 | | | — | | — | | | (1.0) | | (1.0) | | | + | | + | 4.5 | | 3.8 | | | $885 / SF | | $885 / SF | | 53 | | | 3 | | 3 |
| 21 | 21 | Senior Loan | | New York, NY | | Multifamily | | 12/5/2018 | | 163.0 | | | 163.0 | | | 148.0 | | | 22.3 | | | L + 2.6 | | 1.9 | | | $ 556,391 / unit | | 77 | | | 3 | 21 | Senior Loan | | Seattle, WA | | Life Science | | 10/1/2021 | | 188.0 | | | 140.3 | | 140.3 | | | 116.8 | | 116.8 | | | 45.6 | | 45.6 | | | + | | + | 3.2 | | 2.8 | | | $745 / SF | | $745 / SF | | n.a. | | 5 |
| 22 | 22 | Senior Loan | | Oakland, CA | | Office | | 10/23/2020 | | 509.9 | | | 159.7 | | | 106.5 | | | 16.8 | | | L + 4.3 | | 3.9 | | | $ 306 / SF | | 65 | | | 3 | 22 | Senior Loan | | Dallas, TX | | Office | | 12/10/2021 | | 138.0 | | | 138.0 | | 138.0 | | | 138.0 | | 138.0 | | | 25.8 | | 25.8 | | | + | | + | 3.7 | | 2.9 | | | $439 / SF | | $439 / SF | | 68 | | | 3 | | 3 |
| 23 | 23 | Senior Loan | | Plano, TX | | Office | | 2/6/2020 | | 153.7 | | | 153.7 | | | 131.0 | | | 19.8 | | | L + 2.7 | | 3.1 | | | $ 182 / SF | | 63 | | | 2 | 23 | Senior Loan | | Boston, MA | | Multifamily | | 3/29/2019 | | 137.0 | | | 137.0 | | 137.0 | | | 137.0 | | 137.0 | | | 27.8 | | 27.8 | | | + | | + | 3.4 | | 0.3 | | | $351,282 / unit | | $351,282 / unit | | 64 | | | 3 | | 3 |
| 24 | 24 | Senior Loan | | Seattle, WA | | Life Science | | 10/1/2021 | | 188.0 | | | 140.3 | | | 87.3 | | | 21.1 | | | L + 3.1 | | 4.8 | | | $ 555 / SF | | 69 | | | 3 | 24 | Senior Loan | | Arlington, VA | | Multifamily | | 1/20/2022 | | 135.3 | | | 135.3 | | 135.3 | | | 133.1 | | 133.1 | | | 30.6 | | 30.6 | | | + | | + | 2.9 | | 3.1 | | | $443,550 / unit | | $443,550 / unit | | 78 | | | 3 | | 3 |
| 25 | 25 | Senior Loan | | Boston, MA | | Multifamily | | 3/29/2019 | | 138.0 | | | 138.0 | | | 137.0 | | | 29.5 | | | L + 2.7 | | 2.3 | | | $ 351,282 / unit | | 63 | | | 3 | 25 | Senior Loan | | Fontana, CA | | Industrial | | 5/11/2021 | | 132.0 | | | 132.0 | | 132.0 | | | 109.4 | | 109.4 | | | 42.9 | | 42.9 | | | + | | + | 4.7 | | 2.4 | | | $113 / SF | | $113 / SF | | 64 | | | 3 | | 3 |
| 26 | 26 | Senior Loan | | Dallas, TX | | Office | | 12/10/2021 | | 138.0 | | | 138.0 | | | 135.8 | | | 24.8 | | | L + 3.6 | | 4.9 | | | $ 432 / SF | | 68 | | | 3 | 26 | Senior Loan | | Fort Lauderdale, FL | | Hospitality | | 11/9/2018 | | 127.5 | | | 127.5 | | 127.5 | | | 127.5 | | 127.5 | | | 65.5 | | 65.5 | | | + | | + | 5.0 | | 0.2 | | | $368,497 / key | | $368,497 / key | | 66 | | | 3 | | 3 |
| 27 | 27 | Senior Loan | | Fort Lauderdale, FL | | Hospitality | | 11/9/2018 | | 130.0 | | | 130.0 | | | 130.0 | | | 24.1 | | | L + 3.4 | | 1.9 | | | $ 375,723 / key | | 66 | | | 3 | 27 | Senior Loan | | San Carlos, CA | | Life Science | | 2/1/2022 | | 195.9 | | | 125.0 | | 125.0 | | | 102.8 | | 102.8 | | | 30.5 | | 30.5 | | | + | | + | 3.6 | | 3.1 | | | $702 / SF | | $702 / SF | | 68 | | | 3 | | 3 |
| 28 | 28 | Senior Loan | | Fontana, CA | | Industrial | | 5/11/2021 | | 119.9 | | | 119.9 | | | 43.2 | | | 14.0 | | | L + 4.6 | | 4.4 | | | $ 37 / SF | | 64 | | | 3 | 28 | Senior Loan | | Cambridge, MA | | Life Science | | 12/22/2021 | | 401.3 | | | 115.7 | | 115.7 | | | 87.6 | | 87.6 | | | 21.3 | | 21.3 | | | + | | + | 4.0 | | 3.0 | | | $1,072 / SF | | $1,072 / SF | | 51 | | | 3 | | 3 |
| 29 | 29 | Senior Loan | | Irving, TX | | Multifamily | | 4/22/2021 | | 117.6 | | | 117.6 | | | 108.9 | | | 17.1 | | | L + 3.3 | | 4.4 | | | $ 119,949 / unit | | 70 | | 3 | 29 | Senior Loan(K) | | Philadelphia, PA | | Office | | 6/19/2018 | | 114.3 | | | 114.3 | | 114.3 | | | 114.3 | | 114.3 | | | 20.4 | | 20.4 | | | + | | + | 2.8 | | 3.1 | | | $117 / SF | | $117 / SF | | 64 | | | 3 | | 3 |
| 30 | 30 | Senior Loan | | Cambridge, MA | | Life Science | | 12/22/2021 | | 401.3 | | | 115.7 | | | 50.6 | | | 11.5 | | | L + 3.9 | | 5.0 | | | $ 469 / SF | | 51 | | | 3 | 30 | Senior Loan | | Pittsburgh, PA | | Student Housing | | 6/8/2021 | | 112.5 | | | 112.5 | | 112.5 | | | 112.5 | | 112.5 | | | 17.3 | | 17.3 | | | + | | + | 3.0 | | 2.4 | | | $155,602 / unit | | $155,602 / unit | | 74 | | | 3 | | 3 |
| 31 | 31 | Senior Loan | | Pittsburgh, PA | | Student Housing | | 6/8/2021 | | 112.5 | | | 112.5 | | | 112.5 | | | 16.9 | | | L + 2.9 | | 4.4 | | | $ 155,602 / bed | | 74 | | | 3 | 31 | Senior Loan | | West Hollywood, CA | | Multifamily | | 1/26/2022 | | 107.0 | | | 107.0 | | 107.0 | | | 105.1 | | 105.1 | | | 18.6 | | 18.6 | | | + | | + | 3.1 | | 3.1 | | | $2,839,392 / unit | | $2,839,392 / unit | | 65 | | | 4 | | 4 |
| 32 | 32 | Senior Loan | | Las Vegas, NV | | Multifamily | | 12/28/2021 | | 106.3 | | | 106.3 | | | 102.0 | | | 24.5 | | | L + 2.7 | | 5.0 | | | $ 193,182 / unit | | 61 | | | 3 | 32 | Senior Loan | | Las Vegas, NV | | Multifamily | | 12/28/2021 | | 106.3 | | | 106.3 | | 106.3 | | | 102.0 | | 102.0 | | | 17.4 | | 17.4 | | | + | | + | 2.8 | | 3.0 | | | $193,182 / unit | | $193,182 / unit | | 75 | | | 3 | | 3 |
| 33 | 33 | Senior Loan | | Doral, FL | | Multifamily | | 12/10/2021 | | 212.0 | | | 106.0 | | | 106.0 | | | 25.6 | | | L + 2.8 | | 4.9 | | | $ 335,975 / unit | | 77 | | | 3 | 33 | Senior Loan(L) | | Chicago, IL | | Office | | 7/15/2019 | | 105.0 | | | 105.0 | | 105.0 | | | 88.4 | | 88.4 | | | 19.9 | | 19.9 | | | + | | + | 2.3 | | 4.6 | | | $85 / SF | | $85 / SF | | 57 | | | 3 | | 3 |
| 34 | 34 | Senior Loan | | San Diego, CA | | Multifamily | | 10/20/2021 | | 103.5 | | | 103.5 | | | 103.5 | | | 18.3 | | | L + 2.8 | | 4.9 | | | $ 448,052 / unit | | 71 | | | 3 | 34 | Senior Loan | | San Diego, CA | | Multifamily | | 10/20/2021 | | 103.5 | | | 103.5 | | 103.5 | | | 103.5 | | 103.5 | | | 18.9 | | 18.9 | | | + | | + | 2.9 | | 2.9 | | | $448,052 / unit | | $448,052 / unit | | 71 | | | 4 | | 4 |
| 35 | 35 | Senior Loan | | Orlando, FL | | Multifamily | | 12/14/2021 | | 102.4 | | | 102.4 | | | 88.9 | | | 21.2 | | | L + 3.0 | | 5.0 | | | $ 234,565 / unit | | 74 | | | 3 | 35 | Senior Loan | | Boston, MA | | Industrial | | 6/28/2022 | | 285.5 | | | 100.0 | | 100.0 | | | 99.3 | | 99.3 | | | 20.5 | | 20.5 | | | + | | + | 3.0 | | 3.5 | | | $198 / SF | | $198 / SF | | 52 | | | 3 | | 3 |
| 36 | 36 | Senior Loan | | Brisbane, CA | | Life Science | | 7/22/2021 | | 95.0 | | | 95.0 | | | 85.0 | | | 16.3 | | | L + 3.0 | | 4.6 | | | $ 734 / SF | | 71 | | | 3 | 36 | Senior Loan | | Washington, D.C. | | Office | | 1/13/2022 | | 228.5 | | | 100.0 | | 100.0 | | | 65.8 | | 65.8 | | | 13.1 | | 13.1 | | | + | | + | 3.3 | | 4.1 | | | $241 / SF | | $241 / SF | | 55 | | | 3 | | 3 |
| 37 | 37 | Senior Loan | | State College, PA | | Student Housing | | 10/15/2019 | | 93.4 | | | 93.4 | | | 85.3 | | | 27.6 | | | L + 2.7 | | 2.9 | | | $ 71,474 / bed | | 64 | | | 3 | 37 | Senior Loan | | Phoenix, AZ | | Industrial | | 1/13/2022 | | 195.3 | | | 100.0 | | 100.0 | | | 58.1 | | 58.1 | | | 14.1 | | 14.1 | | | + | | + | 4.0 | | 3.1 | | | $57 / SF | | $57 / SF | | 57 | | | 3 | | 3 |
| | Investment(A) | | Location | | Property Type | | Investment Date | | Total Whole Loan(B) | | Committed Principal Amount(B) | | Current Principal Amount | | Net Equity(C) | | Coupon(D)(E) | | Max Remaining Term (Years)(D)(F) | | Loan Per SF / Unit / Key | | LTV(D)(G) | | Risk Rating |
| Investment(A) | | | Investment(A) | | Location | | Property Type | | Investment Date | | Total Whole Loan(B) | | Committed Principal Amount(B) | | Current Principal Amount | | Net Equity(C) | | Coupon(D)(E) | | Max Remaining Term (Years)(D)(F) | | Loan Per SF / Unit / Key(G) | | LTV(D)(H) | | Risk Rating |
| 38 | 38 | Senior Loan | | Dallas, TX | | Multifamily | | 12/23/2021 | | 90.0 | | | 90.0 | | | 77.5 | | | 18.7 | | | L + 2.8 | | 5.0 | | | $ 238,488 / unit | | 67 | | | 3 | 38 | | Senior Loan | Senior Loan | | Cary, NC | | Multifamily | | 11/21/2022 | | 100.0 | | | 100.0 | | 100.0 | | | 95.0 | | 95.0 | | | 18.2 | | 18.2 | | | + | | + | 3.4 | | 3.9 | | | $243,656 / unit | | $243,656 / unit | | 63 | | | 3 | | 3 |
| 39 | 39 | Senior Loan | | Miami, FL | | Multifamily | | 10/14/2021 | | 89.5 | | | 89.5 | | | 89.5 | | | 20.5 | | | L + 2.8 | | 4.9 | | | $ 304,422 / unit | | 76 | | | 3 | 39 | | Senior Loan | Senior Loan | | Orlando, FL | | Multifamily | | 12/14/2021 | | 97.4 | | | 97.4 | | 97.4 | | | 89.3 | | 89.3 | | | 23.3 | | 23.3 | | | + | | + | 3.1 | | 3.0 | | | $235,601 / unit | | $235,601 / unit | | 74 | | | 3 | | 3 |
| 40 | 40 | Senior Loan | | Denver, CO | | Multifamily | | 6/24/2021 | | 88.5 | | | 88.5 | | | 88.5 | | | 16.2 | | | L + 3.0 | | 4.5 | | | $ 295,000 / unit | | 77 | | | 3 | 40 | | Senior Loan | Senior Loan | | Brisbane, CA | | Life Science | | 7/22/2021 | | 95.0 | | | 95.0 | | 95.0 | | | 90.8 | | 90.8 | | | 18.0 | | 18.0 | | | + | | + | 3.1 | | 2.6 | | | $784 / SF | | $784 / SF | | 71 | | | 3 | | 3 |
| 41 | 41 | Senior Loan | | Dallas, TX | | Office | | 1/22/2021 | | 87.0 | | | 87.0 | | | 87.0 | | | 21.1 | | | L + 3.3 | | 4.1 | | | $ 288 / SF | | 65 | | | 3 | 41 | | Senior Loan | Senior Loan | | Brandon, FL | | Multifamily | | 1/13/2022 | | 90.3 | | | 90.3 | | 90.3 | | | 67.4 | | 67.4 | | | 10.1 | | 10.1 | | | + | | + | 3.1 | | 3.1 | | | $193,586 / unit | | $193,586 / unit | | 75 | | | 3 | | 3 |
| 42 | 42 | Senior Loan | | Charlotte, NC | | Multifamily | | 12/14/2021 | | 86.8 | | | 86.8 | | | 76.0 | | | 18.1 | | | L + 3.0 | | 5.0 | | | $ 206,522 / unit | | 74 | | | 3 | 42 | | Senior Loan | Senior Loan | | Dallas, TX | | Multifamily | | 12/23/2021 | | 90.0 | | | 90.0 | | 90.0 | | | 80.1 | | 80.1 | | | 17.2 | | 17.2 | | | + | | + | 2.9 | | 3.0 | | | $246,511 / unit | | $246,511 / unit | | 67 | | | 3 | | 3 |
| 43 | 43 | Senior Loan | | New York, NY | | Multifamily | | 3/29/2018 | | 86.0 | | | 86.0 | | | 86.0 | | | 13.2 | | | L + 4.0 | | 1.3 | | | $ 462,366 / unit | | 63 | | | 2 | 43 | | Senior Loan | Senior Loan | | Miami, FL | | Multifamily | | 10/14/2021 | | 89.5 | | | 89.5 | | 89.5 | | | 89.5 | | 89.5 | | | 17.4 | | 17.4 | | | + | | + | 2.9 | | 2.9 | | | $304,422 / unit | | $304,422 / unit | | 76 | | | 3 | | 3 |
| 44 | 44 | Senior Loan | | Mesa, AZ | | Industrial | | 5/4/2021 | | 84.3 | | | 84.3 | | | 57.0 | | | 23.9 | | | L+ 3.2 | | 4.4 | | | $ 66 / SF | | 55 | | | 3 | 44 | | Senior Loan | Senior Loan | | Dallas, TX | | Office | | 1/22/2021 | | 87.0 | | | 87.0 | | 87.0 | | | 87.0 | | 87.0 | | | 14.6 | | 14.6 | | | + | | + | 3.4 | | 2.1 | | | $294 / SF | | $294 / SF | | 63 | | | 3 | | 3 |
| 45 | 45 | Senior Loan | | Hollywood, FL | | Multifamily | | 12/20/2021 | | 81.0 | | | 81.0 | | | 81.0 | | | 19.4 | | | L + 3.0 | | 5.0 | | | $ 327,935 / unit | | 74 | | | 3 | 45 | | Senior Loan | Senior Loan | | San Antonio, TX | | Multifamily | | 6/1/2022 | | 246.5 | | | 86.3 | | 86.3 | | | 80.3 | | 80.3 | | | 19.8 | | 19.8 | | | + | | + | 2.8 | | 3.4 | | | $103,007 / unit | | $103,007 / unit | | 68 | | | 3 | | 3 |
| 46 | 46 | Senior Loan | | Seattle, WA | | Office | | 3/20/2018 | | 80.7 | | | 80.7 | | | 80.7 | | | 13.4 | | | L + 4.1 | | 1.3 | | | $ 468 / SF | | 56 | | | 3 | 46 | | Senior Loan | Senior Loan | | Scottsdale, AZ | | Multifamily | | 5/9/2022 | | 169.0 | | | 84.5 | | 84.5 | | | 84.5 | | 84.5 | | | 13.0 | | 13.0 | | | + | | + | 2.9 | | 3.4 | | | $457,995 / unit | | $457,995 / unit | | 64 | | | 3 | | 3 |
| 47 | 47 | Senior Loan | | Brooklyn, NY | | Hospitality | | 1/18/2019 | | 76.2 | | | 76.2 | | | 76.2 | | | 16.2 | | | L + 2.9 | | 2.1 | | | $ 389,000 / key | | 69 | | | 4 | 47 | | Senior Loan | Senior Loan | | Raleigh, NC | | Multifamily | | 4/27/2022 | | 82.9 | | | 82.9 | | 82.9 | | | 80.1 | | 80.1 | | | 16.7 | | 16.7 | | | + | | + | 3.0 | | 3.4 | | | $250,170 / unit | | $250,170 / unit | | 68 | | | 4 | | 4 |
| 48 | 48 | Senior Loan | | Phoenix, AZ | | Single Family Rental | | 4/22/2021 | | 72.1 | | | 72.1 | | | 15.7 | | | 8.1 | | | L + 4.8 | | 4.4 | | | $ 34,268 / unit | | 50 | | | 3 | 48 | | Senior Loan | Senior Loan | | Hollywood, FL | | Multifamily | | 12/20/2021 | | 81.0 | | | 81.0 | | 81.0 | | | 81.0 | | 81.0 | | | 15.1 | | 15.1 | | | + | | + | 3.1 | | 3.0 | | | $327,935 / unit | | $327,935 / unit | | 74 | | | 3 | | 3 |
| 49 | 49 | Senior Loan | | Arlington, VA | | Multifamily | | 10/23/2020 | | 141.8 | | | 70.9 | | | 70.9 | | | 11.5 | | | L + 3.8 | | 3.8 | | | $ 393,858 / unit | | 73 | | | 3 | 49 | | Senior Loan | Senior Loan | | Charlotte, NC | | Multifamily | | 12/14/2021 | | 79.3 | | | 79.3 | | 79.3 | | | 75.5 | | 75.5 | | | 12.0 | | 12.0 | | | + | | + | 3.1 | | 3.0 | | | $205,055 / unit | | $205,055 / unit | | 74 | | | 3 | | 3 |
| 50 | 50 | Senior Loan | | Denver, CO | | Multifamily | | 9/14/2021 | | 70.3 | | | 70.3 | | | 69.3 | | | 12.0 | | | L + 2.7 | | 4.8 | | | $ 286,157 / unit | | 78 | | | 3 | 50 | | Senior Loan(M) | Senior Loan(M) | | Various | | Industrial | | 6/30/2021 | | 153.0 | | | 76.5 | | 76.5 | | | 63.7 | | 63.7 | | | 27.1 | | 27.1 | | | + | | + | 5.5 | | 2.5 | | | $74 / SF | | $74 / SF | | 59 | | | 3 | | 3 |
| 51 | 51 | Senior Loan | | Queens, NY | | Industrial | | 7/21/2017 | | 70.1 | | | 70.1 | | | 67.5 | | | 17.3 | | | L + 3.0 | | 0.6 | | | $ 112 / SF | | 77 | | | 4 | 51 | | Senior Loan | Senior Loan | | Phoenix, AZ | | Single Family Rental | | 4/22/2021 | | 72.1 | | | 72.1 | | 72.1 | | | 67.7 | | 67.7 | | | 17.7 | | 17.7 | | | + | | + | 4.9 | | 2.4 | | | $157,092 / unit | | $157,092 / unit | | 50 | | | 3 | | 3 |
| 52 | 52 | Senior Loan | | Washington, D.C. | | Multifamily | | 12/4/2020 | | 69.0 | | | 69.0 | | | 66.3 | | | 10.3 | | | L + 3.5 | | 3.9 | | | $ 265,132 / unit | | 63 | | | 3 | 52 | | Senior Loan | Senior Loan | | Denver, CO | | Multifamily | | 9/14/2021 | | 70.3 | | | 70.3 | | 70.3 | | | 70.3 | | 70.3 | | | 10.7 | | 10.7 | | | + | | + | 2.8 | | 2.8 | | | $290,496 / unit | | $290,496 / unit | | 78 | | | 3 | | 3 |
| 53 | 53 | Senior Loan | | Dallas, TX | | Multifamily | | 8/18/2021 | | 68.2 | | | 68.2 | | | 68.2 | | | 9.6 | | | L + 3.8 | | 4.7 | | | $ 189,444 / unit | | 70 | | | 3 | 53 | | Senior Loan | Senior Loan | | Washington, D.C. | | Multifamily | | 12/4/2020 | | 69.0 | | | 69.0 | | 69.0 | | | 66.8 | | 66.8 | | | 10.7 | | 10.7 | | | + | | + | 3.6 | | 1.9 | | | $267,000 / unit | | $267,000 / unit | | 63 | | | 3 | | 3 |
| 54 | 54 | Senior Loan | | Austin, TX | | Multifamily | | 9/12/2019 | | 67.5 | | | 67.5 | | | 67.5 | | | 10.5 | | | L + 2.5 | | 2.7 | | | $ 191,218 / unit | | 74 | | | 3 | 54 | | Senior Loan | Senior Loan | | Dallas, TX | | Multifamily | | 8/18/2021 | | 68.2 | | | 68.2 | | 68.2 | | | 68.2 | | 68.2 | | | 10.2 | | 10.2 | | | + | | + | 3.9 | | 2.7 | | | $189,444 / unit | | $189,444 / unit | | 70 | | | 3 | | 3 |
| 55 | 55 | Senior Loan | | Nashville, TN | | Hospitality | | 12/9/2021 | | 66.0 | | | 66.0 | | | 64.3 | | | 9.7 | | | L + 3.6 | | 5.0 | | | $ 279,498 / key | | 68 | | | 3 | 55 | | Senior Loan | Senior Loan | | Manassas Park, VA | | Multifamily | | 2/25/2022 | | 68.0 | | | 68.0 | | 68.0 | | | 68.0 | | 68.0 | | | 13.3 | | 13.3 | | | + | | + | 2.7 | | 3.2 | | | $223,684 / unit | | $223,684 / unit | | 73 | | | 3 | | 3 |
| 56 | 56 | Senior Loan | | Atlanta, GA | | Multifamily | | 12/10/2021 | | 61.5 | | | 61.5 | | | 55.4 | | | 13.3 | | | L + 2.9 | | 5.0 | | | $ 183,542 / unit | | 67 | | | 3 | 56 | | Senior Loan | Senior Loan | | Plano, TX | | Multifamily | | 3/31/2022 | | 67.8 | | | 67.8 | | 67.8 | | | 67.4 | | 67.4 | | | 19.0 | | 19.0 | | | + | | + | 2.8 | | 3.3 | | | $253,226 / unit | | $253,226 / unit | | 75 | | | 3 | | 3 |
| 57 | 57 | Senior Loan | | Durham, NC | | Multifamily | | 12/15/2021 | | 60.0 | | | 60.0 | | | 50.0 | | | 49.4 | | | L + 2.9 | | 5.0 | | | $ 144,795 / unit | | 67 | | | 3 | 57 | | Senior Loan | Senior Loan | | Nashville, TN | | Hospitality | | 12/9/2021 | | 66.0 | | | 66.0 | | 66.0 | | | 64.7 | | 64.7 | | | 10.1 | | 10.1 | | | + | | + | 3.7 | | 3.0 | | | $281,237 / key | | $281,237 / key | | 68 | | | 3 | | 3 |
| 58 | 58 | Senior Loan | | Sharon, MA | | Multifamily | | 12/1/2021 | | 56.9 | | | 56.9 | | | 56.9 | | | 13.8 | | | L + 2.8 | | 4.9 | | | $ 296,484 / unit | | 70 | | | 3 | 58 | | Senior Loan | Senior Loan | | Oakland, CA | | Office | | 10/23/2020 | | 205.5 | | | 64.4 | | 64.4 | | | 45.8 | | 45.8 | | | 7.2 | | 7.2 | | | + | | + | 4.4 | | 1.9 | | | $141 / SF | | $141 / SF | | 55 | | | 2 | | 2 |
| 59 | 59 | Senior Loan | | Georgetown, TX | | Multifamily | | 12/16/2021 | | 41.8 | | | 41.8 | | | 41.8 | | | 41.4 | | | L + 3.3 | | 5.0 | | | $ 199,048 / unit | | 68 | | | 3 | 59 | | Senior Loan | Senior Loan | | Atlanta, GA | | Multifamily | | 12/10/2021 | | 61.5 | | | 61.5 | | 61.5 | | | 59.3 | | 59.3 | | | 14.8 | | 14.8 | | | + | | + | 3.0 | | 3.0 | | | $196,421 / unit | | $196,421 / unit | | 67 | | | 3 | | 3 |
| 60 | 60 | Senior Loan(K) | | New York, NY | | Condo (Residential) | | 8/4/2017 | | 39.9 | | | 39.9 | | | 39.9 | | | 20.4 | | | L + 4.2 | | 0.3 | | | $ 1,333 / SF | | 73 | | | 4 | 60 | | Senior Loan | Senior Loan | | Durham, NC | | Multifamily | | 12/15/2021 | | 60.0 | | | 60.0 | | 60.0 | | | 56.5 | | 56.5 | | | 10.1 | | 10.1 | | | + | | + | 3.0 | | 3.0 | | | $163,879 / unit | | $163,879 / unit | | 67 | | | 3 | | 3 |
| 61 | 61 | Senior Loan | | Denver, CO | | Industrial | | 12/11/2020 | | 28.8 | | | 28.8 | | | 10.7 | | | 10.3 | | | L + 3.8 | | 4.0 | | | $ 21 / SF | | 61 | | | 3 | 61 | | Senior Loan | Senior Loan | | San Antonio, TX | | Multifamily | | 4/20/2022 | | 57.6 | | | 57.6 | | 57.6 | | | 56.4 | | 56.4 | | | 10.6 | | 10.6 | | | + | | + | 2.7 | | 3.4 | | | $164,950 / unit | | $164,950 / unit | | 79 | | | 3 | | 3 |
| Total/Weighted Average
Senior Loans Unlevered | | $ | 10,004.1 | | | $ | 8,051.8 | | | $ | 6,636.2 | | | $ | 1,623.6 | | | L + 3.2% | | 3.6 | | | 68 | % | | 2.9 |
| Non-Senior Loans | |
| 62 | | 62 | | Senior Loan | | Queens, NY | | Industrial | | 2/22/2022 | | 55.3 | | | 55.3 | | | 54.7 | | | 13.9 | | | + | 4.0 | | 0.7 | | | $89 / SF | | 68 | | | 3 |
| 63 | | 63 | | Senior Loan | | Sharon, MA | | Multifamily | | 12/1/2021 | | 51.9 | | | 51.9 | | | 51.9 | | | 7.7 | | | + | 2.9 | | 2.9 | | | $270,443 / unit | | 70 | | | 3 |
| 64 | | 64 | | Senior Loan | | Reno, NV | | Industrial | | 4/28/2022 | | 140.4 | | | 50.5 | | | 50.5 | | | 11.4 | | | + | 2.7 | | 3.4 | | | $117 / SF | | 74 | | | 3 |
| 65 | | 65 | | Senior Loan | | Carrollton, TX | | Multifamily | | 4/1/2022 | | 48.5 | | | 48.5 | | | 47.5 | | | 13.8 | | | + | 2.9 | | 3.3 | | | $148,428 / unit | | 74 | | | 3 |
| 66 | | 66 | | Senior Loan | | Dallas, TX | | Multifamily | | 4/1/2022 | | 43.9 | | | 43.9 | | | 42.6 | | | 11.6 | | | + | 2.9 | | 3.3 | | | $119,706 / unit | | 73 | | | 3 |
| 67 | | 67 | | Senior Loan | | Georgetown, TX | | Multifamily | | 12/16/2021 | | 41.8 | | | 41.8 | | | 41.8 | | | 10.3 | | | + | 3.4 | | 3.0 | | | $199,048 / unit | | 68 | | | 3 |
| 68 | | 68 | | Senior Loan | | San Diego, CA | | Multifamily | | 4/29/2022 | | 203.0 | | | 40.0 | | | 39.7 | | | 6.2 | | | + | 2.6 | | 3.4 | | | $455,485 / unit | | 63 | | | 3 |
| 69 | | 69 | | Senior Loan | | Denver, CO | | Industrial | | 12/11/2020 | | 15.4 | | | 15.4 | | | 12.1 | | | 4.4 | | | + | 3.8 | | 2.0 | | | $47 / SF | | 61 | | | 2 |
| Total/Weighted Average
Senior Loans Unlevered | | | Total/Weighted Average
Senior Loans Unlevered | | $ | 11,842.2 | | | $ | 8,390.1 | | | $ | 7,558.0 | | | $ | 1,821.0 | | | | 3.3% | | 2.7 | | | | | 66 | % | | 3.2 |
| Non-Senior Loans | |
| CMBS B-Pieces | |
| CMBS B-Pieces | |
| CMBS B-Pieces | |
| 1 | 1 | Corporate | | n.a. | | Multifamily | | 12/11/2020 | | 102.6 | | | 41.1 | | | 41.1 | | | 40.5 | | | L + 12.0 | | 4.0 | | | n.a. | | n.a. | | 3 |
| Total/Weighted Average
Non-Senior Loans Unlevered | | $ | 102.6 | | | $ | 41.1 | | | $ | 41.1 | | | $ | 40.5 | | | 12.3% | | 4.0 | | | n.a. | | 3.0 |
| CMBS B-Pieces | |
| 1 | 1 | RECOP I(H) | | Various | | Various | | 2/13/2017 | | n.a. | | 40.0 | | | 35.7 | | | 35.7 | | | 4.6 | | 7.4 | | | n.a. | | 58 | | | n.a. |
| Total/Weighted Average
CMBS B-Pieces Unlevered | | $ | 40.0 | | | $ | 35.7 | | | $ | 35.7 | | | 4.6% | | 7.4 | | | 58 | % | |
| Real Estate Owned | |
| 1 | 1 | Real Estate Asset | | Portland, OR | | Retail | | 12/16/2021 | | n.a. | | n.a. | | 78.6 | | | 78.4 | | | n.a. | | n.a. | | n.a. | | n.a. | | n.a. | RECOP I(N) | | Various | | 2/13/2017 | | n.a. | | 40.0 | | | 35.7 | | 35.7 | | | 35.7 | | 35.7 | | | | 4.7 | | | 4.7 | | 5.5 | | | n.a. | | n.a. | | 58 | | | n.a. | | n.a. |
| Total/Weighted Average
Real Estate Owned | | $ | 78.6 | | | $ | 78.4 | | |
| Grand Total / Weighted Average | | $ | 8,132.8 | | | $ | 6,791.5 | | | $ | 1,778.2 | | | 4.0% | | 3.6 | | | 68 | % | | 2.9 |
| Total/Weighted Average
CMBS B-Pieces Unlevered | |
| Real Estate Owned | |
| Real Estate Owned | |
| Real Estate Owned | |
| 1 | |
| 1 | |
| 1 | | | Real Estate Asset | | Portland, OR | | Retail | | 12/16/2021 | | n.a. | | 82.1 | | | 82.1 | | | | n.a. | | n.a. |
| | | | | | | | | | | | | | | | | | | | | | | | | | | | | | | | | | | | | | | | | | | | | | | | | | | | | | | | | | | | | | | | | | | | | | | | | | | | | | | | |
| Investment(A) | | Location | | Property Type | | Investment Date | | Total Whole Loan(B) | | Committed Principal Amount(B) | | Current Principal Amount | | Net Equity(C) | | Coupon(D)(E) | | Max Remaining Term (Years)(D)(F) | | Loan Per SF / Unit / Key(G) | | LTV(D)(H) | | Risk Rating |
| 2 | Real Estate Asset | | Philadelphia, PA | | Office | | 12/22/2023 | | n.a. | | n.a. | | $ | 76.5 | | | $ | 26.5 | | | | n.a. | | n.a. | | n.a. | | n.a. | | n.a. |
| Total/Weighted Average
Real Estate Owned | | | | | | $ | 158.6 | | | $ | 108.6 | | | | | | | | | | | | |
| | | | | | | | | | | | | | | | | | | | |
| | | | | | | | | | | | | | | | | | | | | | | | | | |
| Grand Total / Weighted Average | | | | $ | 8,430.1 | | | $ | 7,752.3 | | | $ | 1,965.2 | | | | 8.7% | | 2.7 | | | | | 66 | % | | 3.2 |
* Numbers presented may not foot due to rounding.
(A) Our total portfolio represents the current principal amount on senior mezzanine and corporatemezzanine loans, net equity in RECOP I, which holds CMBS B-Piece investments, and net carrying value of our sole REO investment.investments. Excludes one impaired mezzanine loan with an outstanding principal of $5.5$5.5 million that was fully written off.
For Senior Loan 9, the total whole loan is $199.4 million, including (i) a fully funded senior mortgage loan of $120.0 million, at an interest rate of S+2.25% and (ii) a mezzanine note with a commitment of $79.4 million, of which $74.4 million was funded as of December 31, 2023, at a fixed interest rate of 4.5%. The mezzanine note interest is payment-in-kind (“PIK Interest”), which is capitalized, compounded, and added to the outstanding principal balance of the respective loans.
For Senior Loan 1211, the total whole loan is $375.0 million, co-originated and co-funded by us and a KKR affiliate. Our interest wasis 50% of the loan or $187.5 million, of which $150.0 million in senior notes were syndicated to a third party. Post syndication, we retained a mezzanine loan with a commitment of $37.5 million, fully funded as of December 31, 2021,2023, at an interest rate of L+7.9%.
For Senior LoaS+n 13,7.96% the total whole loan is $186.0 million, of which an $81.6 million senior note was syndicated to a third party lender. Post syndication, we retained the mezzanine loan and a 45% interest in the senior loan with a total commitment of $104.4 million, of which $100.7 million was funded as of December 31, 2021, at a blended interest rate of L+4.7%.
For Senior Loan 22,31, the total whole loan is $509.9$107.0 million, including (i) a fully funded senior mortgage loan of $102.0 million, at an interest rate of S+3.06%, (ii) a senior mezzanine note with $2.3 million funded as of December 31, 2023, at a fixed interest rate of 10.0% and (iii) a fully funded junior mezzanine note of $0.8 million, at a fixed interest rate 10.0% with certain profit share provisions, as defined in the loan agreement.
For Senior Loan 58, the total whole loan is $205.5 million, co-originated and co-funded by us and a KKR affiliate. Our interest wasis 31% of the loan or $159.7$64.4 million, of which $134.7$54.3 million in senior notes were syndicated to third party lenders. Post syndication, we retained a mezzanine loan with a commitment of $25.0$10.1 million, of which $16.7$7.2 million was funded as of December 31, 2021,2023, at an interest rate of L+12.9%S+13.02%.
(B) Total Whole Loan represents total commitment of the entire whole loan originated. Committed Principal Amount includes participations by KKR affiliated entities and third parties that are syndicated/sold.
(C) Net equity reflects (i) the amortized cost basis of our loans, net of borrowings; and (ii) the cost basis of our investments in RECOP I and REO.
(D) Weighted average is weighted by the current principal amount for our senior mezzanine and corporatemezzanine loans and by net equity for our RECOP I CMBS B-Pieces. Risk-rated 5 loans are excluded from the weighted average LTV.
(E) L = the greater of one-month USD LIBOR; spot rate of 0.10%, and the applicable contractual LIBOR floor, included in portfolio-wide averages representedCoupon expressed as fixed rates.spread over Term SOFR.
(F) Max remaining term (years) assumes all extension options are exercised, if applicable.
(G) Loan Per SF / Unit / Key is based on the current principal amount divided by the current SF / Unit / Key. For Senior Loans 2, 3, 6, 20, 25, 28, 37, 50, 51, and 69, Loan Per SF / Unit / Key is calculated as the total commitment amount of the loan divided by the proposed SF / Unit / Key.
(H) For senior loans, LTV is generally based on the initial loan amount divided by the as-is appraised value as of the date the loan was originated or by the current principal amount as of the date of the most recent as-is appraised value; for mezzanine loans, LTV is based on the current balance of the whole loan divided by the as-is appraised value as of the date the loan was originated; for RECOP I CMBS B-Pieces, LTV is based on the weighted average LTV of the underlying loan pool at issuance. Weighted Average LTV excludes one fully funded corporate loan to a multifamily operator with an outstanding principal amount of $41.1 millionrisk-rated 5 loans.
For Senior Loan 6,18, LTV is based on the initial loan amount divided by the appraised bulk sale value assuming a condo-conversion and no renovation.
For Senior Loan 60, LTV is based on the current principal amount divided by the adjusted appraised gross sellout value net of sales cost.
For Senior Loans 2, 7, 9,3, 6, 20, 25, 28, 30, 44, 4837, 50, 51, and 61,69, LTV is calculated as the total commitment amount of the loan divided by the as-stabilized value as of the date the loan was originated.
(H) Represents our investment in an aggregator vehicle alongside RECOP I that invests in CMBS B-Pieces. Committed principal represents our total commitment to the aggregator vehicle whereas current principal represents the current funded amount.
(I) Senior loans include senior mortgages and similar credit quality investments, including junior participations in our originated senior loans for which we have syndicated the senior participations and retained the junior participations for our portfolio and excludes vertical loan participations.
(J) Senior Loan 14 and Senior Loan 18 were fully repaid in January 2024.
(K) For Senior LoaLoan 29, the Total Whole Loan, Committed Principal Amount, and Current Principal Amount excludes junior mezzanine notes with a total outstanding principal of $25.0 million that was fully written off.
(L) n 9,For Senior Loan 33, the Total Whole Loan, Committed Principal Amount, and Current Principal Amount excludes a subordinated note with a total outstanding principal of $15.0 million that was fully written off.
(M) For Senior Loan 50, the total whole loan facility is $425.0$153.0 million co-originated and co-funded by us and a KKR affiliate. Our interest was 50% of the facility, or $212.5$76.5 million. The facility is comprised of
individual cross-collateralized whole loans. As of December 31, 2021,2023, there were three underlyingwere five underlying senior loanloans in the facility with a commitment of $31.6$76.5 million and outstanding principal of $3.7$63.7 million.
(K) For S(N) enior Loan 60, Loan per SF of $1,333 is based onRepresents our investment in an aggregator vehicle alongside RECOP I that invests in CMBS B-Pieces. Committed principal represents our total commitment to the allocated loan amount ofaggregator vehicle whereas current principal represents the residential units. Excluding the value of the retail and parking components of the collateral, the Loan per SF is current funded amount.
$1,926 based on allocating the full amount of the loan to only the residential units.
Portfolio Surveillance and Credit Quality
Our Manager actively manages our portfolio and assesses the risk of any deterioration in credit quality by quarterly evaluating the performance of the underlying property, the valuation of comparable assets as well as the financial wherewithal of the associated borrower. Our loan documents generally give us the right to receive regular property, borrower and guarantor financial statements; approve annual budgets and tenant leases; and enforce loan covenants and remedies. In addition, our Manager evaluates the macroeconomic environment, prevailing real estate fundamentals and micro-market dynamics where the underlying property is located. Through site inspections, local market experts and various data sources, as part of its risk assessment, our Manager monitors criteria such as new supply and tenant demand, market occupancy and rental rate trends, and capitalization rates and valuation trends.
We maintain a robust asset management relationship with our borrowers and have utilized these relationships to proactively addressmaximize the potential impacts of the COVID-19 pandemic on our loans secured by properties experiencing cash flow pressure, most significantly hospitality and retail assets. Someperformance of our borrowers have indicated that due to the impactportfolio, including during periods of the COVID-19 pandemic, they will be unable to timely execute their business plans, have had to temporarily close their businesses, or have experienced other negative business consequences and have requested temporary interest deferral or forbearance, or other modifications of their loans. Accordingly, discussions we have had with our borrowers have addressed potential near-term defensive loan modifications, which could include repurposing of reserves, temporary deferrals of interest, or performance test or covenant waivers on loans collateralized by assets directly impacted by the COVID-19 pandemic, and which would generally be coupled with an additional equity commitment and/or guaranty from sponsors.volatility.
We believe our loan sponsors are generally committed to supporting assets collateralizing our loans through additional equity investments, and that we will benefit from our long-standing core business model of originating senior loans collateralized by large assets in major markets with experienced, well-capitalized institutional sponsors. While we believe the principal amounts of our loans are generally adequately protected by underlying collateral value, there is a risk that we will not realize the entire principal value of certain investments.
In addition to ongoing asset management, our Manager performs a quarterly review of our portfolio whereby each loan is assigned a risk rating of 1 through 5, from lowest risk to highest risk. Our Manager is responsible for reviewing, assigning and updating the risk ratings for each loan on a quarterly basis.at least once per quarter. The risk ratings are based on many factors, including, but not limited to, underlying real estate performance, and asset value, values of comparable properties, durability and quality of property cash flows, sponsor experience and financial wherewithal, and the existence of a risk-mitigating loan structure. Additional key considerations include LTVs, debt service coverage ratios, real estate and credit market dynamics, and risk of default or principal loss. In performing this review and assigning a risk rating with respect to each loan, our Manager assesses these various factors holistically and considers these factors on a case-by-case basis, determining whether to give additional weight to any of these factors based upon the specific facts and circumstances of each loan. Based on a five-point scale, our loans are rated "1" through "5," from less risk to greater risk, which ratings are defined as follows: 1 (Very Low Risk); 2 (Low Risk); 3 (Medium Risk); 4 (High Risk/Potential for Loss); and 5 (Impaired/Loss Likely).
1—Very Low Risk—The underlying property performance has surpassed underwritten expectations, andAs of December 31, 2023, the sponsor’s business plan is generally complete. The property demonstrates stabilized occupancy and/or rental rates resulting in strong current cash flow and/or a very low LTV (<65%). At the levelaverage risk rating of performance, it is very likelyour loan portfolio was 3.2, weighted by total loan exposure, consistent with that the underlying loan can be refinanced easily in the period’s prevailing capital market conditions.as of December 31, 2022.
2—Low Risk—The underlying property performance has matched or exceeded underwritten expectations, and the sponsor’s business plan | | | | | | | | | | | | | | | | | | | | | | | | | | | | | | | | | | | | | | | | | | | | | | | | | | | | |
| December 31, 2023 | | | | December 31, 2022 |
| Risk Rating | | Number of Loans(A) | | Carrying Value | | Total Loan Exposure(A) | | Total Loan Exposure %* | | | | Number of Loans(A) | | Carrying Value | | Total Loan Exposure(B) | | Total Loan Exposure %* |
| 1 | | — | | | $ | — | | | $ | — | | | — | % | | | | — | | | $ | — | | | $ | — | | | — | % |
| 2 | | 2 | | | 19,392 | | | 57,925 | | | 1 | | | | | — | | | — | | | — | | | — | |
| 3 | | 60 | | | 6,493,506 | | | 6,511,894 | | | 86 | | | | | 70 | | | 6,560,166 | | | 6,864,941 | | | 88 | |
| 4 | | 4 | | | 325,286 | | | 476,112 | | | 6 | | | | | 3 | | | 443,957 | | | 446,322 | | | 6 | |
| 5 | | 3 | | | 505,364 | | | 512,105 | | | 7 | | | | | 3 | | | 490,015 | | | 489,214 | | | 6 | |
| Total loan receivable | | 69 | | | $ | 7,343,548 | | | $ | 7,558,036 | | | 100 | % | | | | 76 | | | $ | 7,494,138 | | | $ | 7,800,477 | | | 100 | % |
| Allowance for credit losses | | (210,470) | | | | | | | | | | | (106,974) | | | | | |
| Loan receivable, net | | | | $ | 7,133,078 | | | | | | | | | | | $ | 7,387,164 | | | | | |
*Numbers presented may be ahead of schedule or has achieved some or many of the major milestones from a risk mitigation perspective. The property has achieved improving occupancy at market rents, resulting in sufficient current cash flow and/or a low LTV (65%-70%). Operating trends are favorable, and the underlying loan can be refinanced in today’s prevailing capital market conditions. The sponsor/manager is well capitalized or has demonstrated a history of success in owning or operating similar real estate.not foot due to rounding.
(A) Excludes three fully written off risk-rated 5 loans with a combined outstanding principal balance of $45.5 million as of December 31, 2023.
3—Average Risk—The underlying property performanceExcludes one fully written off risk-rated 5 loan with an outstanding principal balance of $5.5 million as of December 31, 2022.
(B) In certain instances, KREF finances its loans through the non-recourse sale of a senior interest that is in-line with underwritten expectations, or the sponsor may benot included in the early stagesconsolidated financial statements. Total loan exposure includes the entire loan KREF originated and financed, including $188.6 million and $263.1 million of executing its business plan. Current cash flow supports debt service payments, or there is an ample interest reserve or loan structure in place to provide the sponsor time to execute the value-improvement plan. The property exhibits a moderate LTV (<75%). Loan structure appropriately mitigates additional risks. The sponsor/manager has a stable credit historysuch non-consolidated interests as of December 31, 2023 and experience owning or operating similar real estate.
4—High Risk/Potential for Loss—AIn January 2023, we completed the modification of a risk-rated 5 senior office loan thatlocated in Philadelphia, PA, with an outstanding principal balance of $161.0 million. The terms of the modification included, among others, a $25.0 million principal repayment and a restructure of the $136.0 million senior loan (after the $25.0 million repayment) into (i) a $116.5 million committed senior mortgage loan (with $5.5 million in unfunded commitment) and (ii) a $25.0 million junior mezzanine note. The restructured senior loan earns a coupon rate of S+2.75% and has a risknew term of realizingup to four years, assuming all extension options are exercised. The $25.0 million junior mezzanine note is subordinate to a principal loss. The underlying property performance is behind underwritten expectations, ornew $41.5 million committed senior mezzanine note held by the sponsor is behind schedule(with $16.5 million in executing its business plan. The underlying market fundamentals may have deteriorated, comparable property valuations may be declining or property occupancy has been volatile, resulting in current cash flow that may not support debt service payments. The loan exhibits a high LTV (>80%), andunfunded commitment). As of December 31, 2022, $25.0 million of the loan covenants are unlikelywas deemed uncollectible and written off, which was applied to fully mitigate some risks. Interest payments may come from an interest reserve or sponsor equity.
5—Impaired/Loss Likely—A loan that has a very high risk of realizing a principal loss or has otherwise incurred a principal loss. The underlying property performance is significantly behind underwritten expectations, the sponsor has failed to execute its business plan and/or the sponsor has missed interest payments. The market fundamentals have deteriorated, or property performance has unexpectedly declined or valuations for comparable properties have declined meaningfully since loan origination. Current cash flow does not support debt service payments. With the current capital structure, the sponsor might not be incentivized to protect its equity without a restructuringjunior mezzanine note upon completion of the loan.modification. This loan modification was accounted for as a new loan for GAAP purposes. The loan exhibits a very high LTV (>90%), and default may be imminent.
During the fourth quarter of 2021, we took title to one defaultedrestructured senior retail loan with an outstanding principal balance and net carrying value of $109.6$114.3 million and $69.3 million, respectively,was risk-rated 3 as of September 30, 2021; such acquisition was accounted for as an asset acquisition under ASC 805. Accordingly, we recognized the property on our balance sheet as REO with a carrying value of $78.6 million, which included the estimated fair value of the property and capitalized transaction costs. In addition, we assumed $2.0 million in other net assets of the REO. Accordingly, in the fourth quarter we recognized an $8.2 million GAAP gain from the reversal of the allowance for credit losses and recognized a $32.1 million write-off through distributable earnings. In addition, in the fourth quarter of 2021, we wrote off $0.9 million remaining outstanding balance of an impaired loan and recognized the write off in GAAP earnings and through distributable earnings.December 31, 2023.
In June 2023, we completed the modification of a risk-rated 4 senior multifamily loan located in West Hollywood, CA, with an outstanding principal balance of $102.0 million as of March 31, 2023. The terms of the modification included, among others, an additional borrower deposit in escrow in exchange for an upsize in the loan commitment structured as (i) an accompanying senior mezzanine note with a commitment of $4.2 million, at a fixed interest rate of 10.0%, and (ii) an accompanying junior mezzanine note with a commitment of $0.8 million, at a fixed interest rate of 10.0% with certain profit share provisions, as defined in the loan agreement. As of December 31, 2021,2023, the average risk ratingsenior mezzanine note had an outstanding principal balance of our$2.3 million, while the junior mezzanine note was fully funded. The restructured whole loan portfoliowith an outstanding principal balance of $105.1 million was 2.9 (Average Risk), weighted by total loan exposure, as compared to 3.0 (Average Risk) as of September 30, 2021.
| | | | | | | | | | | | | | | | | | | | | | | | | | | | | | | | | | | | | | | | | | | | | | | | | | | | | | | | |
| December 31, 2021 | | September 30, 2021 |
| Risk Rating | | Number of Loans | | Net Book Value | | Total Loan Exposure(A) | | Total Loan Exposure % | | Risk Rating | | Number of Loans | | Net Book Value | | Total Loan Exposure(A) | | Total Loan Exposure % |
| 1 | | 1 | | | $ | 243,544 | | | $ | 243,552 | | | 3.6 | % | | 1 | | — | | | $ | — | | | $ | — | | | — | % |
| 2 | | 3 | | | 409,812 | | | 411,424 | | | 6.2 | | | 2 | | 3 | | | 517,168 | | | 517,434 | | | 8.9 | |
| 3 | | 54 | | | 5,256,052 | | | 5,627,927 | | | 84.3 | | | 3 | | 43 | | | 4,415,030 | | | 4,764,745 | | | 82.3 | |
| 4 | | 4 | | | 385,081 | | | 394,336 | | | 5.9 | | | 4 | | 4 | | | 381,608 | | | 393,501 | | | 6.8 | |
| 5 | | 1 | | | — | | | — | | | — | | | 5 | | 2 | | | 70,121 | | | 115,071 | | | 2.0 | |
| | 63 | | | $ | 6,294,489 | | | $ | 6,677,239 | | | 100.0 | % | | | | 52 | | | $ | 5,383,927 | | | $ | 5,790,751 | | | 100.0 | % |
(A) In certain instances, we finance our loans through the non-recourse sale of a senior interest that is not included in our consolidated financial statements under GAAP. Total loan exposure includes the entire loan we originated and financed, including $318.6 million and $312.7 million of such non-consolidated senior interestsrisk-rated 4 as of December 31, 20212023.
In June 2023, we completed the modification of a risk-rated 5 senior office loan located in Minneapolis, MN, with an outstanding principal balance of $194.4 million as of March 31, 2023. The terms of the modification included, among others, a restructure of the $194.4 million senior loan into (i) a $120.0 million senior mortgage loan (fully funded) and (ii) a $79.4 million mezzanine note (with $5.0 million in unfunded commitment). The restructured senior loan earns a coupon rate of S+2.25% and the mezzanine note earns a fixed 4.5% PIK interest rate. Post modification, the whole loan’s maximum maturity is July 2025, assuming all extension options are exercised. The restructured whole loan with an outstanding principal balance of $194.4 million was risk-rated 5 as of December 31, 2023.
In September 30, 2021, respectively.2023, we completed the modification of a risk-rated 4 senior office loan located in Chicago, IL, with an outstanding principal balance of $118.4 million. The terms of the modification included, among others, a $15.0 million principal repayment, a $15.0 million reduction in unfunded loan commitment, and a restructure of the $103.4 million senior loan (after the $15.0 million repayment) into (i) a $105.0 million committed senior mortgage loan (with $16.6 million in unfunded commitment) and (ii) a $15.0 million subordinated note. The restructured senior loan earns a coupon rate of S+2.25% and has a new term of five years. The $15.0 million subordinated note is subordinate to a new $18.5 million sponsor interest and was deemed uncollectible and written off. The restructured senior loan with an outstanding principal balance of $88.4 million was risk-rated 3 as of December 31, 2023.
CMBS B-Piece Investments
Our current CMBS exposure is through RECOP I, an equity method investment. Our Manager has processes and procedures in place to monitor and assess the credit quality of our CMBS B-Piece investments and promote the regular and active management of these investments. This includes reviewing the performance of the real estate assets underlying the loans that collateralize the investments and determining the impact of such performance on the credit and return profile of the investments. Our Manager holds monthly surveillance calls with the special servicer of our CMBS B-Piece investments to monitor the performance of our portfolio and discuss issues associated with the loans underlying our CMBS B-Piece investments. At each meeting, our Manager is provided with a due diligence submission for each loan underlying our CMBS B-Piece investments, which includes both property- and loan-level information. These meetings assist our Manager in monitoring our portfolio, identifying any potential loan issues, determining if a re-underwriting of any loan is warranted and examining the timing and severity of any potential losses or impairments.
Valuations for our CMBS B-Piece investments are prepared using inputs from an independent valuation firm and confirmed by our Manager via quotes from two or more broker-dealers that actively make markets in CMBS. As part of the quarterly valuation process, our Manager also reviews pricing indications for comparable CMBS and monitors the credit metrics of the loans that collateralize our CMBS B-Piece investments.
Our current CMBS exposure is through RECOP I, an equity method investment.
PortfolioTotal Financing
Our portfolio financing arrangements include our term loan financing,facility, term lending agreements, collateralized loan obligations, secured term loan, warehouse facility, asset specific financing, corporate revolving credit agreement ("Revolver"), non-consolidated senior interest (collectively “Non-Mark-to-Market Financing Sources”) and master repurchase agreements.
Our Non-Mark-to-Market Financing Sources, which accounted for 71%76% of our total secured financing (excluding our corporate revolver) as of December 31, 2021,2023, are not subject to credit or capital markets mark-to-market provisions. The remaining 29%24% of our secured borrowings,total financing, which is primarily comprised of three master repurchase agreements, are only subject to credit marks.
We continue to expand and diversify our financing sources, especially those sources that provide non-mark-to-market financing, reducing our exposure to market volatility.
The following table summarizes our portfolio financing (dollars in thousands):
| | | | | | | | | | | | | | | | | | | | |
| | | | Portfolio Financing Outstanding Principal Balance(A) |
| | Non-/Mark-to-Market | | December 31, 2021 | | December 31, 2020 |
| Master repurchase agreements | | Mark-to-Credit | | $ | 1,554,808 | | | $ | 673,120 | |
| Term lending agreements | | Non-Mark-to-Market | | 1,117,627 | | | 900,000 | |
| Collateralized loan obligations | | Non-Mark-to-Market | | 1,095,250 | | | 810,000 | |
| Term loan financing | | Non-Mark-to-Market | | 870,458 | | | 948,204 | |
| Secured term loan | | Non-Mark-to-Market | | 350,000 | | | 300,000 | |
| Asset specific financing | | Non-Mark-to-Market | | 60,000 | | | 60,000 | |
| Warehouse facility | | Non-Mark-to-Market | | — | | | — | |
| Non-consolidated senior interests | | Non-Mark-to-Market | | 318,634 | | | 158,672 | |
| Total portfolio financing | | | | $ | 5,366,777 | | | $ | 3,849,996 | |
(A) Excludes $66.2 million of vertical loan participations sold as of December 31, 2020. Such participations did not qualify for sale accounting under GAAP and therefore were consolidated in our Consolidated Balance Sheets as of December 31, 2020.
Financing Agreements
The following table details our financing agreements (dollars in thousands):
| | | | | | | | | | | | | | | | | | | | | | | | | | | | | | | | |
| | December 31, 2021 |
| | Maximum | | Collateral | | Borrowings |
| | Facility Size(A) | | Assets(B) | | Potential(C) | | Outstanding | | Available |
| Master Repurchase Agreements | | | | | | | | | | |
| Wells Fargo | | $ | 1,000,000 | | | $ | 1,395,703 | | | $ | 1,000,000 | | | $ | 980,593 | | | $ | 19,407 | |
| Morgan Stanley | | 600,000 | | | 552,313 | | | 409,498 | | | 383,592 | | | 25,906 | |
| Goldman Sachs | | 240,000 | | | 282,026 | | | 196,911 | | | 190,623 | | | 6,288 | |
| Term Loan Facility | | 1,000,000 | | | 1,078,795 | | | 870,458 | | | 870,458 | | | — | |
| Term Lending Agreements | | | | | | | | | | |
| KREF Lending V | | 671,625 | | | 755,701 | | | 623,453 | | | 617,627 | | | 5,826 | |
| KREF Lending IX | | 500,000 | | | 621,573 | | | 500,000 | | | 500,000 | | | — | |
| Warehouse Facility | | | | | | | | | | |
| HSBC | | 500,000 | | | — | | | — | | | — | | | — | |
| Asset Specific Financing | | | | | | | | | | |
| BMO Facility | | 300,000 | | | 76,000 | | | 60,000 | | | 60,000 | | | — | |
| Revolver | | 335,000 | | | — | | | 335,000 | | | 135,000 | | | 200,000 | |
| | $ | 5,146,625 | | | $ | 4,762,111 | | | $ | 3,995,320 | | | $ | 3,737,893 | | | $ | 257,427 | |
68 | | | | | | | | | | | | | | | | | | | | | | | | | | | | | | | | | | | | | | | | |
| | | | December 31, 2023 | | December 31, 2022 |
| | | | Maximum | | Collateral | | | | Borrowings | | Borrowings |
| | Non-/Mark-to-Market | | Facility Size(A) | | Assets(B) | | | | Outstanding | | Available(C) | | Outstanding |
| Master Repurchase Agreements | | Mark-to-Credit | | $ | 2,000,000 | | | $ | 2,231,723 | | | | | $ | 1,477,227 | | | $ | 35,610 | | | $ | 1,436,166 | |
| Collateralized loan obligations | | Non-Mark-to-Market | | 1,942,750 | | | 2,300,000 | | | | | 1,942,750 | | | — | | | 1,942,750 | |
| Term Lending Agreements | | Non-Mark-to-Market | | 1,977,399 | | | 1,737,431 | | | | | 1,329,390 | | | 8,394 | | | 1,530,105 | |
| Term Loan Facility | | Non-Mark-to-Market | | 1,000,000 | | | 718,739 | | | | | 561,377 | | | — | | | 631,557 | |
| Warehouse Facility | | Non-Mark-to-Market | | 500,000 | | | — | | | | | — | | | — | | | — | |
| Asset Specific Financing | | Non-Mark-to-Market | | 490,625 | | | 320,379 | | | | | 266,072 | | | — | | | 172,873 | |
| Revolver | | Non-Mark-to-Market | | 610,000 | | | n.a. | | | | 160,000 | | | 450,000 | | | — | |
| Secured term loan | | Non-Mark-to-Market | | 343,000 | | | n.a. | | | | 343,000 | | | — | | | 346,500 | |
| Non-consolidated senior interests | | Non-Mark-to-Market | | 188,611 | | | 188,611 | | | | | 188,611 | | | — | | | 263,086 | |
| Total financing | | | | $ | 9,052,385 | | | | | | | $ | 6,268,427 | | | $ | 494,004 | | | $ | 6,323,037 | |
(A) Maximum facility size represents the largest amount of borrowings available under a given facility once sufficient collateral assets have been approved by the lender and pledged by us.
(B) Represents the principal balance of the collateral assets.
(C) PotentialAvailable borrowings represents the totalundrawn amount we could draw under the terms of each credit facility, based on collateral already approved and pledged. When undrawn, these amounts are available to us under the terms of each credit facility.
Master Repurchase Agreements
We utilize master repurchase facilities to finance the origination of senior loans. After a mortgage asset is identified by us, the lender agrees to advance a certain percentage of the principal of the mortgage to us in exchange for a secured interest in the mortgage. We have not received any margin calls on any of our master repurchase facilities to date.
Repurchase agreements effectively allow us to borrow against loans and participations that we own in an amount generally equal to (i) the market value of such loans and/or participations multiplied by (ii) the applicable advance rate. Under these agreements, we sell our loans and participations to a counterparty and agree to repurchase the same loans and participations from the counterparty at a price equal to the original sales price plus an interest factor. The transaction is treated as a secured loan from the financial institution for GAAP purposes. During the term of a repurchase agreement, we receive the principal and interest on the related loans and participations and pay interest to the lender under the master repurchase agreement. At any point in time, the amounts and the cost of our repurchase borrowings will be based upon the assets being financed—higher risk assets will result in lower advance rates (i.e., levels of leverage) at higher borrowing costs and vice versa. In addition, these facilities include various financial covenants and limited recourse guarantees, including those described below.
Each of our existing master repurchase facilities includes "credit mark-to-market" features. "Credit mark-to-market" provisions in repurchase facilities are designed to keep the lenders' credit exposure generally constant as a percentage of the underlying collateral value of the assets pledged as security to them. If the credit underlying collateral value decreases, the gross amount of leverage available to us will be reduced as our assets are marked-to-market, which would reduce our liquidity. The lender under the applicable repurchase facility sets the valuation and any revaluation of the collateral assets in its sole, good faith discretion.
As a contractual matter, the lender has the right to reset the value of the assets at any time based on then-current market conditions, but the market convention is to reassess valuations on a monthly, quarterly and annual basis using the financial information delivered pursuant to the facility documentation regarding the real property, borrower and guarantor under such underlying loans. Generally, if the lender determines (subject to certain conditions) that the market value of the collateral in a repurchase transaction has decreased by more than a defined minimum amount, the lender may require us to provide additional collateral or lead to margin calls that may require us to repay all or a portion of the funds advanced. We closely monitor our liquidity and intend to maintain sufficient liquidity on our balance sheet in order to meet any margin calls in the event of any significant decreases in asset values. As of December 31, 2021 and 2020,2023, the weighted average haircut under our repurchase agreements was agreement30.3%s w and 36.7%, respectivelyas 33.8% (or 25.9% and 34.8%32.2%, respectively, if we had borrowed the maximum amount approved by its repurchase agreement counterparties as of such dates). In addition, our existing master repurchase facilities are not entirely term-matched financings and may mature before our CRE debt investments that represent underlying collateral to those financings. As we negotiate renewals and extensions of these liabilities, we may experience lower advance rates and higher pricing under the renewed or extended agreements.
Term Loan FinancingLending Agreements
In connection with our efforts to diversify our financing sources, further expand our non-mark-to-market borrowing base and reduce our exposure to market volatility,August 2018, we entered into a term$200.0 million loan financing agreement in April 2018facility with third party lenders for an initialBMO Harris Bank (the "BMO Facility”). In May 2019, we increased the borrowing capacity of $200.0 million that was increased to $1.0 billion in October 2018 (“Term Loan Facility”).$300.0 million. The facility provides us with asset-based financing on a non-mark-to-market basis with matched termmatch-term up to five years and is non-recoursewith partial recourse to us. Borrowings under the facility are collateralized by senior loans, held-for-investment, and bear interest equal to one-month LIBOR plus a margin. As of December 31, 2021, the weighted average margin on the facility was 1.6%.
The following table summarizes our borrowings under the Term Loan Facility (dollars in thousands):
| | | | | | | | | | | | | | | | | | | | | | | | | | | | | | | | | | | | | | | | | | | | |
| | December 31, 2021 |
| Term Loan Facility | | Count | | Outstanding Principal | | Amortized Cost | | Carrying Value | | Wtd. Avg. Yield/Cost(A) | | Guarantee(B) | | Wtd. Avg. Term(C) |
| Collateral assets | | 12 | | $ | 1,078,795 | | | $ | 1,076,241 | | | $ | 1,074,116 | | | L + 3.4% | | n.a. | | August 2024 |
| Financing provided | | n.a. | | 870,458 | | | 870,458 | | | 870,458 | | | L + 1.6% | | n.a. | | August 2024 |
(A) Floating rate loans and related liabilities are indexed to one-month LIBOR. Our net interest rate exposure is in direct proportion to our interest in the net assets indexed to that rate. In addition to cash coupon, yield/cost includes the amortization of deferred origination/financing costs.
(B) Financing under the Term Loan Facility is non-recourse to us.
(C) The weighted-average term is determined using the maximum maturity date of the corresponding loans, assuming all extension options are exercised by the borrower.
Term Lending Agreements
In June 2019, we entered into a Master Repurchase and Securities Contract Agreement ("KREF Lending V Facility") with Morgan Stanley Mortgage Capital Holdings LLC ("Administrative Agent"), as administrative agent on behalf of Morgan Stanley Bank, N.A. ("Initial Buyer"), which provides non-mark-to-market financing.financing. In March 2021,June 2023, the current stated maturity was extended to June 2022,2024, subject to fourtwo additional one-year extension options, which we may be exercised by usexercise upon the satisfaction of certain customary conditions and thresholds. The Initial Buyer subsequently syndicated a portion of the facility to multiple financial institutions. As of December 31, 2021,2023, the Initial Buyer held 24.4%23% of the total commitmentcommitment under the facility. Borrowings under the facility are collateralized by certain loans, held for investment, and bear interest equal to one-month LIBOR, plus a 1.9% margin. Total outstanding borrowings under the facility as of December 31, 2021 was $617.6 million.
In July 2021, we entered into a $500.0 million Master Repurchase and Securities Contract Agreement with a financial institution (“KREF Lending IX Facility”). In March 2022, we increased the borrowing capacity to $750.0 million. In August 2022, we further increased the borrowing capacity to $1,000.0 million. The facility, which provides financing on a non-mark-to-market basis with partial recourse to us, has a three-year draw period and matchedmatch- term to the underlying loans. As
In June 2022, we entered into a $350.0 million Master Repurchase Agreement and Securities Contract with a financial institution (“KREF Lending XII Facility”). The facility, which provides financing on a non-mark-to-market basis with partial recourse to KREF, has a two-year draw period and match-term to the underlying loans. In addition, we have the option to increase the facility amount to $500.0 million.
Term Loan Facility
In April 2018, we entered into a term loan financing agreement with third party lenders for an initial borrowing capacity of December 31, 2021, there was $500.0$200.0 million outstanding that was increased to $1.0 billion in October 2018 (“Term Loan Facility”). The facility provides us with asset-based financing on this facility.a non-mark-to-market basis with match-term up to five years, with additional two-year extension available, and is non-recourse to us.
Warehouse Facility
In March 2020, we entered into a $500.0 million Loan and Security Agreement with HSBC Bank USA, National Association (“HSBC Facility”). In March 2023, we extended the facility maturity date to March 2026. The facility which matures in March 2023, provides warehouse financing on a non-mark-to-market basis with partial recourse to us. Borrowings under the facility are collateralized by certain loans, held for investment, and bear interest equal to one-month LIBOR, plus a margin. As of December 31, 2021, there was no balance outstanding on this facility.
Asset Specific Financing
In August 2018,April 2022, we entered into a $200.0$100.0 million loan financing facility with BMO Harris Bank (the "BMO Facility”a financial institution ("KREF Lending XI Facility"). In May 2019, we increased the borrowing capacity to $300.0 million. The facility provides non-recourse match-term asset-based financing on a non-mark-to-market basisbasis.
In August 2022, we entered into a $265.6 million loan financing facility with matched-term up to five yearsa financial institution ("KREF Lending XIII Facility"). The facility provides non-recourse match-term asset-based financing on a non-mark-to-market basis.
In October 2022, we entered into a $125.0 million loan financing facility with partial recourse to us. As of December 31, 2021, there was a financial institution ("KREF Lending XIV Facility"). The facility pro$60.0 millionvides non-recourse m outstandingatch-term asset-based financing on this facility.a non-mark-to-market basis.
Revolving Credit Agreement
We have a $335.0 millionIn March 2022, we upsized our corporate revolving credit facilityagreement (“Revolver”), administered by Morgan Stanley Senior Funding, Inc., to $520.0 million and extended the maturity date to March 2027. In April 2022, we further upsized our Revolver to $610.0 million. We may use our Revolver as a source of financing, which is designed to provide short-term liquidity to purchaseoriginate or de-lever loans, pay operating expenses and borrow amounts for general corporate purposes. Borrowings under the Revolver bear interest at a per annum rate equal to the sum of (i) a floating rate index and (ii) a fixed margin. Our Revolver is secured by corporate level guarantees and does not include asset-based collateral. As of December 31, 2021, there was $135.0 million outstanding on this facility.includes net equity interests in the investment portfolio.
Collateralized Loan Obligations
In August 2021, we financed a pool of loan participations from our existing loan portfolio through a managed collateralized loan obligation ("CLO" or "KREF 2021-FL2") and, in February 2022, we financed a pool of loan participations from our existing multifamily loan portfolio through a managed CLO ("KREF 2022-FL3"). The CLO providesCLOs provide us with match-term financing on a non-mark-to-market and
non-recourse basis. The CLO hasCLOs have a two-year reinvestment feature that allows principal proceeds of the collateral assets to be reinvested in qualifying replacement assets, subject to the satisfaction of certain conditions set forth in the indenture. In connection with the closing of KREF 2021-FL2, we fully repaid the outstanding notes under our previous CLO, KREF 2018-FL1.indentures.
The following table outlines KREF 2021-FL2the CLO collateral assets and respective borrowing (dollars in thousands):
| | | | | | | | | | | | | | | | | | | | | | | | | | | | | | | | | | | | | | |
| | December 31, 2021 |
| Collateralized Loan Obligation 2021-FL2 | | Count | | Outstanding Principal | | Amortized Cost | | Carrying Value | | Wtd. Avg. Yield/Cost | | Wtd. Avg. Term(B) |
Collateral assets(A) | | 20 | | $ | 1,300,000 | | | $ | 1,300,000 | | | $ | 1,296,745 | | | L + 3.4% | | June 2025 |
| Financing provided | | 1 | | 1,095,250 | | | 1,087,976 | | | 1,087,976 | | | L + 1.7% | | February 2039 |
| | | | | | | | | | | | | | | | | | | | | | | | | | | | | | | | | | | | | | |
| | December 31, 2023 |
| | Count | | Outstanding Principal | | Amortized Cost | | Carrying Value | | Wtd. Avg. Yield/Cost(A) | | Wtd. Avg. Term(B) |
| KREF 2021-FL2 | | | | | | | | | | | | |
Collateral assets(C) | | 18 | | $ | 1,300,000 | | | $ | 1,300,000 | | | $ | 1,288,464 | | | S + 3.1% | | July 2026 |
| Financing provided | | 1 | | 1,095,250 | | | 1,095,128 | | | 1,095,128 | | | S + 1.5% | | February 2039 |
| KREF 2022-FL3 | | | | | | | | | | | | |
Collateral assets(C)(D) | | 16 | | $ | 1,000,000 | | | $ | 1,000,000 | | | $ | 990,320 | | | S + 3.0% | | September 2026 |
| Financing provided | | 1 | | 847,500 | | | 847,043 | | | 847,043 | | | S + 2.2% | | February 2039 |
(A)Including $54.0 millionIn addition to cash held in CLO ascoupon, yield/cost includes the amortization of December 31, 2021.Collateral loan assets represent 19.6% of the principal of our commercial real estate loans as of December 31, 2021. As of December 31, 2021, 100% of our loans financed through the CLO are floating rate loans.deferred origination/financing costs.
(B)Loan term represents weighted-average final maturity, assuming all extension options are exercised by the borrower.borrower, weighted by outstanding principal. Repayments of CLO notes are dependent on timing of relatedunderlying collateral loan asset repayments post reinvestment period. The term of the CLO notes represents the rated final distribution date.
Loan Participations Sold
In connection withof the principal of our investments in CREcommercial real estate loans we finance certain investmentsas of December 31, 2023. As of December 31, 2023, 100% of our loans financed through the syndication of a non-recourse, or limited-recourse, loan participation to unaffiliated third parties. Our presentation of the senior loan and related financing involvedCLOs are floating-rate loans.
(D)Including $5.0 million cash held in the syndication depends upon whether GAAP recognized the transactionKREF 2021-FL3 as a sale, though such differences in presentation do not generally impact our net stockholders’ equity or net income aside from timing differences in the recognition of certain transaction costs.
To the extent that GAAP recognizes a sale resulting from the syndication, we derecognize the participation in the senior/whole loan that we sold and continue to carry the retained portion of the loan as an investment. While we do not generally expect to recognize a material gain or loss on these sales, we would realize a gain or loss in an amount equal to the difference between the net proceeds received from the third party purchaser and our carrying value of the loan participation we sold at time of sale. Furthermore, we recognize interest income only on the portion of the senior loan that we retain as a result of the sale.
To the extent that GAAP does not recognize a sale resulting from the syndication, we do not derecognize the participation in the senior/whole loan that we sold. Instead, we recognize a loan participation sold liability in an amount equal to the principal of the loan participation syndicated less any unamortized discounts or financing costs resulting from the syndication. We continue to recognize interest income on the entire senior loan, including the interest attributable to the loan participation sold, as well as interest expense on the loan participation sold liability.
December 31, 2023.
Non-Consolidated Senior Interests
In certain instances, we finance our loans through the non-recourse sale of a senior loan interest that is not included in our consolidated financial statements. These non-consolidated senior interests provide structural leverage on a non-mark-to-market, matched-termmatch-term basis for our net investments, which are typically reflected in the form of mezzanine loans or other subordinate interests on our consolidated balance sheetssheet and in our statementsconsolidated statement of income.
The following table details the subordinate interests retained on our balance sheet and the related non-consolidated senior interests (dollars in thousands):
| | | | | | | | | | | | | | | | | | | | | | | | | | | | | | | | | | | | | | |
| | December 31, 2021 |
| Non-Consolidated Senior Interests | | Count | | Principal Balance | | Carrying Value | | Wtd. Avg. Yield/Cost | | Guarantee | | Wtd. Avg. Term |
| Total loan | | 3 | | $ | 473,531 | | | n.a. | | L + 3.6% | | n.a. | | May 2025 |
| Senior participation | | 3 | | 318,634 | | | n.a. | | L + 2.3% | | n.a. | | August 2025 |
| Interests retained | | | | 154,897 | | | | | L + 6.4% | | | | December 2024 |
| | | | | | | | | | | | | | | | | | | | | | | | | | | | | | | | | | | | | | |
| | December 31, 2023 |
| Non-Consolidated Senior Interests | | Count | | Principal Balance | | Carrying Value | | Wtd. Avg. Yield/Cost | | Guarantee | | Wtd. Avg. Term |
| Total loan | | 2 | | $ | 233,278 | | | n.a | | S + 3.6% | | n.a. | | January 2026 |
| Senior participation | | 2 | | 188,611 | | | n.a | | S + 2.3% | | n.a. | | January 2026 |
| Interests retained | | | | 44,667 | | | | | S + 8.8% | | | | January 2026 |
Secured Term Loan
In September 2020, we entered into a $300.0 million secured term loan at a price of 97.5%, which bears interest at a per annum rate equal to LIBOR plus a 4.75% margin, subject to a 1.0% LIBOR floor, payable quarterly beginning in December 2020.. The secured term loan is partially amortizing, with an amount equal to 1.0% per annum of the principal balance due in quarterly installments starting March 31, 2021.
installments. In November 2021, we completed a repricing of a $297.8 million existing secured term loan and a $52.2 million add-on, for an aggregate principal amount of $350.0 million, which was issued at par. In June 2023, the secured term loan was amended to transition the benchmark rate from LIBOR to SOFR. The new secured term loan bears coupon interest at LIBORAdjusted Term SOFR, as defined in the secured term loan agreements, plus a 3.50% margin, and is subject to a 0.50% LIBOR floor, which is an aggregate improvement of 1.75% over the 2020 secured term loan.SOFR floor.
The secured term loan matures on September 1, 2027 and contains restrictions relating to liens, asset sales, indebtedness, investments and transactions with affiliates. Our secured term loan is secured by corporate level guarantees and does not include asset-based collateral. Refer to Notes 2 and 7 to our consolidated financial statements for additional discussion of our secured term loan.
Convertible Notes
We may issue convertible debt to take advantage of favorable market conditions. In May 2018, we issued $143.75 million of 6.125% Convertible Notes due on May 15, 2023. The Convertible Notes bear interest at a rate of 6.125% per year, payable semi-annually in arrears on May 15 and November 15 of each year, beginning on November 15, 2018. The Convertible Notes mature on May 15, 2023, unless earlier repurchased or converted. Refer to Notes 2 and 8 to our consolidated financial statements for additional discussion of our Convertible Notes.
Borrowing Activities
The following tables provide additional information regarding our borrowings (dollars in thousands):
| | | | | | | | | | | | | | | | | | | | | | | |
| | | Year Ended December 31, 2021 |
| Outstanding Principal as of December 31, 2021 | | Average Daily Amount Outstanding(A) | | Maximum Amount Outstanding | | Weighted Average Daily Interest Rate |
| Wells Fargo | $ | 980,593 | | | $ | 547,166 | | | $ | 980,593 | | | 1.6 | % |
| Morgan Stanley | 383,592 | | | 368,089 | | | 473,902 | | | 2.1 | |
| Goldman Sachs | 190,623 | | | 91,217 | | | 190,623 | | | 3.0 | |
| Term Loan Facility | 870,458 | | | 926,978 | | | 992,777 | | | 1.7 | |
| KREF Lending V | 617,627 | | | 816,719 | | | 900,000 | | | 2.0 | |
| KREF Lending IX | 500,000 | | | 242,786 | | | 500,000 | | | 1.8 | |
| BMO Facility | 60,000 | | | 60,000 | | | 60,000 | | | 1.8 | |
| Revolver | 135,000 | | | 43,507 | | | 335,000 | | | 2.1 | |
| Total/Weighted Average | $ | 3,737,893 | | | | | | | 1.9 | % |
(A) Represents the average for the period the facility was outstanding.
| | | | | | | | | | | | | | | | | | | | | | | | | | |
| | Average Daily Amount Outstanding(A) |
| | Three Months Ended |
| | December 31, 2021 | | September 30, 2021 | | June 30, 2021 | | March 31, 2021 |
| Wells Fargo | | $ | 566,984 | | | $ | 598,729 | | | $ | 529,169 | | | $ | 492,395 | |
| Morgan Stanley | | 326,625 | | | 366,046 | | | 429,449 | | | 350,519 | |
| Goldman Sachs | | 99,140 | | | 97,574 | | | 91,075 | | | 76,762 | |
| Term Loan Facility | | 933,928 | | | 953,283 | | | 878,021 | | | 942,484 | |
| KREF Lending V | | 638,958 | | | 830,634 | | | 900,000 | | | 900,000 | |
| KREF Lending IX | | 422,974 | | | 62,598 | | | — | | | — | |
| BMO Facility | | 60,000 | | | 60,000 | | | 60,000 | | | 60,000 | |
| Revolver | | 119,837 | | | 32,609 | | | — | | | 20,611 | |
(A) Represents the average for the period the debt was outstanding.
Covenants—Each of our repurchase facilities, term lending agreements, warehouse facility and our Revolver contain customary terms and conditions, including, but not limited to, negative covenants relating to restrictions on our operations with respect to our status as a REIT, and financial covenants, such as:
•ana trailing four quarter interest income to interest expense ratio covenant (1.5(1.4 to 1.0);
•a minimum consolidated tangible net worth covenant (75.0% of the aggregate net cash proceeds of any equity issuances made and any capital contributions received by us and KKR Real Estate Finance Holdings L.P. (our "Operating Partnership") or up to approximately $1,095.4$1,307.7 million,, depending on the agreement;
•a cash liquidity covenant (the greater of $10.0 million or 5.0% of our recourse indebtedness);
•a total indebtedness covenant (83.3% of our Total Assets, as defined in the applicable financing agreements);
With respect to our secured term loan, we are required to comply with customary loan covenants and event of default provisions that include, but are not limited to, negative covenants relating to restrictions on operations with respect to our status as a REIT, and financial covenants. Such financial covenants include a minimum consolidated tangible net worth of $650.0 million and a maximum total debt to total assets ratio of 83.3% (the “Leverage Covenant”).
As of December 31, 2021,2023, we were in compliance with the covenants of our financing facilities.
Guarantees—In connection with our financing arrangements including; master repurchase agreements, our term lending agreements, and our asset specific financing, our Operating Partnership has entered into a limited guarantee in favor of each lender, under which our Operating Partnership guarantees the obligations of the borrower under the respective financing agreement (i) in the case of certain defaults, up to a maximum liability of 25.0% of the then-outstanding repurchase price of the eligible loans, participations or securities, as applicable, or (ii) up to a maximum liability of 100.0% in the case of certain "bad boy" defaults. The borrower in each case is a special purpose subsidiary of us.ours. In addition, some guarantees include certain full recourse insolvency-related trigger events.
With respect to our Revolver, amounts borrowed are full recourse to certain guarantor wholly-owned subsidiaries of us.ours.
Real Estate Owned and Joint Venture
In 2015, we originated a $177.0 million senior loan secured by a retail property in Portland, Oregon. The loan had a risk rating of 5 and was placed on a non-accrual status in October 2020, with an amortized cost and carrying value of $109.6 million and $69.3 million, respectively, as of September 30, 2021. In December 2021, we took title to the retail property; such acquisition was accounted for as an asset acquisition under ASC 805. Accordingly, we recognized the property on our balance sheet as REO with a carrying value of $78.6 million, which included the estimated fair value of the property and capitalized transaction costs.property. In addition, we assumed $2.0 million in other net assets of the REO.
Concurrently with taking the title to the REO asset, we contributed a portion of the REO asset to a joint venture (the "REO JV") with a third party local development operator (“JV Partner”), whereby we have a 90% interest and the JV Partner has a 10% interest. As of December 31, 2023, the REO JV held REO assets with a net carrying value of $72.4 million. We have priority of distributions up to $78.1 million before the JV Partner can participate in the economics of the REO JV.
In 2019, we originated a $182.6 million senior loan secured by an office property in Philadelphia, PA. In December 2022, this loan was placed on nonaccrual status and subsequent interest collections were accounted for under the cost recovery method. As of September 30, 2023, the loan had a risk rating of 5 with an amortized cost of $151.1 million. On December 22, 2023, we received a $6.0 million partial repayment and then took title to the office property through a deed-in-lieu of foreclosure. The transaction was accounted for as an asset acquisition under ASC 805. Accordingly, we recorded the property with its net assets on the Consolidated Balance Sheet with an estimated fair value of $86.4 million, which included $1.3 million of cash received and $76.5 million, $24.6 million and $15.9 million allocated to REO held for sale, lease intangible and other assets, and leasing and other liabilities, respectively. As a result, we recognized an $8.2a $58.7 million benefit from the reversal of the allowance for credit losses for GAAP, and a $32.1 million realized loss on loan write-off through distributable earnings (representingfor the difference between the carrying value of the foreclosed loan and the fair value of the REO’s net assets).
Concurrently with taking the title of our sole REO asset, we contributed the majority of the REO's net assets to a joint venture with a third party local development operator (“JV Partner”), whereby we have a 90% interest in the joint venture and the JV Partner has a 10% interest.assets. As of December 31, 2021,2023, the joint ventureREO's assets and liabilities met the criteria to be classified as held REO assets with a net carrying value of $68.9 million, of which $0.1 million represented non-controlling interests.for sale under ASC 360. As such, depreciation on the building and building improvements was suspended.
Results of Operations
The following table summarizes the changes in our results of operations for years ended December 31, 2021, 20202023, 2022, and 20192021 (dollars in thousands, except per share data):
| | | | | | | | | | | | | | | | | | | | | | | | | | | | | | | | | | | | | | | | | | | | | | | | | | |
| | For the Year Ended December 31, | | Increase (Decrease) | | For the Year Ended
December 31, | | Increase (Decrease) |
| | 2023 | | 2022 | | Dollars | | Percentage | | 2022 | | 2021 | | Dollars | | Percentage |
| Net Interest Income | | | | | | | | | | | | | | | | |
| Interest income | | $ | 640,412 | | | $ | 421,968 | | | $ | 218,444 | | | 52 | % | | $ | 421,968 | | | $ | 279,950 | | | $ | 142,018 | | | 51 | % |
| Interest expense | | 458,802 | | | 236,095 | | | 222,707 | | | 94 | | | 236,095 | | | 114,439 | | | 121,656 | | | 106 | |
| Total net interest income | | 181,610 | | | 185,873 | | | (4,263) | | | (2) | | | 185,873 | | | 165,511 | | | 20,362 | | | 12 | |
| Other Income | | | | | | | | | | | | | | | | |
| Revenue from real estate owned operations | | 8,545 | | | 8,971 | | | (426) | | | (5) | | | 8,971 | | | — | | | 8,971 | | | 100 | |
| Income (loss) from equity method investments | | 1,417 | | | 4,655 | | | (3,238) | | | (70) | | | 4,655 | | | 6,371 | | | (1,716) | | | (27) | |
| Other income | | 11,237 | | | 5,568 | | | 5,669 | | | 102 | | | 5,568 | | | 686 | | | 4,882 | | | 712 | |
| Gain on sale of investments | | — | | | — | | | — | | | — | | | — | | | 5,126 | | | (5,126) | | | (100) | |
| | | | | | | | | | | | | | | | |
| Total other income | | 21,199 | | | 19,194 | | | 2,005 | | | 10 | | | 19,194 | | | 12,183 | | | 7,011 | | | 58 | |
| Operating Expenses | | | | | | | | | | | | | | | | |
| General and administrative | | 18,788 | | | 17,616 | | | 1,172 | | | 7 | | | 17,616 | | | 14,235 | | | 3,381 | | | 24 | |
| Provision for (reversal of ) credit losses, net | | 175,116 | | | 112,373 | | | 62,743 | | | 56 | | | 112,373 | | | (4,059) | | | 116,432 | | | 2,868 | |
| Management fee to affiliate | | 26,171 | | | 25,680 | | | 491 | | | 2 | | | 25,680 | | | 19,378 | | | 6,302 | | | 33 | |
| Incentive compensation to affiliate | | 2,491 | | | 634 | | | 1,857 | | | 293 | | | 634 | | | 10,273 | | | (9,639) | | | (94) | |
| Expenses from real estate owned operations | | 11,190 | | | 11,113 | | | 77 | | | 1 | | | 11,113 | | | — | | | 11,113 | | | 100 | |
| Total operating expenses | | 233,756 | | | 167,416 | | | 66,340 | | | 40 | | | 167,416 | | | 39,827 | | | 127,589 | | | 320 | |
| Income (Loss) Before Income Taxes, Noncontrolling Interests, Preferred Dividends, Redemption Value Adjustment and Participating Securities' Share in Earnings | | (30,947) | | | 37,651 | | | (68,598) | | | (182) | | | 37,651 | | | 137,867 | | | (100,216) | | | (73) | |
| Income tax expense | | 710 | | | 58 | | | 652 | | | 1,124 | | | 58 | | | 684 | | | (626) | | | (92) | |
| Net Income (Loss) | | (31,657) | | | 37,593 | | | (69,250) | | | (184) | | | 37,593 | | | 137,183 | | | (99,590) | | | (73) | |
| Net income (loss) attributable to noncontrolling interests | | (806) | | | (510) | | | (296) | | | 58 | | | (510) | | | — | | | (510) | | | 100 | |
| Net Income (Loss) Attributable to KKR Real Estate Finance Trust Inc. and Subsidiaries | | (30,851) | | | 38,103 | | | (68,954) | | | (181) | | | 38,103 | | | 137,183 | | | (99,080) | | | (72) | |
| Preferred stock dividends and redemption value adjustment | | 21,304 | | | 21,304 | | | — | | | — | | | 21,304 | | | 11,369 | | | 9,935 | | | 87 | |
| Participating securities' share in earnings | | 1,764 | | | 1,428 | | | 336 | | | 24 | | | 1,428 | | | 179 | | | 1,249 | | | 698 | |
| Net Income (Loss) Attributable to Common Stockholders | | $ | (53,919) | | | $ | 15,371 | | | $ | (69,290) | | | (451) | | | $ | 15,371 | | | $ | 125,635 | | | $ | (110,264) | | | (88) | |
| | | | | | | | | | | | | | | | |
| Net Income (Loss) Per Share of Common Stock | | | | | | | | | | | | | | | | |
| Basic | | $ | (0.78) | | | $ | 0.23 | | | $ | (1.01) | | | (439) | | | $ | 0.23 | | | $ | 2.22 | | | $ | (1.99) | | | (90) | |
| Diluted | | $ | (0.78) | | | $ | 0.23 | | | $ | (1.01) | | | (439) | | | $ | 0.23 | | | $ | 2.21 | | | $ | (1.98) | | | (90) | |
| | | | | | | | | | | | | | | | |
| Weighted Average Number of Shares of Common Stock Outstanding | | | | | | | | | | | | | | | | |
| Basic | | 69,180,039 | | | 67,553,578 | | | 1,626,461 | | | 2 | | | 67,553,578 | | | 56,571,200 | | | 10,982,378 | | | 19 | |
| Diluted | | 69,180,039 | | | 67,553,578 | | | 1,626,461 | | | 2 | | | 67,553,578 | | | 56,783,388 | | | 10,770,190 | | | 19 | |
| | | | | | | | | | | | | | | | |
| Dividends Declared per Share of Common Stock | | $ | 1.72 | | | $ | 1.72 | | | $ | — | | | — | | | $ | 1.72 | | | $ | 1.72 | | | $ | — | | | — | |
Year Ended December 31, 2023 Compared to Year Ended December 31, 2022
| | | | | | | | | | | | | | | | | | | | | | | | | | | | | | | | | | | | | | |
| | For the Year Ended December 31, | | Increase (Decrease) | | For the Year Ended December 31, | | Increase (Decrease) |
| | 2021 | 2020 | | Dollars | Percentage | | 2020 | 2019 | | Dollars | Percentage |
| Net Interest Income | | | | | | | | | | | | |
| Interest income | | $ | 279,950 | | $ | 269,188 | | | $ | 10,762 | | 4.0 | % | | $ | 269,188 | | $ | 274,335 | | | $ | (5,147) | | (1.9) | % |
| Interest expense | | 114,439 | | 127,312 | | | (12,873) | | (10.1) | | | 127,312 | | 158,860 | | | (31,548) | | (19.9) | |
| Total net interest income | | 165,511 | | 141,876 | | | 23,635 | | 16.7 | | | 141,876 | | 115,475 | | | 26,401 | | 22.9 | |
| Other Income | | | | | | | | | | | | |
| Income (loss) from equity method investments | | 6,371 | | 537 | | | 5,834 | | 1,086.4 | | | 537 | | 4,568 | | | (4,031) | | (88.2) | |
| Gain (loss) on sale of investments | | 5,126 | | — | | | 5,126 | | 100.0 | | | — | | (2,688) | | | 2,688 | | 100.0 | |
| Change in net assets related to CMBS consolidated variable interest entities | | — | | — | | | — | | — | | | — | | 1,665 | | | (1,665) | | (100.0) | |
| Other income | | 686 | | 744 | | | (58) | | (7.8) | | | 744 | | 2,453 | | | (1,709) | | (69.7) | |
| Total other income (loss) | | 12,183 | | 1,281 | | | 10,902 | | 851.1 | | | 1,281 | | 5,998 | | | (4,717) | | (78.6) | |
| Operating Expenses | | | | | | | | | | | | |
| General and administrative | | 14,235 | | 14,238 | | | (3) | | — | | | 14,238 | | 10,522 | | | 3,716 | | 35.3 | |
| Provision for (reversal of ) credit losses, net | | (4,059) | | 50,344 | | | (54,403) | | (108.1) | | | 50,344 | | — | | | 50,344 | | 100.0 | |
| Management fees to affiliate | | 19,378 | | 16,992 | | | 2,386 | | 14.0 | | | 16,992 | | 17,135 | | | (143) | | (0.8) | |
| Incentive compensation to affiliate | | 10,273 | | 6,774 | | | 3,499 | | 51.7 | | | 6,774 | | 3,272 | | | 3,502 | | 107.0 | |
| Total operating expenses | | 39,827 | | 88,348 | | | (48,521) | | (54.9) | | | 88,348 | | 30,929 | | | 57,419 | | 185.6 | |
| Income (Loss) Before Income Taxes, Preferred Dividends, Redemption Value Adjustment and Participating Securities' Share in Earnings | | 137,867 | | 54,809 | | | 83,058 | | 151.5 | | | 54,809 | | 90,544 | | | (35,735) | | (39.5) | |
| Income tax expense | | 684 | | 412 | | | 272 | | 66.0 | | | 412 | | 579 | | | (167) | | (28.8) | |
| Net Income (Loss) | | 137,183 | | 54,397 | | | 82,786 | | 152.2 | | | 54,397 | | 89,965 | | | (35,568) | | (39.5) | |
| | | | | | | | | | | | |
| | | | | | | | | | | | |
| Preferred stock dividends and redemption value adjustment | | 11,369 | | 844 | | | 10,525 | | 1,247.0 | | | 844 | | (527) | | | 1,371 | | 260.2 | |
| Participating securities' share in earnings | | 179 | | — | | | 179 | | 100.0 | | | — | | — | | | — | | — | |
| Net Income (Loss) Attributable to Common Stockholders | | $ | 125,635 | | $ | 53,553 | | | $ | 72,082 | | 134.6 | % | | $ | 53,553 | | $ | 90,492 | | | $ | (36,939) | | (40.8) | % |
| | | | | | | | | | | | |
| Net Income (Loss) Per Share of Common Stock | | | | | | | | | | | | |
| Basic | | $ | 2.22 | | $ | 0.96 | | | $ | 1.26 | | 131.3 | % | | $ | 0.96 | | $ | 1.58 | | | $ | (0.62) | | (39.2) | % |
| Diluted | | $ | 2.21 | | $ | 0.96 | | | $ | 1.25 | | 130.2 | % | | $ | 0.96 | | $ | 1.57 | | | $ | (0.61) | | (38.9) | % |
| | | | | | | | | | | | |
| Weighted Average Number of Shares of Common Stock Outstanding | | | | | | | | | | | | |
| Basic | | 56,571,200 | | 55,985,014 | | | 586,186 | | 1.0 | % | | 55,985,014 | | 57,426,912 | | | (1,441,898) | | (2.5) | % |
| Diluted | | 56,783,388 | | 56,057,237 | | | 726,151 | | 1.3 | % | | 56,057,237 | | 57,532,490 | | | (1,475,253) | | (2.6) | % |
| | | | | | | | | | | | |
| Dividends Declared per Share of Common Stock | | $ | 1.72 | | $ | 1.72 | | | $ | — | | — | % | | $ | 1.72 | | $ | 1.72 | | | $ | — | | — | % |
Net interest income decreased by $4.3 million, during the year ended December 31, 2023, as compared to the prior year. This decrease was primarily due to the suspension of interest income accrual on loans accounted for under the cost recovery method. Otherwise, both interest income and interest expense increased due to higher index rates. During the year ended December 31, 2023, $9.8 million of interest collections on nonaccrual loans were applied as a cost reduction to the loan amortized cost.
Interest income included $3.0 million in prepayment penalty income in connection with loan repayments during the year ended December 31, 2023, as compared to $8.3 million during the prior year. We recognized $23.6 million of deferred loan fees and origination discounts accreted into interest income during the year ended December 31, 2023, as compared to $25.1 million during the prior year. We recorded $26.2 million of deferred financing costs amortization into interest expense during the year ended December 31, 2023, as compared to $23.9 million during the prior year.
Other Income
Total other income increased by $2.0 million during the year ended December 31, 2023, as compared to the prior year. This increase was primarily due to a $6.7 million increase in interest income earned on our cash balances, as compared to the prior year, resulting from higher market rates. The increase was partially offset by (i) a $3.2 million change in an unrealized mark-to-market adjustment on our RECOP I's underlying CMBS investments, as compared to the prior year, and (ii) a nonrecurring $1.3 million of profit sharing income in connection with the repayment of an industrial senior loan during the prior year.
Operating Expenses
Total operating expenses increased by $66.3 million during the year ended December 31, 2023, as compared to the prior year period. This increase was primarily due to a net increase of $62.7 million in the provision for credit losses.
Year Endedended December 31, 20212022 Compared to Year Ended December 31, 2020
Net Interest Income
Net interest income increased by $23.6 million, or 16.7%, during the year ended December 31, 2021 as compared to the year ended December 31, 2020, primarily due to a $10.8 million, or 4.0%, increase in our interest income and a $12.9 million, or 10.1%, decrease in our interest expense.
The increase in interest income was primarily attributable to a decrease in the weighted average principal of our loan portfolio of $401.1 million for the year ended December 31, 2021, as compared to the year ended December 31, 2020, as a result of continuing capital deployment from loan repayments and deployment of the proceeds from the issuance of 6.5% Series A Preferred Stock in April 2021 and issuance of common stock in November 2021. In addition, we recognized net accelerated deferred loan fees and prepayment fee income of $11.3 million during the year ended December 31, 2021, as compared to $1.8 million during the year ended December 31, 2020.
The decrease in interest expense was primarily due to a decrease in spot LIBOR, partially offset by an increase in the weighted average principal balance of our financing facilities of $253.5 million for the year ended December 31, 2021, as compared to the year ended December 31, 2020.
In addition, our loans continued to benefit from in-the-money LIBOR floors during the year ended December 31, 2021. As of December 31, 2021, 54% of our loan portfolio was subject to a LIBOR floor of at least 0.25%, with a weighted average floor of 0.74%; by contrast, only 9% of total outstanding financing (inclusive of the secured term loan) is subject to a LIBOR floor greater than 0.0%.
Other Income
Total other income increased by $10.9 million during the year ended December 31, 2021, as compared to the year ended December 31, 2020. This increase was due to a $2.2 million unrealized mark-to-market gain on our RECOP I's underlying CMBS investments during the year ended December 31, 2021, as compared to a $3.9 million unrealized loss during the year ended December 31, 2020. In addition, we recognized a $5.1 million gain from the redemption of non-voting manager units during the year ended December 31, 2021.
Operating Expenses
Total operating expenses decreased by $48.5 million during the year ended December 31, 2021, as compared to the year ended December 31, 2020. This decrease was primarily due to a net decrease of $54.4 million in the provision for credit losses resulting from the reversal of $32.1 million in allowance for credit losses for one senior retail loan where we took title of the underlying collateral and a more stable macro-economic outlook based on improved observed economic data, partially offset by an increase to the allowance related to newly originated loans during the year ended December 31, 2021.
The following table provides additional information regarding total operating expenses (dollars in thousands):
| | | | | | | | | | | | | | | | | | | | | | | | | | |
| | Three Months Ended |
| | March 31, 2021 | | June 30, 2021 | | September 30, 2021 | | December 31, 2021 |
| Professional services | | $ | 567 | | | $ | 527 | | | $ | 610 | | | $ | 673 | |
| Operating and other costs | | 946 | | | 1,167 | | | 1,022 | | | 1,297 | |
| Stock-based compensation | | 1,992 | | | 1,994 | | | 2,027 | | | 1,413 | |
| Total general and administrative expenses | | 3,505 | | | 3,688 | | | 3,659 | | | 3,383 | |
| Provision for (reversal of) credit losses, net | | (1,588) | | | (559) | | | 1,165 | | | (3,077) | |
| Management fees to affiliate | | 4,290 | | | 4,835 | | | 4,964 | | | 5,289 | |
| Incentive compensation to affiliate | | 2,192 | | | 2,403 | | | 2,215 | | | 3,463 | |
| Total operating expenses | | $ | 8,399 | | | $ | 10,367 | | | $ | 12,003 | | | $ | 9,058 | |
Year Ended December 31, 2020 Compared to Year Ended December 31, 2019
Net Interest Income
Net interest income increased by $26.4$20.4 million during the year ended December 31, 2020,2022, as compared to the year ended December 31, 2019. This increase was primarily2021. Interest income and interest expense both increased due to a decreasehigher index rates. The increases were further due to increases in the weighted-average LIBOR which decreasedweighted average principal of our interest expenseloan portfolio and financing facilities for the year ended December 31, 2022, as compared to priorthe year as substantially all of our secured financing facilities are not subject to LIBOR floors, while the interest income earned on our loans from rate floors above LIBOR increased (85% of our portfolio was subject to a LIBOR floor of 1.0% or higher as ofended December 31, 2020).2021.
In addition, weInterest income included $8.3 million in prepayment penalty income in connection with loan repayments during the year ended December 31, 2022, as compared to $6.7 million for the year ended December 31, 2021. We recognized $18.1$25.1 million of deferred loan fees and origination discounts accreted into interest income during the year ended December 31, 2020,2022, as compared to $20.2$23.2 million duringfor the year ended December 31, 2019. We also recognized a non-recurring exit fee income of $2.8 million during the year ended December 31, 2020.2021. We recorded $22.3$23.9 million of deferred financing costs amortization into interest expense during the year ended December 31, 2020,2022, as compared to $16.3$15.7 million during the year ended December 31, 2019.prior year.
Other Income
Total other income decreasedincreased by $4.7$7.0 million during the year ended December 31, 2020,2022, as compared to the year ended December 31, 2019.2021. This decreaseincrease was primarily due to (i) a $3.9$9.0 million unrealized mark-to-market lossincrease in REO operating revenue, (ii) a $2.1 million increase in money market fund dividend income resulting from our RECOP I equity method investmenthigher market rates and (iii) $1.3 million of profit sharing income in connection with the repayment of a senior loan. The increase was partially offset by a $5.1 million nonrecurring gain from the redemption of non-voting manager units during the year ended December 31, 2020.2021.
Operating Expenses
Total operating expenses increased by $57.4$127.6 million during the year ended December 31, 2020,2022, as compared to the year ended December 31, 2019.prior year. This increase was primarily due to (i) a $50.3net increase of $116.4 million in the provision for credit losses, in connection with the adoption of ASU 2016-03, (ii) and a $3.5$11.1 million increase in Manager incentive compensation, (iii) a $1.6 million increase in noncash stock-based compensation expense, and (iv) $2.0 million in non-recurring dead deal costs for the year ended December 31, 2020.
We did not have a provision for loan credit losses prior to January 1, 2020. Upon the adoption of ASU 2016-13 on January 1, 2020, we recorded a $15.0 million cumulative-effect adjustment to our accumulated deficit. During the year ended December 31, 2020, we recorded an incremental $50.3 million in credit loss provision primarily due to the adverse change in the economic outlook as a result of the COVID-19 pandemic and incremental reserves for our 4- and 5-risk rated loans.
COVID-19 Impact
During 2020, the COVID-19 pandemic created disruption in global supply chains, increased rates of unemployment and adversely impacted many industries, including industries related to the collateral underlying certain of our loans. The impact of the outbreak has been rapidly evolving around the globe, with several countries taking drastic measures to limit the spread of the virus by instituting quarantines or lockdowns, imposing travel restrictions and limiting operations of non-essential offices and retail centers.
In 2021, the global economy has, with certain setbacks, begun reopening and wider distribution of vaccines will likely encourage greater economic activity. However, wide disparities in vaccination rates and continued vaccine hesitancy, combined with the emergence of COVID-19 variants and surges in COVID-19 cases, could trigger the reinstatement of restrictions, including mandatory business shut-downs, travel restrictions, reduced business operations and social distancing requirements, which could dampen or delay any economic recovery and could materially and adversely affect our results and financial condition. Although we have observed signs of economic recovery and is generally encouraged by the response of its borrowers, we cannot predict the time required for a widespread sustainable economic recovery to take hold.
While the economy has improved significantly since the initial outbreak of the COVID-19 pandemic, the pandemic has resulted in, and may continue to result in, declines in rental rates and increases in rental concessions, including free rent to renew tenants early, to retain tenants who are up for renewal or to attract new tenants, or rent abatements for tenants severely impacted by the COVID-19 pandemic. Such responses have resulted in, and may continue to result in, decreases in cash flows to certain of our borrowers and potentially in defaults in paying debt service on outstanding indebtedness, which could adversely impact our
results of operations and financial performance. The COVID-19 pandemic continues to disrupt global supply chains, has caused labor shortages and has added broad inflationary pressures, which has a potential negative impact on our borrowers’ ability to execute on their business plans and potentially their ability to perform under the terms of their loan obligations. In addition, declines in economic conditions caused by the COVID-19 pandemic could negatively impact real estate and real estate capital markets and result in lower occupancy, lower rental rates and declining values in our portfolio, which could adversely impact the value of our investments, making it more difficult for us to make distributions or meet our financing obligations.
We believe COVID-19’s adverse impact on our business, financial performance and operating results will in part be significantly driven by a number of factors that we are unable to predict or control, including, for example: the severity and duration of the pandemic; the distribution and acceptance of vaccines and their impact on the timing and speed of economic recovery; the spread of new variants of the virus; the pandemic’s impact on the U.S. and global economies, including concerns regarding additional surges of the pandemic or the expansion of the economic impact thereof as a result of certain jurisdictions “re-opening” or otherwise lifting certain restrictions prematurely; the availability of U.S. federal, state, local or non-U.S. funding programs aimed at supporting the economy during the COVID-19 pandemic, including uncertainties regarding the potential implementation of new or extended programs; the timing, scope and effectiveness of additional governmental responses to the pandemic; and the negative impact on our financing sources, vendors and other business partners that may indirectly adversely affect us. The prolonged duration and impact of the COVID-19 pandemic could materially disrupt our business operations and negatively impact our business, financial performance and operating results for the year ending December 31, 2021 and potentially longer.
Liquidity and Capital Resources
Overview
We have capitalized our business to date primarily through the issuance and sale of our common stock and preferred stock, borrowings from our Non-Mark-to-Market Financing Sources(1), and borrowings from three master repurchase agreements, the issuance and sale of convertible notes and our secured term loan.agreements. Our Non-Mark-to-Market Financing Sources, which accounted for 71% of76% of our total secured financing (excluding our corporate Revolver) as of December 31, 2021,2023, are not subject to credit or capital markets mark-to-market provisions. The remaining 29%remaining 24% of our secured borrowings,total financing, which are comprised of three master repurchase agreements, are only subject to credit marks. We have not received any margin calls on our master repurchase agreements to date, nor do we expect any at this time.date.
Our primary sources of liquidity include $271.5$135.9 million of cash on our consolidated balance sheet, $200.0Consolidated Balance Sheet, $450.0 million of available capacity on our corporate revolver, $57.4Revolver, $44.0 million of available borrowings under our financing arrangements based on existing collateral, and cash flows from operations. In addition, we had $235.3$43.1 million of unencumbered senior loans that can be financed, as of December 31, 2021.2023. Our corporate revolverRevolver and secured term loan are secured by corporate level guarantees and do not include asset-based collateral.net equity interests in the investment portfolio. We may seek additional sources of liquidity from syndicated financing, other borrowings (including borrowings not related to a specific investment) and future offerings of equity and debt securities.
Our primary liquidity needs include our ongoing commitments to repay the principal and interest on our borrowings and to pay other financing costs, financing our assets, meeting future funding obligations, making distributions to our stockholders, funding our operations that includes making payments to our Manager in accordance with the management agreement, and other general business needs. We believe that our cash position and sources of liquidity will be sufficient to meet anticipated requirements for financing, operating and other expenditures in both the short- and long-term, based on current conditions. Based on current market conditions, macroeconomic factors, and the status of our loan portfolio, we reduced our common stock dividend for the first quarter of 2024 to $0.25 per share. This level should support coverage of the dividend with operating earnings from our performing loan portfolio, while simultaneously managing our REO assets, as well as expectations for future interest rate reductions.
As described in Note 109 to our consolidated financial statements, we have off-balance sheet arrangements related to VIEs that we account for using the equity method of accounting and in which we hold an economic interest or have a capital commitment. Our maximum risk of loss associated with our interests in these VIEs is limited to the carrying value of our investment in the entity and any unfunded capital commitments. As of December 31, 2021,2023, we held $35.5$35.1 million of interests in such entities, which does not include a remaining commitment of $4.3$4.3 million to RECOP I that we are required to fund if called.
We are continuing to monitorThe year ended December 31, 2023 witnessed significant volatility in the COVID-19 pandemic and its impact on our operating partners, financing sources, borrowers and their tenants, and the economybanking sector as a whole.result of disruptions to the banking system and financial market volatility resulting from multiple bank failures. While the availabilitywe maintained no accounts at these failed banks, substantially all of approved COVID-19 vaccinesour cash currently on deposit with other major financial institutions exceeds insured limits. We limit exposure relating to our short-term financial instruments by diversifying these financial instruments among various counterparties. Generally, deposits may be redeemed upon demand and their impact on the economy is encouraging, the distributionare maintained with financial institutions with reputable credit and acceptance of such vaccines and their effectiveness with respect to new variants of the virus remain unknown. Accordingly, the ultimate magnitude and duration of the COVID-19 pandemic, as well as its impact on our borrowers, lenders and the economy as a whole, remains uncertain and continues to evolve. To the extent that our operating partners, financing sources, borrower’s and their tenants continue to be impacted by the COVID-19 pandemic, or by the other risks disclosed in this Annual Report on Form 10-K, it would have a material adverse effect on our liquidity and capital resources.therefore we believe bear minimal credit risk.
To facilitate future offerings of equity, debt and other securities, we have in place an effective shelf registration statement (the “Shelf”) with the SEC. The amount of securities that mayto be issued pursuant to this Shelf was not specified when it was filed and there is not to exceed $750.0 million.no specific dollar limit on the amount of securities we may issue. The securities covered by this Shelf include: (i) common stock, (ii) preferred stock, (iii) depository shares, (iv) debt securities, (v) warrants, (vi) subscription rights, (vii) and purchase contracts, and (viii) units. The specifics of any future offerings, along with the use of proceeds of any securities offered, will be described in detail in a prospectus supplement, or other offering material, at the time of any offering. In February 2019, we
We have also entered into an equity distribution agreement with certain sales agents, pursuant to which we may sell, from time to time, up to an aggregate sales price of $100.0 million of our common stock, pursuant to a continuous offering program (the “ATM”), under the Shelf. Sales of our common stock made pursuant to the ATM may be made in negotiated transactions or transactions that are deemed to be “at the market” offerings as defined in Rule 415 under the Securities Act. We haveDuring the year ended December 31, 2023, we did not soldsell any shares of our common stock under the ATM to date.ATM. As of December 31, 2023, $93.2 million remained available for issuance under the ATM.
(1) Comprised of collateralized loan obligations, term lending agreements, term loan facility, secured term loan, asset specific financing, warehouse facility, corporate revolver and non-consolidated senior interests.
See Notes 5, 6, 7, 8 and 1110 to our consolidated financial statements for additional details regarding our secured financing agreements, collateralized loan obligations, secured term loan, convertible notes and stock activity.
(1) Comprised of term loan financing, term lending agreements, collateralized loan obligations, secured term loan, warehouse facility, asset specific financing, and non-consolidated senior interests.
Debt-to-Equity Ratio and Total Leverage Ratio
The following table presents our debt-to-equity ratio and total leverage ratio:
| | | | | | | | | | | | | | |
| | December 31, 20212023 | | December 31, 20202022 |
Debt-to-equity ratio(A) | | 2.3x | | 1.9x2.0x |
Total leverage ratio(B) | | 3.7x4.2x | | 3.6x3.8x |
(A) Represents (i) total outstanding debt agreements (excluding non-recourse term loan facility)facilities), secured term loan and convertible notes, less cash to (ii) total permanent equity, in each case, at period end.
(B) Represents (i) total outstanding debt agreements, secured term loan, convertible notes, and collateralized loan obligations, less cash to (ii) total permanent equity, in each case, at period end.
Sources of Liquidity
Our primary sources of liquidity include cash and cash equivalents and available borrowings under our secured financing agreements, inclusive of our Revolver. Amounts available under these sources as of the date presented are summarized in the following table (dollars in thousands):
| | | | | | | | | | | | | | |
| | December 31, 2021 | | December 31, 2020 |
| Cash and cash equivalents | | $ | 271,487 | | | $ | 110,832 | |
| Available borrowings under revolving credit agreements | | 200,000 | | | 335,000 | |
| Available borrowings under master repurchase agreements | | 51,601 | | | 19,319 | |
| | | | |
| Available borrowings under term lending agreement | | 5,826 | | | — | |
| | | | |
| Available borrowings under asset specific financing | | — | | | 800 | |
| Loan principal payments receivable | | — | | | 15,850 | |
| | $ | 528,914 | | | $ | 481,801 | |
| | | | | | | | | | | | | | |
| | December 31, 2023 | | December 31, 2022 |
| Cash and cash equivalents | | $ | 135,898 | | | $ | 239,791 | |
| Available borrowings under revolving credit agreement | | 450,000 | | | 610,000 | |
| Available borrowings under master repurchase agreements | | 35,610 | | | 94,426 | |
| | | | |
| Available borrowings under term lending agreements | | 8,394 | | | 7,583 | |
| | | | |
| | | | |
| | | | |
| | $ | 629,902 | | | $ | 951,800 | |
We also had $235.3$43.1 million and $274.7$179.4 million of unencumbered senior loans that can be pledged to financing facilities subject to lender approval, as of December 31, 20212023 and 2020.2022, respectively. In addition to our primary sources of liquidity, we have the ability to access further liquidity through our ATM program and public offerings of debt and equity securities. Our existing loan portfolio also provides us with liquidity as loans are repaid or sold, in whole or in part, and the proceeds from repayment become available for us to invest.
Cash Flows
The following table sets forth changes in cash and cash equivalents for the years ended December 31, 2021, 20202023, 2022 and 20192021 (dollars in thousands):
| | For the Year Ended December 31, |
| 2021 | | 2020 | | 2019 |
| | Year Ended December 31, | | | | Year Ended December 31, |
| | 2023 | | | | 2023 | | 2022 | | 2021 |
| Cash Flows From Operating Activities | Cash Flows From Operating Activities | | $ | 124,793 | | | $ | 115,062 | | | $ | 91,713 | |
| Cash Flows From Investing Activities | Cash Flows From Investing Activities | | (1,540,836) | | | 88,709 | | | (926,314) | |
| Cash Flows From Financing Activities | Cash Flows From Financing Activities | | 1,578,981 | | | (160,558) | | | 815,689 | |
| Net Increase (Decrease) in Cash, Cash Equivalents, and Restricted Cash | Net Increase (Decrease) in Cash, Cash Equivalents, and Restricted Cash | | $ | 162,938 | | | $ | 43,213 | | | $ | (18,912) | |
Cash Flows from Operating Activities
Our cash flows from operating activities were primarily driven by our net interest income, which is driven by the income generated by our investments less financing costs. The following table sets forth interest received by,from, and paid for, our investments for the years ended December 31, 2021, 20202023, 2022 and 20192021 (dollars in thousands):
| | For the Year Ended December 31, |
| 2021 | | 2020 | | 2019 |
| | Year Ended December 31, | | | | Year Ended December 31, |
| | 2023 | | | | 2023 | | 2022 | | 2021 |
| Interest Received: | Interest Received: | | | | | | |
| Commercial real estate loans | Commercial real estate loans | | $ | 249,564 | | | $ | 242,313 | | | $ | 251,062 | |
| CMBS B-Pieces | | — | | | — | | | 1,715 | |
| Commercial real estate loans | |
| Commercial real estate loans | |
| | 249,564 | | | 242,313 | | | 252,777 | |
| | 612,046 | |
| | 612,046 | |
| | 612,046 | |
| Interest Paid: | Interest Paid: | |
| Interest expense | Interest expense | | $ | 95,256 | | | 103,405 | | | 146,156 | |
| Interest expense | |
| Interest expense | |
| Net interest collections | Net interest collections | | $ | 154,308 | | | $ | 138,908 | | | $ | 106,621 | |
Our net interest collections were partially offset by cash used to pay management and incentive fees, as follows (dollars in thousands):
| | For the Year Ended December 31, |
| 2021 | | 2020 | | 2019 |
| | Year Ended December 31, | | | | Year Ended December 31, |
| | 2023 | | | | 2023 | | 2022 | | 2021 |
| Management Fees to affiliate | Management Fees to affiliate | | $ | 18,341 | | | $ | 17,020 | | | $ | 17,185 | |
| Incentive Fees to affiliate | Incentive Fees to affiliate | | 10,273 | | | 6,774 | | | 3,272 | |
| Net decrease in cash and cash equivalents | | $ | 28,614 | | | $ | 23,794 | | | $ | 20,457 | |
| Total management and incentive fee payments | |
Cash Flows from Investing Activities
Our cash flows from investing activities consisted of cash outflows to fund new loan originations and our commitments under existing loan investments, partially offset by cash inflows from the sale/syndication and principal repayments onand sale/syndication of our loan investments. During the year ended December 31, 2021,2023, we funded $3,904.6$677.3 million of CRE loans and received $2,362.4$691.3 million from the from repayments and sales/syndications of CRE loans.
During the year ended December 31, 2020,2022, we funded $966.2$2,419.7 million of CRE loans and received $1,054.9$1,244.3 million from the sale/syndication and repayments of CRE loans.
Cash Flows from Financing Activities
Our cash flows from financing activities were primarily driven by proceeds from borrowings under our financing agreements of $3,642.0$811.1 million proceeds from CLO KREF 2021-FL2 issuance of $1,095.3 million, net proceeds from Series A preferred stock issuance of $167.1 million, and net proceeds from common stock issuance of $120.7 million during theduring year ended December 31, 2021, which were2023, partially offset by (i) repaymentsrepayments of $2,487.7$791.3 million on borrowings under our financing agreements, (ii) principal repayment of $810.0$143.75 million under CLO KREF 2018-FL1,convertible notes, and (iii) payment of $103.9$140.2 million in dividends.
During the year ended December 31, 2020,2022, our cash flows from financing activities were primarily driven by proceeds from borrowings under our financing agreements of $1,015.4$2,483.9 million, proceeds from CLO KREF 2022-FL3 issuance of $847.5 million and net proceeds from our secured term loanSeries A Preferred and Common stock issuance of $292.5$345.4 million which wereduring 2022, partially offset by (i) principal repayments of $1,332.8$2,454.6 million on borrowings under our financing agreements, (ii) payment of $97.1$136.9 million in dividends, and (iii) payment of $25.1$35.8 million for our share repurchases.
Contractual Obligations and Commitments
The following table presents our contractual obligations and commitments (including interest payments) as of December 31, 20212023 (dollars in thousands):
| | | | | | | | | | | | | | | | | | | | | | | | | | | | | |
| Total | | Less than 1 year | | 1 to 3 years | | 3 to 5 years | | Thereafter |
| Recourse Obligations: | | | | | | | | | |
Master Repurchase Facilities(A) | | | | | | | | | |
Wells Fargo(B) | $ | 1,021,558 | | | $ | 14,997 | | | $ | 1,006,561 | | | $ | — | | | $ | — | |
Morgan Stanley(C) | 390,826 | | | 390,826 | | | — | | | — | | | — | |
Goldman Sachs(D) | 194,177 | | | 194,177 | | | — | | | — | | | — | |
Term Lending Agreements(A) | | | | | | | | | |
KREF Lending V(E) | 623,696 | | | 623,696 | | | — | | | — | | | — | |
| KREF Lending IX | 529,332 | | | 9,031 | | | 391,379 | | | 128,922 | | | — | |
| Warehouse Facility | | | | | | | | | |
| HSBC | — | | | — | | | — | | | — | | | — | |
| Asset Specific Financing | | | | | | | | | |
BMO Facility(A) | 60,114 | | | 60,114 | | | — | | | — | | | — | |
| Total secured financing agreements | 2,819,703 | | | 1,292,841 | | | 1,397,940 | | | 128,922 | | | — | |
| Convertible Notes | 155,979 | | | 8,927 | | | 147,052 | | | — | | | — | |
| Secured Term Loan | 428,277 | | | 17,602 | | | 34,894 | | | 34,288 | | | 341,493 | |
Future funding obligations(F) | 1,367,880 | | | 554,118 | | | 738,948 | | | 74,814 | | | — | |
RECOP I commitment(G) | 4,324 | | | 4,324 | | | — | | | — | | | — | |
Revolver(H) | 137,840 | | | 137,840 | | | — | | | — | | | — | |
| Total recourse obligations | 4,914,003 | | | 2,015,652 | | | 2,318,834 | | | 238,024 | | | 341,493 | |
| Non-Recourse Obligations: | | | | | | | | | |
| Collateralized Loan Obligations | 1,173,598 | | | 15,661 | | | 31,322 | | | 31,365 | | | 1,095,250 | |
| Term Loan Financing | 887,323 | | | 535,842 | | | 314,708 | | | 36,773 | | | — | |
| Total | $ | 6,974,924 | | | $ | 2,567,155 | | | $ | 2,664,864 | | | $ | 306,162 | | | $ | 1,436,743 | |
| | | | | | | | | | | | | | | | | | | | | | | | | | | | | |
| Total | | Less than 1 year | | 1 to 3 years | | 3 to 5 years | | Thereafter |
Master Repurchase Facilities(A) | $ | 1,477,227 | | | $ | 89,186 | | | $ | 1,248,693 | | | $ | 139,347 | | | $ | — | |
Term Lending Agreements(A) | 1,329,390 | | | 94,256 | | | 538,690 | | | 696,444 | | | — | |
| Warehouse Facility | — | | | — | | | — | | | — | | | — | |
| Term Loan Facility | 561,377 | | | 61,950 | | | 215,523 | | | 283,904 | | | — | |
| Asset Specific Facility | 266,072 | | | — | | | 100,000 | | | 166,072 | | | — | |
Revolver(B) | 160,000 | | | 160,000 | | | — | | | — | | | — | |
| Total secured financing agreements | 3,794,066 | | | 405,392 | | | 2,102,906 | | | 1,285,767 | | | — | |
| Collateralized Loan Obligations | 1,942,750 | | | — | | | — | | | — | | | 1,942,750 | |
| Secured Term Loan | 343,000 | | | 3,500 | | | 7,000 | | | 332,500 | | | — | |
Interest payable(C) | 1,513,606 | | | 434,470 | | | 740,932 | | | 338,204 | | | — | |
Future funding obligations(D) | 816,428 | | | 470,414 | | | 338,301 | | | 7,713 | | | — | |
| RECOP I commitment | 4,324 | | | 4,324 | | | — | | | — | | | — | |
| Total | $ | 8,414,174 | | | $ | 1,318,100 | | | $ | 3,189,139 | | | $ | 1,964,184 | | | $ | 1,942,750 | |
(A) The allocation of repurchase facilities and term lending agreements is based on the currentearlier of (i) the maximum maturity date of each individual borrowingthe underlying loans pledged as collateral or (ii) the maximum maturity of the respective financing agreements. Amounts borrowed are subject to a maximum 25.0% recourse limit.
(B) Any amounts borrowed are full recourse to certain subsidiaries of KREF. Amounts are estimated based on the amount outstanding under these facilities.the Revolver and the interest rate in effect as of December 31, 2023. This is only an estimate as actual amounts borrowed, the timing of repayments and interest rates may vary over time. The Revolver matures in March 2027.
(C) The amounts include the related future interest payment obligations, which are estimated by assuming the amounts outstanding under these facilities and the interest rates in effect as of December 31, 20212023 will remain constant into the future. This is only an estimate, asThe actual amounts borrowed and rates may vary over time. Amounts borrowed are subject to a maximum 25.0% recourse limit.
(B) In September 2021, the current stated maturity was amended to September 2024, subject to two, twelve-month facility term extensions available to us, which is contingent upon certain covenants and thresholds.
(C) In December 2021, the current stated maturity was extended to December 2022, with one-year extension option upon KREF giving written notice and another two one-year extension periods subject to approval by Morgan Stanley.
(D) In October 2021, the current stated maturity was amended to October 2022, subject to a twelve-month extension option available to us, subject to the satisfaction of certain conditions.
(E) In March 2021, the current stated maturity was extended to June 2022, subject to four additional one-year extension options, which may be exercised by us upon the satisfaction of certain customary conditions and thresholds.
(F) We have future funding obligations related to our investments in senior loans. These future funding obligations primarily relate to construction projects, capital improvements, tenant improvements and leasing commissions. Generally, funding obligations are subject to certain conditions that must be met, such as customary construction draw certifications, minimum debt service coverage ratios, minimal debt yield tests, or executions of new leases before advances are made to the borrower. As such, the allocation of our future funding obligations is based on the earlier of the expected funding or commitment expiration date.
(G) Amounts committed to invest in an aggregator vehicle alongside RECOP I, which had a two-year investment period which ended in April 2019.
(H) Any amounts borrowed are full recourse to certain subsidiaries of KREF. Includes principal and assumes interest outstanding over a one-year period. Amounts are estimated based on the amount outstanding under the Revolver and the interest rate in effect as of December 31, 2021. This is only an estimate as actual amounts borrowed, the timing of repayments and interest rates may vary over time. The Revolver matures in December 2023.
We are required to pay our Manager a base management fee, an incentive fee and reimbursements for certain expenses pursuant to our management agreement. The table above does not include the amounts payable to our Manager under our management agreement as they are not fixed and determinable. See Note 1514 to our consolidated financial statements included in this Form 10-Q10-K for additional terms and details of the fees payable under our management agreement.
As a REIT, we generally must distribute at least 90% of our REIT taxable income, determined without regard to the deduction for dividends paid and excluding net capital gains, to stockholders in the form of dividends to comply with the REIT provisions
of the Code. Our taxable income does not necessarily equal our net income as calculated in accordance with GAAP, or our Distributable Earnings as described above under "Key Financial Measures and Indicators — Distributable Earnings."
Recent Market Conditions
Due to the ongoing COVID-19 pandemic in the United States and globally, our operating partners, borrowers and their tenants, the properties securing our investments, and the economy as a whole have been, and will continue to be, adversely impacted. The magnitude and duration of the COVID-19 pandemic and its impact on our borrowers and their tenants, cash flows and future results of operations has been significant, and its continued impact will largely depend on future developments, which are highly uncertain and cannot be predicted.
Although there are effective vaccines for COVID-19 that have been approved for use and are widely available to the majority of the public, vaccination rates across populations varies and the effectiveness of such vaccines against future strains of COVID-19 is uncertain. Accordingly, given the ongoing nature of the outbreak, at this time we cannot reasonably estimate the magnitude of the ultimate impact that COVID-19 will have on our business, financial performance and operating results. We believe COVID-19’s adverse impact on our business, financial performance and operating results will in part be significantly driven by a number of factors that we are unable to predict or control, including, for example: the severity and duration of the pandemic; the distribution and acceptance of vaccines and their impact on the timing and speed of economic recovery; the spread of new variants of the virus; the pandemic’s impact on the U.S. and global economies, including concerns regarding additional surges of the pandemic or the expansion of the economic impact thereof as a result of certain jurisdictions “re-opening” or otherwise lifting certain restrictions prematurely; the availability of U.S. federal, state, local or non-U.S. funding programs aimed at supporting the economy during the COVID 19 pandemic, including uncertainties regarding the potential implementation of new or extended programs; the timing, scope and effectiveness of additional governmental responses to the pandemic; and the negative impact on our financing sources, vendors and other business partners that may indirectly adversely affect us. The prolonged duration and impact of the COVID-19 pandemic could materially disrupt our business operations and impact our financial performance.
While the economy has improved significantly since the initial outbreak of the COVID-19 pandemic, the pandemic has resulted in and may continue to result in declines in rental rates and increases in rental concessions, including free rent to renew tenants early, to retain tenants who are up for renewal or to attract new tenants, or rent abatements for tenants severely impacted by the COVID-19 pandemic. Such responses have resulted in and may continue to result in decreases in cash flows to certain of our borrowers and potentially in defaults in paying debt service on outstanding indebtedness, which could adversely impact our results of operations and financial performance. The COVID-19 pandemic continues to disrupt global supply chains, has caused labor shortages and has added broad inflationary pressures, which has a potential negative impact on our borrowers’ ability to execute on their business plans and potentially their ability to perform under the terms of their loan obligations. In addition, declines in economic conditions could negatively impact real estate and real estate capital markets and result in lower occupancy, lower rental rates and declining values in our portfolio, which could adversely impact the value of our investments, making it more difficult for us to make distributions or meet our financing obligations.Earnings".
Subsequent Events
Our subsequent events are detailed in Note 1817 to our consolidated financial statements.
Critical Accounting Policies and Use of Estimates
Our consolidated financial statements are prepared in accordance with GAAP, which requires the use of estimates and assumptions that involve the exercise of judgment and use of assumptions as to future uncertainties. Accounting estimates and assumptions discussed in this section are those that we consider to be the most critical to understanding our financial statements because they involve significant judgments and uncertainties that could affect our reported assets and liabilities, as well as our reported revenue and expenses. All of these estimates reflect our best judgment about current, and for some estimates, future economic and market conditions and their effects based on information available as of the date of the financial statements. If conditions change from those expected, it is possible that the judgments and estimates described below could change, which may result in a change in our allowance for credit losses, future write-offwrite-offs of our investments, and valuation of our investment
portfolio, among other effects. We believe that the following accounting policies are among the most important to the portrayal of our financial condition and results of operations and require the most difficult, subjective or complex judgments:judgments.
Upon the acquisition of Contentsa property, we assess the fair value of the acquired tangible and intangible assets (including land, buildings, tenant improvements, favorable and unfavorable leases, acquired in-place leases, other identified intangible assets and assumed liabilities) and allocate the purchase price to the acquired assets and assumed liabilities, which are on a relative fair value basis. The most significant portion of the allocation is to building and land and requires the use of market based estimates and assumptions. We assess and consider fair value based on estimated cash flow projections that utilize appropriate discount and/or capitalization rates, as well as other available market information. Estimates of future cash flows are based on a number of factors including the historical operating results, known and anticipated trends, and market and economic conditions.
The fair value of the tangible assets of an acquired property considers the value of the property as if it were vacant. We also consider an allocation of purchase price of other acquired intangibles, including acquired in-place leases that may have a customer relationship intangible value, including (but not limited to) the nature and extent of the existing relationship with the tenants, the tenants’ credit quality and expectations of lease renewals.
Acquired favorable and unfavorable leases are recorded at their fair values (using a discount rate which reflects the risks associated with the leases acquired) equal to the difference between (i) the contractual amounts to be paid pursuant to each in-place lease and (ii) management’s estimate of fair market lease rates for each corresponding in-place lease, measured over a period equal to the remaining term of the lease for favorable leases and the initial term plus the term of any below-market fixed rate renewal options for unfavorable leases. Other intangible assets acquired include amounts for in-place lease values that are based on our evaluation of the specific characteristics of each tenant’s lease. Factors to be considered include estimates of carrying costs during hypothetical expected lease-up periods considering current market conditions, and costs to execute similar leases. In estimating carrying costs, we include real estate taxes, insurance and other operating expenses and estimates of lost rentals at market rates during the expected lease-up periods, depending on local market conditions. In estimating costs to execute similar leases, we consider leasing commissions, legal and other related expenses.
Allowance for LoanCredit Losses
We originate and purchase CRE debt and related instruments generally to be held as long-term investments at amortized cost. We adopted ASU No. 2016-13, Financial Instruments—Credit Losses, and subsequent amendments (“ASU 2016-13”), which replaced the incurred loss methodology with an expected loss model known as the Current Expected Credit Loss or CECL model. CECL amends the previous credit loss model to reflect our current estimate of all expected credit losses, not only based on historical experience and current conditions, but also by including reasonable and supportable forecasts incorporating forward-looking information.
In connection with our adoption of ASU No. 2016-13 on January 1, 2020, we implemented new processes including the utilization of loan loss forecasting models, updates to our reserve policy documentation, changes to our internal reporting processes and related internal controls. We have implemented loan loss forecasting models for estimating expected life-time credit losses, at the individual loan level, for our commercial mortgage loan portfolio. The CECL forecasting methods used by us include (i) a probability of default and loss given default method using underlying third-party CMBS/CRE loan database with historical loan losses from 1998 to 2020,through 2023, and (ii) a probability weighted expected cash flow method, depending on the type of loan and the availability of relevant historical market loan loss data. We might use other acceptable alternative approaches in the future depending on, among other factors, the type of loan, underlying collateral, and availability of relevant historical market loan loss data.
We estimate our CECL allowance for our loan portfolio, including unfunded loan commitments, at the individual loan level. Significant inputs to our forecasting methods include (i) key loan-specific inputs such as vintage year, loan-term, underlying property type, geographic location, and expected timing and amount of future loan fundings, (ii) performance against the underwritten business plan and our internal loan risk rating and (iii) a macro-economic forecast. In certain instances, we consider relevant loan-specific qualitative factors to certain loans to estimate its CECL allowance.
We consider loan investments that are both (i) expected to be substantially repaid through the operation or sale of the underlyingFor collateral and (ii) for which the borrower is experiencing financial difficulty, to be “collateral-dependent” loans. For suchdependent loans that we determine that foreclosure of the collateral is probable, we measure the expected losses based on the difference between the fair value of the collateral and the amortized cost basis of the loan as of the measurement date. For collateral-dependentcollateral dependent loans thatwhere we determine foreclosure is not probable, we apply a practical expedient to estimate expected losses using the difference between the collateral’s fair value (less costs to sell the asset if repayment is expected through the sale of the collateral) and the amortized cost basis of the loan.
We consider the individual A loan internal risk rating as the primary credit quality indicator underlying the CECL assessment. We perform a quarterly review of our loan portfolio at the individual loan levelis determined to determine the internal risk rating for each of our loans by assessing the risk factors of each loan, including, without limitation, LTV, debt yield, property type, geographic and local market dynamics, physical condition, cash flow volatility, leasing and tenant profile, loan structure and exit plan, and project sponsorship. Considering these factors, we rate our loans based on a five-point scale, "1" though "5", from less risk to greater risk, which ratings are defined as follows:
1—Very Low Risk—The underlying property performance has surpassed underwritten expectations, and the sponsor’s business plan is generally complete. The property demonstrates stabilized occupancy and/or rental rates resulting in strong current cash flow and/or a very low loan-to-value ratio (<65%). At the level of performance, it is very likely that the underlying loan can be refinanced easily in the period’s prevailing capital market conditions.
2—Low Risk—The underlying property performance has matched or exceeded underwritten expectations, and the sponsor’s business plan may be ahead of schedule or has achieved some or many of the major milestones from a risk mitigation perspective. The property has achieved improving occupancy at market rents, resulting in sufficient current cash flow and/or a low loan-to-value ratio (65%-70%). Operating trends are favorable, and the underlying loan can be refinanced in today’s prevailing capital market conditions. The sponsor/manager is well capitalized or has demonstrated a history of success in owning or operating similar real estate.
3—Average Risk—The underlying property performance is in-line with underwritten expectations, or the sponsor may be in the early stages of executing its business plan. Current cash flow supports debt service payments, or there is an ample interest reserve or loan structure in place to provide the sponsor time to execute the value-improvement plan.collateral dependent if (i)
The property exhibits a moderate loan-to-value ratio (<75%). Loan structure appropriately mitigates additional risks. The sponsor/manager has a stable credit historyborrower or sponsor is experiencing financial difficulty, and experience owning or operating similar real estate.(ii) the loan is expected to be substantially repaid through the sale of the underlying collateral; such determination requires the use of significant judgment and can be based on several factors subject to uncertainty.
4—High Risk/PotentialIn conjunction with reviewing commercial real estate loans held-for-investment for Loss—Aimpairment, the Manager evaluates our commercial real estate loans at least once per quarter, assesses the risk factors of each loan, that hasand assigns a risk rating based on a variety of realizingfactors, including, without limitation, underlying real estate performance, values of comparable properties, durability and quality of property cash flows, sponsor experience and financial wherewithal, and the existence of a risk-mitigating loan structure. Additional key considerations include debt service coverage ratios, loan structure, real estate and credit market dynamics, and risk of default or principal loss. The underlying property performance is behind underwritten expectations, or the sponsor is behind schedule in executing its business plan. The underlying market fundamentals may have deteriorated, comparable property valuations may be declining or property occupancy has been volatile, resulting in current cash flow that may not support debt service payments. The loan exhibitsBased on a high loan-to-value ratio (>80%), and the loan covenantsfive-point scale, our loans are unlikelyrated "1" through "5," from less risk to fully mitigate some risks. Interest payments may come from an interest reserve or sponsor equity.greater risk.
5—Impaired/Loss Likely—A loan that has a very high risk of realizing a principal loss or has otherwise incurred a principal loss. The underlying property performance is significantly behind underwritten expectations, the sponsor has failed to execute its business plan and/or the sponsor has missed interest payments. The market fundamentals have deteriorated, or property performance has unexpectedly declined or valuations for comparable properties have declined meaningfully since loan origination. Current cash flow does not support debt service payments. With the current capital structure, the sponsor might not be incentivized to protect its equity without a restructuring of the loan. The loan exhibits a very high loan-to-value ratio (>90%), and default may be imminent.
Recent Accounting Pronouncements
Recently Adopted Accounting StandardIn March 2020, the FASB issued ASU No. 2020-04, Reference Rate Reform (Topic 848): Facilitation of the Effects of Reference Rate Reform on Financial Reporting, which provides temporary optional expedients and exceptions to the US GAAP guidance on contract modifications and hedge accounting to ease the financial reporting burdens of the expected market transition from LIBOR and other interbank offered rates to alternative reference rates. The guidance is effective upon issuance and generally may be elected over time through December 31, 2024, as extended under ASU No. 2022-06, Reference Rate Reform (Topic 848): Deferral of the Sunset Date of Topic 848. We have not adopted any of the optional expedients or exceptions through December 31, 2023, but will continue to evaluate the possible adoption of any such expedients or exceptions during the effective period as circumstances evolve.
None.In March 2022, the FASB issued ASU No. 2022-02, Financial Instruments — Credit Losses (Topic 326): Troubled Debt Restructurings and Vintage Disclosures, which eliminates the recognition and measurement guidance for a troubled debt restructuring for creditors that have adopted CECL and requires public business entities to present gross write-offs by year of origination in their vintage disclosures. On January 1, 2023, we adopted ASU 2022-02 on a prospective basis and the adoption had no significant impact on our consolidated financial statements.
In November 2023, the FASB issued ASU No. 2023-07, Segment Reporting (Topic 280): Improvements to Reportable Segment Disclosures, which requires a public entity to disclose significant segment expenses and other segment items on an annual and interim basis and to provide in interim periods all disclosures about a reportable segment’s profit or loss and assets that are currently required annually. Public entities with a single reportable segment are required to provide the new disclosures and all the disclosures required under ASC 280. The guidance is effective for our 2024 annual reporting. The guidance is applied retrospectively to all periods presented in the financial statements, unless it is impracticable. We are evaluating the impact of ASU 2023-07.
ITEM 7A. QUANTITATIVE AND QUALITATIVE DISCLOSURES ABOUT MARKET RISK
We seek to manage our risks related to the credit quality of our assets, interest rates, liquidity, prepayment rates and market value, while at the same time seeking to provide an opportunity to stockholders to realize attractive risk-adjusted returns. While risks are inherent in any business enterprise, we seek to quantify and justify risks in light of available returns and to maintain capital levels consistent with the risks we undertake.
Credit Risk
Our investments are subject to credit risk, including the risk of default. The performance and value of our investments depend upon the sponsors' ability to operate the properties that serve as our collateral so that they produce cash flows adequate to pay interest and principal due to us. To monitor this risk, our Manager reviews our investment portfolio and is in regular contact with the sponsors, monitoring performance of the collateral and enforcing our rights as necessary.
The COVID-19 pandemic continuesvalue of underlying real estate collateral relating to disrupt global supply chains, has caused labor shortagesKREF’s investments and has added broad inflationary pressures, which has a potential negative impact on ourimpair KREF's borrowers’ ability to execute on their business plans and potentially their ability to perform under the terms of their loan obligations. The COVID-19 pandemic has adversely impacted the commercial real estate markets, causing reduced occupancy, requests from tenants for rent deferral or abatement, and delays in property renovations currently planned or underway. While the economy has improved significantly from the initial outbreak of the COVID-19 pandemic, these negative conditions may persist into the future and impair our borrowers’ ability to pay principal and interest due under our loan agreements. We maintain robust asset management relationships with our borrowers and have leveraged these relationships to address the potential impact of the COVID-19 pandemic on our loans secured by properties experiencing cash flow pressure, most significantly hospitality and retail assets, to which we have limited exposure.
Based on the limited loan modifications completed to date, and the relative performance of most modified loans, we are encouraged by our borrowers’ initial response to the COVID-19 pandemic’s impact on their properties and current trends. We believe our loan sponsors are generally committed to supporting assets collateralizing our loans through additional equity investments. While we believe the principal amounts of our loans are generally adequately protected by underlying collateral value and have adequate CECL reserves, there is a risk that we will not realize the entire principal value of certain investments.
Credit Yield Risk
Credit yields measure the return demanded on financial instruments by the lending market based on their risk of default. Increasing supply of credit-sensitive financial instruments and reduced demand will generally cause the market to require a higher yield on such financial instruments, resulting in a lower price for the financial instruments we hold.
Interest Rate Risk
Generally, theThe composition of our investments is such that rising interest rates will increase our net income, while declining interest rates will generally decrease our net income. Our net interest income currently benefits from in-the-money LIBORRate floors inrelating to our loan portfolio which benefit is expected to initially decrease as LIBOR increases.may offset some of the impact from declining rates. There can be no assurance that we will continue to utilize LIBORrate floors. As of December 31, 2021, one-month USD LIBOR was 0.10%, as compared to 0.14% as of December 31, 2020. There can be no assurance of how our net income may be affected in future quarters, which will depend on, among other things, the interest rate environment and our then-current portfolio. As of December 31, 2021, 100.0% of our loans by principal balance earned a floating rate of interest indexed to one-month USD LIBOR. The interest rates we pay under our current financing facilities are floating rate. Accordingly, our interest expense will generally increase as interest rates increase and decrease as interest rates decrease.
In light of increasing inflation in recent years, the U.S. Federal Reserve has raised interest rates eleven times since January 2022.
As noted above,
In addition to the risks related to fluctuations in cash flows and asset values associated with movements in interest rates, there is also the risk of non-performance on floating-rate assets. In the case of a significant increase in interest rates, the cash flows of the collateral real estate assets may not be sufficient to pay debt service due under our loans, which may contribute to non-performance or, in severe cases, default.
Notwithstanding the current period of relatively high interest rates, the U.S. Federal Reserve has indicated that it may decrease in interest rates in 2024. In a period of declining interest rates, our interest income on floating-rate investments would generally decreases as LIBOR decreases;decrease, while any decrease in certain circumstances, however, LIBORthe interest we are charged on our floating-rate debt may be subject to floors and may not compensate for such decrease in interest income. However, rate floors relating to our loan portfolio may offset some of the impact from declining rates. In addition, interest we are charged on our fixed-rate debt would not change.
As of December 31, 2021,2023, our accruing loan portfolio and related portfolio financing by principal amount earned or paid a floating rate of interest indexed to Term SOFR. Accordingly, our interest income and expense will generally change directionally with index rates; however, in certain circumstances, rate floors relating to our loan portfolio approximately 54%may partially offset the impact from changing rates. As of our portfolio was subject toDecember 31, 2023, a LIBOR floor of at least 0.25% with a weighted average floor of 0.74%. Due to these LIBOR floors, a 1050 basis point or greaterand a 100 basis point decrease in LIBORthe index rates would decrease our expected cash flows by approximately $1.1 million and $2.2 million, or ($0.02) and ($0.03) per common share, respectively, for the following three-month period. Conversely, a 50 basis point and a 100 basis point increase in the index rates would increase our expected cash flows by approximately $4.3$1.1 million and $2.2 million, or $0.07 $0.02 and $0.03 per common share, for the twelve months following December 31, 2021. Conversely, a 25 basis point and 50 basis point increase in LIBOR would decrease our expected cash flows by approximately $4.1 million and $6.8 million, or $0.07 and $0.11 per common share,respectively, for the same period, respectively.
LIBOR Transition
OnOn March 5, 2021, the Financial Conduct Authority of the U.K. (the “FCA”), which regulates LIBOR, announced (the “FCA Announcement”) that all relevant LIBOR tenors relevant to us willwould cease to be published or willwould no longer be representative after June 30, 2023. The FCA Announcement coincidescoincided with the March 5, 2021 announcement of LIBOR’s administrator, the ICE Benchmark Administration Limited (the “IBA”), indicating that, as a result of not having access to input data necessary to calculate relevant LIBOR tenors relevant to us on a representative basis after June 30, 2023, the IBA would have to cease publication of such LIBOR tenors immediately after the last publication on June 30, 2023. Further, on March 15, 2022, the Consolidated Appropriations Act of 2022, which includes the Adjustable Interest Rate (LIBOR) Act, was signed into law in the United States. This legislation established a uniform benchmark replacement process for financial contracts maturing after June 30, 2023 that do not contain clearly defined or practicable fallback provisions. The United Stateslegislation also created a safe harbor that shields lenders from litigation if they choose to utilize a replacement rate recommended by the Board of Governors of the Federal Reserve has also advised banks to cease entering into new contracts that use USD LIBOR as a reference rate. Reserve.
The Federal Reserve, in conjunction with the Alternative Reference Rate Committee, a committee convened by the Federal Reserve that includes major market participants, has identified the Secured Overnight Financing Rate, or SOFR, a newan index calculated by short-term repurchase agreements, backed by Treasury securities, as its preferred alternative rate for LIBOR. There are significant differences between LIBOR and SOFR, such as LIBOR being an unsecured lending rate while SOFR is a secured lending rate, and SOFR is an overnight rate while LIBOR reflects term rates at different maturities. If our LIBOR-based borrowings are converted to SOFR, theThe differences between LIBOR and SOFR, could result in higher interest costs for us, which could have a material adverse effect on our operating results. Although SOFR is the ARRC’s recommended replacement rate, it is also possible that lenders may instead choose alternative replacement rates that may differ from LIBOR in ways similar to SOFR or in other ways that would result in higher interest costs for us. We cannot predict the effect of the decision not to sustain LIBOR, or the potential transition to SOFR or another alternative reference rate as LIBOR’s replacement.
As of December 31, 2021, 100.0% of2023, our loans by principal balance earned a floating rate of interestfloating-rate loan portfolio and financing arrangements were all indexed to LIBOR, and 100.0% of our outstanding financing arrangements (excluding convertible notes) bear interest indexed to LIBOR. All of these arrangements provide procedures for determining an alternative base rate in the event that LIBOR is discontinued. Regardless, there can be no assurances as to what alternative base rates may be and whether such base rate will be more or less favorable than LIBOR and any other unforeseen impacts of the discontinuation of LIBOR. We are monitoring the developments with respect to the phasing out of LIBOR and are working with our lenders and borrowers to minimize the impact of any LIBOR transition on our financial condition and results of operations, but can provide no assurances regarding the impact of the discontinuation of LIBOR.Term SOFR.
Prepayment Risk
Prepayment risk is the risk that principal will be repaid at an earlier date than anticipated, potentially causing the return on certain investments to be less than expected. As we receive prepayments of principal on our assets, any premiums paid on such assets are amortized against interest income. In general, an increase in prepayment rates accelerates the amortization of purchase premiums, thereby reducing the interest income earned on the assets. Conversely, discounts on such assets are accreted into interest income. In general, an increase in prepayment rates accelerates the accretion of purchase discounts, thereby increasing the interest income earned on the assets. Additionally, we may not be able to reinvest the principal repaid at the same or higher yield of the original investment.
Higher interest rates imposed by the Federal Reserve may lead to a decrease in prepayment speeds and an increase in the number of our borrowers who exercise extension options, which could extend beyond the term of certain secured financing agreements we use to finance our loan investments. This could have a negative impact on our results of operations, and in some situations, we may be forced to sell assets to maintain adequate liquidity, which could cause us to incur losses.
Financing Risk
We finance our target assets using our repurchase facilities, our term lending agreements, our Term Loan Financing,Facility, Warehouse Facility, Asset Based Financing, secured term loan, collateralized loan obligations and through syndicating senior participations in our originated senior loans. Over time, as market conditions change, we may use other forms of leverage in addition to these methods of financing. Weakness or volatility in the financial markets, the CRE and mortgage markets or the economy generally could adversely affect one or more of our lenders or potential lenders and could cause one or more of our lenders or potential lenders to be unwilling or unable to provide us with financing, or to decrease the amount of our available financing through a market to market, or to increase the costs of that financing.
Real Estate Risk
The market values of commercial real estate assets are subject to volatility and may be adversely affected by a number of factors, including, but not limited to, national, regional and local economic conditions (which may be adversely affected by industry slowdowns and other factors); local real estate conditions; changes or continued weakness in specific industry segments; construction quality, age and design; demographic factors; and retroactive changes to building or similar codes. In
addition, decreases in property values reduce the value of the collateral and the potential proceeds available to a borrower to repay the underlying loans, which could also cause us to suffer losses.
ITEM 8. FINANCIAL STATEMENTS AND SUPPLEMENTARY DATA
INDEX TO CONSOLIDATED FINANCIAL STATEMENTS AND SCHEDULE
REPORT OF INDEPENDENT REGISTERED PUBLIC ACCOUNTING FIRM
To the ShareholdersStockholders and the Board of Directors of
KKR Real Estate Finance Trust Inc.
Opinions on the Financial Statements and Internal Control over Financial Reporting
We have audited the accompanying consolidated balance sheets of KKR Real Estate Finance Trust Inc. and subsidiaries (the "Company") as of December 31, 20212023 and 2020,2022, the related consolidated statements of income, changes in equity and cash flows, for each of the three years in the period ended December 31, 2021,2023, and the related notes and the schedule IVlisted in Index at Item 815(a) (collectively referred to as the "financial statements"). We also have also audited the Company’s internal control over financial reporting as of December 31, 2021,2023, based on criteria established in Internal Control — Integrated Framework (2013) issued by the Committee of Sponsoring Organizations of the Treadway Commission (COSO).
In our opinion, the financial statements referred to above present fairly, in all material respects, the financial position of the Company as of December 31, 20212023 and 2020,2022, and the results of its operations and its cash flows for each of the three years in the period ended December 31, 2021,2023, in conformity with accounting principles generally accepted in the United States of America. Also, in our opinion, the Company maintained, in all material respects, effective internal control over financial reporting as of December 31, 2021,2023, based on criteria established in Internal Control — Integrated Framework (2013) issued by COSO.
Change in Accounting Principle
As discussed in Note 2 to the financial statements, the Company has changed its method of accounting for impairments of financial assets measured at amortized cost, and off-balance sheet credit exposures effective January 1, 2020 due to the adoption of ASU No. 2016-13, Financial Instruments-Credit Losses, using the modified retrospective approach.
Basis for Opinions
The Company’s management is responsible for these financial statements, for maintaining effective internal control over financial reporting, and for its assessment of the effectiveness of internal control over financial reporting, included in the accompanying Management’s Annual Report on Internal Control overOver Financial Reporting. Our responsibility is to express an opinion on these financial statements and an opinion on the Company’s internal control over financial reporting based on our audits. We are a public accounting firm registered with the Public Company Accounting Oversight Board (United States) (PCAOB) and are required to be independent with respect to the Company in accordance with the U.S. federal securities laws and the applicable rules and regulations of the Securities and Exchange Commission and the PCAOB.
We conducted our audits in accordance with the standards of the PCAOB. Those standards require that we plan and perform the audits to obtain reasonable assurance about whether the financial statements are free of material misstatement, whether due to error or fraud, and whether effective internal control over financial reporting was maintained in all material respects.
Our audits of the financial statements included performing procedures to assess the risks of material misstatement of the financial statements, whether due to error or fraud, and performing procedures to respond to those risks. Such procedures included examining, on a test basis, evidence regarding the amounts and disclosures in the financial statements. Our audits also included evaluating the accounting principles used and significant estimates made by management, as well as evaluating the overall presentation of the financial statements. Our audit of internal control over financial reporting included obtaining an understanding of internal control over financial reporting, assessing the risk that a material weakness exists, and testing and evaluating the design and operating effectiveness of internal control based on the assessed risk. Our audits also included performing such other procedures as we considered necessary in the circumstances. We believe that our audits provide a reasonable basis for our opinions.
Definition and Limitations of Internal Control over Financial Reporting
A company’s internal control over financial reporting is a process designed to provide reasonable assurance regarding the reliability of financial reporting and the preparation of financial statements for external purposes in accordance with generally accepted accounting principles. A company’s internal control over financial reporting includes those policies and procedures that (1) pertain to the maintenance of records that, in reasonable detail, accurately and fairly reflect the transactions and dispositions of the assets of the company; (2) provide reasonable assurance that transactions are recorded as necessary to permit preparation of financial statements in accordance with generally accepted accounting principles, and that receipts and expenditures of the company are being made only in accordance with authorizations of management and directors of the company; and (3) provide reasonable assurance regarding prevention or timely detection of unauthorized acquisition, use, or disposition of the company’s assets that could have a material effect on the financial statements.
Because of its inherent limitations, internal control over financial reporting may not prevent or detect misstatements. Also, projections of any evaluation of effectiveness to future periods are subject to the risk that controls may become inadequate because of changes in conditions, or that the degree of compliance with the policies or procedures may deteriorate.
Critical Audit MatterMatters
The critical audit mattermatters communicated below is a matterare matters arising from the current-period audit of the financial statements that waswere communicated or required to be communicated to the audit committee and that (1) relatesrelate to accounts or disclosures that are material to the financial statements and (2) involved our especially challenging, subjective, or complex judgments. The communication of critical audit matters does not alter in any way our opinion on the financial statements, taken as a whole, and we are not, by communicating the critical audit mattermatters below, providing a separate opinionopinions on the critical audit mattermatters or on the accounts or disclosures to which they relate.
Commercial Real Estate Loans and Allowance for Credit Losses – Estimation of Economic Conditions – Refer to NoteNotes 2 and Note 3 of the Consolidated Financial Statementsfinancial statements
Critical Audit Matter Description
On January 1, 2020, the Company adopted ASU 2016-13, "Financial Instruments - Credit Losses, Measurement of Credit Losses on Financial Instruments” (“CECL”), which changes how the Company measures credit losses for its commercial real estate loans that are not measured at fair value through net income. The CECL forecasting methods used by KREF include (i) a probability of default and loss given default method using a third-party CMBS/CRE loan database with historical loan losses from 1998 to 2021 and (ii) probability weighted expected cash flow method, using the availability of relevant historical market loan loss data. The Company estimates the current expectedallowance for credit loss allowancelosses for its loan portfolio, including unfunded loan commitments, at the individual loan level. Significant inputsThe CECL forecasting methods used by KREF include a probability of default and loss given default method using a third-party Commercial Mortgage Back Securities and Commercial Real Estate loan database with historical loan losses from 1998 to 2023. In determining the CECL allowance, the Company considers various factors including (i) historical loss experience in the commercial real estate lending market, (ii) timing of expected repayments, (iii) expected future funding, (iv) capital subordinate to the Company when they are the senior lender, (v) capital senior to the Company when they are the subordinate lender, and (vi) the Company’s forecasting methodscurrent and future view of the macroeconomic environment. Management’s estimation of the current and future economic conditions that may impact the performance of the commercial real estate properties securing the Company’s assets include (i) key loan-specific inputsfactors such as loan-to-value ("LTV"), (ii) performance against the underwritten business planunemployment rate, commercial real estate prices, and market liquidity. The Company uses projections, obtained from third-party service providers, of each factor to approximate the borrower and KREF's internal loan risk rating and (iii) aimpact the macroeconomic forecast. The CECL reserve as of December 31, 2021 was $23.7 million.outlook may have on the loss rate.
We identified the assessment ofmacroeconomic factors within the CECL for commercial real estate loans, held-for-investmentallowance as a critical audit matter because of the subjectivity, complexity, and estimation uncertainty in determining the impact of the factors on the Company’s loss rate. This required a high degree of auditor judgment and an increased extent of effort when performing audit procedures to evaluate whether the macroeconomic factors determined by management reasonably and appropriately quantify the current and future macroeconomic risks associated with the Company’s loan portfolio.
How the Critical Audit Matter Was Addressed in the Audit
Our audit procedures to assess the macroeconomic factors applied by management to the CECL allowance to account for current and future economic conditions included, among others: Our audit procedures to assess the macroeconomic factors applied by management to the CECL allowance to account for current and future economic conditions included, among others:
•We tested the effectiveness of controls over management’s review of the macroeconomic factors applied to the loss rate.
•With the assistance of our credit specialist, we evaluated the reasonableness of the methodology and significant assumptions used to determine the macroeconomic factors by considering relevant industry trends and economic conditions.
•We tested the accuracy and completeness of quantitative data used by management to estimate the current and future view of macroeconomic conditions.We tested the effectiveness of controls over management’s review of the macroeconomic factors applied to the loss rate.With the assistance of our credit specialist, we evaluated the reasonableness of the methodology and significant assumptions used to determine the macroeconomic factors by considering relevant industry trends and economic conditions. We tested the accuracy and completeness of quantitative data used by management to estimate the current and future view of macroeconomic conditions.
Allowance for Credit Losses Allowance – Determination of Collateral Value – Refer to Notes 2 and 3 of the financial statements
Critical Audit Matter Description
The Company determines a loan to be collateral dependent if (i) a borrower or sponsor is experiencing financial difficulty, and (ii) the loan is expected to be substantially repaid through the sale of the underlying collateral. For collateral dependent loans, the Company estimates expected losses using the difference between the collateral’s fair value and the amortized cost basis of the loan.
We identified the determination of the CECL allowance for collateral dependent loans as a critical audit matter due to the significant judgment and assumptions. This required aassumptions relating to the determination of the fair value of the collateral. A high degree of auditor judgement and increased extent of effort was required when performing audit procedures, including the use of our specialists to evaluate management’s CECL assessment.
How the Critical Audit Matter Was Addressed in the Audit
Our audit procedures related to the assessmentdetermination of CECLthe fair value of the collateral for commercial real estatecollateral dependent loans, among others:
•We tested the effectiveness of controls over management’s determination of fair value of the collateral.
•We evaluated the Company’s determination of fair value by performing the following:
◦With the assistance of our fair value specialists, we evaluated the reasonableness of the (1) valuation methodology; (2) significant assumptions made, including whether the significant inputs used to determine the fair value were appropriate and consistent with what market participants would use to value the collateral; and (3) mathematical accuracy of the overall valuation model.
◦We tested the underlying data used to determine fair value to determine that the information used in the analysis was accurate and complete.
Real Estate Owned — Refer to Notes 2 and 4 of the financial statements
Critical Audit Matter Description
The Company accounts for the acquisition of properties by recording the purchase price of tangible and intangible assets acquired and liabilities assumed based on their relative fair values. The value of the tangible assets, consisting of land, tenant improvements, and buildings is determined as if these assets are vacant. Intangible assets may include the value of in-place leases and favorable lease intangibles, which are each recorded at their relative fair values. Intangible liabilities may include the value of unfavorable leases which are recorded at their relative fair values.
We identified the determination of the relative fair value of assets acquired and liabilities assumed as a critical audit matter. This fair value analysis required management to make estimates related to the future expected cash flows, including market information as well as discount rates and capitalization rates. We performed audit procedures to evaluate the reasonableness of these estimates which required a high degree of auditor judgment and an increased extent of effort, including the need to involve our fair value specialists.
How the Critical Audit Matter Was Addressed in the Audit
Our audit procedures related to the relative fair value of assets acquired and liabilities assumed by the Company included the following, among others:
•We involved more senior, more experienced audit team memberstested the effectiveness of controls over management’s critical assumptions including:
◦The selection of the methods and valuation techniques used to perform audit procedures.determine that fair value is appropriate and consistent with industry standards.
◦The assumptions for allocating the purchase price to tangible and intangible assets and liabilities.
•We obtained and evaluated the purchase price allocation report prepared by management’s expert along with relevant supporting documentation in order to corroborate our understanding of the substance of the acquisition and assess the completeness of the assets acquired and liabilities assumed as part of the acquisition.
•With the assistance of our fair value specialists, we evaluated the reasonableness of the valuation methodology, costs to replace certain assets, and significant assumptions used in the cash flow models, including testing the mathematical accuracy of the calculation and comparing the key inputs used in the projections to external market sources.
•We tested the design, implementation,reasonableness of management's capitalization and operating effectiveness of controls overdiscount rates by comparing the determination of the CECL reserve and allowance.assumptions used to external market sources.
•We reviewed the service auditor's report for the third-party Probability of Default-Loss Given Default-Expected Loss ("PD-LGD-EL") logistical regression web-based model, which is used to calculate the expected loss for each loan.
•Our specialists evaluated the PD-LGD-EL model and performed testing procedures over specified inputs used in determining the expected loss.
•We tested the inputs and assumptions by:
◦Independently corroborating and evaluating the accuracy and completenessreasonableness of management's projections of the key loan-specific inputsproperty's net operating income by comparing the assumptions used in the CECL model such as management's risk rating, business plan, loan-to-value ("LTV"), vintage year, loan-term, underlying property type, geographic location,projections to external market sources, executed lease agreements, historical data, and expected timing and amount of future loan fundings,
◦Analyzing the appropriatenessresults from other areas of the macroeconomic assumptions and forecasts by comparing them to other third-party forecasts, and
◦Assessing management's qualitative adjustments.audit.
/s/ DELOITTE & TOUCHE LLP
New York, NYNew York
February 8, 20226, 2024
We have served as the Company's auditor since 2016.
KKR Real Estate Finance Trust Inc. and Subsidiaries
ConsolidatedBalance Sheets
(Amounts in thousands, except share and per share data)
| | December 31, 2021 | | December 31, 2020 |
| | December 31, 2023 | | | | December 31, 2023 | | December 31, 2022 |
| Assets | Assets | | | | |
Cash and cash equivalents(A) | |
Cash and cash equivalents(A) | |
Cash and cash equivalents(A) | Cash and cash equivalents(A) | | $ | 271,487 | | | $ | 110,832 | |
| Commercial real estate loans, held-for-investment | Commercial real estate loans, held-for-investment | | 6,316,733 | | | 4,844,534 | |
| Less: Allowance for credit losses | Less: Allowance for credit losses | | (22,244) | | | (59,801) | |
| Commercial real estate loans, held-for-investment, net | Commercial real estate loans, held-for-investment, net | | 6,294,489 | | | 4,784,733 | |
| Real estate owned, net | | 78,569 | | | — | |
| Real estate owned assets, held for sale | |
| Real estate owned, held for investment, net | |
| Accrued interest receivable | |
| Equity method investments | Equity method investments | | 35,537 | | | 33,651 | |
| Accrued interest receivable | | 15,241 | | | 15,412 | |
Other assets(B) | Other assets(B) | | 7,916 | | | 20,984 | |
| Total Assets | Total Assets | | $ | 6,703,239 | | | $ | 4,965,612 | |
| | Liabilities and Equity | Liabilities and Equity | |
| Liabilities and Equity | |
| Liabilities and Equity | |
| Liabilities | Liabilities | |
| Liabilities | |
| Liabilities | |
| Secured financing agreements, net | |
| Secured financing agreements, net | |
| Secured financing agreements, net | Secured financing agreements, net | | $ | 3,726,593 | | | $ | 2,574,747 | |
| Collateralized loan obligations, net | Collateralized loan obligations, net | | 1,087,976 | | | 810,000 | |
| Secured term loan, net | Secured term loan, net | | 338,549 | | | 288,028 | |
| Convertible notes, net | Convertible notes, net | | 141,851 | | | 140,465 | |
| Loan participations sold, net | | — | | | 66,232 | |
| | Dividends payable | |
| Dividends payable | |
| Dividends payable | Dividends payable | | 26,589 | | | 24,287 | |
| Accrued interest payable | Accrued interest payable | | 6,627 | | | 5,381 | |
Accounts payable, accrued expenses and other liabilities(C) | | 7,521 | | | 4,823 | |
| Real estate owned liabilities, held for sale | |
| | Due to affiliates | Due to affiliates | | 5,952 | | | 6,243 | |
| Due to affiliates | |
| Due to affiliates | |
| Other liabilities | |
| Total Liabilities | Total Liabilities | | 5,341,658 | | | 3,920,206 | |
| | Commitments and Contingencies (Note 14) | | — | | | — | |
| Commitments and Contingencies (Note 13) | |
| Commitments and Contingencies (Note 13) | |
| Commitments and Contingencies (Note 13) | |
| | Temporary Equity | |
| Redeemable preferred stock | | — | | | 1,852 | |
| | Permanent Equity | |
| Preferred Stock, 50,000,000 shares authorized | |
| Preferred stock, $0.01 par value (0 and 1 share issued and outstanding as of December 31, 2021 and 2020, respectively) | | — | | | — | |
| Series A cumulative redeemable preferred stock, $0.01 par value (6,900,000 and zero shares issued and outstanding as of December 31, 2021 and 2020, respectively; liquidation preference of $25.00 per share) | | 69 | | | — | |
Common stock, $0.01 par value, 300,000,000 authorized (65,271,058 and 59,519,754 shares issued; 61,370,732 and 55,619,428 shares outstanding as of December 31, 2021 and 2020, respectively) | | 613 | | | 556 | |
| | Equity | |
| | Equity | |
| | Equity | |
| Preferred Stock, $0.01 par value, 50,000,000 shares authorized | |
| Preferred Stock, $0.01 par value, 50,000,000 shares authorized | |
| Preferred Stock, $0.01 par value, 50,000,000 shares authorized | |
| | Series A cumulative redeemable preferred stock, (13,110,000 shares issued and outstanding as of December 31, 2023 and 2022); liquidation preference of $25.00 per share | |
| | Series A cumulative redeemable preferred stock, (13,110,000 shares issued and outstanding as of December 31, 2023 and 2022); liquidation preference of $25.00 per share | |
| | Series A cumulative redeemable preferred stock, (13,110,000 shares issued and outstanding as of December 31, 2023 and 2022); liquidation preference of $25.00 per share | |
| Common stock, $0.01 par value, 300,000,000 authorized (75,299,556 and 75,080,707 shares issued; 69,313,860 and 69,095,011 shares outstanding; as of December 31, 2023 and 2022, respectively) | |
| Additional paid-in capital | Additional paid-in capital | | 1,459,959 | | | 1,169,695 | |
| Accumulated deficit | Accumulated deficit | | (38,208) | | | (65,698) | |
| Repurchased stock (3,900,326 shares repurchased as of December 31, 2021 and 2020) | | (60,999) | | | (60,999) | |
| Total KKR Real Estate Finance Trust Inc. stockholders’ equity | | 1,361,434 | | | 1,043,554 | |
| Repurchased stock (5,985,696 shares repurchased as of December 31, 2023 and 2022) | |
| Total KKR Real Estate Finance Trust Inc. Stockholders’ Equity | |
| Noncontrolling interests in equity of consolidated joint venture | Noncontrolling interests in equity of consolidated joint venture | | 147 | | | — | |
| Total Permanent Equity | | 1,361,581 | | | 1,043,554 | |
| Total Equity | |
| Total Liabilities and Equity | Total Liabilities and Equity | | $ | 6,703,239 | | | $ | 4,965,612 | |
(A) Includes $54.0$5.0 million and $0.0$151.0 million of cash held in collateralized loan obligation as of December 31, 20212023 and 2020,2022, respectively.
(B) Includes $0.0 million and $15.9 million of loan repayment proceeds held by servicer and receivable by KREF, and$2.3 million and $0.0 million of restricted cash as of December 31, 2021 and 2020, respectively.
(C) Includes $1.5 million and $0.9 million of expected loss reserve for unfunded loan commitments as of December 31, 2021 and 2020, respectively.
See Notes to Consolidated Financial Statements.
KKR Real Estate Finance Trust Inc. and Subsidiaries
Consolidated Statements of Income
(Amounts in thousands, except share and per share data)
| | For the Year Ended December 31, |
| 2021 | | 2020 | | 2019 |
| | For the Year Ended December 31, | | | | For the Year Ended December 31, |
| | 2023 | | | | 2023 | | 2022 | | 2021 |
| Net Interest Income | Net Interest Income | | | | | | |
| Interest income | |
| Interest income | |
| Interest income | Interest income | | $ | 279,950 | | | $ | 269,188 | | | $ | 274,335 | |
| Interest expense | Interest expense | | 114,439 | | | 127,312 | | | 158,860 | |
| Total net interest income | Total net interest income | | 165,511 | | | 141,876 | | | 115,475 | |
| Other Income | Other Income | | | | | | |
| Income (loss) from equity method investments | | 6,371 | | | 537 | | | 4,568 | |
| Revenue from real estate owned operations | |
| Revenue from real estate owned operations | |
| Revenue from real estate owned operations | |
| Income from equity method investments | |
| Other income | |
| Gain on sale of investments | |
| | Gain (loss) on sale of investments | | 5,126 | | | — | | | (2,688) | |
| Change in net assets related to CMBS consolidated variable interest entities | | — | | | — | | | 1,665 | |
| Other income | | 686 | | | 744 | | | 2,453 | |
| Total other income (loss) | | 12,183 | | | 1,281 | | | 5,998 | |
| Total other income | |
| Total other income | |
| Total other income | |
| Operating Expenses | Operating Expenses | |
| General and administrative | |
| General and administrative | |
| General and administrative | General and administrative | | 14,235 | | | 14,238 | | | 10,522 | |
| Provision for (reversal of) credit losses, net | Provision for (reversal of) credit losses, net | | (4,059) | | | 50,344 | | | — | |
| Management fees to affiliate | Management fees to affiliate | | 19,378 | | | 16,992 | | | 17,135 | |
| Incentive compensation to affiliate | Incentive compensation to affiliate | | 10,273 | | | 6,774 | | | 3,272 | |
| Expenses from real estate owned operations | |
| Total operating expenses | Total operating expenses | | 39,827 | | | 88,348 | | | 30,929 | |
| Income (Loss) Before Income Taxes, Preferred Dividends, Redemption Value Adjustment and Participating Securities' Share in Earnings | | 137,867 | | | 54,809 | | | 90,544 | |
| Income (Loss) Before Income Taxes, Noncontrolling Interests, Preferred Dividends, Redemption Value Adjustment and Participating Securities' Share in Earnings | |
| Income tax expense | Income tax expense | | 684 | | | 412 | | | 579 | |
| Net Income (Loss) | Net Income (Loss) | | 137,183 | | | 54,397 | | | 89,965 | |
| Net income (loss) attributable to noncontrolling
interests | |
| Net Income (Loss) Attributable to KKR Real Estate Finance Trust Inc. and Subsidiaries | |
| Preferred stock dividends and redemption value adjustment | Preferred stock dividends and redemption value adjustment | | 11,369 | | | 844 | | | (527) | |
| Participating securities' share in earnings | Participating securities' share in earnings | | 179 | | | — | | | — | |
| Net Income (Loss) Attributable to Common Stockholders | Net Income (Loss) Attributable to Common Stockholders | | $ | 125,635 | | | $ | 53,553 | | | $ | 90,492 | |
| | Net Income (Loss) Per Share of Common Stock | Net Income (Loss) Per Share of Common Stock | |
| Net Income (Loss) Per Share of Common Stock | |
| Net Income (Loss) Per Share of Common Stock | |
| Basic | |
| Basic | |
| Basic | Basic | | $ | 2.22 | | | $ | 0.96 | | | $ | 1.58 | |
| Diluted | Diluted | | $ | 2.21 | | | $ | 0.96 | | | $ | 1.57 | |
| | Weighted Average Number of Shares of Common Stock Outstanding | Weighted Average Number of Shares of Common Stock Outstanding | |
| Weighted Average Number of Shares of Common Stock Outstanding | |
| Weighted Average Number of Shares of Common Stock Outstanding | |
| Basic | |
| Basic | |
| Basic | Basic | | 56,571,200 | | | 55,985,014 | | | 57,426,912 | |
| Diluted | Diluted | | 56,783,388 | | | 56,057,237 | | | 57,532,490 | |
| | Dividends Declared per Share of Common Stock | Dividends Declared per Share of Common Stock | | $ | 1.72 | | | $ | 1.72 | | | $ | 1.72 | |
| Dividends Declared per Share of Common Stock | |
| Dividends Declared per Share of Common Stock | |
See Notes to Consolidated Financial Statements.
KKR Real Estate Finance Trust Inc. and Subsidiaries
Consolidated Statements of Changes in Equity
(Amounts in thousands, except share data)
| | | | | | | | | | | | | | | | | | | | | | | | | | | | | | | | | | | | | | | | | | | | | | | | | | | | | | | | | | | | | | | | | | | | | | | | | | | | | | | | |
| | Temporary Equity |
| | | |
| | Preferred Stock | | Series A Preferred Stock | | Common Stock | | | | | | | | | | | | | | |
| | Shares | | Par Value | | Shares | | Par Value | | Shares | | Par Value | | Additional
Paid-In Capital | | Retained Earnings (Accumulated Deficit) | | Repurchased Stock | | Total KKR Real Estate Finance Trust Inc. Stockholders' Equity | | Noncontrolling Interests in Equity of Consolidated Joint Venture | | Total Permanent Equity | | Redeemable Preferred Stock |
| Balance at December 31, 2020 | | 1 | | | $ | — | | | — | | | $ | — | | | 55,619,428 | | | $ | 556 | | | $ | 1,169,695 | | | $ | (65,698) | | | $ | (60,999) | | | $ | 1,043,554 | | | $ | — | | | $ | 1,043,554 | | | $ | 1,852 | |
| Issuance of common stock | | — | | | — | | | — | | | — | | | 5,547,361 | | | 55 | | | 120,655 | | | — | | | — | | | 120,710 | | | — | | | 120,710 | | | — | |
| Issuance of Series A cumulative redeemable preferred stock (liquidation preference of $25.00 per share) | | — | | | — | | | 6,900,000 | | | 69 | | | — | | | — | | | 166,997 | | | — | | | — | | | 167,066 | | | — | | | 167,066 | | | — | |
| Offering costs | | — | | | — | | | — | | | — | | | — | | | — | | | (953) | | | — | | | — | | | (953) | | | — | | | (953) | | | — | |
| Conversion of special voting preferred stock | | (1) | | | * | | — | | | — | | | 1 | | | * | | — | | | — | | | — | | | — | | | — | | | — | | | — | |
| Redemption of special non-voting preferred stock | | — | | | — | | | — | | | — | | | — | | | — | | | — | | | — | | | — | | | — | | | — | | | — | | | (5,126) | |
| Contribution by noncontrolling interests | | — | | | — | | | — | | | — | | | — | | | — | | | — | | | — | | | — | | | — | | | 147 | | | 147 | | | — | |
| Special non-voting preferred dividends declared | | — | | | — | | | — | | | — | | | — | | | — | | | — | | | — | | | — | | | — | | | — | | | — | | | (650) | |
| Series A preferred dividends declared, $1.08 per share | | — | | | — | | | — | | | — | | | — | | | — | | | — | | | (7,444) | | | — | | | (7,444) | | | — | | | (7,444) | | | — | |
| Common dividends declared, $1.72 per share | | — | | | — | | | — | | | — | | | — | | | — | | | — | | | (98,153) | | | — | | | (98,153) | | | — | | | (98,153) | | | — | |
| Participating security dividends declared, $0.43 per share | | — | | | — | | | — | | | — | | | — | | | — | | | — | | | (172) | | | — | | | (172) | | | — | | | (172) | | | — | |
| Stock-based compensation, net | | — | | | — | | | — | | | — | | | 203,942 | | | 2 | | | 3,565 | | | — | | | — | | | 3,567 | | | — | | | 3,567 | | | — | |
| Adjustment of redeemable preferred stock to redemption value | | — | | | — | | | — | | | — | | | — | | | — | | | — | | | (3,274) | | | — | | | (3,274) | | | — | | | (3,274) | | | 3,274 | |
| Net income (loss) | | — | | | — | | | — | | | — | | | — | | | — | | | — | | | 136,533 | | | — | | | 136,533 | | | — | | | 136,533 | | | 650 | |
| Balance at December 31, 2021 | | — | | | $ | — | | | 6,900,000 | | | $ | 69 | | | 61,370,732 | | | $ | 613 | | | $ | 1,459,959 | | | $ | (38,208) | | | $ | (60,999) | | | $ | 1,361,434 | | | $ | 147 | | | $ | 1,361,581 | | | $ | — | |
| Issuance of common stock | | — | | | — | | | — | | | — | | | 9,584,613 | | | 97 | | | 194,128 | | | — | | | — | | | 194,225 | | | — | | | 194,225 | | | — | |
| Issuance of Series A cumulative redeemable preferred stock (liquidation preference of $25.00 per share) | | — | | | — | | | 6,210,000 | | | 62 | | | — | | | — | | | 151,105 | | | — | | | — | | | 151,167 | | | — | | | 151,167 | | | — | |
| Offering costs | | — | | | — | | | — | | | — | | | — | | | — | | | (1,384) | | | — | | | — | | | (1,384) | | | — | | | (1,384) | | | — | |
| Contribution by noncontrolling interest | | — | | | — | | | — | | | — | | | — | | | — | | | — | | | — | | | — | | | — | | | 261 | | | 261 | | | — | |
| Repurchase of common stock | | — | | | — | | | — | | | — | | | (2,085,370) | | | (21) | | | — | | | — | | | (35,765) | | | (35,786) | | | — | | | (35,786) | | | — | |
| Series A preferred dividends declared, $1.63 per share | | — | | | — | | | — | | | — | | | — | | | — | | | — | | | (21,304) | | | — | | | (21,304) | | | — | | | (21,304) | | | — | |
| Common dividends declared, $1.72 per share | | — | | | — | | | — | | | — | | | — | | | — | | | — | | | (118,688) | | | — | | | (118,688) | | | — | | | (118,688) | | | — | |
| Participating security dividends declared, $1.72 per share | | — | | | — | | | — | | | — | | | — | | | — | | | — | | | (1,406) | | | — | | | (1,406) | | | — | | | (1,406) | | | — | |
| Stock-based compensation, net | | — | | | — | | | — | | | — | | | 225,036 | | | 2 | | | 5,175 | | | — | | | — | | | 5,177 | | | — | | | 5,177 | | | — | |
| Net income (loss) | | — | | | — | | | — | | | — | | | — | | | — | | | — | | | 38,103 | | | — | | | 38,103 | | | (510) | | | 37,593 | | | — | |
| Balance at December 31, 2022 | | — | | | $ | — | | | 13,110,000 | | | $ | 131 | | | 69,095,011 | | | $ | 691 | | | $ | 1,808,983 | | | $ | (141,503) | | | $ | (96,764) | | | $ | 1,571,538 | | | $ | (102) | | | $ | 1,571,436 | | | $ | — | |
| Contribution by noncontrolling interest | | — | | | — | | | — | | | — | | | — | | | — | | | — | | | — | | | — | | | — | | | 323 | | | 323 | | | — | |
| Series A preferred dividends declared, $1.63 per share | | — | | | — | | | — | | | — | | | — | | | — | | | — | | | (21,304) | | | — | | | (21,304) | | | — | | | (21,304) | | | — | |
| Common dividends declared, $1.72 per share | | — | | | — | | | — | | | — | | | — | | | — | | | — | | | (118,948) | | | — | | | (118,948) | | | — | | | (118,948) | | | — | |
| Participating security dividends declared, $1.72 per share | | — | | | — | | | — | | | — | | | — | | | — | | | — | | | (1,764) | | | — | | | (1,764) | | | — | | | (1,764) | | | — | |
| Stock-based compensation, net | | — | | | — | | | — | | | — | | | 218,849 | | | 2 | | | 6,094 | | | — | | | — | | | 6,096 | | | — | | | 6,096 | | | — | |
| Net income (loss) | | — | | | — | | | — | | | — | | | — | | | — | | | — | | | (30,851) | | | — | | | (30,851) | | | (806) | | | (31,657) | | | — | |
| Balance at December 31, 2023 | | — | | | $ | — | | | 13,110,000 | | | $ | 131 | | | 69,313,860 | | | $ | 693 | | | $ | 1,815,077 | | | $ | (314,370) | | | $ | (96,764) | | | $ | 1,404,767 | | | $ | (585) | | | $ | 1,404,182 | | | $ | — | |
| | | | | | | | | | | | | | | | | | | | | | | | | | | | | | | | | | | | | | | | | | | | | | | | | | | | | | | | | | | | | | | | | | | | | | | | | | | | | | | | |
| | Permanent Equity | Temporary Equity |
| | KKR Real Estate Finance Trust Inc. | | |
| | Preferred Stock | | Series A Preferred Stock | | Common Stock | | | | | | | | | | | | | | |
| | Shares | | Par Value | | Shares | | Par Value | | Shares | | Par Value | | Additional
Paid-In Capital | | Retained Earnings (Accumulated Deficit) | | Repurchased Stock | | Total KKR Real Estate Finance Trust Inc. Stockholders' Equity | | Noncontrolling Interests in Equity of Consolidated Joint Venture | | Total Permanent Equity | | Redeemable Preferred Stock |
| Balance at December 31, 2018 | | 1 | | | $ | — | | | — | | | $ | — | | | 57,596,217 | | | $ | 576 | | | $ | 1,163,845 | | | $ | (225) | | | $ | (31,854) | | | $ | 1,132,342 | | | $ | — | | | $ | 1,132,342 | | | $ | 2,846 | |
| Repurchase of common stock | | — | | | — | | | — | | | — | | | (212,809) | | | (2) | | | — | | | — | | | (4,104) | | | (4,106) | | | — | | | (4,106) | | | — | |
| Offering costs | | — | | | — | | | — | | | — | | | — | | | — | | | (518) | | | — | | | — | | | (518) | | | — | | | (518) | | | — | |
| Special non-voting preferred dividends declared | | — | | | — | | | — | | | — | | | — | | | — | | | — | | | — | | | — | | | — | | | — | | | — | | | (624) | |
| Common dividends declared, $1.72 per share | | — | | | — | | | — | | | — | | | — | | | — | | | — | | | (98,860) | | | — | | | (98,860) | | | — | | | (98,860) | | | — | |
| Stock-based compensation, net | | — | | | — | | | — | | | — | | | 103,175 | | | 1 | | | 2,668 | | | — | | | — | | | 2,669 | | | — | | | 2,669 | | | — | |
| Adjustment of redeemable preferred stock to redemption value | | — | | | — | | | — | | | — | | | — | | | — | | | — | | | 1,152 | | | — | | | 1,152 | | | — | | | 1,152 | | | (1,152) | |
| Net income (loss) | | — | | | — | | | — | | | — | | | — | | | — | | | — | | | 89,339 | | | — | | | 89,339 | | | — | | | 89,339 | | | 624 | |
| Balance at December 31, 2019 | | 1 | | | $ | — | | | — | | | $ | — | | | 57,486,583 | | | $ | 575 | | | $ | 1,165,995 | | | $ | (8,594) | | | $ | (35,958) | | | $ | 1,122,018 | | | $ | — | | | $ | 1,122,018 | | | $ | 1,694 | |
| Cumulative-effect adjustment upon adoption of ASU 2016-13 (Note 2) | | — | | | — | | | — | | | — | | | — | | | — | | | — | | | (15,009) | | | — | | | (15,009) | | | — | | | (15,009) | | | — | |
| Repurchase of common stock | | — | | | — | | | — | | | — | | | (2,037,637) | | | (20) | | | — | | | — | | | (25,041) | | | (25,061) | | | — | | | (25,061) | | | — | |
| Special non-voting preferred dividends declared | | — | | | — | | | — | | | — | | | — | | | — | | | — | | | — | | | — | | | — | | | — | | | — | | | (686) | |
| Common dividends declared, $1.72 per share | | — | | | — | | | — | | | — | | | — | | | — | | | — | | | (95,648) | | | — | | | (95,648) | | | — | | | (95,648) | | | — | |
| Stock-based compensation, net | | — | | | — | | | — | | | — | | | 170,482 | | | 1 | | | 3,700 | | | — | | | — | | | 3,701 | | | — | | | 3,701 | | | — | |
| Adjustment of redeemable preferred stock to redemption value | | — | | | — | | | — | | | — | | | — | | | — | | | — | | | (158) | | | — | | | (158) | | | — | | | (158) | | | 158 | |
| Net income (loss) | | — | | | — | | | — | | | — | | | — | | | — | | | — | | | 53,711 | | | — | | | 53,711 | | | — | | | 53,711 | | | 686 | |
| Balance at December 31, 2020 | | 1 | | | $ | — | | | — | | | $ | — | | | 55,619,428 | | | $ | 556 | | | $ | 1,169,695 | | | $ | (65,698) | | | $ | (60,999) | | | $ | 1,043,554 | | | $ | — | | | $ | 1,043,554 | | | $ | 1,852 | |
| Issuance of common stock | | — | | | — | | | — | | | — | | | 5,547,361 | | | 55 | | | 120,655 | | | — | | | — | | | 120,710 | | | — | | | 120,710 | | | — | |
| Issuance of Series A cumulative redeemable preferred stock (liquidation preference of $25.00 per share) | | — | | | — | | | 6,900,000 | | | 69 | | | — | | | — | | | 166,997 | | | — | | | — | | | 167,066 | | | — | | | 167,066 | | | — | |
| Offering costs | | — | | | — | | | — | | | — | | | — | | | — | | | (953) | | | — | | | — | | | (953) | | | — | | | (953) | | | — | |
| Conversion of special voting preferred stock | | (1) | | | * | | — | | | — | | | 1 | | | * | | — | | | — | | | — | | | — | | | — | | | — | | | — | |
| Redemption of special non-voting preferred stock | | — | | | — | | | — | | | — | | | — | | | — | | | — | | | — | | | — | | | — | | | — | | | — | | | (5,126) | |
| Contribution by noncontrolling interests | | — | | | — | | | — | | | — | | | — | | | — | | | — | | | — | | | — | | | — | | | 147 | | | 147 | | | — | |
| Special non-voting preferred dividends declared | | — | | | — | | | — | | | — | | | — | | | — | | | — | | | — | | | — | | | — | | | — | | | — | | | (650) | |
| Series A preferred dividends declared, $1.08 per share | | — | | | — | | | — | | | — | | | — | | | — | | | — | | | (7,444) | | | — | | | (7,444) | | | — | | | (7,444) | | | — | |
| Common dividends declared, $1.72 per share | | — | | | — | | | — | | | — | | | — | | | — | | | — | | | (98,153) | | | — | | | (98,153) | | | — | | | (98,153) | | | — | |
| Participating security dividends declared, $0.43 per share | | — | | | — | | | — | | | — | | | — | | | — | | | — | | | (172) | | | — | | | (172) | | | — | | | (172) | | | — | |
| Stock-based compensation, net | | — | | | — | | | — | | | — | | | 203,942 | | | 2 | | | 3,565 | | | — | | | — | | | 3,567 | | | — | | | 3,567 | | | — | |
| Adjustment of redeemable preferred stock to redemption value | | — | | | — | | | — | | | — | | | — | | | — | | | — | | | (3,274) | | | — | | | (3,274) | | | — | | | (3,274) | | | 3,274 | |
| Net income (loss) | | — | | | — | | | — | | | — | | | — | | | — | | | — | | | 136,533 | | | — | | | 136,533 | | | — | | | 136,533 | | | 650 | |
| Balance at December 31, 2021 | | — | | | $ | — | | | 6,900,000 | | | $ | 69 | | | 61,370,732 | | | $ | 613 | | | $ | 1,459,959 | | | $ | (38,208) | | | $ | (60,999) | | | $ | 1,361,434 | | | $ | 147 | | | $ | 1,361,581 | | | $ | — | |
* Rounds to zero.
See Notes to Consolidated Financial Statements.
KKR Real Estate Finance Trust Inc. and Subsidiaries
Consolidated Statements of Cash Flows
(Amounts in thousands)
| | For the Year Ended December 31, |
| 2021 | | 2020 | | 2019 |
| | For the Year Ended December 31, | | | | For the Year Ended December 31, |
| | 2023 | | | | 2023 | | 2022 | | 2021 |
| Cash Flows From Operating Activities | Cash Flows From Operating Activities | | | | | | |
| Net income (loss) | |
| Net income (loss) | |
| Net income (loss) | Net income (loss) | | $ | 137,183 | | | $ | 54,397 | | | $ | 89,965 | |
| Adjustments to reconcile net income (loss) to net cash provided by (used in) operating activities: | Adjustments to reconcile net income (loss) to net cash provided by (used in) operating activities: | |
| Amortization of deferred debt issuance costs and discounts | Amortization of deferred debt issuance costs and discounts | | 15,731 | | | 22,327 | | | 16,765 | |
| Amortization of deferred debt issuance costs and discounts | |
| Amortization of deferred debt issuance costs and discounts | |
| Accretion of net deferred loan fees and discounts | Accretion of net deferred loan fees and discounts | | (22,851) | | | (17,222) | | | (20,217) | |
| Payment-in-kind interest | Payment-in-kind interest | | (2,094) | | | (4,232) | | | — | |
| Loss (Gain) on sale of investment securities | | (5,126) | | | — | | | 2,688 | |
| Loss (Income) from equity method investments | | (3,150) | | | 2,840 | | | (1,420) | |
| Provision for credit losses, net | | (4,059) | | | 50,344 | | | — | |
| Loss (gain) on sale of investment | |
| Loss (income) from equity method investments | |
| Provision for (reversal of) credit losses, net | |
| Stock-based compensation expense | Stock-based compensation expense | | 7,427 | | | 5,676 | | | 4,091 | |
| Changes in operating assets and liabilities: | Changes in operating assets and liabilities: | |
| Accrued interest receivable, net | |
| Accrued interest receivable, net | |
| Accrued interest receivable, net | Accrued interest receivable, net | | 171 | | | 893 | | | 61 | |
| Other assets | Other assets | | (1,112) | | | (337) | | | 321 | |
| Accrued interest payable | Accrued interest payable | | 1,246 | | | (1,303) | | | (830) | |
| Accounts payable, accrued expenses and other liabilities | Accounts payable, accrued expenses and other liabilities | | 621 | | | 2,029 | | | 122 | |
| Due to affiliates | Due to affiliates | | 806 | | | (350) | | | 167 | |
| Net cash provided by (used in) operating activities | Net cash provided by (used in) operating activities | | 124,793 | | | 115,062 | | | 91,713 | |
| | Cash Flows From Investing Activities | Cash Flows From Investing Activities | |
| Proceeds from sales of commercial mortgage-backed securities | | — | | | — | | | 9,784 | |
| Cash Flows From Investing Activities | |
| Cash Flows From Investing Activities | |
| Proceeds from principal repayments and sale/syndication of commercial real estate loans, held-for-investment | |
| Proceeds from principal repayments and sale/syndication of commercial real estate loans, held-for-investment | |
| Proceeds from principal repayments and sale/syndication of commercial real estate loans, held-for-investment | Proceeds from principal repayments and sale/syndication of commercial real estate loans, held-for-investment | | 2,362,442 | | | 1,054,891 | | | 1,934,893 | |
| Origination of commercial real estate loans, held-for-investment | Origination of commercial real estate loans, held-for-investment | | (3,904,580) | | | (966,182) | | | (2,864,810) | |
| Investment in real estate owned | |
| Net cash assumed from investment in real estate owned and related joint venture | Net cash assumed from investment in real estate owned and related joint venture | | 1,302 | | | — | | | — | |
| Investment in commercial mortgage-backed securities, equity method investee | | — | | | — | | | (6,245) | |
| Purchase of available-for-sale debt securities | | — | | | — | | | (94,007) | |
| Sales of available-for-sale debt securities | | — | | | — | | | 94,071 | |
| | Net cash provided by (used in) investing activities | |
| | Net cash provided by (used in) investing activities | |
| | | Net cash provided by (used in) investing activities | Net cash provided by (used in) investing activities | | (1,540,836) | | | 88,709 | | | (926,314) | |
| | Cash Flows From Financing Activities | Cash Flows From Financing Activities | |
| Cash Flows From Financing Activities | |
| Cash Flows From Financing Activities | |
| Proceeds from borrowings under secured financing agreements | |
| Proceeds from borrowings under secured financing agreements | |
| Proceeds from borrowings under secured financing agreements | Proceeds from borrowings under secured financing agreements | | 3,641,991 | | | 1,015,430 | | | 3,217,859 | |
| Proceeds from issuance of collateralized loan obligations | Proceeds from issuance of collateralized loan obligations | | 1,095,250 | | | — | | | — | |
| Net proceeds from issuance of secured term loan | Net proceeds from issuance of secured term loan | | 52,250 | | | 292,500 | | | — | |
| Net proceeds from issuances of common stock | Net proceeds from issuances of common stock | | 120,711 | | | — | | | — | |
| Net proceeds from issuances of preferred stock | Net proceeds from issuances of preferred stock | | 167,066 | | | — | | | — | |
| Proceeds from noncontrolling interest contributions | |
| Payments of common stock dividends | Payments of common stock dividends | | (95,680) | | | (96,451) | | | (98,954) | |
| Payments of preferred stock dividends | Payments of preferred stock dividends | | (8,266) | | | (634) | | | (592) | |
| Principal repayments on borrowings under secured financing agreements | Principal repayments on borrowings under secured financing agreements | | (2,487,673) | | | (1,332,822) | | | (2,284,819) | |
| Principal repayments on collateralized loan obligations | | (810,000) | | | — | | | — | |
| Principal repayments on borrowings under convertible notes | |
| Principal repayments on borrowings under collateralized loan obligations | |
| Payments of debt and collateralized debt obligation issuance costs | Payments of debt and collateralized debt obligation issuance costs | | (24,192) | | | (12,066) | | | (12,060) | |
| Principal repayments on loan participations | Principal repayments on loan participations | | (66,248) | | | — | | | — | |
| Payments of stock issuance costs | Payments of stock issuance costs | | (647) | | | (157) | | | (1,254) | |
| Payments to reacquire common stock | Payments to reacquire common stock | | — | | | (25,061) | | | (4,106) | |
| Tax withholding on stock-based compensation | Tax withholding on stock-based compensation | | (5,581) | | | (1,297) | | | (385) | |
| | Net cash provided by (used in) financing activities | Net cash provided by (used in) financing activities | | 1,578,981 | | | (160,558) | | | 815,689 | |
| Net cash provided by (used in) financing activities | |
| Net cash provided by (used in) financing activities | |
| | Net Increase (Decrease) in Cash, Cash Equivalents and Restricted Cash | |
| Net Increase (Decrease) in Cash, Cash Equivalents and Restricted Cash | |
| Net Increase (Decrease) in Cash, Cash Equivalents and Restricted Cash | |
| Cash, Cash Equivalents and Restricted Cash at Beginning of Period | |
| Cash, Cash Equivalents and Restricted Cash at End of Period | |
|
| | Net Increase (Decrease) in Cash, Cash Equivalents and Restricted Cash | | 162,938 | | | 43,213 | | | (18,912) | |
| Cash, Cash Equivalents and Restricted Cash at Beginning of Period | | 110,832 | | | 67,619 | | | 86,531 | |
| Cash, Cash Equivalents and Restricted Cash at End of Period | | $ | 273,770 | | | $ | 110,832 | | | $ | 67,619 | |
| | | For the Year Ended December 31, | | | | For the Year Ended December 31, |
| | 2023 | | | | 2023 | | 2022 | | 2021 |
| Reconciliation of cash, cash equivalents and restricted cash | Reconciliation of cash, cash equivalents and restricted cash | |
| Cash and cash equivalents | |
| Cash and cash equivalents | |
| Cash and cash equivalents | Cash and cash equivalents | | $ | 271,487 | | | $ | 110,832 | | | $ | 67,619 | |
| Restricted cash | Restricted cash | | 2,283 | | | — | | | — | |
| Total cash, cash equivalents and restricted cash shown in the Consolidated Statements of Cash Flows | Total cash, cash equivalents and restricted cash shown in the Consolidated Statements of Cash Flows | | $ | 273,770 | | | $ | 110,832 | | | $ | 67,619 | |
| | Supplemental Disclosure of Cash Flow Information | Supplemental Disclosure of Cash Flow Information | |
| Supplemental Disclosure of Cash Flow Information | |
| Supplemental Disclosure of Cash Flow Information | |
| Cash paid during the period for interest | |
| Cash paid during the period for interest | |
| Cash paid during the period for interest | Cash paid during the period for interest | | $ | 95,256 | | | $ | 103,405 | | | $ | 146,156 | |
| Cash paid during the period for income taxes | Cash paid during the period for income taxes | | 409 | | | 124 | | | 398 | |
| | Supplemental Schedule of Non-Cash Investing and Financing Activities | Supplemental Schedule of Non-Cash Investing and Financing Activities | |
| Loan principal payments held by servicer | | $ | — | | | $ | 15,850 | | | $ | — | |
| Supplemental Schedule of Non-Cash Investing and Financing Activities | |
| Supplemental Schedule of Non-Cash Investing and Financing Activities | |
| Dividend declared, not yet paid | |
| Dividend declared, not yet paid | |
| Dividend declared, not yet paid | Dividend declared, not yet paid | | 26,561 | | | 24,287 | | | 25,036 | |
| | Net real estate owned acquired | | 77,516 | | | — | | | — | |
| Payoff of loan participations sold and commercial real estate loan, held-for-investment | | — | | | — | | | 150,880 | |
| Deconsolidation of variable interest entities (assets and liabilities) | | — | | | — | | | 1,047,346 | |
| Assumption of real estate owned | |
| Assumption of real estate owned | |
| Assumption of real estate owned | |
| | Assumption of other assets related to real estate owned | |
| Assumption of other assets related to real estate owned | |
| Assumption of other assets related to real estate owned | |
| Assumption of other liabilities related to real estate owned | |
| Transfer of senior loans to real estate owned | |
| Loan principal payments held by servicer | | Loan principal payments held by servicer | | — | | | — | | | |
| Modifications accounted for as repayments and new loans, net of write-offs | |
|
See Notes to Consolidated Financial Statements.
KKR Real Estate Finance Trust Inc.
Notes to Consolidated Financial Statements
(dollarsamount in tables in thousands, except per share amounts)
Note 1. Business and Organization
KKR Real Estate Finance Trust Inc. (together with its consolidated subsidiaries, referred to throughout this report as the "Company" or "KREF") is a Maryland corporation that was formed and commenced operations on October 2, 2014 as a mortgage real estate investment trust ("REIT") that focuses primarily on originating and acquiring transitional senior loans secured by commercial real estate ("CRE") assets.
KREF has elected and intends to maintain its qualification to be taxed as a REIT under the requirements of the Internal Revenue Code of 1986, as amended (the "Internal Revenue Code"), for U.S. federal income tax purposes. As such, KREF will generally not be subject to U.S. federal income tax on that portion of its income that it distributes to stockholders if it distributes at least 90% of its REIT taxable income, determined without regard to the deduction for dividends paid and excluding any net capital gains. See Note 1716 regarding taxes applicable to KREF.
KREF is externally managed by KKR Real Estate Finance Manager LLC ("Manager"), an indirect subsidiary of KKR & Co. Inc. (together with its subsidiaries, "KKR"), through a management agreement ("Management Agreement") pursuant to which the Manager provides a management team and other professionals who are responsible for implementing KREF’s business strategy, subject to the supervision of KREF’s board of directors. For its services, the Manager is entitled to management fees and incentive compensation, both defined in, and in accordance with the terms of, the Management Agreement (Note 15)14).
As of December 31, 2021,2023, KKR beneficially owned 14,250,00110,000,001 shares, or 23.2%14.4% of KREF's outstanding common stock.stock.
KREF's principal business activities are related to the origination and purchase of credit investments related to CRE. Management assesses the performance of KREF's current portfolio of leveraged and unleveraged commercial real estate loans and commercial mortgage-backed securities ("CMBS") as a whole and makes operating decisions accordingly. As a result, management presents KREF's operations within a single reporting segment.
KKR Real Estate Finance Trust Inc.
Notes to Consolidated Financial Statements
(dollarsamount in tables in thousands, except per share amounts)
Note 2. Summary of Significant Accounting Policies
Basis of Presentation — The accompanying consolidated financial statements and related notes of KREF are prepared in accordance with accounting principles generally accepted in the United States of America ("GAAP"). The consolidated financial statements include the accounts of KREF and its consolidated subsidiaries, and all intercompany transactions and balances have been eliminated. In the opinion of management, all adjustments considered necessary for a fair presentation of KREF’s financial position, results of operations and cash flows have been included and are of a normal and recurring nature.
Risks and Uncertainties — The coronavirus pandemic ("COVID-19") has adversely impacted global commercial activity and has contributed to significant volatility in financial markets. DuringSince its onset in 2020, the COVID-19 pandemic has created disruption in global supply chains, increased rates of unemployment and adversely impacted many industries, including industries related to the collateral underlying certain of our loans. The impact ofIn response to the outbreak has been rapidly evolving around the globe, withpandemic, several countries takingtook drastic measures to limit the spread of the virus by instituting quarantines or lockdowns, imposing travel restrictions and limiting operations of non-essential offices and retail centers.
In 2021,While the global economy has withre-opened, the longer-term macro-economic effects of the pandemic continue to impact many industries, including those of certain setbacks, begun reopening,of KREF’s borrowers. In particular, the increase in remote working arrangements in response to the pandemic has contributed to a decline in commercial real estate values and wider distributionreduced demand for commercial real estate compared to pre-pandemic levels, which have adversely impacted and may continue to adversely impact certain of vaccines will likely encourage greater economic activity. However, wide disparities in vaccination ratesKREF's borrowers and continued vaccine hesitancy, combined withhas persisted even as the emergence of COVID-19 variants and surges in COVID-19 cases, could trigger the reinstatement of restrictions, including mandatory business shut-downs, travel restrictions, reduced business operations and social distancing requirements, which could dampen or delay any economic recovery and could materially and adversely affect KREF’s results and financial condition.pandemic continues to subside. In addition, the COVID-19 pandemic continueshas contributed to disrupt global supply chains, has causedchain disruptions, labor shortages and has added broad inflationary pressures, each of which has a potential negative impact on KREF's borrowers’ ability to execute on their business plans and potentially their ability to perform under the terms of their loan obligations. Although KREFThe Federal Reserve has observed signs of economic recovery and is generally encouragedraised interest rates eleven times since January 2022. Higher interest rates imposed by the responseFederal Reserve to address inflation may adversely impact real estate asset values and increase our interest expense, which expense may not be fully offset by any resulting increase in interest income, and may lead to decreased prepayments from KREF's borrowers and an increase in the number of itsKREF's borrowers KREF cannot predictwho exercise extension options. The Federal Reserve has indicated that it may decrease in interest rates in 2024. In a period of declining interest rates, our interest income on floating-rate investments would generally decrease, while any decrease in the time requiredinterest we are charged on our floating-rate debt may be subject to floors and may not compensate for a widespread sustainable economic recovery to take hold.such decrease in interest income.
Use of Estimates — The preparation of consolidated financial statements in conformity with GAAP requires management to make estimates and assumptions that affect the reported amounts of assets and liabilities, the disclosure of contingent assets and liabilities at the date of the consolidated financial statements and the reported amounts of revenue and expenses during the reporting period. Management makes subjective estimates to project cash flows KREF expects to receive on its investments in loans and securities as well as the related market discount rates, which significantly impactsimpact the interest income, impairments, allowance for loan loss and fair values recorded or disclosed. The effects of COVID-19 may negatively and materially impact significant estimates and assumptions used by the Company including, but not limited to estimates of expected credit losses, valuation of our equity method investments and the fair value estimates of the Company’s assets and liabilities. Actual results could materially differ from those estimates.
Consolidation — KREF consolidates those entities for whichthat (i) it controls through either majority ownership or voting rights or (ii) management determines that KREF is the primary beneficiary of entities deemed to be variable interest entities ("VIEs").
Variable Interest Entities — VIEs are entities (i) in which equity investors do not have an interest with the characteristics of a controlling financial interest, (ii) that do not have sufficient equity at risk for the entity to finance its activities without additional subordinated financial support from other parties or (iii) established with non-substantive voting rights. A VIE is required to be consolidated only by its primary beneficiary, which is defined as the party that has the power to direct the activities of the VIE that most significantly impact the VIE’s economic performance and that has the obligation to absorb losses of, or the right to receive benefits from, the VIE that could be potentially significant to the VIE (Note 10)9).
To assess whether KREF has the power to direct the activities of a VIE that most significantly impact the VIE’s economic performance, KREF considers all the facts and circumstances, including its role in establishing the VIE and its ongoing rights and responsibilities. This assessment includes, first, identifying the activities that most significantly impact the VIE’s economic performance; and second, identifying which party, if any, has power to direct those activities. To assess whether KREF has the obligation to absorb losses of, or the right to receive benefits from, the VIE that could potentially be significant to the VIE, KREF considers all of its economic interests and applies judgment in determining whether these interests, in the aggregate, are considered potentially significant to the VIE.
KKR Real Estate Finance Trust Inc.
Notes to Consolidated Financial Statements
(dollarsamount in tables in thousands, except per share amounts)
Collateralized Loan Obligations — KREF consolidates collateralized loan obligations (“CLO”CLOs”) when it determines that the CLO issuers wholly-owned subsidiaries of KREF, are VIEs and that KREF is the primary beneficiary of such VIEs.
The collateral assets of KREF's CLO,CLOs, comprised of a pool of loan participations, are included in “Commercial real estate loans, held-for-investment, net” on the Consolidated Balance Sheets. The liabilities of KREF's consolidated CLOCLOs consist solely of obligations to the senior CLO noteholders, excluding subordinated CLO tranches held by KREF as such interests are eliminated in consolidation, and are presented in “Collateralized loan obligations, net” on the Consolidated Balance Sheets. The collateral assets of a CLOthe CLOs can only be used to settle the obligations of the consolidated CLO.CLOs. The interest income from the CLO’sCLOs’ collateral assets and the interest expense on the CLO’sCLOs’ liabilities are presented on a gross basis in “Interest income” and “Interest expense”, respectively, in KREF's Consolidated Statements of Income.
Real Estate Owned Joint Venture — KREF consolidatedconsolidates a joint venture that heldholds the majority of KREF’s sole investment in a real estate owned (“REO”) retail property that was acquired in the fourth quarter of 2021, in which a third party ownedowns a 10% noncontrolling interest (Note 11)9). Management determined the joint venture to be a VIE as the joint venture had insufficient equity-at-risk.equity at risk. KREF owns 90% of the equity interest in the joint venture and participates in the profits and losses. Management concluded that KREF to beis the primary beneficiary of the joint venture as KREF heldholds decision-making power over the activities that most significantly impact the economic performance of the joint venture and has the obligation to absorb losses of, or the right to receive benefits from, the joint venture that could be potentially significant to the joint venture.
Noncontrolling Interests — Noncontrolling interests represent the ownership interests in certain consolidated subsidiaries held by entities or persons other than KREF. These noncontrolling interests do not include redemption features and are presented as "Noncontrolling interests in equity of consolidated joint venture" on the Consolidated Balance Sheet.
Temporary Equity— KREF's Special Non-Voting Preferred Stock (“SNVPS”) became redeemable by the SNVPS holder in the second quarter of 2018. As a result, starting with the second quarter of 2018, KREF adjusts the carrying value of the SNVPS to its redemption value quarterly. The SNVPS Redemption Value Adjustment is treated similar to a dividend on preferred stock for GAAP purposes and therefore is deducted from (or added back to) “Net Income (Loss)” to arrive at “Net Income (Loss) Attributable to Common Stockholders” on KREF's Consolidated Statements of Income.
KREF recorded a $3.3 million non-cash redemption value adjustment to the SNVPS (“SNVPS Redemption Value Adjustment”) during the year ended December 31, 2021, which increased the carrying value of the SNVPS to its redemption value of $5.1 million prior to redemption of the SNVPS by KREF on October 1, 2021 for a cash redemption value of $5.1 million (Note 10).Sheets.
Equity method investmentsMethod Investments — Investments are accounted for under the equity method when KREF has significant influence over the operations of an investee but does not consolidate that investment. Equity method investments, for which management has not elected a fair value option, are initially recorded at cost and subsequently adjusted for KREF's share of net income or loss and cash contributions and distributions each period.
Management determined that KREF's investment in the Manager is an interest in a VIE, however KREF is not the primary beneficiary. KREF does not have substantive participating or kick-out rights nor the power to direct activities and the obligation to absorb losses of the Manager that could be significant to the Manager. KREF accounts for its investment in the Manager using the equity method. On October 1, 2021, KREF TRS redeemed its interest in the Manager for a cash call amount of $5.1 million when the KKR Member exercised its Call Option to redeem the Non-Voting Manager Units, including the Non-Voting Manager Units held by KREF TRS (Note 10).
Management determined that KREF's investment in an aggregator vehicle alongside KKR Real Estate Credit Opportunity Partners L.P. ("RECOP I ") is an interest in a VIE, however KREF is not the primary beneficiary and does not have substantive participating or kick-out rights. KREF records its share of net asset value in RECOP I in “Equity method investments” on its Consolidated Balance Sheets and its share of unrealized gains or losses in “Income (loss) from equity method investments” in its Consolidated Statements of Income. Management elected the fair value option for KREF's investment in RECOP I.
KREF classifies distributions received from equity method investees using the cumulative earnings approach. Distributions received up to the cumulative earnings from each equity method investee are considered returns on investment and presented within “Cash Flows from Operating Activities” in the Consolidated Statements of Cash Flows; excess distributions received are considered returns of investment and presented within “Cash Flows fromFrom Investing Activities” in the Consolidated Statements of Cash Flows.
KKR Real Estate Finance Trust Inc.
Notes to Consolidated Financial Statements
(dollars in tables in thousands, except per share amounts)
Fair Value — GAAP requires the categorization of the fair value of financial instruments into three broad levels that form a hierarchy based on the transparency of inputs to the valuation.
Level 1 -— Inputs are unadjusted, quoted prices in active markets for identical assets or liabilities at the measurement date.
Level 2 -— Inputs are other than quoted prices that are observable for the asset or liability, either directly or indirectly. Level 2 inputs include quoted prices for similar instruments in active markets, and inputs other than quoted prices that are observable for the asset or liability.
Level 3 -— Inputs are unobservable for the asset or liability, and include situations where there is little, if any, market activity for the asset or liability.
KREF follows this hierarchy for its financial instruments. The classifications are based on the lowest level of input that is significant to the fair value measurement.
KKR Real Estate Finance Trust Inc.
Notes to Consolidated Financial Statements
(amount in tables in thousands, except per share amounts)
Valuation Process — The Manager reviews the valuation of Level 3 financial instruments as part of KKR's quarterly process. As of December 31, 2021,2023, KKR’s valuation process for Level 3 measurements, as described below, subjected valuations to the review and oversight of various committees. KKR has a global valuation committee assisted by the asset class-specific valuation committees, including a real estate valuation committee that reviews and approves all preliminary Level 3 valuations for real estate assets, including the financial instruments held by KREF. The global valuation committee is responsible for coordinating and implementing KKR’s valuation process to ensure consistency in the application of valuation principles across portfolio investments and between periods. All Level 3 valuations are also subject to approval by the global valuation committee.
Valuation of Commercial Real Estate Loans and Participation Sold— Management generally considers KREF's commercial real estate loans to be Level 3 assets in the fair value hierarchy as such assets are illiquid, structured investments that are specific to the sponsor, underlying property and its operating performance (Note 16)15). OnFor financial statement disclosure purposes, on a quarterly basis, management generally engages an independent valuation firm to estimate the fair value of each loan categorized as a Level 3 asset. These loans are generally valued using a discounted cash flow model based on assumptions regarding the collection of principal and interest and estimated market rates. Management reviews the quarterly loan valuation estimates provided by the independent valuation firm. TheseFor collateral dependent loans, are generally valued using a discounted cash flow model using discount rates derived from observable market data applied to the capital structure of the respective sponsor and/or estimated property value. In the event that management's estimate of fair value differs fromKREF may apply alternative valuation methods based on the fair value estimate provided by the independent valuation firm, KREF ultimately relies solely upon the valuation prepared by the investment personnel of the Manager.underlying collateral. Determination of collateral value involves significant judgment, including assumptions regarding capitalization rates, discount rates, leasing, occupancy rates, and other factors.
Valuation of CLO Consolidated VIEs — Management estimates the fair value of the CLO liabilities using prices obtained from an independent valuation firm. If prices received from the independent valuation firm are inconsistent with values determined in connection with management’s independent review, management makes inquiries to the independent valuation firm about the prices received and related methods. In the event management determines the price obtained from an independent valuation firm to be unreliable or an inaccurate representation of the fair value of the CLO liabilities (based on considerations given to observable market data), management then compiles evidence independently and presents the independent valuation firm with such evidence supporting a different value. As a result, the independent valuation firm may revise their price after evaluating any additional evidence.
However, if management continues to disagree with the price from the independent valuation firm, in light of evidence that management compiled independently and believes to be compelling, valuations are then prepared using inputs based on non-binding broker quotes obtained from independent, well-known, major financial brokers that are CLO market makers. In validating any non-binding broker quote used in this circumstance, management compares the non-binding quote to the observable market data points in addition to understanding the valuation methodologies used by the market makers. These market participants may utilize a similar methodology as the independent valuation firm to value the CLO liabilities, with the key input of expected yield determined independently based on both observable and unobservable factors. To avoid reliance on any single broker-dealer, management receives a minimum of two non-binding quotes, of which the average is used.
Other Valuation Matters — For Level 3 financial assets originated, or otherwise acquired, and financial liabilities assumed during the current calendar quarter that were conducted in an orderly transaction with an unrelated party, management generally believes that the transaction price provides the most observable indication of fair value given the illiquid nature of these
KKR Real Estate Finance Trust Inc.
Notes to Consolidated Financial Statements
(dollars in tables in thousands, except per share amounts)
financial instruments, unless management is aware of any circumstances that may cause a material change in the fair value through the remainder of the quarterly reporting period. For instance, significant changes to the underlying property or its planned operations may cause material changes in the fair value of commercial real estate loans acquired, or originated, by KREF.
KREF’s determination of fair value is based upon the best information available for a given circumstance and may incorporate assumptions that are management’s best estimates after consideration of a variety of internal and external factors. When an independent valuation firm expresses an opinion on the fair value of a financial instrument in the form of a range, management selects a value within the range provided by the independent valuation firm, generally the midpoint, to assess the reasonableness of management’s estimated fair value for that financial instrument.
See Note 1615 for additional information regarding the valuation of KREF's financial assets and liabilities.
Sales of Financial Assets and Financing Agreements — KREF will, from time to time, transfer loans, securities and other assets as well as finance assets in the form of secured borrowings. In each case, management evaluates whether the transaction constitutes a sale through legal isolation of the transferred financial asset from KREF, the ability of the transferee to pledge or exchange the transferred asset without constraint and the transfer of control of the transferred asset. For transfers that constitute
KKR Real Estate Finance Trust Inc.
Notes to Consolidated Financial Statements
(amount in tables in thousands, except per share amounts)
sales, KREF (i) recognizes the financial assets it retains and liabilities it has incurred, if any, (ii) derecognizes the financial assets it has sold, and derecognizes liabilities when extinguished and (iii) recognizes a realized gain, or loss, based upon the excess, or deficient, proceeds received over the carrying value of the transferred asset. KREF does not recognize a gain, or loss, on interests retained, if any, where management elected the fair value option prior to sale.
Balance Sheet Measurement
Cash and Cash Equivalents and Restricted Cash — KREF considers cash equivalents as highly liquid short-term investments with maturities of 90 days or less when purchased. KREF maintains its cash deposits with major financial institutions. Substantially all such amounts on deposit with major financial institutions exceed insured limits.
KREF must maintain sufficient cash and cash equivalents to satisfy liquidity covenants related to its secured financing agreements. However, such amounts are not restricted from use in KREF's current operations, and KREF does not present these cash and cash equivalents as restricted. As of December 31, 20212023 and 2020,2022, KREF was required to maintain unrestricted cash and cash equivalents of at least $65.6$60.2 million and $42.6$54.4 million, respectively, to satisfy its liquidity covenants (Note 5).
As of December 31, 2021,2023 and 2022, KREF had $2.3$12.4 million and $10.8 million of restricted cash held in lender-controlled bank accounts.accounts, respectively. Such amount isamounts are presented within "Other Assets" in the Consolidated Balance Sheet.Sheets.
Commercial Real Estate Loans Held-For-Investment and Allowance for Credit Losses — KREF recognizes its investments in commercial real estate loans based on management's intent, and KREF's ability, to hold those investments through their contractual maturity. Management classifies those loans that management does not intend to sell in the foreseeable future, and KREF is able to hold until maturity, as held-for-investment. Loans that are held-for-investment are carried at their aggregate outstanding principal, net of applicable (i) unamortized origination or acquisition premiums and discounts, (ii) unamortized deferred nonrefundable fees and other direct loan origination costs, and (iii) allowance for credit losses, net of write-offs of impaired loans. If a loan is determined to be impaired, management writes off the loan through a charge to the "Allowance for credit losses" and to the respective loan balance. KREF applies the interest method to amortize origination or acquisition premiums and discounts and deferred nonrefundable fees or other direct loan origination costs, or on a straight-line basis when it approximates the interest method. Loans for which management elects the fair value option at the time of origination, or acquisition, are carried at fair value on a recurring basis (Note 3).
On January 1, 2020, KREF adopted ASU No. 2016-13, Financial Instruments-Credit Losses,recognizes and subsequent amendments (“ASU 2016-13”), which replacedmeasures the incurred loss methodology with an expected loss model known asallowance for credit losses under the Current Expected Credit Loss ("CECL") model. CECLmodel which amended the previous credit loss model to reflect a reporting entity's current estimate of all expected credit losses, not only based on historical experience and current conditions, but also by including reasonable and supportable forecasts incorporating forward-looking information. The measurement of expected credit losses under CECL is applicable to financial assets measured at amortized cost, and off-balance sheet credit exposures such as unfunded loan commitments. The allowance for credit losses required under ASU 2016-13 is deducted from the respective loans’ amortized cost basis on KREF's Consolidated Balance Sheets. The allowance for credit losses attributed to unfunded loan commitments is
KKR Real Estate Finance Trust Inc.
Notes to Consolidated Financial Statements
(dollars in tables in thousands, except per share amounts)
included in “Accounts payable, accrued expenses and other“Other liabilities” on the Consolidated Balance Sheets. The guidance also required a cumulative-effect adjustment to retained earnings as of the beginning of the reporting period of adoption.
In connection with KREF’s adoption of ASU 2016-13, KREF implemented new processes including the utilization of loan loss forecasting models, updates to KREF's reserve policy documentation, changes to internal reporting processes and related internal controls. KREF has implemented loan loss forecasting models for estimating expected life-time credit losses, at the individual loan level, for its commercial real estate loan portfolio. The CECL forecasting methods used by KREF include (i) a probability of default and loss given default method using an underlying third-party CMBS/CRE loan database with historical loan losses from 1998 to 2021through 2023 and (ii) a probability weighted expected cash flow method, depending on the type of loan and the availability of relevant historical market loan loss data. KREF might use other acceptable alternative approaches in the future depending on, among other factors, the type of loan, underlying collateral and availability of relevant historical market loan loss data.
KREF estimates the CECL allowance for its loan portfolio, including unfunded loan commitments, at the individual loan level. Significant inputs to KREF’s forecasting methods include (i) key loan-specific inputs such as loan-to-value ("LTV"), vintage year, loan-term,loan term, underlying property type, geographic location, most recent appraisal, and expected timing and amount of future loan fundings, (ii) performance against the underwritten business plan and KREF's internal loan risk rating and (iii) a macro-economic forecast. These estimates may change in future periods based on available future macro-economic data and might result in a material change in the KREF’s future estimates of expected credit losses for its loan portfolio. KREF considers the individual loan internal risk rating as the primarykey credit quality indicator underlyingin assessing the CECL assessment. In certain instances,allowance. KREF considersmay also consider relevant loan-specific qualitative factors tofor certain loans to estimate its CECL allowance.loans.
KKR Real Estate Finance Trust Inc.
Notes to be substantially repaid through the operation or sale of the underlyingConsolidated Financial Statements
(amount in tables in thousands, except per share amounts)
For collateral and (ii)dependent loans for which the borrower is experiencing financial difficulty, to be “collateral-dependent” loans. For such loans that KREF determines that foreclosure of the collateral is probable, KREF measures the expected losses based on the difference between the fair value of the collateral and the amortized cost basis of the loan as of the measurement date. For collateral-dependentcollateral dependent loans thatfor which KREF determines foreclosure is not probable, KREF applies a practical expedient to estimate expected losses using the difference between the collateral’s fair value (less costs to sell the asset if repayment is expected through the sale of the collateral) and thethe amortized cost basis of the loan. A loan is determined to be collateral dependent if (i) a borrower or sponsor is experiencing financial difficulty, and (ii) the loan is expected to be substantially repaid through the sale of the underlying collateral. Such determination requires the use of significant judgment and can be based on several factors subject to uncertainty. Considerations used in determination of financial difficulty may include, but are not limited to, whether the borrower's operating cash flow is sufficient to cover the current and future debt service requirements, the borrower’s ability to refinance the loan, market liquidity and other circumstances that can affect the borrower’s ability to satisfy its contractual obligations under the loan agreement.
See "Expense Recognition — Commercial Real Estate Loans, Held-For-Investment" for additional discussion regarding management’s determination for loan losses.
Commercial Real Estate Loans Held-For-Sale — Loans that KREF originates or acquires, which KREF is unable to hold, or management intends to sell or otherwise dispose of, in the foreseeable future are classified as held-for-sale and are carried at the lower of amortized cost or fair value.
Real Estate Owned — To maximize recovery from a defaulted loan, KREF may assume legal title or physical possession of the underlying collateral through foreclosure or the execution of a deed in lieu of foreclosure. Foreclosed properties are generallyinitially recognized at fair value in accordance with ASC 805 on KREF's consolidated balance sheetsConsolidated Balance Sheets as Real"Real Estate Owned (“REO”)Owned" when KREF assumeassumes either legal title or physical possession. KREF’s cost basis in REO equals the estimated fair value on the acquisition date plus related acquisition costs. Any difference between the estimated fairdate. The value of acquired REO is allocated based on the REO from the net carrying valuerelative fair values of the related loan is recorded in “Provision for credit losses, net” in the Consolidated Statements of Income.assets acquired and liabilities assumed, including, but not limited to, land, building, furniture and fixtures, and intangibles.
REO assets held for investment, except for land, are depreciated using the straight-line method over estimated useful lives. Renovations and/or replacements that improve or extend the life of the REO asset are capitalized and depreciated over their estimated useful lives. The cost of ordinary repairs and maintenance are expensed as incurred.
REO assets held for investment are evaluated for impairment on a quarterly basis. KREF considers the following factors when performing the impairment analysis: (i) significant underperformance relative to anticipated operating results; (ii) significant negative industry and economic outlook or trends; (iii) expected material costs necessary to extend the life or operate the REO asset; and (iv) KREF’s ability to hold and dispose of the REO asset in the ordinary course of business. A REO asset is considered for impairment when the sum of estimated future undiscounted cash flows to be generated by the REO asset over the estimated remaining holding period is less than the carrying value of such REO asset. An impairment charge is recorded when the carrying value of the REO exceeds itsthe fair value. When determining the fair value of a REO asset, KREF makes certain assumptions including, but not limited to, projected operating cash flows, comparable selling prices and projected cash flows from the eventual disposition of the REO asset.
REO assets are classified as held for sale in the period when they meet the criteria under ASC 360. Once a REO is classified as held for sale, depreciation is suspended and the asset is reported at the lower of its carrying value or fair value less cost to sell. The actual sales price of the REO could differ from the estimated fair value. If circumstances arise that were previously considered unlikely and, as a result, KREF decides not to sell the real estate asset previously classified as held for sale, the real estate asset is reclassified as held for investment. Upon reclassification, the real estate asset is measured at the lower of (i) its carrying amount prior to classification as held for sale, adjusted for depreciation expense that would have been recognized had the real estate been classified as held for investment, and (ii) its estimated fair value at the time of reclassification.
For all REO assets, KREF may opportunistically transact as suitable opportunities emerge.
Secured Financing Agreements — KREF's secured financing agreements, including uncommitted repurchase facilities, term lending agreements, warehouse facility, asset specific financings and term loan financings,facility, are treated as floating-rate collateralized financing arrangements carried at their contractual amounts, net of unamortized debt issuance costs (Note 5). Included within KREF's secured financing agreements is KREF's corporate revolving credit facilityagreement ("Revolver"), which is full recourse to certain guarantor wholly-owned subsidiaries of KREF.
KKR Real Estate Finance Trust Inc.
Notes to Consolidated Financial Statements
(amount in tables in thousands, except per share amounts)
Secured Term Loan, Net — KREF records its secured term loan at its contractual amount, net of unamortized original issuance discount and deferred financing costs (Note 7) on its Consolidated Balance Sheets. Any original issuance discount or deferred financing costs are amortized through the maturity date of the secured term loan as additional non-cash interest expense.
KKR Real Estate Finance Trust Inc.
Notes to Consolidated Financial Statements
(dollars in tables in thousands, except per share amounts)
Convertible Notes, Net — KREF accountsaccounted for its convertible debt with a cash conversion feature in accordance with ASC 470-20, Debt with Conversion and Other Options, which requires the liability and equity components of convertible debt instruments that may be settled in cash upon conversion, including partial cash settlement, to be separately accounted for in a manner that reflects the issuer’s nonconvertible debt borrowing rate. The initial proceeds from the sale of convertible notes arewere allocated between a liability component and an equity component in a manner that reflects interest expense at the rate of similar nonconvertible debt that could have been issued at such time. The equity component represents the excess initial proceeds received over the fair value of the liability component of the notes as of the date of issuance. KREF measured the estimated fair value of the debt component of the 6.125% convertible senior notes due May 15, 2023 (“Convertible Notes”) as of the issuance date based on KREF’s nonconvertible debt borrowing rate. The equity component of the Convertible Notes iswas reflected within "Additional Paid-in Capital"paid-in capital" on the Consolidated Balance Sheets, and the resulting debt discount iswas amortized over the period during which such Convertible Notes arewere expected to be outstanding (through the maturity date) as additional non-cash interest expense using the interest method, or on a straight line basis when it approximates the interest method. The additional non-cash interest expense attributable to such convertible notes will increaseincreased in subsequent periods through the maturity date as the notes accrete to their par value over the same period (Note 8).
Loan Participations Sold, Net— In connection with its investments in CRE loans, KREF finances certain investments through the syndication of non-recourse, or limited-recourse, loan participation to unaffiliated third parties. KREF’s presentation The entire $143.75 million principal balance of the senior loanConvertible Notes matured and related financing involvedwas repaid in the syndication depends upon whether the transaction is recognized as a sale under GAAP, though such differences in presentation do not generally impact KREF’s net stockholders’ equity or net income aside from timing differences in the recognitioncash on May 15, 2023. As of certain transaction costs.December 31, 2023, there were no convertible notes outstanding.
To the extent that a sale is recognized under GAAP from the syndication, KREF derecognizes the participation in the senior/whole loan that KREF sold and continues to carry the retained portion of the loan as an investment. While KREF does not generally expect to recognize a material gain or loss on these sales, KREF would realize a gain or loss in an amount equal to the difference between the net proceeds received from the third party purchaser and its carrying value of the loan participation that KREF sold at time of sale. Furthermore, KREF recognizes interest income only on the portion of the loan that it retains as a result of the sale.
To the extent that a sale is not recognized under GAAP from the syndication, KREF does not derecognize the participation in the senior/whole loan that it sold. Instead, KREF recognizes a loan participation sold liability in an amount equal to the principal of the loan participation syndicated less any unamortized discounts or financing costs resulting from the syndication. KREF continues to recognize interest income on the entire senior loan, including the interest attributable to the loan participation sold, as well as interest expense on the loan participation sold liability (Note 9).
Other Assets and Accounts Payable, Accrued Expenses and Other Liabilities — As of December 31, 2021,2023, other assets included $2.3$12.4 million of restricted cash $1.7and $3.7 million of deferred financing costs related to KREF's Revolver (Note 5), $1.4 million of interest collections held by the servicer and $1.4 million of prepaid expenses.. As of December 31, 2020,2022, other assets included $15.9$10.8 million of restricted cash, loan repayment proceeds held by the servicer and receivable by KREF, $2.54.9 million of deferred financing costs related to KREF's Revolver and $0.5$1.1 million of prepaid expenses.
As of December 31, 2021, accounts payable, accrued expenses and2023, other liabilities included $3.9 million of accrued expenses, $3.3$2.1 million of assumed REO liabilities, $1.5 million of allowance for credit losses related to KREF's unfunded loan commitments and commitmen$0.6ts, $5.4 million of prepaid stub interests.REO, held for investment, liabilities (Note 4) and $1.8 million of accrued expenses. As of December 31, 2020, accounts payable, accrued expenses and2022, other liabilities included $3.1 million of accrued expenses, $0.9$4.1 million of allowance for credit losses related to KREF's unfunded loan commitments, $3.7 million of REO, held for investment, liabilities and $0.8$2.1 million of accrued expenses of good faith deposits..
Dividends Payable — KREF records dividends payable on its common stock and preferred stock upon declaration of such dividends. In December 2021,2023, KREF's board of directors declared a dividend of $0.43$0.43 per share of common stock to shareholdersstockholders of record as of December 31, 2021,29, 2023, which was accrued in “Dividends payable” on KREF’s Consolidated Balance SheetSheets as of December 31, 20212023 and was subsequently paid on January 14, 2022. 12, 2024. In October 2021,2023, KREF's board of directors declared a dividend of $0.35$0.41 per each issued and outstanding share of the Company’s 6.50% Series A Cumulative Redeemable Preferred Stock, which represents an annual dividend of $1.625 per share. The dividend was paid on December 15, 20212023 to KREF’s preferred stockholders of record as of November 30, 2021.
Special Non-Voting Preferred Stock — Equity instruments that are redeemable for cash or other assets are classified as temporary equity if the instrument is redeemable, at the option of the holder, at a fixed or determinable price on a fixed or
KKR Real Estate Finance Trust Inc.
Notes to Consolidated Financial Statements
(dollars in tables in thousands, except per share amounts)
determinable date or upon the occurrence of an event that is not solely within the control of the issuer. Redeemable equity instruments are initially carried at the fair value of the equity instrument at the issuance date, which is subsequently adjusted at each balance sheet date if the instrument is currently redeemable or probable of becoming redeemable. KREF accounted for the SNVPS as redeemable preferred stock since a third party holds a redemption option, exercisable after May 5, 2018, and such redemption is not solely within KREF's control. As a result, starting with the second quarter of 2018, KREF adjusts the carrying value of the SNVPS to its redemption value quarterly.
KREF recorded a $3.3 million SNVPS Redemption Value Adjustment during the year ended December 31, 2021, which increased the carrying value of the SNVPS to its redemption value of $5.1 million prior to SNVPS redemption by KREF on October 1, 2021 for a cash redemption value of $5.1 million (Note 11).2023.
Repurchased Stock — KREF accounts for repurchases of its common stock based on the settlement date and presents repurchased stock in “Repurchased stock” on its Consolidated Balance Sheets (Note 11)10). Payments for stock repurchases that are not yet settled as of the reporting date are presented within “Other assets” on the Consolidated Balance Sheets. As of December 31, 2021,2023, KREF didhad not retireretired any repurchased stock.
Income Recognition
Interest Income — Loans where management expects to collect all contractually required principal and interest payments are considered performing loans. KREF accrues interest income on performing loans based on the outstanding principal amount and contractual terms of the loan. Interest income also includes origination fees, direct loan origination costs and related exit fees for loans that KREF originates, but where management did not elect the fair value option, as a yield adjustment using the interest method over the loan term, or on a straight line basis when it approximates the interest method. KREF expenses origination fees and direct loan origination costs for loans acquired, but not originated, by KREF as well as loans for which management elected the fair value option, as incurred.
Revenue from Real Estate Owned Operations — Revenue from REO operations is primarily comprised of rental income, including base rent and reimbursements of property operating expenses. For leases that have fixed and measurable base rent escalations, KREF recognizes base rent on a straight-line basis over the non-cancelable lease terms. The difference between such rental income earned and the cash rent amount is recorded as straight-line rent receivable and presented within "Other
KKR Real Estate Finance Trust Inc.
Notes to Consolidated Financial Statements
(amount in tables in thousands, except per share amounts)
assets" on the Consolidated Balance Sheets. Reimbursement of property operating expenses arises from tenant leases which provide for the recovery of certain operating expenses and real estate taxes of the respective property. This revenue is accrued in the same periods as the expenses are incurred. Rental income is presented within “Revenue from real estate owned operations” in the Consolidated Statements of Income.
Other Income — KREF recognizes interest income earned on its cash balances and miscellaneous fee income in “Other income” on its Consolidated Statements of Income.
Realized Gain (Loss) on Sale of Investments — KREF recognizes the excess, or deficiency, of net proceeds received, less the net carrying value of such investments, as realized gains or losses, respectively. KREF reverses cumulative, unrealized gains or losses previously reported in its Consolidated Statements of Income with respect to the investment sold at the time of sale.
Expense Recognition
Commercial Real Estate Loans, Held-For-Investment — For each loan in KREF's portfolio, management performs aan evaluation, at least quarterly, evaluation of credit quality indicators of loans classified as held-for-investment using applicable loan, property, market and sponsor information obtained from borrowers, loan servicers and local market participants. Such indicators may include the net present value of the underlying collateral, property operating cash flows, the sponsor’s financial wherewithal and competency in managing the property, macroeconomic trends, and property submarket—specific economic factors. The evaluation of these credit quality indicators requires significant judgment by management to determine whether failure to collect contractual amounts is probable.
If management deems that it is probable that KREF will be unable to collect all amounts owed according to the contractual terms of a loan, deterioration in credit quality of that loan is indicated. Management evaluates all available facts and circumstances that might impact KREF’s ability to collect outstanding loan balances when determining loan write-offs. These facts and circumstances may vary and may include, but are not limited to, (i) significant deterioration in the underlying collateral performance and/or value, if repayment is solely based on the collateral, (ii) correspondence fromcommunications with the borrower, indicating that it does not intend to pay the contractual principal and interest, (iii) violation of multiplecompliance with debt covenants, without indication the borrower has the ability to remediate such violations, (iv) occurrence of one or more events of default by the borrower, or (v) KREF has sufficient informationother facts that impact the borrower’s ability to determine thatpay the borrower is insolvent, orcontractual amounts due under the borrower has filed for bankruptcy, and the valueterms of the underlying collateral is below the loan basis.loan.
If management considers a loan to be impaired, management writes-offwrites off the loan through a charge to "Allowance for credit losses" based on the present value of expected future cash flows discounted at the loan’s contractual effective rate or the fair value of the collateral, if repayment is expected solely from the collateral. Significant judgment is required in determining
KKR Real Estate Finance Trust Inc.
Notes to Consolidated Financial Statements
(dollars in tables in thousands, except per share amounts)
impairment and in estimating the resulting credit loss allowance, and actual losses, if any, could materially differ from those estimates.
Management considers loans to be past due when a monthly payment is due and unpaid for 60 days or more. Loans are placed on nonaccrual status and considered non-performing when full repayment of principal and interest is in doubt, which generally occurs when principal or interest is 12090 days or more past due unless the loan is both well secured and in the process of collection.collection, or when repayment of interest and principal is, in management's judgment, in doubt. Interest received on loans placed on nonaccrual status aremay be accounted for under the cost-recovery method until qualifying for returnunder certain circumstances, whereby interest collected on a loan is a reduction to accrual.its amortized cost. Management may return a loan to accrual status when repayment of principal and interest is reasonably assured under the terms of the restructured loan. As of December 31, 2021, 1 mezzanine loan with an outstanding principal balance of $5.5 million was on nonaccrual status (Note 3). The remaining net carrying value of such loan of $0.9 million was written off in the fourth quarter of 2021.assured.
In certain circumstances, KREF may also modify the original terms of a loan agreement by granting a concession to accommodate a borrower experiencing financial difficulty. Such modifications are considered troubled debt restructurings (“TDR”) under GAAP and typically include interest rate reductions, payment extension and modification of loan covenants. None of KREF’s loan modifications in 2021 was considered a TDR.
In conjunction with reviewing commercial real estate loans held-for-investment for impairment, the Manager evaluates KREF's commercial real estate loans on a quarterly basis,at least once per quarter, assesses the risk factors of each loan, and assigns a risk rating based on a variety of factors, including, without limitation, underlying real estate performance, and asset value, values of comparable properties, durability and quality of property cash flows, sponsor experience and financial wherewithal, and the existence of a risk-mitigating loan structure. Additional key considerations include loan-to-value ratios, debt service coverage ratios, loan structure, real estate and credit market dynamics, and risk of default or principal loss. Based on a five-point scale, KREF's loans are rated "1" through "5," from less risk to greater risk, which ratings are defined as follows:
1—Very 1 (Very Low Risk—The underlying property performance has surpassed underwritten expectations, and the sponsor’s business plan is generally complete. The property demonstrates stabilized occupancy and/or rental rates resulting in strong current cash flow and/or a very low loan-to-value ratio (<65%). At the level of performance, it is very likely that the underlying loan can be refinanced easily in the period’s prevailing capital market conditions.
2—Low Risk—The underlying property performance has matched or exceeded underwritten expectations, and the sponsor’s business plan may be ahead of schedule or has achieved some or many of the major milestones from a risk mitigation perspective. The property has achieved improving occupancy at market rents, resulting in sufficient current cash flow and/or a low loan-to-value ratio (65%-70%). Operating trends are favorable, and the underlying loan can be refinanced in today’s prevailing capital market conditions. The sponsor/manager is well capitalized or has demonstrated a history of success in owning or operating similar real estate.
3—Average Risk—The underlying property performance is in-line with underwritten expectations, or the sponsor may be in the early stages of executing its business plan. Current cash flow supports debt service payments, or there is an ample interest reserve or loan structure in place to provide the sponsor time to execute the value-improvement plan. The property exhibits a moderate loan-to-value ratio (<75%). Loan structure appropriately mitigates additional risks. The sponsor/manager has a stable credit history and experience owning or operating similar real estate.
4—HighRisk); 2 (Low Risk); 3 (Medium Risk); 4 (High Risk/Potential for Loss—A loan that has a risk of realizing a principal loss. The underlying property performance is behind underwritten expectations, or the sponsor is behind schedule in executing its business plan. The underlying market fundamentals may have deteriorated, comparable property valuations may be declining or property occupancy has been volatile, resulting in current cash flow that may not support debt service payments. The loan exhibits a high loan-to-value ratio (>80%),Loss); and the loan covenants are unlikely to fully mitigate some risks. Interest payments may come from an interest reserve or sponsor equity.
5—Impaired/5 (Impaired/Loss Likely—A loan that has a very high risk of realizing a principal loss or has otherwise incurred a principal loss. The underlying property performance is significantly behind underwritten expectations, the sponsor has failed to execute its business plan and/or the sponsor has missed interest payments. The market fundamentals have deteriorated, or property performance has unexpectedly declined or valuations for comparable properties have declined meaningfully since loan origination. Current cash flow does not support debt service payments. With the current
KKR Real Estate Finance Trust Inc.
Notes to Consolidated Financial Statements
(dollars in tables in thousands, except per share amounts)
capital structure, the sponsor might not be incentivized to protect its equity without a restructuring of the loan. The loan exhibits a very high loan-to-value ratio (>90%), and default may be imminent.Likely).
Commercial Real Estate Loans, Held-For-Sale — For commercial real estate loans held-for-sale, KREF applies the lower of cost or fair value accounting and may be required, from time to time, to record a nonrecurring fair value adjustment.
KKR Real Estate Finance Trust Inc.
Notes to Consolidated Financial Statements
(amount in tables in thousands, except per share amounts)
Accrued Interest Receivables — KREF elected not to measure an allowance for credit losses for accrued interest receivables. KREF generally writes off an accrued interest receivable balance when interest is 12090 days or more past due unless the loan is both well secured and in the process of collection. Write-offs of accrued interest receivable are recognized as “Provision for (reversal of) credit losses, net” in the Consolidated Statements of Income.
Tenant Receivables — KREF periodically reviews its REO tenant receivables for collectability, taking into consideration changes in factors such as the tenant’s payment history, the financial condition of the tenant, business conditions in the industry in which the tenant operates and economic conditions in the area where the property is located. Tenant receivables, including receivables arising from the straight-lining of rents, are written-off directly when management deems that the collectability of substantially all future lease payments from a specified lease is not probable, at which point, KREF will begin recognizing revenue on a cash basis, based on actual amounts received. Any receivables that are deemed to be uncollectible are recognized as a reduction to “Revenue from real estate owned operations” in the Consolidated Statements of Income.
Interest Expense — KREF expenses contractual interest due in accordance with KREF's financing agreements as incurred.
Deferred Debt Issuance Costs — KREF capitalizes and amortizes deferred financing costs incurred in connection with financing arrangements over their respective expected term using the interest method, or on a straight line basis when it approximates the interest method. KREF presents such expensed amounts, as well as deferred amounts written off, as additional interest expense in its Consolidated Statements of Income.
General and Administrative Expenses — KREF expenses general and administrative costs, including legal diligence and audit fees; information technology costs;fees, insurance premiums;premiums, and other costs as incurred.
Management and Incentive Compensation to Affiliate — KREF expenses management fees and incentive compensation earned by the Manager on a quarterly basis in accordance with the Management Agreement (Note 15)14).
Income Taxes — Certain activities of KREF are conducted through joint ventures that are formed as limited liability companies, taxed as partnerships, and consolidated by KREF. Some of these joint ventures are subject to state and local income taxes, based on the tax jurisdictions in which they operate. In addition, certain activities of KREF are conducted through taxable REIT subsidiaries consolidated by KREF. Taxable REIT subsidiaries are subject to federal, state and local income taxes (Note 17)16).
As of December 31, 20212023 and 2020,2022, KREF did not have any material deferred tax assets or liabilities arising from future tax consequences attributable to differences between the carrying amounts of existing assets and liabilities in accordance with GAAP and their respective tax bases.
KREF recognizes tax benefits for uncertain tax positions only if it is more likely than not that the position is sustainable based on its technical merits. Interest and penalties on uncertain tax positions are included as a component of the provision for income taxes in KREF's Consolidated Statements of Income. As of December 31, 2021,2023, KREF did not have any material uncertain tax positions.
Stock-Based Compensation
KREF's stock-based compensation consists of awards issued to employees of the Manager or its affiliates that vest over the life of the awards, as well as restricted stock units issued to certain members of KREF's board of directors. KREF recognizes the compensation cost of stock-based awards to its directors and employees of the Manager or its affiliates on a straight-line basis over the awards’ term at their grant date fair value. Certain stock-based awards are entitled to nonforfeitable dividends, at the same rate as those declared on the common stocks,stock, during the vesting period. Such nonforteitable dividends are deducted from "Retained earnings (Accumulated deficit)" in the consolidated financial statements. KREF accounts for forfeitures as they occur. Refer to Note 1211 for additional information.
Earnings per Share
KREF calculates basic earnings per share ("EPS") using the two-class method, which defines unvested share-based payment awards that contain nonforfeitable rights to dividends as participating securities. The two-class method is an allocation formula that determines earnings per share for each share of common stock and participating securities according to dividends declared and participation rights in undistributed earnings. Under this method, all earnings (distributed and undistributed) are allocated to
KKR Real Estate Finance Trust Inc.
Notes to Consolidated Financial Statements
(amount in tables in thousands, except per share amounts)
common shares and participating securities based on their respective rights. Basic EPS, is calculated by dividing net income (loss) attributable to common stockholders by the weighted average number of common stock outstanding for the period.
KKR Real Estate Finance Trust Inc.
On January 1, 2022, KREF adopted ASU No. 2020-06, Debt — Debt with Conversion and Other Options (Subtopic 470-20) and Derivatives and Hedging — Contracts in Entity’s Own Equity (Subtopic 815-40): Accounting for Convertible Instruments and Contracts in an Entity’s Own Equity, which requires KREF to include convertible instruments in the diluted EPS calculation, regardless of a company's intent and ability to settle such debt in cash. As of December 31, 2023, KREF had no outstanding convertible instruments and, as a result, no potentially issuable shares related to convertible instruments have been included in the dilutive EPS calculations for year ended December 31, 2023. For the year ended December 31, 2022, 6,316,174 potentially issuable shares related to the Convertible Notes to Consolidated Financial Statements
(dollars in tables in thousands, except per share amounts)
were excluded from the calculation of dilutive EPS as the effect was anti-dilutive.
KREF presents diluted EPS under the more dilutive of the treasury stock methodand if-converted methods or the two-class method. Under the treasury stock method,and if-converted methods, the denominator includes weighted average common stock outstanding plus the incremental dilutive shares issuable from restricted stock units.units and an assumed conversion of convertible instruments. The numerator includes any changes in income (loss) attributable to common stockholders that would result from the assumed conversion of these potential shares of common stock. Refer to Note 1112 for additional discussion of earnings per share.
Recent Accounting Pronouncements
In March 2020, the FASB issued ASU No. 2020-04, Reference Rate Reform (Topic 848): Facilitation of the Effects of Reference Rate Reform on Financial Reporting, which provides temporary optional expedients and exceptions to the US GAAP guidance on contract modifications and hedge accounting to ease the financial reporting burdens of the expected market transition from LIBOR and other interbank offered rates to alternative reference rates. The guidance is effective upon issuance and generally may be elected over time through December 31, 2022.2024, as extended under ASU No. 2022-06, Reference Rate Reform (Topic 848): Deferral of the Sunset Date of Topic 848. KREF has not adopted any of the optional expedients or exceptions through December 31, 2021,2023, but will continue to evaluate the possible adoption of any such expedients or exceptions during the effective period as circumstances evolve.
In August 2020,March 2022, the FASB issued ASU No. 2020-06,2022-02, Financial Instruments — Credit Losses (Topic 326): Troubled Debt — Debt with ConversionRestructurings and Other Options (Subtopic 470-20) and Derivatives and Hedging — Contracts in Entity’s Own Equity (Subtopic 815-40): Accounting for Convertible Instruments and Contracts in an Entity’s Own EquityVintage Disclosures, which simplifies an issuer’s accountingeliminates the recognition and measurement guidance for convertible instruments and its application of the derivatives scope exceptiona troubled debt restructuring for contracts in its own equity. The guidance also addresses how convertible instruments are accounted for in the diluted EPS calculationcreditors that have adopted CECL and requires enhancedpublic business entities to present gross write-offs by year of origination in their vintage disclosures. On January 1, 2023, KREF adopted ASU 2022-02 on a prospective basis and the adoption had no significant impact on KREF's consolidated financial statements.
In November 2023, the FASB issued ASU No. 2023-07, Segment Reporting (Topic 280): Improvements to Reportable Segment Disclosures, which requires a public entity to disclose significant segment expenses and other segment items on an annual and interim basis and to provide in interim periods all disclosures about a reportable segment’s profit or loss and assets that are currently required annually. Public entities with a single reportable segment are required to provide the terms of convertible instrumentsnew disclosures and contracts in an entity’s own equity.all the disclosures required under ASC 280. The guidance is effective for KREF in the first quarter of 2022.its 2024 annual reporting. The guidance allowsis applied retrospectively to all periods presented in the usefinancial statements, unless it is impracticable. KREF is evaluating the impact of a modified or full retrospective transition method. KREF expects the inclusion of its convertible notes to be dilutive to the EPS calculations starting the first quarter of 2022.ASU 2023-07.
KKR Real Estate Finance Trust Inc.
Notes to Consolidated Financial Statements
(dollarsamount in tables in thousands, except per share amounts)
Note 3. Commercial Real Estate Loans
The following table summarizes KREF's investments in commercial real estate loans as of December 31, 20212023 and 2020:
2022:
| | | | | | | | | | | | | | | | | | | | | | | | | | | | | | | | | | | | | | | | | | | | |
| | | | | | | | | | Weighted Average |
| Loan Type | | Outstanding Principal | | Amortized Cost(A) | | Carrying Value(B) | | Loan Count | | Floating Rate Loan %(C) | | Coupon(C) | | Life (Years)(D) |
| December 31, 2021 | | | | | | | | | | | | | | |
| Loans held-for-investment | | | | | | | | | | | | | | |
Senior loans(E) | | $ | 6,263,370 | | | $ | 6,222,058 | | | $ | 6,200,078 | | | 59 | | | 100.0 | % | | 3.9 | % | | 3.6 |
Mezzanine and other loans(F) | | 100,735 | | | 94,675 | | | 94,411 | | | 4 | | | 94.5 | | | 11.2 | | | 4.0 |
| | $ | 6,364,105 | | | $ | 6,316,733 | | | $ | 6,294,489 | | | 63 | | | 99.9 | % | | 4.1 | % | | 3.6 |
| December 31, 2020 | | | | | | | | | | | | | | |
| Loans held-for-investment | | | | | | | | | | | | | | |
Senior loans(E) | | $ | 4,779,367 | | | $ | 4,759,624 | | | $ | 4,701,268 | | | 38 | | | 100.0 | % | | 4.7 | % | | 3.3 |
Mezzanine and other loans(F) | | 90,329 | | | 84,910 | | | 83,465 | | | 4 | | | 93.9 | | | 12.6 | | | 4.6 |
| | $ | 4,869,696 | | | $ | 4,844,534 | | | $ | 4,784,733 | | | 42 | | | 99.9 | % | | 4.9 | % | | 3.3 |
| | | | | | | | | | | | | | | | | | | | | | | | | | | | | | | | | | | | | | | | | | | | |
| | | | | | | | | | Weighted Average(C) |
| Loan Type | | Outstanding Principal | | Amortized Cost(A) | | Carrying Value(B) | | Loan Count | | Floating Rate Loan % | | Coupon(D) | | Life (Years)(E) |
| December 31, 2023 | | | | | | | | | | | | | | |
Loans held-for-investment(F) | | | | | | | | | | | | | | |
Senior loans(G) | | $ | 7,324,758 | | | $ | 7,298,844 | | | $ | 7,089,930 | | | 67 | | | 98.9 | % | | 8.7 | % | | 2.7 |
| Mezzanine loans | | 44,667 | | | 44,704 | | | 43,148 | | | 2 | | | 100.0 | | | 14.1 | | | 2.1 |
| Total/Weighted Average | | $ | 7,369,425 | | | $ | 7,343,548 | | | $ | 7,133,078 | | | 69 | | | 98.9 | % | | 8.7 | % | | 2.7 |
| December 31, 2022 | | | | | | | | | | | | | | |
Loans held-for-investment(F) | | | | | | | | | | | | | | |
Senior loans(G) | | $ | 7,463,459 | | | $ | 7,395,463 | | | $ | 7,288,635 | | | 73 | | | 100.0 | % | | 7.7 | % | | 3.3 |
Mezzanine and other loans(H) | | 98,933 | | | 98,675 | | | 98,529 | | | 3 | | | 100.0 | | | 15.0 | | | 3.0 |
| Total/Weighted Average | | $ | 7,562,392 | | | $ | 7,494,138 | | | $ | 7,387,164 | | | 76 | | | 100.0 | % | | 7.8 | % | | 3.3 |
(A) Amortized cost represents the outstanding principal of loan, net of applicable unamortized discounts, loan origination fees, cost recovery interest and write-offwrite-offs on uncollectableuncollectible loan balances.
(B) Carrying value represents the amortized cost of loan, net of applicable allowance for credit losses.
(C) Average weighted by outstanding principal of loan. loan principal.
(D) Weighted average coupon assumes the greater of applicable index rate, including one-month LIBOR rates of 0.10%Term SOFR and 0.14% as of December 31, 2021 and 2020, respectively,LIBOR, or the applicable contractual LIBORrate floor. Excludes loans accounted for under the cost recovery method.
(D)(E) The weighted average life of each loan is based on the expected timing of the receipt of contractual principal repayments assumingassumes all extension options are exercised by the borrower.borrowers.
(E)(F) Excludes three fully written off risk-rated 5 loans with a combined outstanding principal balance of $45.5 million as of December 31, 2023. Excludes one fully written off risk-rated 5 mezzanine loan with an outstanding principal balance of $5.5 million as of December 31, 2022.
(G) Senior loans may include accommodation mezzanine loans in connection with the senior mortgage financing. Also, includes vertical loan participations sold with a principal and a carrying value of $66.2 million as of December 31, 2020.
(H) Includes CLO loan participations of $1,246.0 million and $1,000.0 million as of December 31, 2021 and 2020, respectively.
(F) Includes 1one real estate corporate loan to a multifamily operator with a principal and a carrying value of $41.1 million and $40.3 million, respectively, as of December 31, 2021, and $50.0$40.4 million and $48.0$40.1 million, respectively, as of December 31, 2020.
Activity — For the years ended December 31, 20212023 and 2020,2022, the loan portfolio activity was as follows:
| | | | | | | | | | | | | | | | | |
| Amortized Cost | | Allowance for
Credit Losses | | Carrying Value |
| Balance at December 31, 2019 | $ | 4,931,042 | | | $ | — | | | $ | 4,931,042 | |
Originations and future fundings, net(A) | 966,182 | | | — | | | 966,182 | |
Proceeds from sales and loan repayments(B) | (1,069,494) | | | — | | | (1,069,494) | |
Accretion of loan discount and other amortization, net(C) | 17,222 | | | — | | | 17,222 | |
| Payment-in-kind interest | 4,232 | | | — | | | 4,232 | |
| Cumulative-effect adjustment upon adoption of ASU 2016-13 | — | | | (13,909) | | | (13,909) | |
| Provision for credit losses | — | | | (50,542) | | | (50,542) | |
| Write-off charged | (4,650) | | | 4,650 | | | — | |
| Balance at December 31, 2020 | $ | 4,844,534 | | | $ | (59,801) | | | $ | 4,784,733 | |
Originations and future fundings, net(A) | 3,904,267 | | | — | | | 3,904,267 | |
Proceeds from sales and loan repayments(B) | (2,346,593) | | | — | | | (2,346,593) | |
Accretion of loan discount and other amortization, net(C) | 22,852 | | | — | | | 22,852 | |
| Payment-in-kind interest | 2,094 | | | — | | | 2,094 | |
| Transfer to real estate owned | (77,516) | | | — | | | (77,516) | |
| Reversal of credit losses, net | — | | | 4,652 | | | 4,652 | |
| Write-off charged | (32,905) | | | 32,905 | | | — | |
| Balance at December 31, 2021 | $ | 6,316,733 | | | $ | (22,244) | | | $ | 6,294,489 | |
| | | | | | | | | | | | | | | | | |
| Amortized Cost | | Allowance for
Credit Losses | | Carrying Value |
| Balance at December 31, 2021 | $ | 6,316,733 | | | $ | (22,244) | | | $ | 6,294,489 | |
Originations and future fundings, net(A) | 2,419,733 | | | — | | | 2,419,733 | |
| Proceeds from sales and loan repayments | (1,244,262) | | | — | | | (1,244,262) | |
| Accretion of loan discount and other amortization, net | 25,064 | | | — | | | 25,064 | |
| Payment-in-kind interest | 1,870 | | | — | | | 1,870 | |
| (Provision for) Reversal of credit losses | — | | | (109,730) | | | (109,730) | |
Write-offs charged(B) | (25,000) | | | 25,000 | | | — | |
| Balance at December 31, 2022 | $ | 7,494,138 | | | $ | (106,974) | | | $ | 7,387,164 | |
Originations and future fundings, net(A)(C) | 876,726 | | | — | | | 876,726 | |
Proceeds from loan repayments and cost recovery interest(C)(D) | (890,785) | | | — | | | (890,785) | |
| Accretion of loan discount and other amortization, net | 23,597 | | | — | | | 23,597 | |
| | | | | |
| (Provision for) Reversal of credit losses | — | | | (177,202) | | | (177,202) | |
Write-offs charged(B) | (73,706) | | | 73,706 | | | — | |
| Transfer to real estate owned | (86,422) | | | — | | | (86,422) | |
| Balance at December 31, 2023 | $ | 7,343,548 | | | $ | (210,470) | | | $ | 7,133,078 | |
(A) Net of applicable premiums, discounts and deferred loan origination costs. Includes fundings on previously originated loans.
(B) Includes $150.0a $58.7 million and $27.9 million in proceeds from non-recourse salewrite-off on a defaulted senior loan upon deed-in-lieu of senior interestsforeclosure during the yearsthree months ended December 31, 2023, and a $15.0 million write-off of a subordinated loan during the three months ended September 30, 2023. Includes a $25.0 million partial write-off of a defaulted senior loan during the year ended December 31, 2021 and 2020, respectively.2022.
(C) Includes accretion$199.4 million of applicable discounts, certain fees and deferredamortized cost for loan origination costs.modifications accounted for as new loans for GAAP purposes.
(D) Includes $9.8 million of cost recovery interest collections applied as a reduction to loan amortized cost during the year ended December 31, 2023.
KKR Real Estate Finance Trust Inc.
Notes to Consolidated Financial Statements
(dollarsamount in tables in thousands, except per share amounts)
As of December 31, 20212023 and 2020,2022, there waswas $20.8 million and $41.9 million and $20.543.3 million, respectively, of unamortized origination discounts and deferred fees included in "Commercial Real Estate Loans, Held-for-investment, Net" inreal estate loans, held-for-investment, net" on the Consolidated Balance Sheets. During the year ended December 31, 2023, KREF recognizedrecognized prepayment fee incomeincome of $6.7$3.0 million and $0.0 million, respectively, during the years ended December 31, 2021 and 2020. KREF recognized net accelerated fee income of $5.3$1.9 million, and $1.8 million, respectively, duringrelating to loan repayments.During the yearsyear ended December 31, 20212022, KREF recognized prepayment fee income of $9.6 million and 2020, respectively.net accelerated fee income of $1.8 million.
KREF may enter into loan modifications that include, among other changes, incremental capital contributions or partial repayments from certain borrowers, repurposing of reserves, and a temporary partial deferral for a portion of the coupon as payment-in-kind interest (“PIK Interest”) due, which is capitalized, compounded, and added to the outstanding principal balance of the respective loans.
In January 2023, KREF completed the modification of a risk-rated 5 senior office loan located in Philadelphia, PA, with an outstanding principal balance of $161.0 million. The terms of the modification included, among others, a $25.0 million principal repayment and a restructure of the $136.0 million senior loan (after the $25.0 million repayment) into (i) a $116.5 million committed senior mortgage loan (with $5.5 million in unfunded commitment) and (ii) a $25.0 million junior mezzanine note. The restructured senior loan earns a coupon rate of S+2.75% and has a new term of up to four years, assuming all extension options are exercised. The $25.0 million junior mezzanine note is subordinate to a new $41.5 million committed senior mezzanine note held by the sponsor (with $16.5 million in unfunded commitment). As of December 31, 2021, total PIK Interest outstanding relating2022, $25.0 million of the loan was deemed uncollectible and written off, which was applied to the junior mezzanine note upon completion of the modification. This loan modificationsmodification was $0.2 million.
During the fourth quarter of 2021, KREF took title to 1 defaultedaccounted for as a new loan for GAAP purposes. The restructured senior retail loan with an outstanding principal balance and net carrying value of $109.6$114.3 million and $69.3 million, respectively,was risk-rated 3 as of September 30, 2021.December 31, 2023.
In June 2023, KREF recognizedcompleted the property onmodification of a risk-rated 4 senior multifamily loan located in West Hollywood, CA, with an outstanding principal balance of $102.0 million as of March 31, 2023. The terms of the Consolidated Balance Sheetmodification included, among others, an additional borrower deposit in escrow in exchange for an upsize in the loan commitment structured as REO(i) an accompanying senior mezzanine note with a carrying valuecommitment of $78.6$4.2 million, which includedat a fixed interest rate of 10.0%, and (ii) an accompanying junior mezzanine note with a commitment of $0.8 million, at a fixed interest rate of 10.0% with certain profit share provisions, as defined in the estimated fair valueloan agreement. As of December 31, 2023, the senior mezzanine note had an outstanding principal balance of $2.3 million, while the junior mezzanine note was fully funded. The restructured whole loan with an outstanding principal balance of $105.1 million was risk-rated 4 as of December 31, 2023.
In June 2023, KREF completed the modification of a risk-rated 5 senior office loan located in Minneapolis, MN, with an outstanding principal balance of $194.4 million as of March 31, 2023. The terms of the propertymodification included, among others, a restructure of the $194.4 million senior loan into (i) a $120.0 million senior mortgage loan (fully funded) and capitalized transaction costs. In addition, KREF assumed $2.0(ii) a $79.4 million mezzanine note (with $5.0 million in other net assetsunfunded commitment). The restructured senior loan earns a coupon rate of S+2.25% and the mezzanine note earns a fixed 4.5% PIK interest rate. Post modification, the whole loan’s maximum maturity is July 2025, assuming all extension options are exercised. The restructured whole loan with an outstanding principal balance of $194.4 million was risk-rated 5 as of December 31, 2023.
In September 2023, KREF completed the modification of a risk-rated 4 senior office loan located in Chicago, IL, with an outstanding principal balance of $118.4 million. The terms of the REO. Accordingly,modification included, among others, a $15.0 million principal repayment, a $15.0 million reduction in the fourth quarter KREF wrote off $32.1 million ofunfunded loan balance against the allowance for credit lossescommitment, and recognized an $8.2 million GAAP gain from the reversala restructure of the allowance$103.4 million senior loan (after the $15.0 million repayment) into (i) a $105.0 million committed senior mortgage loan (with $16.6 million in unfunded commitment) and (ii) a $15.0 million subordinated note. The restructured senior loan earns a coupon rate of S+2.25% and has a new term of five years. The $15.0 million subordinated note is subordinate to a new $18.5 million sponsor interest and was deemed uncollectible and written off. This loan modification was accounted for credit losses. In addition, in the fourth quarter of 2021, KREF wrote off $0.9 million remainingas a new loan for GAAP purposes. The restructured senior loan with an outstanding principal balance of an impaired mezzanine loan and recognized the write off in GAAP earnings.$88.4 million was risk-rated 3 as of December 31, 2023.
Loan Risk Ratings — As further described in Note 2, our Manager evaluates KREF's commercial real estate loan portfolio on a quarterly basis.at least once per quarter. In conjunction with the quarterlyits commercial real estate loan portfolio review, KREF's Manager assesses the risk factors of each loan and assigns a risk rating based on a variety of factors. Loans are rated “1” (very low risk)(Very Low Risk) through “5” Impaired/Loss Likely), which ratings are defined in Note 2.
KKR Real Estate Finance Trust Inc.
Notes to Consolidated Financial Statements
(amount in tables in thousands, except per share amounts)
The following tables summarize the net bookcarrying value of the loan portfolio based on KREF's internal risk ratings:
| | December 31, 2021 | | December 31, 2020 |
| December 31, 2023 | |
| December 31, 2023 | |
| December 31, 2023 | | | | | December 31, 2022 |
| Risk Rating | Risk Rating | | Number of Loans(B) | | Net Book Value | | Total Loan Exposure(A) | | Total Loan Exposure % | | Risk Rating | | Number of Loans | | Net Book Value | | Total Loan Exposure(A) | | Total Loan Exposure % | Risk Rating | | Number of Loans(A) | | Carrying Value | | Total Loan Exposure(B) | | Total Loan Exposure %* | | | | Number of Loans(A) | | Carrying Value | | Total Loan Exposure(B) | | Total Loan Exposure %* |
| 1 | 1 | | 1 | | | $ | 243,544 | | | $ | 243,552 | | | 3.6 | % | | 1 | | — | | | $ | — | | | $ | — | | | — | % | 1 | | — | | | $ | | $ | — | | | $ | | $ | — | | | — | | — | % | | | | — | | | $ | | $ | — | | | $ | | $ | — | | | — | | — | % |
| 2 | 2 | | 3 | | | 409,812 | | | 411,424 | | | 6.2 | | | 2 | | 2 | | | 321,686 | | | 323,026 | | | 6.5 | |
| 3 | 3 | | 54 | | | 5,256,052 | | | 5,627,927 | | | 84.3 | | | 3 | | 32 | | | 3,715,132 | | | 3,836,983 | | | 77.3 | |
| 4 | 4 | | 4 | | | 385,081 | | | 394,336 | | | 5.9 | | | 4 | | 6 | | | 675,727 | | | 687,040 | | | 13.9 | |
| 5 | 5 | | 1 | | | — | | | — | | | — | | | 5 | | 2 | | | 72,188 | | | 115,071 | | | 2.3 | |
| | 63 | | | $ | 6,294,489 | | | $ | 6,677,239 | | | 100.0 | % | | 42 | | | $ | 4,784,733 | | | $ | 4,962,120 | | | 100.0 | % |
| Total loan receivable | |
| Total loan receivable | |
| Total loan receivable | | | 69 | | | $ | 7,343,548 | | | $ | 7,558,036 | | | 100 | % | | | | 76 | | | $ | 7,494,138 | | | $ | 7,800,477 | | | 100 | % |
| Allowance for credit losses | |
| Loan receivable, net | |
| Loan receivable, net | |
| Loan receivable, net | |
*Numbers presented may not foot due to rounding.
(A) Excludes three fully written off risk-rated 5 loans with a combined outstanding principal balance of $45.5 million as of December 31, 2023. Excludes a fully written off risk-rated 5 loan with an outstanding principal balance of $5.5 million as of December 31, 2022.
(B) In certain instances, KREF finances its loans through the non-recourse sale of a senior interest that is not included in the consolidated financial statements. Total loan exposure includes the entire loan KREF originated and financed, including $318.6$188.6 million and $158.7$263.1 million of such non-consolidatednon-consolidated interests and excludes $0.0 million and $66.2 million vertical loan participation as of December 31, 20212023 and 2020,2022, respectively.
(B) Includes 1 impaired 5-rated mezzanine retail loan that was fully written off as of December 31, 2021.
As of December 31, 2021,2023, the average risk rating of KREF's portfolio was2.9 (Av3.2erage Risk), weighted by total loan exposure, consistent with that aas compared to 3.1 (Average Risk) ass of December 31, 2020.2022.
KKR Real Estate Finance Trust Inc.
Notes to Consolidated Financial Statements
(dollars in tables in thousands, except per share amounts)
Loan Vintage — The following tables present the amortized cost of the loan portfolio by KREF's internal risk rating and year of origination. The risk ratings are updated as of December 31, 20212023 and 20202022 in the corresponding table.
| December 31, 2021 | | Amortized Cost by Year of Origination | |
| December 31, 2023 | |
| December 31, 2023 | |
| December 31, 2023 | |
| | | | | | Amortized Cost by Year of Origination(A) | |
| Risk Rating | |
| Risk Rating | |
| Risk Rating | Risk Rating | | Number of Loans | | Outstanding Principal | | 2021 | | 2020 | | 2019 | | 2018 | | 2017 | | Prior | | Total | | Carrying Amount |
| Commercial Real Estate Loans | Commercial Real Estate Loans | | | | | | | | | | | | | | | | |
| Commercial Real Estate Loans | |
| Commercial Real Estate Loans | |
| 1 | |
| 1 | |
| 1 | 1 | | 1 | | | $ | 243,552 | | | $ | — | | | $ | — | | | $ | — | | | $ | 243,549 | | | $ | — | | | $ | — | | | $ | 243,549 | | | $ | 243,544 | |
| 2 | 2 | | 3 | | | 411,424 | | | — | | | 130,400 | | | — | | | 85,943 | | | 193,950 | | | — | | | 410,293 | | | 409,812 | |
| 2 | |
| 2 | |
| 3 | |
| 3 | |
| 3 | 3 | | 54 | | | 5,309,293 | | | 3,523,611 | | | 203,961 | | | 1,017,080 | | | 523,938 | | | — | | | — | | | 5,268,590 | | | 5,256,052 | |
| 4 | 4 | | 4 | | | 394,336 | | | — | | | — | | | 76,221 | | | 210,701 | | | 107,379 | | | — | | | 394,301 | | | 385,081 | |
| 4 | |
| 4 | |
| 5 | 5 | | 1 | | | 5,500 | | | — | | | — | | | — | | | — | | | — | | | — | | | — | | | — | |
| 63 | | | $ | 6,364,105 | | | $ | 3,523,611 | | | $ | 334,361 | | | $ | 1,093,301 | | | $ | 1,064,131 | | | $ | 301,329 | | | $ | — | | | $ | 6,316,733 | | | $ | 6,294,489 | |
| 5 | |
| 5 | |
| | 69 | |
| | 69 | |
| | 69 | |
| Current period gross write-offs | |
| Current period gross write-offs | |
| Current period gross write-offs | |
| | | | | | | | | | | | | | | | | | | | | | | | | | | | | | | | | | | | | | | | | | | | | | | | | | | | | | | | | | | | | | |
| December 31, 2020 |
| | | | | | Amortized Cost by Year of Origination | | |
| Risk Rating | | Number of Loans | | Outstanding Principal | | 2020 | | 2019 | | 2018 | | 2017 | | 2016 | | 2015 | | Total | | Carrying Amount |
| Commercial Real Estate Loans | | | | | | | | | | | | | | | | |
| 1 | | — | | | $ | — | | | $ | — | | | $ | — | | | $ | — | | | $ | — | | | $ | — | | | $ | — | | | $ | — | | | $ | — | |
| 2 | | 2 | | | 323,026 | | | — | | | 128,514 | | | — | | | 193,633 | | | — | | | — | | | 322,147 | | | 321,686 | |
| 3 | | 32 | | | 3,744,559 | | | 461,406 | | | 2,105,972 | | | 1,159,818 | | | — | | | — | | | — | | | 3,727,196 | | | 3,715,132 | |
| 4 | | 6 | | | 687,040 | | | 101,586 | | | 76,670 | | | 340,745 | | | 165,751 | | | — | | | — | | | 684,752 | | | 675,727 | |
| 5 | | 2 | | | 115,071 | | | — | | | — | | | — | | | — | | | — | | | 110,439 | | | 110,439 | | | 72,188 | |
| | 42 | | | $ | 4,869,696 | | | $ | 562,992 | | | $ | 2,311,156 | | | $ | 1,500,563 | | | $ | 359,384 | | | $ | — | | | $ | 110,439 | | | $ | 4,844,534 | | | $ | 4,784,733 | |
Allowance for Credit Losses(B) Excludes —three The following tables present the changes to the allowance for credit losses for the years ended December 31, 2021 and 2020, respectively:fully written off risk-rated 5 loans with a combined outstanding principal balance of $45.5 million.
| | | | | | | | | | | | | | | | | | | | |
| | Commercial
Real Estate Loans | | Unfunded Loan Commitments | | Total |
| Balance at December 31, 2019 | | $ | — | | | $ | — | | | $ | — | |
Cumulative-effect adjustment upon adoption of ASU 2016-13 | | 13,909 | | | 1,100 | | | 15,009 | |
| Provision for (reversal of) credit losses, net | | 50,542 | | | (198) | | | 50,344 | |
| Write-off charged | | (4,650) | | | — | | | (4,650) | |
| Recoveries | | — | | | — | | | — | |
| Balance as December 31, 2020 | | $ | 59,801 | | | $ | 902 | | | $ | 60,703 | |
| Provision for (reversal of) credit losses, net | | (4,652) | | | 593 | | | (4,059) | |
| Write-off charged | | (32,905) | | | — | | | (32,905) | |
| Recoveries | | — | | | — | | | — | |
| Balance as December 31, 2021 | | $ | 22,244 | | | $ | 1,495 | | | $ | 23,739 | |
| | | | | | | | | | | | | | | | | | | | | | | | | | | | | | | | | | | | | | | | | | | | | | | | | | | | | | | | | | |
| December 31, 2022 |
| | | | | | Amortized Cost by Year of Origination | | |
| Risk Rating | | Number of Loans(A) | | Outstanding Principal(A) | | 2022 | | 2021 | | 2020 | | 2019 | | 2018 | | Prior | | Total | | |
| Commercial Real Estate Loans | | | | | | | | | | | | | | | | |
| 1 | | — | | | $ | — | | | $ | — | | | $ | — | | | $ | — | | | $ | — | | | $ | — | | | $ | — | | | $ | — | | | |
| 2 | | — | | | — | | | — | | | — | | | — | | | — | | | — | | | — | | | — | | | |
| 3 | | 70 | | | 6,601,856 | | | 1,812,576 | | | 3,594,235 | | | 353,506 | | | 472,125 | | | 307,582 | | | 20,142 | | | 6,560,166 | | | |
| 4 | | 3 | | | 446,322 | | | 101,469 | | | 193,883 | | | — | | | 148,605 | | | — | | | — | | | 443,957 | | | |
| 5 | | 3 | | | 514,214 | | | — | | | — | | | — | | | 158,698 | | | 136,825 | | | 194,492 | | | 490,015 | | | |
| | 76 | | | $ | 7,562,392 | | | $ | 1,914,045 | | | $ | 3,788,118 | | | $ | 353,506 | | | $ | 779,428 | | | $ | 444,407 | | | $ | 214,634 | | | $ | 7,494,138 | | | |
| Current period gross write-offs | | $ | — | | | $ | — | | | $ | — | | | $ | — | | | $ | 25,000 | | | $ | — | | | $ | 25,000 | | | |
The $4.1 million net benefit during the year ended December 31, 2021 was primarily due to the reversalExcludes a fully written off risk-rated 5 loan with an outstanding principal balance of $32.1 million in allowance for credit losses for 1 senior retail loan where we took title of the underlying collateral and a more stable macro-economic outlook based on improved observed economic data, partially offset by an increase to the allowance related to newly originated loans and an impaired mezzanine loan that was deemed uncollectable. The $50.3 million in provision for credit loss during the year ended December 31, 2020 was primarily due to the significant adverse change in the economic outlook resulting from the outbreak of COVID-19 pandemic and incremental reserves for 4- and 5-risk rated loans.$5.5 million.
KKR Real Estate Finance Trust Inc.
Notes to Consolidated Financial Statements
(dollarsamount in tables in thousands, except per share amounts)
Allowance for Credit Losses — The following tables present the changes to the allowance for credit losses for the years ended December 31, 2023 and 2022, respectively:
| | | | | | | | | | | | | | | | | | | | |
| | Commercial
Real Estate Loans | | Unfunded Loan Commitments | | Total |
| Balance at December 31, 2021 | | $ | 22,244 | | | $ | 1,495 | | | $ | 23,739 | |
| Provision for (reversal of) credit losses, net | | 109,730 | | | 2,643 | | | 112,373 | |
| Write-offs charged | | (25,000) | | | — | | | (25,000) | |
| | | | | | |
| Balance at December 31, 2022 | | $ | 106,974 | | | $ | 4,138 | | | $ | 111,112 | |
| Provision for (reversal of) credit losses, net | | 177,202 | | | (2,086) | | | 175,116 | |
| Write-offs charged | | (73,706) | | | — | | | (73,706) | |
| | | | | | |
| Balance at December 31, 2023 | | $ | 210,470 | | | $ | 2,052 | | | $ | 212,522 | |
As of December 31, 2023, the allowance for credit losses was $212.5 million. The CECL provision of $175.1 million for the year ended December 31, 2023 was primarily due to additional reserves on risk-rated 5 senior loan predominantly in the office sector, as well as macroeconomic conditions.
KREF had a risk-rated 5 senior office loan located in Mountain View, CA, originated in July 2021, with an outstanding principal balance of $200.9 million and an unfunded commitment of $49.1 million as of December 31, 2023. The loan had an amortized cost of $198.9 million as of December 31, 2023. The property is located in a challenged leasing market. In June 2023, this loan was placed on nonaccrual status and subsequent interest collections are accounted for under the cost recovery method. This loan's maximum maturity is August 2026, assuming all extension options are exercised. During the year ended December 31, 2023, KREF recognized $7.3 million of interest income on this loan. During the year ended December 31, 2023, an additional $0.8 million of contractual interest payments was received and applied as a reduction to the loan amortized cost under the cost recovery method of accounting.
KREF had a risk-rated 5 senior office loan located in Minneapolis, MN, originated in November 2017, with an outstanding principal balance of $194.4 million and an unfunded commitment of $5.0 million as of December 31, 2023. The loan had an amortized cost of $190.1 million as of December 31, 2023. The property is located in a challenged leasing market. In June 2023, KREF restructured the $194.4 million senior loan into (i) a $120.0 million senior mortgage loan (fully funded) and (ii) a $79.4 million mezzanine note (with $5.0 million in unfunded commitment). The restructured senior loan earns a coupon rate of S+2.25% and the mezzanine note earns a fixed 4.5% PIK interest rate. Post modification, the whole loan’s maximum maturity is July 2025, assuming all extension options are exercised. During the year ended December 31, 2023, KREF recognized $7.9 million of interest income on this loan. During the year ended December 31, 2023, an additional $4.3 million of contractual interest payments was received and applied as a reduction to the loan amortized cost under the cost recovery method of accounting. Beginning in June 2023, the senior loan was solely on nonaccrual status.
KREF had a risk-rated 5 senior life science loan located in Seattle, WA, originated in October 2021, with an outstanding principal balance of $116.8 million and an unfunded commitment of $23.5 million as of December 31, 2023. The loan had an amortized cost of $116.3 million as of December 31, 2023. The property is located in a challenged leasing market. In December 2023, this loan was placed on nonaccrual status and subsequent interest collections are accounted for under the cost recovery method. This loan's maximum maturity is October 2026, assuming all extension options are exercised. During the year ended December 31, 2023, KREF recognized $9.2 million of interest income on this loan.
The 5-rated loans were determined to be collateral dependent as of December 31, 2023. KREF estimated expected losses based on each loan’s collateral fair value, which was determined by applying a capitalization rate between 7.0% and 8.7% and a discount rate between 9.0% and 12.0%, respectively.
As of December 31, 2022, the allowance for credit losses was $111.1 million. The CECL provision of $112.4 million for the year ended December 31, 2022 was primarily due to increased uncertainty in the macroeconomic outlook, as well as volatility and reduced liquidity in the office sector.
KKR Real Estate Finance Trust Inc.
Notes to Consolidated Financial Statements
(amount in tables in thousands, except per share amounts)
Concentration of Credit Risk — The following tables present the geographies and property types of collateral underlying KREF's commercial real estate loans as a percentage of the loans' principal amounts:
| | December 31, 2021 | | December 31, 2020 | | December 31, 2021 | | December 31, 2020 | |
Geography(A) | | | | Collateral Property Type | | | |
| | December 31, 2023 | |
| | December 31, 2023 | |
| | December 31, 2023 | |
| Geography | |
| Geography | |
| Geography | |
| California | |
| California | |
| California | |
| Texas | Texas | | 15.0 | % | | 6.6 | % | | Multifamily | | 46.7 | % | | 51.0 | % | |
| New York | | 11.5 | | | 14.5 | | | Office | | 25.4 | | | 30.2 | | |
| California | | 10.8 | | | 7.7 | | | Life Science | | 9.3 | | | — | | |
| Texas | |
| Texas | |
| Massachusetts | |
| Massachusetts | |
| Massachusetts | |
| Florida | Florida | | 10.5 | | | 5.7 | | | Hospitality | | 6.9 | | | 4.5 | | |
| Massachusetts | | 10.3 | | | 8.4 | | | Industrial | | 4.4 | | | 1.8 | | |
| Pennsylvania | | 8.2 | | | 9.7 | | | Condo (Residential) | | 3.9 | | | 6.1 | | |
| Florida | |
| Florida | |
| Virginia | |
| Virginia | |
| Virginia | Virginia | | 6.7 | | | 10.1 | | | Student Housing | | 3.1 | | | 1.4 | | |
| Washington D.C. | Washington D.C. | | 4.7 | | | 2.9 | | | Single Family Rental | | 0.2 | | | — | | |
| Washington D.C. | |
| Washington D.C. | |
| New York | |
| New York | |
| New York | |
| Washington | |
| Washington | |
| Washington | |
| North Carolina | |
| North Carolina | |
| North Carolina | |
| Pennsylvania | |
| Pennsylvania | |
| Pennsylvania | |
| Arizona | |
| Arizona | |
| Arizona | |
| Georgia | |
| Georgia | |
| Georgia | |
| Minnesota | |
| Minnesota | |
| Minnesota | |
| Nevada | |
| Nevada | |
| Nevada | |
| Illinois | Illinois | | 3.8 | | | 11.8 | | | Retail | | 0.1 | | | 5.0 | | |
| Washington | | 3.6 | | | 7.2 | | | Total | | 100.0 | % | | 100.0 | % | |
| Minnesota | | 3.1 | | | 4.0 | | | | | | |
| Illinois | |
| Illinois | |
| Colorado | Colorado | | 2.7 | | | 4.7 | | | |
| Georgia | | 2.2 | | | 1.8 | | | |
| North Carolina | | 2.0 | | | — | | | |
| Nevada | | 1.6 | | | — | | | |
| Arizona | | 1.2 | | | — | | | |
| Alabama | | 1.1 | | | 1.4 | | | |
| Oregon | | — | | | 2.3 | | | |
| Colorado | |
| Colorado | |
| Other U.S. | |
| Other U.S. | |
| Other U.S. | Other U.S. | | 1.0 | | | 1.2 | | | |
| Total | Total | | 100.0 | % | | 100.0 | % | | |
| Total | |
| Total | |
(A) Excludes 1one real estate corporate loan to a multifamily operator with an outstanding principal amount of $41.1 million and $50.0$40.4 million, representing 0.6% and 1.0%0.5% of KREF’s commercial real estate loans, as of December 31, 2021 and 2020, respectively.2022. This loan was fully repaid during the first quarter of 2023.
KKR Real Estate Finance Trust Inc.
Notes to Consolidated Financial Statements
(dollarsamount in tables in thousands, except per share amounts)
Note 4. Real Estate Owned
As of December 31, 2023, REO assets and liabilities consisted of a retail property in Portland, OR and an office property in Philadelphia, PA.
Portland Retail —In 2015, KREF originated a $177.0 million senior loan secured by a retail property in Portland, Oregon. The loan had a risk rating of 5 and placed on non-accrual status in October 2020, with an amortized cost and carrying value of $109.6 million and $69.3 million, respectively, as of September 30, 2021. OnOR. In December 17, 2021, KREF took title to the retail property. Such acquisitionThe transaction was accounted for as an asset acquisition under ASC 805. Accordingly, KREF recognized the property on the Consolidated Balance SheetsSheet as REO with a carrying value of $78.6 million, which included the estimated fair value of the property.
Concurrently with taking title to the REO, KREF contributed a portion of the REO asset with a carrying value of $68.9 million to a joint venture (the "REO JV") with a third party local developer operator (“JV Partner”), whereby KREF has a 90% interest and the JV Partner has a 10% interest. In September 2023, the REO JV submitted a conceptual master plan to the City of Portland’s Bureau of Development Services in an application for a Design Advice Request (DAR) meeting with the City's Design Commission.
Philadelphia Office — In 2019, KREF originated a $182.6 million senior loan secured by an office property in Philadelphia, PA. In December 2022, this loan was placed on nonaccrual status and capitalizedsubsequent interest collections were accounted for under the cost recovery method. As of September 30, 2023, the loan had a risk rating of 5 with an amortized cost of $151.1 million. On December 22, 2023, KREF received a $6.0 million partial repayment and then took title to the office property through a deed-in-lieu of foreclosure. The transaction costs. In addition,was accounted for as an asset acquisition under ASC 805. Accordingly, KREF assumed $2.0 million in otherrecorded the property with its net assets on the Consolidated Balance Sheet with an estimated fair value of the REO.$86.4 million, which included $1.3 million of cash received and $76.5 million, $24.6 million and $15.9 million allocated to REO held for sale, lease intangible and other assets, and leasing and other liabilities, respectively. As a result, KREF recognized an $8.2a $58.7 million benefit from the reversal of credit losses, representingloan write-off for the difference between the carrying value of the foreclosed loan and the fair value of the REO’s net assets. As of December 31, 2023, the REO's assets and liabilities met the criteria to be classified as held for sale under ASC 360. As such, depreciation and amortization on the REO and related lease intangibles were suspended.
KREF assumed certain legacy lease arrangements upon the acquisition of the REO assets and entered into lease arrangements during the hold period. These arrangements entitle KREF to receive contractual rent payments during the lease periods and tenant reimbursements for certain property operating expenses, including common area costs, insurance, utilities and real estate taxes. KREF elects the practical expedient to not separate the lease and non-lease components of the rent payments and accounts for these lease arrangements as operating leases.
KKR Real Estate Finance Trust Inc.
Notes to Consolidated Financial Statements
(amount in tables in thousands, except per share amounts)
The following table details the fair value of the components ofpresents the REO assets and liabilities included on acquisition date:KREF's Consolidated Balance Sheets:
| | | | | | | | |
| | December 17, 2021 |
Assets | | |
Cash | | $ | 3,377 | |
Real estate owned, net | | 78,569 | |
In place lease intangibles(A)
| | 335 |
Other assets(A)
| | 1,119 | |
Total | | $ | 83,400 | |
Liability | | |
Below market lease intangibles(B)
| | $ | (1,825) | |
Accounts payable(B)
| | (1,742) | |
Total | | $ | (3,567) | |
| | | | | | | | | | | | | | |
| | December 31, 2023 | | December 31, 2022 |
| Real estate owned, held for investment | | | | |
| Assets | | | | |
| Real estate owned - land | | $ | 78,569 | | | $ | 78,569 | |
| Real estate owned - land improvements | | 3,522 | | | 1,662 | |
| | | | |
| | | | |
| Real estate owned, net | | 82,091 | | | 80,231 | |
| Cash | | 2,152 | | | 781 | |
In-place lease intangibles(A) | | 201 | | 268 |
Tenant receivables(A) | | 692 | | | 541 | |
Other assets(A) | | 1,256 | | | 1,304 | |
| Total | | $ | 86,392 | | | $ | 83,125 | |
| Liabilities | | | | |
Unfavorable lease intangibles(B) | | $ | 1,095 | | | $ | 1,460 | |
Other liabilities(B) | | 4,268 | | | 2,254 | |
| Total | | $ | 5,363 | | | $ | 3,714 | |
| | | | |
Real estate owned, held for sale(C) | | | | |
| Assets | | | | |
| | | | |
| | | | |
| | | | |
| | | | |
| Real estate owned, held for sale | | $ | 76,461 | | | $ | — | |
| | | | |
| In-place lease intangibles | | 15,928 | | — | |
| Favorable lease intangibles | | 3,885 | | | — | |
| Other assets | | 4,743 | | | — | |
| Total | | $ | 101,017 | | | $ | — | |
| Liabilities | | | | |
| Unfavorable lease intangibles | | $ | 1,087 | | | $ | — | |
| Other liabilities | | 14,796 | | | — | |
| Total | | $ | 15,883 | | | $ | — | |
(A) Included in “Other Assets” inassets” on the Consolidated Balance Sheets.
(B) Included in “Accounts payable, accrued expenses and other liabilities" in“Other liabilities” on the Consolidated Balance Sheets.
(C) Represents assets acquired and liabilities assumed as of December 22, 2023.
The following table presents the REO operations and related income (loss) were immaterial betweenincluded in KREF’s Consolidated Statements of Income:
| | | | | | | | | | | | | | | | | | | |
| | | | | For the Year Ended December 31, |
| | | | | | | 2023 | | 2022 |
| Rental income | | | | | | | $ | 7,038 | | | $ | 7,589 | |
| Other operating income | | | | | | | 1,507 | | | 1,382 | |
| Revenue from rest estate owned operations | | | | | | | 8,545 | | | 8,971 | |
| Expenses from real estate owned operations | | | | | | | (11,190) | | | (11,113) | |
| Other income | | | | | | | 1,722 | | | 1,382 | |
| Total | | | | | | | $ | (923) | | | $ | (760) | |
The following table presents the acquisition date and December 31, 2021.amortization of lease intangibles included in KREF’s Consolidated Statements of Income:
| | | | | | | | | | | | | | | | | | | | | | | | | |
| | | | | | | For the Year Ended December 31, |
| | Income Statement Location | | | | | | | 2023 | | 2022 |
| Asset | | | | | | | | | | | |
| In-place lease intangibles | | Expenses from real estate owned operations | | | | | | | $ | 67 | | | $ | 67 | |
| Liability | | | | | | | | | | | |
| Unfavorable lease intangibles | | Revenue from real estate owned operations | | | | | | | 365 | | | 365 | |
KKR Real Estate Finance Trust Inc.
Notes to Consolidated Financial Statements
(amount in tables in thousands, except per share amounts)
The following table presents the amortization of lease intangibles related to REO, held for investment for each of the succeeding fiscal years:
| | | | | | | | | | | | | | | | |
| Year | | In-place Lease Intangible Assets | | | | Unfavorable Lease Intangible Liabilities |
| | | | | | |
| 2024 | | 67 | | | | | 365 | |
| 2025 | | 67 | | | | | 365 | |
| 2026 | | 67 | | | | | 365 | |
| | | | | | |
| | | | | | |
| | | | | | |
Future Minimum Lease Payments — The following table presents the future minimum lease payments to be collected under non-cancelable operating leases, excluding tenant reimbursements of expenses:
| | | | | | | | |
| Year | | Contractual
Lease Payments |
| | |
| 2024 | | 11,731 | |
| 2025 | | 8,030 | |
| 2026 | | 6,211 | |
| 2027 | | 4,618 | |
| 2028 | | 3,237 | |
| Thereafter | | 5,067 | |
KKR Real Estate Finance Trust Inc.
Notes to Consolidated Financial Statements
(dollarsamount in tables in thousands, except per share amounts)
Note 5. Debt Obligations
The following table summarizes KREF's secured master repurchase agreements and other financing arrangements in place as of December 31, 20212023 and 2020:2022:
| | | | | | | | | | | | | | | | | | | | | | | | | | | | | | | | | | | | | | | | | | | | | | | | | | | | | | | | | | | | | | |
| | December 31, 2023 | | | | December 31, 2022 |
| | Facility | | | | Collateral | | | | Facility |
| | Current Maturity | | Final Stated Maturity(A) | | Maximum Facility Size | | Outstanding Principal | | Carrying Value(B) | | Weighted Average Funding Cost(C) | | | | Outstanding Principal | | | | Carrying Value | | | | Carrying Value(B) |
Master Repurchase Agreements(D) |
| Wells Fargo | | Sep 2024 | | Sep 2026 | | $ | 1,000,000 | | | $ | 646,559 | | | $ | 645,091 | | | 7.1 | % | | | | $ | 981,708 | | | | | $ | 891,969 | | | | | $ | 670,824 | |
| Morgan Stanley | | Mar 2026 | | Mar 2026 | | 600,000 | | | 483,339 | | | 483,055 | | | 7.6 | | | | | 730,304 | | | | | 684,371 | | | | | 593,136 | |
| Goldman Sachs | | Dec 2025 | | Dec 2027 | | 400,000 | | | 347,329 | | | 346,464 | | | 8.2 | | | | | 519,711 | | | | | 513,900 | | | | | 168,369 | |
| Term Loan Facility |
KREF Lending VII(E) | | Match-term | | Match-term | | 1,000,000 | | | 561,377 | | | 560,945 | | | 7.3 | | | | | 718,739 | | | | | 709,760 | | | | | 630,757 | |
| Term Lending Agreements |
| KREF Lending IX | | Match-term | | Match-term | | 1,000,000 | | | 696,605 | | | 693,458 | | | 7.7 | | | | | 872,516 | | | | | 862,127 | | | | | 719,000 | |
| KREF Lending V | | Jun 2024 | | Jun 2026 | | 327,399 | | | 327,399 | | | 327,163 | | | 7.5 | | | | | 459,844 | | | | | 441,846 | | | | | 502,539 | |
| KREF Lending XII | | Match-term | | Match-term | | 350,000 | | | 166,771 | | | 166,308 | | | 7.2 | | | | | 225,470 | | | | | 223,442 | | | | | 159,784 | |
| BMO Facility | | Match-term | | Match-term | | 300,000 | | | 138,615 | | | 137,752 | | | 7.4 | | | | | 179,601 | | | | | 178,557 | | | | | 137,170 | |
| Warehouse Facility |
| HSBC Facility | | Mar 2026 | | Mar 2026 | | 500,000 | | | — | | | (11) | | | — | | | | | — | | | | | — | | | | | — | |
| Asset Specific Financing |
| KREF Lending XIII | | Aug 2026 | | Aug 2027 | | 265,625 | | | 166,072 | | | 163,836 | | | 8.7 | | | | | 195,379 | | | | | 193,123 | | | | | 69,777 | |
| KREF Lending XIV | | Oct 2026 | | Oct 2027 | | 125,000 | | | — | | | (1,216) | | | — | | | | | — | | | | | (999) | | | | | (1,655) | |
| KREF Lending XI | | Sep 2024 | | Sep 2026 | | 100,000 | | | 100,000 | | | 99,574 | | | 8.7 | | | | | 125,000 | | | | | 123,947 | | | | | 98,990 | |
| Revolving Credit Agreement |
Revolver(F) | | Mar 2027 | | Mar 2027 | | 610,000 | | | 160,000 | | | 160,000 | | | 7.5 | | | | | n.a. | | | | n.a. | | | | — | |
| Total / Weighted Average | | | | | $ | 6,578,024 | | | $ | 3,794,066 | | | $ | 3,782,419 | | | 7.6 | % | | | | | | | | | | | | $ | 3,748,691 | |
| | | | | | | | | | | | | | | | | | | | | | | | | | | | | | | | | | | | | | | | | | | | | | | | | | | | | | | | | | | | | | | | | | | | | | | | | | |
| | December 31, 2021 | | December 31, 2020 |
| | Facility | | Collateral | | Facility |
| | Month Issued | | Maximum Facility Size | | Outstanding Principal | | Carrying Value(A) | | Final Stated Maturity | | Weighted Average Funding Cost(B) | | Weighted Average Life (Years)(B) | | Outstanding Principal | | Amortized Cost Basis | | Carrying Value | | Weighted Average Life (Years)(C) | | Carrying Value(A) |
Master Repurchase Agreements(D) |
Wells Fargo(E) | | Oct 2015 | | $ | 1,000,000 | | | $ | 980,593 | | | $ | 978,615 | | | Sep 2026 | | 1.6 | % | | 3.4 | | $ | 1,395,703 | | | $ | 1,378,878 | | | $ | 1,375,919 | | | 4.7 | | $ | 443,745 | |
Morgan Stanley(F) | | Dec 2016 | | 600,000 | | | 383,592 | | | 382,081 | | | Dec 2023 | | 2.5 | | | 0.8 | | 552,313 | | | 547,940 | | | 538,676 | | | 3.6 | | 148,772 | |
Goldman Sachs(G) | | Sep 2016 | | 240,000 | | | 190,623 | | | 189,456 | | | Oct 2023 | | 2.8 | | | 1.7 | | 282,026 | | | 277,300 | | | 276,838 | | | 4.2 | | 76,163 | |
| Term Lending Agreements |
KREF Lending V(H) | | Jun 2019 | | 671,625 | | | 617,627 | | | 617,185 | | | Jun 2026 | | 2.1 | | | 0.5 | | 755,701 | | | 754,546 | | | 752,443 | | | 2.0 | | 899,363 | |
KREF Lending IX(I) | | Jul 2021 | | 500,000 | | | 500,000 | | | 493,853 | | | n.a | | 2.3 | | | 3.2 | | 621,573 | | | 616,248 | | | 614,983 | | | 4.8 | | — | |
| Warehouse Facility |
HSBC Facility(J) | | Mar 2020 | | 500,000 | | | — | | | (55) | | | Mar 2023 | | — | | | 1.2 | | — | | | — | | | — | | | n.a | | (353) | |
| Asset Specific Financing |
BMO Facility(K) | | Aug 2018 | | 300,000 | | | 60,000 | | | 60,000 | | | n.a | | 1.8 | | | 0.2 | | 76,000 | | | 75,977 | | | 75,855 | | | 2.1 | | 59,795 | |
| Revolving Credit Agreement |
Revolver(L) | | Dec 2018 | | 335,000 | | | 135,000 | | | 135,000 | | | Dec 2023 | | 2.3 | | | 1.9 | | n.a | | n.a | | n.a | | n.a | | — | |
| Total / Weighted Average | | $ | 4,146,625 | | | $ | 2,867,435 | | | $ | 2,856,135 | | | | | 2.1 | % | | 2.1 | | | | | | | | | | $ | 1,627,485 | |
(A)(B) Net of $11.3$11.6 million and $5.6$22.0 million unamortized debt issuancedeferred financing costs as of December 31, 20212023 and 2020,2022, respectively.
(B) Average weighted by the outstanding principal of borrowings. Funding cost includes(C) Including deferred financing costs.
(C)costs and applicable index in effect as of December 31, 2023. Average based on the fully extended loan maturity, weighted by the outstanding principal of the collateral.
(D) Borrowings under these repurchase agreements are collateralized by senior loans, held-for-investment, and bear interest equal to the sum of (i) a floating rate index, equal to one-month LIBOR, or an index approximating LIBOR,Term SOFR, and (ii) a margin, based on the collateral.financing spread. As of December 31, 20212023 and 2020,2022, the percentage of the outstanding principal of the collateral sold and not borrowed under these repurchase agreements, or average "haircut" weighted by outstanding principal of collateral, wawas 33.8% ans 30.3% and 36.7%d 31.5%, respectively (or 25.9%32.2% and 34.8%25.6%, respectively, if KREF had borrowed the maximum amount approved by its repurchase agreement counterparties as of such dates).
(E) In September 2021, the current stated maturity date was amended to September 2024, which does not reflect 2, twelve-monthThe term loan facility term extensions available to KREF, which is contingent upon certain covenants and thresholds. As of December 31, 2021, the collateral-based margin was between 1.25% and 1.55%.
(F) In December 2021, the current stated maturity was extended to December 2022, with one-year extension option upon KREF giving written notice and another 2 one-year extension periods subject to approval by Morgan Stanley. In addition, KREF has the option to increase the facility amount to $750.0 million. As of December 31, 2021, the collateral-based margin was between 1.65% and 2.35%.
(G) In October 2021, the current stated maturity date was amended to October 2022. In addition, KREF has the option to extend the maturity date to October 31, 2023, subject to the satisfaction of certain conditions. As of December 31, 2021, the collateral-base margin was between 1.75% and 3.20%.
(H) In June 2019, KREF, through its wholly–owned subsidiary KREF Lending V LLC, entered into a Master Repurchase and Securities Contract Agreement ("KREF Lending V Facility") with Morgan Stanley Mortgage Capital Holdings LLC ("Administrative Agent"), as administrative agent on behalf of Morgan Stanley Bank, N.A. ("Initial Buyer"), which provides non-mark-to-market financing. The Initial Buyer subsequently syndicated a portion of the facility to multiple financial institutions. As of December 31, 2021, the Initial Buyer held 24.4% of the total commitment under the facility. Borrowings under the facility are collateralized by certain loans, held for investment, and bear interest equal to one-month LIBOR, plus a 1.90% margin. In March 2021, the current stated maturity was extended to June 2022, subject to 4 additional one-year extension options, which may be exercised by KREF upon the satisfaction of certain customary conditions and thresholds.
(I) In July 2021, KREF, through its wholly–owned subsidiary KREF Lending IX LLC, entered into a $500.0 million Master Repurchase and Securities Contract Agreement with a financial institution ("KREF Lending IX Facility"). The facility, which providesasset-based financing on a non-mark-to-market basis with partial recourse to KREF, has a three-year draw period and matched term to the underlying loans. As of December 31, 2021, the collateral-based margin was between 1.65% and 1.75%.
(J) In March 2020, KREF entered into a $500.0 million Loan and Security Agreement with HSBC Bank USA, National Association (“HSBC Facility”). The facility, which matures in March 2023, provides warehouse financing on a non-mark-to-market basis with partial recourse to KREF.
(K) In August 2018, KREF entered into a $200.0 million loan financing facility with BMO Harris Bank ("BMO Facility"). The facility provides asset-based financing on a non-mark to market basis with matched-termmatch-term up to five years, with partial recourseadditional two-year extension available to KREF. During May 2019, KREF increased the borrowing capacity to $300.0 million.
(F) As of December 31, 2021,2023, the collateral-based margin was 1.70%.
(L) In December 2018, KREF entered into a $100.0 million corporate revolving credit facility (“Revolver”) administered by Morgan Stanley Senior Funding, Inc. Additional lenders were added in 2019 and 2020, further increasing the borrowing capacity under the Revolver to $335.0 million as of December 31, 2021. The current stated maturity of the facility is December 2023. Borrowings under the facility bear interest at a per annum rate equal to the sum of (i) a floating rate index and (ii) a fixed margin. Borrowings under this facility are full recourse to certain guarantor wholly-owned subsidiaries of KREF. As of December 31, 2021, therevolver carrying value excluded $1.7$3.7 million unamortized debt issuance costs presented within "Other assets" on KREF's Consolidated Balance Sheets.
KKR Real Estate Finance Trust Inc.
Notes to Consolidated Financial Statements
(dollars in tables in thousands, except per share amounts)
As of December 31, 20212023 and 2020,2022, KREF had outstanding repurchase agreements and term lending agreements where the amount at risk with any individual counterparty, or group of related counterparties, exceeded 10.0% of KREF’s stockholders' equity. The amount at risk under these agreements is the net counterparty exposure, defined as the excess of the carrying amount (or market value, if higher than the carrying amount, for repurchase agreements) of the assets sold under agreement to repurchase, including accrued interest plus any cash or other assets on deposit to secure the repurchase obligation, over the amount of the repurchase liability, adjusted for accrued interest.
KKR Real Estate Finance Trust Inc.
Notes to Consolidated Financial Statements
(amount in tables in thousands, except per share amounts)
The following table summarizes certain characteristics of KREF's repurchase agreements where the amount at risk with any individual counterparty, or group of related counterparties, exceeded 10.0% of KREF’s stockholders' equity as of December 31, 20212023 and 2020:2022:
| | | Outstanding Principal | | Net Counterparty Exposure | | Percent of Stockholders' Equity | | Weighted Average Life (Years)(A) |
| December 31, 2021 | | | | | | | | |
| | Outstanding Principal | | | | Outstanding Principal | | Net Counterparty Exposure | | Percent of Stockholders' Equity | | Weighted Average Life (Years)(A) |
| December 31, 2023 | |
| Wells Fargo | |
| Wells Fargo | |
| Wells Fargo | Wells Fargo | | $ | 980,593 | | | $ | 409,489 | | | 30.1 | % | | 3.4 | | $ | 646,559 | | | $ | | $ | 248,891 | | | 17.7 | | 17.7 | % | | 2.7 |
| Morgan Stanley | Morgan Stanley | | 383,592 | | | 166,426 | | | 12.2 | | | 0.8 | Morgan Stanley | | 483,339 | | | 203,080 | | 203,080 | | | 14.5 | | 14.5 | | | 1.6 | | 1.6 |
| KREF Lending IX | | KREF Lending IX | | 696,605 | | | 172,462 | | | 12.3 | | | 3.1 |
| Goldman Sachs | | Goldman Sachs | | 347,329 | | | 170,236 | | | 12.1 | | | 2.9 |
| Total / Weighted Average | | Total / Weighted Average | | $ | 2,173,832 | | | $ | 794,669 | | | 56.6 | % | | 2.6 |
| December 31, 2022 | |
| Wells Fargo | |
| Wells Fargo | |
| Wells Fargo | | | $ | 672,556 | | | $ | 240,897 | | | 15.3 | % | | 2.5 |
| Morgan Stanley | | Morgan Stanley | | 594,537 | | | 199,485 | | | 12.7 | | | 0.8 |
| Goldman Sachs | | Goldman Sachs | | 169,073 | | | 190,917 | | | 12.1 | | | 2.1 |
KREF Lending V(B) | KREF Lending V(B) | | 617,627 | | | 139,149 | | | 10.2 | | | 0.5 | KREF Lending V(B) | | 502,878 | | | 182,774 | | 182,774 | | | 11.6 | | 11.6 | | | 0.3 | | 0.3 |
| KREF Lending IX | | KREF Lending IX | | 727,472 | | | 177,358 | | | 11.3 | | | 2.2 |
| Total / Weighted Average | Total / Weighted Average | | $ | 1,981,812 | | | $ | 715,064 | | | 52.5 | % | | 2.0 | Total / Weighted Average | | $ | 2,666,516 | | | $ | | $ | 991,431 | | | 63.0 | | 63.0 | % | | 1.6 |
| December 31, 2020 | | | | | | | | |
| Wells Fargo | | $ | 446,208 | | | $ | 196,715 | | | 18.9 | % | | 2.0 |
KREF Lending V(B) | | 900,000 | | | 214,135 | | | 20.5 | | | 1.5 |
| Total / Weighted Average | | $ | 1,346,208 | | | $ | 410,850 | | | 39.4 | % | | 1.7 |
(A) Average weighted by the outstanding principal of borrowings under the secured financing agreement.
(B) There were multiple counterparties to the KREF Lending V Facility. Morgan Stanley Bank, N.A. represented 2.5%2.8% and 4.6% of the net counterparty exposure as a percent of stockholders' equity as of December 31, 2021 and 2020, respectively.2022.
Debt obligations included in the tables above are obligations of KREF’s consolidated subsidiaries, which own the related collateral, and such collateral is generally not available to other creditors of KREF.
While KREF is generally not required to post margin under certain repurchase agreement terms for changes in general capital market conditions such as changes in credit spreads or interest rates, KREF may be required to post margin for changes in conditions to specific loans that serve as collateral for those repurchase agreements. Such changes may include declines in the appraised value of property that secures a loan or a negative change in the borrower's ability or willingness to repay a loan. To the extent that KREF is required to post margin, KREF's liquidity could be significantly impacted. Both KREF and its lenders work cooperatively to monitor the performance of the properties and operations related to KREF's loan investments to mitigate investment-specific credit risks. Additionally, KREF incorporates terms in the loans it originates to further mitigate risks related to loan nonperformance.
Term LoanActivity — For the years ended December 31, 2023 and 2022, the activity related to the carrying value of KREF’s secured financing agreements were as follows:
| | | | | | | | |
| | Secured Financing Agreements, Net |
| Balance as of December 31, 2021 | | $ | 3,726,593 | |
| Principal borrowings | | 2,483,907 | |
| Principal repayments/sales | | (2,451,099) | |
| Deferred debt issuance costs | | (22,181) | |
| Amortization of deferred debt issuance costs | | 11,471 | |
| Balance as of December 31, 2022 | | $ | 3,748,691 | |
| Principal borrowings | | 811,119 | |
| Principal repayments/sales | | (787,754) | |
| Deferred debt issuance costs | | (4,889) | |
| Amortization of deferred debt issuance costs | | 15,252 | |
| Balance as of December 31, 2023 | | $ | 3,782,419 | |
In April 2018, KREF, through its consolidated subsidiaries, entered into a term loan financing agreement (“Term Loan Facility”) with third party lenders for an initial borrowing capacity of $200.0 million that was subsequently increased to $1.0 billion in October 2018. The facility provides asset-based financing on a non-mark-to-market basis with matched term up to five years and is non-recourse to KREF. Borrowings under the facility are collateralized by senior loans, held-for-investment, and bear interest equal to one-month LIBOR plus a margin. The weighted average margin on the facility was 1.6% as of December 31, 2021 and 2020.
The following tables summarize our borrowings under the Term Loan Facility:
| | | | | | | | | | | | | | | | | | | | | | | | | | | | | | | | | | | | | | | | | | | | |
| | December 31, 2021 |
| Term Loan Facility | | Count | | Outstanding Principal | | Amortized Cost | | Carrying Value | | Wtd. Avg. Yield/Cost(A) | | Guarantee(B) | | Wtd. Avg. Term(C) |
| Collateral assets | | 12 | | $ | 1,078,795 | | | $ | 1,076,241 | | | $ | 1,074,116 | | | L + 3.4% | | n.a. | | August 2024 |
| Financing provided | | n.a. | | 870,458 | | | 870,458 | | | 870,458 | | | L + 1.6% | | n.a. | | August 2024 |
KKR Real Estate Finance Trust Inc.
Notes to Consolidated Financial Statements
(dollarsamount in tables in thousands, except per share amounts)
| | | | | | | | | | | | | | | | | | | | | | | | | | | | | | | | | | | | | | | | | | | | |
| | December 31, 2020 |
| Term Loan Facility | | Count | | Outstanding Principal | | Amortized Cost | | Carrying Value | | Wtd. Avg. Yield/Cost(A) | | Guarantee(B) | | Wtd. Avg. Term(C) |
| Collateral assets | | 13 | | $ | 1,155,378 | | | $ | 1,151,144 | | | $ | 1,147,517 | | | L + 3.0% | | n.a. | | January 2024 |
| Financing provided | | n.a. | | 948,204 | | | 947,262 | | | 947,262 | | | L + 1.9% | | n.a. | | January 2024 |
(A) Floating rate loans and related liabilities are indexed to one-month LIBOR. KREF's net interest rate exposure is in direct proportion to its interest in the net assets indexed to that rate. In addition to cash coupon, yield/cost includes the amortization of deferred origination/financing costs.
(B) Financing under the Term Loan Facility is non-recourse to KREF.
(C) The weighted-average term is determined using the maximum maturity date of the corresponding loans, assuming all extension options are exercised by the borrower.
Activity — For the years ended December 31, 2021 and 2020, the activity related to the carrying value of KREF’s secured financing agreements were as follows:
| | | | | | | | |
| | Secured Financing Agreements, Net |
Balance as of December 31, 2019 | | $ | 2,884,887 | |
Principal borrowings | | 1,015,430 | |
Principal repayments/sales | | (1,332,822) | |
Deferred debt issuance costs | | (5,505) | |
Amortization of deferred debt issuance costs | | 12,757 | |
Balance as of December 31, 2020 | | $ | 2,574,747 | |
Principal borrowings | | 3,641,992 | |
Principal repayments/sales | | (2,485,423) | |
Deferred debt issuance costs | | (13,929) | |
Amortization of deferred debt issuance costs | | 9,206 | |
Balance as of December 31, 2021 | | $ | 3,726,593 | |
Maturities — KREF’s secured financing agreements, term loan financingfacility and other consolidated debt obligations in place as of December 31, 20212023 had contractual maturities as follows:
| | Year | Year | | Nonrecourse | | Recourse(A) | | Total | Year | | Nonrecourse(A) | | Recourse(A)(B) | | Total |
| 2022 | | 1,337,992 | | | 270,181 | | | 1,608,173 | |
| 2023 | | 319,047 | | | 192,140 | | | 511,187 | |
| 2024 | 2024 | | 567,275 | | | 135,893 | | | 703,168 | |
| 2025 | 2025 | | 427,209 | | | 142,403 | | | 569,612 | |
| 2026 | |
| 2027 | |
| Thereafter | Thereafter | | 268,261 | | | 77,492 | | | 345,753 | |
| $ | 2,919,784 | | | $ | 818,109 | | | $ | 3,737,893 | |
| | $ | |
(A) Represents the earlier of (i) the maximum maturity of the underlying loans pledged as collateral or (ii) the maximum maturity of the respective financing agreements.
(B) Except for the Revolver, which is full recourse, amounts borrowed are subject to a maximum 25.0% recourse limit. The Revolver expiresmatures in December 2023.March 2027.
Covenants — KREF is required to comply with customary loan covenants and event of default provisions related to its secured financing agreements and Revolver, including, but not limited to, negative covenants relating to restrictions on operations with respect to KREF’s status as a REIT, and financial covenants. Such financial covenants include ana trailing four quarter interest income to interest expense ratio covenant (1.5(1.4 to 1.0); a minimum consolidated tangible net worth covenant (75.0% of the aggregate cash proceeds of any equity issuances made and any capital contributions received by KREF and certain subsidiaries, or up to approximately $1,095.4$1,307.7 million depending upon the facility); a cash liquidity covenant (the greater of $10.0 million or 5.0% of KREF's recourse indebtedness); and a total indebtedness covenant (83.3% of KREF's Total Assets, as defined in the applicable financing agreements). As of December 31, 20212023 and 2020,2022, KREF was in compliance with its financial debt covenants.
KKR Real Estate Finance Trust Inc.
Notes to Consolidated Financial Statements
(dollarsamount in tables in thousands, except per share amounts)
Note 6. Collateralized Loan Obligations
In November 2018, KREF financed a pool of loan participations from its existing loan portfolio through a managed CLO ("KREF 2018-FL1"). KREF 2018-FL1 provided KREF with match-term financing on a non-mark-to-market and non-recourse basis. In August 2021, KREF fully repaid its outstanding CLO notes under KREF 2018-FL1.
In August 2021, KREF financed a pool of loan participations from its existing loan portfolio through a managed CLO ("KREF 2021-FL2"). KREF 2021-FL2 provides KREF with match-term financing on a non-mark-to-market and non-recourse basis. KREF 2021-FL2 has a two-year reinvestment feature that allows principal proceeds of the collateral assets to be reinvested in qualifying replacement assets, subject to the satisfaction of certain conditions set forth in the indenture. Upon the execution of the KREF 2021-FL2, KREF recorded $8.9 million in issuance costs, inclusive of $0.9 million in structuring and placement agent fees paid to KKR Capital Markets LLC ("KCM"), an affiliate of KREF.
In February 2022, KREF financed a pool of loan participations from its existing multifamily loan portfolio through a managed CLO ("KREF 2022-FL3"). KREF 2022-FL3 provides KREF with match-term financing on a non-mark-to-market and non-recourse basis and has a two-year reinvestment feature. Upon the execution of the KREF 2022-FL3, KREF recorded $7.4 million in issuance costs, inclusive of $0.5 million in structuring and placement agent fees paid to KCM.
The CLO issuance costs are netted against the outstanding principal balance of the CLO notes in "Collateralized loan obligations, net" in the condensed consolidated balance sheets.Consolidated Balance Sheets.
The following tables outline CLO collateral assets and respective borrowing as of December 31, 20212023 and 2020:2022:
| | | | | | | | | | | | | | | | | | | | | | | | | | | | | | | | | | | | | | |
| | December 31, 2023 |
| | Count | | Outstanding Principal | | Amortized Cost | | Carrying Value | | Wtd. Avg. Yield/Cost(A) | | Wtd. Avg. Term(B) |
| KREF 2021-FL2 | | | | | | | | | | | | |
Collateral assets(C) | | 18 | | $ | 1,300,000 | | | $ | 1,300,000 | | | $ | 1,288,464 | | | S + 3.1% | | July 2026 |
| Financing provided | | 1 | | 1,095,250 | | | 1,095,128 | | | 1,095,128 | | | S + 1.5% | | February 2039 |
| KREF 2022-FL3 | | | | | | | | | | | | |
Collateral assets(C)(D) | | 16 | | $ | 1,000,000 | | | $ | 1,000,000 | | | $ | 990,320 | | | S + 3.0% | | September 2026 |
| Financing provided | | 1 | | 847,500 | | | 847,043 | | | 847,043 | | | S + 2.2% | | February 2039 |
| | | | | | | | | | | | | | | | | | | | | | | | | | | | | | | | | | | | | | |
| | December 31, 2021 |
| KREF 2021-FL2 | | Count | | Outstanding Principal | | Amortized Cost | | Carrying Value | | Wtd. Avg. Yield/Cost | | Wtd. Avg. Term(B) |
Collateral assets(A) | | 20 | | $ | 1,300,000 | | | $ | 1,300,000 | | | $ | 1,296,745 | | | L + 3.4% | | June 2025 |
| Financing provided | | 1 | | 1,095,250 | | | 1,087,976 | | | 1,087,976 | | | L + 1.7% | | February 2039 |
| | | December 31, 2022 | | | | December 31, 2022 |
| | December 31, 2020 | | | Count | | Outstanding Principal | | Amortized Cost | | Carrying Value | | Wtd. Avg. Yield/Cost(A) | | Wtd. Avg. Term(B) |
| KREF 2018-FL1 | | Count | | Outstanding Principal | | Amortized Cost | | Carrying Value | | Wtd. Avg. Yield/Cost | | Wtd. Avg. Term(B) |
| KREF 2021-FL2 | |
Collateral assets(A)(D) | |
Collateral assets(A)(D) | |
Collateral assets(A)(D) | Collateral assets(A)(D) | | 21 | | $ | 1,000,000 | | | $ | 1,000,000 | | | $ | 997,336 | | | L + 2.9% | | March 2024 | | 17 | | $ | 1,300,000 | | | $ | | $ | 1,300,000 | | | $ | | $ | 1,283,162 | | | + 3.3% | | + 3.3% | | April 2026 |
| Financing provided | Financing provided | | 1 | | 810,000 | | | 810,000 | | | 810,000 | | | L + 1.4% | | June 2036 | Financing provided | | 1 | | 1,095,250 | | | 1,092,332 | | 1,092,332 | | | 1,092,332 | | 1,092,332 | | | L + 1.7% | | L + 1.7% | | February 2039 |
| KREF 2022-FL3 | |
Collateral assets(C) | |
Collateral assets(C) | |
Collateral assets(C) | | | 16 | | $ | 1,000,000 | | | $ | 1,000,000 | | | $ | 991,452 | | | + 3.1% | | October 2026 |
| Financing provided | | Financing provided | | 1 | | 847,500 | | | 843,260 | | | 843,260 | | | S + 2.2% | | February 2039 |
(A) Including $54.0 million cash held in CLOExpressed as a spread over the relevant benchmark rates, which include one-month Term SOFR and LIBOR, as applicable to each loan. As of December 31, 2021. Collateral2023, 100.0% of the CLO collateral loan assets represent 19.6% and 20.5%by principal balance earned a floating rate of the principal of KREF's commercial real estate loans as of December 31, 2021 and 2020, respectively.interest indexed to Term SOFR. As of December 31, 20212022, 64.1% and 2020, 100%35.9% of KREF loans financed through the CLOs are CLO collateral loan assets by principal balance earned a floating rate loans.of interest indexed to one-month Term SOFR and LIBOR, respectively. In addition to cash coupon, yield/cost includes the amortization of deferred origination/financing costs.
(B) Loan term represents weighted-average final maturity, assuming all extension options are exercised by the borrower.borrowers, weighted by outstanding principal. Repayments of CLO notes are dependent on timing of relatedunderlying collateral loan asset repayments post reinvestment period. The term of the CLO notes represents the rated final distribution date.
The following table presentsent 31.0% and 28.4% of the CLO Assetsprincipal of KREF's commercial real estate loans as of December 31, 2023 and Liabilities included in KREF’s Consolidated Balance Sheets:
2022, respectively. As of December 31, 2023 and 2022,
| | | | | | | | | | | | | | |
| | KREF 2021-FL2 | | KREF 2018-FL1 |
| Assets | | December 31, 2021 | | December 31, 2020 |
| Cash | | $ | 54,000 | | | $ | — | |
| Commercial real estate loans, held-for-investment | | 1,246,000 | | | 1,000,483 | |
| Less: Allowance for credit losses | | (3,255) | | | (2,669) | |
| Commercial real estate loans, held-for-investment, net | | 1,242,745 | | | 997,814 | |
| Accrued interest receivable | | 3,091 | | | 3,075 | |
| Other assets | | 766 | | | 5 | |
| Total | | $ | 1,300,602 | | | $ | 1,000,894 | |
| Liabilities | | | | |
Collateralized loan obligations, net(A) | | $ | 1,087,976 | | | $ | 810,000 | |
| Accrued interest payable | | 852 | | | 668 | |
| Accounts payable, accrued expenses and other liabilities | | — | | | 72 | |
| Total | | $ | 1,088,828 | | | $ | 810,740 | |
(A) Unamortized deferred financing costs related to KREF(D) Including $5.0 million cash held in CLO 2022-FL3 as of December 31, 2023. Including $151.0 million cash held in CLO 2021-FL2 were $7.3 million as of December 31, 2021. 2022Deferred financing costs related to KREF 2018-FL1 were fully amortized as of December 31, 2020..
KKR Real Estate Finance Trust Inc.
Notes to Consolidated Financial Statements
(dollarsamount in tables in thousands, except per share amounts)
The following table presents the CLO assets and liabilities included in KREF’s Consolidated Balance Sheets:
| | | | | | | | | | | | | | |
| Assets | | December 31, 2023 | | December 31, 2022 |
| Cash | | $ | 5,000 | | | $ | 151,000 | |
| Commercial real estate loans, held-for-investment | | 2,295,000 | | | 2,149,000 | |
| Less: Allowance for credit losses | | (21,216) | | | (25,387) | |
| Commercial real estate loans, held-for-investment, net | | 2,273,784 | | | 2,123,613 | |
| Accrued interest receivable | | 12,653 | | | 10,693 | |
| Other assets | | 155 | | | 155 | |
| Total | | $ | 2,291,592 | | | $ | 2,285,461 | |
| Liabilities | | | | |
| Collateralized loan obligations | | $ | 1,942,750 | | | $ | 1,942,750 | |
| Deferred financing costs | | (579) | | | (7,158) | |
| Collateralized loan obligations, net | | $ | 1,942,171 | | | $ | 1,935,592 | |
| Accrued interest payable | | 5,666 | | | 4,442 | |
| | | | |
| Total | | $ | 1,947,837 | | | $ | 1,940,034 | |
The following table presents the components of net interest income of CLOs included in KREF’s Consolidated Statements of Income:
| | | For the Year Ended December 31, |
| | 2021 | | 2020 |
| Net Interest Income | | | | | |
| | | | | | | | For the Year Ended December 31, | |
| | | | | | | | For the Year Ended December 31, | |
| | | | | | | | For the Year Ended December 31, | |
| | | | | | | | | | 2023 | | | | | | | | | | | | 2023 | | 2022 |
| Interest income | Interest income | | | $ | 48,296 | | | $ | 45,617 | |
Interest expense(A) | Interest expense(A) | | | 14,876 | | | 22,723 | |
| Net interest income | Net interest income | | | $ | 33,420 | | | $ | 22,894 | |
(A) Net of interest expenses on internally held CLO notes. IncludIncluesdes $1.77.2 million and $7.9 million and $6.8 million ofof deferred financing costs amortization for the years ended December 31, 20212023 and 2022, respectively.
2020, respectively.
KKR Real Estate Finance Trust Inc.
Notes to Consolidated Financial Statements
(dollarsamount in tables in thousands, except per share amounts)
Note 7. Secured Term Loan, Net
In September 2020, KREF entered into a $300.0 million secured term loan at a price of 97.5%, which bearsinitially bore interest at a per annum rate equal to LIBOR plus a 4.75% margin, subject to a 1.0% LIBOR floor, payable quarterly beginning in December 2020. The secured term loan is partially amortizing, with an amount equal to 1.0% per annum of the principal balance due in quarterly installments starting March 31, 2021. The secured term loan matures on September 1, 2027 and contains restrictions relating to liens, asset sales, indebtedness, investments and transactions with affiliates. The secured term loan is secured by KREF level guarantees and does not include asset-based collateral. Upon the execution of the secured term loan, KREF recorded a $7.5 million issuance discount and $5.1 million in issuance costs, inclusive of $1.1 million in arrangement and structuring fees paid to KCM.
In November 2021, KREF completed the repricing of a $297.8 million then existingthen-existing secured term loan and a $52.2 million add-on, for an aggregate principal amount of $350.0 million due September 2027, which was issued at par. The upsize of the secured term loan was accounted for as partial debt extinguishment under GAAP, accordingly, KREF recognized an accelerated deferred loan financing cost of $0.7 million during the year ended December 31,fourth quarter of 2021. The new secured term loan bearsbore interest at LIBOR plus 3.5% and is, subject to a 0.5% LIBOR floor of 0.5%.floor. KREF recorded $2.0 million in issuance costs, inclusive of $0.8 million in arrangement and structuring fees paid to KCM.
In June 2023, KREF transitioned the secured term loan from LIBOR to Term SOFR. Inclusive of the amortization of the discount and issuance costs, KREF’s total cost of the secured term loan is LIBORAdjusted Term SOFR, as defined in the secured term loan agreements, plus a 4.1% margin per annum, subject to the applicable LIBORSOFR floor, as of December 31, 2021. 2023.
The following table summarizes KREF’s secured term loan at December 31, 2021:2023 and 2022, respectively:
| | | | | | | | |
| | December 31, 2021 |
Principal amount | | $ | 350,000 | |
Unamortized discount | | (5,652) | |
Deferred financing costs | | (5,799) | |
Carrying amount | | $ | 338,549 | |
| | | | | | | | | | | | | | |
| | December 31, 2023 | | December 31, 2022 |
| Principal | | $ | 343,000 | | | $ | 346,500 | |
| Deferred financing costs | | (4,010) | | | (5,016) | |
| Unamortized discount | | (3,659) | | | (4,656) | |
| Carrying value | | $ | 335,331 | | | $ | 336,828 | |
Covenants — KREF is required to comply with customary loan covenants and event of default provisions related to its secured term loan that include, but are not limited to, negative covenants relating to restrictions on operations with respect to KREF’s status as a REIT, and financial covenants. Such financial covenants include a minimum consolidated tangible net worth of $650.0 million and a maximum Total Debt to Total Assets ratio, as defined in the secured term loan agreements, of 83.3% (the “Leverage Covenant”). KREF was in compliance with such covenants as of December 31, 20212023 and 2020.2022.
KKR Real Estate Finance Trust Inc.
Notes to Consolidated Financial Statements
(dollarsamount in tables in thousands, except per share amounts)
Note 8. Convertible Notes, Net
In May 2018, KREF issued $143.75 million of the Convertible Notes which bear interest at a fixed interest rate of 6.125% per year, payable semi-annually in arrears on May 15 and November 15 of each year, beginning on November 15, 2018. The Convertible Notes maturematured on May 15, 2023, unless earlier repurchased or converted.2023. The Convertible Notes’ issuance costs of $5.1 million arewas amortized through interest expense over the life of the Convertible Notes.
The initial conversion rate for the Convertible Notes is 43.9386 shares of KREF’s common stock per $1,000entire $143.75 million principal amount of Notes, which is equivalent to an initial conversion price of approximately $22.76 per share of KREF’s common stock, which represents a 10% conversion premium over the last reported sale price of $20.69 per share of KREF’s common stock on the New York Stock Exchange on May 15, 2018. The conversion rate is subject to adjustment under certain circumstances. In addition, upon a make-whole fundamental change as defined within the indenture governing the Convertible Notes, KREF will, under certain circumstances, increase the applicable conversion rate for a holder that elects to convert its Notes in connection with such make-whole fundamental change. Prior to February 15, 2023, the Convertible Notes will be convertible only upon satisfaction of certain conditions and during certain periods, and thereafter, at any time until the close of business on the second scheduled trading day immediately preceding the maturity date. KREF will satisfy any conversion elections by paying or delivering, as the case may be, cash, shares of KREF’s common stock or a combination of cash and shares of KREF’s common stock, at its election. KREF has the intent and ability to settle the Convertible Notes in cash and, as a result, the Convertible Notes did not have an impact on the diluted earnings per share.
Upon the issuancebalance of the Convertible Notes KREF recorded a $1.8 million discount basedmatured and was repaid in cash on May 15, 2023. As of December 31, 2023, there were no Convertible Notes outstanding.
The following table details the impliedcarrying value of the conversion option and an assumed effective interest rate of 6.50%, as well as $5.1 million of initial issuance costs, inclusive of $0.8 million paid to an affiliate of KREF. Inclusive of the amortization of this discount and the issuance costs, KREF’s total cost of the May 2018 Convertible Notes issuance is 6.92% per annum.on KREF's Consolidated Balance Sheets:
| | | | | | | | | | | | | | |
| | December 31, 2023 | | December 31, 2022 |
| Principal | | $ | — | | | $ | 143,750 | |
| Deferred financing costs | | — | | | (380) | |
| Unamortized discount | | — | | | (133) | |
| Carrying value | | $ | — | | | $ | 143,237 | |
The following table details the interest expense related to the Convertible Notes:
| | | | | | | | | | | | | | | | | | |
| | | | For the Year Ended December 31, |
| | | | | | 2021 | | 2020 |
| Cash coupon | | | | | | $ | 8,805 | | | $ | 8,805 | |
| Discount and issuance cost amortization | | | | | | 1,386 | | | 1,390 | |
| Total interest expense | | | | | | $ | 10,191 | | | $ | 10,195 | |
The following table details the net book value of the Convertible Notes on KREF's Consolidated Balance Sheets:
| | | | | | | | | | | | | | |
| | December 31, 2021 | | December 31, 2020 |
| Principal | | $ | 143,750 | | | $ | 143,750 | |
| Deferred financing costs | | (1,405) | | | (2,431) | |
| Unamortized discount | | (494) | | | (854) | |
| Net book value | | $ | 141,851 | | | $ | 140,465 | |
| | | | | | | | | | | | | | | | | | | | | | |
| | | | | | For the Year Ended December 31, |
| | | | | | | | | | 2023 | | 2022 |
| Cash coupon | | | | | | | | | | $ | 3,276 | | | $ | 8,805 | |
| Discount and issuance cost amortization | | | | | | | | | | 513 | | | 1,386 | |
| Total interest expense | | | | | | | | | | $ | 3,789 | | | $ | 10,191 | |
Accrued interest payable for the Convertible Notes was $1.1zero and $1.1 million as of December 31, 20212023 and 2020,2022, respectively. Refer to Note 2 for additional discussion of accounting policies for the Convertible Notes.
KKR Real Estate Finance Trust Inc.
Notes to Consolidated Financial Statements
(dollars in tables in thousands, except per share amounts)
Note 9. Loan Participations Sold
KREF finances certain loan investments through the syndication of a non-recourse, or limited-recourse, loan participations to unaffiliated third parties. In October 2019, KREF syndicated a $65.0 million vertical participation in one of its loan investments with a principal balance of $328.5 million to an unaffiliated third party, at par value. In June 2020, KREF increased the maximum loan amount by $6.5 million and syndicated additional $1.2 million vertical participation to the same third party. Such syndications did not qualify for "sale" accounting under GAAP and therefore were consolidated in KREF's consolidated financial statements as of December 31, 2020.
In September 2021, KREF fully repaid the $66.2 million vertical loan participation in connection with the payoff of the underlying loan.
During the years ended December 31, 2021 and 2020, KREF recorded $3.0 million and $2.9 million of interest income, respectively, and $3.0 million and $2.9 million of interest expense, respectively, related to the vertical loan participation sold.
KKR Real Estate Finance Trust Inc.
Notes to Consolidated Financial Statements
(dollarsamount in tables in thousands, except per share amounts)
Note 10.9. Variable Interest Entities
Collateralized Loan Obligations — KREF consolidates CLOs when it determines that the CLO issuers, wholly-owned subsidiaries of KREF, are VIEs and that KREF is the primary beneficiary of its consolidated CLOssuch VIEs (Note 6). Management considers the CLO Issuers, wholly-owned subsidiaries of KREF to be the primary beneficiary asof the CLO Issuers haveissuers as KREF has the ability to control the most significant activities of the CLO issuers, the obligation to absorb losses, and the right to receive benefits of the CLOCLOs through the subordinate interests the CLO Issuersissuers own.
Real Estate Owned Joint Venture — Concurrently with taking title to a Portland retail property in December 2021, KREF contributed a portion of KREF’s solethe REO asset KREF contributed the REO to a joint ventureREO JV with a third party local developer operator (“JV Partner”),Partner, whereby KREF has a 90% interest in the joint venture and the JV Partner has a 10% interest. Management determined the joint ventureREO JV to be a VIE as the joint ventureREO JV has insufficient equity-at-risk and concluded that KREF is the primary beneficiary of the joint ventureREO JV as KREF holds decision-making power over the activities that most significantly impact the economic performance of the joint ventureREO JV and has the obligation to absorb losses of, or the right to receive benefits from, the joint ventureREO JV that could be potentially significant to the joint venture. REO JV.
As of December 31, 2021,2023, the joint ventureREO JV held REO assets with a net carrying value of $68.9 million, of which $0.1 million represented non-controlling interests. The JV Partner’s non-controlling interests of $0.1 million as of December represents the JV Partner’s share of acquisition costs of the REO. $72.4 million. KREF has priority of distributions up to the acquisition date net fair value of the REO$78.1 million before the JV Partner can participate in the economics of the joint venture.REO JV.
Equity method investmentsMethod Investments —
As of December 31, 2021,2023, KREF held a 3.5% interest in RECOP I, an unconsolidated VIE of which KREF is not the primary beneficiary, at its fair value of $35.5 million.$35.1 million. The aggregator vehicle in which KREF invests is controlled and advised by affiliates of the Manager. RECOP I primarily acquired junior tranches of CMBS newly issued by third parties. KREF will not pay any fees to RECOP I, but KREF bears its pro rata share of RECOP I's expenses. KREF reported its share of the net asset value of RECOP I in its Consolidated Balance Sheets, presented as “Equity method investments” and its share of net income, presented as “Income (loss) from equity method investments” in the Consolidated Statements of Income.
KREF, through a Taxable REIT Subsidiary ("TRS"), held non-voting limited liability company interests issued by the Manager ("Non-Voting Manager Units"), a VIE, for the benefit of the holder of the SNVPS (Note 11). KREF reported its share of net income, presented as “Income from equity method investments” in the Consolidated Statements of Income. On October 1, 2021, KREF TRS redeemed its interest in the Manager for a cash call amount of $5.1 million when the KKR Member exercised its Call Option to redeem the Non-Voting Manager Units, including the Non-Voting Manager Units held by KREF TRS.
KKR Real Estate Finance Trust Inc.
Notes to Consolidated Financial Statements
(dollarsamount in tables in thousands, except per share amounts)
Note 11.10. Equity
Authorized Capital — On October 2, 2014, KREF's board of directors authorized KREF to issue up to 350,000,000 shares of stock, at $0.01 par value per share, consisting of 300,000,000 shares of common stock and 50,000,000 shares of preferred stock, subject to certain restrictions on transfer and ownership of shares. Restrictions placed on the transfer and ownership of shares relate to KREF's REIT qualification requirements.
Common Stock — As further described below, since December 2015,31, 2019, KREF issued the following shares of common stock:
| | | | | | | | | | | | | | | | |
| Pricing Date | | Shares Issued | | | | Net Proceeds |
| As of December 31, 2015 | | 13,636,416 | | | | | $ | 272,728 | |
| February 2016 | | 2,000,000 | | | | | 40,000 | |
| May 2016 | | 3,000,138 | | | | | 57,130 | |
June 2016(A) | | 21,838 | | | | | — | |
| August 2016 | | 5,500,000 | | | | | 109,875 | |
| As of December 31, 2016 | | 24,158,392 | | | | | $ | 479,733 | |
| February 2017 | | 7,386,208 | | | | | 147,662 | |
| April 2017 | | 10,379,738 | | | | | 207,595 | |
| May 2017 - Initial Public Offering | | 11,787,500 | | | | | 219,356 | |
| As of December 31, 2017 | | 53,711,838 | | | | | $ | 1,054,346 | |
| August 2018 | | 5,000,000 | | | | | 98,326 | |
| November 2018 | | 500,000 | | | | | 9,351 | |
| As of December 31, 2018 | | 59,211,838 | | | | | $ | 1,162,023 | |
| November 2021 | | 5,000,000 | | | | | 108,800 | |
November 2021(B) | | 1 | | | | | — | |
| November 2021 | | 547,361 | | | | | 11,911 | |
| As of December 31, 2021 | | 64,759,200 | | | | | $ | 1,282,734 | |
| | | | | | | | | | | | | | |
| Pricing Date | | Shares Issued(A) | | Net Proceeds |
| As of December 31, 2019 | | 59,211,838 | | | $ | 1,162,023 | |
| November 2021 | | 5,000,000 | | | 108,800 | |
November 2021(B) | | 1 | | | — | |
| November 2021 | | 547,361 | | | 11,911 | |
| As of December 31, 2021 | | 64,759,200 | | | $ | 1,282,734 | |
February 2022(C) | | 68,817 | | | 1,426 | |
| March 2022 | | 6,494,155 | | | 133,845 | |
| June 2022 | | 2,750,000 | | | 53,653 | |
August 2022(C) | | 271,641 | | | 5,300 | |
| As of December 31, 2022 and 2023 | | 74,343,813 | | | $ | 1,476,958 | |
(A) KREF did not receive any proceeds with respect to 21,838Excludes 955,743 net shares of common stock issued to certain current and former employees of, and non-employee consultants to, KKR and third-party investorsto-date in the private placement completed in March 2016, in accordanceconnection with KREF's Stockholders Agreement dated as of March 29, 2016.vested restricted stock units.
(B) KREF did not receive any proceeds with respect to 1one share of common stock issued to KKR in connection with the conversion of the special voting preferred stock, in accordance with KREF’s Articles of Restatement dated as of May 10, 2017.
(C) Represents shares issued under the ATM.
In May 2021, KKR sold 5,750,000March and June of 2022, KREF issued 6,494,155 and 2,750,000 shares of KREF common stock, through a secondary offering, includingrespectively, in separate underwritten offerings each of which included the partial exercise of the underwriters'underwriters’ option to purchase additional common shares, and received all of the $100.4 million net proceeds from the offering. On November 1, 2021, KKR converted its special voting preferred stock into 1 share of KREF common stock when KREF issued 5,000,000 shares of common stock, resulting in KKR’s ownership to decrease below 25.0%and received net proceeds after underwriting discounts and commissions of KREF’s outstanding common stock.$133.8 million and $53.7 million, respectively.
KKR and affiliates beneficially owned 14,250,001 and 21,234,528 shares, or 23.2% and 38.2% of KREF's outstanding common stock as of December 31, 2021 and 2020, respectively.
During the years ended December 31, 20212023 and 2020, 203,9422022, 218,849 and 170,482225,036 shares of common stock waswere issued related to the vesting of restricted stock units. Upon any payment of shares as a result of restricted stock unit vesting, the related tax withholding obligation will generally be satisfied by KREF, reducing the number of shares to be delivered by a number of shares necessary to satisfy the related applicable tax withholding obligation. Refer to Note 1211 for further detail.
Of the 65,271,058 commonthe 75,299,556 common shares KREF issued, there were 61,370,73269,313,860 common shares outstanding as of December 31, 2021,2023, which includes 511,858included 955,743 net sharesshares of common stock issued in connection with vested restricted stock units and iswas net of 3,900,326 5,985,696 common shares repurchased.
In May 2021 and June 2022, KKR issued and sold 5,750,000 and 4,250,000 shares of KREF common stock, respectively, through secondary offerings, including the exercise of the underwriters' option to purchase additional common shares, and received $100.4 million and $82.9 million of net proceeds from the offerings, respectively. On November 1, 2021, KKR converted its special voting preferred stock into one share of KREF common stock when KREF issued 5,000,000 shares of common stock, resulting in KKR’s ownership to decrease below 25.0% of KREF’s outstanding common stock.
KKR and affiliates beneficially owned 10,000,001 shares, or 14.4% and 14.5% of KREF's outstanding common stock as of each of December 31, 2023 and 2022, respectively.
Share Repurchase Program — Under the Company’sKREF's current share repurchase program, which has no expiration date, the CompanyKREF may repurchase up to an aggregate of $100.0 million of its common stock beginning July 1, 2020,effective as of February 3, 2023, of which up to $50.0 million may be repurchased under a pre-set trading plan meeting the requirements of Rule 10b5-1 under the Exchange Act, and provide for repurchases of common stock when the market price per share is below book value per share (calculated in accordance with GAAP as of the end of the most recent quarterly period for which financial statements are available), and the remaining
KKR Real Estate Finance Trust Inc.
Notes to Consolidated Financial Statements
(dollars in tables in thousands, except per share amounts)
$50.0 $50.0 million may be used for repurchases in the open market, pursuant to pre-set trading plans meeting the requirements of Rule 10b5-1 under the Exchange Act, in privately negotiated transactions or otherwise. The timing, manner,
KKR Real Estate Finance Trust Inc.
Notes to Consolidated Financial Statements
(amount in tables in thousands, except per share amounts)
price and amount of any common stock repurchases will be determined by the CompanyKREF in its discretion and will depend on a variety of factors, including legal requirements, price, liquidity and economic considerations, and market conditions. The program does not require the CompanyKREF to repurchase any specific number of shares of common stock,stock. The program does not have an expiration date and the program may be suspended, extended, modified or discontinued at any time.
KREF did not repurchase any of its common stocks during the year ended December 31, 2021. During the year ended December 31, 2020,2023, KREF did not repurchase any of its common stock under the repurchase program. During the year ended December 31, 2022, KREF repurchased 2,037,6372,085,370 shares of common stock under the repurchase program at an average price per share of $12.27 for a total of $25.0$35.8 million. As of December 31, 2021,2023, KREF had $100.0 million of remaining capacity to repurchase shares under the program.
At the Market Stock Offering Program — On February 22, 2019, KREF entered into an equity distribution agreement with certain sales agents, pursuant to which KREF may sell, from time to time, up to an aggregate sales price of $100.0 million of its common stock pursuant to a continuous offering program (the “ATM”). Sales of KREF’s common stock made pursuant to the ATM may be made in negotiated transactions or transactions that are deemed to be “at the market” offerings as defined in Rule 415 under the Securities Act of 1933, as amended. The timing and amount of actual sales will depend on a variety of factors including market conditions, the trading price of KREF’s common stock, KREF’s capital needs, and KREF’s determination of the appropriate sources of funding to meet such needs.
During the year ended December 31, 2023, KREF hasdid not soldissue or sell any shares of itscommon stock under the ATM. During the year ended December 31, 2022, KREF issued and sold 340,458 shares of common stock under the ATM, to date.generating net proceeds totaling $6.7 million. As of December 31, 2023, $93.2 million remained available for issuance under the ATM.
Special Voting Preferred Stock — In March 2016, KREF issued 1one share of special voting preferred stock to KKR Fund Holdings L.P. ("KKR Fund Holdings") for $20.00 per share, which KKR Fund Holdings transferred to its subsidiary, KKR REFT Asset Holdings LLC. The holder of the special voting preferred stock hashad special voting rights related to the election of members to KREF's board of directors until KKR and its affiliates ceaseceased to own at least 25.0% of KREF's issued and outstanding common stock.
On November 1, 2021, KREF issued 5,000,000 shares of common stock, which resulted in KKR’s ownership to decreasedecreasing below 25.0% of KREF’s outstanding common stock. Accordingly, KKR converted its special voting preferred share into one share of KREF common stock and ceased to possess its special voting rights related to the election of members to KREF's board of directors.
Special Non-Voting Preferred Stock —In connection with KREF's initial investors’ subscription for shares of KREF's common stock in the private placements prior to the initial public offering of KREF's equity on May 5, 2017, those investors were also allocated a class of non-voting limited liability company interest in the Manager ("Non-Voting Manager Units"). In February 2017, KREF issued an investor 1 share of SNVPS, at $0.01 per share, in lieu of that investor receiving Non-Voting Manager Units to facilitate compliance by the investor with regulatory requirements applicable to it. The corresponding Non-Voting Manager Units are held by a wholly-owned TRS of KREF ("KREF TRS"). All distributions received by KREF TRS from these Non-Voting Manager Units are passed through to the investor as preferred distributions on its SNVPS, less applicable taxes and withholdings. Except for the Non-Voting Manager Units, an indirect subsidiary of KKR ("KKR Member"), owns and controls the limited liability company interests of the Manager.
Dividends on the SNVPS are payable quarterly, and will accrue whether or not KREF has earnings, there are assets legally available for the payment of those dividends or those dividends have been declared. Any dividend payment made on the SNVPS shall first be credited against the earliest accumulated but unpaid dividend due with respect to the SNVPS. Upon redemption of the SNVPS or liquidation of KREF, the holder of the SNVPS is entitled to payment of $0.01 per share, together with any accumulated but unpaid preferred distributions, including respective call or put amounts, before any holder of junior security interests, which includes KREF's common stock. As KREF does not control the circumstances under which the holder of the SNVPS may redeem its interests, management considers the SNVPS as temporary equity (Note 2).
KREF is required to redeem the SNVPS at the option of the holder at any time or upon the redemption by the KKR Member of the Non-Voting Manager Units (the "Call Option"). Upon redemption, KREF will pay a price in cash equal to $0.01 per share of the SNVPS, together with any accumulated but unpaid preferred distributions, including respective call or put amounts, and the SNVPS will be canceled automatically and cease to be outstanding. Concurrently, upon redemption of the SNVPS, the KKR Member will acquire from KREF TRS its respective Non-Voting Manager Units, resulting in a one-time gain, thus
KKR Real Estate Finance Trust Inc.
Notes to Consolidated Financial Statements
(dollars in tables in thousands, except per share amounts)
substantially eliminating the historical cumulative impact of the SNVPS redemption value adjustments recorded in KREF's permanent equity.
On October 1, 2021, the KKR Member exercised its Call Option to redeem the Non-Voting Manager Units, including the Non-Voting Manager Units held by KREF TRS. Accordingly, KREF TRS received a cash call amount of $5.1 million and KREF concurrently redeemed the SNVPS, which resulted in book value accretion in the fourth quarter of $2.6 million, or $0.05 per common share, thus eliminating the cumulative negative impact of the SNPVS on book value.
6.50% Series A Cumulative Redeemable Preferred Stock — In April 2021 and January 2022, KREF issued, respectively, 6,900,000 and 6,210,000 shares of 6.50% Series A Cumulative Redeemable Preferred Stock (the “Series A Preferred Stock”), which included the exercise of the underwriters' option to purchase additional shares of Series A Preferred Stock, and received net proceeds after underwriting discount and commission of $167.1 million. million and $151.2 million, respectively.
The perpetual Series A Preferred Stock is redeemable, at KREF's option, at a liquidation price of $25.00 per share plus accrued and unpaid dividends commencing in April 2026. Dividends on the Series A Preferred Stock are payable quarterly at a rate of 6.50% per annum of the $25.00 liquidation preference, which is equivalent to $1.625 per annum per share. With respect to dividend rights and liquidation, the Series A Preferred Stock ranks senior to KREF's common stock, SNVPS and special voting preferred stock.
Noncontrolling Interests — Noncontrolling interests represent a third party’s 10.0% interest in a joint venture, a consolidated VIE, that holds portion of KREF’s sole REO investment. KREF and the noncontrolling interest holder contribute to the joint venture’s ongoing operating shortfalls and capital expenditures on a pari passu basis. Distributions from the joint venture are allocated between KREF and the noncontrolling interest holder based on contractual terms and waterfalls as outlined in the joint venture agreement.
Dividends— During the years ended December 31, 2021 and 2020, KREF's board of directors declared the following dividends on shares of its common stock and special voting preferred stock:
| | | | | | | | | | | | | | | | | | | | | | | | | | |
| | | | | | Amount |
| Declaration Date | | Record Date | | Payment Date | | Per Share | | Total |
| 2021 | | | | | | | | |
| March 15, 2021 | | March 31, 2021 | | April 15, 2021 | | $ | 0.43 | | | $ | 23,916 | |
| June 15, 2021 | | June 30, 2021 | | July 15, 2021 | | 0.43 | | | 23,924 | |
| September 15, 2021 | | September 30, 2021 | | October 15, 2021 | | 0.43 | | | 23,924 | |
| December 14, 2021 | | December 31, 2021 | | January 14, 2022 | | 0.43 | | | 26,389 | |
| | | | | | | | $ | 98,153 | |
| 2020 | | | | | | | | |
| March 16, 2020 | | March 31, 2020 | | April 15, 2020 | | $ | 0.43 | | | $ | 24,010 | |
| June 15, 2020 | | June 30, 2020 | | July 15, 2020 | | 0.43 | | | 23,861 | |
| September 15, 2020 | | September 30, 2020 | | October 15, 2020 | | 0.43 | | | 23,861 | |
| December 15, 2020 | | December 31, 2020 | | January 15, 2021 | | 0.43 | | | 23,916 | |
| | | | | | | | $ | 95,648 | |
KKR Real Estate Finance Trust Inc.
Notes to Consolidated Financial Statements
(dollarsamount in tables in thousands, except per share amounts)
Dividends— During the years ended December 31, 2021,2023 and 2022, KREF's board of directors declared the following dividends on shares of its common stock:
| | | | | | | | | | | | | | | | | | | | | | | | | | |
| | | | | | Amount |
| Declaration Date | | Record Date | | Payment Date | | Per Share | | Total |
| 2023 | | | | | | | | |
| March 17, 2023 | | March 31, 2023 | | April 14, 2023 | | $ | 0.43 | | | $ | 29,711 | |
| June 15, 2023 | | June 30, 2023 | | July 14, 2023 | | 0.43 | | | 29,716 | |
| September 15, 2023 | | September 29, 2023 | | October 13, 2023 | | 0.43 | | | 29,716 | |
| December 15, 2023 | | December 29, 2023 | | January 12, 2024 | | 0.43 | | | 29,805 | |
| | | | | | | | $ | 118,948 | |
| 2022 | | | | | | | | |
| March 15, 2022 | | March 31, 2022 | | April 15, 2022 | | $ | 0.43 | | | $ | 29,211 | |
| June 15, 2022 | | June 30, 2022 | | July 15, 2022 | | 0.43 | | | 29,951 | |
| September 13, 2022 | | September 30, 2022 | | October 14, 2022 | | 0.43 | | | 29,815 | |
| December 13, 2022 | | December 30, 2022 | | January 13, 2023 | | 0.43 | | | 29,711 | |
| | | | | | | | $ | 118,688 | |
During the years ended December 31, 2023 and 2022, KREF's board of directors declared the following dividends on shares of its Series A Preferred Stock:
| | | | | | | | | | | | | | | | | | | | | | | | | | |
| | | | | | Amount |
| Declaration Date | | Record Date | | Payment Date | | Per Share | | Total |
| 2021 | | | | | | | | |
| April 23, 2021 | | May 31, 2021 | | June 15, 2021 | | $ | 0.27 | | | $ | 1,838 | |
| September 8, 2021 | | September 17, 2021 | | September 27, 2021 | | 0.46 | | | 3,177 | |
| October 19, 2021 | | November 30, 2021 | | December 15, 2021 | | 0.35 | | | 2,429 | |
| | | | | | | | $ | 7,444 | |
| | | | | | | | | | | | | | | | | | | | | | | | | | |
| | | | | | Amount |
| Declaration Date | | Record Date | | Payment Date | | Per Share | | Total |
| 2023 | | | | | | | | |
| February 3, 2023 | | February 28, 2023 | | March 15, 2023 | | $ | 0.41 | | | $ | 5,326 | |
| April 21, 2023 | | May 31, 2023 | | June 15, 2023 | | 0.41 | | | 5,326 | |
| July 21, 2023 | | August 31, 2023 | | September 15, 2023 | | 0.41 | | | 5,326 | |
| October 20, 2023 | | November 30, 2023 | | December 15, 2023 | | 0.41 | | | 5,326 | |
| | | | | | | | $ | 21,304 | |
| 2022 | | | | | | | | |
| February 1, 2022 | | February 28, 2022 | | March 15, 2022 | | $ | 0.41 | | | $ | 5,326 | |
| April 22, 2022 | | May 31, 2022 | | June 15, 2022 | | 0.41 | | | 5,326 | |
| July 19, 2022 | | August 31, 2022 | | September 15, 2022 | | 0.41 | | | 5,326 | |
| October 20, 2022 | | November 30, 2022 | | December 15, 2022 | | 0.41 | | | 5,326 | |
| | | | | | | | $ | 21,304 | |
KKR Real Estate Finance Trust Inc.
Notes to Consolidated Financial Statements
(dollarsamount in tables in thousands, except per share amounts)
Note 12.11. Stock-based Compensation
KREF is externally managed by the Manager and does not currently have any employees. However, as of December 31, 2021,2023, certain individuals employed by the Manager and affiliates of the Manager and certain members of KREF's board of directors were compensated, in part, through the issuance of stock-based awards.
As of December 31, 2021,2023, KREF had 1,147,927 restricted stock unit (“RSU”) awards outstanding under the KKR Real Estate Finance Trust Inc. 2016 Omnibus Incentive Plan that was adopted on February 12, 2016 and amended and restated on November 17, 2016 (the "Incentive Plan") to certain members of KREF’s board of directors and employees of the Manager or its affiliates, none of whom are KREF employees. RSUs awarded to employees of the Manager or its affiliates, generally vest over 3three consecutive one-year periods and awards to certain members of KREF's board of directors generally vest over a one-year period, pursuant to the terms of the respective award agreements and the terms of the Incentive Plan.
In December 2021, KREF's board of directors granted 400,000 shares of RSU awards that are entitled to nonforfeitable dividends during the vesting periods, at the same rate as those declared on the common stocks, duringstock. In February 2022, KREF's board of directors approved a modification that entitled the vesting period.unvested RSU awards granted prior to December 2021 were not entitled to dividends until KREF issues sharesduring the vesting periods, at the same rate as those declared on the common stock, starting with the first quarter of its common stock.2022.
The following table summarizes the activity in KREF’s outstanding RSUs and the weighted-average grant date fair value per RSU:
| | | | | | | | | | | | | | |
| | Restricted Stock Units | | Weighted Average Grant Date Fair Value Per RSU(A) |
| Unvested as of December 31, 2020 | | 787,942 | | | $ | 18.78 | |
| Granted | | 415,520 | | | 20.25 | |
| Vested | | (386,906) | | | 18.87 | |
| Forfeited / cancelled | | (8,226) | | | 18.13 | |
| Unvested as of December 31, 2021 | | 808,330 | | | $ | 19.50 | |
| | | | | | | | | | | | | | |
| | Restricted Stock Units | | Weighted Average Grant Date Fair Value Per RSU(A) |
| Unvested as of December 31, 2022 | | 935,218 | | | $ | 16.80 | |
| Granted | | 673,370 | | | 13.32 | |
| Vested | | (458,277) | | | 17.46 | |
| Forfeited / cancelled | | (2,384) | | | 17.31 | |
| Unvested as of December 31, 2023 | | 1,147,927 | | | $ | 14.49 | |
(A) The grant-date fair value is based upon the last saleclosing price of KREF’s common stock at the date of grant.
KREF expects the unvested RSUs outstanding to vest during the following years:
| | Year | Year | | Restricted Stock Units | Year | | Restricted Stock Units |
| 2022 | | 402,494 | |
| 2023 | | 272,489 | |
| 2024 | 2024 | | 133,347 | |
| 2025 | |
| 2026 | |
| Total | Total | | 808,330 | |
KREF recognizes the compensation cost of RSUs awarded to employees of the Manager, or one or more of its affiliates, on a straight-line basis over the awards’ term at their grant date fair value, consistent with the RSUs awarded to certain members of KREF's board of directors.
During the years ended December 31, 2021, 20202023, 2022 and 2019,2021, KREF recognized $7.4$8.1 million, $5.7$7.8 million and $4.0$7.4 million, respectively, of stock-based compensation expense included in “General and administrative” expense in the Consolidated Statements of Income. As of December 31, 2021,2023, there was $14.2$14.9 million of total unrecognized stock-based compensation expense related to unvested share-based compensation arrangements. This cost is expected to be recognized over a weighted average period of 1.2 years.
During the years ended December 31, 2021, 20202023, 2022 and 2019,2021, KREF declared $0.2$1.8 million, $0.0$1.4 million and $0.0$0.2 million,, respectively, of nonforfeitable dividends on employee RSUs during the vesting period.unvested RSUs. Such nonforfeitable dividends were deducted from “Retained earnings (Accumulated deficit)” in the Consolidated Statement of Changes in Stockholders' Equity.
Directors and Officers Deferral Plan — In March 2022, KREF's board of directors adopted the KKR Real Estate Finance Trust Inc. Directors and Officers Deferral Plan (the “Deferral Plan”). Pursuant to the Deferral Plan, participants may elect to defer receipt of all or a portion of any shares of KREF’s common stock issuable upon vesting of any RSU granted to such
KKR Real Estate Finance Trust Inc.
Notes to Consolidated Financial Statements
(amount in tables in thousands, except per share amounts)
participant in 25% increments. Deferred stock units (“DSU”) credited to a participant are non-voting but shall be entitled to dividend equivalent payments upon payment of dividends on shares of KREF’s common stock in the same form and amount equal to the amount of such dividends and are not subject to deferral under the Deferral Plan. During the year ended December 31, 2023, 72,708 vested RSUs were deferred under the Deferral Plan. As of December 31, 2023, there were 72,708 DSUs outstanding.
Upon any payment of shares as a result of restricted stock unit vesting, the related tax withholding obligation will generally be satisfied by KREF, reducing the number of shares to be delivered by a number of shares necessary to satisfy the related applicable tax withholding obligation. The amount results in a cash payment related to this tax liability and a corresponding reduction to additional paid-in capital in the Consolidated Statement of Changes in Stockholders' Equity. KREF delivered 218,849 shares of common stock for 458,277 vested RSUs during the year ended December 31, 2023 and paid $2.0 million of withholding tax in connection with employee RSUs vested in the fourth quarter of 2023.
Refer to Note 14 for additional information regarding the Incentive Plan.
KKR Real Estate Finance Trust Inc.
Notes to Consolidated Financial Statements
(dollars in tables in thousands, except per share amounts)
203,942 shares of common stock for 386,906 vested RSUs during the year ended December 31, 2021. During the year ended December 31, 2021, KREF paid $3.9 million and $1.7 million of withholding tax in connection with employee RSUs vested in the fourth quarter of 2021 and 2020, respectively.
Refer to Note 15 for additional information regarding the Incentive Plan.
KKR Real Estate Finance Trust Inc.
Notes to Consolidated Financial Statements
(dollarsamount in tables in thousands, except per share amounts)
Note 13.12. Earnings (Loss) per Share
Earnings (Loss) per Share — KREF calculates its basic EPS using the two-class method, which defines unvested share-based payment awards that contain nonforfeitable rights to dividends as participating securities. Under the two-class method earnings (distributed and undistributed) are allocated to common shares and participating securities based on their respective rights. Basic EPS, is calculated by dividing net income (loss) attributable to common stockholders by the weighted average common stock outstanding for the period.
KREF presents diluted EPS under the more dilutive of the treasury stock methodand if-converted methods or the two-class method.method. Under the treasury stock method,and if-converted methods, the denominator includes weighted average common stock outstanding plus the incremental dilutive shares issuable from restricted stock units.units and an assumed conversion of the Convertible Notes (for the periods in which such notes were outstanding). The numerator includes any changes in income (loss) that would result from the assumed conversion of these potential shares of common stock.
KREF hasFor the intentyears ended December 31, 2023, 2022 and ability2021, 18,209, 171,111 and 13,043 weighted average unvested RSUs, respectively, were excluded from the calculation of diluted EPS because the effect was anti-dilutive.
Since May 15, 2023, there were no convertible instruments outstanding. For the years ended December 31, 2022 and 2021, 6,316,174 potentially issuable shares related to settle its Convertible Notes in cash upon maturity and, as a result, the Convertible Notes were excluded from the calculation of diluted EPS calculations forbecause the years ended December 31, 2021, 2020 and 2019.effect was anti-dilutive.
The following table illustrates the computation of basic and diluted earnings (loss) per shareEPS for the years ended December 31, 2021, 20202023, 2022 and 2019:2021:
| | | | For the Year Ended December 31, |
| | 2021 | | 2020 | | 2019 |
| Basic and Diluted Earnings | | | | | | | |
| | | | For the Year Ended December 31, | |
| | | | For the Year Ended December 31, | |
| | | | For the Year Ended December 31, | |
| | | | 2023 | | | | | | 2023 | | 2022 | | 2021 |
| Earnings | |
| Net Income (Loss) | Net Income (Loss) | | | $ | 137,183 | | | $ | 54,397 | | | $ | 89,965 | |
| Less: Preferred stock dividends and redemption value adjustment | | | (11,369) | | | (844) | | | 527 | |
| Net Income (Loss) | |
| Net Income (Loss) | |
| Less: Preferred stock dividends | |
| Less: Participating securities' share in earnings | Less: Participating securities' share in earnings | | | (179) | | | — | | | — | |
| Net income (loss) attributable to common stockholders | | | $ | 125,635 | | | $ | 53,553 | | | $ | 90,492 | |
| Net income (loss) attributable to common stockholders, basic and diluted | |
| | | Denominator | | | |
| Basic weighted average common shares outstanding | | | 56,571,200 | | | 55,985,014 | | | 57,426,912 | |
| Dilutive restricted stock units | | | 212,188 | | | 72,223 | | | 105,578 | |
| Shares | |
| | | Shares | |
| | Shares | |
| Weighted average common shares outstanding | |
| Weighted average common shares outstanding | |
| Weighted average common shares outstanding | |
| Add: Deferred stock units | |
| | Add: Dilutive restricted stock units | |
| | Add: Dilutive restricted stock units | |
| | Add: Dilutive restricted stock units | |
| Diluted weighted average common shares outstanding | Diluted weighted average common shares outstanding | | | 56,783,388 | | | 56,057,237 | | | 57,532,490 | |
| | Net income (loss) attributable to common stockholders, per: | Net income (loss) attributable to common stockholders, per: | | | |
| Net income (loss) attributable to common stockholders, per: | |
| Net income (loss) attributable to common stockholders, per: | |
| Basic common share | |
| Basic common share | |
| Basic common share | Basic common share | | | $ | 2.22 | | | $ | 0.96 | | | $ | 1.58 | |
| Diluted common share | Diluted common share | | | $ | 2.21 | | | $ | 0.96 | | | $ | 1.57 | |
KKR Real Estate Finance Trust Inc.
Notes to Consolidated Financial Statements
(dollarsamount in tables in thousands, except per share amounts)
Note 14.13. Commitments and Contingencies
As of December 31, 2021,2023, KREF was subject to the following commitments and contingencies:
Litigation — From time to time, KREF may be involved in various claims and legal actions arising in the ordinary course of business. KREF establishes an accrued liability for legal proceedings only when those matters present loss contingencies that are both probable and reasonably estimable.
As of December 31, 2021,2023, KREF was not involved in any material legal proceedings regarding claims or legal actions against KREF.
Indemnifications — In the normal course of business, KREF enters into contracts that contain a variety of representations and warranties that provide general indemnifications and other indemnities relating to contractual performance. In addition, certain of KREF’s subsidiaries have provided certain indemnities relating to environmental and other matters and has provided nonrecourse carve-out guarantees for fraud, willful misconduct and other customary wrongful acts, each in connection with the financing of certain real estate investments that KREF has made. KREF’s maximum exposure under these arrangements is unknown as this would involve future claims that may be made against KREF that have not yet occurred. However, KREF expects the risk of material loss to be low.
Capital Commitments — As of December 31, 2021,2023, KREF had future funding commitments of $1,367.9$816.4 million related to its investments in commercial real estate loans. These future funding commitments primarily relate to construction projects, capital improvements, tenant improvements and leasing commissions. Generally, funding commitments are subject to certain conditions that must be met, such as customary construction draw certifications, minimum credit metrics or executions of new leases before advances are made to the borrower.
In January 2017, KREF committed $40.0 million to invest in an aggregator vehicle alongside RECOP I. The two-year investment period for RECOP I ended in April 2019. As of December 31, 2021,2023, KREF had a remaining commitment of $4.3$4.3 million to RECOP I.
Impact ofMacroeconomic Environment — The Federal Reserve has raised interest rates eleven times since January 2022. Higher interest rates imposed by the COVID-19 Pandemic — Although the global economy has, with certain setbacks, begun reopeningFederal Reserve to address inflation may adversely impact real estate asset values and wider distribution of vaccines will likely encourage greater economic activity, KREF is unableincrease our interest expense, which expense may not be fully offset by any resulting increase in interest income, and may lead to predict how widely utilized the vaccines will be, whether they will be effective in preventing the spread of COVID-19 (including its variant strains),decreased prepayments from KREF's borrowers and the time required for a widespread sustainable economic recovery to take hold. Accordingly, the full extent of the impact of COVID-19 on the global economy generally, and on KREF’s business and on the businesses of KREF’s borrowers, in particular, is uncertain. However, to the extent COVID-19 continues to cause dislocationsan increase in the global economy,number of KREF's borrowers who exercise extension options. The Federal Reserve has indicated that it may decrease in interest rates in 2024. In a period of declining interest rates, our financial condition, results of operations and cash flowsinterest income on floating-rate investments would generally decrease, while any decrease in the interest we are charged on our floating-rate debt may be adversely impacted. Refersubject to “Note 2 — Summary of Significant Accounting Policies”floors and may not compensate for further discussion regarding COVID-19.such decrease in interest income.
KKR Real Estate Finance Trust Inc.
Notes to Consolidated Financial Statements
(dollarsamount in tables in thousands, except per share amounts)
Note 15.14. Related Party Transactions
Management Agreement — The Management Agreement between KREF and the Manager is a three-year agreement that provides for automatic one-year renewal periods starting October 8, 2017, subject to certain termination and nonrenewal rights, which in the case of KREF are exercisable by a two-thirds vote by the independent directors of KREF's board of directors. If the independent directors of KREF's board of directors decline to renew the Management Agreement other than for cause, KREF is required to pay the Manager a termination fee equal to 3three times the total 24-month trailing average annual management fee and incentive compensation earned by the Manager through the most recently completed calendar quarter. For administrative efficiency purposes, the Management Agreement was amended in August 2019 to change the expiration date of each automatic renewal period from October 7th to December 31st.
Pursuant to the Management Agreement, the Manager, as agent to KREF and under the supervision of KREF's board of directors, manages the investments, subject to investment guidelines approved by KREF's board of directors; financing activities; and day-to-day business and affairs of KREF and its subsidiaries.
For its services to KREF, the Manager is entitled to a quarterly management fee equal to the greater of $62,500 or 0.375% of a weighted average adjusted equity and quarterly incentive compensation equal to 20.0% of the excess of (a) the trailing 12-month distributable earnings (before incentive compensation payable to the Manager) over (b) 7.0% of the trailing 12-month weighted average adjusted equity (“Hurdle Rate”), less incentive compensation KREF already paid to the Manager with respect to the first 3three calendar quarters of such trailing 12-month period. The quarterly incentive compensation is calculated and paid in arrears with a one-quarter lag.
Adjusted equity generally represents the proceeds received by KREF and its subsidiaries from equity issuances, without duplication and net of offering costs, and distributable earnings, reduced by distributions, equity repurchases, and incentive compensation paid. Distributable earnings generally represent the net income, or loss, attributable to equity interests in KREF and its subsidiaries, without duplication, as well as realized losses not otherwise included in such net income, or loss, excluding non-cash equity compensation expense, incentive compensation, depreciation and amortization and unrealized gains or losses, from and after the effective date to the end of the most recently completed calendar quarter. KREF's board of directors, after majority approval by independent directors, may also exclude one-time events pursuant to changes in GAAP and certain material non-cash income or expense items from distributable earnings. For purposes of calculating incentive compensation, adjusted equity excludes: (i) the effects of equity issued by KREF and its subsidiaries that provides for fixed distributions or other debt characteristics and (ii) unrealized provision for (reversal of) credit losses.
KREF is also required to reimburse the Manager or its affiliates for documented costs and expenses incurred by it and its affiliates on behalf of KREF, except those specifically required to be borne by the Manager under the Management Agreement. The Manager is responsible for, and KREF does not reimburse the Manager or its affiliates for, the expenses related to investment personnel of the Manager and its affiliates who provide services to KREF. However, KREF does reimburse the Manager for KREF's allocable share of compensation paid to certain of the Manager’s non-investment personnel, based on the percentage of time devoted by such personnel to KREF's affairs.
Incentive Plan — KREF's compensation committee or board of directors may administer the Incentive Plan, which provides for awards of stock options; stock appreciation rights; restricted stock; RSUs; limited partnership interests of KKR Real Estate Finance Holdings L.P. (the "Operating Partnership"), a wholly owned subsidiary of KREF, that are directly or indirectly convertible into or exchangeable or redeemable for shares of KREF's common stock pursuant to the limited partnership agreement of the Operating Partnership (“OP Interests”); awards payable by (i) delivery of KREF's common stock or other equity interests, or (ii) reference to the value of KREF's common stock or other equity interests, including OP Interests; cash-based awards; or performance compensation awards.
No more than 7.5% of the issued and outstanding shares of common stock on a fully diluted basis, assuming the exercise of all outstanding stock options granted under the Incentive Plan and the conversion of all warrants and convertible securities into shares of common stock, or a total of 4,028,387 shares of common stock, will be available for awards under the Incentive Plan. In addition, (i) the maximum number of shares of common stock subject to awards granted during a single fiscal year to any non-employee director (as defined in the Incentive Plan), taken together with any cash fees paid to such non-employee director during the fiscal year, may not exceed $1.0 million and (ii) the maximum amount that can be paid to any participant for a single fiscal year during a performance period (or with respect to each single fiscal year if a performance period extends beyond a single fiscal year) pursuant to a performance compensation award denominated in cash may not exceed $10.0 million.
KKR Real Estate Finance Trust Inc.
Notes to Consolidated Financial Statements
(dollarsamount in tables in thousands, except per share amounts)
No awards may be granted under the Incentive Plan on and after February 12, 2026. The Incentive Plan will continue to apply to awards granted prior to such date. During the year ended December 31, 2021, KREF2023, 673,370 RSUs were granted415,520 RSUs to KREF's directors and employees of the Manager.Manager or its affiliates. During the year ended December 31, 2020, KREF2022, 547,625 RSUs were granted 443,052 RSUs to KREF's directors and employees of the Manager. Manager or its affiliates. As of December 31, 2021, 2,708,199 shares2023, 1,852,009 shares of common stock remained available for awards under the Incentive Plan.
Due to Affiliates — The following table contains the amounts presented in KREF's Consolidated Balance Sheets that it owes to affiliates:
| | | | | | | | | | | | | | |
| | December 31, 2021 | | December 31, 2020 |
| Management fees | | $ | 5,289 | | | $ | 4,252 | |
| Expense reimbursements and other | | 663 | | | 1,991 | |
| | $ | 5,952 | | | $ | 6,243 | |
| | | | | | | | | | | | | | |
| | December 31, 2023 | | December 31, 2022 |
| Management fees | | $ | 6,523 | | | $ | 6,578 | |
| Expense reimbursements | | — | | | 100 | |
| KCM fees | | 1,747 | | | 2,044 | |
| | $ | 8,270 | | | $ | 8,722 | |
Affiliates Expenses — The following table contains the amounts included in KREF's Consolidated Statements of Income that arose from transactions with the Manager:
| | | | | | | | | | | | | | | | | | | | | | | | |
| | | | For the Year Ended December 31, |
| | | | | | 2021 | | 2020 | | 2019 |
| Management fees | | | | | | $ | 19,378 | | | $ | 16,992 | | | $ | 17,135 | |
| Incentive compensation | | | | | | 10,273 | | | 6,774 | | | 3,272 | |
Expense reimbursements and other(A) | | | | | | 1,551 | | | 1,668 | | | 1,469 | |
| | | | | | $ | 31,202 | | | $ | 25,434 | | | $ | 21,876 | |
(A) KREF presents these amounts in "Operating Expenses — General and administrative" in its Consolidated Statements of Income. Affiliate expense reimbursements presented in the table above exclude the out-of-pocket amounts paid by the Manager to parties unaffiliated with the Manager on behalf of KREF, and for which KREF reimburses the Manager in cash. For the years ended December 31, 2021, 2020 and 2019, these cash reimbursements totaled $1.4 million, $3.8 million and $1.8 million, respectively. | | | | | | | | | | | | | | | | | | | | | | | | |
| | | | For the Year Ended December 31, |
| | | | | | 2023 | | 2022 | | 2021 |
| Management fees | | | | | | $ | 26,171 | | | $ | 25,680 | | | $ | 19,378 | |
| Incentive compensation | | | | | | 2,491 | | | 634 | | | 10,273 | |
| Expense reimbursements and other | | | | | | 6,581 | | | 4,385 | | | 1,551 | |
| | | | | | $ | 35,243 | | | $ | 30,699 | | | $ | 31,202 | |
In connection with the ATM, KCM, in its capacity as one of the sales agents, will receive commissions for the shares of KREF’s common stock it sells. This amount is not to exceed, but may be less than, 2.0% of the gross sales price per share. KREF did not sell anysold zero and 340,548 shares under the ATM through a third-party broker during the years ended December 31, 2021.2023 and 2022, respectively. KREF did not incur or pay any commissions to KCM during the years ended December 31, 2023 and 2022.
In connection with the BMO Facility, and in consideration for its services as the structuring and sourcing this arrangement,agent, KREF is obligated to pay KCM a $0.2 million structuring fee equal to 0.35% of the respective committed loan advances under the agreement in the first quarter of 2019.agreement. Such fees are capitalized as deferred financing cost and amortized to interest expense over the estimated lifedraw period of the facility.
In connection with the Term Loan Facility (Note 5), KREF paid KCM a $1.5zero and $0.5 million structuring fee equal to 0.75% of the respective committed loan advances, as defined, in the second quarter of 2019. Such fees are capitalized as deferred financing cost and amortized to interest expense over the life of the facility.
In connection with the Revolver, and in consideration for structuring and sourcing this arrangement, KREF paid KCM a structuring fee equal to 0.75% of the aggregate amount of commitments first made available. The structuring fees are capitalized as deferred financing cost included within "Other Assets" in the Consolidated Balance Sheet and amortized to interest expense over the life of the Revolver. During the years ended December 31, 2021 and 2020, KREF incurred $0.0 million and $0.6 million, respectively, in structuring fees in connection with the Revolver.facility during the years ended December 31, 2023 and 2022.
In connection with the HSBC Facility entered into in March 2020, and in consideration for structuring and sourcing this arrangement, KREF is obligated to pay KCM a structuring fee equal to 0.25% of the respective committed loan advances under the agreement. Such fees are capitalized as deferred financing cost and amortized to interest expense over the lesser of the initial term of the loan or the facility. During the years ended December 31, 20212023 and 2020,2022, KREF incurred and paiddid not incur or pay any KCM$0.0 million and $0.1 million in structuring fees in connection with the facility.
In connection with the secured term loan, and in consideration for structuring and arranging the loan, KREF paid KCM a $1.1 million arrangement and structuring fee equal to 0.37% of the principal amount of the secured term loan in the third quarter of 2020. In addition, KREF paid KCM a $0.8 million arrangement and structuring fee in connection with the secured
KKR Real Estate Finance Trust Inc.
Notes to Consolidated Financial Statements
(dollars in tables in thousands, except per share amounts)
term loan repricing and upsize in the fourth quarter of 2021. Such fees were capitalized as deferred financing cost and amortized to interest expense over the life of the secured term loan.
In connection with the syndication of a senior mortgage loan in October 2020, and in consideration for its services as the placement agent, KREF paid KCM a $0.4 million placement agent fee equal to 0.30% of KREF's proportion share of the senior loan commitment. Such fee was capitalized as a direct loan origination cost and amortized to interest income over the life of the loan.
In connection with the syndication of a senior mortgage loan in February 2021, and in consideration for its services as the placement agent, KREF paid KCM a $0.4 million placement agent fee equal to 0.25% of KREF’s proportionate share of the senior loan commitment. Such fee was capitalized as a direct loan origination cost and amortized to interest income over the life of the loan.
In connection with the Series A Preferred Stock issuance in April 2021 and January 2022, and in consideration for its services as joint bookrunner, KREF incurred and paid KCM a $1.6 million and $1.3 million in underwriting discount and commission.commission, respectively. The underwriting discount and commission was settled net of the preferred stock issuance proceeds and recorded as a reduction to additional paid-in-capital in KREF's consolidated financial statements.
In connection with the KREF Lending IX Facility entered into in July 2021, and in consideration for structuring and sourcing this arrangement, KREF is obligated to pay KCM a structuring fee equal to 0.75% of the respective committed loan advances under the agreement. Such fees are capitalized as deferred financing cost and amortized to interest expense over the draw period of the facility. During the yearyears ended December 31, 2021,2023 and 2022, KREF incurred and paid KCM $3.1$0.3 million and accrued for an additional $0.6$2.3 million in structuring fees in connection with the facility.facility, respectively.
KKR Real Estate Finance Trust Inc.
Notes to Consolidated Financial Statements
(amount in tables in thousands, except per share amounts)
In connection with the KREF 2021-FL2 and KREF 2022-FL3 CLO issuanceissuances in August 2021 and February 2022, and in consideration for its services as the co-lead manager and joint bookrunner, KREF paid KCM $0.9$0.9 million and $0.5 million, respectively, in structuring and placement agent fees in the third quarter of 2021. The fee was2021 and 2022. These fees were capitalized as deferred financing cost and amortized to interest expense over the estimated life of the CLO.CLOs.
In connection with the extension and upsize of the Revolver in March 2022, and in consideration for its services as the arranger, KREF is obligated to pay KCM an arrangement fee equal to 0.375% of the aggregate amount of existing commitments plus 0.75% of the aggregate amount of new commitments. KREF paid $3.3 million of arrangement fees in connection with the Revolver in 2022. Such fees were capitalized as deferred financing cost and amortized to interest expense over the estimated life of the Revolver.
In connection with the KREF Lending XI Facility entered into in April 2022, and in consideration for its services as the structuring agent, KREF paid KCM $0.5 million in structuring fees in 2022. Such fees are capitalized as deferred financing cost and amortized to interest expense over the estimated life of the facility.
In connection with the KREF Lending XII Facility entered into in June 2022, and in consideration for structuring and sourcing this arrangement, KREF is obligated to pay KCM a structuring fee equal to 0.35% of the respective loan advances under the agreement. KREF paid $0.6 million in KCM structuring fees in connection with the facility in 2022. Such fees are capitalized as deferred financing cost and amortized to interest expense over the draw period of the facility.
In connection with the KREF Lending XIII Facility entered into in August 2022, and in consideration for structuring and sourcing this arrangement, KREF is obligated to pay KCM a structuring fee equal to 0.5% of the facility amount under the agreement. KREF paid $1.3 million in KCM structuring fees in connection with the facility in 2022. Such fees are capitalized as deferred financing cost and amortized to interest expense over the draw period of the facility.
In connection with the KREF Lending XIV Facility entered into in October 2022, and in consideration for its services as the structuring agent, KREF paid KCM $0.6 million in structuring fees in 2022. Such fees are capitalized as deferred financing cost and amortized to interest expense over the estimated life of the facility.
KKR Real Estate Finance Trust Inc.
Notes to Consolidated Financial Statements
(dollarsamount in tables in thousands, except per share amounts)
Note 16.15. Fair Value of Financial Instruments
The carrying values and fair values of KREF’s financialfinancial assets and liabilities recorded at fair value on a recurring basis, as well as other financial instruments not carried at fair value, as of December 31, 2021 were2023, were as follows:
| | | Fair Value |
| Principal Balance(A) | | Amortized Cost(B) | | Carrying Value(C) | | Level 1 | | Level 2 | | Level 3 | | Total |
| | | | | | | Fair Value | | | | | | | | | Fair Value |
| Principal Balance | | | Principal Balance | | Amortized Cost(A) | | Carrying Value(B) | | Level 1 | | Level 2 | | Level 3 | | Total |
| Assets | Assets | | | | | | | | | | | | | |
| Cash and cash equivalents | Cash and cash equivalents | $ | 271,487 | | | $ | 271,487 | | | $ | 271,487 | | | $ | 271,487 | | | $ | — | | | $ | — | | | $ | 271,487 | |
Commercial real estate loans, held-for-investment, net(D) | 6,364,105 | | | 6,316,733 | | | 6,294,489 | | | — | | | — | | | 6,340,837 | | | 6,340,837 | |
| Cash and cash equivalents | |
| Cash and cash equivalents | |
Commercial real estate loans, held-for-investment, net(C) | |
| Equity method investments | Equity method investments | 35,537 | | | 35,537 | | | 35,537 | | | — | | | — | | | 35,537 | | | 35,537 | |
| $ | 6,671,129 | | | $ | 6,623,757 | | | $ | 6,601,513 | | | $ | 271,487 | | | $ | — | | | $ | 6,376,374 | | | $ | 6,647,861 | |
| $ | |
| Liabilities | Liabilities | | | | | | | | | | | | | |
| Secured financing agreements, net | |
| Secured financing agreements, net | |
| Secured financing agreements, net | Secured financing agreements, net | $ | 3,737,893 | | | $ | 3,726,593 | | | $ | 3,726,593 | | | $ | — | | | $ | — | | | $ | 3,726,593 | | | $ | 3,726,593 | |
| Collateralized loan obligations, net | Collateralized loan obligations, net | 1,095,250 | | | 1,087,976 | | | 1,087,976 | | | — | | | — | | | 1,094,834 | | | 1,094,834 | |
| Secured term loan, net | Secured term loan, net | 350,000 | | | 338,549 | | | 338,549 | | | — | | | 352,625 | | | — | | | 352,625 | |
| Convertible notes, net | 143,750 | | | 141,851 | | | 141,851 | | | — | | | 152,203 | | | — | | | 152,203 | |
| $ | 5,326,893 | | | $ | 5,294,969 | | | $ | 5,294,969 | | | $ | — | | | $ | 504,828 | | | $ | 4,821,427 | | | $ | 5,326,255 | |
| $ | |
(A) The principal balance of commercial real estate loans excludes premiums and unamortized discounts.
(B) The amortized cost of commercial real estate loans is net of $5.5$20.8 million write-off on a mezzanine loan and $41.9 million of unamortized origination discounts, cost recovery interest and deferred fees. The amortized cost of secured financing agreements is net of $11.3$11.6 million unamortized debt issuance costs. The amortized cost of collateralized loan obligations is net of $7.3$0.6 million unamortized debt issuance costs.
(C)(B) The carrying value of commercial mortgage loans is net of $22.2$210.5 million allowance for credit losses.
(D)(C) Includes $1,246.0$2,295.0 million of CLO loan participations as of December 31, 2021.2023. Excludes fully written off risk-rated 5 loans with a combined outstanding principal balance of $45.5 million as of December 31, 2023.
The carrying values and fair values of KREF’s financial assets recorded at fair value on a recurring basis, as well as other financial instruments for which fair value is disclosed, as of December 31, 20202022, were as follows:
| | Fair Value |
| Principal Balance(A) | | Amortized Cost(B) | | Carrying Value(C) | | Level 1 | | Level 2 | | Level 3 | | Total |
| | | | | | | | Fair Value | | | | | | | | | | Fair Value |
| | Principal Balance | | | | Principal Balance | | Amortized Cost(A) | | Carrying Value(B) | | Level 1 | | Level 2 | | Level 3 | | Total |
| Assets | Assets | | | | | | | | | | | | | | |
| Cash and cash equivalents | Cash and cash equivalents | | $ | 110,832 | | | $ | 110,832 | | | $ | 110,832 | | | $ | 110,832 | | | $ | — | | | $ | — | | | $ | 110,832 | |
Commercial real estate loans, held-for-investment, net(D) | | 4,869,696 | | | 4,844,534 | | | 4,784,733 | | | — | | | — | | | 4,757,203 | | | 4,757,203 | |
| Cash and cash equivalents | |
| Cash and cash equivalents | |
Commercial real estate loans, held-for-investment, net(C) | |
| Equity method investments | Equity method investments | | 33,651 | | | 33,651 | | | 33,651 | | | — | | | — | | | 33,651 | | | 33,651 | |
| $ | 5,014,179 | | | $ | 4,989,017 | | | $ | 4,929,216 | | | $ | 110,832 | | | $ | — | | | $ | 4,790,854 | | | $ | 4,901,686 | |
| | $ | |
| Liabilities | Liabilities | | | | | | | | | | | | | | |
| Secured financing agreements, net | |
| Secured financing agreements, net | |
| Secured financing agreements, net | Secured financing agreements, net | | $ | 2,581,324 | | | $ | 2,574,747 | | | $ | 2,574,747 | | | $ | — | | | $ | — | | | $ | 2,581,324 | | | $ | 2,581,324 | |
| Collateralized loan obligations, net | Collateralized loan obligations, net | | 810,000 | | | 810,000 | | | 810,000 | | | — | | | — | | | 803,766 | | | 803,766 | |
| Secured term loan, net | Secured term loan, net | | 300,000 | | | 288,028 | | | 288,028 | | | — | | | 303,000 | | | — | | | 303,000 | |
| Convertible notes, net | Convertible notes, net | | 143,750 | | | 140,465 | | | 140,465 | | | — | | | 145,817 | | | — | | | 145,817 | |
| Loan participations sold, net | | 66,248 | | | 66,232 | | | 66,232 | | | — | | | — | | | 66,232 | | | 66,232 | |
| $ | 3,901,322 | | | $ | 3,879,472 | | | $ | 3,879,472 | | | $ | — | | | $ | 448,817 | | | $ | 3,451,322 | | | $ | 3,900,139 | |
| | $ | |
(A) The principal balance of commercial real estate loans excludes premiums and unamortized discounts.
(B) The amortized cost of commercial real estate loans is net of $4.7$43.3 million write-off on a mezzanine loan and $20.5 millionof unamortized origination discounts and deferred nonrefundable fees.fees, a $25.0 million write-off on a defaulted senior loan. The amortized cost of secured financing agreements is net of $6.6$22.0 million of unamortized debt issuance costs. The amortized cost of collateralized loan obligations is net of $7.2 million of unamortized debt issuance costs.
(C)(B) The carrying value of commercial mortgage loans is net of $59.8$107.0 million allowance for credit losses.
(D)(C) Includes $1,000.0$2,149.0 million of CLO loan participations as of December 31, 2020. Includes senior loans for which KREF syndicated2022. Excludes a verticalfully written off risk-rated 5 loan participation that did not qualify for sale accounting under GAAP, with a carrying value and a fair valuean outstanding principal balance of $66.2$5.5 million as of December 31, 2020.
KKR Real Estate Finance Trust Inc.
Notes to Consolidated Financial Statements
(dollarsamount in tables in thousands, except per share amounts)
During the year ended December 31, 2021, KREF received distributions of $3.2 million and recognized income of $5.4 million related to its investment in RECOP I. During the year ended December 31, 2020, KREF received distributions of $3.4 million and recorded a loss of $0.5 million related to its investment in RECOP I.
The following table contains the Level 3 inputs used to value assets and liabilities on a recurring and nonrecurring basis or where KREF discloses fair value as of December 31, 2021:2023:
| | | Fair Value | | Valuation Methodologies | | Unobservable Inputs(A) | | Weighted Average(B) | | Range |
| | Fair Value | | | | Fair Value | | Valuation Methodologies | | Unobservable Inputs(A) | | Weighted Average(B) | | Range |
Assets and Liabilities(C) | Assets and Liabilities(C) | | | | | | | | | | |
Commercial real estate loans, held-for-investment(D) | Commercial real estate loans, held-for-investment(D) | | $ | 6,340,837 | | | Discounted cash flow | | Discount rate | | 4.1% | | 1.8% - 19.1% |
Commercial real estate loans, held-for-investment(D) | |
Commercial real estate loans, held-for-investment(D) | | | $ | 7,133,696 | | | Discounted cash flow | | Discount margin | | 4.4% | | 3.3% - 17.2% |
| | | | | | Discount rate | | | | | | | | Discount rate | | 10.7% | | 9.0% - 12.0% |
| | | | | | Capitalization rate | | | | | | | | Capitalization rate | | 7.8% | | 7.0% - 8.7% |
| | $ | |
| | $ | 6,340,837 | | |
|
(A) An increase (decrease) in the valuation input results in a decrease (increase) in value.
(B) Represents the average of the input value, weighted by the unpaid principal balance of the financial instrument.
(C) KREF carries a $35.5$35.1 million investment in an aggregator vehicle alongside RECOP I (Note 10)9) at its pro rata share of the aggregator's net asset value, which management believes approximates fair value.
(D) Commercial real estate loans are generally valued using a discounted cash flow model using a discount rate derived from relevant market indices and/or estimates of the underlying property's value.
Assets and Liabilities Measured at Fair Value on a Nonrecurring Basis
Certain assets not measured at fair value on an ongoing basis but subject to fair value adjustments only in certain circumstances, such as when there is evidence of impairment, are measured at fair value on a nonrecurring basis. ForKREF measures commercial real estate loans held-for-sale KREF appliesat the lower of cost or fair value accounting and may be required, from time to time, to record a nonrecurring fair value adjustment. ForKREF measures commercial real estate loans held-for-investment and preferred interest in joint venture held-to-maturity, KREF applies theat amortized cost, method of accounting, but may be required, from time to time, to record a nonrecurring fair value adjustment in the form of a valuation provision or impairment.
REO, including related assets and liabilities, are recorded at their respective estimated fair values and periodically evaluated for impairment.
KREF did not report any significant financial assets or liabilities at fair value on a nonrecurring basis as of December 31, 2021 and 2020.
Assets and Liabilities for Which Fair Value is Only Disclosed
KREF does not carry its secured financing agreements at fair value as management did not elect the fair value option for these liabilities. As of December 31, 2021,2023, the fair value of KREF's financing facilities approximated their respective carrying value.
KKR Real Estate Finance Trust Inc.
Notes to Consolidated Financial Statements
(dollarsamount in tables in thousands, except per share amounts)
Note 17.16. Income Taxes
KREF has elected to be taxed as a REIT under Sections 856 through 860 of the Internal Revenue Code commencing with its taxable year ended December 31, 2014. A REIT is generally not subject to U.S. federal and state income tax on that portion of its income that is distributed to stockholders if it distributes at least 90% of its REIT taxable income, determined without regard to the deduction for dividends paid and excluding any net capital gains. A REIT will also be subject to a nondeductible excise tax to the extent certain percentages of its taxable income are not distributed within specified dates. While KREF expects to distribute at least 90% of its net taxable income for the foreseeable future, KREF will continue to evaluate its capital and liquidity needs in light of the significant uncertainties created by the COVID-19 pandemic, including the potential for a continued and prolonged adverse impact onexisting economic and market conditions.
KREF consolidates subsidiaries that incur U.S. federal, state and local income taxes, based on the tax jurisdiction in which each subsidiary operates. During the years ended December 31, 2021, 20202023, 2022 and 2019,2021, KREF recorded a currentan income tax provisionexpense of $0.7 million,, $0.4 $0.1 million and $0.6$0.7 million, respectively, related to the operations of its taxable REIT subsidiaries and various other state and local taxes. There were no material deferred tax assets or liabilities as of December 31, 20212023 and 2020.
As of December 31, 2021, tax years 2017 through 2021 remain subject to examination by taxing authorities.2022.
Common stock distributions treated as dividends for tax purposes were taxable as follows:
| | Year | Year | | Ordinary
Dividends | | Qualified
Dividends | | Long Term
Capital Gain | | Return of
Capital | Year | | Ordinary
Dividends | | Qualified
Dividends | | Long Term
Capital Gain | | Return of
Capital |
| 2023 | | 2023 | | 91.5 | % | | — | % | | — | % | | 8.5 | % |
| 2022 | |
| 2021 | 2021 | | 99.1 | % | | 1.2 | % | | 0.9 | % | | — | % |
| 2020 | 2020 | | 100.0 | | | 0.8 | | | — | | | — | |
| 2019 | | 99.1 | | | 1.6 | | | 0.9 | | | — | |
|
KKR Real Estate Finance Trust Inc.
Notes to Consolidated Financial Statements
(dollarsamount in tables in thousands, except per share amounts)
Note 18.17. Subsequent Events
The following events occurred subsequent to December 31, 2021:
Investing Activities
KREF originated the following loans:
| | | | | | | | | | | | | | | | | | | | | | | | | | | | | | | | | | | | | | | | | | | | |
| Description/ Location | | Property Type | | Month Originated | | Committed Principal Amount | | Initial Principal Funded | | Interest Rate (A) | | Maturity Date(B) | | LTV |
| Senior Loan, Brandon, FL | | Multifamily | | January 2022 | | $ | 90,300 | | | $ | 61,920 | | | SOFR + 3.1% | | February 2027 | | 75% |
Senior Loan, Washington, D.C.(C) | | Office | | January 2022 | | 100,000 | | | 57,060 | | | L + 3.2% | | February 2028 | | 55 |
Senior Loan, Phoenix, AZ(D) | | Industrial | | January 2022 | | 100,000 | | | 2,244 | | | SOFR + 4.0% | | February 2027 | | 57 |
| Senior Loan, Arlington, VA | | Multifamily | | January 2022 | | 135,300 | | | 130,890 | | | SOFR + 2.9% | | February 2027 | | 65 |
| Senior Loan, West Hollywood, CA | | Multifamily | | January 2022 | | 102,000 | | | 102,000 | | | L + 3.0% | | February 2027 | | 65 |
Senior Loan, San Carlos, CA(E) | | Life Science | | February 2022 | | 125,000 | | | 79,809 | | | SOFR + 3.6% | | February 2027 | | 68 |
| Total/ Weighted Average | | | | | | $ | 652,600 | | | $ | 433,923 | | | L/SOFR + 3.3% | | | | 64% |
(A) Floating rate based on one-month USD LIBOR or one-month Term SOFR, as applicable.
(B) Maturity date assumes all extension options are exercised, if applicable.
(C) The total whole loan is $228.5 million, co-originated by KREF and a KKR affiliate. KREF's interest is 43.8% of the loan.
(D) The total whole loan is $195.3 million, co-originated by KREF and a KKR affiliate. KREF's interest is 51.2% of the loan.
(E) The total whole loan is $195.9 million, co-originated by KREF and a KKR affiliate. KREF's interest is 63.8% of the loan.2023:
Loan Repayments
In January 2022,2024, KREF received approximately $139.8$324.7 million in loanprincipal repayments, includingcomprised of a full loan repayment of $76.2$173.4 million on one 4-rated senior hospitality loan.
Financing Activities
In February 2022, KREF priced a $1.0 billion managed multifamily CLO (“KREF 2022-FL3”) expected to close on or around February 10, 2022, subject to customary closing conditions. KREF 2022-FL3 will provide KREF with match-term financing on a non-mark-to-marketsenior office loan in Washington, D.C. and non-recourse basis, and features a two-year reinvestment period with an 84.75% advance rate atfull loan repayment of $151.3 million on a weighted average running cost of capital of Term SOFR plus 1.71%, before transaction costs.senior condo loan in New York, NY.
Corporate Activities
Preferred Stock IssuanceDividends
In January 2022, KREF issued additional 6,210,000 shares of 6.5% Series A Cumulative Redeemable Preferred Stock (the “Series A Preferred Stock”), which included the exercise of the underwriters' option to purchase additional shares of Series A Preferred Stock, and received net proceeds after underwriting discount and commission (inclusive of $1.5 million paid to KKR Capital Markets, a KKR affiliate, for its services as joint bookrunner) of $151.2 million.
Dividends
In January 2022,2024, KREF paid $26.4$29.8 million in dividends on its common stock, or $0.43$0.43 per share, with respect to the fourth quarter of 2021,2023, to stockholders of record on December 31, 2021.29, 2023.
On February 1, 2024, KREF’s Board of Directors declared a dividend of $0.25 per share of common stock with respect to the first quarter of 2024. The dividend is payable on April 15, 2024 to KREF’s common stockholders of record as of March 28, 2024.
KKR Real Estate Finance Trust Inc.
Notes to Consolidated Financial Statements
(dollarsamount in tables in thousands, except per share amounts)
Note 19.18. Summary Quarterly Consolidated Financial Information (Unaudited)
The following tables summarize KREF's quarterly financial data which, in the opinion of management, reflects all adjustments, consisting only of normal recurring adjustments, necessary for a fair presentation of KREF's results of operations for the years ended December 31, 20212023 and 2020:2022:
| | 2021 |
| Quarter Ended | | Year Ended |
| March 31 | | June 30 | | September 30 | | December 31 | | December 31, 2021 |
| 2023 | | | 2023 |
| Quarter Ended | | | Quarter Ended | | Year Ended |
| March 31 | | | March 31 | | June 30 | | September 30 | | December 31 | | December 31, 2023 |
| Net Interest Income | Net Interest Income | | | | | | | | | |
| Interest income | |
| Interest income | |
| Interest income | Interest income | $ | 64,766 | | | $ | 67,149 | | | $ | 75,320 | | | $ | 72,715 | | | $ | 279,950 | |
| Interest expense | Interest expense | 27,383 | | | 26,958 | | | 29,832 | | | 30,266 | | | 114,439 | |
| Total net interest income | Total net interest income | 37,383 | | | 40,191 | | | 45,488 | | | 42,449 | | | 165,511 | |
| Other Income (Loss) | 1,156 | | | 1,356 | | | 2,292 | | | 7,379 | | | 12,183 | |
| Other Income | |
| Operating Expenses | Operating Expenses | 8,399 | | | 10,367 | | | 12,003 | | | 9,058 | | | 39,827 | |
| Income (Loss) Before Income Taxes, Preferred Dividends, Redemption Value Adjustment and Participating Securities' Share in Earnings | 30,140 | | | 31,180 | | | 35,777 | | | 40,770 | | | 137,867 | |
| Income (Loss) Before Income Taxes, Noncontrolling Interests, Preferred Dividends and Participating Securities' Share in Earnings | |
| Income tax expense | Income tax expense | 48 | | | 103 | | | 106 | | | 427 | | | 684 | |
| Net Income (Loss) | Net Income (Loss) | $ | 30,092 | | | $ | 31,077 | | | $ | 35,671 | | | $ | 40,343 | | | $ | 137,183 | |
| | Preferred stock dividends and redemption value adjustment | 908 | | | 1,813 | | | 3,682 | | | 4,966 | | | 11,369 | |
| Noncontrolling interests in income (loss) of consolidated joint venture | |
| Net Income (Loss) Attributable to KKR Real Estate Finance Trust Inc. and Subsidiaries | |
| Preferred stock dividends | |
| Participating securities' share in earnings | Participating securities' share in earnings | — | | | — | | | — | | | 179 | | | 179 | |
| Net Income (Loss) Attributable to Common Stockholders | Net Income (Loss) Attributable to Common Stockholders | $ | 29,184 | | | $ | 29,264 | | | $ | 31,989 | | | $ | 35,198 | | | $ | 125,635 | |
| | Net Income (Loss) Per Share of Common Stock | Net Income (Loss) Per Share of Common Stock | |
| Basic | $ | 0.52 | | | $ | 0.53 | | | $ | 0.57 | | | $ | 0.59 | | | $ | 2.22 | |
| Diluted | $ | 0.52 | | | $ | 0.52 | | | $ | 0.57 | | | $ | 0.59 | | | $ | 2.21 | |
| Net Income (Loss) Per Share of Common Stock | |
| Net Income (Loss) Per Share of Common Stock | |
| Basic and Diluted | |
| Basic and Diluted | |
| Basic and Diluted | |
| | | Weighted Average Number of Shares of Common Stock Outstanding | Weighted Average Number of Shares of Common Stock Outstanding | |
| Basic | 55,619,428 | | | 55,632,322 | | | 55,637,480 | | | 59,364,672 | | | 56,571,200 | |
| Diluted | 55,731,061 | | | 55,907,086 | | | 56,011,243 | | | 59,453,264 | | | 56,783,388 | |
| | Weighted Average Number of Shares of Common Stock Outstanding | |
| | Weighted Average Number of Shares of Common Stock Outstanding | |
| Basic and Diluted | |
| Basic and Diluted | |
| Basic and Diluted | |
|
KKR Real Estate Finance Trust Inc.
Notes to Consolidated Financial Statements
(dollarsamount in tables in thousands, except per share amounts)
| | 2020 |
| Quarter Ended | | Year Ended |
| March 31 | | June 30 | | September 30 | | December 31 | | December 31, 2020 |
| 2022 | | | 2022 |
| Quarter Ended | | | Quarter Ended | | Year Ended |
| March 31 | | | March 31 | | June 30 | | September 30 | | December 31 | | December 31, 2022 |
| Net Interest Income | Net Interest Income | | | | | | | | | |
| Interest income | |
| Interest income | |
| Interest income | Interest income | $ | 71,079 | | | $ | 67,219 | | | $ | 67,689 | | | $ | 63,201 | | | $ | 269,188 | |
| Interest expense | Interest expense | 39,082 | | | 30,563 | | | 28,832 | | | 28,835 | | | 127,312 | |
| Total net interest income | Total net interest income | 31,997 | | | 36,656 | | | 38,857 | | | 34,366 | | | 141,876 | |
| Other Income (Loss) | (1,541) | | | 493 | | | 1,075 | | | 1,254 | | | 1,281 | |
| Other Income | |
| Operating Expenses | Operating Expenses | 64,946 | | | 8,147 | | | 8,650 | | | 6,605 | | | 88,348 | |
| Income (Loss) Before Income Taxes, Preferred Dividends and Redemption Value Adjustment | (34,490) | | | 29,002 | | | 31,282 | | | 29,015 | | | 54,809 | |
| Income (Loss) Before Income Taxes, Noncontrolling Interests, Preferred Dividends and Participating Securities' Share in Earnings | |
| Income tax expense | Income tax expense | 82 | | | 77 | | | 96 | | | 157 | | | 412 | |
| Net Income (Loss) | Net Income (Loss) | $ | (34,572) | | | $ | 28,925 | | | $ | 31,186 | | | $ | 28,858 | | | $ | 54,397 | |
| Preferred stock dividends and redemption value adjustment | 592 | | | 335 | | | (165) | | | 82 | | | 844 | |
| Noncontrolling interests in income (loss) of consolidated joint venture | |
| Net Income (Loss) Attributable to KKR Real Estate Finance Trust Inc. and Subsidiaries | |
| Preferred stock dividends | |
| Participating securities' share in earnings | |
| Net Income (Loss) Attributable to Common Stockholders | Net Income (Loss) Attributable to Common Stockholders | $ | (35,164) | | | $ | 28,590 | | | $ | 31,351 | | | $ | 28,776 | | | $ | 53,553 | |
| | Net Income (Loss) Per Share of Common Stock | Net Income (Loss) Per Share of Common Stock | |
| Net Income (Loss) Per Share of Common Stock | |
| Net Income (Loss) Per Share of Common Stock | |
| Basic | |
| Basic | |
| Basic | Basic | $ | (0.61) | | | $ | 0.52 | | | $ | 0.56 | | | $ | 0.52 | | | $ | 0.96 | |
| Diluted | Diluted | $ | (0.61) | | | $ | 0.52 | | | $ | 0.56 | | | $ | 0.52 | | | $ | 0.96 | |
| | Weighted Average Number of Shares of Common Stock Outstanding | Weighted Average Number of Shares of Common Stock Outstanding | |
| Weighted Average Number of Shares of Common Stock Outstanding | |
| Weighted Average Number of Shares of Common Stock Outstanding | |
| Basic | |
| Basic | |
| Basic | Basic | 57,346,726 | | | 55,491,937 | | | 55,491,405 | | | 55,619,428 | | | 55,985,014 | |
| Diluted | Diluted | 57,346,726 | | | 55,504,077 | | | 55,632,170 | | | 55,669,230 | | | 56,057,237 | |
|
Schedule IV - Mortgage Loans on Real Estate(F)
December 31, 20212023
(dollars in millions)
| | | | | | | | | | | | | | | | | | | | | | | | | | | | | | | | | | | | | | |
| Description/Location | | Prior Liens(A) | | Face Amount | | Carrying Amount | | Interest Rate(B) | | Payment Terms(C) | | Maturity Date(D) |
Senior Loans(E) | | | | | | | | | | | | |
| Senior Loan 1, Arlington, VA | | N/A | | 352.9 | | | 350.3 | | | L + 3.2% | | I/O | | 10/7/2026 |
| Senior Loan 2, Los Angeles, CA | | N/A | | 249.7 | | | 247.3 | | | L + 3.6% | | I/O | | 3/7/2026 |
| Senior Loan 3, Boston, MA | | N/A | | 243.6 | | | 243.5 | | | L + 3.2% | | I/O | | 1/7/2024 |
| Senior Loan 4, Various | | N/A | | 215.3 | | | 214.3 | | | L + 3.1% | | I/O | | 6/7/2024 |
| Senior Loan 5, New York, NY | | N/A | | 210.7 | | | 209.8 | | | L + 3.6% | | I/O | | 1/7/2024 |
| Senior Loan 6, Minneapolis, MN | | N/A | | 194.4 | | | 193.7 | | | L + 3.8% | | I/O | | 12/5/2022 |
| Senior Loan 7, Mountain View, CA | | N/A | | 184.1 | | | 181.9 | | | L + 3.3% | | I/O | | 8/7/2026 |
| Senior Loan 8, West Palm Beach, FL | | N/A | | 169.2 | | | 167.1 | | | L + 2.7% | | I/O | | 1/7/2027 |
| Senior Loan 9, The Woodlands, TX | | N/A | | 168.3 | | | 165.8 | | | L + 4.2% | | I/O | | 10/7/2026 |
| Senior Loan 10, Philadelphia, PA | | N/A | | 165.0 | | | 165.6 | | | L + 2.5% | | I/O | | 7/7/2023 |
| Senior Loan 11, Philadelphia, PA | | N/A | | 156.9 | | | 155.7 | | | L + 2.6% | | I/O | | 5/7/2024 |
| Senior Loan 12, New York, NY | | N/A | | 148.0 | | | 147.7 | | | L + 2.6% | | I/O | | 12/7/2023 |
| Senior Loan 13, Boston, MA | | N/A | | 137.0 | | | 137.5 | | | L + 2.7% | | I/O | | 4/7/2024 |
| Senior Loan 14, Chicago, IL | | N/A | | 136.6 | | | 135.9 | | | L + 3.3% | | I/O | | 8/7/2024 |
| Senior Loan 15, Dallas, TX | | N/A | | 135.8 | | | 134.1 | | | L + 3.6% | | I/O | | 12/7/2026 |
| Senior Loan 16, Plano, TX | | N/A | | 131.0 | | | 130.2 | | | L + 2.7% | | I/O | | 2/7/2025 |
| Senior Loan 17, Fort Lauderdale, FL | | N/A | | 130.0 | | | 129.4 | | | L + 3.4% | | I/O | | 12/7/2023 |
| Senior Loan 18, Boston, MA | | N/A | | 123.1 | | | 121.6 | | | L + 3.6% | | I/O | | 5/9/2026 |
| Senior Loan 19, Washington D.C. | | N/A | | 119.7 | | | 118.3 | | | L + 3.4% | | I/O | | 1/7/2025 |
| Senior Loan 20, Pittsburgh, PA | | N/A | | 112.5 | | | 111.4 | | | L + 2.9% | | I/O | | 6/7/2026 |
| Senior Loan 21, Washington D.C. | | N/A | | 111.9 | | | 110.0 | | | L + 3.3% | | I/O | | 12/7/2026 |
| Senior Loan 22, Irving, TX | | N/A | | 108.9 | | | 107.9 | | | L + 3.3% | | I/O | | 5/7/2026 |
| Senior Loan 23, Doral, FL | | N/A | | 106.0 | | | 104.8 | | | L + 2.8% | | I/O | | 12/7/2026 |
| Senior Loan 24, San Diego, CA | | N/A | | 103.5 | | | 102.5 | | | L + 2.8% | | I/O | | 11/7/2026 |
| Senior Loan 25, Las Vegas, NV | | N/A | | 102.0 | | | 101.0 | | | L + 2.7% | | I/O | | 1/7/2027 |
| Senior Loan 26, Chicago, IL | | N/A | | 100.7 | | | 100.4 | | | L + 4.7% | | I/O | | 6/7/2024 |
| Senior Loan 27, Bronx, NY | | N/A | | 97.5 | | | 95.7 | | | L + 4.1% | | I/O | | 9/7/2026 |
| Senior Loan 28, Miami, FL | | N/A | | 89.5 | | | 88.6 | | | L + 2.8% | | I/O | | 11/7/2026 |
| Senior Loan 29, Orlando, FL | | N/A | | 88.9 | | | 87.6 | | | L + 3.0% | | I/O | | 1/7/2027 |
| Senior Loan 30, Denver, CO | | N/A | | 88.5 | | | 87.6 | | | L + 3.0% | | I/O | | 7/7/2026 |
| Senior Loan 31, Seattle, WA | | N/A | | 87.3 | | | 86.2 | | | L + 3.1% | | I/O | | 10/7/2026 |
| Senior Loan 32, Dallas, TX | | N/A | | 87.0 | | | 86.2 | | | L + 3.3% | | I/O | | 2/7/2026 |
| Senior Loan 33, New York, NY | | N/A | | 86.0 | | | 85.9 | | | L + 4.0% | | I/O | | 4/7/2023 |
| Senior Loan 34, State College, PA | | N/A | | 85.3 | | | 85.0 | | | L + 2.7% | | I/O | | 11/7/2024 |
| Senior Loan 35, Brisbane, CA | | N/A | | 85.0 | | | 84.0 | | | L + 3.0% | | I/O | | 8/7/2026 |
| Senior Loan 36, Hollywood, FL | | N/A | | 81.0 | | | 79.9 | | | L + 3.0% | | I/O | | 1/7/2027 |
| Senior Loan 37, Seattle, WA | | N/A | | 80.7 | | | 80.6 | | | L + 4.1% | | I/O | | 4/7/2023 |
| Senior Loan 38, Dallas, TX | | N/A | | 77.5 | | | 76.8 | | | L + 2.8% | | I/O | | 1/7/2027 |
| Senior Loan 39, Brooklyn, NY | | N/A | | 76.2 | | | 76.1 | | | L + 2.9% | | I/O | | 2/7/2024 |
| Senior Loan 40, Charlotte, NC | | N/A | | 76.0 | | | 74.9 | | | L + 3.0% | | I/O | | 1/7/2027 |
| Senior Loan 41, Arlington, VA | | N/A | | 70.9 | | | 70.2 | | | L + 3.8% | | I/O | | 10/7/2025 |
| Senior Loan 42, Denver, CO | | N/A | | 69.3 | | | 68.5 | | | L + 2.7% | | I/O | | 10/7/2026 |
| Senior Loan 43, Dallas, TX | | N/A | | 68.2 | | | 67.5 | | | L + 3.8% | | I/O | | 9/7/2026 |
| Senior Loan 44, Queens, NY | | N/A | | 67.5 | | | 59.5 | | | L + 3.0% | | I/O | | 8/7/2022 |
| Senior Loan 45, Austin, TX | | N/A | | 67.5 | | | 67.3 | | | L + 2.5% | | I/O | | 9/7/2024 |
| Senior Loan 46, Washington D.C. | | N/A | | 66.3 | | | 65.8 | | | L + 3.5% | | I/O | | 12/7/2025 |
| Senior Loan 47, Nashiville, TN | | N/A | | 64.3 | | | 63.0 | | | L + 3.6% | | I/O | | 1/7/2027 |
| Senior Loan 48, Bellevue, WA | | N/A | | 61.0 | | | 58.6 | | | L + 3.6% | | I/O | | 4/7/2027 |
| Senior Loan 49, Mesa, AZ | | N/A | | 57.0 | | | 56.3 | | | L + 3.2% | | I/O | | 5/7/2026 |
| Senior Loan 50, Sharon, MA | | N/A | | 56.9 | | | 56.4 | | | L + 2.8% | | I/O | | 12/7/2026 |
| Senior Loan 51, Atlanta, GA | | N/A | | 55.4 | | | 54.7 | | | L + 2.9% | | I/O | | 1/7/2027 |
| Senior Loan 52, Cambridge, MA | | N/A | | 50.6 | | | 49.4 | | | L + 3.9% | | I/O | | 1/7/2027 |
| Senior Loan 53, Durham, NC | | N/A | | 50.0 | | | 49.3 | | | L + 2.9% | | I/O | | 1/7/2027 |
| Senior Loan 54, Fontana, CA | | N/A | | 43.2 | | | 42.3 | | | L + 4.6% | | I/O | | 6/7/2026 |
Schedule IV - Mortgage Loans on Real Estate(F)
December 31, 2021
(dollars in millions)
| | | | | | | | | | | | | | | | | | | | | | | | | | | | | | | | | | | | | | |
| Description/Location | | Prior Liens(A) | | Face Amount | | Carrying Amount | | Interest Rate(B) | | Payment Terms(C) | | Maturity Date(D) |
| Senior Loan 55, Geogetown, TX | | N/A | | 41.8 | | | 41.3 | | | L + 3.3% | | I/O | | 1/7/2027 |
| Senior Loan 56, New York, NY | | N/A | | 39.9 | | | 39.8 | | | L + 4.2% | | I/O | | 4/5/2022 |
| Senior Loan 57, Phoenix, AZ | | N/A | | 15.7 | | | 15.1 | | | L + 4.8% | | I/O | | 5/7/2026 |
| Senior Loan 58, Denver, CO | | N/A | | 10.7 | | | 10.3 | | | L + 3.8% | | I/O | | 1/7/2026 |
| Senior Loan 59, Various | | N/A | | 3.7 | | | 1.9 | | | L + 5.4% | | I/O | | 7/7/2026 |
| | | | | | | | | | | | |
| Mezzanine Loans | | | | | | | | | | | | |
| Mezzanine Loan 1, Boston, MA | | N/A | | 37.5 | | | 37.3 | | | L + 7.9% | | I/O | | 2/7/2026 |
| Mezzanine Loan 2, Oakland, CA | | N/A | | 16.7 | | | 16.8 | | | L + 12.9% | | I/O | | 11/7/2025 |
| Mezzanine Loan 3, Various | | N/A | | 5.5 | | | — | | | 11.0 | | I/O | | 7/6/2025 |
| | | | | | | | | | | | | | | | | | | | | | | | | | | | | | | | | | | | | | | | | | | | | | | |
| Type of Loan | | Description / Location | | Interest Rates(A) | | Maturity Date(B) | | Payment Terms(C) | | Principal Amount | | Carrying Amount |
Senior Loans(D) | | | | | | | | | | | | | | | |
| Senior Loans in excess of 3% of the carrying amount of total loans | | | | | | | | |
| Senior Loan 1 | | Multifamily / Virginia | | + | 3.3% | | October 2026 | | I/O | | $ | 369.0 | | | $ | 367.7 | |
| Senior Loan 2 | | Industrial / Various | | + | 2.7% | | May 2027 | | I/O | | 252.3 | | | 251.8 | |
| Senior Loan 3 | | Multifamily / California | | + | 2.9% | | March 2026 | | I/O | | 220.0 | | | 219.5 |
| Senior Loans less than 3% of the carrying amount of total loans | | | | | | | | |
| Senior Loans | | Multifamily / Diversified | | + | 2.6% | — | 4.0% | | 2024 - 2027 | | I/O | | 2,517.1 | | | 2,509.9 | |
| Senior Loans | | Office / Diversified | | + | 2.3% | — | 3.7% | | 2025 - 2028 | | I/O | | 1,558.9 | | | 1,551.3 | |
| Senior Loans | | Industrial / Diversified | | + | 2.7% | — | 5.5% | | 2024 - 2027 | | I/O | | 820.2 | | | 818.0 | |
| Senior Loans | | Life Science / Diversified | | + | 3.1% | — | 4.5% | | 2026 - 2027 | | I/O | | 754.6 | | | 749.8 | |
| Senior Loans | | Hospitality / Diversified | | + | 3.7% | — | 5.0% | | 2024 - 2027 | | I/O | | 373.1 | | | 372.8 | |
| Senior Loan | | Condo (Residential) / New York | | + | 3.7% | | January 2024 | | I/O | | 149.9 | | | 149.9 | |
| Senior Loan | | Self-Storage / Various | | + | 3.8% | | January 2028 | | I/O | | 129.6 | | | 128.4 | |
| Senior Loan | | Student Housing / Pennsylvania | | + | 3.0% | | June 2026 | | I/O | | 112.5 | | | 112.0 | |
| Senior Loan | | Single Family Rental / Arizona | | + | 4.9% | | May 2026 | | I/O | | 67.7 | | | 67.6 | |
| | | | | | | | | | | | | | | |
| Total senior loans | | | | | | | | | | | | | $ | 7,324.7 | | | $ | 7,298.8 | |
| | | | | | | | | | | | | | | |
| Mezzanine Loans | | | | | | | | | | | | | |
| Mezzanine Loans less than 3% of the carrying amount of total loans | | | | | | | | |
| Mezzanine Loans | | Various / Diversified | | + | 0.4% | — | 13.0% | | 2025 - 2028 | | I/O | | 90.2 | | | 44.7 | |
| Total mezzanine loans | | | | | | | | | | | | | $ | 90.2 | | | $ | 44.7 | |
| | | | | | | | | | | | | | | |
| Total loans | | | | | | | | | | | | | $ | 7,414.9 | | | $ | 7,343.5 | |
| CECL reserve | | | | | | | | | | | | | | | (210.5) | |
| Total loans, net | | | | | | | | | | | | | | | $ | 7,133.1 | |
(A) Represents third-party priority liens. Third-party portions of pari-passu participations are not considered priority liens. Additionally, excludes the outstanding debt on third-party joint ventures of underlying borrowers.Expressed as a spread over Term SOFR.
(B) L = one-month LIBOR rate.Maturity date assumes all extension options are exercised, if applicable.
(C) I/O = interest only until final maturity unless otherwise notednoted.
(D) Maturity date assumes all extension options are exercised, if applicable.
(E) IncludesSenior loans include senior mortgages and similar credit quality investments, including junior participations in our originated senior loans and pari passu participations in senior loans. May include accommodation mezzanine loans in connection withfor which we have syndicated the senior mortgage financing
(F) Excludes 1 real estate corporateparticipations and retained the junior participations for our portfolio and excludes vertical loan to a multifamily operator with an outstanding principal and a carrying amount of $41.1 million and $40.3 million, respectively.participations.
For the activity within KREF's loan portfolio during the year ended December 31, 2021,2023, refer to Note 3 of the consolidated financial statements.
ITEM 9. CHANGES IN AND DISAGREEMENTS WITH ACCOUNTANTS ON ACCOUNTING AND FINANCIAL DISCLOSURE
None.
ITEM 9A. CONTROLS AND PROCEDURES
Evaluation of Disclosure Controls and Procedures
We maintain disclosure controls and procedures (as such term is defined in Rules 13a-15(e) and 15d-15(e) under the Exchange Act) that are designed to ensure that the information required to be disclosed by us in the reports filed or submitted by us under the Exchange Act is recorded, processed, summarized and reported within the time periods specified in the SEC’s rules and forms and such information is accumulated and communicated to management, including the Chief Executive Officer and the Chief Financial Officer, as appropriate, to allow timely decisions regarding required disclosure. Any controls and procedures, no matter how well designed and operated, can provide only reasonable assurances of achieving the desired controls.
As of December 31, 2021,2023, we carried out an evaluation, under the supervision and with the participation of our management, including the Chief Executive Officer and the Chief Financial Officer, of the effectiveness of the design and operation of our disclosure controls and procedures. Based upon that evaluation, our Chief Executive Officer and Chief Financial Officer have concluded that, as of December 31, 2021,2023, our disclosure controls and procedures were effective to accomplish their objectives at the reasonable assurance level.
Management’s Annual Report on Internal Control Over Financial Reporting
Our management is responsible for establishing and maintaining adequate internal control over financial reporting as defined in Rules 13a-15(f) and 15d-15(f) under the Exchange Act. Our internal control over financial reporting is designed to provide reasonable assurance regarding the reliability of financial reporting and the preparation of our consolidated financial statements for external purposes in accordance with generally accepted accounting principles. Our internal control over financial reporting includes those policies and procedures that (1) pertain to the maintenance of records that, in reasonable detail, accurately and fairly reflect the transactions and dispositions of the assets of KREF, (2) provide reasonable assurance that transactions are recorded as necessary to permit preparation of consolidated financial statements in accordance with U.S. generally accepted accounting principles, and that our receipts and expenditures are being made only in accordance with authorizations of our management and directors, and (3) provide reasonable assurance regarding prevention or timely detection of unauthorized acquisition, use or disposition of our assets that could have a material effect on the consolidated financial statements.
Because of its inherent limitations, internal control over financial reporting may not prevent or detect misstatements in our consolidated financial statements. Also, projections of any evaluation of effectiveness to future periods are subject to the risk that controls may become inadequate because of changes in conditions, or that the degree of compliance with the policies or procedures may deteriorate.
Under the supervision and with the participation of our management, including our Chief Executive OfficersOfficer and the Chief Financial Officer, we conducted an evaluation of the effectiveness of our internal control over financial reporting using the criteria set forth by the Committee of Sponsoring Organizations of the Treadway Commission (COSO) in Internal Control-Integrated Framework (2013). Based on its evaluation, our management concluded that our internal control over financial reporting was effective as of the end of the fiscal year covered by this Annual Report on Form 10-K.
Changes in Internal Control over Financial Reporting
No change in our internal control over financial reporting (as such term is defined in Rule 13a-15(f) of the Exchange Act) occurred during the quarter ended December 31, 20212023 that materially affected, or is reasonably likely to materially affect, our internal control over financial reporting.
Attestation Report of the Independent Registered Public Accounting Firm
Deloitte & Touche LLP, our independent registered public accounting firm that audited our consolidated financial statements included in this Annual Report, has issued its attestation report on our internal control over financial reporting, which is included in Part II, Item 8. “Financial Statements and Supplementary Data” of this Annual Report.
ITEM 9B. OTHER INFORMATION
None.Rule 10b5-1 Trading Plans
During the quarter ended December 31, 2023, no director or officer (as defined in Rule 16a-1(f) under the Exchange Act) of the Company adopted or terminated any Rule 10b5-1 trading arrangements or non-Rule 10b5-1 trading arrangements (in each case, as defined in Item 408(a) of Regulation S-K).
ITEM 9C. DISCLOSURE REGARDING FOREIGN JURISDICTIONS THAT PREVENT INSPECTIONS
Not applicable.
PART III.
ITEM 10. DIRECTORS, EXECUTIVE OFFICERS AND CORPORATE GOVERNANCE
We have adopted a code of business conduct and ethics (the “Code of Conduct”) that applies to all of our directors, employees (if any) and the officers and employees of our Manager and its affiliates who provide services to us, including our principal executive officer, principal financial officer, principal accounting officer or controller or persons performing similar functions. Our Code of Conduct, as it relates to employees of KKR, operates in conjunction with, and in addition to, any applicable policies of KKR.
Our Code of Conduct is available the Investor Relations section of our website at www.kkrreit.com. We intend to make any legally required disclosures regarding amendments to, or waivers of, provisions of our Code of Conduct on our website rather than by filing a Current Report on Form 8-K.
The remaining information required by this item is incorporated by reference to the company’s definitive proxy statement to be filed not later than May 2, 2022April 29, 2024 with the SEC pursuant to Regulation 14A under the Exchange Act.
ITEM 11. EXECUTIVE COMPENSATION
The information required by this item is incorporated by reference to the company’s definitive proxy statement to be filed not later than May 2, 2022 withApril 29, 2024 with the SEC pursuant to Regulation 14A under the Exchange Act.
ITEM 12. SECURITY OWNERSHIP OF CERTAIN BENEFICIAL OWNERS AND MANAGEMENT AND RELATED STOCKHOLDER MATTERS
The information required by this item is incorporated by reference to the company’s definitive proxy statement to be filed not later than May 2, 2022April 29, 2024 with the SEC pursuant to Regulation 14A under the Exchange Act.
ITEM 13. CERTAIN RELATIONSHIPS AND RELATED TRANSACTIONS AND DIRECTOR INDEPENDENCE
The information required by this item is incorporated by reference to the company’s definitive proxy statement to be filed not later than May 2, 2022April 29, 2024 with the SEC pursuant to Regulation 14A under the Exchange Act.
ITEM 14. PRINCIPAL ACCOUNTANT FEES AND SERVICES
The information required by this item is incorporated by reference to the company’s definitive proxy statement to be filed not later than May 2, 2022April 29, 2024 with the SEC pursuant to Regulation 14A under the Exchange Act.
PART IV.
ITEM 15. EXHIBITS, FINANCIAL STATEMENT SCHEDULES
(a) The following documents are filed as part of the Annual Report on Form 10-K.
1. Financial Statements
See Item 8 to the Annual Report on Form 10-K.
2. Financial Statement Schedules:
Schedule:
See Schedule IV — Mortgage Loans on Real Estate as of December 31, 20212023 of the Annual Report on Form 10-K.
3. Exhibits:
| | | | | | | | | | | |
Exhibit
Number | | Exhibit Description |
| | | |
| 3.1 | | |
| | | |
| 3.2 | | |
| | | |
| 3.3 | | |
| | | |
| 3.4 | | |
| | | |
| 4.1 | | |
| | | |
| 4.2 | | |
| | | |
| 4.34.2 | | Indenture, dated as of November 28, 2018, among KREF 2018-FL1 Ltd., KREF 2018-FL1 LLC, KREF CLO Loan Seller LLC, Wilmington Trust, National Association, and Wells Fargo Bank, National Association (incorporated by reference to Exhibit 10.1 to the Company’s Current Report on Form 8-K filed on November 29, 2018). |
| | | |
| 4.4 | | |
| | | |
| 4.54.3 | | Indenture, dated as of August 16, 2021, among KREF 2021-FL2 Ltd., KREF 2021-FL2 LLC, KREF CLO Loan Seller LLC, Wilmington Trust, National Association, and Wells Fargo Bank, National Association (incorporated by reference to Exhibit 4.1 to the Company's Current Report on Form 8-K filed on August 19, 2021). |
| | | |
| 4.4 | | | Supplemental Indenture No. 1, dated as of June 26, 2023, among KREF 2021-FL2 Ltd., KREF 2021-FL2 LLC, KREF CLO Loan Seller LLC, Wilmington Trust, National Association, and Wells Fargo Bank, National Association (incorporated by reference to Exhibit 4.1 to the Company's Quarterly Report on Form 10-Q for the quarter ended June 30, 2023). |
| | | |
| 4.5 | | Indenture, dated as of February 10, 2022, among KREF 2022-FL3 Ltd., KREF 2022-FL3 LLC, KREF CLO Loan Seller LLC, Wilmington Trust, National Association, and Computershare Trust Company, National Association (incorporated by reference to Exhibit 4.1 to the Company's Current Report on Form 8-K filed on February 16, 2022). |
| | | |
| 10.1 | | |
| | | |
| 10.2 | | |
| | | |
| 10.3 | | |
| | | |
| 10.4 | | |
| | | |
| | | | | | | | | | | |
Exhibit
Number | | Exhibit Description |
| 10.5 | | |
| | | | | | | | | | | |
Exhibit
Number | | Exhibit Description |
| | | |
| 10.6 | | |
| | | |
| 10.7 | | |
| | | |
| 10.8 | | Amended and Restated Loan and Servicing Agreement, dated as of April 11, 2018,December 20, 2022, among KREF Holdings VII LLC, KREF Lending VII LLC, PNC Bank, National Association, Midland Loan Services, a division of PNC Bank, National Association, the Initial Lender, and KKR Capital Markets LLC (incorporated by reference to Exhibit 10.710.1 to the Company’s AnnualCompany's Quarterly Report on Form 10-K10-Q for the yearquarter ended December 31, 2018)June 30, 2023). |
| | | |
| 10.9 | | First Amendment to Amended and Restated Loan and Servicing Agreement, dated as of December 20, 2019.June 27, 2023, among KREF Holdings VII LLC, KREF Lending VII LLC, PNC Bank, National Association, Midland Loan Services, a division of PNC Bank, National Association, the Initial Lender, and the Lenders parties theretoKKR Capital Markets LLC (incorporated by reference to Exhibit 10.9 to the Company’s Annual Report on Form 10-K for the year ended December 31, 2019). |
| | | |
| 10.10 | | |
| | | |
| 10.11 | | |
| | | |
| 10.12 | | |
| | | |
| 10.13 | | |
| | | |
| 10.14 | | |
| | | |
| 10.15 | | |
| | | |
| 10.1610.10 | | |
| | | |
| 10.17 | | |
| | | |
| | | | | | | | | | | |
Exhibit
Number | | Exhibit Description |
| 10.18 | | |
| | | |
| 10.19 | | |
| | | |
| 10.20 | | |
| | | |
| 10.2110.11 | | |
| | | |
| 10.2210.12 | | |
| | | |
| 10.13 | | | |
| | | |
| 10.2310.14 | | |
| | | |
| 10.15 | | |
| | | |
| 10.2410.16 | | |
| | | |
| 10.2510.17 | | |
| | | |
| | | | | | | | | | | |
Exhibit
Number | | Exhibit Description |
| 10.2610.18 | | |
| | | |
| 10.2710.19 | | |
| | | |
| 10.2810.20 | | |
| | | |
| 10.2910.21 | | |
| | | |
| 10.22 | | | |
| | | |
| 10.23 | | |
| | | |
| 10.24 | | |
| | | |
| 10.25* | | |
| | | |
| 10.26 | | |
| | | |
| 10.27* | | |
| | | |
| 10.28* | | |
| | | |
| 10.29* | | |
| | | |
| | | | | | | | | | | |
Exhibit
Number | | Exhibit Description |
| 10.30 | | |
| | | |
| | | | | | | | | | | |
| Exhibit
Number | Exhibit Description |
| 10.31 | | |
| | | |
| 10.32 | | |
| | | |
| 10.33 | | |
| | | |
| 10.34 | | |
| | | |
| 10.35 | | |
| | | |
| 10.36 | | Amendment No. 2 to Master Repurchase and Securities Contract, Guarantee Agreement, Servicing Agreement and Custodial Agreement, dated as of September 9, 2016, among KREF Lending I LLC, Wells Fargo Bank, National Association, KKR Real Estate Finance Holdings, L.P. and Situs Asset Management LLC (incorporated by reference to Exhibit 10.12 to the Company’s Registration on Form S-11 filed on April 3, 2017). |
| | | |
| 10.37 | | |
| | | |
| 10.38 | | |
| | | |
| 10.39 | | |
| | | |
| 10.40 | | |
| | | |
| 10.41 | | |
| | | |
| 10.4110.42 | | |
| | | |
| 10.42 | | |
| | | |
| | | | | | | | | | | |
Exhibit
Number | | Exhibit Description |
| 10.43 | | Second Omnibus Amendment and Reaffirmation Agreement to Masterthe MUFG Repurchase Agreement, dated as of June 29, 2021, by andMarch 31, 2022, among Morgan Stanley Mortgage Capital Holdings LLC, Morgan Stanley Bank, N.A. and the other Buyers named therein, and KREF Lending VIX LLC, KREF Holdings IX LLC, KREF Capital LLC, KKR Real Estate Finance Holdings L.P. and MUFG Bank, Ltd. (incorporated by reference to Exhibit 10.610.3 to the Company’s Quarterly Report on Form 10-Q for the quarter ended June 30, 2021)March 31, 2022). |
| | | |
| 10.44* | | | |
| | | |
| 10.4410.45 | | |
| | | |
| 10.46 | | |
| | | |
| 10.45†10.47† | | |
| | | |
| 10.46†10.48† | | |
| | | |
| 10.47†10.49† | | |
| | | |
| 10.48†10.50† | | |
| | | |
| 10.49†10.51† | | |
| | | |
| 10.50†10.52† | | |
| | | |
| 10.53† | | | |
| | | |
| 21.1 | | |
| | | |
| 23.1 | | |
| | | |
| 31.1 | | |
| | | |
| 31.2 | | |
| | | |
| 32.1 | | |
| | | |
| | | | | | | | | | | |
Exhibit
Number | | | Exhibit Description |
| 32.2 | | |
| | | |
| 97.1 | | | Policy Relating to Recovery of Erroneously Awarded Compensation. |
| | | |
| 101.INS | | Inline XBRL Instance Document - the instance document does not appear in the Interactive Data File because its XBRL tags are embedded within the Inline XBRL document. |
| | | |
| 101.SCH | | Inline XBRL Taxonomy Extension Schema Document. |
| | | |
| 101.CAL | | Inline XBRL Taxonomy Extension Calculation Linkbase Document. |
| | | |
| 101.DEF | | Inline XBRL Taxonomy Extension Definition Linkbase Document. |
| | | |
| 101.LAB | | Inline XBRL Taxonomy Extension Label Linkbase Document. |
| | | |
| 101.PRE | | Inline XBRL Taxonomy Extension Presentation Linkbase Document. |
| | | | | | | | | | | |
| Exhibit
Number | Exhibit Description |
| | | |
| 104 | | Cover Page Interactive Data File, formatted in Inline XBRL and contained in Exhibit 101. |
* Certain information contained in this agreement has been omitted because it is not material and is the type that the registrant treats as private or confidential.
† Management contract or compensatory plan in which directors and/or executive officers are eligible to participate.
Certain agreements and other documents filed as exhibits to this Annual Report on Form 10-K contain representations and warranties that the parties thereto made to each other. These representations and warranties have been made solely for the benefit of the other parties to such agreements and may have been qualified by certain information that has been disclosed to the other parties to such agreements and other documents and that may not be reflected in such agreements and other documents. In addition, these representations and warranties may be intended as a way of allocating risks among parties if the statements contained therein prove to be incorrect, rather than as actual statements of fact. Accordingly, there can be no reliance on any such representations and warranties as characterizations of the actual state of facts. Moreover, information concerning the subject matter of any such representations and warranties may have changed since the date of such agreements and other documents.
ITEM 16. FORM 10-K SUMMARY
None.
SIGNATURES
Pursuant to requirements of Section 13 or 15(d) of the Securities Exchange Act of 1934, the registrant has duly caused this report to be signed on its behalf by the undersigned, thereunto duly authorized.
| | | | | | | | | | | |
| | KKR REAL ESTATE FINANCE TRUST INC. |
| | | |
| Date: | February 8, 20226, 2024 | By: | /s/ Matthew A. Salem |
| | | Name: Matthew A. Salem |
| | | Title: Chief Executive Officer and Director |
| | | (Principal Executive Officer) |
Pursuant to the requirements of the Securities Exchange Act of 1934, this report has been signed below by the following persons on behalf of the registrant and in the capacities indicated below and on the dates indicated below.
| | | | | | | | | | | |
| Date: | February 8, 20226, 2024 | By: | /s/ Matthew A. Salem |
| | | Name: Matthew A. Salem |
| | | Title: Chief Executive Officer and Director |
| | | (Principal Executive Officer) |
| | | |
| Date: | February 8, 20226, 2024 | By: | /s/ Mostafa NagatyKendra L. Decious |
| | | Name: Mostafa NagatyKendra L. Decious |
| | | Title: Chief Financial Officer and Treasurer |
| | | (Principal Financial and Accounting Officer) |
| | | |
| Date: | February 8, 20226, 2024 | By: | /s/ Ralph F. Rosenberg |
| | | Name: Ralph F. Rosenberg |
| | | Title: Director |
| | | |
| Date: | February 8, 20226, 2024 | By: | /s/ Christen E.J. Lee |
| | | Name: Christen E.J. Lee |
| | | Title: Director |
| | | |
| | | |
| | | |
| | | |
| | | |
| Date: | February 8, 2022 | By: | /s/ Todd A. Fisher |
| | | Name: Todd A. Fisher |
| | | Title: Director |
| | | |
Date: | February 8, 20226, 2024 | By: | /s/ Terrence R. Ahern |
| | | Name: Terrence R. Ahern |
| | | Title: Director |
| | | |
| Date: | February 8, 20226, 2024 | By: | /s/ Jonathan A. Langer |
| | | Name: Jonathan A. Langer |
| | | Title: Director |
| | | |
| Date: | February 8, 20226, 2024 | By: | /s/ Deborah H. McAneny |
| | | Name: Deborah H. McAneny |
| | | Title: Director |
| | | |
| Date: | February 8, 20226, 2024 | By: | /s/ Irene M. Esteves |
| | | Name: Irene M. Esteves |
| | | Title: Director |
| | | |
| Date: | February 8, 20226, 2024 | By: | /s/ Paula Madoff |
| | | Name: Paula Madoff |
| | | Title: Director |