On March 12, 2020, the U.S. Securities and Exchange Commission voted to adopt amendmentsdiscretionary bonuses were awarded to the
"accelerated filer" and "large accelerated filer" definitions in Rule 12b-2 under the Securities Exchange Act of 1934. The amendments increased the transition thresholds for large accelerated filers to exit the large accelerated filer status from $500 million to $560 million. The measurement is performed annually each June 30th using that day's Class A common stock closing price applied to the number of Class A commons shares considered to be publicly traded float, which is defined as the number of shares available to the public for trading in the secondary market without restriction. This excludes, among others, shares held by officers and directors. As of June 30, 2020, the Company's public float was less than $560 million and changed the Company's filing status from large accelerated filer to accelerated filer. At June 30, 2021, there was no change in the Company's filing status as an accelerated filer.Named Executive Officers.
Equity Security Holders
The number of stockholders of record on March 7, 2022 was as follows:
| | | | | |
Class A Common Stock | 2,047 | |
Class B Common Stock | 2 | |
Dividends
Class B common stockholders receive dividends at one-half the per share amount declared on Class A common stock. During 2021, NWLGI paid cash dividends on its Class A and Class B common stock in the amounts of $1.2 million and $36,000, respectively. During 2020, the Company also paid cash dividends on its Class A and Class B common stock in the amounts of $1.2 million and $36,000, respectively. Payment of dividends is within the discretion of the Company’s Board of Directors.
Payment of dividends by National Western Life Insurance Company ("National Western") to NWLGI, as the sole owner of National Western, are also within the discretion of National Western's Board of Directors, but are subject to prescribed limitations set by the Colorado Division of Insurance without prior approval. The Company’s general policy is to reinvest earnings internally to finance the development of new business, provide for potential acquisitions, and to lend support to its financial strength ratings assigned by independent rating agencies. In the years ended December 31, 2021 and 2020, National Western did not declare or pay dividends to NWLGI.
Securities Authorized For Issuance Under Equity Compensation Plans
The Company currently has one equity compensation plan, thatwhich was originally approved by security holdersNWLIC’s stockholders in 2008. ThisThat equity plan was assumed by NWLGI from National WesternNWLIC in 2015 pursuant to the terms of the holding company reorganization. TheThereafter, the plan was amended, restated and approved by stockholders of NWLGI in June 2016, extending its term for ten years from the date of stockholder approval. There are no outstanding options atIn December 2022, this plan was amended and restated by the Board of Directors to make certain technical and administrative changes. This amended and restated incentive plan, as amended, is referred to in this annual report as the “Amended Incentive Plan.” As of December 31, 2021 under the plan which would otherwise entitle option holders to shares. At December 31, 2021,2023, there were a total of 291,000 shares of Class A common stock remain availableStock that were authorized for future issuance underupon the plan.
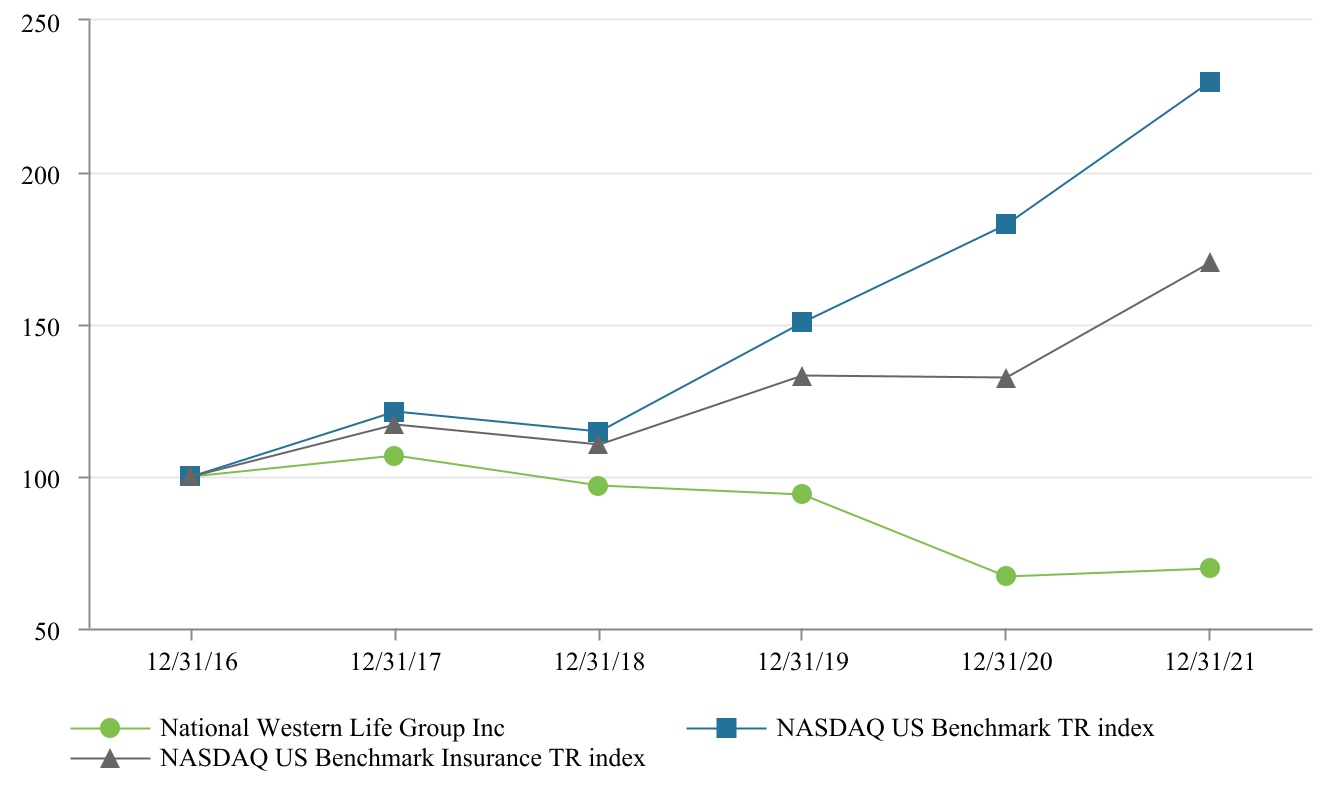
Performance Graph
The following graph compares the annual percentage change in the Company's cumulative total return on its common stock over the past five years with the total returnsettlement or exercise, as applicable, of companies comprising the NASDAQ - U.S. Benchmark TR index and the NASDAQ - US Benchmark Insurance TR index. The graph assumes that the value of the Company's Class A common stock and each index was $100 at December 31, 2016, and that all dividends were reinvested. The NASDAQ US Benchmark TR index replaces the NASDAQ Stock Market (US Companies) Index and the NASDAQ US Benchmark Insurance TR index replaces the NASDAQ Insurance Index in this analysis and going forward, as the CRSP Index data is no longer accessible.
Issuer Purchases of Equity Securities
Effective August 22, 2008, National Western adopted and implemented a limited stock buy-back program associated with the 2008 Incentive Plan which provides Option Holders the additional alternative of selling shares acquired through the exercise of options directly back to the Company. This plan and program was assumed by NWLGI from National Western in 2015awards granted pursuant to the terms of the holding company reorganization. The program provides Option Holders with the ability to elect to sell acquired shares back to the Company at any time within ninety (90) days after the exercise of options at the prevailing market price as of the date of notice of election. As of December 31, 2021, there are no options outstanding under the plan.
The following table sets forth the Company’s issuance and repurchase activity of its Class A common shares from Option Holders for the quarter ended December 31, 2021.
| | | | | | | | | | | | | | | | | | | | | | | | | | |
Period | | Total Number of Shares Purchased | | Average Price Paid Per Share | | Total Number of Shares Purchased as Part of Publicly Announced Plans or Programs | | Approximate Dollar Value of Shares that May yet Be Purchased Under the Plans or Programs |
| | | | | | | | |
October 1, 2021 through October 31, 2021 | | — | | | $ | — | | | N/A | | N/A |
November 1, 2021 through November 30, 2021 | | — | | | $ | — | | | N/A | | N/A |
December 1, 2021 through December 31, 2021 | | — | | | $ | — | | | N/A | | N/A |
| | | | | | | | |
Total | | — | | | $ | — | | | N/A | | N/A |
Purchased shares are reported in the Company's Consolidated Financial Statements as authorized and unissued.
ITEM 7. MANAGEMENT’S DISCUSSION AND ANALYSIS
OF FINANCIAL CONDITION AND RESULTS OF OPERATIONS
Forward-Looking Statements
The Private Securities Litigation Reform Act of 1995 provides a “safe harbor” for forward-looking statements. Certain information contained herein or in other written or oral statements made by or on behalf of National Western Life Group, Inc. and its subsidiaries (the "Company") are or may be viewed as forward-looking. Although the Company has taken appropriate carehistorically granted stock options, in developing any such information, forward-looking information involves risks and uncertainties that could significantly impact actual results. These risks and uncertainties include, but are not limited to, matters described in the Company's filings such as exposure to market risks, anticipated cash flows or operating performance, future capital needs, and statutory or regulatory related issues. However, as a matter of policy, the Company does not make any specific projections as to future earnings, nor does it endorse any projections regarding future performance that may be made by others. Whether or not actual results differ materially from forward-looking statements may depend on numerous foreseeable and unforeseeable events or developments. Also, the Company undertakes no obligation to publicly update or revise any forward-looking statements, whether as a result of new information, future developments, or otherwise.
Management’s discussion and analysis of the financial condition and results of operations (“MD&A”) of National Western Life Group, Inc. ("NWLGI") for the three years ended December 31, 2021 follows. Where appropriate, discussion specific to the insurance operations of National Western Life Insurance Company is denoted by "National Western" or "NWLIC". This discussion should be read in conjunction with the Company’s Consolidated Financial Statements and related notes beginning on page 97 of this report.
Effective January 31, 2019, the Company completed its previously announced acquisition of Ozark National Life Insurance Company ("Ozark National") and N.I.S. Financial Services, Inc. ("NIS") following the receipt of regulatory approvals. NWLGI and National Western paid cash in an aggregate amount of approximately $205.4 million in exchange for all of the outstanding stock of Ozark National (wholly owned by National Western) and NIS (wholly owned by NWLGI). The eleven month results of Ozark National and NIS are included in the Company's Consolidated Financial Statements as of and for the year ended December 31, 2019 and reference to each is made in this MD&A where appropriate.
Overview
National Western has historically provided life insurance products on a global basis for the savings and protection needs of policyholders and issued annuity contracts for the asset accumulation and retirement needs of contract holders, both domestic and international residents. As disclosed in the Company's 2018 filings, the Company discontinued accepting applications for its international life insurance products from all foreign residents in other countries in the second quarter of 2018.
The Company, National Western and Ozark National, accepts funds from policyholders or contract holders and establishes a liability representing future obligations to pay the policy or contract holders and their beneficiaries. To ensure the Company will be able to pay these future commitments, the funds received as premium payments and deposits are invested in high quality investments, primarily fixed income securities.
Due to the business of accepting funds to pay future obligations in later years and the underlying economics, the relevant factors affecting the Company’s overall business and profitability include the following:
| | | | | |
● | the level of sales and premium revenues collected |
● | the volume of life insurance and annuity business in force |
● | persistency of policies and contracts |
● | the ability to price products to earn acceptable margins over benefit costs and expenses |
● | return on investments sufficient to produce acceptable spread margins over interest crediting rates |
● | investment credit quality which minimizes the risk of default or impairment |
● | levels of policy benefits and costs to acquire business |
● | the ability to manage the level of operating expenses |
● | effect of interest rate changes on revenues and investments including asset and liability matching |
● | maintaining adequate levels of capital and surplus |
● | corporate tax rates and the treatment of financial statement items under tax rules and accounting |
● | actual levels of surrenders, withdrawals, claims and interest spreads |
● | changes in assumptions for amortization of deferred policy acquisition expenses and deferred sales inducements |
● | changes in the fair value of derivative index options and embedded derivatives pertaining to fixed-index life and annuity products |
● | pricing and availability of adequate counterparties for reinsurance and index option contracts |
● | litigation subject to unfavorable judicial development, including the time and expense of litigation |
The Company monitors these factors continually as key business indicators. The discussion that follows in this Item 6 includes these indicators and presents information useful to an overall understanding of the Company’s business performance in 2021, incorporating required disclosures in accordance with the rules and regulations of the Securities Exchange Commission ("SEC").
Impact of Recent Business Environment
The Company's business is generally aided by an economic environment experiencing growth, whether moderate or vibrant, characterized by improving employment data and increases in personal income. Important metrics indicating sustained economic growth over the longer term principally revolve around employment and confidence, both consumer and business sentiment.
The COVID-19 pandemic not only affected how businesses conducted operations but also introduced a great deal of uncertainty to the life insurance industry. The morbidity exposure of COVID-19 translated into a higher death claim incidence throughout the industry and was a frequently discussed item in company earnings releases. In 2021, the Company (National Western and Ozark National) incurred approximately $32 million in net death claims for which COVID-19 was identified as the cause of death, an increase from $8 million in the preceding year. However, composite reports tracking the incidence of COVID-19 death activity appear to suggest that a peak occurred in the third quarter of 2021 with noticeable declines observed thereafter.
Another consequence of the pandemic has been the impact on investment yields and asset valuations. Interest rates have hovered at levels making traditional industry investments in fixed income debt securities insufficient to price products competitively or to meet minimum interest rate guarantees without reducing internal rates of return below required targets. Seizing on this situation, large investment entities have entered the industry through acquisitions or reinsurance transactions in order to tap insurance company portfolios of low yielding assets with the goal of using specific investment expertise to roll these assets into higher yielding, and higher risk, assets. While the COVID-19 environment has not caused widespread declines in the value of invested assets through downgrades in credit market securities, insurers have still faced fair value decreases resulting in unrealized losses, impairment-related losses or sizable additions being made to the allowance for current credit losses in financial statements.
In recent years, in an attempt to acquire additional investment yield in the low rate environment, life insurers substantially increased allocations to BBB- rated bonds. In a recession, many of these investment grade corporate credits are at risk for downgrades, as well as the potential to default. Risk-based capital (RBC) formulas assess higher required capital charges as investment quality declines. A meaningful shift of BBB- rated debt securities to non-investment grade categories could have significant implications in terms of required capital levels which would depress RBC ratios of impacted insurers. Life insurance companies also have a large exposure to real estate in its investment portfolios through commercial mortgage, direct real estate investment, alternative investment funds, and mortgage-backed securities. These investments are highly dependent upon occupancy and payment of rent and lease obligations.
With regard to the credit market, industry analysts and observers generally agree that a sudden jump in interest rate levels would be harmful to life insurers with interest-sensitive products as it could provide an impetus for abnormal levels of product surrenders and withdrawals at the same time fixed debt securities held by insurers declined in market value. The current rise of inflation rates has prompted Federal Reserve officials to begin signalling their intent to commence with a series of interest rate increases in order to head off the crippling effects of rising prices. Ultimately, a mix of monetary policy adjustments, fiscal policy, and economic fundamentals will determine the degree of interest rate increases and the speed of such shifts. It is uncertain what impacts, if any, such movements would have on the Company’s business, results of operations, cash flows or financial condition.
In an environment such as this, the need for a strong capital position that can cushion against unexpected bumps is critical for stability and ongoing business activity. The Company's operating strategy continues to be focused on maintaining capital levels substantially above regulatory and rating agency requirements. In addition, its business model is predicated upon steady growth in invested assets while managing the block of business within profitability objectives. A key premise of the Company's financial management is maintaining a high quality investment portfolio, well matched in terms of duration with policyholder obligations, that continues to outperform the industry with respect to adverse impairment experience. This discipline enables the Company to sustain resources more than adequate to fund future growth and absorb abnormal periods of cash outflows.
Critical Accounting Policies
Accounting policies discussed below are those considered critical to an understanding of the Company’s financial statements.
Impairment of Investment Securities. The Company’s accounting policy requires that a decline in the value of a security below its amortized cost basis be evaluated to determine if the decline is a result of credit loss. The primary factors considered in evaluating whether a decline in value for fixed income and equity securities without readily determinable fair values is a result of credit loss are: (a) the length of time and the extent to which the fair value has been less than cost, (b) the reasons for the decline in value (credit event, interest rate related, credit spread widening), (c) the overall financial condition as well as the near-term prospects of the issuer, (d) whether the debtor is current on contractually obligated principal and interest payments, and (e) that the Company does not intend or be required to sell the investment prior to recovery. In addition, certain securitized financial assets with contractual cash flows are evaluated periodically by the Company to update the estimated cash flows over the life of the security. If the Company determines that the fair value of the securitized financial asset is less than its carrying amount and there has been a decrease in the present value of the estimated cash flows since the previous purchase or prior impairment, then a credit loss charge is recognized. The Company would recognize impairment of securities due to changing interest rates or market dislocations only if the Company intended to sell the securities prior to recovery. When a security is deemed to be impaired, a charge is recorded equal to the difference between the fair value and amortized cost basis of the security. In compliance with GAAP guidance after adoption of ASU 2016-13, Financial Instruments-Credit Losses the estimated credit loss is recorded as an allowance with changes in the allowance recorded to Net investment income in the Consolidated Statements of Earnings.
Deferred Policy Acquisition Costs (“DPAC”). The Company is required to defer certain policy acquisition costs and amortize them over future periods. These costs include commissions and certain other expenses that vary with and are directly associated with acquiring new business. The deferred costs are recorded as an asset commonly referred to as deferred policy acquisition costs. The DPAC asset balance is subsequently charged to income over the lives of the underlying contracts in relation to the anticipated emergence of revenue or profits. Actual revenue or profits can vary from Company estimates resulting in increases or decreases in the rate of amortization. The Company performs regular evaluations of its universal life and annuity contracts to determine if actual experience or other evidence suggests that earlier estimates should be revised. Assumptions considered significant include surrender and lapse rates, mortality, expense levels, investment performance, and estimated interest spread. Should actual experience dictate that the Company change its assumptions regarding the emergence of future revenues or profits (commonly referred to as “unlocking”), the Company would record a charge or addition to bring its DPAC balance to the level it would have been if using the new assumptions from the inception date of each policy.
DPAC is also subject to periodic recoverability and loss recognition testing. These tests ensure that the present value of future contract-related cash flows will support the capitalized DPAC balance to be amortized in the future. The present value of these cash flows, less the benefit reserve, is compared with the unamortized DPAC balance and if the DPAC balance is greater, the deficiency is charged to expense as a component of amortization and the asset balance is reduced to the recoverable amount. For more information about accounting for DPAC see Note (1), Summary of Significant Accounting Policies, in the accompanying Notes to Consolidated Financial Statements in this report.
Deferred Sales Inducements ("DSI"). Costs related to sales inducements offered on sales to new customers, principally on investment type contracts and primarily in the form of additional credits to the customer’s account value or enhancements to interest credited for a specified period, which are beyond amounts currently being credited to existing contracts, are deferred and recorded as other assets. All other sales inducements are expensed as incurred and included in interest credited to contract holders’ funds. Deferred sales inducements are amortized to income using the same methodology and assumptions as DPAC, and are included in interest credited to contract holders’ funds. Deferred sales inducements are also periodically reviewed for recoverability. For more information about accounting for deferred sales inducementssee Note (1), Summary of Significant Accounting Policies, in the accompanying Notes to Consolidated Financial Statements in this report.
Value of Business Acquired ("VOBA"). VOBA is a purchase accounting convention for life insurance companies in business combinations based upon an actuarial determination of the difference between the fair value of policyholder liabilities acquired and the same policyholder liabilities measured in accordance with the acquiring company's accounting policies. The difference, referred to as VOBA, is an intangible asset subject to periodic amortization. Similar to DPAC and DSI, VOBA is subject to periodic analysis assessing recoverability.
Future Policy Benefits. Because of the long-term nature of insurance contracts, the Company is liable for policy benefit payments many years into the future. The liability for future policy benefits represents estimates of the present value of the Company’s expected benefit payments, net of the related present value of future net premium collections. For traditional life insurance contracts, this is determined by standard actuarial procedures, using assumptions as to mortality (life expectancy), morbidity (health expectancy), persistency, and interest rates, which are based on the Company’s experience with similar products. The assumptions used are those considered to be appropriate at the time the policies are issued. An additional provision is made on most products to allow for possible adverse deviation from the assumptions assumed. For universal life and annuity products, the Company’s liability is the amount of the contract’s account balance. Account balances are also subject to minimum liability calculations as a result of minimum guaranteed interest rates in the policies. While management and Company actuaries have used their best judgment in determining the assumptions and in calculating the liability for future policy benefits, there is no assurance that the estimate of the liabilities reflected in the financial statements represents the Company’s ultimate obligation. In addition, significantly different assumptions could result in materially different reported amounts. A discussion of the assumptions used to calculate the liability for future policy benefits is reported in Note (1), Summary of Significant Accounting Policies, in the accompanying Notes to Consolidated Financial Statements in this report.
Revenue Recognition. Premium income for the Company’s traditional life insurance contracts is generally recognized as the premium becomes due from policyholders. For annuity and universal life contracts, the amounts collected from policyholders are considered deposits and are not included in revenue. For these contracts, fee income consists of policy charges for policy administration, cost of insurance charges and surrender charges assessed against policyholders’ account balances which are recognized in the period the services are provided.
Investment activities of the Company are integral to its insurance operations. Since life insurance benefits may not be paid until many years into the future, the accumulation of cash flows from premium receipts are invested with income reported as revenue when earned. Anticipated yields on investments are reflected in premium rates, contract liabilities, and other product contract features. These anticipated yields are implied in the interest required on the Company’s net insurance liabilities (future policy benefits less deferred acquisition costs) and contractual interest obligations in its insurance and annuity products. The Company benefits to the extent actual net investment income exceeds the required interest on net insurance liabilities and manages the rates it credits on its products to maintain the targeted excess or “spread” of investment earnings over interest credited. The Company will continue to be required to provide for future contractual obligations in the event of a decline in investment yield. For more information concerning revenue recognition, investment accounting, and interest sensitivity, please refer to Note (1), Summary of Significant Accounting Policies, and Note (3), Investments, in the accompanying Notes to Consolidated Financial Statements in this report, and the discussions under Investments in Item 6 of this report.
Pension Plans and Other Postretirement Benefits. The Company sponsors a qualified defined benefit pension plan, which was frozen effective December 31, 2007, covering substantially all employees at that time, and three non-qualified defined benefit plans covering certain senior officers. In addition, the Company has postretirement health care benefits for certain senior officers. The freeze of the qualified benefit pension plan ceased future benefit accruals to all participants and closed the Plan to any new participants. In addition, all participants became immediately 100% vested in their accrued benefits as of that date. In accordance with prescribed accounting standards, the Company annually reviews plan assumptions.
The Company annually reviews its pension benefit plans' assumptions which include the discount rate, the expected long-term rate of return on plan assets, and the compensation increase rate. The assumed discount rate is set based on the rates of return on high quality long-term fixed income investments currently available and expected to be available during the period to maturity of the pension benefits. The assumed long-term rate of return on plan assets is generally set at the rate expected to be earned based on the long-term investment policy of the plans, the various classes of the invested funds, input of the plan’s investment advisors and consulting actuary, and the plan’s historic rate of return. The compensation rate increase assumption is generally set at a rate consistent with current and expected long-term compensation and salary policy, including inflation. These assumptions involve uncertainties and judgment, and therefore actual performance may not be reflective of the assumptions.
Other postretirement benefit assumptions include future events affecting retirement age, mortality, dependency status, per capita claims costs by age, health care trend rates, and discount rates. Per capita claims cost by age is the current cost of providing postretirement health care benefits for one year at each age from the youngest age to the oldest age at which plan participants are expected to receive benefits under the plan. Health care trend rates involve assumptions about the annual rate(s) of change in the cost of health care benefits currently provided by the plan, due to factors other than changes in the composition of the plan population by age and dependency status. These rates implicitly consider estimates of health care inflation, changes in utilization, technological advances, and changes in health status of the participants.
Share-Based Payments. Liability awards under a share-based payment arrangement have been measured based on the awards’ fair value at the reporting date. The Black-Scholes valuation method is used to estimate the fair value of the options. This fair value calculation of the options includes assumptions relative to the following:
| | | | | |
● | exercise price |
● | expected term based on contractual term and perceived future behavior relative to exercise |
● | current price |
● | expected volatility |
● | risk-free interest rates |
● | expected dividends |
These assumptions are continually reviewed by the Company and adjustments may be made based upon current facts and circumstances.
Other significant accounting policies, although not involving the same level of measurement uncertainties as those discussed above, but nonetheless important to an understanding of the financial statements, are described in Note (1), Summary of Significant Accounting Policies, in the accompanying Notes to Consolidated Financial Statements in this report.
RESULTS OF OPERATIONS
The Company’s Consolidated Financial Statements are prepared in accordance with U.S. generally accepted accounting principles (“GAAP”). In addition, the Company regularly evaluates operating performance using non-GAAP financial measures which exclude or segregate derivative and realized investment gains and losses from operating revenues. Similar measures are commonly used in the insurance industry in order to assess profitability and results from ongoing operations. The Company believes that the presentation of these non-GAAP financial measures enhances the understanding of the Company’s results of operations by highlighting the results from ongoing operations and the underlying profitability factors of the Company’s business. The Company excludes or segregates derivative and realized investment gains and losses because such items are often the result of events which may or may not be at the Company’s discretion and the fluctuating effects of these items could distort trends in the underlying profitability of the Company’s business. Therefore, in the following sections discussing consolidated operations and segment operations, appropriate reconciliations have been included to report information management considers useful in enhancing an understanding of the Company’s operations to reportable GAAP balances reflected in the Consolidated Financial Statements.
Consolidated Operations
Revenues. The following details Company revenues:
| | | | | | | | | | | | | | | | | |
| | Years Ended December 31, |
| | 2021 | | 2020 | | 2019 |
| | (In thousands) |
| | | | | |
| Universal life and annuity contract charges | $ | 134,254 | | | 145,405 | | | 149,721 | |
| Traditional life premiums | 90,043 | | | 92,542 | | | 90,248 | |
| Net investment income (excluding index option derivatives) | 441,812 | | | 402,448 | | | 432,285 | |
| Other revenues | 22,314 | | | 18,522 | | | 17,486 | |
| | | | | |
| | | | | |
| Derivative gain, index options | 120,718 | | | 14,754 | | | 123,207 | |
| Net realized investment gains | 14,950 | | | 21,071 | | | 6,241 | |
| | | | | |
| Total revenues | $ | 824,091 | | | 694,742 | | | 819,188 | |
Universal life and annuity contract revenues - Revenues for universal life and annuity products consist of policy charges for the cost of insurance, administration charges, and surrender charges assessed against policyholder account balances, less reinsurance premiums. As depicted in the following table, revenues for universal life and annuity contract charges decreased in 2021 compared to 2020 due to lower surrender charge revenue from terminated policies and lower cost of insurance charges associated with decreased levels of universal life insurance in force.
| | | | | | | | | | | | | | | | | |
| | Years Ended December 31, |
| Contract Charges: | 2021 | | 2020 | | 2019 |
| | (In thousands) |
| | | | | |
| Cost of insurance and administrative charges | $ | 122,961 | | | 124,821 | | | 126,049 | |
| Surrender charges | 25,363 | | | 26,623 | | | 33,079 | |
| Other charges | 4,347 | | | 11,430 | | | 8,171 | |
| Gross contract revenues | 152,671 | | | 162,874 | | | 167,299 | |
| | | | | |
| Reinsurance premiums | (18,417) | | | (17,469) | | | (17,578) | |
| | | | | |
| Net contract charges | $ | 134,254 | | | 145,405 | | | 149,721 | |
Cost of insurance charges were $95.9 million in 2021 compared to $98.9 million in 2020 and $102.0 million in 2019. Cost of insurance charges typically trend with the size of the universal life insurance block in force and the amount of new business issued during the period. The volume of universal life insurance in force during 2021 decreased to $12.7 billion from $13.5 billion at year-end 2020 and $14.4 billion at year-end 2019. Administrative charges were $27.1 million, $25.9 million, and $24.1 million for the years ended December 31, 2021, 2020 and 2019, respectively, and correlate with new universal life insurance business sales by the number of policies placed, the amount of premiums received and the volume of insurance issued.
Surrender charges assessed against policyholder account balances upon withdrawal were $25.4 million in 2021 compared to $26.6 million in 2020 and $33.1 million in 2019. The Company earns surrender charge income that is assessed upon policy terminations, however, the Company’s overall profitability is enhanced when policies remain in force and additional contract revenues are realized and the Company continues to make an interest rate spread equivalent to the difference it earns on its investment and the amounts that it credits to policyholders. While policy lapse rates in 2021 for the domestic life insurance and international life insurance segments were somewhat lower than those experienced in 2020, the annuities segment continued to exhibit a higher lapse rate due to liquidity demands prompted by the pandemic crisis. Surrender charge income recognized is also dependent upon the duration of policies at the time of surrender (i.e. later duration policy surrenders have lower surrender charges assessed and earlier policy surrenders have a higher surrender charge assessed). The declining trend in assessed surrender charges is indicative of policy surrenders later in the surrender charge period.
Other charges include the net amortization into income of the premium load on single premium life insurance products which is deferred at the inception of the policy. The net income reported for this activity is dependent upon the level of amortization of accumulated deferrals compared to current premium loads being deferred. In addition, as part of the Company's annual unlocking analysis, a prospective unlocking of the unearned revenue reserve was done for each year shown. The effect of the unlocking in the year ended December 31, 2021 was a decrease in other charges revenue of $(0.6) million while the effect of the unlockings increased other charges revenue by $5.9 million and $0.5 million in the years ended December 31, 2020 and 2019, respectively.
Traditional life premiums - Traditional life premiums include the activity of Ozark National subsequent to their acquisition on January 31, 2019. Ozark National's principal product is a non-participating whole life insurance policy with premiums remitted primarily on a monthly basis. The product is sold in tandem with a mutual fund investment product offered through its broker-dealer affiliate, NIS. Traditional life insurance premiums for products such as whole life and term life are recognized as revenues over the premium-paying period. A sizable portion of National Western's traditional life business resided in the International Life insurance segment which ceased accepting new applications in 2018. However, National Western’s overall life insurance sales focus has historically been primarily centered around universal life products. The addition of Ozark National's business of repetitive paying permanent life insurance adds an important complement to National Western's life insurance sales. Included in the amounts for the years ended December 31, 2021, 2020, and 2019 is $73.5 million, $74.8 million, and $69.0 million, respectively, of life insurance renewal premium from Ozark National. Universal life products, especially National Western’s equity indexed universal life products, which offer the opportunity for consumers to acquire life insurance protection and receive credited interest linked in part to an outside market index, have been the more popular product offerings in the Company’s markets.
Net investment income (with and without derivatives) - A detail of net investment income is provided below.
| | | | | | | | | | | | | | | | | |
| | Years Ended December 31, |
| | 2021 | | 2020 | | 2019 |
| | (In thousands) |
| | | | | |
| Gross investment income: | | | | | |
| Debt and equities | $ | 309,082 | | | 373,479 | | | 403,372 | |
| Mortgage loans | 20,155 | | | 13,162 | | | 12,595 | |
| Policy loans | 2,667 | | | 3,361 | | | 3,539 | |
| Short-term investments | 293 | | | 2,160 | | | 2,974 | |
| Other invested assets | 16,321 | | | 12,698 | | | 13,057 | |
| | | | | |
| Total investment income | 348,518 | | | 404,860 | | | 435,537 | |
| Less: investment expenses | 2,762 | | | 2,412 | | | 3,252 | |
| | | | | |
| Net investment income (excluding derivatives and trading securities) | 345,756 | | | 402,448 | | | 432,285 | |
| Index option derivative gain | 120,718 | | | 14,754 | | | 123,207 | |
| Embedded derivative on reinsurance | 84,725 | | | — | | | — | |
| Trading securities market adjustments | 11,331 | | | — | | | — | |
| | | | | |
| Net investment income | $ | 562,530 | | | 417,202 | | | 555,492 | |
The Company’s strategy is to invest a substantial portion of its cash flows in fixed debt securities within its guidelines for credit quality, duration, and diversification. National Western's debt and equities investment income continues to experience higher yielding debt securities maturing or being called by borrowers and being replaced with lower yielding securities in the current interest rate environment. In addition, the excess of annuity outflows over inflows has caused the debt security portfolio to contract. As part of the acquisition of Ozark National and NIS in the first quarter of 2019, a sizable part of National Western's investable cash resources were applied toward the purchase of the two companies and then subsequently to pay back line of credit borrowings of $75 million used to fund a part of the acquisition price.
The Company's investable funds are derived from incremental cash flow from new business and investment income from its portfolio above its operational requirements to pay policy benefits, commissions, and expenses. The debt securities portfolio increased from $10.5 billion at December 31, 2019 to $10.8 billion at December 31, 2020, largely the result of recording certain holdings at fair value instead of amortized cost as had been done previously. At December 31, 2021, the debt securities portfolio declined to $10.1 billion. Investment yields on new bond purchases in 2021 and 2020 were less than the portfolio's weighted average yield after exceeding the portfolio yield in the prior two years. The portfolio weighted average yield was approximately 3.62% at December 31, 2021, while the yield on debt security purchases to fund insurance operations was 3.02%, 3.33%, and 4.06% in 2021, 2020, and 2019, respectively. Ozark National's weighted average portfolio yield at December 31, 2021 was 3.62%. Bond portfolio yields have continued to be impacted by higher yielding debt securities maturing or being called by borrowers with the proceeds being reinvested into lower yielding securities.
Fair value changes of equity securities are included in the Consolidated Statements of Earnings as a component of net investment income. For the years ended December 31, 2021, 2020, and 2019 an unrealized gain (loss) of $6.0 million, $(1.0) million, and $3.5 million, respectively, has been included in net investment income reflecting the change in fair value of equity securities during the periods. The carrying value of the Company’s portfolio of equity securities was $28.2 million at December 31, 2021.
Prior to 2020, the Company’s new mortgage loan activity had been challenged by the low level of interest rates and highly competitive underwriting of commercial properties. The COVID-19 pandemic crisis further impeded the underwriting of new loan applications early in 2020 until clarity regarding the impacts of closing down the economy upon commercial real estate became discernible. Eventually the volume of new mortgage loan originations during the latter half of 2020 resumed a pace closer to that of the pre-pandemic environment. Additional resources were added with the goal of increasing mortgage loan investments to a more appreciable percentage of total invested assets. The Company originated new mortgage loans in the amount of $183.6 million, $80.2 million, and $121.4 in 2021, 2020, and 2019, respectively. Mortgage loan investment income also benefits from incremental contributions from loan prepayment fees and profit participation receipts.
Policy loan and other invested asset balances outstanding have remained relatively stable over the past few years. During the latter part of 2020, National Western, in order to obtain incremental investment yield, expanded its invested asset vehicles to include alternative investments. These assets are typically syndicated, targeted capital pools with specific investment objectives managed by investment firms having specific expertise in designated asset opportunities. At December 31, 2021 and 2020, the Company held balances of $67.7 million and $28.9 million, respectively, in this investment category.
Effective January 1, 2021, the Company's net investment income is reduced for amounts ceded to the reinsurer under the funds withheld reinsurance agreement associated with funds withheld assets. For the year ended December 31, 2021, the Company ceded net investment income of $55.1 million, substantially comprised of investment income from debt securities.
The Company adopted new accounting guidance pertaining to current expected credit losses on financial instruments ("CECL") in 2020. The adoption as of January 1, 2020 was reported as a change in accounting with initial balances recorded and $3.0 million, net of taxes, charged to retained earnings. Remeasurement of the CECL allowance during 2020 resulted in a decrease in the allowance of $2.0 million for the year ended December 31, 2020 which is netted in gross investment income. During the year ended December 31, 2021, remeasurement of the CECL allowance resulted in an increase to the allowance of $0.5 million.
In order to evaluate underlying profitability and results from ongoing operations, net investment income performance is analyzed excluding derivative gain (loss), which is a common practice in the insurance industry. Although this is considered a non-GAAP financial measure, Company management believes this financial measure provides useful supplemental information by removing the swings associated with fair value changes on derivative instruments. Net investment income and average invested assets shown below includes cash and cash equivalents. Net investment income performance is summarized as follows:
| | | | | | | | | | | | | | | | | | | | |
| | | Years Ended December 31, |
| | | 2021 | | 2020 | | 2019 |
| | | (In thousands except percentages) |
| | | | | | |
| Excluding derivatives and trading securities: | | | | | | |
| Net investment income | | $ | 345,756 | | | 402,448 | | | 432,285 | |
| Average invested assets, at amortized cost | | 9,420,544 | | | 10,994,033 | | | 10,881,052 | |
| Annual yield on average invested assets | | 3.67 | % | | 3.66 | % | | 3.97 | % |
| | | | | | |
| Including derivatives and trading securities: | | | | | | |
| Net investment income | | $ | 562,530 | | | 417,202 | | | 555,492 | |
| Average invested assets, at amortized cost | | 11,163,776 | | | 11,139,238 | | | 10,967,188 | |
| Annual yield on average invested assets | | 5.04 | % | | 3.75 | % | | 5.07 | % |
The decline in average invested asset yield, excluding derivatives and trading securities, from 2019 to 2020 is due to the Company continuing to obtain lower yields on newly invested cash inflows as higher yielding assets mature or are called. The average invested asset yield in 2021 remained level with 2020 reflecting diversification during 2021 into other invested assets, namely commercial mortgage loans and alternative investments, which have incrementally higher yields.
The pattern in average invested asset yield, including derivatives and trading securities, incorporates increases and decreases in the fair value of index options purchased by National Western to support its fixed-index products as well as net investment income from the embedded derivative funds withheld liability. Fair values of the purchased call options recorded net gains in 2021, 2020, and 2019 corresponding to the movement in the S&P 500 Index® during these periods (the primary index the fixed-index products employ). Refer to the derivatives discussion following this section for a more detailed explanation.
Other revenues - Other revenues pertain to NIS, the broker-dealer affiliate of Ozark National; the operations of Braker P III ("BP III"), a subsidiary which owns and manages a commercial office building which includes the home office operations of National Western; and a maintenance expense allowance earned by National Western for administering the funds withheld block of annuity policies ceded to a third party reinsurer. The operations of the Company’s previously owned two nursing home operations in Reno, Nevada and San Marcos, Texas are included in the results for the year ended December 31, 2019 up to their respective dates of sales.
NIS revenues were $12.5 million, $9.9 million, and $8.2 million for the years ended December 31, 2021, 2020, and 2019, respectively. NIS revenues in 2019 were for the period subsequent to its acquisition effective January 31, 2019.
Revenues associated with BP III were $5.1 million, $4.7 million, and $3.9 million in December 31, 2021, 2020, and 2019, respectively, reflecting additional tenant leases subsequently executed. The facility is currently fully leased.
Under terms of the funds withheld reinsurance contract, National Western earns a monthly expense allowance equal to the average policy count of the funds withheld reinsurance block of business multiplied by a stated amount per policy. In the year ended December 31, 2021, the Company reported $5.4 million as maintenance expense allowance revenue.
The Company closed on the sale of its Reno nursing home operations effective February 1, 2019 and on the sale of its San Marcos nursing home operations effective May 1, 2019. Revenues associated with these operations were $(0.2) million, $(0.6) million, and $4.3 million in 2021, 2020, and 2019, respectively. In addition, net gains from the sale of personal property and equipment at the Reno facility of $1.4 million are included in 2019 revenues.
The Company's acquisition of Ozark National (by National Western) included a contingent payment provision that was dependent upon the subsequent persistency of Ozark National's in force block of business that was acquired. The Company had been progressively accruing for this potential obligation in its financial statements. During 2020, the Company executed an agreement with the seller under which both parties agreed that the Company had fulfilled its payment obligation under the Stock Purchase Agreement executed October 3, 2018. Consequently, the Company reversed the contingent payment amounts previously accrued and recognized as Other revenues $4.1 million in the year ended December 31, 2020.
Other revenues also include semi-annual distributions from the life interest in the Libbie Shearn Moody Trust. Revenues recognized from these distributions were $5.7 million, $5.3 million, and $6.7 million for the years ended December 31, 2021, 2020, and 2019, respectively.
Index option derivative gain (loss) - Index options are derivative financial instruments used to hedge the equity return component of National Western’s fixed-index products. Derivative gain or loss includes the amounts realized from the sale or expiration of the options. Since the index options do not meet the requirements for hedge accounting under GAAP, they are marked to fair value on each reporting date and the resulting unrealized gain or loss is reflected as a component of net investment income. As the options hedging the notional amount of policyholder contract obligations are purchased as close as possible to like amounts, the amount of the options returns tend to correlate closely with indexed interest credited.
Gains and losses from index options are substantially due to changes in equity market conditions. Index options are intended to act as hedges to match the returns on the product’s underlying reference index and the rise or decline in the index relative to the index level at the time of the option purchase which causes option values to likewise rise or decline. As income from index options fluctuates with the underlying index, the contract interest expense to policyholder accounts for the Company’s fixed-index products also fluctuates in a similar manner and direction. The Company recorded derivative gain (loss) and contract interest amounts as shown below.
| | | | | | | | | | | | | | | | | |
| | Years Ended December 31, |
| | 2021 | | 2020 | | 2019 |
| | (In thousands) |
| | | | | |
| Index option derivatives: | | | | | |
| Unrealized gain (loss) | $ | (16,564) | | | (9,740) | | | 152,993 | |
| Realized gain (loss) | 137,282 | | | 24,494 | | | (29,786) | |
| | | | | |
| Total gain included in net investment income | $ | 120,718 | | | 14,754 | | | 123,207 | |
| | | | | |
| Total contract interest | $ | 213,184 | | | 206,250 | | | 295,330 | |
The economic impact of option performance in the Company's financial statements is not generally determined solely by the option gain or loss included in net investment income as there is a corresponding amount recorded in the contract interest expense line. The Company's profitability with respect to these options is largely dependent upon the purchase cost of the option remaining within the financial budget for acquiring options embedded in the product pricing. Option prices vary with interest rates, volatility, and dividend yields among other things. As option prices vary, the Company manages for the variability by making offsetting adjustments to product caps, participation rates, and management fees. For the periods shown, the Company's option costs have generally been within the product pricing budgets.
The financial statement investment spread, the difference between investment income and interest credited to contract holders, is subject to variations from option performance during any given period. For example, many of the Company's equity-index annuity products provide for the collection of asset management fees. These asset management fees are assessed when returns on expiring options are positive, and they are collected prior to passing any additional returns above the assessed management fees to the policy contractholders. During periods of positive returns, the collected asset management fees serve to increase the financial statement spread by increasing option realized gains reported as investment income in an amount greater than interest credited to policy contractholders which is reported as contract interest expense. Asset management fees collected in 2021, 2020, and 2019 were $5.8 million, $30.7 million, and $15.9 million, respectively. While the level of asset management fees collected is dependent upon equity market performance, the reduced amount in 2021 is primarily the result of the Company's change in option hedging to an "out-of-the-money" basis during the second quarter of 2020. Consequently, no asset management fees were collected during the third and fourth quarters of 2021 as the out-of-the-money hedges constituted all hedges maturing during these time periods. Though asset management fees are no longer being collected, the costs to purchase the out-of-the-money options similarly decreases.
Net realized investment gains (losses) - Realized gains (losses) on investments generally include proceeds from bond calls, sales and impairment write-downs, as well as gains and losses on the sale of real estate property. Net gains reported in 2021 consisted of gross gains of $16.4 million which were mostly from bond calls of debt securities in the available-for-sales category, offset by gross losses of $(1.4) million. Gross losses include $1.4 million pertaining to property held by Ozark National which was sold during 2021. Gross gains in 2020 and 2019 include proceeds from bond calls of securities classified in the held-to-maturity category at that time.
Included the year ended December 31, 2019 gross gains is $5.7 million from the sale of land and building associated with the nursing home in Reno, Nevada and a $3.2 million gain on the sale of the Company's former Austin, Texas home office facility. Included in 2019 gross losses is a $2.0 million loss on the sale of the building pertaining to the San Marcos, Texas nursing home and an other-than-temporary impairment on a single debt security credit in the amount of $7.8 million.
Prior to January 1, 2020 and the adoption of the new accounting guidance on current expected credit losses, the Company recorded impairment write-downs when a decline in value was considered to be other-than-temporary and full recovery of the investment was not expected. Impairments due to credit factors were recorded in the Company’s Consolidated Statements of Earnings while non-credit (liquidity) impairment losses were included in the Consolidated Statements of Comprehensive Income (Loss). Under current expected credit loss accounting guidance, credit loss allowances for available-for-sale debt securities are recorded following the same process previously applied for impairment accounting and are recorded through net investment income in the Consolidated Statement of Earnings. Impairment or valuation write-downs recorded prior to January 1, 2020 under previous accounting guidance totaled $7.8 million in the year ended December 31, 2019.
Benefits and Expenses. The following details benefits and expenses.
| | | | | | | | | | | | | | | | | |
| | Years Ended December 31, |
| | 2021 | | 2020 | | 2019 |
| | (In thousands) |
| | | | | |
| Life and other policy benefits | $ | 187,577 | | | 131,337 | | | 137,342 | |
| Amortization of deferred transaction costs | 69,461 | | | 140,503 | | | 116,802 | |
| Universal life and annuity contract interest | 213,184 | | | 206,250 | | | 295,330 | |
| Other operating expenses | 126,612 | | | 104,584 | | | 104,558 | |
| | | | | |
| Totals | $ | 596,834 | | | 582,674 | | | 654,032 | |
Life and other policy benefits - Life and other policy benefits include death claims of $96.3 million, $72.5 million and $65.8 million for 2021, 2020 and 2019, respectively. Included in the amounts for the years ended December 31, 2021, 2020, and 2019, are $39.6 million, $37.0 million and $29.3 million in death claims pertaining to Ozark National. Death claim amounts are subject to variation from period to period. Death claims reported in 2021 and 2020 include net benefit amounts (after reinsurance) pertaining to death from COVID-19 of $23.5 million and $5.1 million for National Western and $8.2 million and $2.8 million for Ozark National. In 2021, the number of National Western life insurance claims incurred was level with that of 2020 while the average dollar amount per net claim increased 42% to $61,900 from $43,600. National Western’s mortality experience has generally been consistent with or better than its product pricing assumptions. The average net claim for Ozark National during 2021 increased to $15,400 from the 2020 period amount of $14,800. The average face amount of insurance in force for Ozark National was $33,600 at December 31, 2021. Mortality exposure is managed through reinsurance treaties under which the Company's retained maximum net amount at risk on any one life is capped at $500,000. Ozark National's retained maximum net amount at risk is capped at $200,000 under its reinsurance treaties with limited exceptions related to the conversion of child protection and guaranteed insurability riders.
Life and other policy benefits also includes policy liabilities held associated with the Company's traditional life products, including riders such as the guaranteed minimum withdrawal benefit rider ("WBR"), a popular rider to National Western's equity-indexed annuity products. The increases in these liabilities for National Western were $46.5 million, $10.7 million, and $24.4 million in 2021, 2020, and 2019, respectively. In each of these years, National Western unlocked its policy benefit reserves associated with the WBR which resulted in an increase/(decrease) to the policy benefit liability of $27.4 million, $(11.9) million, and $0.7 million in 2021, 2020, and 2019, respectively. The 2020 adjustment included an unlocking amount pertaining to mortality experience on payout annuities with life contingencies of $(3.3) million.
Life and other policy benefits in the years ended December 31, 2021, 2020, and 2019 includes changes in traditional life reserves and miscellaneous benefit payments associated with Ozark National's operations of $29.5 million, $30.7 million, and $30.5 million, respectively, reflecting normal business conditions.
Amortization of deferred transaction costs - Life insurance companies are required to defer certain expenses that vary with, and are directly related to, the cost of acquiring new business. The majority of these acquisition expenses consist of commissions paid to agents, underwriting costs, and certain marketing expenses. Recognition of these deferred policy acquisition costs (“DPAC”) as an expense in the Consolidated Financial Statements occurs over future periods in relation to the expected emergence of profits priced into the products sold. This emergence of profits is based upon assumptions regarding premium payment patterns, mortality, persistency, investment performance, and expense patterns. Companies are required to review universal life and annuity contract assumptions periodically to ascertain whether actual experience has deviated significantly from that assumed. If it is determined that a significant deviation has occurred, the emergence of profits pattern is to be "unlocked" and reset based upon the actual experience. DPAC balances are also adjusted each period to reflect current policy lapse or termination rates, expense levels and credited rates on policies as compared to anticipated experience (“true-up”) with the adjustment reflected in current period amortization expense. In accordance with GAAP guidance, the Company must also write off deferred acquisition costs and unearned revenue liabilities upon internal replacement of certain contracts as well as annuitizations of deferred annuities.
The following table identifies the effects of unlocking adjustments on DPAC balances recorded through amortization expense separate from recurring amortization expense components for 2021, 2020, and 2019.
| | | | | | | | | | | | | | | | | |
| | Years Ended December 31, |
| Amortization of DPAC | 2021 | | 2020 | | 2019 |
| | (In thousands) |
| | | | | |
| Unlocking adjustments | $ | (36,510) | | | 22,358 | | | (8,643) | |
| Other amortization components | 84,349 | | | 107,917 | | | 117,748 | |
| | | | | |
| Totals | $ | 47,839 | | | 130,275 | | | 109,105 | |
The amortization amounts for the years ended December 31, 2021, 2020, and 2019 were comprised of DPAC amortization by National Western of $47.2 million, $129.7 million, and $108.4 million and by Ozark National of $0.6 million, $0.6 million, and $0.7 million. Ozark National's deferred policy acquisition cost balance was initiated February 1, 2019 following its acquisition by National Western.
In 2021, the Company unlocked its DPAC balances for: (1) mortality rates, lapse rates, portfolio yield rates and spreads, and increased cost of insurance ("COI") charges on International universal life products inforce which collectively increased DPAC balances (and decreased amortization expense) on its Life segment by $33.3 million; and (2) surrender rates, annuitization rates, portfolio yield rates and spreads, mortality experience on payout annuities, and utilization of the Company's withdrawal benefit rider which collectively increased DPAC balances (and decreased amortization expense) on its Annuity segment by $3.2 million.
In 2020, the Company unlocked its DPAC balances for: (1) mortality rates, lapse rates, portfolio yield rates and spreads, which collectively decreased DPAC balances (and increased amortization expense) on its Life segment by $7.4 million; and (2) surrender rates, annuitization rates, portfolio yield rates and spreads, mortality experience on payout annuities, and utilization of the Company's withdrawal benefit rider which collectively decreased DPAC balances (and increased amortization expense) on its Annuity segment by $15.0 million.
In 2019, the Company unlocked its DPAC balances for: (1) mortality rates, lapse rates, portfolio yield rates and spreads, and maintenance expense on its International life business which collectively increased DPAC balances (and reduced amortization expense) on its Life segment by $11.2 million; and (2) surrender rates, annuitization rates, portfolio yield rates and spreads, and utilization of the Company's withdrawal benefit rider which collectively decreased DPAC balances (and increased amortization expense) on its Annuity segment by $2.6 million.
As the DPAC balance is an asset on the Company's Consolidated Balance Sheets, GAAP provides for an earned interest return on the unamortized balance each period. The earned interest serves to increase the DPAC balance and reduce other amortization component expense. The rate at which the DPAC balance earns interest is the average credited interest rate on universal life and annuity policies in force, including credited interest on equity-indexed policies. The amount of earned interest on DPAC balances was $32.7 million, $17.2 million, and $12.0 million in 2021, 2020, and 2019, respectively, each decreasing other amortization component expense. The increasing interest amounts reflect larger realized returns on equity-index products, particularly life insurance products.
As part of the purchase accounting required with the acquisition of Ozark National effective January 31, 2019, the Company recorded an intangible asset of $145.8 million referred to as the value of business acquired ("VOBA"). VOBA represents the difference between the acquired assets and liabilities of Ozark National measured in accordance with the Company's accounting policies and the fair value of these same assets and liabilities. During the year ended December 31, 2020, the cash value of certain acquired reserves was increased which resulted in a commensurate $35.1 million increase in both the traditional life reserve liability and the related VOBA balance reported on the Consolidated Balance Sheets. The VOBA balance sheet amount is amortized following a methodology similar to that used for amortizing deferred policy acquisition costs. In the years ended December 31, 2021, 2020, and 2019 the Company's VOBA amortization was $8.5 million, and $10.2 million, and $7.7 million, respectively.
Universal life and annuity contract interest - The Company closely monitors its credited interest rates on interest sensitive policies (National Western products), taking into consideration such factors as profitability goals, policyholder benefits, product marketability, and economic market conditions. As long-term interest rates change, the Company's credited interest rates are often adjusted accordingly, taking into consideration the factors described above. The difference between yields earned on investments over policy credited rates is often referred to as the "interest spread."
Contract interest reported in the financial statements also encompasses the performance of the index options associated with the Company's fixed-index products. As previously noted, the market value changes of these derivative features resulted in net realized and unrealized gains/(losses) in 2021, 2020, and 2019 of $120.7 million, $14.8 million, and $123.2 million, respectively. In 2021, this figure was comprised of unrealized losses totaling $(16.6) million offset by realized gains of $137.3 million. In 2020, this figure was comprised of unrealized losses totaling $(9.7) million offset by realized gains of $24.5 million. In 2019, the amount consisted of unrealized gains of $153.0 million offset by realized losses of $(29.8) million. These returns similarly increased/(decreased) the computed average credited rates for the periods shown above. Policyholders of equity-indexed products cannot receive an interest credit below 0% according to the policy contract terms.
| | | | | | | | | | | | | | | | | |
| Contract Interest Expense | December 31, |
| 2021 | | 2020 | | 2019 |
| |
| | | | | |
| Gross reserve changes | $ | 24,250 | | | 18,748 | | | 26,893 | |
| Ceded reserve changes under funds withheld | (26,429) | | | — | | | — | |
| Unlocking adjustments, net | (14,547) | | | 17,180 | | | 10,274 | |
| Asset management fees collected | (5,835) | | | (30,675) | | | (15,856) | |
| Projected asset management fees | 6,477 | | | 34,426 | | | (33,600) | |
| Other embedded derivative components | 5,814 | | | (5,188) | | | 6,389 | |
| | | | | |
| Totals | $ | (10,270) | | | 34,491 | | | (5,900) | |
Contract interest expense includes reserve changes for immediate annuities, two tier annuities, excess death benefit reserves, excess annuitizations, and amortization of deferred sales inducement balances. These gross reserve items are offset by policy charges assessed for policies having the withdrawal benefit rider (WBR). As changes in these items collectively impact contract interest expense, financial statement interest spread is also affected. Netted against reserve changes in the years ended December 31, 2021, 2020, and 2019 are WBR assessed policy charges of $28.2 million, $24.8 million, and $23.8 million, respectively.
Beginning in 2021, reserve changes associated with funds withheld annuity policies are ceded to the reinsurer and no longer reflected in the financial statements of the Company. Accordingly, contract interest expense is adjusted to remove these expense items which are shown in the above table for the year ended December 31, 2021. In addition to these amounts, the Company also cedes the fixed interest credited on the funds withheld annuity policies. For the year ended December 31, 2021, the fixed interest credited ceded was $29.8 million.
Generally, the impact of the market value change of index options on asset values aligns closely with the movement of the embedded derivative liability held for the Company's fixed-index products such that the net effect upon pretax earnings is negligible (i.e. net realized and unrealized gains/(losses) included in net investment income approximate the change in contract interest associated with the corresponding embedded derivative liability change). However, other aspects of the embedded derivatives can cause deviations to occur between the change in index option asset values included in net investment income and the change in the embedded derivative liability included in contract interest. As noted in the discussion of net investment income, the collection of asset management fees in a period can cause investment income to increase marginally higher than contract interest expense since these collected fees are deducted from indexed interest credited to policyholders. As shown in the table above, the collection of asset management fees are deductions from contract interest expense.
Accounting rules require the embedded derivative liability to include a projection of asset management fees estimated to be collected in the succeeding fiscal year due to the Company's historical practice of purchasing options priced to incorporate an expected probability of collecting asset management fees (referred to as "at the money hedging"). This projection for the embedded derivative liability is based upon the most recent performance of the reference equity index. Increases in projected asset management fees to be collected reduce contract interest expense while decreases in projected asset management fees to be collected increase contract interest expense. During the years ended December 31, 2021, 2020, and 2019, contract interest was increased/(decreased) by $6.5 million, $34.4 million, and $(33.6) million, respectively, for the projected change in asset management fees to be collected. During 2020, the Company changed its embedded derivative hedging process to incorporate "out-of-the-money" hedging which reduces option costs and eliminates the requirement for estimating probability projections of collected asset management fees. The remaining inventory of at the money option hedges purchase with a one year term completed its roll over to out-of-the-money hedges during the second quarter of 2021. Consequently, the embedded derivative liability component for projected asset management fees to be collected was phased out as of the end of the 2021 second quarter. Refer to Note (3) Derivative Investments in the accompanying Notes to Consolidated Financial Statements in this report for further information.
Other embedded derivative components include changes pertaining to other modeling differences, changes in future interest adjustments, and the change in the host contract component of the embedded derivative products. In the first quarter of 2020, the Company incurred an additional charge to contract interest of $12.1 million pertaining to an assumption regarding the embedded derivative option budget which was made several years ago when the Company's investment portfolio yield was higher. The combination of the embedded derivative option budget being out of date relative to the Company's current investment portfolio yield and the historically low interest rate levels introduced an embedded derivative floor which prevented the Company's contract interest expense from declining in tandem with the option value decreases recorded in net investment income. The Company subsequently unlocked for this out of date embedded derivative option budget assumption to reflect the Company's current investment portfolio yield. The effect of the unlocking was to remove the embedded derivative floor and reverse the contract interest charge recorded in the first quarter of 2020 so that there was no effect for this occurrence for the year ended December 31, 2020.
Another contract interest expense component is the amortization of deferred sales inducements (included in Gross reserve changes above). Similar to deferred policy acquisition costs, the Company defers sales inducements in the form of first year credited interest bonuses on annuity products that are directly related to the production of new business. These bonus interest charges are deferred and amortized using the same methodology and assumptions used to amortize other capitalized acquisition costs and the amortization is included in contract interest. In addition, deferred sales inducement balances ("DSI") are also reviewed periodically to ascertain whether actual experience has deviated significantly from that assumed (unlock) and are adjusted to reflect current policy lapse or termination rates, expense levels and credited rates on policies compared to anticipated experience (true-up). These adjustments, plus or minus, are included in contract interest expense. As part of the DPAC balance unlockings for the Annuity segment previously discussed for 2021, 2020, and 2019, the Company also unlocked its DSI balance. The effect of these prospective unlockings was to increase/(decrease) the DSI balance by $1.0 million, $(4.4) million, and $(0.6) million, respectively. These amounts are included in the previous table in the Unlocking adjustments line.
Other operating expenses - Other operating expenses consist of general administrative expenses, licenses and fees, commissions not subject to deferral, real estate expenses, brokerage expenses, compensation costs, and reinsurance ceded commission expense. These are summarized in the table that follows.
| | | | | | | | | | | | | | | | | |
| Years Ended December 31, |
| 2021 | | 2020 | | 2019 |
| (In thousands) |
| | | | | |
| General administrative expenses | $ | 51,317 | | | 42,688 | | | 42,353 | |
| | | | | |
| Compensation expenses | 40,178 | | | 30,372 | | | 31,956 | |
| Commission expenses | 10,810 | | | 11,159 | | | 10,502 | |
| Real estate expenses | 5,947 | | | 5,598 | | | 5,236 | |
| Brokerage expenses (NIS) | 6,123 | | | 5,085 | | | 4,372 | |
| Reinsurance ceded commission expense | 12 | | | — | | | — | |
| Taxes, licenses and fees | 12,225 | | | 9,682 | | | 10,139 | |
| | | | | |
| Totals | $ | 126,612 | | | 104,584 | | | 104,558 | |
General administrative expenses include software amortization of previously capitalized information technology (IT) expenditures including National Western's proprietary policy administration systems. Software costs, including amortization expense, for 2021, 2020, and 2019 were $13.8 million, $12.6 million, and $12.7 million, respectively. Other IT expenditures include consulting costs for system implementations, assistance with analysis involving a security incident experienced by National Western, and contractor resources to fill IT staffing shortages. These amounts in the years ended December 31, 2021 and 2020 were $17.5 million and $10.4 million, respectively. General administrative expenses also include payments and provisions made relating to potential or contingent legal liabilities and legal fees. Expenses in this category were $6.0 million, $2.8 million, and $3.8 million in 2021, 2020, and 2019, respectively. The 2021 amount includes $4.4 million accrued for potential settlement of a class action lawsuit pertaining to the IT security incident experienced by National Western. General administrative expenses for the year ended December 31, 2019 include a $3.3 million broker fee paid in connection with the acquisition of Ozark National and NIS which closed early in 2019. GAAP precludes this fee from being part of the purchase price for acquiring these businesses. General administrative expenses in the years ended December 31, 2021, 2020, and 2019 include Ozark National expenses in the amount of $4.3 million, $4.4 million, and $4.2 million, respectively.
General administrative expenses include nursing home expenses that reflect the operations of the Company's two facilities which were sold during 2019. The Reno, Nevada nursing home was sold effective February 1, 2019, while the San Marcos, Texas nursing home sale closed effective May 1, 2019. Expenses shown for 2019 reflect operations up to the date of sale for each facility. The Company must maintain the legal entities for a specified time period subsequent to each sale and incur various record safekeeping and other administrative expenses in the interim.
Compensation expenses include share-based compensation costs related to outstanding vested and nonvested stock appreciation rights ("SARs"), restricted stock units ("RSUs"), and performance share units ("PSUs"). The related share-based compensation costs move in tandem not only with the number of awards outstanding but also with the movement in the market price of the Company's Class A common stock as a result of marking the SARs, RSUs and PSUs, to fair value under the liability method of accounting. Consequently, the related expense amount varies positive or negative in any given period. In the amounts shown above, share-based compensation expense totaled $5.8 million in 2021, $(2.2) million in 2020, and $2.4 million in 2019. The negative expense level in 2020 reflects a change in the Company's Class A common share price to $206.44 at December 31, 2020 from $290.88 at December 31, 2019. In addition to the changes in price of the Company's Class A common shares, there were 64,157, 40,990, and 20,380 SARs granted to officers in 2021, 2020, and 2019, respectively. Refer to Note (12) Stockholders' Equity in the accompanying Notes to Consolidated Financial Statements of this report for a discussion of performance share awards.
Commission expenses in 2021, 2020, and 2019 include Ozark National non-deferrable commissions of $3.0 million, $3.1 million, and $3.2 million, respectively.
Real estate expenses pertain to the commercial building operated by Braker P III. The building was acquired at year-end 2016 and National Western relocated to this facility during the fourth quarter of 2017. The trending increase in the level of operating expenses reflects the addition of new tenants and associated operating expenses. At December 31, 2021, the facility was fully occupied.
Taxes, licenses and fees include premium taxes and licensing fees paid to state insurance departments, guaranty fund assessments, the company portion of social security and Medicare taxes, real estate taxes, state income taxes, and other state and municipal taxes. Ozark National taxes, licenses and fees were $2.5 million in 2021, $2.3 million in 2020, and $2.2 million in 2019. The increase in taxes, licenses and fee expenses in 2021 is due to the State of Colorado, National Western's domiciliary state, enacting a premium tax on non-qualified annuities effective January 1, 2021. While the impact upon Colorado premiums taxes was not significant, the Colorado law increased the Company's retaliatory premium tax burden with other states by $3.5 million.
Segment Operations
Summary of Segment Earnings
A summary of segment earnings from continuing operations for the years ended December 31, 2021, 2020, and 2019 is provided below. The segment earnings exclude realized gains and losses on investments, net of taxes.
| | | | | | | | | | | | | | | | | | | | | | | | | | | | | | | | | | | |
| | Domestic Life Insurance | | International Life Insurance | | Annuities | | ONL & Affiliates | | All Others | | Totals |
| | (In thousands) |
| | | | | | | | | | | |
| Segment earnings (loss): | | | | | | | | | | | |
| 2021 | $ | 2,548 | | | 51,420 | | | 81,868 | | | 14,550 | | | 18,485 | | | 168,871 | |
| 2020 | 1,499 | | | 51,609 | | | (9,308) | | | 14,036 | | | 17,830 | | | 75,666 | |
| 2019 | 2,163 | | | 34,818 | | | 53,582 | | | 16,617 | | | 19,506 | | | 126,686 | |
Domestic Life Insurance Operations
A comparative analysis of results of operations for the Company's domestic life insurance segment is detailed below.
| | | | | | | | | | | | | | | | | |
| | Years Ended December 31, |
| | 2021 | | 2020 | | 2019 |
| | (In thousands) |
| | | | | |
| Premiums and other revenues: | | | | | |
| Premiums and contract revenues | $ | 51,294 | | | 53,834 | | | 45,709 | |
| Net investment income | 90,006 | | | 54,516 | | | 77,672 | |
| Other revenues | 105 | | | 58 | | | 313 | |
| | | | | |
| Total premiums and other revenues | 141,405 | | | 108,408 | | | 123,694 | |
| | | | | |
| Benefits and expenses: | | | | | |
| Life and other policy benefits | 24,416 | | | 18,471 | | | 18,948 | |
| Amortization of deferred transaction costs | 9,580 | | | 17,661 | | | 11,797 | |
| Universal life insurance contract interest | 77,246 | | | 44,782 | | | 69,849 | |
| Other operating expenses | 26,959 | | | 25,730 | | | 20,376 | |
| | | | | |
| Total benefits and expenses | 138,201 | | | 106,644 | | | 120,970 | |
| | | | | |
| Segment earnings before Federal income taxes | 3,204 | | | 1,764 | | | 2,724 | |
| | | | | |
| Provision for Federal income taxes | 656 | | | 265 | | | 561 | |
| | | | | |
| Segment earnings | $ | 2,548 | | | 1,499 | | | 2,163 | |
Revenues from domestic life insurance operations include life insurance premiums on traditional type products and contract revenues from universal life insurance. Revenues from traditional products are simply premiums collected, while revenues from universal life insurance consist of policy charges for the cost of insurance, policy administration fees, and surrender charges assessed during the period. A comparative detail of premiums and contract revenues is provided below.
| | | | | | | | | | | | | | | | | |
| | Years Ended December 31, |
| | 2021 | | 2020 | | 2019 |
| | (In thousands) |
| | | | | |
| Universal life insurance revenues | $ | 58,637 | | | 60,664 | | | 51,591 | |
| Traditional life insurance premiums | 4,620 | | | 4,349 | | | 5,063 | |
| Reinsurance premiums | (11,963) | | | (11,179) | | | (10,945) | |
| | | | | |
| Totals | $ | 51,294 | | | 53,834 | | | 45,709 | |
National Western’s domestic life insurance in force, in terms of policy counts, has been declining for some time. The pace of new policies issued has lagged the number of policies terminated from death or surrender causing a declining level of policies in force from which contract revenue is received. Consequently, the number of domestic life insurance policies in force has declined from 47,900 at December 31, 2019 to 46,900 at December 31, 2020 and to 46,100 at December 31, 2021. Policy lapse rates in 2021 remained level with the 6.0% experienced in 2020. While policy counts have declined, the face amount of life insurance in force has increased from $3.4 billion at December 31, 2019 to $3.5 billion at December 31, 2020 and to $3.7 billion at December 31, 2021.
Universal life insurance revenues are also generated with the issuance of new business based upon amounts per application and percentages of the face amount (volume) of insurance issued. The number of domestic policies issued during 2021 increased 2% over that in 2020 and the volume of insurance issued increased 5% from that in 2020.
Universal life insurance revenues also include surrender charge income realized on terminating policies and, in the case of domestic universal life, amortization into income of the premium load on single premium policies which is deferred. Amounts deferred are amortized into revenues over future periods corresponding with the duration of the policies. The net premium load amortization associated with this activity was $4.3 million, $11.4 million, and $8.2 million in 2021, 2020, and 2019, respectively. The net amortization amount in 2020 includes $5.9 million from the Company's annual unlocking of actuarial assumptions.
Premiums collected on universal life products are not reflected as revenues in the Company's Consolidated Statements of Earnings in accordance with GAAP. Actual domestic universal life premiums collected are detailed below.
| | | | | | | | | | | | | | | | | |
| | Years Ended December 31, |
| | 2021 | | 2020 | | 2019 |
| | (In thousands) |
| | | | | |
| Universal life insurance: | | | | | |
| First year and single premiums | $ | 203,329 | | | 194,520 | | | 180,457 | |
| Renewal premiums | 16,870 | | | 17,905 | | | 18,124 | |
| | | | | |
| Totals | $ | 220,199 | | | 212,425 | | | 198,581 | |
Domestic life insurance sales for some time have consisted substantially of single premium policies which do not have much in the way of recurring premium payments. These products utilize wealth transfer strategies involving the movement of accumulated wealth in alternative investment vehicles, including annuities, into life insurance products. As a result, renewal premium levels have not been exhibiting a corresponding level of increase as that of first year and single premiums.
Net investment income for this segment of business, excluding derivative gain/(loss), has been gradually increasing due to the increased new business activity described above (single premium policies) and a higher level of investments needed to support the corresponding growth in policy obligations, especially those for single premium policies. The increase in net investment income has been partially muted by lower investment yields from debt security investment purchases during this time frame. Net investment income also includes the gains and losses on index options purchased to back the index crediting mechanism on fixed-index universal life products. A detail of net investment income for domestic life insurance operations is provided below.
| | | | | | | | | | | | | | | | | |
| Years Ended December 31, |
| 2021 | | 2020 | | 2019 |
| (In thousands) |
| | | | | |
| Net investment income (excluding index option derivatives) | $ | 51,733 | | | 47,380 | | | 44,399 | |
| Index option derivative gain | 38,273 | | | 7,136 | | | 33,273 | |
| | | | | |
| Net investment income | $ | 90,006 | | | 54,516 | | | 77,672 | |
| | | | | |
| Universal life insurance contract interest | $ | 77,246 | | | 44,782 | | | 69,849 | |
Life and policy benefits for a smaller block of business are subject to variation from period to period. Claim count activity during 2021 decreased 5% compared to 2020 while the average net claim amount increased to $37,700 from $30,600. In 2021, National Western's domestic life insurance segment incurred 129 COVID-19 claims with a net benefit amount (after reinsurance) of $4.5 million, roughly 9% of the total net claims for this segment. In 2020, National Western's domestic life insurance segment incurred 70 COVID-19 claims with a net benefit amount (after reinsurance) of $2.4 million, roughly 6% of the total net claims for this segment. The low face amount per domestic life claim relative to the current issued amounts of insurance per policy reflects the older block of domestic life insurance policies sold which were final expense type products (i.e. purchased to cover funeral costs). The overall mortality experience for this segment has been consistent with pricing assumptions.
Included in amortization of deferred transaction costs is DPAC amortization. As noted previously in the discussion of results from Consolidated Operations, the Company records true-up adjustments to DPAC balances each period to reflect current policy lapse or termination rates, expense levels and credited rates on policies as compared to anticipated experience with the adjustment reflected in current period amortization expense. To the extent required, unlocking adjustments may also be recorded to DPAC balances. The following table identifies the effects of unlocking adjustments on domestic life insurance DPAC balances recorded through amortization expense separate from recurring amortization expense components for 2021, 2020, and 2019.
| | | | | | | | | | | | | | | | | |
| | Years Ended December 31, |
| 2021 | | 2020 | | 2019 |
| | (In thousands) |
| Amortization of DPAC | | | | | |
| Unlocking adjustments | $ | 495 | | | 7,391 | | | (360) | |
| Other amortization components | 9,085 | | | 10,270 | | | 12,157 | |
| | | | | |
| Totals | $ | 9,580 | | | 17,661 | | | 11,797 | |
In 2021, DPAC balances were unlocked for this segment for mortality, lapse rates, and portfolio yield (interest spread) increasing amortization expense by $0.5 million. In 2020, DPAC balances were unlocked for this segment for mortality, lapse rates, and investment spread also increasing amortization expense. In 2019, DPAC balances were unlocked for this segment for mortality rates, lapse rates, and portfolio yield rates (investment spread margin) which cumulatively had the effect of marginally increasing DPAC balances (and reducing amortization expense).
In the Consolidated Operations discussion of amortization of deferred acquisition costs it was noted that interest earned on DPAC balances serves to offset (decrease) amortization expense and that the interest rate used is the crediting rate experience during the period. The decrease in the core amortization expense in 2021 relative to 2020 reflects higher interest earned on universal life DPAC balances due to increased realized gains from index options.
Contract interest expense includes the fluctuations that are the result of the effect upon the embedded derivative for the performance of the underlying equity indices associated with fixed-indexed universal life products. For liability purposes, the embedded option in the Company's policyholder obligations for this feature is bifurcated and reserved for separately. Accordingly, the impact for the embedded derivative component in the equity-index universal life product is reflected in contract interest expense for approximately the same amounts as in net investment income for each respective period.
Contract interest also includes certain policy reserve balance changes which are also subject to unlocking adjustments in conjunction with DPAC. As part of the unlockings discussed above, the Company increased its domestic life insurance excess benefit reserve balance by $0.5 million, $1.4 million, and $0.3 million in 2021, 2020, and 2019, respectively (increasing contract interest expense).
Operating expenses are allocated to lines of business based upon a functional cost analysis of the business activity giving rise to incurred expenses. With the Company's decision to cease accepting applications from international residents and the lower level of annuity sales, a higher proportion of operating expenses were allocated to the Domestic Life segment in 2021 and 2020 given the increase in activity in this segment and its greater share of the overall operational resources.
International Life Insurance Operations
A comparative analysis of results of operations for the Company's international life insurance segment is detailed below.
| | | | | | | | | | | | | | | | | |
| | Years Ended December 31, |
| | 2021 | | 2020 | | 2019 |
| | (In thousands) |
| | | | | |
| Premiums and other revenues: | | | | | |
| Premiums and contract revenues | $ | 79,085 | | | 88,167 | | | 99,417 | |
| Net investment income | 52,227 | | | 27,273 | | | 47,004 | |
| Other revenues | 95 | | | 67 | | | 86 | |
| | | | | |
| Total premiums and other revenue | 131,407 | | | 115,507 | | | 146,507 | |
| | | | | |
| Benefits and expenses: | | | | | |
| Life and other policy benefits | 26,481 | | | 14,084 | | | 17,064 | |
| Amortization of deferred transaction costs | (11,118) | | | 24,929 | | | 17,593 | |
| Universal life insurance contract interest | 31,696 | | | (2,087) | | | 48,561 | |
| Other operating expenses | 19,679 | | | 17,829 | | | 19,447 | |
| | | | | |
| Total benefits and expenses | 66,738 | | | 54,755 | | | 102,665 | |
| | | | | |
| Segment earnings before Federal income taxes | 64,669 | | | 60,752 | | | 43,842 | |
| | | | | |
| Provision for Federal income taxes | 13,249 | | | 9,143 | | | 9,024 | |
| | | | | |
| Segment earnings | $ | 51,420 | | | 51,609 | | | 34,818 | |
As with Domestic Life operations, revenues from the International Life insurance segment include both premiums on traditional type products and contract revenues from universal life insurance. A comparative detail of premiums and contract revenues is provided below.
| | | | | | | | | | | | | | | | | |
| | Years Ended December 31, |
| | 2021 | | 2020 | | 2019 |
| | (In thousands) |
| | | | | |
| Universal life insurance revenues | $ | 77,225 | | | 85,185 | | | 95,391 | |
| Traditional life insurance premiums | 8,314 | | | 9,272 | | | 10,659 | |
| Reinsurance premiums | (6,454) | | | (6,290) | | | (6,633) | |
| | | | | |
| Totals | $ | 79,085 | | | 88,167 | | | 99,417 | |
Universal life revenues and operating earnings are largely generated from the amount of life insurance in force. Over the past three years, the volume of insurance in force for this segment has contracted from $13.7 billion at December 31, 2019 to $12.4 billion at December 31, 2020 and to $11.3 billion at December 31, 2021. The decline in volume of in force reflects the decision to begin progressively disengaging from certain countries and ultimately making the decision in 2018 to cease accepting international policy applications from residents from all remaining countries.
Another component of international universal life revenues include surrender charges assessed upon surrender of contracts by policyholders. In addition to termination rates trending lower, the resulting surrender charge fee revenue has been less due to policy contract provisions which provide for lower surrender charge fees to be assessed later in the contract term. The following table illustrates National Western's recent international life termination experience.
| | | | | | | | | | | |
| Volume In Force Terminations | Amount in $’s | | Annualized Termination Rate |
| | (millions) | | |
| | | |
| Year Ended December 31, 2021 | $ | 1,080.1 | | | 8.7 | % |
| Year Ended December 31, 2020 | 1,295.2 | | | 9.5 | % |
| Year Ended December 31, 2019 | 1,671.5 | | | 10.9 | % |
| Year Ended December 31, 2018 | 1,706.3 | | | 10.0 | % |
| Year Ended December 31, 2017 | 2,309.7 | | | 12.2 | % |
As noted previously, premiums collected on universal life products are not reflected as revenues in the Company's Consolidated Statements of Earnings in accordance with GAAP. Actual international universal life premiums collected are detailed below.
| | | | | | | | | | | | | | | | | |
| | Years Ended December 31, |
| | 2021 | | 2020 | | 2019 |
| | (In thousands) |
| | | | | |
| Universal life insurance: | | | | | |
| First year and single premiums | $ | — | | | — | | | 989 | |
| Renewal premiums | 50,518 | | | 55,383 | | | 67,066 | |
| | | | | |
| Totals | $ | 50,518 | | | 55,383 | | | 68,055 | |
National Western’s most popular international products were its fixed-index universal life products in which the policyholder could elect to have the interest rate credited to their policy account values linked in part to the performance of an outside equity index. These products issued were not generally available in the local markets when sold. Included in the totals in the above table are collected premiums for fixed-index universal life products of approximately $28.9 million, $32.4 million, and $41.3 million for the years ended 2021, 2020, and 2019, respectively. The declining trend in renewal premiums during these periods corresponds with the decline in policies in force due to the elimination of new sales and the termination activity as discussed above.
As previously noted, net investment income and contract interest include period-to-period changes in fair values pertaining to call options purchased to hedge the interest crediting feature on the fixed-index universal life products. With the relatively large size of the fixed-index universal life block of business, the period-to-period changes in fair values of the underlying options have a significant effect on net investment income and universal life contract interest. A detail of net investment income for international life insurance operations is provided below.
| | | | | | | | | | | | | | | | | |
| | Years Ended December 31, |
| | 2021 | | 2020 | | 2019 |
| | (In thousands) |
| | | | | |
| Net investment income (excluding index option derivatives) | $ | 22,866 | | | 26,938 | | | 30,126 | |
| Index option derivative gain | 29,361 | | | 335 | | | 16,878 | |
| | | | | |
| Net investment income | $ | 52,227 | | | 27,273 | | | 47,004 | |
| | | | | |
| Universal life insurance contract interest | $ | 31,696 | | | (2,087) | | | 48,561 | |
The gain or loss on index options follows the movement of the reference indice with realized gains or losses being recognized on the anniversary of each index option based upon the reference indice level at the expiration date relative to the index level at the time the index option was purchased. Unrealized gains and losses are recorded for index options outstanding based upon their fair values, largely determined by the reference indice level, at the balance sheet reporting date as compared to the original purchase cost of each respective option.
Life and policy benefits primarily consist of death claims on policies. National Western’s clientele for international products are generally wealthy individuals with access to U.S. dollars and quality medical care. Consequently, the amounts of coverage purchased historically tended to be larger amounts. Life and policy benefit expense for the international life segment reflects the larger policies historically purchased, however mortality due to natural causes is comparable to that in the United States. The Company's maximum risk exposure per insured life is capped at $500,000 through reinsurance. The average international life net claim amount (after reinsurance) in 2021 increased to $202,900 from $158,200 while the number of claims incurred increased 43% from the amount incurred in 2020. Included in International Life death claims for 2021 were 72 with a cause of death identified as COVID-19 which aggregated to $19.0 million in net claims. Included in International Life death claims for 2020 were 18 with a cause of death identified as COVID-19 which aggregated to $2.7 million in net claims. The increased number of reported COVID-19 death claims accounts for substantially most of the increase in claim activity.
Included in amortization of deferred transaction costs is DPAC amortization. The Company records true-up adjustments to DPAC balances each period to reflect current policy lapse or termination rates, expense levels, and credited rates on policies as compared to anticipated experience as well as unlocking adjustments as necessary. The following table identifies the effects of unlocking adjustments on international life insurance DPAC balances recorded through amortization expense separate from recurring amortization expense components for 2021, 2020, and 2019.
| | | | | | | | | | | | | | | | | |
| | Years Ended December 31, |
| 2021 | | 2020 | | 2019 |
| | (In thousands) |
| Amortization of DPAC | | | | | |
| Unlocking adjustments | $ | (33,800) | | | (20) | | | (10,860) | |
| Other amortization components | 22,682 | | | 24,949 | | | 28,453 | |
| | | | | |
| Totals | $ | (11,118) | | | 24,929 | | | 17,593 | |
In 2021, the Company unlocked DPAC balances associated with its International Life segment for lapse rates, mortality, investment portfolio yields and cost of insurance ("COI") charge increases. The effect of the prospective unlocking, particularly for the COI charge increases, was to increase DPAC balances (and decrease amortization expense) by $33.8 million.
In 2020, the Company unlocked DPAC balances for lapse rates, mortality, and investment spread. While this unlocking had a relatively small impact on the International Life segment DPAC balance, a substantially larger effect was recorded in benefit reserves the change of which is reflected in contract interest expense as discussed below.
In 2019, DPAC balances were unlocked for mortality rates, lapse rates, maintenance expenses, and investment spread which increased DPAC balances and reduced amortization expense. Favorable mortality experience on the block of business was the primary cause behind the DPAC balance increase and the amortization expense decrease.
Contract interest expense includes the fluctuations that are the result of the effect upon the embedded derivative for the performance of the underlying equity indices associated with fixed-indexed universal life products. For liability purposes, the embedded option in the Company's policyholder obligations for this feature is bifurcated and reserved for separately. Accordingly, the impact for the embedded derivative component in the equity-index universal life product is reflected in the contract interest expense for approximately the same amounts as the purchased call options are reported in net investment income for each respective period. Amounts realized on purchase call options generally approximate the amounts credited to policyholders.
As part of the mortality unlocking analysis done in 2021, the Company decreased its excess death benefit reserves by $14.1 million for favorable experience. The reduction in reserve is reported as an offset to contract interest expense. In 2020, the Company's excess benefit reserve was also unlocked resulting in a decrease in the amount of $22.8 million which served to decrease contract interest expense by a like amount. In 2019, the excess death benefit was unlocked producing a $7.9 million increase in the reserve and a similar increase in contract interest expense.
As noted in the Domestic Life segment discussion, operating expenses are allocated to lines of business based upon a functional cost analysis of the activity by business area giving rise to incurred expenses. A greater proportion of the Company's overall operating expenses have been allocated toward the Domestic Life and Annuity segments and away from the International Life segment due to the decreased activity in this segment relative to the former two segments.
Annuity Operations
A comparative analysis of results of operations for the Company's annuity segment is detailed below.
| | | | | | | | | | | | | | | | | |
| | Years Ended December 31, |
| | 2021 | | 2020 | | 2019 |
| | (In thousands) |
| | | | | |
| Premiums and other revenues: | | | | | |
| Premiums and contract revenues | $ | 16,809 | | | 17,025 | | | 20,317 | |
| Net investment income | 368,234 | | | 290,576 | | | 380,357 | |
| Other revenues | 5,374 | | | 43 | | | (34) | |
| | | | | |
| Total premiums and other revenues | 390,417 | | | 307,644 | | | 400,640 | |
| | | | | |
| Benefits and expenses: | | | | | |
| Life and other policy benefits | 67,515 | | | 31,043 | | | 41,487 | |
| Amortization of deferred transaction costs | 61,881 | | | 87,133 | | | 79,064 | |
| Annuity contract interest | 104,242 | | | 163,555 | | | 176,920 | |
| Other operating expenses | 53,817 | | | 36,870 | | | 35,699 | |
| | | | | |
| Total benefits and expenses | 287,455 | | | 318,601 | | | 333,170 | |
| | | | | |
| Segment earnings (loss) before Federal income taxes | 102,962 | | | (10,957) | | | 67,470 | |
| | | | | |
| Provision (benefit) for Federal income taxes | 21,094 | | | (1,649) | | | 13,888 | |
| | | | | |
| Segment earnings (loss) | $ | 81,868 | | | (9,308) | | | 53,582 | |
Premiums and contract charges primarily consist of surrender charge income recognized on terminated policies. The amount of the surrender charge income recognized is determined by the volume of surrendered contracts as well as the duration of each contract at the time of surrender given the pattern of declining surrender charge rates over time that is common to most annuity contracts. The Company's lapse rate for annuity contracts during 2021 was 8.6%, an increase from a rate of 8.1% in 2020 and the 7.4% rate experienced in 2019. The 2021 and 2020 lapse rates are elevated as an outcome of the COVID-19 pandemic crisis with consumers fortifying their liquidity positions. This has manifested by consumers accessing funds available from their policies through greater withdrawal and surrender activity. In addition, annuity contracts with fixed interest rates are more prone to terminate as contracts approach the end of their surrender charge period and in periods of rising interest rates.
Deposits collected on annuity contracts are not reflected as revenues in the Company's Consolidated Statements of Earnings in accordance with GAAP. Actual annuity deposits collected are detailed below.
| | | | | | | | | | | | | | | | | |
| | Years Ended December 31, |
| | 2021 | | 2020 | | 2019 |
| | (In thousands) |
| | | | | |
| Fixed-index annuities | $ | 425,734 | | | 330,899 | | | 241,253 | |
| Other deferred annuities | 3,727 | | | 7,355 | | | 14,747 | |
| Immediate annuities | 32,488 | | | 20,627 | | | 8,648 | |
| | | | | |
| Totals | $ | 461,949 | | | 358,881 | | | 264,648 | |
Fixed-index products are more attractive for consumers when interest rate levels remain low and equity markets produce positive returns. Since National Western does not offer variable products or mutual funds, fixed-index products provide an important alternative to the Company's existing fixed interest rate annuity products. Fixed-index annuity deposits as a percentage of total annuity deposits were 92%, 92%, and 91% for the years ended December 31, 2021, 2020, and 2019, respectively. The percentage of fixed-index products to total annuity sales reflects the low interest rate environment and the overall positive performance in the equities market.
Some of the Company's deferred products, including fixed-index annuity products, contain a first year interest bonus, in addition to the base first year interest rate, which is credited to the account balance when premiums are applied. These sales inducements are deferred in conjunction with other capitalized policy acquisition costs. The amounts currently deferred to be amortized over future periods amounted to approximately $18.1 million, $10.3 million, and $3.2 million for the years ended December 31, 2021, 2020, and 2019, respectively. Amortization of deferred sales inducements is included as a component of annuity contract interest as described later in this discussion of Annuity Operations.
A detail of net investment income for annuity operations is provided below.
| | | | | | | | | | | | | | | | | |
| | Years Ended December 31, |
| | 2021 | | 2020 | | 2019 |
| | (In thousands) |
| | | | | |
| Net investment income (excluding derivatives and trading securities) | $ | 219,094 | | | 283,293 | | | 307,301 | |
| Index option derivative gain | 53,084 | | | 7,283 | | | 73,056 | |
| Embedded derivative liability decrease | 84,725 | | | — | | | — | |
| Trading securities market adjustment | 11,331 | | | — | | | — | |
| | | | | |
| Net investment income | $ | 368,234 | | | 290,576 | | | 380,357 | |
As noted in the Consolidated Operations discussion, the Company ceded net investment income of $55.1 million to the reinsurer under the funds withheld reinsurance agreement. This amount consisted entirely of net investment income from investments supporting the fixed and payout annuities ceded under the agreement.
As seen in the above table, net investment income also includes the derivative gains and losses on index options purchased to back the index crediting mechanism on fixed-index products. The derivative gain or loss on index options follows the movement of the reference indice with realized gains and losses being recognized on the anniversary of each index option based upon the reference indice at the expiration date relative to the index level at the time the index option was purchased. Unrealized gains and losses are recorded for index options outstanding based upon their fair value, largely determined by the reference indice level, at the balance sheet reporting date as compared to the original purchase cost of each respective option.
Since the embedded derivative option in the policies is bifurcated when determining the contract reserve liability, the impact of the market value change of index options on asset values generally aligns closely with the movement of the embedded derivative liability such that the net effect upon pretax earnings is negligible (i.e. net realized and unrealized gains/(losses) included in net investment income approximate the change in contract interest associated with the corresponding embedded derivative liability change). See further discussion below regarding contract interest activity.
The funds withheld reinsurance agreement executed December 31, 2020 introduced embedded derivative accounting with respect to the annuity policyholder obligations reinsured. During the year ended December 31, 2021, the embedded derivative liability decreased $84.7 million which was recorded as a component of investment income. Debt securities supporting the funds withheld policyholder obligations classified as trading securities incurred an $11.3 million market value increase in the year ended December 31, 2021 which was also recorded as a component of net investment income. The total of these two amounts, the embedded liability decrease and the change in market value of trading securities, or $96.0 million, increased net investment income for the Annuity segment.
Other revenues in the year ended December 31, 2021, includes $5.4 million of maintenance expense allowance revenue. Under the terms of the funds withheld reinsurance contract, National Western earns from the reinsurer a monthly expense allowance equal to the average policy count of the funds withheld reinsured block of business multiplied by a stated amount per policy.
Life and other policy benefits for the Annuity segment include the effects of the annual prospective unlocking exercise performed by the Company. In 2021, the Company unlocked updating assumptions for the ultimate election rates associated with guaranteed minimum withdrawal benefit (GMWB) riders on its annuity contracts, GMWB utilization rates in certain durations, and portfolio yield rates supporting this business. The effect of the prospective unlocking was to increase the GMWB reserve by $27.4 million which increased Life and other policy benefits.
Life and other policy benefits for the Annuity segment in 2020 also included the effects of the annual prospective unlocking exercise performed by the Company. The Company unlocked updating assumptions for the ultimate election rates associated with guaranteed minimum withdrawal benefit (GMWB) riders on its annuity contracts. The effect of the prospective unlocking was to reduce the GMWB reserve by $8.5 million which reduced Life and other policy benefits. The Company also unlocked for the mortality assumption associated with it payout annuity business. The effect of the prospective unlocking was to accelerate the deferred profit liability for this business by $3.3 million which also reduced Life and other policy benefits. Combined, the two unlockings decreased Life and other policy benefits by $11.8 million in 2020.
As part of the unlockings performed in 2019, the Company also unlocked its policy benefits reserves associated with the assumptions regarding policyholder utilization of the GMWB rider. The assumptions were updated for actual utilization experience versus that which was previously assumed. The effect of this prospective unlocking was to increase policy reserves by $0.7 million (and increase Life and other policy benefits expense) in 2019.
Included in amortization of deferred transaction costs is DPAC amortization. Consistent with the domestic and international life segments, the Company records true-up adjustments to DPAC balances each period to reflect current policy lapse or termination rates, expense levels and credited rates on policies as compared to anticipated experience as well as unlocking adjustments as necessary. The following table identifies the effects of unlocking adjustments on annuity DPAC balances recorded through amortization expense separate from recurring amortization expense components for 2021, 2020, and 2019.
| | | | | | | | | | | | | | | | | |
| | Years Ended December 31, |
| 2021 | | 2020 | | 2019 |
| | (In thousands) |
| Amortization of deferred transaction costs | | | | | |
| Unlocking adjustments | $ | (3,205) | | | 14,987 | | | 2,577 | |
| DPAC amortization expense | 51,932 | | | 72,146 | | | 76,487 | |
| Cost of reinsurance amortization expense | 13,154 | | | — | | | — | |
| | | | | |
| Totals | $ | 61,881 | | | 87,133 | | | 79,064 | |
In 2021, the Company unlocked Annuity segment DPAC balances for assumptions pertaining to lapse rates, annuitization rates, portfolio investment yield rates supporting the block of business, and expenses. The effect of the prospective unlocking was to increase DPAC balances by $3.2 million (and decrease amortization expense).
In 2020, the Company unlocked Annuity segment DPAC balances for assumptions pertaining to lapse rates, annuitization rates, and portfolio investment yield rates supporting the block of business which increased amortization expense approximately $15.0 million.
DPAC balances associated with the Annuity segment were unlocked in 2019 for assumptions pertaining to lapse rates, annuitization rates, investment spreads, and utilization of the Company's withdrawal benefit rider. The effect of the prospective unlocking was to increase amortization expense $2.6 million.
Amortization of DPAC balances is proportional to estimated expected gross profits ("EGPs") for a line of business. The EGPs of the block of annuity policies have been steadily decreasing with the declining amount of policies in force, as well as DPAC unlocking in recent years for unfavorable experience. In addition, experience which deviates from the EGPs assumed, such as the amounts of asset fees collected, can similarly increase or decrease the amortization of DPAC. In the year ended December 31, 2021, DPAC amortization expense was reduced by $6.2 million for DPAC ceded to a reinsurer under the funds withheld reinsurance agreement entered into at December 31, 2020.
Amortization of deferred transaction costs includes amortization of the cost of reinsurance recorded at year-end 2020 associated with the funds withheld reinsurance agreement. At December 31, 2020, the Company recorded as an asset on the Consolidated Balance Sheet a deferred Cost of Reinsurance ("COR") amount of $102.8 million associated with the funds withheld reinsurance transaction. This represents the amount of assets transferred at the closing date of the funds withheld agreement (debt securities, policy loans, and cash) in excess of the GAAP liability ceded plus a $48 million ceding commission paid to the reinsurer. The COR balance is amortized commensurate with the runoff of the ceded block of funds withheld business. In the year ended December 31, 2021, COR amortization expense of $13.2 million is included in Amortization of deferred transaction costs.
Annuity contract interest includes the equity component return associated with the call options purchased to hedge National Western's fixed-index annuities. The detail of fixed-index annuity contract interest as compared to contract interest for all other annuities is as follows:
| | | | | | | | | | | | | | | | | |
| | Years Ended December 31, |
| | 2021 | | 2020 | | 2019 |
| | (In thousands) |
| | | | | |
| Fixed-indexed annuities | $ | 108,878 | | | 65,785 | | | 100,292 | |
| All other annuities | (281) | | | 85,307 | | | 59,434 | |
| | | | | |
| Gross contract interest | 108,597 | | | 151,092 | | | 159,726 | |
| Bonus interest deferred and capitalized | (18,117) | | | (10,344) | | | (3,160) | |
| Bonus interest amortization | 13,762 | | | 22,807 | | | 20,354 | |
| | | | | |
| Total contract interest | $ | 104,242 | | | 163,555 | | | 176,920 | |
The fluctuation in reported contract interest amounts for fixed-index annuities is driven by sales levels, the level of the business in force, and the effect of positive or negative market returns of option values on projected interest credits. As noted in the net investment income discussion, the amounts shown for contract interest for fixed-index annuities generally align with the derivative gains/(losses) included in net investment income due to the market change of index options aligning closely with the movement of the embedded derivative liability held for these products.
In the year ended December 31, 2020, in addition to the effects of the unlocking adjustments on Life and other policy benefits and amortization of DPAC expenses, the unlocking assumption changes impacted certain annuity benefit reserves. The Company unlocked the mortality assumption with regards to payout annuities (contracts paying systematic benefits), with the effect of the prospective unlocking increasing annuity benefit reserves by $22.8 million which increased contract interest expense by a like amount. For other deferred fixed rate annuities, 2020 unlocking assumption changes pertaining to lapse rates, annuitization rates and portfolio yields supporting the block of business increased annuitization and excess death benefit reserves by $11.3 million which similarly increased contract interest expense.
Collection of asset management fees on positive returns of expiring options is subtracted from contract interest credited to policyholders. This offset serves to lessen the increase in contract interest expense relative to the option gains reported in the Company's net investment income. Asset management fees collected during 2021, 2020, and 2019 were $5.8 million, $30.7 million, and $15.9 million, respectively. As previously noted, the Company changed its option hedging methodology during 2020 to an "out-of-the-money" approach. During 2021, all outstanding options had been converted to this methodology which no longer hedges for the collection of asset management fees. Consequently, asset management fees collected during 2021 exhibited a decline.
As previously noted, accounting rules require the embedded derivative liability to include a projection of asset management fees estimated to be collected in the succeeding fiscal year due to the Company's historical practice of purchasing options priced to incorporate an expected probability of collecting asset management fees (referred to as "at the money hedging"). This projection for the embedded derivative liability is based upon the recent performance of the reference equity index. Increases in projected asset management fees to be collected reduce contract interest expense while decreases in projected asset management fees to be collected increase contract interest. During the years ended December 31, 2021, 2020, and 2019, contract interest was increased/(decreased) by $6.5 million, $34.4 million, and $(33.6) million, respectively, for this occurrence. As noted above, the Company changed its option hedging methodology during 2020 to an "out-of-the-money" approach. By the end of the second quarter of 2021, all outstanding options had been converted to this methodology which no longer hedges for the collection of asset management fees. As a result, projections of collected asset management fees were no longer applicable in the second half of 2021 (as the inventory of annual at the money hedges rolled over to only out-of-the-money hedges).
Annuity contract interest includes true-up adjustments for the deferred sales inducement balance which are done each period similar to that done with respect to DPAC balances with the adjustment reflected in current period contract interest expense. To the extent required, the Company may also record unlocking adjustments to deferred sales inducement balances in conjunction with DPAC balance unlockings. In conjunction with the previously discussed unlocking adjustments, the Company unlocked its deferred sales inducement balance during the years ended December 31, 2021, 2020, and 2019 the effect of which was to increase/(decrease) bonus interest amortization by $(1.0) million, $4.4 million, and $0.6 million, respectively.
As noted in the Domestic Life insurance and International Life insurance segments, the Company's overall operating expenses are allocated based upon functional business activity and volumes.
ONL & Affiliates
Effective January 31, 2019, Ozark National and NIS were acquired and their results included in the Consolidated Financial Statements of the Company. Ozark National and NIS have been combined into a separate segment "ONL & Affiliates" given their inter-related marketing and sales approach which consists of a coordinated sale of a non-participating whole life insurance product (Ozark National) and a mutual fund investment product (NIS). An analysis of results of operations for the Company's acquired businesses segment is detailed below. The 2019 results include activity subsequent to the acquisition date.
| | | | | | | | | | | | | | | | | |
| | | |
| | 2021 | | 2020 | | 2019 |
| | | | | |
| | (In thousands) |
| | | | | |
| Premiums and contract revenues: | | | | | |
| Premiums and contract charges | $ | 77,109 | | | 78,921 | | | 74,526 | |
| Net investment income | 26,989 | | | 26,383 | | | 22,593 | |
| Other revenues | 12,654 | | | 10,118 | | | 8,445 | |
| | | | | |
| Total revenues | 116,752 | | | 115,422 | | | 105,564 | |
| | | | | |
| Benefits and expenses: | | | | | |
| Life and other policy benefits | 69,165 | | | 67,739 | | | 59,843 | |
| Amortization of deferred transaction costs | 9,118 | | | 10,780 | | | 8,348 | |
| | | | | |
| Other operating expenses | 20,244 | | | 18,454 | | | 17,056 | |
| | | | | |
| Total benefits and expenses | 98,527 | | | 96,973 | | | 85,247 | |
| | | | | |
| Segment earnings before Federal income taxes | 18,225 | | | 18,449 | | | 20,317 | |
| Provision for Federal income taxes | 3,675 | | | 4,413 | | | 3,700 | |
| | | | | |
| Segment earnings | $ | 14,550 | | | 14,036 | | | 16,617 | |
Revenues from acquired businesses principally include life insurance premiums on traditional type products. Unlike universal life, revenues from traditional products are simply life premiums recognized as income over the premium-paying period of the related policies. The detail of premiums is provided below.
| | | | | | | | | | | | | | | | | |
| | | | | |
| | 2021 | | 2020 | | 2019 |
| | (In thousands) |
| | | | | |
| Traditional life insurance premiums | $ | 79,450 | | | 81,222 | | | 76,576 | |
| Other insurance premiums and considerations | 423 | | | 434 | | | 419 | |
| Reinsurance premiums | (2,764) | | | (2,735) | | | (2,469) | |
| | | | | |
| Totals | $ | 77,109 | | | 78,921 | | | 74,526 | |
Ozark National's traditional life block of business at December 31, 2021 included 175,610 policies in force representing $5.9 billion of life insurance coverage. The repetitive pay nature of Ozark National's business promotes a higher level of persistency with an annualized lapse rate of 4.0% for the year ended December 31, 2021 as compared to 4.1% in 2020. Traditional life premiums by first year and renewal are detailed below.
| | | | | | | | | | | | | | | | | |
| | 2021 | | 2020 | | 2019 |
| | (In thousands) |
| | | | | |
| Traditional life insurance premiums: | | | | | |
| First year premiums | $ | 3,419 | | | 3,943 | | | 5,332 | |
| Renewal premiums | 76,031 | | | 77,279 | | | 71,244 | |
| | | | | |
| Totals | $ | 79,450 | | | 81,222 | | | 76,576 | |
Other revenues consists primarily of brokerage revenue of NIS. Brokerage revenues of $12.5 million for 2021, $9.9 million for 2020, and $8.2 million for 2019 had associated brokerage expenses of $6.1 million, $5.1 million, and $4.4 million, respectively, which are included in Other operating expenses. The 2019 figures are for the eleven months subsequent to its acquisition by the Company.
The average face value of Ozark National's policies in force at December 31, 2021 was approximately $33,600. Consequently, life and policy benefits for smaller face amounts are subject to variation from quarter to quarter. Incurred death claims in 2021 were $39.6 million representing an average net claim of $15,400. Incurred death claims in 2020 were $37.0 million representing an average net claim of $14,800. For the eleven months of operations in 2019 incurred death claims were $29.3 million representing an average net claim of $15,300. Included in 2021 death claims were 458 reported claims with a cause of death identified as COVID-19 which aggregated to $8.2 million in net claims. Included in 2020 death claims were 191 claims with a reported cause of death identified as COVID-19 which aggregated to $2.8 million in net claims. Ozark National's maximum retention on any single insured life is $200,000 with limited exceptions related to the conversion of child protection and guaranteed insurability riders. The balance of life and policy benefits during 2021, 2020, and 2019 consists of increases in insurance reserves and payments of other policy benefits.
Amortization of deferred transaction costs for this segment includes amortizatioin of DPAC and the value of business acquired. As part of the purchase accounting required with the acquisition of Ozark National effective January 31, 2019, the Company recorded an intangible asset of $145.8 million referred to as the value of business acquired ("VOBA"). VOBA represents the difference between the acquired assets and liabilities of Ozark National measured in accordance with the Company's accounting policies and the fair value of these same assets and liabilities. The VOBA balance sheet amount is amortized following a methodology similar to that used for amortizing deferred policy acquisition costs. During the year ended December 31, 2020, the cash value of certain acquired reserves was increased which resulted in a commensurate increase in both the traditional life reserve liability and the related VOBA balance reported on the Consolidated Balance Sheets.
Subsequent to its acquisition effective January 31, 2019, Ozark National began deferring policy acquisition costs and amortizing these deferrals similar to the methodology employed by National Western. The following table identifies the amortization expense of Ozark National's DPAC and VOBA for the years shown.
| | | | | | | | | | | | | | | | | |
| Amortization of deferred transaction costs | 2021 | | 2020 | | 2019 |
| | (In thousands) |
| | | | | |
| Unlocking | $ | — | | | — | | | — | |
| VOBA amortization expense | 8,468 | | | 10,228 | | | 7,697 | |
| DPAC amortization expense | 650 | | | 552 | | | 651 | |
| | | | | |
| Totals | $ | 9,118 | | | 10,780 | | | 8,348 | |
Other Operations
The Company's primary business encompasses its domestic and international life insurance operations, its annuity operations, and ONL & Affiliates. However, the Company also has real estate and other investment operations through its wholly owned subsidiaries, and owned nursing home operations through the early part of 2019.
As discussed in the Consolidated Operations section, the Company closed on the sales of its two nursing home facilities during 2019. Operating results for each entity are included to the date of their respective sales. Nursing home operations generated $(0.2) million, $(0.7) million, and $0.8 million of pre-tax earnings in 2021, 2020, and 2019, respectively. The results for 2019 include net gains of $1.4 million from the sale of Reno personal property and equipment.
Pre-tax operating amounts include the results of BP III, the entity owning and operating the Company's home office facility in Austin, Texas. BP III incurred pre-tax losses of $(0.8) million, $(0.9) million, and $(1.4) million in 2021, 2020, and 2019, respectively. National Western maintains its home office in the facility leasing approximately 40% of the space available. Lease and operating expense payments made by National Western to BP III have been eliminated in consolidation.
The remaining pre-tax earnings in Other Operations of $24.2 million, $22.6 million, and $25.2 million for the years ended December 31, 2021, 2020, and 2019, respectively, includes investment income from real estate, municipal bonds, and common and preferred equities held in subsidiary company portfolios principally for tax-advantage purposes. Included in these amounts are semi-annual distributions from a life interest in the Libbie Shearn Moody Trust which is held in NWLSM, Inc. Pretax distributions from this trust were $5.7 million, $5.3 million, and $6.7 million in 2021, 2020, and 2019, respectively. In addition, the Company holds a modest portfolio of equity securities, primarily in NWL Financial, Inc., whose fair value changes are recorded in net investment income. For the years ended December 31, 2021, 2020, and 2019, the market value changes for these securities were $6.0 million, $(1.0) million, and $3.5 million, respectively.
Pre-tax earnings in 2020 include other revenue of $4.1 million pertaining to the release of a contingent purchase price liability associated with the Ozark National acquisition which the buyer and seller mutually agreed had been satisfied. Pre-tax earnings in 2019 include expenses of $3.3 million related to the purchase of Ozark National and NIS which were not eligible for inclusion in the purchase price.
INVESTMENTS
General
The Company's investment philosophy emphasizes the careful handling of policyowners' and stockholders' funds to achieve security of principal, to obtain the maximum possible yield while maintaining security of principal, and to maintain liquidity in a measure consistent with current and long-term requirements of the Company.
The Company's overall investment philosophy is reflected in the allocation of its investments, which is detailed below as of December 31, 2021 and 2020. The Company has historically emphasized investment grade debt securities.
| | | | | | | | | | | | | | | | | | | | | | | |
| | December 31, 2021 | | December 31, 2020 |
| | Carrying Value | | % | | Carrying Value | | % |
| (In thousands) | | | | (In thousands) | | |
| | | | | | | |
| Debt securities available-for-sale | $ | 9,068,946 | | | 82.7 | | | $ | 10,770,923 | | | 94.2 | |
| Debt securities trading | 1,077,438 | | | 9.8 | | | — | | | — | |
| Mortgage loans | 487,304 | | | 4.4 | | | 332,521 | | | 2.9 | |
| Policy loans | 71,286 | | | 0.6 | | | 74,083 | | | 0.6 | |
| Derivatives, index options | 101,622 | | | 0.9 | | | 132,821 | | | 1.2 | |
| Real estate | 28,606 | | | 0.3 | | | 33,783 | | | 0.3 | |
| Equity securities | 28,217 | | | 0.3 | | | 17,744 | | | 0.2 | |
| Other | 109,064 | | | 1.0 | | | 70,330 | | | 0.6 | |
| | | | | | | |
| Totals | $ | 10,972,483 | | | 100.0 | | | $ | 11,432,205 | | | 100.0 | |
Invested assets at December 31, 2021 include Ozark National amounts as follows: Debt securities of $823.0 million; Policy loans of $23.3 million; and Real estate of $0.0 million. These amounts as of December 31, 2020 consisted of: Debt securities of $811.6 million; Policy loans of $25.5 million; and Real estate of $4.6 million.
The Company’s investment portfolio decreased 4% to $11.0 billion at December 31, 2021 compared to $11.4 billion at December 31, 2020 primarily reflecting a reduction in unrealized gains for investments recorded at their fair market values and higher balances maintained in cash and cash equivalents at December 31, 2021.
Effective December 31, 2020, National Western entered into a Funds Withheld Coinsurance Agreement ("Agreement") with Prosperity Life Assurance Limited ("Prosperity")2023, there were no outstanding stock options. Furthermore, under which it ceded a 100% quota share of contractual statutory annuity reserve liabilities approximating $1.7 billion. Under terms of the Agreement, National Western, on behalf of Prosperity, transferred debt securities to a funds withheld account on its Consolidated Balance Sheet. These securities had previously been classified as held-to-maturity with an amortized cost value of $964.8 million and as available-for-sale at a fair market value of $712.5 million. Prosperity, as investment manager of the funds withheld account, indicated their intention to actively trade these securities in an effort to secure higher yields. Since Prosperity's intent was to not hold the funds withheld debt securities to maturity, the Company was required to reclassify the transferred holdings in the held-to-maturity category to the available-for-sale portfolio category for financial statement purposes. An unrealized gain of $67.1 million was recorded as a result of this transfer and resulted in all funds withheld debt securities recorded at fair market value as of December 31, 2020.
During 2021, the reinsurer actively engaged in selling debt securities in the funds withheld account and purchasing other debt securities. The debt securities acquired by the reinsurer remain as invested assets on the Company's financial statements and have been classified as trading debt securities. The designation as trading debt securities allows the market value fluctuation of these securities to be recorded directly in the Consolidated Statements of Earnings. This results in offsetting the embedded derivative liability change due to market value fluctuations which is also recorded directly in the Consolidated Statements of Earnings.
The Company historically designated approximately 70% of its debt securities in the held-to-maturity portfolio category, which is reported at amortized cost, with the remainder designated in the available-for-sale portfolio, which is reported at fair market value. As an outcome of the accounting for the securities involved in the Agreement with Prosperity, the Company's remaining held-to-maturity securities not included in the Agreement were also precluded from retaining the held-to-maturity classification. Accordingly, at December 31, 2020 the Company reclassified debt securities with a $5.7 billion amortized cost to the available-for-sale category and recognized an unrealized gain of $523.8 million in reporting the securities at their fair market values. Consequently, the increase in the investment portfolio during 2020 was primarily due to reporting balances at fair market value.
Derivatives are call options purchased to hedge the interest crediting mechanism associated with the Company's fixed-index universal life and annuity policies. These options are reported on the Consolidated Balance Sheets at fair value in accordance with GAAP. The unrealized gain position of options held at December 31, 2021 was $54.4 million which was $16.6 million lower than the unrealized gain position at December 31, 2020 of $71.0 million. The decrease is due to the Company moving to an "out-of-the-money" option approach during 2020 which reduces the cost of options by not hedging for potential collection of asset management fees on the associated equity-indexed annuity contracts. The purchase cost of options outstanding at December 31, 2021 was $47.2 million and at December 31, 2020 was $61.8 million.
The Other investment category primarily consists of investments in alternative investment opportunities which have the potential for higher yields than that available with other investment securities. The typical structure involves a fund under the management of an investment management firm with direct lending expertise in a particular market niche which seeks to construct portfolios comprised of senior secured debt. The Company participates through capital funding commitments approved by its Board of Directors based upon the recommendation of the Company's senior investment management team. The funds have targeted dollar sizes and targeted internal rates of return. The Company strategically targeted increasing the portion of its investment portfolio allocated to mortgage loans and alternative investments in the past two years.
Debt Securities
The Company maintains a diversified debt securities portfolio which consists mostly of corporate, mortgage-backed, and public utility fixed income securities. Investments in mortgage-backed securities primarily include U.S. government agency pass-through securities and collateralized mortgage obligations ("CMO"). The Company's investment guidelines prescribe limitations by type of security as a percent of the total investment portfolio and all holdings were within these threshold limits. As of December 31, the Company's debt securities portfolio classified as available-for-sale consisted of the following for 2021 and 2020:
| | | | | | | | | | | | | | | | | | | | | | | |
| | December 31, 2021 | | December 31, 2020 |
| | Carrying Value | | % | | Carrying Value | | % |
| (In thousands) | | | | (In thousands) | | |
| | | | | | | |
| Corporate | $ | 6,700,953 | | | 73.8 | | | $ | 8,098,973 | | | 75.2 | |
| Residential mortgage-backed | 549,623 | | | 6.1 | | | 953,788 | | | 8.9 | |
| Public utilities | 784,969 | | | 8.7 | | | 909,910 | | | 8.4 | |
| State and political subdivisions | 505,960 | | | 5.6 | | | 566,089 | | | 5.3 | |
| U.S. agencies | 44,543 | | | 0.5 | | | 75,441 | | | 0.7 | |
| Asset-backed securities | 390,260 | | | 4.3 | | | 120,524 | | | 1.1 | |
| Commercial mortgage-backed | 27,757 | | | 0.3 | | | 31,471 | | | 0.3 | |
| Foreign governments | 62,391 | | | 0.7 | | | 11,449 | | | 0.1 | |
| U.S. Treasury | 2,490 | | | — | | | 3,278 | | | — | |
| | | | | | | |
| Totals | $ | 9,068,946 | | | 100.0 | | | $ | 10,770,923 | | | 100.0 | |
A substantial portion of the Company’s investable cash flows are directed toward the purchase of long-term debt securities. The Company’s investment policy calls for investing in debt securities that are investment grade, meet quality and yield objectives, and provide adequate liquidity for obligations to policyholders. Particular attention is paid to avoiding concentration in any one industry classification or in large singular credit exposures. Debt securities with intermediate maturities are targeted by the Company as they more closely match the intermediate nature of the Company’s policy liabilities and provide an appropriate strategy for managing cash flows. In the past several years, the Company has purchased a higher level of longer maturity debt securities to match the increased duration of its growing life insurance policy liabilities. The Company holds minimal levels of U.S. Treasury securities due to their low yields and deposits most of these holdings with various state insurance departments in order to meet security deposit on hand requirements in these jurisdictions. At December 31, 2021, the Company has no investments in debt securities in businesses based in Russia or Ukraine and has minimal, if any, holdings in debt securities with exposure to these areas.
Long-term debt securities purchased to fund National Western insurance company operations are summarized below.
| | | | | | | | | | | |
| | Years Ended December 31, |
| | 2021 | | 2020 |
| | (Dollars in thousands) |
| | | |
| Cost of acquisitions | $ | 1,104,009 | | | $ | 727,947 | |
| Average S&P quality | A- | | BBB+ |
| Effective annual yield | 3.02 | % | | 3.33 | % |
| Spread to treasuries | 1.31 | % | | 2.10 | % |
| Effective duration | 10.5 years | | 12.2 years |
The Company has deemphasized mortgage-backed securities for a number of years given the low interest rate environment and the lack of incremental yield relative to other classes of debt securities. Rating agencies generally view mortgage-backed securities as having additional risk for insurers holding interest sensitive liabilities given the potential for asset/liability disintermediation. Consequently, the Company holds predominantly agency mortgage-backed securities. Because mortgage-backed securities are subject to prepayment and extension risk, the Company has substantially reduced these risks by investing in collateralized mortgage obligations ("CMO"), which have more predictable cash flow patterns than pass-through securities. These securities, known as planned amortization class I ("PAC I"), very accurately defined maturity ("VADM"), and sequential tranches, are designed to amortize in a more predictable manner than other CMO classes or pass-throughs. The Company does not purchase tranches, such as PAC II and support tranches, that subject the portfolio to greater than average prepayment risk. Using this strategy, the Company can more effectively manage and reduce prepayment and extension risks, thereby helping to maintain the appropriate matching of the Company's assets and liabilities.
In addition to diversification, an important aspect of the Company's investment approach is managing the credit quality of its investment in debt securities. Thorough credit analysis is performed on potential corporate investments including examination of a company's credit and industry outlook, financial ratios and trends, and event risks. This emphasis is reflected in the high average credit rating of the Company's debt securities portfolio with 98.3%, as of December 31, 2021, held in investment grade securities. In the table below, investments in debt securities available-for-sale are classified according to credit ratings by nationally recognized statistical rating organizations.
| | | | | | | | | | | | | | | | | | | | | | | |
| | December 31, 2021 | | December 31, 2020 |
| | Carrying Value | | % | | Carrying Value | | % |
| (In thousands) | | | | (In thousands) | | |
| | | | | | | |
| AAA | $ | 126,954 | | | 1.4 | | | $ | 116,147 | | | 1.1 | |
| AA | 2,474,572 | | | 27.3 | | | 1,818,879 | | | 16.9 | |
| A | 1,861,686 | | | 20.5 | | | 3,188,008 | | | 29.6 | |
| BBB | 4,452,694 | | | 49.1 | | | 5,344,412 | | | 49.6 | |
| BB and other below investment grade | 153,040 | | | 1.7 | | | 303,477 | | | 2.8 | |
| | | | | | | |
| Totals | $ | 9,068,946 | | | 100.0 | | | $ | 10,770,923 | | | 100.0 | |
Historically, the Company's investment guidelines have not permitted the purchase of below investment grade securities. Recently, these guidelines were amended to allow for purchases of below investment grade securities that are part of an alternative investment ("Schedule BA assets"). The Company continues its longstanding practice of not purchasing any other below investment grade securities. Investments held in available-for-sale debt securities may become below investment grade as the result of subsequent downgrades of the securities. These below investment grade holdings, including structured notes associated with the Schedule BA assets category, are further summarized below.
| | | | | | | | | | | | | | | | | | | | | | | |
| | Available-for-Sale Below Investment Grade Debt Securities |
| | Amortized Cost | | Carrying Value | | Fair Value | | % of Invested Assets |
| | (In thousands except percentages) |
| | | | | | | |
| December 31, 2021 | $ | 150,447 | | | 153,040 | | | 153,040 | | | 1.4 | % |
| | | | | | | |
| December 31, 2020 | $ | 300,417 | | | 303,477 | | | 303,477 | | | 2.7 | % |
The Company's percentage of below investment grade securities compared to total invested assets at December 31, 2021 decreased compared to year-end 2020 primarily due to the disposal of below investment grade securities during 2021. The Company's holdings of below investment grade securities are relatively small and as a percentage of total invested assets remain low compared to industry averages.
Holdings in below investment grade securities by category as of December 31, 2021 are summarized below, including their comparable fair value as of December 31, 2020 for those debt securities rated below investment grade at December 31, 2021. The Company continually monitors developments in these industries for issues that may affect security valuation.
| | | | | | | | | | | | | | | | | | | | | | | | | | |
| | | Available-for-Sale Below Investment Grade Debt Securities |
| Industry Category | | Amortized Cost 2021 | | Carrying Value 2021 | | Fair Value 2021 | | Fair Value
2020 |
| | | (In thousands) |
| | | | | | | | |
| | | | | | | | |
| | | | | | | | |
| Asset-backed securities | | 1,139 | | | 1,154 | | | 1,154 | | | 1,156 | |
| | | | | | | | |
| Oil & gas | | 93,581 | | | 95,772 | | | 95,772 | | | 91,982 | |
| Manufacturing | | 37,823 | | | 38,032 | | | 38,032 | | | 39,510 | |
| | | | | | | | |
| | | | | | | | |
| Other | | 17,904 | | | 18,082 | | | 18,082 | | | 6,352 | |
| | | | | | | | |
| Total before allowance for credit losses | | 150,447 | | | 153,040 | | | 153,040 | | | 139,000 | |
| | | | | | | | |
| Allowance for credit losses | | — | | | — | | | — | | | — | |
| | | | | | | | |
| Totals | | $ | 150,447 | | | 153,040 | | | 153,040 | | | 139,000 | |
The Company closely monitors its below investment grade holdings by reviewing investment performance indicators, including information such as issuer operating performance, debt ratings, analyst reports and other economic factors that may affect these specific investments. While additional losses are not currently anticipated, based on the existing status and condition of these securities, credit deterioration of some securities or the markets in general is possible, which may result in future allowances or write-downs.
Generally accepted accounting principles through the end of 2019 required that investments in debt securities be written down to fair value when declines in value were judged to be other-than-temporary. Fair value is the price that would be received to sell an asset or paid to transfer a liability in an orderly transaction between market participants at the measurement date (an exit price methodology). Refer to Note (4), Fair Values of Financial Instruments, of the accompanying Notes to Consolidated Financial Statements for further discussion.
During 2019, the Company recorded a $7.8 million other-than-temporary impairment on a single debt security issuer. Under the GAAP guidance at that time pertaining to the recognition and accounting for other-than-temporary impairments and their classification as either a credit loss or non-credit loss, the Company recognized a cumulative total of $7.8 million of other-than-temporary impairments of which $7.8 million was deemed credit related and recognized as realized investment losses in earnings, and $0.0 million, net of amortization, which was deemed non-credit related and recognized in other comprehensive income.
As disclosed in Note (1) Summary of SignificantAccounting Policies in the accompanying Notes to Consolidated Financial Statements in this report, the Company adopted new accounting guidance effective January 1, 2020 for credit loss recognition of certain financial assets, including debt securities classified in the "held-to-maturity" category. The Company employed a cohort cumulative loss rate method in estimating current expected credit losses with respect to its held-to-maturity debt securities as of January 1, 2020 and derived an initial allowance of $3.3 million. This method applied publicly available industry wide statistics of default incidence by defined segmentations of debt security investments combined with future assumptions regarding economic conditions (i.e. GDP forecasts) both in the near term and the long term. As noted previously, at December 31, 2020, the Company was required to reclassify all of its held-to-maturity debt securities to the available-for-sale category eliminating the allowance previously recorded. The following table presents the allowance for credit losses activity for the period shown.
| | | | | | | | | | | | | | | | |
| | December 31, |
| | 2021 | | 2020 | | |
| | | | | | |
| Debt Securities Allowance for Credit Losses: | | | | | | |
| Balance, beginning of the period | | $ | — | | | $ | — | | | |
| Impact of adopting new accounting guidance | | — | | | 3,334 | | | |
| (Releases)/provision during the period | | — | | | (3,334) | | | |
| | | | | | |
| Balance, end of period | | $ | — | | | $ | — | | | |
The Company is required to classify its investments in debt securities into one of three categories: (a) trading securities; (b) securities available-for-sale; or (c) securities held-to-maturity. The Company's investment philosophy calls for purchases of securities with the intent to hold to maturity. Historically, a determination was made on categorization based on various factors including the type and quality of the particular security and how it will be incorporated into the Company's overall asset/liability management strategy. As shown in the table below, at December 31, 2021, 89.4% of the Company's total debt securities were classified as securities available-for-sale, including the debt securities in the funds withheld account. These holdings in available-for-sale provide flexibility to the Company to react to market opportunities and conditions and to practice active management within the portfolio to provide adequate liquidity to meet policyholder obligations and other cash needs.
| | | | | | | | | | | | | | | | | | | | | | | |
| | December 31, 2021 |
| | Fair Value | | Amortized Cost | | Allowance For Credit Loss | | Net Unrealized Gains |
| | (In thousands) |
| | | | | | | |
| | | | | | | |
| Debt securities available-for-sale | $ | 9,068,946 | | | 8,604,250 | | | — | | | 464,696 | |
| Debt securities trading | 1,077,438 | | | 1,066,108 | | | — | | | 11,330 | |
| | | | | | | |
| Totals | $ | 10,146,384 | | | 9,670,358 | | | — | | | 476,026 | |
Under the terms of
the funds withheld reinsurance agreement, effective December 31, 2020, the Company, on behalfall outstanding SARs, RSUs and PSUs, all such awards may be settled only in cash. Accordingly, no shares of
the reinsurer, transferred debt securities approximating $1.7 billion to a funds withheld account. Due to the nature of the reinsurance transaction, these debt securities remained as invested assets on the Company's financial statements and were included in the available-for-sale category. In accordance withClass A Stock are issuable under the terms of
such awards.
Under the agreement,Amended Incentive Plan, the reinsurer, or their appointed sub-advisor, wasCompensation Committee has provided Company officers with long-term incentive awards through grants of SARs directly aligning the interest of the officers with stockholder interests. All SARs granted investment management authorityDecember 2019 and thereafter vest ratably over a three-year period, with respect to these securities following agreed upon investment guidelines defined in the reinsurance agreement. During 2021, the reinsurer actively engaged in selling debt securities in the funds withheld account and purchased other debt securities. The debt securities acquired by the reinsurer remain as invested assetsfirst vesting date occurring on the Company's financial statements and have been classified as trading debt securities. The designation as trading debt securities allows the market value fluctuation of these securities to be recorded directly in the Consolidated Statements of Earnings. This results in offsetting the embedded derivative liability change due to market value fluctuations which is also recorded directly in the Consolidated Statements of Earnings.
The Company's trading debt securities portfolio consisted of the following classes of securities:
| | | | | | | | | | | | | | | | | | | | | | | |
| | December 31, 2021 | | December 31, 2020 |
| Carrying
Value | | % | | Carrying
Value | | % |
| (In thousands) | | | | (In thousands) | | |
| | | | | | | |
| Corporate | $ | 423,778 | | | 39.4 | | $ | — | | | — |
| Residential mortgage-backed securities | 44,772 | | | 4.2 | | — | | | — |
| Public utilities | 36,973 | | | 3.4 | | — | | | — |
| State and political subdivisions | 17,487 | | | 1.6 | | — | | | — |
| | | | | | | |
| Asset-backed securities | 313,855 | | | 29.1 | | — | | | — |
| Commercial mortgage-backed | 240,573 | | | 22.3 | | — | | | — |
| | | | | | | |
| | | | | | | |
| | | | | | | |
| Totals | $ | 1,077,438 | | | 100.0 | | $ | — | | | — |
In the table below, investments in trading debt securities are classified according to credit ratings by nationally recognized statistical rating organizations.
| | | | | | | | | | | | | | | | | | | | | | | |
| December 31, 2021 | | December 31, 2020 |
| Carrying
Value | | % | | Carrying
Value | | % |
| (In thousands) | | | | (In thousands) | | |
| | | | | | | |
| AAA | $ | 6,473 | | | 0.6 | | $ | — | | | — |
| AA | 251,507 | | | 23.3 | | — | | | — |
| A | 207,637 | | | 19.3 | | — | | | — |
| BBB | 573,139 | | | 53.2 | | — | | | — |
| BB and other below investment grade | 38,682 | | | 3.6 | | — | | | — |
| | | | | | | |
| Totals | $ | 1,077,438 | | | 100.0 | | $ | — | | | — |
The investments in the trading debt securities below investment grade are summarized below.
| | | | | | | | | | | | | | | | | | | | | | | |
| | Below Investment Grade Trading Debt Securities |
| Amortized
Cost | | Carrying
Value | | Fair
Value | | % of
Invested
Assets |
| | | | | | | |
| | (In thousands, except percentages) |
| | | | | | | |
| December 31, 2021 | $ | 39,470 | | | 38,682 | | | 38,682 | | | 0.4 | % |
| | | | | | | |
Mortgage Loans and Real Estate
The Company originates loans on high quality, income-producing properties such as shopping centers, freestanding retail stores, office buildings, industrial and sales or service facilities, selected apartment buildings, hotels, and health care facilities. The location of these properties is typically in major metropolitan areas that offer a potential for property value appreciation. Credit and default risk is minimized through strict underwriting guidelines and diversification of underlying property types and geographic locations. In addition to being secured by the property, mortgage loans with leases on the underlying property are often guaranteed by the lease payments. This approach has proved over time to result in quality mortgage loans with few defaults. Mortgage loan interest income is recognized on an accrual basis with any premium or discount amortized over the life of the loan. Prepayment and late fees are recorded on the date of collection.
The Company targets a minimum specified yield on mortgage loan investments determined by reference to currently available debt security instrument yields, plus a desired amount of incremental basis points. A low interest rate environment, along with a competitive marketplace, more recently resulted in fewer loan opportunities being available that met the Company's required rate of return. During 2020, mortgage loan originations were further impeded by the COVID-19 pandemic and its effects upon the commercial real estate market. As stabilization returned to the commercial real estate market, the Company directed resources and effort towards expanding its mortgage loan investment portfolio. Mortgage loans originated by the Company totaled $183.6 million and $80.2 million for the years 2021 and 2020, respectively. Principal repayments on mortgage loans in 2021 and 2020 were $28.8 million and $14.8 million, respectively.
Loans in foreclosure, loans considered impaired or loans past due 90 days or more are placed on a non-accrual status. If a mortgage loan is determined to be on non-accrual status, the mortgage loan does not accrue any revenue into the Consolidated Statements of Earnings. The loan is independently monitored and evaluated as to potential impairment or foreclosure. If delinquent payments are made and the loan is brought current, then the Company returns the loan to active status and accrues income accordingly. The Company currently has no loans past due 90 days which are accruing interest. As a result of the economic climate change induced by the COVID-19 virus, during 2020 various mortgage loan borrowers of the Company requested a temporary forbearance of principal payments on loans in the range of three to nine months. There were eight loans representing an aggregate principal balance of $29.2 million with borrowers meeting specified criteria of the Company that forbearance terms were agreed to. At December 31, 2020, only one of these loans with a principal balance of $4.7 million remained in forbearance. All forbearance loans returned to the terms of the original loan agreements during the first quarter of 2021.
Included in the mortgage loan investment balance at December 31, 2021, are three mortgage loan investments made by the reinsurer under the funds withheld reinsurance agreement totaling $8.5 million. Similar to trading debt securities, these loans are reported at fair market values in order to allow the market value fluctuation to be recorded directly in the Consolidated Statements of Earnings and to offset the embedded derivative liability change due to market value fluctuations.
The Company held net investments in mortgage loans, after allowances for possible losses, totaling $487.3 million and $332.5 million at December 31, 2021 and 2020, respectively. The diversification of the portfolio by geographic region, property type, and loan-to-value ratio was as follows:
| | | | | | | | | | | | | | | | | | | | | | | |
| | December 31, 2021 | | December 31, 2020 |
| Amount | | % | | Amount | | % |
| | (In thousands) | | | | (In thousands) | | |
| | | | | | | |
| Mortgage Loans by Geographic Region: | | | | | | | |
| West South Central | $ | 237,644 | | | 48.5 | | | $ | 201,501 | | | 60.1 | |
| East North Central | 61,397 | | | 12.6 | | | 16,478 | | | 4.9 | |
| South Atlantic | 81,847 | | | 16.7 | | | 51,857 | | | 15.5 | |
| East South Central | 20,069 | | | 4.1 | | | 27,590 | | | 8.2 | |
| West North Central | 12,213 | | | 2.5 | | | 12,423 | | | 3.7 | |
| Pacific | 13,800 | | | 2.8 | | | 6,228 | | | 1.9 | |
| Middle Atlantic | 36,296 | | | 7.4 | | | 1,975 | | | 0.6 | |
| Mountain | 26,613 | | | 5.4 | | | 16,955 | | | 5.1 | |
| | | | | | | |
| Gross balance | 489,879 | | | 100.0 | | | 335,007 | | | 100.0 | |
| | | | | | | |
| Market value adjustment | 412 | | | 0.1 | | | — | | | — | |
| Allowance for credit losses | (2,987) | | | (0.6) | | | (2,486) | | | (0.7) | |
| | | | | | | |
| Totals | $ | 487,304 | | | 99.5 | | | $ | 332,521 | | | 99.3 | |
| | | | | | | | | | | | | | | | | | | | | | | |
| | December 31, 2021 | | December 31, 2020 |
| Amount | | % | | Amount | | % |
| | (In thousands) | | | | (In thousands) | | |
| | | | | | | |
| Mortgage Loans by Property Type: | | | | | | | |
| Retail | $ | 164,895 | | | 33.7 | | | $ | 92,173 | | | 27.5 | |
| Office | 142,824 | | | 29.2 | | | 111,735 | | | 33.3 | |
| Hotel | 23,748 | | | 4.8 | | | 8,372 | | | 2.5 | |
| Storage Facility | 73,401 | | | 15.0 | | | 53,591 | | | 16.0 | |
| Industrial | 34,212 | | | 7.0 | | | 29,131 | | | 8.7 | |
| Land/Lots | 4,597 | | | 0.9 | | | 4,680 | | | 1.4 | |
| Apartments | 38,920 | | | 7.9 | | | 29,743 | | | 8.9 | |
| Residential | 1,905 | | | 0.4 | | | — | | | — | |
| All other | 5,377 | | | 1.1 | | | 5,582 | | | 1.7 | |
| Gross balance | 489,879 | | | 100.0 | | | 335,007 | | | 100.0 | |
| | | | | | | |
| Market value adjustment | 412 | | | 0.1 | | | — | | | — | |
| Allowance for credit losses | (2,987) | | | (0.6) | | | (2,486) | | | (0.7) | |
| | | | | | | |
| Totals | $ | 487,304 | | | 99.5 | | | $ | 332,521 | | | 99.3 | |
| | | | | | | | | | | | | | | | | | | | | | | |
| | December 31, 2021 | | December 31, 2020 |
| Amount | | % | | Amount | | % |
| | (In thousands) | | | | (In thousands) | | |
| | | | | | | |
Mortgage Loans by Loan-to-Value Ratio (1): | | | | | | | |
| Less than 50% | $ | 100,806 | | | 20.6 | | | $ | 66,635 | | | 19.9 | |
| 50% to 60% | 128,191 | | | 26.2 | | | 64,536 | | | 19.3 | |
| 60% to 70% | 202,670 | | | 41.3 | | | 153,414 | | | 45.8 | |
| 70% to 80% | 58,212 | | | 11.9 | | | 50,422 | | | 15.0 | |
| 80% to 90% | — | | | — | | | — | | | — | |
| | | | | | | |
| Gross balance | 489,879 | | | 100.0 | | | 335,007 | | | 100.0 | |
| | | | | | | |
| Market value adjustment | 412 | | | 0.1 | | | — | | | — | |
| Allowance for credit losses | (2,987) | | | (0.6) | | | (2,486) | | | (0.7) | |
| | | | | | | |
| Totals | $ | 487,304 | | | 99.5 | | | $ | 332,521 | | | 99.3 | |
(1) Loan-to-Value Ratio using the most recent appraised value. Appraisals are required at the time of funding and may be updated if a material change occurs from the original loan agreement.
All mortgage loans are analyzed quarterly in order to monitor the financial quality of these assets. Based on ongoing monitoring, mortgage loans with a likelihood of becoming delinquent are identified and placed on an internal “watch list”. Among the criteria that would indicate a potential problem are: major tenant vacancies or bankruptcies, late payments, and loan relief/restructuring requests. The mortgage loan portfolio is analyzed for the need for a valuation allowance on any loan that is on the internal watch list, in the process of foreclosure, or that currently has a valuation allowance.
Prior to January 1, 2020, mortgage loans were considered impaired when, based on current information and events, it was probable that the Company would be unable to collect all amounts due according to the contractual terms of the loan agreement. When it was determined that a loan was impaired, a loss was recognized for the difference between the carrying amount of the mortgage loan and the estimated value reduced by the cost to sell. Estimated value was typically based on the loan's observable market price or the fair value of the collateral less cost to sell. Impairments and changes in the valuation allowance were reported in net realized investment gains (losses) in the Consolidated Statements of Earnings. The Company held a valuation allowance of $0.7 million at December 31, 2019.
As disclosed in Note (1) Summary of Significant Accounting Policies in the accompanying Notes to Consolidated Financial Statements in this report, the Company adopted new accounting guidance for credit loss recognition criteria for certain financial assets, including mortgage loans. For mortgage loan investments the Company employed the Weighted Average Remaining Maturity ("WARM") method in estimating current expected losses with respect to mortgage loan investments as of January 1, 2020 and each succeeding calendar quarter-end. The WARM method applies publicly available data of default incidence of commercial real estate properties by several defined segmentations combined with future assumptions regarding economic conditions (i.e. GDP forecasts) both in the near term and the long term. Under this new accounting guidance, at January 1, 2020 a balance of $1.2 million was recorded for mortgage loan investments which incorporated the previous year-end balance under the prior accounting method. The adjustment resulted in a charge to retained earnings as a change in accounting, net of tax, of $0.4 million. Subsequent changes in the allowance for current expected credit losses are reported in net investment income in the Consolidated Statements of Earnings.
The following table represents the mortgage loan allowance for credit losses.
| | | | | | | | | | | |
| Years Ended December 31, |
| | 2021 | | 2020 |
| | (In thousands) |
| | | |
| Mortgage Loans Allowance for Credit Losses: | | | |
| Balance, beginning of the period | $ | 2,486 | | | 675 | |
| Impact of adoption of new accounting guidance | — | | | 504 | |
| Provision during the period | 501 | | | 1,307 | |
| Releases | — | | | — | |
| | | |
| Balance, end of period | $ | 2,987 | | | 2,486 | |
The Company had no mortgage loans past due six months or more at December 31, 2021 or 2020. There was no interest income that was not recognized in 2021, 2020, or 2019.
The contractual maturities of mortgage loan principal balances at December 31, 2021 and 2020 were as follows:
| | | | | | | | | | | | | | | | | | | | | | | |
| | December 31, 2021 | | December 31, 2020 |
| Amount | | % | | Amount | | % |
| | (In thousands) | | | | (In thousands) | | |
| | | | | | | |
| Principal Balance by Contractual Maturity: | | | | | | | |
| Due in one year or less | $ | 13,422 | | | 2.7 | | | $ | 4,208 | | | 1.3 | |
| Due after one year through five years | 127,766 | | | 26.1 | | | 60,826 | | | 18.1 | |
| Due after five years through ten years | 222,444 | | | 45.4 | | | 154,787 | | | 46.1 | |
| Due after ten years through fifteen years | 115,313 | | | 23.5 | | | 107,662 | | | 32.1 | |
| Due after fifteen years | 11,280 | | | 2.3 | | | 7,977 | | | 2.4 | |
| | | | | | | |
| Totals | $ | 490,225 | | | 100.0 | | | $ | 335,460 | | | 100.0 | |
The Company's direct investments in real estate total approximately $28.6 million at December 31, 2021 and $33.8 million at December 31, 2020, and consist primarily of income-producing properties which are being operated by a wholly owned subsidiary of National Western. Included in the amount at December 31, 2020 was a surface parking property owned by Ozark National in Kansas City, Missouri which contracted it out for rent. The value of this real estate investment was appraised at $4.3 million at January 31, 2019 as part of the purchase accounting done as of that date. During 2021, Ozark National sold its home office properties, including the surface parking property. The Company recognized operating income on its direct investments in real estate of approximately $2.9 million, $2.9 million and $2.9 million for the years ended December 31, 2021, 2020, and 2019, respectively. The Company monitors the conditions and market values of these properties on a regular basis and makes repairs and capital improvements to keep the properties in good condition.
The Company recorded net realized investment gains (losses) of $(1.4) million, $2.7 million and $6.9 million associated with real estate investments in the years ended December 31, 2021, 2020 and 2019, respectively. The net real estate loss for the year ended December 31, 2021 was related to Ozark National sale of the home office, parking garage and parking lot described above. Net realized investment gains for the year ended December 31, 2020 pertain to property located in Travis County, Texas which was sold. Included in net realized investment gains during 2019 are the sale of the Company's former home office facility in Austin, Texas at a gain of $3.2 million and the sale of the Company's two nursing home facilities at a net gain of $3.7 million.
Other invested asset balances outstanding have remained relatively stable over the past few years. National Western, in order to obtain incremental investment yield, began expanding its invested asset vehicles to include alternative investments during 2020. These assets consist of syndicated, targeted capital pools with specific investment objectives managed by investment firms having expertise in designated asset opportunities. At December 31, 2021 and 2020, the Company held balances of $67.7 million and $28.9 million, respectively, in this investment type which are included in the Other category in the investment table at the beginning of this section.
Derivatives, Index Options
The Company offers fixed-index universal life and annuity products that guarantee the return of principal to policyholders and, at the policyholder’s election, credit interest based on a percentage gain in a specified equity market index (policyholders may alternatively elect a fixed interest rate). Premiums and deposits received on these products are predominantly invested in investment grade fixed income securities with a portion used to purchase derivatives consisting of call options on the applicable market index to fund the index credits due to fixed-index policyholders. The call options purchased are one year over-the-counter option contracts coinciding with the initial issuance of the policy and subsequent annual renewal periods in order to match the Company’s funding requirements for the underlying policies. On the respective anniversary dates of the index policies, the index used to compute the annual index credit is reset and a new one-year call option is purchased to fund the next annual index credit.
Although the call options are employed to be effective hedges against the Company’s policyholder obligations from an economic standpoint, they do not meet the requirements for hedge accounting under GAAP. Accordingly, the call options are marked to fair value on each reporting date with the change in fair value, plus or minus, included as a component of net investment income. The change in fair value of the call options includes the realized gains or losses recognized at the expiration of the option term and the unrealized gain or loss changes in fair value for open contracts.
The Company’s design of its fixed-index products incorporates a budget for the purchase of over-the-counter call options to fund the index credits due to policyholders. Management monitors current prices of these call options and manages component features of the fixed-index products in accordance with the terms of the policy contracts in order to control the cost of purchases. These terms permit the Company to change caps, participation rates, and asset fees, subject to guaranteed minimums, thus managing the cost of the call options quoted by counterparties. In addition, the Company's product terms allow for the Company to withdraw from offering a particular index option at any time effective on the next policy anniversary date.
The fair value of derivative instruments presented in the Company’s Consolidated Financial Statements totaling $101.6 million at December 31, 2021 and $132.8 million at December 31, 2020 pertain to notional policyholder account values of $2.1 billion and $2.1 billion at December 31, 2021 and 2020, respectively, electing interest credits based upon applicable market index performance.
Market Risk
Market risk is the risk of change in market values of financial instruments due to changes in interest rates, currency exchange rates, commodity prices, or equity prices. The most significant market risk exposure for the Company is interest rate risk. Substantial and sustained increases and decreases in market interest rates can affect the profitability of insurance products and the fair value of investments. The yield realized on new investments generally increases or decreases in direct relationship with interest rate changes. The fair values of fixed income debt securities correlate to external market interest rate conditions as market values typically increase when market interest rates decline and decrease when market interest rates rise. However, market values may fluctuate for other reasons, such as changing economic conditions, market dislocations, declination in credit quality, or increasing event-risk concerns.
Interest Rate Risk
A gradual increase in interest rates from current levels would generally be a positive development for the Company. Rate increases would be expected to provide incremental net investment income, produce increased sales of fixed rate products, and limit the potential erosion of the Company’s interest rate spread on products due to minimum guaranteed crediting rates in products. Alternatively, a rise in interest rates would reduce the fair value of the Company’s investment portfolio and if long-term rates rise dramatically within a relatively short time period the Company could be exposed to disintermediation risk. Disintermediation risk is the risk that policyholders will surrender their policies in a rising interest rate environment forcing the Company to liquidate assets when they are in an unrealized loss position.
A decline in interest rates could cause certain mortgage-backed securities in the Company’s portfolio to be more likely to pay down or prepay. In this situation, the Company typically will be unable to reinvest the proceeds at comparable yields. Lower interest rates will likely also cause lower net investment income, subject the Company to reinvestment rates risks, and possibly reduce profitability through reduced interest rate margins associated with products having minimum guaranteed crediting rates. Alternatively, the fair value of the Company’s investment portfolio will increase when interest rates decline.
The correlation between fair values and interest rates for available-for-sale debt securities is reflected in the tables below.
| | | | | | | | | | | |
| | December 31, |
| | 2021 | | 2020 |
| | (In thousands except percentages) |
| | | |
| Available-for-Sale Debt securities - fair value | $ | 9,068,946 | | | 10,770,923 | |
| Available-for-Sale Debt securities - amortized cost | $ | 8,604,250 | | | 9,874,543 | |
| | | |
| Fair value as a percentage of amortized cost | 105.40 | % | | 109.08 | % |
| Unrealized gains at year-end | $ | 464,696 | | | 896,380 | |
| Ten-year U.S. Treasury bond - increase (decrease) in yield for the year | 0.59 | % | | (1.00) | % |
The Company's trading debt securities, which are exclusively in the funds withheld assets managed by the reinsurer, are recorded at fair value upon purchase. While the recorded value of these trading debt securities subsequently fluctuates with market prices, the fair value movement of the securities is entirely offset by an identical fair value movement of the associated funds withheld liabilities.
The Company's unrealized gain balance for available-for-sale and trading debt securities held at December 31, 2021 and 2020 is shown in the following table.
| | | | | | | | | | | | | | | | | |
| | Unrealized Gain Balance |
| Net Balance at | | Net Balance at | | |
| December 31, | | December 31, | | Change in Net |
| | 2021 | | 2020 | | Balance |
| | (In thousands) |
| | | | | |
| | | | | |
| Debt securities available-for-sale | $ | 464,696 | | | 896,380 | | | (431,684) | |
| Debt securities trading | 11,331 | | | — | | | 11,331 | |
| | | | | |
| Totals | $ | 476,027 | | | 896,380 | | | (420,353) | |
The change in the unrealized balance pertaining to debt securities available-for-sale is recorded in Other comprehensive income in the Consolidated Statements of Comprehensive Income while the change in the unrealized balance pertaining to trading debt securities is recorded in net investment income in the Consolidated Statements of Earnings.
Changes in interest rates typically have a sizable effect on the fair values of the Company's debt securities. During 2021, the market interest rate of the ten-year U.S. Treasury bond increased 59 basis points from 0.92% at year-end 2020 to 1.51% at year-end 2021. Therefore, the decrease in the unrealized gain position is an expected portfolio value movement.
The Company manages interest rate risk principally through ongoing cash flow testing as required for insurance regulatory purposes. Computer models are used to perform cash flow testing under various commonly used stress test interest rate scenarios to determine if existing assets would be sufficient to meet projected liability outflows. Sensitivity analysis allows the Company to measure the potential gain or loss in fair value of its interest-sensitive instruments and to protect its economic value and achieve a predictable spread between what is earned on invested assets and what is paid on liabilities. The Company seeks to minimize the impact of interest risk through surrender charges that are imposed to discourage policy surrenders. Interest rate changes can be anticipated in computer models and the corresponding risk addressed by management actions affecting asset and liability instruments. However, potential changes in the values of financial instruments indicated by hypothetical interest rate changes will likely be different from actual changes experienced, and the differences could be significant.
The Company has the ability to adjust interest rates, participation rates, and asset management fees and caps, as applicable, in response to changes in investment portfolio yields for a substantial portion of its business in force. The ability to adjust these rates is subject to competitive forces in the market for the Company’s products. Surrender rates could increase and new sales could be negatively affected if crediting rates are not competitive with the rates on competing products offered by other insurance companies and financial service entities. The Company designs its interest sensitive and annuity products with features encouraging persistency, such as surrender and withdrawal penalty provisions. Typically, surrender charge rates gradually decrease each year the contract is in force.
The Company seeks to minimize the impact of interest rate risk through surrender charges that are imposed to discourage policy surrenders and to offset unamortized deferred policy acquisition costs. Certain products, such as supplementary contracts with life contingencies, are not subject to surrender or discretionary withdrawal. The Company may also include a market value adjustment (“MVA”) feature on its annuity products which could increase or decrease the amount paid to contract holders upon surrender of their contract as a means to further mitigate interest rate risk.
The following table profiles the Company’s insurance liabilities at December 31, 2021 for annuities, deposit-type contracts and supplementary contracts with life contingencies by surrender and discretionary withdrawal characteristics.
| | | | | | | | | | | |
| | December 31, 2021 |
| | Amount | | % |
| | (In thousands) | | |
| | | |
| Subject to discretionary withdrawal: | | | |
| With market value adjustment | $ | 145,634 | | | 2.2 | |
| With surrender charge of 5% or more | 4,439,039 | | | 65.9 | |
| With surrender charge of 5% or less | 1,761,750 | | | 26.2 | |
| Not subject to discretionary withdrawal | 385,937 | | | 5.7 | |
| | | |
| Total Gross | 6,732,360 | | | 100.0 | |
| | | |
| Reinsurance ceded | 1,504,044 | | | |
| | | |
| Total Net | $ | 5,228,316 | | | |
Interest Rate Sensitivity
The following table illustrates the market risk sensitivity of the Company's interest rate sensitive assets. The table shows the effect of a change in interest rates on the fair value of the portfolio using models that measure the change in fair value arising from an immediate and sustained change in interest rates in increments of 100 basis points.
| | | | | | | | | | | | | | | | | | | | | | | | | | | | | |
| Fair Values of Assets
Changes in Interest Rates in Basis Points |
| | -100 | | 0 | | 100 | | 200 | | 300 |
| | (In thousands) |
| | | | | | | | | |
| Debt and equity securities | $ | 10,790,199 | | | 10,174,601 | | | 9,631,667 | | | 9,145,271 | | | 8,706,995 | |
| Mortgage loans | 544,575 | | | 513,246 | | | 484,481 | | | 458,028 | | | 433,663 | |
| Other loans | 25,500 | | | 25,085 | | | 24,683 | | | 24,291 | | | 23,911 | |
| Derivatives | 100,148 | | | 101,622 | | | 103,083 | | | 104,559 | | | 106,040 | |
The selection of the 100 basis point parallel shift in the yield curve was made as an illustration of the potential hypothetical impact of such an event and should not be construed as a prediction of future market events. Actual results could vary materially from those illustrated due to the nature of the estimates and assumptions used in the above analysis. Expected maturities of debt securities may differ from contractual maturities due to call or prepayment provisions. The models assume that prepayments on mortgage-backed securities are influenced by agency and pool types, the level of interest rates, loan age, refinancing incentive, month of the year, and underlying coupon. During periods of declining interest rates, principal payments on mortgage-backed securities and collateralized mortgage obligations tend to increase as the underlying mortgages are prepaid. Conversely, during periods of rising interest rates, the rate of prepayment slows. Both of these situations can expose the Company to the possibility of asset-liability cash flow and yield mismatch. The model uses a proprietary method of sampling interest rate paths along with a mortgage prepayment model to derive future cash flows. The initial interest rates used are based on the current U.S. Treasury yield curve as well as current mortgage rates for the various types of collateral in the portfolio.
Mortgage and other loans were modeled by discounting scheduled cash flows through the scheduled maturities of the loans, starting with interest rates currently being offered for similar loans to borrowers with similar credit ratings. Policy loans were modeled by discounting estimated cash flows using U.S. Treasury Bill interest rates as base rates at December 31, 2021. The estimated cash flows include assumptions as to whether such loans will be repaid by the policyholders or settled upon payment of death or surrender benefits on the underlying insurance contracts and incorporate both Company experience and mortality assumptions associated with such contracts.
In addition to the securities analyzed above, the Company invests in index options which are derivative financial instruments used to hedge the equity return component of the Company's indexed annuity and life products. The values of these options are primarily impacted by equity price risk, as the options' fair values are dependent on the performance of the underlying reference index. However, increases or decreases in investment returns from these options are substantially offset by corresponding increases or decreases in amounts paid to indexed policyholders, subject to minimum guaranteed policy interest rates.
The Company's market risk liabilities, which include policy liabilities for annuity and supplemental contracts, are managed for interest rate risk through cash flow testing as previously described. As part of this cash flow testing, the Company has analyzed the potential impact on net earnings of a 100 basis point decrease and increases in increments of 100 basis points in the U.S. Treasury yield curve as of December 31, 2021. The potential impact on net earnings from these interest rate changes are summarized below.
| | | | | | | | | | | | | | | | | | | | | | | |
| | Changes in Interest Rates in Basis Points |
| | -100 | | 100 | | 200 | | 300 |
| | (In thousands) |
| | | | | | | |
| Impact on net earnings | $ | (1,189) | | | 1,485 | | | 4,280 | | | 10,357 | |
These estimated impacts on earnings are net of tax effects and the estimated effects of deferred policy acquisition costs.
The above described scenarios produce estimated changes in cash flows as well as cash flow reinvestment projections. Estimated cash flows in the Company's model assume cash flow reinvestments, which are representative of the Company's current investment strategy. Calls and prepayments include scheduled maturities and those expected to occur which would benefit the security issuers. Assumed policy surrenders consider differences and relationships between credited interest rates and market interest rates as well as surrender charges on individual policies. The impact to earnings also includes the expected effects on amortization of deferred policy acquisition costs. The model considers only annuity and supplemental contracts in force at December 31, 2021, and does not consider new product sales or the possible impact of interest rate changes on sales.
Credit Risk
The Company is exposed to credit risk through counterparties and within its investment portfolio. Credit risk relates to the uncertainty associated with an obligor’s continued ability to make timely payments of principal and interest in accordance with the contractual terms of an instrument or contract. As previously discussed, the Company manages credit risk through established investment credit policies and guidelines which address the quality of creditors and counterparties, concentration limits, diversification practices and acceptable risk levels. These policies and guidelines are regularly reviewed and approved by senior management and the Company’s Board of Directors.
In connection with the Company’s use of call options to hedge the equity return component of its fixed-indexed annuity and life products, the Company is exposed to the risk that a counterparty fails to perform under terms of the option contract. The Company purchases one-year option contracts from multiple counterparties and evaluates the creditworthiness of all counterparties prior to the purchase of the contracts. For consideration in contracting with a counterparty the rating required by the Company is a credit rating of “A” or higher. Accordingly, all options are purchased from nationally recognized financial institutions with a demonstrated performance for honoring their financial obligations and possessing substantial financial capacity. In addition, each counterparty is required to execute a credit support agreement obligating the counterparty to provide collateral to the Company when the fair value of the Company’s exposure to the counterparty exceeds specified amounts. Counterparty credit ratings and credit exposure are monitored continuously by National Western’s Investment Department with adjustments to collateral levels managed as incurred under the credit support agreements.
The Company follows the industry practice of reinsuring (ceding) portions of its insurance risks with a variety of reinsurance companies on either a coinsurance or a modified coinsurance basis in order to limit risk. Use of reinsurance does not relieve the Company of its primary liability to pay the full amount of the insurance benefit in the event the reinsurer (counterparty) fails to honor its contractual obligation. Consequently, the Company avoids concentrating reinsurance counterparty credit risk with any one reinsurer and only maintains reinsurance agreements with reputable carriers which are well-capitalized and highly rated by independent rating agencies. With respect to the funds withheld coinsurance arrangement entered into by National Western, assets backing the reserves for the policyholder obligations under the agreement are retained by the Company and are available to meet benefit payment commitments. In addition, National Western is the beneficiary of an incremental collateral trust account provided by the reinsurer providing additional security for the payment of all amounts due under the reinsurance agreement.
The Company’s net exposure to loss due to credit risk if option counterparties failed to completely perform according to the terms of their one-year contracts is as follows at December 31, 2021 and 2020.
| | | | | | | | | | | | | | | | | | | | | | | | | | |
| | | | December 31, 2021 |
| | Moody/ | | Fair | | Collateral | | Net |
| Counterparty | | S&P Rating | | Value | | Held | | Exposure |
| | | | (In thousands) |
| | | | | | | | |
| Credit Suisse | | WR/A+ | | $ | 12,659 | | | 12,965 | | | — | |
| Wells Fargo | | Aa2/A+ | | 19,169 | | | 19,868 | | | — | |
| Bank of America | | Aa2/A+ | | 13,451 | | | 13,740 | | | — | |
| Barclays Bank | | A1/A | | 8,119 | | | 8,597 | | | — | |
| BNP Paribas | | Aa3/A+ | | 25,906 | | | 27,004 | | | — | |
| | | | | | | | |
| Royal Bank of Canada | | Aa2/AA- | | 5,923 | | | 6,845 | | | — | |
| Canadian Imperial Bank | | Aa2/A+ | | 6,125 | | | 6,592 | | | — | |
| Societe Generale | | A1/A | | 10,270 | | | 10,660 | | | — | |
| | | | | | | | |
| | | | $ | 101,622 | | | 106,271 | | | — | |
| | | | | | | | | | | | | | | | | | | | | | | | | | |
| | | | December 31, 2020 |
| | Moody/ | | Fair | | Collateral | | Net |
| Counterparty | | S&P Rating | | Value | | Held | | Exposure |
| | | | (In thousands) |
| | | | | | | | |
| Credit Suisse | | Aa3/A+ | | $ | 14,044 | | | 13,485 | | | 559 | |
| Wells Fargo | | Aa2/A+ | | 30,278 | | | 30,611 | | | — | |
| Bank of America | | Aa2/A+ | | 14,677 | | | 14,976 | | | — | |
| Barclays Bank | | A1/A | | 34,088 | | | 33,717 | | | 371 | |
| BNP Paribas | | Aa3/A+ | | 7,361 | | | 6,657 | | | 704 | |
| | | | | | | | |
| Royal Bank of Canada | | Aa2/AA- | | 5,108 | | | 5,083 | | | 25 | |
| Canadian Imperial Bank | | Aa2/A+ | | 12,572 | | | 12,388 | | | 184 | |
| Societe Generale | | A1/A | | 14,693 | | | 14,480 | | | 213 | |
| | | | | | | | |
| | | | $ | 132,821 | | | 131,397 | | | 2,056 | |
The Company has never incurred a loss on index options due to counterparty default.
The Company is also exposed to credit spread risk related to market prices of investment securities and cash flows associated with changes in credit spreads. Credit spread tightening will reduce net investment income associated with new purchases of fixed debt securities but will also increase the fair value of the investment portfolio. Credit spread widening will reduce the fair value of the investment portfolio but will also increase net investment income on new purchases.
LIQUIDITY AND CAPITAL RESOURCES
Liquidity
Liquidity requirements are met primarily by funds provided from operations. Premium deposits and annuity considerations, investment income, and investment maturities and prepayments are the primary sources of funds while investment purchases, policy benefits in the form of claims, and payments to policyholders and contract holders in connection with surrenders and withdrawals as well as operating expenses are the primary uses of funds. To ensure the Company will be able to pay future commitments, the funds received as premium payments and deposits are invested in high quality investments, primarily fixed income securities. Funds are invested with the intent that the income from investments, plus proceeds from maturities, will meet the ongoing cash flow needs of the Company. The approach of matching asset and liability durations and yields requires an appropriate mix of investments. Although the Company historically has not been put in the position of having to liquidate invested assets to provide cash flow, its investments consist primarily of marketable debt securities that could be readily converted to cash for liquidity needs. National Western maintains a line of credit facility of $75 million which it may access for short-term cash needs. As part of the acquisition of Ozark National and NIS effective January 31, 2019, National Western borrowed $75 million to partly fund the closing cash purchase price of $205.4 million. The amounts borrowed were subsequently repaid during the first quarter of 2019 and there have been no borrowings under the line of credit since that time including as at December 31, 2021.
In addition, National Western became a member of the Federal Home Loan Bank of Dallas (FHLB) during 2020 through an initial minimum required stock investment of $4.3 million. Through this membership, National Western is able to create a specified borrowing capacity based upon the amount of collateral it elects to establish. At December 31, 2021, cash and securities in the amount of $57.3 million (fair value of $60.6 million) were pledged as collateral to FHLB.
A primary liquidity concern for life insurers is the risk of an extraordinary level of early policyholder withdrawals, particularly with respect to annuity products which can move more rapidly with interest rate changes. The Company includes provisions within its annuity and universal life insurance policies, such as surrender and market value adjustments, that help limit and discourage early withdrawals.
The following table sets forth withdrawal characteristics of National Western's annuity reserves and deposit liabilities (based on statutory reporting liability values) as of the dates indicated.
| | | | | | | | | | | | | | | | | | | | | | | |
| | December 31, 2021 | | December 31, 2020 |
| | Amount | | % of Total | | Amount | | % of Total |
| | (In thousands except percentages) |
| | | | | | | |
| Not subject to discretionary withdrawal provisions | $ | 385,937 | | | 5.7 | % | | $ | 369,627 | | | 5.4 | % |
| | | | | | | |
| Subject to discretionary withdrawal, with adjustment: | | | | | | | |
| With market value adjustment | 145,634 | | | 2.2 | % | | 290,794 | | | 4.2 | % |
| At contract value less current surrender charge of 5% or more | 4,439,039 | | | 65.9 | % | | 4,644,808 | | | 67.6 | % |
| | | | | | | |
| Subtotal | 4,970,610 | | | 73.8 | % | | 5,305,229 | | | 77.2 | % |
| Subject to discretionary withdrawal at contract value with no surrender charge or surrender charge of less than 5% | 1,761,750 | | | 26.2 | % | | 1,564,485 | | | 22.8 | % |
| | | | | | | |
| Total annuity reserves and deposit liabilities - Gross | 6,732,360 | | | 100.0 | % | | 6,869,714 | | | 100.0 | % |
| | | | | | | |
| Reinsurance ceded | 1,504,044 | | | | | 1,707,361 | | | |
| | | | | | | |
| Total annuity reserves and deposit liabilities - Net | $ | 5,228,316 | | | | | $ | 5,162,353 | | | |
The actual amounts paid out by product line in connection with surrenders and withdrawals are noted in the table below.
| | | | | | | | | | | | | | | | | |
| Years Ended December 31, |
| | 2021 | | 2020 | | 2019 |
| | (In thousands) |
| | | | | |
| Product Line: | | | | | |
| Traditional Life | $ | 16,348 | | | 17,022 | | | 17,614 | |
| Universal Life | 95,628 | | | 96,031 | | | 101,187 | |
| Annuities | 658,403 | | | 643,223 | | | 705,892 | |
| | | | | |
| Total | $ | 770,379 | | | 756,276 | | | 824,693 | |
The above contractual withdrawals, as well as the level of surrenders experienced, and the associated cash outflows did not have an adverse impact on overall liquidity. The amounts shown includes funds withheld policyholder obligations in 2021 and Ozark National cash outflows (subsequent to their acquisition on January 31, 2019). Individual life insurance policies are typically less susceptible to withdrawal than annuity reserves and deposit liabilities because policyholders may need to undergo a new underwriting process in order to obtain a new insurance policy elsewhere. Annuity dollar outflows are generally more sensitive to economic conditions, interest rate levels, and the level of surrender charges assessed upon withdrawal or termination. Cash flow projections and tests under various market interest rate scenarios and assumptions are performed to assist in evaluating liquidity needs and adequacy. With economic decline precipitated by the COVID-19 pandemic, Company management conducted additional liquidity scenario testing during 2020 using more severe assumptions and concluded that liquid assets were more than adequate under these scenarios. Accordingly, the Company currently expects available liquidity sources and future cash flows to be more than adequate to meet the demand for funds.
Cash flows from the Company's insurance operations have historically been sufficient to meet current needs. Cash flows from operating activities were $276.8 million, $373.1 million, and $329.0 million in 2021, 2020, and 2019, respectively. The Company also has significant cash flows from both scheduled and unscheduled investment security maturities, redemptions, and prepayments. These cash flows totaled $1,582.0 million, $1,294.8 million, and $995.8 million in 2021, 2020, and 2019, respectively. Operating and investing activity cash flow items could be reduced if interest rates rise at an accelerated rate in the future. Net cash inflows/(outflows) from the Company's universal life and annuity product operations totaled $(322.2) million, $(437.4) million, and $(584.7) million in 2021, 2020, and 2019, respectively. The lower net outflow in 2021 reflects a higher level of fixed-index annuity sales.
Capital Resources
The Company relies on stockholders for its capital resources as there is no long-term debt outstanding and the Company does not anticipate the need for any long-term debt in the near future. As of December 31, 2021, the Company maintained commitments for its normal operating and investment activities.
The Company has declared and paid an annual dividend on its common shares since 2005. The Company's practice has been to take a conservative approach to dividends, and the Board of Directors has adopted a strategic position to substantially reinvest earnings internally. This conservative approach yields the following benefits: (1) providing capital to finance the development of new business; (2) enabling the Company to take advantage of potential acquisitions and other competitive situations as they arise; (3) building a strong capital base to support the Company's financial strength ratings; (4) maintaining the Company's liquidity and solvency during difficult economic and market conditions; and (5) enhancing the Company's regulatory capital position. For similar reasons, despite the fact the Company's market price of its Class A common shares has been trading at a discount to the book value per share for some time, there are no imminent plans for the Company to repurchase its shares.
As the largest subsidiary of NWLGI, National Western serves as the primary funding source for NWLGI. The capacity of National Western to pay dividends to NWLGI is limited by law in the state of Colorado to earned profits (statutory unassigned surplus). At December 31, 2021, the maximum amount legally available for distribution during 2022 without further regulatory approval is $64.4 million.
The National Association of Insurance Commissioners ("NAIC") has established risk-based capital ("RBC") standards for U.S. life insurers as well as a risk-based capital model act ("RBC Model Act"). The RBC Model Act requires that life insurers annually submit a report to state regulators regarding their RBC amounts based upon four categories of risk (asset risk, insurance risk, interest rate risk, and business risk). The capital requirement for each is determined by applying factors that vary based upon the degree of risk to various asset, premium and policy benefit reserve items. The formula is an early warning tool to identify potential weakly capitalized companies for purposes of initiating further regulatory action. Independent rating agencies utilize proprietary versions similar to the NAIC RBC model incorporating additional risk factors identified in their respective rating methodology. At December 31, 2021, National Western and Ozark National each maintained statutory capital substantially in excess of applicable statutory requirements.
It is Company practice to not enter into off-balance sheet arrangements or to issue guarantees to third parties, other than in the normal course of issuing insurance contracts. Commitments related to insurance products sold are reflected as liabilities for future policy benefits. Insurance contracts guarantee certain performances by National Western and Ozark National.
Insurance reserves are the means by which life insurance companies determine the liabilities that must be established to assure that future policy benefits are provided for and can be paid. These reserves are required by law and based upon standard actuarial methodologies to ensure fulfillment of commitments guaranteed to policyholders and their beneficiaries, even though the obligations may not be due for many years. Refer to Note (1) Summary of Significant Accounting Policies in the accompanying Notes to Consolidated Financial Statements in this report for a discussion of reserving methods.
The table below summarizes future estimated cash payments under existing contractual obligations.
| | | | | | | | | | | | | | | | | | | | | | | | | | | | | |
| | Payment Due by Period |
| | Total | | Less Than 1 Year | | 1 - 3 Years | | 3 - 5 Years | | More Than 5 Years |
| | (In thousands) |
| | | | | | | | | |
| Loan commitments | $ | 18,500 | | | 18,500 | | | — | | | — | | | — | |
| Commitments for capital calls to investment funds | 256,392 | | | 85,882 | | | 126,010 | | | — | | | 44,500 | |
Lease obligations (1) | 1,346 | | | 343 | | | 659 | | | 344 | | | — | |
Claims payable (2) | 77,536 | | | 77,536 | | | — | | | — | | | — | |
Other long-term reserve liabilities reflected on the balance sheet under GAAP (3) | 12,632,010 | | | 1,017,321 | | | 1,924,228 | | | 1,683,675 | | | 8,006,786 | |
| | | | | | | | | |
| Total | $ | 12,985,784 | | | 1,199,582 | | | 2,050,897 | | | 1,684,019 | | | 8,051,286 | |
(1) Refer to Note (17) Commitments and Contingencies in the accompanying Notes to Consolidated Financial Statements in this report relating to Company leases.
(2) Claims payable include benefit and claim liabilities for life, accident and health policies which the Company believes the amount and timing of the payment is essentially fixed and determinable. Such amounts generally relate to incurred and reported death, critical illness, accident and health claims including an estimate of claims incurred but not reported.
(3) Other long-term liabilities include estimated life and annuity obligations related to death claims, policy surrenders, policy withdrawals, maturities and annuity payments based on mortality, lapse, annuitization, and withdrawal assumptions consistent with the Company’s historical experience. These estimated life and annuity obligations are undiscounted projected cash outflows that assume interest crediting and market growth consistent with assumptions used in amortizing deferred acquisition costs. They do not include any offsets for future premiums or deposits. Other long-term liabilities also include determinable payout patterns related to immediate annuities. Due to the significance of the assumptions used, the actual cash outflows will differ both in amount and timing, possibly materially, from these estimates.
ACCOUNTING STANDARDS AND CHANGES IN ACCOUNTING
Changes in Accounting Principles
Effective January 1, 2020, the Company implemented ASU 2016-13, Financial Instruments - Credit Losses. This standard replaced the previous incurred loss recognition model with an expected loss recognition model for certain financial assets. Adoption of the standard resulted in an incremental allowance for credit losses as of January 1, 2020 of $3.8 million, and a charge to retained earnings, net of tax, of $3.0 million as a change in accounting. There were no other changes in accounting principles during the periods reported in this Form 10-K.
Recently Issued Accounting Standards
Refer to Note (1), Summary of Significant Accounting Policies in the accompanying Notes to Consolidated Financial Statements in this report.
Correction of Errors
None.
ITEM 7A. QUANTITATIVE AND QUALITATIVE DISCLOSURES
ABOUT MARKET RISK
The information called for by Item 6A is set forth in the Investments section of the Management's Discussion and Analysis of Financial Condition and Results of Operations.
ITEM 8. FINANCIAL STATEMENTS AND SUPPLEMENTARY DATA
See Attachment A, Index to Consolidated Financial Statements, Notes and Schedules, in Part IV, Item 15. of this report.
ITEM 9. CHANGES IN AND DISAGREEMENTS WITH ACCOUNTANTS
ON ACCOUNTING AND FINANCIAL DISCLOSURE
There have been no disagreements with auditors that are reportable pursuant to Item 304 of Regulation S-K.
ITEM 9A. CONTROLS AND PROCEDURES
Evaluation of Disclosure Controls and Procedures
Disclosure controls and procedures are designed to ensure that information to be disclosed in reports filed or submitted under the Securities Exchange Act of 1934 (the "Exchange Act") is recorded, processed, summarized and reported within required time periods. Disclosure controls and procedures include, without limitation, controls and procedures designed to ensure that information required to be disclosed in reports filed or submitted under the Exchange Act is accumulated and communicated to the Company's management, including the Chief Executive Officer and Chief Financial Officer, as appropriate, to allow timely decisions regarding disclosure matters.
The Company's management, with the participation of the Company's Chief Executive Officer and Chief Financial Officer, has evaluated the effectiveness of the Company's disclosure controls and procedures (as such term is defined in Rules 13a-15(e) and 15d-15(e) under the Securities Exchange Act of 1934) as of the end of the period covered by this report. Based on such evaluation, the Company's Chief Executive Officer and Chief Financial Officer have concluded that, as of the end of such period, the Company’s disclosure controls and procedures are effective in recording, processing, summarizing, and reporting, on a timely basis, information required to be disclosed by the Company in the reports that it files or submits under the Exchange Act.
In 2020, the Company's businesses were included in the financial services sector categorized as a Critical Infrastructure Sector by the Department of Homeland Security at the onset of the COVID-19 pandemic crisis and were mandated to maintain normal work schedules, which the Company did throughout. The Company adopted working remote for a sizable portion of its home office employees, with existing controls over financial reporting maintained and augmented where necessary given the unique circumstances of this environment. In 2021, the Company returned the majority of its staff to its home office facilities with a smaller fraction continuing a partial working remote schedule.
Management's Report on Internal Control Over Financial Reporting
Management of the Company is responsible for establishing and maintaining adequate internal control over financial reporting, as such term is defined in Rules 13a-15(f) under the Securities Exchange Act of 1934. The Company's internal control over financial reporting is a process designed to provide reasonable assurance regarding the reliability of financial reporting and the preparation of the Company's financial statements for external reporting purposes in accordance with U.S. generally accepted accounting principles. Because of its inherent limitations, internal control over financial reporting may or may not prevent and detect misstatements. In addition, projections of any evaluation of effectiveness of internal controls to future periods are subject to risk that controls may become inadequate because of changes in conditions or deterioration in the degree of compliance with policies and procedures.
Under the supervision and participation of the Company's management, including the Chief Executive Officer and Chief Financial Officer, an assessment of the effectiveness of the Company's internal control over financial reporting as of December 31, 2021 was conducted based on the criteria set forth by the Committee of Sponsoring Organizations of the Treadway Commission (“COSO”) in Internal Control - Integrated Framework (Updated 2013). Management's assessment included evaluation of such elements as the design and operating effectiveness as the design and operating effectiveness of key financial reporting controls, process documentation, accounting policies, and the overall control environment. Based on the Company's assessment under the criteria of this framework, management concluded that the Company maintained effective internal control over financial reporting as of December 31, 2021.
The Company's independent registered public accounting firm, BKD LLP, who audited the Company’s consolidated financial statements included in this annual report on Form 10-K, has issued an attestation report on the effectiveness of management's internal control over financial reporting as of December 31, 2021. This report appears on the page that follows.
Changes in Internal Control Over Financial Reporting
Internal controls over financial reporting change as the Company modifies and enhances its systems and processes to meet changing needs. Changes are also made as the Company strives to be more efficient in how it conducts its business. Any significant changes in controls are evaluated prior to implementation to help ensure continued effectiveness of internal controls and the control environment. As noted above, the COVID-19 pandemic crisis prompted the Company to adopt a remote work environment in 2020 for a significant portion of its home office staff in order to comply with the Department of Homeland Security's directive to remain operational throughout the pandemic. This continued into 2021 as the Company returned a majority of its home office staff to its facilities. While existing internal controls were augmented and adapted to facilitate a working remote environment, these efforts did not constitute changes in internal control over financial reporting.
There were no other changes in the Company's internal controls over financial reporting during the year ended December 31, 2021, as defined in Rules 13a-15(f) and 15d-15(e) under the Exchange Act, that have materially affected, or are reasonably likely to materially affect, the Company’s internal controls over financial reporting. There have been no other significant changes in the Company’s internal controls or in other factors that could significantly affect these controls subsequent to the date of this examination.
Report of Independent Registered Public Accounting Firm
Audit Committee, Board of Directors and Stockholders
National Western Life Group, Inc.
Austin, Texas
Opinion on the Internal Control over Financial Reporting
We have audited National Western Life Group, Inc.’s (the “Company”) internal control over financial reporting as of December 31, 2021, based on criteria established in Internal Control – Integrated Framework (2013 edition) issued by the Committee of Sponsoring Organizations of the Treadway Commission (COSO). In our opinion, the Company maintained, in all material respects, effective internal control over financial reporting as of December 31, 2021, based on criteria established in Internal Control – Integrated Framework (2013) issued by COSO.
We also have audited, in accordance with the standards of the Public Company Accounting Oversight Board (United States) (“PCAOB”), the consolidated financial statements of the Company and our report dated March 10, 2022, expressed an unqualified opinion thereon.
Basis for Opinion
The Company’s management is responsible for maintaining effective internal control over financial reporting and for its assessment of the effectiveness of internal control over financial reporting, included in the accompanying Management’s Report on Internal Control over Financial Reporting. Our responsibility is to express an opinion on the Company’s internal control over financial reporting based on our audit. We are a public accounting firm registered with the PCAOB and are required to be independent with respect to the Company in accordance with the U.S. federal securities laws and the applicable rules and regulations of the Securities and Exchange Commission and the PCAOB.
We conducted our audit in accordance with the standards of the PCAOB. Those standards require that we plan and perform the audit to obtain reasonable assurance about whether effective internal control over financial reporting was maintained in all material respects.
Our audit included obtaining an understanding of internal control over financial reporting, assessing the risk that a material weakness exists and testing and evaluating the design and operating effectiveness of internal control based on the assessed risk. Our audit also included performing such other procedures as we considered necessary in the circumstances. We believe that our audit provides a reasonable basis for our opinion.
Definitions and Limitations of Internal Control over Financial Reporting
A company’s internal control over financial reporting is a process designed to provide reasonable assurance regarding the reliability of financial reporting and the preparation of financial statements for external purposes in accordance with generally accepted accounting principles. A company’s internal control over financial reporting includes those policies and procedures that (1) pertain to the maintenance of records that, in reasonable detail, accurately and fairly reflect the transactions and dispositions of the assets of the company; (2) provide reasonable assurance that transactions are recorded as necessary to permit preparation of financial statements in accordance with generally accepted accounting principles, and that receipts and expenditures of the company are being made only in accordance with authorizations of management and directors of the company; and (3) provide reasonable assurance regarding prevention or timely detection of unauthorized acquisition, use or disposition of the company’s assets that could have a material effect on the financial statements.
Because of its inherent limitations, internal control over financial reporting may not prevent or detect misstatements. Also, projections of any evaluation of effectiveness to future periods are subject to the risk that controls may become inadequate because of changes in conditions or that the degree of compliance with the policies or procedures may deteriorate.
/s/BKD, LLP
West Des Moines, Iowa
March 10, 2022
ITEM 9B. OTHER INFORMATION
There is no information required to be disclosed on Form 8-K for the quarter ended December 31, 2021 which has not been previously reported.
PART III
The information required by Part III is incorporated by reference from our definitive proxy statement for our annual meeting of shareholders to be held June 17, 2022 to be filed with the Commission pursuant to Regulation 14A within 120 days after December 31, 2021.
PART IV
ITEM 15. EXHIBITS AND FINANCIAL STATEMENT SCHEDULES
(a) 1. Listing of Financial Statements
See Attachment A, Index to Consolidated Financial Statements, Notes and Schedules, on page 97 for a list of financial statements included in this report.
(a) 2. Listing of Financial Statement Schedules
See Attachment A, Index to Consolidated Financial Statements, Notes and Schedules, on page 97 for a list of financial statement schedules included in this report.
All other schedules are omitted because they are not applicable, not required, or because the information required by the schedule is included elsewhere in the financial statements or notes.
(a) 3. Listing of Exhibits
The exhibits listed below, as part of Form 10-K, are numbered in accordance with the numbering used in Item 601 of Regulation S-K of The Securities and Exchange Commission.
National Western Life Group, Inc.:
| | | | | | | | |
Exhibit 2.1 | - | Agreement and Plan of Merger, dated April 6, 2015, among National Western Life Insurance Company, a Colorado corporation, National Western Life Group, Inc., a Delaware corporation, and NWLIC MergerCo., Inc. (Incorporated by reference to Annex I of the Registration Statement on Form S-4 (File No. 333-203257) filed by National Western Life Group, Inc. with the SEC on April 6, 2015) (incorporated by reference to Exhibit 2.1 to the Company's Form 8-K dated October 2, 2015). |
| | |
Exhibit 2.2 | - | Stock Purchase Agreement, dated October 3, 2018, among National Western Life Insurance Company, a Colorado corporation, National Western Life Group, Inc., a Delaware corporation, and CNS Corporation filed by National Western Life Group, Inc. with the SEC on October 4, 2018 (incorporated by reference to Exhibit 2.2 to the Company's Form 8-K dated October 4, 2018). |
| | |
Exhibit 10(a) | - | National Western Life Insurance Company 2016 Executive Officer Bonus Program (Exhibit 10(a) to Form 8-K dated December 15, 2015). |
| | |
Exhibit 10(b) | - | National Western Life Insurance Company 2016 Domestic Marketing Officer Bonus Program (Exhibit 10(b) to Form 8-K dated December 15, 2015). |
| | |
Exhibit 10(c) | - | National Western Life Insurance Company 2016 International Marketing Officer Bonus Program (Exhibit 10(c) to Form 8-K dated December 15, 2015). |
| | |
Exhibit 10(d) | - | National Western Life Insurance Company 2016 Officer Bonus Program (Exhibit 10(d) to Form 8-K dated December 15, 2015). |
| | |
Exhibit 10(e) | - | National Western Life Insurance Company Change in Control & Severance Agreement - dated December 21, 2015. |
| | |
Exhibit 10(f) | - | National Western Life Insurance Company 2017 Executive Officer Bonus Program (Exhibit 10(f) to Form 8-K dated December 16, 2016). |
| | |
Exhibit 10(g) | - | National Western Life Insurance Company 2017 Domestic Marketing Officer Bonus Program (Exhibit 10(g) to Form 8-K dated December 16, 2016). |
| | |
Exhibit 10(h) | - | National Western Life Insurance Company 2017 International Marketing Officer Bonus Program (Exhibit 10(h) to Form 8-K dated December 16, 2016). |
| | |
Exhibit 10(i) | - | National Western Life Insurance Company 2017 Officer Bonus Program (Exhibit 10(i) to Form 8-K dated December 16, 2016). |
| | |
Exhibit 10(j) | - | National Western Life Insurance Company 2018 Executive Officer Bonus Program (Exhibit 10(j) to Form 8-K dated December 18, 2017). |
| | |
Exhibit 10(k) | - | National Western Life Insurance Company 2018 Domestic Marketing Officer Bonus Program (Exhibit 10(k) to Form 8-K dated December 18, 2017). |
| | |
Exhibit 10(l) | - | National Western Life Insurance Company 2018 International Marketing Officer Bonus Program (Exhibit 10(l) to Form 8-K dated December 18, 2017). |
| | |
Exhibit 10(m) | - | National Western Life Insurance Company 2018 Officer Bonus Program (Exhibit 10(m) to Form 8-K dated December 18, 2017). |
| | | | | | | | |
| | |
Exhibit 10(n) | - | National Western Life Insurance Company Change in Control & Severance Agreement - dated December 21, 2017. |
| | |
Exhibit 10(o) | - | National Western Life Insurance Company 2019 Officer Bonus Program (Exhibit 10(o) to Form 8-K dated December 14, 2018). |
| | |
Exhibit 10(p) | - | National Western Life Insurance Company Change in Control Agreement - dated February 28, 2019. |
| | |
Exhibit 10(q) | - | National Western Life Insurance Company Change in Control Agreement Kitty K. Nelson (Exhibit 10(q) to Form 8-K dated March 6, 2019). |
| | |
Exhibit 10(r) | - | National Western Life Insurance Company Change in Control Agreement Patricia L. Scheuer (Exhibit 10(r) to Form 8-K dated March 6, 2019). |
| | |
Exhibit 10(s) | - | National Western Life Insurance Company Change in Control Agreement Rey Perez (Exhibit 10(s) to Form 8-K dated March 6, 2019). |
| | |
Exhibit 10(t) | - | National Western Life Insurance Company Change in Control Agreement R. Bruce Wallace (Exhibit 10(t) to Form 8-K dated March 6, 2019). |
| | |
Exhibit 10(u) | - | National Western Life Insurance Company Change in Control Agreement Steve W. Mills (Exhibit 10(u) to Form 8-K dated March 6, 2019). |
| | |
Exhibit 10(v) | - | National Western Life Insurance Company Change in Control Agreement Greg J. Owen (Exhibit 10(v) to Form 8-K dated March 6, 2019). |
| | |
Exhibit 10(w) | - | National Western Life Insurance Company Change in Control Agreement Charles D. Milos (Exhibit 10(w) to Form 8-K dated March 6, 2019). |
| | |
Exhibit 10(x) | - | National Western Life Insurance Company Change in Control Agreement Carlos A. Martinez (Exhibit 10(x) to Form 8-K dated March 6, 2019). |
| | |
Exhibit 10(y) | - | National Western Life Insurance Company 2020 Officer Bonus Program (Exhibit 10(y) to Form 8-K dated December 16, 2019). |
| | |
Exhibit 10(z) | - | National Western Life Insurance Company Change in Control & Severance Agreement Ross R. Moody (Exhibit 10(z) to Form 8-K dated December 16, 2019). |
| | |
Exhibit 10(aa) | - | National Western Life Insurance Company 2021 Officer Bonus Program (Exhibit 10(aa) to Form 8-K dated December 11, 2020). |
| | |
Exhibit 10(ab ) | - | National Western Life Insurance Company 2021 Chief Marketing Officer Bonus Program (Exhibit 10(ab) to Form 8-K dated December 11, 2020). |
| | |
Exhibit 10(ac) | - | Funds Withheld Coinsurance Agreement between National Western Life Insurance Company Funds Withheld Coinsurance Agreement between National Western Life Insurance Company And Prosperity Life Assurance Limited effective as of January 6, 2021 (redacted) (Exhibit 10(ac) to Form 8-K dated December 31, 2020) |
| | |
Exhibit 10(ad) | - | National Western Life Insurance Company 2022 Officer Bonus Program (Exhibit 10(ad) to Form 8-K dated December 16, 2021). |
| | |
| | | | | | | | |
Exhibit 10(ae) | - | National Western Life Insurance Company 2022 Chief Marketing Officer Bonus Program (Exhibit 10(ae) to Form 8-K dated December 16, 2021). |
| | |
Exhibit 10(af) | - | National Western Life Insurance Company Change in Control Agreement Ross R. Moody (Exhibit 10(af) to Form 8-K dated December 16, 2021). |
| | |
| - | Subsidiaries of the Registrant. |
| | |
| - | Consent of Independent Registered Public Accounting Firm. |
| | |
| - | Certification of Chief Executive Officer pursuant to Section 302 of the Sarbanes-Oxley Act of 2002. |
| | |
| - | Certification of Chief Financial Officer pursuant to Section 302 of the Sarbanes-Oxley Act of 2002. |
| | |
| - | Certifications of Chief Executive Officer and Chief Financial Officer pursuant to 18 U.S.C. Section 1350, as adopted pursuant to Section 906 of the Sarbanes-Oxley Act of 2002. |
National Western Life Insurance Company:
| | | | | | | | |
Exhibit 3ii(i) | - | Amended and Restated Bylaws of National Western Life Insurance Company, dated March 16, 2015 (incorporated by reference to Exhibit 3ii(i) to the Company's Form 8-K dated March 16, 2015). |
| | |
Exhibit 3.1 | - | Restated Certificate of Incorporation of National Western Life Group, Inc. (Incorporated by reference to Annex II of the Supplement to the Proxy Statement/Prospectus (File No. 333-203257) filed with the SEC on June 12, 2015) (incorporated by reference to Exhibit 3.1 of the Company's Form 8-K dated October 2, 2015). |
| | |
Exhibit 3.2 | - | Bylaws of National Western Life Group, Inc. (Incorporated by reference to Annex III of the Supplement to the Proxy Statement/Prospectus (File No. 333-203257) filed with the SEC on June 12, 2015) (incorporated by reference to Exhibit 3.1 of the Company's Form 8-K dated October 2, 2015). |
| | |
Exhibit 10(a) | - | National Western Life Insurance Company Non-Qualified Defined Benefit Plan dated July 26, 1991 (incorporated by reference to Exhibit 10(a) to the Company's Form 10-K for the year ended December 31, 1995). |
| | |
Exhibit 10(c) | - | National Western Life Insurance Company Non-Qualified Deferred Compensation Plan, as amended and restated, dated March 27, 1995 (incorporated by reference to Exhibit 10(c) to the Company's Form 10-K for the year ended December 31, 1995). |
| | |
Exhibit 10(d) | - | First Amendment to the National Western Life Insurance Company Non-Qualified Deferred Compensation Plan effective July 1, 1995 (incorporated by reference to Exhibit 10(d) to the Company's Form 10-K for the year ended December 31, 1995). |
| | |
Exhibit 10(e) | - | National Western Life Insurance Company 1995 Stock and Incentive Plan (incorporated by reference to Exhibit 10(e) to the Company's Form 10-K for the year ended December 31, 1995). |
| | |
Exhibit 10(f) | - | First Amendment to the National Western Life Insurance Company Non-Qualified Defined Benefit Plan effective December 17, 1996 (incorporated by reference to Exhibit 10(f) to the Company's Form 10-K for the year ended December 31, 1996). |
| | |
Exhibit 10(g) | - | Second Amendment to the National Western Life Insurance Company Non-Qualified Defined Benefit Plan effective December 17, 1996 (incorporated by reference to Exhibit 10(g) to the Company's Form 10-K for the year ended December 31, 1996). |
| | |
| | | | | | | | |
Exhibit 10(h) | - | Second Amendment to the National Western Life Insurance Company Non-Qualified Deferred Compensation Plan effective December 17, 1996 (incorporated by reference to Exhibit 10(h) to the Company's Form 10-K for the year ended December 31, 1996). |
| | |
Exhibit 10(i) | - | Third Amendment to the National Western Life Insurance Company Non-Qualified Deferred Compensation Plan effective December 17, 1996 (incorporated by reference to Exhibit 10(i) to the Company's Form 10-K for the year ended December 31, 1996). |
| | |
Exhibit 10(j) | - | Fourth Amendment to the National Western Life Insurance Company Non-Qualified Deferred Compensation Plan effective June 20, 1997 (incorporated by reference to Exhibit 10(j) to the Company's Form 10-K for the year ended December 31, 1997). |
| | |
Exhibit 10(k) | - | First Amendment to the National Western Life Insurance Company 1995 Stock and Incentive Plan effective June 19, 1998 (incorporated by reference to Exhibit 10(k) to the Company's Form 10-Q for the quarter ended June 30, 1998). |
| | |
Exhibit 10(m) | - | Fifth Amendment to the National Western Life Insurance Company Non-Qualified Deferred Compensation Plan effective July 1, 1998 (incorporated by reference to Exhibit 10(m) to the Company's Form 10-Q for the quarter ended September 30, 1998). |
| | |
Exhibit 10(n) | - | Sixth Amendment to the National Western Life Insurance Company Non-Qualified Deferred Compensation Plan effective August 7, 1998 (incorporated by reference to Exhibit 10(n) to the Company's Form 10-K for the year ended December 31, 1998). |
| | |
Exhibit 10(o) | - | Third Amendment to the National Western Life Insurance Company Non-Qualified Defined Benefit Plan effective August 7, 1998 (incorporated by reference to Exhibit 10(o) to the Company's Form 10-K for the year ended December 31, 1998). |
| | |
Exhibit 10(p) | - | Exchange Agreement by and among National Western Life Insurance Company, NWL Services, Inc., Alternative Benefit Management, Inc., and American National Insurance Company effective November 23, 1998 (incorporated by reference to Exhibit 10(p) to the Company's Form 10-K for the year ended December 31, 1998). |
| | |
Exhibit 10(s) | - | Seventh Amendment to the National Western Life Insurance Company Non-Qualified Deferred Compensation Plan effective August 7, 1998 (incorporated by reference to Exhibit 10(s) to the Company's Form 10-K for the year ended December 31, 2000). |
| | |
Exhibit 10(u) | - | Eighth Amendment to the National Western Life Insurance Company Non-Qualified Deferred Compensation Plan effective December 1, 2000 (incorporated by reference to Exhibit 10(u) to the Company's Form 10-K for the year ended December 31, 2000). |
| | |
Exhibit 10(v) | - | Fourth Amendment to the National Western Life Insurance Company Non-Qualified Defined Benefit Plan effective December 1, 2000 (incorporated by reference to Exhibit 10(v) to the Company's Form 10-K for the year ended December 31, 2000). |
| | |
Exhibit 10(w) | - | Second Amendment to the National Western Life Insurance Company 1995 Stock and Incentive Plan (incorporated by reference to Exhibit 10(w) to the Company's Form 10-Q for the quarter ended September 30, 2001). |
| | |
Exhibit 10(z) | - | Fifth Amendment to the National Western Life Insurance Company Non-Qualified Defined Benefit Plan effective January 1, 2001 (incorporated by reference to Exhibit 10(z) to the Company's Form 10-K for the year ended December 31, 2001). |
| | |
Exhibit 10(ae) | - | Sixth Amendment to the National Western Life Insurance Company Non-Qualified Defined Benefit Plan effective August 23, 2002 (incorporated by reference to Exhibit 10(ae) to the Company's Form 10-Q for the quarter ended September 30, 2002). |
| | | | | | | | |
| | |
Exhibit 10(af) | - | Seventh Amendment to the National Western Life Insurance Company Non-Qualified Defined Benefit Plan effective October 18, 2002 (incorporated by reference to Exhibit 10(af) to the Company's Form 10-Q for the quarter ended September 30, 2002). |
| | |
Exhibit 10(ai) | - | Eighth Amendment to the National Western Life Insurance Company Non-Qualified Defined Benefit Plan effective January 1, 2003 (incorporated by reference to Exhibit 10(ai) to the Company's Form 10-K for the year ended December 31, 2002). |
| | |
Exhibit 10(am) | - | Ninth amendment to the National Western Life Insurance Company Non-Qualified Deferred Compensation Plan effective November 1, 2003 (incorporated by reference to Exhibit 10(am) to the Company's Form 10-K for the year ended December 31, 2003). |
| | |
Exhibit 10(an) | - | Ninth amendment to the National Western Life Insurance Company Non-Qualified Defined Benefit Plan effective December 5, 2003 (incorporated by reference to Exhibit 10(an) to the Company's Form 10-K for the year ended December 31, 2003.) |
| | |
Exhibit 10(ar) | - | Third Amendment to the National Western Life Insurance Company 1995 Stock and Incentive Plan (incorporated by reference to Exhibit 10(ar) to the Company's Form 10-Q for the quarter ended September 30, 2004). |
| | |
Exhibit 10(as) | - | Amendment to the National Western Life Insurance Company Group Excess Benefit Plan effective December 15, 2004 (incorporated by reference to Exhibit 10(as) to the Company's Form 10-K for the year ended December 31, 2004). |
| | |
Exhibit 10(at) | - | The National Western Life Insurance Company Employee Health Plan was amended and restated effective August 20, 2004 (incorporated by reference to Exhibit 10(at) to the Company's Form 10-K for the year ended December 31, 2004). |
| | |
Exhibit 10(au) | - | Tenth Amendment to the National Western Life Insurance Company Non-Qualified Defined Benefit Plan effective December 31, 2004 (incorporated by reference to Exhibit 10(au) to the Company's Form 10-K for the year ended December 31, 2004). |
| | |
Exhibit 10(az) | - | National Western Life Insurance Company Non-Qualified Defined Benefit Plan for Robert L. Moody (Exhibit 10(az) to Form 8-K dated July 1, 2005). |
| | |
Exhibit 10(ba) | - | First Amendment to the National Western Life Insurance Company Non-Qualified Defined Benefit Plan for Robert L. Moody (Exhibit 10(ba) to Form 8-K dated August 22, 2005). |
| | |
Exhibit 10(bb) | - | Second Amendment to the National Western Life Insurance Company Non-Qualified Defined Benefit Plan for Robert L. Moody (Exhibit 10(bb) to Form 8-K dated December 15, 2005). |
| | |
Exhibit 10(bc) | - | Tenth Amendment to the National Western Life Insurance Company Non-Qualified Deferred Compensation Plan (Exhibit 10(bc) to Form 8-K dated December 15, 2005). |
| | |
Exhibit 10(bd) | - | National Western Life Insurance Company Retirement Bonus Program for Robert L. Moody (Exhibit 10(bd) to Form 8-K dated December 15, 2005). |
| | |
Exhibit 10(be) | - | Eleventh Amendment to the National Western Life Insurance Company Non-Qualified Defined Benefit Plan (Exhibit 10(be) to Form 8-K dated December 15, 2005). |
| | |
Exhibit 10(bf) | - | Non-Qualified Defined Benefit Plan for the President of National Western Life Insurance Company (Exhibit 10(bf) to Form 8-K dated December 15, 2005). |
| | |
Exhibit 10(bl) | - | Amendment No. 16 to Loan Agreement (Exhibit 10(bl) to Form 8-K dated July 31, 2006). |
| | | | | | | | |
| | |
Exhibit 10(bu) | - | National Western Life Insurance Company 2008 Incentive Plan (Exhibit 10(bu) to S-8 dated September 2, 2008). |
| | |
Exhibit 10(ca) | - | National Western Life Insurance Company Non-Qualified Defined Benefit Plan for Robert L. Moody As Amended and Restated Effective as of January 1, 2009 (incorporated by reference to Exhibit 10(ca) to the Company's Form 10-K for the year ended December 31, 2008). |
| | |
Exhibit 10(cb) | - | Non-Qualified Defined Benefit Plan for the President of National Western Life Insurance Company As Amended and Restated Effective as of January 1, 2009 (incorporated by reference to Exhibit 10(cb) to the Company's Form 10-K for the year ended December 31, 2008). |
| | |
Exhibit 10(cc) | - | National Western Life Insurance Company Grandfathered Non-Qualified Defined Benefit Plan As Amended and Restated Effective as of December 31, 2004 (incorporated by reference to Exhibit 10(cc) to the Company's Form 10-K for the year ended December 31, 2008). |
| | |
Exhibit 10(cd) | - | National Western Life Insurance Company Non-Qualified Defined Benefit Plan As Amended and Restated Effective as of January 1, 2009 (incorporated by reference to Exhibit 10(cd) to the Company's Form 10-K for the year ended December 31, 2008). |
| | |
Exhibit 10(ce) | - | National Western Life Insurance Company Grandfathered Non-Qualified Deferred Compensation Plan As Amended and Restated Effective as of December 31, 2004 (incorporated by reference to Exhibit 10(ce) to the Company's Form 10-K for the year ended December 31, 2008). |
| | |
Exhibit 10(cf) | - | National Western Life Insurance Company Non-Qualified Deferred Compensation Plan As Amended and Restated Effective as of January 1, 2009 (incorporated by reference to Exhibit 10(cf) to the Company's Form 10-K for the year ended December 31, 2008). |
| | |
Exhibit 10(cg) | - | First Amendment to The National Western Life Insurance Company Pension Plan As Amended and Restated Effective as of January 1, 2007 (incorporated by reference to Exhibit 10(cg) to the Company's Form 10-K for the year ended December 31, 2008). |
| | |
Exhibit 10(ch) | - | Amended National Western Life Insurance Company Group Excess Benefit Plan, effective May 1, 2009 (incorporated by reference to Exhibit 10(ch) to the Company's Form 10-Q for the quarter ended March 31, 2009). |
| | |
Exhibit 10(ci) | - | Revolving Credit Loan Agreement with Moody National Bank (Exhibit 10(ci) to Form 8-K dated August 31, 2009). |
| | |
Exhibit 10(co) | - | Amended National Western Life Insurance Company Pension Plan, effective January 1, 2008. (incorporated by reference to Exhibit 10(co) to the Company's Form 10-Q for the quarter ended March 31, 2010). |
| | |
Exhibit 10(cp) | - | Management/Consultant Agreement dated March 29, 2000 by and between Regent Care Operations, Limited Partnership and Regent Management Services, Limited Partnership. (incorporated by reference to Exhibit 10(cp) to the Company's Form 10-K /A for the year ended December 31, 2010). |
| | |
Exhibit 10(cq) | - | Management Agreement dated October 1, 2008 by and between Regent Care San Marcos B-3, Limited Partnership and Regent Management Services, Limited Partnership. (incorporated by reference to Exhibit 10(cq) to the Company's Form 10-K /A for the year ended December 31, 2010). |
| | |
Exhibit 10(cr) | - | Administrative Services Only Agreement dated January 1, 2001 by and between National Western Life Insurance Company and American National Insurance Company (ANICO) pertaining to ANICO Excess Benefit Plan. (incorporated by reference to Exhibit 10(cr) to the Company's Form 10-K /A for the year ended December 31, 2010). |
| | |
| | | | | | | | |
Exhibit 10(cs) | - | Premium Payment Agreement dated January 1, 2001 by and between National Western Life Insurance Company and American National Insurance Company (ANICO) pertaining to ANICO Excess Benefit Plan. (incorporated by reference to Exhibit 10(cs) to the Company's Form 10-K /A for the year ended December 31, 2010). |
| | |
Exhibit 10(ct) | - | Administrative Services Only Agreement dated January 1, 2001 by and between National Western Life Insurance Company and American National Insurance Company (ANICO) pertaining to ANICO Excess Benefit Plan. (incorporated by reference to Exhibit 10(ct) to the Company's Form 10-K /A for the year ended December 31, 2010). |
| | |
Exhibit 10(cu) | - | Premium Payment Agreement dated January 1, 2001 by and between National Western Life Insurance Company and American National Insurance Company (ANICO) pertaining to ANICO Excess Benefit Plan. (incorporated by reference to Exhibit 10(cu) to the Company's Form 10-K /A for the year ended December 31, 2010). |
| | |
Exhibit 10(dh) | - | National Western Life Insurance Company 2014 Executive Officer Bonus Program (Exhibit 10(dh) to Form 8-K dated December 11, 2013). |
| | |
Exhibit 10(di) | - | National Western Life Insurance Company 2014 Domestic Marketing Officer Bonus Program (Exhibit 10(di) to Form 8-K dated December 11, 2013). |
| | |
Exhibit 10(dj) | - | National Western Life Insurance Company 2014 International Marketing Officer Bonus Program (Exhibit 10(dj) to Form 8-K dated December 11, 2013). |
| | |
Exhibit 10(dk) | - | National Western Life Insurance Company 2014 Officer Bonus Program (Exhibit 10(dk) to Form 8-K dated December 11, 2013). |
| | |
Exhibit 10(dl) | - | National Western Life Insurance Company 2015 Executive Officer Bonus Program (Exhibit 10(dl) to Form 8-K dated December 10, 2014). |
| | |
Exhibit 10(dm) | - | National Western Life Insurance Company 2015 Domestic Marketing Officer Bonus Program (Exhibit 10(dm) to Form 8-K dated December 10, 2014). |
| | |
Exhibit 10(dn) | - | National Western Life Insurance Company 2015 International Marketing Officer Bonus Program (Exhibit 10(dn) to Form 8-K dated December 10, 2014). |
| | |
Exhibit 10(do) | - | National Western Life Insurance Company 2015 Officer Bonus Program (Exhibit 10(do) to Form 8-K dated December 10, 2014). |
(b) Exhibits
Exhibits required by Regulation S-K are listed as to location in the Listing of Exhibits in Item 15.(a)3 above. Exhibits not referred to have been omitted as inapplicable or not required.
(c) Financial Statement Schedules
The financial statement schedules required by Regulation S-K are listed as to location in Attachment A, Index to Consolidated Financial Statements, Notes and Schedules, on page 97 of this report.
ATTACHMENT A
Index to Consolidated Financial Statements, Notes and Schedules
| | | | | |
| Page |
| |
| |
| |
| |
| |
| |
| |
| |
| |
| |
| |
| |
| |
| |
| |
| |
| |
| |
| |
Schedule IV - Reinsurance | |
| |
| |
All other schedules are omitted because they are not applicable, not required, or because the information required by the schedule is included elsewhere in the Consolidated Financial Statements or notes.
REPORT OF INDEPENDENT REGISTERED PUBLIC ACCOUNTING FIRM
Audit Committee, Board of Directors and Stockholders
National Western Life Group, Inc.
Austin, Texas
Opinion on the Financial Statements
We have audited the accompanying consolidated balance sheets of National Western Life Group, Inc. (the “Company”) as of December 31, 2021 and 2020, the related consolidated statements of earnings, comprehensive income, changes in stockholders’ equity and cash flows for each of the years in the three- year period ended December 31, 2021, and the related notes and schedules I (summary of investments other than investments in related parties), II (condensed financial information of registrant), IV (reinsurance information), and V (valuation and qualifying accounts) (collectively referred to as the “financial statements”). In our opinion, the consolidated financial statements referred to above present fairly, in all material respects, the financial position of the Company as of December 31, 2021 and 2020, and the results of its operations and its cash flows for each of the years in the three-year period ended December 31, 2021, in conformity with accounting principles generally accepted in the United States of America.
We also have audited, in accordance with the standards of the Public Company Accounting Oversight Board (United States) (“PCAOB”), the Company’s internal control over financial reporting as of December 31, 2021, based on criteria established in Internal Control – Integrated Framework (2013 edition) issued by the Committee of Sponsoring Organizations of the Treadway Commission (COSO) and our report dated March 10, 2022, expressed an unqualified opinion on the effectiveness of the Company’s internal control over financial reporting.
Basis for Opinion
These financial statements are the responsibility of the Company’s management. Our responsibility is to express an opinion on the Company’s financial statements based on our audits. We are a public accounting firm registered with the PCAOB and are required to be independent with respect to the Company in accordance with the U.S. federal securities laws and the applicable rules and regulations of the Securities and Exchange Commission and the PCAOB.
We conducted our audits in accordance with the standards of the PCAOB. Those standards require that we plan and perform the audits to obtain reasonable assurance about whether the financial statements are free of material misstatement, whether due to error or fraud. Our audits included performing procedures to assess the risks of material misstatement of the financial statements, whether due to error or fraud, and performing procedures that respond to those risks. Such procedures include examining, on a test basis, evidence regarding the amounts and disclosures in the financial statements.
Our audits also included evaluating the accounting principles used and significant estimates made by management, as well as evaluating the overall presentation of the financial statements. We believe that our audits provide a reasonable basis for our opinion.
Critical Audit Matters
The critical audit matters communicated below are matters arising from the current-period audit of the financial statements that were communicated or required to be communicated to the audit committee and that: (1) relate to accounts or disclosures that are material to the financial statements and (2) involved our especially challenging, subjective or complex judgments. The communication of critical audit matters does not alter in any way our opinion on the financial statements, taken as a whole, and we are not, by communicating the critical audit matters below, providing separate opinions on the critical audit matters or on the accounts or disclosures to which they relate.
Future Policy Benefits
Critical Audit Matter Description
Future policy benefits consist of universal life and annuity contracts of approximately $9.0 billion and traditional life reserves of approximately $910 million at December 31, 2021. As described in Note 1, the liability for future policy benefits on traditional products is calculated using assumptions as to future mortality, interest rates and withdrawals based on the Company’s experience. The liability for future policy benefits for universal life and annuity contracts represents the contract balance. Fixed-index products combine features associated with traditional fixed annuities and universal life contracts, with the option to have interest rates linked in part to an equity index. The equity return component of such policy contracts is identified separately and accounted for at fair value as an embedded derivative. The remaining portion of these policy contracts are recorded separately as fixed annuity or universal life contracts. These contracts are recorded as discounted debt instruments that are accreted to their minimum account values at their projected maturities or termination dates using the effective yield method.
Auditing estimates for future policy benefits required a high degree of judgment, including the need to involve an actuarial specialist, due to the nature of the data utilized in the complex actuarial models and the high degree of judgment applied by management in determining these liabilities.
How the Critical Audit Matter was Addressed in the Audit
Our audit procedures related to the future policy benefits liabilities included the following procedures, among others:
a.Obtained an understanding, evaluated the design and tested the operating effectiveness of controls, including technology controls, over the Company’s inputs and processes utilized in the calculation of future policy benefits, and the design and operating effectiveness of controls over the completeness and accuracy of the underlying source data.
b.Tested the completeness and accuracy of the underlying policy data used in the actuarial analysis.
c.Engaged an actuarial specialist to evaluate the appropriateness of actuarial methods and assumptions used in developing the estimates related to these liabilities.
Amortization of Deferred Policy Acquisition Costs, Deferred Sales Inducements and Value of Business Acquired
Critical Audit Matter Description
As described in Note 1, deferred policy acquisition costs include certain costs of successfully acquiring new insurance business, including commissions and other expenses directly related to the acquisition of new business, to the extent the costs are recoverable from future policy revenues and gross profits. Premium bonuses and bonus interest credited to contracts during the first contract year are also deferred to the extent the costs are recoverable. For interest sensitive universal life and annuity products, these costs are amortized in relation to the present value of expected gross margins or gross profits on these policies. For nonparticipating traditional life products, these costs are amortized over the premium paying period of the related policies in proportion to the ratio of annual premium revenues to total anticipated premium revenues. The Company evaluates the recoverability of deferred policy acquisition costs and sales inducement costs by considering expected mortality, interest earned, credit rates, persistency and expenses and estimated future gross profits or future premiums. Amortization is reviewed each year and adjusted retrospectively through an unlocking process when estimates of current or future gross profits/margins (including the impact of investment gains and losses) to be realized from a group of products are revised.
The value of business acquired (VOBA) is an intangible asset based upon the difference between the fair value of policyholder liabilities acquired in a business combination and the same policyholder liability measured in accordance with the Company’s accounting policies. It represents the portion of the purchase price allocated to the value of the rights to receive future cash flows from business in force at the acquisition date. VOBA is subject to recoverability testing, and is amortized following a methodology similar to that used for deferred policy acquisition costs.
Auditing the amortization of deferred policy acquisition costs, deferred sales inducements and VOBA was especially challenging due to the complexity and high degree of judgment applied by management, including the need to involve an actuarial specialist, in determining estimated future gross profits. The estimate of future gross profits includes assumptions regarding premium payment and expense patterns, mortality, persistency and investment performance.
How the Critical Audit Matter was Addressed in the Audit
Our audit procedures related to the amortization of deferred policy acquisition costs, deferred sales inducements and VOBA included the following procedures, among others:
a.Obtained an understanding, evaluated the design and tested the operating effectiveness of controls, including technology controls, over the Company’s inputs and processes utilized in estimating future gross profits and resulting amortization and the design and operating effectiveness of controls over the completeness and accuracy of the underlying source data
b.Tested the completeness and accuracy of the underlying data used in the actuarial analysis.
c.Engaged an actuarial specialist to evaluate the appropriateness of actuarial methods and assumptions utilized in the estimated gross profits used for amortization.
/s/BKD, LLP
Firm ID 686
We have served as the Company’s auditor since 2014.
West Des Moines, Iowa
March 10, 2022
NATIONAL WESTERN LIFE GROUP, INC.
CONSOLIDATED BALANCE SHEETS
December 31, 2021 and 2020
(In thousands)
| | | | | | | | | | | |
| ASSETS | 2021 | | 2020 |
| | | |
| Investments: | | | |
| | | |
| Debt securities available-for-sale, at fair value (cost: $8,604,250 and $9,874,543) | $ | 9,068,946 | | | 10,770,923 | |
| Debt securities trading, at fair value (cost: $1,066,108 and $0) | 1,077,438 | | | — | |
| Mortgage loans, net of allowance for credit losses ($2,987 and $2,486), ($8,469 and $0 at fair value) | 487,304 | | | 332,521 | |
| Policy loans | 71,286 | | | 74,083 | |
| Derivatives, index options | 101,622 | | | 132,821 | |
| Equity securities, at fair value (cost: $16,549 and $12,069) | 28,217 | | | 17,744 | |
| Other long-term investments | 137,670 | | | 104,113 | |
| | | |
| Total investments | 10,972,483 | | | 11,432,205 | |
| | | |
| Cash and cash equivalents | 714,624 | | | 581,059 | |
| Deferred policy acquisition costs | 569,839 | | | 382,080 | |
| Deferred sales inducements | 78,136 | | | 43,845 | |
| Value of business acquired | 154,499 | | | 162,968 | |
| Cost of reinsurance | 89,686 | | | 102,840 | |
| Accrued investment income | 84,394 | | | 88,323 | |
| Federal income tax receivable | — | | | 10,408 | |
| Amounts recoverable from reinsurer | 1,539,919 | | | 1,709,232 | |
| Other assets | 126,609 | | | 135,310 | |
| | | |
| Total assets | $ | 14,330,189 | | | 14,648,270 | |
See accompanying notes to Consolidated Financial Statements.
NATIONAL WESTERN LIFE GROUP, INC.
CONSOLIDATED BALANCE SHEETS
December 31, 2021 and 2020
(In thousands)
| | | | | | | | | | | |
| LIABILITIES AND STOCKHOLDERS' EQUITY | 2021 | | 2020 |
| | | |
| LIABILITIES: | | | |
| Future policy benefits: | | | |
| Universal life and annuity contracts | $ | 9,003,275 | | | 9,035,316 | |
| Traditional life reserves | 909,712 | | | 898,103 | |
| Other policyholder liabilities | 134,338 | | | 138,480 | |
| Funds withheld liability | 1,485,267 | | | 1,697,591 | |
| Deferred Federal income tax liability | 101,166 | | | 145,126 | |
| Federal income tax payable | 2,331 | | | — | |
| Other liabilities | 154,409 | | | 193,904 | |
| | | |
| Total liabilities | 11,790,498 | | | 12,108,520 | |
| | | |
| | | |
| COMMITMENTS AND CONTINGENCIES (Notes 5, 14, and 17) | 0 | | 0 |
| | | |
| STOCKHOLDERS' EQUITY (Note 12): | | | |
| Common stock: | | | |
| Class A - $0.01 par value; 7,500,000 shares authorized; 3,436,020 issued and outstanding in 2021 and 2020 | 34 | | | 34 | |
| Class B - $0.01 par value; 200,000 shares authorized, issued, and outstanding in 2021 and 2020 | 2 | | | 2 | |
| Additional paid-in capital | 41,716 | | | 41,716 | |
| Accumulated other comprehensive income | 215,953 | | | 395,421 | |
| Retained earnings | 2,281,986 | | | 2,102,577 | |
| | | |
| Total stockholders' equity | 2,539,691 | | | 2,539,750 | |
| | | |
| Total liabilities and stockholders' equity | $ | 14,330,189 | | | 14,648,270 | |
See accompanying notes to Consolidated Financial Statements.
NATIONAL WESTERN LIFE GROUP, INC.
CONSOLIDATED STATEMENTS OF EARNINGS
For the Years Ended December 31, 2021, 2020 and 2019
(In thousands except per share amounts)
| | | | | | | | | | | | | | | | | |
| | 2021 | | 2020 | | 2019 |
| | | | | |
| Premiums and other revenues: | | | | | |
| Universal life and annuity contract charges | $ | 134,254 | | | 145,405 | | | 149,721 | |
| Traditional life premiums | 90,043 | | | 92,542 | | | 90,248 | |
| Net investment income | 562,530 | | | 417,202 | | | 555,492 | |
| Other revenues | 22,314 | | | 18,522 | | | 17,486 | |
| Net realized investment gains: | | | | | |
| Total other-than-temporary impairment (“OTTI”) gains (losses) | — | | | 5 | | | (7,838) | |
| Portion of OTTI (gains) losses recognized in other comprehensive income | — | | | (5) | | | (9) | |
| Net OTTI losses recognized in earnings | — | | | — | | | (7,847) | |
| Other net investment gains | 14,950 | | | 21,071 | | | 14,088 | |
| Total net realized investment gains | 14,950 | | | 21,071 | | | 6,241 | |
| | | | | |
| Total revenues | 824,091 | | | 694,742 | | | 819,188 | |
| | | | | |
| Benefits and expenses: | | | | | |
| Life and other policy benefits | 187,577 | | | 131,337 | | | 137,342 | |
| Amortization of deferred transaction costs | 69,461 | | | 140,503 | | | 116,802 | |
| Universal life and annuity contract interest | 213,184 | | | 206,250 | | | 295,330 | |
| Other operating expenses | 126,612 | | | 104,584 | | | 104,558 | |
| | | | | |
| Total benefits and expenses | 596,834 | | | 582,674 | | | 654,032 | |
| | | | | |
| Earnings before Federal income taxes | 227,257 | | | 112,068 | | | 165,156 | |
| | | | | |
| Federal income taxes | 46,576 | | | 19,756 | | | 33,540 | |
| | | | | |
| Net earnings | $ | 180,681 | | | 92,312 | | | 131,616 | |
| | | | | |
| Basic Earnings Per Share: | | | | | |
| Class A | $ | 51.10 | | | 26.11 | | | 37.22 | |
| Class B | $ | 25.55 | | | 13.05 | | | 18.61 | |
| | | | | |
| Diluted Earnings Per Share: | | | | | |
| Class A | $ | 51.10 | | | 26.11 | | | 37.22 | |
| Class B | $ | 25.55 | | | 13.05 | | | 18.61 | |
See accompanying notes to Consolidated Financial Statements.
NATIONAL WESTERN LIFE GROUP, INC.
CONSOLIDATED STATEMENTS OF COMPREHENSIVE INCOME
For the Years Ended December 31, 2021, 2020 and 2019
(In thousands)
| | | | | | | | | | | | | | | | | |
| | 2021 | | 2020 | | 2019 |
| | | | | |
| Net earnings | $ | 180,681 | | | 92,312 | | | 131,616 | |
| | | | | |
| Other comprehensive income (loss), net of effects of deferred costs and taxes: | | | | | |
| Unrealized gains (losses) on securities: | | | | | |
| Net unrealized holding gains (losses) arising during period | (179,587) | | | 352,561 | | | 96,954 | |
| Net unrealized liquidity gains (losses) | — | | | 6 | | | 3 | |
| Reclassification adjustment for net amounts included in net earnings | (12,934) | | | (4,485) | | | 3,997 | |
| | | | | |
| | | | | |
| Net unrealized gains (losses) on securities | (192,521) | | | 348,082 | | | 100,954 | |
| | | | | |
| Foreign currency translation adjustments | (16) | | | 15 | | | 524 | |
| | | | | |
| Benefit plans: | | | | | |
| Amortization of net prior service cost and net gain (loss) | 13,069 | | | (12,784) | | | (4,355) | |
| | | | | |
| Other comprehensive income (loss) | (179,468) | | | 335,313 | | | 97,123 | |
| | | | | |
| Comprehensive income | $ | 1,213 | | | 427,625 | | | 228,739 | |
See accompanying notes to Consolidated Financial Statements.
NATIONAL WESTERN LIFE GROUP, INC.
CONSOLIDATED STATEMENTS OF CHANGES IN STOCKHOLDERS' EQUITY
For the Years Ended December 31, 2021, 2020 and 2019
(In thousands)
| | | | | | | | | | | | | | | | | |
| | 2021 | | 2020 | | 2019 |
| | | | | |
| Common stock: | | | | | |
| Balance at beginning of period | $ | 36 | | | 36 | | | 36 | |
| | | | | |
| Balance at end of period | 36 | | | 36 | | | 36 | |
| | | | | |
| Additional paid-in capital: | | | | | |
| Balance at beginning of period | 41,716 | | | 41,716 | | | 41,716 | |
| | | | | |
| Balance at end of period | 41,716 | | | 41,716 | | | 41,716 | |
| | | | | |
| Accumulated other comprehensive income: | | | | | |
| Unrealized gains (losses) on non-impaired securities: | | | | | |
| Balance at beginning of period | 418,741 | | | 70,665 | | | (30,286) | |
| Change in unrealized gains (losses) during period | (192,521) | | | 348,076 | | | 100,951 | |
| | | | | |
| Balance at end of period | 226,220 | | | 418,741 | | | 70,665 | |
| | | | | |
| Unrealized losses on impaired held-to-maturity securities: | | | | | |
| Balance at beginning of period | — | | | (4) | | | (7) | |
| | | | | |
| Amortization | — | | | 4 | | | 7 | |
| | | | | |
| | | | | |
| Change in shadow deferred policy acquisition costs | — | | | (2) | | | (4) | |
| Disposals of previously impaired securities | — | | | 2 | | | — | |
| | | | | |
| | | | | |
| Balance at end of period | — | | | — | | | (4) | |
| | | | | |
| Unrealized losses on impaired available-for-sale securities: | | | | | |
| Balance at beginning of period | — | | | (2) | | | (2) | |
| Other-than-temporary impairments, non-credit, net of tax | — | | | — | | | — | |
| Change in shadow deferred policy acquisition costs | — | | | — | | | — | |
| Cumulative change in accounting principle (see Note 1) | — | | | 2 | | | — | |
| | | | | |
| | | | | |
| | | | | |
| Balance at end of period | — | | | — | | | (2) | |
| | | | | |
| | | (Continued on Next Page) |
| | | | | |
| | | | | |
| | | | | |
NATIONAL WESTERN LIFE GROUP, INC.
CONSOLIDATED STATEMENTS OF CHANGES IN STOCKHOLDERS' EQUITY
For the Years Ended December 31, 2021, 2020 and 2019
(In thousands)
| | | | | | | | | | | | | | | | | |
| | | | | |
| 2021 | | 2020 | | 2019 |
| | | | | |
| Foreign currency translation adjustments: | | | | | |
| Balance at beginning of period | 5,116 | | | 5,101 | | | 4,577 | |
| Change in translation adjustments during period | (16) | | | 15 | | | 524 | |
| | | | | |
| | | | | |
| Balance at end of period | 5,100 | | | 5,116 | | | 5,101 | |
| | | | | |
| Benefit plan liability adjustment: | | | | | |
| Balance at beginning of period | (28,436) | | | (15,652) | | | (11,297) | |
| Amortization of net prior service cost and net gain (loss), net of tax | 13,069 | | | (12,784) | | | (4,355) | |
| | | | | |
| | | | | |
| Balance at end of period | (15,367) | | | (28,436) | | | (15,652) | |
| | | | | |
| Accumulated other comprehensive income at end of period | 215,953 | | | 395,421 | | | 60,108 | |
| | | | | |
| Retained earnings: | | | | | |
Balance at beginning of period (1) | 2,102,577 | | | 2,014,570 | | | 1,884,227 | |
| Reclassification from accumulated other comprehensive income (see Note 1) | — | | | (3,032) | | | — | |
| | | | | |
| Net earnings | 180,681 | | | 92,312 | | | 131,616 | |
| Stockholder dividends | (1,272) | | | (1,273) | | | (1,273) | |
| | | | | |
| Balance at end of period | 2,281,986 | | | 2,102,577 | | | 2,014,570 | |
| | | | | |
| Total stockholders' equity | $ | 2,539,691 | | | 2,539,750 | | | 2,116,430 | |
| | | | | |
(1) The 2019 beginning balance was revised by $11.8 million. See Note (1). |
See accompanying notes to Consolidated Financial Statements.
NATIONAL WESTERN LIFE GROUP, INC.
CONSOLIDATED STATEMENTS OF CASH FLOWS
For the Years Ended December 31, 2021, 2020 and 2019
(In thousands)
| | | | | | | | | | | | | | | | | |
| | 2021 | | 2020 | | 2019 |
| | | | | |
| Cash flows from operating activities: | | | | | |
| Net earnings | $ | 180,681 | | | 92,312 | | | 131,616 | |
| Adjustments to reconcile net earnings to net cash provided by operating activities: | | | | | |
| Universal life and annuity contract interest | 213,184 | | | 206,250 | | | 295,330 | |
| Surrender charges and other policy revenues | (26,315) | | | (26,623) | | | (32,909) | |
| Realized (gains) losses on investments | (14,950) | | | (21,071) | | | (6,241) | |
| Accretion/amortization of discounts and premiums, investments | 1,846 | | | 3,371 | | | 2,264 | |
| Depreciation and amortization | 13,001 | | | 11,903 | | | 11,677 | |
| Increase (decrease) in estimated credit losses on investments | 501 | | | (2,027) | | | — | |
| (Increase) decrease in value of debt securities trading | (11,331) | | | — | | | — | |
| (Increase) decrease in value of equity securities | (6,369) | | | 937 | | | (4,051) | |
| (Increase) decrease in value of derivative options | (120,717) | | | (14,754) | | | (123,207) | |
| (Increase) decrease in deferred policy acquisition and sales inducement costs, and value of business acquired | (25,594) | | | 82,897 | | | 69,176 | |
| (Increase) decrease in accrued investment income | 3,929 | | | 4,975 | | | 9,157 | |
| (Increase) decrease in reinsurance recoverable | 169,313 | | | 728 | | | (7,512) | |
| (Increase) decrease in cost of reinsurance | 13,154 | | | — | | | — | |
| (Increase) decrease in other assets | (6,017) | | | (620) | | | (5,236) | |
| Increase (decrease) in liabilities for future policy benefits | 114,873 | | | 14,138 | | | 13,758 | |
| (Decrease) increase in other policyholder liabilities | (4,142) | | | 10,873 | | | (21,955) | |
| (Decrease) increase in Federal income tax liability | 12,739 | | | (14,156) | | | 21,580 | |
| Increase (decrease) in deferred Federal income tax | 3,746 | | | 20,031 | | | (25,294) | |
| Increase (decrease) in funds withheld liability | (212,324) | | | — | | | — | |
| (Decrease) increase in other liabilities | (22,383) | | | 3,907 | | | 876 | |
| | | | | |
| | | | | |
| Net cash provided by operating activities | 276,825 | | | 373,071 | | | 329,029 | |
| | | | | |
| Cash flows from investing activities: | | | | | |
| Proceeds from sales of: | | | | | |
| | | | | |
| Debt securities available-for-sale | 1,221,308 | | | — | | | 87,298 | |
| Other investments | 38,975 | | | 9,198 | | | 30,082 | |
| Proceeds from maturities, redemptions, and prepayments of: | | | | | |
| Debt securities held-to-maturity | — | | | 960,360 | | | 700,759 | |
| Debt securities available-for-sale | 1,520,734 | | | 334,397 | | | 295,026 | |
| Debt securities trading | 61,313 | | | — | | | — | |
| Other investments | 22,597 | | | 13,715 | | | 6,263 | |
| Derivatives, index options | 197,877 | | | 106,451 | | | 52,768 | |
| | | | | |
| | | | | |
| | | (Continued on Next Page) |
| | | | | |
| | | | | |
NATIONAL WESTERN LIFE GROUP, INC.
CONSOLIDATED STATEMENTS OF CASH FLOWS
For the Years Ended December 31, 2021, 2020 and 2019
(In thousands)
| | | | | | | | | | | | | | | | | |
| | 2021 | | 2020 | | 2019 |
| | | | | |
| | | | | |
| | | | | |
| Purchases of: | | | | | |
| Debt securities held-to-maturity | — | | | (544,092) | | | (257,928) | |
| Debt securities available-for-sale | (1,382,318) | | | (297,998) | | | (187,570) | |
| Debt securities trading | (1,140,965) | | | — | | | — | |
| Equity securities | (15,265) | | | (1,395) | | | (1,342) | |
| Derivatives, index options | (47,383) | | | (62,568) | | | (77,381) | |
| Other investments | (57,153) | | | (52,944) | | | (7,315) | |
| Property, equipment, and other productive assets | (9,977) | | | (12,106) | | | (2,844) | |
| Payment to acquire businesses, net of cash acquired | — | | | — | | | (189,121) | |
| Principal payments on mortgage loans | 28,847 | | | 14,814 | | | 47,755 | |
| Cost of mortgage loans acquired | (183,601) | | | (80,220) | | | (121,420) | |
| (Increase) decrease in policy loans | 2,797 | | | 5,925 | | | 2,844 | |
| Other (increases) decreases to funds withheld | (77,191) | | | — | | | — | |
| | | | | |
| | | | | |
| Net cash provided by investing activities | 180,595 | | | 393,537 | | | 377,874 | |
| | | | | |
| Cash flows from financing activities: | | | | | |
| Dividends on common stock | (1,272) | | | (1,273) | | | (1,273) | |
| Deposits to account balances for universal life and annuity contracts | 610,357 | | | 501,867 | | | 405,236 | |
| Return of account balances on universal life and annuity contracts | (932,531) | | | (939,309) | | | (989,980) | |
| Borrowings under line of credit agreement | — | | | — | | | 75,000 | |
| Principal payments on line of credit borrowings | — | | | — | | | (75,000) | |
| Principal payments under finance lease obligation | (389) | | | (378) | | | — | |
| | | | | |
| | | | | |
| Net cash provided by (used in) financing activities | (323,835) | | | (439,093) | | | (586,017) | |
| | | | | |
| Effect of foreign exchange | (20) | | | 19 | | | 663 | |
| | | | | |
| Net increase (decrease) in cash, cash equivalents, and restricted cash | 133,565 | | | 327,534 | | | 121,549 | |
| Cash, cash equivalents, and restricted cash at beginning of year | 581,059 | | | 253,525 | | | 131,976 | |
| | | | | |
| Cash, cash equivalents, and restricted cash at end of year | $ | 714,624 | | | 581,059 | | | 253,525 | |
NATIONAL WESTERN LIFE GROUP, INC.
CONSOLIDATED STATEMENTS OF CASH FLOWS
For the Years Ended December 31, 2021, 2020 and 2019
(In thousands)
| | | | | | | | | | | | | | | | | |
| | | | | |
| SUPPLEMENTAL DISCLOSURES OF CASH FLOW INFORMATION: | | | | | |
| | | | | |
| Cash paid during the year for: | | | | | |
| Interest | $ | 75 | | | 75 | | | 271 | |
| Income taxes | $ | 30,043 | | | 13,980 | | | 37,153 | |
| | | | | |
| Noncash operating activities: | | | | | |
| Net deferral and amortization of sales inducements | $ | 4,355 | | | (12,464) | | | (17,195) | |
| Establishment of funds withheld liability (see Note 5) | $ | — | | | 1,697,591 | | | — | |
| Deferred cost of reinsurance (see Note 5) | $ | — | | | 102,840 | | | — | |
| | | | | |
| Noncash investing activities: | | | | | |
| Contingent consideration to acquire businesses | $ | — | | | — | | | 3,700 | |
| Exchange of debt securities available-for-sale for equity securities | — | | | — | | | 2,452 | |
| Exchange of debt securities available-for-sale | — | | | — | | | 782 | |
| Exchange of debt securities trading | $ | 4,800 | | | — | | | — | |
| Right of use asset obtained in exchange for finance lease liability | $ | 1,422 | | | — | | | — | |
See accompanying notes to Consolidated Financial Statements.
NATIONAL WESTERN LIFE GROUP, INC.
NOTES TO CONSOLIDATED FINANCIAL STATEMENTS
(1) SUMMARY OF SIGNIFICANT ACCOUNTING POLICIES
Principles of Consolidation
National Western Life Insurance Company ("National Western" or "NWLIC") became a wholly owned subsidiary of National Western Life Group, Inc. ("NWLGI") effective October 1, 2015 under a previously announced holding company reorganization. As a result of the reorganization, NWLGI replaced National Western as the publicly held company.
The accompanying Consolidated Financial Statements include the accounts of NWLGI and its wholly owned subsidiaries: National Western, Regent Care San Marcos Holdings, LLC, NWL Services, Inc., and N.I.S. Financial Services, Inc. ("NIS"). National Western's wholly owned subsidiaries include The Westcap Corporation, NWL Financial, Inc., NWLSM, Inc., Braker P III, LLC, and Ozark National Life Insurance Company ("Ozark National"). The 2019 results of operations for Ozark National and NIS include their respective business activity subsequent to their acquisition effective January 31, 2019 and all references herein to results for 2019 refer to their eleven month activity February 1, 2019 through December 31, 2019. All significant intercorporate transactions and accounts have been eliminated in consolidation.
Basis of Presentation
The accompanying Consolidated Financial Statements have been prepared in conformity with U.S. generally accepted accounting principles ("GAAP") which require management to make estimates and assumptions that affect the reported amounts of assets and liabilities, disclosures of contingent assets and liabilities, and the reported amounts of revenues and expenses during the reporting periods. Actual results could differ from those estimates. Significant estimates in the accompanying Consolidated Financial Statements include (1) liabilities for future policy benefits, (2) valuation of derivative instruments, (3) recoverability and amortization of deferred policy acquisition costs ("DPAC"), deferred sales inducements ("DSI"), the value of business acquired ("VOBA"), and the cost of reinsurance ("COR"), (4) valuation allowances for deferred tax assets, (5) goodwill, (6) allowances for credit losses and, prior to January 1, 2020, other-than-temporary impairment losses on debt securities, (7) commitments and contingencies, and (8) allowance for credit losses for mortgage loans and real estate. During the year ended December 31, 2019, the Company incorporated accounting estimates for business combinations, value of business acquired, and fair value measurement as a result of its acquisition of Ozark National and NIS.
The table below shows the unrealized gains and losses on available-for-sale securities that were reclassified out of accumulated other comprehensive income for the years ended December 31, 2021, 2020 and 2019.
| | | | | | | | | | | | | | | | | | | | |
| Affected Line Item In the Consolidated Statements of Earnings | | Amount Reclassified from Accumulated Other Comprehensive Income |
| | Years Ended December 31, |
| | 2021 | | 2020 | | 2019 |
| | (In thousands) |
| |
| Other net investment gains | | $ | 16,372 | | | 5,677 | | | 2,787 | |
| Net OTTI losses recognized in earnings | | — | | | — | | | (7,847) | |
| Earnings (loss) before Federal income taxes | | 16,372 | | | 5,677 | | | (5,060) | |
| Federal income taxes (benefit) | | 3,438 | | | 1,192 | | | (1,063) | |
| | | | | | |
| Net earnings (loss) | | $ | 12,934 | | | 4,485 | | | (3,997) | |
National Western and Ozark National also file financial statements with insurance regulatory authorities which are prepared on the basis of statutory accounting practices prescribed or permitted by the Colorado Division of Insurance and Missouri Department of Commerce and Insurance, respectively, which are significantly different from Consolidated Financial Statements prepared in accordance with GAAP. These differences are described in detail in Note (9) Statutory Information.
NATIONAL WESTERN LIFE GROUP, INC.
NOTES TO CONSOLIDATED FINANCIAL STATEMENTS
Certain amounts in the prior year Consolidated Financial Statements have been reclassified to conform to the current year financial statement presentation.
Revision of Prior Period Consolidated Financial Statements
During the first quarter of 2020, management identified an understatement of an excess benefit reserve on a specific block of policies that dated back to the first quarter of 2004 with the adoption of the Statement of Position 03-1, Accounting and Reporting by Insurance Enterprises for Certain Nontraditional Long-Duration Contracts and for Separate Accounts (SOP 03-1). Management concluded that this error was not material to previously issued consolidated financial statements and would be corrected through a revision to the comparative consolidated balance sheet presented for the year ended December 31, 2019. The impact of this revision as of December 31, 2019 was an increase to the future policy benefits liability of $15.0 million, a decrease to deferred federal income tax liability of $3.2 million, and a decrease to retained earnings of $11.8 million.
Investments
Fixed Maturities and Equity Securities
Historically, investments in debt securities the Company purchased with the intent to hold to maturity were classified as securities held-to-maturity and were reported at amortized cost (less declines in fair value that were deemed other-than-temporary). Effective December 31, 2020, the Company entered into a funds withheld reinsurance agreement under which certain securities were required to be reclassified from held-to-maturity to available-for-sale given a change in intent with respect to these securities by the reinsurer. Given this occurrence, it was determined that the held-to maturity classification of the other remaining held-to-maturity securities was no longer appropriate. Accordingly, all other debt securities previously classified as held-to-maturity were transferred at their fair value to available-for-sale as of December 31, 2020.
Investments in debt securities classified as securities available-for-sale are reported in the accompanying Consolidated Financial Statements at fair value. Valuation changes resulting from changes in the fair value of the securities are reflected as a component of Stockholders' Equity in Accumulated other comprehensive income. These unrealized gains or losses in stockholders' equity are reported net of taxes and adjustments to deferred policy acquisition costs.
As a result of executing a funds withheld coinsurance agreement at December 31, 2020, the Company implemented accounting policies related to trading debt securities in its financial statements. Trading securities represent debt securities that are included in the fund assets withheld as part of the funds withheld coinsurance agreement to support the policyholder liability obligations ceded to the reinsurer. Trading debt securities are reported in the accompanying Consolidated Financial Statements at their fair values with changes in their values reflected as a component of Net investment income in the Consolidated Statements of Earnings. Since these trading debt securities pertain to investment activities related to coinsurance agreements rather than as an income strategy based on active trading, they are classified as investing activities in the Consolidated Statements of Cash Flows.
Transfers of securities between categories are recorded at fair value at the date of transfer.
Premiums and discounts are amortized or accreted over the life of the related security as an adjustment to yield using the effective interest method. For mortgage-backed and asset-backed securities, the effective interest method is used based on anticipated prepayments and the estimated economic life of the securities. When estimates of prepayments change, the effective yield is recalculated to reflect actual payments to date and anticipated future payments. The net investment in the securities is adjusted to the amount that would have existed had the new effective yield been applied at the time of acquisition (retrospective method). This adjustment is reflected in net investment income. For loan-backed securities not meeting the definition of "highly rated", the prospective method is evaluated and, if materially different from the retrospective method, utilized to account for these securities. The retrospective adjustment method has been used to value all loan-backed and structured securities included in the accompanying Consolidated Financial Statements.
NATIONAL WESTERN LIFE GROUP, INC.
NOTES TO CONSOLIDATED FINANCIAL STATEMENTS
As further disclosed under Accounting Standards and Changes in Accounting in this note, the Company adopted new accounting guidance for credit loss recognition of debt securities in the held-to-maturity category as of January 1, 2020. Under this guidance, the Company employed a cohort cumulative loss rate method in estimating current expected credit losses with respect to its held-to-maturity debt securities. This method applies publicly available industry wide statistics of default incidence by defined segmentations of debt security investments combined with future assumptions regarding economic conditions (i.e. GDP forecasts) both in the near term and the long term. The Company utilized Moody's loss rates by industry type and credit ratings and applied them to each major bond category. These bond categories were further segmented by credit ratings and by maturities of two years and less and more than two years.
The Company determines current expected credit losses for available-for-sale debt securities in accordance with FASB ASC Subtopic 326-30 when fair value is less than amortized cost, interest payments are missed and the security is experiencing credit issues. Provisions to and releases from the allowance for credit losses are recorded in net investment income in the Consolidated Statements of Earnings.
Previous accounting guidance required the Company to review its portfolio for potential other-than-temporary impairments which would require that affected securities be written down to an adjusted cost basis with the amount of the writedown recorded as part of net realized gains and losses in the Consolidated Statements of Earnings. Under this previous guidance, the Company reviewed its investment portfolio for market value changes to identify changes caused by issuer credit deterioration, changes in market interest rates and changes in economic conditions. If this review indicated a decline in fair value that was other-than-temporary, the Company’s carrying amount in the investment was reduced to its estimated fair value as an other-than-temporary impairment ("OTTI"). In accordance with GAAP guidance the estimated credit versus non-credit components of the OTTI were bifurcated. The credit component was recorded in earnings and resulted in the establishment of a new cost basis for the security. The non-credit component was reclassified as unrealized loss in Other comprehensive income. The Company would not recognize impairment of securities due to changing of interest rates or market dislocations unless the Company had the intent to sell the securities prior to recovery or maturity.
The Company considered a number of factors in determining whether the impairment was other-than-temporary. These included, but were not limited to: 1) actions taken by rating agencies, 2) default by the issuer, 3) the significance of the decline in fair value, 4) the intent and ability to hold the investment until recovery, 5) the time period during which the decline had occurred, 6) an economic analysis of the issuer’s industry, and 7) the financial strength, liquidity, and recoverability of the issuer. Management performed a security-by-security review in evaluating the need for any other-than-temporary impairments. Although no set formula was used in this process, the investment performance, collateral position, and continued viability of the issuer were significant measures considered.
Equity securities, common and non-redeemable preferred stocks are reported at fair value with changes in fair value included in net investment income in the Consolidated Statement of Earnings.
Alternative Investments
The Company invests in certain non-fixed income, alternative investments in the form of limited partnerships or similar legal structures (i.e. investment funds). The Company does not have a controlling interest and is not the primary beneficiary for any of its alternative investments; accordingly, these investments are accounted for using the equity method of accounting where the cost is recorded as an investment in the fund. Adjustments to the carrying amount reflect the pro rata ownership percentage of the operating results as indicated by the net asset value in the investment fund financial statements, which can be done on a lag of up to three months when investee information is not received in a timely manner. Alternative investments are reported in other long-term investments in the Consolidated Balance Sheets. The proportionate share of investment fund income is reported as a component of Net investment income in the Consolidated Statements of Earnings.
NATIONAL WESTERN LIFE GROUP, INC.
NOTES TO CONSOLIDATED FINANCIAL STATEMENTS
Derivatives
Fixed-index products combine features associated with traditional fixed annuities and universal life contracts, with the option to have interest rates linked in part to an underlying equity index. The equity return component of such policy contracts is identified separately and accounted for in future policy benefits as embedded derivatives on the Consolidated Balance Sheets. The remaining portions of these policy contracts are considered the host contracts and are recorded separately within future policy benefits as fixed annuity or universal life contracts. The host contracts are accounted for under debt instrument type accounting. The host contracts are recorded as discounted debt instruments that are accreted, using the effective yield method, to their minimum account values at their projected maturities or termination dates.
The Company purchases over-the-counter index options, which are derivative financial instruments, to hedge the equity return component of its index annuity and life products. The amounts which may be credited to policyholders are linked, in part, to the returns of the underlying index. The index options act as hedges to match closely the returns on the underlying index. Cash is exchanged upon purchase of the index options and no principal or interest payments are made by either party during the option periods, typically one year. Upon maturity or expiration of the options, cash is paid to the Company based on the underlying index performance and terms of the contract. As a result, amounts credited to policyholders' account balances are substantially offset by changes in the value of the options.
The Company does not elect hedge accounting relative to derivative instruments.The derivatives are reported at their fair value in the accompanying Consolidated Financial Statements. Changes in the values of the index options and changes in the policyholder liabilities are both reflected in the Consolidated Statement of Earnings. Any gains or losses from the sale or expiration of the options, as well as period-to-period changes in values, are reflected as net investment income in the Consolidated Statement of Earnings. Any changes relative to the embedded derivatives associated with policy contracts are reflected in contract interest in the Consolidated Statement of Earnings.
Although there is credit risk in the event of nonperformance by counterparties to the index options, the Company does not expect any counterparties to fail to meet their obligations, given their high credit ratings. In addition, credit support agreements are in place with all counterparties for option holdings in excess of specific limits, which further reduces the Company's credit exposure. At December 31, 2021 and 2020, the fair value of index options owned by the Company totaled $101.6 million and $132.8 million, respectively. Of these amounts, $54.4 million and $71.0 million represent net unrealized gains on the options held at December 31, 2021 and 2020, respectively.
Additionally, effective December 31, 2020, the Company is a party to a coinsurance funds withheld reinsurance agreement under which identified assets are maintained in a funds withheld account. Under terms of the coinsurance funds withheld agreement, while the assets are withheld, the associated interest and credit risk of these assets are transferred to the reinsurer creating an embedded derivative on reinsurance in the funds withheld liability. Accordingly the Company is required to bifurcate the embedded derivative from the host contract in accordance with ASC 815-15. The bifurcated embedded derivative on reinsurance is computed as the fair value unrealized gain (loss) on the underlying funds withheld assets. This amount is included as a component of the funds withheld liability on the Consolidated Balance Sheets, with changes in the embedded derivative on reinsurance reported in the Net investment income in the Consolidated Statements of Earnings. The embedded derivative on reinsurance is classified as a Level 2 financial instrument in the fair value hierarchy because its valuation input is the fair value market adjustments on the underlying Level 2 debt securities. See Note (4) Fair Values of Financial Instruments for further details of fair value disclosures. In the Consolidated Statements of Cash Flows, changes in the funds withheld liability are reported in operating activities. Realized gains on funds withheld assets are transferred to the reinsurer and reported as investing activities in the Consolidated Statements of Cash Flows. The value of the embedded derivative at December 31, 2021 and 2020 was $84.7 million and $0.0 million, respectively.
Mortgage Loans and Other Long-term Investments
Mortgage loans and other long-term investments are primarily stated at cost, less unamortized discounts, deferred fees, and allowances for possible losses. Mortgage loans made by the reinsurer under the funds withheld reinsurance agreement are reported at fair value. Policy loans are stated at their aggregate unpaid balances. Real estate is stated at the lower of cost or fair value less estimated costs to sell.
NATIONAL WESTERN LIFE GROUP, INC.
NOTES TO CONSOLIDATED FINANCIAL STATEMENTS
As further disclosed under Accounting Standards and Changes in Accounting in this note, effective January 1, 2020, the Company implemented FASB ASU 2016-13, Financial Instruments-Credit Losses, which revises the credit loss recognition criteria for mortgage loans replacing the existing incurred loss recognition model with an expected loss recognition model (“CECL”). The objective of the CECL model is for the reporting entity to recognize its estimate of current expected credit losses for affected financial assets in a valuation allowance deducted from the amortized cost basis of the related financial assets that results in presenting the net carrying value of the financial assets at the amount expected to be collected. For mortgage loan investments the Company is using the Weighted Average Remaining Maturity ("WARM") method, which uses an average annual charge-off rate applied to each mortgage loan risk category. The WARM method is also used to calculate the CECL allowance on unfunded mortgage loan commitments. The CECL allowance on unfunded mortgage loan commitments is reported in other liabilities in the Consolidated Balance Sheets, with changes in the CECL allowance related to unfunded commitments recorded through Other operating expenses in the Consolidated Statements of Earnings.
Prior to January 1, 2020, impaired loans were those loans where it is probable that all amounts due according to contractual terms of the loan agreement would not be collected. The Company identified these loans through its normal loan review procedures. Impaired loans included: 1) nonaccrual loans, 2) loans which were 90 days or more past due, unless they were well secured and were in the process of collection, and 3) other loans which management believed were impaired. Impaired loans were measured based on: 1) the present value of expected future cash flows discounted at the loan's effective interest rate, 2) the loan's observable market price, or 3) the fair value of the collateral if the loan is collateral dependent. When the Company had loans considered impaired substantially all were measured at the fair value of the collateral. In limited cases, the Company used other methods to determine the level of impairment of a loan if such loan was not collateral dependent. Mortgage loans were placed on non-accrual status if there were concerns regarding the collectability of future payments. Interest income on non-performing loans is generally recognized on a cash basis. Once mortgage loans were classified as nonaccrual loans, the resumption of the interest accrual would commence only after all past due interest had been collected or the mortgage loan had been restructured such that the collection of interest was considered likely.
Accrued Investment Income
The accrual of investment income on invested assets is discontinued when it is determined that it is probable that the income will not be collected.
Realized Gains and Losses on Investments
Realized gains and losses for securities available-for-sale, securities held-to-maturity, and trading securities are included in earnings and are derived using the specific identification method for determining the cost of securities sold or called. Prepayment penalty fees received from issuers that call their securities before maturity are excluded from the calculation of realized gain or loss and are included as a component of investment income. After an OTTI write down of fixed maturities due to a credit-only impairment, the cost basis is not adjusted for subsequent recoveries in fair value. For fixed maturities for which a reasonable estimate of future cash flows are available after a write down, the discount or reduced premium recorded, based on the new cost basis, is amortized over the remaining life of the security. Amortization in this instance is computed using the prospective method and the current estimate of the amount and timing of future cash flows.
Fair Values
Fair values of equity securities are based on quoted market prices in active markets when available. Fair values of fixed maturities are based on market prices in the fixed income markets. Fair values of derivative investments are based on the latest counterparty model market prices. Items not readily marketable are generally based on values that are representative of the fair values of comparable issues. Fair values for all securities are reviewed for reasonableness by considering overall market conditions and values for similar securities. See Note (4) Fair Values of Financial Instruments for more information on fair value policies, including assumptions and the amount of securities priced using the valuation models.
NATIONAL WESTERN LIFE GROUP, INC.
NOTES TO CONSOLIDATED FINANCIAL STATEMENTS
Cash and Cash Equivalents
For purposes of the Consolidated Statements of Cash Flows, the Company considers all short-term investments with a maturity at the date of purchase of three months or less to be cash equivalents.
Deferred Policy Acquisition Costs, Deferred Sales Inducements, Value of Business Acquired, and Cost of Reinsurance
Deferred policy acquisition costs ("DPAC") include certain costs of successfully acquiring new insurance business, including commissions and other expenses related directly to the production of new business, to the extent recoverable from future policy revenues and gross profits (indirect or unsuccessful acquisition costs, maintenance, product development and overhead expenses are charged to expenses as incurred). Also included are premium bonuses and bonus interest credited to contracts during the first contract year only. These deferred sales inducements ("DSI") are also deferrable to the extent recoverable.
For interest sensitive universal life and annuity products, these costs are amortized in relation to the present value of expected gross margins or gross profits on these policies. For nonparticipating traditional life products, these costs are amortized over the premium paying period of the related policies, in proportion to the ratio of annual premium revenues to total anticipated premium revenues. Such anticipated premium revenues are estimated using the same assumptions used for computing liabilities for future policy benefits. The Company evaluates the recoverability of deferred policy acquisition and sales inducement costs on a quarterly basis. In this evaluation, the Company considers estimated future gross profits or future premiums, as applicable for the type of contract. The Company also considers expected mortality, interest earned and credited rates, persistency, and expenses.
In accordance with GAAP guidance, the Company must also write off deferred policy acquisition costs and unearned revenue liabilities upon internal replacement of certain contracts as well as annuitizations of deferred annuities. All insurance and investment contract modifications and replacements are reviewed to determine if the internal replacement results in a substantially changed contract. If so, the acquisition costs, sales inducements and unearned revenue associated with the new contract are deferred and amortized over the lifetime of the new contract. In addition, the existing deferred policy acquisition costs, sales inducement costs and unearned revenue balances associated with the replaced contract are written off. If an internal replacement results in a substantially unchanged contract, the acquisition costs, sales inducements and unearned revenue associated with the new contract are immediately recognized in the period incurred. In addition, the existing deferred policy acquisition costs, sales inducement costs or unearned revenue balance associated with the replaced contract are not written off, but instead are carried over to the new contract.
Amortization of DPAC and DSI is reviewed each year and adjusted retrospectively through an unlocking process when estimates of current or future gross profits/margins (including the impact of investment gains and losses) to be realized from a group of products are revised.
The value of insurance in force business acquired ("VOBA") is a purchase accounting convention for life insurance companies in business combinations based upon an actuarial determination of the difference between the fair value of policy liabilities acquired and the same policyholder liabilities measured in accordance with the acquiring company's accounting policies. The difference, referred to as VOBA, is an intangible asset subject to periodic amortization. It represents the portion of the purchase price allocated to the value of the rights to receive future cash flows from the business in force at the acquisition date. The Company began performing recoverability testing in 2020 of value business acquired.
At December 31, 2020, the Company recorded as an asset on the Consolidated Balance Sheet a deferred Cost of Reinsurance ("COR") amount of $102.8 million associated with the funds withheld reinsurance transaction. This represents the amount of assets transferred at the closing date of the funds withheld agreement (debt securities, policy loans, and cash) in excess of the GAAP liability ceded plus a $48.0 million ceding commission paid to the reinsurer. The COR balance is amortized commensurate with the runoff of the ceded block of funds withheld business and the amortization expense reported in the Consolidated Statements of Earnings.
NATIONAL WESTERN LIFE GROUP, INC.
NOTES TO CONSOLIDATED FINANCIAL STATEMENTS
Reinsurance
The Company cedes insurance and investment contracts under a coinsurance with funds withheld arrangement, following reinsurance accounting for transactions that provides indemnification against loss or liability relating to insurance risk. To meet risk transfer requirements, a reinsurance agreement must transfer insurance risk arising from uncertainties about both underwriting and timing risks. Cessions under reinsurance do not discharge the Company's obligations as the primary insurer. Assets and liabilities are presented on a gross basis on the Consolidated Balance Sheets.
Under the funds withheld reinsurance agreement, funds withheld assets consist of a segregated portfolio of cash and invested assets which is sufficient to support the current balance of statutory reserves. The fair value of the funds withheld is recorded as a funds withheld liability and any excess or shortfall in relation to statutory reserves is settled periodically. Refer to Note (5) Reinsurance for more information.
Other Assets
Other assets include property and equipment, primarily comprised of capitalized software costs, furniture and equipment and leasehold improvements, which are reported at cost less allowances for depreciation and amortization. Costs incurred in the preliminary stages of developing internal-use software as well as costs incurred post-implementation for maintenance are expensed. Capitalization of internal-use software costs occurs after management has authorized the project and it is probable that the software will be used as intended. Amortization of software costs begins after the software has been placed in production. Depreciation and amortization expense is computed primarily using the straight-line method over the estimated useful lives of the assets, which range from 3 to 39 years. Leasehold improvements are amortized over the lesser of the economic useful life of the improvement or the term of the lease. Capitalized software, property, and equipment had a carrying value of $165.3 million at December 31, 2021 and $155.9 million at December 31, 2020, and accumulated depreciation and amortization of $84.0 million at December 31, 2021 and $72.6 million at December 31, 2020. Depreciation and amortization expense for capitalized software, furniture and equipment, and leasehold improvements was $13.0 million, $11.9 million, and $10.7 million in 2021, 2020, and 2019, respectively.
Other assets also include goodwill at December 31, 2021 and 2020 of $13.9 million related to the excess of the amounts paid to acquire companies over the fair value of other net tangible and intangible assets acquired. It represents the future economic benefits arising from assets acquired and liabilities assumed that could not be individually identified. Goodwill is not amortized but is subject to annual impairment analysis at the same time each year or more frequently if indicators are present. The Company annually reviews its goodwill balance to determine if indicators suggest an impairment may have occurred and would suggest the value has declined below the carrying value of goodwill. Refer to Note (7) Goodwill and Specifically Identifiable Intangible Assets for further information.
Other assets at December 31, 2021 and 2020 further include $7.5 million and $8.2 million, respectively, of identifiable intangible assets acquired in a business combination. These intangible assets include trademarks and trade names, internally developed software, and various insurance licenses. Identifiable intangible assets are being amortized using a straight-line method over their estimated useful lives.
Future Policy Benefits
Under GAAP, the liability for future policy benefits on traditional products has been calculated using assumptions as to future mortality (based on the 1965-1970, 1975-1980, and 2001 Select and Ultimate mortality tables), interest ranging from 3.25% to 8.00%, and withdrawals based on Company experience. For universal life and annuity contracts, the liability for future policy benefits represents the account balance. Fixed-index products combine features associated with traditional fixed annuities and universal life contracts, with the option to have interest rates linked in part to an equity index. In accordance with GAAP guidance, the equity return component of such policy contracts must be identified separately and accounted for as embedded derivatives. The remaining portions of these policy contracts are considered the host contracts and are recorded separately as fixed annuity or universal life contracts. The host contracts are accounted for under GAAP guidance provisions that require debt instrument type accounting. The host contracts are recorded as discounted debt instruments that are accreted, using the effective yield method, to their minimum account values at their projected maturities or termination dates.
NATIONAL WESTERN LIFE GROUP, INC.
NOTES TO CONSOLIDATED FINANCIAL STATEMENTS
The embedded derivatives are recorded at fair value. The fair value of the embedded derivative component of policy benefit reserves is estimated at each valuation date by (a) projecting policy and contract values and minimum guaranteed values over the expected lives of the policies and contracts and (b) discounting the excess of the projected value amounts at the applicable risk free interest rates adjusted for nonperformance risk related to those liabilities. The projections of policy and contract values are based upon best estimate assumptions for future policy growth and future policy decrements. Best estimate assumptions for future policy growth includes assumptions for the expected index credit on the next policy anniversary date which are derived from the fair values of the underlying call options purchased to fund such index credits and the expected costs of annual cost options purchased in the future to fund index credits beyond the next policy anniversary. The projections of minimum guaranteed contract values include the same best estimate assumptions for policy decrements as were used to project policy contract values.
Other Policy Claims and Benefits
Unearned revenue reserves are maintained that reflect the unamortized balance of charges assessed to interest sensitive contract holders which serve as compensation for services to be performed over future periods (policy premium loads). These charges have been deferred and are being recognized in income over the period benefited using the same assumptions and factors used to amortize deferred acquisition costs.
Share-based Compensation
The Company accounts for share-based compensation under GAAP using liability accounting, and measures compensation cost using the fair value method at each reporting date. For stock appreciation rights, fair value is determined using an option pricing model that takes into account various information and assumptions including the Company's stock price, volatility, option price, vesting dates, exercise dates and projected lapses from forfeiture or termination.
Deferred Income Taxes
Federal income taxes are accounted for under the asset and liability method. Under this method, deferred tax assets and liabilities are recognized for the future tax consequences attributable to differences between the financial statement carrying amounts of existing assets and liabilities and their respective tax bases. Deferred tax assets and liabilities are measured using enacted tax rates expected to apply to taxable income in the years in which those temporary differences are expected to be recovered or settled. The effect on deferred tax assets and liabilities of a change in tax rates is recognized in income in the period that includes the enactment date. A valuation allowance for deferred tax assets is provided if all or some portion of the deferred tax asset may not be realized. An increase or decrease in a valuation allowance that results from a change in circumstances that affects the realizability of the related deferred tax asset is included in income in the period the change occurs.
Recognition of Premiums, Contract Revenues and Costs
Premiums on traditional life insurance products are recognized as revenues as they become due from policyholders. Benefits and expenses are matched with premiums in arriving at profits by providing for policy benefits over the lives of the policies and by amortizing costs over premium-paying periods of the policies.
NATIONAL WESTERN LIFE GROUP, INC.
NOTES TO CONSOLIDATED FINANCIAL STATEMENTS
Revenues for interest sensitive universal life and annuity products consist of policy charges for the cost of insurance asset charges, administration charges, amortization of policy initiation fees and surrender charges assessed against policyholder account balances. The timing of revenue recognition as it relates to these charges and fees is determined based on the nature of such charges and fees. Policy charges for the cost of insurance, asset charges and policy administration charges are assessed on a daily or monthly basis and are recognized as revenue when assessed and earned. Certain policy initiation fees that represent compensation for services to be provided in the future are reported as unearned revenue and recognized in income over the periods benefited. Surrender charges are determined based upon contractual terms and are recognized upon surrender of a contract. Policy benefits and claims charged to expense include interest amounts credited to policyholder account balances and benefit claims incurred in excess of policyholder account balances during the period. Amortization of DPAC, DSI, VOBA, and COR balances are recognized as expense over the life of the underlying policies. All insurance-related revenues, benefits and expenses are reported net of reinsurance ceded. The cost of reinsurance ceded is recognized over the contract periods of the reinsurance agreements.
Comprehensive Income
Comprehensive income includes net income, as well as other comprehensive income items not recognized through net income. Other comprehensive income includes unrealized gains and losses on available-for-sale securities as well as the underfunded obligations for certain retirement and postretirement benefit plans. These items are included in accumulated other comprehensive income, net of tax and other offsets, in stockholders’ equity. The changes in unrealized gains and losses reported in the Consolidated Statements of Comprehensive Income (Loss), excludes net investment gains and losses included in net income that represent transfers from unrealized to realized gains and losses. These transfers are further discussed in Note (2) Investments. The components of the underfunded obligation for certain retirement and postretirement benefit plans are provided in Note (14) Pension and Other Postretirement Plans.
Use of Estimates
The preparation of financial statements in conformity with GAAP requires management to make estimates and assumptions that affect the reported amounts of assets, liabilities, revenues and expenses and the disclosure of contingent assets and liabilities. For example, significant estimates and assumptions are utilized in the valuation of investments, determination of credit losses and impairments of investments, recoverability and amortization of deferred policy acquisition costs, deferred sales inducements and value of business acquired, calculation of policyholder liabilities and accruals and determination of pension expense. It is reasonably possible that actual experience could differ from the estimates and assumptions utilized, which could have a material impact on the Consolidated Financial Statements.
Accounting Standards and Changes in Accounting
Recent accounting pronouncements not yet adopted
In August 2018, the Financial Accounting Standards Board ("FASB") issued ASU 2018-12 Financial Services-Insurance (Topic 944) - Targeted Improvements to the Accounting for Long-Duration Contracts ("LDTI"). This update pertains to long-duration contracts and improving the timeliness of recognizing changes in the liability for future policy benefits, simplifying accounting for certain market-based options, simplifying the amortization of deferred policy acquisition costs, and improving the effectiveness of required disclosures. Amendments include the following:
A. Require an insurance entity to (1) review and update assumptions used to measure cash flows at least annually (with changes recognized in net income) and (2) update discount rate assumptions at each quarterly reporting date with the impact recognized in other comprehensive income ("OCI").
B. Require an insurance entity to measure all market risk benefits, which are contracts or contract features that provide protection to the policyholder from capital market risk, associated with deposit (i.e. account balance) contracts at fair value. The periodic change in fair value attributable to change in instrument-specific credit risk is recognized in OCI.
NATIONAL WESTERN LIFE GROUP, INC.
NOTES TO CONSOLIDATED FINANCIAL STATEMENTS
C. Simplify amortization of deferred policy acquisition costs and other balances amortized in proportion to premiums, gross profits, or gross margins and require those balances be amortized on a constant basis over the expected term of the related contracts. Deferred policy acquisition costs are required to be written off for unexpected contract terminations but are not subject to impairment testing.
D. Require an insurance entity to add disclosures of disaggregated rollforwards of significant insurance liabilities and other account balances (i.e. beginning to ending balances of the liability for future policy benefits, policyholder account balances, market risk benefits, separate account liabilities, and deferred acquisition costs). The insurance entity must also disclose information about significant inputs, judgments, assumptions, and methods used in measurement, including changes in those inputs, judgments, and assumptions, and the effect of those changes on measurement.
In November 2020, the FASB released ASU 2020-11 Financial Services – Insurance (Topic 944). The amendments in this update deferred the effective date of adoption of ASU 2018-12 for all entities by one year. In particular, for publicly traded business entities, adoption of LDTI was made effective for fiscal years beginning after December 15, 2022, and interim periods within those fiscal years. Accordingly, the Company's required adoption date is January 1, 2023. To date, the Company has: (1) performed a preliminary gap analysis identifying contracts and contract features in scope of this guidance, (2) identified the actuarial models, systems and processes to be updated, (3) identified and gathered cash flow data to be extracted from the Company's policy administrative systems necessary for implementation of this standard, (4) developed valuation models specific to LDTI for valuation date calculations integrating historical cash flows, and (5) established work streams for evaluating and finalizing key accounting policies, determining the impact to financial reporting charts of account, and developing the format and content of the new required disclosures.
Adoption of this standard will significantly change the accounting and reporting for the Company's insurance and annuity products. As the Company progresses through its implementation of the requirements of the standard, it will be better able to assess the impact to its Consolidated Financial Statements.
Accounting pronouncements adopted
In December 2019, the FASB issued ASU 2019-12 Income Taxes - Simplifying the Accounting for Income Taxes (Topic 740), which simplifies various aspects of the income tax accounting guidance and is applied using different approaches depending on the specific amendment. The amendments were effective for fiscal periods beginning after December 15, 2020. The adoption of this ASU did not have a material impact on the results of operations or financial position of the Company.
NATIONAL WESTERN LIFE GROUP, INC.
NOTES TO CONSOLIDATED FINANCIAL STATEMENTS
In June 2016, the FASB released ASU 2016-13, Financial Instruments-Credit Losses, which revises the credit loss recognition criteria for certain financial assets measured at amortized cost. The new guidance replaces the existing incurred loss recognition model with an expected loss recognition model (“CECL”). The objective of the CECL model is for the reporting entity to recognize its estimate of current expected credit losses for affected financial assets in a valuation allowance deducted from the amortized cost basis of the related financial assets that results in presenting the net carrying value of the financial assets at the amount expected to be collected. In April 2019, the FASB issued ASU 2019-04, Codification Improvements to Topic 326, Financial Instruments - Credit Losses, Topic 815, Derivatives and Hedging, and Topic 825, Financial Instruments. The amendments in this Update add clarification and correction to ASU 2016-13 around accrued interest, transfers between classifications or categories for loans and debt securities, consideration of recoveries in estimating allowances, reinsurance recoveries, consideration of prepayments and estimated costs to sell when foreclosure is probable. In November, the FASB issued ASU 2019-11, Codification Improvements to Topic 326, Financial Instruments - Credit Losses. The amendments in this Update add clarification and correction to ASU 2016-13 around expected recoveries for purchased financial assets with credit deterioration, transition relief for troubled debt restructurings, disclosures related to accrued interest receivables, and financial assets secured by collateral maintenance provisions. The guidance for these pronouncements was effective for interim and annual periods beginning after December 15, 2019, and for most affected instruments must be adopted using a modified retrospective approach, with a cumulative effect adjustment recorded to beginning retained earnings. Effective January 1, 2020, the Company adopted the expected loss recognition model related to mortgage loans, debt securities held to maturity and reinsurance recoverable using a modified retrospective approach. The change in accounting, net of tax, of $3.0 million was recorded as a charge to retained earnings in the first quarter of 2020 reflecting initial allowance for estimated credit losses balances of $1.2 million on mortgage loans and $3.3 million on debt securities held to maturity. The estimated credit losses for the reinsurance recoverable were immaterial to the financial statements, but are monitored on a quarterly basis for any changes. Refer to Note (2) Investments for more information. Certain disclosures required by ASU 2016-13 are not included in the Consolidated Financial Statements as the impact of this standard was not material.
In April 2017, the FASB issued ASU 2017-04, Intangibles - Goodwill and Other (Topic 350): Simplifying the Test for Goodwill Impairment. The new guidance simplifies the current two-step goodwill impairment test by eliminating Step 2 of the test. The new guidance requires a one-step impairment test in which an entity compares the fair value of a reporting unit with its carrying amount and recognizes an impairment charge for the amount by which the carrying amount exceeds the reporting unit’s fair value, if any. The amendments will be effective for annual goodwill impairment tests occurring after December 15, 2019. The Company elected to adopt the requirements of this update in its Consolidated Financial Statements for the year ended December 31, 2019. The adoption of this amendment did not have an impact on the Company’s results of operations or financial position.
In August 2018, FASB issued ASU 2018-13 Fair Value Measurement (Topic 820) Disclosure Framework - Changes to the Disclosure requirements for Fair Value Measurement. This update removed disclosures for 1) amount of and reasons for transfers between Level 1 and Level 2 for fair value hierarchy, 2) policy for timing of transfers between levels, 3) valuation process for Level 3 fair value measurements. This update also added disclosure requirement as follows: 1) changes in unrealized gains and losses for the period included in OCI for recurring Level 3 fair value measurements held at end of reporting period; 2) range and weighted average (or other reasonable quantitative measurement) of significant unobservable inputs used to develop Level 3 fair value measurements. The amendments will be effective for interim periods beginning after December 15, 2019. The Company elected to adopt the requirements of this update in its Consolidated Financial Statements for the year ended December 31, 2019. The adoption of this amendment did not have an impact on the Company’s results of operations or financial position.
NATIONAL WESTERN LIFE GROUP, INC.
NOTES TO CONSOLIDATED FINANCIAL STATEMENTS
In August 2018, FASB issued ASU 2018-14 Compensation-Retirement Benefits - Defined Benefit Plans-General (Subtopic 715-20) Disclosure Framework - Changes to the Disclosure Requirements for Defined Benefit Plans. This update removed disclosures for 1) amounts in AOCI expected to be recognized as components of net periodic benefit cost over the next fiscal year, 2) amount and timing of plan assets expected to be returned to the employer, 3) related party disclosures about the amount of future annual benefits covered by insurance and annuity contracts and significant transactions between the employer or related parties and the plan, 4) the effects of a one-percentage-point change in assumed health care cost trend rates on the (a) aggregate of the service and interest cost components of the net periodic benefit costs and (b) benefit obligation for postretirement health care benefits. This update also added disclosures as follows: 1) weighted-average interest crediting rates for cash balance plans and other plans with promised crediting rates, 2) explanation of the reasons for significant gains and losses related to changes in the benefit obligation for the period. Finally, this update clarified that the following information for defined benefit pension plans should be disclosed: 1) projected benefit obligation (PBO) and fair value of plan assets for plans with PBO in excess of plan assets, 2) accumulated benefit obligation (ABO) and fair value of plan assets for plans with ABOs in excess of plan assets. The amendments are effective for fiscal periods ending after December 31, 2020. The Company elected to adopt the requirements of this update in its Consolidated Financial Statements for the year ended December 31, 2019. The adoption of this amendment did not have an impact on the Company’s results of operations or financial position.
In August 2018, the SEC released a final rule updating disclosure requirements, Disclosure Update and Simplification, which resulted in the additional interim disclosure of an analysis of changes in stockholders’ equity to be required for the current and comparative quarter and year-to-date interim periods. Registrants are required to provide an analysis of changes in each caption of stockholders’ equity and noncontrolling interests, which will be accompanied by dividends per share and in the aggregate for each class of shares. The disclosure must be presented in the form of a reconciliation, either as a separate statement or in the footnotes. The adoption of this rule in 2019 did not have a material effect on the results of operations or financial position of the Company as this information in year-to-date format was already provided.
In March 2017, the FASB issued ASU 2017-08, Receivables - Nonrefundable Fees and Other Costs: Premium Amortization on Purchased Callable Debt Securities, which amends the amortization period for certain purchased callable debt securities held at a premium. The amortization period for premiums is being shortened to the earliest call date. This guidance was effective for fiscal years, and interim periods within those years, beginning after December 15, 2018. The adoption of this ASU in 2019 did not have a material effect on the results of operations or financial position of the Company.
In June 2018, the FASB released ASU 2018-07 Compensation - Stock Compensation (Topic 718) - Improvements to Nonemployee Share-Based Payment Accounting. This update largely aligns the accounting for share-based payment awards issued to employees and nonemployees. Previously, nonemployee stock compensation was accounted for under Subtopic 505-50 but will now fall under Topic 718. Changes to the accounting for nonemployee awards include 1) measurement based on fair value of the equity instrument at grant date, rather than previous requirement to measure based on the more reliable option of the fair value of the consideration or the fair value of the equity instrument, 2) initial measurement at grant date, rather than the earlier of the date at which commitment for performance is reached or performance is complete, and 3) when performance conditions are present, the probability of satisfying performance conditions should be considered in measurement rather than the previous requirement to measure at the lowest aggregate fair value. The amendments in the new guidance were effective for public business entities for fiscal years beginning after December 15, 2018, including interim periods within that fiscal period. There was no impact to the Company’s financial position, results of operations or cash flows as the result of the adoption of this ASU.
Other recent accounting pronouncements issued by the FASB (including its Emerging Issues Task Force), the AICPA, and the SEC did not, or are not believed by management to, have a material impact on the Company’s present or future Consolidated Financial Statements.
NATIONAL WESTERN LIFE GROUP, INC.
NOTES TO CONSOLIDATED FINANCIAL STATEMENTS
(2) INVESTMENTS
(A) Investment Income
The major components of net investment income are as follows:
| | | | | | | | | | | | | | | | | |
| | Years Ended December 31, |
| | 2021 | | 2020 | | 2019 |
| | (In thousands) |
| | | | | |
| Gross investment income: | | | | | |
| Debt and equity securities | $ | 309,082 | | | 373,479 | | | 403,372 | |
| Mortgage loans | 20,155 | | | 13,162 | | | 12,595 | |
| Policy loans | 2,667 | | | 3,361 | | | 3,539 | |
| Short-term investments | 293 | | | 2,160 | | | 2,974 | |
| Other investment assets | 16,321 | | | 12,698 | | | 13,057 | |
| | | | | |
| Total investment income | 348,518 | | | 404,860 | | | 435,537 | |
| Less investment expenses | 2,762 | | | 2,412 | | | 3,252 | |
| | | | | |
| Net investment income (excluding derivatives and trading securities) | 345,756 | | | 402,448 | | | 432,285 | |
| Index option derivative gain | 120,718 | | | 14,754 | | | 123,207 | |
| Embedded derivative on reinsurance | 84,725 | | | — | | | — | |
| Trading securities market adjustments | 11,331 | | | — | | | — | |
| | | | | |
| Net investment income | $ | 562,530 | | | 417,202 | | | 555,492 | |
(B) Mortgage Loans and Real Estate
A financing receivable is a contractual right to receive money on demand or on fixed or determinable dates that is recognized as an asset in a company’s statement of financial position. The Company’s mortgage, participation and mezzanine loans on real estate are the only financing receivables included in the Consolidated Balance Sheets.
In general, the Company originates loans on high quality, income-producing properties such as shopping centers, freestanding retail stores, office buildings, industrial and sales or service facilities, selected apartment buildings, hotels, and health care facilities. The location of these properties is typically in major metropolitan areas that offer a potential for property value appreciation. Credit and default risk are minimized through strict underwriting guidelines and diversification of underlying property types and geographic locations. In addition to being secured by the property, mortgage loans with leases on the underlying property are often guaranteed by the lease payments. This approach has proven to result in quality mortgage loans with few defaults. Mortgage loan interest income is recognized on an accrual basis with any premium or discount amortized over the life of the loan. Prepayment and late fees are recorded on the date of collection.
The Company targets a minimum specified yield on mortgage loan investments determined by reference to currently available debt security instrument yields plus a desired amount of incremental basis points. A low interest rate environment and a competitive marketplace, more recently resulted in fewer loan opportunities being available that met the Company's required rate of return. During 2020, mortgage loan originations were further impeded by the COVID-19 pandemic and its effects upon the commercial real estate market. As stabilization returned to the commercial real estate market, the Company directed resources and effort towards expanding its mortgage loan investment portfolio. Mortgage loans originated by the Company totaled $183.6 million and $80.2 million for the years 2021 and 2020, respectively.
NATIONAL WESTERN LIFE GROUP, INC.
NOTES TO CONSOLIDATED FINANCIAL STATEMENTS
Loans in foreclosure, loans considered impaired or loans past due 90 days or more are placed on a non-accrual status. If a mortgage loan is determined to be on non-accrual status, the mortgage loan does not accrue any revenue into the Consolidated Statements of Earnings. The loan is independently monitored and evaluated as to potential impairment or foreclosure. If delinquent payments are made and the loan is brought current, then the Company returns the loan to active status and accrues income accordingly. The Company has no loans past due 90 days which are accruing interest. As a result of the economic climate change induced by the COVID-19 virus, during 2020 various mortgage loan borrowers of the Company requested a temporary forbearance of principal payments on loans in the range of three to nine months. There were 8 loans representing an aggregate principal balance of $29.2 million with borrowers meeting specified criteria of the Company that forbearance terms were agreed to. At December 31, 2020, only 1 of these loans with a principal balance of $4.7 million remained in forbearance. All forbearance loans returned to the terms of the original loan agreements during the first quarter of 2021.
Included in the mortgage loan investment balance at December 31, 2021, are 3 mortgage loan investments made by the reinsurer under the funds withheld reinsurance agreement totaling $8.5 million. Similar to trading debt securities, these loans are reported at fair market values in order to allow the market value fluctuation to be recorded directly in the Consolidated Statements of Earnings and to offset the embedded derivative liability change due to market value fluctuations.
The Company held net investments in mortgage loans, after allowances for credit losses, totaling $487.3 million and $332.5 million at December 31, 2021 and 2020, respectively. The diversification of the portfolio by geographic region, property type, and loan-to-value ratio was as follows:
| | | | | | | | | | | | | | | | | | | | | | | |
| | December 31, 2021 | | December 31, 2020 |
| Amount | | % | | Amount | | % |
| | (In thousands) | | | | (In thousands) | | |
| | | | | | | |
| Mortgage Loans by Geographic Region: | | | | | | | |
| West South Central | $ | 237,644 | | | 48.5 | | | $ | 201,501 | | | 60.1 | |
| East North Central | 61,397 | | | 12.6 | | | 16,478 | | | 4.9 | |
| South Atlantic | 81,847 | | | 16.7 | | | 51,857 | | | 15.5 | |
| East South Central | 20,069 | | | 4.1 | | | 27,590 | | | 8.2 | |
| West North Central | 12,213 | | | 2.5 | | | 12,423 | | | 3.7 | |
| Pacific | 13,800 | | | 2.8 | | | 6,228 | | | 1.9 | |
| Middle Atlantic | 36,296 | | | 7.4 | | | 1,975 | | | 0.6 | |
| Mountain | 26,613 | | | 5.4 | | | 16,955 | | | 5.1 | |
| | | | | | | |
| Gross balance | 489,879 | | | 100.0 | | | 335,007 | | | 100.0 | |
| | | | | | | |
| Market value adjustment | 412 | | | 0.1 | | | — | | | — | |
| Allowance for credit losses | (2,987) | | | (0.6) | | | (2,486) | | | (0.7) | |
| | | | | | | |
| Totals | $ | 487,304 | | | 99.5 | | | $ | 332,521 | | | 99.3 | |
NATIONAL WESTERN LIFE GROUP, INC.
NOTES TO CONSOLIDATED FINANCIAL STATEMENTS
| | | | | | | | | | | | | | | | | | | | | | | |
| | December 31, 2021 | | December 31, 2020 |
| Amount | | % | | Amount | | % |
| | (In thousands) | | | | (In thousands) | | |
| | | | | | | |
| Mortgage Loans by Property Type: | | | | | | | |
| Retail | $ | 164,895 | | | 33.7 | | | $ | 92,173 | | | 27.5 | |
| Office | 142,824 | | | 29.2 | | | 111,735 | | | 33.3 | |
| Storage facility | 73,401 | | | 15.0 | | | 53,591 | | | 16.0 | |
| Industrial | 34,212 | | | 7.0 | | | 29,131 | | | 8.7 | |
| Hotel | 23,748 | | | 4.8 | | | 8,372 | | | 2.5 | |
| Land/lots | 4,597 | | | 0.9 | | | 4,680 | | | 1.4 | |
| Apartments | 38,920 | | | 7.9 | | | 29,743 | | | 8.9 | |
| Residential | 1,905 | | | 0.4 | | | — | | | — | |
| All other | 5,377 | | | 1.1 | | | 5,582 | | | 1.7 | |
| Gross balance | 489,879 | | | 100.0 | | | 335,007 | | | 100.0 | |
| | | | | | | |
| Market value adjustment | 412 | | | 0.1 | | | — | | | — | |
| Allowance for credit losses | (2,987) | | | (0.6) | | | (2,486) | | | (0.7) | |
| | | | | | | |
| Totals | $ | 487,304 | | | 99.5 | | | $ | 332,521 | | | 99.3 | |
| | | | | | | | | | | | | | | | | | | | | | | |
| | December 31, 2021 | | December 31, 2020 |
| Amount | | % | | Amount | | % |
| | (In thousands) | | | | (In thousands) | | |
| | | | | | | |
| Mortgage Loans by Loan-to-Value Ratio (1): | | | | | | | |
| Less than 50% | $ | 100,806 | | | 20.6 | | | $ | 66,635 | | | 19.9 | |
| 50% to 60% | 128,191 | | | 26.2 | | | 64,536 | | | 19.3 | |
| 60% to 70% | 202,670 | | | 41.3 | | | 153,414 | | | 45.8 | |
| 70% to 80% | 58,212 | | | 11.9 | | | 50,422 | | | 15.0 | |
| 80% and above | — | | | — | | | — | | | — | |
| | | | | | | |
| Gross balance | 489,879 | | | 100.0 | | | 335,007 | | | 100.0 | |
| | | | | | | |
| Market value adjustment | 412 | | | 0.1 | | | — | | | — | |
| Allowance for credit losses | (2,987) | | | (0.6) | | | (2,486) | | | (0.7) | |
| | | | | | | |
| Totals | $ | 487,304 | | | 99.5 | | | $ | 332,521 | | | 99.3 | |
(1) Loan-to-Value Ratio is determined using the most recent appraised value. Appraisals are required at the time of funding and may be updated if a material change occurs from the original loan agreement.
NATIONAL WESTERN LIFE GROUP, INC.
NOTES TO CONSOLIDATED FINANCIAL STATEMENTS
Market value adjustments are recorded for mortgage loan investments for which the Company has elected to measure the loan at fair value. During the year ended December 31, 2021, the investment manager associated with the funds withheld coinsurance agreement arrangement executed several mortgage loan investments for the funds withheld assets under the reinsurance treaty. The Company has elected fair value measurement for these mortgage loans, which are included in the funds withheld portfolio.
All mortgage loans are analyzed quarterly in order to monitor the financial quality of these assets. Based on ongoing monitoring, mortgage loans with a likelihood of becoming delinquent are identified and placed on an internal “watch list.” Among the criteria that would indicate a potential problem include: major tenant vacancies or bankruptcies, late payments, and loan relief/restructuring requests. The mortgage loan portfolio is analyzed for the need for a valuation allowance on any loan that is on the internal watch list, in the process of foreclosure, or that currently has a valuation allowance.
Effective January 1, 2020, the Company implemented FASB ASU 2016-13, Financial Instruments-Credit Losses, which revised the credit loss criteria for certain financial assets. The guidance replaced the existing incurred loss recognition model with an expected loss recognition model ("CECL"). Previously, mortgage loans were considered impaired when, based on current information and events, it was probable that the Company would be unable to collect all amounts due according to the contractual terms of the loan agreement. When it was determined that a loan was impaired, a loss was recognized for the difference between the carrying amount of the mortgage loan and the estimated value reduced by the cost to sell. Estimated value was typically based on the loan's observable market price or the fair value of the collateral less cost to sell. The objective of the CECL model is for the reporting entity to recognize its estimate of current expected credit losses for affected financial assets in a valuation allowance deducted from the amortized cost basis of the related financial assets that results in presenting the net carrying value of financial assets at the amount expected to be collected.
For mortgage loan investments the Company employed the Weighted Average Remaining Maturity ("WARM") method in estimating current expected losses with respect to mortgage loan investments as of January 1, 2020 and each succeeding calendar quarter-end thereafter. The WARM method applies publicly available data of default incidence of commercial real estate properties by several defined segmentations combined with future assumptions regarding economic conditions (i.e. GDP forecasts) both in the near term and the long term. Under this new accounting guidance, at January 1, 2020 a balance of $1.2 million was recorded for mortgage loan investments which incorporated the previous year-end balance under the prior accounting method. The adjustment resulted in a charge to retained earnings as a change in accounting, net of tax, of $0.4 million. Subsequent changes in the allowance for current expected credit losses are reported in net investment income in the Consolidated Statements of Earnings.
The following table represents the mortgage loan allowance for credit losses.
| | | | | | | | | | | |
| Years Ended December 31, |
| | 2021 | | 2020 |
| | (In thousands) |
| | | |
| Mortgage Loans Allowance for Credit Losses: | | | |
| Balance, beginning of the period | $ | 2,486 | | | 675 | |
| Impact of adoption of new accounting guidance | — | | | 504 | |
| Provision during the period | 501 | | | 1,307 | |
| Releases | — | | | — | |
| | | |
| Balance, end of period | $ | 2,987 | | | 2,486 | |
The Company does not recognize interest income on loans past due 90 days or more. The Company had no mortgage loans past due six months or more at December 31, 2021, 2020 and 2019. There was no interest income not recognized in 2021, 2020 or 2019.
NATIONAL WESTERN LIFE GROUP, INC.
NOTES TO CONSOLIDATED FINANCIAL STATEMENTS
The contractual maturities of mortgage loan principal balances at December 31, 2021 and 2020 were as follows:
| | | | | | | | | | | | | | | | | | | | | | | |
| | December 31, 2021 | | December 31, 2020 |
| Amount | | % | | Amount | | % |
| | (In thousands) | | | | (In thousands) | | |
| | | | | | | |
| Principal Balance by Contractual Maturity: | | | | | | | |
| Due in one year or less | $ | 13,422 | | | 2.7 | | | $ | 4,208 | | | 1.3 | |
| Due after one year through five years | 127,766 | | | 26.1 | | | 60,826 | | | 18.1 | |
| Due after five years through ten years | 222,444 | | | 45.4 | | | 154,787 | | | 46.1 | |
| Due after ten years through fifteen years | 115,313 | | | 23.5 | | | 107,662 | | | 32.1 | |
| Due after fifteen years | 11,280 | | | 2.3 | | | 7,977 | | | 2.4 | |
| | | | | | | |
| Totals | $ | 490,225 | | | 100.0 | | | $ | 335,460 | | | 100.0 | |
The Company's direct investments in real estate investments are not a significant portion of its total investment portfolio. These investments totaled approximately $28.6 million at December 31, 2021 and $33.8 million at December 31, 2020, and consist primarily of income-producing properties which are being operated by a wholly owned subsidiary of National Western. Included in the amount at December 31, 2020 was a surface parking property owned by Ozark National in Kansas City, Missouri which it contracted out for rent. The value of this real estate investment was appraised at $4.3 million at January 31, 2019 as part of the purchase accounting done as of that date. During 2021, Ozark National sold its home office properties, including the surface parking property. The Company recognized operating income on its direct investments in real estate of approximately $2.9 million, $2.9 million and $2.9 million for the years ended December 31, 2021, 2020 and 2019, respectively. The Company had real estate investments that were non-income producing for the preceding twelve months totaling $0.1 million, $0.4 million, and $0.4 million at December 31, 2021, 2020 and 2019, respectively.
Net real estate loss for the year ended December 31, 2021 was related to the Ozark National sale of its home office, parking garage and parking lot all located in Kansas City, Missouri at a net realized loss of $1.4 million. Net real estate gains for the year ended December 31, 2020 were $2.7 million, and related to the sale of a property located in Travis County Texas. Included in net realized investment gains during 2019 are the sale of the Company's former home office facility in Austin, Texas at a gain of $3.2 million and the sale of the Company's 2 nursing home facilities at a net gain of $3.7 million.
NATIONAL WESTERN LIFE GROUP, INC.
NOTES TO CONSOLIDATED FINANCIAL STATEMENTS
(C) Debt Securities
The table below presents amortized costs and fair values of debt securities available-for-sale at December 31, 2021.
| | | | | | | | | | | | | | | | | | | | | | | | | | | | | |
| | Debt Securities Available-for-Sale |
| | Amortized Cost | | Gross Unrealized Gains | | Gross Unrealized Losses | | Fair Value | | Allowance for Credit Losses |
| | (In thousands) | | |
| | | | | | | | | |
| Debt securities: | | | | | | | | | |
| U.S. Agencies | $ | 43,472 | | | 1,071 | | | — | | | 44,543 | | | — | |
| U.S. Treasury | 2,469 | | | 21 | | | — | | | 2,490 | | | — | |
| States and political subdivisions | 479,148 | | | 27,733 | | | (921) | | | 505,960 | | | — | |
| Foreign governments | 62,979 | | | 293 | | | (881) | | | 62,391 | | | — | |
| Public utilities | 745,359 | | | 39,919 | | | (309) | | | 784,969 | | | — | |
| Corporate | 6,322,471 | | | 391,287 | | | (12,805) | | | 6,700,953 | | | — | |
| Commercial mortgage-backed | 27,016 | | | 741 | | | — | | | 27,757 | | | — | |
| Residential mortgage-backed | 530,702 | | | 18,921 | | | — | | | 549,623 | | | — | |
| Asset-backed | 390,634 | | | 2,123 | | | (2,497) | | | 390,260 | | | — | |
| | | | | | | | | |
| Totals | $ | 8,604,250 | | | 482,109 | | | (17,413) | | | 9,068,946 | | | — | |
NATIONAL WESTERN LIFE GROUP, INC.
NOTES TO CONSOLIDATED FINANCIAL STATEMENTS
The table below presents amortized costs and fair values of debt securities available-for-sale at December 31, 2020.
| | | | | | | | | | | | | | | | | | | | | | | |
| | Debt Securities Available-for-Sale |
| | Amortized Cost | | Gross Unrealized Gains | | Gross Unrealized Losses | | Fair Value |
| | (In thousands) |
| | | | | | | |
| Debt securities: | | | | | | | |
| U.S. Agencies | $ | 72,945 | | | $ | 2,496 | | | $ | — | | | 75,441 | |
| U.S. Treasury | 3,152 | | | 126 | | | $ | — | | | 3,278 | |
| States and political subdivisions | $ | 528,266 | | | 37,909 | | | (86) | | | 566,089 | |
| Foreign governments | 11,115 | | | 334 | | | — | | | 11,449 | |
| Public utilities | 831,990 | | | 77,920 | | | — | | | 909,910 | |
| Corporate | 7,376,104 | | | 727,470 | | | (4,601) | | | 8,098,973 | |
| Commercial mortgage-backed | 30,108 | | | 1,363 | | | — | | | 31,471 | |
| Residential mortgage-backed | 902,974 | | | 50,970 | | | (156) | | | 953,788 | |
| Asset-backed | 117,889 | | | 2,635 | | | — | | | 120,524 | |
| | | | | | | |
| Totals | $ | 9,874,543 | | | $ | 901,223 | | | $ | (4,843) | | | $ | 10,770,923 | |
The Company's investment policy is to invest in high quality securities with the primary intention of holding these securities until the stated maturity. As such, the portfolio has exposure to interest rate risk, which is the risk that funds are invested today at a market interest rate and in the future interest rates rise causing the current market price on that investment to be lower. This risk is not a significant factor relative to the Company's buy and hold portfolio, since the intention is to receive the stated interest rate and principal at maturity to match liability requirements to policyholders. The Company manages these risks, for example, by purchasing mortgage-backed securities types that have more predictable cash flow patterns.
The Company held below investment grade debt securities totaling $153.0 million and $303.5 million at December 31, 2021 and 2020, respectively. These amounts represent 1.4% and 2.7% of total invested assets for December 31, 2021 and 2020, respectively. Below investment grade holdings are the result of credit rating downgrades subsequent to purchase, as the Company only invests in high quality securities with ratings quoted as investment grade. Below investment grade securities generally have greater default risk than higher rated corporate debt. The issuers of these securities are usually more sensitive to adverse industry or economic conditions than are investment grade issuers.
For the years ended December 31, 2021, December 31, 2020 and 2019, the Company recorded net realized gains totaling $15.0 million, $21.1 million and $6.2 million, respectively, related to the disposition of investment securities and real estate.
Debt securities balances at December 31, 2021 and 2020 include Ozark National holdings of $823.0 million and $811.6 million in available-for-sale, respectively. As part of the acquisition of Ozark National effective January 31, 2019 the Company employed purchase accounting procedures in accordance with GAAP which revalued the acquired investment portfolio to their fair values as of the date of the acquisition. These fair values became the book values for Ozark National from that point going forward.
NATIONAL WESTERN LIFE GROUP, INC.
NOTES TO CONSOLIDATED FINANCIAL STATEMENTS
The following table shows the gross unrealized lossesgrant, in order to promote a long-term perspective and fair values of the Company's available-for-sale investments by investment category and length of time the individual securities have been in a continuous unrealized loss position at December 31, 2021.
| | | | | | | | | | | | | | | | | | | | | | | | | | | | | | | | | | | |
| | Debt Securities Available-For-Sale |
| | Less than 12 Months | | 12 Months or Greater | | Total |
| | Fair Value | | Unrealized Losses | | Fair Value | | Unrealized Losses | | Fair Value | | Unrealized Losses |
| | (In thousands) |
| | | | | | | | | | | |
| Debt securities: | | | | | | | | | | | |
| | | | | | | | | | | |
| | | | | | | | | | | |
| States and political subdivisions | $ | 38,853 | | | (779) | | | 1,790 | | | (142) | | | 40,643 | | | (921) | |
| Foreign governments | 31,862 | | | (881) | | | — | | | — | | | 31,862 | | | (881) | |
| Public utilities | 15,286 | | | (309) | | | — | | | — | | | 15,286 | | | (309) | |
| Corporate bonds | 541,974 | | | (11,378) | | | 25,319 | | | (1,427) | | | 567,293 | | | (12,805) | |
| | | | | | | | | | | |
| | | | | | | | | | | |
| Asset-backed | 188,960 | | | (2,497) | | | — | | | — | | | 188,960 | | | (2,497) | |
| | | | | | | | | | | |
| Total | $ | 816,935 | | | (15,844) | | | 27,109 | | | (1,569) | | | 844,044 | | | (17,413) | |
The following table shows the gross unrealized losses and fair values of the Company's available-for-sale investments by investment category, and length of time the individual securities have been in a continuous unrealized loss position at December 31, 2020.
| | | | | | | | | | | | | | | | | | | | | | | | | | | | | | | | | | | |
| | Debt Securities Available-For-Sale |
| | Less than 12 Months | | 12 Months or Greater | | Total |
| Fair
Value | | Unrealized
Losses | | Fair
Value | | Unrealized
Losses | | Fair
Value | | Unrealized
Losses |
| | (In thousands) |
| | | | | | | | | | | |
| Debt securities: | | | | | | | | | | | |
| | | | | | | | | | | |
| | | | | | | | | | | |
| States and political subdivisions | $ | — | | | — | | | 1,762 | | | (86) | | | 1,762 | | | (86) | |
| | | | | | | | | | | |
| Public utilities | — | | | — | | | — | | | — | | | — | | | — | |
| Corporate bonds | 174,252 | | | (3,836) | | | 36,152 | | | (765) | | | 210,404 | | | (4,601) | |
| | | | | | | | | | | |
| Residential mortgage-backed | — | | | — | | | 500 | | | (156) | | | 500 | | | (156) | |
| | | | | | | | | | | |
| | | | | | | | | | | |
| | | | | | | | | | | |
| Total | $ | 174,252 | | | (3,836) | | | 38,414 | | | (1,007) | | | 212,666 | | | (4,843) | |
Unrealized losses increased in 2021 from 2020 amounts primarily as a result of an increase in market interest rate levels during 2021.
NATIONAL WESTERN LIFE GROUP, INC.
NOTES TO CONSOLIDATED FINANCIAL STATEMENTS
The amortized cost and fair value of investments in debt securities at December 31, 2021, by contractual maturity, are shown below. Expected maturities may differ from contractual maturities because borrowers may have the right to call or prepay obligations with or without call or prepayment penalties.
| | | | | | | | | | | |
| | Debt Securities Available-for-Sale |
| | Amortized Cost | | Fair Value |
| | (In thousands) |
| | | |
| Due in 1 year or less | $ | 256,576 | | | 258,754 | |
| Due after 1 year through 5 years | 3,198,107 | | | 3,353,853 | |
| Due after 5 years through 10 years | 2,205,479 | | | 2,355,857 | |
| Due after 10 years | 1,995,736 | | | 2,132,842 | |
| | 7,655,898 | | | 8,101,306 | |
| | | |
| Mortgage and asset-backed securities | 948,352 | | | 967,640 | |
| | | |
| Total before allowance for credit losses | 8,604,250 | | 9,068,946 |
| | | |
| Allowance for credit losses | — | | | — | |
| | | |
| Total | $ | 8,604,250 | | | 9,068,946 | |
The Company uses the specific identification method in computing realized gains and losses. The table below presents realized gains and losses for the periods indicated.
| | | | | | | | | | | | | | | | | |
| | Years Ended December 31, |
| | 2021 | | 2020 | | 2019 |
| | (In thousands) |
| | | | | |
| Available-for-sale debt securities: | | | | | |
| Realized gains on disposal | $ | 16,377 | | | 5,677 | | | 3,798 | |
| Realized losses on disposal | (5) | | | — | | | (1,011) | |
| Held-to-maturity debt securities: | | | | | |
| Realized gains on redemption | — | | | 12,734 | | | 4,390 | |
| Realized losses on redemption | — | | | (1) | | | — | |
| | | | | |
| Real estate | (1,421) | | | 2,661 | | | 6,911 | |
| Mortgage loans | — | | | — | | | — | |
| Other | (1) | | | — | | | — | |
| | | | | |
| Totals | $ | 14,950 | | | 21,071 | | | 14,088 | |
Disposals in the held-to-maturity category during the year ended December 31, 2020 represent calls initiated by the credit issuer of the debt security. At year-end 2020, the Company transferred all of its held-to-maturity debt securitiesencourage key employees to the available-for-sale category as a result of entering into a funds withheld reinsurance agreement effective December 31, 2020. The Company's policy was to initiate disposals of debt securities in the held-to-maturity category only in instances in which the credit status of the issuer came into question and the realization of all or a significant portion of the investment principal of the holding was deemed to be in jeopardy.
NATIONAL WESTERN LIFE GROUP, INC.
NOTES TO CONSOLIDATED FINANCIAL STATEMENTS
Except for the total U.S. government agency mortgage-backed securities held, the Company had no other investments in any entity in excess of 10.0% of stockholders' equity at December 31, 2021 or 2020.
As noted previously in this Note (2), the Company implemented accounting guidance as of January 1, 2020 for expected credit loss recognition of certain financial assets, which included debt securities classified in the held-to-maturity category. The Company employed a cohort cumulative loss rate method in estimating current expected credit losses ("CECL") with respect to its held-to-maturity debt securities. This method applied publicly available industry wide statistics of default incidence by defined segmentations of debt security investments combined with future assumptions regarding economic conditions (i.e. GDP forecasts) both in the near term and the long term. The Company utilized Moody's loss rates by industry type and credit ratings and applied them to each major bond category. These bond categories were further segmented by credit ratings and by maturities of two years and less and more than two years. The following table presents the allowance for credit losses for years ended December 31, 2021 and 2020.
| | | | | | | | | | | | | | | | | | | | | | | | | | | | | | | |
| December 31, | | | | | | |
| 2021 | | 2020 | | 2021 | | 2020 | | | | | | | | |
| | Debt Securities Held-to-Maturity | | Debt Securities Available-for- Sale | | | | | | | | |
| | (In thousands) |
| | | | | | | | | | | | | | | |
| Balance, beginning of period | $ | — | | | — | | | — | | | — | | | | | | | | | |
| Provision January 1, 2020 for adoption of new accounting guidance | — | | | 3,334 | | | — | | | — | | | | | | | | | |
| | | | | | | | | | | | | | | |
| (Releases)/provision during period | — | | | (3,334) | | | — | | | — | | | | | | | | | |
| | | | | | | | | | | | | | | | |
| Balance, end of period | $ | — | | | — | | | — | | | — | | | | | | | | | |
Since the Company reclassified all held-to-maturity debt securities to available-for-sale as of December 31, 2020, all provisions to the allowance for credit losses in 2020 were released as of the 2020 year-end.
The Company determines current expected credit losses for available-for-sale debt securities in accordance with FASB ASC Subtopic 326-30 when fair value is less than amortized cost, interest payments are missed and the security is experiencing credit issues. The Company performed additional analyses on certain available-for-sale securities whose market values were negatively impacted by the change in the economic environment precipitated by the COVID-19 pandemic crisis. Based on its reviews, the Company determined none of these investments required an allowance for credit loss at December 31, 2021 or December 31, 2020. Under the previous guidance, debt securities were not considered to be other-than-temporarily impaired when a decline in market value was attributable to factors such as market volatility, liquidity, spread widening and credit quality in which it was anticipated that a recovery of all amounts due under the contractual terms of the security would occur and the Company had the intent and ability to hold the security until recovery or maturity. There was a $7.8 million other-than-temporary impairment recorded on a single debt security during the year ended December 31, 2019. The Company's operating procedures include monitoring the investment portfolio on an ongoing basis for any changes in issuer facts and circumstances that might lead to future need for a credit loss allowance.
NATIONAL WESTERN LIFE GROUP, INC.
NOTES TO CONSOLIDATED FINANCIAL STATEMENTS
(D) Net Unrealized Gains (Losses)
Net unrealized gains (losses) on investment securities included in stockholders' equity at December 31, 2021 and 2020, are as follows:
| | | | | | | | | | | |
| | December 31, |
| | 2021 | | 2020 |
| | (In thousands) |
| | | |
| Gross unrealized gains | $ | 482,109 | | | 901,222 | |
| Gross unrealized losses | (17,413) | | | (4,843) | |
| Adjustments for: | | | |
| Deferred policy acquisition costs and sales inducements | (178,340) | | | (366,327) | |
| Deferred Federal income tax expense | (60,135) | | | (111,311) | |
| | | |
| | | |
| | | |
| | | |
| Net unrealized gains on investment securities | $ | 226,221 | | | 418,741 | |
(E) Transfer of Securities
In 2020, the Company reassessed its classification of its held-to-maturity portfolio as a result of a funds withheld coinsurance agreement entered into with a third party reinsurer. A portion of the transferred debt securities under the reinsurance agreement were added to a funds withheld account for which the reinsurer would provide investment management services and did not intend to hold the securities until maturity. The Company determined that its continued classification of held-to-maturity debt securities was not appropriate. As a result, the entire portfolio of debt securities held-to-maturity with a fair value of $7.3 billion and amortized value of $6.7 billion were transferred into the available-for-sale portfolio at December 31, 2020. The unrealized gains on securities of $0.6 billion were reclassified into accumulated other comprehensive income at December 31, 2020. There were 0 transfers in 2021 or 2019 between the held-to-maturity, available-for-sale, or trading portfolios.
(3) DERIVATIVE INVESTMENTS
Fixed-index products provide traditional fixed annuities and universal life contracts with the option to have credited interest rates linked in part to an underlying equity index or a combination of equity indices. The equity return component of such policy contracts is identified separately and accounted for in future policy benefits as embedded derivatives on the Consolidated Balance Sheets. The remaining portions of these policy contracts are considered the host contracts and are recorded separately as fixed annuity or universal life contracts. The host contracts are accounted for under debt instrument type accounting in which future policy benefits are recorded as discounted debt instruments and accreted, using the effective yield method, to their minimum account values at their projected maturities or termination dates.
The Company purchases over-the-counter index options, which are derivative financial instruments, to hedge the equity return component of its fixed-index annuity and life products. The index options act as hedges to match closely the returns on the underlying index or indices. The amounts which may be credited to policyholders are linked, in part, to the returns of the underlying index or indices. As a result, changes to policyholders' liabilities are substantially offset by changes in the value of the options. Cash is exchanged upon purchase of the index options and no principal or interest payments are made by either party during the option periods. Upon maturity or expiration of the options, cash may be paid to the Company depending on the performance of the underlying index or indices and terms of the contract.
NATIONAL WESTERN LIFE GROUP, INC.
NOTES TO CONSOLIDATED FINANCIAL STATEMENTS
The Company does not elect hedge accounting relative to these derivative instruments. The index options are reported at fair value in the accompanying Consolidated Financial Statements. The changes in the values of the index options and the changes in the policyholder liabilities are both reflected in the Consolidated Statements of Earnings. Any changes relative to the embedded derivatives associated with policy contracts are reflected in contract interest in the Consolidated Statements of Earnings. Any gains or losses from the sale or expiration of the options, as well as period-to-period changes in values, are reflected as net investment income in the Consolidated Statements of Earnings.
Although there is credit risk in the event of nonperformance by counterparties to the index options, the Company does not expect any of its counterparties to fail to meet their obligations, given their high credit ratings. In addition, credit support agreements are in place with all counterparties for option holdings in excess of specific limits, which may further reduce the Company's credit exposure.
Effective December 31, 2020, the Company entered into a coinsurance funds withheld reinsurance agreement under which identified assets are maintained in a funds withheld account. While the assets are withheld, the associated interest and credit risk of these assets are transferred to the reinsurer creating an embedded derivative on reinsurance in the funds withheld liability. Accordingly, the Company is required to bifurcate the embedded derivative from the host contract in accordance with GAAP. The bifurcated embedded derivative on reinsurance is computed as the fair value unrealized gain (loss) on the underlying funds withheld assets. This amount is included as a component of the funds withheld liability balance on the Consolidated Balance Sheets with changes in the embedded derivative on reinsurance reported in Net investment income (loss) in the Consolidated Statements of Earnings. Changes in the funds withheld liability are reported in operating activities in the Consolidated Statements of Cash Flows.
The tables below present the fair value of derivative instruments as of December 31, 2021 and 2020.
| | | | | | | | | | | | | | | | | | | | | | | |
| | December 31, 2021 |
| | Asset Derivatives | | Liability Derivatives |
| | Balance Sheet Location | | Fair Value | | Balance Sheet Location | | Fair Value |
| | | | (In thousands) | | | | (In thousands) |
| | | | | | | |
| Derivatives not designated as hedging instruments: | | | | | | | |
| Equity index options | Derivatives, Index Options | | $ | 101,622 | | | | | |
| | | | | | | |
| Fixed-index products | | | | | Universal Life and Annuity Contracts | | $ | 142,761 | |
| Embedded derivative on reinsurance contract | | | | | Funds Withheld Liability | | (84,725) | |
| | | | | | | |
| Total | | | $ | 101,622 | | | | | $ | 58,036 | |
NATIONAL WESTERN LIFE GROUP, INC.
NOTES TO CONSOLIDATED FINANCIAL STATEMENTS
| | | | | | | | | | | | | | | | | | | | | | | |
| | December 31, 2020 |
| | Asset Derivatives | | Liability Derivatives |
| | Balance Sheet Location | | Fair Value | | Balance Sheet Location | | Fair Value |
| | | | (In thousands) | | | | (In thousands) |
| | | | | | | |
| Derivatives not designated as hedging instruments: | | | | | | | |
| Equity index options | Derivatives, Index Options | | $ | 132,821 | | | | | |
| | | | | | | |
| Fixed-index products | | | | | Universal Life and Annuity Contracts | | $ | 161,351 | |
| | | | | | | |
| Total | | | $ | 132,821 | | | | | $ | 161,351 | |
The table below presents the effect of derivative instruments in the Consolidated Statements of Earnings for the years ended December 31, 2021, 2020 and 2019.
| | | | | | | | | | | | | | | | | | | | | | | | | | |
| | | | Amount of Gain or (Loss) Recognized In Income on Derivatives |
| Derivatives Not Designated as Hedging Instruments | | Location of Gain or (Loss) Recognized In Income on Derivatives | | 2021 | | 2020 | | 2019 |
| | | | | (In thousands) | | |
| | | | | | | | |
| Equity index options | | Net investment income | | $ | 120,718 | | | 14,754 | | | 123,207 | |
| | | | | | | | |
| Fixed-index products | | Universal life and annuity contract interest | | (133,327) | | | (44,970) | | | (91,424) | |
| Embedded derivative on reinsurance contract | | Net investment income | | 84,725 | | | — | | | — | |
| | | | | | | | |
| | | | | $ | 72,116 | | | (30,216) | | | 31,783 | |
The embedded derivative liability on fixed-index products, the change of which is recorded in universal life and annuity contract interest in the Consolidated Statements of Earnings, includes projected interest credits that are offset by the expected collectability by the Company of asset management fees on fixed-index products. The anticipated asset management fees assumed to be collected increases or decreases based upon the most recent performance of index options and adds to or reduces the offset applied to the embedded derivative liability (increasing or decreasing contract interest expense). In the years ended December 31, 2021, 2020, and 2019, the change in the embedded derivative liability due to the expected collectability of asset management fees increased/(decreased) contract interest expense by $6.5 million, $34.4 million, and $(33.6) million, respectively.
During 2020, the Company changed its budget for purchasing these options to match the collection of asset management fees with the payoff from out-of-the-money options, thereby removing the option premium previously being paid for the probability or expectation of collecting asset management fees ("out-of-the-money" hedging). During 2021, the remaining one-year options purchased under the prior method expired and have been replaced by out-of-the-money hedges, Accordingly, the embedded derivative liability component due to the projected collectability of asset management fees no longer exists.
NATIONAL WESTERN LIFE GROUP, INC.
NOTES TO CONSOLIDATED FINANCIAL STATEMENTS
(4) FAIR VALUES OF FINANCIAL INSTRUMENTS
For financial instruments the FASB provides guidance which defines fair value, establishes a framework for measuring fair value under GAAP, and requires additional disclosures about fair value measurements. In compliance with this GAAP guidance, the Company has categorized its financial instruments, based on the priority of the inputs to the valuation technique, into a three level hierarchy. The fair value hierarchy gives the highest priority to quoted prices in active markets for identical assets or liabilities ("Level 1") and the lowest priority to unobservable inputs ("Level 3"). If the inputs used to measure fair value fall within different levels of the hierarchy, the category level is based on the lowest priority level input that is significant to the fair value measurement of the instrument.
Financial assets and liabilities recorded at fair value on the Consolidated Balance Sheets are categorized as follows:
Level 1: Fair value is based on unadjusted quoted prices in active markets that are accessible to the Company for identical assets or liabilities. Active markets are those in which transactions for the asset or liability occur in sufficient frequency and volume to provide pricing information on an ongoing basis. These generally provide the most reliable evidence and are used to measure fair value whenever available. The Company's Level 1 assets are equity securities that are traded in an active exchange market. Valuations are obtained from readily available pricing sources for market transactions involving identical assets.
Level 2: Fair value is based upon significant inputs other than quoted prices in active markets included in Level 1, which are either directly or indirectly observable for substantially the full term of the asset or liability through corroboration with observable market data as of the reporting date. Level 2 inputs include quoted market prices in active markets for similar assets and liabilities, quoted market prices in markets that are not active for identical or similar assets or liabilities, model-derived valuations whose inputs are observable or whose significant value drivers are observable and other observable inputs. The Company’s Level 2 assets include fixed maturity debt securities (corporate and private bonds, government or agency securities, asset-backed and mortgage-backed securities). The Company's Level 2 liabilities include the embedded derivative on reinsurance. Valuations are generally obtained from third party pricing services for identical or comparable assets or determined through use of valuation methodologies using observable market inputs.
Level 3: Fair value is based on significant unobservable inputs which reflect the entity’s or third party pricing service’s assumptions about the assumptions market participants would use in pricing an asset or liability. The Company’s Level 3 assets are debt securities available-for-sale, trading securities, over-the-counter derivative contracts and mortgage loans. The Company’s Level 3 liabilities consist of share-based compensation obligations and certain equity-index product-related embedded derivatives. Valuations are estimated based on non-binding broker prices or internally developed valuation models or methodologies, discounted cash flow models and other similar techniques.
NATIONAL WESTERN LIFE GROUP, INC.
NOTES TO CONSOLIDATED FINANCIAL STATEMENTS
The following table sets forth the Company’s assets and liabilities that are measured at fair value on a recurring basis as of the date indicated.
| | | | | | | | | | | | | | | | | | | | | | | |
| | December 31, 2021 |
| | Total | | Level 1 | | Level 2 | | Level 3 |
| | (In thousands) |
| | | | | | | |
| Debt securities, available-for-sale | $ | 9,068,946 | | | — | | | 8,741,984 | | | 326,962 | |
| Debt securities, trading | 1,077,438 | | | — | | | 1,002,616 | | | 74,822 | |
| Equity securities | 28,217 | | | 23,795 | | | 4,422 | | | — | |
| Mortgage loans | 8,469 | | | — | | | — | | | 8,469 | |
| Derivatives, index options | 101,622 | | | — | | | — | | | 101,622 | |
| | | | | | | |
| | | | | | | |
| Total assets | $ | 10,284,692 | | | 23,795 | | | 9,749,022 | | | 511,875 | |
| | | | | | | |
Policyholder account balances (a) | $ | 142,761 | | | — | | | — | | | 142,761 | |
Other liabilities (b) | (76,856) | | | — | | | (84,725) | | | 7,869 | |
| | | | | | | |
| Total liabilities | $ | 65,905 | | | — | | | (84,725) | | | 150,630 | |
| | | | | | | | | | | | | | | | | | | | | | | |
| | December 31, 2020 |
| | Total | | Level 1 | | Level 2 | | Level 3 |
| | (In thousands) |
| | | | | | | |
| Debt securities, available-for-sale | $ | 10,770,923 | | | — | | | 10,770,923 | | | — | |
| Equity securities | 17,744 | | | 17,744 | | | — | | | — | |
| Derivatives, index options | 132,821 | | | — | | | — | | | 132,821 | |
| | | | | | | |
| | | | | | | |
| Total assets | $ | 10,921,488 | | | 17,744 | | | 10,770,923 | | | 132,821 | |
| | | | | | | |
Policyholder account balances (a) | $ | 161,351 | | | — | | | — | | | 161,351 | |
Other liabilities (c) | 6,202 | | | — | | | — | | | 6,202 | |
| | | | | | | |
| Total liabilities | $ | 167,553 | | | — | | | — | | | 167,553 | |
(a) Represents the fair value of certain product-related embedded derivatives that were recorded at fair value.
(b) Represents the liability for share-based compensation and the embedded derivative for funds withheld.
(c) Represents the liability for share-based compensation.
NATIONAL WESTERN LIFE GROUP, INC.
NOTES TO CONSOLIDATED FINANCIAL STATEMENTS
The following tables provide additional information about fair value measurements for which significant unobservable inputs (Level 3) were utilized to determine fair value.
| | | | | | | | | | | | | | | | | | | | | | | | | | | | | | | | | | | | | |
| December 31, 2021 |
| Assets | | |
| Debt Securities, Available-for-Sale | | Trading Securities | | Derivatives, Index Options | | Mortgage Loans | | Total Assets | | | | | | | | |
| | (In thousands) |
| | | | | | | | | | | | | | | | | |
| Beginning balance, January 1, 2021 | $ | — | | | — | | | 132,821 | | | — | | | 132,821 | | | | | | | | | |
| Total realized and unrealized gains (losses): | | | | | | | | | | | | | | | | | |
| Included in net earnings | — | | | 757 | | | 120,717 | | | 412 | | | 121,886 | | | | | | | | | |
| Included in other comprehensive income | 876 | | | — | | | — | | | — | | | 876 | | | | | | | | | |
| Purchases, sales, issuances and settlements, net: | | | | | | | | | | | | | | | | | |
| Purchases | 245,456 | | | 75,265 | | | 47,203 | | | 8,103 | | | 376,027 | | | | | | | | | |
| Sales | — | | | — | | | — | | | — | | | — | | | | | | | | | |
| Issuances | — | | | — | | | — | | | — | | | — | | | | | | | | | |
| Settlements | (13,031) | | | (1,200) | | | (199,119) | | | (46) | | | (213,396) | | | | | | | | | |
| Transfers into (out of) Level 3 | 93,661 | | | — | | | — | | | — | | | 93,661 | | | | | | | | | |
| | | | | | | | | | | | | | | | | |
| Balance at end of period | $ | 326,962 | | | 74,822 | | | 101,622 | | | 8,469 | | | 511,875 | | | | | | | | | |
| | | | | | | | | | | | | | | | | |
| Change in unrealized gains or losses for the period included in earnings (or changes in net assets) for assets/liabilities held at the end of the reporting period: | | | | | | | | | | | | | | | | | |
| Net investment income | — | | | 757 | | | 54,420 | | | 412 | | | 55,589 | | | | | | | | | |
| Benefits and expenses | — | | | — | | | — | | | — | | | — | | | | | | | | | |
| | | | | | | | | | | | | | | | | |
| Total | $ | — | | | 757 | | | 54,420 | | | 412 | | | 55,589 | | | | | | | | | |
NATIONAL WESTERN LIFE GROUP, INC.
NOTES TO CONSOLIDATED FINANCIAL STATEMENTS
| | | | | | | | | | | | | | | | | | | | | | | | | | | | | |
| | | | | | | | | | | December 31, 2021 |
| | | Other Liabilities |
| | | | | | | | | | | Policyholder Account Balances | | Share-based Comp | | | | Total Other Liabilities |
| | | | | | | | | | | | (In thousands) |
| | | | | | | | | | | | | | | | | |
| Beginning balance, January 1, 2021 | | | | | | | | | | | 161,351 | | | 6,202 | | | | | 167,553 | |
| Total realized and unrealized gains (losses): | | | | | | | | | | | | | | | | | |
| Included in net earnings | | | | | | | | | | | 133,326 | | | 5,581 | | | | | 138,907 | |
| Included in other comprehensive income | | | | | | | | | | | — | | | — | | | | | — | |
| Purchases, sales, issuances and settlements, net: | | | | | | | | | | | | | | | | | |
| Purchases | | | | | | | | | | | 47,203 | | | — | | | | | 47,203 | |
| Sales | | | | | | | | | | | — | | | — | | | | | — | |
| Issuances | | | | | | | | | | | — | | | 182 | | | | | 182 | |
| Settlements | | | | | | | | | | | (199,119) | | | (4,096) | | | | | (203,215) | |
| Transfers into (out of) Level 3 | | | | | | | | | | | — | | | — | | | | | — | |
| | | | | | | | | | | | | | | | | |
| Balance at end of period | | | | | | | | | | | $ | 142,761 | | | 7,869 | | | | | 150,630 | |
| | | | | | | | | | | | | | | | | |
| Change in unrealized gains or losses for the period included in earnings (or changes in net assets) for assets/liabilities held at the end of the reporting period: | | | | | | | | | | | | | | | | | |
| Net investment income | | | | | | | | | | | — | | | — | | | | | — | |
| Benefits and expenses | | | | | | | | | | | 54,420 | | | 5,581 | | | | | 60,001 | |
| | | | | | | | | | | | | | | | | |
| Total | | | | | | | | | | | $ | 54,420 | | | 5,581 | | | | | 60,001 | |
NATIONAL WESTERN LIFE GROUP, INC.
NOTES TO CONSOLIDATED FINANCIAL STATEMENTS
| | | | | | | | | | | | | | | | | | | | | | | | | | | | | | | | | | | | | | | | | |
| | | | December 31, 2020 |
| | | | Assets | | Other Liabilities |
| | | | | Derivatives, Index Options | | Total Assets | | Policyholder Account Balances | | Share-based Comp | | Contingent Consideration | | Total Other Liabilities |
| | | | | (In thousands) |
| | | | | | | | | | | | | | | |
| Beginning balance, January 1, 2020 | | | | | $ | 157,588 | | | 157,588 | | | 155,902 | | | 11,225 | | | 4,076 | | | 171,203 | |
| Total realized and unrealized gains (losses): | | | | | | | | | | | | | | | |
| Included in net earnings | | | | | 14,754 | | | 14,754 | | | 44,970 | | | (2,350) | | | (4,076) | | | 38,544 | |
| Included in other comprehensive income | | | | | — | | | — | | | — | | | — | | | — | | | — | |
| Purchases, sales, issuances and settlements, net: | | | | | | | | | | | | | | | |
| Purchases | | | | | 61,837 | | | 61,837 | | | 61,837 | | | — | | | — | | | 61,837 | |
| Sales | | | | | — | | | — | | | — | | | — | | | — | | | — | |
| Issuances | | | | | — | | | — | | | — | | | 164 | | | — | | | 164 | |
| Settlements | | | | | (101,358) | | | (101,358) | | | (101,358) | | | (2,837) | | | — | | | (104,195) | |
| Transfers into (out of) Level 3 | | | | | — | | | — | | | — | | | — | | | — | | | — | |
| | | | | | | | | | | | | | | |
| Balance at end of period | | | | | $ | 132,821 | | | 132,821 | | | 161,351 | | | 6,202 | | | — | | | 167,553 | |
| | | | | | | | | | | | | | | |
| Change in unrealized gains or losses for the period included in earnings (or changes in net assets) for assets/liabilities held at the end of the reporting period: | | | | | | | | | | | | | | | |
| Net investment income | | | | | $ | 70,984 | | | 70,984 | | | — | | | — | | | — | | | — | |
| Benefits and expenses | | | | | — | | | — | | | 70,984 | | | (2,350) | | | (4,076) | | | 64,558 | |
| | | | | | | | | | | | | | | |
| Total | | | | | $ | 70,984 | | | 70,984 | | | 70,984 | | | (2,350) | | | (4,076) | | | 64,558 | |
NATIONAL WESTERN LIFE GROUP, INC.
NOTES TO CONSOLIDATED FINANCIAL STATEMENTS
The following table presents the valuation method for financial assets and liabilities categorized as level 3, as well as the unobservable inputs used in the valuation of those financial instruments:
| | | | | | | | | | | | | | | | | | | | | | | |
| December 31, 2021 |
| Fair Value | | Valuation Technique | | Unobservable Input | | Range (Weighted Average) |
| (In thousands) | | | | | | |
| | | | | | | |
Assets: | | | | | | | |
Debt securities, available-for-sale | $ | 113,268 | | | Discounted cash flow | | Discount rate | | 2.40% - 6.14% (4.06%) |
Derivatives, index options | 101,622 | | | Broker prices | | Implied volatility | | 11.76% - 16.54% (14.55%) |
Mortgage loans | 8,469 | | | Discounted cash flow | | Spread | | 100 - 250 bps |
Total assets | $ | 223,359 | | | | | | | |
| | | | | | | |
Liabilities: | | | | | | | |
Policyholder account balances | $ | 142,761 | | | Deterministic cash flow model | | Projected option cost | | 0.03% - 14.49% (2.65%) |
Share based compensation | 7,869 | | | Black-Scholes model | | Expected term | | 1.9 to 10.0 years |
| | | | | Expected volatility | | 35.05% |
| | | | | | | |
| | | | | | | |
Total liabilities | $ | 150,630 | | | | | | | |
| | | | | | | | | | | | | | | | | | | | | | | |
| December 31, 2020 |
| Fair Value | | Valuation Technique | | Unobservable Input | | Range (Weighted Average) |
| (In thousands) | | | | | | |
| | | | | | | |
Assets: | | | | | | | |
Derivatives, index options | $ | 132,821 | | | Broker prices | | Implied volatility | | 12.96% - 53.69% (20.70%) |
| | | | | | | |
Total assets | $ | 132,821 | | | | | | | |
| | | | | | | |
Liabilities: | | | | | | | |
Policyholder account balances | $ | 161,351 | | | Deterministic cash flow model | | Projected option cost | | 0.0% - 45.04% (3.27%) |
Share based compensation | 6,202 | | | Black-Scholes model | | Expected term | | 1.0 to 9.9 years |
| | | | | Expected volatility | | 33.47% |
| | | | | | | |
Total liabilities | $ | 167,553 | | | | | | | |
NATIONAL WESTERN LIFE GROUP, INC.
NOTES TO CONSOLIDATED FINANCIAL STATEMENTS
The tables above exclude certain securities for which fair values are obtained and unadjusted from third party vendors. Realized gains (losses) on debt securities are reported in the Consolidated Statements of Earnings as net investment gains (losses) with liabilities reported as expenses. Unrealized gains (losses) on available-for-sale debt securities are reported as Other comprehensive income (loss) within the stockholders’ equity section of the Consolidated Balance Sheets. Unrealized gains (losses) on trading debt securities are reported in the Consolidated Statements of Earnings as Net investment income.
The fair value hierarchy classifications are reviewed each reporting period. Reclassification of certain financial assets and liabilities may result based on changes in the observability of valuation attributes. Reclassifications are reported as transfers into and out of Level 3remain at the beginning fair value for the reporting period in which the changes occur. During the fourth quarter of the year ended December 31, 2021, private placement and alternative structured securities included in debt securities available-for-saleCompany. All SARs were reclassified from Level 2 into Level 3 due to the unobservable inputs now included in their valuation.
GAAP defines fair value, establishes a framework for measuring fair value and requires additional disclosures about fair value measurements. Fair value is based on an exit price, which is the price that would be received to sell an asset or paid to transfer a liability in an orderly transaction between market participants at the measurement date. The objective of a fair value measurement is to determine that price for each financial instrument at each measurement date. GAAP also establishes a hierarchical disclosure framework which prioritizes and ranks the level of market price observability used in measuring financial instruments at fair value. Market price observability is affected by a variety of factors including the type of instrument and the characteristics of instruments. Financial instruments with readily available active quoted prices or those for which fair value can be measured from actively quoted prices generally will have a higher degree of market price observability and a lesser degree of judgment used in measuring fair value. It is the Company’s policy to maximize the use of observable inputs and minimize the use of unobservable inputs when developing fair value measures.
The following methods and assumptions were used in estimating the fair value of financial instruments and liabilities during the periods presented in the Consolidated Financial Statements.
Fixed maturity securities. Fair values for debt securities are based on quoted market prices, where available. For securities not actively traded, fair values are estimated using values obtained from various independent pricing services with any adjustments based upon observable data. In the cases where prices are unavailable for these sources, values are estimated by discounting expected future cash flows using a current market rate applicable to the yield, credit quality, and maturity of the investments.
Equity securities. Fair values for equity securities are based upon quoted market prices, where available. For equity securities that are not actively traded, estimated values are based on values of comparable issues or audited financial statements of the issuer.
Cash and cash equivalents. The carrying amounts reported in the Consolidated Balance Sheets for these instruments approximate their fair values due to the relatively short time between the purchase of the instrument and its expected repayment or maturity.
Mortgage and other loans. The fair values of performing mortgage and other loans are estimated by discounting scheduled cash flows through the scheduled maturities of the loans, using interest rates currently being offered for similar loans to borrowers with similar credit ratings. Fair values for significant nonperforming loans are based on recent internal or external appraisals. If appraisals are not available, estimated cash flows are discounted using a rate commensurate with the risk associated with the estimated cash flows. Assumptions regarding credit risk, cash flows, and discount rates are judgmentally determined using available market information and specific borrower information.
Policy Loans. Policy loans with fixed interest rates are classified within Level 3. The estimated fair values for these loans are determined using a discounted cash flow model applied to groups of similar policy loans determined by the nature of the underlying insurance liabilities. Cash flow estimates are developed by applying a weighted-average interest rate to the outstanding principal balance of the respective group of policy loans and an estimated average maturity. These cash flows are discounted using current risk-free interest rates with no adjustment for borrower credit risk as these loans are collateralized by the cash surrender value of the underlying insurance policy.
NATIONAL WESTERN LIFE GROUP, INC.
NOTES TO CONSOLIDATED FINANCIAL STATEMENTS
Derivatives. Fair values for index (call) options are based on counterparty market prices. The counterparties use market standard valuation methodologies incorporating market inputs for volatility and risk free interest rates in arriving at a fair value for each option contract. Prices are monitored for reasonableness by the Company using analytical tools. There are no performance obligations related to the call options purchased to hedge the Company’s fixed-index life and annuity policy liabilities. Fair values for embedded derivatives on reinsurance contracts are classified consistently with the underlying assets withheld under coinsurance funds withheld agreements, which were Level 2 fixed maturity securities. Valuations are obtained from third party pricing services for identical or comparable assets or determined through use of valuation methodologies using observable market inputs.
Life interest in Libbie Shearn Moody Trust. The fair value of the life interest asset is determined annually based on assumptions as to future distributions from the Trust over the life expectancy of Robert L. Moody, Sr., Chairman Emeritus of the Board of Directors of NWLGI. These estimated cash flows are discounted at a rate consistent with uncertainties relating to the amount and timing of future cash distributions subject to the maximum amount to be received by the Company from life insurance proceeds in the event of Mr. Moody's death. The carrying value or cost basis of the life interest asset is amortized ratably over the remaining expected life of Mr. Moody, updated for changes in expected mortality.
Annuity and supplemental contracts. Fair values for the Company's insurance contracts other than annuity contracts are not required to be disclosed. This includes the Company's traditional and universal life products. Fair values for immediate annuities without mortality features are based on the discounted future estimated cash flows using current market interest rates for similar maturities. Fair values for deferred annuities, including fixed-index annuities, are determined using estimated projected future cash flows discounted at the rate that would be required to transfer the liability in an orderly transaction. The fair values of liabilities under all insurance contracts are taken into consideration in the Company's overall management of interest rate risk, which minimizes exposure to changing interest rates through the matching of investment maturities with amounts due under insurance and annuity contracts.
Contingent consideration. The fair value of contingent consideration in the acquisition of businesses is valued using a probabilistic method that includes a discounted projection of renewal premiums.
The Company utilizes independent third-party pricing services to determine the majority of its fair values of investment securities. The independent pricing services provide quoted market prices when available or otherwise incorporate a variety of observable market data in their valuation techniques including reported trading prices, broker-dealer quotes, bids and offers, benchmark securities, benchmark yields, credit ratings, and other reference data. The Company reviews prices received from service providers for unusual fluctuations to ensure that the prices represent a reasonable estimate of fair value but generally accepts the price identified from the primary pricing service.
When quoted market prices in active markets are unavailable, the Company determines fair values using various valuation techniques and modelsgranted based on a range20-day average of observable market inputsthe Class A Stock closing price up to and including pricing models, quotedthe grant date. The Compensation Committee believes that SARs are inherently performance-based and a form of at-risk compensation since the recipient does not benefit unless the market price of publicly traded securities with similar duration and yield, time value, yield curve, prepayment speeds, default rates and discounted cash flow. In most cases, these estimates are determined based on independent third party valuation information, and the amounts are disclosed in Level 2 of the fair value hierarchy. Generally, the Company obtains a single price or quote per instrument from independent third parties to assist in establishing the fair value of these investments.
Fair value measurements for investment securities where there exists limited or no observable data are calculated using the Company’s own estimates based on current interest rates, credit spreads, liquidity premium or discount, the economic and competitive environment, unique characteristics of the security and other pertinent factors. These estimates are derived a number of ways including, but not limited to, pricing provided by brokers where the price indicates reliability as to value, fair values of comparable securities incorporating a spread adjustment (for maturity differences, credit quality, liquidity, and collateralization), discounted cash flow models and margin spreads, bond yield curves, and observable market prices and exchange transaction information not provided by external pricing services. The resulting prices may not be realized in an actual sale or immediate settlement and there may be inherent weaknesses in any calculation technique. In addition, changes in underlying assumptions used, including discount rates and estimates of future cash flows, could significantly affect the results of current or future values.
NATIONAL WESTERN LIFE GROUP, INC.
NOTES TO CONSOLIDATED FINANCIAL STATEMENTS
The following table presents, by pricing source and fair value hierarchy level, the Company’s assets that are measured at fair value on a recurring basis:
| | | | | | | | | | | | | | | | | | | | | | | |
| | December 31, 2021 |
| | Total | | Level 1 | | Level 2 | | Level 3 |
| | (In thousands) |
| | | | | | | |
| Debt securities, available-for-sale: | | | | | | | |
| Priced by third-party vendors | $ | 8,955,678 | | | — | | | 8,741,984 | | | 213,694 | |
| Priced internally | 113,268 | | | — | | | — | | | 113,268 | |
| Subtotal | 9,068,946 | | | — | | | 8,741,984 | | | 326,962 | |
| | | | | | | |
| Debt securities, trading: | | | | | | | |
| Priced by third-party vendors | 1,077,438 | | | — | | | 1,002,616 | | | 74,822 | |
| Priced internally | — | | | — | | | — | | | — | |
| Subtotal | 1,077,438 | | | — | | | 1,002,616 | | | 74,822 | |
| | | | | | | |
| Equity securities: | | | | | | | |
| Priced by third-party vendors | 28,217 | | | 23,795 | | | 4,422 | | | — | |
| Priced internally | — | | | — | | | — | | | — | |
| Subtotal | 28,217 | | | 23,795 | | | 4,422 | | | — | |
| | | | | | | |
| Mortgage loans: | | | | | | | |
| Priced by third-party vendors | — | | | — | | | — | | | — | |
| Priced internally | 8,469 | | | — | | | — | | | 8,469 | |
| Subtotal | 8,469 | | | — | | | — | | | 8,469 | |
| | | | | | | |
| Derivatives, index options: | | | | | | | |
| Priced by third-party vendors | 101,622 | | | — | | | — | | | 101,622 | |
| Priced internally | — | | | — | | | — | | | — | |
| Subtotal | 101,622 | | | — | | | — | | | 101,622 | |
| | | | | | | |
| | | | | | | |
| | | | | | | |
| | | | | | | |
| | | | | | | |
| | | | | | | |
| Total | $ | 10,284,692 | | | 23,795 | | | 9,749,022 | | | 511,875 | |
| | | | | | | |
| Percent of total | 100.0 | % | | 0.2 | % | | 94.8 | % | | 5.0 | % |
NATIONAL WESTERN LIFE GROUP, INC.
NOTES TO CONSOLIDATED FINANCIAL STATEMENTS
The carrying amounts and fair values of the Company's financial instruments are as follows:
| | | | | | | | | | | | | | | | | | | | | | | | | | | | | |
| December 31, 2021 |
| | | | Fair Value Hierarchy Level |
| Carrying
Values | | Fair
Values | | Level 1 | | Level 2 | | Level 3 |
| | (In thousands) |
| | | | | | | | | |
| ASSETS | | | | | | | | | |
| | | | | | | | | |
| Debt securities, available-for-sale | $ | 9,068,946 | | | 9,068,946 | | | — | | | 8,741,984 | | | 326,962 | |
| | | | | | | | | |
| Debt securities, trading | 1,077,438 | | | 1,077,438 | | | — | | | 1,002,616 | | | 74,822 | |
| Cash and cash equivalents | 714,624 | | | 714,624 | | | 702,632 | | | 11,992 | | | — | |
| Mortgage loans | 487,304 | | | 513,246 | | | — | | | — | | | 513,246 | |
| Real estate | 28,606 | | | 47,027 | | | — | | | — | | | 47,027 | |
| Policy loans | 71,286 | | | 110,492 | | | — | | | — | | | 110,492 | |
| Other loans | 24,266 | | | 25,085 | | | — | | | — | | | 25,085 | |
| Derivatives, index options | 101,622 | | | 101,622 | | | — | | | — | | | 101,622 | |
| Equity securities | 28,217 | | | 28,217 | | | 23,795 | | | 4,422 | | | — | |
| Life interest in Libbie Shearn Moody Trust | 8,254 | | | 12,775 | | | — | | | — | | | 12,775 | |
| Other investments | 4,537 | | | 24,876 | | | — | | | — | | | 24,876 | |
| | | | | | | | | |
| LIABILITIES | | | | | | | | | |
| Deferred annuity contracts | $ | 6,463,314 | | | 4,703,331 | | | — | | | — | | | 4,703,331 | |
| Immediate annuity and supplemental contracts | 422,209 | | | 457,787 | | | — | | | — | | | 457,787 | |
| | | | | | | | | |
NATIONAL WESTERN LIFE GROUP, INC.
NOTES TO CONSOLIDATED FINANCIAL STATEMENTS
| | | | | | | | | | | | | | | | | | | | | | | | | | | | | |
| December 31, 2020 |
| | | | Fair Value Hierarchy Level |
| Carrying
Values | | Fair
Values | | Level 1 | | Level 2 | | Level 3 |
| | (In thousands) |
| | | | | | | | | |
| ASSETS | | | | | | | | | |
| | | | | | | | | |
| Debt securities, available-for-sale | $ | 10,770,923 | | | 10,770,923 | | | — | | | 10,770,923 | | | — | |
| | | | | | | | | |
| Cash and cash equivalents | 581,059 | | | 581,059 | | | 581,059 | | | — | | | — | |
| Mortgage loans | 332,521 | | | 348,175 | | | — | | | — | | | 348,175 | |
| Real Estate | 33,783 | | | 48,577 | | | — | | | — | | | 48,577 | |
| Policy loans | 74,083 | | | 121,260 | | | — | | | — | | | 121,260 | |
| Other loans | 23,396 | | | 23,691 | | | — | | | — | | | 23,691 | |
| Derivatives, index options | 132,821 | | | 132,821 | | | — | | | — | | | 132,821 | |
| Equity Securities | 17,744 | | | 17,744 | | | 17,744 | | | — | | | — | |
| Life interest in Libbie Shearn Moody Trust | 9,083 | | | 12,775 | | | — | | | — | | | 12,775 | |
| Other investments | 4,513 | | | 22,580 | | | — | | | — | | | 22,580 | |
| | | | | | | | | |
| LIABILITIES | | | | | | | | | |
| Deferred annuity contracts | $ | 6,662,730 | | | 5,192,663 | | | — | | | — | | | 5,192,663 | |
| Immediate annuity and supplemental contracts | 412,526 | | | 467,538 | | | — | | | — | | | 467,538 | |
Fair value estimates are made at a specific point in time based on relevant market information and information about the financial instruments. These estimates do not reflect any premium or discount that could result from offering for sale at one time the Company's entire holdings of a particular financial instrument. Because no market exists for a portion of the Company's financial instruments, fair value estimates are based on judgments regarding future expected loss experience, current economic conditions, risk characteristics of various financial instruments, and other factors. These estimates are subjective in nature and involve uncertainties and matters of significant judgment and therefore cannot be determined with precision. Changes in assumptions could significantly affect the estimates.
(5) REINSURANCE
National Western reinsures the risk on any one life in excess of $500,000. Total life insurance in force was $15.0 billion and $15.9 billion at December 31, 2021 and 2020, respectively. Of these amounts, life insurance in force totaling $3.3 billion and $3.5 billion was ceded to reinsurance companies on a yearly renewable term basis at December 31, 2021 and 2020, respectively. In accordance with these reinsurance contracts, reinsurance receivables, including amounts related to claims incurred but not reported and liabilities for future policy benefits, totaled $31.6 million and $8.6 million at December 31, 2021 and 2020, respectively. Premiums and contract revenues were reduced by $22.0 million, $21.0 million and $21.1 million for reinsurance premiums ceded during 2021, 2020 and 2019, respectively. Benefit expenses were reduced by $44.2 million, $8.4 million and $22.0 million, for reinsurance recoveries during 2021, 2020 and 2019, respectively.
NATIONAL WESTERN LIFE GROUP, INC.
NOTES TO CONSOLIDATED FINANCIAL STATEMENTS
In addition to the above, on December 31, 2020, National Western entered into a Funds Withheld Coinsurance Agreement ("FWC Agreement") with Prosperity Life Assurance Limited ("Prosperity"), an unauthorized reinsurer organized under the Laws of Bermuda. Under the FWC Agreement, National Western ceded, on a coinsurance with funds withheld basis, a 100% quota share of contractual statutory reserve liabilities approximating $1.7 billion pertaining to a group of in force fixed rate and payout annuity contracts issued by the Company on or before December 31, 2020, and paid to Prosperity a ceding commission of $48.0 million. At December 31, 2020, the Company held a reinsurance recoverable of $1.7 billion under the Agreement. The annuity statutory reserve liabilities that have been ceded to Prosperity are secured by the funds withheld assets and a comfort trust established by Prosperity under which National Western is the sole beneficiary. The funds withheld assets and the assets in the trust are required to remain at a value prescribed under the FWC Agreement which is sufficient to support the current balance of policy benefit liabilities of the ceded business on a statutory basis. If the value of the funds withheld assets and the comfort trust account assets were ever to be less than the prescribed amount under the FWC Agreement, Prosperity is required to deposit funds into the trust for the amount of any shortfall. At December 31, 2021, the current balance of policy benefit liabilities ceded on a statutory basis was $1.5 billion.
At December 31, 2020, the Company recorded as an asset on the Consolidated Balance Sheet a deferred cost of reinsurance amount of $102.8 million associated with the funds withheld reinsurance transaction. This represents the amount of assets transferred at the closing date of the FWC Agreement (debt securities, policy loans, and cash) in excess of the GAAP liability ceded to Prosperity. This balance is amortized as a component of benefits and expenses commensurate with the runoff of the ceded block of funds withheld business. Amortization expense for the year ended December 31, 2021 was $13.2 million.
Ozark National generally reinsures the risk on any one life in excess of $200,000. Total life insurance in force was $5.9 billion and $6.0 billion at December 31, 2021 and 2020, respectively. Of this amount, life insurance in force totaling $0.5 billion and $0.5 billion was ceded to reinsurance companies at December 31, 2021 and 2020, respectively. In accordance with the reinsurance contracts, reinsurance receivables, including amounts related to claims incurred but not reported and liabilities for future policy benefits, totaled $32.4 million and $33.1 million at December 31, 2021 and 2020, respectively. Premiums and contract revenues were reduced by $2.8 million and $2.7 million for reinsurance premiums ceded during 2021 and 2020, respectively. Benefit expenses were reduced by $2.4 million and $2.6 million for reinsurance recoveries during 2021 and 2020, respectively.
A contingent liability exists with respect to reinsurance, as the Company remains liable if the reinsurance companies are unable to perform and meet their obligations under the existing agreements. The Company does not assume reinsurance but Ozark National maintains a closed block of assumed reinsurance.
As discussed in Note (1) Summary of Significant Accounting Policies, the Company adopted ASU 2016-13 pertaining to the recognition and measurement of credit losses on most financial assets. For a reinsurance agreement to qualify for reinsurance accounting, it must meet certain risk transfer conditions that include the possibility of financial loss by the assuming reinsurer. The Company records, among other items, amounts recoverable under reinsurance agreements which is a financial asset subject to the credit loss requirements of ASU 2016-13. The Company's credit loss analysis included historical loss information, historical credit rating data, and existing collateral arrangements to estimate expected credit losses over the life of the reinsurance recoverable assets and determined that an allowance was not required at December 31, 2021 or 2020.
NATIONAL WESTERN LIFE GROUP, INC.
NOTES TO CONSOLIDATED FINANCIAL STATEMENTS
(6) DEFERRED TRANSACTION COSTS
Deferred transaction costs include deferred policy acquisition costs (DPAC), deferred sales inducements (DSI), value of business acquired (VOBA), and cost of reinsurance (COR).
A summary of information related to DPAC is provided in the following table:
| | | | | | | | | | | | | | | | | |
| | Years Ended December 31, |
| | 2021 | | 2020 | | 2019 |
| | (In thousands) |
| | | | | |
| Balance, beginning of year | $ | 382,080 | | | 723,972 | | | 841,704 | |
| Deferrals | 77,306 | | | 69,857 | | | 64,824 | |
| Amortization, net of interest: | | | | | |
| Amortization, excluding unlocking, net of interest | (84,349) | | | (107,917) | | | (117,748) | |
| Unlocking | 36,510 | | | (22,358) | | | 8,643 | |
| | | | | |
| Adjustments related to unrealized gains (losses) | 158,292 | | | (261,186) | | | (73,451) | |
| Reinsurance | — | | | (20,288) | | | — | |
| | | | | |
| Balance, end of year | $ | 569,839 | | | 382,080 | | | 723,972 | |
NATIONAL WESTERN LIFE GROUP, INC.
NOTES TO CONSOLIDATED FINANCIAL STATEMENTS
A summary of information related to DSI is provided in the following table:
| | | | | | | | | | | | | | | | | |
| | Years Ended December 31, |
| | 2021 | | 2020 | | 2019 |
| (In thousands) |
| | | | | |
| Balance, beginning of year | $ | 43,845 | | | 104,359 | | | 133,714 | |
| Deferrals | 18,118 | | | 10,344 | | | 3,160 | |
| Amortization, net of interest: | | | | | |
| Amortization, excluding unlocking, net of interest | (14,755) | | | (18,363) | | | (19,714) | |
| Unlocking | 993 | | | (4,445) | | | (641) | |
| | | | | |
| Adjustments related to unrealized gains (losses) | 29,935 | | | (43,557) | | | (12,160) | |
| Reinsurance | — | | | (4,493) | | | — | |
| | | | | |
| Balance, end of year | $ | 78,136 | | | 43,845 | | | 104,359 | |
A summary of information related to VOBA is provided in the following table:
| | | | | | | | | | | | | | | | | |
| | Years Ended December 31, |
| | 2021 | | 2020 | | 2019 |
| (In thousands) |
| | | | | |
| Balance, beginning of year | $ | 162,968 | | | 138,071 | | | — | |
| Business acquired | — | | | — | | | 145,768 | |
| Other increase | — | | | 35,125 | | | — | |
| Amortization: | | | | | |
| Amortization, excluding unlocking | (8,469) | | | (10,228) | | | (7,697) | |
| | | | | |
| | | | | |
| Balance as of end of year | $ | 154,499 | | | 162,968 | | | 138,071 | |
During the year ended December 31, 2020, the cash value of certain acquired reserves was increased which resulted in a commensurate increase in both the traditional life reserve liability and the related VOBA balance reported on the Consolidated Balance Sheets.
Estimated future amortization of VOBA, net of interest (in thousands), as of December 31, 2021, is as follows:
| | | | | |
| 2022 | $ | 8,075 | |
| 2023 | 7,757 | |
| 2024 | 7,464 | |
| 2025 | 7,289 | |
| 2026 | 7,162 | |
NATIONAL WESTERN LIFE GROUP, INC.
NOTES TO CONSOLIDATED FINANCIAL STATEMENTS
A summary of information related to COR is provided in the following table:
| | | | | | | | | | | | | | | | | |
| | Years Ended December 31, |
| | 2021 | | 2020 | | 2019 |
| (In thousands) |
| | | | | |
| Balance, beginning of year | $ | 102,840 | | | — | | | — | |
| Additions | — | | | 102,840 | | | — | |
| Amortization | (13,154) | | | — | | | — | |
| | | | | |
| Balance as of end of year | $ | 89,686 | | | 102,840 | | | — | |
(7) GOODWILL AND SPECIFICALLY IDENTIFIABLE INTANGIBLE ASSETS
Goodwill
The changes in the carrying amount of goodwill were as follows:
| | | | | | | | | | | | | | | | | |
| | Years Ended December 31, |
| | 2021 | | 2020 | | 2019 |
| | (In thousands) |
| | | | | |
| Gross goodwill as of beginning of year | $ | 13,864 | | | 13,864 | | | — | |
| Goodwill resulting from business acquisition | — | | | — | | | 13,864 | |
| Gross goodwill, before impairments | 13,864 | | | 13,864 | | | 13,864 | |
| Accumulated impairment as of beginning of year | — | | | — | | | — | |
| Current year impairments | — | | | — | | | — | |
| | | | | |
| Net goodwill as of end of year | $ | 13,864 | | | 13,864 | | | 13,864 | |
NATIONAL WESTERN LIFE GROUP, INC.
NOTES TO CONSOLIDATED FINANCIAL STATEMENTS
Due to the severe change in economic climate during 2021 and 2020 as a result of the COVID-19 pandemic, the Company periodically evaluated the goodwill balance for potential impairment and determined that there was sufficient evidence to support not impairing the balance.
Identifiable Intangible Assets
The gross carrying amounts and accumulated amortization for each specifically identifiable intangible asset were as follows.
| | | | | | | | | | | | | | | | | | | | | | | | | | | | | |
| December 31, 2021 | | December 31, 2020 |
| Weighted-Average Amortization Period | | Gross Carrying Amount | | Accumulated Amortization | | Gross Carrying Amount | | Accumulated Amortization |
| | | (In thousands) |
| | | | | | | | | |
| Trademarks/trade names | 15 | | $ | 2,800 | | | (545) | | | 2,800 | | | (358) | |
| Internally developed software | 7 | | 3,800 | | | (1,583) | | | 3,800 | | | (1,040) | |
| Insurance licenses | N/A | | 3,000 | | | — | | | 3,000 | | | — | |
| | | | | | | | | |
| | | $ | 9,600 | | | (2,128) | | | 9,600 | | | (1,398) | |
The value of trademarks was estimated using the relief from royalty method, based on the assumption that in lieu of ownership, an organization would be willing to pay a royalty in order to receive the related benefits of using the brand. The value of insurance licenses was estimated using the market approach to value, based on values paid for licenses in recent shell company transactions. The value of internally developed software was estimated using the replacement cost method. Trademarks, trade names and internally developed software are amortized using a straight-line method over their estimated useful lives. These intangibles assets will be evaluated for impairment if indicators of impairment arise. Insurance licenses were determined to have an indefinite useful life. The Company evaluates the useful life of the insurance licenses at each reporting period to determine whether the useful life remains indefinite.
As of December 31, 2021, expected amortization expenses relating to purchased intangible assets for each of the next 5 years and thereafter is as follows:
| | | | | |
| Expected |
| Amortization |
| (In thousands) |
| |
| 2022 | $ | 730 | |
| 2023 | $ | 730 | |
| 2024 | $ | 730 | |
| 2025 | $ | 730 | |
| 2026 | $ | 232 | |
| Thereafter | $ | 1,320 | |
| |
| $ | 4,472 | |
NATIONAL WESTERN LIFE GROUP, INC.
NOTES TO CONSOLIDATED FINANCIAL STATEMENTS
(8) SEGMENT AND OTHER OPERATING INFORMATION
(A) Operating Segment Information
The Company defines its reportable operating segments as domestic life insurance, international life insurance, annuities, and ONL and Affiliates (previously referred to as "Acquired Businesses"). These segments are organized based on product types, geographic marketing areas, and business groupings. Ozark National and NIS have been combined into the segment given its inter-related marketing and sales approach which consists of a coordinated sale of a non-participating whole life insurance product (Ozark National) and a mutual fund investment product (NIS). A fifth category "All Others" primarily includes investments and earnings of non-operating subsidiaries as well as other remaining investments and assets not otherwise supporting specific segment operations. In accordance with GAAP guidance for segment reporting, the Company excludes or segregates realized investment gains and losses.
A summary of segment information is provided below.
| | | | | | | | | | | | | | | | | | | | | | | | | | | | | | | | | | | |
| | Domestic Life Insurance | | International Life Insurance | | Annuities | | ONL & Affiliates | | All Others | | Totals |
| | (In thousands) |
| | | | | | | | | | | |
| 2021: | | | | | | | | | | | |
| Selected Balance Sheet Items: | | | | | | | | | | | |
| Deferred transaction costs | $ | 150,688 | | | 152,340 | | | 423,318 | | | 165,814 | | | — | | | 892,160 | |
| Total segment assets | 1,791,017 | | | 975,942 | | | 9,187,610 | | | 1,115,380 | | | 356,716 | | | 13,426,665 | |
| Future policy benefits | 1,537,482 | | | 749,537 | | | 6,843,457 | | | 782,511 | | | — | | | 9,912,987 | |
| Other policyholder liabilities | 20,950 | | | 14,268 | | | 82,650 | | | 16,470 | | | — | | | 134,338 | |
| Funds withheld liability | — | | | — | | | 1,485,267 | | | — | | | — | | | 1,485,267 | |
| | | | | | | | | | | |
| Condensed Income Statements: | | | | | | | | | | | |
| Premiums and contract revenues | $ | 51,294 | | | 79,085 | | | 16,809 | | | 77,109 | | | — | | | 224,297 | |
| Net investment income | 90,006 | | | 52,227 | | | 368,234 | | | 26,989 | | | 25,074 | | | 562,530 | |
| Other revenues | 105 | | | 95 | | | 5,374 | | | 12,654 | | | 4,086 | | | 22,314 | |
| | | | | | | | | | | |
| Total revenues | 141,405 | | | 131,407 | | | 390,417 | | | 116,752 | | | 29,160 | | | 809,141 | |
| | | | | | | | | | | |
| Life and other policy benefits | 24,416 | | | 26,481 | | | 67,515 | | | 69,165 | | | — | | | 187,577 | |
| Amortization of deferred transaction costs | 9,580 | | | (11,118) | | | 61,881 | | | 9,118 | | | — | | | 69,461 | |
| Universal life and annuity contract interest | 77,246 | | | 31,696 | | | 104,242 | | | — | | | — | | | 213,184 | |
| Other operating expenses | 26,959 | | | 19,679 | | | 53,817 | | | 20,244 | | | 5,913 | | | 126,612 | |
| Federal income taxes | 656 | | | 13,249 | | | 21,094 | | | 3,675 | | | 4,762 | | | 43,436 | |
| Total expenses | 138,857 | | | 79,987 | | | 308,549 | | | 102,202 | | | 10,675 | | | 640,270 | |
| | | | | | | | | | | |
| Segment earnings | $ | 2,548 | | | 51,420 | | | 81,868 | | | 14,550 | | | 18,485 | | | 168,871 | |
NATIONAL WESTERN LIFE GROUP, INC.
NOTES TO CONSOLIDATED FINANCIAL STATEMENTS
| | | | | | | | | | | | | | | | | | | | | | | | | | | | | | | | | | | |
| | Domestic Life Insurance | | International Life Insurance | | Annuities | | ONL & Affiliates | | All Others | | Totals |
| | (In thousands) |
| | | | | | | | | | | |
| 2020: | | | | | | | | | | | |
| Selected Balance Sheet Items: | | | | | | | | | | | |
| Deferred transaction costs | $ | 94,100 | | | 124,480 | | | 302,397 | | | 170,756 | | | — | | | 691,733 | |
| Total segment assets | 3,242,794 | | | 1,034,280 | | | 7,976,588 | | | 1,117,509 | | | 382,149 | | | 13,753,320 | |
| Future policy benefits | 1,337,174 | | | 798,952 | | | 7,028,860 | | | 768,433 | | | — | | | 9,933,419 | |
| Other policyholder liabilities | 16,378 | | | 11,086 | | | 94,049 | | | 16,967 | | | — | | | 138,480 | |
| Funds withheld liability | — | | | — | | | 1,697,591 | | | — | | | — | | | 1,697,591 | |
| | | | | | | | | | | |
| Condensed Income Statements: | | | | | | | | | | | |
| Premiums and contract revenues | $ | 53,834 | | | 88,167 | | | 17,025 | | | 78,921 | | | — | | | 237,947 | |
| Net investment income | 54,516 | | | 27,273 | | | 290,576 | | | 26,383 | | | 18,454 | | | 417,202 | |
| Other revenues | 58 | | | 67 | | | 43 | | | 10,118 | | | 8,236 | | | 18,522 | |
| | | | | | | | | | | |
| Total revenues | 108,408 | | | 115,507 | | | 307,644 | | | 115,422 | | | 26,690 | | | 673,671 | |
| | | | | | | | | | | |
| Life and other policy benefits | 18,471 | | | 14,084 | | | 31,043 | | | 67,739 | | | — | | | 131,337 | |
| Amortization of deferred transaction costs | 17,661 | | | 24,929 | | | 87,133 | | | 10,780 | | | — | | | 140,503 | |
| Universal life and annuity contract interest | 44,782 | | | (2,087) | | | 163,555 | | | — | | | — | | | 206,250 | |
| Other operating expenses | 25,730 | | | 17,829 | | | 36,870 | | | 18,454 | | | 5,701 | | | 104,584 | |
| Federal income taxes (benefit) | 265 | | | 9,143 | | | (1,649) | | | 4,413 | | | 3,159 | | | 15,331 | |
| Total expenses | 106,909 | | | 63,898 | | | 316,952 | | | 101,386 | | | 8,860 | | | 598,005 | |
| | | | | | | | | | | |
| Segment earnings (loss) | $ | 1,499 | | | 51,609 | | | (9,308) | | | 14,036 | | | 17,830 | | | 75,666 | |
NATIONAL WESTERN LIFE GROUP, INC.
NOTES TO CONSOLIDATED FINANCIAL STATEMENTS
| | | | | | | | | | | | | | | | | | | | | | | | | | | | | | | | | | | |
| | Domestic Life Insurance | | International Life Insurance | | Annuities | | ONL & Affiliates | | All Others | | Totals |
| | (In thousands) |
| | | | | | | | | | | |
| 2019: | | | | | | | | | | | |
| Selected Balance Sheet Items: | | | | | | | | | | | |
| Deferred transaction costs | $ | 127,557 | | | 209,858 | | | 486,553 | | | 142,434 | | | — | | | 966,402 | |
| Total segment assets | 1,399,818 | | | 1,153,105 | | | 8,198,730 | | | 978,243 | | | 362,900 | | | 12,092,796 | |
| Future policy benefits (1) | 1,198,103 | | | 870,461 | | | 7,366,894 | | | 706,513 | | | — | | | 10,141,971 | |
| Other policyholder liabilities | 18,016 | | | 14,903 | | | 80,002 | | | 14,686 | | | — | | | 127,607 | |
| | | | | | | | | | | |
| Condensed Income Statements: | | | | | | | | | | | |
| Premiums and contract revenues | $ | 45,709 | | | 99,417 | | | 20,317 | | | 74,526 | | | — | | | 239,969 | |
| Net investment income | 77,672 | | | 47,004 | | | 380,357 | | | 22,593 | | | 27,866 | | | 555,492 | |
| Other revenues | 313 | | | 86 | | | (34) | | | 8,445 | | | 8,676 | | | 17,486 | |
| | | | | | | | | | | |
| Total revenues | 123,694 | | | 146,507 | | | 400,640 | | | 105,564 | | | 36,542 | | | 812,947 | |
| | | | | | | | | | | |
| Life and other policy benefits | 18,948 | | | 17,064 | | | 41,487 | | | 59,843 | | | — | | | 137,342 | |
| Amortization of deferred transaction costs | 11,797 | | | 17,593 | | | 79,064 | | | 8,348 | | | — | | | 116,802 | |
| Universal life and annuity contract interest | 69,849 | | | 48,561 | | | 176,920 | | | — | | | — | | | 295,330 | |
| Other operating expenses | 20,376 | | | 19,447 | | | 35,699 | | | 17,056 | | | 11,980 | | | 104,558 | |
| Federal income taxes | 561 | | | 9,024 | | | 13,888 | | | 3,700 | | | 5,056 | | | 32,229 | |
| Total expenses | 121,531 | | | 111,689 | | | 347,058 | | | 88,947 | | | 17,036 | | | 686,261 | |
| | | | | | | | | | | |
| Segment earnings | $ | 2,163 | | | 34,818 | | | 53,582 | | | 16,617 | | | 19,506 | | | 126,686 | |
(1) Revised for an adjustment to reserve liabilities of $15.0 million. Refer to Note (1).
NATIONAL WESTERN LIFE GROUP, INC.
NOTES TO CONSOLIDATED FINANCIAL STATEMENTS
Reconciliations of segment information to the Company's Consolidated Financial Statements are provided below.
| | | | | | | | | | | | | | | | | |
| | Years Ended December 31, |
| | 2021 | | 2020 | | 2019 |
| | (In thousands) |
| | | | | |
Premiums and Other Revenue: | | | | | |
| Premiums and contract revenues | $ | 224,297 | | | 237,947 | | | 239,969 | |
| Net investment income | 562,530 | | | 417,202 | | | 555,492 | |
| Other revenues | 22,314 | | | 18,522 | | | 17,486 | |
| Realized gains on investments | 14,950 | | | 21,071 | | | 6,241 | |
| | | | | |
| Total consolidated premiums and other revenue | $ | 824,091 | | | 694,742 | | | 819,188 | |
| | | | | | | | | | | | | | | | | |
| | Years Ended December 31, |
| | 2021 | | 2020 | | 2019 |
| | (In thousands) |
| | | | | |
Federal Income Taxes: | | | | | |
| Total segment Federal income taxes | $ | 43,436 | | | 15,331 | | | 32,229 | |
| Taxes on realized gains on investments | 3,140 | | | 4,425 | | | 1,311 | |
| | | | | |
| Total consolidated Federal income taxes | $ | 46,576 | | | 19,756 | | | 33,540 | |
| | | | | | | | | | | | | | | | | |
| | Years Ended December 31, |
| | 2021 | | 2020 | | 2019 |
| | (In thousands) |
| | | | | |
Net Earnings: | | | | | |
| Total segment earnings | $ | 168,871 | | | 75,666 | | | 126,686 | |
| Realized gains on investments, net of taxes | 11,810 | | | 16,646 | | | 4,930 | |
| | | | | |
| Total consolidated net earnings | $ | 180,681 | | | 92,312 | | | 131,616 | |
| | | | | | | | | | | | | | | | | |
| | December 31, |
| | 2021 | | 2020 | | 2019 |
| | (In thousands) |
| | | | | |
Assets: | | | | | |
| Total segment assets | $ | 13,426,665 | | | 13,753,320 | | | 12,092,796 | |
| Other unallocated assets | 903,524 | | | 894,950 | | | 460,651 | |
| | | | | |
| Total consolidated assets | $ | 14,330,189 | | | 14,648,270 | | | 12,553,447 | |
NATIONAL WESTERN LIFE GROUP, INC.
NOTES TO CONSOLIDATED FINANCIAL STATEMENTS
(B) Geographic Information
A portion of the Company's premiums and contract revenues are from international policies with residents of countries other than the United States. Premiums and contract revenues detailed by country are provided below.
| | | | | | | | | | | | | | | | | |
| | Years Ended December 31, |
| | 2021 | | 2020 | | 2019 |
| | (In thousands) |
| | | | | |
| United States | $ | 156,614 | | | 165,233 | | | 156,330 | |
| Brazil | 20,535 | | | 22,190 | | | 24,975 | |
| Taiwan | 10,954 | | | 11,433 | | | 12,054 | |
| Peru | 8,635 | | | 9,167 | | | 10,127 | |
| Venezuela | 8,560 | | | 9,949 | | | 11,763 | |
| Colombia | 6,505 | | | 7,313 | | | 8,110 | |
| Other foreign countries | 37,330 | | | 36,348 | | | 40,229 | |
| | | | | |
| Revenues, excluding reinsurance premiums | 249,133 | | | 261,633 | | | 263,588 | |
| Reinsurance premiums | (24,836) | | | (23,686) | | | (23,619) | |
| | | | | |
| Total premiums and contract revenues | $ | 224,297 | | | 237,947 | | | 239,969 | |
Premiums and contract revenues are attributed to countries based on the location of the policyholder. All premiums from international policies are renewal premiums. The Company has no significant assets, other than certain limited financial instruments, located in countries other than the United States.
(C) Major Agency Relationships
A portion exceeding 10% of National Western's annual annuity sales has been sold through one or more of its top independent marketing agencies in recent years. Business from 3 top agencies accounted for approximately 11%, 11%, and 10%, respectively, of annuity sales in 2021. In 2021, 1 domestic independent marketing agency exceeded 10% of total Domestic Life sales accounting for 58%. Ozark National did not have a single distributor accounting for 10% or more of its sales in 2021.
(9) STATUTORY INFORMATION
Domiciled in Colorado, National Western prepares its statutory financial statements in accordance with accounting practices prescribed or permitted by the Colorado Division of Insurance, while Ozark National, domiciled in Missouri, follows the accounting practices prescribed or permitted by the Missouri Department of Commerce and Insurance. These insurance departments have adopted the provisions of the National Association of Insurance Commissioners' ("NAIC") Statutory Accounting Practices (“SSAP”) as the basis for its statutory accounting practices.
The following are major differences between GAAP and SSAP.
1. The Company accounts for universal life and annuity contracts based on the provisions of GAAP. The basic difference between GAAP and SSAP with respect to certain long-duration contracts is that deposits for universal life and annuity contracts are not reflected as revenues, and surrenders and certain other benefit payments are not reflected as expenses. Only contracts with no insurance risk qualify for such treatment under statutory accounting practices. For all other contracts, SSAP does reflect such items as revenues and expenses.
NATIONAL WESTERN LIFE GROUP, INC.
NOTES TO CONSOLIDATED FINANCIAL STATEMENTS
A summary of direct premiums and deposits collected is provided below.
| | | | | | | | | | | | | | | | | |
| | Years Ended December 31, |
| | 2021 | | 2020 | | 2019 |
| | (In thousands) |
| | | | | |
| Annuity deposits | $ | 462,632 | | | 358,900 | | | 264,667 | |
| Universal life insurance deposits | 270,717 | | | 267,809 | | | 266,600 | |
| Traditional life and other premiums | 96,429 | | | 98,711 | | | 95,695 | |
| | | | | |
| Totals | $ | 829,778 | | | 725,420 | | | 626,962 | |
2. SSAP requires commissions and related acquisition costs to be expensed as incurred, whereas under GAAP these items are deferred and amortized.
3. For SSAP, liabilities for future policy benefits for life insurance policies are calculated by the net level premium method, the commissioners reserve valuation method, or principles-based reserving under VM-20. Future policy benefit liabilities for annuities are calculated based on the continuous commissioners annuity reserve valuation method and provisions of Actuarial Guidelines 33 and 35.
4. Deferred Federal income taxes are provided for temporary differences which are recognized in the Consolidated Financial Statements in a different period than for Federal income tax purposes. Deferred taxes are also recognized under SSAP; however, there are limitations as to the amount of deferred tax assets that may be reported as admitted assets. The change in the deferred taxes is recorded directly in surplus, rather than as a component of income tax expense.
5. For SSAP, debt securities are recorded at amortized cost, except for securities in or near default, which are reported at fair value. Under GAAP, debt securities are carried at amortized cost or fair value based on their classification as either held-to-maturity, available-for-sale, or trading.
6. Investments in subsidiaries are recorded as affiliated common stock investments at their respective SSAP investment value under statutory accounting, whereas the financial statements of the subsidiaries have been consolidated with those of the Company under GAAP.
7. The asset valuation reserve and interest maintenance reserve, which are investment valuation reserves prescribed by SSAP, have been eliminated, as they are not required under GAAP.
NATIONAL WESTERN LIFE GROUP, INC.
NOTES TO CONSOLIDATED FINANCIAL STATEMENTS
8. The table below provides the National Western and Ozark National net gain from operations, net income, unassigned surplus (retained earnings) and capital and surplus (stockholders' equity), on the statutory basis used to report to regulatory authorities for the years ended December 31.
| | | | | | | | | | | | | | | | | |
| | 2021 | | 2020 | | 2019 |
| | (In thousands) |
| | | | | |
| National Western Life Insurance Company: | | | | | |
| Net gain from operations before Federal and foreign income taxes | $ | 85,440 | | | 1,423 | | | 209,139 | |
| | | | | |
| Net income | $ | 63,476 | | | 6,487 | | | 151,316 | |
| | | | | |
| Unassigned surplus | $ | 1,536,112 | | | 1,461,100 | | | 1,485,424 | |
| | | | | |
| Capital and surplus | $ | 1,580,176 | | | 1,505,163 | | | 1,529,487 | |
| | | | | |
| Ozark National Life Insurance Company: | | | | | |
| Net gain from operations before Federal and foreign income taxes | $ | 23,103 | | | 24,976 | | | 22,870 | |
| | | | | |
| Net income | $ | 28,183 | | | 20,966 | | | (854) | |
| | | | | |
| Unassigned surplus | $ | 77,806 | | | 50,054 | | | 29,452 | |
| | | | | |
| Capital and surplus | $ | 105,761 | | | 78,009 | | | 58,404 | |
(10) EARNINGS PER SHARE
Basic earnings per share of common stock are computed by dividing net earnings available to each class of common stockholders on an as if distributed basis by the weighted-average number of common shares outstanding for the period. Diluted earnings per share, by definition, reflects the potential dilution that could occur if securities or other contracts to issue common stock were exercised or converted into common stock or resulted in the issuance of common stock, that then shared in the distributed earnings of each class of common stock. U.S. GAAP requires a two-class presentation for the Company’s 2 classes of common stock (refer to Note (13) Information Regarding Controlling Stockholder). The Company currently has no share-based compensation awards outstanding that could be redeemed for shares of common stock.
NATIONAL WESTERN LIFE GROUP, INC.
NOTES TO CONSOLIDATED FINANCIAL STATEMENTS
Net earnings for the periods shown below are allocated between Class A shares and Class B shares based upon (1) the proportionate number of shares issued and outstanding as of the end of the period, and (2) the per share dividend rights of the 2 classes under the Company's Restated Certificate of Incorporation (the Class B dividend per share is equal to one-half the Class A dividend per share).
| | | | | | | | | | | | | | | | | | | | | | | | | | | | | | | | | | | |
| | Years Ended December 31, |
| | 2021 | | 2020 | | 2019 |
| | Class A | | Class B | | Class A | | Class B | | Class A | | Class B |
| | (In thousands except per share amounts) |
| | | | | | | | | | | |
| Numerator for Basic and Diluted Earnings Per Share: | | | | | | | | | | | |
| Net earnings | $ | 180,681 | | | | | 92,312 | | | | | 131,616 | | | |
| Dividends – Class A shares | (1,237) | | | | | (1,237) | | | | | (1,237) | | | |
| Dividends – Class B shares | (36) | | | | | (36) | | | | | (36) | | | |
| | | | | | | | | | | |
| Undistributed earnings | $ | 179,408 | | | | | 91,039 | | | | | 130,343 | | | |
| | | | | | | | | | | |
| Allocation of net earnings: | | | | | | | | | | | |
| Dividends | $ | 1,237 | | | 36 | | | 1,237 | | | 36 | | | 1,237 | | | 36 | |
| Allocation of undistributed earnings | 174,334 | | | 5,074 | | | 88,464 | | | 2,575 | | | 126,657 | | | 3,686 | |
| | | | | | | | | | | |
| Net earnings | $ | 175,571 | | | 5,110 | | | 89,701 | | | 2,611 | | | 127,894 | | | 3,722 | |
| | | | | | | | | | | |
| Denominator: | | | | | | | | | | | |
| Basic earnings per share - weighted-average shares | 3,436 | | | 200 | | | 3,436 | | | 200 | | | 3,436 | | | 200 | |
| Effect of dilutive stock options | — | | | — | | | — | | | — | | | — | | | — | |
| | | | | | | | | | | |
| Diluted earnings per share - adjusted weighted-average shares for assumed conversions | 3,436 | | | 200 | | | 3,436 | | | 200 | | | 3,436 | | | 200 | |
| | | | | | | | | | | |
| Basic earnings per share | $ | 51.10 | | | 25.55 | | | 26.11 | | | 13.05 | | | 37.22 | | | 18.61 | |
| | | | | | | | | | | |
| Diluted earnings per share | $ | 51.10 | | | 25.55 | | | 26.11 | | | 13.05 | | | 37.22 | | | 18.61 | |
(11) COMPREHENSIVE INCOME
GAAP guidance requires that all items recognized under accounting standards as components of comprehensive income (loss) be reported in a financial statement that is displayed with the same prominence as other financial statements. This guidance requires that an enterprise (a) classify items of other comprehensive income by their nature in a financial statement and (b) display the accumulated balance of other comprehensive income (loss) separately from retained earnings and additional paid-in capital in the equity section of a statement of financial position. This guidance affects the Company's reporting presentation of certain items such as foreign currency translation adjustments, unrealized gains and losses on investment securities, and benefit plan liabilities. These items are reflected as components of other comprehensive income (loss), net of taxes, as reported in the accompanying Consolidated Financial Statements.
NATIONAL WESTERN LIFE GROUP, INC.
NOTES TO CONSOLIDATED FINANCIAL STATEMENTS
Components of other comprehensive income (loss) for 2021, 2020 and 2019 and the related tax effect are detailed below.
| | | | | | | | | | | | | | | | | |
| | Amounts Before Taxes | | Tax (Expense)
Benefit | | Amounts Net of Taxes |
| | (In thousands) |
| | | | | |
| 2021: | | | | | |
| Unrealized gains (losses) on securities, net of effects of deferred costs of $187,987: | | | | | |
| Net unrealized holding gains (losses) arising during the period | $ | (227,325) | | | 47,738 | | | (179,587) | |
| | | | | |
| Reclassification adjustment for net (gains) losses included in net earnings | (16,372) | | | 3,438 | | | (12,934) | |
| | | | | |
| | | | | |
| Net unrealized gains (losses) on securities | (243,697) | | | 51,176 | | | (192,521) | |
| | | | | |
| Foreign currency translation adjustments | (20) | | | 4 | | | (16) | |
| Benefit plan liability adjustment | 16,543 | | | (3,474) | | | 13,069 | |
| | | | | |
| Other comprehensive income (loss) | $ | (227,174) | | | 47,706 | | | (179,468) | |
| | | | | | | | | | | | | | | | | |
| | Amounts Before Taxes | | Tax (Expense) Benefit | | Amounts Net of Taxes |
| | (In thousands) |
| | | | | |
| 2020: | | | | | |
| Unrealized gains (losses) on securities, net of effects of deferred costs of $(304,955): | | | | | |
| Net unrealized holding gains (losses) arising during the period | $ | 446,280 | | | (93,719) | | | 352,561 | |
| Unrealized liquidity gains (losses) | 8 | | | (2) | | | 6 | |
| Reclassification adjustment for net (gains) losses included in net earnings | (5,677) | | | 1,192 | | | (4,485) | |
| | | | | |
| | | | | |
| Net unrealized gains (losses) on securities | 440,611 | | | (92,529) | | | 348,082 | |
| | | | | |
| Foreign currency translation adjustments | 18 | | | (4) | | | 14 | |
| Benefit plan liability adjustment | (16,182) | | | 3,398 | | | (12,784) | |
| | | | | |
| Other comprehensive income (loss) | $ | 424,447 | | | (89,135) | | | 335,312 | |
NATIONAL WESTERN LIFE GROUP, INC.
NOTES TO CONSOLIDATED FINANCIAL STATEMENTS
| | | | | | | | | | | | | | | | | |
| | Amounts Before Taxes | | Tax (Expense) Benefit | | Amounts Net of Taxes |
| | (In thousands) |
| | | | | |
| 2019: | | | | | |
| Unrealized gains (losses) on securities, net of effects of deferred costs of $(85,609): | | | | | |
| Net unrealized holding gains (losses) arising during the period | $ | 122,726 | | | (25,772) | | | 96,954 | |
| Unrealized liquidity gains (losses) | 4 | | | (1) | | | 3 | |
| Reclassification adjustment for net (gains) losses included in net earnings | 5,060 | | | (1,063) | | | 3,997 | |
| | | | | |
| | | | | |
| Net unrealized (losses) gains on securities | 127,790 | | | (26,836) | | | 100,954 | |
| | | | | |
| Foreign currency translation adjustments | 663 | | | (139) | | | 524 | |
| Benefit plan liability adjustment | (5,513) | | | 1,158 | | | (4,355) | |
| | | | | |
| Other comprehensive income (loss) | $ | 122,940 | | | (25,817) | | | 97,123 | |
(12) STOCKHOLDERS' EQUITY
(A) Changes in Common Stock Shares Outstanding
Changes in shares of common stock outstanding are provided below.
| | | | | | | | | | | | | | | | | |
| | Years Ended December 31, |
| | 2021 | | 2020 | | 2019 |
| | (In thousands) |
| | | | | |
| Common stock shares outstanding: | | | | | |
| Shares outstanding at beginning of year | $ | 3,636 | | | 3,636 | | | 3,636 | |
| Shares exercised under stock option plan | — | | | — | | | — | |
| | | | | |
| Shares outstanding at end of year | $ | 3,636 | | | 3,636 | | | 3,636 | |
(B) Dividend Restrictions
National Western is restricted by state insurance laws as to dividend amounts which may be paid to stockholders without prior approval from the Colorado Division of Insurance. The restrictions are based on the lesser of statutory earnings from operations, excluding capital gains, or 10% of statutory surplus as of the previous year-end. Under these guidelines, the maximum dividend payment which may be made without prior approval in 2022 is $64.4 million. As the sole owner of NWLIC, all dividends declared by National Western are payable entirely to NWLGI and are eliminated in consolidation. National Western did not declare or pay cash dividends to NWLGI during the years ended December 31, 2021 and 2020.
NATIONAL WESTERN LIFE GROUP, INC.
NOTES TO CONSOLIDATED FINANCIAL STATEMENTS
Ozark National is similarly restricted under the state insurance laws of Missouri as to dividend amounts which may be paid to stockholders without prior approval to the greater of 10% of the statutory surplus of the company from the preceding year-end or the company's net gain from operations, excluding capital gains, from the prior calendar year. Based upon this restriction, the maximum dividend payment which may be made in 2022 without prior approval is $18.6 million. All dividends declared by Ozark National are payable entirely to NWLIC as the sole owner and are eliminated in consolidation. Ozark National did not declare or pay cash dividends to NWLIC during the years ended December 31, 2021 and 2020.
NIS is restricted under FINRA rules as to maximum dividend amounts that can be paid out to stockholders. Maximum allowable dividend amounts are determined based on calculations which require that certain net capital thresholds be maintained after dividends are paid out. Under these guidelines, the maximum dividend payment which may be made as of December 31, 2021 was $8.6 million. In the year ended December 31, 2020, NIS made dividend payments of $1.4 million to NWLGI which were eliminated in consolidation. NaN dividends were declared or paid in the year ended December 31, 2021.
On October 22, 2021, the Board of Directors of NWLGI declared a cash dividend to stockholders on record as of November 5, 2021 which was paid December 1, 2021. The dividends approved were $0.36 per common share to Class A stockholders and $0.18 per common share to Class B stockholders. A dividend in the same amounts per share on Class A and Class B shares was declared in October 2020 and paid in December of 2020.
(C) Regulatory Capital Requirements
The Colorado Division of Insurance and Missouri Department of Commerce and Insurance impose minimum risk-based capital requirements on insurance companies that were developed by the National Association of Insurance Commissioners ("NAIC"). The formulas for determining the amount of risk-based capital ("RBC") specify various weighting factors that are applied to statutory financial balances or various levels of activity based on the perceived degree of risk. Regulatory compliance is determined by a ratio of a company's regulatory total adjusted capital to its authorized control level RBC, as defined by the NAIC. Companies below specific trigger points or ratios are classified within certain levels, each of which requires specified corrective action. National Western's current authorized control level RBC of $120.6 million is significantly below its regulatory total adjusted capital of $1.7 billion. In addition, Ozark National's regulatory total adjusted capital of $109.3 million is also materially greater than its current authorized control level RBC of $7.8 million.
(D) Share-Based Payments
Effective June 20, 2008, the Company's shareholders approved a 2008Amended Incentive Plan (“2008 Plan”) which provided for the grant of any or all of the following types of awards to eligible employees: (1) stock options, including incentive stock options and nonqualified stock options; (2) stock appreciation rights ("SARs"), in tandem with stock options or freestanding; (3) restricted stock or restricted stock units; and (4) performance awards. The number of shares of Class A, $1.00 par value, common stock which were allowed to be issued under the plan, or as to which SARs or other awards were allowed to be granted, could not exceed 300,000. This plan was assumed by NWLGI from National Western pursuant to the terms of the holding company reorganization in 2015. On June 15, 2016, stockholders of NWLGI approved an amended and restated 2008 Plan ("Incentive Plan"), which extended the term of the 2008 Plan for ten years from the date of stockholder approval. The Incentive Planalso includes additional provisions most notably regarding the definition of performance objectives which could be used in the issuance of the fourth type of award noted above (performance awards).
All of the employees of the Company and its subsidiaries are eligible to participate in the current Incentive Plan. In addition, directors of the Company are eligible to receive the same types of awards as employees except that they are not eligible to receive incentive stock options. Company directors, including members of the Compensation and Stock Option Committee, are eligible for nondiscretionary stock options. SARs granted prior to 2016 vest 20% annually following three years of service following the grant date. Employee SARs granted in 2016 and forward vest 33.3% annually following one year of service from the date of the grant. Directors' SARs grants vest 20% annually following one year of service from the date of grant.
NATIONAL WESTERN LIFE GROUP, INC.
NOTES TO CONSOLIDATED FINANCIAL STATEMENTS
performance awards. The Incentive Plan allows for certain other share or unit awards which are solely paid out in cash based on the value of the
Company'sCompany’s shares, or changes therein, as well as the financial performance of the Company under
pre-determined target performance
metrics.metrics predetermined by the Compensation Committee. Certain awards, such as
restricted stock units ("RSUs")RSUs, provide solely for cash settlement based upon the market price
(as defined) of the
Company's Class A
common shares,Stock, often referred to as
"phantom“phantom stock-based
awards" in equity compensation plans.awards.” Unlike share-settled awards, which have a fixed grant-date fair value, the fair value of unsettled or unvested liability awards is remeasured at the end of each reporting period based on the change in
the fair value of a share. The liability and corresponding expense are adjusted accordingly until the award is settled.
For employees,Other awards may involve PSUs. PSU awards specify a target number of PSUs for each recipient and have a three-year cliff vesting schedule, subject to certain limited exceptions permitting earlier vesting. The number of PSUs that vests varies based upon the three-year compound annual growth rate (“CAGR”) in our GAAP book value, with a range of three-year book value CAGRs, and corresponding percentages of target PSUs that may vest, being predetermined by the Compensation Committee and set forth in each recipient’s PSU award agreement. Upon vesting, earned PSUs are settled in cash based on the average per share closing price of Class A Stock on the twenty trading days up to and including the vesting
perioddate.
The Compensation Committee is responsible for RSUs is 100% atdetermining the endrecipients of three yearsthe grants, when the grants should be made, and the number of shares, rights, or units to be granted. The size of the awards generally reflect each officer’s position relative to other officers in the Company with consideration to total compensation targets obtained from the peer group information previously discussed. In addition, as is the case with base salaries, the Compensation Committee considers the grant date.recommendations of Mr. Moody and Mr. Perez for other officers who directly or indirectly report to them.
On October 8, 2023, the Company entered into an Agreement and Plan of Merger (the “Merger Agreement”) with S. USA Life Insurance Company, Inc. (“S.USA”) and its wholly owned subsidiary, PHG Merger Inc. (“Merger Sub”). When the transactions contemplated by the Merger Agreement are completed, Merger Sub will merge into the Company (the “Merger”). The Company will serve the Merger as a wholly owned subsidiary of S.USA. The Merger Agreement contains a number of restrictions on the Company’s operations between the signing of the Merger Agreement and the closing of the transaction. Among those limitations were restrictions on the Company’s ability to grant equity-linked awards like SARs, PSUs, and RSUs. As a result, the Company did not grant any SARs, PSUs, or RSUs granted prior to 2019 were paidour Named Executive Officers or any other employees during the regular grant period in cash atDecember 2023. The only exception to this statement is that Ross R. Moody, who also serves a director, received the vestingsame grant of 217 RSUs in June 2023 that all of our directors received. Those RSUs had a grant date equal tovalue of $83,384, which was based on the $384.26 closing price of the Company's Class ACompany’s common sharestock on the date of grant.
Retirement and Other Benefits
NWLIC’s executive officers are eligible to participate in the health and welfare, 401(k), and defined benefit retirement benefit plans that are offered to other company employees (NWLIC’s qualified defined benefit pension plan was frozen as of December 31, 2007). In addition, if eligible, executive officers may participate in the following plans:
Group Excess Benefit Plan
Company officers at the senior vice president level and above, including Named Executive Officers, are eligible to participate in a group excess benefit plan which supplements NWLIC’s core medical insurance plan. Administered by ANICO, the group excess benefit plan provides coverage for co-pays, deductibles, and other out-of-pocket expenses not covered by the core medical insurance plan. Offering such a plan to the selected company officer levels is viewed as a key component of the overall compensation strategy for attracting and retaining talented executive officers. The benefits provided to each Named Executive Officer are reported in the “All Other Compensation Column” of the Summary Compensation Table.
Non-Qualified Deferred Compensation Plan
This plan allows NWLIC senior officers, including Named Executive Officers, to defer payment of a percentage of their compensation and to provide for up to a 2% matching and 2% profit sharing contribution on plan compensation that exceeds certain qualified plan limits, and an additional NWLIC discretionary matching contribution of up to 2% of plan compensation. Company contributions are subject to a vesting schedule based upon each officer’s years of service. Benefit information associated with this plan is disclosed in the Non-Qualified Deferred Compensation table below, and NWLIC contributions are included in the “All Other Compensation” column in the Summary Compensation Table.
Non-Qualified Defined Benefit Plan for the President of NWLIC
Similar to the immediately preceding plan, this plan specifically covers NWLIC’s former President, Mr. Ross R. Moody, and is intended to provide retirement benefits that comply with the American Jobs Creation Act of 2004. Mr. Moody’s benefits associated with this plan are disclosed in the Pension Benefits table in the Pension Benefits section.
Special Considerations for Pension-Related Amounts Reported in the Summary Compensation Table
It is important to note that amounts reported in the “Changes in Pension Value and Non-Qualified Deferred Compensation Earnings” column of the Summary Compensation Table below are not the result of any decision to increase or decrease pay. For each of the NEOs, the amount reported in such column includes the year-over-year change in accrued pension benefits under our frozen defined benefit pension plans. Such change is influenced by variables outside of the Company’s control, including interest rates, mortality factors, and the age of each individual.
Postretirement Benefits
The Company’s basic health plan and group excess benefit plan have a provision for individuals serving in the positions of Chairman of the Board or President for seven years or more subsequent to 1980 to continue to receive lifetime health benefits for themselves and their dependents upon retirement. Mr. Ross R. Moody currently meets this eligibility criteria.
Perquisites and Other Personal Benefits
The Compensation Committee periodically reviews executive officer perquisites and other benefits based upon information supplied to it by NWLIC’s Human Resources, Legal, and Financial departments. In addition to base salaries and annual and long-term bonus incentives, the Company provides its executive officers with certain and varying perquisites and benefits.
The perquisites and personal benefits provided to each Named Executive Officer are reported in the “All Other Compensation Column” of the Summary Compensation Table below and are described in further detail in the footnotes to that table.
Stock Ownership Guidelines
The Company does not require that its executive officers or directors be stockholders. The Compensation Committee is satisfied that the long-term incentive compensation offered to directors and officers in the form of SARs, RSUs, and PSUs adequately aligns this group’s interest with those of the Company’s stockholders.
Anti-Hedging Policy
Our Insider Trading Policy prohibits our officers, employees, and directors from engaging in hedging or monetization transactions with respect to our stock that are designed to or have the effect of hedging or offsetting any decreases in the market value of such stock, such as zero-cost collars and forward sale contracts. Such transactions are prohibited because when our officers, employees, and directors own our stock without the full risks of ownership, they may no longer have the same objectives as our other stockholders.
Employment Agreements
The Company does not generally utilize employment agreements with its executive officers or other employees. The Company’s practice has been to issue offer letters to executive officer candidates when recruited to their positions. In addition to outlining the executive officer’s responsibilities, each offer letter specifies the beginning base salary and eligibility for any additional compensation programs overseen by the Compensation Committee. Except for the change in control agreements with our Named Executive Officers described below, as of December 31, 2023, the Company does not have any contractual obligations to its Named Executive Officers for severance payments in connection with any termination or change-in-control.
In December 2021, we entered into a Change in Control & Severance Agreement with Ross R. Moody, with a two-year term. The term of this agreement was renewed for an additional two years with the term now scheduled to expire on December 16, 2025. However, following any change in control, the term of the agreement ends on the third anniversary of such change in control. The agreement also terminates upon Mr. Moody’s earlier death or incapacity. Pursuant to this agreement, Mr. Moody is eligible to receive certain severance benefits, including enhanced severance benefits, if there is a qualifying termination of employment within three years anniversary date. RSUs grantedfollowing a change in control.
Also in 2019, and afterwe entered into Change in Control Agreements with our Named Executive Officers other than Mr. Moody. The term of each of such agreements ends on the second anniversary of a “change in control,” as defined in the agreements, unless the agreement is earlier terminated pursuant to its terms. Under these agreements, the Named Executive Officers other than Mr. Moody are payableeligible to receive certain severance benefits if there is a qualifying termination of employment within two years following a change in cash atcontrol. Such agreements do not provide for any payments or benefits in connection with a termination of employment in the three years vesting date equal to the 20-day moving average closing priceabsence of a change in control.
See below under “Potential Payments Upon Termination or Change in Control” for a description of the Company's Class A common shareseverance benefits each of the Named Executive Officers would have been eligible to receive as of December 31, 2023 had his or her employment terminated at thatsuch time.
Other awards may involve performance share units ("PSUs") which are units granted atThe Compensation Committee has not formally adopted a specified dollar amount per unit, typically linkedpolicy with respect to whether retroactive adjustments to any form of compensation paid under arrangements for executive officers will be made where the Company's Class A common share price,prior payment was related to financial results of the Company that are subsequently multipliedrestated. However, beginning in 2021, the Compensation Committee authorized the addition of a clawback provision to the Company’s SAR award agreements for such year and that provision continued to apply in SAR award agreements for 2022. Such clawback provision provides that in the event of a restatement of the Company’s previously issued financial statements, the Compensation Committee will review the circumstances regarding the restatement and all performance-based compensation awarded to the holder that is attributable to performance during the time periods restated. If the Compensation Committee determines that (1) the restatement is required due to the failure of the Company’s management to act reasonably and (2) the holder received more compensation than he or she would have received absent the restated financial statements, then the Compensation Committee will take action to recoup any such excess compensation. We will also implement the incentive compensation “clawback” provisions required by the Dodd-Frank Wall Street Reform and Consumer Protection Act of 2010 as the method of their implementation becomes finalized under applicable SEC rules.
Tax and Accounting Treatment of Compensation
Section 162(m) of the Internal Revenue Code precludes us, as a public company, from taking a tax deduction for individual compensation to certain of our executive officers in excess of $1 million, subject to certain exemptions. Prior to 2018, Section 162(m) excluded performance-based compensation from the $1 million limit. However, the Tax Cuts and Jobs Act, enacted in December 2017, amended Section 162(m) and eliminated this exclusion, subject to certain exemptions. The Compensation Committee believes tax deductibility of compensation is an attained performance factorimportant consideration and continues to deriveconsider the implications of legislative changes to section 162(m).
However, the Compensation Committee also believes that it is important to retain flexibility in designing compensation programs. As a result, the Compensation Committee has not adopted a policy that any particular amount of compensation must be deductible to the Company under section 162(m). In addition, effective as of December 2022, the Board of Directors amended the Amended Incentive Plan to remove various provisions from the plan that had addressed the performance-based compensation exclusion requirements that are no longer part of Section 162(m).
The Company accounts for long-term incentive compensation in the form of stock options (if any), SARs, RSUs, and PSUs to executive officers under generally accepted accounting principles (“GAAP”) guidance which requires the Company to estimate and expense each award of equity compensation over the service period of the award. Other accounting guidance requires that cash compensation be recorded as an expense at the time the obligation is accrued.
Equity Compensation Plan Information at December 31, 2023
| Plan Category | | Number of securities to be issued upon exercise of outstanding options, warrants and rights (#) (a) | | Weighted-average exercise price of outstanding options, warrants and rights ($) (b) | | Number of securities remaining available for future issuance under equity compensation plans (excluding securities reflected in column (a)) (#) (c) |
| | | | | | |
| Equity compensation plans approved by security holders | | — | | — | | 291,000 |
| | | | | | |
| Equity compensation plans not approved by security holders | | — | | — | | — |
| Total | | — | | — | | 291,000 |
As of December 31, 2023, a total of 291,000 shares of Class A Stock were authorized for issuance upon the settlement or exercise, as applicable, of awards granted pursuant to the Amended Incentive Plan. However, as of December 31, 2023, there were no outstanding stock options. Furthermore, under the terms of all outstanding SARs, RSUs and PSUs, all such awards may be settled only in cash. Accordingly, no shares of Class A Stock are issuable under the terms of such awards.
Under the terms of the Amended Incentive Plan approved by the Company’s stockholders in June 2016, the 291,000 share limitation is a limit on the number of shares of Class A Stock that may be issued under the Amended Incentive Plan, but not necessarily a limit on the shares that can be subject to outstanding awards at any given time. For example, the Amended Incentive Plan provides that awards that may be settled or exercised solely for cash (as with all currently outstanding SARs, RSUs, and PSUs) will not reduce the number of shares of Class A Stock that may be issued under the Amended Incentive Plan.
Compensation Committee Report
The Compensation Committee has reviewed each element of executive officer compensation and believes that the compensation philosophy and practices are designed to serve the best interests of the Company and its stockholders. The Compensation Committee also believes that the compensation of the Company’s executive officers is both appropriate and consistent with the objectives set by this committee.
The Compensation Committee has reviewed and discussed the Compensation Discussion and Analysis set forth above with the Company’s management. Based on its reviews and discussions, the Compensation Committee approved and recommended to the Company’s Board of Directors that the Compensation Discussion and Analysis be included in this Amended Filing.
Submitted by the Compensation Committee of the Board of Directors
Dr. Thomas A. Blackwell, Chairman
David S. Boone
Stephen E. Glasgow
E. J. Pederson
This Compensation Committee Report shall not be deemed incorporated by reference by any general statement incorporating by reference this annual report into any filing under the Securities Act of 1933, as amended (the “Securities Act”), or under the Exchange Act, except to the extent that NWLGI specifically incorporates this information by reference, and shall not otherwise be deemed filed under such acts.
Summary Compensation Table
The following table sets forth all of the compensation awarded to, earned by, or paid to the Company’s Named Executive Officers for the years ended December 31, 2023, 2022, and 2021.
| Name and Principal Position | | Year | | | Salary (a) | | | Stock/
Option/SAR/
RSU/PSU
Awards (b) | | | Non-Equity
Incentive
Plan
Compensation | | | | Change in Pension Value and Nonqualified Deferred
Compensation
Earnings (d) | | | All Other Compensation (e) | | | Total | |
| | | | | | | | | | | | | | | | | | | | | | | |
| Ross R. Moody | | 2023 | | | $ | 1,197,108 | | | $ | 83,384 | | | $ | 1,183,939 | (c) | | | $ | 8,477,943 | | | $ | 114,290 | | | $ | 11,056,664 | |
| Chairman of the Board | | 2022 | | | $ | 1,166,571 | | | $ | 10,801,433 | | | $ | 811,404 | | | | $ | 0 | | | $ | 116,968 | | | $ | 12,896,376 | |
| President & CEO | | 2021 | | | $ | 1,135,847 | | | $ | 3,183,159 | | | $ | 1,607,021 | | | | $ | 726,178 | | | $ | 111,146 | | | $ | 6,763,351 | |
| | | | | | | | | | | | | | | | | | | | | | | | | | | | | |
| Rey Perez | | 2023 | | | $ | 493,109 | | | $ | 0 | | | $ | 505,016 | (c) | | | $ | 5,584 | | | $ | 42,038 | | | $ | 1,045,747 | |
| NWLIC President & | | 2022 | | | $ | 467,859 | | | $ | 905,269 | | | $ | 297,903 | | | | $ | 0 | | | $ | 40,924 | | | $ | 1,711,955 | |
| Chief Operating Officer | | 2021 | | | $ | 444,750 | | | $ | 341,606 | | | $ | 567,125 | | | | $ | 0 | | | $ | 38,275 | | | $ | 1,391,756 | |
| | | | | | | | | | | | | | | | | | | | | | | | | | | | | |
| Brian M. Pribyl | | 2023 | | | $ | 441,000 | | | $ | 0 | | | $ | 219,285 | (c) | | | $ | 21,230 | | | $ | 45,063 | | | $ | 726,578 | |
| Senior Vice President | | 2022 | | | $ | 374,556 | | | $ | 699,753 | | | $ | 128,971 | | | | $ | 0 | | | $ | 40,127 | | | $ | 1,243,407 | |
| Chief Financial Officer & Treasurer | | 2021 | | | $ | 358,502 | | | $ | 181,006 | | | $ | 112,070 | | | | $ | 0 | | | $ | 38,141 | | | $ | 689,719 | |
| | | | | | | | | | | | | | | | | | | | | | | | | | | | | |
| Chad J. Tope | | 2023 | | | $ | 441,481 | | | $ | 0 | | | $ | 69,165 | (c) | | | $ | 0 | | | $ | 54,411 | | | $ | 565,057 | |
| NWLIC Executive Vice President | | 2022 | | | $ | 437,125 | | | $ | 477,959 | | | $ | 222,219 | | | | $ | 0 | | | $ | 42,526 | | | $ | 1,179,829 | |
| Chief Marketing Officer | | 2021 | | | $ | 431,812 | | | $ | 221,600 | | | $ | 408,625 | | | | $ | 0 | | | $ | 41,877 | | | $ | 1,103,914 | |
| | | | | | | | | | | | | | | | | | | | | | | | | | | | | |
| Gregory J. Owen | | 2023 | | | $ | 310,278 | | | $ | 0 | | | $ | 115,207 | (c) | | | $ | 0 | | | $ | 49,301 | | | $ | 474,786 | |
| NWLIC Senior Vice President | | 2022 | | | $ | 295,882 | | | $ | 416,074 | | | $ | 73,470 | | | | $ | 0 | | | $ | 36,857 | | | $ | 822,283 | |
| Chief Information Officer | | 2021 | | | $ | 283,385 | | | $ | 109,156 | | | $ | 125,157 | | | | $ | 0 | | | $ | 35,056 | | | $ | 552,754 | |
Note: Columns with no data have been omitted.
| (a) | The 2023 amounts in this column include Company and subsidiary Board of Director fees of $61,000 for Mr. Moody, $7,500 for Mr. Perez, $7,500 for Mr. Pribyl, $1,000 for Mr. Owen, and $1,500 for Mr. Tope. |
| (b) | Grant date fair value computed in accordance with FASB ASC Topic 718. A discussion of the assumptions underlying the calculations can be found in Note 14 to our Consolidated Financial Statements in our Form 10-K for the fiscal year ended December 31, 2023. 2023 values reflect grants awarded on June 22, 2023. |
| (c) | The amounts for Mr. Moody, Mr. Perez, Mr. Pribyl, and Mr. Owen represent the bonus earned under the 2023 Officer Bonus Program. The amount for Mr. Tope represents the bonus earned under the 2023 Chief Marketing Officer Bonus Program. |
| (d) | The amounts in this column represent the change in the accumulated pension benefit under the Company’s qualified defined benefit plan for Mr. Perez and Mr. Pribyl and the change in the accumulated pension benefit under the Company’s qualified and non-qualified defined benefit plans for Mr. Moody. The Company does not pay above-market earnings on deferred compensation; therefore, no amounts are reported in this column for deferred compensation. For a discussion of the assumptions made in the calculation of these amounts, refer to the Notes to Consolidated Financial Statements section of the Annual Report on Form 10-K. |
| (e) | The amounts in this column include the items summarized in the following table: |
All Other Compensation
| Name and Principal Position | | Year | | Company Paid
Benefit
Premiums (a) | | | Excess Benefit
Claims
Paid (b) | | | Company Contributions
To Savings
Plans (c) | | | Company Paid
Taxes/
Insurance | | | Other
Perquisites | | | Total All Other
Compensation | |
| | | | | | | | | | | | | | | | | | | | | |
| Ross R. Moody | | 2023 | | | 2,679 | | | | 4,419 | | | | 68,626 | | | | — | | | | 38,566 | (d) | | | 114,290 | |
| Chairman of the Board | | 2022 | | | 2,601 | | | | 3,760 | | | | 66,685 | | | | — | | | | 43,922 | | | | 116,968 | |
| President & CEO | | 2021 | | | 2,447 | | | | 6,552 | | | | 66,727 | | | | — | | | | 35,420 | | | | 111,146 | |
| | | | | | | | | | | | | | | | | | | | | | | | | | | |
| Rey Perez | | 2023 | | | 6,831 | | | | 4,954 | | | | 29,503 | | | | — | | | | 750 | | | | 42,038 | |
| NWLIC President & | | 2022 | | | 6,507 | | | | 5,677 | | | | 28,040 | | | | — | | | | 700 | | | | 40,924 | |
| Chief Operating Officer | | 2021 | | | 6,112 | | | | 3,028 | | | | 28,435 | | | | — | | | | 700 | | | | 38,275 | |
| | | | | | | | | | | | | | | | | | | | | | | | | | | |
| Brian M. Pribyl | | 2023 | | | 8,420 | | | | 10,544 | | | | 25,399 | | | | — | | | | 700 | | | | 45,063 | |
| Senior Vice President | | 2022 | | | 8,004 | | | | 8,745 | | | | 22,678 | | | | — | | | | 700 | | | | 40,127 | |
| Chief Financial Officer & Treasurer | | 2021 | | | 7,498 | | | | 6,945 | | | | 22,998 | | | | — | | | | 700 | | | | 38,141 | |
| | | | | | | | | | | | | | | | | | | | | | | | | | | |
| Chad J. Tope | | 2023 | | | 13,807 | | | | 13,074 | | | | 26,830 | | | | — | | | | 700 | | | | 54,411 | |
| NWLIC Executive Vice President | | 2022 | | | 13,126 | | | | 2,166 | | | | 26,534 | | | | — | | | | 700 | | | | 42,526 | |
| Chief Marketing Officer | | 2021 | | | 12,296 | | | | 3,604 | | | | 25,277 | | | | — | | | | 700 | | | | 41,877 | |
| | | | | | | | | | | | | | | | | | | | | | | | | | | |
| Gregory J. Owen | | 2023 | | | 13,807 | | | | 18,305 | | | | 16,489 | | | | — | | | | 700 | | | | 49,301 | |
| NWLIC Senior Vice President | | 2022 | | | 13,126 | | | | 7,704 | | | | 15,327 | | | | — | | | | 700 | | | | 36,857 | |
| Chief Information Officer | | 2021 | | | 12,296 | | | | 6,615 | | | | 15,445 | | | | — | | | | 700 | | | | 35,056 | |
| (a) | NWLIC provides its officers additional compensation equivalent to the premiums for health, dental, and accidental death and dismemberment coverage offered to all employees. |
| (b) | The amounts in this column represent claims paid under NWLIC’s Group Excess Benefit Program. |
| (c) | The amounts in this column represent NWLIC contributions to NWLIC’s qualified and non-qualified savings plans. NWLIC’s 401(k) plan is available to all employees with the same contribution criteria. |
| (d) | Mr. Moody’s amounts in this column include $23,096 for car expenses, $11,005 in credit card membership points, $374 for Sirius radio, $3,391 in membership dues, and $700 in officer and director gifts. |
Grants of Plan-Based Awards
The following table provides information regarding grants under NWLIC’s 2023 Officer Bonus Program for the Named Executive Officers.
| | | Estimated Future Payouts
Under Non-Equity Incentive
Plan Awards (a) |
| Name | | Threshold ($) | | | Target ($) | | | Maximum (b) ($) |
| | | | | | | | | |
| Ross R. Moody | | | | | | | | |
| 2023 Officer Bonus Program: | | | | | | | | |
| Life insurance sales | | | 85,208 | | | | 170,416 | | | No limit |
| Annuity sales | | | 85,208 | | | | 170,416 | | | No limit |
| Expense management | | | 1 | | | | 340,833 | | | No limit |
| Company profitability | | | 284,027 | | | | 568,055 | | | No limit |
| | | | | | | | | | | |
| Rey Perez | | | | | | | | | | |
| 2023 Officer Bonus Program: | | | | | | | | | | |
| Life insurance sales | | | 36,421 | | | | 72,841 | | | No limit |
| Annuity sales | | | 36,421 | | | | 72,841 | | | No limit |
| Expense management | | | 1 | | | | 145,683 | | | No limit |
| Company profitability | | | 97,122 | | | | 194,244 | | | No limit |
| | | | | | | | | | | |
| Brian M. Pribyl | | | | | | | | | | |
| 2023 Officer Bonus Program: | | | | | | | | | | |
| Life insurance sales | | | 16,256 | | | | 27,094 | | | No limit |
| Annuity sales | | | 16,256 | | | | 27,094 | | | No limit |
| Expense management | | | 1 | | | | 54,188 | | | No limit |
| Expense management | | | 65,025 | | | | 108,375 | | | No limit |
| | | | | | | | | | | |
| Chad J. Tope | | | | | | | | | | |
| 2023 Chief Marketing Officer Bonus Program: | | | | | | | | | | |
| Life insurance sales | | | 87,996 | | | | 175,992 | | | No limit |
| Annuity sales | | | 87,996 | | | | 175,992 | | | No limit |
| Company profitability | | | 65,997 | | | | 87,996 | | | No limit |
| | | | | | | | | | | |
| Gregory J. Owen | | | | | | | | | | |
| 2023 Officer Bonus Program: | | | | | | | | | | |
| Life insurance sales | | | 9,665 | | | | 13,531 | | | No limit |
| Annuity sales | | | 9,665 | | | | 13,531 | | | No limit |
| Expense management | | | 1 | | | | 27,062 | | | No limit |
| Company profitability | | | 38,660 | | | | 54,124 | | | No limit |
Note: The expense management component has a minimum threshold that equates to a 0% bonus (i.e., there is no bonus unless the minimum target is exceeded). Therefore, the minimum threshold bonus payment, if there is any payment, is $1.
| (a) | Amounts that have been or are expected to be paid in 2024 pertaining to the 2023 programs are reflected in the Summary Compensation Table. The 2023 program bonus amounts are based upon the base salary reflected in the applicable program addendums. |
| (b) | Although the Officer Bonus Program has no limit for each program component, the aggregate bonus amount cannot exceed 150% for the Chairman and CEO, 130% for the President, 65% for Executive Vice Presidents, and 45% for Senior Vice Presidents, respectively, of base salaries. The aggregate bonus amount for the Chief Marketing Officer cannot exceed 200% of base salary. |
The following table provides information regarding all RSU grants awarded during the year ended December 31, 2023 under the Company’s Incentive Plan for the Named Executive Officers. No PSU or SAR grants were awarded under the Company’s Incentive Plan during 2023. The RSU grant to Ross R. Moody shown below was granted to Mr. Moody in recognition of his service as a director. Mr. Moody’s grant is the same number of RSUs as the grants to the other directors, which grants are described under the heading “Director Compensation.”
| Name | | Grant Date | | Grant Type | | All Other Option Awards: Number of Securities Underlying
Award (#) | | Exercise or Share Price of Awards(1) ($) | | | Grant Date Fair Value of Awards ($) | |
| | | | | | | | | | | | | |
| Ross R. Moody | | 06/22/23 | | RSU | | 217 | | $ | 384.26 | | | $ | 83,384 | |
| (1) | RSUs do not have an exercise price, so for those awards, the price shown is the share price upon which the award is based. |
Outstanding Equity Awards at December 31, 2023
The following table provides information regarding outstanding stock options, SARs, RSUs, and PSUs held by the Named Executive Officers as of December 31, 2023. Under the terms of all outstanding SARs, RSUs and PSUs, all such awards may be settled only in cash. Accordingly, no shares of Class A Stock are issuable under the terms of such awards.
| | | Option/SAR/RSU/PSU Awards |
| Name | | Number of
Securities
Underlying
Unexercised
Options/SARs/RSUs/PSUs
Exercisable (#) | | | Number of
Securities
Underlying
Unexercised
Options/SARs/RSUs/PSUs
Unexercisable (#) | | | Option/SAR/RSU/PSU Exercise Price ($)(1) | | | Option/SAR/RSU/PSU
Expiration
Date |
| | | | | | | | | | | | |
| Ross R. Moody Grants: | | | | | | | | | | | | | | |
| 02/17/16 SAR | | | 2,964 | * | | | — | | | | 216.48 | | | 02/17/2026 |
| 02/16/17 SAR | | | 6,342 | * | | | — | | | | 311.16 | | | 02/16/2027 |
| 12/13/17 SAR | | | 5,902 | * | | | — | | | | 334.34 | | | 12/13/2027 |
| 12/12/18 SAR | | | 6,798 | * | | | — | | | | 303.77 | | | 12/12/2028 |
| 12/11/19 SAR | | | 9,509 | * | | | — | | | | 252.91 | | | 12/11/2029 |
| 12/09/20 SAR | | | 13,771 | * | | | — | | | | 192.10 | | | 12/09/2030 |
| 12/14/21 SAR | | | 24,825 | | | | 12,413 | | | | 218.44 | | | 12/14/2031 |
| 12/14/21 RSU | | | — | | | | 2,793 | | | | 218.44 | | | 12/14/2024 |
| 12/14/21 PSU | | | — | | | | 2,793 | | | | 218.44 | | | 12/14/2024 |
| 12/14/22 SAR | | | 24,603 | | | | 49,207 | | | | 220.61 | | | 12/14/2025 |
| 12/14/22 RSU | | | — | | | | 4,429 | | | | 220.61 | | | 12/14/2023 |
| 06/22/23 (director RSU) | | | — | | | | 217 | | | | 384.26 | | | 06/22/2024 |
| | | | | | | | | | | | | | | |
| Rey Perez Grants: | | | | | | | | | | | | | | |
| 12/14/21 SAR | | | — | | | | 1,366 | | | | 218.44 | | | 12/14/2031 |
| 12/14/21 RSU | | | — | | | | 307 | | | | 218.44 | | | 12/14/2024 |
| 12/14/21 PSU | | | — | | | | 307 | | | | 218.44 | | | 12/14/2024 |
| 12/14/22 SAR | | | — | | | | 4,154 | | | | 220.61 | | | 12/14/2032 |
| 12/14/22 RSU | | | — | | | | 374 | | | | 220.61 | | | 12/14/2025 |
| 12/14/22 PSU | | | — | | | | 374 | | | | 220.61 | | | 12/14/2025 |
| Name | | Number of
Securities
Underlying
Unexercised Options/SARs/RSUs/PSUs
Exercisable (#) | | | Number of
Securities
Underlying
Unexercised
Options/SARs/RSUs/PSUs
Unexercisable (#) | | | Option/SAR/RSU/PSU Exercise Price ($)(1) | | | Option/SAR/RSU/PSU
Expiration
Date |
| | | | | | | | | | | | |
| Brian M. Pribyl Grants: | | | | | | | | | | | | | | |
| 12/14/21 SAR | | | — | | | | 723 | | | | 218.44 | | | 12/14/2031 |
| 12/14/21 RSU | | | — | | | | 163 | | | | 218.44 | | | 12/14/2024 |
| 12/14/21 PSU | | | — | | | | 163 | | | | 218.44 | | | 12/14/2024 |
| 12/14/22 SAR | | | — | | | | 3,211 | | | | 220.61 | | | 12/14/2032 |
| 12/14/22 RSU | | | — | | | | 289 | | | | 220.61 | | | 12/14/2025 |
| 12/14/22 PSU | | | — | | | | 289 | | | | 220.61 | | | 12/14/2025 |
| | | | | | | | | | | | | | | |
| Chad J. Tope Grants: | | | | | | | | | | | | | | |
| 12/09/20 SAR | | | 492 | * | | | — | | | | 192.10 | | | 12/09/2030 |
| 12/14/21 SAR | | | 886 | | | | 1,773 | | | | 218.44 | | | 12/14/2031 |
| 12/14/21 RSU | | | — | | | | 199 | | | | 218.44 | | | 12/14/2024 |
| 12/14/21 PSU | | | — | | | | 197 | | | | 218.44 | | | 12/14/2024 |
| 12/14/22 SAR | | | 1,097 | | | | 2,194 | | | | 220.61 | | | 12/14/2032 |
| 12/14/22 RSU | | | — | | | | 199 | | | | 220.61 | | | 12/14/2025 |
| 12/14/22 PSU | | | — | | | | 197 | | | | 220.61 | | | 12/14/2025 |
| | | | | | | | | | | | | | | |
| Gregory J. Owen Grants: | | | | | | | | | | | | | | |
| 12/09/20 SAR | | | 241 | * | | | — | | | | 192.10 | | | 12/09/2030 |
| 12/14/21 SAR | | | 437 | | | | 437 | | | | 218.44 | | | 12/14/2031 |
| 12/14/21 RSU | | | — | | | | 98 | | | | 218.44 | | | 12/14/2024 |
| 12/14/21 PSU | | | — | | | | 98 | | | | 218.44 | | | 12/14/2024 |
| 12/14/22 SAR | | | 954 | | | | 1,909 | | | | 220.61 | | | 12/14/2032 |
| 12/14/22 RSU | | | — | | | | 172 | | | | 220.61 | | | 12/14/2025 |
| 12/14/22 PSU | | | — | | | | 172 | | | | 220.61 | | | 12/14/2025 |
| Note: | Columns with no data have been omitted. |
| | |
| (1) | PSUs and RSUs do not have an exercise price, so for those awards, the price shown is the share price upon which the award is based. |
Officer SARs granted prior to be paid as cash compensation2016 vest 20% annually following three full years of service to the Company from the date of grant. SARs granted to members of the Board of Directors prior to 2016 vest 20% annually following one full year of service to the Company from the date of grant. Beginning with the grants awarded in 2017, SARs granted to officers vest annually at a rate of 33.3% per year from the vesting date.date of grant while RSUs and PSUs alsogranted to officers vest three years from the date of grant. For PSUs, the performance period begins the first day of the calendar year for which the PSUs are granted and runs three calendar years. At that time, the three-year performance outcome is measured against the pre-defined target amounts to determine the number of PSUs earned as compensation. PSUs granted prior to 2019 were paid at the closing price of the Company’s Class A common share on the vesting date. PSUs granted in 2019 and forward are payable at the 20-day moving average closing price of the Company’s Class A common share at the vesting date.
PSU awards covering the three year measurement period ended December 31, 2020 were paid out in April 2021. The performance factor during the measurement period used to determine compensation payouts was 85.16% of the pre-defined metric target.
PSU awards covering the three year measurement period ended December 31, 2019 were paid out in the first quarter of 2020. The performance factor during the measurement period used to determine compensation payouts was 101.19% of the pre-defined metric target.
Directors of the Company are eligible to receive RSUs under the Incentive Plan. Unlike RSUs granted to
officers,members of the
RSUs granted to directorsBoard of Directors in 2023 vest one year from the date of grant.
Accordingly, the unexercisable SARs, RSUs,
granted priorand PSUs shown in the previous table are scheduled to
2019 were paid in cash atvest during the
vesting date equal to the closing price of the Company's Class A common share at that time. RSUs granted in 2019following years:
| Name | | 2024 | | | 2025 | | | 2026 | | | Total
Unexercisable | |
| | | | | | | | | | | | | |
| Ross R. Moody Grants: | | | | | | | | | | | | |
| 12/14/21 SAR | | | 1,243 | | | | — | | | | — | | | | 1,243 | |
| 12/14/21 RSU | | | 2,793 | | | | — | | | | — | | | | 2,793 | |
| 12/14/21 PSU | | | 2,793 | | | | — | | | | — | | | | 2,793 | |
| 12/14/22 SAR | | | 24,603 | | | | 24,604 | | | | — | | | | 49,207 | |
| 12/14/22 RSU | | | — | | | | 4,429 | | | | — | | | | 4,429 | |
| 12/14/22 PSU | | | — | | | | 4,429 | | | | — | | | | 4,429 | |
| 06/22/23 (director RSU) | | | 217 | | | | — | | | | — | | | | 217 | |
| 12/14/23 SAR | | | — | | | | — | | | | — | | | | — | |
| 12/14/23 RSU | | | — | | | | — | | | | — | | | | — | |
| 12/14/23 PSU | | | — | | | | — | | | | — | | | | — | |
| | | | | | | | | | | | | | | | | |
| Rey Perez Grants: | | | | | | | | | | | | | | | | |
| 12/14/21 SAR | | | 1,366 | | | | — | | | | — | | | | 1,366 | |
| 12/14/21 RSU | | | 307 | | | | — | | | | — | | | | 307 | |
| 12/14/21 PSU | | | 307 | | | | — | | | | — | | | | 307 | |
| 12/14/22 SAR | | | 2,077 | | | | 2,077 | | | | — | | | | 4,154 | |
| 12/14/22 RSU | | | — | | | | 374 | | | | — | | | | 374 | |
| 12/14/22 PSU | | | — | | | | 374 | | | | — | | | | 374 | |
| 12/14/23 SAR | | | — | | | | — | | | | — | | | | — | |
| 12/14/23 RSU | | | — | | | | — | | | | — | | | | — | |
| 12/14/23 PSU | | | — | | | | — | | | | — | | | | — | |
| | | | | | | | | | | | | | | | | |
| Brian M. Pribyl Grants: | | | | | | | | | | | | | | | | |
| 12/14/21 SAR | | | 723 | | | | — | | | | — | | | | 723 | |
| 12/14/21 RSU | | | 163 | | | | — | | | | — | | | | 163 | |
| 12/14/21 PSU | | | 163 | | | | — | | | | — | | | | 163 | |
| 12/14/22 SAR | | | 1,605 | | | | 1,606 | | | | — | | | | 3,211 | |
| 12/14/22 RSU | | | — | | | | 289 | | | | — | | | | 289 | |
| 12/14/22 PSU | | | — | | | | 289 | | | | — | | | | 289 | |
| 12/14/23 SAR | | | — | | | | — | | | | — | | | | — | |
| 12/14/23 RSU | | | — | | | | — | | | | — | | | | — | |
| 12/14/23 PSU | | | — | | | | — | | | | — | | | | — | |
| Name | | 2023 | | | 2024 | | | 2025 | | | Total
Unexercisable | |
| | | | | | | | | | | | | |
| Chad J. Tope Grants: | | | | | | | | | | | | |
| 12/14/21 SAR | | | 887 | | | | — | | | | — | | | | 887 | |
| 12/14/21 RSU | | | 199 | | | | — | | | | — | | | | 199 | |
| 12/14/21 PSU | | | 199 | | | | — | | | | — | | | | 199 | |
| 12/14/22 SAR | | | 1,097 | | | | 1,097 | | | | — | | | | 2,194 | |
| 12/14/22 RSU | | | — | | | | 197 | | | | — | | | | 197 | |
| 12/14/22 PSU | | | — | | | | 197 | | | | — | | | | 197 | |
| 12/14/23 SAR | | | — | | | | — | | | | — | | | | — | |
| 12/14/23 RSU | | | — | | | | — | | | | — | | | | — | |
| 12/14/23 PSU | | | — | | | | — | | | | — | | | | — | |
| | | | | | | | | | | | | | | | | |
| Gregory J. Owen Grants: | | | | | | | | | | | | | | | | |
| 12/14/21 SAR | | | 437 | | | | — | | | | — | | | | 437 | |
| 12/14/21 RSU | | | 98 | | | | — | | | | — | | | | 98 | |
| 12/14/21 PSU | | | — | | | | — | | | | — | | | | 221 | |
| 12/14/22 SAR | | | 954 | | | | 955 | | | | — | | | | 1,909 | |
| 12/14/22 RSU | | | — | | | | 172 | | | | — | | | | 172 | |
| 12/14/22 PSU | | | — | | | | 172 | | | | — | | | | 172 | |
| 12/14/23 SAR | | | — | | | | — | | | | — | | | | — | |
| 12/14/23 RSU | | | — | | | | — | | | | — | | | | — | |
| 12/14/23 PSU | | | — | | | | — | | | | — | | | | — | |
Option Exercises and forward are payable in cash at the vesting date equal to the 20-day moving average closing price of the Company’s Class A common share at that time.Stock Vested
The following table shows all grants issued to officerssets forth information regarding stock option and directorsSAR exercises by the Named Executive Officers for the twelve monthsyear ended December 31, 2021 and 2020. These grants were made based upon the 20-day moving average closing market price of the Company's Class A common share at the grant date.
| | | | | | | | | | | | | | | | | | | | | | | |
| Years Ended |
| December 31, 2021 | | December 31, 2020 |
| Officers | | Directors | | Officers | | Directors |
| | | | | | | |
| SARs | 64,157 | | | — | | | 40,990 | | | — | |
| RSUs | 5,301 | | | 3,530 | | | 6,147 | | | 3,400 | |
| PSUs | 4,066 | | | — | | | 9,324 | | | — | |
The grant price of the awards increased from $192.10 in 2020 to $218.44 in 2021. The annual allocation of PSU, SAR, and RSU awards in 2021 was changed to place greater emphasis on SARs and less on PSUs awards.
NATIONAL WESTERN LIFE GROUP, INC.
NOTES TO CONSOLIDATED FINANCIAL STATEMENTS
The Company uses the current fair value method to measure compensation cost for awards granted under the share-based plans.2023. As of December 31, 2021, and 2020, the liability balance for these plans was $7.9 million and $6.2 million, respectively. A summary of awards by type and related activity is detailed below.
| | | | | | | | | | | | | | | | | |
| | | Options Outstanding |
| Shares Available For Grant | | Shares | | Weighted-Average Exercise Price |
| | | | | |
Stock Options: | | | | | |
Balance at January 1, 2021 | 291,000 | | | — | | | $ | — | |
Exercised | — | | | — | | | $ | — | |
Forfeited | — | | | — | | | $ | — | |
Expired | — | | | — | | | $ | — | |
Stock options granted | — | | | — | | | $ | — | |
| | | | | |
Balance at December 31, 2021 | 291,000 | | | — | | | $ | — | |
| | | | | | | | | | | | | | | | | |
| | Liability Awards |
| Other Share/Unit Awards: | SARs | | RSUs | | PSUs |
| | | | | |
| Balance at January 1, 2021 | 144,248 | | | 16,449 | | | 24,282 | |
| Exercised | (19,881) | | | (6,168) | | | (3,863) | |
| Forfeited | (1,530) | | | (157) | | | — | |
| Granted | 64,157 | | | 8,831 | | | 4,066 | |
| | | | | |
| Balance at December 31, 2021 | 186,994 | | | 18,955 | | | 24,485 | |
SARs, RSUs, and PSUsthere were no outstanding stock options. All exercises shown as forfeited in the above tables represent vested and unvested awards not exercised by plan participants upon their termination from the Company in accordance with the expiration provisions of the awards.
The total intrinsic value of share-based compensation exercised and paid was $4.1 million, $2.8 million, and $3.1 millionbelow for the
yearsyear ended December 31,
2021, 2020,2022 were released pursuant to plan provisions and
2019, respectively. The total fair value ofnot based on participant election.
| | | SAR/RSU/PSU Awards | |
| Name | | Number of Shares
Exercised (#) | | | Value Realized
On Exercise ($) | |
| | | | | | | |
| Ross R. Moody | | | 24,694 | | | | 9,295,311 | |
| | | | | | | | | |
| Rey Perez | | | 11,070 | | | | 3,146,809 | |
| | | | | | | | | |
| Brian M. Pribyl | | | 7,312 | | | | 1,969,087 | |
| | | | | | | | | |
| Chad J. Tope | | | 3,517 | | | | 1,121,141 | |
| | | | | | | | | |
| Gregory J. Owen | | | 1,994 | | | | 595,831 | |
Note: Columns with no data have been omitted.
*Mr. Moody’s totals include 3,098 officer RSUs, 9,296 officer PSUs, 1,000 director SARs, RSUs, and PSUs vested during the years ended December 31, 2021, 2020, and 2019 was $3.7 million, $4.2 million, and $4.4 million, respectively. No cash amounts were received from the exercise of stock options under the Plans during the periods reported on.371 director RSUs.
NATIONAL WESTERN LIFE GROUP, INC.NOTES TO CONSOLIDATED FINANCIAL STATEMENTS
Pension Benefits
The following table summarizesprovides information about SARs outstanding at December 31, 2021.regarding benefits under NWLIC’s Pension Plan and Non-Qualified Defined Benefit Plan for the President of National Western Life Insurance Company (NWLIC).
| Name | | Plan Name | | Number of
Years of
Credited
Service | | Present
Value of
Accumulated
Benefit ($) | | | Payments
During
Last Fiscal Year
($) | |
| | | | | | | | | | | |
| Ross R. Moody | | NWLIC Pension Plan | | 17 | | | 570,605 | | | | — | |
| | | | | | | | | | | | | |
| | | Non-Qualified Defined | | | | | | | | | | |
| | | Benefit Plan for the | | | | | | | | | | |
| | | President of NWLIC | | 33 | | | 23,242,676 | | | | — | |
| | | | | | | | | | | | | |
| Rey Perez | | NWLIC Pension Plan | | 7 | | | 54,618 | | | | — | |
| | | | | | | | | | | | | |
| Brian M. Pribyl | | NWLIC Pension Plan | | 7 | | | 286,944 | | | | — | |
| | | | | | | | | | | | | | | | | |
| | SARs Outstanding | | |
| | Number Outstanding | | Weighted-Average Remaining Contractual Life | | Number Exercisable |
| | | | | |
| Exercise prices: | | | | | |
| $210.22 | 22,750 | | | 1.9 years | | 22,750 | |
| $216.48 | 11,086 | | | 4.1 years | | 11,086 | |
| $311.16 | 9,295 | | | 5.1 years | | 9,295 | |
| $310.55 | 203 | | | 5.3 years | | 203 | |
| $334.34 | 8,880 | | | 6.0 years | | 8,880 | |
| $303.77 | 11,068 | | | 7.0 years | | 11,068 | |
| $252.91 | 19,007 | | | 7.9 years | | 12,677 | |
| $192.10 | 40,548 | | | 8.9 years | | 13,504 | |
| $218.44 | 64,157 | | | 10.0 years | | — | |
| | | | | |
| Totals | 186,994 | | | | | 89,463 | |
| | | | | |
| Aggregate intrinsic value | | | | | |
| (in thousands) | $ | 1,002 | | | | | $ | 398 | |
The aggregate intrinsic valueNote: Mr. Tope and Mr. Owen are not eligible participants in the table above is based on the closing Class A common share price of $214.44 per share on December 31, 2021.
In estimating the fair value of SARs outstanding at December 31, 2021 and 2020, the Company employed the Black-Scholes option pricing modelPension Plan. Columns with assumptions as detailed below.
| | | | | | | | | | | |
| December 31, 2021 | | December 31, 2020 |
| | | |
| Expected term | 1.9 to 10.0 years | | 1.0 to 9.9 years |
| Expected volatility weighted-average | 35.05 | % | | 33.47 | % |
| Expected dividend yield | 0.17 | % | | 0.17 | % |
| Risk-free rate weighted-average | 1.01 | % | | 0.19 | % |
The Company reviewed the contractual term relative to the SARs as well as perceived future behavior patterns of exercise. Volatility is based on the Company’s historical volatility over the expected term of the SARs by expected exercise date.
The pre-tax compensation expense/(benefit) recognized in the Consolidated Financial Statements related to these plans was $5.8 million, $(2.2) million, and $2.4 million for the years ended December 31, 2021, 2020 and 2019, respectively. The related tax (benefit)/expense recognized was $(1.2) million, $0.5 million, and $(0.5) million for the years ended December 31, 2021, 2020 and 2019, respectively.
For the years ended December 31, 2021, 2020 and 2019, the total pre-tax compensation expense related to nonvested share-based awards not yet recognized was $11.9 million, $9.1 million, and $8.0 million, respectively. The December 31, 2021 amount is expected to be recognized over a weighted-average period of 1.5 years. The Company recognizes compensation cost over the graded vesting periods.
NATIONAL WESTERN LIFE GROUP, INC.
NOTES TO CONSOLIDATED FINANCIAL STATEMENTS
(13) INFORMATION REGARDING CONTROLLING STOCKHOLDER
Robert L. Moody, Sr., through the Robert L. Moody Revocable Trust controls 99.0% of the total outstanding shares of the Company's Class B common stock as of December 31, 2021. Holders of the Company's Class A common stock elect one-third of the Board of Directors of the Company, and holders of the Class B common stock elect the remainder. Any cash or in-kind dividends paid on each share of Class B common stock are to be only one-half of the cash or in-kind dividends paid on each share of Class A common stock. In the event of liquidation of the Company, the Class A stockholders will receive the par value of their shares; then the Class B stockholders will receive the par value of their shares; and the remaining net assets of the Company shall be divided between the stockholders of both Class A and Class B stock based upon the number of shares held.
NATIONAL WESTERN LIFE GROUP, INC.
NOTES TO CONSOLIDATED FINANCIAL STATEMENTS
(14) PENSION AND OTHER POSTRETIREMENT PLANS
(A) Defined Benefit Pension Plans
National Western sponsors aPlan. The qualified defined benefit
pension plan
covering(“Pension Plan”) covers substantially all employees
enrolled prior to 2008. The planand officers of NWLIC and provides benefits based on the
participants'participant’s years of service and compensation. The
companyCompany makes annual contributions to the
planPension Plan that comply with the minimum funding provisions of the Employee Retirement Income Security
ActAct. Annual pension benefits for those employees who became eligible participants prior to January 1, 1991, are generally calculated as the sum of
1974 ("ERISA"). the following:
| (i) | 50% of the participant’s final 5-year average annual eligible compensation at December 31, 1990, less 50% of their primary social security benefit determined at December 31, 1990; this net amount is then prorated for less than 15 years of benefit service at normal retirement date. This result is multiplied by a fraction which is the participant’s years of benefit service at December 31, 1990, divided by the participant’s years of benefit service at normal retirement date. |
| (ii) | 1.5% of the participant’s eligible compensation earned during each year of benefit service after December 31, 1990 and through December 31, 2007. |
Annual pension benefits for those employees who become eligible participants on or subsequent to January 1, 1991, are generally calculated as 1.5% of their compensation earned during each year of benefit service through December 31, 2007.
On October 19, 2007, National Western’sNWLIC’s Board of Directors approved an amendment to freeze the pension planPension Plan as of December 31, 2007. The freeze ceased future benefit accruals to all participants and closed the planPension Plan to any new participants. In addition, all participants became immediately 100% vested in their accrued benefits as of that date. As participants are no longer earning a credit for service, future qualified defined benefit plan expense is projected to be minimal. Fair values of plan assets and liabilities are measured as of the prior December 31 for each year. A detail of plan disclosures is provided below.
Obligations and Funded Status
| | | | | | | | | | | |
| | December 31, |
| | 2021 | | 2020 |
| | (In thousands) |
| | | |
| Changes in projected benefit obligations: | | | |
| Projected benefit obligations at beginning of year | $ | 23,927 | | | 22,689 | |
| Service cost | 119 | | 107 | |
| Interest cost | 528 | | | 674 | |
| Plan amendments | — | | | — | |
| Actuarial (gain) loss | (805) | | | 2,153 | |
| Benefits paid | (1,713) | | | (1,696) | |
| | | |
| Projected benefit obligations at end of year | 22,056 | | | 23,927 | |
| | | |
| Changes in plan assets: | | | |
| Fair value of plan assets at beginning of year | 20,833 | | | 18,512 | |
| Actual return on plan assets | 3,265 | | | 2,910 | |
| Contributions | 856 | | | 1,107 | |
| Benefits paid | (1,713) | | | (1,696) | |
| | | |
| Fair value of plan assets at end of year | 23,241 | | | 20,833 | |
| | | |
| Funded status at end of year | $ | 1,185 | | | (3,094) | |
The service cost shown above for each year represents plan expenses expected to be paid out of plan assets. Under the clarified rules of the Pension Protection Act, plan expenses paid from plan assets are to be included in the plan's service cost component.
The ProjectedNon-Qualified Defined Benefit Obligation decreased in 2021 due to the following:
•An experience loss of approximately $309,000 due to census demographics.
•An experience loss of approximately $78,000 due to the change in mortality.
•An experience loss of approximately $127,000 due to the difference in expected and actual benefit payments.
•An experience gain of approximately $1,319,000 due to the increase in the discount rate from 2.25% to 2.75%.
NATIONAL WESTERN LIFE GROUP, INC.
NOTES TO CONSOLIDATED FINANCIAL STATEMENTS
The Projected Benefit Obligation increased in 2020 from the previous year due to the following:
•An experience loss of approximately $587,000 due to census demographics.
•An experience gain of approximately $317,000 due to the change in mortality.
•An experience loss of approximately $45,000 due to the difference in expected and actual benefit payments.
•An experience loss of approximately $1,838,000 due to the decrease in the discount rate from 3.00% to 2.25%.
| | | | | | | | | | | |
| | December 31, |
| | 2021 | | 2020 |
| | (In thousands) |
| | | |
| Amounts recognized in the Company's Consolidated Financial Statements: | | | |
| Assets | $ | 1,185 | | | — | |
| Liabilities | — | | | (3,094) | |
| | | |
| Net amount recognized | $ | 1,185 | | | (3,094) | |
| | | |
| Amounts recognized in accumulated other comprehensive income: | | | |
| Net (gain) loss | $ | 3,642 | | | 6,826 | |
| Prior service cost | — | | | — | |
| | | |
| Net amount recognized | $ | 3,642 | | | 6,826 | |
The accumulated benefit obligation was $22.1 million and $23.9 million at December 31, 2021 and 2020, respectively.
Components of Net Periodic Benefit Cost
| | | | | | | | | | | | | | | | | |
| | Years Ended December 31, |
| | 2021 | | 2020 | | 2019 |
| | (In thousands) |
| | | | | |
| Components of net periodic benefit costs: | | | | | |
| Interest cost | $ | 528 | | | 674 | | | 839 | |
| Service cost | 119 | | | 107 | | | 96 | |
| Expected return on plan assets | (1,425) | | | (1,261) | | | (1,086) | |
| | | | | |
| Amortization of net loss (gain) | 539 | | | 580 | | | 660 | |
| | | | | |
| Net periodic benefit cost | (239) | | | 100 | | | 509 | |
| | | | | |
| Other changes in plan assets and benefit obligations recognized in other comprehensive income: | | | | | |
| Net loss (gain) | (2,645) | | | 503 | | | (872) | |
| | | | | |
| Amortization of net loss (gain) | (539) | | | (580) | | | (660) | |
| | | | | |
| Total recognized in other comprehensive income | (3,184) | | | (77) | | | (1,532) | |
| | | | | |
| Total recognized in net periodic benefit cost and other comprehensive income | $ | (3,423) | | | 23 | | | (1,023) | |
NATIONAL WESTERN LIFE GROUP, INC.
NOTES TO CONSOLIDATED FINANCIAL STATEMENTS
The components of net periodic benefit cost including service cost are reported in "Other operating expenses" in the Consolidated Statement of Earnings.
Assumptions
| | | | | | | | | | | |
| | December 31, |
| | 2021 | | 2020 |
| | | |
| Weighted-average assumptions used to determine benefit obligations: | | | |
| Discount rate | 2.75 | % | | 2.25 | % |
| Rate of compensation increase | n/a | | n/a |
| | | | | | | | | | | | | | | | | |
| | December 31, |
| | 2021 | | 2020 | | 2019 |
| | | | | |
| Weighted-average assumptions used to determine net periodic benefit cost: | | | | | |
| Discount rate | 2.25 | % | | 3.00 | % | | 4.00 | % |
| Expected long-term return on plan assets | 7.00 | % | | 7.00 | % | | 7.00 | % |
| Rate of compensation increase | n/a | | n/a | | n/a |
The assumed long-term rate of return on plan assets is generally set at the rate expected to be earned based on the long-term investment policy of the plan and the various classes of invested funds, based on the input of the plan’s investment advisors and consulting actuary and the plan’s historic rate of return. As of December 31, 2021, the plan’s average 10-year returns were 10.90%.
In setting the annual discount rate assumption, the Pension Committee designated by National Western's Board of Directors reviews current 10 year and 30 year corporate bond yields, the current spread to treasuries, and their relative change during the past twelve months. It also considers the present value of the projected benefit payment stream based on the Citigroup Pension Discount Curve and market data observations provided by independent consultants.
In setting the annual portfolio rate of return assumption, the Pension Committee considers the Plan’s actual long-term performance, the portfolio’s current allocation and individual investment holdings, the Committee’s and the investment manager’s expectations for future long term investment strategy and expected performance, and the advice of consultants knowledgeable about overall market expectations and benchmark rates of return used by comparable companies.
NATIONAL WESTERN LIFE GROUP, INC.
NOTES TO CONSOLIDATED FINANCIAL STATEMENTS
Plan Assets
As discussed in Note (4) Fair Values of Financial Instruments, GAAP defines fair value and establishes a framework for measuring fair value of financial assets. Using this guidance, the Company has categorized its pension plan assets into a three level hierarchy, based on the priority of inputs to the valuation process. The fair value hierarchy classifications are reviewed annually. Reclassification of certain financial assets and liabilities may result based on changes in the observability of valuation attributes. The following tables set forth the Company’s pension plan assets within the fair value hierarchy as of December 31, 2021 and 2020.
| | | | | | | | | | | | | | | | | | | | | | | |
| | December 31, 2021 |
| | Total | | Level 1 | | Level 2 | | Level 3 |
| | (In thousands) |
| | | | | | | |
| Cash and cash equivalents | $ | 852 | | | 852 | | | — | | | — | |
| Equity securities | | | | | | | |
| Domestic | 15,752 | | | 15,752 | | | — | | | — | |
| International | 163 | | | 163 | | | — | | | — | |
| Debt securities | | | | | | | |
| | | | | | | |
| Corporate bonds | 6,474 | | | — | | | 6,474 | | | — | |
| Other invested assets | — | | | — | | | — | | | — | |
| | | | | | | |
| Total | $ | 23,241 | | | 16,767 | | | 6,474 | | | — | |
| | | | | | | | | | | | | | | | | | | | | | | |
| | December 31, 2020 |
| | Total | | Level 1 | | Level 2 | | Level 3 |
| | (In thousands) |
| | | | | | | |
| Cash and cash equivalents | $ | 1,050 | | | 1,050 | | | — | | | — | |
| Equity securities | | | | | | | |
| Domestic | 13,853 | | | 13,853 | | | — | | | — | |
| International | 170 | | | 170 | | | — | | | — | |
| Debt securities | | | | | | | |
| | | | | | | |
| Corporate bonds | 5,759 | | | — | | | 5,759 | | | — | |
| Other invested assets | 1 | | | 1 | | | — | | | — | |
| | | | | | | |
| Total | $ | 20,833 | | | 15,074 | | | 5,759 | | | — | |
Investment securities. Fair values for investments in debt and equity securities are based on quoted market prices, where available. For securities not actively traded, fair values are estimated using values obtained from various independent pricing services. In cases where prices are unavailable from these sources, values are estimated by discounting expected future cash flows using a current market rate applicable to the yield, credit quality, and maturity of the investments.
Cash and cash equivalents. Carrying amounts for these instruments approximate their fair values.
NATIONAL WESTERN LIFE GROUP, INC.
NOTES TO CONSOLIDATED FINANCIAL STATEMENTS
The plan’s weighted-average asset allocations by asset category have been as follows:
| | | | | | | | | | | | | | | | | |
| | December 31, |
| | 2021 | | 2020 | | 2019 |
| | | | | |
| Asset Category: | | | | | |
| Equity securities | 68% | | 67% | | 65% |
| Debt securities | 28% | | 28% | | 31% |
| Cash and cash equivalents | 4% | | 5% | | 4% |
| | | | | |
| | | | | |
| Total | 100% | | 100% | | 100% |
The Company has established and maintains an investment policy statement for the assets held in the plan's trust. The investment strategies arePresident of a long-term nature and are designed to meet the following objectives:
| | | | | |
| Ensure that funds are available to pay benefits as they become due |
| Set forth an investment structure detailing permitted assets and expected allocation ranges among classes |
| Ensure that plan assets are managed in accordance with ERISA |
The pension plan is a highly diversified portfolio. The 96% of pension assets not invested in cash is allocated among 247 different investments, with no single issuer representing more than 4.9% of the fair value of the portfolio. The investment policy statement sets forth the following acceptable ranges for each asset's class.
| | | | | |
| Acceptable Range |
| |
Asset Category: | |
Equity securities | 55-70% |
Debt securities | 30-40% |
Cash and cash equivalents | 0-15% |
Deviations from these ranges are permitted if such deviations are consistent with the duty of prudence under ERISA. Investments in natural resources, venture capital, precious metals, futures and options, real estate, and other vehicles that do not have readily available objective valuations are not permitted. Short sales, use of margin or leverage, and investment in commodities and art objects are also prohibited.
The investment policy statement is reviewed annually to ensure that the objectives are met considering any changes in benefit plan design, market conditions, or other material considerations.
Contributions
National Western expects to contribute up to $500,000 to the plan during 2022 which amount includes a $250,000 voluntary contribution for the 2021 plan year. Additional amounts may be contributed at NWLIC's discretion. The plan’s funding status is reviewed periodically throughout the year by National Western’s Pension Plan Committee. NWLIC intends to contribute at least the minimum amounts necessary for tax compliance and to maintain an Adjusted Funding Target Attainment Percentage ("AFTAP") of over 80% to meet the Pension Protection Act Plan’s threshold.
NATIONAL WESTERN LIFE GROUP, INC.
NOTES TO CONSOLIDATED FINANCIAL STATEMENTS
Estimated Future Benefit Payments
The following benefit payments, which reflect expected future service, as appropriate, are expected to be paid (in thousands):
| | | | | |
| 2022 | $ | 1,568 | |
| 2023 | 1,555 | |
| 2024 | 1,470 | |
| 2025 | 1,488 | |
| 2026 | 1,417 | |
| 2027-2031 | 6,621 | |
National Western also sponsors 3 non-qualified defined benefit pension plans. The firstLife Insurance Company. This plan covers certain senior officers and provides benefits based on the participants' years of service and compensation. The primary pension obligations and administrative responsibilities of the plan are maintained by a pension administration firm, which is a subsidiary of American National Group, Inc. ("American National"), a related party. American National has guaranteed the payment of pension obligations under the plan. However, the Company has a contingent liability with respect to the plan should these entities be unable to meet their obligations under the existing agreements. Also, the Company has a contingent liability with respect to the plan in the event that a plan participant continues employment with National Western beyond age seventy, the aggregate average annual participant salary increases exceed 10% per year, or any additional employees become eligible to participate in the plan. If any of these conditions are met, the Company would be responsible for any additional pension obligations resulting from these items. Amendments were made to this plan to allow an additional employee to participate and to change the benefit formula for the then Chairman of the Company. As previously mentioned, these additional obligations are a liability to the Company. Effective December 31, 2004, this plan was frozen with respect to the continued accrual of benefits of the then Chairman and the thenformer President of the Company in orderNWLIC, Ross R. Moody, and is intended to provide benefit accruals that comply with law changes under the American Jobs Creation Act of 2004 ("Act").2004. No minimum funding standards are required. The annual benefit to be paid to Mr. Moody, if he retires at his normal retirement date, shall be equal to (a) minus (b) minus (c) where:
(a) equals his years of service (up to 45), multiplied by 1.66667%, and then multiplied by the excess of his eligible compensation over his primary social security benefit under the terms of the Pension Plan as of December 31, 1990, as if that plan had continued without change and without regard to Internal Revenue Code Section 401(a) (17) and 415 limits, and,
(b) equals the actuarial equivalent life annuity provided by an accumulation of 2% of his compensation for each year of service on and after his date of hire, accumulated at an assumed interest rate of 8.5% to his normal retirement date, and,
(c) equals the benefit actually payable to him under the terms of the Pension Plan.
The plan provides for a monthly in-service benefit if Mr. Ross R. Moody continues employment after his normal retirement date.
Effective July 1, 2005, National Western established a second24
Non-Qualified Deferred Compensation
The following table provides information regarding NWLIC’s non-qualified defined benefitdeferred compensation plan for the benefitNamed Executive Officers as of December 31, 2023.
| Name | | Executive
Contributions
in Last
Fiscal Year (a) ($) | | | Registrant
Contributions
in Last Fiscal
Year (b) ($) | | | Aggregate
Earnings
in Last Fiscal
Year (c) ($) | | | Aggregate
Withdrawals/
Distributions ($) | | | Aggregate
Balance
at Last
Fiscal
Year-End (d) ($) | |
| | | | | | | | | | | | | | | | |
| Ross R. Moody | | | 68,687 | | | | 54,945 | | | | 774,454 | | | | — | | | | 4,652,708 | |
| | | | | | | | | | | | | | | | | | | | | |
| Rey Perez | | | 124,610 | | | | 16,303 | | | | 89,976 | | | | — | | | | 547,667 | |
| | | | | | | | | | | | | | | | | | | | | |
| Brian M. Pribyl | | | 31,354 | | | | 12,199 | | | | 17,149 | | | | — | | | | 947,026 | |
| | | | | | | | | | | | | | | | | | | | | |
| Chad J. Tope | | | 68,068 | | | | 13,897 | | | | 48,992 | | | | — | | | | 430,880 | |
| | | | | | | | | | | | | | | | | | | | | |
| Gregory J. Owen | | | 6,462 | | | | 3,312 | | | | 11,467 | | | | — | | | | 80,140 | |
Note: Columns with no data have been omitted.
| (a) | These amounts are included within the “Salary” and “Non-Equity Incentive Compensation Plan” columns of the Summary Compensation Table above. |
| | |
| (b) | NWLIC contributions are reflected in the “All Other Compensation” column in the Summary Compensation Table and are not additional earned compensation. |
| | |
| (c) | The investment options under the plan consist of a selection of mutual funds identical to those available to all employees through the 401(k) plan. The Company does not provide any above-market or preferential earnings rates, nor does it guarantee that an officer will have positive earnings under the investment options he or she selects. Since these amounts are not preferential, they are not included in the Summary Compensation Table. |
| | |
| (d) | The aggregate balance shown represents the sum of executive contributions, Company contributions, and aggregate earnings, less any distributions or withdrawals, through December 31, 2023. Balances in the plan are settled in cash upon the termination event selected by the officer and distributed either in a lump sum or in annual installments. Deferred amounts represent unsecured obligations of the Company. This column includes amounts that were reported in prior years’ Summary Compensation Tables to the extent the NEO was an NEO in one or more prior years. These amounts are as follows: $1,361,025 for Mr. Moody; $316,678 for Mr. Pribyl; $320,069 for Mr. Perez; and $259,121 for Mr. Tope. |
Potential Payments Upon Termination or Change in Control
As of December 31, 2023, other than any outstanding SARs, RSUs, and PSUs under the Amended Incentive Plan (and any predecessor plan), Ross R. Moody’s December 2023 Change in Control & Severance Agreement, and the 2019 Change in Control Agreements of each of the then Chairmanother Named Executive Officers, the Company has no contract, agreement, plan, or arrangement, written or unwritten, that provides for payment to any Named Executive Officer at, following, or in connection with any termination, severance, retirement or a constructive termination, or a change in control of the Company. ThisCompany, or a change in any officer’s responsibilities.
Termination of Employment without Cause in Absence of a Change in Control
Under Mr. Moody’s Change in Control & Severance Agreement, if Mr. Moody’s employment is terminated by us for any reason other than for “cause,” death, or incapacity during the employment period (but not within three years of a “change in control,” as defined in the agreement), subject to his execution of a release of claims, he will be entitled to (1) a lump sum cash amount equal to two times the sum of his annual base salary and his target bonus payable within 10 business days following the date of the employment termination and (2) financial counseling services, not to exceed $35,000, for a one-year period after termination of employment.
In addition, in the event of any such termination, the agreement provides that for the sole purposes of the vesting of any incentive awards outstanding at the time of termination and for determining the expiration date of any such award, Mr. Moody’s employment shall be treated as having extended until the third anniversary of the date of termination. Under the agreement, “cause” is defined as the willful and continued failure of the executive to perform substantially the executive’s duties owed to the Company or its affiliates after a written demand for substantial performance is delivered to the executive specifically identifying the nature of such unacceptable performance.
Change in Control
The Company currently has one equity compensation plan, is intendedthe Amended Incentive Plan. As of December 31, 2023, there were a total of 291,000 shares of Class A Stock that were authorized for issuance upon the settlement or exercise, as applicable, of awards granted pursuant to the plan. However, as of December 31, 2023, there were no outstanding stock options. Furthermore, under the terms of all outstanding SARs, RSUs and PSUs, all such awards may be settled only in cash. Accordingly, no shares of Class A Stock are issuable under the terms of such awards.
The Amended Incentive Plan governs the SARs, RSUs and PSUs that have been granted to our executive officers. Pursuant to the Amended Incentive Plan, the terms regarding any vesting acceleration may be set forth in the award agreements relating to such SARs, RSUs and PSUs. With respect to all outstanding awards of SARs, RSUs and PSUs that have been granted to our executive officers, the underlying award agreements for such SARs, RSUs and PSUs provide for post-2004 benefit accruals that mirror and supplementaccelerated vesting upon the pre-2005 benefit accrualsoccurrence of a change in control. The provisions contained in the preceding sentence are inapplicable to an award granted within six months before the occurrence of a change in control if the holder of such award is subject to the reporting requirements of Section 16(a) of the Exchange Act. The provisions contained in this paragraph shall not terminate any rights of the holder to further payments pursuant to any other agreement with the Company following a change in control.
Our Named Executive Officers hold grants under the Amended Incentive Plan, as well as one tranche of fully-vested SARS under a predecessor plan. Grants under the Amended Incentive Plan will immediately vest upon a change in control. The following table depicts potential benefits for our Named Executive Officers as a result of a change in control. Such termination is assumed to occur on December 31, 2023.
Acceleration of Vesting of SARs, RSUs, and PSUs Upon Change in Control
| Named Executive Officer | | Intrinsic
Value
of Accelerated SARs, RSUs, and PSUs (1)
($) | |
| | | |
| Ross R. Moody | | | 48,467,629 | |
| | | | |
| Rey Perez | | | 2,108,578 | |
| | | | |
| Brian M. Pribyl | | | 1,470,034 | |
| | | | |
| Chad J. Tope | | | 1,857,933 | |
| | | | |
| Gregory J. Owen | | | 1,313,163 | |
| (1) | Value is based upon the closing price per share of our Class A Stock on the NASDAQ Global Select Market on December 29, 2023, the last trading day of 2023, which was $483.02. |
Mr. Moody’s Change in Control & Severance Agreement provides for severance payments upon a termination of employment by us for any reason except for “cause,” death or incapacity, or by Mr. Moody for certain reasons specified in such agreement, within three years following a “change in control.” In the event of a qualifying termination following a change in control, Mr. Moody would be entitled to (1) a lump sum cash amount payable within 10 business days after his termination date equal to (a) his currently effective annual base salary through the termination date plus any accrued vacation pay and (b) an amount equal to two times the sum of his annual base salary plus his target bonus, (2) reimbursement of up to $50,000 for expenses and costs related to outplacement services, the provider of which shall be selected by Mr. Moody in his sole discretion, (3) continued use of a company car for one year following the termination date, and (4) reimbursement up to $75,000 for legal fees and expenses incurred as a result of any dispute resolution process entered into by Mr. Moody to enforce the agreement.
The Change in Control Agreements with each of our Named Executive Officers other than Mr. Moody provide for severance payments upon a termination of employment by us for any reason except for “cause,” death or incapacity, or by the Named Executive Officer for certain reasons specified in such agreement, within two years following a “change in control.” In the event of a qualifying termination following a change in control, the terminated executive would be entitled to a lump sum cash amount equal to his or her currently effective annual base salary and any accrued vacation pay through the termination date, plus a lump sum cash amount equal to the sum of his or her annual base salary and target bonus, both payable within 10 business days following the date of termination.
Under these change in control agreements with Mr. Moody and the other Named Executive Officers, if the executive terminates his or her employment after one or more of the following events following a change in control, such termination is treated as a qualifying termination for purposes of the benefits payable under the agreements: (1) the executive’s annual base salary, target bonus or any of his or her other material compensation arrangements is materially reduced, unrelated to his or her performance, (2) the executive’s duties or responsibilities are negatively and materially changed in a manner inconsistent with his or her position or authority, (3) the Company requires the executive’s work location or residence to be relocated more than 25 miles from its location as of the change in control, or (4) the Company or its successor fails to offer the executive a comparable position after the change in control.
Under these change in control agreements with Mr. Moody and the other Named Executive Officers, “cause” is generally defined as the willful and continued failure of the executive to perform substantially the executive’s duties owed to the Company or its affiliates after demand for performance is delivered to the executive identifying the nature of such unacceptable performance. A “change in control” is deemed to occur if:
(a) any person or group of persons (within the meaning of Section 13(d) of the Exchange Act), other than NWLGI or a subsidiary of NWLGI or an employee benefit plan sponsored by NWLGI or a subsidiary of NWLGI, acquires beneficial ownership (as defined in Section 13(d) (directly or indirectly)) of (i) 50 percent or more of the outstanding securities of NWLGI entitled to vote in the elections of directors (or securities or rights convertible into or exchangeable for such securities) (“Stock”) of NWLGI, or (ii) Stock having a total number of votes that may be cast and elect a majority of the directors of NWLGI; or
(b) there shall have been a change in a majority of the members of the Board of Directors of NWLGI within a twelve month period, unless the election or nomination for election by NWLGI’s stockholders of each new director during such twelve month period was approved by the vote of two-thirds of the directors then still in office who were directors at the beginning of such twelve month period; or
(c) the stockholders of NWLGI shall approve (i) any consolidation, merger, or other reorganization of NWLGI in which NWLGI is not the continuing or surviving corporation or pursuant to which shares of Stock would be converted into cash, securities, or other property, other than a merger of NWLGI in which holders of Stock immediately prior to the merger have either the same proportionate ownership of common stock of the surviving corporation immediately after the merger as immediately before or have more than 50 percent of the ownership of voting common stock of the surviving corporation immediately after the merger, or (ii) any sale, lease, exchange, or other transfer in one transaction or a series of related transactions of 50 percent or more of the assets of NWLGI; or
(d) there shall occur a liquidation or dissolution of NWLGI.
A similar change in control definition applies with respect to the Amended Incentive Plan (except that stockholder approval applies with respect to the subject matter set forth in subparagraph (d) above), which was amended by the Board of Directors, effective December 2022, to (among other things) provide that, effective with respect to the December 2022 SARs, RSUs and PSUs, that a change in control shall not occur under subparagraph (c) or (d) above with respect to a merger, consolidation, liquidation, sale or disposition referred to in such subparagraph (as applicable) unless and until such merger, consolidation, liquidation, sale or disposition has been consummated. The NEOs, as well as certain other officers, have agreed that the modified change in control definition will apply to all outstanding SARs, RSUs, and PSUs held by those officers, even those awards made prior to December 2022.
Payments and Benefits Upon Termination of Employment
The following table reflects the estimated payments and benefits that may be made or provided to the Named Executive Officers upon certain terminations of employment as described above. If applicable, these payments and benefits are in addition to the benefits of automatic acceleration of vesting of SARs, RSUs and PSUs upon a change in control described in the table above. The estimated payments in the table are calculated based on the assumption that the hypothetical termination of employment occurred on December 31, 2023. See the table above titled “Acceleration of Vesting of SARs, RSUs, and PSUs Upon Change in Control” for a calculation of the intrinsic value of accelerated equity following a change in control.
| Named Executive Officer | | Scenario | | Cash
Severance ($) | | | Benefits
($) | | | Total
($) | |
| | | | | | | | | | | | |
| Ross R. Moody | | Voluntary Resignation (No Good Reason) | | | — | | | | — | | | | — | |
| | | Qualifying Termination | | | 4,853,724 | | | | 35,000 | | | | 4,888,724 | |
| | | Involuntary Termination for Cause | | | — | | | | — | | | | — | |
| | | Qualifying Termination Following Change In Control* | | | 4,853,724 | | | | 125,000 | | | | 4,978,724 | |
| | | No Termination Following Change in Control* | | | — | | | | — | | | | — | |
| | | | | | | | | | | | | | | |
| Rey Perez | | Voluntary Resignation (No Good Reason) | | | — | | | | — | | | | — | |
| | | Qualifying Termination | | | 1,000,000 | | | | — | | | | 1,000,000 | |
| | | Involuntary Termination for Cause | | | — | | | | — | | | | — | |
| | | Qualifying Termination Following Change In Control* | | | 1,000,000 | | | | — | | | | 1,000,000 | |
| | | No Termination Following Change in Control* | | | — | | | | — | | | | — | |
| | | | | | | | | | | | | | | |
| Brian M. Pribyl | | Voluntary Resignation (No Good Reason) | | | — | | | | — | | | | — | |
| | | Qualifying Termination | | | 663,000 | | | | — | | | | 663,000 | |
| | | Involuntary Termination for Cause | | | — | | | | — | | | | — | |
| | | Qualifying Termination Following Change In Control* | | | 663,000 | | | | — | | | | 663,000 | |
| | | No Termination Following Change in Control* | | | — | | | | — | | | | — | |
| | | | | | | | | | | | | | | |
| Chad J. Tope | | Voluntary Resignation (No Good Reason) | | | — | | | | — | | | | — | |
| | | Qualifying Termination | | | 888,676 | | | | — | | | | 888,676 | |
| | | Involuntary Termination for Cause | | | — | | | | — | | | | — | |
| | | Qualifying Termination Following Change In Control* | | | 888,676 | | | | — | | | | 888,676 | |
| | | No Termination Following Change in Control* | | | — | | | | — | | | | — | |
| | | | | | | | | | | | | | | |
| Gregory J. Owen | | Voluntary Resignation (No Good Reason) | | | — | | | | — | | | | — | |
| | | Qualifying Termination | | | 425,713 | | | | — | | | | 425,713 | |
| | | Involuntary Termination for Cause | | | — | | | | — | | | | — | |
| | | Qualifying Termination Following Change In Control* | | | 425,713 | | | | — | | | | 425,713 | |
| | | No Termination Following Change in Control* | | | — | | | | — | | | | — | |
| * | Note: As disclosed in the preceding table titled “Acceleration of Vesting of SARs, RSUs, and PSUs Upon Change in Control,” in connection with a change in control, regardless of whether the Named Executive Officer is terminated, the Named Executive Officer would receive the benefits of automatic acceleration of vesting of SARs, RSUs and PSUs upon a change in control. |
Under the terms of their respective change in control agreements, each Named Executive Officer would also be entitled to be paid the amounts of any accrued salary and accrued vacation through the date of termination to the extent not previously discussed non-qualified plan, while complyingpaid or provided. In addition, Mr. Moody would also be entitled to the following: (1) reimbursement of up to $50,000 for expenses and costs related to outplacement services, (2) continued use of a company car for one year following the termination date, and (3) reimbursement up to $75,000 for legal fees and expenses incurred as a result of any dispute resolution process entered into by Mr. Moody to enforce the agreement.
CEO Pay Ratio
We calculated the CEO Pay Ratio in compliance with the requirements of the Act.
Effective November 1, 2005, National Western established a third non-qualified defined benefit plan for the benefitSection 953(b) of the then PresidentDodd-Frank Wall Street Reform and Consumer Protection Act and Item 402(u) of Regulation S-K. Our median employee was identified from our total employee population (excluding the Company. This plan is intended to provideCEO) as of December 31, 2023, using total gross earnings for post-2004 benefit accruals2023 as our consistently applied compensation measure, without annualizing the compensation of individuals who were employed for less than the full year. We determined that supplement the pre-2005 benefit accruals under the first non-qualified plan as previously discussed, while complying with the requirements of the Act.
Ozark National and NIS have no defined benefit plans.
NATIONAL WESTERN LIFE GROUP, INC.
NOTES TO CONSOLIDATED FINANCIAL STATEMENTS
A detail of plan disclosures related to the amendments of the original plan and the additional 2 plans is provided below:
Obligations and Funded Status
| | | | | | | | | | | |
| | December 31, |
| | 2021 | | 2020 |
| | (In thousands) |
| | | |
| Changes in projected benefit obligations: | | | |
| Projected benefit obligations at beginning of year | $ | 51,571 | | | 29,258 | |
| Service cost | 1,235 | | | 1,209 | |
| Interest cost | 1,044 | | | 1,350 | |
| Actuarial (gain) loss | (7,420) | | | 21,736 | |
| Benefits paid | (1,982) | | | (1,982) | |
| | | |
| Projected benefit obligations at end of year | 44,448 | | | 51,571 | |
| | | |
| Change in plan assets: | | | |
| Fair value of plan assets at beginning of year | — | | | — | |
| Contributions | 1,982 | | | 1,982 | |
| Benefits paid | (1,982) | | | (1,982) | |
| | | |
| Fair value of plan assets at end of year | — | | | — | |
| | | |
| Funded status at end of year | $ | (44,448) | | | (51,571) | |
The Projected Benefit Obligation decreased in 2021 due to the following:
•An experience gain of approximately $4,208,000 due to census demographics different than assumed including changes inmedian employee’s annual total compensation different than assumed.
•An experience loss of approximately $80,000 due to the change in mortality.
•An experience gain of approximately $3,292,000 due to the increasefor 2023 in the discount rate from 2.25% to 2.75%.
The Projected Benefit Obligation increased in 2020 from the prior year due to the following:
•An experience loss of approximately $16,720,000 due to census demographics different than assumed including increases in actual compensation more than the actuarial assumption.
•An experience gain of approximately $441,000 due to the change in mortality.
•An experience loss of approximately $5,457,000 due to the decrease in the discount rate from 3.00% to 2.25%.
NATIONAL WESTERN LIFE GROUP, INC.
NOTES TO CONSOLIDATED FINANCIAL STATEMENTS
| | | | | | | | | | | |
| December 31, |
| | 2021 | | 2020 |
| | (In thousands) |
| | | |
| Amounts recognized in the Company's Consolidated Financial Statements: | | | |
| Assets | $ | — | | | — | |
| Liabilities | (44,448) | | | (51,571) | |
| | | |
| Net amount recognized | $ | (44,448) | | | (51,571) | |
| | | |
| Amounts recognized in accumulated other comprehensive income: | | | |
| Net (gain) loss | $ | 13,925 | | | 26,476 | |
| Prior service cost | 345 | | | 404 | |
| | | |
| Net amount recognized | $ | 14,270 | | | 26,880 | |
The accumulated benefit obligation was $26.4 million and $27.0 million at December 31, 2021 and 2020, respectively.
Components of Net Periodic Benefit Cost
| | | | | | | | | | | | | | | | | |
| | Years Ended December 31, |
| | 2021 | | 2020 | | 2019 |
| | (In thousands) |
| | | | | |
| Components of net periodic benefit cost: | | | | | |
| Service cost | $ | 1,235 | | | 1,209 | | | 502 | |
| Interest cost | 1,044 | | | 1,350 | | | 1,025 | |
| Amortization of prior service cost | 59 | | | 59 | | | 59 | |
| Amortization of net loss (gain) | 5,131 | | | 5,781 | | | 1,391 | |
| | | | | |
| Net periodic benefit cost | 7,469 | | | 8,399 | | | 2,977 | |
| | | | | |
| Other changes in plan assets and benefit obligations recognized in other comprehensive income: | | | | | |
| Net loss (gain) | (7,420) | | | 21,736 | | | 7,438 | |
| Amortization of prior service cost | (59) | | | (59) | | | (59) | |
| Amortization of net loss (gain) | (5,131) | | | (5,781) | | | (1,391) | |
| | | | | |
| Total recognized in other comprehensive income | (12,610) | | | 15,896 | | | 5,988 | |
| | | | | |
| Total recognized in net periodic benefit cost and other comprehensive income | $ | (5,141) | | | 24,295 | | | 8,965 | |
The components of net periodic benefit cost including service cost are reported in "Other operating expenses" in the Consolidated Statement of Earnings.
NATIONAL WESTERN LIFE GROUP, INC.
NOTES TO CONSOLIDATED FINANCIAL STATEMENTS
Assumptions
| | | | | | | | | | | |
| | December 31, |
| | 2021 | | 2020 |
| | | |
| Weighted-average assumptions used to determine benefit obligations: | | | |
| Discount rate | 2.75 | % | | 2.25 | % |
| Rate of compensation increase | 8.00 | % | | 8.00 | % |
| | | | | | | | | | | | | | | | | |
| | December 31, |
| | 2021 | | 2020 | | 2019 |
| | | | | |
| Weighted-average assumptions used to determine net periodic benefit costs: | | | | | |
| Discount rate | 2.25 | % | | 3.00 | % | | 4.00 | % |
| Expected long-term return on plan assets | n/a | | n/a | | n/a |
| Rate of compensation increase | 8.00 | % | | 8.00 | % | | 8.00 | % |
The plan is unfunded and therefore no assumption has been made related to the expected long-term return on plan assets.
Plan Assets
The plan is unfunded and therefore had no assets at December 31, 2021 or 2020.
Contributions
National Western expects to contribute approximately $2.0 million to the plan in 2022.
Estimated Future Benefit Payments
The following benefit payments, which reflect expected future service, as appropriate, are expected to be paid (in thousands):
| | | | | |
| 2022 | $ | 1,982 | |
| 2023 | 1,982 | |
| 2024 | 1,982 | |
| 2025 | 1,982 | |
| 2026 | 1,982 | |
| 2027-2031 | 13,084 | |
(B) Defined Contribution Pension Plans
In addition to the defined benefit pension plans, National Western sponsors a qualified 401(k) plan for substantially all employees and a non-qualified deferred compensation plan primarily for senior officers. National Western made annual contributions to the 401(k) plan in 2021, 2020, and 2019 of up to 4 percent of each employee's compensation, based on the employee's personal level of salary deferrals to the plan. Contributions prior to 2021 are subject to a vesting schedule based on the employee's years of service and those for 2021 are not subject to a vesting schedule. For the years ended December 31, 2021, 2020, and 2019, NWLIC contributions totaled $755,000, $720,000, and $664,000, respectively.
NATIONAL WESTERN LIFE GROUP, INC.
NOTES TO CONSOLIDATED FINANCIAL STATEMENTS
The non-qualified deferred compensation plan sponsored by National Western was established to allow eligible employees to defer the payment of a percentage of their compensation and to provide for additional company contributions. Contributions are subject to a vesting schedule based on the employee's years of service. For the years ended December 31, 2021, 2020, and 2019, contributions totaled $143,000, $175,000, and $97,000, respectively.
Ozark sponsors a qualified 401(k) plan for substantially all employees of Ozark and NIS. The employer match was discretionary for deferral dates prior to 2021. In 2021, Ozark contributions for employee deferrals went up to 4 percent of each employee's compensation, based on the employee's personal level of salary deferrals to the plan. Contributions for deferral dates prior to 2021 were subject to a graded vesting schedule while 2021 contributions are not subject to a vesting schedule. Expense related to this plan totaled $125,000, $175,000, and $176,000 for Ozark and $10,000, $17,000, and $30,000 for NIS for the years ended December 31, 2021, 2020, and 2019, respectively.
Ozark also sponsors a non-qualified, unfunded retirement plan covering certain members of executive staff. The plan is funded solely through discretionary employer contributions. Expense related to this plan totaled $24,000, $247,000, and $45,000 for the years ended December 31, 2021, 2020, and 2019, respectively.
(C) Postretirement Employment Plans Other Than Pension
National Western sponsors 2 health care plans that were amended in 2004 to provide postretirement benefits to certain fully-vested individuals. The plan is unfunded. A December 31 measurement date issame manner used for the
plan. A detailNamed Executive Officers in the Summary Compensation Table.
For 2023, our median employee’s (excluding the CEO) annual total compensation was $60,070 and our Chief Executive Officer’s annual total compensation was $11,056,664. As such, our CEO to Employee Pay Ratio was 184 to 1. Our Chief Executive Officer’s annual total compensation, as reported in the Summary Compensation Table above, for 2023 was $11,056,664 as compared to $12,896,376 for 2022.
This pay ratio is a reasonable good faith estimate calculated in a manner consistent with SEC rules based on our payroll and employment records and the methodology described above. The SEC rules for identifying the median compensated employee and calculating the pay ratio based on his or her annual total compensation allow companies to use a variety of plan disclosures relatedmethodologies, to apply certain exclusions, and to make reasonable estimates and assumptions that reflect their compensation practices. As such, the pay ratio reported by other companies may not be comparable to the planpay ratio we report above, as other companies may have different employment and compensation practices and may use different methodologies, exclusions, estimates and assumptions to calculate their own pay ratios.
Director Compensation
The following table sets forth the compensation for 2023 for those individuals who served as members of the Company’s Board of Directors during 2023 (excluding Ross Moody, who receives compensation for serving on the Board of Directors, whose director compensation is provided below:
Obligations and Funded Status
| | | | | | | | | | | |
| | December 31, |
| | 2021 | | 2020 |
| | (In thousands) |
| | | |
| Changes in projected benefit obligations: | | | |
| Projected benefit obligations at beginning of year | $ | 6,469 | | | 5,782 | |
| Interest cost | 148 | | | 165 | |
| Actuarial (gain) loss | (457) | | | 522 | |
| Benefits paid | — | | | — | |
| | | |
| Projected benefit obligations at end of year | 6,160 | | | 6,469 | |
| | | |
| Changes in plan assets: | | | |
| Fair value of plan assets at beginning of year | — | | | — | |
| Contributions | — | | | — | |
| Benefits paid | — | | | — | |
| | | |
| Fair value of plan assets at end of year | — | | | — | |
| | | |
| Funded status at end of year | $ | (6,160) | | | (6,469) | |
The Projected Benefit Obligation decreased in 2021 due to the following:
•An experience loss of approximately $123,000 due to the claims/healthcare cost trend experience.
•An experience loss of approximately $30,000 due to the change in mortality.
•An experience gain of approximately $610,000 due to the increaseincluded in the discount rate from 2.25%Summary Compensation Table).
| Name | | Fees Earned or
Paid in Cash ($) | | | RSU
Awards
($) | | | All Other
Compensation ($) | | | Total
($) | |
| | | | | | | | | | | | | |
| Dr. Thomas A. Blackwell | | | 97,600 | | | | 142,765 | | | | 928 | | | | 241,293 | |
| | | | | | | | | | | | | | | | | |
| David S. Boone | | | 99,000 | * | | | 142,765 | | | | 16,047 | (a) | | | 257,812 | |
| | | | | | | | | | | | | | | | | |
| Stephen E. Glasgow | | | 75,000 | * | | | 142,765 | | | | 33,485 | (b) | | | 251,250 | |
| | | | | | | | | | | | | | | | | |
| E. Douglas McLeod | | | 43,000 | | | | 142,765 | | | | 718 | | | | 186,483 | |
| | | | | | | | | | | | | | | | | |
| Charles D. Milos | | | 43,000 | | | | 142,765 | | | | 36,592 | (c) | | | 222,357 | |
| | | | | | | | | | | | | | | | | |
| Frances A. Moody-Dahlberg | | | 43,000 | | | | 142,765 | | | | 16,047 | (d) | | | 201,812 | |
| | | | | | | | | | | | | | | | | |
| E.J. Pederson | | | 123,400 | * | | | 142,765 | | | | 718 | | | | 266,883 | |
| | | | | | | | | | | | | | | | | |
| Todd M. Wallace | | | 60,000 | * | | | 142,765 | | | | 44,283 | | | | 247,048 | |
| Note: | The All Other Compensation column includes company-paid premiums for term life coverage and director gifts for all directors. |
| * | The Fees Earned column includes Company subsidiary director fees of $6,000 for Mr. Boone, $17,000 for Mr. Glasgow, $6,000 for Mr. Pederson, and $17,000 for Mr. Wallace. |
| (a) | The amount shown for Mr. Boone also includes $15,119 value of the company’s Group Excess Benefit Plan. |
| | |
| (b) | The amount shown for Mr. Glasgow also includes $15,119 value of the company’s Group Excess Benefit Plan and the value of the health insurance plan. |
| | |
| (c) | The amount shown for Mr. Milos also includes $15,119 value of the company’s Group Excess Benefit Plan and the value of the health insurance plan. |
| | |
| (d) | The amount shown for Mrs. Moody-Dahlberg also includes $15,119 value of the company’s Group Excess Benefit Plan. |
| | |
| (e) | The amount shown for Mr. Wallace also includes $15,119 value of the company’s Group Excess Benefit Plan and the value of the health insurance plan. |
Company directors received $3,000 per month in retainer fees and $1,000 for each board meeting attended in 2023. They are also reimbursed for actual travel expenses incurred in performing services as directors. An additional $1,000 is paid for each committee meeting attended. The amounts paid pursuant to 2.75%.
The Projected Benefit Obligation increased in 2020 from
Directors of the prior year due toCompany, including employees of the following:
•An experience lossCompany serving as director, are eligible for restricted stock awards, incentive awards, and performance awards under the Amended Incentive Plan. Company directors, including members of approximately $389,000 due to the claims/healthcare cost trend experience.
•An experience gain of approximately $656,000 due to the change in actuarial assumptions.
•An experience gain of approximately $104,000 due to the change in mortality.
•An experience loss of approximately $893,000 due to the decrease in the discount rate from 3.00% to 2.25%.
| | | | | | | | | | | |
| | December 31, |
| | 2021 | | 2020 |
| | (In thousands) |
| | | |
| Amounts recognized in the Company's Consolidated Financial Statements: | | | |
| Assets | $ | — | | | — | |
| Liabilities | (6,160) | | | (6,469) | |
| | | |
| Net amount recognized | $ | (6,160) | | | (6,469) | |
| | | |
| Amounts recognized in accumulated other comprehensive income: | | | |
| Net (gain) loss | $ | 1,539 | | | 2,288 | |
| Prior service cost | — | | | — | |
| | | |
| Net amount recognized | $ | 1,539 | | | 2,288 | |
The accumulated benefit obligation was $6.2 million and $6.5 million at December 31, 2021 and 2020, respectively.
NATIONAL WESTERN LIFE GROUP, INC.
NOTES TO CONSOLIDATED FINANCIAL STATEMENTS
Components of Net Periodic Benefit Cost
| | | | | | | | | | | | | | | | | |
| | Years Ended December 31, |
| | 2021 | | 2020 | | 2019 |
| | (In thousands) |
| | | | | |
| Components of net periodic benefit cost: | | | | | |
| Interest cost | $ | 148 | | | 165 | | | 198 | |
| Amortization of prior service cost | — | | | — | | | 52 | |
| Amortization of net loss | 292 | | | 158 | | | 244 | |
| | | | | |
| Net periodic benefit cost | 440 | | | 323 | | | 494 | |
| | | | | |
| Other changes in plan assets and benefit obligations recognized in other comprehensive income: | | | | | |
| Net loss (gain) | (457) | | | 522 | | | 1,354 | |
| Amortization of prior service cost | — | | | — | | | (52) | |
| Amortization of net loss (gain) | (292) | | | (158) | | | (244) | |
| | | | | |
| Total recognized in other comprehensive income | (749) | | | 364 | | | 1,058 | |
| | | | | |
| Total recognized in net periodic benefit cost and other comprehensive income | $ | (309) | | | 687 | | | 1,552 | |
As the plansCompensation Committee, are not funded, there is no expected return on plan assets shown in the net periodic benefit cost table above. Ozark National and NIS do not offer postretirement employment benefits.
The components of net periodic benefit cost including service cost are reported in "Other operating expenses" in the Consolidated Statement of Earnings.
Assumptions
| | | | | | | | | | | |
| | December 31, |
| | 2021 | | 2020 |
| | | |
| Weighted-average assumptions used to determine benefit obligations: | | | |
| Discount rate | 2.75 | % | | 2.25 | % |
| Expected long-term return on plan assets | n/a | | n/a |
| | | | | | | | | | | | | | | | | |
| | December 31, |
| | 2021 | | 2020 | | 2019 |
| | | | | |
| Weighted-average assumptions used to determine net periodic benefit costs: | | | | | |
| Discount rate | 2.25 | % | | 3.00 | % | | 4.00 | % |
| Expected long-term return on plan assets | n/a | | n/a | | n/a |
NATIONAL WESTERN LIFE GROUP, INC.
NOTES TO CONSOLIDATED FINANCIAL STATEMENTS
For measurement purposes, a 7.5% annual rate of increase in the per capita cost of covered health care benefits was assumedeligible for 2022, decreasing annually by 0.5% until reaching an ultimate rate of 5%.
Plan Assets
The plans are unfunded and therefore had no assets at December 31, 2021 and 2020.
Contributions
nondiscretionary stock options. The following benefit payments, which reflect expected future service, as appropriate, are expectedtable provides information regarding RSU awards to be paid (in thousands):
| | | | | |
| 2022 | $ | — | |
| 2023 | — | |
| 2024 | — | |
| 2025 | — | |
| 2026 | 198 | |
| 2027-2031 | 1,354 | |
(15) FEDERAL INCOME TAXES
Total Federal income taxes were allocated as follows:
| | | | | | | | | | | | | | | | | |
| | Years Ended December 31, |
| | 2021 | | 2020 | | 2019 |
| | (In thousands) |
| | | | | |
| Taxes (benefits) on earnings from continuing operations: | | | | | |
| Current | $ | 42,829 | | | (275) | | | 58,834 | |
| Deferred | 3,747 | | | 20,031 | | | (25,294) | |
| | | | | |
| Taxes on earnings | 46,576 | | | 19,756 | | | 33,540 | |
| | | | | |
| Taxes (benefits) on components of stockholders' equity: | | | | | |
| Net unrealized gains and losses on securities available-for-sale | (51,177) | | | 92,528 | | | 26,836 | |
| Foreign currency translation adjustments | (4) | | | 4 | | | 139 | |
| Change in benefit plan liability | 3,474 | | | (3,398) | | | (1,158) | |
| Change in accounting | — | | | (806) | | | — | |
| | | | | |
| | | | | |
| Total Federal income taxes | $ | (1,131) | | | 108,084 | | | 59,357 | |
.
NATIONAL WESTERN LIFE GROUP, INC.
NOTES TO CONSOLIDATED FINANCIAL STATEMENTS
The provisions for Federal income taxes attributable to earnings from continuing operations vary from amounts computed by applying the statutory income tax rate to income statement earnings before Federal income taxes due to differences between the financial statement reporting and income tax treatment of certain items. These differences and the corresponding tax effects are as follows:
| | | | | | | | | | | | | | | | | |
| | Years Ended December 31, |
| | 2021 | | 2020 | | 2019 |
| | (In thousands) |
| | | | | |
| Income tax expense at statutory rate of 21% | $ | 47,724 | | | 23,534 | | | 34,683 | |
| Dividend received deduction | (394) | | | (401) | | | (493) | |
| Tax exempt interest | (1,263) | | | (1,436) | | | (1,564) | |
| | | | | |
| Non deductible salary expense | 439 | | | 351 | | | 294 | |
| | | | | |
| Adjustments pertaining to prior tax years | (63) | | | (8) | | | 459 | |
| Nondeductible insurance | 96 | | | 96 | | | 96 | |
| Nondeductible expenses | 54 | | | 44 | | | 117 | |
| Tax rate differential for loss carryback | — | | | (2,497) | | | — | |
| Other, net | (17) | | | 73 | | | (52) | |
| | | | | |
| Taxes on earnings from continuing operations | $ | 46,576 | | | 19,756 | | | 33,540 | |
The Coronavirus Aid, Relief and Economic Security (CARES) Act was signed into law on March 27, 2020 to provide relief to businesses impacted by the Coronavirus pandemic. The CARES Act included a temporary reprieve from the carryback limitation on the use of net operating losses, allowing taxpayers to carryback certain net operating losses generated from 2018 through 2020 for up to five years in order to claim a refund of taxes paid in prior years. Accordingly, the Company was permitted to carryback the taxable loss generated indirectors during the year ended December 31,
2020 to tax years when2023 under the
corporate tax rate was 35%. This resultedCompany’s Incentive Plan. The RSUs vest one year from the date of grant, and are payable solely in
a permanent tax benefitcash at the vesting date equal to the
14% corporate tax rate differential between20-day average closing price of the
carryback rateClass A Stock up to and including the vesting date.
| Name | | Grant Date | | All Other Option Awards: Number of Securities Underlying
RSUs (#) | | Exercise or Base Price of RSU Awards ($)* | | | Grant Date Fair Value of RSU Awards ($) | |
| | | | | | | | | | | |
| Dr. Thomas A. Blackwell | | 06/22/23 | | 217 | | | 384.26 | | | | 83,384 | |
| | | | | | | | | | | | | |
| David S. Boone | | 06/22/23 | | 217 | | | 384.26 | | | | 83,384 | |
| | | | | | | | | | | | | |
| Stephen E. Glasgow | | 06/22/23 | | 217 | | | 384.26 | | | | 83,384 | |
| | | | | | | | | | | | | |
| E. Douglas McLeod | | 06/22/23 | | 217 | | | 384.26 | | | | 83,384 | |
| | | | | | | | | | | | | |
| Charles D. Milos | | 06/22/23 | | 217 | | | 384.26 | | | | 83,384 | |
| | | | | | | | | | | | | |
| Frances A. Moody-Dahlberg | | 06/22/23 | | 217 | | | 384.26 | | | | 83,384 | |
| | | | | | | | | | | | | |
| E. J. Pederson | | 06/22/23 | | 217 | | | 384.26 | | | | 83,384 | |
| | | | | | | | | | | | | |
| Todd M. Wallace | | 06/22/23 | | 217 | | | 384.26 | | | | 83,384 | |
| | | | | | | | | | | | | |
| * | RSUs are payable solely in cash at the vesting date equal to the 20-day average closing price of the Class A Stock up to and including the vesting date. |
Item 12. Security Ownership of 35%Certain Beneficial Owners and Management and Related Stockholder Matters
The information provided below sets forth certain information as of April 25, 2024, regarding (i) the current statutory rateownership of 21%. There wasvoting securities of the Company by each person who is known to the management of the Company to have been the beneficial owner of more than five percent (5%) of the outstanding shares of the Company’s Class A Stock or Class B Stock; (ii) the ownership interest of each director of the Company; (iii) the ownership interest of each Named Executive Officer of the Company; and (iv) the ownership interest of executive officers and directors of the Company as a permanent tax benefitgroup. Insofar as is known to the Company, each such person, entity, or group has sole voting and dispositive power with respect to all such shares of $2.5 million reflectedClass A Stock and Class B Stock, except as may otherwise be noted.
For purposes of the tables below, the amounts and percentages of Class A Stock and Class B Stock beneficially owned are reported on the basis of regulations of the SEC governing the determination of beneficial ownership of securities. Under the rules of the SEC, a person is deemed to be a “beneficial owner” of a security if that person has or shares “voting power,” which includes the power to vote or to direct the voting of such security, or “dispositive power,” which includes the power to dispose of or to direct the disposition of such security. A person is also deemed to be a beneficial owner of any securities of which that person has a right to acquire beneficial ownership within 60 days, including through the exercise of options or warrants. However, the Company’s outstanding equity-linked compensatory awards may be settled or exercised solely for cash, and no shares of capital stock of the Company may be issued upon the settlement or exercise of those awards. Furthermore, there are currently no outstanding stock options. Beneficial ownership also includes securities that are the subject of a voting trust, proxy, power of attorney, or other similar agreement. Under these rules, more than one person may be deemed a beneficial owner of the same securities and a person may be deemed a beneficial owner of securities as to which he has no economic interest.
Security Ownership of Certain Beneficial Owners
Based solely upon filings made with the SEC, the following persons are the only persons known by us to own beneficially more than 5% of the outstanding shares of Class A Stock or Class B Stock as of April 25, 2024. Percent of class is calculated based on 3,436,020 shares of Class A Stock and 200,000 shares of Class B Stock outstanding as of April 25, 2024.
| Name and Address of Beneficial Owner | | Title of Class | | Amount and
Nature of
Beneficial
Ownership | | | Percent of
Class | |
| | | | | | | | | |
| Robert L. Moody Revocable Trust(1) | | Class B Stock | | | 198,074 | | | | 99.04 | % |
| 2302 Post Office Street, Suite 702 | | | | | | | | | | |
| Galveston, TX 77550 | | | | | | | | | | |
| | | | | | | | | | | |
| Three R Trust(1) | | Class B Stock | | | 198,074 | | | | 100.00 | % |
| 2302 Post Office Street, Suite 702 | | | | | | | | | | |
| Galveston, TX 77550 | | | | | | | | | | |
| | | | | | | | | | | |
| Ross R. Moody(2) | | Class A Stock | | | 298,474 | | | | 8.69 | % |
| 10801 N. Mopac Expy, Bldg 3 | | | | | | | | | | |
| Austin, TX 78759 | | | | | | | | | | |
| | | | | | | | | | | |
| Robert L. Moody, Jr.(3) | | Class A Stock | | | 298,390 | | | | 8.68 | % |
| 2302 Post Office Street, Suite 601 | | | | | | | | | | |
| Galveston, TX 77550 | | | | | | | | | | |
| | | | | | | | | | | |
| Frances A. Moody-Dahlberg(4) | | Class A Stock | | | 291,324 | | | | 8.48 | % |
| 2302 Post Office Street, Suite 704 | | | | | | | | | | |
| Galveston, TX 77550 | | | | | | | | | | |
| | | | | | | | | | | |
| Russell S. Moody(5) | | Class A Stock | | | 291,324 | | | | 8.48 | % |
| 2302 Post Office Street, Suite 704 | | | | | | | | | | |
| Galveston, TX 77550 | | | | | | | | | | |
| | | | | | | | | | | |
| Dimensional Fund Advisors LP(6) | | Class A Stock | | | 229,371 | | | | 6.68 | % |
| Building One | | | | | | | | | | |
| 6300 Bee Cave Road | | | | | | | | | | |
| Austin, TX 78746 | | | | | | | | | | |
| | | | | | | | | | | |
| The Vanguard Group(7) | | Class A Stock | | | 191,609 | | | | 5.58 | % |
| 100 Vanguard Blvd. | | | | | | | | | | |
| Malvern, PA 19355 | | | | | | | | | | |
| | | | | | | | | | | |
| BlackRock, Inc.(8) | | Class A Stock | | | 194,560 | | | | 5.66 | % |
| 55 East 52nd Street | | | | | | | | | | |
| New York, NY 10055 | | | | | | | | | | |
| (1) | Prior to the November 7, 2023 death of Robert L. Moody, Sr., the Chairman Emeritus of the Company, Mr. Moody was the controlling stockholder of the Company because he held, through the Moody Revocable Trust, the voting power to elect a majority of the members of the National Western Board of Directors. Under the terms of the Moody Revocable Trust, the shares of Class B common stock held by the Moody Revocable Trust Pass to the Three R Trust, a trust created by Robert Moody for the benefit of his children and their lineal descendants. The trustee of the Moody Revocable Trust, however, is authorized to retain trust properties, including the shares of Class B common stock, for as long as is necessary to administer the trust and Robert Moody’s estate, including the payment of debts, expenses, and taxes. Therefore, upon Robert Moody’s death, Three R Trust acquired beneficial ownership of the shares of Class B common stock held by the Moody Revocable Trust. However, legal title will remain with the Moody Revocable Trust for the foreseeable future. Therefore, until the transfer of legal title to Three R Trust, Moody Bank, as trustee of the Moody Revocable Trust, retains the voting power with respect to those shares of Class B common stock. In addition to its beneficial ownership of the shares of Class B common stock held by the Moody Revocable Trust, Three R Trust directly owns 2,500 shares of Class A common stock and the remaining 1,926 shares of Class B common stock outstanding. As a result, Three R Trust has beneficial ownership of 100% of the 200,000 outstanding shares of Class B common stock. Management has been advised that Moody Bank Holding Company, Inc. (“MBHC”), which is wholly-owned by Moody Bancshares, Inc. (“Bancshares”), owns approximately 98.5% of the common stock of Moody Bank. Management has been advised further that Three R Trust owns 100% of Bancshares’ Class B Stock (which elects a majority of Bancshares’ directors) and approximately 50.3% of Bancshares’ Class A Stock. Accordingly, Three R Trust, through ownership of Bancshares, controls Moody Bank. The Trustee of Three R Trust is Irwin M. Herz, Jr., One Moody Plaza, 18th Floor, Galveston, Texas. MBHC, Bancshares, Three R Trust, and Irwin M. Herz, Jr. may have shared voting and dispositive power with respect to the shares of Class B common stock that may be beneficially owned by Moody Bank. |
| (2) | Ross R. Moody is the Company’s Chairman of the Board, President and Chief Executive Officer. According to a Schedule 13D filed jointly on April 9, 2020 by Ross R. Moody, Moody RRM Interests Ltd. (the “RRM Partnership”), and Moody RRM Management Company LLC (“RRM Management”), the RRM Partnership acquired 289,474 shares of Class A common stock of the Company from the Moody Revocable Trust on March 30, 2020. Such Schedule 13D reports that RRM Management is general partner of the RRM Partnership and that Ross R. Moody is manager of RRM Management. Such Schedule 13D further reports that the RRM Partnership, RRM Management, and Ross R. Moody have shared voting and dispositive power with respect to 289,474 shares of Class A common stock and that Ross R. Moody disclaims beneficial ownership of such shares. A Statement of Changes in Beneficial Ownership on Form 4 filed by Ross R. Moody with the SEC on May 17, 2022 reports that Ross R. Moody directly owns 9,000 shares of Class A common stock. Mr. Moody is deemed to have sole voting and dispositive power with respect to such directly-owned shares. The principal address of the RRM Partnership and RRM management is as shown in the table above for Ross Moody. |
| (3) | According to a Schedule 13G filed jointly on February 14, 2023 by Robert L. Moody, Jr., Moody RLM Jr. Interests Ltd. (the “RLM Jr. Partnership”), and Moody RLM Jr. Management Company LLC (“RLM Jr. Management”) the RLM Jr. Partnership and RLM Jr. Management have shared voting and dispositive power with respect to 289,474 shares of Class A common stock and that Robert L. Moody, Jr. has shared voting and dispositive power with respect to 298,390 shares of Class A common stock. The principal address of the RLM Jr. Partnership and RLM Jr. Management is as shown in the table above for Mr. Moody, Jr. |
| (4) | Frances A. Moody-Dahlberg is a director of the Company. According to a Schedule 13D filed jointly on April 9, 2020 by Ms. Moody-Dahlberg, Moody FAMD Interests Ltd. (the “FAMD Partnership”), and Moody FAMD Management Company LLC (“FAMD Management”), the FAMD Partnership acquired 289,474 shares of Class A common stock of the Company from the Moody Revocable Trust on March 30, 2020. Such Schedule 13D reports that FAMD Management is general partner of the FAMD Partnership and that Ms. Moody-Dahlberg is manager of FAMD Management. Such Schedule 13D further reports that the FAMD Partnership, FAMD Management, and Ms. Moody-Dahlberg have shared voting and dispositive power with respect to 289,474 shares of Class A common stock and that Ms. Moody-Dahlberg disclaims beneficial ownership of such shares. Such Schedule 13D further reports that Ms. Moody-Dahlberg has sole voting and dispositive power with respect to 1,850 shares of Class A common stock. The principal address of the FAMD Partnership and FAMD Management is as shown in the table above for Ms. Moody-Dahlberg. |
| (5) | Russell S. Moody is an advisory director of the Company. According to an amended Schedule 13D filed jointly on April 7, 2020 by Russell S. Moody, Moody RSM Interests Ltd. (the “RSM Partnership”), Moody RSM Management Company LLC (“RSM Management”), Moody Bank, MBHC, Bancshares, Three R Trust, and Irwin M. Herz, Jr., the RSM Partnership acquired 289,474 shares of Class A common stock of the Company from the Moody Revocable Trust on March 30, 2020. Such amended Schedule 13D reports that RSM Management is general partner of the RSM Partnership, that Russell S. Moody and Moody National Bank are co-managers of RSM Management, and that Moody Bank is attorney-in-fact for Russell S. Moody pursuant to a Power of Attorney previously executed by him. Such amended Schedule 13D further reports that the RSM Partnership and RSM Management have shared voting and dispositive power with respect to 289,474 shares of Class A common stock; Russell S. Moody has shared voting and dispositive power with respect to 291,324 shares of Class A common stock (including the 289,474 shares owned by the RSM Partnership) and disclaims beneficial ownership of 289,474 of such shares; Moody Bank, MBHC and Bancshares have shared voting and dispositive power with respect to 291,325 shares of Class A common stock (including the 291,324 shares collectively owned by the RSM Partnership and by Russell S. Moody) and disclaim beneficial ownership of all of such shares; Three R Trust and Irwin M. Herz, Jr. have shared voting and dispositive power with respect to 293,825 shares of Class A common stock (including the 291,324 shares collectively owned by the RSM Partnership and by Russell S. Moody) and disclaim beneficial ownership of 291,325 of such shares; and Irwin M. Herz, Jr. has sole voting and dispositive power with respect to 2,000 shares of Class A common stock and disclaims beneficial ownership of 2,500 shares beneficially owned by Three R Trust. The principal address of the RSM Partnership, RSM Management, Moody Bank, MBHC, and Bancshares is 2302 Postoffice Street, Galveston, Texas 77550. The principal address of Three R Trust is 2302 Postoffice Street, Suite 702, Galveston, Texas 77550, and the principal address of Irwin M. Herz, Jr. is One Moody Plaza, 18th Floor, Galveston, Texas 77550. |
| (6) | In a Schedule 13G/A filed by Dimensional Fund Advisors LP (“Dimensional”) on February 9, 2024, Dimensional reported beneficially owning 229,371 Class A shares, with sole voting power with respect to 225,204 Class A shares and sole dispositive power with respect to 229,3711 Class A shares. According to such Schedule 13G/A, Dimensional is an investment adviser registered under the Investment Advisors Act of 1940, and the shares reported as beneficially owned by Dimensional are held by various investment companies registered under the Investment Company Act of 1940. The Schedule 13G/A also reported that Dimensional serves as investment manager or sub-adviser to certain other commingled funds, group trusts and separate accounts (such investment companies, trusts and accounts, collectively referred to as the “Funds”) and that, in certain cases, subsidiaries of Dimensional may act as an adviser or sub-adviser to certain Funds. The Schedule 13G/A further stated that all of the Class A shares included in the Schedule 13G/A were owned by the Funds and that Dimensional disclaimed beneficial ownership of all such shares. |
| (7) | In a Schedule 13G/A filed by The Vanguard Group (“Vanguard”) on February 13, 2024, Vanguard reported beneficially owning 191,609 Class A shares, with shared voting power with respect to 1,412 Class A shares, sole dispositive power with respect to 188,264 Class A shares, and shared dispositive power with respect to 3,345 Class A shares. According to such Schedule 13G/A, Vanguard is an investment adviser registered under the Investment Advisors Act of 1940. |
| (8) | In a Schedule 13G/A filed by BlackRock, Inc. on January 29, 2024, BlackRock, Inc. reported beneficially owning 194,560 Class A shares, with sole voting power with respect to 189,715 Class A shares and sole dispositive power with respect to 194,560 Class A shares. According to such Schedule 13G/A, BlackRock, Inc. is a parent holding company in accordance with Rule 13d-1(b)(1)(ii)(G) under the Exchange Act. |
Security Ownership of Directors and Executive Officers
Except under applicable community property laws or as otherwise indicated in the reconciliation offootnotes to the tax rate fortable below, the year ended December 31, 2020. An additional permanent tax benefit of $120,000 has been reflected in the reconciliation of the tax rate for the year ended December 31, 2021 as the true up from provision to actual for the carryback claim.
The Company generally expects its effective tax rate to be slightly less than the current statutory rate due to recurring permanent differences that reduce tax expense, principally tax exempt interest income and the dividend received deduction.
NATIONAL WESTERN LIFE GROUP, INC.
NOTES TO CONSOLIDATED FINANCIAL STATEMENTS
The tax effects of temporary differences that give rise to significant portions of the deferred tax assets and deferred tax liabilities at December 31, 2021 and 2020 are presented below.
| | | | | | | | | | | |
| | December 31, |
| | 2021 | | 2020 |
| | (In thousands) |
| | | |
| Deferred tax assets: | | | |
| Future policy benefits, excess of financial accounting liabilities over tax liabilities | $ | 183,692 | | | 188,635 | |
| Investment securities write-downs for financial accounting purposes | 735 | | | 649 | |
| Benefit plan liabilities | 12,546 | | | 14,714 | |
| | | |
| Accrued operating expenses recorded for financial accounting purposes not currently tax deductible | 4,490 | | | 3,346 | |
| | | |
| Accrued and unearned investment income recognized for tax purposes and deferred for financial accounting purposes | 64 | | | 85 | |
| | | |
| Goodwill | 1,696 | | | 2,077 | |
| Other | 88 | | | 95 | |
| | | |
| Total gross deferred tax assets | 203,311 | | | 209,601 | |
| | | |
| Deferred tax liabilities: | | | |
| Deferred policy acquisition costs, sales inducement costs, and VOBA, principally expensed for tax purposes | (157,543) | | | (153,742) | |
| Tax reform reserve adjustment | (34,942) | | | (43,687) | |
| Debt securities, principally due to deferred market discount for tax | (5,611) | | | (8,338) | |
| Real estate, principally due to adjustments for financial accounting purposes | (14) | | | (2,245) | |
| Net unrealized gains on debt and equity securities | (66,696) | | | (112,500) | |
| Foreign currency translation adjustments | (1,356) | | | (1,360) | |
| Fixed assets, due to different depreciation bases | (13,032) | | | (10,645) | |
| Cost of reinsurance | (18,834) | | | (21,596) | |
| Funds withheld liability | (5,591) | | | — | |
| Other | (858) | | | (614) | |
| | | |
| Total gross deferred tax liabilities | (304,477) | | | (354,727) | |
| | | |
| Net deferred tax liabilities | $ | (101,166) | | | (145,126) | |
Beginning January 1, 2018, the Tax Cuts and Jobs Actimposed a limitation on life insurance tax reserves based upon the greater of net surrender value or 92.81% of the reserve method prescribed by the National Association of Insurance Commissioners which covers such contracts as of the date the reserve is determined. The Company determined that this limitation resulted in a tax reserve decrease of $332.9 million which the Tax Act allowed to be recognized over an eight-year period. At the statutory rate of 21%, the Company recorded a deferred tax liability as of December 31, 2017 of $69.9 million. This amount has been incorporated into the periodic measurement of net deferred tax liabilities and at December 31, 2021 is $34.9 million as shownpersons named in the table above.have sole voting and investment power with respect to all shares of Common Stock beneficially owned. The total tax reserve adjustmentaddress of $332.9 million resulting from the limitation imposed under the Tax Actall directors and Named Executive Officers in this table is being recognized as an increase of $41.6 million in taxable income per year through the year 2025. At the statutory rate of 21%, this results in additional tax of $8.7 million per year.
NATIONAL WESTERN LIFE GROUP, INC.
NOTES TO CONSOLIDATED FINANCIAL STATEMENTS
There were no valuation allowances for deferred tax assets at December 31, 2021 and 2020. In assessing deferred tax assets, management considers whether it is more likely than not that some portion or all of the deferred tax assets will not be realized. The ultimate realization of deferred tax assets is primarily dependent upon the generation of future taxable income during the periods in which those temporary differences become deductible. Management considers the scheduled reversal of deferred tax liabilities, projected future taxable income, and available tax planning strategies in making this assessment. Based upon the level of historical taxable income and projections for future taxable income over the periods in which the deferred tax assets are deductible, management believes it is more likely than not that the Company will realize the benefits of these deductible differences.
In accordance with GAAP, the Company assessed whether it had any significant uncertain tax positions related to open examination or other IRS issues and determined that there were none. Accordingly, no reserve for uncertain tax positions has been recorded. Should a provision for any interest or penalties relative to unrecognized tax benefits be necessary, it is the Company's policy to accrue for such in its income tax accounts. There were no such accruals as of December 31, 2021 or 2020. The Company and its corporate subsidiaries file a consolidated U.S. Federal income tax return, which is subject to examination for all years after 2017.
The Company's federal income tax return is consolidated with the entities listed below.
•c/o National Western Life Group, Inc. (NWLGI), 10801 N Mopac Expy Bldg 3, Austin, TX 78759. Ownership amounts are as of April 25, 2024. Percent of class is calculated based on 3,436,020 shares of Class A Stock and 200,000 shares of Class B Stock outstanding as of April 25, 2024.
| Directors and Officers | | Title of Class | | Amount and
Nature of
Beneficial
Ownership | | | Percent of
Class | |
| | | | | | | | | |
| Named Executive Officers: | | | | | | |
| Ross R. Moody | | Class A Stock | | | 298,474 | (1) | | | 8.69 | % |
| | | | | | | | | | | |
| Rey Perez | | Class A Stock | | | 110 | | | | + | |
| | | | | | | | | | | |
| Directors: | | | | | | | | | | |
| Dr. Thomas A. Blackwell | | Class A Stock | | | 500 | | | | + | |
| | | | | | | | | | | |
| David S. Boone | | Class A Stock | | | 200 | | | | + | |
| | | | | | | | | | | |
| Stephen E. Glasgow | | Class A Stock | | | 20 | | | | + | |
| | | | | | | | | | | |
| E. Douglas McLeod | | Class A Stock | | | 2,000 | | | | + | |
| | | | | | | | | | | |
| Charles D. Milos | | Class A Stock | | | 6,838 | | | | + | |
| | | | | | | | | | | |
| Frances A. Moody-Dahlberg | | Class A Stock | | | 291,324 | (2) | | | 8.48 | % |
| | | | | | | | | | | |
| E.J. Pederson | | Class A Stock | | | 1,010 | | | | + | |
| | | | | | | | | | | |
| Directors and Executive | | Class A Stock | | | 600,476 | | | | 17.48 | % |
| Officers as a Group | | | | | | | | | | |
| (16 Persons) | | | | | | | | | | |
| (1) | See footnote (2) to the “Security Ownership of Certain Beneficial Owners” table above. |
| | |
| (2) | See footnote (4) to the “Security Ownership of Certain Beneficial Owners” table above. |
| | |
| + | Indicates ownership of less than one percent of the class. |
•ITEM 13. CERTAIN RELATIONSHIPS AND RELATED TRANSACTIONS AND DIRECTOR INDEPENDENCE
National Western Life Insurance Company (NWLIC, a subsidiary
Other than as set forth in the following paragraphs, we are not aware of NWLGI)
•The Westcap Corporation (subsidiaryany transactions since the beginning of NWLIC)
•Braker P III, LLC (subsidiary of NWLIC)
•NWL Financial, Inc. (subsidiary of NWLIC)
•NWLSM, Inc. (subsidiary of NWLIC)
•NWL Services, Inc. (subsidiary of NWLGI)
•Regent Care Operations General Partner, Inc. (subsidiary of NWL Services, Inc.)
•Regent Care Operations Limited Partner, Inc. (subsidiary of NWL Services, Inc.)
•Regent Care General Partner, Inc. (subsidiary of NWL Services, Inc.)
•Regent Care Limited Partner, Inc. (subsidiary of NWL Services, Inc.)
•N.I.S. Financial Services, Inc. (NIS, a subsidiary of NWLGI)
Ozark National will not be consolidated with NWLGI for federal tax filings until it has been a2023 or any currently proposed transaction between us or our subsidiaries and any member of the affiliated group for five full years, per section 1504(c)(2)Board of the Internal Revenue Code.
AllocationDirectors, any of the consolidated Federal income tax liability amongst the Company and its consolidated subsidiariesour executive officers, any security holder who is based on separate return calculations pursuantknown to the "wait-and-see" method as described in sections 1.1552-1(a)(1) and 1.1502-33(d)(2)us to own of the current Treasury Regulations. Under this method, consolidated group members are not given current credit for net losses until future net taxable income is generated to realize such credits.
(16) SHORT-TERM BORROWINGS
National Western has available a $75 million bank linerecord or beneficially more than 5% of credit (with Moody National Bank, its custodian bank and a related party) primarily for cash management purposes. The Company is required to maintain a collateral security deposit in trust with the sponsoring bank having a fair value equal to 110% of the line of credit. The Company had no outstanding borrowings under the line of credit at December 31, 2021our Common Stock, or 2020. The Company maintained assets having an amortized value of $91.2 million (fair value of $93.7 million) on deposit with the lender at December 31, 2021.
During 2020, National Western became aany member of the Federal Home Loan Bankimmediate family of Dallas (FHLB) through an initial minimum required stock investmentany of $4.3 million. Through this membership, National Westernthe foregoing persons, in which the amount involved exceeds $120,000 and in which any of the foregoing persons had, or will have, a specified borrowing capacity based upondirect or indirect material interest. Except as otherwise noted and as applicable, we believe that each transaction described below is, or was, as the amount of collateral it establishes. At December 31, 2021, cash and securities in the amount of $57.3 million (fair value of $60.6 million) were pledged to FHLB.
NATIONAL WESTERN LIFE GROUP, INC.
NOTES TO CONSOLIDATED FINANCIAL STATEMENTS
(17) COMMITMENTS AND CONTINGENCIES
(A) Legal Proceedings
In the normal course of business, the Company is involved or may become involved in various legal actions in which claims for alleged economic and punitive damages have been orcase may be,
asserted, some for substantial amounts. In recent years, carriers offering life insuranceon terms at least as favorable to us as we would expect to negotiate with an unaffiliated party.
Relationships among Directors and annuity products have faced litigation, including class action lawsuits, alleging improper product design, improper sales practices, and similar claims. As previously disclosed, the Company has been a defendant in prior years in such class action lawsuits. Given the uncertainty involved in these types of actions, the ability to make a reliable evaluation of the likelihood of an unfavorable outcome or an estimate of the amount of or range of potential loss is endemic to the particular circumstances and evolving developments of each individual matter on its own merits.
On September 28, 2017, a purported shareholder derivative lawsuit was filed in the 122nd District Court of Galveston County, State of Texas entitled Robert L. Moody, Jr. derivatively on behalf of National Western Life Insurance Company and National Western Life Group, Inc. v. Ross Rankin Moody, et al., naming certain current and former directors and current officers as defendants. The complaint challenged the directors’ oversight of insurance sales to non-U.S. residents and alleged that the defendants breached their fiduciary duties in the conduct of their duties as board members by failing to act (i) on an informed basis and (ii) in good faith or with the honest belief that their actions were in the best interests of the Company. The complaint sought an undetermined amount of damages, attorneys’ fees and costs, and equitable relief, including the removal of the Company’s Chairman and Chief Executive
Officer and other board members and/or officers of the Company. The Company believed that the claims in the complaint were baseless and without merit, vigorously defended this lawsuit, and was awarded reimbursement of legal costs and expenses from plaintiff as detailed below. The companies and directors filed their respective Pleas to the Jurisdiction ("Pleas") contesting the plaintiff's standing to even pursue this action, along with their Answers, on October 27, 2017. On December 14, 2017, plaintiff filed a Response to the Pleas and on December 21, 2017, the Court heard oral argument on the Pleas. Plaintiff then filed a First Amended Petition on January 11, 2018. The companies and directors filed a Supplement to the Pleas on January 30, 2018, to which plaintiff responded on February 1, 2018, and the companies and directors replied on February 9, 2018. On May 3, 2018, the Court issued a memorandum to all attorneys of record stating that the Court would grant the defendants' Pleas and asked the attorney for defendants to prepare and submit proposed orders/judgments granting the requested relief for consideration by the Court. The defendants filed such proposed order granting the Pleas on May 7, 2018. On May 16, 2018 the Court issued an Order granting the Pleas and dismissing Robert L. Moody, Jr.’s claims with prejudice, and plaintiff then filed a Motion to Transfer Venue (“MTTV”). Defendants filed an Application for Fees, seeking to recover defendants’ legal costs and expenses from plaintiff, and a Response to the MTTV on June 8, 2018. In response plaintiff filed a Motion to Vacate, a Response to the Application for Fees, and his own Request for Attorney’s Fees on July 5, 2018. Defendants filed a Response to the Motion to Vacate and to plaintiff’s Request for Attorney’s Fees on July 11, 2018, and the Court heard oral arguments on July 16, 2018. Plaintiff filed supplemental briefing in support of his July 5, 2018 filings on July 25, 2018, and defendants filed their response to plaintiff's supplemental briefing on July 27, 2018. On August 8, 2018 the Court issued an Order denying plaintiff's Motion to Vacate. Pursuant to the Court’s instructions, on October 5, 2018, defendants filed an Order Granting Application for Expenses. Defendants then filed a Motion for Entry of Final Judgment and a Request for Submission Date on Motion for Entry of Final Judgment on October 11, 2018, which the Court set as October 30, 2018. Plaintiff filed his Objection to Proposed Final Judgment and Objection to Proposed Order on Attorneys’ Fees on October 25, 2018, to which defendants filed a response on October 30, 2018. On November 11, 2018, the Court issued its Final Judgment: ordering Plaintiff to pay the companies $1,314,054 for reasonable and necessary fees and expenses, denying Plaintiff’s Motion to Transfer Venue, and dismissing Plaintiff’s counterclaim. Plaintiff appealed the Court’s Final Judgment to the First District Court of Appeals in Houston, TX. The court of appeals issued a panel decision on December 10, 2020 affirming the dismissal and award of attorneys’ fees and expenses to the companies. On January 22, 2021, Plaintiff filed a motion for rehearing of the affirmance of the award of attorneys’ fees and expenses. On July 27, 2021, the Court of Appeals vacated its December 10, 2020 judgment and withdrew its earlier opinion, and issued a new judgment and opinion again affirming the dismissal and award of attorneys’ fees and expenses to the companies. Plaintiff filed an Extension for Filing Review with the Texas Supreme Court on September 10, 2021, which expired on October 12, 2021. On October 15, 2021, Defendants received final payment in satisfaction of judgment from Robert L. Moody, Jr. for a total amount of $1,803,503. The Court of Appeals stated in its opinion that the evidence supported the trial court’s implied finding that Robert L. Moody, Jr.’s suit was filed without reasonable cause and for an improper purpose, and therefore, the court’s order that he pay $1,803,503 in attorneys’ fees to the Defendants was proper. Defendants filed a Notice of Satisfaction of Judgment with the trial court on October 19, 2021. Judgment in the Defendants’ favor is now final and not subject to any further appeals.Officers
NATIONAL WESTERN LIFE GROUP, INC.
NOTES TO CONSOLIDATED FINANCIAL STATEMENTS
In April of 2019, National Western defended a two-week jury trial in which it was alleged that it committed actionable Financial Elder Abuse in its issuance of a $100,000 equity indexed annuity to the Plaintiff in the case of Williams v Pantaleoni et al, Case No. 17CV03462, Butte County California Superior Court. The Court entered an Amended Judgment on the Jury Verdict on July 27, 2019 against National Western in the amount of $14,949 for economic damages and $2.9 million in non-economic and punitive damages. National Western vigorously disputes the verdicts and the amounts awarded, and in furtherance of such, filed a Motion for Judgment Notwithstanding Jury Verdict and a Motion for New Trial, both of which were rejected by the Court. On September 9, 2019, NWLIC filed its Notice of Appeal. On November 11, 2019, the judge awarded the Plaintiff attorney’s fees in the amount of $1.26 million. Both the Plaintiff and NWLIC appealed this ruling. On June 11, 2021, the appellate court reversed the judgment and directed the trial court to enter judgment in favor of NWLIC. Plaintiff has filed an appeal with the Supreme Court of California. On September 22, 2021, the California Supreme Court granted review and transferred the case back to the appellate court with instructions to vacate its decision and reconsider its finding that Mr. Pantaleoni did not have an agency relationship with NWLIC. On March 4, 2022, the appellate court filed an opinion completely striking the award of punitive damages that had been in the amount of $2.50 million, affirming economic damages of $14,949 and non-economic damages of $420,000, and awarding Plaintiff costs on appeal. The appellate court remanded the case to the trial court to reconsider the attorney fee award of $1.26 million in light of the reversal of punitive damages.
In the Form 10-Q for the period ended September 30, 2020, the Company reported that it experienced a data event in which an intruder accessed and exfiltrated certain data from the Company's network. As a result of this event, the Company reported in its Form 10-K for the year ended December 31, 2020, that it was aware of 2 proposed class actions filed against National Western, Mildred Baldwin, on behalf of herself and others similarly situated vs. National Western Life Insurance Company, Missouri Circuit Court for the 18th Judicial Circuit (Pettis County) filed February 16, 2021, and Douglas Dyrssen Sr., individually and on behalf of all others similarly situated vs. National Western Life Insurance Company and National Western Life Group, Inc., United States District Court for the Eastern District of California filed March 8, 2021. The parties agreed to consolidate those 2 proposed class actions into a single proposed class action, Mildred Baldwin, on behalf of herself and others similarly situated vs. National Western Life Insurance Company, United States District Court for the Western District of Missouri. Baldwin is seeking an undetermined amount of damages, attorneys' fees and costs, injunctive relief, declaratory and other equitable relief, and enjoinment. National Western filed a Motion to Dismiss on July 16, 2021. On July 26, 2021, the parties filed a Joint Motion to Stay Pending Mediation, which the court denied. On September 15, 2021, the court granted in part and denied in part National Western’s Motion to Dismiss. At the mediation held on October 12, 2021, the parties agreed on preliminary terms to settle the litigation. The parties filed a Joint Notice of Settlement and Motion to Stay Deadlines with the court on October 20, 2021. The Company accrued $4.4 million for this matter. The Court issued an order preliminarily approving the settlement on January 19, 2022. The settlement terms remain subject to final court approval. The final approval hearing is currently set for June 16, 2022.
Although there can be no assurances, at the present time, the Company does not anticipate that the ultimate liability arising from such other potential, pending, or threatened legal actions will have a material adverse effect on the financial condition or operating results of the Company.
The Company was informed by the Internal Revenue Service (“IRS”) that it had countersigned a previously negotiated closing agreement effective February 11, 2022 (“Agreement”) by and between National Western and the Commissioner of Internal Revenue pertaining to an open matter regarding the tax status of certain of the Company’s international life insurance products. Under terms of the Agreement, the Company is to remit to the IRS a payment in the amount of $4.9 million within sixty days of the effective date of the Agreement and to make stipulated adjustments to the policies covered under the Agreement within ninety days of the effective date. The Company had previously accrued for this contingency in a financial statement period predating the financial statements for the three years ended December 31, 2021. Accordingly, there is no effect on the financial statements for the year ended December 31, 2021 for this Agreement.
Separately, in 2015 Brazilian authorities commenced an investigation into possible violations of Brazilian criminal law in connection with the issuance of National Western insurance policies to Brazilian residents, and in assistance of such investigation a Commissioner appointed by the U.S. District Court for the Western District of Texas issued a subpoena in March of 2015 upon NWLIC to provide information relating to such possible violations. National Western cooperated with the relevant governmental authorities in regard to this matter. No conclusion can be drawn at this time as to its outcome or how such outcome may impact the Company’s business, results of operations or financial condition.
NATIONAL WESTERN LIFE GROUP, INC.
NOTES TO CONSOLIDATED FINANCIAL STATEMENTS
(B) Financial Instruments
In order to meet the financing needs of its customers in the normal course of business, the Company is a party to financial instruments with off-balance sheet risk. These financial instruments are commitments to extend credit which involve elements of credit and interest rate risk in excess of the amounts recognized in the Consolidated Balance Sheets.
The Company's exposure to credit loss in the event of nonperformance by the other party to the financial instrument for commitments to extend credit is represented by the contractual amounts, assuming that the amounts are fully advanced and that collateral or other security is of no value. Commitments to extend credit are legally binding agreements to lend to a customer that generally have fixed expiration dates or other termination clauses and may require payment of a fee. Commitments do not necessarily represent future liquidity requirements, as some could expire without being drawn upon. The Company uses the same credit policies in making commitments and conditional obligations as it does for on-balance sheet instruments. The Company controls the credit risk of these transactions through credit approvals, limits, and monitoring procedures.
The Company had $5.4 million in commitments to fund new loans and $13.1 million in commitments to extend credit relating to existing loans at December 31, 2021. The Company evaluates each customer's creditworthiness on a case-by-case basis. The Company also had commitments to make capital contributions to alternative investment debt and equity funds of $256.4 million as of December 31, 2021. The Company had no commitments to extend credit relating to revolving credit facilities at December 31, 2021.
(C) Guaranty Association Assessments
National Western and Ozark National are subject to state guaranty association assessments in all states in which they are licensed to do business. These associations generally guarantee certain levels of benefits payable to resident policyholders of insolvent insurance companies. Many states allow premium tax credits for all or a portion of such assessments, thereby allowing potential recovery of these payments over a period of years. However, several states do not allow such credits.
The Company estimates its liabilities for guaranty association assessments by using the latest information available from the National Organization of Life and Health Insurance Guaranty Associations. The Company monitors and revises its estimates for assessments as additional information becomes available which could result in changes to the estimated liabilities. As of December 31, 2021, 2020 and 2019, liabilities for guaranty association assessments totaled $0.1 million, $0.2 million and $0.2 million, respectively. Other operating expenses related to state guaranty association assessments were minimal for the years ended December 31, 2021, 2020 and 2019.
NATIONAL WESTERN LIFE GROUP, INC.
NOTES TO CONSOLIDATED FINANCIAL STATEMENTS
(D) Leases
The Company leases various office related equipment. Rental expenses for these leases were $0.4 million, $0.5 million and $0.4 million for the years ended December 31, 2021, 2020, and 2019, respectively. In 2021, the Company entered into 2 lease agreements for new equipment under finance leases. These leases will expire in October 2024 and November 2026. The present value of future payments capitalized amounted to $1.4 million and amortization commenced in 2021. The Company's future annual lease obligations under finance leases as of December 31, 2021 are as shown below (in thousands).
| | | | | |
| 2022 | $ | 343 | |
| 2023 | 343 | |
| 2024 | 316 | |
| 2025 | 179 | |
| 2026 | 165 | |
| Total minimum lease payments | 1,346 | |
| |
| Less: Interest | (10) | |
| | |
| Present value of net minimum lease payments | $ | 1,336 | |
(18) DEPOSITS WITH REGULATORY AUTHORITIES
The following assets, stated at amortized cost, were on deposit with state and other regulatory authorities, as required by law, at the end of each year.
| | | | | | | | | | | |
| | December 31, |
| | 2021 | | 2020 |
| | (In thousands) |
| | | |
| National Western: | | | |
| | | |
| Debt securities available-for-sale | $ | 15,307 | | | 15,283 | |
| Short-term investments | 475 | | | 475 | |
| | | |
| Total National Western | 15,782 | | | 15,758 | |
| | | |
| Ozark National: | | | |
| | | |
| Debt securities available-for-sale | 3,319 | | | 3,331 | |
| | | |
| Total Ozark National | 3,319 | | | 3,331 | |
| | | |
| Total | $ | 19,101 | | | 19,089 | |
(19) RELATED PARTY TRANSACTIONS
Robert L. Moody, Jr. ("Mr. Moody, Jr.") is the brother of Ross R. Moody,
NWLGI'sthe Company’s Chairman, President and Chief Executive Officer
is the son of Robert L. Moody, Sr.,
the former Chairman Emeritus of the Board of Directors of
NWLGI, the
stepson of Ann M.Company, who passed away on November 7, 2023. Ross R. Moody
who serves as a director of NWLGI,is also the brother of Russell S. Moody, who serves as an advisory director of
NWLGI,the Company, and a half-brother of Frances A. Moody-Dahlberg, who serves as a director of
NWLGI.the Company Frances A. Moody-Dahlberg of Dallas, Texas, a director of the Company, is the daughter of Robert L. Moody, Sr., the half-sister of Ross R. Moody and niece of E. Douglas McLeod. Douglas McLeod of Galveston, Texas, a director of the Company, is the step-uncle of Ross R. Moody and uncle of Frances A. Moody-Dahlberg.
The information regarding the payments and awards we made to our Named Executive Officers in Item 11 under the heading “Compensation Discussion and Analysis” is incorporated herein by reference.
The information regarding director independence contained in Item 10 under the heading “Corporate Governance – Board Leadership / Affirmative Determinations Regarding Director Independence” is incorporated herein by reference.
NATIONAL WESTERN LIFE GROUP, INC.
NOTES TO CONSOLIDATED FINANCIAL STATEMENTS
Transactions with Related Persons, Promoters, and Certain Control Persons
Robert L. Moody, Jr. (“Mr. Moody, Jr.”) wholly owns an insurance marketing organization that maintains agency contracts with National WesternNWLIC pursuant to which agency commissions are paid in accordance with NWLIC’s standard commission schedules. Mr. Moody, Jr. also maintains an independent agent contract with National WesternNWLIC for policies personally sold under which commissions are also paid in accordance with standard commission schedules. CommissionsIn 2023, commissions paid under these agency contracts aggregated approximately $155,107 and $182,957 in 2021 and 2020, respectively.
Management fees totaling $2,000 and $0 were paid to Regent Management Services, Limited Partnership ("RMS") for services provided to downstream nursing home subsidiaries of NWLGI in 2021 and 2020, respectively. These nursing home operations were sold by$25,569. Mr. Moody, Jr. is the
Company during 2019. RMS is 1% owned by general partner RCC Management Services, Inc. ("RCC"), and 99% owned by limited partner, the Three R Trusts. RCC is 100% owned by the Three R Trusts. The Three R Trusts are four separate Texas trusts for the benefit of the childrenson of Robert L. Moody, Sr.
(Robertthe brother of Ross R. Moody, the half-brother of Frances A. Moody-Dahlberg, and the step-nephew of E. Douglas McLeod. Mr. Moody, Jr. is also a stockholder of the Company, as shown below under the heading “Security Ownership of Certain Beneficial Owners and Management – Owners of More than 5% of Our Class A Stock or Class B Stock.”
Robert L. Moody, Jr.Sr., served as the Company’s Chairman Emeritus until his death on November 7, 2023. He was the last surviving life estate beneficiary of the Libbie Shearn Moody Trust, which was established in 1943 pursuant to the last will and testament of his grandmother, Libbie Shearn Moody. At the end of 1963, Robert Moody, Sr.’s life estate interest (the “Life Interest”) in that trust was assigned to NWLIC and was then held by a wholly owned subsidiary of NWLIC. Because the Life Interest terminated by its terms upon Robert Moody, Sr.’s death, the Company carried life insurance policies totaling a face amount of $27.0 million on the life of Mr. Moody, Sr. of which $26.85 million was reinsured with third party reinsurers. The amount of the premiums paid by the Company during 2023 was $964,000. NWLIC was included as a beneficiary on these policies and received $12.8 million in proceeds. The Three R Trust received $11.4 million in proceeds from the policies and Ross R. Moody, Frances A. Moody-Dahlberg, Russell S. Moody, and Frances A. Moody-Dahlberg).
National Western holds an investment totaling approximately 9.4% ofMr. Moody, Jr. each received $581,593 in proceeds from the
issued and outstanding shares of Moody Bancshares, Inc. at December 31, 2021 and the Three R Trusts owns a majority of the issued and outstanding shares. Moody Bancshares, Inc. owns 100% of the outstanding shares of Moody Bank Holding Company, Inc., which owns approximately 98.5% of the outstanding shares of Thepolicies.
NWLIC utilizes Moody National Bank of Galveston ("MNB"(“MNB”). Ross R. Moody and Frances A. Moody-Dahlberg are members of the Board of Directors of Moody Bancshares, Inc. National Western utilizes MNB for certain bank custodian services as well as for certain administrative services with respect to its defined benefit plan. FeesIn 2023, NWL Financial, Inc., a subsidiary of NWLIC, entered into an investment management agency agreement with MNB. The Three R Trust, four separate Texas trusts for the benefit of the children of Robert L. Moody, Sr. (Ross R. Moody, Russell S. Moody, Frances A. Moody-Dahlberg, and Mr. Moody, Jr.) own a majority of the issued and outstanding shares of Moody Bancshares, Inc. At December 31, 2022, Moody Bancshares, Inc. owned 100% of the outstanding shares of Moody Bank Holding Company, Inc., which owned approximately 98.5% of the outstanding shares of MNB. Ross R. Moody, Russell S. Moody, and Frances A. Moody-Dahlberg are members of the Board of Directors of MNB. NWLIC and affiliated entities paid fees totaling $536,101 and $582,150 were paid$470,307 in 2023, to MNB with respect to thesethe services in 2021 and 2020, respectively. The Companyprovided as described above. NWLIC also maintains an office space lease with MNB and made payments totaling $32,101 and $32,101 in 2021 and 2020, respectively,2023 under this lease.
National Western
paid American National Group, Inc. (“American National”) $642,099 and $840,802 in 2021 and 2020, respectively, in premiums for certain company sponsored benefit plans and $3,021,197 and $2,635,164 in 2021 and 2020, respectively, in reimbursements for claim costs for which American National provides third party administrative services. American National paid National Western $3,147,080 and $2,744,962 in 2021 and 2020, respectively, in premiums for its company sponsored benefit plans. National Western maintainedheld an investment
agreement with American National Registered Investment Advisory,totaling approximately 9.4% of the issued and outstanding shares of Moody Bancshares, Inc.
, at December 31, 2022. In response to a tender offer made by Moody Bancshares, Inc. to all its stockholders other than the Three R Trust, the Company sold this investment holding during 2023 for net cash proceeds of $___ million, recognizing a gain of $25.7 million.
Todd M. Wallace serves as a director of NWLGI. Mr. Wallace is the President of the Central Texas Region of Jones, Lang, LaSalle Brokerage, Inc. (“JLL”). Braker P III, LLC, a subsidiary of American National Western, entered into a leasing agent agreement with JLL in 2022 under which $58,032payments were made totaling $21,427 in 2023. Ozark National also entered into a services agreement with JLL in 2022, but no payments were made under that agreement in 2023.
Review, Approval, and $47,778 was paid in 2021Ratification of Transactions with Related Persons
In accordance with the Company’s Audit Committee Charter, related party transactions must be reviewed and 2020, respectively, for services. Robert L. Moody, Sr., serves as Chairman Emeritus and Ross R. Moody serves as a non-executive Chairmanapproved by the Audit Committee of the Board of American National. Anne M. Moody, E. Douglas McLeod,Directors, both at inception and E. J. Pederson, memberson an ongoing basis. Periodic reports of potential related party transactions are brought to the attention of the NWLGI BoardAudit Committee by management, and the Audit Committee reviews the information on a case by case basis to determine if any transaction is a related party transaction. The standard of Directors, are also members ofreview for any related party transaction is that the American National Board of Directors.
During 2015, American National soldtransaction must be fair to the Company and the transaction must be no more favorable to the related party than a
24.93% undivided participation insimilar arm’s length transaction with a
mortgage loan to The Westcap Corporation for $20.0 million. The Westcap Corporation will receive 24.93% of all future cash receipts, which will be recognized overnon-related party.
Other than the life of the loan. This mortgage loan investment had a balance of $17.9 million and $18.5 million as of December 31, 2021 and 2020, respectively, which is reflectedrequirements contained in the Consolidated Balance Sheets.Audit Committee Charter, memorandums, and documentation of review and approvals, the Company has not adopted written procedures for review of, or written standards for approval of, these transactions.
Subsequent events have been evaluated through the date of filing and no other reportable items were identified.
NATIONAL WESTERN LIFE GROUP, INC.
SCHEDULE I
SUMMARY OF INVESTMENTS
OTHER THAN INVESTMENTS IN RELATED PARTIES
December 31, 2021
(In thousands)
| | | | | | | | | | | | | | | | | | | | |
| Type of Investment | | Amortized Cost or Cost (1) | | Fair Value | | Balance Sheet Amount |
| | | | | | |
| | | | | | |
| | | | | | |
| | | | | | |
| | | | | | |
| | | | | | |
| | | | | | |
| | | | | | |
| | | | | | |
| | | | | | |
| | | | | | |
| | | | | | |
| | | | | | |
| Debt securities available-for-sale: | | | | | | |
| United States government and government agencies and authorities | | $ | 45,941 | | | 47,033 | | | 47,033 | |
| States, municipalities, and political subdivisions | | 479,148 | | | 505,960 | | | 505,960 | |
| Foreign governments | | 62,979 | | | 62,391 | | | 62,391 | |
| Public utilities | | 745,359 | | | 784,969 | | | 784,969 | |
| Corporate | | 6,322,471 | | | 6,700,953 | | | 6,700,953 | |
| Commercial mortgage-backed | | 27,016 | | | 27,757 | | | 27,757 | |
| Residential mortgage-backed | | 530,702 | | | 549,623 | | | 549,623 | |
| Asset-backed | | 390,634 | | | 390,260 | | | 390,260 | |
| Total securities available-for-sale | | 8,604,250 | | | 9,068,946 | | | 9,068,946 | |
| | | | | | |
| Debt securities trading: | | | | | | |
| United States government and government agencies and authorities | | — | | | — | | | — | |
| States, municipalities, and political subdivisions | | 16,644 | | | 17,487 | | | 17,487 | |
| Foreign Government | | — | | | — | | | — | |
| Public utilities | | 36,282 | | | 36,973 | | | 36,973 | |
| Corporate | | 413,250 | | | 423,778 | | | 423,778 | |
| Commercial mortgage-backed | | 240,484 | | | 240,573 | | | 240,573 | |
| Residential mortgage-backed | | 45,195 | | | 44,772 | | | 44,772 | |
| Asset-backed | | 314,253 | | | 313,855 | | | 313,855 | |
| Total securities trading | | 1,066,108 | | | 1,077,438 | | | 1,077,438 | |
| | | | | | |
| Total fixed maturity bonds | | 9,670,358 | | | 10,146,384 | | | 10,146,384 | |
| | | | | | |
| | | | | | |
| | | | | | |
| | | | | | |
| | | | | | |
| | | | | | |
| | | | | | |
| Equity securities: | | | | | | |
| Common stocks: | | | | | | |
| Public utilities | | 578 | | | 1,335 | | | 1,335 | |
| Banks, trust, and insurance companies | | 1,701 | | | 4,287 | | | 4,287 | |
| Industrial, miscellaneous, and all others | | 9,945 | | | 18,173 | | | 18,173 | |
| Preferred stocks | | 4,325 | | | 4,422 | | | 4,422 | |
| Total equity securities | | 16,549 | | | 28,217 | | | 28,217 | |
| | | | | | |
| Derivatives, index options | | 101,622 | | | | | 101,622 | |
| Mortgage loans on real estate | | 486,892 | | | | | 486,892 | |
| Policy loans | | 71,286 | | | | | 71,286 | |
Other long-term investments (2) | | 137,670 | | | | | 137,670 | |
| Total investments other than investments in related parties | | $ | 10,484,377 | | | | | 10,972,071 | |
NATIONAL WESTERN LIFE GROUP, INC.
SCHEDULE I
SUMMARY OF INVESTMENTS
OTHER THAN INVESTMENTS IN RELATED PARTIES (Continued)
December 31, 2021
(In thousands)
(1) Bonds and mortgages are shown at amortized cost reduced by repayments and allowances for possible losses. Real estate is stated at costs net of accumulated depreciation. Derivatives are shown at fair value.
(2) There was no real estate acquired by foreclosure included in other long-term investments.
See accompanying report of Independent Registered Public Accounting Firm.
National Western Life Group, Inc.
Condensed Financial Information of Registrant
Condensed Statements of Financial Position as of December 31, 2021 and 2020
(Parent Company Only)
(in thousands)
| | | | | | | | | | | |
| 2021 | | 2020 |
| | | |
| ASSETS | | | |
| Investment in subsidiaries | $ | 2,538,996 | | | 2,535,669 | |
| Cash and cash equivalents | 7,017 | | | 8,376 | |
| | | |
| Deferred Federal income tax asset | 8,258 | | | 7,721 | |
| Other assets | 263 | | | 293 | |
| | | |
| Total assets | $ | 2,554,534 | | | 2,552,059 | |
| | | |
| LIABILITIES AND STOCKHOLDERS' EQUITY | | | |
| Liabilities: | | | |
| | | |
| Current Federal income tax liability | 14,388 | | | 11,667 | |
| | | |
| Other liabilities | 455 | | | 642 | |
| | | |
| Total liabilities | 14,843 | | | 12,309 | |
| | | |
| Stockholders' Equity: | | | |
| Common Stock: | | | |
| Class A - $0.01 par value; 7,500,000 shares authorized; 3,436,020 issued and outstanding in 2021 and 2020 | 34 | | | 34 | |
| Class B - $0.01 par value; 200,000 shares authorized, issued, and outstanding in 2021 and 2020 | 2 | | | 2 | |
| Additional paid-in capital | 41,716 | | | 41,716 | |
| Accumulated other comprehensive income | 215,953 | | | 395,421 | |
| Retained earnings | 2,281,986 | | | 2,102,577 | |
| | | |
| Total stockholders’ equity | 2,539,691 | | | 2,539,750 | |
| | | |
| Total liabilities and stockholders' equity | $ | 2,554,534 | | | 2,552,059 | |
| | | |
See Notes to Condensed Financial Information of Registrant
National Western Life Group, Inc.
Schedule II
Condensed Financial Information of Registrant
Condensed Statements of Operations for the Years Ended December 31, 2021, 2020 and 2019
(Parent Company Only)
(in thousands)
| | | | | | | | | | | | | | | | | |
| 2021 | | 2020 | | 2019 |
| | | | | |
| Revenues: | | | | | |
| Dividend income from subsidiaries | $ | — | | | 1,395 | | | 36,000 | |
| Net investment income | 10 | | | 9 | | | — | |
| | | | | |
| Total revenues | 10 | | | 1,404 | | | 36,000 | |
| | | | | |
| Expenses: | | | | | |
| Other operating expenses | 2,660 | | | 3,322 | | | 5,358 | |
| | | | | |
| Total expenses | 2,660 | | | 3,322 | | | 5,358 | |
| | | | | |
| Earnings/(loss) before Federal income taxes | (2,650) | | | (1,918) | | | 30,642 | |
| Federal income taxes/(benefit) | (537) | | | (2,212) | | | (1,739) | |
| | | | | |
| Earnings (loss) before equity in earnings of affiliates | (2,113) | | | 294 | | | 32,381 | |
| Equity in earnings of affiliates | 182,794 | | | 92,018 | | | 99,235 | |
| | | | | |
| Net earnings | $ | 180,681 | | | 92,312 | | | 131,616 | |
See Notes to Condensed Financial Information of Registrant
National Western Life Group, Inc.
Schedule II
Condensed Financial Information of Registrant
Condensed Statements of Cash Flows for the Years Ended December 31, 2021, 2020 and 2019
(Parent Company Only)
(in thousands)
| | | | | | | | | | | | | | | | | |
| 2021 | | 2020 | | 2019 |
| | | | | |
| Cash flows from operating activities: | | | | | |
| Net earnings | $ | 180,681 | | | 92,312 | | | 131,616 | |
| Adjustments to reconcile net earnings to cash provided by operating activities: | | | | | |
| Equity in earnings of affiliates | (182,794) | | | (92,018) | | | (99,235) | |
| | | | | |
| Depreciation and amortization | 30 | | | 30 | | | 30 | |
| Change in: | | | | | |
| Federal income tax, net | 2,721 | | | 16,397 | | | (547) | |
| Deferred Federal income tax | (537) | | | (7,481) | | | (637) | |
| Due to subsidiaries, net | — | | | — | | | — | |
| Other, net | (188) | | | (830) | | | (4) | |
| | | | | |
| Net cash provided by (used in) operating activities | (87) | | | 8,410 | | | 31,223 | |
| | | | | |
| Cash flows from investing activities: | | | | | |
| Payments to acquire businesses | — | | | — | | | (30,154) | |
| | | | | |
| Net cash provided by (used in) investing activities | — | | | — | | | (30,154) | |
| | | | | |
| Cash flows from financing activities: | | | | | |
| Dividends on common stock | (1,272) | | | (1,273) | | | (1,273) | |
| | | | | |
| Net cash provided by (used in) financing activities | (1,272) | | | (1,273) | | | (1,273) | |
| | | | | |
| Net increase (decrease) in cash, cash equivalents, and restricted cash | (1,359) | | | 7,137 | | | (204) | |
| Cash, cash equivalents, and restricted cash at the beginning of year | 8,376 | | | 1,239 | | | 1,443 | |
| | | | | |
| Cash, cash equivalents, and restricted cash at the end of year | $ | 7,017 | | | 8,376 | | | 1,239 | |
| | | | | |
See Notes to Condensed Financial Information of Registrant
National Western Life Group, Inc.
Schedule II
Notes to the Condensed Financial Information of Registrant
(Parent Company Only)
1. Basis of Presentation
The accompanying condensed financial information of the Parent Company Only should be read in conjunction with the consolidated financial statements and notes thereto of National Western Life Group, Inc. ("NWLGI").
As discussed in Note (1) Summary of Significant Accounting Policies of the Consolidated Financial Statements, on October 1, 2015, National Western Life Insurance Company ("National Western" or "NWLIC") completed its previously announced holding company reorganization and became a wholly owned subsidiary of NWLGI. As a result of the reorganization, NWLGI replaced National Western as the publicly held company.
In the Parent Company Only condensed financial statements, NWLGI's investments in subsidiaries are stated at cost plus equity in undistributed income (losses) of subsidiaries since the date of acquisition. The subsidiary information presented is eliminated in the consolidated financial statements.aggregate fees billed NWLGI and its subsidiaries
pay serviceby FORVIS, LLP for 2023 and 2022 are set forth in the table below:
| | | 2023 | | | 2022 | |
| | | (In thousands) | |
| | | | | | | |
| Audit Fees(1) | | $ | 1,491 | | | $ | 1,447 | |
| Audit Related Fees(2) | | | 164 | | | | 68 | |
| Tax Fees | | | — | | | | — | |
| All Other Fees(3) | | | 22 | | | | — | |
| Total | | $ | 1,515 | | | $ | 1,360 | |
| (1) | These amounts represent the aggregate fees for professional services agreed upon by FORVIS, LLP for the audit of the Company’s consolidated annual financial statements for the years ended December 31, 2023 and 2022, reviews of the condensed consolidated financial statements included in the Company quarterly reports on Form 10-Q for these years, and the related annual audits of internal control over financial reporting, and for stand-alone audits of the statutory financial statements of NWLIC and Ozark National, and the stand-alone GAAP financial statements of N.I.S. Financial Services, Inc. |
| (2) | These amounts represent non-recurring audit related services provided by FORVIS, LLP pertaining to the Company’s implementation of a new accounting standard. |
| (3) | These amounts represent non-recurring non-audit related services provided by FORVIS, LLP pertaining to insurance department regulatory examinations and merger due diligence assistance. |
The Audit Committee has adopted a formal policy concerning approval of audit and non-audit services to NWLIC which arebe provided by the independent auditor of the Company. The policy requires that all services the Company’s independent auditor may provide to the Company, including audit services and permitted audit-related and non-auditor services, be pre-approved by the Committee. The Committee approved all audit and non-audit services provided by FORVIS, LLP during 2023 and 2022.
PART IV
ITEM 15. EXHIBITS AND FINANCIAL STATEMENT SCHEDULES
(a) 1. Listing of Financial Statements
See Attachment A, Index to Consolidated Financial Statements, Notes and Schedules, on page 93 of the Original Filing for a list of financial statements included in expensesthis report.
(a) 2. Listing of Financial Statement Schedules
See Attachment A, Index to Consolidated Financial Statements, Notes and equity earnings. These service feesSchedules, on page 93 of the Original Filing for a list of financial statement schedules included in this report.
All other schedules are also eliminatedomitted because they are not applicable, not required, or because the information required by the schedule is included elsewhere in the consolidated financial statements.statements or notes.
(a) 3. Listing of Exhibits
The exhibits listed below, as part of Form 10-K, are numbered in accordance with the numbering used in Item 601 of Regulation S-K promulgated by the SEC.
| | | | | Incorporated by Reference |
| Exhibit Number | | Exhibit Description | | Form | | Exhibit | | Filing Period or Date of Earliest Event Reported |
| | | | | | | | | |
| 2.1 | | Agreement and Plan of Merger, dated as of October 8, 2023, by and amount S. USA Life Insurance Company Inc., PGH Merger Inc. and National Western Life Group Inc. | | 8-K | | 2.1 | | 10/08/2023 |
| 3.1 | | Restated Certificate of Incorporation of National Western Life Group, Inc. | | 10-K | | 3.1 | | 12/31/2022 |
| 3.2 | | Second Amended and Restated Bylaws of National Western Life Group, Inc. | | 8-K | | 3.1 | | 10/08/2023 |
| 10(a) | | Revolving Credit Loan Agreement with Moody National Bank | | 8-K | | 10(ci) | | 8/31/2009 |
| 10(b) | | Funds Withheld Coinsurance Agreement between National Western Life Insurance Company and Prosperity Life Assurance Limited effective as of January 6, 2021 (redacted) | | 8-K | | 10(ac) | | 1/6/2021 |
| 10(c) | | Funds Withheld Coinsurance Agreement between National Western Life Insurance Company and Aspida Life Re Ltd. dated July 27, 2022 | | 8-K | | 10(ag) | | 7/27/2022 |
| 10(d) | | Management/Consultant Agreement dated March 29, 2000 by and between Regent Care Operations, Limited Partnership and Regent Management Services, Limited Partnership. | | 10-K/A | | 10(cp) | | 12/31/2009 |
| 10(e) | | Management Agreement dated October 1, 2008 by and between Regent Care San Marcos B-3, Limited Partnership and Regent Management Services, Limited Partnership. | | 10-K/A | | 10(cq) | | 12/31/2009 |
| 10(f) | | Administrative Services Only Agreement dated January 1, 2001 by and between National Western Life Insurance Company and American National Insurance Company | | 10-K/A | | 10(cr) | | 12/31/2009 |
| 10(g) | | Premium Payment Agreement dated January 1, 2001 by and between National Western Life Insurance Company and American National Insurance Company | | 10-K/A | | 10(cs) | | 12/31/2009 |
| 10(h) | | Exchange Agreement by and among National Western Life Insurance Company, NWL Services, Inc., Alternative Benefit Management, Inc., and American National Insurance Company effective November 23, 1998 | | 10-K405 | | 10(p) | | 12/31/1998 |
| 10(i) | | Administrative Services Only Agreement dated January 1, 2001 by and between National Western Life Insurance Company and American National Insurance Company | | 10-K/A | | 10(ct) | | 12/31/2009 |
| 10(j) | | Premium Payment Agreement dated January 1, 2001 by and between National Western Life Insurance Company and American National Insurance Company | | 10-K/A | | 10(cu) | | 12/31/2009 |
| 10(k)† | | National Western Life Insurance Company 2022 Officer Bonus Program | | 8-K | | 10(af) | | 12/16/2021 |
| 10(l)† | | National Western Life Insurance Company 2022 Chief Marketing Officer Bonus Program | | 8-K | | 10(ad) | | 12/16/2021 |
| 10(m)† | | National Western Life Insurance Company 2023 Officer Bonus Program | | 8-K | | 10(ah) | | 12/14/2022 |
| 10(n)† | | National Western Life Insurance Company 2023 Chief Marketing Officer Bonus Program | | 8-K | | 10(ai) | | 12/14/2022 |
In the years ended December 31, 2021, 2020, and 2019, dividends of $0.0 million, $0.0 million and $36.0 million were declared and paid
| 10(o)† | | Amended and Restated National Western Life Insurance Company Grandfathered Non-Qualified Defined Benefit Plan, effective as of December 31, 2004 | | 10-K | | 10(cc) | | 12/31/2008 |
| 10(p)† | | Amended and Restated National Western Life Insurance Company Non-Qualified Defined Benefit Plan, effective as of January 1, 2009 | | 10-K | | 10(cd) | | 12/31/2008 |
| 10(q)† | | Amended and Restated National Western Life Insurance Company Non-Qualified Defined Benefit Plan for Robert L. Moody, Sr., effective as of January 1, 2009 | | 10-K | | 10(ca) | | 12/31/2008 |
| 10(r)† | | Amended and Restated Non-Qualified Defined Benefit Plan for Ross R. Moody, effective as of January 1, 2009 | | 10-K | | 10(cb) | | 12/31/2008 |
| 10(s)† | | Amended and Restated National Western Life Insurance Company Grandfathered Non-Qualified Deferred Compensation Plan, effective as of December 31, 2004 | | 10-K | | 10(ce) | | 12/31/2008 |
| 10(t)† | | Amended and Restated National Western Life Insurance Company Non-Qualified Deferred Compensation Plan, effective as of January 1, 2009 | | 10-K | | 10(cf) | | 12/31/2008 |
| 10(u)† | | Amended and Restated National Western Life Insurance Company Pension Plan, effective January 1, 2008 | | 10-Q | | 10(co) | | 3/31/2010 |
| 10(v)† | | Amended and Restated National Western Life Insurance Company Group Excess Benefit Plan, effective May 1, 2009 | | 10-Q | | 10(ch) | | 3/31/2009 |
| 10(w)† | | National Western Life Insurance Company Change in Control Agreement Ross R. Moody | | 8-K | | 10(af) | | 12/14/2021 |
| 10(x)† | | National Western Life Insurance Company Change in Control Agreement Rey Perez | | 8-K | | 10(s) | | 3/6/2019 |
| 10(y)† | | National Western Life Insurance Company Change in Control Agreement with Brian Pribyl dated February 28, 2019 | | 10-K | | 10(p) | | 12/31/2018 |
| 10(z)† | | National Western Life Insurance Company Change in Control Agreement Kitty K. Nelson | | 8-K | | 10(q) | | 3/6/2019 |
| 10(aa)† | | National Western Life Insurance Company Change in Control Agreement Patricia L. Scheuer | | 8-K | | 10(r) | | 3/6/2019 |
| 10(ab)† | | National Western Life Insurance Company Change in Control Agreement R. Bruce Wallace | | 8-K | | 10(t) | | 3/6/2019 |
| 10(ac)† | | National Western Life Insurance Company Change in Control Agreement Steven W. Mills | | 8-K | | 10(u) | | 3/6/2019 |
| 10(ad)† | | National Western Life Insurance Company Change in Control Agreement Gregory J. Owen | | 8-K | | 10(v) | | 3/6/2019 |
| 10(ae)† | | National Western Life Insurance Company Change in Control Agreement Charles D. Milos | | 8-K | | 10(w) | | 3/6/2019 |
| 10(af)† | | National Western Life Insurance Company Change in Control Agreement Carlos A. Martinez | | 8-K | | 10(x) | | 3/6/2019 |
| 10(ag)† | | National Western Life Insurance Company Retirement Bonus Program for Robert L. Moody, Sr. | | 8-K | | 10(bd) | | 12/15/2005 |
| 10(ah)† | | Amended and Restated National Western Life Insurance Company Employee Health Plan, effective as of April 1, 2004 | | 10-K | | 10(at) | | 12/31/2004 |
| 10(ai)† | | National Western Life Insurance Company 1995 Stock and Incentive Plan | | 10-K | | 10(e) | | 12/31/1995 |
| 10(aj)† | | First Amendment to the National Western Life Insurance Company 1995 Stock and Incentive Plan, effective June 19, 1998 | | 10-Q | | 10(k) | | 6/30/1998 |
| 10(ak)† | | Second Amendment to the National Western Life Insurance Company 1995 Stock and Incentive Plan | | 10-Q | | 10(w) | | 6/30/2001 |
| 10(al)† | | Third Amendment to the National Western Life Insurance Company 1995 Stock and Incentive Plan | | 10-Q | | 10(ar) | | 9/30/2004 |
| 10(am)† | | Amended and Restated National Western Life Group, Inc. Incentive Plan, effective December 14, 2022 | | 10-K | | 10(aj) | | 12/31/2022 |
| 10(an)† | | National Western Life Insurance Company Change in Control Agreement Ross R. Moody | | 8-K | | 10(ak) | | 12/14/2023 |
| † | Management contract or compensatory plan or arrangement. |
(b) Exhibits
Exhibits required by NWLICRegulation S-K are listed as to NWLGI, respectively. In the years ended December 31, 2021, 2020, and 2019, dividends of $0.0 million, $1.4 million, and $0.0 million were declared and paid by NIS to NWLGI, respectively. These dividend payments are eliminatedlocation in the consolidatedListing of Exhibits in Item 15.(a)3 above. Exhibits not referred to have been omitted as inapplicable or not required.
(c) Financial Statement Schedules
The financial statements.statement schedules required by Regulation S-K are listed as to location in Attachment A, Index to Consolidated Financial Statements, Notes and Schedules, on page 93 of the Original Filing.
NATIONAL WESTERN LIFE GROUP, INC.
SCHEDULE IV
REINSURANCE INFORMATION
For the Years Ended December 31, 2021, 2020 and 2019
(In thousands)
| | | | | | | | | | | | | | | | | | | | | | | | | | | | | |
| | Gross Amount | | Ceded to Other Companies | | Assumed from Other Companies | | Net amount | | Percentage of Amount Assumed to Net |
| | (In thousands) |
| | | | | | | | | |
| 2021 | | | | | | | | | |
| Life insurance face in force | $ | 20,888,431 | | | 3,781,167 | | | — | | | 17,107,264 | | | — | % |
| | | | | | | | | |
| Premiums: | | | | | | | | | |
| Life insurance | $ | 92,891 | | | 6,419 | | | 194 | | | 86,666 | | | 0.2 | % |
| Accident and health insurance | 3,346 | | | — | | | — | | | 3,346 | | | — | % |
| Annuities | 31 | | | — | | | — | | | 31 | | | — | % |
| Total premiums | $ | 96,268 | | | 6,419 | | | 194 | | | 90,043 | | | 0.2 | % |
| | | | | | | | | |
| 2020 | | | | | | | | | |
| Life insurance face in force | $ | 21,954,160 | | | 4,013,073 | | | — | | | 17,941,087 | | | — | % |
| | | | | | | | | |
| Premiums: | | | | | | | | | |
| Life insurance | $ | 95,579 | | | 6,217 | | | 205 | | | 89,567 | | | 0.2 | % |
| Accident and health insurance | 2,956 | | | — | | | — | | | 2,956 | | | — | % |
| Annuities | 19 | | | — | | | — | | | 19 | | | — | % |
| Total premiums | $ | 98,554 | | | 6,217 | | | 205 | | | 92,542 | | | 0.2 | % |
| | | | | | | | | |
| 2019 | | | | | | | | | |
| Life insurance face in force | $ | 23,299,829 | | | 4,252,828 | | | — | | | 19,047,001 | | | — | % |
| | | | | | | | | |
| Premiums: | | | | | | | | | |
| Life insurance | $ | 92,844 | | | 6,041 | | | 212 | | | 87,015 | | | 0.2 | % |
| Accident and health insurance | 3,214 | | | — | | | — | | | 3,214 | | | — | % |
| Annuities | 19 | | | — | | | — | | | 19 | | | — | % |
| Total premiums | $ | 96,077 | | | 6,041 | | | 212 | | | 90,248 | | | 0.2 | % |
NATIONAL WESTERN LIFE GROUP, INC.
SCHEDULE V
VALUATION AND QUALIFYING ACCOUNTS
For the Years Ended December 31, 2021, 2020 and 2019
(In thousands)
| | | | | | | | | | | | | | | | | | | | | | | | | | | | | | | | |
| Description | | Balance at Beginning of Period | | (1) Charged to Costs and Expenses | | (2) Charged to Retained Earnings | | Reductions | | Balance at End of Period |
| | | | | | | | | | |
| Valuation accounts deducted from applicable assets: | | | | | | | | |
| | | | | | | | | | |
| Allowance for possible losses on mortgage loans: | | | | | | | | |
| | | | | | | | | | |
| December 31, 2021 | | $ | 2,486 | | | 501 | | | — | | | — | | | 2,987 | |
| | | | | | | | | | |
| December 31, 2020 | | $ | 675 | | | 1,307 | | | 504 | | | — | | | 2,486 | |
| | | | | | | | | | |
| December 31, 2019 | | $ | 675 | | | — | | | — | | | — | | | 675 | |
| | | | | | | | | | |
| Allowance for current expected credit losses on debt securities | | | | |
| | | | | | | | | | |
| December 31, 2021 | | $ | — | | | — | | | — | | | — | | | — | |
| | | | | | | | | | |
| December 31, 2020 | | $ | — | | | — | | | 3,334 | | | (3,334) | | | — | |
| | | | | | | | | | |
| Allowance for possible losses on real estate: | | | | | | |
| | | | | | | | | | |
| December 31, 2021 | | $ | 424 | | | — | | | — | | | — | | | 424 | |
| | | | | | | | | | |
| December 31, 2020 | | $ | 596 | | | — | | | — | | | (172) | | | 424 | |
| | | | | | | | | | |
| December 31, 2019 | | $ | 611 | | | — | | | — | | | (15) | | | 596 | |
Notes:
(1) Amounts were recorded to realized (gains) losses on investments prior to January 1, 2020, and net investment income, subsequent to January 1, 2020.
(2) On January 1, 2020, the Company adopted ASU 2016-13 and recorded a transition adjustment to retained earnings.
See accompanying report of Independent Registered Public Accounting Firm.
SIGNATURES
Pursuant to the requirements of Section 13 or 15(d) of the Securities Exchange Act of 1934, the Registrant has duly caused this report to be signed on its behalf by the undersigned, thereunto duly authorized.
NATIONAL WESTERN LIFE GROUP, INC.
(Registrant)
| NATIONAL WESTERN LIFE GROUP, INC. (Registrant) |
| | | | | | | |
| Date: | March 10, 2022 April 29, 2024 | /S/s/ Ross R. Moody |
| | By: | Ross R. Moody, Chairman of the Board, President and |
| | Chief Executive Officer |
Pursuant to the requirements of the Securities Exchange Act of 1934, this report has been signed below by the following persons on behalf of the Registrant and in the capacities and on the dates indicated.
| | | | | | | | | | | | | | |
Signature | | Title (Capacity) | | Date |
| | | | |
/S/Ross R. Moody | | Chairman of the Board, President | | March 10, 2022 |
Ross R. Moody | | and Chief Executive Officer | | |
| | (Principal Executive Officer) | | |
| | | | |
/S/Brian M. Pribyl | | Senior Vice President - Chief Financial Officer, | | March 10, 2022 |
Brian M. Pribyl | | and Treasurer | | |
| | (Principal Financial Officer) | | |
| | (Principal Accounting Officer) | | |
| | | | |
/S/Thomas A. Blackwell | | Director | | March 10, 2022 |
Thomas A. Blackwell | | | | |
| | | | |
/S/David S. Boone | | Director | | March 10, 2022 |
David S. Boone | | | | |
| | | | |
/S/Stephen E. Glasgow | | Director | | March 10, 2022 |
Stephen E. Glasgow | | | | |
| | | | |
/S/E. Douglas McLeod | | Director | | March 10, 2022 |
E. Douglas McLeod | | | | |
| | | | |
/S/Frances A. Moody-Dahlberg | | Director | | March 10, 2022 |
Frances A. Moody-Dahlberg | | | | |
| | | | |
/S/Charles D. Milos | | Director | | March 10, 2022 |
Charles D. Milos | | | | |
| | | | |
/S/Ann M. Moody | | Director | | March 10, 2022 |
Ann M. Moody | | | | |
| | | | |
/S/E.J. Pederson | | Director | | March 10, 2022 |
E.J. Pederson | | | | |
39
0001635984 us-gaap:CommonClassBMember 2024-02-28