TABLE OF CONTENTS
Index
| GLOSSARY OF TERMS | |||||
| PART I | |||||
| Item 1 — Business | |||||
| Item 1A — Risk Factors | |||||
| Item 1B — Unresolved Staff Comments | |||||
| Item 2 — Properties | |||||
| Item 3 — Legal Proceedings | |||||
| Item 4 — Mine Safety Disclosures | |||||
| PART II | |||||
| Item 5 — Market for Registrant's Common Equity, Related Stockholder Matters and Issuer Purchases of Equity Securities | |||||
| Item 6 — | |||||
| Item 7 — Management's Discussion and Analysis of Financial Condition and Results of Operations | |||||
| Item 7A — Quantitative and Qualitative Disclosures About Market Risk | |||||
| Item 8 — Financial Statements and Supplementary Data | |||||
| Item 9 — Changes in Disagreements With Accountants on Accounting and Financial Disclosure | |||||
| Item 9A — Controls and Procedures | |||||
| Item 9B — Other Information | |||||
| PART III | |||||
| Item 10 — Directors, Executive Officers and Corporate Governance | |||||
| Item 11 — Executive Compensation | |||||
| Item 12 — Security Ownership of Certain Beneficial Owners and Management and Related Stockholder Matters | |||||
| Item 13 — Certain Relationships and Related Transactions, and Director Independence | |||||
| Item 14 — Principal Accounting Fees and Services | |||||
| PART IV | |||||
| Item 15 — Exhibits, Financial Statement Schedules | |||||
| EXHIBIT INDEX | |||||
| Item 16 — Form 10-K Summary | |||||
2
GLOSSARY OF TERMS
When the following terms and abbreviations appear in the text of this report, they have the meanings indicated below:
| 2020 Convertible Notes | ||||||||
| 2024 Senior Notes | $500 million aggregate principal amount of 5.375% unsecured senior notes due 2024, issued by | |||||||
| 2025 Senior Notes | $600 million aggregate principal amount of 5.750% unsecured senior notes due 2025, issued by Clearway Energy Operating LLC, which were repaid in March 2021 | |||||||
| 2026 Senior Notes | $350 million aggregate principal amount of 5.00% unsecured senior notes due 2026, issued by | |||||||
| 2028 Senior Notes | $850 million aggregate principal amount of 4.75% unsecured senior notes due 2028, issued by Clearway Energy Operating LLC | |||||||
| ARO | Asset Retirement Obligation | |||||||
| ASC | The FASB Accounting Standards Codification, which the FASB established as the source of authoritative GAAP | |||||||
| ASU | Accounting Standards Updates – updates to the ASC | |||||||
| ATM | At-The-Market Equity Offering | |||||||
| A non-GAAP measure, Cash Available | ||||||||
The Coronavirus Aid, Relief, and Economic Security Act | ||||||||
| Carlsbad Drop Down | The acquisition by the Company of the Carlsbad Energy Center, a 527 MW natural | |||||||
| Right of First Offer Agreement, entered into as of August 31, 2018, by and between Clearway Energy Group LLC and Clearway Energy, Inc., and solely for purposes of Section 2.4, GIP III Zephyr Acquisition Partners, L.P., as amended by the First Amendment dated February 14, 2019, the Second Amendment dated August 1, 2019, the Third Amendment dated December 6, 2019 and the Fourth Amendment dated November 2, 2020 | ||||||||
| Clearway, Inc. | Clearway Energy, Inc., the holder of the Company's Class A and Class C units | |||||||
| Clearway Energy Group LLC | The holder of all of Clearway, Inc.'s Class B and Class D common shares and the Company's Class B and Class D units and, from time to time, possibly shares of Clearway Energy, Inc.'s Class A and/or Class C common stock | |||||||
3
| Clearway Energy Operating LLC | The holder of the project assets that are owned by the Company | |||||||
| COD | Commercial Operation Date | |||||||
| Code | Internal Revenue Code of 1986, as amended | |||||||
| Company | ||||||||
| CVSR | California Valley Solar Ranch | |||||||
| CVSR Holdco LLC, the indirect owner of CVSR | ||||||||
| DGPV Holdco | ||||||||
| DGPV Holdco 2 and DGPV Holdco 3 | ||||||||
| DGPV Holdco 1 | ||||||||
| DGPV Holdco 2 | DGPV Holdco 2 LLC | |||||||
| DGPV Holdco 3 | ||||||||
Distributed Solar | Solar power projects, typically less than 20 MW in size, that primarily sell power produced to customers for usage on site, or are interconnected to sell power into the local distribution grid | |||||||
| Drop Down Assets | Collectively, assets under common control acquired by the | |||||||
| Energy | ||||||||
| ERCOT | ||||||||
| Electric Reliability Council of Texas, the ISO and the regional reliability coordinator of the various electricity systems within Texas | ||||||||
| EWG | Exempt Wholesale Generator | |||||||
| Exchange Act | The Securities Exchange Act of 1934, as amended | |||||||
| FASB | Financial Accounting Standards Board | |||||||
| FERC | Federal Energy Regulatory Commission | |||||||
| FPA | Federal Power Act | |||||||
| GAAP | Accounting principles generally accepted in the U.S. | |||||||
| GenConn | GenConn Energy LLC | |||||||
| GHG | Greenhouse gas | |||||||
| Global Infrastructure Management, LLC | ||||||||
| GIP | Global Infrastructure Partners | |||||||
| GIP Transaction | ||||||||
| ISO | Independent System Operator, also referred to as an RTO | |||||||
| ITC | Investment Tax Credit | |||||||
| KKR | KKR Thor Bidco, LLC, an affiliate of Kohlberg Kravis Roberts & Co. L.P. | |||||||
| kWh | Kilowatt Hour | |||||||
| LIBOR | London Inter-Bank Offered Rate | |||||||
| MBTA | Migratory Bird Treaty Act | |||||||
| Mesquite Star | Mesquite Star Special LLC | |||||||
| MMBtu | Million British Thermal Units | |||||||
| Mt. Storm | NedPower Mount Storm LLC | |||||||
| MW | Megawatt | |||||||
| MWh | Saleable megawatt hours, net of internal/parasitic load megawatt-hours | |||||||
4
| MWt | Megawatts Thermal Equivalent | |||||||
| NEPA | National Environmental Policy Act | |||||||
| NERC | North American Electric Reliability Corporation | |||||||
| Net Exposure | Counterparty credit exposure to Clearway Energy LLC, net of collateral | |||||||
NOx | Nitrogen Oxides | |||||||
| NPNS | Normal Purchases and Normal Sales | |||||||
| NPPD | Nebraska Public Power District | |||||||
| NRG | NRG Energy, Inc. | |||||||
| OCI/OCL | Other comprehensive income/loss | |||||||
| O&M | Operations and Maintenance | |||||||
| PG&E Bankruptcy | On January 29, 2019, PG&E Corporation and Pacific Gas | |||||||
| PJM Interconnection, LLC | ||||||||
| PPA | Power Purchase Agreement | |||||||
| PTC | Production Tax Credit | |||||||
| PUCT | Public Utility Commission of Texas | |||||||
| PUHCA | Public Utility Holding Company Act of 2005 | |||||||
| PURPA | Public Utility Regulatory Policies Act of 1978 | |||||||
| QF | Qualifying Facility under PURPA | |||||||
| RENOM | Clearway Renewable Operation & Maintenance LLC | |||||||
| ROFO | Right of First Offer | |||||||
| RPS | Renewable Portfolio Standards | |||||||
| RPV Holdco | RPV Holdco 1 LLC | |||||||
| RTO | Regional Transmission Organization | |||||||
| SCE | Southern California Edison | |||||||
| SEC | U.S. Securities and Exchange Commission | |||||||
| Senior Notes | Collectively, the 2028 Senior Notes, the 2031 Senior Notes and the 2032 Senior Notes | |||||||
SO2 | Sulfur Dioxide | |||||||
| SOFR | Secured Overnight Financing Rate | |||||||
| SREC | Solar Renewable Energy Credit | |||||||
| Tax Act | Tax Cuts and Jobs Act of 2017 | |||||||
| Thermal Business | The Company's thermal business, which consists of thermal infrastructure assets that provide steam, hot water and/or chilled water, and in some instances electricity, to commercial businesses, universities, hospitals and governmental units | |||||||
| U.S. | United States of America | |||||||
| U.S. DOE | U.S. Department of Energy | |||||||
| Utah Solar Portfolio | Collection consists of Four Brothers Solar, LLC, Granite Mountain Holdings, LLC, and Iron Springs Holdings, LLC, which are equity investments owned by Four Brothers | |||||||
Utility Scale Solar | Solar power projects, typically 20 MW or greater in size (on an alternating current, or AC, basis), that are interconnected into the transmission or distribution grid to sell power at a wholesale level | |||||||
| VaR | Value at Risk | |||||||
| VIE | Variable Interest Entity | |||||||
5
PART I
Item 1 — Business
General
The Company is one of the primary vehicle through which NRG owns, operates and acquires contracted renewable and conventional generation and thermal infrastructure assets. On February 6, 2018, Global Infrastructure Partners, or GIP, entered into a purchase and sale agreement with NRG, or the NRG Transaction, for the acquisition of NRG’s full ownership interest in NRG Yield, Inc. and NRG’slargest renewable energy development and operations platform. The Company believes it is well positioned to be a premier company for investors seeking stable and growing dividend income from a diversified portfolio of lower-risk, high-quality assets.
On October 22, 2021, Clearway Energy Operating LLC entered into a binding agreement to sell the Thermal Business to KKR Thor Bidco, LLC, an affiliate of Kohlberg Kravis Roberts & Co. L.P., or KKR, for total consideration of $1.9 billion, subject to customary closing adjustments, which is referred to herein as the Thermal Disposition. The transaction is expected to close in the first half of 2022. The Company's Thermal segment is comprised solely of the Thermal Business's results of operations. For further discussion of the Thermal Disposition, refer to Item 15 — Note 3, Acquisitions and Dispositions.
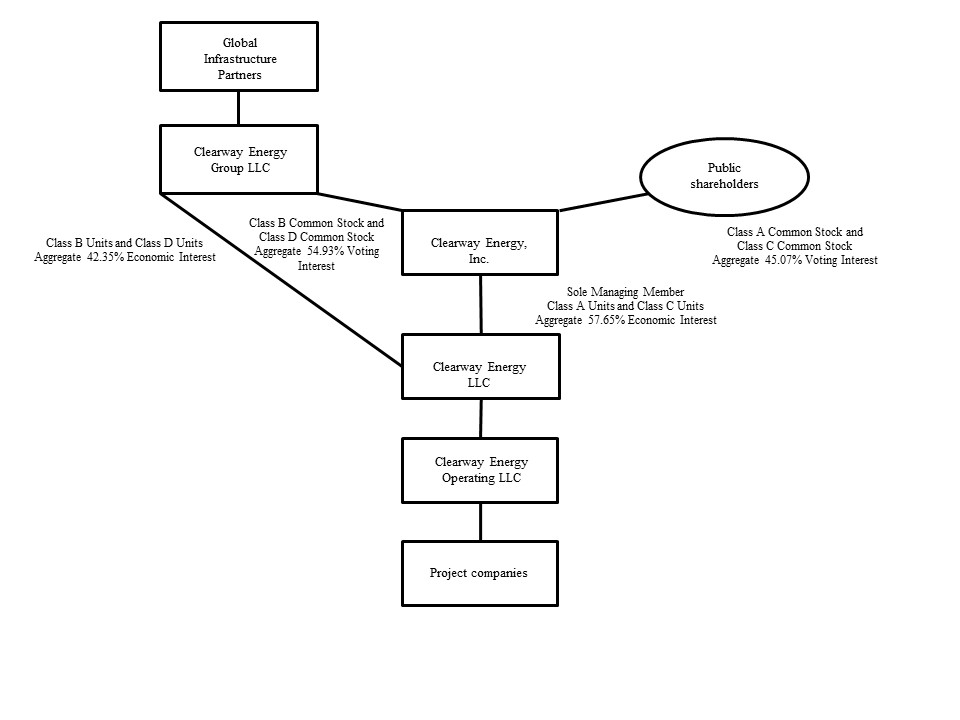
As of December 31, 2021, GIP indirectly owned 42.35% of the economic interests in the Company also owns thermal infrastructure assets with an aggregate steam and chilled water capacity54.93% of 1,319 net MWt and electric generation capacity of 123 net MW. These thermal infrastructure assets provide steam, hot and/the voting interests in Clearway Energy, Inc., or chilled water, and, in some instances, electricity, to commercial businesses, universities, hospitals and governmental units in multiple locations, principally through long-term contracts or pursuant to rates regulated by state utility commissions.Clearway, Inc.
A complete listing of the Company's interests in facilities, operations and/or projects owned or leased as of December 31, 20172021 can be found in Item 2 —Properties.
History
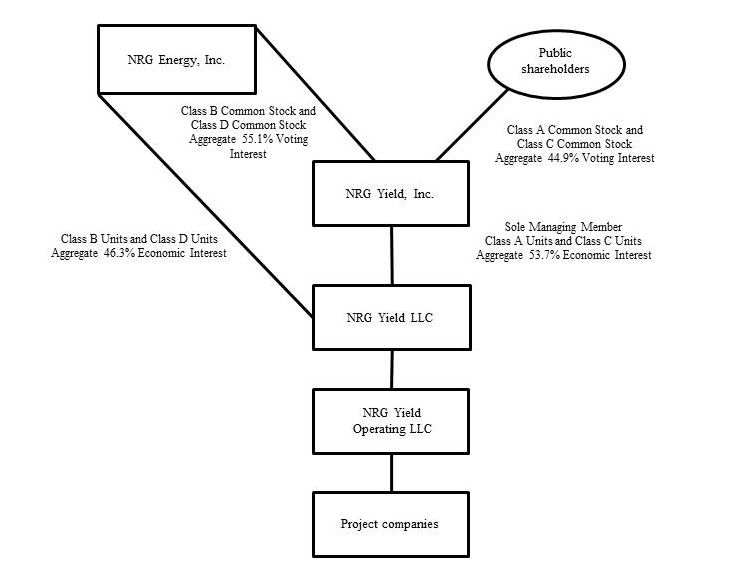
The Company was formed as a Delaware limited liability company by NRG on March 5, 2013. On July 22, 2013, Yield,August 31, 2018, NRG transferred its full ownership interest in Clearway, Inc. closedand its subsidiaries to CEG, the initial public offeringholder of 22,511,250 sharesNRG’s renewable energy development and operations platform, and subsequently sold 100% of its Class A common stock for net proceeds, after deducting underwriting discounts, of $468 million, of which Yield, Inc. used $395 million to purchase 19,011,250 of the Company's Class A units from NRG and $73 million to purchase 3,500,000 of the Company's Class A units directly from the Company. On July 29, 2014, Yield, Inc. issued 12,075,000 shares of Class A common stock for net proceeds, after underwriting discounts and expenses, of $630 million and utilized the proceeds of the offering to acquire 12,075,000 additional Class A units of the Company.
The Company is a holding company for the companies that directly and indirectly own and operate Yield,Clearway, Inc.'s business. As of December 31, 2017, NRG continues to control Yield,2021, GIP, through CEG, controls Clearway, Inc., and Yield,Clearway, Inc. in turn, as the sole managing member of the Company, controls the Company and its subsidiaries.
As of December 31, 2021, GIP, through CEG, owned 42,738,750 of each of the Company's Class B units and Class D units and Clearway, Inc. owned 34,599,645 of the Company's Class A units and 81,779,021 of the Company's Class C units. Clearway, Inc., through its holdings of Class A units and Class C units, owned a 57.65% economic interest in the Company as of December 31, 2021. Additionally, GIP, through CEG's holdings of Class B units and Class D units, owned a 42.35% economic interest in the Company as of December 31, 2021.
6
The diagram below depicts the Company’s organizational structure as of December 31, 2017:2021:
Business Strategy
The Company's primary business strategy is to focus on the acquisition and ownership of assets with predictable, long-term cash flows in order that it may be able to increase the cash distributions to Yield,Clearway, Inc. and NRG over time without compromising the ongoing stability of the business.
The Company's plan for executing thisits business strategy includes the following key components:
Focus on contracted renewable energy and conventional generation and thermal infrastructure assets. generation. The Company owns and operates utility scale and distributed renewable energy and natural gas-fired generation thermal and other infrastructure assets with proven technologies, low operating risks and stable cash flows. The Company believes by focusing on this core asset class and leveraging its industry knowledge, it will maximize its strategic opportunities, be a leader in operational efficiency and maximize its overall financial performance. The Company also owns the Thermal Business that Clearway Energy Operating LLC has entered into a binding agreement to sell to KKR. For further discussion of the Thermal Disposition, refer to Item 15 — Note 3, Acquisitions and Dispositions.
7
Growing the business through acquisitions of contracted operating assets. The Company believes that its base of operations and relationship with NRG provideprovides a platform in the conventional and renewable power generation and thermal sectors for strategic growth through cash accretive and tax advantaged acquisitions complementary to its existing portfolio. In addition to acquiring renewable generation conventional generation and thermal infrastructure assetsfacilities from third parties where the Company believes its knowledge of the market and operating expertise provides it with a competitive advantage, the Company may consummate future acquisitions from CEG. The Company believes that CEG's project development expertise provides the Company access to a development platform with an extensive pipeline of potential renewable energy and storage projects that are aligned to support the Company's growth. Furthermore, the Company has entered into a Right of First Offer Agreement with NRG, or the NRG ROFO Agreement. Under the NRGCEG ROFO Agreement, NRGwhereby CEG has granted the Company and its affiliates a right of first offer on any proposed sale, transfer or other disposition of certain assets of NRGCEG, or the CEG ROFO Assets, until February 24, 2022. NRGAugust 31, 2023. CEG is not obligated to sell the remaining NRGCEG ROFO Assets to the Company and, if offered by NRG,CEG, the Company cannot be sure whether these assets will be offered on acceptable terms, or that the Company will choose to consummate such acquisitions. The Company and CEG work collaboratively in considering new assets to be added under the CEG ROFO Agreement or to be acquired by the Company outside of the CEG ROFO Agreement. The assets listed below, all of which are included in the table belowa co-investment partnership with Hannon Armstrong Sustainable Infrastructure Capital, Inc., represent the NRGCompany's currently committed investments in projects with CEG and the CEG ROFO Assets:
| Asset | Fuel Type | Rated Capacity (MW)(a) | COD | |||
| Agua Caliente | Solar | 102 | 2014 | |||
| Ivanpah | Solar | 196 | 2013 | |||
Hawaii(b) | Solar | 80 | 2019 | |||
Distributed Solar (up to $190 million of equity in distributed solar generation portfolio(s)(b) | Solar | various | various | |||
Buckthorn Solar(c) | Solar | 154 | 2018 | |||
Carlsbad (d) | Conventional | 527 | 2018 | |||
Puente/Mandalay(e) | Conventional | Project not expected to move forward | ||||
| Community | Wind | Sold to third party | ||||
| Jeffers | Wind | Sold to third party | ||||
| Minnesota Portfolio | Wind | Sold to third party | ||||
| Asset | Technology | Gross Capacity (MW) | State | COD | Status | |||||||||||||||||||||||||||
| Mililani I | Solar | 39 | HI | 2H22 | Committed | |||||||||||||||||||||||||||
| Waiawa | Solar | 36 | HI | 2H22 | Committed | |||||||||||||||||||||||||||
| Daggett Solar 2 and 3 | Solar | 482 | CA | 2H22/1H23 | Committed | |||||||||||||||||||||||||||
Primary focus on North America.The Company intends to primarily focus its investments in North America (including the unincorporated territories of the U.S.). The Company believes that industry fundamentals in North America present it with significant opportunity to acquire renewable, natural gas-fired generation and thermal infrastructure assets,grow its portfolio without creating significant exposure to currency and sovereign risk. By primarily focusing its efforts on North America, the Company believes it will best leverage its regional knowledge of power markets, industry relationships and skill sets to maximize the performance of the Company.
Maintain sound financial practices to grow the distributions. The Company intends to maintain a commitment to disciplined financial analysis and a balanced capital structure to enable it to increase its distributions over time and serve the long-term interests of its unit holders. The Company's financial practices include a risk and credit policy focused on transacting with creditworthy counterparties; a financing policy, which focuses on seeking an optimal capital structure through various capital formation alternatives to minimize interest rate and refinancing risks, ensure stable distributions and maximize value. The Company intends to evaluate various alternatives for financing future acquisitions and refinancing of existing project-level debt, in each case, to reduce the cost of debt, extend maturities and maximize CAFD.
Competition
Power generation is a capital-intensive business with numerous and diverse industry participants. The Company competes on the basis of the location of its plants and on the basis of contract price and terms of individual projects. Within the power industry, there is a wide variation in terms of the capabilities, resources, nature and identity of the companies with whom the Company competes with depending on the market. Competitors for energy supply are utilities, independent power producers and other providers of distributed generation. The Company also competes to acquire new projects with renewable developers who retain renewable power plant ownership, independent power producers, financial investors and other dividend, growth-oriented companies. Competitive conditions may be substantially affected by capital market conditions and by various forms of energy legislation and regulation considered by federal, state and local legislatures and administrative agencies, including tax policy. Such laws and regulations may substantially increase the costs of acquiring, constructing and operating projects, and it could be difficult for the Company to adapt to and operate under such laws and regulations.
The Company's thermal businessThermal Business has certain cost efficiencies that may form barriers to entry. Generally, there is only one district energy system in a given territory, for which the only competition comes from on-site systems. While the district energy system can usually make an effective case for the efficiency of its services, some building owners nonetheless may opt for on-site systems, either due to corporate policies regarding allocation of capital, unique situations where an on-site system might in fact prove more efficient or because of previously committed capital in systems that are already on-site. Growth in existing district energy systems generally comes from new building construction or existing building conversions within the service territory of the district energy provider. On October 22, 2021, Clearway Energy Operating LLC entered into a binding agreement to sell the Thermal Business to KKR. For further discussion of the Thermal Disposition, refer to Item 15 — Note 3, Acquisitions and Dispositions.
8
Competitive Strengths
Stable, high quality cash flows. The Company's facilities have a stable, predictable cash flow profile consisting of predominantly long-life electric generation assets that sell electricity under long-term fixed priced contracts or pursuant to regulated rates with investment gradeinvestment-grade and certain other credit-worthycreditworthy counterparties. Additionally, theThe Company's facilities have minimal fuel risk. For the Company's contracted conventional assets, fuel is provided by the toll counterparty or the cost thereof is a pass-through cost under the CfD.Contract for Differences. Renewable facilities have no fuel costs, and most of the Company's thermal infrastructure assets have contractual or regulatory tariff mechanisms for fuel cost recovery. The offtake agreements for the Company's conventional and renewable generation facilities have a weighted-average remaining duration, based on CAFD, of approximately 1512 years as of December 31, 2017, based on CAFD,2021, providing long-term cash flow stability. The Company's generation offtake agreements with counterparties for whom credit ratings are available have a weighted-average Moody’s rating of A3Ba1 based on rated capacity under contract.contract and continues to be influenced by the PG&E Bankruptcy. All of the Company's assets are in the U.S. and accordingly have no currency or repatriation risks.
Environmentally well-positioned portfolio of assets. The Company's portfolio of electric generation assets consists of 3,173over 5,000 net MW of renewable generation capacity that are non-emitting sources of power generation. TheAdditionally, the Company's California conventional assets consist of the dual fuel-fired GenConn assets as well as the Marsh Landing and Walnut Creek simple cycle natural gas-fired peakingefficient gas generation facilities and the El Segundo combined cycle natural gas-fired peaking facility.that support electric system reliability. The Company does not anticipate having to expend any significant capital expenditures in the foreseeable future to comply with current environmental regulations applicable to its generation assets. Taken as a whole, the Company believes its strategy will be a net beneficiary of current and potential environmental legislation and regulatory requirements that may serve as a catalyst for capacity retirements and improve market opportunities for environmentally well-positioned assets like the Company's assets once its current offtake agreements expire.
High quality, long-lived assets with low operating and capital requirements. The Company benefits from a portfolio of relatively younger assets, other than thermal infrastructure assets. The Company's assets are comprised of proven and reliable technologies, provided by leading original solar and wind equipment manufacturers such as General Electric, Siemens AG, SunPower Corporation, or SunPower, First Solar Inc., or First Solar, Vestas, Mitsubishi, Trina Solar, JA Solar and Siemens Gamesa. Given the modern nature of the portfolio, which includes a substantial number of relatively low operating and maintenance cost solar and wind generation assets, the Company expects to achieve high fleet availability and expend modest maintenance-related capital expenditures.
Significant scale and diversity. The Company is one of the largest renewable energy owners in the U.S. with over 5,000 net MW of installed wind and solar generation projects. The Company's over 9,000 net MW of assets also includes approximately 2,500 net MW of environmentally-sound, highly efficient natural gas-fired generation facilities as well as the Thermal Business. The Company's contracted renewable and conventional generation assets benefit from significant diversification in terms of technology, fuel type, counterparty and geography. The Company's Thermal Business consists of fifteen operations, seven of which are district energy centers that provide steam and chilled water to approximately 685 customers, and eight of which provide generation. The Company believes its scale and access to best practices across the fleet improves its business development opportunities through enhanced industry relationships, reputation and understanding of regional power market dynamics. Furthermore, the Company's diversification reduces its operating risk profile and reliance on any single market.
Relationship with GIP and CEG. The Company believes that its relationship with GIP and CEG provides significant benefits. Global Infrastructure Management, LLC, or GIM, the manager of GIP, is an independent infrastructure fund manager that makes equity and debt investments in infrastructure assets and businesses in both the Organization for Economic Co-operation and Development and select emerging market countries. GIM has a strong track record of investment and value creation in the renewable energy sector. GIM also has extensive experience with publicly traded yield vehicles and development platforms, ranging from Europe's first application of a yield company/development company model to the largest renewable platform in Asia-Pacific. Additionally, the Company believes that CEG provides the Company access to a highly capable renewable development and operations platform that is aligned to support the Company's growth.
9
Thermal infrastructure business has high entry costs. Significant capital has been invested to construct the Company's thermal infrastructure assets, serving as a barrier to entry in the markets in which such assets operate. As of December 31, 2017, the Company's thermal gross property, plant, and equipment was approximately $473 million. The Company's thermal district energy centers are located in urban city areas, with the chilled water and steam delivery systems located underground. Constructing underground delivery systems in urban areas requires long lead times for permitting, rights of way and inspections and is costly. By contrast, the incremental cost to add new customers in existing markets is relatively low. Once thermal infrastructure is established, the Company believes it has the ability to retain customers over long periods of time and to compete effectively for additional business against stand-alone on-site heating and cooling generation facilities. Installation of stand-alone equipment can require significant modification to a building as well as significant space for equipment and funding for capital expenditures. The Company's system technologies often provide economies of scale in terms of fuel procurement, ability to switch between multiple types of fuel to generate thermal energy, and fuel conversion efficiency. On October 22, 2021, Clearway Energy Operating LLC entered into a binding agreement to sell the Thermal Business to KKR. For further discussion of the Thermal Disposition, refer to Item 15 — Note 3, Acquisitions and Dispositions.
Segment Review
The following tables summarize the Company's operating revenues, net income (loss) and assets by segment for the years ended December 31, 2017, 20162021, 2020 and 2015,2019, as discussed in Item 15 — Note 12, 13, Segment Reporting, to.
| Year ended December 31, 2021 | |||||||||||||||||||||||||||||
| (In millions) | Conventional Generation | Renewables | Thermal | Corporate | Total | ||||||||||||||||||||||||
| Operating revenues | $ | 441 | $ | 641 | $ | 204 | $ | — | $ | 1,286 | |||||||||||||||||||
| Net income (loss) | 172 | (65) | 22 | (192) | (63) | ||||||||||||||||||||||||
| Total assets | $ | 2,442 | $ | 9,603 | $ | 631 | $ | 42 | 12,718 | ||||||||||||||||||||
| Year ended December 31, 2020 | |||||||||||||||||||||||||||||
| (In millions) | Conventional Generation | Renewables | Thermal | Corporate | Total | ||||||||||||||||||||||||
| Operating revenues | $ | 437 | $ | 569 | $ | 193 | $ | — | $ | 1,199 | |||||||||||||||||||
| Net income (loss) | 140 | (108) | 3 | (87) | (52) | ||||||||||||||||||||||||
| Total assets | $ | 2,575 | $ | 7,157 | $ | 627 | $ | 129 | 10,488 | ||||||||||||||||||||
| Year ended December 31, 2019 | |||||||||||||||||||||||||||||
| (In millions) | Conventional Generation | Renewables | Thermal | Corporate | Total | ||||||||||||||||||||||||
| Operating revenues | $ | 346 | $ | 485 | $ | 201 | $ | — | $ | 1,032 | |||||||||||||||||||
| Net income (loss) | 135 | (104) | (5) | (127) | (101) | ||||||||||||||||||||||||
Policy Incentives
Policy incentives in the Consolidated Financial Statements. All amountsU.S. have been recast to include the effect of making the acquisitionsdevelopment of renewable energy projects more competitive by providing tax credits or grants and accelerated depreciation for a portion of the Drop Down Assets,development costs, decreasing the costs and risks associated with developing such projects or creating demand for renewable energy assets through RPS programs. The elimination of, loss of or reduction in such incentives could decrease the attractiveness of renewable generation projects to developers, including, but not limited to, CEG, which were accountedcould reduce the Company's acquisition opportunities. Such an elimination, loss or reduction could also reduce the Company's willingness to pursue or develop certain renewable energy projects due to higher operating costs or decreased revenues under its PPAs.
U.S. federal, state and local governments have established various incentives to support the development of renewable energy projects. These incentives include accelerated tax depreciation, PTCs, ITCs, cash grants, tax abatements and RPS programs. Pursuant to the U.S. federal Modified Accelerated Cost Recovery System, or MACRS, wind and solar projects are generally fully depreciated for as transferstax purposes over a five-year period (before taking into account certain conventions) even though the useful life of entities under common control.such projects is generally much longer than five years. The accounting guidance requires retrospective combinationTax Cuts and Jobs Act of 2017, or the Tax Act, also provides the ability for wind and solar projects to claim immediate expensing for property acquired and placed in service after September 27, 2017, and before January 1, 2023.
10
Owners of utility-scale wind facilities are eligible to claim an income tax credit (the PTC, or an ITC in lieu of the entitiesPTC) upon initially achieving commercial operation. The PTC is determined based on the amount of electricity produced by the wind facility during the first ten years of commercial operation. This incentive was created under the Energy Policy Act of 1992 and has been extended several times. Alternatively, an ITC equal to a percentage of the cost of a wind facility may be claimed in lieu of the PTC. In order to qualify for all periods presented asthe PTC (or ITC in lieu of the PTC), construction of a wind facility must begin before a specified date and the taxpayer must maintain a continuous program of construction or continuous efforts to advance the project to completion. The Internal Revenue Service, or IRS, issued guidance stating that the safe harbor for continuous efforts and continuous construction requirements will generally be satisfied if the combination has beenfacility is placed in effect sinceservice no more than four years after the inception of common control. Accordingly, the Company prepared its consolidated financial statements to reflect the transfers as if they had taken place from the beginningyear in which construction of the financial statementsfacility began. In response to the COVID-19 pandemic, the IRS extended this safe harbor by one year for facilities that began construction in 2016 or 2017. In 2021, the IRS further extended the continuity safe harbor period or fromto six years for facilities that began construction in 2016 through 2019. For facilities that began construction in 2020, the datecontinuity safe harbor was extended to five years.
Owners of solar projects are eligible to claim an ITC for new solar projects. This incentive was created under the entities were under common control (if later thanEnergy Policy Act of 2005 and has also been extended several times, including most recently by the beginningConsolidated Appropriations Act of 2020.
Tax credits for qualifying wind and solar projects are subject to the following phase-down schedule:
| Year construction of project begins | ||||||||||||||||||||||||||||||||||||||||||||||||||||||||||||||||||||||||||||||||||||||
| 2015 | 2016 | 2017 | 2018 | 2019 | 2020 | 2021 | 2022 | 2023 | 2024 | |||||||||||||||||||||||||||||||||||||||||||||||||||||||||||||||||||||||||||||
PTC (a) | 100 | % | 100 | % | 80 | % | 60 | % | 40 | % | 60 | % | 60 | % | — | % | — | % | — | % | ||||||||||||||||||||||||||||||||||||||||||||||||||||||||||||||||||
On Shore Wind ITC (b) | 30 | % | 30 | % | 24 | % | 18 | % | 12 | % | 18 | % | 18 | % | — | % | — | % | — | % | ||||||||||||||||||||||||||||||||||||||||||||||||||||||||||||||||||
Solar ITC (c) | 30 | % | 30 | % | 30 | % | 30 | % | 30 | % | 26 | % | 26 | % | 26 | % | 22 | % | 10 | % | ||||||||||||||||||||||||||||||||||||||||||||||||||||||||||||||||||
(a) Percentage of the financial statements period). full PTC available for wind projects that begin construction during the applicable year.
(b) The Taxpayer Certainty and Disaster Tax Relief Act of 2020 provides for a new 30% ITC for offshore wind projects that begin construction before January 1, 2026.
| Year ended December 31, 2017 | |||||||||||||||||||
| (In millions) | Conventional Generation | Renewables | Thermal | Corporate | Total | ||||||||||||||
| Operating revenues | $ | 336 | $ | 501 | $ | 172 | $ | — | $ | 1,009 | |||||||||
| Net income (loss) | 120 | 9 | 25 | (92 | ) | 62 | |||||||||||||
| Total assets | 1,897 | 5,811 | 422 | 24 | 8,154 | ||||||||||||||
| Year ended December 31, 2016 | |||||||||||||||||||
| (In millions) | Conventional Generation | Renewables | Thermal | Corporate | Total | ||||||||||||||
| Operating revenues | $ | 333 | $ | 532 | $ | 170 | $ | — | $ | 1,035 | |||||||||
| Net income (loss) | 153 | (86 | ) | 29 | (81 | ) | 15 | ||||||||||||
| Total assets | 1,993 | 6,114 | 426 | 212 | 8,745 | ||||||||||||||
| Year ended December 31, 2015 | |||||||||||||||||||
| (In millions) | Conventional Generation | Renewables | Thermal | Corporate | Total | ||||||||||||||
| Operating revenues | $ | 336 | $ | 458 | $ | 174 | $ | — | $ | 968 | |||||||||
| Net income (loss) | 156 | (18 | ) | 22 | (65 | ) | 95 | ||||||||||||
Regulatory Matters
As owners of power plants and participants in wholesale and thermal energy markets, certain of the Company's subsidiaries are subject to regulation by various federal and state government agencies. These agencies include FERC and the PUCT, as well as other public utility commissions in certain states where the Company's assets are located. Each of the Company's U.S. generating facilities qualifies as an EWG or QF. In addition, the Company is subject to the market rules, procedures and protocols of the various ISO and RTO markets in which it participates. Likewise, certain of the CompanyCompany's subsidiaries must also comply with the mandatory reliability requirements imposed by NERC and the regional reliability entities in the regions where the Company operates.has generating facilities subject to NERC's reliability authority.The Company's operations within the ERCOT footprint are not subject to rate regulation by FERC, as they are deemed to operate solely within the ERCOT market and not in interstate commerce. These operations are subject to regulation by PUCT.
FERC
FERC, among other things, regulates the transmission and the wholesale sale of electricity in interstate commerce under the authority of the FPA. The transmission and sale of electric energy occurring wholly within ERCOT is not subject to FERC’s jurisdiction under Sections 203 or 205 of the FPA.jurisdiction. Under existing regulations, FERC determineshas the authority to determine whether an entity owning a generation facility is an EWG, as defined in the PUHCA. FERC also determineshas the authority to determine whether a generation facility meets the ownership and technicalapplicable criteria of a QF under the PURPA. Each of the Company’s non-ERCOTU.S. generating facilities qualifies as either an EWG.EWG or QF.
The FPA gives FERC exclusive rate-making jurisdiction over the wholesale sale of electricity and transmission of electricity in interstate commerce of public utilities (as defined by the FPA). Under the FPA, FERC, with certain exceptions, regulates the owners and operators of facilities used for the wholesale sale of electricity or transmission in interstate commerce as public utilities, and establishesis charged with ensuring that market rules that are just and reasonable.
11
Public utilities are required to obtain FERC’s acceptance, pursuant to Section 205 of the FPA, of their rate schedules for the wholesale sale of electricity. AllSeveral of the Company's QF generating facilities and all of the Company’s non-QF generating entitiesfacilities located in the U.S. outside of ERCOT make sales of electricity pursuant to market-based rates, as opposed to traditional cost-of-service regulated rates. Every three years FERC will conductconducts a review of the Company’s market basedmarket-based rates of Company public utilities and potential market power onevery three years according to a regional basis.schedule established by FERC.
In accordance with the Energy Policy Act of 2005, FERC has approved the NERC as the national Energy Reliability Organization, or ERO. As the ERO, NERC is responsible for the development and enforcement of mandatory reliability standards for the wholesale electric power system. In additionsystem, with such authority delegated in part to complying with NERC requirements, each entity must comply with the requirements of the regional reliability entityentities charged with enforcement of mandatory reliability standards for the region in which it is located.they are responsible for overseeing.
The PURPA was passed in 1978 in large part to promote increased energy efficiency and development of independent power producers. The PURPA created QFs to further both goals, and FERC is primarily charged with administering the PURPA as it applies to QFs. Certain QFs are exempt from regulation, either in whole or in part,certain regulations under the FPA as public utilities.FPA.
The PUHCA provides FERC with certain authority over and access to books and records of public utility holding companies not otherwise exempt by virtue of their ownership of EWGs, QFs, and Foreign Utility Companies. The Company is exempt from many of the accounting, record retention, and reporting requirements of the PUHCA.
Environmental Matters
The Company is subject to a wide range of environmental laws induring the development, construction, ownership and operation of projects.facilities. These existing and future laws generally require that governmental permits and approvals be obtained before construction and maintained during operation of facilities. The Company is also subjectobligated to comply with all environmental laws regardingand regulations applicable within each jurisdiction and required to implement environmental programs and procedures to monitor and control risks associated with the protectionconstruction, operation and decommissioning of wildlife, including migratory birds, eagles, threatened and endangered species.regulated or permitted energy assets. Federal and state environmental laws have historically become more stringent over time, although this trend could change in the future.
A number of regulations that may affect the Company are under review for potential revision or rescission in 2022, including the federal Migratory Bird Treaty Act (MBTA) incidental take permit regulations and federal Bald and Golden Eagle Protection Act incidental take permit regulations. Government leaders have also considered proposed MBTA legislation (Lowenthal Bill). The Company will evaluate the impact of the legislation and regulations as they are revised but cannot fully predict the impact of each until anticipated revisions and legal challenges are resolved.To the extent that proposed legislation and new or revised regulations restrict or otherwise impact the Company's operations, the proposed legislation and regulations could have a negative impact on the Company's financial performance.
Proposed Federal MBTA Incidental Take Legislation and Regulations — On October 4, 2021, U.S. Fish and Wildlife Service (FWS) issued the final MBTA rule, effective December 3, 2021, restoring the MBTA to prohibit the incidental take of migratory birds. FWS also issued an advance notice of proposed rulemaking (ANPR) advising that it intends to gather information necessary to develop proposed regulations to authorize the incidental take of migratory birds under prescribed conditions and prepare a draft environmental review pursuant to the National Environmental Policy Act. In the ANPR, FWS is considering authorizing incidental take using three primary mechanisms: exceptions to the MBTA’s prohibition on incidental take, general permits for certain activity types and specific or individual permits. FWS is seeking comments on when and how it should apply these three mechanisms to different types of activities. The Company is working with respectrenewable industry groups to provide comments on the proposed rule. Scoping comments on the ANPR were due to FWS by December 3, 2021 and the company participated in this process through the industry groups. FWS is expecting to have the Draft Environmental Impact Statement out for public review during the summer 2022 and the Final Environmental Impact Statement and Record of Decision are anticipated for the following summer 2023.
Changes to the National Environmental Policy Act — On October 7, 2021, the Council on Environmental Quality (CEQ) published notice of proposed rulemaking that would alter regulations for implementing the National Environmental Policy Act (NEPA) in order "to generally restore regulatory provisions that were in effect for decades before being modified in 2020." Specifically, the proposed rule would (1) grant federal lawsagencies greater discretion in developing project alternatives; (2) allow federal agencies to adopt NEPA regulations more stringent than CEQ’s regulations; and (3) require agencies to consider direct, indirect, and cumulative effects of major federal actions. The Notice represents "Phase 1" of the Biden Administration’s plans to revise NEPA regulations, which focuses on provisions that pose significant near-term interpretation or implementation challenges and that "make sense to revert to the 1978 regulatory approach."A "Phase 2" proposal that will "more broadly revisit the 2020 NEPA Regulations" is expected to be released in 2022.
12
Proposed Federal Eagle Incidental Take Permit Proposed Rule — On September 14, 2021, the FWS published in the Federal Register a Notice of Proposed Rulemaking (ANPR) seeking public and regulated-community input on potential approaches for further expediting and simplifying the permit process authorizing incidental take of eagles. This advance notice of proposed rulemaking seeks comment on several approaches that could potentially underpin a more streamlined eagle incidental-take-permitting framework that was first established in 2009. Specifically, FWS is interested in comments clarifying specific aspects of the current permitting process that hinder permit application, processing, or implementation. FWS is also seeking recommendations for additional guidance that would reduce the time and/or cost associated with applying for and implementing long-term, eagle incidental take permits under existing regulations. FWS is looking for recommendations for targeted revisions that could be made to existing regulations consistent with the overall permitting framework that would reduce the time and/or cost associated with applying for and processing long-term permits for incidental take of eagles. Finally, FWS is interested in comments regarding potential new regulatory approaches to authorizing incidental take under the current U.S. presidential administration.
Local California Air District Rules — Air districts have proposed updates to its respective rules to amend, as applicable, Best Available Control Technology criteria for stationary emissions sources including gas turbines, Toxic Air Contaminant Health Risk reporting and general reporting requirements. Rulemaking in the D.C. Circuit agreed on April 28, 2017Los Angeles Air Basin, as regulated by South Coast Air Quality Management District, or SCAQMD, continues to holdupdate command-and-control regulations that limit NOx emissions for stationary sources in preparation for sunsetting SCAQMD’s Regional Clean Air Market, or RECLAIM, NOx cap and trade program in the case in abeyance. On October 16, 2017,next few years. The Company’s conventional generation plants meet the EPAdistrict’s existing and proposed a ruleamendments to repealcommand-and-control regulations. Proposed updates to local California Air District Rules are not expected to affect the CPP. Accordingly,operations nor compliance of the Company believes the CPP is not likely to survive.Company’s conventional generation plants.
Customers
The Company sells its electricity and environmental attributes, including RECs, primarily to local utilities under long-term, fixed-price PPAs.contractual arrangements. During the year ended December 31, 2017,2021, the Company derived approximately 41%33% of its consolidated revenue from Southern California Edison, or SCE, and approximately 23% of its consolidated revenue from Pacific Gas and Electric, or PG&E.
The Company focuses on attracting, developing and retaining a team of highly talented and motivated employees. The majorityCompany regularly conducts assessments of its compensation and benefit practices and pay levels to help ensure that staff members are compensated fairly and competitively. The Company devotes extensive resources to staff development and training, including tuition assistance for career-enhancing academic and professional programs. Employee performance is measured in part based on goals that are aligned with the Company's annual objectives. The Company recognizes that its success is based on the talents and dedication of those it employs, and the Company is highly invested in their success. See "Environmental, Social and Governance (ESG)" below for a discussion of the Company's commitment to the health and safety of the Company's employees.
The Company is committed to maintaining a workplace that acknowledges, encourages, and values diversity and inclusion. The Company believes that individual differences, experiences, and strengths enrich the culture and fabric of its organization. Having employees with backgrounds and orientations that reflect a variety of viewpoints and experiences also helps the Company to better understand the needs of its customers and the communities in which it operates.
By leveraging the multitude of backgrounds and perspectives of its team and developing ongoing relationships with diverse vendors, the Company achieves a collective strength that enhances the workplace and makes the Company a better business partner for its customers and others with a stake in the Company’s success.
13
In 2020, the Company launched its Equity, Partnership & Inclusion Council, or EPIC. As part of its commitment, the Company provides education on topics related to diversity, inclusion, and anti-racism. The Company also identified three areas of focus: Our People, Our Product & Customers and Our Purchasing. With the involvement of its employees, EPIC is advancing efforts in each of these areas to identify and implement opportunities for the Company to address equity, partnership and inclusion issues in its business activities.
Our People focuses on education and training; diversity, equity and inclusion policies and recruitment strategies; community and industry partnerships; and maintaining high employee engagement and retention.
Our Product & Customers focuses on pursuing opportunities that provide more equitable access to renewable energy for low-to-moderate income customers; supporting the diversity, equity and inclusion goals of the Company's offtakers; and meaningfully representing that work in the external market.
Our Purchasing focuses on establishing a non-discriminatory practices standard for the Company’s suppliers, diverse vendor sourcing and benchmarking.
In addition to the personnel who manageof CEG, the Company relies on other third-party service providers in the daily operations of its conventional facilities and certain renewable facilities.
Environmental, Social and Governance (ESG)
The Company is committed to engaging with its stakeholders on environmental, social and governance, or ESG, matters in a proactive, holistic and integrated manner. The Company strives to provide recent, credible and comparable data to ESG agencies while engaging institutional investors and investor advocacy organizations around ESG issues. The Company's Corporate Governance, Conflicts and Nominating Committee reviews developing trends and emerging ESG matters as well as the Company’s strategies, activities policies and communications regarding ESG matters, and makes recommendations to the Company's Board of Directors regarding potential actions by the Company.
Since December 2019, the Company has issued $2.1 billion of corporate green bonds under a green bond framework that applies the net proceeds to finance or refinance, in part or in full, new and existing projects and assets meeting certain criteria focused on the supply of energy from renewable resources, including solar energy and wind energy. The Company's projects and alignment of its Green Bond Principles (2018) are reviewed by Sustainalytics, an outside consultant with recognized expertise in ESG research and analysis.
The Company includes safety performance goals in the annual incentive plan for its management and the Company had zero fatalities in 2021. In response to the ongoing coronavirus (COVID-19) pandemic, the Company has implemented preventative measures and developed corporate and regional response plans to protect the health and safety of its employees, customers and other business counterparties, while supporting the Company’s suppliers and customers’ operations to the best of NRG or third parties managedits ability in the circumstances. The Company also has modified certain business practices (including limiting non-essential business travel, implementing a temporary work-from-home policy for employees who can execute their work remotely and encouraging employees to adhere to local and regional social distancing, more stringent hygiene and cleaning protocols across the Company’s facilities and operations and self-quarantining recommendations) to support efforts to reduce the spread of COVID-19 and its variants and to conform to government restrictions and best practices encouraged by NRG,governmental and their services are providedregulatory authorities. The Company continues to evaluate these measures, response plans and business practices in light of the evolving effects of COVID-19 and its variants.
As discussed in greater detail above, the Company has focused its diversity, equity and inclusion efforts in three areas: Our People, Our Product & Customers and Our Purchasing – through its launch of EPIC. With the involvement of the Company’s employees, EPIC is advancing efforts in each of these areas to identify and implement opportunities for the Company's benefit under the Management Services AgreementCompany to address equity, partnership and project operations and maintenance agreements with NRG as describedinclusion issues in Item 15 —Note 13, Related Party Transactions, to the Consolidated Financial Statements.its business activities.
Available Information
The Company's annual reports on Form 10-K, quarterly reports on Form 10-Q, current reports on Form 8-K, and amendments to those reports filed or furnished pursuant to section 13(a) or 15(d) of the Exchange Act are available free of charge through Yield,the SEC's website, www.sec.gov, and through the "Investor Relations" section of Clearway, Inc.'s website, www.nrgyield.comwww.clearwayenergy.com, as soon as reasonably practicable after they are electronically filed with, or furnished to, the SEC. The Company also routinely posts press releases, presentations, webcasts, and other information regarding the Company on Yield,Clearway, Inc.'s website. The information posted on Yield,Clearway, Inc.'s website is not a part of this report.
Item 1A — Risk Factors
Summary of Risk Factors
The Company’s business is subject to numerous risks and uncertainties, discussed in more detail in the following section. These risks include among others, the following key risks:
Risks Related to the Proposed NRG TransactionCompany’s Business
•The ongoing coronavirus (COVID-19) pandemic or any other pandemic could adversely affect the Company’s business, financial condition and results of operations.
•Certain facilities are newly constructed and may not perform as expected.
•The Company's ability to grow and make acquisitions through cash on hand is limited.
•The Company may be unable to close the Thermal Disposition.
•The Company may not realizebe able to effectively identify or consummate any future acquisitions on favorable terms, or at all, and future acquisitions may not be accretive as a result of incorrect assumptions in the anticipated benefitsCompany’s evaluation of such acquisitions, unforeseen consequences or other external events beyond the Company’s control.
•Counterparties to the Company's offtake agreements may not fulfill their obligations and, as the contracts expire, the Company may not be able to replace them with agreements on similar terms in light of increasing competition in the markets in which the Company operates.
•The Company’s ability to effectively consummate future acquisitions will also depend on the Company’s ability to arrange the required or desired financing for acquisitions.
•The Company’s indebtedness could adversely affect its ability to raise additional capital to fund the Company’s operations or pay distributions, and its debt may be adversely affected by changes to, or replacement of, the NRG Transaction.London Interbank Offered Rate, or LIBOR.
•The operation of electric generation facilities depends on suitable meteorological conditions and involves significant risks and hazards customary to the power industry that could have a material adverse effect on the Company's business, financial condition, results of operations and cash flows. These facilities may operate without long-term power sales agreements.
•Supplier and/or customer concentration at certain of the Company's facilities may expose the Company to significant financial credit or performance risks.
•The Company currently owns, and sale agreement with NRG for the acquisition of NRG’s full ownership interest in the Company and NRG’s renewable energy development and operations platform. Also on February 6, 2018,future may acquire, certain assets in which the Company entered into a consenthas limited control over management decisions and indemnity agreement with NRGits interests in such assets may be subject to transfer or other related restrictions.
•The Company's assets are exposed to risks inherent in the use of interest rate swaps and GIP in connection with theforward commodity purchase and sale agreement between NRG and GIP. The consent and indemnity agreementcontracts and the purchase and sale agreement are collectively referredCompany may be exposed to asadditional risks in the NRG Transaction. Consummationfuture if it utilizes other derivative instruments.
•The Company does not own all of the NRG Transactionland on which its power generation or thermal assets are located, which could result in disruption to its operations.
•The Company's businesses are subject to physical, market and economic risks relating to potential effects of climate change and public and governmental initiatives to address climate change.
•Risks that are beyond the Company's control, including but not limited to acts of terrorism or related acts of war, natural disaster, inflation, supply chain disruptions, hostile cyber intrusions or other catastrophic events, could have a material adverse effect on the business, financial condition, results of operations and cash flows.
•The operation of the Company’s businesses is subject to cyber-based security and integrity risk.
•The Company relies on electric distribution and transmission facilities that it does not own or control and that are subject to transmission constraints within a number of conditions,the Company's regions.If these facilities fail to provide the Company with adequate transmission capacity, it may be restricted in its ability to deliver electric power to its customers and may either incur additional costs or forego revenues.
•The Company's costs, results of operations, financial condition and cash flows could be adversely impacted by the disruption of the fuel supplies necessary to generate power at its conventional and thermal power generation facilities.
•The Company depends on key personnel and its ability to attract and retain additional skilled management and other personnel, the loss of any of which could have a material adverse effect on the Company's financial condition and results of operations.
15
•The Company may potentially be adversely affected by emerging technologies that may over time impact capacity markets and the energy industry overall.
Risks Related to the Company’s Relationship with GIP and CEG
•GIP exercises substantial influence over the Company through its position as the controlling shareholder of Clearway, Inc.The Company is highly dependent on GIP and CEG.
•The Company may not be able to consummate future acquisitions from CEG.
•The Company may be unable to terminate the CEG Master Services Agreement, in certain circumstances.
•If CEG terminates the CEG Master Services Agreement or defaults in the performance of its obligations under the agreement, the Company may be unable to contract with a substitute service provider on similar terms, or at all.
Risks Related to Regulation
•The Company's business is subject to restrictions resulting from environmental, health and safety laws and regulations.
•The electric generation business is subject to substantial governmental regulation, including receiptenvironmental laws, and may be adversely affected by changes in laws or regulations, as well as liability under, or any future inability to comply with, existing or future regulations or other legal requirements.
•The Company's business is subject to complex and evolving U.S. laws and regulations regarding privacy and data protection.
•Government regulations providing incentives for renewable power generation could change at any time and such changes may negatively impact the Company's growth strategy.
•The profitability of certain contractual consentsof the Company's Thermal assets is dependent on regulatory approval.
Risks Related to the Company's Business
The ongoing coronavirus (COVID-19) pandemic or any other pandemic could adversely affect the Company’s business, financial condition and results of operations.
The ongoing coronavirus (COVID-19) outbreak, which the World Health Organization declared as a pandemic on March 11, 2020, has reached every region of the world and has resulted in widespread adverse impacts on the global economy. In response, the Company has modified certain business and workforce practices (including discontinuing all non-essential business travel, implementing a temporary work-from-home policy for employees who can execute their work remotely and encouraging employees to adhere to local and regional social distancing, more stringent hygiene and cleaning protocols across the Company’s facilities and operations and self-quarantining recommendations) to conform to government restrictions and best practices encouraged by governmental and regulatory approvals fromauthorities. However, the quarantine of personnel or the inability to access the Company’s facilities or customer sites could adversely affect the Company’s operations. Also, the Company has a limited number of highly skilled employees for some of its operations and relies on certain regulatory agencies, including approval by FERCindependent contractors and approvals from certain state regulatory agencies. Whileother service providers. If a large proportion of the parties have begunCompany’s employees in those critical positions, or independent contractors or other service providers to the process of notifying agencies and obtaining regulatory approvals and consents,Company or its customers were to contract COVID-19 at the same time, the Company would rely upon its business continuity plans in an effort to continue operations at its facilities, but there is no assurancecertainty that the partiessuch measures will be ablesufficient to obtainmitigate the requisite regulatory approvalsadverse impact to its operations that could result from shortages of highly skilled employees, independent contractors or consentsservice providers.
There is considerable uncertainty regarding how long the COVID-19 pandemic will persist and affect economic conditions, as well as whether governmental and other measures implemented to try to slow the spread of the virus, such as large-scale travel bans and restrictions, border closures, quarantines, shelter-in-place orders and business and government shutdowns that exist as of the date of this report will be effective or whether new measures will be implemented or reinstated. Restrictions of this nature may cause the Company, its suppliers and other business counterparties to experience operational delays and delays in the delivery of materials and supplies and may cause milestones or deadlines relating to various projects to be missed. As a result, the Company could experience reductions in its sales and corresponding revenues in future periods. In addition, worsening economic conditions could result in the Company’s customers being unable or unwilling to fulfill their contractual obligations over time, or as contracts expire, to replace them with agreements on similar terms, which would impact the Company’s future financial performance. A significant decline in sales for the output the Company generates, whether due to decreases in consumer demand or disruption to its facilities or otherwise, would have a material adverse effect on the Company’s financial expectations, its financial condition, results of operations and cash flows, its ability to make distributions to its unit holders and its ability to satisfy its debt service obligations.
As of the closing conditions. date of this report, the Company's efforts to respond to the challenges presented by the conditions described above have allowed the Company to minimize the impacts to its business.
16
Additionally, the NRG Transaction requireseffects of COVID-19 (and its variants) or any other pandemic on the global economy could adversely affect the Company’s consent which is conditioned upon a numberability to access the capital and other financial markets, and if so, the Company may need to consider alternative sources of items, allfunding for some of its operations and for working capital, which may not be metincrease its cost of, as well as adversely impact its access to, capital. These uncertain economic conditions may also result in the inability of the Company’s customers and other counterparties to make payments to the Company, on a timely basis or at all.
Certain facilities are newly constructed and may not perform as expected.
Certain of the Company's conventional and renewable assets are newly constructed. The ability of these facilities to meet the Company's performance expectations is subject to the risks inherent in newly constructed power generation facilities and the construction of such facilities, including, but not limited to, degradation of equipment in excess of the Company's expectations, system failures, and outages. The failure of these facilities to perform as the Company expects could have a material adverse effect on the Company's business, financial condition, results of operations, cash flows and its ability to pay distributions to Yield,Clearway, Inc. and NRG.CEG.
Pursuant to the Company's cash distribution policy, the Company intends to distribute a significant amount of the CAFD through regular quarterly distributions, and the Company's ability to grow and make acquisitions through cash on hand could beis limited.
The Company expects to distribute a significant amount of the CAFD each quarter and to rely primarily upon external financing sources, including the issuance of debt and equity securities and, if applicable, borrowings under the Company's revolving credit facility to fund acquisitions and growth capital expenditures. The Company may be precluded from pursuing otherwise attractive acquisitions if the projected short-term cash flow from the acquisition or investment is not adequate to service the capital raised to fund the acquisition or investment, after giving effect to the Company's available cash reserves. The incurrence of bank borrowings or other debt by NRG YieldClearway Energy Operating LLC or by the Company's project-level subsidiaries to finance the Company’s growth strategy will result in increased interest expense and the imposition of additional or more restrictive covenants, which, in turn, may impact the cash distributions the Company makes to Yield,Clearway, Inc. and NRG.CEG.
The Company may be unable to close the Thermal Disposition.
On October 22, 2021, Clearway Energy Operating LLC entered into a Membership Interest Purchase Agreement to sell the Company’s Thermal Business to KKR, or the Thermal Disposition. The Thermal Disposition is expected to close in the first half of 2022 and is subject to certain customary closing conditions that make its completion and timing uncertain. Accordingly, there can be no assurance that the Thermal Disposition will be consummated on the anticipated schedule or at all. If the Company is unable to complete the Thermal Disposition, the Company may need to seek a new buyer or reassess the decision to sell the Thermal Business, and any such new sale would also be subject to new regulatory approvals and other conditions. Such renegotiation and conditions and the process of obtaining regulatory approvals could have the effect of delaying or impeding consummation of the sale of the Thermal Business. In addition, if the Thermal Disposition is not completed, the Company may need to raise additional capital, including the issuance of additional shares of Clearway Inc.'s common stock to raise equity capital to repay existing indebtedness that has been incurred in anticipation of the Thermal Disposition and to fund the Company’s operations or future growth investments. The future issuance of additional shares of Clearway, Inc. common stock may cause dilution of investors' ownership interest and adversely impact the value of Clearway, Inc.'s common stock. As a result, a delay or failure to consummate the Thermal Disposition could have a material adverse effect on the Company’s business, financial position or results of operations.
17
The Company may not be able to effectively identify or consummate any future acquisitions on favorable terms, or at all.all, and future acquisitions may not be accretive as a result of incorrect assumptions in the Company's evaluation of such acquisitions, unforeseen consequences or other external events beyond the Company's control.
The Company's business strategy includes growth through the acquisitions of additional generation assets (including through corporate acquisitions). This strategy depends on the Company’s ability to successfully identify and evaluate acquisition opportunities and consummate acquisitions on favorable terms. However, the number of acquisition opportunities is limited. In addition, the Company will compete with other companies for these limited acquisition opportunities, which may increase the Company’s cost of making acquisitions or cause the Company to refrain from making acquisitions at all. Some of the Company’s competitors for acquisitions are much larger than the Company with substantially greater resources. These companies may be able to pay more for acquisitions and may be able to identify, evaluate, bid for and purchase a greater number of assets than the Company’s financial or human resources permit. If the Company is unable to identify and consummate future acquisitions, it will impede the Company’s ability to execute its growth strategy and limit the Company’s ability to increase the amount of dividends paid to holders of Yield,Clearway, Inc.'s common stock.
The acquisition of companies and assets are subject to substantial risks, including the failure to identify material problems during due diligence (for which the Company may not be indemnified post-closing) and the risk of overpaying for assets (or not making acquisitions on an accretive basis). The integration and consolidation of acquisitions requires substantial human, financial and other resources and, ultimately, the Company's acquisitions may divert management’s attention from the Company's existing business concerns, disrupt the Company's ongoing business or not be successfully integrated. There can be no assurances that any future acquisitions will perform as expected or that the returns from such acquisitions will support the financing utilized to acquire them or maintain them. A failure to achieve the financial returns the Company expects when it acquires generation assets could have a material adverse effect on the Company’s ability to grow its business and make cash distributions to its unit holders. Any failure of the Company’s acquired generation assets to be accretive or difficulty in integrating such acquisition into the Company’s business could have a material adverse effect on the Company’s ability to grow its business and make cash distributions to its unit holders. As a result, the consummation of acquisitions could have a material adverse effect on the Company's business, financial condition, results of operations, cash flows and ability to pay distributions to its unit holders.
Counterparties to the Company's offtake agreements may not fulfill their obligations and, as the contracts expire, the Company may not be able to replace them with agreements on similar terms in light of increasing competition in the markets in which the Company operates.
A significant portion of the electric power the Company generates is sold under long-term offtake agreements with public utilities or industrial or commercial end-users, with a weighted average remaining duration, based on CAFD, of approximately 12 years. As of December 31, 2021, the largest customers of the Company's power generation assets, including assets in which the Company has less than a 100% membership interest, were SCE and PG&E, which represented 33% and 23%, respectively, of total consolidated revenues generated by the Company during the year ended December 31, 2021.
If, for any reason, any of the purchasers of power under these agreements are unable or unwilling to fulfill their related contractual obligations or if they refuse to accept delivery of power delivered thereunder or if they otherwise terminate such agreements prior to the expiration thereof, the Company's assets, liabilities, business, financial condition, results of operations and cash flows could be materially and adversely affected. Furthermore, to the extent any of the Company's power purchasers are, or are controlled by, governmental entities, the Company's facilities may be subject to legislative or other political action that may impair their contractual performance.
18
The power generation industry is characterized by intense competition and the Company's electric generation assets encounter competition from utilities, industrial companies and independent power producers, in particular with respect to uncontracted output. In recent years, there has been increasing competition among generators for offtake agreements and this has contributed to a reduction in electricity prices in certain markets characterized by excess supply above designated reserve margins. In light of these market conditions, the Company may not be able to replace an expiring or terminated agreement with an agreement on equivalent terms and conditions, including at prices that permit operation of the related facility on a profitable basis. In addition, the Company believes many of its competitors have well-established relationships with the Company's current and potential suppliers, lenders and customers, and have extensive knowledge of its target markets. As a result, these competitors may be able to respond more quickly than the Company to evolving industry standards and changing customer requirements. The adoption of more advanced technology could reduce its competitors' power production costs resulting in their having a lower cost structure than is achievable with the technologies currently employed by the Company and adversely affect its ability to compete for offtake agreement renewals. If the Company is unable to replace an expiring or terminated offtake agreement, the affected facility may temporarily or permanently cease operations. External events, such as a severe economic downturn or force majeure events, could also impair the ability of some counterparties to the Company's offtake agreements and other customer agreements to pay for energy and/or other products and services received.
The Company's inability to enter into new or replacement offtake agreements or to compete successfully against current and future competitors in the markets in which the Company operates could have a material adverse effect on the Company's business, financial condition, results of operations and cash flows.
The Company’s ability to effectively consummate future acquisitions will also depend on the Company’s ability to arrange the required or desired financing for acquisitions.
The Company may not have sufficient availability under the Company’s credit facilities or have access to project-level financing on commercially reasonable terms when acquisition opportunities arise. An inability to obtain the required or desired financing could significantly limit the Company’s ability to consummate future acquisitions and effectuate the Company’s growth strategy. If financing is available, utilization of the Company’s credit facilities or project-level financing for all or a portion of the purchase price of an acquisition could significantly increase the Company’s interest expense, impose additional or more restrictive covenants and reduce CAFD. The Company’s ability to consummate future acquisitions may also depend on the Company’s ability to obtain any required regulatory approvals for such acquisitions, including, but not limited to, approval by FERC under Section 203 of the FPA.
The Company’s indebtedness could adversely affect its ability to raise additional capital to fund the Company’s operations or pay distributions. It could also expose the Company to the risk of increased interest rates and limit the Company’s ability to react to changes in the economy or the Company’s industry as well as impact the Company’s results of operations, financial condition and cash flows.
As of December 31, 2017,2021, the Company had approximately $5,899$7,779 million of total consolidated indebtedness, $4,376$5,073 million of which was incurred by the Company's non-guarantor subsidiaries. In addition, the Company’s share of its unconsolidated affiliates’ total indebtedness and letters of credit outstanding as of December 31, 2017,2021, totaled approximately $777$345 million and $98$37 million, respectively (calculated as the Company’s unconsolidated affiliates’ total indebtedness as of such date multiplied by the Company’s percentage membership interest in such assets).
The Company’s substantial debt could have important negative consequences on the Company’s financial condition, including:
•increasing the Company’s vulnerability to general economic and industry conditions;
•requiring a substantial portion of the Company’s cash flow from operations to be dedicated to the payment of principal and interest on the Company’s indebtedness, therefore reducing the Company’s ability to pay distributions to Yield,Clearway, Inc. and NRGCEG or to use the Company’s cash flow to fund its operations, capital expenditures and future business opportunities;
•limiting the Company’s ability to enter into long-term power sales or fuel purchases which require credit support;
•limiting the Company’s ability to fund operations or future acquisitions;
•restricting the Company’s ability to make certain distributions to Yield,Clearway, Inc. and NRGCEG and the ability of the Company’s subsidiaries to make certain distributions to it, in light of restricted payment and other financial covenants in the Company’s credit facilities and other financing agreements;
•exposing the Company to the risk of increased interest rates because certain of the Company’s borrowings, which may include borrowings under the Company’s revolving credit facility, are at variable rates of interest;
•limiting the Company’s ability to obtain additional financing for working capital including collateral postings, capital expenditures, debt service requirements, acquisitions and general corporate or other purposes; and
19
•limiting the Company’s ability to adjust to changing market conditions and placing it at a competitive disadvantage compared to the Company’s competitors who have less debt.
The Company's revolving credit facility contains financial and other restrictive covenants that limit the Company’s ability to return capital to stockholdersunit holders or otherwise engage in activities that may be in the Company’s long-term best interests. The Company’s inability to satisfy certain financial covenants could prevent the Company from paying cash distributions, and the Company’s failure to comply with those and other covenants could result in an event of default which, if not cured or waived, may entitle the related lenders to demand repayment or enforce their security interests, which could have a material adverse effect on the Company’s business, financial condition, results of operations and cash flows. In addition, failure to comply with such covenants may entitle the related lenders to demand repayment and accelerate all such indebtedness.
The agreements governing the Company’s project-level financing contain financial and other restrictive covenants that limit the Company’s project subsidiaries’ ability to make distributions to the Company or otherwise engage in activities that may be in the Company’s long-term best interests. The project-level financing agreements generally prohibit distributions from the project entities to the Company unless certain specific conditions are met, including the satisfaction of certain financial ratios. The Company’s inability to satisfy certain financial covenants may prevent cash distributions by the particular project(s) to it and, the Company’s failure to comply with those and other covenants could result in an event of default which, if not cured or waived may entitle the related lenders to demand repayment or enforce their security interests, which could have a material adverse effect on the Company’s business, results of operations and financial condition. In addition, failure to comply with such covenants may entitle the related lenders to demand repayment and accelerate all such indebtedness. If the Company is unable to make distributions from the Company’s project-level subsidiaries, it would likely have a material adverse effect on the Company’s ability to pay distributions to Yield,Clearway, Inc. and NRG.CEG.
Letter of credit facilities to support project-level contractual obligations generally need to be renewed after five to seven years,have a limited term that may require future renewal, at which time the Company or relevant project-level subsidiary will need to satisfy applicable financial ratios and covenants. If the Company is unable to renew the Company’s letters of credit as expected or replace them with letters of credit under different facilities on favorable terms or at all, the Company may experience a material adverse effect on its business, financial condition, results of operations and cash flows. Furthermore, such inability may constitute a default under certain project-level financing arrangements, restrict the ability of the project-level subsidiary to make distributions to it and/or reduce the amount of cash available at such subsidiary to make distributions to the Company.
In addition, the Company’s ability to arrange financing, either at the corporate level or at a non-recourse project-level subsidiary, and the costs of such capital, are dependent on numerous factors, including:
•general economic and capital market conditions;
•credit availability from banks and other financial institutions;
•investor confidence in the Company, its partners, Yield,Clearway, Inc. (as the Company's sole managing member), NRG (as Yieldor GIP, through CEG, as Clearway, Inc.’s's principal stockholder on(on a combined voting basis, and manager under the Management Services Agreement), or GIP, as successor to NRG's interests in the Company if the NRG Transaction is consummated,basis) and the regional wholesale power markets;
•the Company’s financial performance and the financial performance of the Company subsidiaries;
•the Company’s level of indebtedness and compliance with covenants in debt agreements;
•maintenance of acceptable project credit ratings or credit quality;
•cash flow; and
•provisions of tax and securities laws that may impact raising capital.
The Company may not be successful in obtaining additional capital for these or other reasons. Furthermore, the Company may be unable to refinance or replace project-level financing arrangements or other credit facilities on favorable terms or at all upon the expiration or termination thereof. The Company's failure, or the failure of any of the Company’s projects, to obtain additional capital or enter into new or replacement financing arrangements when due may constitute a default under such existing indebtedness and may have a material adverse effect on the Company's business, financial condition, results of operations and cash flows.
20
Changes in the method of determining the London Interbank Offered Rate, or LIBOR, or the replacement of LIBOR with an alternative reference rate, may adversely affect interest expense related to outstanding debt.
Amounts drawn under the Company's revolving credit facility and certain of the Company's project-level debt facilitiescurrently bear interest at rates based on LIBOR. On July 27, 2017, the Financial Conduct Authority in the United Kingdom announced that it would phase out LIBOR as a benchmark by the end of 2021. On November 30, 2020, ICE Benchmark Administration Limited, the administrator of LIBOR, with the support of the United States Federal Reserve and the United Kingdom’s Financial Conduct Authority, announced plans to consult on ceasing publication of USD LIBOR on December 31, 2021 for only the one week and two month USD LIBOR tenors, and on June 30, 2023 for all other USD LIBOR tenors. While this announcement extends the transition period to June 30, 2023, the United States Federal Reserve concurrently issued a statement advising banks to stop new LIBOR issuances by the end of 2021. In light of these recent announcements, the future of LIBOR at this time is uncertain and any changes in the methods by which LIBOR is determined or regulatory activity related to LIBOR’s phase-out could cause LIBOR to perform differently than in the past or cease to exist. While the Company's revolving credit facility includes a mechanism to amend the facilities to reflect the establishment of an alternative rate of interest upon the occurrence of certain events related to the phase-out of LIBOR, many of the Company's project-level debt facilities and swap arrangements do not. The Company has not yet pursued technical amendments or other contractual alternatives to address this matter with respect to all its existing debt facilities and swap arrangements and is continuing to evaluate the impact of LIBOR’s expected replacement. If no such amendments or other contractual alternatives are established on or prior to the phase-out of LIBOR, interest under the Company's revolving credit facility and other project-level debt facilities will bear interest at higher rates based on the prime rate until such amendments or other contractual amendments are established. Even if the Company has entered into interest rate swaps or other derivative instruments for purposes of managing its interest rate exposure or has otherwise amended its interest rate swaps or other derivative instruments to reflect an alternative reference rate, these hedging strategies may not be effective as a result of the replacement or phasing out of LIBOR, and the Company may incur losses as a result. The potential increase in the Company’s interest expense as a result of the phase-out of LIBOR and uncertainty as to the nature of the alternative reference rates could have an adverse effect on the Company's business, financial condition, results of operations and cash flows.
The Company’s proceeds from “Green Bonds” may not satisfy investor criteria and expectations regarding environmental impact and sustainability performance.
Certain of the Company’s Senior Notes are “Green Bonds,” which require that an amount equal to the net proceeds from the sale of such Senior Notes must be allocated to finance or refinance, in part or in full, new and existing projects and assets meeting certain eligibility criteria under the Company's green bond framework. There is no assurance that the eligible projects to which the Company allocates proceeds from such Senior Notes will satisfy, or continue to satisfy, investor criteria and expectations regarding environmental impact and sustainability performance, and no assurance is given that the use or allocation will satisfy present or future investor expectations or requirements, voluntary taxonomies or standards regarding any investment criteria or guidelines with which investors or their investments are required to comply, whether by any present or future applicable laws or regulations, by their own governing rules or investment portfolio mandates, ratings criteria, voluntary taxonomies or standards or other independent expectations. The market price of such Senior Notes may be impacted by any failure by the Company to satisfy these present or future investor expectations or requirements.
Certain of the Company's long-term bilateral contracts result from state-mandated procurements and could be declared invalid by a court of competent jurisdiction.
A significant portion of the Company's revenues are derived from long-term bilateral contracts with utilities that are regulated by their respective states, and have been entered into pursuant to certain state programs. Certain long-term contracts that other companies have with state-regulated utilities have been challenged in federal court and have been declared unconstitutional on the grounds that the rate for energy and capacity established by the contracts impermissibly conflicts with the rate for energy and capacity established by FERC pursuant to the FPA. If certain of the Company's state-mandated agreements with utilities are ever held to be invalid or unenforceable due to the financial conditions or other conditions of such utility, the Company may be unable to replace such contracts, which could have a material adverse effect on the Company's business, financial condition, results of operations and cash flows.
21
The generation of electric energy from solar and wind energy sources depends heavily on suitable meteorological conditions.
If solar or wind conditions are unfavorable, the Company's electricity generation and revenue from renewable generation facilities may be substantially below the Company's expectations. The electricity produced and revenues generated by a solar or wind energy generation facility is highly dependent on suitable solar or wind conditions, as applicable, and associated weather conditions, which are beyond the Company's control. Furthermore, components of the Company's systems, such as solar panels and inverters, could be damaged by severe weather, such as wildfires, hailstorms, tornadoes or tornadoes.freezing temperatures and other winter weather conditions. In addition, replacement and spare parts for key components may be difficult or costly to acquire or may be unavailable. Unfavorable weather and atmospheric conditions could impair the effectiveness of the Company's assets or reduce their output beneath their rated capacity or require shutdown of key equipment, impeding operation of the Company's renewable assets. For example, in February 2021, the Company's wind projects in Texas were unable to operate and experienced outages for a few days as a result of the extreme winter weather conditions. In addition, climate change may have the long-term effect of changing wind patterns at ourthe Company's projects. Changing wind patterns could cause changes in expected electricity generation. These events could also degrade equipment or components and the interconnection and transmission facilities’ lives or maintenance costs.
Although the Company bases its investment decisions with respect to each renewable generation facility on the findings of related wind and solar studies conducted on-site prior to construction or based on historical conditions at existing facilities, actual climatic conditions at a facility site, particularly wind conditions, may not conform to the findings of these studies and may be affected by variations in weather patterns, including any potential impact of climate change. Therefore, the Company's solar and wind energy facilities may not meet anticipated production levels or the rated capacity of the Company's generation assets, which could adversely affect the Company's business, financial condition, results of operations and cash flows.
Operation of electric generation facilities involves significant risks and hazards customary to the power industry that could have a material adverse effect on the Company's business, financial condition, results of operations and cash flows.
The ongoing operation of the Company's facilities involves risks that include the breakdown or failure of equipment or processes or performance below expected levels of output or efficiency due to wear and tear, latent defect, design error or operator error or force majeure events, among other things. Operation of the Company's facilities also involves risks that the Company will be unable to transport its products to its customers in an efficient manner due to a lack of transmission capacity. Unplanned outages of generating units, including extensions of scheduled outages due to mechanical failures or other problems, occur from time to time and are an inherent risk of the business. Unplanned outages typically increase operation and maintenance expenses, capital expenditures and may reduce revenues as a result of selling fewer MWh or require the Company to incur significant costs as a result of obtaining replacement power from third parties in the open market to satisfy forward power sales obligations. The Company's inability to operate its electric generation assets efficiently, manage capital expenditures and costs and generate earnings and cash flow from the Company's asset-based businesses could have a material adverse effect on the Company's business, financial condition, results of operations and cash flows. While the Company maintains insurance, obtains warranties from vendors and obligates contractors to meet certain performance levels, the proceeds of such insurance, warranties or performance guarantees may not cover the Company's lost revenues, increased expenses or liquidated damages payments should it experience equipment breakdown or non-performance by contractors or vendors.
22
The Company’s facilities may operate, wholly or partially, without long-term power sales agreements.
The Company’s facilities may operate without long-term power sales agreements for some or all of their generating capacity and output and therefore be exposed to market fluctuations. Without the benefit of long-term power sales agreements for the facilities, the Company cannot be sure that it will be able to sell any or all of the power generated by the facilities at commercially attractive rates or that the facilities will be able to operate profitably. This could lead to less predictable revenues, future impairments of the Company's property, plant and equipment or to the closing of certain of its facilities, resulting in economic losses and liabilities, which could have a material adverse effect on the Company's results of operations, financial condition or cash flows.
Maintenance, expansion and refurbishment of electric generation facilities involve significant risks that could result in unplanned power outages or reduced output.
If the Company makes any major modifications to its conventional power generation facilities, it may charge,be required to install the best available control technology or to achieve the revenue thatlowest achievable emission rates as such terms are defined under the new source review provisions of the Clean Air Act in the future. Any such modifications could likely result in substantial additional capital expenditures. The Company may earn with respectalso choose to this capacity are subject to authorization of the applicable regulatory authorities. There can be no assurancerepower, refurbish or upgrade its facilities based on its assessment that such regulatory authoritiesactivity will consider allprovide adequate financial returns. Such facilities require time for development and capital expenditures before commencement of thecommercial operations, and key assumptions underpinning a decision to make such an investment may prove incorrect, including assumptions regarding construction costs, to have been prudently incurred or that the regulatory process by which rates or revenues are determined will always result in rates or revenues that achieve full recovery of costs or an adequate return on the Company's capital investments. While the Company's ratestiming, available financing and revenues are generally established based on an analysis of costs incurred in a base year, the rates the Company is allowed
Supplier and/or customer concentration at certain of the Company's facilities may expose the Company to significant financial credit or performance risks.
The Company often relies on a single contracted supplier or a small number of suppliers for the provision of fuel, transportation of fuel, equipment, technology and/or other services required for the operation of certain facilities. In addition, certain of the Company's suppliers provide long-term warranties with respect to the performance of their products or services. If any of these suppliers cannot perform under their agreements with the Company, or satisfy their related warranty obligations, the Company will need to utilize the marketplace to provide or repair these products and services. There can be no assurance that the marketplace can provide these products and services as, when and where required. The Company may not be able to enter into replacement agreements on favorable terms or at all. If the Company is unable to enter into replacement agreements to provide for fuel, equipment, technology and other required services, it would seek to purchase the related goods or services at market prices, exposing the Company to market price volatility and the risk that fuel and transportation may not be available during certain periods at any price. The Company may also be required to make significant capital contributions to remove, replace or redesign equipment that cannot be supported or maintained by replacement suppliers, which could have a material adverse effect on the business, financial condition, results of operations, credit support terms and cash flows.
In addition, potential or existing customers at the Company’s district energy centers and combined heat and power plants, or the Energy Centers, may opt for on-site systems in lieu of using the Company’s Energy Centers, either due to corporate policies regarding the allocation of capital, unique situations where an on-site system might in fact prove more efficient, because of previously committed capital in systems that are already on-site, or otherwise. At times, the Company relies on a single customer or a few customers to purchase all or a significant portion of a facility's output, in some cases under long-term agreements that account for a substantial percentage of the anticipated revenue from a given facility.
The failure of any supplier to fulfill its contractual obligations to the Company or the Company’s loss of potential or existing customers could have a material adverse effect on its financial results. Consequently, the financial performance of the Company's facilities is dependent on the credit quality of, and continued performance by, the Company's suppliers and vendors and the Company’s ability to solicit and retain customers.
23
The Company currently owns, and in the future may acquire, certain assets in which the Company has limited control over management decisions and its interests in such assets may be subject to transfer or other related restrictions.
As described in Item 15 — Note 5, Investments Accounted for by the Equity Method and Variable Interest Entities, the Company has limited control over the operation of certain of its assets, because the Company beneficially owns less than a majority of the membership interests in such assets. The Company may seek to acquire additional assets in which it owns less than a majority of the related membership interests in the future. In these investments, the Company will seek to exert a degree of influence with respect to the management and operation of assets in which it owns less than a majority of the membership interests by negotiating to obtain positions on management committees or to receive certain limited governance rights, such as rights to veto significant actions. However, the Company may not always succeed in such negotiations. The Company may be dependent on its co-venturers to operate such assets. The Company's co-venturers may not have the level of experience, technical expertise, human resources management and other attributes necessary to operate these assets optimally. In addition, conflicts of interest may arise in the future between theCompany and its stockholders,unit holders, on the one hand, and the Company's co-venturers, on the other hand, where the Company's co-venturers' business interests are inconsistent with the interests of the Company and its stockholders.unit holders. Further, disagreements or disputes between the Company and its co-venturers could result in litigation, which could increase expenses and potentially limit the time and effort the Company's officers and directors are able to devote to the business.
The approval of co-venturers may also be required for the Company to receive distributions of funds from assets or to sell, pledge, transfer, assign or otherwise convey its interest in such assets, or for the Company to acquire NRG'sGIP's or CEG's interests in such co-ventures as an initial matter. Alternatively, the Company's co-venturers may have rights of first refusal or rights of first offer in the event of a proposed sale or transfer of the Company's interests in such assets. These restrictions may limit the price or interest level for interests in such assets, in the event the Company wants to sell such interests.
Furthermore, certain of the Company's facilities are operated by third-party operators, such as First Solar.operators. To the extent that third-party operators do not fulfill their obligations to manage operations of the facilities or are not effective in doing so, the amount of CAFD may be adversely affected.
The Company's assets are exposed to risks inherent in the use of interest rate swaps and forward fuelcommodity purchase contracts and the Company may be exposed to additional risks in the future if it utilizes other derivative instruments.
The Company uses interest rate swaps to manage interest rate risk. In addition, the Company uses forward fuelcommodity purchase contracts to hedge its limited commodity exposure with respect to the Company's district energy assets. If the Company elects to enter into such commodity hedges, the related asset could recognize financial losses on these arrangements as a result of volatility in the market values of the underlying commodities or if a counterparty fails to perform under a contract. If actively quoted market prices and pricing information from external sources are not available, the valuation of these contracts would involve judgment or the use of estimates. As a result, changes in the underlying assumptions or use of alternative valuation methods could affect the reported fair value of these contracts. If the values of these financial contracts change in a manner that the Company does not anticipate, or if a counterparty fails to perform under a contract, it could harm the business, financial condition, results of operations and cash flows.
The Company does not own all of the land on which its power generation or thermal assets are located, which could result in disruption to its operations.
The Company does not own all of the land on which its power generation or thermal assets are located and the Company is, therefore, subject to the possibility of less desirable terms and increased costs to retain necessary land use if it does not have valid leases or rights-of-way or if such rights-of-way lapse or terminate. Although the Company has obtained rights to construct and operate these assets pursuant to related lease arrangements, the rights to conduct those activities are subject to certain exceptions, including the term of the lease arrangement. The Company is also at risk of condemnation on land it owns. The loss of these rights, through the Company's inability to renew right-of-way contracts, condemnation or otherwise, may adversely affect the Company's ability to operate its generation and thermal infrastructure assets.
24
The Company’s use and enjoyment of real property rights for its projects may be adversely affected by the rights of lienholders and leaseholders that are superior to those of the grantors of those real property rights to the Company.
Solar and wind projects generally are, and are likely to be, located on land occupied by the project pursuant to long-term easements and leases. The ownership interests in the land subject to these easements and leases may be subject to mortgages securing loans or other liens (such as tax liens) and other easement and lease rights of third parties (such as leases of oil or mineral rights) that were created prior to the project’s easements and leases. As a result, the project’s rights under these easements or leases may be subject, and subordinate, to the rights of those third parties. The Company performs title searches and obtains title insurance to protect itself against these risks. Such measures may, however, be inadequate to protect the Company against all risk of loss of its rights to use the land on which the wind projects are located, which could have a material adverse effect on the Company’s business, financial condition and results of operations.
The Company's businesses are subject to physical, market and economic risks relating to potential effects of climate change and public and governmental initiatives to address climate change.
Climate change creates uncertainty in weather and other environmental conditions, including temperature and precipitation levels, and thus may affect consumer demand for electricity. For example, milder than normal weather can reduce demand for electricity and gas distribution services. In addition, the potential physical effects of climate change, such as increased frequency and severity of storms, cloud coverage, precipitation, floods and other climatic events, could disrupt the Company's operations and supply chain, and cause them to incur significant costs in preparing for or responding to these effects. These or other meteorological changes could lead to increased operating costs, capital expenses or power purchase costs.
Furthermore, governmental, scientific and public concern over the threat of climate change arising from GHG emissions may limit the Company's access to natural gas or decrease demand for energy generated by the Company’s conventional assets. State, national and foreign governments and agencies continue to evaluate, and in some instances adopt, climate-related legislation and other regulatory initiatives that would restrict GHG emissions. Changes in environmental requirements related to GHG, climate change and alternative energy sources may impact demand for the Company's services. For example, the Build Back Better Act, passed by the U.S. House of Representatives and supported by President Biden, includes incentives to increase wind and solar electric generation and encourage consumers to use these alternative energy sources. While this could benefit the Company by increasing the demand for the Company's solar or wind energy, the Company could experience delayed or cancelled projects and/or reduced production and demand for energy generated by the Company’s conventional assets. At this time, it is uncertain whether, and in what form, the Build Back Better Act may become law. However, the Build Back Better Act or similar state or federal initiatives to incentivize a shift away from fossil fuels could reduce demand for energy generated by fossil fuels, and therefore have an adverse effect on the Company’s business, financial condition and results of operations.
Lastly, companies across all industries are facing increased scrutiny from the public, stakeholders and government agencies related to their environmental, social, and governance (ESG) practices and commitments to address climate change. In recent years, investor advocacy groups, institutional investors, investment funds, and other influential investors have placed increasing importance on ESG practices. Increased focus and activism related to ESG and similar matters may hinder access to capital, as investors may decide to reallocate capital or to not commit capital as a result of their assessment of a company’s ESG practices. While the Company is committed to engaging with its stakeholders on ESG practices in a proactive, holistic and integrated manner, changes in the public or stakeholder sentiment could impact the Company's ability to fund its conventional assets, or decrease the demand for the energy generated by these assets.
Risks that are beyond the Company's control, including but not limited to acts of terrorism or related acts of war, natural disaster, inflation, supply chain disruptions, hostile cyber intrusions or other catastrophic events, could have a material adverse effect on the business, financial condition, results of operations and cash flows.
The Company's generation facilities that were acquired or those that the Company otherwise acquires or constructs and the facilities of third parties on which they rely may be targets of terrorist activities, as well as events occurring in response to or in connection with them, that could cause environmental repercussions and/or result in full or partial disruption of the facilities ability to generate, transmit, transport or distribute electricity or natural gas. Strategic targets, such as energy-related facilities, may be at greater risk of future terrorist activities than other domestic targets. Inflation, disruption in global and domestic supply chains, and other economic conditions could negatively impact the Company’s business in a manner that could adversely affect the Company's results of operations and financial condition. Hostile cyber intrusions, including those targeting information systems as well as electronic control systems used at the generating plants and for the related distribution systems, could severely disrupt business operations and result in loss of service to customers, as well as create significant expense to repair security breaches or system damage.
25
Furthermore, certain of the Company's power generation and thermal assets are located in active earthquake zones in California and Arizona, and certain project companies and suppliers conduct their operations in the same region or in other locations that are susceptible to natural disasters. In addition, California and some of the locations where certain suppliers are located, from time to time, have experienced shortages of water, electric power and natural gas. The occurrence of a natural disaster, such as an earthquake, wildfire, drought, flood or localized extended outages of critical utilities or transportation systems, or any critical resource shortages, affecting the Company or its suppliers, could cause a significant interruption in the business, damage or destroy the Company's facilities or those of its suppliers or the manufacturing equipment or inventory of the Company's suppliers. Any such terrorist acts, environmental repercussions or disruptions or natural disasters could result in a significant decrease in revenues or significant reconstruction or remediation costs, beyond what could be recovered through insurance policies, which could have a material adverse effect on the business, financial condition, results of operations and cash flows.
The operation of the Company’s businesses is subject to cyber-based security and integrity risk.
Numerous functions affecting the efficient operation of the Company’s businesses depend on the secure and reliable storage, processing and communication of electronic data and the use of sophisticated computer hardware and software systems. The operation of the Company's generating assets relies on cyber-based technologies and has been the target of disruptive actions. Potential disruptive actions could result from cyber-attack or cyber intrusion, including by computer hackers, foreign governments and cyber terrorists, or otherwise be compromised by unintentional events with respect to the Company or any of its contractors or customers. As a result, operations could be interrupted, property could be damaged and sensitive customer information could be lost or stolen, causing the Company to incur significant losses of revenues, other substantial liabilities and damages, costs to replace or repair damaged equipment and damage to the Company's reputation. In addition, the Company may experience increased capital and operating costs to implement increased security for its cyber systems and generating assets.
The Company relies on electric distribution and transmission facilities that it does not own or control and that are subject to transmission constraints within a number of the Company's regions. If these facilities fail to provide the Company with adequate transmission capacity, it may be restricted in its ability to deliver electric power to its customers and may either incur additional costs or forego revenues.
The Company depends on electric distribution and transmission facilities owned and operated by others to deliver the wholesale power it will sell from its electric generation assets to its customers. A failure or delay in the operation or development of these facilities or a significant increase in the cost of the development of such facilities could result in lost revenues. Such failures or delays could limit the amount of power the Company's operating facilities deliver or delay the completion of the Company's construction projects. Additionally, such failures, delays or increased costs could have a material adverse effect on the business, financial condition and results of operations. If a region's power transmission infrastructure is inadequate, the Company's recovery of wholesale costs and profits may be limited. If restrictive transmission price regulation is imposed, the transmission companies may not have a sufficient incentive to invest in expansion of transmission infrastructure. The Company also cannot predict whether distribution or transmission facilities will be expanded in specific markets to accommodate competitive access to those markets. In addition, certain of the Company's operating facilities' generation of electricity may be curtailed without compensation due to transmission limitations or limitations on the electricity grid's ability to accommodate intermittent and other electricity generating sources, reducing the Company's revenues and impairing its ability to capitalize fully on a particular facility's generating potential. Such curtailments could have a material adverse effect on the business, financial condition, results of operations and cash flows. Furthermore, economic congestion on transmission networks in certain of the markets in which the Company operates may occur and the Company may be deemed responsible for congestion costs. If the Company were liable for such congestion costs, its financial results could be adversely affected.
The Company's costs, results of operations, financial condition and cash flows could be adversely impacted by the disruption of the fuel supplies necessary to generate power at its conventional and thermal power generation facilities.
Delivery of fossil fuels to fuel the Company's conventional and thermal generation facilities is dependent upon the infrastructure (including natural gas pipelines) available to serve each such generation facility as well as upon the continuing financial viability of contractual counterparties. As a result, the Company is subject to the risks of disruptions or curtailments in the production of power at these generation facilities if a counterparty fails to perform or if there is a disruption in the fuel delivery infrastructure.
26
The Company depends on key personnel and its ability to attract and retain additional skilled management and other personnel, the loss of any of which could have a material adverse effect on the Company's financial condition and results of operations.
The Company believes its current operations and future success depend largely on the continued services of key personnel that it employs. Although the Company currently has access to the resources of CEG, the loss of key personnel employed by the Company or CEG could have a material adverse effect on the Company’s financial condition and results of operations.
The Company may potentially be adversely affected by emerging technologies that may over time impact capacity markets and the energy industry overall.
Research and development activities are ongoing in the Company's industry to provide alternative and more efficient technologies to produce power, including wind, photovoltaic (solar) cells, hydrogen, energy storage, and improvements in traditional technologies and equipment, such as more efficient gas turbines. Advances in these or other technologies could reduce the costs of power production to a level below what the Company has currently forecasted, which could adversely affect its cash flows, results of operations or competitive position.
Some emerging technologies, such as distributed renewable energy technologies, broad consumer adoption of electric vehicles and energy storage devices, could affect the price of energy. These emerging technologies may affect the financial viability of utility counterparties and could have significant impacts on market prices, which could ultimately have a material adverse effect on the Company’s financial condition, results of operations and cash flows.
Risks Related to the Company's Relationships with GIP and CEG
GIP, through its ownership of CEG, exercises substantial influence over the Company through its position as controlling shareholder of Clearway, Inc. The Company is highly dependent on GIP and CEG.
GIP, through its ownership of CEG, owns all of Clearway, Inc.'s outstanding Class B and Class D common stock. Clearway, Inc.'s outstanding Class B and Class D common stock is entitled to one vote per share and 1/100th of a vote per share, respectively. As a result of its ownership of Clearway, Inc.'s Class B and Class D common stock, GIP indirectly owned 54.93% of the combined voting power of Clearway, Inc.’s common stock as of December 31, 2021. Clearway, Inc., through its holdings of Class A units and Class C units, owned a 57.65% economic interest in the Company as of December 31, 2021. Additionally, GIP, through CEG's holdings of Class B units and Class D units, owned the remaining 42.35% economic interest in the Company as of December 31, 2021. As a result of this ownership, GIP has a substantial influence on the Company's affairs.
Furthermore, the Company depends on certain services provided by or under the direction of CEG under the CEG Master Services Agreement, including numerous processes related to the Company's internal control over financial reporting. CEG personnel and support staff that provide services to the Company under the CEG Master Services Agreement are not required to, and the Company does not expect that they will, have as their primary responsibility the management and administration of the Company or to act exclusively for the Company and the CEG Master Services Agreement does not require any specific individuals to be provided by CEG. Under the CEG Master Services Agreement, CEG has the discretion to determine which of its employees perform assignments required to be provided to the Company. Any failure to effectively manage the Company's processes related to internal controls over financial reporting, operations or to implement its strategy could have a material adverse effect on the business, financial condition, results of operations and cash flows. The CEG Master Services Agreement will continue in perpetuity, until terminated in accordance with its terms.
The Company also depends upon CEG and third parties for the provision of management, administration, O&M and certain other services at certain of the Company's facilities. Any failure by CEG or third parties to perform its requirements under these arrangements or the failure by the Company to identify and contract with replacement service providers, if required, could adversely affect the operation of the Company's facilities and have a material adverse effect on the business, financial condition, results of operations and cash flows.
27
GIP and its affiliates control the Company and have the ability to designate a majority of the members of Clearway, Inc.'s Board.
Due to GIP's approximate 54.93% combined voting power in Clearway, Inc., the ability of other holders of Clearway, Inc.’s Class A and Class C common stock to exercise control over the corporate governance of the Company is limited. GIP and its affiliates have a substantial influence on Clearway, Inc.’s affairs and its voting power constitutes a large percentage of any quorum of Clearway, Inc.’s stockholders voting on any matter requiring the approval of Clearway, Inc.’s stockholders. Such matters include the election of directors, the adoption of amendments to Clearway, Inc.'s amended and restated certificate of incorporation and fourth amended and restated bylaws and approval of mergers or sale of all or substantially all of its assets. This concentration of ownership may also have the effect of delaying or preventing a change in control of Clearway, Inc. or discouraging others from making tender offers for Clearway, Inc.'s shares. In addition, GIP has the right to elect all of Clearway, Inc.'s directors. GIP and its affiliates may hold certain interests that are different from those of the Company or other holders of Clearway, Inc.'s Class A and Class C common stock and there is no assurance that GIP and its affiliates will exercise its control over the Company in a manner that is consistent with the Company’s interests or those of the holders of Clearway, Inc.'s Class A and Class C common stock.
The Company may not be able to consummate future acquisitions from CEG.
The Company's ability to grow through acquisitions depends, in part, on CEG's ability to identify and present the Company with acquisition opportunities. Although CEG has agreed, pursuant to the CEG ROFO Agreement, to grant the Company a right of first offer with respect to certain power generation assets that CEG may elect to sell in the future, CEG is under no obligation to sell any such power generation assets or to accept any related offers from the Company. In addition, CEG has not agreed to commit any minimum level of dedicated resources for the pursuit of renewable power-related acquisitions. There are a number of factors which could materially and adversely impact the extent to which suitable acquisition opportunities are made available from CEG, including that the same professionals within CEG's organization that are involved in acquisitions that are suitable for the Company have responsibilities within CEG's broader asset management business, which may include sourcing acquisition opportunities for CEG. Limits on the availability of such individuals will likewise result in a limitation on the availability of acquisition opportunities for the Company. In making these determinations, CEG may be influenced by factors that result in a misalignment with the Company's interests or conflict of interest.
The Company may be unable to terminate the CEG Master Services Agreement, in certain circumstances.
The CEG Master Services Agreement provides that the Company may terminate the agreement upon 30 days prior written notice to CEG upon the occurrence of any of the following: (i) CEG defaults in the performance or observance of any material term, condition or covenant contained therein in a manner that results in material harm to the Company and the default continues unremedied for a period of 30 days after written notice thereof is given to CEG; (ii) CEG engages in any act of fraud, misappropriation of funds or embezzlement that results in material harm to the Company; (iii) CEG is grossly negligent in the performance of its duties under the agreement and such negligence results in material harm to the Company; or (iv) upon the happening of certain events relating to the bankruptcy or insolvency of CEG. Furthermore, if the Company requests an amendment to the scope of services provided by CEG under the CEG Master Services Agreement and is not able to agree with CEG as to a change to the service fee resulting from a change in the scope of services within 180 days of the request, the Company will be able to terminate the agreement upon 30 days prior notice to CEG. The Company will not be able to terminate the agreement for any other reason, including if CEG experiences a change of control, and the agreement continues in perpetuity, until terminated in accordance with its terms. If CEG's performance does not meet the expectations of investors, and the Company is unable to terminate the CEG Master Services Agreement, the market price of the Class A and Class C common stock could suffer.
If CEG terminates the CEG Master Services Agreement or defaults in the performance of its obligations under the agreement, the Company may be unable to contract with a substitute service provider on similar terms, or at all.
The Company relies on CEG to provide certain services under the CEG Master Services Agreement. The CEG Master Services Agreement provides that CEG may terminate the agreement upon 180 days prior written notice of termination to the Company if the Company defaults in the performance or observance of any material term, condition or covenant contained in the agreement in a manner that results in material harm and the default continues unremedied for a period of 30 days after written notice of the breach is given. If CEG terminates the Management Services Agreement or defaults in the performance of its obligations under the agreement, the Company may be unable to contract with CEG or a substitute service provider on similar terms or at all, and the costs of substituting service providers may be substantial. In addition, in light of CEG's familiarity with the Company's assets, a substitute service provider may not be able to provide the same level of service due to lack of pre-existing synergies.
28
The liability of CEG is limited under the Company's arrangements with it and the Company has agreed to indemnify CEG against claims that it may face in connection with such arrangements, which may lead CEG to assume greater risks when making decisions relating to the Company than it otherwise might if acting solely for its own account.
Under the CEG Master Services Agreement, CEG does not assume any responsibility other than to provide or arrange for the provision of the services described in the CEG Master Services Agreement in good faith. In addition, under the CEG Master Services Agreement, the liability of CEG and its affiliates is limited to the fullest extent permitted by law to conduct involving bad faith, fraud, willful misconduct or gross negligence or, in the case of a criminal matter, action that was known to have been unlawful. In addition, the Company has agreed to indemnify CEG to the fullest extent permitted by law from and against any claims, liabilities, losses, damages, costs or expenses incurred by an indemnified person or threatened in connection with the Company's operations, investments and activities or in respect of or arising from the CEG Master Services Agreement or the services provided by CEG, except to the extent that the claims, liabilities, losses, damages, costs or expenses are determined to have resulted from the conduct in respect of which such persons have liability as described above. These protections may result in CEG tolerating greater risks when making decisions than otherwise might be the case, including when determining whether to use leverage in connection with acquisitions. The indemnification arrangements to which CEG is a party may also give rise to legal claims for indemnification that are adverse to the Company and its unit holders.
Certain of the Company’s PPAs and project-level financing arrangements include provisions that would permit the counterparty to terminate the contract or accelerate maturity in the event GIP or its affiliates ceases to control or own, directly or indirectly, a majority of the voting power of the Company.
Certain of the Company’s PPAs and project-level financing arrangements contain change in control provisions that provide the counterparty with a termination right or the ability to accelerate maturity in the event of a change of control of the Company without the counterparty's consent. These provisions are triggered in the event GIP or its affiliates ceases to own, directly or indirectly, capital stock representing more than 50% of the voting power of the Company’s capital stock outstanding on such date, or, in some cases, if GIP or its affiliates ceases to be the majority owner, directly or indirectly, of the applicable project subsidiary. As a result, if GIP or its affiliates ceases to control, or in some cases, own a majority of the voting power of the Company, the counterparties could terminate such contracts or accelerate the maturity of such financing arrangements. The termination of any of the Company’s PPAs or the acceleration of the maturity of any of the Company’s project-level financing could have a material adverse effect on the Company’s business, financial condition, results of operations and cash flow.
Risks Related to Regulation
The Company's business is subject to restrictions resulting from environmental, health and safety laws and regulations.
The Company is subject to various federal, state and local environmental and health and safety laws and regulations. In addition, the Company may be held primarily or jointly and severally liable for costs relating to the investigation and clean-up of any property where there has been a release or threatened release of a hazardous regulated material as well as other affected properties, regardless of whether the Company knew of or caused the release. In addition to these costs, which are typically not limited by law or regulation and could exceed an affected property's value, the Company could be liable for certain other costs, including governmental fines and injuries to persons, property or natural resources. Further, some environmental laws provide for the creation of a lien on a contaminated site in favor of the government as security for damages and any costs the government incurs in connection with such contamination and associated clean-up. Although the Company generally requires its operators to undertake to indemnify it for environmental liabilities they cause, the amount of such liabilities could exceed the financial ability of the operator to indemnify the Company. The presence of contamination or the failure to remediate contamination may adversely affect the Company's ability to operate the business.
Greenhouse gas (GHG) regulation could also increase the cost of electricity generated by fossil fuels, and such increases could reduce demand for the power the Company's conventional assets generate and market. Legislative and regulatory measures to address climate change and GHG emissions are in various phases of discussion or implementation. The Company does not own allEPA regulates GHG emissions from new and modified facilities that are potential major sources of criteria pollutants under the Clean Air Act's Prevention of Significant Deterioration and Title V programs and has adopted regulations that require, among other things, preconstruction and operating permits for certain large stationary sources and the monitoring and reporting of GHGs from certain onshore oil and natural gas production sources on an annual basis.
29
In addition, in 2015, the U.S., Canada and the U.K. participated in the United Nations Conference on Climate Change, which led to the creation of the landParis Agreement. The Paris Agreement, which was signed by the U.S. in April 2016, requires countries to review and “represent a progression” in their intended nationally determined contributions (which set GHG emission reduction goals) every five years beginning in 2020. In November 2020, the U.S. officially withdrew from the Paris Agreement in November 2020. However, on which its power generationJanuary 20, 2021, President Biden signed an “Acceptance on Behalf of the United States of America” that will allow the U.S. to rejoin the Paris Agreement. The newly signed acceptance, deposited with the United Nations on January 20, reverses the prior withdrawal. The U.S. officially rejoined the Paris Agreement on February 19, 2021.
The U.S. Congress, along with federal and state agencies, has also considered measures to reduce the emissions of GHGs. Legislation or thermalregulation that restricts carbon emissions could increase the cost of environmental compliance for the Company’s conventional assets by requiring the Company to install new equipment to reduce emissions from larger facilities and/or purchase emission allowances. Climate change and GHG legislation or regulation could also delay or otherwise negatively affect efforts to obtain and maintain permits and other regulatory approvals for the Company’s conventional assets’ existing and new facilities, impose additional monitoring and reporting requirements or adversely affect demand for the natural gas the Company gathers, transports and stores. Conversely, legislation or regulation that sets a price on or otherwise restricts carbon emissions could also benefit the Company by increasing demand for solar or wind energy sources. In addition, governmental, scientific and public concern over the threat of climate change arising from GHG emissions has resulted in increasing political risks in the U.S, including climate change related pledges made by the Biden Administration. Shortly after taking office in January 2021, President Biden issued a series of executive orders designed to address climate change and suspend, revise, or rescind, prior agency actions that are located, which couldidentified as conflicting with the Biden Administration’s climate policies. Furthermore, as part of rejoining the Paris Agreement, President Biden announced that the United States would commit to a 50 to 52 percent reduction from 2005 levels of GHG emissions by 2030, and set the goal of reaching net-zero GHG emissions by 2050. Reentry into the Paris Agreement and President Biden's executive orders may result in disruptionthe development of additional regulations or changes to its operations.
existing regulations. The Company does not own all of the land on which its power generation or thermal assets are located and the Company is, therefore, subject to the possibility of less desirable terms and increased costs to retain necessary land use if it does not have valid leases or rights-of-way or if such rights-of-way lapse or terminate. Although the Company has obtained rights to construct and operate these assets pursuant to related lease arrangements, the rights to conduct those activities are subject to certain exceptions, including the term of the lease arrangement. The Company is also at risk of condemnation on land it owns. The loss of these rights, through the Company's inability to renew right-of-way contracts, condemnation or otherwise, may adversely affect the Company's ability to operate its generation and thermal infrastructure assets.
any new legislative or regulatory measures will depend on the particular provisions that are ultimately adopted.
The electric generation business is subject to substantial governmental regulation and may be adversely affected by changes in laws or regulations, as well as liability under, or any future inability to comply with, existing or future regulations or other legal requirements.
The Company's electric generation business is subject to extensive U.S. federal, state and local laws and regulations. Compliance with the requirements under these various regulatory regimes may cause the Company to incur significant additional costs, and failure to comply with such requirements could result in the shutdown of the non-complying facility, the imposition of liens, fines, and/or civil or criminal liability. Public utilities under the FPA are required to obtain FERC acceptance of their rate schedules for wholesale sales of electric energy, capacity and ancillary services. Except for generating facilities located in Hawaii, in Texas within the footprint of ERCOT, which are regulated by the PUCT,or in Puerto Rico, all of the Company’s assets make wholesale sales of electric energy, capacity and ancillary services in interstate commerce andgenerating companies are public utilities for purposes ofunder the FPA with market-based rate authority unless otherwise exempt from such status.FPA public utility rate regulation. FERC's orders that grant market-based rate authority to wholesale power marketerssellers reserve the right to revoke or revise that authority if FERC subsequently determines that the seller can exercise market power in transmission or generation, create barriers to entry, or engage in abusive affiliate transactions. In addition, public utilities are subject to FERC reporting requirements that impose administrative burdens and that, if violated, can expose the company to criminal and civil penalties or other risks.
The Company's market-based sales will beare subject to certain rules prohibiting manipulative or deceptive conduct, and if any of the Company's generating companies with market-based rate authority are deemed to have violated those rules, they willcould be subject to potential disgorgement of profits associated with the violation, penalties, suspension or revocation of market based rate authority. If such generating companies were to lose their market-based rate authority, such companies would be required to obtain FERC's acceptance of a cost-of-service rate schedule and could become subject to the significant accounting, record-keeping, and reporting requirements that are imposed on utilities with cost-based rate schedules. This could have a material adverse effect on the rates the Company is able to charge for power from its facilities.
30
Substantially all of the Company's generation assets are also subject to the reliability standards promulgated by the designated Electric Reliability Organization (currently the North American Electric Reliability Corporation, or NERC) and approved by FERC. If the Company fails to comply with the mandatory reliability standards, it could be subject to sanctions, including substantial monetary penalties and increased compliance obligations. The Company will also be affected by legislative and regulatory changes, as well as changes to market design, market rules, tariffs, cost allocations and bidding rules that occur in the existing regional markets operated by RTOs or ISOs, such as PJM. The RTOs/ISOs that oversee most of the wholesale power markets impose, and in the future may continue to impose, mitigation, including price limitations, offer caps, non-performance penalties and other mechanisms to address some of the volatility and the potential exercise of market power in these markets. These types of price limitations and other regulatory mechanisms may have a material adverse effect on the profitability of the Company's generation facilities acquired in the future that sell energy, capacity and ancillary products into the wholesale power markets. The regulatory environment for electric generation has undergone significant changes in the last several years due to state and federal policies affecting wholesale competition and the creation of incentives for the addition of large amounts of new renewable generation and, in some cases, transmission assets. These changes are ongoing and the Company cannot predict the future design of the wholesale power markets or the ultimate effect that the changing regulatory environment will have on the Company's business. In addition, in some of these markets, interested parties have proposed to re-regulate the markets or require divestiture of electric generation assets by asset owners or operators to reduce their market share. Other proposals to re-regulate may be made and legislative or other attention to the electric power market restructuring process may delay or reverse the deregulation process. If competitive restructuring of the electric power markets is reversed, discontinued, or delayed, the Company's business prospects and financial results could be negatively impacted.
The Company is subject to environmental laws and regulations that impose extensive and increasingly stringent requirements on its operations, as well as potentially substantial liabilities arising out of environmental contamination.
The Company's assets are subject to numerous and significant federal, state and local laws, including statutes, regulations, guidelines, policies, directives and other requirements governing or relating to, among other things: protection of wildlife, including threatened and endangered species; air emissions; discharges into water; water use; the storage, handling, use, transportation and distribution of dangerous goods and hazardous, residual and other regulated materials, such as chemicals; the prevention of releases of hazardous materials into the environment; the prevention, presence and remediation of hazardous materials in soil and groundwater, both on and offsite; land use and zoning matters; and workers' health and safety matters. The Company's facilities could experience incidents, malfunctions and other unplanned events that could result in spills or emissions in excess of permitted levels and result in personal injury, penalties and property damage. Any failure to comply with applicable environmental laws and regulations, including those relating to equipment failures, or obtain required governmental approvals and permits, may result in the assessment of administrative, civil or criminal penalties, imposition of investigatory or remedial activities and, in certain, less common circumstances, issuance of temporary or permanent injunctions, or construction or operation bans or delays. As such, the operation of the Company's facilities carries an inherent risk of environmental, health and safety liabilities (including potential civil actions, compliance or remediation orders, fines and other penalties), and may result in the assets being involved from time to time in administrative and judicial proceedings relating to such matters. The Company has implemented environmental, health and safety management programs designed to continually improve environmental, health and safety performance. Environmental laws and regulations have generally become more stringent over time. Significant costs may be incurred for capital expenditures under environmental programs to keep the assets compliant with such environmental laws and regulations. If it is not economical to make those expenditures, it may be necessary to retire or mothball facilities or restrict or modify the Company's operations to comply with more stringent standards. These environmental requirements and liabilities could have a material adverse effect on the business, financial condition, results of operations and cash flows.
The Company's generation facilities that were acquired or those that the Company otherwise acquires or constructsbusiness is subject to complex and the facilitiesevolving U.S. laws and regulations regarding privacy and data protection (“data protection laws”). Many of third parties on which they rely may be targets of terrorist activities, as well as events occurring in responsethese laws and regulations are subject to or in connection with them, that could cause environmental repercussions and/or result in full or partial disruption of the facilities ability to generate, transmit, transport or distribute electricity or natural gas. Strategic targets, such as energy-related facilities, may be at greater risk of future terrorist activities than other domestic targets. Hostile cyber intrusions, including those targeting information systems as well as electronic control systems used at the generating plantschange and for the related distribution systems, could severely disrupt business operationsuncertain interpretation, and result in loss of service to customers, as well as create significant expense to repair security breaches or system damage.
The operation of the Company’s businessesregulatory environment surrounding data privacy and protection is constantly evolving and can be subject to cyber-based securitysignificant change. New data protection laws pose increasingly complex compliance challenges and integrity risk.
31
Government regulations providing incentives for renewable power generation could change at any time and such changes may negatively impact the Company's growth strategy.
The Company's growth strategy depends in part on government policies that support renewable generation and enhance the economic viability of owning renewable electric generation assets. Renewable generation assets currently benefit from various federal, state and local governmental incentives such as ITCs, cash grants in lieu of ITCs, PTCs, loan guarantees, RPS, programs, modified accelerated cost-recovery system of depreciation and bonus depreciation. In December 2015,These laws, regulations and policies have had a significant impact on the U.S. Congress enacted an extensiondevelopment of renewable energy generation projects and they could be changed, reduced or eliminated at any time. These incentives make the development of renewable generation projects more competitive by providing tax credits or grants and accelerated depreciation for a portion of the 30% solar ITC sodevelopment costs, decreasing the costs and risks associated with developing such projects or creating demand for renewable energy assets through RPS programs. The elimination of, loss of or reduction in such incentives could decrease the attractiveness of renewable generation projects to developers, including, but not limited to, CEG, which could reduce the Company's acquisition opportunities. Such an elimination, loss or reduction could also reduce the Company's willingness to pursue or develop certain renewable energy projects due to higher operating costs or decreased revenues under its PPAs.
If these laws, regulations and policies are not continued or renewed, the market for future renewable energy PPAs may be smaller and the prices for future renewable energy PPAs may be lower. If the IRS issues guidance that projects that began construction in 2016 through 2019 will continue to qualify forlimits the 30% ITC. Projects beginning construction in 2020 and 2021 will be eligible foravailability of the PTC or the ITC, at the rates of 26%projects could generate reduced revenues and 22%, respectively. The same legislation also extendedreduced economic returns, experience increased financing costs and encounter difficulty obtaining financing on acceptable terms.
If the 10-year wind PTC for wind projects that began construction in years 2016 through 2019. Wind projects that begin constructionCompany is unable to utilize various federal, state and local government incentives to acquire additional renewable assets in the years 2018future, or the terms of such incentives are revised in a manner that is less favorable to the Company, it may suffer a material adverse effect on the business, financial condition, results of operations and 2019 are eligible for PTC at 60% and 40% of the statutory rate per kWh, respectively.cash flows.
Many states have adopted RPS programs mandating that a specified percentage of electricity sales come from eligible sources of renewable energy. However, the regulations that govern the RPS programs, including pricing incentives for renewable energy, or reasonableness guidelines for pricing that increase valuation compared to conventional power (such as a projected value for carbon reduction or consideration of avoided integration costs), may change. If the RPS requirements are reduced or eliminated, it could lead to fewer future powercommodity contracts or lead to lower prices for the sale of power in future powercommodity contracts, which could have a material adverse effect on the Company's future growth prospects. Such material adverse effects may result from decreased revenues, reduced economic returns on certain project company investments, increased financing costs, and/or difficulty obtaining financing. Furthermore, the ARRAAmerican Recovery and Reinvestment Act of 2009 included incentives to encourage investment in the renewable energy sector, such as cash grants in lieu of ITCs, bonus depreciation and expansion of the U.S. DOE loan guarantee program. It is uncertain what loan guarantees may be made by the U.S. DOE loan guarantee program in the future. In addition, the cash grant in lieu of ITCs program only applies to facilities that commenced construction prior to December 31, 2011, which commencement date may be determined in accordance with the safe harbor if more than 5%
Any of the total cost of the eligible property was paid or incurred by December 31, 2011.
A portion of the Company with acquisition opportunities. NRGsteam and chilled water produced by the Company's thermal assets is sold at regulated rates, and the revenue earned by the Company's GenConn assets is established the Company to hold and acquire a diversified suite of power generating assets in the U.S. and its territories. Although NRG has agreed to grant the Company a right of first offer with respect to certain power generation assets that NRG may elect to sell in the future, NRG is under no obligation to sell any such power generation assets or to accept any related offer from the Company. In addition, NRG has not agreed to commit any minimum level of dedicated resources for the pursuit of renewable power-related acquisitions. There are a number of factors which could materially and adversely impact the extent to which suitable acquisition opportunities are made available from NRG, including:
Approximately 433 net MWt of factors including an assessment by NRG relating to the Company's liquidity position at the time, the risk profile of the opportunity and its fit with the balance of the Company's then current operations and other factors. If NRG determines that an opportunity is not suitable for the Company, it may still pursue such opportunity on its own behalf, or on behalf of another NRG affiliate.
32
CAUTIONARY STATEMENT REGARDING FORWARD-LOOKING INFORMATION
This Annual Report on Form 10-K of NRG YieldClearway Energy LLC, together with its consolidated subsidiaries, or the Company, includes forward-looking statements within the meaning of Section 27A of the Securities Act of 1933, as amended, or the Securities Act, and Section 21E of the Securities Exchange Act of 1934, as amended, or the Exchange Act. The words "believes," "projects," "anticipates," "plans," "expects," "intends," "estimates" and similar expressions are intended to identify forward-looking statements. These forward-looking statements involve known and unknown risks, uncertainties and other factors that may cause the Company's actual results, performance and achievements, or industry results, to be materially different from any future results, performance or achievements expressed or implied by such forward-looking statements. These factors, risks and uncertainties include the factors described under Item 1A — Risk Factors and the following:
•The Company's ability to maintain and grow its quarterly distributions;
•Potential risks related to COVID-19 (including any variant of the virus) or any other pandemic;
•Potential risks related to the Company as a result of the NRG Transaction;Company's relationships with GIP and CEG;
•The Company's ability to successfully identify, evaluate and consummate acquisitions from, and dispositions to, third parties;
•The Company's ability to close the Thermal Disposition;
•The Company's ability to acquire assets from NRG;GIP or CEG;
•The Company's ability to raise additional capital due to its indebtedness, corporate structure, market conditions or otherwise;
•Changes in law, including judicial decisions;
•Hazards customary to the power production industry and power generation operations such as fuel and electricity price volatility, unusual weather conditions (including wind and solar conditions), catastrophic weather-related or other damage to facilities, unscheduled generation outages, maintenance or repairs, unanticipated changes to fuel supply costs or availability due to higher demand, shortages, transportation problems or other developments, environmental incidents, or electric transmission or gas pipeline system constraints and the possibility that the Company may not have adequate insurance to cover losses as a result of such hazards;
•The Company's ability to operate its businesses efficiently, manage maintenance capital expenditures and costs effectively, and generate earnings and cash flows from its asset-based businesses in relation to its debt and other obligations;
•The willingness and ability of counterparties to the Company's offtake agreements to fulfill their obligations under such agreements;
•The Company's ability to enter into contracts to sell power and procure fuel on acceptable terms and prices as current offtake agreements expire;
•Government regulation, including compliance with regulatory requirements and changes in market rules, rates, tariffs and environmental laws;
•Operating and financial restrictions placed on the Company that are contained in the project-level debt facilities and other agreements of certain subsidiaries and project-level subsidiaries generally, in the NRG YieldClearway Energy Operating LLC amended and restated revolving credit facility and in the indentures governing the Senior Notes;
•Cyber terrorism and inadequate cybersecurity, or the occurrence of a catastrophic loss and the possibility that the Company may not have adequate insurance to cover losses resulting from such hazards or the inability of the Company's insurers to provide coverage; and
•The Company's ability to borrow additional funds and access capital markets as well as the Company's substantial indebtedness and the possibility that the Company may incur additional indebtedness going forward.
Forward-looking statements speak only as of the date they were made, and the Company undertakes no obligation to publicly update or revise any forward-looking statements, whether as a result of new information, future events or otherwise. The foregoing review of factors that could cause the Company's actual results to differ materially from those contemplated in any forward-looking statements included in this Annual Report on Form 10-K should not be construed as exhaustive.
Item 1B — Unresolved Staff Comments
None.
33
Item 2 — Properties
Listed below are descriptions of the Company's interests in facilities, operations and/or projects owned or leased as of December 31, 2017.2021.
| Capacity | ||||||||||||||||||||||||||||||||||||||||||||||||||
| Rated MW | Net MW(a) | Owner-ship | PPA Terms | |||||||||||||||||||||||||||||||||||||||||||||||
| Assets | Location | Fuel | COD | Counterparty | Expiration | |||||||||||||||||||||||||||||||||||||||||||||
| Conventional | ||||||||||||||||||||||||||||||||||||||||||||||||||
| Carlsbad | Carlsbad, CA | 527 | 527 | 100 | % | Natural Gas | December 2018 | San Diego Gas & Electric | 2038 | |||||||||||||||||||||||||||||||||||||||||
| El Segundo | El Segundo, CA | 550 | 550 | 100 | % | Natural Gas | August 2013 | SCE | 2023 | |||||||||||||||||||||||||||||||||||||||||
| GenConn Devon | Milford, CT | 190 | 95 | 50 | % | Natural Gas/Oil | June 2010 | Connecticut Light & Power | 2040 | |||||||||||||||||||||||||||||||||||||||||
| GenConn Middletown | Middletown, CT | 190 | 95 | 50 | % | Natural Gas/Oil | June 2011 | Connecticut Light & Power | 2041 | |||||||||||||||||||||||||||||||||||||||||
| Marsh Landing | Antioch, CA | 720 | 720 | 100 | % | Natural Gas | May 2013 | Various | 2023 - 2030 | |||||||||||||||||||||||||||||||||||||||||
| Walnut Creek | City of Industry, CA | 485 | 485 | 100 | % | Natural Gas | May 2013 | SCE | 2023 - 2026 | |||||||||||||||||||||||||||||||||||||||||
| Total Conventional | 2,662 | 2,472 | ||||||||||||||||||||||||||||||||||||||||||||||||
| Utility Scale Solar | ||||||||||||||||||||||||||||||||||||||||||||||||||
| Agua Caliente | Dateland, AZ | 290 | 148 | 51 | % | Solar | June 2014 | PG&E | 2039 | |||||||||||||||||||||||||||||||||||||||||
| Alpine | Lancaster, CA | 66 | 66 | 100 | % | Solar | January 2013 | PG&E | 2033 | |||||||||||||||||||||||||||||||||||||||||
| Avenal | Avenal, CA | 45 | 23 | 50 | % | Solar | August 2011 | PG&E | 2031 | |||||||||||||||||||||||||||||||||||||||||
| Avra Valley | Pima County, AZ | 27 | 27 | 100 | % | Solar | December 2012 | Tucson Electric Power | 2032 | |||||||||||||||||||||||||||||||||||||||||
| Blythe | Blythe, CA | 21 | 21 | 100 | % | Solar | December 2009 | SCE | 2029 | |||||||||||||||||||||||||||||||||||||||||
| Borrego | Borrego Springs, CA | 26 | 26 | 100 | % | Solar | February 2013 | San Diego Gas and Electric | 2038 | |||||||||||||||||||||||||||||||||||||||||
Buckthorn Solar (b) | Fort Stockton, TX | 154 | 154 | 100 | % | Solar | July 2018 | City of Georgetown, TX | 2043 | |||||||||||||||||||||||||||||||||||||||||
| CVSR | San Luis Obispo, CA | 250 | 250 | 100 | % | Solar | October 2013 | PG&E | 2038 | |||||||||||||||||||||||||||||||||||||||||
| Desert Sunlight 250 | Desert Center, CA | 250 | 63 | 25 | % | Solar | December 2014 | SCE | 2034 | |||||||||||||||||||||||||||||||||||||||||
| Desert Sunlight 300 | Desert Center, CA | 300 | 75 | 25 | % | Solar | December 2014 | PG&E | 2039 | |||||||||||||||||||||||||||||||||||||||||
| Kansas South | Lemoore, CA | 20 | 20 | 100 | % | Solar | June 2013 | PG&E | 2033 | |||||||||||||||||||||||||||||||||||||||||
Kawailoa (b) | Oahu, HI | 49 | 24 | 48 | % | Solar | November 2019 | Hawaiian Electric Company | 2041 | |||||||||||||||||||||||||||||||||||||||||
Oahu Solar Projects (b) | Oahu, HI | 61 | 58 | 95 | % | Solar | September 2019 | Hawaiian Electric Company | 2041 | |||||||||||||||||||||||||||||||||||||||||
| Roadrunner | Santa Teresa, NM | 20 | 20 | 100 | % | Solar | August 2011 | El Paso Electric | 2031 | |||||||||||||||||||||||||||||||||||||||||
Rosamond Central (b) | Rosamond, CA | 192 | 96 | 50 | % | Solar | December 2020 | Various | 2035 - 2047 | |||||||||||||||||||||||||||||||||||||||||
| TA High Desert | Lancaster, CA | 20 | 20 | 100 | % | Solar | March 2013 | SCE | 2033 | |||||||||||||||||||||||||||||||||||||||||
| Utah Solar Portfolio | Various | 530 | 530 | 100 | % | Solar | July - September 2016 | PacifiCorp | 2036 | |||||||||||||||||||||||||||||||||||||||||
| Total Utility Scale Solar | 2,321 | 1,621 | ||||||||||||||||||||||||||||||||||||||||||||||||
| Distributed Solar | ||||||||||||||||||||||||||||||||||||||||||||||||||
DGPV Fund Projects (b) | Various | 286 | 286 | 100 | % | Solar | September 2015 - March 2019 | Various | 2030 - 2044 | |||||||||||||||||||||||||||||||||||||||||
| Solar Power Partners (SPP) Projects | Various | 25 | 25 | 100 | % | Solar | June 2008 - June 2012 | Various | 2026 - 2037 | |||||||||||||||||||||||||||||||||||||||||
| Other DG Projects | Various | 21 | 21 | 100 | % | Solar | December 2010 - October 2015 | Various | 2023 - 2039 | |||||||||||||||||||||||||||||||||||||||||
| Total Distributed Solar | 332 | 332 | ||||||||||||||||||||||||||||||||||||||||||||||||
| Wind | ||||||||||||||||||||||||||||||||||||||||||||||||||
| Alta I | Tehachapi, CA | 150 | 150 | 100 | % | Wind | December 2010 | SCE | 2035 | |||||||||||||||||||||||||||||||||||||||||
| Alta II | Tehachapi, CA | 150 | 150 | 100 | % | Wind | December 2010 | SCE | 2035 | |||||||||||||||||||||||||||||||||||||||||
| Alta III | Tehachapi, CA | 150 | 150 | 100 | % | Wind | February 2011 | SCE | 2035 | |||||||||||||||||||||||||||||||||||||||||
| Alta IV | Tehachapi, CA | 102 | 102 | 100 | % | Wind | March 2011 | SCE | 2035 | |||||||||||||||||||||||||||||||||||||||||
| Alta V | Tehachapi, CA | 168 | 168 | 100 | % | Wind | April 2011 | SCE | 2035 | |||||||||||||||||||||||||||||||||||||||||
34
| Capacity | |||||||||||||||||||
| Rated MW | Net MW(a) | Owner-ship | PPA Terms | ||||||||||||||||
| Assets | Location | Fuel | COD | Counterparty | Expiration | ||||||||||||||
| Conventional | |||||||||||||||||||
| El Segundo | El Segundo, CA | 550 | 550 | 100 | % | Natural Gas | August 2013 | Southern California Edison | 2023 | ||||||||||
| GenConn Devon | Milford, CT | 190 | 95 | 50 | % | Natural Gas/Oil | June 2010 | Connecticut Light & Power | 2040 | ||||||||||
| GenConn Middletown | Middletown, CT | 190 | 95 | 50 | % | Natural Gas/Oil | June 2011 | Connecticut Light & Power | 2041 | ||||||||||
| Marsh Landing | Antioch, CA | 720 | 720 | 100 | % | Natural Gas | May 2013 | Pacific Gas and Electric | 2023 | ||||||||||
| Walnut Creek | City of Industry, CA | 485 | 485 | 100 | % | Natural Gas | May 2013 | Southern California Edison | 2023 | ||||||||||
| Total Conventional | 2,135 | 1,945 | |||||||||||||||||
| Utility Scale Solar | |||||||||||||||||||
| Agua Caliente | Dateland, AZ | 290 | 46 | 16 | % | Solar | June 2014 | Pacific Gas and Electric | 2039 | ||||||||||
| Alpine | Lancaster, CA | 66 | 66 | 100 | % | Solar | January 2013 | Pacific Gas and Electric | 2033 | ||||||||||
| Avenal | Avenal, CA | 45 | 23 | 50 | % | Solar | August 2011 | Pacific Gas and Electric | 2031 | ||||||||||
| Avra Valley | Pima County, AZ | 26 | 26 | 100 | % | Solar | December 2012 | Tucson Electric Power | 2032 | ||||||||||
| Blythe | Blythe, CA | 21 | 21 | 100 | % | Solar | December 2009 | Southern California Edison | 2029 | ||||||||||
| Borrego | Borrego Springs, CA | 26 | 26 | 100 | % | Solar | February 2013 | San Diego Gas and Electric | 2038 | ||||||||||
| CVSR | San Luis Obispo, CA | 250 | 250 | 100 | % | Solar | October 2013 | Pacific Gas and Electric | 2038 | ||||||||||
| Desert Sunlight 250 | Desert Center, California | 250 | 63 | 25 | % | Solar | December 2014 | Southern California Edison | 2034 | ||||||||||
| Desert Sunlight 300 | Desert Center, California | 300 | 75 | 25 | % | Solar | December 2014 | Pacific Gas and Electric | 2039 | ||||||||||
| Four Brothers Solar | New Castle/Milford, UT | 320 | 160 | 50 | % | Solar | July 2016 - August 2016 | PacifiCorp | 2036 | ||||||||||
| Granite Mountain | Cedar City, UT | 130 | 65 | 50 | % | Solar | September 2016 | PacifiCorp | 2036 | ||||||||||
| Iron Springs | Cedar City, UT | 80 | 40 | 50 | % | Solar | August 2016 | PacifiCorp | 2036 | ||||||||||
| Kansas South | Lemoore, CA | 20 | 20 | 100 | % | Solar | June 2013 | Pacific Gas and Electric | 2033 | ||||||||||
| Roadrunner | Santa Teresa, NM | 20 | 20 | 100 | % | Solar | August 2011 | El Paso Electric | 2031 | ||||||||||
| TA High Desert | Lancaster, CA | 20 | 20 | 100 | % | Solar | March 2013 | Southern California Edison | 2033 | ||||||||||
| Total Utility Scale Solar | 1,864 | 921 | |||||||||||||||||
| Distributed Solar | |||||||||||||||||||
| Apple I LLC Projects | CA | 9 | 9 | 100 | % | Solar | October 2012 - December 2012 | Various | 2032 | ||||||||||
| AZ DG Solar Projects | AZ | 5 | 5 | 100 | % | Solar | December 2010 - January 2013 | Various | 2025-2033 | ||||||||||
| SPP Projects | Various | 25 | 25 | 100 | % | Solar | June 2008 - June 2012 | Various | 2026-2037 | ||||||||||
| Other DG Projects | Various | 13 | 13 | 100 | % | Solar | October 2012 - October 2015 | Various | 2023-2039 | ||||||||||
| Total Distributed Solar | 52 | 52 | |||||||||||||||||
| Wind | |||||||||||||||||||
| Alta I | Tehachapi, CA | 150 | 150 | 100 | % | Wind | December 2010 | Southern California Edison | 2035 | ||||||||||
| Capacity | ||||||||||||||||||||||||||||||||||||||||||||||||||
| Rated MW | Net MW(a) | Owner-ship | PPA Terms | |||||||||||||||||||||||||||||||||||||||||||||||
| Assets | Location | Fuel | COD | Counterparty | Expiration | |||||||||||||||||||||||||||||||||||||||||||||
Alta X (b) | Tehachapi, CA | 137 | 137 | 100 | % | Wind | February 2014 | SCE | 2038 | |||||||||||||||||||||||||||||||||||||||||
Alta XI (b) | Tehachapi, CA | 90 | 90 | 100 | % | Wind | February 2014 | SCE | 2038 | |||||||||||||||||||||||||||||||||||||||||
Black Rock (b)(d) | Mineral and Grant Counties, WV | 70 | 35 | 50 | % | Wind | December 2021 | Toyoya and AEP | 2036 | |||||||||||||||||||||||||||||||||||||||||
| Buffalo Bear | Buffalo, OK | 19 | 19 | 100 | % | Wind | December 2008 | Western Farmers Electric Co-operative | 2033 | |||||||||||||||||||||||||||||||||||||||||
| Crosswinds | Ruthven, IA | 21 | 21 | 99 | % | Wind | June 2007 | Corn Belt Power Cooperative | 2027 | |||||||||||||||||||||||||||||||||||||||||
Elbow Creek (b) | Howard County, TX | 122 | 122 | 100 | % | Wind | December 2008 | Various | 2029 | |||||||||||||||||||||||||||||||||||||||||
| Elkhorn Ridge | Bloomfield, NE | 81 | 54 | 66.7 | % | Wind | March 2009 | Nebraska Public Power District | 2029 | |||||||||||||||||||||||||||||||||||||||||
| Forward | Berlin, PA | 29 | 29 | 100 | % | Wind | April 2008 | Constellation NewEnergy, Inc. | 2022 | |||||||||||||||||||||||||||||||||||||||||
| Goat Wind | Sterling City, TX | 150 | 150 | 100 | % | Wind | April 2008/June 2009 | Dow Pipeline Company | 2025 | |||||||||||||||||||||||||||||||||||||||||
| Hardin | Jefferson, IA | 15 | 15 | 99 | % | Wind | May 2007 | Interstate Power and Light Company | 2027 | |||||||||||||||||||||||||||||||||||||||||
Langford (b) | Christoval, TX | 160 | 160 | 100 | % | Wind | December 2009/November 2020 | Goldman Sachs | 2033 | |||||||||||||||||||||||||||||||||||||||||
| Laredo Ridge | Petersburg, NE | 81 | 81 | 100 | % | Wind | February 2011 | Nebraska Public Power District | 2031 | |||||||||||||||||||||||||||||||||||||||||
Lookout (b) | Berlin, PA | 38 | 38 | 100 | % | Wind | October 2008 | Southern Maryland Electric Cooperative | 2030 | |||||||||||||||||||||||||||||||||||||||||
Mesquite Sky (b) | Callahan County, TX | 340 | 170 | 50 | % | Wind | December 2021 | Various | 2033 - 2036 | |||||||||||||||||||||||||||||||||||||||||
Mesquite Star (b) | Fisher County, TX | 419 | 210 | 50 | % | Wind | June 2020 | Various | 2032 - 2035 | |||||||||||||||||||||||||||||||||||||||||
| Mt Storm | Mt Storm, WV | 264 | 264 | 100 | % | Wind | October 2008 | Citigroup | 2031 | |||||||||||||||||||||||||||||||||||||||||
| Ocotillo | Forsan, TX | 59 | 59 | 100 | % | Wind | November 2008 | N/A | ||||||||||||||||||||||||||||||||||||||||||
| Odin | Mountain Lake, MN | 21 | 21 | 100 | % | Wind | June 2008 | Missouri River Energy Services | 2028 | |||||||||||||||||||||||||||||||||||||||||
Pinnacle (b) | Keyser, WV | 54 | 54 | 100 | % | Wind | December 2011/December 2021 | Maryland Department of General Services and University System of Maryland | 2031 | |||||||||||||||||||||||||||||||||||||||||
Rattlesnake (b) (c) | Ritzville, WA | 160 | 160 | 100 | % | Wind | December 2020 | Avista Corporation | 2040 | |||||||||||||||||||||||||||||||||||||||||
| San Juan Mesa | Elida, NM | 120 | 90 | 75 | % | Wind | December 2005 | Southwestern Public Service Company | 2025 | |||||||||||||||||||||||||||||||||||||||||
| Sleeping Bear | Woodward, OK | 95 | 95 | 100 | % | Wind | October 2007 | Public Service Company of Oklahoma | 2032 | |||||||||||||||||||||||||||||||||||||||||
| South Trent | Sweetwater, TX | 101 | 101 | 100 | % | Wind | January 2009 | AEP Energy Partners | 2029 | |||||||||||||||||||||||||||||||||||||||||
| Spanish Fork | Spanish Fork, UT | 19 | 19 | 100 | % | Wind | July 2008 | PacifiCorp | 2028 | |||||||||||||||||||||||||||||||||||||||||
Spring Canyon II (b) | Logan County, CO | 34 | 31 | 90.1 | % | Wind | October 2014 | Platte River Power Authority | 2039 | |||||||||||||||||||||||||||||||||||||||||
Spring Canyon III (b) | Logan County, CO | 29 | 26 | 90.1 | % | Wind | December 2014 | Platte River Power Authority | 2039 | |||||||||||||||||||||||||||||||||||||||||
| Taloga | Putnam, OK | 130 | 130 | 100 | % | Wind | July 2011 | Oklahoma Gas & Electric | 2031 | |||||||||||||||||||||||||||||||||||||||||
Wildorado (b) | Vega, TX | 161 | 161 | 100 | % | Wind | April 2007 | Southwestern Public Service Company | 2027 | |||||||||||||||||||||||||||||||||||||||||
| Total Wind | 3,739 | 3,262 | ||||||||||||||||||||||||||||||||||||||||||||||||
| Thermal Generation | ||||||||||||||||||||||||||||||||||||||||||||||||||
| CA Fuel Cell | Tulare, CA | 3 | 3 | 100 | % | Natural Gas | May 2018 | City of Tulare | 2038 | |||||||||||||||||||||||||||||||||||||||||
| ECP Uptown Campus | Pittsburgh, PA | 6 | 6 | 100 | % | Natural Gas | May 2019 | Duquesne University | 2059 | |||||||||||||||||||||||||||||||||||||||||
| Energy Center - Pittsburgh | Pittsburgh, PA | 7 | 7 | 100 | % | Diesel | January 2019 | University of Pittsburgh Medical Center | 2038 | |||||||||||||||||||||||||||||||||||||||||
| Energy Center Caguas | Caguas, PR | 3 | 3 | 100 | % | Natural Gas | September 2020 | Viatris Pharmaceuticals | 2032 | |||||||||||||||||||||||||||||||||||||||||
| Paxton Creek Cogen | Harrisburg, PA | 12 | 12 | 100 | % | Natural Gas | November 1986 | Power sold into PJM markets | ||||||||||||||||||||||||||||||||||||||||||
| Princeton Hospital | Princeton, NJ | 5 | 5 | 100 | % | Natural Gas | January 2012 | Princeton Hospital | 2025 | |||||||||||||||||||||||||||||||||||||||||
35
| Capacity | |||||||||||||||||||
| Rated MW | Net MW(a) | Owner-ship | PPA Terms | ||||||||||||||||
| Assets | Location | Fuel | COD | Counterparty | Expiration | ||||||||||||||
| Alta II | Tehachapi, CA | 150 | 150 | 100 | % | Wind | December 2010 | Southern California Edison | 2035 | ||||||||||
| Alta III | Tehachapi, CA | 150 | 150 | 100 | % | Wind | February 2011 | Southern California Edison | 2035 | ||||||||||
| Alta IV | Tehachapi, CA | 102 | 102 | 100 | % | Wind | March 2011 | Southern California Edison | 2035 | ||||||||||
| Alta V | Tehachapi, CA | 168 | 168 | 100 | % | Wind | April 2011 | Southern California Edison | 2035 | ||||||||||
Alta X (b) | Tehachapi, CA | 137 | 137 | 100 | % | Wind | February 2014 | Southern California Edison | 2038 | ||||||||||
Alta XI (b) | Tehachapi, CA | 90 | 90 | 100 | % | Wind | February 2014 | Southern California Edison | 2038 | ||||||||||
| Buffalo Bear | Buffalo, OK | 19 | 19 | 100 | % | Wind | December 2008 | Western Farmers Electric Co-operative | 2033 | ||||||||||
Crosswinds (b) | Ayrshire, IA | 21 | 21 | 99 | % | Wind | June 2007 | Corn Belt Power Cooperative | 2027 | ||||||||||
Elbow Creek (b) | Howard County, TX | 122 | 122 | 100 | % | Wind | December 2008 | NRG Power Marketing LLC | 2022 | ||||||||||
Elkhorn Ridge (b) | Bloomfield, NE | 81 | 54 | 66.7 | % | Wind | March 2009 | Nebraska Public Power District | 2029 | ||||||||||
Forward (b) | Berlin, PA | 29 | 29 | 100 | % | Wind | April 2008 | Constellation NewEnergy, Inc. | 2022 | ||||||||||
Goat Wind (b) | Sterling City, TX | 150 | 150 | 100 | % | Wind | April 2008/June 2009 | Dow Pipeline Company | 2025 | ||||||||||
Hardin (b) | Jefferson, IA | 15 | 15 | 99 | % | Wind | May 2007 | Interstate Power and Light Company | 2027 | ||||||||||
| Laredo Ridge | Petersburg, NE | 80 | 80 | 100 | % | Wind | February 2011 | Nebraska Public Power District | 2031 | ||||||||||
Lookout (b) | Berlin, PA | 38 | 38 | 100 | % | Wind | October 2008 | Southern Maryland Electric Cooperative | 2030 | ||||||||||
Odin (b) | �� | Odin, MN | 20 | 20 | 99.9 | % | Wind | June 2008 | Missouri River Energy Services | 2028 | |||||||||
| Pinnacle | Keyser, WV | 55 | 55 | 100 | % | Wind | December 2011 | Maryland Department of General Services and University System of Maryland | 2031 | ||||||||||
San Juan Mesa (b) | Elida, NM | 120 | 90 | 75 | % | Wind | December 2005 | Southwestern Public Service Company | 2025 | ||||||||||
Sleeping Bear (b) | Woodward, OK | 95 | 95 | 100 | % | Wind | October 2007 | Public Service Company of Oklahoma | 2032 | ||||||||||
| South Trent | Sweetwater, TX | 101 | 101 | 100 | % | Wind | January 2009 | AEP Energy Partners | 2029 | ||||||||||
Spanish Fork (b) | Spanish Fork, UT | 19 | 19 | 100 | % | Wind | July 2008 | PacifiCorp | 2028 | ||||||||||
Spring Canyon II (b) | Logan County, CO | 32 | 29 | 90.1 | % | Wind | October 2014 | Platte River Power Authority | 2039 | ||||||||||
Spring Canyon III(b) | Logan County, CO | 28 | 25 | 90.1 | % | Wind | December 2014 | Platte River Power Authority | 2039 | ||||||||||
| Taloga | Putnam, OK | 130 | 130 | 100 | % | Wind | July 2011 | Oklahoma Gas & Electric | 2031 | ||||||||||
Wildorado (b) | Vega, TX | 161 | 161 | 100 | % | Wind | April 2007 | Southwestern Public Service Company | 2027 | ||||||||||
| Total Wind | 2,263 | 2,200 | |||||||||||||||||
| Thermal Generation | |||||||||||||||||||
| Dover | Dover, DE | 103 | 103 | 100 | % | Natural Gas | June 2013 | NRG Power Marketing LLC | 2018 | ||||||||||
| Paxton Creek Cogen | Harrisburg, PA | 12 | 12 | 100 | % | Natural Gas | November 1986 | Power sold into PJM markets | |||||||||||
| Princeton Hospital | Princeton, NJ | 5 | 5 | 100 | % | Natural Gas | January 2012 | Excess power sold to local utility | |||||||||||
| Tucson Convention Center | Tucson, AZ | 2 | 2 | 100 | % | Natural Gas | January 2003 | Excess power sold to local utility | |||||||||||
| Capacity | |||||||||||||||||||
| Rated MW | Net MW(a) | Owner-ship | PPA Terms | ||||||||||||||||
| Assets | Location | Fuel | COD | Counterparty | Expiration | ||||||||||||||
| University of Bridgeport | Bridgeport, CT | 1 | 1 | 100 | % | Natural Gas | April 2015 | University of Bridgeport | 2034 | ||||||||||
| Total Thermal Generation | 123 | 123 | |||||||||||||||||
Total NRG Yield, Inc. (c) | 6,437 | 5,241 | |||||||||||||||||
| Capacity | ||||||||||||||||||||||||||||||||||||||||||||||||||
| Rated MW | Net MW(a) | Owner-ship | PPA Terms | |||||||||||||||||||||||||||||||||||||||||||||||
| Assets | Location | Fuel | COD | Counterparty | Expiration | |||||||||||||||||||||||||||||||||||||||||||||
| Tucson Convention Center | Tucson, AZ | 2 | 2 | 100 | % | Natural Gas | January 2003 | City of Tucson | 2023 | |||||||||||||||||||||||||||||||||||||||||
| University of Bridgeport | Bridgeport, CT | 1 | 1 | 100 | % | Natural Gas | April 2015 | University of Bridgeport | 2034 | |||||||||||||||||||||||||||||||||||||||||
Total Thermal Generation (e) | 39 | 39 | ||||||||||||||||||||||||||||||||||||||||||||||||
| Total Clearway Energy LLC | 9,093 | 7,726 | ||||||||||||||||||||||||||||||||||||||||||||||||
(a) Net capacity represents the maximum, or rated, generating capacity of the facility multiplied by the Company's percentage ownership in the facility as of December 31, 2017.2021.
(b) Projects are part of tax equity arrangements, as further described in Item 15 —Note 2, Summary of Significant Accounting Policies.
(c) NRG Yield's total generation Rattlesnake has a deliverable capacity of 144 MW.
(d) Black Rock's rated capacity is net115 MW, of 6 MWswhich 70 MW, representing fourteen of the twenty-three wind turbines, became operational as of December 31, 2021. The remaining 45 MW of rated capacity became operational in January 2022.
(e) Includes thermal assets held for noncontrolling interest for Spring Canyon II and III. NRG Yield's generation capacity including this noncontrolling interest was 5,247 MWs.
The following table summarizes the Company's thermal steam and chilled water facilities as of December 31, 2017:2021:
| Name and Location of Facility | Thermal Energy Purchaser | % Owned | Rated Megawatt Thermal Equivalent Capacity (MWt) | Net Megawatt Thermal Equivalent Capacity (MWt) | Generating Capacity | |||||||
| NRG Energy Center Minneapolis, MN | Approx. 100 steam and 55 chilled water customers | 100 | 322 136 | 322 136 | Steam: 1,100 MMBtu/hr. Chilled water: 38,700 tons | |||||||
| NRG Energy Center San Francisco, CA | Approx. 180 steam customers | 100 | 133 | 133 | Steam: 454 MMBtu/hr. | |||||||
| NRG Energy Center Omaha, NE | Approx. 60 steam and 65 chilled water customers | 100 12(a) 100 0(a) | 142 73 77 26 | 142 9 77 0 | Steam: 485 MMBtu/hr Steam: 250 MMBtu/hr Chilled water: 22,000 tons Chilled water: 7,250 tons | |||||||
| NRG Energy Center Harrisburg, PA | Approx. 125 steam and 5 chilled water customers | 100 | 108 13 | 108 13 | Steam: 370 MMBtu/hr. Chilled water: 3,600 tons | |||||||
| NRG Energy Center Phoenix, AZ | Approx. 35 chilled water customers | 24(a) 100 12(a) 0(a) | 5 104 14 28 | 1 104 2 0 | Steam: 17 MMBtu/hr Chilled water: 29,600 tons Chilled water: 3,920 tons Chilled water: 8,000 tons | |||||||
| NRG Energy Center Pittsburgh, PA | Approx. 25 steam and 25 chilled water customers | 100 | 88 49 | 88 49 | Steam: 302 MMBtu/hr. Chilled water: 13,874 tons | |||||||
| NRG Energy Center San Diego, CA | Approx. 20 chilled water customers | 100 | 31 | 31 | Chilled water: 8,825 tons | |||||||
| NRG Energy Center Dover, DE | Kraft Heinz Company; Proctor and Gamble | 100 | 66 | 66 | Steam: 225 MMBtu/hr. | |||||||
| NRG Energy Center Princeton, NJ | Princeton HealthCare System | 100 | 21 17 | 21 17 | Steam: 72 MMBtu/hr. Chilled water: 4,700 tons | |||||||
| Total Generating Capacity (MWt) | 1,453 | 1,319 | ||||||||||
| Name and Location of Facility | Thermal Energy Customers (steam/chilled water) | % Owned | Rated Megawatt Thermal Equivalent Capacity (MWt) | Net Megawatt Thermal Equivalent Capacity (MWt) (a) | Generating Capacity | |||||||||||||||||||||||||||
| Energy Center Minneapolis, MN | 100 steam | 100 | % | 284 | 284 | Steam: 1,075 MMBtu/hr. | ||||||||||||||||||||||||||
| 55 chilled water | 100 | % | 136 | 136 | Chilled water: 38,700 tons | |||||||||||||||||||||||||||
| ECP Uptown Campus, PA | Duquesne University | 100 | % | 53 | 53 | Steam: 181 MMBtu/hr. | ||||||||||||||||||||||||||
| Duquesne University | 100 | % | 24 | 24 | Chilled water: 5,790 tons | |||||||||||||||||||||||||||
| Energy Center San Francisco, CA | 180 steam | 100 | % | 133 | 133 | Steam: 454 MMBtu/hr. | ||||||||||||||||||||||||||
| Energy Center Omaha, NE | 60 steam | 100 | % | 180 | 180 | Steam: 675 MMBtu/hr. | ||||||||||||||||||||||||||
| 65 chilled water | 100 | % | 88 | 88 | Chilled water: 28,000 tons | |||||||||||||||||||||||||||
| Energy Center Harrisburg, PA | 115 steam | 100 | % | 94 | 94 | Steam: 370 MMBtu/hr. | ||||||||||||||||||||||||||
| 5 chilled water | 100 | % | 14 | 14 | Chilled water: 3,900 tons | |||||||||||||||||||||||||||
| Energy Center Phoenix, AZ | 40 chilled water | 73 % (b) | 144 | 104 | Chilled water 41,020 tons | |||||||||||||||||||||||||||
| 24 | % | 5 | 1 | Steam: 17 MMBtu/hr. | ||||||||||||||||||||||||||||
| Energy Center Pittsburgh, PA | 25 steam | 100 | % | 118 | 118 | Steam: 452 MMBtu/hr. | ||||||||||||||||||||||||||
| 30 chilled water | 100 | % | 68 | 68 | Chilled water: 22,224 tons | |||||||||||||||||||||||||||
| Energy Center San Diego, CA | 20 chilled water | 100 | % | 31 | 31 | Chilled water: 9,295 tons | ||||||||||||||||||||||||||
| Energy Center Princeton, NJ | Princeton HealthCare System | 100 | % | 21 | 21 | Steam: 72 MMBtu/hr. | ||||||||||||||||||||||||||
| Princeton HealthCare System | 100 | % | 17 | 17 | Chilled water: 4,700 tons | |||||||||||||||||||||||||||
| Energy Center Caguas, PR | Viatris Pharmaceuticals | 100 | % | 1 | 1 | Steam: 4 MMBtu/hr. | ||||||||||||||||||||||||||
| Viatris Pharmaceuticals | 100 | % | 3 | 3 | Chilled water: 800 tons | |||||||||||||||||||||||||||
Total generating capacity (c) | 1,414 | 1,370 | ||||||||||||||||||||||||||||||
(a)Net megawatt thermal equivalent capacity represents the maximum, or rated, generating capacity of the facility multiplied by the Company's percentage ownership in the facility as of December 31, 2021.
(b) Net MWt capacity excludes 13444 MWt available under the right-to-use provisions contained in agreements between twoone of the Company's thermal facilities and certain of its customers.
36
Item 3 — Legal Proceedings
See Item 15 — Note 14, Commitments and Contingencies, to the Consolidated Financial Statements for discussion of the material legal proceedings to which the Company is a party.party or of which any of its properties is subject.
Item 4 — Mine Safety Disclosures
Not applicable.
37
PART II
Item 5 — Market for Registrant's Common Equity, Related Stockholder Matters and Issuer Purchases of Equity Securities
Market Information and Holders
As of the date of this report, there is no publicly-traded market for the Company's membership units. All of the Company's Class A and Class C units are held by Yield,Clearway, Inc. and all of the Company's Class B and Class D units are held by NRG.CEG.
Distributions
The following table lists the distributions paid on the Company's Class A, Class B, Class C and Class D units during the year ended December 31, 2017:2021:
| Fourth Quarter 2017 | Third Quarter 2017 | Second Quarter 2017 | First Quarter 2016 | Fourth Quarter 2021 | Third Quarter 2021 | Second Quarter 2021 | First Quarter 2021 | |||||||||||||||||||||||||||||||
| Distributions per Class A and Class B unit | $ | 0.288 | $ | 0.28 | $ | 0.27 | $ | 0.260 | Distributions per Class A and Class B unit | $ | 0.3400 | $ | 0.3345 | $ | 0.3290 | $ | 0.3240 | |||||||||||||||||||||
| Distributions per Class C and Class D unit | $ | 0.288 | $ | 0.28 | $ | 0.27 | $ | 0.260 | Distributions per Class C and Class D unit | $ | 0.3400 | $ | 0.3345 | $ | 0.3290 | $ | 0.3240 | |||||||||||||||||||||
On February 15, 2018,17, 2022, the Company declared a quarterly distribution on its Class A, Class B, Class C and Class D units of $0.298$0.3468 per unit payable on March 15, 2018.
2022.
Item 6 — Selected Financial DataReserved
38
Item 7 Management's Discussion and Analysis of Financial Condition and Results of Operations.
| Fiscal year ended December 31, | |||||||||||||||||||
| (In millions) | 2017 | 2016 | 2015 | 2014 | 2013 | ||||||||||||||
| Statement of Income Data: | |||||||||||||||||||
| Operating Revenues | |||||||||||||||||||
| Total operating revenues | $ | 1,009 | $ | 1,035 | $ | 968 | $ | 844 | $ | 451 | |||||||||
| Operating Costs and Expenses | |||||||||||||||||||
| Cost of operations | 326 | 308 | 323 | 279 | 156 | ||||||||||||||
| Depreciation and amortization | 334 | 303 | 303 | 240 | 98 | ||||||||||||||
| Impairment losses | 44 | 185 | 1 | — | — | ||||||||||||||
| General and administrative | 19 | 14 | 10 | 8 | 7 | ||||||||||||||
| Acquisition-related transaction and integration costs | 3 | 1 | 3 | 4 | — | ||||||||||||||
| Total operating costs and expenses | 726 | 811 | 640 | 531 | 261 | ||||||||||||||
| Operating Income | 283 | 224 | 328 | 313 | 190 | ||||||||||||||
| Other Income (Expense) | |||||||||||||||||||
| Equity in earnings of unconsolidated affiliates | 71 | 60 | 31 | 22 | 27 | ||||||||||||||
| Other income, net | 4 | 3 | 3 | 6 | 4 | ||||||||||||||
| Loss on debt extinguishment | (3 | ) | — | (9 | ) | (1 | ) | — | |||||||||||
| Interest expense | (293 | ) | (272 | ) | (258 | ) | (217 | ) | (72 | ) | |||||||||
| Total other expense, net | (221 | ) | (209 | ) | (233 | ) | (190 | ) | (41 | ) | |||||||||
| Income Before Income Taxes | 62 | 15 | 95 | 123 | 149 | ||||||||||||||
| Income tax expense (benefit) | — | — | — | — | (3 | ) | |||||||||||||
| Net Income | 62 | 15 | 95 | $ | 123 | $ | 152 | ||||||||||||
| Less: Net (loss) income attributable to noncontrolling interests | (75 | ) | (111 | ) | (62 | ) | 9 | — | |||||||||||
| Net Income Attributable to NRG Yield LLC | $ | 137 | $ | 126 | $ | 157 | $ | 114 | $ | 152 | |||||||||
| Other Financial Data: | |||||||||||||||||||
| Capital expenditures | $ | 31 | $ | 20 | $ | 29 | $ | 79 | $ | 790 | |||||||||
| Cash Flow Data: | |||||||||||||||||||
| Net cash provided by (used in): | |||||||||||||||||||
| Operating activities | $ | 516 | $ | 577 | $ | 424 | $ | 363 | $ | 174 | |||||||||
| Investing activities | (283 | ) | (131 | ) | (1,098 | ) | (760 | ) | (987 | ) | |||||||||
| Financing activities | (416 | ) | (202 | ) | 354 | 767 | 853 | ||||||||||||
| Balance Sheet Data (at period end): | |||||||||||||||||||
| Cash and cash equivalents | $ | 146 | $ | 321 | $ | 110 | $ | 430 | $ | 60 | |||||||||
| Property, plant and equipment, net | 5,204 | 5,554 | 5,980 | 6,119 | 3,488 | ||||||||||||||
| Total assets | 8,154 | 8,746 | 8,759 | 8,930 | 4,831 | ||||||||||||||
| Long-term debt, including current maturities | 5,845 | 6,069 | 5,692 | 5,828 | 2,916 | ||||||||||||||
| Total liabilities | 6,146 | 6,382 | 6,054 | 6,173 | 3,221 | ||||||||||||||
| Total members' equity | 2,008 | 2,364 | 2,705 | 2,757 | 1,610 | ||||||||||||||
As you read this discussion and analysis, refer to the Company's Consolidated Statements of Operations to this Form 10-K, which present the results of operations for the years ended December 31, 2017, 2016 and 2015.10-K. Also refer to Item 1 — Businessand Item 1A — Risk Factors, which include detailed discussions of various items impacting the Company's business, results of operations and financial condition. Discussions of the year ended December 31, 2019 that are not included in this Annual Report on Form 10-K and year-to-year comparisons of the year ended December 31, 2020 and the year ended December 31, 2019 can be found in “Management’s Discussion and Analysis of Financial Condition and the Results of Operations” in Part II, Item 7 of the Company’s Annual Report on Form 10-K for the year ended December 31, 2020.
The discussion and analysis below has been organized as follows:
•Executive Summary, including a description of the business and significant events that are important to understanding the results of operations and financial condition;
•Results of operations, including an explanation of significant differences between the periods in the specific line items of the consolidated statements of operations;
•Financial condition addressing liquidity position, sources and uses of cash, capital resources and requirements, commitments, and off-balance sheet arrangements;
•Known trends that may affect the Company’s results of operations and financial condition in the future; and
•Critical accounting policies which are most important to both the portrayal of the Company's financial condition and results of operations, and which require management's most difficult, subjective or complex judgment.
39
Executive Summary
Introduction and Overview
Clearway Energy LLC, together with its consolidated subsidiaries, or the Company, is an energy infrastructure investor in and owner of modern, sustainable and long-term contracted assets across North America. The Company is a dividend growth-orientedsponsored by GIP through GIP's portfolio company, Clearway Energy Group LLC, or CEG. GIP is an independent infrastructure fund manager that has historically served as the primary vehicle through which NRG owns, operatesmakes equity and acquires contracted renewabledebt investments in infrastructure assets and conventional generation and thermal infrastructure assets. businesses.
The Company believes it is well positioned to be a premier company for investors seeking stable and growing distribution income from a diversified portfolioone of lower-risk high-quality assets.
Significant Events
•On February 6, 2018, Global Infrastructure Partners, or GIP,October 22, 2021, Clearway Energy Operating LLC entered into a purchase and salebinding agreement with NRG, orto sell the NRG Transaction,Thermal Business to KKR for the acquisitiontotal consideration of NRG’s full ownership interest in NRG Yield, Inc. and NRG’s renewable energy development and operations platform. The NRG Transaction is$1.9 billion, subject to certaincustomary closing conditions, including customary legal and regulatory approvals. Theadjustments, which is referred to herein as the Thermal Disposition. Based on current estimates, the Company expects total net cash proceeds of approximately $1.35 billion after the NRG Transactionassumption of project level debt, estimated taxes and obligations owed, transaction expenses and capital expenditures required to close inbe funded pursuant to the second half of 2018.
Corporate Level Financing
•On November 30, 2021, Clearway Energy Operating LLC entered into a senior secured bridge credit agreement, or the Bridge Loan Agreement, that provides for a term loan facility in an aggregate principal amount of $335 million. The Bridge Loan Agreement will mature no later than November 29, 2022. The Company intends to use proceeds from the Thermal Disposition to repay the outstanding principal balance of the term loans under the Bridge Loan Agreement. The borrowings under the term loan facility were used to acquire the Utah Solar Portfolio on December 1, 2021, as described below.
•On November 30, 2021, Clearway Energy Operating LLC entered into the Sixth Amendment to Amended and Restated Credit Agreement to provide for an increase of the maximum permitted Borrower Leverage Ratio to 6.00 to 1.00 during the period commencing on November 30, 2021 and ending on the leverage period termination date, which is the earliest of (i) two business days following the consummation of the Thermal Disposition, (ii) 120 days following the termination or expiration of the binding agreement entered into with KKR to sell the Thermal Business and (iii) the maturity date of the Bridge Loan Agreement. The Sixth Amendment also permits the incurrence of the term loan facility under the Bridge Loan Agreement, permits the incurrence of hedging obligations, permits the prepayment of indebtedness and implements certain other technical modifications.
•On October 1, 2021, Clearway Energy Operating LLC completed the sale of $350 million of senior unsecured notes due 2032, or the 2032 Senior Notes. The 2032 Senior Notes bear interest at 3.750% and mature on January 15, 2032. The net proceeds from the 2032 Senior Notes were used, together with existing corporate liquidity, to repurchase the 2026 Senior Notes, as described below.
•In October 2021, the Company repurchased and redeemed an aggregate principal amount of $350 million of the 2026 Senior Notes, through the cash tender offer announced on September 24, 2021 and the redemption of the remaining amount on October 25, 2021. The repurchases and redemption were effectuated at a premium of approximately 103% for total consideration of $359 million.
•On March 9, 2021, Clearway Energy Operating LLC completed the sale of $925 million of senior unsecured notes due 2031, or the 2031 Senior Notes. The 2031 Senior Notes bear interest at 3.750% and mature on February 15, 2031. The net proceeds from the 2031 Senior Notes were used to repurchase the 2025 Senior Notes, as described below, as well as to repay amounts outstanding under the Company’s revolving credit facility and for general corporate purposes.
40
•In March 2021, the Company repurchased and redeemed an aggregate principal amount of $600 million of the 2025 Senior Notes, through the cash tender offer announced on March 2, 2021 and the redemption of the remaining amount on March 17, 2021. The repurchases and redemption were effectuated at a premium of approximately 106% for total consideration of $636 million.
Project-Level Financing Activities
•On March 10, 2021, the Company entered into a financing agreement for non-recourse debt for a total commitment of $126 million related to the Consolidated Financial Statements,repowering of the Pinnacle wind project. The debt consists of a construction loan at an interest rate of LIBOR plus 1.00%. The Company's initial borrowings of $79 million were utilized to repay $53 million of the outstanding balance under the Tapestry financing agreement, which related to the Pinnacle wind project, and to reimburse Clearway Renew LLC for previous contributions and pay vendor invoices and fees. On December 15, 2021, the Company repaid the outstanding principal amount of $117 million utilizing existing corporate liquidity, along with proceeds from tax equity.
Third- Party Acquisitions
•On December 1, 2021, the Company acquired the following:
