Washington, D.C. 20549
None.
TABLE OF CONTENTS
Index
| | | | | |
| |
| GLOSSARY OF TERMS | |
| PART I | |
| Item 1 — Business | |
| Item 1A — Risk Factors | |
| Item 1B — Unresolved Staff Comments | |
| Item 1C — Cybersecurity | |
| Item 2 — Properties | |
| Item 3 — Legal Proceedings | |
| Item 4 — Mine Safety Disclosures | |
| PART II | |
Item 5 — Market for Registrant'sRegistrant’s Common Equity, Related Stockholder Matters and Issuer Purchases of Equity Securities | |
Item 6 — Selected Financial DataReserved | |
Item 7 — Management'sManagement’s Discussion and Analysis of Financial Condition and Results of Operations | |
| Item 7A — Quantitative and Qualitative Disclosures About Market Risk | |
| Item 8 — Financial Statements and Supplementary Data | |
Item 9 — Changes in and Disagreements Withwith Accountants on Accounting and Financial Disclosure | |
| Item 9A — Controls and Procedures | |
| Item 9B — Other Information | |
| PART III | |
| Item 10 — Information about Directors, Executive Officers and Corporate Governance | |
| Item 11 — Executive Compensation | |
| Item 12 — Security Ownership of Certain Beneficial Owners and Management and Related Stockholder Matters | |
| Item 13 — Certain Relationships and Related Transactions, and Director Independence | |
| Item 14 — Principal Accounting Fees and Services | |
| PART IV | |
| Item 15 — Exhibits, Financial Statement Schedules | |
| EXHIBIT INDEX | |
| Item 16 — Form 10-K Summary | |
GLOSSARY OF TERMS
When the following terms and abbreviations appear in the text of this report, they have the meanings indicated below:
| | | | | |
| | |
2019 Convertible2028 Senior Notes | | Yield, Inc.'s $345$850 million aggregate principal amount of 3.50% Convertible Notes4.75% unsecured senior notes due 20192028, issued by Clearway Energy Operating LLC |
2020 Convertible2031 Senior Notes | | Yield, Inc.'s $287.5$925 million aggregate principal amount of 3.25% Convertible Notes due 2020 |
2024 Senior Notes | | $500 million aggregate principal amount of 5.375%3.75% unsecured senior notes due 2024,2031, issued by NRG YieldClearway Energy Operating LLC |
20262032 Senior Notes | | $350 million aggregate principal amount of 5.00%3.75% unsecured senior notes due 2026,2032, issued by NRG YieldClearway Energy Operating LLC |
Alta TE HoldcoAdjusted EBITDA | | Alta Wind X-XI TE Holdco LLCA non-GAAP measure, represents earnings before interest (including loss on debt extinguishment), tax, depreciation and amortization adjusted for mark-to-market gains or losses, asset write offs and impairments; and factors which the Company does not consider indicative of future operating performance |
Alta Wind PortfolioARO | | Seven wind facilities that total 947 MW located in Tehachapi, California and a portfolio of associated land leases |
AOCL | | Accumulated Other Comprehensive Loss |
ARO | | Asset Retirement Obligation |
| ARRA | American Recovery and Reinvestment Act of 2009 |
| ASC | | The FASB Accounting Standards Codification, which the FASB established as the source of authoritative GAAP |
| ASU | | Accounting Standards Updates – updates to the ASC |
| ATM Program | | At-The-Market Equity Offering Program |
August 2017 Drop Down AssetsBESS | | The remaining 25% interest in NRG Wind TE Holdco, an 814 net MW portfolio of twelve wind projects, acquired from NRG on August 1, 2017Battery energy storage system |
Buckthorn SolarBlackRock | | The 154 MW Buckthorn Solar projectBlackRock, Inc. |
Buffalo BearBlack Start | | Buffalo Bear, LLC,The capability of a generating asset to restore the operating subsidiarygrid in the event of Tapestry Wind LLC, which ownsa blackout without relying on the Buffalo Bear projectexternal electric power transmission network |
CAABridge Loan Agreement | | Clean Air ActSenior secured bridge credit agreement entered into by Clearway Energy Operating LLC that provides a term loan facility in an aggregate principal amount of $335 million that was repaid on May 3, 2022 |
| CAFD | | A non-GAAP measure, Cash Available Forfor Distribution which the Company definesis defined as net income before interest expense, income taxes, depreciation and amortization,of December 31, 2023 as Adjusted EBITDA plus cash distributionsdistributions/return of investment from unconsolidated affiliates, cash receipts from notes receivable, cash contributions from noncontrolling interests, adjustments to reflect sales-type lease cash payments and payments for lease expenses, less cash distributions to noncontrolling interests, maintenance capital expenditures, pro-rata Adjusted EBITDA from unconsolidated affiliates, cash interest paid, income taxes paid, principal amortization of indebtedness, and changes in prepaid and accrued capacity payments, and adjusted for development expenses |
CarlsbadCapistrano Wind Portfolio | | The Carlsbad Energy Center, a 527Five wind projects representing 413 MW natural gas fired projectof capacity, which includes Broken Bow and Crofton Bluffs located in Carlsbad, CA
Nebraska, Cedro Hill located in Texas and Mountain Wind 1 and 2 located in Wyoming |
CfDCEG | | Contract for DifferencesClearway Energy Group LLC (formerly Zephyr Renewables LLC) |
CFTCCEG Master Services Agreement | | U.S. Commodity Future Trading CommissionAmended and Restated Master Services Agreements, dated as of February 2, 2023, among the Company, Clearway Energy, Inc., Clearway Energy Operating LLC and CEG |
CODClearway, Inc. | Clearway Energy, Inc., the holder of the Company’s Class A and Class C units |
| Clearway Energy Group LLC | The holder of all shares of Clearway, Inc.’s Class B and Class D common stock and the Company’s Class B and Class D units and, from time to time, possibly shares of Clearway, Inc.’s Class A and/or Class C common stock |
| Clearway Energy Operating LLC | The holder of the project assets that are owned by the Company |
| Clearway Renew | Clearway Renew LLC, a subsidiary of CEG, and its wholly-owned subsidiaries |
| COD | Commercial Operation Date |
| Code | | Internal Revenue Code of 1986, as amended |
| Company | | NRG YieldClearway Energy LLC, together with its consolidated subsidiaries |
| CVSR | | California Valley Solar Ranch |
CVSR Drop Down | | The Company's acquisition from NRG of the remaining 51.05% interest of CVSR Holdco |
CVSR Holdco | | CVSR Holdco LLC, the indirect owner of CVSR |
DGPV Holdco 1 | | NRG DGPV Holdco 1 LLC |
DGPV Holdco 2 | | NRG DGPV Holdco 2 LLC |
DGPV Holdco 3 | | NRG DGPV Holdco 3 LLC |
Distributed Solar
| | Solar power projects, typically less than 20 MW in size (on an alternating current, or AC, basis), that primarily sell power produced to customers for usage on site, or are interconnected to sell power into the local distribution grid |
| Drop Down Assets | | Collectively,Assets under common control acquired by the June 2014 Drop Down Assets, January 2015 Drop Down Assets, November 2015 Drop Down Assets, CVSR Drop Down, March 2017 Drop Down Assets, August 2017 Drop Down Assets and November 2017 Drop Down Assets |
Economic Gross Margin | | Energy and capacity revenue, less cost of fuels |
EDA | | Equity Distribution Agreement |
EGU | | Electric Utility Generating UnitCompany from CEG |
| | | | | |
| EPA | United States Environmental Protection Agency |
ERCOT
| | |
El Segundo | | NRG West Holdings LLC, the subsidiary of Natural Gas Repowering LLC, which owns the El Segundo Energy Center project |
EPC | | Engineering, Procurement and Construction |
ERCOT
| | Electric Reliability Council of Texas, the ISO and the regional reliability coordinator of the various electricity systems within Texas |
| EWG | | Exempt Wholesale Generator |
| Exchange Act | | The Securities Exchange Act of 1934, as amended |
| FASB | | Financial Accounting Standards Board |
| FERC | | Federal Energy Regulatory Commission |
| FPA | | Federal Power Act |
GAAPFWS | U.S. Fish & Wildlife Service |
| GAAP | Accounting principles generally accepted in the U.S. |
| GenConn | | GenConn Energy LLC |
| GHG | | Greenhouse gas |
GIPGIM | Global Infrastructure Management, LLC, the manager of GIP |
| GIP | Global Infrastructure Partners |
GWHLBV | | Gigawatt |
HLBV | | Hypothetical Liquidation at Book Value |
IASBIRA | | International Accounting Standards BoardInflation Reduction Act of 2022 |
| IRS | | Internal Revenue Service |
| ISO | | Independent System Operator, also referred to as Regional Transmission Organization, oran RTO |
| ITC | | Investment Tax Credit |
January 2015 Drop Down AssetsKKR | | The Laredo Ridge, Tapestry and Walnut Creek projects, which were acquired by Yield OperatingKKR Thor Bidco, LLC, from NRG on January 2, 2015an affiliate of Kohlberg Kravis Roberts & Co. L.P. |
June 2014 Drop Down AssetskWh | | The TA High Desert, Kansas South and El Segundo projects, which were acquired by Yield Operating LLC from NRG on June 30, 2014Kilowatt Hour |
Kansas SouthLIBOR | | NRG Solar Kansas South LLC, the operating subsidiary of NRG Solar Kansas South Holdings LLC, which owns the Kansas South project |
KPPH | | 1,000 Pounds Per Hour |
Laredo Ridge | | Laredo Ridge Wind, LLC, the operating subsidiary of Mission Wind Laredo, LLC, which owns the Laredo Ridge project |
LIBOR | | London Inter-Bank Offered Rate |
| Management Services Agreement |
| MBTA | | Agreement between NRG and the Company for various operational, management and administrative servicesMigratory Bird Treaty Act |
March 2017 Drop Down AssetsMesquite Star | | (i) Agua Caliente Borrower 2Mesquite Star Special, LLC which owns a 16% interest (approximately 31% of NRG's 51% interest) in the Agua Caliente solar farm and (ii) NRG's 100% ownership in the Class A equity interests in the Utah Solar Portfolio (defined below), both acquired by the Company on March 27, 2017 |
Marsh LandingMMBtu | | NRG Marsh Landing LLC, formerly GenOn Marsh Landing LLC |
May 9, 2017 Form 8-K | | NRG Yield, Inc.'s Current Report on Form 8-K filed with the SEC on May 9, 2017 in connection with NRG Yield Operating LLC's acquisition of the March 2017 Drop Down Assets |
MMBtu | | Million British Thermal Units |
MWMt. Storm | | MegawattNedPower Mount Storm LLC |
MWhMW | Megawatt |
| MWh | Saleable megawatt hours, net of internal/parasitic load megawatt-hours |
| MWt | | Megawatts Thermal Equivalent |
NECPNEPA | | NRG Energy Center Pittsburgh LLCNational Environmental Policy Act |
| NERC | | North American Electric Reliability Corporation |
| Net Exposure | | Counterparty credit exposure to NRG Yield, Inc.Clearway Energy LLC, net of collateral |
| November 2015 Drop Down Assets | 75% of the Class B interests of NRG Wind TE Holdco, which owns a portfolio of 12 wind facilities totaling 814 net MW, which was acquired by Yield Operating LLC from NRG on November 3, 2015 |
|
| NOLs | | |
November 2017 Drop Down Assets | | 38 MW portfolio of distributed and small utility-scale solar assets, primarily comprised of assets from NRG's Solar Power Partners (SPP) funds, in addition to other projects developed since the acquisition of SPP by NRG, which was acquired by NRG YieldNet Operating LLC from NRG on November 1, 2017Losses |
NOx | | Nitrogen Oxides |
| NPNS | | Normal Purchases and Normal Sales |
| NRG | | NRG Energy, Inc. |
NRG Power MarketingOCI/OCL | | NRG Power Marketing LLC |
NRG ROFO Agreement | | Second Amended and Restated Right of First Offer Agreement between the Company and NRG |
NRG Transaction | | On February 6, 2018, GIP entered into a purchase and sale agreement with NRG for the acquisition of NRG's full ownership interest in Yield, Inc., and NRG's renewable energy development and operations platform. GIP, NRG and the Company also entered into a consent and indemnity agreement in connection with the purchase and sale agreement.
|
NRG Transformation Plan | | A three-year, three-part improvement plan announced by NRG on July 12, 2017, which includes exploring strategic alternatives for NRG's renewables platform and its interest in the Company |
NRG Wind TE Holdco | | NRG Wind TE Holdco LLC |
OCI/OCL | | Other comprehensive income/loss |
| O&M | | Operations and Maintenance |
OSHAPG&E | | Occupational SafetyPacific Gas and Health AdministrationElectric Company |
| PG&E | Pacific Gas & Electric Company |
PinnaclePJM | | Pinnacle Wind, LLC, the operating subsidiary of Tapestry Wind LLC, which owns the Pinnacle project |
PJM | | PJM Interconnection, LLC |
| PPA | | Power Purchase Agreement |
| PTC | | Production Tax Credit |
| PUCT | | Public Utility Commission of Texas |
| PUHCA | | Public Utility Holding Company Act of 2005 |
| PURPA | | Public Utility Regulatory Policies Act of 1978 |
| QF | | Qualifying Facility under PURPA |
RECRA | Resource adequacy |
| | | | | |
| RENOM | Clearway Renewable Energy CertificateOperation & Maintenance LLC, a wholly-owned subsidiary of CEG |
RecapitalizationRosie Central BESS | | The adoption of the Company's Second Amended and Restated Certificate of Incorporation which authorized two new classes of common stock, Class C common stock and Class D common stock, and distributed shares of such new classes of common stock to holders of the Company’s outstanding Class A common stock and Class B common stock, respectively, through a stock split on May 14, 2015 Rosie BESS Devco LLC |
| ROFO Assets | Specified assets subject to sale, as described in the NRG ROFO Agreement |
RPMRPS | | Reliability Pricing Model |
RPS | | Renewable Portfolio Standards |
RPV HoldcoRTO | | NRG RPV Holdco 1 LLC |
RTO | | Regional Transmission Organization |
| SCE | | Southern California Edison |
| SEC | | U.S. Securities and Exchange Commission |
| Senior Notes | | Collectively, the 20242028 Senior Notes, the 2031 Senior Notes and the 20262032 Senior Notes |
SO2 | | Sulfur Dioxide |
SPPSOFR | Secured Overnight Financing Rate |
| SPP | Solar Power Partners |
TA High DesertSREC | | TA-High Desert LLC, the operating subsidiary of NRG Solar Mayfair LLC, which owns the TA High Desert projectRenewable Energy Credit |
| Taloga | Taloga Wind, LLC, the operating subsidiary of Tapestry Wind LLC, which owns the Taloga project |
Tapestry | | Collection of the Pinnacle, Buffalo Bear and Taloga projects |
|
| | |
Tax Act | | Tax Cuts and Jobs Act of 2017 |
| Thermal Business | | The Company'sCompany’s thermal business, which consistsconsisted of thermal infrastructure assets that provideprovided steam, hot water and/or chilled water, and in some instances electricity, to commercial businesses, universities, hospitals and governmental units |
UPMCThermal Disposition | | UniversityThe Company’s sale of Pittsburgh Medical Center100% of its interests in the Thermal Business to KKR, which was completed on May 1, 2022 |
U.S.TotalEnergies | TotalEnergies SE |
| U.S. | United States of America |
U.S. DOE | | U.S. Department of Energy |
| Utah Solar Portfolio | | Collection consistsSeven utility-scale solar farms located in Utah, representing 530 MW of Four Brothers Solar, LLC, Granite Mountain Holdings, LLC, and Iron Springs Holdings, LLC, which are equity investments owned by Four Brothers Holdings, LLC, Granite Mountain Renewables, LLC, and Iron Springs Renewables, LLC, respectively, and are part of the March 2017 Drop Down Assets acquisition that closed on March 27, 2017capacity |
Utility Scale Solar
| | Solar power projects, typically 20 MW or greater in size (on an alternating current, or AC, basis), that are interconnected into the transmission or distribution grid to sell power at a wholesale level |
VaRVIE | | Value at Risk |
VIE | | Variable Interest Entity |
| Walnut Creek | NRG Walnut Creek, LLC, the operating subsidiary of WCEP Holdings, LLC, which owns the Walnut Creek project |
Yield, Inc. | | NRG Yield, Inc. |
Yield Operating LLC | | NRG Yield Operating LLC, the holding company that owns the project companies and is a wholly owned subsidiary of NRG Yield LLC |
PART I
Item 1 — Business
General
NRG YieldClearway Energy LLC, together with its consolidated subsidiaries, or the Company, is an energy infrastructure investor with a focus on investments in clean energy and owner of modern, sustainable and long-term contracted assets across North America. The Company was formed as a Delaware limited liability company on March 5, 2013 to serve as2013. The Company is sponsored by GIP and TotalEnergies through the primary vehicle throughportfolio company, Clearway Energy Group LLC, or CEG, which NRG owns, operatesis equally owned by GIP and acquires contractedTotalEnergies. GIP is an independent infrastructure fund manager that makes equity and debt investments in infrastructure assets and businesses. TotalEnergies is a global multi-energy company. CEG is a leading developer of renewable and conventional generation and thermalenergy infrastructure assets.in the U.S. On February 6, 2018, Global Infrastructure Partners, or GIP,January 12, 2024, BlackRock entered into a purchasedefinitive agreement to acquire 100% of the business and sale agreement with NRG, orassets of GIM, which is the NRG Transaction, forinvestment manager of the acquisition of NRG’s full ownershipGIP funds that own an interest in NRG Yield, Inc.CEG. BlackRock has indicated that the transaction is expected to close in the third quarter of 2024, subject to regulatory approvals and NRG’sother customary closing conditions. BlackRock is a publicly-traded global investment management firm.
The Company is one of the largest renewable energy development and operations platform. The Company believes it is well positioned to be a premier company for investors seeking stable and growing dividend income from a diversified portfolio of lower-risk, high-quality assets.
The Company owns a diversified portfolio of contracted renewable and conventional generation and thermal infrastructure assetsowners in the U.S. with approximately 6,000 net MW of installed wind, solar and energy storage projects. The Company’s contracted generation portfolio collectively represents 5,118approximately 8,500 net MW as of December 31, 2017. Nearly allassets also includes approximately 2,500 net MW of environmentally-sound, highly efficient natural gas-fired generation facilities. Through this environmentally-sound, diversified and primarily contracted portfolio, the Company endeavors to increase distributions to its unit holders. The majority of the Company’s revenues are derived from long-term contractual arrangements for the output or capacity from these assets sell substantially all of its output pursuant to long-term offtake agreements with creditworthy counterparties.assets. The weighted average remaining contract duration of these offtake agreements was approximately 1510 years as of December 31, 2017,2023 based on CAFD. The Company also owns thermal infrastructure assets with an aggregate steam and chilled water capacity of 1,319 net MWt and electric generation capacity of 123 net MW. These thermal infrastructure assets provide steam, hot and/or chilled water, and, in some instances, electricity, to commercial businesses, universities, hospitals and governmental units in multiple locations, principally through long-term contracts or pursuant to rates regulated by state utility commissions.
A complete listing of the Company'sCompany’s interests in facilities, operations and/or projects owned or leased as of December 31, 20172023 can be found in Item 2 —Properties.
History
On July 22, 2013, Yield, Inc. closed the initial public offering of 22,511,250 shares of its Class A common stock for net proceeds, after deducting underwriting discounts, of $468 million, of which Yield, Inc. used $395 million to purchase 19,011,250 of the Company's Class A units from NRG and $73 million to purchase 3,500,000 of the Company's Class A units directly from the Company. On July 29, 2014, Yield, Inc. issued 12,075,000 shares of Class A common stock for net proceeds, after underwriting discounts and expenses, of $630 million and utilized the proceeds of the offering to acquire 12,075,000 additional Class A units of the Company.
Effective May 14, 2015, Yield, Inc. amended its certificate of incorporation to create two new classes of capital stock, Class C common stock and Class D common stock, and distributed shares of the Class C common stock and Class D common stock to holders of Yield, Inc.'s outstanding Class A common stock and Class B common stock, respectively, through a stock split. The stock split is referred to as the Recapitalization. Contemporaneously with Yield, Inc.’s Recapitalization, each Class A unit of the Company was automatically reclassified into one Class A unit and one Class C unit and each Class B unit of the Company was automatically reclassified into one Class B unit and one Class D unit. On June 29, 2015, Yield, Inc. issued 28,198,000 shares of Class C common stock for net proceeds of $599 million and utilized the proceeds of the offering to acquire 28,198,000 Class C units of the Company.
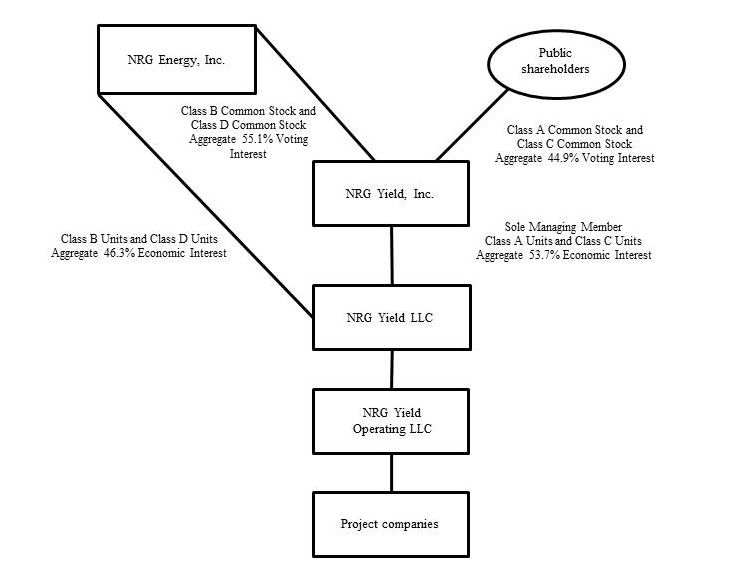
As of December 31, 2017, NRG owned 42,738,750 of each of the Company's Class B units and Class D units and Yield, Inc. owned 34,586,250 of the Company's Class A units and 64,717,087 of the Company's Class C units. Yield, Inc., through its holdings of Class A units and Class C units, has a 53.7% economic interest in the Company. Yield, Inc. consolidates the results of the Company through its controlling interest as sole managing member. NRG, through its holdings of Class B units and Class D units, has a 46.3% economic interest in the Company.
The Company is a holding company for the companies that directly and indirectly own and operate Yield,Clearway Energy, Inc.'s’s, or Clearway, Inc., business. As of December 31, 2017, NRG continues to control Yield,CEG controls Clearway, Inc., and Yield,Clearway, Inc. in turn, as the sole managing member of the Company, controls the Company and its subsidiaries. Clearway, Inc. consolidates the results of the Company through its controlling interest, with CEG’s interest shown as contributed capital in the Company’s consolidated financial statements. The holders of Clearway, Inc.’s outstanding shares of Class A and Class C common stock are entitled to dividends as declared. CEG receives its distributions from the Company through its ownership of the Company’s Class B and Class D units. From time to time, CEG may also hold shares of Clearway Inc’s Class A and/or Class C common stock.
As of December 31, 2023, CEG owned 42,738,750 of the Company’s Class B units and 42,336,750 of the Company’s Class D units, while Clearway, Inc. owned 34,613,853 of the Company’s Class A units and 82,391,441 of the Company’s Class C units. Clearway, Inc., through its holdings of Class A units and Class C units, owned a 57.90% economic interest in the Company as of December 31, 2023. Additionally, CEG, through its holdings of Class B units and Class D units, owned a 42.10% economic interest in the Company as of December 31, 2023.
The diagram below depictsrepresents a summarized structure of the Company’s organizational structureCompany as of December 31, 2017:2023:
Strategic Sponsorship with Global Infrastructure Partners
On February 6, 2018, Global Infrastructure Partners, or GIP, entered into a purchase and sale agreement with NRG, or the NRG Transaction, for the acquisition of NRG’s full ownership interest in NRG Yield, Inc. and NRG’s renewable energy development and operations platform. The NRG Transaction is subject to certain closing conditions, including customary legal and regulatory approvals. The Company expects the NRG Transaction to close in the second half of 2018.
In connection with the NRG Transaction, the Company entered into a Consent and Indemnity Agreement with NRG and GIP setting forth key terms and conditions of the Company's consent to the NRG Transaction. Key provisions of the Consent and Indemnity Agreement include:
Minimized impact to CAFD from potential change in control costs — No more than $10 million in reduced annual CAFD on a recurring basis that would result from changes in the Company's cost structure or any impact from various consents.
Enhanced ROFO pipeline — Upon closing, the Company will enter into a new ROFO agreement with GIP that adds 550 MW to the current pipeline through the operational 150 MW Langford Wind project and the 400 MW Mesquite Star Wind project which is under development. The NRG ROFO Agreement will be amended to remove the Ivanpah solar facility.
Financial cooperation and support — GIP has arranged a $1.5 billion backstop credit facility to manage any change of control costs associated with the Company's corporate debt. GIP has also committed to provide up to $400 million in financial support, if necessary, for the purchase of the Carlsbad Energy Center.
Voting and Governance Agreement — As part of the NRG Transaction, the parties have agreed to enter into a voting and governance agreement, which would provide that:
the Chief Executive Officer of Yield, Inc. will at all times be a full-time Yield, Inc. employee appointed by the Board of Directors, or the Board, of Yield, Inc.;
the parties thereto will use their commercially reasonable efforts to submit to Yield, Inc.’s stockholders at Yield, Inc.'s 2019 Annual Meeting of Stockholders a charter amendment to classify the Board into two classes (with the independent directors and directors designated by an affiliate of GIP allocated across the two classes); and
the Board will be expanded to nine members at the closing of the NRG Transaction, comprised at that date of five directors designated by GIP, three independent directors and Yield, Inc.’s Chief Executive Officer.
Business Strategy
The Company'sCompany’s primary business strategy is to focus on the acquisition and ownership of assets with predictable, long-term cash flows in order that it may be able to increase the cash distributions to Yield,Clearway, Inc. and NRG over time without compromising the ongoing stability of the business.
The Company'sCompany’s plan for executing thisits business strategy includes the following key components:
Focus on contracted renewable energy and conventional generation and thermal infrastructure assets. generation. The Company owns and operates utility scale and distributed renewable energy and natural gas-fired generation thermal and other infrastructureassets, as well as energy storage assets, with proven technologies, generally low operating risks and stable cash flows. The Company believes by focusing on this core asset class and leveraging its industry knowledge, it will maximize its strategic opportunities, be a leader in operational efficiency and maximize its overall financial performance.
Growing the business through acquisitions of contracted operating assets. The Company believes that its base of operations and relationship with NRG provideprovides a platform in the conventional and renewable power generation and thermal sectors for strategic growth through cash accretive and tax advantaged acquisitions complementary to its existing portfolio. In addition to acquiring renewable generation conventional generation and thermal infrastructure assetsfacilities from third parties where the Company believes its knowledge of the market and operating expertise provides it with a competitive advantage, the Company entered into a Right of First Offer Agreement with NRG, or the NRG ROFO Agreement. Under the NRG ROFO Agreement, NRG has grantedmay consummate future acquisitions from CEG. The Company believes that CEG’s project development expertise provides the Company access to a development platform with an extensive pipeline of potential renewable energy and its affiliates a right of first offer on any proposed sale, transfer or other disposition of certain assets of NRG until February 24, 2022. NRG is not obligatedenergy storage projects that are aligned to sellsupport the remaining NRG ROFO Assets to theCompany’s growth. The Company and if offeredCEG work collaboratively in considering new assets to be acquired by NRG, the Company cannot be sure whether these assets will be offered on acceptable terms, or that the Company will choose to consummate such acquisitions.Company. The assets listed in the table below represent the NRG ROFO Assets: |
| | | | | | |
| Asset | | Fuel Type | | Rated Capacity
(MW)(a) | | COD |
| Agua Caliente | | Solar | | 102 | | 2014 |
| Ivanpah | | Solar | | 196 | | 2013 |
Hawaii(b) | | Solar | | 80 | | 2019 |
Distributed Solar (up to $190 million of equity in distributed solar generation portfolio(s)(b) | | Solar | | various | | various |
Buckthorn Solar(c) | | Solar | | 154 | | 2018 |
Carlsbad (d) | | Conventional | | 527 | | 2018 |
Puente/Mandalay(e) | | Conventional | | Project not expected to move forward |
| Community | | Wind | | Sold to third party |
| Jeffers | | Wind | | Sold to third party |
| Minnesota Portfolio | | Wind | | Sold to third party |
| | | | | | | | | | | | | | | | | | | | | | | | | | |
| Asset | | Technology | | Gross Capacity (MW) | | State | | Estimated COD |
| Cedar Creek | | Wind | | 160 | | ID | | 1H24 |
| Cedro Hill Repowering | | Wind | | 160 | | TX | | 2H24 |
| | | | | | | | |
Texas Solar Nova 2 (a) | | Solar | | 200 | | TX | | 1H24 |
(a) Represents the maximum, or rated, electricity generating capacity of the facilityIncluded in MW multiplied by NRG's percentage ownership interest in the facility as of December 31, 2017.a co-investment partnership.
(b) Hawaii and Distributed Solar are part of the NRG ROFO Agreement. These are not expected to be offered by NRG prior to consummation of the NRG Transaction and, at that time, would become part of a new ROFO Agreement with GIP.
(c) The transaction is expected to close in the first quarter of 2018.
(d) The transaction is expected to close in the fourth quarter of 2018 and is contingent upon the consummation of the NRG Transaction. Reflects capacity per the Power Purchase & Tolling Agreement with San Diego Gas & Electric; actual tested capacity is expected to be 530 MW.
(e) On November 3, 2017, the California Energy Commission suspended the permitting process for the Puente Power Project after two commissioners issued a statement stating their intention to deny the permit. If the CEC formally denies a permit for the Puente Power Project, then the project will not move forward.
Upon closing of the NRG Transaction, the Company will enter into a new ROFO agreement with GIP that adds 550 MW to the current pipeline through the operational 150 MW Langford Wind project and the 400 MW Mesquite Star Wind project which is under development. The NRG ROFO Agreement will be amended to remove the Ivanpah solar facility.
Primary focus on North America.The Company intends to primarily focus its investments in North America (including the unincorporated territories of the U.S.).America. The Company believes that industry fundamentals in North America present it with significant opportunity to acquire renewable, natural gas-fired generation and thermal infrastructure assets,grow its portfolio without creating significant exposure to currency and sovereign risk. By primarily focusing its efforts on North America, the Company believes it will best leverage its regional knowledge of power markets, industry relationships and skill sets to maximize the performance of the Company.
Maintain sound financial practices to grow the distributions. The Company intends to maintain a commitment to disciplined financial analysis and a balanced capital structure to enable it to increase its distributions over time and serve the long-term interests of its unit holders. The Company’s financial practices include a risk and credit policy focused on transacting with creditworthy counterparties; a financing policy, which focuses on seeking an optimal capital structure through various capital formation alternatives to minimize interest rate and refinancing risks, ensure stable distributions and maximize value.
Competition
Power generation is a capital-intensive business with numerous and diverse industry participants. The Company competes on the basis of the location of its plants and on the basis of contract price and terms of individual projects. Within the power industry, there is a wide variation in terms of the capabilities, resources, nature and identity of the companies with whom the Company competes with depending on the market. Competitors for energy supply are utilities, independent power producers and other providers of distributed generation. The Company also competes to acquire new projects with renewable developers who retain renewable power plant ownership, independent power producers, financial investors and other dividend, growth-oriented companies. Competitive conditions may be substantially affected by capital market conditions and by various forms of energy legislation and regulation considered by federal, state and local legislatures and administrative agencies, including tax policy. Such laws and regulations may substantially increase the costs of acquiring, constructing and operating projects, and it could be difficult for the Company to adapt to and operate under such laws and regulations.
The Company's thermal business has certain cost efficiencies that may form barriers to entry. Generally, there is only one district energy system in a given territory, for which the only competition comes from on-site systems. While the district energy system can usually make an effective case for the efficiency of its services, some building owners nonetheless may opt for on-site systems, either due to corporate policies regarding allocation of capital, unique situations where an on-site system might in fact prove more efficient, or because of previously committed capital in systems that are already on-site. Growth in existing district energy systems generally comes from new building construction or existing building conversions within the service territory of the district energy provider.
Competitive Strengths
Stable, high quality cash flows. The Company'sCompany’s facilities have a stable, predictable cash flow profile consisting of predominantly long-life electric generation assets that primarily sell electricity under long-term fixed priced contracts or pursuant to regulated rates with investment gradeinvestment-grade and certain other credit-worthycreditworthy counterparties. Additionally,The majority of the Company'sCompany’s facilities have minimal fuel risk. Forrisk, as the Company's conventional assets, fuel is provided by the toll counterparty or the cost thereof is a pass-through cost under the CfD. RenewableRenewables facilities have no fuel costs, and most ofhowever, the Company's thermal infrastructureCompany’s merchant conventional assets have contractual or regulatory tariff mechanisms for fuel cost recovery.need to procure their own fuel. The offtake agreements for the Company'sCompany’s conventional and renewable generation facilities have a weighted-average remaining duration, based on CAFD, of approximately 1510 years as of December 31, 2017, based on CAFD,2023, providing long-term cash flow stability. The Company's generationCompany’s offtake agreements with counterparties for whom credit ratings are available have a weighted-average Moody’s rating of A3Ba1 based on rated capacity under contract. All of the Company'sCompany’s assets are in the U.S. and accordingly have no currency or repatriation risks.
High quality, long-lived assets with low operating and capital requirements. The Company benefits from a portfolio of relatively younger assets, other than thermal infrastructure assets. The Company's assets are comprised of proven and reliable technologies, provided by leading original solar and wind equipment manufacturers such as General Electric, Siemens AG, SunPower Corporation, or SunPower, First Solar Inc., or First Solar, Vestas, Suzlon and Mitsubishi. Given the modern nature of the portfolio, which includes a substantial number of relatively low operating and maintenance cost solar and wind generation assets, the Company expects to achieve high fleet availability and expend modest maintenance-related capital expenditures. Additionally, with the support of services provided by NRG, the Company expects to continue to implement the same rigorous preventative operating and management practices that NRG uses across its fleet of assets.
Significant scale and diversity. The Company owns and operates a large and diverse portfolio of contracted electric generation and thermal infrastructure assets. As of December 31, 2017, the Company's 5,118 net MW contracted generation portfolio benefits from significant diversification in terms of technology, fuel type, counterparty and geography. The Company's thermal business consists of twelve operations, seven of which are district energy centers that provide steam and chilled water to approximately 695 customers, and five of which provide generation. The Company believes its scale and access to best practices across the fleet improves its business development opportunities through enhanced industry relationships, reputation and understanding of regional power market dynamics. Furthermore, the Company's diversification reduces its operating risk profile and reliance on any single market.
Relationship with NRG. The Company believes its relationship with NRG, a leading competitive power generator in the U.S., provides significant benefits to the Company, including access to the significant resources of NRG to support its operational, financial, legal, regulatory and environmental functions.
Relationship with GIP. The Company believes its potential relationship with GIP, should the NRG Transaction be consummated, may provide significant benefits to the Company. GIP is an independent infrastructure fund with over $45 billion in assets under management that invests in infrastructure assets and businesses in both OECD and select emerging market countries. GIP has a strong track record of investment and value creation in the renewable energy sector. Additionally, GIP has extensive experience with publicly traded yield vehicles and development platforms, ranging from Europe's first application of a yield company/development company model to the largest renewable platform in Asia-Pacific.
Environmentally well-positioned portfolio of assets. The Company'sCompany’s portfolio of electric generation assets consists of 3,173approximately 6,000 net MW of renewable generation capacityinstalled wind, solar and energy storage projects that are predominantly non-emitting sources of power generation. The Company'sAdditionally, the Company’s California conventional assets consist of the dual fuel-fired GenConn assets as well as the Marsh Landing and Walnut Creek simple cycle natural gas-fired peakingefficient gas generation facilities and the El Segundo combined cycle natural gas-fired peaking facility.that support electric system reliability. The Company does not anticipate having to expend any significant capital expenditures in the foreseeable future to comply with current environmental regulations applicable to its generation assets. Taken as a whole, the Company believes its strategy will be a net beneficiary of current and potential environmental legislation and regulatory requirements that may serve as a catalyst for capacity retirements and improve market opportunities for environmentally well-positioned assets like the Company'sCompany’s assets once its current offtake agreements expire.
ThermalHigh quality, long-lived assets with low operating and capital requirements. The Company benefits from a portfolio of relatively newer assets. The Company’s assets are largely comprised of proven and reliable technologies, provided by leading original wind, solar and energy storage equipment manufacturers, including First Solar, General Electric, Siemens Energy AG, SunPower, Vestas and Wärtsilä. Given the nature of the portfolio, which includes a substantial number of relatively low operating and maintenance cost wind, solar and energy storage projects, the Company expects to achieve high fleet availability and expend modest maintenance-related capital expenditures.
Significant scale and diversity. The Company is one of the largest renewable energy owners in the U.S. with approximately 6,000 net MW of installed wind, solar and energy storage projects. The Company’s approximately 8,500 net MW of assets also includes approximately 2,500 net MW of environmentally-sound, highly efficient natural gas-fired generation facilities. The Company’s contracted renewable and conventional generation assets benefit from significant diversification in terms of technology, fuel type, counterparty and geography. The Company believes its scale and access to best practices across the fleet improves its business development opportunities through enhanced industry relationships, reputation and understanding of regional power market dynamics. Furthermore, the Company’s diversification reduces its operating risk profile and reliance on any single market.
Relationship with GIP, TotalEnergies and CEG. The Company believes that its relationship with GIP, TotalEnergies and CEG provides significant benefits. Global Infrastructure Management, LLC, or GIM, the manager of GIP, is an independent infrastructure business has high entry costs. Significant capital has been invested to construct the Company's thermalfund manager that makes equity and debt investments in infrastructure assets serving asand businesses in both the Organization for Economic Co-operation and Development (OECD) and select emerging market countries. GIM has a barrier to entrystrong track record of investment and value creation in the renewable energy sector. GIM also has extensive experience with publicly traded yield vehicles and development platforms, ranging from Europe’s first application of a yield company/development company model to the largest renewable platform in Asia-Pacific. TotalEnergies is a global multi-energy company that produces and markets energies in which such assets operate. As of December 31, 2017, the Company's thermal gross property, plant, and equipment was approximately $473 million. The Company's thermal district energy centers are located in urban city areas, with the chilled water and steam delivery systems located underground. Constructing underground delivery systems in urban areas requires long lead times for permitting, rights of way and inspections and is costly. By contrast, the incremental cost to add new customers in existing markets is relatively low. Once thermal infrastructure is established,more than 130 countries. Additionally, the Company believes it hasthat CEG provides the ability to retain customers over long periods of time and to compete effectively for additional business against stand-alone on-site heating and cooling generation facilities. Installation of stand-alone equipment can require significant modificationCompany access to a building as well as significant space for equipmenthighly capable renewable development and funding for capital expenditures. The Company's system technologies often provide economies of scale in terms of fuel procurement, abilityoperations platform that is aligned to switch between multiple types of fuel to generate thermal energy, and fuel conversion efficiency.support the Company’s growth.
Segment Review
The following tables summarize the Company'sCompany’s operating revenues, net income (loss) and assets by segment, for the years ended December 31, 2017, 2016 and 2015, as discussed in Item 15 — Note 12, Segment Reporting,.
| | | | | | | | | | | | | | | | | | | | | | | | |
| Year ended December 31, 2023 | |
| (In millions) | Conventional Generation | | Renewables | | Corporate | | Total | |
| Operating revenues | $ | 420 | | | $ | 894 | | | $ | — | | | $ | 1,314 | | |
| | | | | | | | |
| Net income (loss) | 109 | | | (12) | | | (110) | | | (13) | | |
| Total assets | 2,058 | | | 12,205 | | | 425 | | | 14,688 | | |
| | | | | | | | | | | | | | | | | | | | | | | | | | | | | |
| Year ended December 31, 2022 |
| (In millions) | Conventional Generation | | Renewables | | Thermal | | Corporate | | Total |
| Operating revenues | $ | 417 | | | $ | 696 | | | $ | 77 | | | $ | — | | | $ | 1,190 | |
| | | | | | | | | |
Net income (loss) (a) | 161 | | | (58) | | | 17 | | | 1,162 | | | 1,282 | |
| Total assets | 2,251 | | | 9,515 | | | — | | | 546 | | | 12,312 | |
(a) Corporate net income includes the $1.29 billion gain on the sale of the Thermal Business to KKR, which was completed on May 1, 2022.
| | | | | | | | | | | | | | | | | | | | | | | | | | | | | |
| Year ended December 31, 2021 |
| (In millions) | Conventional Generation | | Renewables | | Thermal | | Corporate | | Total |
| Operating revenues | $ | 441 | | | $ | 641 | | | $ | 204 | | | $ | — | | | $ | 1,286 | |
| | | | | | | | | |
| Net income (loss) | 172 | | | (65) | | | 22 | | | (192) | | | (63) | |
Policy Incentives
U.S. federal, state and local governments have established various policy incentives to support the Consolidated Financial Statements. All amountsdevelopment, financing, ownership and operation of renewable energy projects. These incentives include PTCs, ITCs, accelerated tax depreciation, cash grants, tax abatements and RPS programs which have been recast to include the effect of decreasing the acquisitionscosts and risks associated with developing and operating such projects or creating demand for renewable energy assets. In particular,
•Owners of wind facilities are eligible to claim the PTC, or an ITC in lieu of the Drop Down Assets, which were accountedPTC, provided that certain requirements are met. Similarly, owners of solar facilities are eligible to claim the ITC or, for as transfers of entities under common control. The accounting guidance requires retrospective combinationfacilities placed in service after August 16, 2022, the PTC, or an ITC in lieu of the entitiesPTC, provided certain requirements are met. Additionally, owners of energy storage facilities are eligible to claim the ITC for all periods presented as iffacilities placed in service after December 31, 2022, provided certain requirements are met. The PTC is an annual credit that is based on the combination has beenamount of electricity sold by the facility during the first ten years after the facility is first placed in effect sinceservice. The ITC is a one-time credit that is based on a percentage of the inceptioncost of common control. Accordingly, the Company prepared its consolidated financial statementsfacility and is claimed for the tax year in which the facility is first placed in service. Depending on the type of taxpayer, the PTC or ITC may be sold to reflect the transfers as if they had taken placean unrelated third party for cash, or in certain cases, direct payment from the beginninggovernment may be received. In order to qualify for the full amount of these credits in the financial statementscase of facilities whose construction began on or after January 30, 2023, certain prevailing wage and apprenticeship requirements generally must be satisfied. For facilities that begin construction after December 31, 2024, the PTC and ITC will no longer apply and such facilities may instead be eligible for the clean electricity production credit or clean electricity investment credit, respectively. In order to qualify for these new credits, the facility’s greenhouse gas emissions cannot be greater than zero.
•Pursuant to the U.S. federal Modified Accelerated Cost Recovery System, or MACRS, wind and solar projects are generally depreciable for tax purposes over a five-year period (before taking into account certain conventions) even though the useful life of such projects is generally much longer than five years. Federal income tax law also provides for immediate and 100% expensing and deductibility for eligible property acquired and placed in service after September 27, 2017, and before January 1, 2023, with phase downs permitting 80%, 60%, 40% and 20% expensing and deductibility for property acquired and placed in service during 2023, 2024, 2025 and 2026, respectively.
•RPS programs, currently in place in certain states and territories, require electricity providers in the state or territory to meet a certain percentage of their retail sales with energy from renewable sources. Additionally, other states in the date the entities were under common control (if later than the beginning of the financial statements period).
|
| | | | | | | | | | | | | | | | | | | |
| | Year ended December 31, 2017 |
| (In millions) | Conventional Generation | | Renewables | | Thermal | | Corporate | | Total |
| Operating revenues | $ | 336 |
| | $ | 501 |
| | $ | 172 |
| | $ | — |
| | $ | 1,009 |
|
| Net income (loss) | 120 |
| | 9 |
| | 25 |
| | (92 | ) | | 62 |
|
| Total assets | 1,897 |
| | 5,811 |
| | 422 |
| | 24 |
| | 8,154 |
|
|
| | | | | | | | | | | | | | | | | | | |
| | Year ended December 31, 2016 |
| (In millions) | Conventional Generation | | Renewables | | Thermal | | Corporate | | Total |
| Operating revenues | $ | 333 |
| | $ | 532 |
| | $ | 170 |
| | $ | — |
| | $ | 1,035 |
|
| Net income (loss) | 153 |
| | (86 | ) | | 29 |
| | (81 | ) | | 15 |
|
| Total assets | 1,993 |
| | 6,114 |
| | 426 |
| | 212 |
| | 8,745 |
|
|
| | | | | | | | | | | | | | | | | | | |
| | Year ended December 31, 2015 |
| (In millions) | Conventional Generation | | Renewables | | Thermal | | Corporate | | Total |
| Operating revenues | $ | 336 |
| | $ | 458 |
| | $ | 174 |
| | $ | — |
| | $ | 968 |
|
| Net income (loss) | 156 |
| | (18 | ) | | 22 |
| | (65 | ) | | 95 |
|
Government Incentives
Government incentives, including PTCs and ITCs, can enhance the economics of the Company's generating assets and investments by providing, for example, loan guarantees, cash grants, favorable tax treatment, favorable depreciation rules or other incentives.U.S. have set renewable energy goals to reduce GHG emissions from historic levels. The Company cannot predictbelieves that these standards and goals will create incremental demand for renewable energy in the effects thatfuture.
The elimination of, loss of, or reduction in, the current U.S. presidential administration will have on government incentives.incentives discussed above could decrease the attractiveness of renewable energy projects to developers, including, but not limited to, CEG, which could reduce the Company’s acquisition or development opportunities. Such an elimination, loss or reduction could also reduce the Company’s willingness to pursue or develop certain renewable energy projects due to higher operating costs or decreased revenues under its PPAs.
Regulatory Matters
As owners of power plants and participants in wholesale and thermal energy markets, certain of the Company'sCompany’s subsidiaries are subject to regulation by various federal and state government agencies. These agencies include FERC and the PUCT, as well as other public utility commissions in certain states where the Company'sCompany’s assets are located. Each of the Company'sCompany’s U.S. generating facilities qualifies as an EWG or QF. In addition, the Company is subject to the market rules, procedures and protocols of the various ISO and RTO markets in which it participates. Likewise, certain of the CompanyCompany’s subsidiaries must also comply with the mandatory reliability requirements imposed by NERC and the regional reliability entities in the regions where the Company operates.has generating facilities subject to NERC’s reliability authority. The Company'sCompany’s operations within the ERCOT footprint are not subject to rate regulation by FERC, as they are deemed to operate solely within the ERCOT market and not in interstate commerce. These operations are subject to regulation by PUCT. Similarly, the Company’s operations within Hawaii are not subject to rate regulation by FERC, as they are deemed to operate solely within the State of Hawaii and not in interstate commerce.
FERC
FERC, among other things, regulates the transmission and the wholesale sale of electricity in interstate commerce under the authority of the FPA. The transmission and sale of electric energy occurring wholly within ERCOT and Hawaii is not subject to FERC’s jurisdiction under Sections 203 or 205 of the FPA.jurisdiction. Under existing regulations, FERC determineshas the authority to determine whether an entity owning a generation facility is an EWG, as defined in the PUHCA. FERC also determineshas the authority to determine whether a generation facility meets the ownership and technicalapplicable criteria of a QF under the PURPA. Each of the Company’s non-ERCOTU.S. generating facilities qualifies as either an EWG.EWG or QF.
The FPA gives FERC exclusive rate-making jurisdiction over the wholesale sale of electricity and transmission of electricity in interstate commerce of public utilities (as defined by the FPA). Under the FPA, FERC, with certain exceptions, regulates the owners and operators of facilities used for the wholesale sale of electricity or transmission in interstate commerce as public utilities, and establishesis charged with ensuring that market rules that are just and reasonable.
Public utilities are required to obtain FERC’s acceptance, pursuant to Section 205 of the FPA, of their rate schedules for the wholesale sale of electricity. AllSeveral of the Company’s QF generating facilities and all of the Company’s non-QF generating entitiesfacilities located in the U.S. outside of ERCOT and Hawaii make sales of electricity pursuant to market-based rates, as opposed to traditional cost-of-service regulated rates. Every three years FERC will conductconducts a review of the Company’s market basedmarket-based rates of Company public utilities and potential market power onevery three years according to a regional basis.schedule established by FERC.
In accordance with the Energy Policy Act of 2005, FERC has approved the NERC as the national Energy Reliability Organization, or ERO. As the ERO, NERC is responsible for the development and enforcement of mandatory reliability standards for the wholesale electric power system. In additionsystem, with such authority delegated in part to complying with NERC requirements, each entity must comply with the requirements of the regional reliability entityentities charged with enforcement of mandatory reliability standards for the region in which it is located.they are responsible for overseeing.
The PURPA was passed in 1978 in large part to promote increased energy efficiency and development of independent power producers. The PURPA created QFs to further both goals, and FERC is primarily charged with administering the PURPA as it applies to QFs. Certain QFs are exempt from regulation, either in whole or in part,certain regulations under the FPA as public utilities.FPA.
The PUHCA provides FERC with certain authority over and access to books and records of public utility holding companies not otherwise exempt by virtue of their ownership of EWGs QFs, and Foreign Utility Companies.QFs. The Company is exempt from many of the accounting, record retention, and reporting requirements of the PUHCA.
Environmental Matters
The Company is subject to a wide range of environmental laws induring the development, construction, ownership and operation of projects.facilities. These existing and future laws generally require that governmental permits and approvals be obtained before construction and maintained during operation of facilities. The Company is also subjectobligated to comply with all environmental laws regardingand regulations applicable within each jurisdiction and required to implement environmental programs and procedures to monitor and control risks associated with the protectionconstruction, operation and decommissioning of wildlife, including migratory birds, eagles, threatened and endangered species.regulated or permitted energy assets. Federal and state environmental laws have historically become more stringent over time, although this trend could change with respectin the future.
A number of regulations that may affect the Company are under review for potential revision or rescission in 2024. The Company will evaluate the impact of the legislation and regulations as they are revised but cannot fully predict the impact of each until anticipated revisions and legal challenges are resolved. To the extent that proposed legislation and new or revised regulations restrict or otherwise impact the Company’s operations, the proposed legislation and regulations could have a negative impact on the Company’s financial performance.
Proposed Federal MBTA Incidental Take Legislation and Regulations — On October 4, 2021, U.S. Fish and Wildlife Service, or FWS, issued the final MBTA rule, effective December 3, 2021, restoring the MBTA to federal lawsprohibit the incidental take of migratory birds. In 2021, FWS issued an advance notice of proposed rulemaking advising that it intends to gather information necessary to develop proposed regulations to authorize the incidental take of migratory birds under prescribed conditions and prepare a draft environmental review pursuant to the National Environmental Policy Act, or NEPA. Throughout 2022, FWS sought comments on the content of the proposed rule. In November 2023, FWS withdrew the draft MBTA permit program rule from the Office of Information and Regulatory Affairs to address technical comments received from agencies. FWS has indicated that the rule is likely to be published in the second half of 2024.
Federal Eagle Incidental Take Permit Rule — On September 30, 2022, FWS published in the Federal Register a draft rule revising the eagle incidental take permit program. Comments on the revised rule continued to be accepted during 2023. The final eagle incidental take permit rule was published in the Federal Register on February 12, 2024 and will become effective on April 13, 2024. The final rule is anticipated to provide an expedited eagle take permitting and lower cost path for many wind facilities.
Local California Air District Rules — Air districts, including the Bay Area Air Quality Management District and the San Diego Air Pollution Control District, have recently proposed and/or updated new source review permitting requirements, including to incorporate public notice requirements as well as updates to programs addressing toxic air contaminants. Rulemaking in the Los Angeles Air Basin, as regulated by South Coast Air Quality Management District, or SCAQMD, continues to update command-and-control regulations that limit NOx emissions for stationary sources in preparation for sunsetting SCAQMD’s Regional Clean Air Market, or RECLAIM, cap and trade program in the next few years. The Company’s conventional generation plants meet the district’s existing and proposed amendments to command-and-control regulations. Proposed updates to local California Air District Rules are not expected to affect the operations nor compliance of the Company’s conventional generation plants.
Amendments to NEPA — On June 3, 2023, President Biden signed the Fiscal Responsibility Act of 2023, or FRA, into law, which includes amendments to the NEPA, aimed at streamlining the environmental review process. Following the FRA, on July 31, 2023, the White House Council on Environmental Quality, or CEQ, published a proposed rule, the Bipartisan Permitting Reform Implementation Rule, which seeks to revise, update and modernize the existing regulations under the current U.S. presidential administration.
In October 2015,NEPA and includes provisions regarding robust public involvement, environmental justice, and climate change, or the EPA finalized the Clean Power Plan, or CPP, addressing GHG emissions from existing EGUs. On February 9, 2016, the U.S. Supreme Court stayed the CPP.Phase 2 Proposed Rule. The D.C. Circuit heard oral argumentpublic comment period on the legal challenges toPhase 2 Proposed Rule closed on September 29, 2023 and the CPP in September 2016. At the EPA's request, the D.C. Circuit agreed on April 28, 2017 to hold the case in abeyance. On October 16, 2017, the EPA proposed afinal rule to repeal the CPP. Accordingly, the Company believes the CPP ishas not likely to survive.yet been published.
Customers
The Company sells its electricity and environmental attributes, including RECs, primarily to local utilities under long-term, fixed-price PPAs.contractual arrangements. During the year ended December 31, 2017,2023, the Company derived approximately 41%24% of its consolidated revenue from Southern California Edison, or SCE, and approximately 23%17% of its consolidated revenue from Pacific Gas and Electric, or PG&E.
EmployeesHuman Capital
The Company employs Christopher Sotos as its President and Chief Executive Officer and Chad Plotkin as its Senior Vice President and Chief Financial Officer. As of December 31, 2017, other than Messrs. Sotos and Plotkin,2023, the Company did not employ any otherhad 61 employees. The majorityCompany also depends upon personnel of CEG for the provision of asset management, administration and O&M services.
The Company focuses on attracting, developing and retaining a team of highly talented and motivated employees. The Company regularly conducts assessments of its compensation and benefit practices and pay levels to help ensure that staff members are compensated equitably and competitively. The Company devotes extensive resources to staff development and training, including tuition assistance for career-enhancing academic and professional programs. Employee performance is measured in part based on goals that are aligned with the Company’s annual objectives. The Company recognizes that its success is based on the talents and dedication of those it employs, and the Company is highly invested in their success.
The Company is committed to maintaining a workplace that acknowledges, encourages, and values diversity and inclusion and provides its employees with unconscious bias training. The Company believes that individual differences, experiences, and strengths enrich the culture and fabric of its organization. Having employees with backgrounds and orientations that reflect a variety of viewpoints and experiences also helps the Company to better understand the needs of its customers and the communities in which it operates.
By leveraging the multitude of backgrounds and perspectives of its team and developing ongoing relationships with diverse vendors, the Company achieves a collective strength that enhances the workplace and makes the Company a better business partner to its customers and others with a stake in the Company’s success.
The Company also has an Equity, Partnership & Inclusion Council, or EPIC. As part of its commitment, the Company provides education on topics related to diversity, inclusion and equity. The Company identified three areas of focus: Our People; Our Brand, Customers and Community; and Our Purchasing. With the involvement of its employees, EPIC is advancing efforts in each of these areas to identify and implement opportunities for the Company to address equity, partnership and inclusion issues in its business activities.
Our People focuses on education and training; diversity, equity and inclusion policies and recruitment strategies; community and industry partnerships; and maintaining high employee engagement and retention.
Our Brand, Customers & Community focuses on pursuing opportunities that provide more equitable access to renewable energy; broadening participation for small to medium enterprises; supporting the diversity, equity and inclusion goals of the Company’s offtakers; building robust community engagement relationships; and meaningfully representing that work in the external market.
Our Purchasing focuses on establishing a non-discriminatory practices standard for the Company’s suppliers, diverse vendor sourcing and benchmarking.
In addition to the personnel who manageof CEG, the Company relies on other third-party service providers in the daily operations of its conventional facilities and certain renewable facilities.
Environmental, Social and Governance (ESG)
The Company is committed to engaging with its stakeholders on environmental, social and governance, or ESG, matters in a proactive, holistic and integrated manner. The Company strives to provide recent, credible and comparable data to investors around ESG issues and to comply with ESG disclosure requirements. Clearway, Inc.’s Board of Directors reviews developing trends and emerging ESG matters as well as the Company’s strategies, activities, policies and communications regarding ESG matters, and reviews and considers potential actions the Company arecould take regarding ESG matters.
Aligned with the Company’s strategy of owning and acquiring environmentally-sound power generation and energy storage assets, the Company has issued $2.1 billion of corporate green bonds under a green bond framework that applies the net proceeds to finance or refinance, in part or in full, new and existing projects and assets meeting certain criteria focused on the supply of energy from renewable resources, including solar energy and wind energy.
As discussed in greater detail above, the Company, through EPIC, has focused its diversity, equity and inclusion efforts in three areas: Our People; Our Brand, Customers and Community; and Our Purchasing. With the involvement of the Company’s employees, EPIC is advancing efforts in each of NRG or third parties managed by NRG,these areas to identify and their services are providedimplement opportunities for the Company's benefit under the Management Services AgreementCompany to address equity, partnership and project operations and maintenance agreements with NRG as describedinclusion issues in Item 15 —Note 13, Related Party Transactions, to the Consolidated Financial Statements.its business activities.
Available Information
The Company'sCompany’s annual reports on Form 10-K, quarterly reports on Form 10-Q, current reports on Form 8-K, and amendments to those reports filed or furnished pursuant to section 13(a) or 15(d) of the Exchange Act are available free of charge through Yield,the SEC’s website, www.sec.gov, and through the “Investor Relations” section of Clearway, Inc.'s’s website, www.nrgyield.comwww.clearwayenergy.com, as soon as reasonably practicable after they are electronically filed with, or furnished to, the SEC. The Company also routinely posts press releases, presentations, webcasts, and other information regarding the Company on Yield,Clearway, Inc.'s’s website. The information posted on Yield,Clearway, Inc.'s’s website is not a part of this report.
Item 1A — Risk Factors
Summary of Risk Factors
The Company’s business is subject to numerous risks and uncertainties, discussed in more detail in the following section. These risks include, among others, the following key risks:
Risks Related to the Proposed NRG TransactionCompany’s Business
•The Company’s ability to grow and make acquisitions through cash on hand is limited.
•The Company may not realizebe able to effectively identify or consummate any future acquisitions on favorable terms, or at all, and future acquisitions may not be accretive as a result of incorrect assumptions in the anticipated benefitsCompany’s evaluation of such acquisitions, unforeseen consequences or other external events beyond the Company’s control.
•Counterparties to the Company’s offtake agreements may not fulfill their obligations and, as the contracts expire, the Company may not be able to replace them with agreements on similar terms in light of increasing competition in the markets in which the Company operates.
•The Company’s ability to effectively consummate future acquisitions will also depend on the Company’s ability to arrange the required or desired financing for acquisitions.
•The Company’s indebtedness could adversely affect its ability to raise additional capital to fund the Company’s operations or pay distributions.
•The operation of electric generation facilities depends on suitable meteorological conditions and involves significant risks and hazards customary to the power industry that could have a material adverse effect on the Company’s business, financial condition, results of operations and cash flows. These facilities may operate without long-term power sales agreements.
•Maintenance, expansion and refurbishment of electric generation facilities involve significant risks that could result in unplanned power outages or reduced output.
•Supplier and/or customer concentration at certain of the NRG Transaction.Company’s facilities may expose the Company to significant financial credit or performance risks.
On February 6, 2018, Global Infrastructure Partners, or GIP, entered into a purchase•The Company currently owns, and sale agreement with NRG for the acquisition of NRG’s full ownership interest in the Company and NRG’s renewable energy development and operations platform. Also on February 6, 2018,future may acquire, certain assets in which the Company entered into a consenthas limited control over management decisions and indemnity agreement with NRGits interests in such assets may be subject to transfer or other related restrictions.
•The Company is exposed to risks inherent in the use of interest rate swaps and GIPenergy-related financial instruments. The Company may be exposed to additional risks in connection with the purchasefuture if it utilizes other derivative instruments.
•The Company does not own all of the land on which its power generation and sale agreement between NRGenergy storage assets are located, which could result in disruption to its operations. The Company’s use and GIP. enjoyment of real property rights for its projects may be adversely affected by the rights of lienholders and leaseholders that are superior to those of the grantors of those real property rights to the Company.
•The consentCompany’s businesses are subject to physical, market and indemnity agreementeconomic risks relating to potential effects of climate change and public and governmental initiatives to address climate change.
•Risks that are beyond the purchase and sale agreement are collectively referredCompany’s control, including but not limited to acts of terrorism or related acts of war, natural disasters, severe weather, changes in weather patterns, flooding, pandemics (such as the NRG Transaction. ConsummationCOVID-19 pandemic), inflation, supply chain disruptions, hostile cyber intrusions or other catastrophic events, could have a material adverse effect on the business, financial condition, results of operations and cash flows.
•The operation of the NRG TransactionCompany’s businesses is subject to cyber-based security and integrity risk.
•The Company relies on electric distribution and transmission facilities that it does not own or control and that are subject to transmission constraints within a number of conditions, including receipt of certain contractual consents and regulatory approvals from certain regulatory agencies, including approval by FERC and approvals from certain state regulatory agencies. While the parties have begun the process of notifying agencies and obtaining regulatory approvals and consents, there is no assurance that the parties will be able to obtain the requisite regulatory approvals or consents to satisfy the closing conditions. Additionally, the NRG Transaction requires the Company’s consent which is conditioned upon a numberregions. If these facilities fail to provide the Company with adequate transmission capacity, it may be restricted in its ability to deliver electric power to its customers and may either incur additional costs or forego revenues.
•The Company’s costs, results of items, alloperations, financial condition and cash flows could be adversely impacted by the disruption of the fuel supplies necessary to generate power at its conventional generation facilities.
•The Company depends on key personnel and its ability to attract and retain additional skilled management and other personnel, the loss of any of which could have a material adverse effect on the Company’s financial condition and results of operations.
•The Company may notpotentially be met on a timely basis, or at all.adversely affected by emerging technologies that may over time impact capacity markets and the energy industry overall.
IfRisks Related to the NRG Transaction is consummated,Company’s Relationship with GIP, mayTotalEnergies and CEG
•GIP and TotalEnergies, through their equal ownership of CEG, the controlling shareholder of Clearway, Inc., exercise substantial influence over the Company’s policies and procedures and exercise substantial influence over the Company’s Board, management and the types of third party acquisitions the Company makes.Company. The Company may not identify future acquisitions or be able to secure financingis highly dependent on attractive terms or at all for future acquisitionsGIP, TotalEnergies and the Company may not realize the anticipated benefits of the financing support to be provided by GIP, which includes a $1.5 billion backstop credit facility to manage any change-of-control costs associated with the Company’s corporate debt and up to $400 million in financing support for the Company’s acquisition of the Carlsbad Energy Center. Further, GIP may not be able to maintain the Company’s current relationships with customers, counterparties, suppliers, lenders and other thirdCEG.
parties. Uncertainty about the effect of the NRG Transaction may negatively affect the Company’s relationship with its counterparties and have a significant impact on the Company’s business. The foregoing risks may adversely affect the Company’s operational performance or limit the Company’s growth prospects, including its ability to grow its dividend per share.
Following the consummation of the NRG Transaction, GIP and its affiliates will control•CEG controls the Company and havehas the ability to designate a majority of the members of Yield,Clearway, Inc.'s’s Board.
•The Company may not be able to consummate future acquisitions from CEG.
•The governance agreementsCompany may be unable to be entered into among NRG,terminate the CEG Master Services Agreement, in certain circumstances.
•If CEG terminates the CEG Master Services Agreement or defaults in the performance of its obligations under the agreement, the Company GIP and its affiliates in connectionmay be unable to contract with the NRG Transaction provide GIP the ability to designate a majority of Yield, Inc.’s Board to the Company’s Corporate Governance, Conflicts and Nominating Committee for nomination for election by Yield, Inc.’s stockholders and also require that the Company and GIP use their commercially reasonable efforts to submit to Yield, Inc.’s stockholderssubstitute service provider on similar terms, or at Yield, Inc.’s 2019 Annual Meeting of Stockholders a charter amendment to classify Yield, Inc.’s Board into two classes (with the independent directors and directors designated by GIP allocated across the two classes). Due to such agreements and GIP's approximate 55.1% combined voting power in Yield, Inc. following the completion of the NRG Transaction, the ability of other holders of Yield, Inc.’s Class A and Class C common stock to exercise control over the corporate governance of the Company will be limited. In addition, due to its approximate 55.1% combined voting power in the Company following the completion of the NRG Transaction, GIP and its affiliates will have a substantial influence on Yield, Inc.’s affairs and its voting power will constitute a large percentage of any quorum of Yield, Inc.’s stockholders voting on any matter requiring the approval of Yield, Inc.’s stockholders, including the classification of Yield, Inc.'s Board of Directors. GIP may hold certain interests that are different from those of the Company or other holders of Yield, Inc.'s Class A and Class C common stock and there is no assurance that GIP will exercise its control over the Company in a manner that is consistent with the Company’s interests or those of the holders of Yield, Inc.'s Class A and Class C common stock.all.
Risks Related to the Company's BusinessRegulation
Certain facilities are newly constructed and may not perform as expected.
Certain of the Company's conventional and renewable assets are newly constructed. •The ability of these facilities to meet the Company's performance expectationsCompany’s business is subject to the risks inherentrestrictions resulting from environmental, health and safety laws and regulations.
•The electric generation business is subject to substantial governmental regulation, including environmental laws, and may be adversely affected by changes in newly constructedlaws or regulations, as well as liability under, or any future inability to comply with, existing or future regulations or other legal requirements.
•The Company’s business is subject to complex and evolving U.S. laws and regulations regarding privacy and data protection.
•Government regulations providing incentives for renewable power generation facilitiescould change at any time and such changes may negatively impact the construction of such facilities, including, but not limited to, degradation of equipment in excess of the Company's expectations, system failures, and outages. Company’s growth strategy.
•The failure of these facilities to perform as the Company expects could have a material adverse effect on the Company's business, financial condition, results of operations, cash flows and itsCompany’s ability to pay distributionscomply with tax laws and policies may depend on its contractual arrangements and information provided by third parties and may require significant resources.
Risks Related to Yield, Inc. and NRG.the Company’s Business
Pursuant to the Company'sCompany’s cash distribution policy, the Company intends to distribute a significant amount of the CAFD through regular quarterly distributions, and the Company'sCompany’s ability to grow and make acquisitions through cash on hand could beis limited.
The Company expects to distribute a significant amount of the CAFD each quarter and to rely primarily upon external financing sources, including the issuance of debt and equity securities and, if applicable, borrowings under the Company'sCompany’s revolving credit facility to fund acquisitions and growth capital expenditures. The Company may be precluded from pursuing otherwise attractive acquisitions if the projected short-term cash flow from the acquisition or investment is not adequate to service the capital raised to fund the acquisition or investment, after giving effect to the Company'sCompany’s available cash reserves. The incurrence of bank borrowings or other debt by NRG YieldClearway Energy Operating LLC or by the Company'sCompany’s project-level subsidiaries to finance the Company’s growth strategy will result in increased interest expense and the imposition of additional or more restrictive covenants, which, in turn, may impact the cash distributions the Company makes to Yield,Clearway, Inc. and NRG.
CEG.
The Company may not be able to effectively identify or consummate any future acquisitions on favorable terms, or at all.all, and future acquisitions may not be accretive as a result of incorrect assumptions in the Company’s evaluation of such acquisitions, unforeseen consequences or other external events beyond the Company’s control.
The Company'sCompany’s business strategy includes growth through the acquisitions of additional generation assets (including through corporate acquisitions). This strategy depends on the Company’s ability to successfully identify and evaluate acquisition opportunities and consummate acquisitions on favorable terms. However, the number of acquisition opportunities is limited. In addition, the Company will compete with other companies for these limited acquisition opportunities, which may increase the Company’s cost of making acquisitions or cause the Company to refrain from making acquisitions at all. Some of the Company’s competitors for acquisitions are much larger than the Company with substantially greater resources. These companies may be able to pay more for acquisitions and may be able to identify, evaluate, bid for and purchase a greater number of assets than the Company’s financial or human resources permit. If the Company is unable to identify and consummate future acquisitions, it will impede the Company’s ability to execute its growth strategy and limit the Company’s ability to increase the amount of dividendsdistributions paid to holders of Yield,Clearway, Inc.'s common stock. and CEG.
Furthermore, theThe Company’s ability to acquire future renewable facilities may depend on the viability of renewable assets generally. These assets currently are largely contingent on public policy mechanisms including ITCs, cash grants, loan guarantees, accelerated depreciation, RPS and carbon trading plans. These mechanisms have been implemented at the state and federal levels to support the development of renewable generation, demand-side and smart grid and other clean infrastructure technologies. The availability and continuation of public policy support mechanisms will drive a significant part of the economics and viability of the Company’s growth strategy and expansion into clean energy investments.
The acquisition of companies and assets are subject to substantial risks, including the failure to identify material problems during due diligence (for which the Company may not be indemnified post-closing) and the risk of overpaying for assets (or not making acquisitions on an accretive basis). The integration and consolidation of acquisitions requires substantial human, financial and other resources and, ultimately, the Company’s acquisitions may divert management’s attention from the Company’s existing business concerns, disrupt the Company’s ongoing business or not be successfully integrated. There can be no assurances that any future acquisitions will perform as expected or that the returns from such acquisitions will support the financing utilized to acquire them or maintain them. A failure to achieve the financial returns the Company expects when it acquires generation assets could have a material adverse effect on the Company’s ability to grow its business and make cash distributions to its unit holders. Any failure of the Company’s acquired generation assets to be accretive or difficulty in integrating such acquisition into the Company’s business could have a material adverse effect on the Company’s ability to grow its business and make cash distributions to its unit holders. As a result, the consummation of acquisitions could have a material adverse effect on the Company’s business, financial condition, results of operations, cash flows and ability to pay distributions to its unit holders.
Counterparties to the Company’s offtake agreements may not fulfill their obligations and, as the contracts expire, the Company may not be able to replace them with agreements on similar terms in light of increasing competition in the markets in which the Company operates.
The majority of the electric power the Company generates is sold under long-term offtake agreements with public utilities or industrial or commercial end-users, with a weighted average remaining duration, based on CAFD, of approximately 10 years. As of December 31, 2023, the largest customers of the Company’s power generation and energy storage assets, including assets in which the Company has less than a 100% membership interest, were SCE and PG&E, which represented 24% and 17%, respectively, of total consolidated revenues generated by the Company during the year ended December 31, 2023.
If, for any reason, any of the purchasers of power under these agreements are unable or unwilling to fulfill their related contractual obligations or if they refuse to accept delivery of power delivered thereunder or if they otherwise terminate such agreements prior to the expiration thereof, the Company’s assets, liabilities, business, financial condition, results of operations and cash flows could be materially and adversely affected. Furthermore, to the extent any of the Company’s power purchasers are, or are controlled by, governmental entities, the Company’s facilities may be subject to legislative or other political action that may impair their contractual performance.
The power generation industry is characterized by intense competition and the Company’s electric generation assets encounter competition from utilities, industrial companies and independent power producers, in particular with respect to uncontracted output. In recent years, there has been increasing competition among generators for offtake agreements and this has contributed to a reduction in electricity prices in certain markets characterized by excess supply above designated reserve margins. In light of these market conditions, the Company may not be able to replace an expiring or terminated agreement with an agreement on equivalent terms and conditions, including at prices that permit operation of the related facility on a profitable basis. In addition, the Company believes many of its competitors have well-established relationships with the Company’s current and potential suppliers, lenders and customers, and have extensive knowledge of its target markets. As a result, these competitors may be able to respond more quickly than the Company to evolving industry standards and changing customer requirements. The adoption of more advanced technology could reduce its competitors’ power production costs resulting in their having a lower cost structure than is achievable with the technologies currently employed by the Company and adversely affect its ability to compete for offtake agreement renewals. If the Company is unable to replace an expiring or terminated offtake agreement, the affected facility may temporarily or permanently cease operations. External events, such as a severe economic downturn or force majeure events, could also impair the ability of some counterparties to the Company’s offtake agreements and other customer agreements to pay for energy and/or other products and services received.
The Company’s inability to enter into new or replacement offtake agreements or to compete successfully against current and future competitors in the markets in which the Company operates could have a material adverse effect on the Company’s business, financial condition, results of operations and cash flows.
The Company’s ability to effectively consummate future acquisitions will also depend on the Company’s ability to arrange the required or desired financing for acquisitions.
The Company may not have sufficient availability under the Company’s credit facilities or have access to project-level financing on commercially reasonable terms when acquisition opportunities arise. An inability to obtain the required or desired financing could significantly limit the Company’s ability to consummate future acquisitions and effectuate the Company’s growth strategy. If financing is available, utilization of the Company’s credit facilities or project-level financing for all or a portion of the purchase price of an acquisition could significantly increase the Company’s interest expense, impose additional or more restrictive covenants and reduce CAFD. The Company’s ability to consummate future acquisitions may also depend on the Company’s ability to obtain any required regulatory approvals for such acquisitions, including, but not limited to, approval by FERC under Section 203 of the FPA.
Finally, the acquisition of companies and assets are subject to substantial risks, including the failure to identify material problems during due diligence (for which the Company may not be indemnified post-closing), the risk of over-paying for assets (or not making acquisitions on an accretive basis) and the ability to retain customers. Further, the integration and consolidation of acquisitions requires substantial human, financial and other resources and, ultimately, the Company's acquisitions may divert management’s attention from the Company's existing business concerns, disrupt the Company's ongoing business or not be successfully integrated. There can be no assurances that any future acquisitions will perform as expected or that the returns from such acquisitions will support the financing utilized to acquire them or maintain them. As a result, the consummation of acquisitions may have a material adverse effect on the Company's business, financial condition, results of operations, cash flows and ability to pay distributions to Yield, Inc. and NRG.
Even if the Company consummates acquisitions that it believes will be accretive to CAFD, those acquisitions may decrease CAFD as a result of incorrect assumptions in the Company’s evaluation of such acquisitions, unforeseen consequences or other external events beyond the Company’s control.
The acquisition of existing generation assets involves the risk of overpaying for such projects (or not making acquisitions on an accretive basis) and failing to retain the customers of such projects. While the Company will perform due diligence on prospective acquisitions, the Company may not discover all potential risks, operational issues or other issues in such generation assets. Further, the integration and consolidation of acquisitions require substantial human, financial and other resources and, ultimately, the Company’s acquisitions may divert the Company’s management’s attention from its existing business concerns, disrupt its ongoing business or not be successfully integrated. Future acquisitions might not perform as expected or the returns from such acquisitions might not support the financing utilized to acquire them or maintain them. A failure to achieve the financial returns the Company expects when it acquires generation assets could have a material adverse effect on the Company’s ability to grow its business and make cash distributions to its unitholders. Any failure of the Company’s acquired generation assets to be accretive or difficulty in integrating such acquisition into the Company’s business could have a material adverse effect on the Company’s ability to grow its business and make cash distributions to its unitholders.
acquisitions.
The Company’s indebtedness could adversely affect its ability to raise additional capital to fund the Company’s operations or pay distributions. It could also expose the Company to the risk of increased interest rates and limit the Company’s ability to react to changes in the economy or the Company’s industry as well as impact the Company’s results of operations, financial condition and cash flows.
As of December 31, 2017,2023, the Company had approximately $5,899 million$8.10 billion of total consolidated indebtedness, $4,376 million$5.97 billion of which was incurred by the Company'sCompany’s non-guarantor subsidiaries. In addition, the Company’s share of its unconsolidated affiliates’ total indebtedness and letters of credit outstanding as of December 31, 2017,2023, totaled approximately $777$303 million and $98$37 million, respectively (calculated as the Company’s unconsolidated affiliates’ total indebtedness as of such date multiplied by the Company’s percentage membership interest in such assets).
The Company’s substantial debt could have important negative consequences on the Company’s financial condition, including:
•increasing the Company’s vulnerability to general economic and industry conditions;
•requiring a substantial portion of the Company’s cash flow from operations to be dedicated to the payment of principal and interest on the Company’s indebtedness, therefore reducing the Company’s ability to pay distributions to Yield,Clearway, Inc. and NRGCEG or to use the Company’s cash flow to fund its operations, capital expenditures and future business opportunities;
•limiting the Company’s ability to enter into long-term power sales or fuel purchases which require credit support;
•limiting the Company’s ability to fund operations or future acquisitions;
•restricting the Company’s ability to make certain distributions to Yield,Clearway, Inc. and NRGCEG and the ability of the Company’s subsidiaries to make certain distributions to it, in light of restricted payment and other financial covenants in the Company’s credit facilities and other financing agreements;
•exposing the Company to the risk of increased interest rates because certain of the Company’s borrowings, which may include borrowings under the Company’s revolving credit facility, are at variable rates of interest;
•limiting the Company’s ability to obtain additional financing for working capital including collateral postings, capital expenditures, debt service requirements, acquisitions and general corporate or other purposes; and
•limiting the Company’s ability to adjust to changing market conditions and placing it at a competitive disadvantage compared to the Company’s competitors who have less debt.
The Company'sCompany’s revolving credit facility contains financial and other restrictive covenants that limit the Company’s ability to return capital to stockholdersunit holders or otherwise engage in activities that may be in the Company’s long-term best interests. The Company’s inability to satisfy certain financial covenants could prevent the Company from paying cash distributions, and the Company’s failure to comply with those and other covenants could result in an event of default which, if not cured or waived, may entitle the related lenders to demand repayment or enforce their security interests, which could have a material adverse effect on the Company’s business, financial condition, results of operations and cash flows. In addition, failure to comply with such covenants may entitle the related lenders to demand repayment and accelerate all such indebtedness.
The agreements governing the Company’s project-level financing contain financial and other restrictive covenants that limit the Company’s project subsidiaries’ ability to make distributions to the Company or otherwise engage in activities that may be in the Company’s long-term best interests. The project-level financing agreements generally prohibit distributions from the project entities to the Company unless certain specific conditions are met, including the satisfaction of certain financial ratios. The Company’s inability to satisfy certain financial covenants may prevent cash distributions by the particular project(s) to it and, the Company’s failure to comply with those and other covenants could result in an event of default which, if not cured or waived may entitle the related lenders to demand repayment or enforce their security interests, which could have a material adverse effect on the Company’s business, results of operations and financial condition. In addition, failure to comply with such covenants may entitle the related lenders to demand repayment and accelerate all such indebtedness. If the Company is unable to make distributions from the Company’s project-level subsidiaries, it would likely have a material adverse effect on the Company’s ability to pay distributions to Yield,Clearway, Inc. and NRG.CEG.
Letter of credit facilities to support project-level contractual obligations generally need to be renewed after five to seven years,have a limited term that may require future renewal, at which time the Company or relevant project-level subsidiary will need to satisfy applicable financial ratios and covenants. If the Company is unable to renew the Company’s letters of credit as expected or replace them with letters of credit under different facilities on favorable terms or at all, the Company may experience a material adverse effect on its business, financial condition, results of operations and cash flows. Furthermore, such inability may constitute a default under certain project-level financing arrangements, restrict the ability of the project-level subsidiary to make distributions to it and/or reduce the amount of cash available at such subsidiary to make distributions to the Company.
In addition, the Company’s ability to arrange financing, either at the corporate level or at a non-recourse project-level subsidiary, and the costs of such capital, are dependent on numerous factors, including:
•general economic and capital market conditions;
•credit availability from banks and other financial institutions;
•investor confidence in the Company, its partners, Yield,Clearway, Inc. (as the Company'sCompany’s sole managing member), NRG (as Yieldor GIP and TotalEnergies, through CEG, as Clearway, Inc.’s principal stockholder on(on a combined voting basis, and manager under the Management Services Agreement), or GIP, as successor to NRG's interests in the Company if the NRG Transaction is consummated,basis) and the regional wholesale power markets;
•the Company’s financial performance and the financial performance of the Company subsidiaries;
•the Company’s level of indebtedness and compliance with covenants in debt agreements;
•maintenance of acceptable project credit ratings or credit quality;
•cash flow; and
•provisions of tax and securities laws that may impact raising capital.
The Company may not be successful in obtaining additional capital for these or other reasons. Furthermore, the Company may be unable to refinance or replace project-level financing arrangements or other credit facilities on favorable terms or at all upon the expiration or termination thereof. The Company'sCompany’s failure, or the failure of any of the Company’s projects, to obtain additional capital or enter into new or replacement financing arrangements when due may constitute a default under such existing indebtedness and may have a material adverse effect on the Company'sCompany’s business, financial condition, results of operations and cash flows.
Certain of the Company'sCompany’s long-term bilateral contracts result from state-mandated procurements and could be declared invalid by a court of competent jurisdiction.
A significant portion of the Company'sCompany’s revenues are derived from long-term bilateral contracts with utilities that are regulated by their respective states and have been entered into pursuant to certain state programs. Certain long-term contracts that other companies have with state-regulated utilities have been challenged in federal court and have been declared unconstitutional on the grounds that the rate for energy and capacity established by the contracts impermissibly conflicts with the rate for energy and capacity established by FERC pursuant to the FPA. If certain of the Company'sCompany’s state-mandated agreements with utilities are ever held to be invalid or unenforceable due to the financial conditions or other conditions of such utility, the Company may be unable to replace such contracts, which could have a material adverse effect on the Company'sCompany’s business, financial condition, results of operations and cash flows.
The generation of electric energy from solar and wind energy sources depends heavily on suitable meteorological conditions.
If solar or wind conditions are unfavorable, the Company'sCompany’s electricity generation and revenue from renewable generation facilities may be substantially below the Company'sCompany’s expectations. The electricity produced and revenues generated by a solar or wind energy generation facility is highly dependent on suitable solar or wind conditions, as applicable, and associated weather conditions, which are beyond the Company'sCompany’s control. Disruption in the generation of solar or wind energy could limit a facility’s ability to generate electricity at its desired level. Should a generation facility fail to perform at the required levels, or other unplanned disruptions occur, the facility may be forced to fulfill an underlying contractual obligation by purchasing electricity at higher prices. In addition, the Company’s facilities may be exposed, based on specific contractual terms, to a locational basis risk resulting from a difference in the price received for generation sold at the location where the power is generated and the price paid for generation purchased at the contracted delivery point, which could lead to potential lower revenues in circumstances where the price received is lower than the price that is paid. Furthermore, components of the Company'sCompany’s systems, such as solar panels and inverters, could be damaged by severe weather, such as wildfires, hailstorms, lightning, tornadoes or tornadoes. In addition, replacementfreezing temperatures and spare parts for key components may be difficult or costly to acquire or may be unavailable.other winter weather conditions. Unfavorable weather and atmospheric conditions could impair the effectiveness of the Company'sCompany’s assets or reduce their output beneath their rated capacity or require shutdown of key equipment, impeding operation of the Company'sCompany’s renewable assets. For example, in February 2021, the Company’s wind projects in Texas were unable to operate and experienced outages for a few days as a result of the extreme winter weather conditions. In addition, climate change may have the long-term effect of changing wind patterns at ourthe Company’s projects. Changing wind patterns could cause changes in expected electricity generation. These events could also degrade equipment or components and the interconnection and transmission facilities’ lives or maintenance costs.
Although the Company bases its investment decisions with respect to each renewable generation facility on the findings of related wind and solar studies conducted on-site prior to construction or based on historical conditions at existing facilities, actual climatic conditions at a facility site, particularly wind conditions, may not conform to the findings of these studies and may be affected by variations in weather patterns, including any potential impact of climate change. Therefore, the Company'sCompany’s solar and wind energy facilities may not meet anticipated production levels or the rated capacity of the Company'sCompany’s generation assets, which could adversely affect the Company’s business, financial condition, results of operations and cash flows.
Operation of electric generation facilities involves significant risks and hazards customary to the power industry that could have a material adverse effect on the Company'sCompany’s business, financial condition, results of operations and cash flows.
The ongoing operation of the Company'sCompany’s facilities involves risks that include the breakdown or failure of equipment or processes or performance below expected levels of output or efficiency due to wear and tear, latent defect, design error, or operator error or force majeure events, among other things. The Company’s facilities are subject to the risks inherent with power generation facilities, including, but not limited to, degradation of equipment in excess of the Company’s expectations, system failures and outages, which could impair the ability of the facilities to meet the Company’s performance expectations. In addition, replacement and spare parts for key components may be difficult or costly to acquire or may be unavailable. Operation of the Company'sCompany’s facilities also involves risks that the Company will be unable to transport its products to its customers in an efficient manner due to a lack of transmission capacity. Unplanned outages of generating units, including extensions of scheduled outages due to mechanical failures or other problems, occur from time to time and are an inherent risk of the business. Unplanned outages typically increase operation and maintenance expenses, capital expenditures and may reduce revenues as a result of selling fewer MWh or require the Company to incur significant costs as a result of obtaining substitute RA or replacement power from third parties in the open market to satisfy forward power sales obligations. The Company'sCompany’s inability to operate its electric generation assets efficiently, manage capital expenditures and costs and generate earnings and cash flow from the Company'sCompany’s asset-based businesses could have a material adverse effect on the Company’s business, financial condition, results of operations and cash flows. While the Company maintains insurance, obtains warranties from vendors and obligates contractors to meet certain performance levels, the proceeds of such insurance, warranties or performance guarantees may not cover the Company'sCompany’s lost revenues, increased expenses or liquidated damages payments should it experience equipment breakdown or non-performance by contractors or vendors.
Power generation involves hazardous activities, including acquiring, transporting and unloading fuel, operating large pieces of rotating equipment and delivering electricity to transmission and distribution systems.
In addition to natural risks such as earthquake, flood, lightning, hurricane and wind, other hazards, such as fire, explosion, structural collapse and machinery failure are inherent risks in the Company's operations. These and other hazards can cause significant personal injury or loss of life, severe damage to and destruction of property, plant and equipment and contamination of, or damage to, the environment and suspension of operations. The occurrence of any one of these events may result in the Company being named as a defendant in lawsuits asserting claims for substantial damages, including for environmental cleanup costs, personal injury and property damage and fines and/or penalties. The Company maintains an amount of insurance protection that it considers adequate but cannot provide any assurance that the Company'sCompany’s insurance will be sufficient or effective under all circumstances and against all hazards or liabilities to which the Company may be subject. Furthermore, the Company'sCompany’s insurance coverage is subject to deductibles, caps, exclusions and other limitations. A loss for which the Company is not fully insured (which may include a significant judgment against any facility or facility operator) could have a material adverse effect on the Company'sCompany’s business, financial condition, results of operations or cash flows. Further, due to rising insurance costs and changes in the insurance markets, the Company cannot provide any assurance that its insurance coverage will continue to be available at all or at rates or on terms similar to those presently available. Any losses not covered by insurance could have a material adverse effect on the Company'sCompany’s business, financial condition, results of operations and cash flows.
Power generation involves hazardous activities, including acquiring, transporting and unloading fuel, operating large pieces of rotating equipment and delivering electricity to transmission and distribution systems. In addition to natural risks such as earthquakes, floods, lightning, hurricanes and strong wind, other hazards, such as fire, explosion, structural collapse and machinery failure are inherent risks in the Company’s operations. These and other hazards can cause significant personal injury or loss of life, severe damage to and destruction of property, plant and equipment and contamination of, or damage to, the environment and suspension of operations. To the extent an event was not covered by insurance policies, such incidents could subject the Company to substantial liabilities arising from emergency response, environmental cleanup and restoration costs, claims made by neighboring landowners and other third parties for personal injury and property damage, and fines or penalties for any related violations of environmental laws or regulations.
The Company’s facilities may operate, wholly or partially, without long-term power sales agreements.
The Company’s facilities may operate without long-term power sales agreements for some or all of their generating capacity and output and therefore be exposed to market fluctuations. Without the benefit of long-term power sales agreements for the facilities, the Company cannot be sure that it will be able to sell any or all of the power generated by the facilities at economic rates or that the facilities will be able to operate profitably. This could lead to less predictable revenues, future impairments of the Company’s property, plant and equipment or to the closing of certain of its facilities, resulting in economic losses and liabilities, which could have a material adverse effect on the Company’s results of operations, financial condition or cash flows.
Maintenance, expansion and refurbishment of electric generation facilities involve significant risks that could result in unplanned power outages or reduced output.
The Company'sCompany’s facilities may require periodic upgrading and improvement. Any unexpected operational or mechanical failure, including failure associated with breakdowns and forced outages, could reduce the Company's facilities'Company’s facilities’ generating capacity below expected levels, reducing the Company'sCompany’s revenues and jeopardizing the Company'sCompany’s ability to pay distributions to Yield,Clearway, Inc. and NRGCEG at expected levels or at all. Degradation of the performance of the Company'sCompany’s solar facilities above levels provided for in the related offtake agreements may also reduce the Company'sCompany’s revenues. Unanticipated capital expenditures associated with maintaining, upgrading or repairing the Company'sCompany’s facilities may also reduce profitability.
If the Company makes any major modifications to its conventional power generation facilities, it may be required to install the best available control technology or to achieve the lowest achievable emission rates as such terms are defined under the new source review provisions of the CAAClean Air Act in the future. Any such modifications could likely result in substantial additional capital expenditures. The Company may also choose to repower, refurbish or upgrade its facilities based on its assessment that such activity will provide adequate financial returns. Such facilities require time for development and capital expenditures before commencement of commercial operations, and key assumptions underpinning a decision to make such an investment may prove incorrect, including assumptions regarding construction costs, timing, available financing and future fuel and power prices. These events could have a material adverse effect on the Company's business, financial condition, results of operations and cash flows.
Counterparties to the Company's offtake agreements may not fulfill their obligations and, as the contracts expire, the Company may not be able to replace them with agreements on similar terms in light of increasing competition in the markets in which the Company operates.
A significant portion of the electric power the Company generates is sold under long-term offtake agreements with public utilities or industrial or commercial end-users, with a weighted average remaining duration of approximately 15 years based on CAFD. As of December 31, 2017, the largest customers of the Company's power generation assets, including assets in which the Company has less than a 100% membership interest, were SCE and PG&E, which represented 40% and 23%, respectively, of the net electric generation capacity of the Company's facilities.
If, for any reason, any of the purchasers of power under these agreements are unable or unwilling to fulfill their related contractual obligations or if they refuse to accept delivery of power delivered thereunder or if they otherwise terminate such agreements prior to the expiration thereof, the Company's assets, liabilities, business, financial condition, results of operations and cash flows could be materially and adversely affected. Furthermore, to the extent any of the Company's power purchasers are, or are controlled by, governmental entities, the Company's facilities may be subject to legislative or other political action that may impair their contractual performance.
The power generation industry is characterized by intense competition and the Company's electric generation assets encounter competition from utilities, industrial companies and other independent power producers, in particular with respect to uncontracted output. In recent years, there has been increasing competition among generators for offtake agreements and this has contributed to a reduction in electricity prices in certain markets characterized by excess supply above designated reserve margins. In light of these market conditions, the Company may not be able to replace an expiring or terminated agreement with an agreement on equivalent terms and conditions, including at prices that permit operation of the related facility on a profitable basis. In addition, the Company believes many of its competitors have well-established relationships with the Company's current and potential suppliers, lenders and customers and have extensive knowledge of its target markets. As a result, these competitors may be able to respond more quickly to evolving industry standards and changing customer requirements than the Company will be able to. Adoption of technology more advanced than the Company's could reduce its competitors' power production costs resulting in their having a lower cost structure than is achievable with the technologies currently employed by the Company and adversely affect its ability to compete for offtake agreement renewals. If the Company is unable to replace an expiring or terminated offtake agreement, the affected facility may temporarily or permanently cease operations. External events, such as a severe economic downturn, could also impair the ability of some counterparties to the Company's offtake agreements and other customer agreements to pay for energy and/or other products and services received.
The Company's inability to enter into new or replacement offtake agreements or to compete successfully against current and future competitors in the markets in which the Company operates could have a material adverse effect on the Company's business, financial condition, results of operations and cash flows.
The Company’s facilities may operate, wholly or partially, without long-term power sales agreements.
The Company’s facilities may operate without long-term power sales agreements for some or all of their generating capacity and output and therefore be exposed to market fluctuations. Without the benefit of long-term power sales agreements for the facilities, the Company cannot be sure that it will be able to sell any or all of the power generated by the facilities at commercially attractive rates or that the facilities will be able to operate profitably. This could lead to less predictable revenues, future impairments of the Company's property, plant and equipment or to the closing of certain of its facilities, resulting in economic losses and liabilities, which could have a material adverse effect on the Company's results of operations, financial condition or cash flows.
A portion of the steam and chilled water produced by the Company's thermal assets is sold at regulated rates, and the revenue earned by the Company's GenConn assets is established each year in a rate case; accordingly, the profitability of these assets is dependent on regulatory approval.
Approximately 378 net MWt of capacity from certain of the Company's thermal assets are sold at rates approved by one or more federal or state regulatory commissions, including the Pennsylvania Public Utility Commission and the California Public Utilities Commission for the thermal assets. Similarly, the revenues related to approximately 380 MW of capacity from the GenConn assets are established each year by the Connecticut Public Utilities Regulatory Authority. While such regulatory oversight is generally premised on the recovery of prudently incurred costs and a reasonable rate of return on invested capital, the rates that the Company may charge, or the revenue that the Company may earn with respect to this capacity are subject to authorization of the applicable regulatory authorities. There can be no assurance that such regulatory authorities will consider all of the costs to have been prudently incurred or that the regulatory process by which rates or revenues are determined will always result in rates or revenues that achieve full recovery of costs or an adequate return on the Company's capital investments. While the Company's rates and revenues are generally established based on an analysis of costs incurred in a base year, the rates the Company is allowed
to charge, and the revenues the Company is authorized to earn, may or may not match the costs at any given time. If the Company's costs are not adequately recovered through these regulatory processes, it could have a material adverse effect on the business, financial condition, results of operations and cash flows.
Supplier and/or customer concentration at certain of the Company'sCompany’s facilities may expose the Company to significant financial credit or performance risks.
The Company often relies on a single contracted supplier or a small number of suppliers for the provision of fuel, transportation of fuel, equipment, technology and/or other services required for the operation of certain facilities. In addition, certain of the Company'sCompany’s suppliers provide long-term warranties with respect to the performance of their products or services. If any of these suppliers cannot perform under their agreements with the Company, or satisfy their related warranty obligations, the Company will need to utilize the marketplace to provide or repair these products and services. There can be no assurance that the marketplace can provide these products and services as, when and where required. The Company may not be able to enter into replacement agreements on favorable terms or at all. If the Company is unable to enter into replacement agreements to provide for fuel, equipment, technology and other required services, it would seek to purchase the related goods or services at market prices, exposing the Company to market price volatility and the risk that fuel and transportation may not be available during certain periods at any price. The Company may also be required to make significant capital contributions to remove, replace or redesign equipment that cannot be supported or maintained by replacement suppliers, which could have a material adverse effect on the business, financial condition, results of operations, credit support terms and cash flows.
In addition, potential or existing customers at the Company’s district energy centers and combined heat and power plants, or the Energy Centers, may opt for on-site systems in lieu of using the Company’s Energy Centers, either due to corporate policies regarding the allocation of capital, unique situations where an on-site system might in fact prove more efficient, because of previously committed capital in systems that are already on-site, or otherwise. At times, the Company relies on a single customer or a few customers to purchase all or a significant portion of a facility's output, in some cases under long-term agreements that account for a substantial percentage of the anticipated revenue from a given facility.
The failure of any supplier to fulfill its contractual obligations to the Company or the Company’s loss of potential or existing customers could have a material adverse effect on its financial results. Consequently, the financial performance of the Company'sCompany’s facilities is dependent on the credit quality of, and continued performance by, the Company'sCompany’s suppliers and vendors and the Company’s ability to solicit and retain customers.
The Company currently owns, and in the future may acquire, certain assets in which the Company has limited control over management decisions and its interests in such assets may be subject to transfer or other related restrictions.
As described in Item 15 — Note 5, Investments Accounted for by the Equity Method and Variable Interest Entities, the Company has limited control over the operation of certain of its assets, because the Company beneficially owns less than a majority of the membership interests in such assets. The Company may seek to acquire additional assets in which it owns less than a majority of the related membership interests in the future. In these investments, the Company will seek to exert a degree of influence with respect to the management and operation of assets in which it owns less than a majority of the membership interests by negotiating to obtain positions on management committees or to receive certain limited governance rights, such as rights to veto significant actions. However, the Company may not always succeed in such negotiations. The Company may be dependent on its co-venturers to operate such assets. The Company'sCompany’s co-venturers may not have the level of experience, technical expertise, human resources management and other attributes necessary to operate these assets optimally. In addition, conflicts of interest may arise in the future between theCompany and its stockholders,unit holders, on the one hand, and the Company'sCompany’s co-venturers, on the other hand, where the Company's co-venturers'Company’s co-venturers’ business interests are inconsistent with the interests of the Company and its stockholders.unit holders. Further, disagreements or disputes between the Company and its co-venturers could result in litigation, which could increase expenses and potentially limit the time and effort the Company'sCompany’s officers and directors are able to devote to the business.
The approval of co-venturers may also be required for the Company to receive distributions of funds from assets or to sell, pledge, transfer, assign or otherwise convey its interest in such assets, or for the Company to acquire NRG'sCEG’s interests in such co-ventures as an initial matter. Alternatively, the Company'sCompany’s co-venturers may have rights of first refusal or rights of first offer in the event of a proposed sale or transfer of the Company'sCompany’s interests in such assets. These restrictions may limit the price or interest level for interests in such assets, in the event the Company wants to sell such interests.
Furthermore, certain of the Company'sCompany’s facilities are operated by third-party operators, such as First Solar.operators. To the extent that third-party operators do not fulfill their obligations to manage operations of the facilities or are not effective in doing so, the amount of CAFD may be adversely affected.
The Company's assets areCompany is exposed to risks inherent in the use of interest rate swaps and forward fuel purchase contracts and theenergy-related financial instruments. The Company may be exposed to additional risks in the future if it utilizes other derivative instruments.
The Company uses interest rate swaps to manage interest rate risk. In addition, the Companyrisk and uses forward fuel purchase contractsenergy-related financial instruments to hedge its limited commodity exposure with respectmanage variability in earnings due to the Company's district energy assets. If the Company elects to enter into such commodity hedges, the related asset could recognize financial losses on these arrangements as a result of volatilityfluctuations in the market values of the underlying commodities or if a counterparty fails to perform under a contract. If actively quoted market prices and pricing information from external sources are not available, the valuation of these contracts would involve judgment or the use of estimates.prices. As a result, changes in the underlying assumptions or use of alternative valuation methods could affect the reported fair value of these contracts. If the values of these financial contracts change in a manner that the Company does not anticipate, or if a counterparty fails to perform under a contract, it could harm the business, financial condition, results of operations and cash flows.
The Company's business is subject to restrictions resulting from environmental, health and safety laws and regulations.
The Company is subject to various federal, state and local environmental and health and safety laws and regulations. In addition, the Company may be held primarily or jointly and severally liable for costs relating to the investigation and clean-up of any property where there has been a release or threatened release of a hazardous regulated material as well as other affected properties, regardless of whether the Company knew of or caused the release. In addition to these costs, which are typically not limited by law or regulation and could exceed an affected property's value, the Company could be liable for certain other costs, including governmental fines and injuries to persons, property or natural resources. Further, some environmental laws provide for the creation of a lien on a contaminated site in favor of the government as security for damages and any costs the government incurs in connection with such contamination and associated clean-up. Although the Company generally requires its operators to undertake to indemnify it for environmental liabilities they cause, the amount of such liabilities could exceed the financial ability of the operator to indemnify the Company. The presence of contamination or the failure to remediate contamination may adversely affect the Company's ability to operate the business.
The Company does not own all of the land on which its power generation or thermaland energy storage assets are located, which could result in disruption to its operations.
The Company does not own all of the land on which its power generation or thermaland energy storage assets are located, and the Company is, therefore, subject to the possibility of less desirable terms and increased costs to retain necessary land use if it does not have valid leases or rights-of-way or if such rights-of-way lapse or terminate. Although the Company has obtained rights to construct and operate these assets pursuant to related lease arrangements, the rights to conduct those activities are subject to certain exceptions, including the term of the lease arrangement. The Company is also at risk of condemnation on land it owns. The loss of these rights, through the Company'sCompany’s inability to renew right-of-way contracts, condemnation or otherwise, may adversely affect the Company'sCompany’s ability to operate its generation and thermal infrastructure assets.
The Company’s use and enjoyment of real property rights for its projects may be adversely affected by the rights of lienholders and leaseholders that are superior to those of the grantors of those real property rights to the Company.
SolarWind, solar and windenergy storage projects generally are, and are likely to be, located on land occupied by the project pursuant to long-term easements and leases. The ownership interests in the land subject to these easements and leases may be subject to mortgages securing loans or other liens (such as tax liens) and other easement and lease rights of third parties (such as leases of oil or mineral rights) that were created prior to the project’s easements and leases. As a result, the project’s rights under these easements or leases may be subject, and subordinate, to the rights of those third parties. The Company performs title searches and obtains title insurance to protect itself against these risks. Such measures may, however, be inadequate to protect the Company against all risk of loss of its rights to use the land on which the wind projects are located, which could have a material adverse effect on the Company’s business, financial condition and results of operations.
The Company’s businesses are subject to physical, market and economic risks relating to potential effects of climate change and public and governmental initiatives to address climate change.
Climate change creates uncertainty in weather and other environmental conditions, including temperature and precipitation levels, and thus may affect consumer demand for electricity. For example, deviations from normal weather may reduce demand or availability of electricity and gas distribution services. In addition, the potential physical effects of climate change, such as increased frequency and severity of storms, cloud coverage, precipitation, floods and other climatic events, could disrupt the Company’s operations and supply chain, and cause them to incur significant costs in preparing for or responding to these effects. These or other meteorological changes could lead to increased operating costs, capital expenses or power purchase costs.
Furthermore, governmental, scientific and public concern over the threat of climate change arising from GHG emissions may limit the Company’s access to natural gas or decrease demand for energy generated by the Company’s conventional assets. State, national and foreign governments and agencies continue to evaluate, and in some instances adopt, climate-related legislation and other regulatory initiatives that would restrict GHG emissions. Changes in environmental requirements related to GHG, climate change and alternative energy sources may impact demand for the Company’s services. For example, the Inflation Reduction Act of 2022, or IRA, includes incentives to promote the construction of wind and solar electric generation, as well as energy storage, and encourages consumers to use these alternative energy sources. While this could benefit the Company by increasing the demand for the Company’s solar or wind energy, the clean energy incentives included in the IRA or similar state or federal initiatives to incentivize a shift away from fossil fuels could reduce demand for energy generated by fossil fuels, and therefore have an adverse effect on the Company’s natural gas generation business, financial condition and results of operations.
Risks that are beyond the Company’s control, including but not limited to acts of terrorism or related acts of war, natural disasters, severe weather, changes in weather patterns, flooding, pandemics(such as the COVID-19 pandemic), inflation, supply chain disruptions, hostile cyber intrusions or other catastrophic events, could have a material adverse effect on the business, financial condition, results of operations and cash flows.
The Company’s generation facilities that were acquired or those that the Company otherwise acquires or constructs and the facilities of third parties on which they rely may be targets of terrorist activities, as well as events occurring in response to or in connection with them, that could cause environmental repercussions and/or result in full or partial disruption of the facilities ability to generate, transmit, transport or distribute electricity or natural gas. Strategic targets, such as energy-related facilities, may be at greater risk of future terrorist activities than other domestic targets. Inflation, disruption in global and domestic supply chains, and other economic conditions could negatively impact the Company’s business in a manner that could adversely affect the Company’s results of operations and financial condition. Hostile cyber intrusions, including those targeting information systems as well as electronic control systems used at the generating plants and for the related distribution systems, could severely disrupt business operations and result in loss of service to customers, as well as create significant expense to repair security breaches or system damage.
Furthermore, certain of the Company’s power generation and energy storage assets are located in active earthquake zones in California and Arizona, and certain project companies and suppliers conduct their operations in the same region or in other locations that are susceptible to natural disasters. In addition, California and some of the locations where certain suppliers are located, from time to time, have experienced shortages of water, electric power and natural gas. Catastrophic events, such as an earthquake, wildfire, drought, flood, pandemics (such as the COVID-19 pandemic) or localized extended outages of critical utilities or transportation systems, or any critical resource shortages, affecting the Company or its suppliers, could cause a significant interruption in the business, damage or destroy the Company’s facilities or those of its suppliers or the manufacturing equipment or inventory of the Company’s suppliers. The Company has a limited number of highly skilled employees for some of its operations and relies on certain independent contractors and other service providers. If a large proportion of the Company’s employees in those critical positions, or independent contractors or other service providers to the Company or its customers were to be negatively impacted by a catastrophic event at the same time, the Company would rely upon its business continuity plans in an effort to continue operations at its facilities, but there is no certainty that such measures will be sufficient to mitigate the adverse impact to its operations that could result from shortages of highly skilled employees, independent contractors or service providers. Any such terrorist acts, environmental repercussions or disruptions or natural disasters could result in a significant decrease in revenues or significant reconstruction or remediation costs, beyond what could be recovered through insurance policies, which could have a material adverse effect on the business, financial condition, results of operations and cash flows.
The operation of the Company’s businesses is subject to cyber-based security and integrity risk.
Numerous functions affecting the efficient operation of the Company’s businesses depend on the secure and reliable storage, processing and communication of electronic data and the use of sophisticated computer hardware and software systems. The operation of the Company’s generating assets relies on cyber-based technologies and has been the target of disruptive actions. In addition, our business is dependent upon the computer systems of third-party providers to process certain data necessary to conduct our business, including sensitive employee information, credit card transaction information and other sensitive data.
Potential disruptive actions could result from cyber-attack or cyber intrusion, including by computer hackers, foreign governments and cyber terrorists, or otherwise be compromised by unintentional events with respect to the Company or any of its contractors or customers. As a result, operations could be interrupted, property could be damaged and sensitive employee, customer or supplier information could be lost or stolen, causing the Company to incur significant losses of revenues, other substantial liabilities and damages, costs to replace or repair damaged equipment and damage to the Company’s reputation. Our insurance may not fully protect us against such losses. In addition, the Company may experience increased capital and operating costs to implement increased security for its cyber systems and generating assets.
In addition, cyberattacks against us or others in our industry could result in additional regulations, which could lead to increased regulatory compliance costs, insurance coverage cost or capital expenditures. Any failure by us to comply with these additional regulations could result in significant penalties and liability to us. We cannot predict the potential impact to our business or the energy industry resulting from such additional regulations.
The Company relies on electric distribution and transmission facilities that it does not own or control and that are subject to transmission constraints within a number of the Company’s regions. If these facilities fail to provide the Company with adequate transmission capacity, it may be restricted in its ability to deliver electric power to its customers and may either incur additional costs or forego revenues.
The Company depends on electric distribution and transmission facilities owned and operated by others to deliver the wholesale power it will sell from its electric generation assets to its customers. A failure or delay in the operation or development of these facilities or a significant increase in the cost of the development of such facilities could result in lost revenues. Such failures or delays could limit the amount of power the Company’s operating facilities deliver or delay the completion of the Company’s construction projects. Additionally, such failures, delays or increased costs could have a material adverse effect on the business, financial condition and results of operations. If a region’s power transmission infrastructure is inadequate, the Company’s recovery of wholesale costs and profits may be limited. If restrictive transmission price regulation is imposed, the transmission companies may not have a sufficient incentive to invest in expansion of transmission infrastructure. The Company also cannot predict whether distribution or transmission facilities will be expanded in specific markets to accommodate competitive access to those markets. In addition, certain of the Company’s operating facilities’ generation of electricity may be curtailed without compensation due to transmission limitations or limitations on the electricity grid’s ability to accommodate intermittent and other electricity generating sources, reducing the Company’s revenues and impairing its ability to capitalize fully on a particular facility’s generating potential. Such curtailments could have a material adverse effect on the business, financial condition, results of operations and cash flows. Furthermore, economic congestion on transmission networks in certain of the markets in which the Company operates may occur and the Company may be deemed responsible for congestion costs. If the Company were liable for such congestion costs, its financial results could be adversely affected.
The Company’s costs, results of operations, financial condition and cash flows could be adversely impacted by the disruption of the fuel supplies necessary to generate power at its conventional power generation facilities.
Delivery of fossil fuels to fuel the Company’s conventional generation facilities is dependent upon the infrastructure (including natural gas pipelines) available to serve each such generation facility as well as upon the continuing financial viability of contractual counterparties. As a result, the Company is subject to the risks of disruptions or curtailments in the production of power at these generation facilities if a counterparty fails to perform or if there is a disruption in the fuel delivery infrastructure.
The Company depends on key personnel and its ability to attract and retain additional skilled management and other personnel, the loss of any of which could have a material adverse effect on the Company’s financial condition and results of operations.
The Company believes its current operations and future success depend largely on the continued services of key personnel that it employs. Although the Company currently has access to the resources of CEG, the loss of key personnel employed by the Company or CEG could have a material adverse effect on the Company’s financial condition and results of operations.
The Company may potentially be adversely affected by emerging technologies that may over time impact capacity markets and the energy industry overall.
Research and development activities are ongoing in the Company’s industry to provide alternative and more efficient technologies to produce power, including wind, photovoltaic (solar) cells, hydrogen, energy storage, and improvements in traditional technologies and equipment, such as more efficient gas turbines. Advances in these or other technologies could reduce the costs of power production to a level below what the Company has currently forecasted, which could adversely affect its cash flows, results of operations or competitive position.
Some emerging technologies, such as distributed renewable energy technologies, broad consumer adoption of electric vehicles and energy storage devices, could affect the price of energy. These emerging technologies may affect the financial viability of utility counterparties and could have significant impacts on market prices, which could ultimately have a material adverse effect on the Company’s financial condition, results of operations and cash flows.
Risks Related to the Company’s Relationships with GIP, TotalEnergies and CEG
GIP and TotalEnergies, through their equal ownership of CEG, exercise substantial influence over the Company through CEG’s position as controlling shareholder of Clearway, Inc. The Company is highly dependent on CEG.
CEG owns all of Clearway, Inc.’s outstanding Class B and Class D common stock. Clearway, Inc.’s outstanding Class B and Class D common stock is entitled to one vote per share and 1/100th of a vote per share, respectively. As a result of its ownership of Clearway, Inc.’s Class B and Class D common stock, CEG owns 54.91% of the combined voting power of Clearway, Inc.’s common stock as of December 31, 2023. CEG is equally owned by GIP and TotalEnergies. On January 12, 2024, BlackRock entered into a definitive agreement to acquire 100% of the business and assets of GIM, which is the investment manager of the GIP funds that own an interest in CEG. BlackRock has indicated that the transaction is expected to close in the third quarter of 2024, subject to regulatory approvals and other customary closing conditions. Clearway, Inc., through its holdings of Class A units and Class C units, owned a 57.90% economic interest in the Company as of December 31, 2023. Additionally, CEG, through its holdings of Class B units and Class D units, owned the remaining 42.10% economic interest in the Company as of December 31, 2023. As a result of this ownership, CEG has a substantial influence on the Company’s affairs.
Furthermore, the Company depends on certain services provided by or under the direction of CEG under the CEG Master Services Agreement, including numerous processes related to the Company’s internal control over financial reporting. CEG personnel and support staff that provide services to the Company under the CEG Master Services Agreement are not required to, and the Company does not expect that they will, have as their primary responsibility the management and administration of the Company or to act exclusively for the Company and the CEG Master Services Agreement does not require any specific individuals to be provided by CEG. Under the CEG Master Services Agreement, CEG has the discretion to determine which of its employees perform assignments required to be provided to the Company. Any failure to effectively manage the Company’s processes related to internal controls over financial reporting, operations or to implement its strategy could have a material adverse effect on the business, financial condition, results of operations and cash flows. The CEG Master Services Agreement will continue in perpetuity, until terminated in accordance with its terms.
The Company also depends upon CEG and third parties for the provision of management, administration, O&M and certain other services at certain of the Company’s facilities. Any failure by CEG or third parties to perform its requirements under these arrangements or the failure by the Company to identify and contract with replacement service providers, if required, could adversely affect the operation of the Company’s facilities and have a material adverse effect on the business, financial condition, results of operations and cash flows.
CEG controls the Company and has the ability to designate a majority of the members of Clearway, Inc.’s Board.
Due to CEG’s approximate 54.91% combined voting power in Clearway, Inc., the ability of other holders of Clearway, Inc.’s Class A and Class C common stock to exercise control over the corporate governance of the Company is limited. CEG has a substantial influence on Clearway, Inc.’s affairs, and CEG’s voting power constitutes a large percentage of any quorum of Clearway, Inc.’s stockholders voting on any matter requiring the approval of Clearway, Inc.’s stockholders. Such matters include the election of directors, the adoption of amendments to Clearway, Inc.’s amended and restated certificate of incorporation and fourth amended and restated bylaws and approval of mergers or sale of all or substantially all of its assets. This concentration of ownership may also have the effect of delaying or preventing a change in control of Clearway, Inc. or discouraging others from making tender offers for Clearway, Inc.’s shares. In addition, CEG and its affiliates have the right to elect all of Clearway, Inc.’s directors. It is possible that the interests of CEG and its affiliates may in certain circumstances differ from the interests of the Company or other holders of Clearway, Inc.’s Class A and Class C common stock.
The Company may not be able to consummate future acquisitions from CEG.
The Company’s ability to grow through acquisitions depends, in part, on CEG’s ability to identify and present the Company with acquisition opportunities. CEG has not agreed to commit a specific level of dedicated resources for the pursuit of renewable power-related acquisitions. There are a number of factors which could materially and adversely impact the extent to which suitable acquisition opportunities are made available from CEG, including that the same professionals within CEG’s organization that are involved in acquisitions that are suitable for the Company have responsibilities within CEG’s broader asset management business, which may include sourcing acquisition opportunities for CEG. Limits on the availability of such individuals will likewise result in a limitation on the availability of acquisition opportunities for the Company. In making these determinations, CEG may be influenced by factors that result in a misalignment with the Company’s interests or conflict of interest.
The Company may be unable to terminate the CEG Master Services Agreement, in certain circumstances.
The CEG Master Services Agreement provides that the Company may terminate the agreement upon 30 days prior written notice to CEG upon the occurrence of any of the following: (i) CEG defaults in the performance or observance of any material term, condition or covenant contained therein in a manner that results in material harm to the Company and the default continues unremedied for a period of 30 days after written notice thereof is given to CEG; (ii) CEG engages in any act of fraud, misappropriation of funds or embezzlement that results in material harm to the Company; (iii) CEG is grossly negligent in the performance of its duties under the agreement and such negligence results in material harm to the Company; or (iv) upon the happening of certain events relating to the bankruptcy or insolvency of CEG. Furthermore, if the Company requests an amendment to the scope of services provided by CEG under the CEG Master Services Agreement and is not able to agree with CEG as to a change to the service fee resulting from a change in the scope of services within 180 days of the request, the Company will be able to terminate the agreement upon 30 days prior notice to CEG. The Company will not be able to terminate the agreement for any other reason, including if CEG experiences a change of control, and the agreement continues in perpetuity, until terminated in accordance with its terms. If CEG’s performance does not meet the expectations of investors, and the Company is unable to terminate the CEG Master Services Agreement, the market price of the Class A and Class C common stock could suffer.
If CEG terminates the CEG Master Services Agreement or defaults in the performance of its obligations under the agreement, the Company may be unable to contract with a substitute service provider on similar terms, or at all.
The Company relies on CEG to provide certain services under the CEG Master Services Agreement. The CEG Master Services Agreement provides that CEG may terminate the agreement upon 180 days prior written notice of termination to the Company if the Company defaults in the performance or observance of any material term, condition or covenant contained in the agreement in a manner that results in material harm and the default continues unremedied for a period of 30 days after written notice of the breach is given. If CEG terminates the Management Services Agreement or defaults in the performance of its obligations under the agreement, the Company may be unable to contract with CEG or a substitute service provider on similar terms or at all, and the costs of substituting service providers may be substantial. In addition, in light of CEG’s familiarity with the Company’s assets, a substitute service provider may not be able to provide the same level of service due to lack of pre-existing synergies.
The liability of CEG is limited under the Company’s arrangements with it and the Company has agreed to indemnify CEG against claims that it may face in connection with such arrangements, which may lead CEG to assume greater risks when making decisions relating to the Company than it otherwise might if acting solely for its own account.
Under the CEG Master Services Agreement, CEG does not assume any responsibility other than to provide or arrange for the provision of the services described in the CEG Master Services Agreement in good faith. In addition, under the CEG Master Services Agreement, the liability of CEG and its affiliates is limited to the fullest extent permitted by law to conduct involving bad faith, fraud, willful misconduct or gross negligence or, in the case of a criminal matter, action that was known to have been unlawful. In addition, the Company has agreed to indemnify CEG to the fullest extent permitted by law from and against any claims, liabilities, losses, damages, costs or expenses incurred by an indemnified person or threatened in connection with the Company’s operations, investments and activities or in respect of or arising from the CEG Master Services Agreement or the services provided by CEG, except to the extent that the claims, liabilities, losses, damages, costs or expenses are determined to have resulted from the conduct in respect of which such persons have liability as described above. These protections may result in CEG tolerating greater risks when making decisions than otherwise might be the case, including when determining whether to use leverage in connection with acquisitions. The indemnification arrangements to which CEG is a party may also give rise to legal claims for indemnification that are adverse to the Company and its unit holders.
Certain of the Company’s PPAs and project-level financing arrangements include provisions that would permit the counterparty to terminate the contract or accelerate maturity in the event CEG ceases to control or own, directly or indirectly, a majority of the voting power of the Company.
Certain of the Company’s PPAs and project-level financing arrangements contain change in control provisions that provide the counterparty with a termination right or the ability to accelerate maturity in the event of a change of control of the Company without the counterparty’s consent. These provisions are triggered in the event CEG ceases to own, directly or indirectly, capital stock representing more than 50% of the voting power of the Company’s capital stock outstanding on such date, or, in some cases, if CEG ceases to be the majority owner, directly or indirectly, of the applicable project subsidiary. As a result, if CEG ceases to control, or in some cases, own a majority of the voting power of the Company, the counterparties could terminate such contracts or accelerate the maturity of such financing arrangements. The termination of any of the Company’s PPAs or the acceleration of the maturity of any of the Company’s project-level financing could have a material adverse effect on the Company’s business, financial condition, results of operations and cash flow.
Risks Related to Regulation
The Company’s business is subject to restrictions resulting from environmental, health and safety laws and regulations.
The Company is subject to various federal, state and local environmental and health and safety laws and regulations. In addition, the Company may be held primarily or jointly and severally liable for costs relating to the investigation and clean-up of any property where there has been a release or threatened release of a hazardous regulated material as well as other affected properties, regardless of whether the Company knew of or caused the release. In addition to these costs, which are typically not limited by law or regulation and could exceed an affected property’s value, the Company could be liable for certain other costs, including governmental fines and injuries to persons, property or natural resources. Further, some environmental laws provide for the creation of a lien on a contaminated site in favor of the government as security for damages and any costs the government incurs in connection with such contamination and associated clean-up. Although the Company generally requires its operators to indemnify it for environmental liabilities the operators cause, the amount of such liabilities could exceed the financial ability of the operator to indemnify the Company. The presence of contamination or the failure to remediate contamination may adversely affect the Company’s ability to operate the business.
Local, state, federal and international regulatory bodies have increasingly focused on greenhouse gas (GHG) regulation, which could increase the cost of electricity generated by fossil fuels and reduce demand for the power the Company’s conventional assets generate and market. The EPA regulates GHG emissions from new and modified facilities that are potential major sources of criteria pollutants under the Clean Air Act and has adopted regulations that require, among other things, preconstruction and operating permits for certain large stationary sources and the monitoring and reporting of GHGs from certain oil and natural gas facilities. Further, the EPA recently announced strict new methane emissions regulations for oil and natural gas facilities, and the IRA established a charge on excess methane emissions from the same facilities. On the international level, under the Paris Agreement, the U.S. established an economy-wide target of reducing its net GHG emissions by 50-52 percent below 2005 levels by 2030 and achieving net zero GHG emissions economy-wide by no later than 2050. In December 2023, the United Nations Climate Change Conference issued a call on parties to the Paris Agreement, including the U.S., to contribute to the transitioning away from fossil fuels, reduction of methane emissions, and increase in renewable energy capacity to achieve net zero emissions by 2050. Many state and local officials have stated their intent to intensify efforts to uphold the commitments set forth in the international accord.
Legislation or regulation that restricts carbon emissions could increase the cost of environmental compliance for the Company’s conventional assets by requiring the Company to install new equipment to reduce emissions from larger facilities and/or purchase emission allowances. Climate change and GHG legislation or regulation could also delay or otherwise negatively affect efforts to obtain and maintain permits and other regulatory approvals for the Company’s conventional assets’ existing and new facilities, impose additional monitoring and reporting requirements or adversely affect demand for the natural gas the Company gathers, transports and stores. The effect on the Company of any new legislative or regulatory measures will depend on the particular provisions that are ultimately adopted.
Governmental, scientific and public concern over the threat of climate change arising from GHG emissions has resulted in increasing political risks in the United States. Companies across all industries are facing increased scrutiny from the public, stakeholders and government agencies related to their environmental, social, and governance, or ESG, practices and commitments to address climate change. For example, the SEC proposed enhanced climate-related disclosures in March 2022, which are expected to be finalized in the first half of 2024, and in September 2023, California passed climate-related disclosure mandates, which are broader than the SEC’s proposed rules. In recent years, investor advocacy groups, institutional investors, investment funds, and other influential investors have placed increasing importance on ESG practices. Increased focus and activism related to ESG and similar matters may hinder access to capital, as investors may decide to reallocate capital or to not commit capital as a result of their assessment of a company’s ESG practices. While the Company is committed to engaging with its stakeholders on ESG practices in a proactive, holistic and integrated manner, changes in the public or stakeholder sentiment could impact the Company’s ability to fund its conventional assets or decrease the demand for the energy generated by these assets. In addition, the additional disclosure requirements involve a significant recordkeeping requirement, which could result in the need for additional resources to support compliance. The Company will also be reliant upon its vendors in providing the necessary information for compliance, which may provide additional challenges in meeting compliance requirements.
The electric generation business is subject to substantial governmental regulation and may be adversely affected by changes in laws or regulations, as well as liability under, or any future inability to comply with, existing or future regulations or other legal requirements.
The Company'sCompany’s electric generation business is subject to extensive U.S. federal, state and local laws and regulations. Compliance with the requirements under these various regulatory regimes may cause the Company to incur significant additional costs, and failure to comply with such requirements could result in the shutdown of the non-complying facility, the imposition of liens, fines, and/or civil or criminal liability. Public utilities under the FPA are required to obtain FERC acceptance of their rate schedules for wholesale sales of electric energy, capacity and ancillary services. Except for generating facilities located in Hawaii or in Texas within the footprint of ERCOT, which are regulated by the PUCT, all of the Company’s assets make wholesale sales of electric energy, capacity and ancillary services in interstate commerce andgenerating companies are public utilities for purposes ofunder the FPA with market-based rate authority unless otherwise exempt from such status. FERC'sFPA public utility rate regulation. FERC’s orders that grant market-based rate authority to wholesale power marketerssellers reserve the right to revoke or revise that authority if FERC subsequently determines that the seller can exercise market power in transmission or generation, create barriers to entry, or engage in abusive affiliate transactions. In addition, public utilities are subject to FERC reporting requirements that impose administrative burdens and that, if violated, can expose the company to criminal and civil penalties or other risks.
The Company'sCompany’s market-based sales will beare subject to certain rules prohibiting manipulative or deceptive conduct, and if any of the Company'sCompany’s generating companies with market-based rate authority are deemed to have violated those rules, they willcould be subject to potential disgorgement of profits associated with the violation, penalties, suspension or revocation of market basedmarket-based rate authority. If such generating companies were to lose their market-based rate authority, such companies would be required to obtain FERC'sFERC’s acceptance of a cost-of-service rate schedule and could become subject to the significant accounting, record-keeping, and reporting requirements that are imposed on utilities with cost-based rate schedules. This could have a material adverse effect on the rates the Company is able to charge for power from its facilities.
MostAll of the Company'sCompany’s generating assets are operating either as EWGs as defined under the PUHCA, or as QFs as defined under the PURPA, as amended, and therefore are exempt from certain regulation under the PUHCA and the PURPA.FPA. If a facility fails to maintain its status as an EWG or a QF or there are legislative or regulatory changes revoking or limiting the exemptions to the PUHCA and/or the FPA, then the Company may be subject to significant accounting, record-keeping, access to books and records and reporting requirements, and failure to comply with such requirements could result in the imposition of penalties and additional compliance obligations.
Substantially all of the Company'sCompany’s generation assets are also subject to the reliability standards promulgated by the designated Electric Reliability Organization (currently the North American Electric Reliability Corporation, or NERC) and approved by FERC. If the Company fails to comply with the mandatory reliability standards, it could be subject to sanctions, including substantial monetary penalties and increased compliance obligations. The Company will also be affected by legislative and regulatory changes, as well as changes to market design, market rules, tariffs, cost allocations and bidding rules that occur in the existing regional markets operated by RTOs or ISOs, such as PJM. The RTOs/ISOs that oversee most of the wholesale power markets impose, and in the future may continue to impose, mitigation, including price limitations, offer caps, non-performance penalties and other mechanisms to address some of the volatility and the potential exercise of market power in these markets. These types of price limitations and other regulatory mechanisms may have a material adverse effect on the profitability of the Company'sCompany’s generation facilities acquired in the future that sell energy, capacity and ancillary products into the wholesale power markets. The regulatory environment for electric generation has undergone significant changes in the last several years due to state and federal policies affecting wholesale competition and the creation of incentives for the addition of large amounts of new renewable generation and, in some cases, transmission assets. These changes are ongoing, and the Company cannot predict the future design of the wholesale power markets or the ultimate effect that the changing regulatory environment will have on the Company'sCompany’s business. In addition, in some of these markets, interested parties have proposed to re-regulate the markets or require divestiture of electric generation assets by asset owners or operators to reduce their market share. Other proposals to re-regulate may be made and legislative or other attention to the electric power market restructuring process may delay or reverse the deregulation process. If competitive restructuring of the electric power markets is reversed, discontinued, or delayed, the Company'sCompany’s business prospects and financial results could be negatively impacted.
The Company is subject to environmental laws and regulations that impose extensive and increasingly stringent requirements on its operations, as well as potentially substantial liabilities arising out of environmental contamination.
The Company'sCompany’s assets are subject to numerous and significant federal, state and local laws, including statutes, regulations, guidelines, policies, directives and other requirements governing or relating to, among other things: protection of wildlife, including threatened and endangered species; air emissions; discharges into water; water use; the storage, handling, use, transportation and distribution of dangerous goods and hazardous, residual and other regulated materials, such as chemicals; the prevention of releases of hazardous materials into the environment; the prevention, presence and remediation of hazardous materials in soil and groundwater, both on and offsite; land use and zoning matters; and workers'workers’ health and safety matters. The Company'sCompany’s facilities could experience incidents, malfunctions and other unplanned events that could result in spills or emissions in excess of permitted levels and result in personal injury, penalties and property damage. Any failure to comply with applicable environmental laws and regulations, including those relating to equipment failures, or obtain required governmental approvals and permits, may result in the assessment of administrative, civil or criminal penalties, imposition of investigatory or remedial activities and, in certain, less common circumstances, issuance of temporary or permanent injunctions, or construction or operation bans or delays. As such, the operation of the Company'sCompany’s facilities carries an inherent risk of environmental, health and safety liabilities (including potential civil actions, compliance or remediation orders, fines and other penalties), and may result in the assets being involved from time to time in administrative and judicial proceedings relating to such matters. The Company has implemented environmental, health and safety management programs designed to continually improve environmental, health and safety performance. Environmental laws and regulations have generally become more stringent over time. Significant costs may be incurred for capital expenditures under environmental programs to keep the assets compliant with such environmental laws and regulations. If it is not economical to make those expenditures, it may be necessary to retire or mothball facilities or restrict or modify the Company'sCompany’s operations to comply with more stringent standards. These environmental requirements and liabilities could have a material adverse effect on the business, financial condition, results of operations and cash flows.
Risks thatThe Company’s business is subject to complex and evolving U.S. laws and regulations regarding privacy and data protection (“data protection laws”). Many of these laws and regulations are beyond the Company's control, including but not limitedsubject to acts of terrorism or related acts of war, natural disaster, hostile cyber intrusions or other catastrophic events, could have a material adverse effect on the business, financial condition, results of operationschange and cash flows.
The Company's generation facilities that were acquired or those that the Company otherwise acquires or constructsuncertain interpretation, and the facilities of third parties on which they rely may be targets of terrorist activities, as well as events occurring in response to or in connection with them, that could cause environmental repercussions and/or result in full or partial disruption of the facilities ability to generate, transmit, transport or distribute electricity or natural gas. Strategic targets, such as energy-related facilities, may be at greater risk of future terrorist activities than other domestic targets. Hostile cyber intrusions, including those targeting information systems as well as electronic control systems used at the generating plants and for the related distribution systems, could severely disrupt business operations and result in loss of service to customers, as well as create significant expense to repair security breaches or system damage.
Furthermore, certain of the Company's power generation thermal assets are located in active earthquake zones in California and Arizona, and certain project companies and suppliers conduct their operations in the same region or in other locations that are susceptible to natural disasters. In addition, California and some of the locations where certain suppliers are located, from time to time, have experienced shortages of water, electric power and natural gas. The occurrence of a natural disaster, such as an earthquake, drought, flood or localized extended outages of critical utilities or transportation systems, or any critical resource shortages, affecting the Company or its suppliers, could cause a significant interruption in the business, damage or destroy the Company's facilities or those of its suppliers or the manufacturing equipment or inventory of the Company's suppliers. Any such terrorist acts, environmental repercussions or disruptions or natural disasters could result in a significant decrease in revenues or significant reconstruction or remediation costs, beyond what could be recovered through insurance policies, which could have a material adverse effect on the business, financial condition, resultsclaims, increased cost of operations, and cash flows.or otherwise harm the Company’s business.
The operation ofregulatory environment surrounding data privacy and protection is constantly evolving and can be subject to significant change. New data protection laws pose increasingly complex compliance challenges and potentially elevate the Company’s businesses iscosts. Complying with varying jurisdictional requirements could increase the costs and complexity of compliance, and violations of applicable data protection laws can result in significant penalties. Any failure, or perceived failure, by the Company to comply with applicable data protection laws could result in proceedings or actions against the Company by governmental entities or others, subject the Company to cyber-based securitysignificant fines, penalties, judgments, and integrity risk.
Numerous functions affectingnegative publicity, require the efficient operationCompany to change its business practices, increase the costs and complexity of compliance, and adversely affect the Company’s businesses depend onbusiness. As noted above, the secure and reliable storage, processing and communication of electronic data and the use of sophisticated computer hardware and software systems. The operation of the Company's generating assets rely on cyber-based technologies and, therefore,Company is also subject to the risk that such systems could be the targetpossibility of disruptive actions, particularly through cyber-attack or cyber intrusion, including by computer hackers, foreign governments and cyber terrorists, or otherwise be compromised by unintentional events. Ascyberattacks, which themselves may result in a result, operations could be interrupted, property could be damaged and sensitive customer information could be lost or stolen, causingviolation of these laws. Additionally, if the Company to incur significant losses of revenues, other substantial liabilities and damages, costs to replaceacquires a company that has violated or repair damaged equipment and damage to the Company's reputation. In addition,is not in compliance with applicable data protection laws, the Company may experience increased capitalincur significant liabilities and operating costs to implement increased security for its cyber systems and generating assets.penalties as a result.
Government regulations providing incentives for renewable power generation could change at any time and such changes may negatively impact the Company'sCompany’s growth strategy.
The Company'sCompany’s growth strategy depends in part on government policies that support renewable generation and energy storage and enhance the economic viability of owning renewable electricpower generation assets. Renewable power generation assets currently benefit from various federal, state and local governmental incentives such as ITCs, cash grants in lieu of ITCs,PTCs, loan guarantees,guarantee programs, RPS programs modifiedand accelerated cost-recovery system of depreciation for tax purposes. These laws, regulations and bonus depreciation. In December 2015,policies have had a significant impact on the U.S. Congress enacted an extension of the 30% solar ITC so that projects that began construction in 2016 through 2019 will continue to qualify for the 30% ITC. Projects beginning construction in 2020 and 2021 will be eligible for the ITC at the rates of 26% and 22%, respectively. The same legislation also extended the 10-year wind PTC for wind projects that began construction in years 2016 through 2019. Wind projects that begin construction in the years 2018 and 2019 are eligible for PTC at 60% and 40% of the statutory rate per kWh, respectively.
Many states have adopted RPS programs mandating that a specified percentage of electricity sales come from eligible sourcesdevelopment of renewable energy. However, the regulations that govern the RPS programs, including pricing incentives for renewable energy, or reasonableness guidelines for pricing that increase valuation compared to conventional power (such as a projected value for carbon reduction or consideration of avoided integration costs), may change. If the RPS requirements aregeneration projects and they could be changed, reduced or eliminated itat any time. These incentives make the development of renewable power generation projects more competitive by providing tax credits or grants and accelerated depreciation for a portion of the development costs, decreasing the costs and risks associated with developing such projects or creating demand for renewable power assets through RPS programs.
The elimination or loss of, or reduction in, such incentives could lead(i) decrease the attractiveness of renewable power generation projects to fewerdevelopers, including, but not limited to, CEG, which could reduce the Company’s acquisition opportunities, (ii) reduce the Company’s willingness to pursue or develop certain renewable power projects due to higher operating costs or decreased revenues under its PPAs, (iii) cause the market for future power contracts or leadrenewable energy PPAs to lowerbe smaller and the prices for future renewable energy PPAs to be lower and/or (iv) result in increased financing costs and difficulty in obtaining financing on acceptable terms.
Any of the sale of power in future power contracts, whichforegoing could have a material adverse effect on the Company's future growth prospects. Such material adverse effects may result from decreased revenues, reduced economic returns on certain project company investments, increased financing costs, and/or difficulty obtaining financing. Furthermore, the ARRA included incentives to encourage investment in the renewable energy sector, such as cash grants in lieu of ITCs, bonus depreciation and expansion of the U.S. DOE loan guarantee program. It is uncertain what loan guarantees may be made by the U.S. DOE loan guarantee program in the future. In addition, the cash grant in lieu of ITCs program only applies to facilities that commenced construction prior to December 31, 2011, which commencement date may be determined in accordance with the safe harbor if more than 5% of the total cost of the eligible property was paid or incurred by December 31, 2011.
If the Company is unable to utilize various federal, state and local government incentives to acquire additional renewable assets in the future, or the terms of such incentives are revised in a manner that is less favorable to the Company, it may suffer a material adverse effect on the business, financial condition, results of operations and cash flows.
The Company relies on electric interconnection and transmission facilities that it does not own or control and that are subject to transmission constraints within a number of the Company's regions. If these facilities fail to provide the Company with adequate transmission capacity, it may be restricted in its ability to deliver electric power to its customers and may either incur additional costs or forego revenues.
The Company depends on electric interconnection and transmission facilities owned and operated by others to deliver the wholesale power it will sell from its electric generation assets to its customers. A failure or delay in the operation or development of these interconnection or transmission facilities or a significant increase in the cost of the development of such facilities could result in lost revenues. Such failures or delays could limit the amount of power the Company's operating facilities deliver or delay the completion of the Company's construction projects. Additionally, such failures, delays or increased costs could have a material adverse effect on the business, financial condition and results of operations. If a region's power transmission infrastructure is inadequate, the Company's recovery of wholesale costs and profits may be limited. If restrictive transmission price regulation is imposed, the transmission companies may not have a sufficient incentive to invest in expansion of transmission infrastructure. The Company also cannot predict whether interconnection and transmission facilities will be expanded in specific markets to accommodate competitive access to those markets. In addition, certain of the Company's operating facilities' generation of electricity may be curtailed without compensation due to transmission limitations or limitations on the electricity grid's ability to accommodate intermittent electricity generating sources, reducing the Company's revenues and impairing its ability to capitalize fully on a particular facility's generating potential. Such curtailments could have a material adverse effect on the business, financial condition, results of operations and cash flows. Furthermore, economic congestion on transmission networks in certain of the markets in which the Company operates may occur and the Company may be deemed responsible for congestion costs. If the Company were liable for such congestion costs, its financial results could be adversely affected.
The Company's costs, results of operations, financial condition and cash flows could be adversely impacted by the disruption of the fuel supplies necessary to generate power at its conventional and thermal power generation facilities.
Delivery of fossil fuels to fuel the Company's conventional and thermal generation facilities is dependent upon the infrastructure (including natural gas pipelines) available to serve each such generation facility as well as upon the continuing financial viability of contractual counterparties. As a result, the Company is subject to the risks of disruptions or curtailments in the production of power at these generation facilities if a counterparty fails to perform or if there is a disruption in the fuel delivery infrastructure.
If the Company is deemed to be an investment company, the Company may be required to institute burdensome compliance requirements and the Company's activities may be restricted, which may make it difficult for the Company to complete strategic acquisitions or effect combinations.
If the Company is deemed to be an investment company under the Investment Company Act of 1940, or the Investment Company Act, the Company's business would be subject to applicable restrictions under the Investment Company Act, which could make it impracticable for the Company to continue its business as contemplated.
The Company believes it is not an investment company under Section 3(b)(1) of the Investment Company Act because the Company is primarily engaged in a non-investment company business. The Company intends to conduct its operations so that the Company will not be deemed an investment company. However, if the Company were to be deemed an investment company, restrictions imposed by the Investment Company Act, including limitations on the Company's capital structure and the Company's ability to transact with affiliates, could make it impractical for the Company to continue its business as contemplated.
The Company depends on key management employees, the loss of any of which could have a material adverse effect on the Company's financial condition and results of operations.
The Company believes its current operations and future success depend largely on the continued services of the management employees that it employs, in particular Christopher Sotos, the Company’s President and Chief Executive Officer and Chad Plotkin, the Company’s Senior Vice President and Chief Financial Officer. Although the Company currently has access to the resources of NRG, the loss of Mr. Sotos’ or Mr. Plotkin’s services, or other key management personnel employed by the Company in connection with the NRG Transaction or in the future, could have a material adverse effect on the Company’s financial condition and results of operations.
Risks Related to the Company's Relationship with NRG
NRG exercises substantial influence over the Company through its position as controlling shareholder of Yield, Inc. The Company is highly dependent on NRG.
NRG owns all of the outstanding Class B and Class D common stock of Yield, Inc. and owns 55.1% of the combined voting power of Yield, Inc. as of December 31, 2017. As a result of NRG's ownership of Yield, Inc. and Yield, Inc.'s position as sole managing member of the Company, NRG has a substantial influence on the Company's affairs and its voting power will constitute a large percentage of any quorum of Yield, Inc.'s stockholders voting on any matter requiring the approval of its stockholders. Such matters include approval of mergers or sale of all or substantially all of its assets. This concentration of ownership may also have the effect of delaying or preventing a change in control of Yield, Inc. or discouraging others from making tender offers for their shares. In addition, NRG has the right to elect all of Yield, Inc.'s directors. NRG may cause corporate actions to be taken even if their interests conflict with the interests of Yield, Inc.'s other stockholders (including holders of Yield, Inc.'s Class A and Class C common stock). If the NRG Transaction is consummated, GIP will become Yield, Inc.'s controlling stockholder and, like NRG, will have substantial control and influence over the Company. See the risk factor entitled “Following the consummation of the NRG Transaction, GIP and its affiliates will control the Company and have the ability to designate a majority of the members of the Company’s Board.”
Furthermore, the Company depends on the management and administration services provided by or under the direction of NRG under the Management Services Agreement. NRG personnel and support staff that provide services to the Company under the Management Services Agreement are not required to, and the Company does not expect that they will, have as their primary responsibility the management and administration of the Company or to act exclusively for the Company and the Management Services Agreement does not require any specific individuals to be provided by NRG. Under the Management Services Agreement, NRG has the discretion to determine which of its employees perform assignments required to be provided to the Company. Any failure to effectively manage the Company's operations or to implement its strategy could have a material adverse effect on the business, financial condition, results of operations and cash flows. The Management Services Agreement will continue in perpetuity, until terminated in accordance with its terms.
The Company also depends upon NRG for the provision of management, administration and certain other services at all of the Company's facilities and contracts with NRG, or its subsidiaries, to procure fuel and sell power for certain of its operating facilities. Any failure by NRG to perform its requirements under these arrangements or the failure by the Company to identify and contract with replacement service providers, if required, could adversely affect the operation of the Company's facilities and have a material adverse effect on the business, financial condition, results of operations and cash flows.
In connection with the proposed NRG Transaction, GIP has agreed to enter into certain agreements with the Company relating to the provision of services and NRG has agreed to enter into certain agreements with the Company relating to transition services and ongoing commercial arrangements. While the provision of transitional services is contemplated under the proposed NRG Transaction, it is uncertain whether, after the transition services end, GIP or its affiliates would continue to provide the same services, or offer the same capabilities and resources, to the Company that the Company currently receives from NRG or whether the Company may have to seek alternative service providers. The Company may not be able to replicate the same level of services, capabilities, experience and familiarity with the Company’s business offered by NRG either through GIP or through alternative service providers or on terms or costs similar to those provided by NRG. The loss of services provided by NRG and the benefits offered to the Company through its relationship with NRG, such as management, operational and financing expertise, could have an impact on the Company’s business, financial condition, results of operations and cash flows. See also the risk factor entitled “If NRG terminates the Management Services Agreement or defaults in the performance of its obligations under the agreement, or if the transition services to be provided by NRG to the Company in connection with the consummation of the NRG Transaction are inadequate or end, the Company may be unable to contract with a substitute service provider on similar terms, or at all.”
The Company may not be able to consummate future acquisitions from NRG.
Until the NRG Transaction is consummated, if at all, the Company's ability to grow through acquisitions depends, in part, on NRG's ability to identifyits business and present the Company with acquisition opportunities. NRGmake cash distributions.
Revenue earned by GenConn is established the Company to hold and acquire a diversified suite of power generating assets in the U.S. and its territories. Although NRG has agreed to grant the Company a right of first offer with respect to certain power generation assets that NRG may elect to sell in the future, NRG is under no obligation to sell any such power generation assets or to accept any related offer from the Company. In addition, NRG has not agreed to commit any minimum level of dedicated resources for the pursuit of renewable power-related acquisitions. There are a number of factors which could materially and adversely impact the extent to which suitable acquisition opportunities are made available from NRG, including:
the same professionals within NRG's organization that are involved in acquisitions that are suitable for the Company have responsibilities within NRG's broader asset management business, which may include sourcing acquisition opportunities for NRG. Limits on the availability of such individuals will likewise resulteach year in a limitation onrate case; accordingly, the availabilityprofitability of acquisition opportunities for the Company; and
in addition to structural limitations, the question of whether a particular asset is suitable is highly subjective andits assets is dependent on a number of factors including an assessmentregulatory approval.
Revenues related to GenConn are established each year by NRG relating to the Company's liquidity position at the time, the risk profile of the opportunity and its fit with the balance of the Company's then current operations and other factors. If NRG determines that an opportunityConnecticut Public Utilities Regulatory Authority. While such regulatory oversight is not suitable for the Company, it may still pursue such opportunity on its own behalf, or on behalf of another NRG affiliate.
In making these determinations, NRG may be influenced by factors that result in a misalignment with the Company's interests or conflict of interest.
The departure of some or all of NRG's employees could prevent the Company from achieving its objectives.
The Company dependsgenerally premised on the diligence, skillrecovery of prudently incurred costs and business contactsa reasonable rate of NRG's professionals andreturn on invested capital, the information and opportunities they generate during the normal course of their activities. Furthermore, approximately 24% of NRG's employees at the Company's generation plants are covered by collective bargaining agreements as of December 31, 2017. The Company's future success will depend on the continued service of these individuals, who are not obligated to remain employed with NRG, or otherwise successfully renegotiate their collective bargaining agreements when such agreements expire or otherwise terminate. NRG has experienced departures of key professionals and personnel in the past andrates that GenConn may do so if the NRG Transaction is consummated, and the Company cannot predict the impact that any such departures will have on its ability to achieve its objectives. The Management Services Agreement does not require NRG to maintain the employment of any of its professionals or to cause any particular professional to provide services to the Company or on its behalf. The departure of a significant number of NRG's professionals or a material portion of the NRG employees who work at any of the Company's facilities for any reason,charge, or the failure to appoint qualified or effective successors in the event of such departures, could have a material adverse effect on the Company's ability to achieve its objectives.
The Company's organizational and ownership structure may create significant conflicts of interest that may be resolved in a manner that is not in the best interests of the Company and that may have a material adverse effect on the business, financial condition, results of operations and cash flows.
The Company's organizational and ownership structure involves a number of relationships that may give rise to certain conflicts of interest between the Company and NRG. Pursuant to the Management Services Agreement with NRG, certain of the Company's executive officers are shared NRG executives and devote their time to both the Company and NRG as needed to conduct the respective businesses. Although the Company's directors and executive officers owe fiduciary duties to the Company's stockholders, these shared NRG executives have fiduciary and other duties to NRG, which duties may be inconsistent with the Company's best interests. In addition, NRG and its representatives, agents and affiliates have access to the Company's confidential information. Although some of these persons are subject to confidentiality obligations pursuant to confidentiality agreements or implied duties of confidence, the Management Services Agreement does not contain general confidentiality provisions.
Additionally, all of the Company's executive officers continue to have economic interests in NRG and, accordingly, the benefit to NRG from a transaction between the Company and NRG will proportionately inure to their benefit as holders of economic interests in NRG. NRG is a related person under the applicable securities laws governing related person transactions and may have interests which differ from the Company's interests, including with respect to the types of acquisitions made, the timing and amount of distributions by the Company, the reinvestment of returns generated by the Company's operations, the use of leverage when making acquisitions and the appointment of outside advisors and service providers. Any material transaction between the Company and NRG will be subject to Yield, Inc.'s related person transaction policy, which will require prior approval of such transaction by Yield, Inc.'s Corporate Governance, Conflicts and Nominating Committee. Those of the Company's executive officers who have economic interests in NRG may be conflicted when advising Yield, Inc.'s Corporate Governance, Conflicts and Nominating Committees or otherwise participating in the negotiation or approval of such transactions. These executive officers have significant project- and industry-specific expertise that could prove beneficial to the Company's decision-making process and the absence of such strategic guidance could have a material adverse effect on the board committees' ability to evaluate any such transaction. Furthermore, the creation of Yield, Inc.'s Corporate Governance, Conflicts and Nominating Committee and Yield, Inc.'s related person transaction approval policy may not insulate the Company from derivative claims with respect to related person transactions and the conflicts of interest described in this risk factor. Regardless of the merits of such claims, the Company may be required to expend significant management time and financial resources in the defense thereof. Additionally, to the extent the Company fails to appropriately deal with any such conflicts, it could negatively impact the Company's reputation and ability to raise additional funds and the willingness of counterparties to do business with the Company, all of which could have a material adverse effect on the business, financial condition, results of operations and cash flows.
The Company may be unable or unwilling to terminate the Management Services Agreement.
The Management Services Agreement providesrevenue that the Company may terminate the agreement upon 30 days prior written notice to NRG upon the occurrence of any of the following: (i) NRG defaults in the performance or observance of any material term, condition or covenant contained therein in a manner that results in material harm to the Company and the default continues unremediedearn through its GenConn investment, which is accounted for a period of 30 days after written notice thereof is given to NRG; (ii) NRG engages in any act of fraud, misappropriation of funds or embezzlement that results in material harm to the Company; (iii) NRG is grossly negligent in the performance of its duties under the agreement and such negligence results in material harmequity method, with respect to the Company; or (iv) upon the happening of certain events relatingthis capacity are subject to the bankruptcy or insolvency of NRG. Furthermore, if the Company requests an amendment to the scope of services provided by NRG under the Management Services Agreement and is not able to agree with NRG as to a change to the service fee resulting from a change in the scope of services within 180 days of the request, the Company will be able to terminate the agreement upon 30 days prior notice to NRG. The Company will not be able to terminate the agreement for any other reason, including if NRG experiences a change of control, and the agreement continues in perpetuity, until terminated in accordance with its terms.
If NRG terminates the Management Services Agreement or defaults in the performance of its obligations under the agreement, or if the transition services to be provided by NRG to the Company in connection with the consummation of the NRG Transaction are inadequate or end, the Company may be unable to contract with a substitute service provider on similar terms, or at all.
The Company relies on NRG to provide management services under the Management Services Agreement and has limited executive or senior management personnel independent from NRG. The Management Services Agreement provides that NRG may terminate the agreement upon 180 days prior written notice of termination to the Company if it defaults in the performance or observance of any material term, condition or covenant contained in the agreement in a manner that results in material harm and the default continues unremedied for a period of 30 days after written notice of the breach is given. If NRG terminates the Management Services Agreement or defaults in the performance of its obligations under the agreement, or if the transition services to be provided by NRG to the Company, in the event the NRG Transaction is consummated, are not adequate or end, the Company may be unable to contract with GIP or a substitute service provider on similar terms or at all, and the costs of substituting service providers may be substantial. In addition, in light of NRG's familiarity with the Company's assets, GIP or a substitute service provider may not be able to provide the same level of service due to lack of pre-existing synergies. If the Company cannot locate a service provider that is able to provide substantially similar services as NRG does under the Management Services Agreement on similar terms, it could have a material adverse effect on the business, financial condition, results of operation and cash flows.
The liability of NRG is limited under the Company's arrangements with it and the Company has agreed to indemnify NRG against claims that it may face in connection with such arrangements, which may lead NRG to assume greater risks when making decisions relating to the Company than it otherwise might if acting solely for its own account.
Under the Management Services Agreement, NRG does not assume any responsibility other than to provide or arrange for the provision of the services described in the Management Services Agreement in good faith. In addition, under the Management Services Agreement, the liability of NRG and its affiliates is limited to the fullest extent permitted by law to conduct involving bad faith, fraud, willful misconduct or gross negligence or, in the case of a criminal matter, action that was known to have been unlawful. In addition, the Company has agreed to indemnify NRG to the fullest extent permitted by law from and against any claims, liabilities, losses, damages, costs or expenses incurred by an indemnified person or threatened in connection with the Company's operations, investments and activities or in respect of or arising from the Management Services Agreement or the services provided by NRG, except to the extent that the claims, liabilities, losses, damages, costs or expenses are determined to have resulted from the conduct in respect of which such persons have liability as described above. These protections may result in NRG tolerating greater risks when making decisions than otherwise might be the case, including when determining whether to use leverage in connection with acquisitions. The indemnification arrangements to which NRG is a party may also give rise to legal claims for indemnification that are adverse to the Company.
Certain of the Company’s PPAs and project-level financing arrangements include provisions that would permit the counterparty to terminate the contract or accelerate maturity in the event NRG ceases to control or own, directly or indirectly, a majority of the voting power of the Company.
Certain of the Company’s PPAs and project-level financing arrangements contain change in control provisions that provide the counterparty with a termination right or the ability to accelerate maturity in the event of a change of control of the Company without the counterparty's consent. These provisions are triggered in the event NRG ceases to own, directly or indirectly, capital stock representing more than 50% of the voting power of all of Yield, Inc.’s capital stock outstanding on such date, or, in some cases, if NRG ceases to be the majority owner, directly or indirectly,authorization of the applicable project subsidiary. As a result, if NRG ceases to control, or in some cases, own a majority of the voting power of the Company, as is contemplated by the NRG Transaction, the counterparties could terminate such contracts or accelerate the maturity of such financing arrangements. Even though the Company’s consent to the NRG Transaction is conditioned upon the receipt of consents from such counterparties, the Company may have to expend significant resources and funds to obtain the consents of such counterparties to the NRG Transaction and thereregulatory authorities. There can be no assurance that such counterpartiesregulatory authorities will provide their consents at all. The termination of anyconsider all of the Company’s PPAscosts to have been prudently incurred or that the accelerationregulatory process by which rates or revenues are determined will always result in rates or revenues that achieve full recovery of the maturity of any ofcosts or an adequate return on the Company’s project-level financingcapital investments. While GenConn’s rates and revenues are generally established based on an analysis of costs incurred in a base year, the rates GenConn is allowed to charge, and the revenues GenConn is authorized to earn, may or may not match the costs at any given time. If GenConn’s costs are not adequately recovered through these regulatory processes, it could have a material adverse effect on the Company’s business, financial condition, results of operations and cash flow.flows.
The Company’s ability to comply with tax laws and policies may depend on its contractual arrangements and information provided by third parties and may require significant resources.
The IRA contains stringent compliance, recordkeeping and certification requirements in order to claim tax credits and incentives available. Additionally, in order to avoid possibly losing available credits, the Company must comply with prevailing wage and apprenticeship requirements applicable to projects on which construction began on or after December 31, 2022. The IRA does permit that certain defects in meeting the requirements may be timely cured under certain conditions rather than causing a loss of the tax credits.
Moreover, the documentation required for this compliance will come from third-party vendors, including equipment manufacturers and engineering, procurement and construction contractors and subcontractors as well as the Company’s internal sources. In addition, if there are defects in compliance with the prevailing wages and apprenticeship requirements, the payments to cure such deficiencies will need to be made by these third parties to their employees. The conduct of these third parties can also impact the right to claim tax credits and/or the exposure to penalties if they fail to adequately comply with the tax laws.
While the Company has secured and will continue to attempt to secure the necessary access to the information required to meet its compliance and certification requirements under the tax law and has included and will continue to include in contracts with third parties rights to have third parties make cure payments if necessary, the Company may not be able to control whether appropriate documentation is actually available or provided in a timely manner and/or whether cure actions are taken by a third party in a timely fashion. This may result in the incurrence of penalties and loss of tax credits. It is also possible that the terms negotiated with third parties fail to meet the requirements of tax law either with respect to compliance requirements, documentation or conduct of third-parties. The impact of such noncompliance could materially adversely affect the Company’s business, financial condition and results of operations.
Moreover, the costs and resources required to adequately comply with the requirements of the IRA and to monitor the activities of third parties are still to be determined as the Company puts in place its compliance and documentation program and as guidance from the Treasury in the form of notices and regulations continues to be issued.
CAUTIONARY STATEMENT REGARDING FORWARD-LOOKING INFORMATION
This Annual Report on Form 10-K of NRG YieldClearway Energy LLC, together with its consolidated subsidiaries, or the Company, includes forward-looking statements within the meaning of Section 27A of the Securities Act of 1933, as amended, or the Securities Act, and Section 21E of the Securities Exchange Act of 1934, as amended, or the Exchange Act. The words "believes," "projects," "anticipates," "plans," "expects," "intends," "estimates"“believes,” “projects,” “anticipates,” “plans,” “expects,” “intends,” “estimates” and similar expressions are intended to identify forward-looking statements. These forward-looking statements involve known and unknown risks, uncertainties and other factors that may cause the Company'sCompany’s actual results, performance and achievements, or industry results, to be materially different from any future results, performance or achievements expressed or implied by such forward-looking statements. These factors, risks and uncertainties include the factors described under Item 1A — Risk Factors and the following:
•The Company'sCompany’s ability to maintain and grow its quarterly distributions;
•Potential risks related to the Company as a result of the NRG Transaction;Company’s relationships with CEG and its owners;
•The Company'sCompany’s ability to successfully identify, evaluate and consummate acquisitions from, and dispositions to, third parties;
•The Company'sCompany’s ability to acquire assets from NRG;CEG;
•The Company'sCompany’s ability to raiseborrow additional funds and access capital due to itsmarkets, as well as the Company’s substantial indebtedness corporate structure, market conditions or otherwise;and the possibility that the Company may incur additional indebtedness going forward;
•Changes in law, including judicial decisions;
•Hazards customary to the power production industry and power generation operations such as fuel and electricity price volatility, unusual weather conditions (including wind and solar conditions), catastrophic weather-related or other damage to facilities, unscheduled generation outages, maintenance or repairs, unanticipated changes to fuel supply costs or availability due to higher demand, shortages, transportation problems or other developments, environmental incidents, or electric transmission or gas pipeline system constraints and the possibility that the Company may not have adequate insurance to cover losses as a result of such hazards;
•The Company'sCompany’s ability to operate its businesses efficiently, manage maintenance capital expenditures and costs effectively, and generate earnings and cash flows from its asset-based businesses in relation to its debt and other obligations;
•The willingness and ability of counterparties to the Company'sCompany’s offtake agreements to fulfill their obligations under such agreements;
•The Company'sCompany’s ability to enter into contracts to sell power and procure fuel on acceptable terms and prices as current offtake agreements expire;prices;
•Government regulation, including compliance with regulatory requirements and changes in market rules, rates, tariffs and environmental laws;
•Operating and financial restrictions placed on the Company that are contained in the project-level debt facilities and other agreements of certain subsidiaries and project-level subsidiaries generally, in the NRG YieldClearway Energy Operating LLC amended and restated revolving credit facility and in the indentures governing the Senior Notes; and
•Cyber terrorism and inadequate cybersecurity, or the occurrence of a catastrophic loss and the possibility that the Company may not have adequate insurance to cover losses resulting from such hazards or the inability of the Company'sCompany’s insurers to provide coverage;
The Company's ability to engage in successful mergers and acquisitions activity; and
The Company's ability to borrow additional funds and access capital markets, as well as the Company's substantial indebtedness and the possibility that the Company may incur additional indebtedness going forward.coverage.
Forward-looking statements speak only as of the date they were made, and the Company undertakes no obligation to publicly update or revise any forward-looking statements, whether as a result of new information, future events or otherwise. The foregoing review of factors that could cause the Company'sCompany’s actual results to differ materially from those contemplated in any forward-looking statements included in this Annual Report on Form 10-K should not be construed as exhaustive.
Item 1B — Unresolved Staff Comments
None.
Item 1C — Cybersecurity
Risk Management and Strategy
The Company recognizes the critical importance of developing, implementing and maintaining robust cybersecurity measures to safeguard information systems and protect the confidentiality, integrity and availability of data.
Managing Material Risks & Integrated Overall Risk Management
The Company has strategically integrated cybersecurity risk management into its broader risk management framework to promote a company-wide culture of cybersecurity risk management. The Company’s risk management team works closely with the IT department to continuously evaluate and address cybersecurity risks in alignment with business objectives and operational needs. In addition, the Company follows the National Institute of Standards and Technology (NIST) 800-53 Cybersecurity Framework.
Engage Third Parties on Risk Management
Recognizing the complexity and evolving nature of cybersecurity threats, the Company engages with a range of external experts, including cybersecurity consultants in evaluating and testing its risk management systems. The Company’s collaboration with these third parties includes regular audits; threat and vulnerability assessments; incident response plan testing; company-wide monitoring of cybersecurity risks; and consultation on security enhancements.
Oversee Third-Party Risk
Due to the risks associated with the engagement of third-party vendors, service providers and business partners, the Company applies stringent processes to manage these risks. Thorough security assessments of all third-party providers with access to internal data and information systems occurs before engagement, as well as ongoing monitoring to ensure compliance with relevant cybersecurity standards. The monitoring includes annual assessments by CEG’s Vice President of Information Technology and its Director of Cybersecurity and assessments on an ongoing basis by the internal cybersecurity team. These services are provided to the Company pursuant to the CEG Master Services Agreement. This approach is designed to mitigate risks related to data breaches or other security incidents originating from third parties.
Risks from Cybersecurity Threats
The Company has not been subject to cybersecurity challenges or incidents that have materially affected, or are reasonably likely to materially affect the Company, its operations or financial standing.
Governance
Board of Directors Oversight
Clearway, Inc.’s Board of Directors has oversight of cybersecurity risks and is well informed with respect to the nature and scope of such risks. The Board of Directors is acutely aware of the critical nature of managing risks associated with cybersecurity threats. The Board has established oversight mechanisms to ensure effective governance in managing risks associated with cybersecurity as they recognize the significance of these risks and threats to operational integrity and stakeholder confidence.
Reporting to Board of Directors
The Vice President of Information Technology and Director of Cybersecurity play a pivotal role in informing Clearway, Inc.’s Board of Directors on cybersecurity risks. They provide briefings to the Board of Directors on a regular basis, with a minimum frequency of once per year. These briefings encompass a broad range of topics, including:
•Current cybersecurity threat landscape and emerging threats;
•Status of ongoing cybersecurity initiatives and strategies;
•Incident reports and learnings from any meaningful cybersecurity events; and
•Compliance status and efforts with regulatory requirements and industry standards.
In addition to scheduled meetings, the Board of Directors of Clearway, Inc., the Vice President of Information Technology and the Director of Cybersecurity maintain an ongoing dialogue regarding emerging cybersecurity risks. Together, they receive updates on significant developments in the cybersecurity domain. The Board of Directors actively participates in strategic decisions related to cybersecurity, offering guidance and approval for major strategic decisions and initiatives. This involvement advances the Company’s overall strategy that cybersecurity considerations are integrated into its broader strategic objectives. The Board of Directors conducts an annual review of the Company’s cybersecurity posture and the effectiveness of its risk management strategies through the information, findings and recommendations from the Company’s internal cybersecurity team as well as third-party audits, penetration tests and incident response plan testing outcomes. This review helps identify areas for improvement and helps align cybersecurity efforts with the overall risk management framework.
Cybersecurity Risk Management Personnel
Primary responsibility for assessing, monitoring and managing cybersecurity risks is overseen by the Vice President of Information Technology and Director of Cybersecurity, whose services are provided to the Company under the CEG Master Services Agreement.
With over 20 years of experience in the field of cybersecurity, the current Vice President of Information Technology brings a wealth of expertise to their role. Their background includes extensive experience in information technology, and their in-depth knowledge and experience are instrumental in developing and executing the Company’s cybersecurity strategies. They oversee the Company’s IT governance programs; test compliance with internal, industry and regulatory standards; remediate known risks; and lead the Company’s employee training program.
The current Director of Cybersecurity has over 30 years of experience in information technology across a variety of industries and compliance programs. The Director of Cybersecurity has been heavily focused on cybersecurity in regulated industries for the past 10 years.
Management’s Role Managing Cybersecurity Risk
The Vice President of Information Technology and Director of Cybersecurity regularly inform the Company’s management of all aspects related to cybersecurity risks and incidents. This ensures that the highest levels of management are kept abreast of the cybersecurity posture and potential risks facing the Company. Furthermore, significant cybersecurity matters and strategic risk management decisions are escalated to Clearway, Inc.’s Board of Directors, ensuring that they have insight and can provide guidance on critical cybersecurity issues.
Monitor Cybersecurity Incidents
The Vice President of Information Technology and Director of Cybersecurity are continually informed about the latest developments in cybersecurity, including emerging threats and innovative risk management techniques. They implement and oversee processes for the regular monitoring of the Company’s information systems. This includes the deployment of advanced security measures and regular system audits to identify potential vulnerabilities. In the event of a cybersecurity incident, the Company is equipped with a defined and practiced incident response plan, which includes retainers from respected third parties. This plan includes immediate actions to mitigate the impact of the incident, long-term strategies for remediation and the prevention of future incidents.
Item 2 — Properties
Listed below are descriptions of the Company'sCompany’s interests in facilities, operations and/or projects owned or leased that were operating as of December 31, 2017.2023.
| | | | | | | | | | | | | | | | | | | | | | | | | | | | | | | | | | | | | | | | | | | | | | | | | | |
| | | | Capacity | | | | | | | | |
| | | | Rated MW | | Net MW(a) | | Ownership | | | | | | Long-term Contract Terms |
| Assets | | Location | | | | | Fuel | | COD | | Counterparty | | Expiration |
| Conventional | | | | | | | | | | | | | | | | |
| Carlsbad | | Carlsbad, CA | | 527 | | | 527 | | | 100 | % | | Natural Gas | | December 2018 | | San Diego Gas & Electric | | 2038 |
| El Segundo | | El Segundo, CA | | 550 | | | 550 | | | 100 | % | | Natural Gas | | August 2013 | | SCE | | 2026 - 2027 |
| GenConn Devon | | Milford, CT | | 190 | | | 95 | | | 50 | % | | Natural Gas/Oil | | June 2010 | | Connecticut Light & Power | | 2040 |
| GenConn Middletown | | Middletown, CT | | 190 | | | 95 | | | 50 | % | | Natural Gas/Oil | | June 2011 | | Connecticut Light & Power | | 2041 |
| Marsh Landing | | Antioch, CA | | 720 | | | 720 | | | 100 | % | | Natural Gas | | May 2013 | | Various | | 2026 - 2030 |
| Walnut Creek | | City of Industry, CA | | 485 | | | 485 | | | 100 | % | | Natural Gas | | May 2013 | | SCE | | 2026 |
| Total Conventional | | 2,662 | | | 2,472 | | | | | | | | | | | |
| Utility Scale Solar | | | | | | | | | | | | | | |
| Agua Caliente | | Dateland, AZ | | 290 | | | 148 | | | 51 | % | | Solar | | June 2014 | | PG&E | | 2039 |
| Alpine | | Lancaster, CA | | 66 | | | 66 | | | 100 | % | | Solar | | January 2013 | | PG&E | | 2033 |
| Avenal | | Avenal, CA | | 45 | | | 23 | | | 50 | % | | Solar | | August 2011 | | PG&E | | 2031 |
| Avra Valley | | Pima County, AZ | | 27 | | | 27 | | | 100 | % | | Solar | | December 2012 | | Tucson Electric Power | | 2032 |
| Blythe | | Blythe, CA | | 21 | | | 21 | | | 100 | % | | Solar | | December 2009 | | SCE | | 2029 |
| Borrego | | Borrego Springs, CA | | 26 | | | 26 | | | 100 | % | | Solar | | February 2013 | | San Diego Gas and Electric | | 2038 |
Buckthorn Solar (b) | | Fort Stockton, TX | | 150 | | | 150 | | | 100 | % | | Solar | | July 2018 | | City of Georgetown, TX | | 2043 |
| CVSR | | San Luis Obispo, CA | | 250 | | | 250 | | | 100 | % | | Solar | | October 2013 | | PG&E | | 2038 |
Daggett 2 (b) | | San Bernardino, CA | | 182 | | | 46 | | | 25 | % | | Solar | | December 2023 | | Various | | 2038 |
| | | | 131 | | | 33 | | | 25 | % | | BESS | | | | | | |
Daggett 3 (b) | | San Bernardino, CA | | 300 | | | 75 | | | 25 | % | | Solar | | July - November 2023 | | Various | | 2033 - 2038 |
| | | | 149 | | | 37 | | | 25 | % | | BESS | | | | | | |
| Desert Sunlight 250 | | Desert Center, CA | | 250 | | | 63 | | | 25 | % | | Solar | | December 2014 | | SCE | | 2034 |
| Desert Sunlight 300 | | Desert Center, CA | | 300 | | | 75 | | | 25 | % | | Solar | | December 2014 | | PG&E | | 2039 |
| Kansas South | | Lemoore, CA | | 20 | | | 20 | | | 100 | % | | Solar | | June 2013 | | PG&E | | 2033 |
Mililani I (b) | | Honolulu, HI | | 39 | | | 20 | | | 50 | % | | Solar | | July 2022 | | Hawaiian Electric Company | | 2042 |
| | | | 39 | | | 20 | | | 50 | % | | BESS | | | | | | |
Oahu Solar Projects (b) | | Oahu, HI | | 61 | | | 61 | | | 100 | % | | Solar | | September 2019 | | Hawaiian Electric Company | | 2041 |
| Roadrunner | | Santa Teresa, NM | | 20 | | | 20 | | | 100 | % | | Solar | | August 2011 | | El Paso Electric | | 2031 |
Rosamond Central (b) | | Rosamond, CA | | 192 | | | 96 | | | 50 | % | | Solar | | December 2020 | | Various | | 2035 - 2047 |
| TA High Desert | | Lancaster, CA | | 20 | | | 20 | | | 100 | % | | Solar | | March 2013 | | SCE | | 2033 |
Texas Solar Nova 1 (b) | | Kent County, TX | | 252 | | | 126 | | | 50 | % | | Solar | | December 2023 | | Verizon | | 2042 |
| Utah Solar Portfolio | | Various | | 530 | | | 530 | | | 100 | % | | Solar | | July - September 2016 | | PacifiCorp | | 2036 |
Waiawa (b) | | Honolulu, HI | | 36 | | | 18 | | | 50 | % | | Solar | | January 2023 | | Hawaiian Electric Company | | 2043 |
| | | | 36 | | | 18 | | | 50 | % | | BESS | | | | | | |
| Total Utility Scale Solar | | 3,432 | | | 1,989 | | | | | | | | | | | |
|
| | | | | | | | | | | | | | | | | | | |
| | | | | Capacity | | | | | | | | | | |
| | | | | Rated MW | | Net MW(a) | | Owner-ship | | | | | | PPA Terms |
| Assets | | Location | | | | | Fuel | | COD | | Counterparty | | Expiration |
| Conventional | | | | | | | | | | | | | | | | |
| El Segundo | | El Segundo, CA | | 550 |
| | 550 |
| | 100 | % | | Natural Gas | | August 2013 | | Southern California Edison | | 2023 |
| GenConn Devon | | Milford, CT | | 190 |
| | 95 |
| | 50 | % | | Natural Gas/Oil | | June 2010 | | Connecticut Light & Power | | 2040 |
| GenConn Middletown | | Middletown, CT | | 190 |
| | 95 |
| | 50 | % | | Natural Gas/Oil | | June 2011 | | Connecticut Light & Power | | 2041 |
| Marsh Landing | | Antioch, CA | | 720 |
| | 720 |
| | 100 | % | | Natural Gas | | May 2013 | | Pacific Gas and Electric | | 2023 |
| Walnut Creek | | City of Industry, CA | | 485 |
| | 485 |
| | 100 | % | | Natural Gas | | May 2013 | | Southern California Edison | | 2023 |
| Total Conventional | | 2,135 |
| | 1,945 |
| | | | | | | | | | |
| Utility Scale Solar | | | | | | | | | | | | | | |
| Agua Caliente | | Dateland, AZ | | 290 |
| | 46 |
| | 16 | % | | Solar | | June 2014 | | Pacific Gas and Electric | | 2039 |
| Alpine | | Lancaster, CA | | 66 |
| | 66 |
| | 100 | % | | Solar | | January 2013 | | Pacific Gas and Electric | | 2033 |
| Avenal | | Avenal, CA | | 45 |
| | 23 |
| | 50 | % | | Solar | | August 2011 | | Pacific Gas and Electric | | 2031 |
| Avra Valley | | Pima County, AZ | | 26 |
| | 26 |
| | 100 | % | | Solar | | December 2012 | | Tucson Electric Power | | 2032 |
| Blythe | | Blythe, CA | | 21 |
| | 21 |
| | 100 | % | | Solar | | December 2009 | | Southern California Edison | | 2029 |
| Borrego | | Borrego Springs, CA | | 26 |
| | 26 |
| | 100 | % | | Solar | | February 2013 | | San Diego Gas and Electric | | 2038 |
| CVSR | | San Luis Obispo, CA | | 250 |
| | 250 |
| | 100 | % | | Solar | | October 2013 | | Pacific Gas and Electric | | 2038 |
| Desert Sunlight 250 | | Desert Center, California | | 250 |
| | 63 |
| | 25 | % | | Solar | | December 2014 | | Southern California Edison | | 2034 |
| Desert Sunlight 300 | | Desert Center, California | | 300 |
| | 75 |
| | 25 | % | | Solar | | December 2014 | | Pacific Gas and Electric | | 2039 |
| Four Brothers Solar | | New Castle/Milford, UT | | 320 |
| | 160 |
| | 50 | % | | Solar | | July 2016 - August 2016 | | PacifiCorp | | 2036 |
| Granite Mountain | | Cedar City, UT | | 130 |
| | 65 |
| | 50 | % | | Solar | | September 2016 | | PacifiCorp | | 2036 |
| Iron Springs | | Cedar City, UT | | 80 |
| | 40 |
| | 50 | % | | Solar | | August 2016 | | PacifiCorp | | 2036 |
| Kansas South | | Lemoore, CA | | 20 |
| | 20 |
| | 100 | % | | Solar | | June 2013 | | Pacific Gas and Electric | | 2033 |
| Roadrunner | | Santa Teresa, NM | | 20 |
| | 20 |
| | 100 | % | | Solar | | August 2011 | | El Paso Electric | | 2031 |
| TA High Desert | | Lancaster, CA | | 20 |
| | 20 |
| | 100 | % | | Solar | | March 2013 | | Southern California Edison | | 2033 |
| Total Utility Scale Solar | | 1,864 |
| | 921 |
| | | | | | | | | | |
| Distributed Solar | | | | | | | | | | | | | | |
| Apple I LLC Projects | | CA | | 9 |
| | 9 |
| | 100 | % | | Solar | | October 2012 - December 2012 | | Various | | 2032 |
| AZ DG Solar Projects | | AZ | | 5 |
| | 5 |
| | 100 | % | | Solar | | December 2010 - January 2013 | | Various | | 2025-2033 |
| SPP Projects | | Various | | 25 |
| | 25 |
| | 100 | % | | Solar | | June 2008 - June 2012 | | Various | | 2026-2037 |
| Other DG Projects | | Various | | 13 |
| | 13 |
| | 100 | % | | Solar | | October 2012 - October 2015 | | Various | | 2023-2039 |
| Total Distributed Solar | | 52 |
| | 52 |
| | | | | | | | | | |
| Wind | | | | | | | | | | | | | | |
| Alta I | | Tehachapi, CA | | 150 |
| | 150 |
| | 100 | % | | Wind | | December 2010 | | Southern California Edison | | 2035 |
| | | | | | | | | | | | | | | | | | | | | | | | | | | | | | | | | | | | | | | | | | | | | | | | | | |
| | | | Capacity | | | | | | | | |
| | | | Rated MW | | Net MW(a) | | Ownership | | | | | | Long-term Contract Terms |
| Assets | | Location | | | | | Fuel | | COD | | Counterparty | | Expiration |
| Distributed Solar | | | | | | | | | | | | | | |
DGPV Fund Projects (b) | | Various | | 286 | | | 286 | | | 100 | % | | Solar | | September 2015 - March 2019 | | Various | | 2030 - 2044 |
| Solar Power Partners (SPP) Projects | | Various | | 25 | | | 25 | | | 100 | % | | Solar | | June 2008 - June 2012 | | Various | | 2024 - 2037 |
| Other DG Projects | | Various | | 21 | | | 21 | | | 100 | % | | Solar | | December 2010 - October 2015 | | Various | | 2025 - 2039 |
| Total Distributed Solar | | 332 | | | 332 | | | | | | | | | | | |
| Wind | | | | | | | | | | | | | | |
| Alta I | | Tehachapi, CA | | 150 | | | 150 | | | 100 | % | | Wind | | December 2010 | | SCE | | 2035 |
| Alta II | | Tehachapi, CA | | 150 | | | 150 | | | 100 | % | | Wind | | December 2010 | | SCE | | 2035 |
| Alta III | | Tehachapi, CA | | 150 | | | 150 | | | 100 | % | | Wind | | February 2011 | | SCE | | 2035 |
| Alta IV | | Tehachapi, CA | | 102 | | | 102 | | | 100 | % | | Wind | | March 2011 | | SCE | | 2035 |
| Alta V | | Tehachapi, CA | | 168 | | | 168 | | | 100 | % | | Wind | | April 2011 | | SCE | | 2035 |
| Alta X | | Tehachapi, CA | | 137 | | | 137 | | | 100 | % | | Wind | | February 2014 | | SCE | | 2038 |
| Alta XI | | Tehachapi, CA | | 90 | | | 90 | | | 100 | % | | Wind | | February 2014 | | SCE | | 2038 |
Black Rock (b) | | Mineral and Grant Counties, WV | | 115 | | | 58 | | | 50 | % | | Wind | | December 2021 | | Toyota and AEP | | 2036 |
| Broken Bow | | Custer County, NE | | 80 | | | 80 | | | 100 | % | | Wind | | December 2012 | | Nebraska Public Power District | | 2032 |
| Buffalo Bear | | Buffalo, OK | | 19 | | | 19 | | | 100 | % | | Wind | | December 2008 | | Western Farmers Electric Co-operative | | 2033 |
| Cedro Hill | | Webb County, TX | | 150 | | | 150 | | | 100 | % | | Wind | | November 2010 | | CPS Energy | | 2030 |
| Crofton Bluffs | | Knox County, NE | | 42 | | | 42 | | | 100 | % | | Wind | | November 2012 | | Nebraska Public Power District | | 2032 |
Elbow Creek (b) | | Howard County, TX | | 122 | | | 122 | | | 100 | % | | Wind | | November 2019 | | Various | | 2029 |
| Elkhorn Ridge | | Bloomfield, NE | | 81 | | | 54 | | | 66.7 | % | | Wind | | March 2009 | | Nebraska Public Power District | | 2029 |
| Forward | | Berlin, PA | | 29 | | | 29 | | | 100 | % | | Wind | | April 2008 | | Constellation NewEnergy, Inc. | | 2025 |
| Goat Wind | | Sterling City, TX | | 150 | | | 150 | | | 100 | % | | Wind | | April 2008/June 2009 | | Dow Pipeline Company | | 2025 |
| | | | | | | | | | | | | | | | |
Langford (b) | | Christoval, TX | | 160 | | | 160 | | | 100 | % | | Wind | | November 2020 | | Goldman Sachs | | 2033 |
| Laredo Ridge | | Petersburg, NE | | 81 | | | 81 | | | 100 | % | | Wind | | February 2011 | | Nebraska Public Power District | | 2031 |
| Lookout | | Berlin, PA | | 38 | | | 38 | | | 100 | % | | Wind | | October 2008 | | Southern Maryland Electric Cooperative | | 2030 |
Mesquite Sky (b) | | Callahan County, TX | | 340 | | | 170 | | | 50 | % | | Wind | | December 2021 | | Various | | 2033 - 2036 |
Mesquite Star (b) | | Fisher County, TX | | 419 | | | 210 | | | 50 | % | | Wind | | May 2020 | | Various | | 2032 - 2035 |
| Mountain Wind 1 | | Uinta County, Wyoming | | 61 | | | 61 | | | 100 | % | | Wind | | July 2008 | | PacifiCorp | | 2033 |
| Mountain Wind 2 | | Uinta County, Wyoming | | 80 | | | 80 | | | 100 | % | | Wind | | September 2008 | | PacifiCorp | | 2033 |
| Mt. Storm | | Grant County, WV | | 264 | | | 264 | | | 100 | % | | Wind | | October 2008 | | Citigroup | | 2031 |
| Ocotillo | | Forsan, TX | | 55 | | | 55 | | | 100 | % | | Wind | | December 2023 | | N/A | | |
| Odin | | Mountain Lake, MN | | 21 | | | 21 | | | 100 | % | | Wind | | June 2008 | | Missouri River Energy Services | | 2028 |
Pinnacle (b) | | Keyser, WV | | 54 | | | 54 | | | 100 | % | | Wind | | December 2021 | | Maryland Department of General Services and University System of Maryland | | 2031 |
Rattlesnake (b) (c) | | Ritzville, WA | | 160 | | | 160 | | | 100 | % | | Wind | | December 2020 | | Avista Corporation | | 2040 |
| San Juan Mesa | | Elida, NM | | 120 | | | 90 | | | 75 | % | | Wind | | December 2005 | | Southwestern Public Service Company | | 2025 |
|
| | | | | | | | | | | | | | | | | | | |
| | | | | Capacity | | | | | | | | | | |
| | | | | Rated MW | | Net MW(a) | | Owner-ship | | | | | | PPA Terms |
| Assets | | Location | | | | | Fuel | | COD | | Counterparty | | Expiration |
| Alta II | | Tehachapi, CA | | 150 |
| | 150 |
| | 100 | % | | Wind | | December 2010 | | Southern California Edison | | 2035 |
| Alta III | | Tehachapi, CA | | 150 |
| | 150 |
| | 100 | % | | Wind | | February 2011 | | Southern California Edison | | 2035 |
| Alta IV | | Tehachapi, CA | | 102 |
| | 102 |
| | 100 | % | | Wind | | March 2011 | | Southern California Edison | | 2035 |
| Alta V | | Tehachapi, CA | | 168 |
| | 168 |
| | 100 | % | | Wind | | April 2011 | | Southern California Edison | | 2035 |
Alta X (b) | | Tehachapi, CA | | 137 |
| | 137 |
| | 100 | % | | Wind | | February 2014 | | Southern California Edison | | 2038 |
Alta XI (b) | | Tehachapi, CA | | 90 |
| | 90 |
| | 100 | % | | Wind | | February 2014 | | Southern California Edison | | 2038 |
| Buffalo Bear | | Buffalo, OK | | 19 |
| | 19 |
| | 100 | % | | Wind | | December 2008 | | Western Farmers Electric Co-operative | | 2033 |
Crosswinds (b) | | Ayrshire, IA | | 21 |
| | 21 |
| | 99 | % | | Wind | | June 2007 | | Corn Belt Power Cooperative | | 2027 |
Elbow Creek (b) | | Howard County, TX | | 122 |
| | 122 |
| | 100 | % | | Wind | | December 2008 | | NRG Power Marketing LLC | | 2022 |
Elkhorn Ridge (b) | | Bloomfield, NE | | 81 |
| | 54 |
| | 66.7 | % | | Wind | | March 2009 | | Nebraska Public Power District | | 2029 |
Forward (b) | | Berlin, PA | | 29 |
| | 29 |
| | 100 | % | | Wind | | April 2008 | | Constellation NewEnergy, Inc. | | 2022 |
Goat Wind (b) | | Sterling City, TX | | 150 |
| | 150 |
| | 100 | % | | Wind | | April 2008/June 2009 | | Dow Pipeline Company | | 2025 |
Hardin (b) | | Jefferson, IA | | 15 |
| | 15 |
| | 99 | % | | Wind | | May 2007 | | Interstate Power and Light Company | | 2027 |
| Laredo Ridge | | Petersburg, NE | | 80 |
| | 80 |
| | 100 | % | | Wind | | February 2011 | | Nebraska Public Power District | | 2031 |
Lookout (b) | | Berlin, PA | | 38 |
| | 38 |
| | 100 | % | | Wind | | October 2008 | | Southern Maryland Electric Cooperative | | 2030 |
Odin (b) | �� | Odin, MN | | 20 |
| | 20 |
| | 99.9 | % | | Wind | | June 2008 | | Missouri River Energy Services | | 2028 |
| Pinnacle | | Keyser, WV | | 55 |
| | 55 |
| | 100 | % | | Wind | | December 2011 | | Maryland Department of General Services and University System of Maryland | | 2031 |
San Juan Mesa (b) | | Elida, NM | | 120 |
| | 90 |
| | 75 | % | | Wind | | December 2005 | | Southwestern Public Service Company | | 2025 |
Sleeping Bear (b) | | Woodward, OK | | 95 |
| | 95 |
| | 100 | % | | Wind | | October 2007 | | Public Service Company of Oklahoma | | 2032 |
| South Trent | | Sweetwater, TX | | 101 |
| | 101 |
| | 100 | % | | Wind | | January 2009 | | AEP Energy Partners | | 2029 |
Spanish Fork (b) | | Spanish Fork, UT | | 19 |
| | 19 |
| | 100 | % | | Wind | | July 2008 | | PacifiCorp | | 2028 |
Spring Canyon II (b) | | Logan County, CO | | 32 |
| | 29 |
| | 90.1 | % | | Wind | | October 2014 | | Platte River Power Authority | | 2039 |
Spring Canyon III(b) | | Logan County, CO | | 28 |
| | 25 |
| | 90.1 | % | | Wind | | December 2014 | | Platte River Power Authority | | 2039 |
| Taloga | | Putnam, OK | | 130 |
| | 130 |
| | 100 | % | | Wind | | July 2011 | | Oklahoma Gas & Electric | | 2031 |
Wildorado (b) | | Vega, TX | | 161 |
| | 161 |
| | 100 | % | | Wind | | April 2007 | | Southwestern Public Service Company | | 2027 |
| Total Wind | | 2,263 |
| | 2,200 |
| | | | | | | | | | |
| Thermal Generation | | | | | | | | | | | | | | |
| Dover | | Dover, DE | | 103 |
| | 103 |
| | 100 | % | | Natural Gas | | June 2013 | | NRG Power Marketing LLC | | 2018 |
| Paxton Creek Cogen | | Harrisburg, PA | | 12 |
| | 12 |
| | 100 | % | | Natural Gas | | November 1986 | | Power sold into PJM markets |
| Princeton Hospital | | Princeton, NJ | | 5 |
| | 5 |
| | 100 | % | | Natural Gas | | January 2012 | | Excess power sold to local utility |
| Tucson Convention Center | | Tucson, AZ | | 2 |
| | 2 |
| | 100 | % | | Natural Gas | | January 2003 | | Excess power sold to local utility |
|
| | | | | | | | | | | | | | | | | | | |
| | | | | Capacity | | | | | | | | | | |
| | | | | Rated MW | | Net MW(a) | | Owner-ship | | | | | | PPA Terms |
| Assets | | Location | | | | | Fuel | | COD | | Counterparty | | Expiration |
| University of Bridgeport | | Bridgeport, CT | | 1 |
| | 1 |
| | 100 | % | | Natural Gas | | April 2015 | | University of Bridgeport | | 2034 |
| Total Thermal Generation | | 123 |
| | 123 |
| | | | | | | | | | |
Total NRG Yield, Inc. (c) | | 6,437 |
| | 5,241 |
| | | | | | | | | | |
| | | | | | | | | | | | | | | | | | | | | | | | | | | | | | | | | | | | | | | | | | | | | | | | | | |
| | | | Capacity | | | | | | | | |
| | | | Rated MW | | Net MW(a) | | Ownership | | | | | | Long-term Contract Terms |
| Assets | | Location | | | | | Fuel | | COD | | Counterparty | | Expiration |
| Sleeping Bear | | Woodward, OK | | 95 | | | 95 | | | 100 | % | | Wind | | October 2007 | | Public Service Company of Oklahoma | | 2032 |
| South Trent | | Sweetwater, TX | | 101 | | | 101 | | | 100 | % | | Wind | | January 2009 | | AEP Energy Partners | | 2029 |
| Spanish Fork | | Spanish Fork, UT | | 19 | | | 19 | | | 100 | % | | Wind | | July 2008 | | PacifiCorp | | 2028 |
Spring Canyon II (b) | | Logan County, CO | | 34 | | | 31 | | | 90.1 | % | | Wind | | October 2014 | | Platte River Power Authority | | 2039 |
Spring Canyon III (b) | | Logan County, CO | | 29 | | | 26 | | | 90.1 | % | | Wind | | December 2014 | | Platte River Power Authority | | 2039 |
| Taloga | | Putnam, OK | | 130 | | | 130 | | | 100 | % | | Wind | | July 2011 | | Oklahoma Gas & Electric | | 2031 |
Wildorado (b) | | Vega, TX | | 161 | | | 161 | | | 100 | % | | Wind | | December 2019 - January 2020 | | Southwestern Public Service Company | | 2027 |
| Total Wind | | 4,157 | | | 3,658 | | | | | | | | | | | |
| | | | | | | | | | | | | | | | |
| Total Clearway Energy LLC | | 10,583 | | | 8,451 | | | | | | | | | | | |
(a) Net capacity represents the maximum, or rated, generating capacity or storage capacity of the facility multiplied by the Company'sCompany’s percentage ownership in the facility as of December 31, 2017.2023.
(b) Projects are part of tax equity arrangements, as further described in Item 15 —Note 2, Summary of Significant Accounting Policies.
(c) NRG Yield's total generation Rattlesnake has a deliverable capacity is net of 6 MWs for noncontrolling interest for Spring Canyon II and III. NRG Yield's generation capacity including this noncontrolling interest was 5,247 MWs.
In addition to the facilities owned or leased in the table above, the Company entered into partnerships to own or purchase solar power generation projects, as well as other ancillary related assets from a related party via intermediate funds. The Company does not consolidate these partnerships and accounts for them as equity method investments. The Company's net interest in these projects is 247 MW based on cash to be distributed. For further discussions, refer to Item 15 — Note 5, Investments Accounted for by the Equity Method and Variable Interest Entities to the Consolidated Financial Statements.
The following table summarizes the Company's thermal steam and chilled water facilities as of December 31, 2017:144 MW.
|
| | | | | | | | | | | | |
| Name and Location of Facility | | Thermal Energy Purchaser | | % Owned | | Rated Megawatt
Thermal
Equivalent
Capacity (MWt) | | Net Megawatt
Thermal
Equivalent
Capacity (MWt) | | Generating
Capacity |
| NRG Energy Center Minneapolis, MN | | Approx. 100 steam and 55 chilled water customers | | 100 | | 322
136 |
| | 322
136 |
| | Steam: 1,100 MMBtu/hr.
Chilled water: 38,700 tons |
NRG Energy Center
San Francisco, CA | | Approx. 180 steam customers | | 100 | | 133 |
| | 133 |
| | Steam: 454 MMBtu/hr. |
NRG Energy Center
Omaha, NE | | Approx. 60 steam and 65 chilled water customers | | 100
12(a)
100
0(a) | | 142
73
77
26 |
| | 142
9
77
0 |
| | Steam: 485 MMBtu/hr
Steam: 250 MMBtu/hr
Chilled water: 22,000 tons
Chilled water: 7,250 tons |
| NRG Energy Center Harrisburg, PA | | Approx. 125 steam and 5 chilled water customers | | 100 | | 108
13 |
| | 108
13 |
| | Steam: 370 MMBtu/hr.
Chilled water: 3,600 tons |
| NRG Energy Center Phoenix, AZ | | Approx. 35 chilled water customers | | 24(a)
100
12(a)
0(a) | | 5
104
14
28 |
| | 1
104
2
0 |
| | Steam: 17 MMBtu/hr
Chilled water: 29,600 tons
Chilled water: 3,920 tons
Chilled water: 8,000 tons |
| NRG Energy Center Pittsburgh, PA | | Approx. 25 steam and 25 chilled water customers | | 100 | | 88
49 |
| | 88
49 |
| | Steam: 302 MMBtu/hr.
Chilled water: 13,874 tons |
NRG Energy Center
San Diego, CA | | Approx. 20 chilled water customers | | 100 | | 31 |
| | 31 |
| | Chilled water: 8,825 tons |
NRG Energy Center
Dover, DE | | Kraft Heinz Company; Proctor and Gamble | | 100 | | 66 |
| | 66 |
| | Steam: 225 MMBtu/hr. |
| NRG Energy Center Princeton, NJ | | Princeton HealthCare System | | 100 | | 21
17 |
| | 21
17 |
| | Steam: 72 MMBtu/hr.
Chilled water: 4,700 tons |
| | | Total Generating Capacity (MWt) | | | | 1,453 |
| | 1,319 |
| | |
(a) Net MWt capacity excludes 134 MWt available under the right-to-use provisions contained in agreements between two of the Company's thermal facilities and certain of its customers.
Other Properties
Through the Management Services Agreement with NRG, the Company utilizes NRG's leased corporate headquarters offices at 804 Carnegie Center, Princeton, New Jersey.
Item 3 — Legal Proceedings
See Item 15 — Note 14, Commitments and Contingencies, to the Consolidated Financial Statements for discussion of the material legal proceedings to which the Company is a party.party or of which any of its properties is subject.
Item 4 — Mine Safety Disclosures
Not applicable.
PART II
Item 5 — Market for Registrant'sRegistrant’s Common Equity, Related Stockholder Matters and Issuer Purchases of Equity Securities
Market Information and Holders
As of the date of this report, there is no publicly-traded market for the Company'sCompany’s membership units. All of the Company'sCompany’s Class A and Class C units are held by Yield,Clearway, Inc. and all of the Company'sCompany’s Class B and Class D units are held by NRG.CEG.
Distributions
The following table lists the distributions paid on the Company'sCompany’s Class A, Class B, Class C and Class D units during the year ended December 31, 2017:2023:
| | | | Fourth Quarter 2017 | | Third Quarter 2017 | | Second Quarter 2017 | | First Quarter 2016 |
| Fourth Quarter 2023 | | | Fourth Quarter 2023 | | Third Quarter 2023 | | Second Quarter 2023 | | First Quarter 2023 |
| Distributions per Class A and Class B unit | $ | 0.288 |
| | $ | 0.28 |
| | $ | 0.27 |
| | $ | 0.260 |
|
| Distributions per Class C and Class D unit | $ | 0.288 |
| | $ | 0.28 |
| | $ | 0.27 |
| | $ | 0.260 |
|
On February 15, 2018,14, 2024, the Company declared a quarterly distribution on its Class A, Class B, Class C and Class D units of $0.298$0.4033 per unit payable on March 15, 2018.
2024.
In addition to the quarterly distributions, the Company paid $51 million in additional distributions, $30 million of which was distributed to Clearway, Inc. and $21 million of which was distributed to CEG, during the year ended December 31, 2023, in order for Clearway, Inc. to make certain additional tax payments primarily associated with the sale of the Thermal Business.
Item 6 — Selected Financial DataReserved
The following table presents the Company's historical selected financial data, which has been recast to include the Drop Down Assets, as if the transfers had taken place from the beginning of the financial statements period, or from the date the respective entities were under common control (if later than the beginning of the financial statements period). The acquisitions are further described in Item 15 — Note 3, Business Acquisitions, to the Consolidated Financial Statements. Additionally, for all periods prior to the formation of the Company, the data below reflects the Company's accounting predecessor, or NRG Yield, the financial statements of which were prepared on a ''carve-out'' basis from NRG and are intended to represent the financial results of the contracted renewable energy and conventional generation and thermal infrastructure assets in the U.S. that were acquired by the Company on July 22, 2013. For all periods subsequent to the formation of the Company, the data below reflects the Company's consolidated financial results.
This historical data should be read in conjunction with the Consolidated Financial Statements and the related notes thereto in Item 15 and
Item 7 Management's Discussion and Analysis of Financial Condition and Results of Operations.
|
| | | | | | | | | | | | | | | | | | | |
| | Fiscal year ended December 31, |
| (In millions) | 2017 | | 2016 | | 2015 | | 2014 | | 2013 |
| Statement of Income Data: | | | |
| Operating Revenues | | | | | | | | | |
| Total operating revenues | $ | 1,009 |
| | $ | 1,035 |
| | $ | 968 |
| | $ | 844 |
| | $ | 451 |
|
| Operating Costs and Expenses | | | | | | | | | |
| Cost of operations | 326 |
| | 308 |
| | 323 |
| | 279 |
| | 156 |
|
| Depreciation and amortization | 334 |
| | 303 |
| | 303 |
| | 240 |
| | 98 |
|
| Impairment losses | 44 |
| | 185 |
| | 1 |
| | — |
| | — |
|
| General and administrative | 19 |
| | 14 |
| | 10 |
| | 8 |
| | 7 |
|
| Acquisition-related transaction and integration costs | 3 |
| | 1 |
| | 3 |
| | 4 |
| | — |
|
| Total operating costs and expenses | 726 |
| | 811 |
|
| 640 |
|
| 531 |
|
| 261 |
|
| Operating Income | 283 |
| | 224 |
|
| 328 |
|
| 313 |
|
| 190 |
|
| Other Income (Expense) | | | | | | | | | |
| Equity in earnings of unconsolidated affiliates | 71 |
| | 60 |
| | 31 |
| | 22 |
| | 27 |
|
| Other income, net | 4 |
| | 3 |
| | 3 |
| | 6 |
| | 4 |
|
| Loss on debt extinguishment | (3 | ) | | — |
| | (9 | ) | | (1 | ) | | — |
|
| Interest expense | (293 | ) | | (272 | ) | | (258 | ) | | (217 | ) | | (72 | ) |
| Total other expense, net | (221 | ) | | (209 | ) | | (233 | ) | | (190 | ) | | (41 | ) |
| Income Before Income Taxes | 62 |
| | 15 |
| | 95 |
| | 123 |
| | 149 |
|
| Income tax expense (benefit) | — |
| | — |
| | — |
| | — |
| | (3 | ) |
| Net Income | 62 |
| | 15 |
| | 95 |
| | $ | 123 |
| | $ | 152 |
|
| Less: Net (loss) income attributable to noncontrolling interests | (75 | ) | | (111 | ) | | (62 | ) | | 9 |
| | — |
|
| Net Income Attributable to NRG Yield LLC | $ | 137 |
| | $ | 126 |
| | $ | 157 |
| | $ | 114 |
| | $ | 152 |
|
| | | | | | | | | | |
| Other Financial Data: | | | | | | | | | |
| Capital expenditures | $ | 31 |
| | $ | 20 |
| | $ | 29 |
| | $ | 79 |
| | $ | 790 |
|
| Cash Flow Data: | | | | | | | | | |
| Net cash provided by (used in): | | | | | | | | | |
| Operating activities | $ | 516 |
| | $ | 577 |
| | $ | 424 |
| | $ | 363 |
| | $ | 174 |
|
| Investing activities | (283 | ) | | (131 | ) | | (1,098 | ) | | (760 | ) | | (987 | ) |
| Financing activities | (416 | ) | | (202 | ) | | 354 |
| | 767 |
| | 853 |
|
| Balance Sheet Data (at period end): | | | | | | | | | |
| Cash and cash equivalents | $ | 146 |
| | $ | 321 |
| | $ | 110 |
| | $ | 430 |
| | $ | 60 |
|
| Property, plant and equipment, net | 5,204 |
| | 5,554 |
| | 5,980 |
| | 6,119 |
| | 3,488 |
|
| Total assets | 8,154 |
| | 8,746 |
| | 8,759 |
| | 8,930 |
| | 4,831 |
|
| Long-term debt, including current maturities | 5,845 |
| | 6,069 |
| | 5,692 |
| | 5,828 |
| | 2,916 |
|
| Total liabilities | 6,146 |
| | 6,382 |
| | 6,054 |
| | 6,173 |
| | 3,221 |
|
| Total members' equity | 2,008 |
| | 2,364 |
| | 2,705 |
| | 2,757 |
| | 1,610 |
|
Item 7 — Management'sManagement’s Discussion and Analysis of Financial Condition and the Results of Operations
The following discussion analyzes the Company's historical financial condition and results of operations, which were recast to include the effect of the Drop Down Assets acquired from NRG. As further discussed in Item 15 — Note 1, Nature of Business, to the Consolidated Financial Statements, the purchases of these assets were accounted for in accordance with ASC 805-50, Business Combinations - Related Issues, whereas the assets and liabilities transferred to the Company relate to interests under common control by NRG and, accordingly, were recorded at historical cost. The difference between the cash proceeds and historical value of the net assets was recorded as a distribution to/from NRG and offset to the noncontrolling interest on the Company's consolidated balance sheet. In accordance with GAAP, the Company prepared its consolidated financial statements to reflect the transfers as if they had taken place from the beginning of the financial statements period, or from the date the entities were under common control (if later than the beginning of the financial statements period).
As you read this discussion and analysis, refer to the Company'sCompany’s Consolidated Statements of OperationsIncome to this Form 10-K, which present the results of operations for the years ended December 31, 2017, 2016 and 2015.10-K. Also refer to Item 1 — Businessand Item 1A — Risk Factors, which include detailed discussions of various items impacting the Company'sCompany’s business, results of operations and financial condition. Discussions of the year ended December 31, 2021 that are not included in this Annual Report on Form 10-K and year-to-year comparisons of the year ended December 31, 2022 and the year ended December 31, 2021 can be found in “Management’s Discussion and Analysis of Financial Condition and the Results of Operations” in Part II, Item 7 of the Company’s Annual Report on Form 10-K for the year ended December 31, 2022.
The discussion and analysis below has been organized as follows:
•Executive Summary, including a description of the business and significant events that are important to understanding the results of operations and financial condition;
•Results of operations, including an explanation of significant differences between the periods in the specific line items of the consolidated statements of operations;income;
•Financial condition addressing liquidity position, sources and uses of cash, capital resources and requirements, commitments and off-balance sheet arrangements;
•Known trends that may affect the Company’s results of operations and financial condition in the future; and
•Critical accounting policies which are most important to both the portrayal of the Company'sCompany’s financial condition and results of operations, and which require management'smanagement’s most difficult, subjective or complex judgment.
Management’s discussion of the results of operations for the years ended December 31, 20162023 and 20152022
Liquidity and Capital Resources
The Company'sCompany’s principal liquidity requirements are to meet its financial commitments, finance current operations, fund capital expenditures, including acquisitions from time to time, service debt and pay distributions. As a normal part of the Company'sCompany’s business, depending on market conditions, the Company will from time to time consider opportunities to repay, redeem, repurchase or refinance its indebtedness. Changes in the Company'sCompany’s operating plans, lower than anticipated sales, increased expenses, acquisitions or other events may cause the Company to seek additional debt or equity financing in future periods. There can be no guarantee that financing will be available on acceptable terms or at all. Debt financing, if available, could impose additional cash payment obligations and additional covenants and operating restrictions.
Current Liquidity Position
As of December 31, 20172023 and 2016,2022, the Company'sCompany’s liquidity was approximately $680 million$1.51 billion and $932 million,$1.37 billion, respectively, comprised of cash, restricted cash and availability under the Company'sCompany’s revolving credit facility.
| | | | | | | | | | | |
| As of December 31, |
| 2023 | | 2022 |
| (In millions) |
| Cash and cash equivalents: | | | |
| Clearway Energy LLC, excluding subsidiaries | $ | 410 | | | $ | 536 | |
| Subsidiaries | 125 | | | 121 | |
| Restricted cash: | | | |
| Operating accounts | 176 | | | 109 | |
| Reserves, including debt service, distributions, performance obligations and other reserves | 340 | | | 230 | |
| Total cash, cash equivalents and restricted cash | 1,051 | | | 996 | |
| Revolving credit facility availability | 454 | | | 370 | |
| Total liquidity | $ | 1,505 | | | $ | 1,366 | |
| | | |
| | | |
|
| | | | | | | |
| | As of December 31, |
| | 2017 | | 2016 |
| | (In millions) |
| Cash and cash equivalents | $ | 146 |
| | $ | 321 |
|
| Restricted cash - operating | 86 |
| | 76 |
|
Restricted cash - reserves | 82 |
| | 100 |
|
| Total | 314 |
| | 497 |
|
| Total credit facility availability | 366 |
| | 435 |
|
| Total liquidity | $ | 680 |
| | $ | 932 |
|
The Company'sCompany’s liquidity includes $168$516 million and $176$339 million of restricted cash balances as of December 31, 20172023 and 20162022, respectively. Restricted cash consists primarily of funds to satisfy the requirements of certain debt arrangements and funds held within the Company'sCompany’s projects that are restricted in their use. Of these funds asAs of December 31, 2017,2023, these restricted funds were comprised of $176 million designated to fund operating expenses, approximately $25$178 million is designated for current debt service payments, $25 million is designated to fund operating expenses and $36 million is designated for distributions to the Company, with the remaining $82$85 million restricted for reserves including debt service, performance obligations and other reserves, as well as capital expenditures. The remaining $77 million is held in distribution reserve accounts.
The Company's various financing arrangements are described in ItemClearway Energy LLC and Clearway Energy Operating LLC Revolving Credit Facility
On March 15, —Note 10, Long-term Debt,2023, Clearway Energy Operating LLC refinanced the Amended and Restated Credit Agreement, which (i) replaced LIBOR with SOFR plus a credit spread adjustment of 0.10% as the applicable reference rate, (ii) increased the available revolving commitments to an aggregate principal amount of $700 million, (iii) extended the Consolidated Financial Statements. maturity date to March 15, 2028, (iv) increased the letter of credit sublimit to $594 million and (v) implemented certain other technical modifications.
As of December 31, 2017, $55 million of2023, the Company had no outstanding borrowings and $74 million of letters of credit were outstanding under the revolving credit facility.facility and $246 million in letters of credit outstanding. The facility will continue to be used for general corporate purposes, including financing of future acquisitions and posting letters of credit.
Management believes that the Company'sCompany’s liquidity position, cash flows from operations and availability under its revolving credit facility will be adequate to meet the Company'sCompany’s financial commitments; debt service obligations; growth, operating and maintenance capital expenditures; and to fund distributions to Yield,Clearway, Inc. and NRG.CEG. Management continues to regularly monitor the Company'sCompany’s ability to finance the needs of its operating, financing and investing activity within the dictates of prudent balance sheet management.
NRG Transaction and Related Liquidity Considerations
On February 6, 2018, NRG entered into agreements for the sale of 100% of its interest in NRG Yield, Inc. and its renewable energy development and operations platform, or the NRG Transaction. In connection with this, the Company entered into a Consent and Indemnity Agreement with NRG and Global Infrastructure Partners. For further discussion of the NRG Transaction and the related ROFO impacts, refer to Item 1 — Business, as well as, Item 15 — Note 1, Nature of Business.
As part of the Consent and Indemnity Agreement, GIP has arranged a $1.5 billion backstop credit facility to manage any change of control costs associated with NRG Yield's corporate debt. In addition, GIP has committed to provide $400 million in financing support for the Carlsbad Energy Center transaction, which would be exercised if necessary.
On February 6, 2018, NRG Yield Operating LLC and NRG Yield LLC amended the revolving credit facility to modify the change of control provisions to permit the consummation of the NRG Transaction, and also to permit NRG Yield Operating LLC, NRG Yield LLC and certain subsidiaries to incur up to $1.5 billion of unsecured indebtedness in order to repurchase or make other required cash payments, in each case if applicable, with respect to NRG Yield Operating LLC’s outstanding senior notes and NRG Yield's outstanding convertible notes in connection with the NRG Transaction.
Credit Ratings
Credit rating agencies rate a firm'sfirm’s public debt securities. These ratings are utilized by the debt markets in evaluating a firm'sfirm’s credit risk. Ratings influence the price paid to issue new debt securities by indicating to the market the Company'sCompany’s ability to pay principal, interest and preferred dividends. Rating agencies evaluate a firm'sfirm’s industry, cash flow, leverage, liquidity and hedge profile, among other factors, in their credit analysis of a firm'sfirm’s credit risk. As of December 31, 2017,2023, the Company's 2024Company’s 2028 Senior Notes, 2031 Senior Notes and 20262032 Senior Notes arewere rated BB by S&P and Ba2 by Moody's. The ratings outlook is stable.Moody’s.
On February 7, 2018, S&P and Moody's reaffirmed the ratings outlook as stable.
Sources of Liquidity
The Company'sCompany’s principal sources of liquidity include cash on hand, cash generated from operations, proceeds from sales of assets, borrowings under new and existing financing arrangements and the issuance of additional equity and debt securities by Yield,Clearway, Inc. or the Company as appropriate given market conditions. As described in Item 15—15 — Note 10, Long-term Debt, to the Consolidated Financial Statements, and above in Significant Events During the Year Ended December 31, 2017, the Company'sCompany’s financing arrangements consist of corporate level debt, which includes Senior Notes, intercompany borrowings with Clearway, Inc. and the revolving credit facility,facility; the 2024 Senior Notes, the 2026 Senior Notes, its intercompany borrowings with Yield, Inc.ATM Program; and project-level financings for its various assets.
At-the-Market Equity Offering Program
In 2016, NRG Yield, Inc.Cedro Hill Repowering Financing — On December 12, 2023, the Company entered into an equity distributiona financing agreement or EDA, with Barclays Capital Inc., Credit Suisse Securities (USA) LLC, J.P. Morgan Securities LLC and RBC Capital Markets, LLC, as sales agents. Pursuantfor non-recourse debt for a total commitment of $254 million related to the termsrepowering of the EDA, NRG Yield, Inc. may offer and sell sharesCedro Hill wind project. The Company’s initial borrowing of its Class C common stock par value $0.01 per share, from time$165 million was utilized to time throughrepay the sales agents, as NRG Yield, Inc.’s sales agents$72 million of outstanding principal under the original financing agreement, to pay $55 million to Clearway Renew for the offer and salefuture delivery of the shares, upequipment, to an aggregate sales price of $150,000,000 through an at-the-market equity offering program, or ATM Program. NRG Yield, Inc. may also sell shares of its Class C common stockpay $27 million to any of the sales agents, as principals for its own account, at a price agreed upon at the time of sale. As of December 31, 2017, Yield, Inc. issued 1,921,866 shares of Class C common stock under the ATM Program for gross proceeds of $35 million and incurred commission fees of $346 thousand. At December 31, 2017, approximately $115 million of Class C common stock remains available for issuance under the ATM Program. Yield, Inc. used the net proceeds to acquire 1,921,866 Class C units from Yield LLC.
Thermal Financing
On March 16, 2017, NRG Energy Center Minneapolis LLC, a subsidiary of the Company, amended the shelf facility of its existing Thermal financing arrangement to allowthird party for the future delivery of equipment, to pay a $4 million development services fee to Clearway Renew, to pay for $4 million in debt issuance of an additional $10costs that were deferred and to pay for $3 million of Series F notes at a 4.60% interest rate, or the Series F Notes, increasing the total principal amount of notes available for issuance under the shelf facility to $80 million. The Series F Notes are secured by substantially all of the assets of NRG Energy Center Minneapolis LLC. NRG Thermal LLC has guaranteed the indebtedness and its guarantee is secured by a pledge of the equity interests in all of NRG Thermal LLC’s subsidiaries.
Uses of Liquidity
The Company'sCompany’s requirements for liquidity and capital resources, other than for operating its facilities, are categorized as: (i) debt service obligations, as described more fully in Item 15 —Note 10, Long-term Debt to the Consolidated Financial Statements;; (ii) capital expenditures; (iii) off-balance sheet arrangements; (iv) acquisitions and investments;investments, as described more fully in Item 15 —Note 3, Acquisitions and (iv)Dispositions and Note 5, Investments Accounted for by the Equity Method and Variable Interest Entities; and (v) distributions.
Debt Service Obligations
Principal payments on debt as of December 31, 2017,2023, are due in the following periods:
| | | | | | | | | | | | | | | | | | | | | | | | | | | | | | | | | | | | | | | | | | | |
| Description | 2024 | | 2025 | | 2026 | | 2027 | | 2028 | | There- after | | Total | | |
| (In millions) | | |
| Corporate-level debt: | | | | | | | | | | | | | | | |
| Intercompany Note with Clearway, Inc. | $ | 1 | | | $ | — | | | $ | — | | | $ | — | | | $ | — | | | $ | — | | | $ | 1 | | | |
| Clearway Energy Operating LLC Senior Notes, due 2028 | — | | | — | | | — | | | — | | | 850 | | | — | | | 850 | | | |
| Clearway Energy Operating LLC Senior Notes, due 2031 | — | | | — | | | — | | | — | | | — | | | 925 | | | 925 | | | |
| Clearway Energy Operating LLC Senior Notes, due 2032 | — | | | — | | | — | | | — | | | — | | | 350 | | | 350 | | | |
| | | | | | | | | | | | | | | |
| Total Corporate-level debt | 1 | | | — | | | — | | | — | | | 850 | | | 1,275 | | | 2,126 | | | |
| Project-level debt: | | | | | | | | | | | | | | | |
| Agua Caliente Solar LLC, due 2037 | 38 | | | 39 | | | 40 | | | 41 | | | 43 | | | 411 | | | 612 | | | |
| Alta Wind Asset Management LLC, due 2031 | 1 | | | 1 | | | 1 | | | 2 | | | 2 | | | 4 | | | 11 | | | |
| Alta Wind I-V lease financing arrangements, due 2034 and 2035 | 52 | | | 54 | | | 55 | | | 57 | | | 60 | | | 382 | | | 660 | | | |
| Alta Wind Realty Investments LLC, due 2031 | 2 | | | 2 | | | 3 | | | 3 | | | 3 | | | 7 | | | 20 | | | |
| Borrego, due 2024 and 2038 | 3 | | | 2 | | | 3 | | | 3 | | | 3 | | | 34 | | | 48 | | | |
| Broken Bow, due 2031 | 4 | | | 5 | | | 5 | | | 5 | | | 6 | | | 16 | | | 41 | | | |
| Buckthorn Solar, due 2025 | 4 | | | 112 | | | — | | | — | | | — | | | — | | | 116 | | | |
| Carlsbad Energy Holdings LLC, due 2027 | 23 | | | 24 | | | 26 | | | 20 | | | — | | | — | | | 93 | | | |
| Carlsbad Energy Holdings LLC, due 2038 | — | | | — | | | — | | | 7 | | | 25 | | | 375 | | | 407 | | | |
| Carlsbad Holdco, LLC, due 2038 | 2 | | | 3 | | | 9 | | | 11 | | | 9 | | | 161 | | | 195 | | | |
Cedro Hill, due 2024 and 2029 (a) | 165 | | | — | | | — | | | — | | | — | | | — | | | 165 | | | |
| Crofton Bluffs, due 2031 | 3 | | | 3 | | | 3 | | | 3 | | | 4 | | | 11 | | | 27 | | | |
| CVSR, due 2037 | 28 | | | 30 | | | 32 | | | 35 | | | 37 | | | 439 | | | 601 | | | |
| CVSR Holdco Notes, due 2037 | 9 | | | 9 | | | 9 | | | 9 | | | 10 | | | 106 | | | 152 | | | |
| Daggett 2, due 2028 | 1 | | | 1 | | | 1 | | | 1 | | | 152 | | | — | | | 156 | | | |
| Daggett 3, due 2028 | — | | | — | | | — | | | — | | | 217 | | | — | | | 217 | | | |
| DG-CS Master Borrower LLC, due 2040 | 29 | | | 30 | | | 30 | | | 28 | | | 20 | | | 248 | | | 385 | | | |
| Mililani Class B Member Holdco LLC, due 2028 | 3 | | | 3 | | | 3 | | | 3 | | | 80 | | | — | | | 92 | | | |
| NIMH Solar, due 2024 | 148 | | | — | | | — | | | — | | | — | | | — | | | 148 | | | |
| Oahu Solar Holdings LLC, due 2026 | 3 | | | 3 | | | 75 | | | — | | | — | | | — | | | 81 | | | |
Rosie Class B LLC, due 2024 and 2029 (a) | 347 | | | — | | | — | | | — | | | — | | | — | | | 347 | | | |
| Texas Solar Nova 1, due 2028 | 2 | | | 3 | | | 4 | | | 4 | | | 89 | | | — | | | 102 | | | |
| Utah Solar Portfolio, due 2036 | 14 | | | 15 | | | 16 | | | 16 | | | 12 | | | 169 | | | 242 | | | |
| Viento Funding II, LLC, due 2029 | 16 | | | 17 | | | 20 | | | 24 | | | 24 | | | 74 | | | 175 | | | |
Victory Pass and Arica, due 2024 (a) | 757 | | | — | | | — | | | — | | | — | | | — | | | 757 | | | |
| Other | 15 | | | 15 | | | 16 | | | 16 | | | 16 | | | 46 | | | 124 | | | |
| Total project-level debt | 1,669 | | | 371 | | | 351 | | | 288 | | | 812 | | | 2,483 | | | 5,974 | | | |
| Total debt | $ | 1,670 | | | $ | 371 | | | $ | 351 | | | $ | 288 | | | $ | 1,662 | | | $ | 3,758 | | | $ | 8,100 | | | |
|
| | | | | | | | | | | | | | | | | | | | | | | | | | | |
| Description | 2018 | | 2019 | | 2020 | | 2021 | | 2022 | | There - after | | Total |
| | (In millions) |
| Long-term debt - affiliate, due 2019 | $ | — |
| | $ | 337 |
| | $ | — |
| | $ | — |
| | $ | — |
| | $ | — |
| | $ | 337 |
|
| Long-term debt - affiliate, due 2020 | — |
| | — |
| | 281 |
| | — |
| | — |
| | — |
| | 281 |
|
| NRG Yield Operating LLC Senior Notes, due 2024 | — |
| | — |
| | — |
| | — |
| | — |
| | 500 |
| | 500 |
|
| NRG Yield Operating LLC Senior Notes, due 2026 | — |
| | — |
| | — |
| | — |
| | — |
| | 350 |
| | 350 |
|
| NRG Yield LLC and NRG Yield Operating LLC Revolving Credit Facility, due 2019 | — |
| | 55 |
| | — |
| | — |
| | — |
| | — |
| | 55 |
|
| Total Corporate-level debt | — |
| | 392 |
| | 281 |
| | — |
| | — |
| | 850 |
| | 1,523 |
|
| Project-level debt: | | | | | | | | | | | | |
|
|
| Agua Caliente Borrower 2, due 2038 | 1 |
| | 1 |
| | 1 |
| | 1 |
| | 1 |
| | 36 |
| | 41 |
|
| Alpine, due 2022 | 8 |
| | 8 |
| | 8 |
| | 8 |
| | 103 |
| | — |
| | 135 |
|
| Alta Wind I - V lease financing arrangements, due 2034 and 2035 | 40 |
| | 41 |
| | 45 |
| | 45 |
| | 47 |
| | 708 |
| | 926 |
|
| CVSR, due 2037 | 26 |
| | 24 |
| | 21 |
| | 23 |
| | 25 |
| | 627 |
| | 746 |
|
| CVSR Holdco Notes, due 2037 | 6 |
| | 6 |
| | 6 |
| | 7 |
| | 9 |
| | 160 |
| | 194 |
|
| El Segundo Energy Center, due 2023 | 48 |
| | 49 |
| | 53 |
| | 57 |
| | 63 |
| | 130 |
| | 400 |
|
| Energy Center Minneapolis, due 2025 | 7 |
| | 11 |
| | 11 |
| | 11 |
| | 11 |
| | 32 |
| | 83 |
|
| Energy Center Minneapolis Series D Notes, due 2031 | — |
| | — |
| | — |
| | — |
| | — |
| | 125 |
| | 125 |
|
| Laredo Ridge, due 2028 | 5 |
| | 5 |
| | 6 |
| | 6 |
| | 7 |
| | 66 |
| | 95 |
|
| Marsh Landing, due 2023 | 55 |
| | 57 |
| | 60 |
| | 62 |
| | 65 |
| | 19 |
| | 318 |
|
| Tapestry, due 2021 | 11 |
| | 11 |
| | 11 |
| | 129 |
| | — |
| | — |
| | 162 |
|
| Utah Solar Portfolio, due 2022 | 12 |
| | 14 |
| | 13 |
| | 13 |
| | 226 |
| | — |
| | 278 |
|
| Viento, due 2023 | 16 |
| | 18 |
| | 16 |
| | 16 |
| | 17 |
| | 80 |
| | 163 |
|
| Walnut Creek, due 2023 | 45 |
| | 47 |
| | 49 |
| | 52 |
| | 55 |
| | 19 |
| | 267 |
|
| Other | 26 |
| | 30 |
| | 69 |
| | 25 |
| | 24 |
| | 269 |
| | 443 |
|
| Total project-level debt | 306 |
| | 322 |
| | 369 |
| | 455 |
| | 653 |
| | 2,271 |
| | 4,376 |
|
| Total debt | $ | 306 |
| | $ | 714 |
| | $ | 650 |
| | $ | 455 |
| | $ | 653 |
| | $ | 3,121 |
| | $ | 5,899 |
|
(a) At December 31, 2023, amount includes $1.11 billion of construction-related financings recorded in long-term debt on the Company’s consolidated balance sheet that is due in 2024 and is either being funded through long-term equity contributions or is converting to long-term debt. Capital Expenditures
The Company'sCompany’s capital spending program is mainly focused on maintenance capital expenditures, consisting of costs to maintain the assets currently operating, such as costs to replace or refurbish assets during routine maintenance, and growth capital expenditures consisting of costs to construct new assets, and costs to complete the construction of assets where construction is in process, and capital expenditures related to acquiring additional thermal customers. process.
For the years ended December 31, 2017, 2016,2023 and 2015,2022, the Company used approximately $31 million, $20$212 million and $29$112 million, respectively, to fund capital expenditures, includingmaintenance capital expenditures of $27 million,$16$22 million and $20$25 million, respectively.Growth capital expenditures in 2017 were in primarily2023 of $190 million in the ThermalRenewables segment and relate to servicing new customers in district energy centers. Growthwere funded through construction-related financing. Renewables segment capital expenditures included $121 million incurred in 2016connection with the Daggett 3 solar project, $23 million incurred in connection with the Daggett 2 solar project, $20 million incurred in connection with the Victory Pass and 2015 primarily related toArica solar projects, $11 million incurred in connection with the servicing new customers in district energy centers within the Thermal segmentWaiawa solar project and construction of the Company's$15 million incurred by other wind and solar generating assets. The Company develops annual capital spending plans based on projected requirements for maintenance and growth capital. projects. The Company estimates $32$40 million of maintenance capital expenditures for 2018. 2024. These estimates are subject to continuing review and adjustment and actual capital expenditures may vary from these estimates.
Off-Balance Sheet Arrangements
Obligations under Certain Guarantee Contracts
The Company may enter into guarantee arrangements in the normal course of business to facilitate commercial transactions with third parties.
Retained or Contingent Interests
The Company does not have any material retained or contingent interests in assets transferred to an unconsolidated entity.
Obligations Arising Out of a Variable Interest in an Unconsolidated Entity
Variable interest in equity investments — As of December 31, 2023, the Company has several investments with an ownership interest percentage of 50% or less. GenConn and Rosie Central BESS are variable interest entities for which the Company is not the primary beneficiary. The Company’s pro-rata share of non-recourse debt held by unconsolidated affiliates was approximately $303 million as of December 31, 2023. This indebtedness may restrict the ability of these subsidiaries to issue dividends or distributions to the Company. See also Item 15 — Note 5, Investments Accounted for by the Equity Method and Variable Interest Entities.
Contractual Obligations and Commercial Commitments
Inaddition to the Company’s capital expenditure programs, the Company has a variety of contractual obligations and other commercial commitments that represent prospective cash requirements. The following table summarizes the Company’s contractual obligations. See Item 15 — Note 10, Long-term Debt andNote 15, Leases, for additional discussion.
| | | | | | | | | | | | | | | | | | | | | | | | | | | | | | | | | | | |
| By Remaining Maturity at December 31, |
| 2023 | | 2022 |
| Contractual Cash Obligations | Under
1 Year | | 1-3 Years | | 3-5 Years | | Over
5 Years | | Total | | Total |
| (In millions) |
| Long-term debt (including estimated interest) | $ | 1,990 | | | $ | 1,258 | | | $ | 2,395 | | | $ | 4,286 | | | $ | 9,929 | | | $ | 8,863 | |
| Operating leases | 34 | | | 69 | | | 72 | | | 980 | | | 1,155 | | | 982 | |
Natural gas transportation obligations (a) | 2 | | | 5 | | | — | | | — | | | 7 | | | — | |
Other liabilities (b) | 29 | | | 55 | | | 46 | | | 315 | | | 445 | | | 300 | |
| Total | $ | 2,055 | | | $ | 1,387 | | | $ | 2,513 | | | $ | 5,581 | | | $ | 11,536 | | | $ | 10,145 | |
(a) These contractual cash obligations relate to reservation charges under the backbone transportation service contracts.
(b) Includes water right agreements, service and maintenance agreements and LTSA commitments.
Acquisitions and Investments
Retained or Contingent Interests
The Company intendsdoes not have any material retained or contingent interests in assets transferred to acquire generation and thermal infrastructure assets developed and constructed by NRG or other third partiesan unconsolidated entity.
Obligations Arising Out of a Variable Interest in the future, as well as generation and thermal infrastructure assets from third parties wherean Unconsolidated Entity
Variable interest in equity investments — As of December 31, 2023, the Company believes its knowledge of the market and operating expertise provides a competitive advantage, and to utilize such acquisitions as a means to grow its CAFD.
On February 24, 2017, the Company amended and restated the ROFO Agreement, expanding the ROFO Assets pipelinehas several investments with the addition of 234 net MW of utility-scale solar projects, consisting of Buckthorn Solar, a 154 net MW solar facility in Texas, and Hawaii solar projects, which have a combined capacity of 80 net MW.
On February 6, 2018, the Company entered into an agreement with NRG to purchase 100% of the membership interests in Carlsbad Energy Holdings LLC, which indirectly owns the Carlsbad project, a 527 MW natural gas fired project in Carlsbad, CA, pursuant to the ROFO Agreement. The purchase price for the transaction is $365 million in cash consideration, subject to customary working capital and other adjustments. The transaction is expected to close during the fourth quarter of 2018 and is contingent upon the consummation of the NRG Transaction.
On January 24, 2018, the Company entered into an agreement with NRG to purchase 100% of NRG's ownership interest in Buckthorn Solar pursuant to the ROFO Agreementpercentage of 50% or less. GenConn and Rosie Central BESS are variable interest entities for cash consideration of $42 million, subject to other adjustments. The transaction is expected to close during the first quarter of 2018.
As discussed in Item 1 — Note 3, Business Acquisitions, the Company completed the following acquisitions in 2017:
November 2017 Drop Down Assets — On November 1, 2017, the Company acquired a 38 MW solar portfolio primarily comprised of assets from NRG's Solar Power Partners (SPP) funds and other projects developed by NRG, for cash consideration of $74 million, including a working capital adjustment of $3 million, plus assumed non-recourse debt of $26 million.
August 2017 Drop Down Assets — On August 1, 2017, the Company acquired the remaining 25% interest in NRG Wind TE Holdco, a portfolio of 12 wind projects, from NRG for total cash consideration of $44 million, including a working capital adjustment of $3 million. The transaction also includes potential additional payments to NRG dependent upon actual energy prices for merchant periods beginning in 2027.
March 2017 Drop Down Assets — On March 27, 2017, the Company acquired the following interests from NRG: (i) Agua Caliente Borrower 2 LLC, which owns a 16% interest (approximately 31% of NRG's 51% interest) in the Agua Caliente solar farm, one of the ROFO Assets, representing ownership of approximately 46 net MW of capacity, and (ii) NRG's interests in seven utility-scale solar farms located in Utah, which are part of a tax equity structure with Dominion Solar Projects III, Inc., or Dominion, from which the Company would receive 50%is not the primary beneficiary. The Company’s pro-rata share of cash to be distributed. The Company paid cash consideration of $132non-recourse debt held by unconsolidated affiliates was approximately $303 million
Investment Partnership with NRG
On September 26, 2017, the Company entered into an additional partnership with NRG by forming NRG DGPV Holdco 3 LLC, or DGPV Holdco 3, in which the Company would invest up to $50 million in an operating portfolio of distributed solar assets, primarily comprised of community solar projects, developed by NRG. The Company owns approximately 43 MW of distributed solar capacity, based on cash to be distributed, with a weighted average contract life of approximately 20 years as of December 31, 2017.2023. This indebtedness may restrict the ability of these subsidiaries to issue dividends or distributions to the Company. See also Item 15 — Note 5, Investments Accounted for by the Equity Method and Variable Interest Entities.
DuringContractual Obligations and Commercial Commitments
Inaddition to the year ended December 31, 2017,Company’s capital expenditure programs, the Company invested $64 million in distributed generation partnerships with NRG.
Cash Distributions to Yield, Inc. and NRG
The Company intends to distribute to its unit holders in the formhas a variety of a quarterly distribution all of the CAFD that is generated each quarter less reserves for the prudent conduct of the business, including among others, maintenance capital expenditures to maintain the operating capacity of the assets. CAFD is defined as net income before interest expense, income taxes, depreciation and amortization, plus cash distributions from unconsolidated affiliates, cash receipts from notes receivable, less cash distributions to noncontrolling interests, maintenance capital expenditures, pro-rata EBITDA from unconsolidated affiliates, cash interest paid, income taxes paid, principal amortization of indebtedness and changes in prepaid and accrued capacity payments. Distributions on units are subject to available capital, market conditions, and compliance with associated laws, regulationscontractual obligations and other contractual obligations. The Company expectscommercial commitments that based on current circumstances, comparable distributions will continue to be paid in the foreseeable future.
represent prospective cash requirements. The following table listssummarizes the distributions paid onCompany’s contractual obligations. See Item 15 — Note 10, Long-term Debt andNote 15, Leases, for additional discussion.
| | | | | | | | | | | | | | | | | | | | | | | | | | | | | | | | | | | |
| By Remaining Maturity at December 31, |
| 2023 | | 2022 |
| Contractual Cash Obligations | Under
1 Year | | 1-3 Years | | 3-5 Years | | Over
5 Years | | Total | | Total |
| (In millions) |
| Long-term debt (including estimated interest) | $ | 1,990 | | | $ | 1,258 | | | $ | 2,395 | | | $ | 4,286 | | | $ | 9,929 | | | $ | 8,863 | |
| Operating leases | 34 | | | 69 | | | 72 | | | 980 | | | 1,155 | | | 982 | |
Natural gas transportation obligations (a) | 2 | | | 5 | | | — | | | — | | | 7 | | | — | |
Other liabilities (b) | 29 | | | 55 | | | 46 | | | 315 | | | 445 | | | 300 | |
| Total | $ | 2,055 | | | $ | 1,387 | | | $ | 2,513 | | | $ | 5,581 | | | $ | 11,536 | | | $ | 10,145 | |
(a) These contractual cash obligations relate to reservation charges under the Company's Class A, Class B, Class Cbackbone transportation service contracts.
(b) Includes water right agreements, service and Class D units during the year ended December 31, 2017:
|
| | | | | | | | | | | | | | | |
| | Fourth Quarter 2017 | | Third Quarter 2017 | | Second Quarter 2017 | | First Quarter 2017 |
| Distributions per Class A and Class B unit | $ | 0.288 |
| | $ | 0.28 |
| | $ | 0.27 |
| | $ | 0.26 |
|
| Distributions per Class C and Class D unit | $ | 0.288 |
| | $ | 0.28 |
| | $ | 0.27 |
| | $ | 0.26 |
|
On February 15, 2018, the Company declared a quarterly distribution on its Class A, Class B, Class Cmaintenance agreements and Class D units of $0.298 per unit payable on March 15, 2018.LTSA commitments.
Cash Flow Discussion
Year Ended December 31, 2017 Compared to Year Ended December 31, 2016
The following table reflects the changes in cash flows for the year ended December 31, 2017, compared to 2016:
|
| | | | | | | | | | | |
| Year ended December 31, | 2017 | | 2016 | | Change |
| (In millions) | |
| Net cash provided by operating activities | $ | 516 |
| | $ | 577 |
| | $ | (61 | ) |
| Net cash used in investing activities | (283 | ) | | (131 | ) | | (152 | ) |
| Net cash used in financing activities | (416 | ) | | (202 | ) | | (214 | ) |
Net Cash Provided By Operating Activities
|
| | | |
| Changes to net cash provided by operating activities were driven by: | (In millions) |
| Decrease in operating income adjusted for non-cash items driven by primarily by lower revenues in the Renewables segment in 2017 compared to 2016 | $ | (63 | ) |
| Decrease in working capital driven primarily by the timing of accounts receivable collections, and inventory build up in the Renewables segment in connection with the transition to self operations, as well as higher prepaid expenses in 2017 compared to 2016 | (12 | ) |
| Higher distributions from unconsolidated affiliates primarily due to the acquisition of the Utah Solar Portfolio, which was acquired by the Company in March 2017 and by NRG in November 2016 | 14 |
|
| | $ | (61 | ) |
Net Cash Used In Investing Activities
|
| | | |
| Changes to net cash used in investing activities were driven by: | (In millions) |
| Payments for the acquisition of the March 2017, August 2017, and November 2017 Drop Down Assets in 2017 compared to the payments made for the CVSR Drop Down in 2016 | $ | (173 | ) |
| Higher return of investment from unconsolidated affiliates combined with lower investments primarily in DGPV HoldCo entities in 2017 | 29 |
|
| Higher capital expenditures primarily related to maintenance capital expenditures at Walnut Creek as a result of the forced outages in 2017 | (11 | ) |
| Higher insurance proceeds in 2017 in the Conventional segment compared to the insurance proceeds in 2016 in the Renewables segment | 3 |
|
| | $ | (152 | ) |
Net Cash Used In Financing Activities
|
| | | |
| Changes in net cash used in financing activities were driven by: | (In millions) |
| Increase in net contributions from noncontrolling interests due to higher production-based payments in 2017 compared to 2016 | $ | 8 |
|
| Lower net payments of distributions to NRG for the Drop Down Assets relating to the pre-acquisition period in 2017 compared to 2016 | 164 |
|
| Proceeds from the issuance of Class C units | 33 |
|
| Net payments of $306 million under the revolving credit facility in 2016 compared to proceeds of $55 million in 2017 | 361 |
|
| Higher borrowing in 2016, primarily related to the 2026 Senior Notes and CVSR Holdco Notes due 2037 partially offset by higher repayments of long-term debt in 2017 | (751 | ) |
| Increase in distributions paid to unit holders | (29 | ) |
| | $ | (214 | ) |
Year Ended December 31, 2016 Compared to Year Ended December 31, 2015
The following table reflects the changes in cash flows for the year ended December 31, 2016, compared to 2015:
|
| | | | | | | | | | | |
| Year ended December 31, | 2016 | | 2015 | | Change |
| (In millions) | |
| Net cash provided by operating activities | $ | 577 |
| | $ | 424 |
| | $ | 153 |
|
| Net cash used in investing activities | (131 | ) | | (1,098 | ) | | 967 |
|
| Net cash (used in) provided by financing activities | (202 | ) | | 354 |
| | (556 | ) |
Net Cash Provided By Operating Activities
|
| | | |
| Changes to net cash provided by operating activities were driven by: | (In millions) |
| Increase in operating income adjusted for non-cash items driven by higher revenues mainly in the Renewables segment in 2016 compared to 2015 | $ | 120 |
|
| Changes in working capital driven primarily by the timing of accounts receivable collections in 2015 compared to 2016 | 35 |
|
| Lower distributions from unconsolidated affiliates | (2 | ) |
| | $ | 153 |
|
Net Cash Used In Investing Activities
|
| | | |
| Changes to net cash used in investing activities were driven by: | (In millions) |
| Payments to acquire businesses, net of cash acquired, in 2015 | $ | 37 |
|
| Higher payments for the acquisition of the January 2015 and November 2015 Drop Down Assets in 2015 compared to the payments made for the CVSR Drop Down in 2016 | 621 |
|
| Decrease in capital expenditures primarily due to the completion of a project in the Thermal segment in 2015, as well as lower maintenance capital expenditures in 2016 | 9 |
|
| Higher net investments in unconsolidated affiliates in 2015, primarily due to investment in Desert Sunlight | 305 |
|
| Other | (5 | ) |
| | $ | 967 |
|
Net Cash (Used In) Provided By Financing Activities
|
| | | |
| Changes in net cash provided by financing activities were driven by: | (In millions) |
| Higher payments of distributions to NRG from Drop Down Assets prior to the acquisition dates | $ | (105 | ) |
Proceeds from sale of an economic interest in Alta TE Holdco in 2015, as further described in Item 15 — Note 5, Investments Accounted for by the Equity Method and Variable Interest Entities, compared to lower net contributions from tax equity investors in 2016 | (117 | ) |
| Proceeds from the issuance of Class C units in 2015 | (599 | ) |
| Increase in distributions paid to unit holders | (34 | ) |
| Net repayments of $306 million under the revolving credit facility in 2016 compared to the net borrowings of $306 million in 2015 | (612 | ) |
| Issuance of the Series D Notes in October 2016, 2026 Senior Notes in August 2016, and CVSR Holdco Notes, due 2037 in July 2016, partially offset by lower debt principal payments throughout 2016, compared to 2015 | 919 |
|
| Higher debt issuance costs paid in 2016 | (8 | ) |
| | $ | (556 | ) |
Off-Balance Sheet Arrangements
Obligations under Certain Guarantee Contracts
The Company may enter into guarantee arrangements in the normal course of business to facilitate commercial transactions with third parties.
Retained or Contingent Interests
The Company does not have any material retained or contingent interests in assets transferred to an unconsolidated entity.
Obligations Arising Out of a Variable Interest in an Unconsolidated Entity
Variable interest in equity investments — As of December 31, 2017,2023, the Company has several investments with an ownership interest percentage of 50% or less in energyless. GenConn and energy-related entities that are accounted for under the equity method. NRG DGPV Holdco 1 LLC, NRG DGPV Holdco 2 LLC, NRG DGPV Holdco 3 LLC, NRG RPV Holdco 1 LLC and GenConnRosie Central BESS are variable interest entities for which the Company is not the primary beneficiary. The Company'sCompany’s pro-rata share of non-recourse debt held by unconsolidated affiliates was approximately $777$303 million as of December 31, 2017.2023. This indebtedness may restrict the ability of these subsidiaries to issue dividends or distributions to the Company. See also Item 15 — Note 5, Investments Accounted for by the Equity Method and Variable Interest Entities, to the Consolidated Financial Statements..
Contractual Obligations and Commercial Commitments
TheInaddition to the Company’s capital expenditure programs, the Company has a variety of contractual obligations and other commercial commitments that represent prospective cash requirements in addition to the Company's capital expenditure programs.requirements. The following table summarizes the Company'sCompany’s contractual obligations. See Item 15 — Note 10,Long-term Debt andNote 14, Commitments and Contingencies15, to the Consolidated Financial StatementsLeases, for additional discussion.
|
| | | | | | | | | | | | | | | | | | | | | | | |
| | By Remaining Maturity at December 31, |
| | 2017 | | 2016 |
| Contractual Cash Obligations | Under 1 Year | | 1-3 Years | | 3-5 Years | | Over 5 Years | | Total | | Total |
| | (In millions) |
| Long-term debt (including estimated interest) | $ | 593 |
| | $ | 1,856 |
| | $ | 1,500 |
| | $ | 3,907 |
| | $ | 7,856 |
| | $ | 8,328 |
|
| Operating leases | 9 |
| | 18 |
| | 18 |
| | 151 |
| | 196 |
| | 199 |
|
| Fuel purchase and transportation obligations | 11 |
| | 8 |
| | 6 |
| | 16 |
| | 41 |
| | 45 |
|
Other liabilities (a) | 29 |
| | 45 |
| | 29 |
| | 105 |
| | 208 |
| | 129 |
|
| Total | $ | 642 |
| | $ | 1,927 |
| | $ | 1,553 |
| | $ | 4,179 |
| | $ | 8,301 |
| | $ | 8,701 |
|
| | | | | | | | | | | | | | | | | | | | | | | | | | | | | | | | | | | |
| By Remaining Maturity at December 31, |
| 2023 | | 2022 |
| Contractual Cash Obligations | Under
1 Year | | 1-3 Years | | 3-5 Years | | Over
5 Years | | Total | | Total |
| (In millions) |
| Long-term debt (including estimated interest) | $ | 1,990 | | | $ | 1,258 | | | $ | 2,395 | | | $ | 4,286 | | | $ | 9,929 | | | $ | 8,863 | |
| Operating leases | 34 | | | 69 | | | 72 | | | 980 | | | 1,155 | | | 982 | |
Natural gas transportation obligations (a) | 2 | | | 5 | | | — | | | — | | | 7 | | | — | |
Other liabilities (b) | 29 | | | 55 | | | 46 | | | 315 | | | 445 | | | 300 | |
| Total | $ | 2,055 | | | $ | 1,387 | | | $ | 2,513 | | | $ | 5,581 | | | $ | 11,536 | | | $ | 10,145 | |
(a) These contractual cash obligations relate to reservation charges under the backbone transportation service contracts.
(b)Includes water right agreements, service and maintenance agreements and LTSA commitments.
Acquisitions and Investments The Company intends to acquire generation assets developed and constructed by CEG as well as generation assets from third parties where the Company believes its knowledge of the market and operating expertise provides a competitive advantage, and to utilize such acquisitions as a means to grow its business.
Texas Solar Nova 1 Drop Down— On December 28, 2023, the Company, through its indirect subsidiary, Lighthouse Renewable Holdco 2 LLC, acquired TSN1 BL Borrower Holdco LLC, the indirect owner of Texas Solar Nova 1, a 252 MW solar project that is located in Kent County, Texas, from Clearway Renew for cash consideration of $23 million. Lighthouse Renewable Holdco 2 LLC is a partnership between the Company and a cash equity investor. The cash equity investor also contributed cash consideration of $109 million to acquire their portion of the acquired entity. TSN1 BL Borrower Holdco LLC consolidates as primary beneficiary, TSN1 TE Holdco LLC, a tax equity fund that owns the Texas Solar Nova 1 solar project.Texas Solar Nova 1 has an 18-year PPA with an investment-grade counterparty that commenced in January 2024. The acquisition was funded with existing sources of liquidity. Additionally, the Company assumed the project’s financing agreement, which included a construction loan that converted to a term loan at acquisition date along with a sponsor equity bridge loan and tax equity bridge loan that were both repaid at acquisition date.
Victory Pass and Arica Drop Down — On October 31, 2023, the Company, through its indirect subsidiary, VP-Arica Parent Holdco LLC, acquired the Class A membership interests in VP-Arica TargetCo LLC, a partnership and the indirect owner of the Victory Pass and Arica solar projects, from Clearway Renew for initial cash consideration of $46 million. At substantial completion, which is expected to occur in the first half of 2024, the Company estimates it will pay an additional $182 million to Clearway Renew. VP Arica TargetCo LLC consolidates as primary beneficiary, VP-Arica TE Holdco LLC, a tax equity fund that owns the Victory Pass and Arica solar projects. Victory Pass and Arica each have PPAs with investment-grade counterparties that have a 15-year and 14-year weighted average contract duration, respectively, that commence when the underlying operating assets reach commercial operations, which is expected to occur in the first half of 2024. The acquisition was funded with existing sources of liquidity. As part of the acquisition of Victory Pass and Arica, the Company assumed the project’s financing agreement, which included a sponsor equity bridge loan that was partially paid off at acquisition date, and a tax equity bridge loan, both of which will be completely paid off when the projects reach substantial completion. Subsequent to the acquisition, the Company borrowed an additional $22 million in tax equity bridge loans.
Daggett 2 Drop Down — On August 30, 2023, the Company, through its indirect subsidiary, Daggett Solar Investment LLC, acquired the Class A membership interests in Daggett 2 TargetCo LLC, a partnership and the indirect owner of the Daggett 2 solar project, from CEG for cash consideration of $13 million. Daggett 2 TargetCo LLC consolidates as primary beneficiary, Daggett 2 TE Holdco LLC, a tax equity fund that owns the Daggett 2 solar project. Daggett 2 has PPAs with investment-grade counterparties that have a 15-year weighted average contract duration that commenced in December 2023. The acquisition was funded with existing sources of liquidity. Additionally, the Company assumed the project’s financing agreement, which included a construction loan, a tax equity bridge loan and a sponsor equity bridge loan that was repaid at acquisition date. Subsequent to the acquisition, the Company borrowed an additional $49 million in construction loans. Upon the project reaching substantial completion on December 22, 2023, the tax equity bridge loan was repaid and the total outstanding construction loans were converted to a term loan in the amount of $156 million.
Rosamond Central BESS Drop Down and Financing Activities — On June 30, 2023, the Company, through its indirect subsidiary, Rosie Class B LLC, the indirect owner of the Rosamond Central solar project, became the owner of the Class B membership interests of Rosie Central BESS in order to facilitate and fund the construction of a BESS project that is co-located at the Rosamond Central solar facility. Clearway Renew indirectly owns the Class A membership interests and controls Rosie Central BESS. As of December 31, 2023, the Company’s investment, which is accounted for under the equity method of accounting, consisted of $28 million contributed into Rosie Central BESS, funded through contributions from the Company and its cash equity investor in Rosie TargetCo LLC, which consolidates Rosie Class B LLC. On December 1, 2023, the Rosamond Central solar project acquired the BESS project from Clearway Renew for initial cash consideration of $70 million, $16 million of which was funded by the Company with the remaining $54 million funded through contributions from third-party investors. At substantial completion, which is expected to occur in the first half of 2024, the Company estimates it will pay an additional $279 million to Clearway Renew, $61 million of which will be funded by the Company with the remaining $218 million to be funded through contributions from the third-party investors. Also, at substantial completion, Clearway Renew will return Rosie Class B LLC’s equity investment. The BESS project has a PPA for capacity with an investment-grade utility that has a 15-year contract duration that commences when the project reaches commercial operations, which is expected to occur in the first half of 2024. The Company’s portion of the initial consideration was funded with existing sources of liquidity.
On June 30, 2023, Rosie Class B LLC amended its financing agreement. During the year ended December 31, 2023, Rosie Class B LLC received total loan proceeds of $265 million under the amended financing agreement. On July 3, 2023, Rosie Class B LLC issued a loan to Clearway Renew, utilizing a portion of the loan proceeds under the amended financing agreement, in order to finance the construction of the BESS project. On December 1, 2023, Clearway Renew partially repaid the loan utilizing the $70 million in proceeds that was paid by the Company to acquire the BESS project. As of December 31, 2023, the loan had an aggregate principal amount of $174 million and matures when the project reaches substantial completion. Also, during the year ended December 31, 2023, the Company utilized a portion of the loan proceeds received under the amended financing agreement to contribute $18 million into Rosie Central BESS.
Waiawa Drop Down —In connection with the 2022 Drop Down of Waiawa, the Company assumed the project’s financing agreement, which includes a construction loan that converted to a term loan on March 30, 2023 upon the project reaching substantial completion and a tax equity bridge loan that was repaid on March 30, 2023.
Daggett 3 Drop Down — On February 17, 2023, the Company, through its indirect subsidiary, Daggett Solar Investment LLC, acquired the Class A membership interests in Daggett TargetCo LLC, the indirect owner of the Daggett 3 solar project, from Clearway Renew for cash consideration of $21 million and then contributed its Class A membership interests into Daggett Renewable Holdco LLC, a partnership that consolidates Daggett TargetCo LLC. Daggett TargetCo LLC consolidates as primary beneficiary, Daggett TE Holdco LLC, a tax equity fund that owns the Daggett 3 solar project. Daggett 3 has PPAs with investment-grade counterparties that have a 15-year weighted average contract duration that commenced between July 2023 and November 2023. The acquisition was funded with existing sources of liquidity. Additionally, the Company assumed the project’s financing agreement, which included a construction loan, a tax equity bridge loan and a sponsor equity bridge loan that was repaid at acquisition date. Subsequent to the acquisition, the Company borrowed an additional $36 million in construction loans. Upon the project reaching substantial completion on December 1, 2023, the tax equity bridge loan was repaid and the total outstanding construction loans were converted to a term loan in the amount of $217 million. CEG also funded an additional $54 million in project completion costs subsequent to the acquisition, which was repaid to CEG in October 2023.
Cash Distributions to Clearway, Inc. and CEG
The Company intends to distribute to its unit holders in the form of a quarterly distribution all of the CAFD that is generated each quarter less reserves for the prudent conduct of the business, including among others, maintenance capital expenditures to maintain the operating capacity of the assets. Distributions on units are subject to available capital, market conditions and compliance with associated laws, regulations and other contractual obligations. The Company expects that, based on current circumstances, comparable distributions will continue to be paid in the foreseeable future.
The following table lists the distributions paid on the Company’s Class A, Class B, Class C and Class D units during the year ended December 31, 2023:
| | | | | | | | | | | | | | | | | | | | | | | |
| Fourth Quarter 2023 | | Third Quarter 2023 | | Second Quarter 2023 | | First Quarter 2023 |
| Distributions per Class A and Class B units | $ | 0.3964 | | | $ | 0.3891 | | | $ | 0.3818 | | | $ | 0.3745 | |
| Distributions per Class C and Class D units | 0.3964 | | | 0.3891 | | | 0.3818 | | | 0.3745 | |
On February 14, 2024, the Company declared a quarterly distribution on its Class A, Class B, Class C and Class D units of $0.4033 per unit payable on March 15, 2024.
In addition to the quarterly distributions, the Company paid $51 million in additional distributions, $30 million of which was distributed to Clearway, Inc. and $21 million of which was distributed to CEG, during the year ended December 31, 2023, in order for Clearway, Inc. to make certain additional tax payments primarily associated with the sale of the Thermal Business.
Cash Flow Discussion
The following table reflects the changes in cash flows for the comparative periods:
| | | | | | | | | | | | | | | | | |
| Year ended December 31, | | |
| 2023 | | 2022 | | Change |
| (In millions) |
| Net cash provided by operating activities | $ | 733 | | | $ | 797 | | | $ | (64) | |
| Net cash (used in) provided by investing activities | (523) | | | 1,065 | | | (1,588) | |
| Net cash used in financing activities | (155) | | | (1,520) | | | 1,365 | |
Net Cash Provided by Operating Activities
| | | | | |
| Changes to net cash provided by operating activities were driven by: | (In millions) |
| Decrease in working capital primarily driven by the timing of accounts receivable collections and payments of accounts payable | $ | (41) | |
| Decrease in operating income after adjusting for non-cash items | (34) | |
| Decrease in distributions from unconsolidated affiliates | (7) | |
| Transaction expenses paid on May 1, 2022 in connection with the sale of the Thermal Business | 18 | |
| $ | (64) | |
Net Cash (Used In) Provided by Investing Activities
| | | | | |
| Changes to net cash (used in) provided by investing activities were driven by: | (In millions) |
| Proceeds from the sale of the Thermal Business in 2022 | $ | (1,457) | |
| Increase in note receivable — affiliate | (174) | |
| Increase in capital expenditures | (100) | |
| Payment for equipment deposit from affiliate in 2023 | (55) | |
| Increase in investments in unconsolidated affiliates | (28) | |
| Payment for equipment deposit in 2023 | (27) | |
| Acquisition of the Capistrano Wind Portfolio in 2022 | 223 | |
| Decrease in cash paid for Drop Down assets, net of cash acquired | 26 | |
| Other | 4 | |
| $ | (1,588) | |
Net Cash Used In Financing Activities
| | | | | |
| Changes in net cash used in financing activities were driven by: | (In millions) |
| Increase in contributions from noncontrolling interests and CEG, net of distributions | $ | 968 | |
| Decrease in payments for the revolving credit facility, net of proceeds | 245 | |
| Increase in proceeds for long-term debt, net of an increase in payments | 166 | |
| Cash released from escrow distributed to CEG in 2022 | 64 | |
| Increase in tax-related distributions | (32) | |
| Increase in distributions paid to unit holders | (22) | |
| Increase in payments of debt issuance costs | (14) | |
| Buyout of noncontrolling interest and redeemable noncontrolling interest in 2023 | (13) | |
| Other | 3 | |
| $ | 1,365 | |
Fair Value of Derivative Instruments
The Company may enter into fuel purchaseenergy-related commodity contracts and other energy-related financial instruments to mitigate variability in earnings due to fluctuations in spot market prices and to hedge fuel requirements at certain generation facilities.prices. In addition, in order to mitigate interest rate risk associated with the issuance of variable rate debt, the Company enters into interest rate swap agreements.
The tables below disclose the activities of non-exchange traded contracts accounted for at fair value in accordance with ASC 820. Specifically, these tables disaggregate realized and unrealized changes in fair value; disaggregate estimated fair values at December 31, 20172023, based on their level within the fair value hierarchy defined in ASC 820; and indicate the maturities of contracts at December 31, 20172023. For a full discussion of the Company'sCompany’s valuation methodology of its contracts, see Derivative Fair Value Measurements in Item 15 —Note 6, Fair Value of Financial Instruments, to the Consolidated Financial Statements.Instruments.
| | | | | |
| Derivative Activity ( Losses)/Gains | (In millions) |
| Fair value of contracts as of December 31, 2022 | $ | (264) | |
| Contracts realized or otherwise settled during the period | 34 | |
| Contracts acquired during the period | 47 | |
| |
| |
| Changes in fair value | (26) | |
| Fair value of contracts as of December 31, 2023 | $ | (209) | |
|
| | | |
| Derivative Activity (Losses)/Gains | (In millions) |
| Fair value of contracts as of December 31, 2016 | $ | (76 | ) |
| Contracts realized or otherwise settled during the period | 32 |
|
| Changes in fair value | (2 | ) |
| Fair value of contracts as of December 31, 2017 | $ | (46 | ) |
| | | | | | | | | | | | | | | | | | | | | | | | | | | | | |
| Fair value of contracts as of December 31, 2023 |
| Maturity |
| Fair Value Hierarchy Losses | 1 Year or Less | | Greater Than 1 Year to 3 Years | | Greater Than 3 Years to 5 Years | | Greater Than 5 Years | | Total Fair Value |
| (In millions) |
| | | | | | | | | |
| Level 2 | $ | 41 | | | $ | 25 | | | $ | 41 | | | $ | 14 | | | $ | 121 | |
| Level 3 | (51) | | | (97) | | | (85) | | | (97) | | | (330) | |
| Total | $ | (10) | | | $ | (72) | | | $ | (44) | | | $ | (83) | | | $ | (209) | |
|
| | | | | | | | | | | | | | |
| | Fair value of contracts as of December 31, 2017 |
| | Maturity |
| Fair Value Hierarchy Losses | 1 Year or Less | | Greater Than
1 Year to 3 Years | | Greater Than
3 Years to 5 Years | | Greater Than
5 Years | | Total Fair
Value |
| | (In millions) |
| Level 2 | 16 |
| | 15 |
| | 9 |
| | 6 |
| | 46 |
|
The Company has elected to disclose derivative assets and liabilities on a trade-by-trade basis and does not offset amounts at the counterparty master agreement level. As discussed below in Quantitative and Qualitative Disclosures about Market Risk -Commodity Price Risk, NRG, on behalf of the Company, measures the sensitivity of the portfolio to potential changes in market prices using VaR, a statistical model which attempts to predict risk of loss based on market price and volatility. NRG's risk management policy places a limit on one-day holding period VaR, which limits the net open position.
Critical Accounting Policies and Estimates
The Company'sCompany’s discussion and analysis of the financial condition and results of operations are based upon the consolidated financial statements, which have been prepared in accordance with GAAP. The preparation of these financial statements and related disclosures in compliance with GAAP requires the application of appropriate technical accounting rules and guidance as well as the use of estimates and judgments that affect the reported amounts of assets, liabilities, revenues and expenses, and related disclosures of contingent assets and liabilities. The application of these policies necessarily involves judgments regarding future events, including the likelihood of success of particular projects, legal and regulatory challenges and the fair value of certain assets and liabilities. These judgments, in and of themselves, could materially affect the financial statements and disclosures based on varying assumptions, which may be appropriate to use. In addition, the financial and operating environment may also have a significant effect, not only on the operation of the business, but on the results reported through the application of accounting measures used in preparing the financial statements and related disclosures, even if the nature of the accounting policies has not changed.
On an ongoing basis, the Company evaluates these estimates, utilizing historic experience, consultation with experts and other methods the Company considers reasonable. Actual results may differ substantially from the Company'sCompany’s estimates. Any effects on the Company'sCompany’s business, financial position or results of operations resulting from revisions to these estimates are recorded in the period in which the information that gives rise to the revision becomes known.
The Company'sCompany’s significant accounting policies are summarized in Item 15 — Note 2, Summary of Significant Accounting Policies, to the Consolidated Financial Statements.. The Company identifies its most critical accounting policies as those that are the most pervasive and important to the portrayal of the Company'sCompany’s financial position and results of operations, and that require the most difficult, subjective and/or complex judgments by management regarding estimates about matters that are inherently uncertain. The Company'sCompany’s critical accounting policies include impairmentaccounting utilizing Hypothetical Liquidation at Book Value, or HLBV, acquisition accounting and determining the fair value of long lived assets and other intangible assets and acquisition accounting.financial instruments.
| | | | | |
| |
| Accounting Policy | Judgments/Uncertainties Affecting Application |
| |
| |
| |
| |
| |
| |
| Hypothetical Liquidation at Book Value (HLBV) | Estimates of taxable income (loss) and tax capital accounts |
| ImpairmentEstimated calculation of Long Lived Assets | Recoverability of investments through future operationsspecified target investor returns |
| Regulatory and political environments and requirementsApplication of liquidation provisions of operating agreements |
| |
| |
| |
| |
| Acquisition Accounting | Estimated useful livesIdentification of assets acquired |
| Operational limitations and environmental obligations |
| Estimates of future cash flows |
| Estimates of fair value |
| Judgment about triggering events |
Acquisition Accounting | Identification of intangible assets acquired |
| Inputs for fair valuevalues of assets and liabilities acquired |
| Application of variousappropriate fair value methodologies |
| Financial Instruments | Use of unobservable market inputs such as future electricity prices, future interest rates and discount rates |
Hypothetical Liquidation at Book Value (HLBV)
EvaluationCertain portions of Assets for Impairmentthe Company’s redeemable noncontrolling interest and Other-Than-Temporary Decline in Value
In accordance with ASC 360, Property, Plant, and Equipment, or ASC 360, property, plant and equipment and certain intangible assets are evaluated for impairment whenever indicators of impairment exist. Examples of such indicators or events are:
Significant decreasenoncontrolling interest represent third-party interests in the market price of a long-lived asset;
Significant adverse change in the manner an asset is being used or its physical condition;
Adverse business climate;
Accumulation of costs significantly in excess of the amount originally expected for the construction or acquisition of an asset;
Current-period loss combined with a history of losses or the projection of future losses; and
Change in the Company's intent about an asset from an intent to hold to a greater than 50% likelihood that an asset will be sold or disposed of before the end of its previously estimated useful life.
Recoverability ofnet assets to be held and used is measured by a comparison of the carrying amount of the assets to the future net cash flows expected to be generatedunder certain tax equity arrangements, which are consolidated by the asset, through considering project specific assumptionsCompany, that were established to finance the cost of facilities eligible for long-term power pool prices, escalated future project operating costscertain tax credits and expected plant operations. If such assets are considered to be impaired, the impairment to be recognized is measured by the amount by which the carrying amount of the assets exceeds the fair value of the assets. The fair value may be determined by factoring in the probability weighting of different courses of action available to the Company as appropriate. Generally, fair value will be determined using valuation techniques such as the present value of expected future cash flows or comparable values determined by transactions in the market.benefits. The Company uses its best estimates in making these evaluations and considers various factors, including forward price curves for energy, fuel costs and operating costs. However, actual future market prices and project costs could vary from the assumptions used in the Company's estimates, and the impact of such variations could be material.
Annually, during the fourth quarter, the Company revises its views of power prices, including the Company's fundamental view for long-term power prices, forecasted generation and operating and capital expenditures, in connection with the preparation of its annual budget.
The Company recorded certain long-lived asset impairments in 2017 and 2016, as described in Item 15 — Note 9, Asset Impairments, to the Consolidated Financial Statements, with respect to several wind projects.
During the fourth quarter of 2017, as the Company updated its estimated cash flows in connection with the preparation and review of the Company's annual budget, the Companyhas determined that the cash flowsprovisions in the contractual agreements of these structures represent substantive profit sharing arrangements. Further, the Company has determined that the appropriate methodology for calculating the Elbow Creekredeemable noncontrolling interest and Forward facilities were belownoncontrolling interest that reflects the carrying valuesubstantive profit sharing arrangements is a balance sheet approach utilizing the HLBV method. Under the HLBV method, the amounts reported as redeemable noncontrolling interest and noncontrolling interest represent the amounts the investors to the tax equity arrangements would hypothetically receive at each balance sheet date under the liquidation provisions of the relatedcontractual agreements, assuming the net assets primarily driven by continued declining merchant power prices in post-contract periods, and that the assets were considered impaired. The fair value of the facilities wasfunding structures were liquidated at their recorded amounts determined using an income approach by applying a discounted cash flow methodology toin accordance with GAAP. The investors’ interests in the long-term budgets for each respective plant. The income approach utilizes estimatesresults of discounted future cash flows, which include key inputs, such as forecasted power prices, operations and maintenance expense, and discount rates. The Company measuredof the impairment lossfunding structures are determined as the difference in redeemable noncontrolling interest and noncontrolling interest at the start and end of each reporting period, after taking into account any capital transactions between the carrying amountstructures and the fair valuefunds’ investors. The calculations utilized to apply the HLBV method include estimated calculations of taxable income or losses for each reporting period as well as estimated calculations of tax capital accounts based on the relevant provisions of each agreement and the related tax guidance. In addition, these calculations often take into account the stipulated targeted investor return specified in the subsidiaries’ operating agreement and agreed by the members of the assetsarrangement. In certain circumstances, the Company and recorded impairment losses of $26 million and $5 million for Elbow Creek and Forward, respectively.
The Company is also required to evaluate its partners in the tax equity method investments to determine whether or not theyarrangements agree that certain tax benefits are impaired. ASC 323, Investments - Equity Method and Joint Ventures, or ASC 323, provides the accounting requirements for these investments. The standard for determining whether an impairment must be recorded under ASC 323 is whether the value is considered to be utilized outside of the tax equity arrangements, which may result in differences in the amount an other-than-temporary decline in value. The evaluation and measurement of impairments under ASC 323 involvesinvestor would hypothetically receive at the same uncertainties as described for long-lived assets that the Company owns directly and accounts forinitial balance sheet date calculated strictly in accordance with ASC 360. Similarly,related contractual agreements. These differences are recognized in the estimates thatconsolidated statements of income using a systematic and rational method over the period during which the investor is expected to achieve its target return. In certain cases, the Company makes with respect to its equity method investments are subjective, andmust apply judgment in determining the impact of variations inmethodology for applying these estimates could be material. Additionally, if the projects in which the Company holds these investments recognize an impairment under the provisions of ASC 360, the Company would record its proportionate share of that impairment loss and would evaluate its investment for an other-than-temporary decline in value under ASC 323.
Certain of the Company’s projects have useful lives that extend well beyond the contract period and therefore, management’s view of long-term power pricesconcepts in the post-contract periodsHLBV method and changes in certain factors may have a significant impact on the expected future cash flows for these projects. Accordingly, if management’s view of long-term power prices in certain markets continues to decrease, it is possibleamounts that somean investor would receive upon a hypothetical liquidation. The use of the Company’s other long-lived assetsHLBV method to allocate income (loss) to the noncontrolling interest holders may be impaired. create volatility in the consolidated statements of income.
Acquisition Accounting
The Company applies ASC 805, Business Combinations, when accounting for the acquisition of a business,acquisitions, with identifiable assets acquired and liabilities assumed recorded at their estimated fair values on theat acquisition date. The Company completes the accounting for an acquisition when the evaluations are completed to the extent that additional information is obtained about the facts and circumstances that existed asFor many of the acquisition date. The allocationCompany’s acquisitions, the Company applies ASC 805-50, which provides that acquisitions of entities under common control are recorded at historical cost, except in the purchase pricecase where the ultimate parent has a different basis, such as when an acquiree did not elect to apply pushdown accounting. In those circumstances, the Company may also be modified uprequired to one year from the date of the acquisition as more information is obtained about the fair value ofrecord its acquired assets acquired and liabilities assumed. Consideration is measured based onat acquisition date fair value of the assets transferred to the seller.value.
Significant judgment is required in determining the acquisition date fair value of the assets acquired and liabilities assumed, predominantly with respect to property, plant and equipment, power purchase agreements, asset retirement obligations and other contractual arrangements.arrangements for third-party acquisitions. Evaluations include numerous inputs including forecasted cash flows that incorporate the specific attributes of each asset including age, useful life, equipment condition and technology as well as current replacement costs for similar assets. Other key inputs that require judgment include discount rates, comparable market transactions, estimated useful lives and probability of future transactions. The Company evaluates all available information as well as all appropriate methodologies, when determining the fair value of assets acquired and liabilities assumed in a business combination. In addition, once the appropriate fair values are determined, the Company must determine the remaining useful life for property, plant and equipment and the amortization period and method of amortization for each finite-lived intangible asset.
Financial Instruments
The Company records its financial instruments, which primarily consist of derivative financial instruments, at fair value. The Company determines the fair value of its financial instruments using discounted cash flow models that require the use of assumptions concerning the amount of estimated future cash flows. The assumptions are determined using external, observable market inputs when available. When observable market inputs are not available, the Company must apply ASC 805-50, Business Combinations - Related Issues, when it acquires ansignificant judgment to determine market participant assumptions such as future electricity prices, future natural gas prices, future interest from NRG. The assetsrates and liabilities transferred todiscount rates. As these inputs are based on estimates, fair values may not reflect the Company related to interests under common control by NRG must be recorded at historical cost, with the difference between the amount paid and the historical value ofamounts actually realized from the related equity recorded as a distribution to or contribution from NRG with the offset to noncontrolling interest. Economics may change in the years subsequent to NRG’s construction or acquisition of certain assets, and although the Company may acquire these assets from NRG based on a different valuation, the Company must record the assets at historical cost. These changes in economics may impact the amount that the Company pays for the assets but will not alter the carrying amount. Accordingly, significant changes in the economics related to these assets may trigger a requirement for impairment testing.transaction.
Recent Accounting Developments
See Item 15 — Note 2, Summary of Significant Accounting Policies, to the Consolidated Financial Statements for a discussion of recent accounting developments.
Item 7A — Quantitative and Qualitative Disclosures About Market Risk
The Company is exposed to several market risks in its normal business activities. Market risk is the potential loss that may result from market changes associated with the Company'sCompany’s power generation or with an existing or forecasted financial or commodity transaction. The types of market risks the Company is exposed to are commodity price risk, interest rate risk, liquidity risk and credit risk.
Commodity Price Risk
Commodity price risks result from exposures to changes in spot prices, forward prices, volatilities, and correlations between various commodities, such as electricity, natural gas and emissions credits. The Company manages the commodity price risk of certain of its merchant generation operations by entering into derivative or non-derivative instruments to hedge the variability in future cash flows from forecasted power sales or purchases of fuel.sales. The portion of forecasted transactions hedged may vary based upon management'smanagement’s assessment of market, weather, operation and other factors. See Item 15 — Note 7, Accounting for Derivative Instruments and Hedging Activities,, to the Consolidated Financial Statements for more information.
Based on a sensitivity analysis using simplified assumptions, the impact of a $0.50 per MMBtuMWh increase or decrease in natural gaspower prices across the term of the derivativelong-term power commodity contracts would cause a change of approximately $16 million in to the net value of the related derivatives as of December 31, 2017.2023.
Interest Rate Risk
The Company is exposed to fluctuations in interest rates through its issuance of variable rate debt. Exposures to interest rate fluctuations may be mitigated by entering into derivative instruments known as interest rate swaps, caps, collars and put or call options. These contracts reduce exposure to interest rate volatility and result in primarily fixed rate debt obligations when taking into account the combination of the variable rate debt and the interest rate derivative instrument. NRG's risk management policies allow the Company to reduce interest rate exposure from variable rate debt obligations. See itemItem 15 — Note 7, Accounting for Derivative Instruments and Hedging Activities, to the Consolidated Financial Statements for more information.
Most of the Company'sCompany’s project subsidiaries enter into interest rate swaps intended to hedge the risks associated with interest rates on non-recourse project level debt. See Item 15 — Note 10,Long-term Debt, to the Consolidated Financial Statements for more information about interest rate swaps of the Company'sCompany’s project subsidiaries.
If all of the above swaps had been discontinued on December 31, 20172023, the Companycounterparties would have owed the counterparties $50Company $127 million. Based on the credit ratings of the counterparties, the Company believes its exposure to credit risk due to nonperformance by counterparties to its hedge contracts to be insignificant.
The Company has long-term debt instruments that subject it to the risk of loss associated with movements in market interest rates. As of December 31, 20172023, a 1% change in interest rates would result in an approximately $3$4 million change in market interest expense on a rolling twelve monthtwelve-month basis.
As of December 31, 20172023, the fair value of the Company'sCompany’s debt was $5,915 million$7.61 billion and the carrying value was $5,899 million. $8.10 billion. The Company estimates that a 1% decrease in market interest rates would have increased the fair value of its long-term debt by $306$338 million.
Liquidity Risk
Liquidity risk arises from the general funding needs of the Company'sCompany’s activities and in the management of the Company'sCompany’s assets and liabilities.
Counterparty Credit Risk
Credit risk relates to the risk of loss resulting from non-performance or non-payment by counterparties pursuant to the terms of their contractual obligations. The Company monitors and manages credit risk through credit policies that include: (i) an established credit approval process, and (ii) the use of credit mitigation measures such as prepayment arrangements or volumetric limits. Risks surrounding counterparty performance and credit could ultimately impact the amount and timing of expected cash flows. The Company seeks to mitigate counterparty risk by having a diversified portfolio of counterparties. See Item 15 — Note 1, Nature of Business, and Note 6, Fair Value of Financial Instruments, to the Consolidated Financial Statements for more information about concentration of credit risk.
Item 8 — Financial Statements and Supplementary Data
The financial statements and schedules are listed in Part IV, Item 15 of this Form 10-K.
Item 9 — Changes in and Disagreements with Accountants on Accounting and Financial Disclosure
None.
Item 9A — Controls and Procedures
Conclusion Regarding the Effectiveness of Disclosure Controls and Procedures and Internal Control Over Financial Reporting
Under the supervision and with the participation of the Company'sCompany’s management, including its principal executive officer, principal financial officer and principal accounting officer, the Company conducted an evaluation of the effectiveness of the design and operation of its disclosure controls and procedures, as such term is defined in Rules 13a-15(e) or 15d-15(e) of the Exchange Act. Based on this evaluation, the Company'sCompany’s principal executive officer, principal financial officer and principal accounting officer concluded that the disclosure controls and procedures were effective as of the end of the period covered by this reportAnnual Report on Form 10-K.
Changes in Internal Control over Financial Reporting
There were no changes in the Company’s internal control over financial reporting (as such term is defined in Rule 13a-15(f) under the Exchange Act) that occurred induring the fourth quarter of 2017ended December 31, 2023, that materially affected, or are reasonably likely to materially affect, the Company’s internal control over financial reporting.
Inherent Limitations over Internal Controls
The Company'sCompany’s internal control over financial reporting is designed to provide reasonable assurance regarding the reliability of financial reporting and the preparation of consolidated financial statements for external purposes in accordance with GAAP. The Company'sCompany’s internal control over financial reporting includes those policies and procedures that:
1. Pertain to the maintenance of records that, in reasonable detail, accurately and fairly reflect the transactions and dispositions of the Company'sCompany’s assets;
2. Provide reasonable assurance that transactions are recorded as necessary to permit preparation of consolidated financial statements in accordance with GAAP, and that the Company'sCompany’s receipts and expenditures are being made only in accordance with authorizations of its management and directors; and
3. Provide reasonable assurance regarding prevention or timely detection of unauthorized acquisition, use or disposition of the Company'sCompany’s assets that could have a material effect on the consolidated financial statements.
Internal control over financial reporting cannot provide absolute assurance of achieving financial reporting objectives because of its inherent limitations, including the possibility of human error and circumvention by collusion or overriding of controls. Accordingly, even an effective internal control system may not prevent or detect material misstatements on a timely basis. Also, projections of any evaluation of effectiveness to future periods are subject to the risk that controls may become inadequate because of changes in conditions or that the degree of compliance with the policies or procedures may deteriorate.
Management'sManagement’s Report on Internal Control over Financial Reporting
The Company'sCompany’s management is responsible for establishing and maintaining adequate internal control over financial reporting, as such term is defined in Exchange Act Rule 13a-15(f). Under the supervision and with the participation of the Company'sCompany’s management, including its principal executive officer, principal financial officer and principal accounting officer, the Company conducted an evaluation of the effectiveness of its internal control over financial reporting based on the framework in Internal Control — Integrated Framework (2013) issued by the Committee of Sponsoring Organizations of the Treadway Commission. Based on the Company'sCompany’s evaluation under the framework in Internal Control — Integrated Framework (2013), the Company'sCompany’s management concluded that its internal control over financial reporting was effective as of December 31, 2017.2023.
Item 9B — Other Information
None.During the three months ended December 31, 2023, no director or officer (as defined in Rule 16a-1(f) under the Exchange Act) of the Company adopted, modified or terminated a “Rule 10b5-1 trading arrangement” or “non-Rule 10b5-1 trading arrangement,” as each term is defined in Item 408(a) of Regulation S-K.
PART III
Item 10 — Information about Directors, Executive Officers and Corporate Governance
Item 10 has been omitted from this report pursuantThe Company is a limited liability company that is managed by Clearway, Inc., as its sole managing member. As a limited liability company managed by Clearway, Inc., the Company does not have a board of directors. References herein to the reduced disclosure format permittedCompany’s board of directors are references to the board of directors (the “Board”) of Clearway, Inc. Pursuant to the Fourth Amended and Restated Limited Liability Company Agreement of the Company, Clearway, Inc. has appointed officers of the Company and designated certain of such officers as “Executive Officers.” These executive officers are the same as the executive officers of Clearway, Inc.
The following table shows information for the Company’s executive officers. Executive officers serve until their successors are duly appointed or elected.
| | | | | | | | |
| Name | Age | Title |
| Christopher S. Sotos | 52 | President and Chief Executive Officer |
| Sarah Rubenstein | 46 | Executive Vice President, Chief Financial Officer |
| Kevin P. Malcarney | 57 | Executive Vice President, General Counsel and Corporate Secretary |
Christopher S. Sotos has served as President and Chief Executive Officer since May 2016, and as a member of the Board of Clearway, Inc. since May 2013. Mr. Sotos had also served in various positions at NRG, including most recently as Executive Vice President-Strategy and Mergers and Acquisitions from February 2016 through May 2016 and Senior Vice President-Strategy and Mergers and Acquisitions from November 2012 through February 2016. In this role, he led NRG’s corporate strategy, mergers and acquisitions, strategic alliances and other special projects for NRG. Previously, he served as NRG’s Senior Vice President and Treasurer from March 2008 to September 2012, where he was responsible for all treasury functions, including raising capital, valuation, debt administration and cash management. Mr. Sotos also previously served as a director of FuelCell Energy, Inc. from September 2014 to April 2019. As President and Chief Executive Officer of the Company, Mr. Sotos provides the Board of Clearway, Inc. with management’s perspective regarding the Company’s day to day operations and overall strategic plan. Mr. Sotos also brings strong financial and accounting skills to the Board of Clearway, Inc.
Sarah Rubenstein has served as Executive Vice President and Chief Financial Officer of the Company since April 2023 and previously served as Senior Vice President and Chief Accounting Officer of the Company from January 2022 to March 2023 and as Vice President, Accounting and Controller from November 2020 through December 2021, where she was responsible for providing oversight of the Company’s financial accounting and reporting functions. Ms. Rubenstein previously served as Assistant Controller of the Company from August 2018 through November 2020, where she was responsible for managing corporate accounting and financial reporting activities, and immediately prior to that, as Director of Accounting Research and Financial Reporting at NRG Energy, Inc. from August 2012 through August 2018. Ms. Rubenstein’s prior roles include Director of Finance at EPV Solar, Inc. and Senior Director of Financial Reporting at Warner Music Group. Ms. Rubenstein began her career as an auditor with PricewaterhouseCoopers.
Kevin P. Malcarney has served as the Company’s General Counsel and Corporate Secretary since May 11, 2018, and was promoted from Senior Vice President to Executive Vice President in January 2022. Mr. Malcarney served as Interim General Counsel of the Company from March 16, 2018 to May 11, 2018. Mr. Malcarney was previously Vice President and Deputy General Counsel and served in various other roles at NRG since September 2008. Prior to NRG, Mr. Malcarney worked at two major law firms in Princeton, New Jersey and Philadelphia, Pennsylvania, and handled mergers and acquisitions, project financing and general corporate matters.
Code of Ethics
The Company has not adopted a separate code of ethics because all of the officers of the Company are subject to the Code of Conduct adopted by General Instruction Ithe Board of Clearway, Inc. The Code of Conduct of Clearway, Inc. applies to Form 10-K.all of its directors and employees, including its and the Company’s officers (e.g., the Company’s CEO, CFO, and Principal Accounting Officer). Clearway, Inc.’s Code of Conduct is available on its website, www.clearwayenergy.com.
Item 11 — Executive Compensation
Compensation Committee Report
The Company’s named executive officers are also named executive officers of Clearway, Inc., and the compensation of the named executive officers disclosed herein reflects total compensation for services with respect to Clearway, Inc. and all of its subsidiaries, including the Company. The Compensation Committee of the Board of Clearway, Inc. (the “Compensation Committee”) has reviewed and discussed the Compensation Discussion and Analysis included in this Annual Report on Form 10-K required by Item 11402(b) of Regulation S-K with management and, based upon such review and discussion, the Compensation Committee has recommended to the Board that the Compensation Discussion and Analysis be included in this Annual Report on Form 10-K.
| | | |
| Compensation Committee: |
| E. Stanley O’Neal, Chair |
| Jonathan Bram |
| Brian R. Ford |
| Jennifer Lowry |
| Daniel B. More |
Compensation Discussion and Analysis
Executive Summary
Executive Compensation Program
Clearway, Inc. is a publicly-traded energy infrastructure investor and owner of modern, sustainable and long-term contracted assets across North America. The Company is sponsored by GIP and TotalEnergies through the portfolio company, CEG, and, together, GIP and TotalEnergies indirectly hold all of Clearway, Inc.’s Class B common stock and Class D common stock and thus collectively have the majority voting interest in the Company. This Compensation Discussion and Analysis (this “CD&A”) describes the philosophy, elements, implementation and results of Clearway, Inc.’s 2023 executive compensation program as it applies to the executive team. As discussed above, Clearway, Inc.’s named executive officers are also named executive officers of Clearway Energy LLC, and the compensation of the named executive officers (“NEOs”) discussed below reflects total compensation for services with respect to Clearway, Inc. and all of its subsidiaries, including Clearway Energy LLC. In this CD&A, the term “Company,” as well as the terms “our,” “we,” “us” or like terms, are used to refer to Clearway, Inc. and its consolidated subsidiaries, including Clearway Energy LLC and its consolidated subsidiaries.
The Compensation Committee’s objectives are to design a simple, yet competitive, executive compensation program, which is aligned with the interests of our stockholders. This program is designed to align short-term and long-term compensation with the Company’s annual performance and three-year total stockholder return (“TSR”), respectively. Our annual incentive program (“AIP”) is primarily based on objective criteria that support the achievement of our short-term objectives, which we believe create long-term stockholder value. Our long-term incentives are comprised of 67% Relative Performance Stock Units (“RPSUs”), which vest based on relative TSR measured over three years and 33% Restricted Stock Units (“RSUs”), which vest based on continued service over three years. The program is intended to incorporate many best practices in compensation design, while being tailored to our business needs and compensation objectives.
In 2023, the Compensation Committee reviewed and did not modify its philosophy related to the compensation program. Thus, NEO compensation continued to be delivered through a mix of (i) base salary, (ii) an annual incentive bonus opportunity under the AIP and (iii) long-term incentive compensation under our Amended and Restated 2013 Equity Incentive Plan (“LTIP”) in the form of RPSUs and RSUs.
At our 2023 Annual Meeting of Stockholders, we received approximately 98% support for our say on pay proposal. We believe these results demonstrate our stockholders support our pay practices and that our compensation program is aligned with their interests.
Key Governance Features of Our Executive Compensation Program
Our compensation program and practices incorporate several key governance features as highlighted in the table below.
| | | | | |
| What We Do: | What We Don’t Do: |
•Pay for performance by delivering a substantial majority of our President and CEO’s compensation through equity | •No excise tax gross‑ups on change‑in‑control payments and no tax gross‑ups on perquisites or benefits |
•The large majority of our equity compensation for Senior Vice Presidents and above is performance‑based | •No pledging or hedging of the Company’s stock by NEOs or directors |
•Target our peer group median for total direct compensation | •No employment agreements for executive officers with the exception of our President and CEO |
•Require a double trigger for the acceleration of equity vesting in connection with a change‑in‑control | •No guaranteed bonus payments for our NEOs |
•Prevent undue risk taking in our compensation practices and engage in robust risk monitoring | •No supplemental executive retirement plans |
•Include legally-required and Company-specific clawback policies in our compensation plans | •No re‑pricing of underwater stock options and no stock option grants with an exercise price below 100% of fair market value |
•Maintain robust stock ownership guidelines for our NEOs | |
•Provide market‑level retirement benefits and limited perquisites | |
•Engage an independent compensation consultant to provide advice to the Compensation Committee with respect to our compensation program | |
•Conduct an annual say on pay vote | |
Business Strategy and Company Performance
The Company’s primary business strategy is to focus on the acquisition and ownership of assets with predictable, long-term cash flows that allow the Company to increase the cash distributions paid to its unit holders over time without compromising the ongoing stability of the business. The Company’s plan for executing this strategy includes the following key components: focusing on contracted renewable energy and conventional generation; growing our business through acquisitions of contracted operating assets primarily in North America; and maintaining sound financial practices to increase distributions to our unit holders.
The execution of the Company’s business strategy produced the following results in 2023:
•Closed on the Drop Downs for the Victory Pass and Arica solar projects that are paired with energy storage, the Daggett 2 and Daggett 3 solar projects that are paired with energy storage, the Texas Solar Nova 1 solar project and the Rosamond Central BESS project
•Invested or committed approximately $160 million in new growth investments with CEG, including the commitments to acquire the Cedar Creek wind project, Texas Solar Nova 1 and 2 solar projects and the Daggett 2 solar project
•Acquired a membership interest in Rosie Central BESS and amended the financing agreement for the Rosamond Central solar project to facilitate and fund the construction of a BESS project that is co-located at the Rosamond Central solar facility
•Entered into an agreement with Clearway Renew to repower the Cedro Hill wind project for an expected investment of $36 million in net corporate capital and entered into a $254 million non-recourse debt facility related to the repowering
•Acquired 100% of the Class A membership interests in DGPV Fund 4 LLC and Alta X-XI TE HoldCo, LLC for an aggregate $13 million
•Signed a 400 MW resource adequacy contract for sixteen months at Marsh Landing and a 274 MW resource adequacy contract for seventeen months at El Segundo, resulting in both assets having at least 50% of capacity contracted in 2027
Such results were taken into account by the Compensation Committee in making determinations with respect to the compensation for our NEOs under the 2023 compensation program.
Executive Compensation Program
2023 Named Executive Officers
This CD&A describes the material components of our compensation program for our NEOs in 2023. For the year ending December 31, 2023, our NEOs included the following individuals:
| | | | | | | | |
| NEO | | 2023 Title |
| Christopher S. Sotos | | President and Chief Executive Officer |
| Sarah Rubenstein | | Executive Vice President and Chief Financial Officer(1) |
| Kevin P. Malcarney | | Executive Vice President, General Counsel and Corporate Secretary |
(1) Ms. Rubenstein was appointed as Executive Vice President and Chief Financial Officer in April 2023 and previously served as Senior Vice President and Chief Accounting Officer of the Company.
Goals and Objectives of the Program
The Compensation Committee is responsible for the development and implementation of the Company’s executive compensation program, subject to Board approval for equity awards to certain officers, and references to Compensation Committee actions described below should be read in a manner that contemplates the requisite Board approval, as applicable, is in effect (see “Board Committees—Compensation Committee” above). The intent of the program is to reward the achievement of the Company’s annual goals and objectives while supporting the Company’s long-term business strategy. The Compensation Committee is committed to aligning executives’ compensation with performance. Our Compensation Committee has designed an executive compensation program that is intended to:
•closely align our executive compensation with stockholder value creation, avoiding plans that encourage executives to take excessive risk, while driving long-term value to stockholders;
•support the Company’s long-term business strategy, while rewarding our executive team for their individual accomplishments with tailored individual executive compensation metrics and incentives; and
•provide a competitive compensation opportunity while aligning with market standards for compensation.
The Compensation Committee’s objectives are achieved through the use of both short-term and long-term incentives. The Company currently targets total direct compensation at the median of our Compensation Peer Group (defined below), as described below under “Elements of Compensation.”
The Compensation Process
Compensation Consultant
Pursuant to its charter, the Compensation Committee is authorized to engage, at the expense of the Company, a compensation consultant to provide independent advice, support and expertise to assist the Compensation Committee in overseeing and reviewing our overall executive compensation strategy, structure, policies and programs, and to assess whether our compensation structure establishes appropriate incentives for management and other key employees. Pay Governance has been omittedthe Compensation Committee’s independent compensation consultant since August 2020, and Pay Governance has continued to serve in that capacity to the present date. Pay Governance worked with the Compensation Committee to formulate the design of the executive and director compensation programs for 2023. As part of its work with the Compensation Committee, Pay Governance provided reports to the Compensation Committee containing research, market data, survey information and information regarding trends and developments in executive and director compensation, and Pay Governance reported directly to the Compensation Committee. Neither Pay Governance, nor any of their affiliates provided any other services for us or any of our affiliates in 2023. In accordance with SEC rules and requirements, the Company has affirmatively determined that no conflicts of interest exist between the Company and Pay Governance (or any individuals working on the Company’s account on behalf of Pay Governance).
Compensation Peer Group Analysis
The Compensation Committee, with support from its independent compensation consultant, identifies the most appropriate comparator group within relevant industries for purposes of benchmarking compensation. The Compensation Committee aims to compare our compensation program to a consistent peer group year-to‑year but given the dynamic nature of our industry and the companies that constitute it, the Compensation Committee annually examines the peer group for appropriateness in terms of size, complexity, and industry. In connection with this reportannual review, the Compensation Committee reviewed the peer group identified for 2022 and adjusted it to remove Covanta Holding Corporation due to its acquisition and delisting, but otherwise maintained the same peer group for compensation benchmarking purposes in 2023 (the “Compensation Peer Group”).
For these purposes, the Compensation Peer Group, comprised of similarly sized publicly owned energy and utility companies, is identified below:
| | | | | | | | | | | | | | | | | | | | |
| Company | | Ticker | | Company | | Ticker |
| Algonquin Power & Utilities Corp. | | NYSE: AQN | | MGE Energy, Inc. | | NASDAQ: MGEE |
| Alliant Energy Corporation | | NASDAQ: LNT | | Northland Power Inc. | | TSX: NPI |
| Atmos Energy Corporation | | NYSE: ATO | | NorthWestern Corporation | | NYSE: NWE |
| Avista Corporation | | NYSE: AVA | | Ormat Technologies, Inc. | | NYSE: ORA |
| Black Hills Corporation | | NYSE: BKH | | Portland General Electric Company | | NYSE: POR |
| Equitrans Midstream Corporation | | NYSE: ETRN | | South Jersey Industries, Inc. | | NYSE: SJI(1) |
| Genesis Energy, L.P. | | NYSE: GEL | | TransAltaCorporation | | NYSE: TAC |
| Innergex Renewable Energy Inc. | | TSX: INE | | | | |
(1) South Jersey Industries, Inc. was acquired by the Infrastructure Investments Fund in February 2023 and was delisted, but was included by Pay Governance as part of its 2023 compensation benchmarking analysis, and for that reason, South Jersey Industries, Inc. is included in the Compensation Peer Group for 2023 but will not be part of the Compensation Peer Group for 2024 or going forward.
For the purposes of determining appropriate NEO pay levels for 2023, the Compensation Committee reviewed NEO compensation from peers, where available and appropriate (e.g., based on an NEO’s position and duties). To supplement this analysis, the Compensation Committee reviewed relevant third-party survey data and considered the recommendations of the CEO on NEO and employee compensation matters not involving the CEO. The Compensation Committee may accept or adjust such CEO recommendations at its discretion. The NEOs did not participate in Compensation Committee discussions regarding their own compensation.
Elements of Compensation
Our compensation program for our NEOs consists of fixed compensation (base salary), performance-based compensation (AIP bonus and RPSUs) and time-based compensation (RSUs). We use the median percentile of our Compensation Peer Group as a guidepost in establishing the targeted levels of total direct compensation (cash and equity) for our NEOs. We expect that, over time, targeted total direct compensation for our NEOs will continue to approximate the median of our Compensation Peer Group. Realized pay in a given year depends on the achievement of defined performance-based compensation metrics. While a portion of our NEOs’ compensation is fixed, a significant percentage is at-risk and payable and/or realizable only if certain performance objectives are met.
Base Salary
Base salary compensates NEOs for their level of experience and position responsibilities and for the continued expectation of superior performance. Recommendations on increases to base salary take into account, among other factors, the NEO’s individual performance, the general contributions of the NEO to overall corporate performance, the level of responsibility of the NEO with respect to his or her specific position, and the NEO’s current base salary level compared to the market median. In lieu of an increase to Mr. Sotos’ base salary, the Board increased Mr. Sotos’ target LTIP award to recognize his performance, better align his total direct compensation with the market median, and cause a higher percentage of Mr. Sotos’ compensation to be performance-based. Each of Ms. Rubenstein and Mr. Malcarney received a base salary increase in 2023 based on such executive’s performance and peer group benchmarking. Ms. Rubenstein received a subsequent base salary increase in 2023 in connection with her appointment as Executive Vice President and Chief Financial Officer. The base salary for each NEO for fiscal year 2023 as of December 31, 2023 is set forth below:
| | | | | | | | | | | | | | |
| Named Executive Officer | | 2023 Annualized Base Salary ($)(1) | | Percentage Increase Over 2022 (%)(2) |
| Christopher S. Sotos | | 665,201 | | | 0% |
Sarah Rubenstein(3) | | 385,000 | | | 18% |
| Kevin P. Malcarney | | 412,000 | | | 3% |
(1) Actual 2023 base salary earnings are presented in the Summary Compensation Table.
(2) As compared to the December 31, 2022 annualized base salary.
(3) Ms. Rubenstein’s base salary was increased from $325,000 to $340,000 in February 2023 to recognize her performance and to better align her total direct compensation with the market median. Ms. Rubenstein’s base salary was subsequently increased from $340,000 to $385,000 in April 2023 in connection with her appointment as Executive Vice President and Chief Financial Officer. Ms. Rubenstein previously served as Senior Vice President and Chief Accounting Officer of the Company.
Annual Incentive Compensation
Overview
Annual incentive compensation awards (AIP bonuses) are made under our AIP. AIP bonuses represent short-term compensation designed to compensate NEOs for meeting annual Company goals and for their individual performance over the course of the year. The Compensation Committee establishes these annual Company goals after reviewing the Company’s business strategy and other matters. As further discussed below, the annual goals for 2023 relate to: (a) CAFD and (b) key performance milestones. In addition, the overall bonus payout is negatively adjusted for any OSHA recordable injuries that occur during the year, and each NEO’s individual performance may (negatively or positively) affect the bonus amount that he or she ultimately receives under our AIP. However, notwithstanding individual performance or the extent to which the Company goals are achieved, the Compensation Committee retains sole discretion under the AIP to reduce the amount of or eliminate any AIP bonuses that are otherwise payable under the AIP.
AIP bonus opportunities are expressed in terms of threshold, target and maximum bonus opportunities. Different percentages of each NEO’s annual base salary relate to these threshold, target and maximum AIP bonus opportunities. However, in the event threshold performance for 2023 was not achieved with respect to one of the AIP performance metrics, no AIP bonuses would have been payable for that component for 2023.
The AIP provides NEOs (other than Mr. Sotos whose severance is governed by his amended and restated employment agreement) eligibility for a pro-rated target bonus payment for the year of a qualifying severance termination, based on the portion of the performance period that the NEO was employed.
2023 AIP Bonus Performance Criteria
The 2023 AIP bonus performance criteria applicable to all NEOs are based upon the two Company goals described above and adjusted, as discussed, based on OSHA recordable injuries and individual performance, as applicable. The table below sets forth the 2023 AIP performance criteria and weightings applicable to all NEOs, assuming the achievement of each goal at target.
| | | | | |
| Goal | Weight |
CAFD(1) | 40% |
| Key Performance Milestones | 60% |
| |
| Overall Funding | 100% |
| OSHA Recordables (per recordable injury) | -5% |
| Individual Performance | +/- 20% |
(1) A non-GAAP measure, CAFD is defined as adjusted earnings before interest, taxes, depreciation and amortization (Adjusted EBITDA) plus cash distributions/return of investment from unconsolidated affiliates, and subsequent release post-bankruptcy, cash receipts from notes receivable, cash distributions from noncontrolling interests, adjustments to reflect sales-type lease cash payments, less cash distributions to noncontrolling interests, maintenance capital expenditures, pro-rata Adjusted EBITDA from unconsolidated affiliates, cash interest paid, income taxes paid, principal amortization of indebtedness, changes in prepaid and accrued capacity payments, and adjusted for development expenses.
•CAFD. The Compensation Committee set the 2023 threshold, target and maximum CAFD performance metric at $360 million, $410 million and $460 million, respectively. For 2023, the CAFD goals and the achieved level are set forth in the chart below. Due to lower-than-expected merchant energy margin caused by milder than normal temperatures during the first half of 2023, the Company did not achieve threshold CAFD performance.
| | | | | | | | | | | |
CAFD Threshold | CAFD Target | CAFD Maximum | CAFD Actual |
| $360 million | $410 million | $460 million | $342 million |
•Key Performance Milestones. “Key performance milestones” performance metrics are established as a defined annual incentive category. The Compensation Committee establishes threshold, target and maximum levels of performance for this category based on the number of milestones achieved. For 2023, a total of five milestones were established relating to adherence to budget, CAFD per share goals, restructuring of Lighthouse Renewable Holdco LLC and Lighthouse Renewable Holdco 2 LLC, ratio of administrative costs to CAFD and natural gas strategic plan and execution. For 2023, threshold performance required the achievement of two out of the five milestones, target performance required the achievement of three out of the five milestones, and maximum performance required the achievement of all five milestones. Ultimately, target performance was attained with the achievement of three out of the five milestones in 2023.
•Individual Performance. As indicated above, an NEO’s individual performance may (negatively or positively) affect his or her AIP bonus by up to 20% of such NEO’s target award, although no AIP bonus payments can exceed 200% of the target award. Such individual performance is determined on a subjective basis based on the Compensation Committee’s assessment of the NEO’s contributions in supporting adherence to budget, support towards the achievement of key milestones, and other contributions towards the successful execution of the Company’s business strategy. The Compensation Committee recommended, and the full Board approved, that an individual performance modifier of +20% be applied to the AIP bonus target award for each NEO’s individual performance, including the completion of several key initiatives that position the Company for future long-term success, as described more fully above under “Business Strategy and Company Performance”, despite a challenging environment attributable to a year of low renewable energy resource.
2023 Annual Incentive Bonus Opportunity
The threshold, target and maximum AIP bonus opportunities for NEOs for 2023, expressed as a percentage of base salary, were:
| | | | | | | | | | | | | | | |
| Named Executive Officer | | Threshold (%)(1) | Target (%)(1) | Maximum (%)(1) | Target Amount ($) |
| Christopher S. Sotos | | 50 | 100 | 200 | 665,201 |
Sarah Rubenstein(2) | | 32.5 | 65 | 130 | 250,250 |
| Kevin P. Malcarney | | 32.5 | 65 | 130 | 267,800 |
(1) This assumes that the CAFD performance metric and all other quantitative and qualitative goals, including the key milestones, are achieved at threshold, target and maximum levels, as applicable.
(2) Ms. Rubenstein’s threshold, target and maximum AIP award opportunities were increased in February 2023 to recognize her performance and to better align her total direct compensation with the market median. Ms. Rubenstein’s threshold, target and maximum AIP award opportunities were subsequently increased in April 2023 in connection with her appointment as Executive Vice President and Chief Financial Officer. Ms. Rubenstein previously served as Senior Vice President and Chief Accounting Officer of the Company.
2023 Annual Incentive Bonuses
As noted above, with respect to AIP bonuses for 2023, the CAFD target was $410 million and the key performance milestone target was achievement of three out of five key performance milestones.
For 2023, CAFD achievement was below threshold at approximately $342 million, three out of five key performance milestones were achieved, and there were no OSHA recordable injuries. Due to the achievement specified above, after taking into account the application of the individual performance modifier, 2023 AIP bonuses were paid at levels between threshold and target. If performance falls between threshold and target or target and maximum, the bonus opportunity will be determined on an interpolated basis. As a result, the CAFD metric and the key performance milestone metrics were respectively weighted at 0% and 100% of target.
The annual incentive bonuses paid to NEOs for 2023 were:
| | | | | | | | | | | | | | | | | | | | | | | | | | |
| Named Executive Officer | | Percentage of Annual Base Salary Achieved (%) | | Individual Performance Modifier (+/- 20%) | | Percentage of Target Achieved (%) | | Annual Incentive Payment ($) |
| Christopher S. Sotos | | 80 | | 20 | | 80 | | 532,161 | |
Sarah Rubenstein(1) | | 52 | | 20 | | 80 | | 200,200 | |
| Kevin P. Malcarney | | 52 | | 20 | | 80 | | 214,240 | |
(1) Ms. Rubenstein was appointed as Executive Vice President and Chief Financial Officer in April 2023. Ms. Rubenstein previously served as Senior Vice President and Chief Accounting Officer of the Company.
Long‑Term Incentive Compensation
We believe that equity awards directly align our NEOs’ interests with those of our stockholders. In 2023, the Compensation Committee granted our NEOs a combination of performance-based equity awards directly linked to long-term stockholder value creation and time-based equity awards which also represent a critical component of our long-term incentive compensation due to the retention aspects of the awards. To enhance our compensation program’s focus on Company performance, the majority of these long-term incentive awards (67%) were performance-based (i.e., granted as RPSUs). The remainder of our long-term incentive awards (33%) were time-based (i.e., granted as RSUs which vest over three years). We believe that our AIP appropriately focuses our NEOs on shorter-term (one-year) financial metrics while our LTIP emphasizes long-term stockholder value creation (i.e., three-year TSR outperformance). For 2023, Mr. Sotos’ target LTIP award was 350% of his base salary and Ms. Rubenstein and Mr. Malcarney’s target LTIP awards were 125% of their respective base salaries. Mr. Sotos’ target LTIP award increased from 315% in 2022 to 350% in 2023 to recognize his performance and better align his total direct compensation with the market median. Ms. Rubenstein and Mr. Malcarney’s target LTIP awards remained unchanged from 2022. The above mix of long-term incentive compensation applied to all NEOs for 2023.
Relative Performance Stock Units
Each RPSU represents the potential to receive one share of Class C common stock, as adjusted, based on the Company’s TSR performance ranked against the TSR performance of a comparator group of similar companies (the “Performance Peer Group”) after the completion of a three-year performance period. Relative measures are designed to normalize for externalities, ensuring the program appropriately reflects management’s impact on the Company’s TSR by including peer companies that the Compensation Committee believes are similarly impacted by market conditions.
The payout of shares of Class C common stock at the end of the three-year performance period is based on the Company’s TSR performance percentile rank compared with the TSR performance of the Performance Peer Group. To ensure a rigorous program design, the target-level payout (100% of shares granted) generally requires the Company to perform at the 50th percentile. However, to induce management to achieve greater than target level (i.e., 50th percentile) performance in a down market, in the event that the Company’s TSR performance declines by more than 20% over the performance period, the target level payout (100% of shares granted) will require achievement of 60th percentile performance. The Compensation Committee believes that this increased performance requirement addresses the concern that a disproportionate award may be paid in the event that our relative performance is high, but absolute performance is low.
In the event relative performance is below the 25th percentile, the award is forfeited. In the event relative performance is between the 25th percentile and the 50th percentile (or the 60th percentile if our TSR performance declines by more than 20% over the performance period), payouts will be based on an interpolated calculation. In the event relative performance reaches the 50th percentile (or the 60th percentile as described above), 100% of the award will be paid. In the event relative performance is between the 50th percentile (or the 60th percentile as described above) and the 75th percentile, payouts will be based on an interpolated calculation. In the event that relative performance is at or above the 75th percentile, a maximum payout of 150% of the target will be paid with respect to RPSU awards granted in 2023. Based on the Company’s TSR performance ranked against the TSR performance of the Performance Peer Group over the three-year performance period ending on December 31, 2023, the RPSUs granted in 2021 will vest on April 15, 2024 at 58% of target.
The table below illustrates the design of our RPSUs in 2023.
| | | | | | | | | | | | | | | | | | | | | | | | | | |
| Performance Targets | | Performance Requirement | | Payout Opportunity | |
| Maximum | | 75th percentile or above | | 150% | |
| Target | | Standard Target: 50th percentile | | Modified Target: 60th percentile (less than −20% absolute TSR) | | 100% | |
| Threshold | | 25th percentile | | 25% | |
| Below Threshold | | Below 25th percentile | | 0% | |
Restricted Stock Units
Each RSU represents the right to receive one share of our Class C common stock after the completion of the vesting period. The RSUs granted to the NEOs in 2023 vest ratably, meaning that one‑third of the award vests each year on the anniversary of the grant date, over a three‑year period.
Dividend Equivalent Rights (DERs)
In connection with awards of both RPSUs and RSUs, each NEO also receives DERs, which accrue with respect to the award to which they relate. Accrued DERs are credited as additional shares that will be subject to the vesting and payment terms of the corresponding award of the RPSUs or RSUs, as applicable. Accordingly, accrued DERs are paid at the same time the shares of Class C common stock underlying each award are delivered to the NEO, and accrued DERs are forfeited if, or to the extent that, the underlying award is forfeited.
Clawbacks
In 2023, the Compensation Committee adopted a “clawback” policy that is intended to comply with the requirements under the federal securities laws, including the Dodd-Frank Wall Street Reform and Consumer Protection Act of 2010. The policy requires the Company to seek recoupment of any cash or equity-based incentive compensation payment or award made or granted to any current or former executive officer of the Company during the three completed fiscal years immediately preceding the date on which the Company is required to prepare a restatement of its financial statements due to material noncompliance of the Company with any financial reporting requirement under the federal securities laws or similar revision of performance indicators on which cash or equity-based incentive compensation was based, if: (i) the payment or award was made or granted based wholly or in part upon the attainment of a Company financial reporting measure (including, without limitation, (a) any measure that is determined and presented in accordance with the accounting principles used in preparing the Company’s financial statements, (b) any measure that is derived wholly or in part from such measure and/or (c) any measure of stock price or total stockholder return); and (ii) a lower payment or award would have been made or granted to the executive officer based upon the restated financial results had there not been a restatement. In each such instance, the amount required to be returned, repaid, or forfeited will be the amount by which the executive officer’s payment or award for the relevant period exceeded the lower payment or award that would have been made or granted based on the restated results.In addition to the above “Dodd-Frank” clawback policy, the Company has long maintained a separate clawback policy that the Compensation Committee may apply with regard to awards made under the AIP and LTIP in the case of a material financial restatement, including a restatement resulting from employee misconduct, or in the case of fraud, embezzlement or other serious misconduct that is materially detrimental to the Company. The Compensation Committee retains discretion regarding application of this separate policy. Each of the above policies is incremental to other remedies that are available to the Company. In addition to the above policies, if the Company is required to restate its earnings as a result of noncompliance with a financial reporting requirement due to misconduct, under the Sarbanes‑Oxley Act of 2002 (“SOX”), the CEO and the CFO would also be subject to a “clawback,” as required by SOX.
Benefits
All of our NEOs are eligible to participate in the same retirement, life insurance, health and welfare plans as other employees. To generally support more complicated financial planning and estate planning matters, NEOs are eligible for reimbursement of annual tax return preparation, tax advice, financial planning and estate planning expenses. Mr. Sotos is eligible for a maximum reimbursement of $12,000 per year and the remaining NEOs are eligible for a maximum reimbursement of $3,000 per year.
Potential Severance and Change‑In‑Control Benefits
Each NEO’s RPSU and RSU award agreements under the LTIP provide for certain treatment in the event of such NEO’s termination of employment under certain circumstances, including in connection with a change-in-control. Additionally, Mr. Sotos, pursuant to his amended and restated employment agreement (as described below), and the remaining NEOs, pursuant to the reduced disclosure formatCompany’s Executive Change-in-Control and General Severance Plan (the “CIC Plan”) as well as pursuant to the Compensation Committee’s discretion under the AIP, are entitled to additional severance payments and benefits in the event of termination of employment under certain circumstances, including following a change-in-control.
We believe change-in-control arrangements are considered a market practice among many publicly held companies. Most often, these arrangements are utilized to encourage executives to remain with the company during periods of extreme job uncertainty and to ensure that any potential transaction is thoroughly and objectively evaluated. In order to enable a smooth transition during an interim period, change-in-control arrangements provide a defined level of security for the executive and the company, enabling a more seamless implementation of a particular merger, acquisition or asset sale or purchase, and subsequent integration. In addition, such agreements include restrictive covenants, such as non-compete, non-solicitation and confidentiality provisions that protect the interests of the Company.
For a more detailed discussion, including the quantification of potential payments, please see the section entitled “Severance and Change-in-Control” following the executive compensation tables below.
Other Matters
Stock Ownership Guidelines
The Compensation Committee and the Board require the CEO to hold Company stock with a value equal to 5.0 times his base salary until his separation from the Company. Executive Vice Presidents are required to hold Company stock with a value equal to 3.0 times their base salary until their separation from the Company.Senior Vice Presidents are required to hold Company stock with a value equal to 2.0 times their base salary until their separation from the Company. Personal holdings, vested awards and unvested RSUs count towards the ownership multiple. Although NEOs are not required to make purchases of our common stock to meet their target ownership multiple, NEOs are restricted from divesting any securities until such ownership multiples are attained, except in the event of hardship or to make a required tax payment, and they must maintain their ownership multiple after any such transactions. Once met, they must maintain their ownership multiple during their service. The current target stock ownership for NEOs as of January 31, 2024 is shown below. Mr. Sotos and Mr. Malcarney each met or exceeded his stock ownership guidelines as of January 31, 2024. Ms. Rubenstein’s stock ownership guideline was increased from a 2.0 to 3.0 multiple in connection with her appointment as Executive Vice President and Chief Financial Officer in April 2023. Therefore, Ms. Rubenstein did not meet this increased stock ownership guideline as of January 31, 2024, and the above divestiture restrictions and related exceptions will apply to Ms. Rubenstein during periods in which, and to the extent that, the above guidelines are not met.
| | | | | | | | | | | | | | | |
| Named Executive Officer | | Target Ownership Multiple | | | Actual Ownership Multiple |
| Christopher S. Sotos | | 5.0x | | | 21.5x |
Sarah Rubenstein(1) | | 3.0x | | | 2.4x |
| Kevin P. Malcarney | | 3.0x | | | 6.6x |
| | | | | |
(1) Ms. Rubenstein was appointed as Executive Vice President and Chief Financial Officer in April 2023. Ms. Rubenstein previously served as Senior Vice President and Chief Accounting Officer of the Company.
Tax and Accounting Considerations
Section 162(m) of the Internal Revenue Code (the “Code”) precludes Clearway, Inc., as a public company, from taking a tax deduction for individual compensation to certain of our executive officers in excess of $1 million, subject to certain exemptions. Prior to 2018, the exemptions included an exclusion of performance-based compensation within the meaning of Section 162(m) of the Code (“Section 162(m)”). The Tax Cuts and Jobs Act, enacted in December 2017, however, amended Section 162(m) and eliminated the exclusion of performance-based compensation from the $1 million limit, subject to certain exemptions. The Compensation Committee believes tax deductibility of compensation is an important consideration and continues to consider the implications of legislative changes to Section 162(m). However, the Compensation Committee also believes that it is important to retain flexibility in designing compensation programs, and as a result, has not adopted a policy that any particular amount of compensation must be deductible to the Company under Section 162(m).
The Compensation Committee also takes into account tax consequences to NEOs in designing the various elements of our compensation program, such as designing the terms of awards to defer immediate income recognition under Section 409A of the Code. The Compensation Committee remains informed of, and takes into account, the accounting implications of its compensation programs. However, the Compensation Committee approves programs based on their total alignment with our strategy and long‑term goals.
Compensation Tables
Summary Compensation Table
Fiscal Year Ended December 31, 2023
| | | | | | | | | | | | | | | | | | | | | | | | | | | | | | | | | | | | | | | | | | | | | | | | | | | | | | | | |
| Name and Principal Position | | Year | | Salary ($)(1) | | Bonus ($) | | Stock Awards ($)(2) | | Option Awards ($) | | Non‑Equity Incentive Plan Compensation ($)(3) | | Change in Pension Value and Nonqualified Deferred Compensation Earnings ($) | | All Other Compensation ($)(4) | | Total ($) |
| Christopher S. Sotos | | 2023 | | 665,201 | | | — | | | 2,244,752 | | | — | | | 532,161 | | | — | | | 16,885 | | | 3,458,999 | |
| President and Chief | | 2022 | | 659,682 | | | — | | | 1,951,273 | | | — | | | 725,069 | | | — | | | 12,200 | | | 3,348,224 | |
| Executive Officer | | 2021 | | 638,260 | | | — | | | 1,535,147 | | | — | | | 899,312 | | | — | | | 19,790 | | | 3,092,509 | |
| | | | | | | | | | | | | | | | | | |
| Sarah Rubenstein | | 2023 | | 369,365 | | | — | | | 464,062 | | | — | | | 200,200 | | | — | | | 13,200 | | | 1,046,827 | |
| Senior Vice President and | | 2022 | | 324,197 | | | — | | | 378,417 | | | — | | | 177,125 | | | — | | | 12,200 | | | 891,939 | |
| Chief Accounting Officer | | 2021 | | — | | | — | | | — | | | — | | | — | | | — | | | — | | | — | |
| | | | | | | | | | | | | | | | | | |
| Kevin P. Malcarney | | 2023 | | 410,154 | | | — | | | 496,605 | | | — | | | 214,240 | | | — | | | 16,200 | | | 1,137,199 | |
| Senior Vice President, | | 2022 | | 398,461 | | | — | | | 465,703 | | | — | | | 283,400 | | | — | | | 12,850 | | | 1,160,414 | |
| General Counsel and | | 2021 | | 323,991 | | | — | | | 348,772 | | | — | | | 274,368 | | | — | | | 12,550 | | | 959,681 | |
| Corporate Secretary | | | | | | | | | | | | | | | | | | |
| | | | | | | | | | | | | | | | | | |
| | | | | | | | | | | | | | | | | | |
| | | | | | | | | | | | | | | | | | |
| | | | | | | | | | | | | | | | | | |
| | | | | | | | | | | | | | | | | | |
| | | | | | | | | | | | | | | | | | |
(1) Reflects base salary earnings.
(2) Reflects the grant date fair value determined in accordance with the Financial Accounting Standards Board Accounting Standards Codification Topic 718, Comparison — Stock Compensation. Clearway, Inc. uses the Company’s Class C common stock price on the date of grant as the fair value of the Company’s RSUs. The fair value of RPSUs is estimated on the date of grant using a Monte Carlo simulation model. The number of RPSUs granted is based on the 10-day average closing price of Clearway, Inc.’s Class C common stock ending on the date of grant, which is intended to more closely reflect the compensation practices of the Compensation Peer Group companies. For RPSUs granted in 2023, if the maximum level of performance is achieved, the fair value will be approximately $2,214,738for Mr. Sotos, $457,868 for Ms. Rubenstein and $489,941 for Mr. Malcarney.
(3) The amounts shown in this column represent the annual incentive bonuses paid to the NEOs. Further information regarding the annual incentive bonuses is included in the ‘‘2023 Annual Incentive Bonuses’’ section of this CD&A.
(4) The amounts provided in the All Other Compensation column represent the additional benefits payable by the Company and include insurance benefits; the employer match under the Company’s 401(k) plan; financial counseling services up to $12,000 per year for Mr. Sotos and up to $3,000 per year for all other NEOs, not including the financial advisor’s travel or out-of-pocket expenses; legal fees incurred by Mr. Sotos in 2021 in connection with reviewing and finalizing his amended and restated employment agreement; and when applicable, the Company’s discretionary contribution to the 401(k) plan. The following table identifies the additional compensation for each NEO.
| | | | | | | | | | | | | | | | | | | | | | | | | | | | | | | | | | | | | | | | |
| Name | | Year | | Financial Advisor Services ($) | | 401(k) Employer Matching Contribution ($) | | | | Legal Fees ($) | | PTO Supplemental Payout ($) | | Total ($) |
| Christopher S. Sotos | | 2023 | | 3,685 | | | 13,200 | | | | | — | | | — | | | 16,885 | |
| | 2022 | | — | | | 12,200 | | | | | — | | | — | | | 12,200 | |
| | 2021 | | — | | | 11,600 | | | | | 8,190 | | | — | | | 19,790 | |
| Sarah Rubenstein | | 2023 | | — | | | 13,200 | | | | | — | | | — | | | 13,200 | |
| | 2022 | | — | | | 12,200 | | | | | — | | | — | | | 12,200 | |
| | 2021 | | — | | | — | | | | | — | | | — | | | — | |
| Kevin P. Malcarney | | 2023 | | 3,000 | | | 13,200 | | | | | — | | | — | | | 16,200 | |
| | 2022 | | 650 | | | 12,200 | | | | | — | | | — | | | 12,850 | |
| | 2021 | | 950 | | | 11,600 | | | | | — | | | — | | | 12,550 | |
| | | | | | | | | | | | | | |
Grants of Plan‑Based Awards
Fiscal Year Ended December 31, 2023
| | | | | | | | | | | | | | | | | | | | | | | | | | | | | | | | | | | | | | | | | | | | | | | | | | | | | | | | | | | | | |
| | | | | | | | Estimated Possible Payouts Under Non‑Equity Incentive Plan Awards | | Estimated Future Payouts Under Equity Incentive Plan Awards | | All Other Stock Awards: Number of Shares of Stock | | Grant Date Fair Value of Stock and Option | | | | | |
| Name | | Award Type | | Grant Date | | Approval Date | | Threshold ($)(1) | Target ($)(2) | Maximum ($)(3) | | Threshold (#) | Target (#) | Maximum (#) | | or Units (#) | | Awards ($)(4) | | | | | |
| Christopher S. Sotos | | AIP | | — | | | — | | | 332,601 | | 665,201 | | 1,330,402 | | | — | | — | | — | | | — | | | — | | | | | | |
| | RPSU | | 4/15/2023 | | 2/17/2023 | | — | | — | | — | | | 12,395 | | 49,580 | | 74,370 | | | — | | | 1,476,492 | | | | | | |
| | RSU | | 4/15/2023 | | 2/17/2023 | | — | | — | | — | | | — | | — | | — | | | 24,366 | | | 768,260 | | | | | | |
| Sarah Rubenstein | | AIP | | — | | | — | | | 125,125 | | 250,250 | | 500,500 | | | — | | — | | — | | | — | | | — | | | | | | |
| | RPSU | | 4/15/2023 | | 4/12/2023 | | — | | — | | — | | | 2,563 | | 10,250 | | 15,375 | | | — | | | 305,245 | | | | | | |
| | RSU | | 4/15/2023 | | 4/12/2023 | | — | | — | | — | | | — | | — | | — | | | 5,037 | | | 158,817 | | | | | | |
| Kevin P. Malcarney | | AIP | | — | | | — | | | 133,900 | | 267,800 | | 535,600 | | | — | | — | | — | | | — | | | — | | | | | | |
| | RPSU | | 4/15/2023 | | 2/17/2023 | | — | | — | | — | | | 2,742 | | 10,968 | | 16,452 | | | — | | | 326,627 | | | | | | |
| | RSU | | 4/15/2023 | | 2/17/2023 | | — | | — | | — | | | — | | — | | — | | | 5,391 | | | 169,978 | | | | | | |
(1) Threshold non-equity incentive plan awards include annual incentive plan threshold payments, as presented in the CD&A.
(2) Target non-equity incentive plan awards include annual incentive plan target payments, as presented in the CD&A.
(3) Maximum non-equity incentive plan awards include annual incentive plan maximum payments, as presented in the CD&A.
(4) Reflects the grant date fair value determined in accordance with the Financial Accounting Standards Board Accounting Standards Codification Topic 718, Comparison—Stock Compensation. The Company uses the Class C common stock price on the date of grant as the fair value of the Company’s RSUs. The fair value of RPSUs is estimated on the date of grant using a Monte Carlo simulation model. The number of RPSUs granted is based on the 10-day average closing price of the Company’s Class C common stock ending on the date of grant.
Outstanding Equity Awards at Fiscal Year End
Fiscal Year Ended December 31, 2023
| | | | | | | | | | | | | | | | | | | | | | | | | | | | | | | | | | | | | | | | | | | | | | | | | | |
| | Option Awards | | Stock Awards |
| | Number of | | Number of | | | | | | Number | | Market Value | | Equity Incentive Plan Awards |
| Name | | Securities Underlying Unexercised Options (#) Exercisable | | Securities Underlying Unexercised Options (#) Unexercisable | | Option Exercise Price ($) | | Option Expiration Date | | of Shares or Units of Stock that Have Not Vested (#) | | of Shares or Units of Stock that Have Not Vested ($) | | Number of Unearned Shares that Have Not Vested (#)(1) | | Market Value of Unearned Shares that Have Not Vested ($)(1) |
| Christopher S. Sotos | | — | | | — | | | — | | | — | | | 47,847 (2) | | 1,312,443 | | 142,034 (3) | | 3,895,993 |
| Sarah Rubenstein | | — | | | — | | | — | | | — | | | 10,924 (4) | | 299,645 | | 19,090 (5) | | 523,639 |
| Kevin P. Malcarney | | — | | | — | | | — | | | — | | | 10,730 (6) | | 294,324 | | 32,454 (7) | | 890,213 |
| | | | | | | | | | | | | | | | |
(1) Assumes achievement at target award level for 2021, 2022 and 2023 RPSU awards as discussed in the CD&A.
(2) This amount represents 21,595 RSUs and 1,907 DERs that will vest on April 15, 2024, 14,859 RSUs and 978 DERs that will vest on April 15, 2025, and 8,139 RSUs and 369 DERs that will vest on April 15, 2026.
(3) This amount represents 41,319 RPSUs and 5,694 DERs that will vest on April 15, 2024, 39,607 RPSUs and 3,586 DERs that will vest on April 15, 2025, and 49,580 RPSUs and 2,248 DERs that will vest on April 15, 2026.
(4) This amount represents 5,452 RSUs and 534 DERs that will vest on April 15, 2024, 2,985 RSUs and 194 DERs that will vest on April 15, 2025, and 1,683 RSUs and 76 DERs that will vest on April 15, 2026.
(5) This amount represents 7,681 RPSUs and 695 DERs that will vest on April 15, 2025, 10,250 RPSUs and 464 DERs that will vest on April 15, 2026.
(6) This amount represents 4,793 RSUs and 424 DERs that will vest on April 15, 2024, 3,405 RSUs and 226 DERs that will vest on April 15, 2025, and 1,801 RSUs and 81 DERs that will vest on April 15, 2026. Amounts do not include shares withheld for payment of taxes due to retirement eligibility.
(7) This amount represents 9,387 RPSUs and 1,293 DERs that will vest on April 15, 2024, 9,453 RPSUs and 856 DERs that will vest on April 15, 2025, and 10,968 RPSUs and 497 DERs that will vest on April 15, 2026.
Option Exercises and Stock Vested
Fiscal Year Ended December 31, 2023
| | | | | | | | | | | | | | | | | | | | | | | | | | |
| | Option Awards | | Stock Awards |
| Name | | Number of Shares Acquired on Exercise (#) | | Value Realized on Exercise ($) | | Number of Shares Acquired on Vesting (#)(1) | | Value Realized on Vesting ($)(2) |
| Christopher S. Sotos | | — | | | — | | | 121,861(3) | | 3,842,342 | |
| Sarah Rubenstein | | — | | | — | | | 7,531(4) | | 220,360 | |
| Kevin P. Malcarney | | — | | | — | | | 23,830(5) | | 751,455 | |
(1) Includes shares and DERs that vested pursuant to underlying awards and converted to Class C common stock in 2023.
(2) The values are based on the April 14, 2023 Class C common stock closing share price of $31.53 for awards and DERs that vested on April 15, 2023, the November 2, 2023 Class C common stock closing share price of $22.77 for awards and DERs that vested on November 2, 2023. The values for retirement eligible NEOs are based on the Class C common stock closing share price on the dates the awards became eligible for continued vesting and shares and DERs were withheld to cover certain tax withholding obligations.
(3) Represents 9,358 RSUs, 85,188 RPSUs and 12,968 DERs that vested on April 15, 2023 pursuant to the stock compensation awards granted on April 15, 2020. Represents 6,738 RSUs and 596 DERs that vested on April 15, 2023 pursuant to the stock compensation award granted on April 15, 2021. Represents 6,723 RSUs and 290 DERs that vested on April 15, 2023 pursuant to the stock compensation award granted on April 15, 2022.
(4) Represents 1,348 RSUs and 184 DERs that vested on April 15, 2023 pursuant to the stock compensation award granted on April 15, 2020. Represents 1,711 RSUs and 248 DERs that vested on November 2, 2023 pursuant to the stock compensation award granted on November 2, 2020. Represents 2,463 RSUs and 217 DERs that vested on April 15, 2023 pursuant to the stock compensation award granted on April 15, 2021. Represents 1,304 RSUs and 56 DERs that vested on April 15, 2023 pursuant to the stock compensation award granted on April 15, 2022.
(5) Represents 1,784 RSUs, 16,241 RPSUs and 2,471 DERs that vested on April 15, 2023 pursuant to the stock compensation awards granted on April 15, 2020. Represents 1,390 RSUs and 122 DERs that vested on April 15, 2023 pursuant to the stock compensation award granted on April 15, 2021. Represents 1,604 RSUs and 69 DERs that vested on April 15, 2023 pursuant to the stock compensation award granted on April 15, 2022. Represents 143 shares and 6 DERs that were withheld to cover certain tax obligations in 2023 due to awards becoming eligible for continued vesting in the event of the NEO’s retirement.
Employment Agreements
The Company has not entered into employment agreements with any executive officers other than Mr. Sotos.
On September 23, 2021, the Company and Mr. Sotos entered into an agreement amending and restating Mr. Sotos’ employment agreement, dated as of May 6, 2016, as previously amended, pursuant to which Mr. Sotos continues to serve as the Company’s President and CEO for a new term that began on September 23, 2021 (the “Effective Date”). Under this amended and restated employment agreement, the term of Mr. Sotos’ employment will continue until the earlier of the date that his employment is terminated by either party or December 31, 2024; provided that such employment period will automatically renew on the same terms and conditions for additional one-year terms unless either party provides the other party with written notice of its election not to renew the then-current employment period at least 90 days before such period’s expiration date. The amended and restated employment agreement originally entitled Mr. Sotos to an annual base salary of $629,330 for the period beginning on the Effective Date and ending on December 31, 2021. For each annual period thereafter, our Board will determine whether to increase Mr. Sotos’ annual base salary. For the 2022 fiscal year, the Board increased Mr. Sotos’ annual base salary to $665,201 and it remained unchanged for the 2023 fiscal year. The amended and restated employment agreement further provides that Mr. Sotos is eligible to receive an annual bonus at a target amount equal to 100% of base salary (i.e., AIP bonus), with it being understood that such percentage may be increased by the Company from time to time, in each case based on achievement of criteria determined by the Board with input from Mr. Sotos. The maximum award opportunity each year is 200% of the target amount. The amended and restated employment agreement further provides that Mr. Sotos is eligible to participate in the LTIP, on such terms as are set forth in the plan. Mr. Sotos’ target LTIP award for the 2023 fiscal year was approximately 350% of base salary.
In addition to the compensation and benefits described above, as well as paid vacation and director and officer liability insurance, the amended and restated employment agreement provides that Mr. Sotos will receive the following:
•Reimbursement for annual tax return preparation expenses and tax advice and financial planning, up to a maximum of $12,000 per year;
•Eligibility to participate in the Company’s retirement plans, health and welfare plans, and disability insurance plans under the same terms, and to the same extent, as other senior management of the Company; and
•Reimbursement for the costs of litigation or other disputes incurred in asserting any claims under the amended and restated employment agreement, unless the court finds in favor of the Company.
The amended and restated employment agreement also provided Mr. Sotos with a reimbursement for legal fees incurred in connection with reviewing and finalizing his amended and restated employment agreement, up to a maximum of $12,000.
The amended and restated employment agreement further entitles Mr. Sotos to certain severance payments and benefits in the event his employment terminates under certain circumstances. These severance payments and benefits are described and quantified under the section “Severance and Change‑in‑Control” below. In addition, under the amended and restated employment agreement, the Company has agreed to indemnify Mr. Sotos against any claims arising as a result of his position with the Company to the fullest extent permitted by General Instruction Ithe Company’s certificate of incorporation, bylaws or Board resolutions or, if greater, Delaware law.
The amended and restated employment agreement includes non‑competition and non‑solicitation restrictions on Mr. Sotos during the term of his employment and for one year after his termination of employment. The amended and restated employment agreement also includes confidentiality, indemnification obligations and intellectual property restrictions and an obligation for Mr. Sotos to Form 10-K.cooperate with the Company in the event of any internal, administrative, regulatory, or judicial proceeding. The provisions of the amended and restated employment agreement may only be waived with the written consent of the Company and Mr. Sotos.
Severance and Change‑In‑Control Each NEO’s RPSU and RSU award agreements under the LTIP provide for special treatment in the event of such NEO’s termination of employment under certain circumstances. Upon death or disability, an NEO’s RSUs and RPSUs will vest in full and the performance metrics with respect to the RPSUs will be deemed to be achieved at target levels. Upon retirement, an NEO’s RSUs and RPSUs will remain eligible for vesting pursuant to the award agreement as though the NEO was continuously employed by the Company throughout the relevant period; provided that retirement occurs more than 12 months following the applicable award’s grant date. Further, if an NEO’s employment is involuntarily terminated by the Company without “cause” (as defined in Mr. Sotos’ amended and restated employment agreement with respect to Mr. Sotos, and as defined in the LTIP with respect to the other NEOs) during the “Change in Control Period” (as defined below), (i) such NEO’s RSUs will vest in full immediately upon the later of such change in control or such termination of employment and (ii) the Compensation Committee will, pursuant to the terms and conditions of the LTIP and RPSU award agreement(s), determine the final amount payable to the NEO, if any, pursuant to his or her RPSUs. In general, no RPSU or RSU that is granted to an NEO provides for accelerated vesting upon any other involuntary termination. RSUs granted to Ms. Rubenstein prior to her promotion to Senior Vice President and Chief Accounting Officer in 2022 provide pro-rated vesting for certain involuntary terminations of service that occur in connection with certain significant business events.
The “Change in Control Period” is the period commencing six months immediately prior to, and ending 24 months immediately following, a “change in control” of the Company (as “change in control” is defined in Mr. Sotos’ amended and restated employment agreement with respect to Mr. Sotos, and in the LTIP with respect to the other NEOs).
In addition to the above described treatment of the equity awards, Mr. Sotos, pursuant to his amended and restated employment agreement, and the other NEOs, pursuant to the CIC Plan and in some cases, the AIP, are entitled to certain additional severance payments and benefits in the event of termination of employment under certain circumstances, including following a change‑in‑control.
Mr. Sotos’ Benefits
If Mr. Sotos’ employment is involuntarily terminated by the Company without cause (including by reason of the Company’s non-renewal of Mr. Sotos’ employment term under his employment agreement) or if he terminates his employment for good reason, subject to Mr. Sotos executing a release of claims, the Company agrees to provide Mr. Sotos with the following severance benefits:
•A lump sum payment equal to no less than 1.5 times Mr. Sotos’ annual base salary in effect at the time of Mr. Sotos’ termination of employment;
•A lump sum payment equal to the bonus that Mr. Sotos would have earned if his employment had not terminated (i.e., contingent on satisfaction of the performance goals applicable to such bonus) under the then‑current bonus plan, which amount will be pro‑rated based on the number of days during the year that he was employed by the Company and paid at the time annual bonus payments are generally made to the Company’s executive officers;
•Any unpaid bonus amount for the prior fiscal year to the extent not paid prior to the termination date; and
•Reimbursement of the portion of COBRA premiums based on the monthly premium cost that would have been paid by the Company immediately prior to Mr. Sotos’ termination of employment for a period of 18 months after the date of termination, except that such coverage will be discontinued if Mr. Sotos becomes eligible for medical benefits from a subsequent employer or otherwise.
If Mr. Sotos’ employment is involuntarily terminated by the Company without cause (including by reason of the Company’s non-renewal of Mr. Sotos’ employment term under his employment agreement) or if he terminates his employment for good reason within the six months immediately prior to, or the 24 months immediately following, a change in control of the Company (i.e., the Change in Control Period with respect to Mr. Sotos), in lieu of the severance benefits set forth above, the Company will provide Mr. Sotos with the following severance benefits:
•A lump sum payment of no less than three times the sum of (a) Mr. Sotos’ base salary in effect at the time of Mr. Sotos’ termination of employment, or if greater, at such time that is immediately prior to the change in control and (b) Mr. Sotos’ target bonus opportunity under the then-current bonus plan for the year of termination;
•A lump sum payment equal to the target bonus opportunity under the then‑current bonus plan, which amount will be pro‑rated based on the number of days during the year that he was employed by the Company;
•Any unpaid bonus amount for the prior fiscal year to the extent not paid prior to the termination date; and
•Reimbursement of the portion of COBRA premiums based on the monthly premium cost that would have been paid by the Company immediately prior to Mr. Sotos’ termination of employment for a period of 18 months after the date of termination, except that such coverage will be discontinued if Mr. Sotos becomes eligible for medical benefits from a subsequent employer or otherwise.
If Mr. Sotos’ employment is terminated as a result of his death or disability, the Company agrees to pay him an amount equal to the target bonus opportunity for the year of termination, which amount will be pro‑rated based on the number of days during the year that Mr. Sotos was employed by the Company. In addition, the Company will pay Mr. Sotos any unpaid bonus amount for the prior fiscal year to the extent not paid prior to the termination date.
If an excise tax under Section 4999 of the Code would be triggered by any payments under Mr. Sotos’ amended and restated employment agreement or otherwise upon a change‑in‑control, the Company will reduce such payments so that no amounts are subject to Section 4999 of the Code, if such reduction would cause the amount to be retained by Mr. Sotos to be greater than if Mr. Sotos were required to pay such excise tax.
NEO Benefits
Eligible NEOs may receive a discretionary payment of the pro-rated target bonus under the AIP in the event of such NEO’s termination of employment under certain circumstances, including upon his or her termination due to retirement or involuntary termination without cause. Such amount, if payable in the Compensation Committee’s discretion, will be pro-rated based on the number of days during the year that he or she was employed by the Company. In addition, under the CIC Plan, in the event of involuntary termination without cause, eligible NEOs are entitled to a general severance benefit equal to 1.5 times base salary payable in a lump sum amount and reimbursement for COBRA benefits continuation cost for a period of 18 months.
The CIC Plan also provides a change-in-control benefit in the event that, within six months prior to, as well as 24 months following, a change-in-control, an eligible NEO’s employment is either involuntarily terminated by the Company without cause or voluntarily terminated by such NEO for good reason. The change-in-control benefit for Mr. Malcarney consists of an amount equal to 2.99 times the sum of his base salary plus the annual target incentive for the year of termination. In connection with Ms. Rubenstein’s appointment as Executive Vice President and Chief Financial Officer in April 2023, the change-in-control benefit for Ms. Rubenstein was increased to an amount equal to 2.99 times the sum of her base salary plus the annual target incentive for the year of termination (prior to such appointment such amount was equal to 2.0 times the sum of her base salary plus the annual target incentive for the year of termination). All such NEOs are also eligible for an amount equal to their target bonus for the year of termination, pro-rated for the number of days during the performance period that such NEO was employed by the Company and reimbursement for all or a portion of such NEO’s COBRA benefits continuation cost for a period of 18 months, such that the NEO maintains the same coverage level and cost, on an after-tax basis, as in effect immediately prior to his or her termination of employment.
As a condition of receiving severance or change-in-control benefits, an eligible NEO must execute a release of claims and acknowledge the restrictive covenants in the CIC Plan. Such restrictive covenants include non-competition, non-solicitation and non-disparagement covenants applicable for one year after termination, confidentiality and intellectual property obligations. The provisions of the CIC Plan may only be waived by the written consent of the Compensation Committee and the applicable NEO.
If an excise tax under Section 4999 of the Code would be triggered for an eligible NEO by any payments under the CIC Plan or otherwise upon a change-in-control, the Company will reduce such payments so that no amounts are subject to Section 4999 of the Code, if such reduction would cause the amount to be retained by such NEO to be greater than if such NEO were required to pay such excise tax.
Definition of Change-In-Control, Etc.
In general, under Mr. Sotos’ amended and restated employment agreement and the CIC Plan, a “change-in-control” occurs in the event: (a) any person or entity (with certain exceptions), becomes the direct or indirect beneficial owner of 50% or more of the Company’s then-outstanding voting or common stock or obtains the power to, directly or indirectly, vote or cause to be voted 50% or more of the Company’s capital stock entitled to vote in the election of directors, including by contract or through proxy, (b) directors serving on the Board as of a specified date cease to constitute at least a majority of the Board unless such directors are approved by a vote of at least a majority of the incumbent directors; provided that a person whose assumption of office is in connection with an actual or threatened election contest or actual or threatened solicitation of proxies including by reason of agreement intended to avoid or settle such contest shall not be considered to be an incumbent director, (c) any reorganization, merger, consolidation, sale of all or substantially all of the assets of the Company or other transaction is consummated unless the previous stockholders of the Company own more than 50% of the then-outstanding common stock and combined voting power of the company resulting from such change-in-control transaction, or (d) the stockholders approve a plan or proposal to liquidate or dissolve the Company.
An involuntary termination without “cause” means the NEO’s termination by the Company for any reason other than the NEO’s (a) conviction of, or agreement to a plea of nolo contendere to, a felony or other crime involving moral turpitude (including an indictment therefore under the CIC Plan), (b) willful failure to perform his or her duties (or in Mr. Sotos’ case, his material duties pursuant to his amended and restated employment agreement), (c) willful gross neglect or willful misconduct (including a material act of theft, fraud, malfeasance or dishonesty in connection with his or her performance of duties under the CIC Plan), or (d) breach of any written agreement between the Company or NEO, a violation of the Company’s Code of Conduct or other written policy (or in Mr. Sotos’ case, a material breach of such a written agreement or material violation of the Company’s Code of Conduct).
A voluntary termination for “good reason” means the resignation of the NEO in the event of (a) a reduction in his or her base salary or target total compensation by more than 15%, excluding across-the-board reductions to his or her base salary or annual bonus target, or if during the Change in Control Period, any reduction of base salary or target total compensation (without regard to whether the reduction applies on an across-the-board basis), (b) a material reduction in his or her benefits under or relative level of participation in the Company’s employee benefit plans, (c) a material diminution in his or her title, authority, duties or responsibilities, (d) a relocation of his or her principal place of employment by more than 50 miles or (e) the failure of a successor to the Company to agree, in writing, to assume the CIC Plan, or in the case of Mr. Sotos, his amended and restated employment agreement, within 15 days after a merger, consolidation, sale or similar transaction. In Mr. Sotos’ case only, “good reason” also includes (i) in lieu of the event described in the preceding subclause (a), a reduction in his base salary, annual bonus target, or target long-term incentive awards by more than 15%, excluding across-the-board reductions to his base salary, annual bonus target, and/or target long-term incentive awards, or if during the period that is within the six months immediately prior to, or 24 months immediately following a change in control of the Company, any reduction of base salary, annual bonus target, or target long-term incentive awards (without regard to whether the reduction applies on an across-the-board basis), (ii) any material failure by the Company to comply with his amended and restated employment agreement, (iii) his removal from the Board, (iv) the failure to elect him to the Board during any regular election, or (v) a change in reporting structure of the Company requiring Mr. Sotos to report to anyone other than the Board.
Potential Payments Upon Termination or Change‑In‑Control
The amount of compensation payable to each NEO in each circumstance is shown in the table below, assuming that termination of employment occurred as of December 31, 2023, and including payments that would have been earned as of such date. The amounts shown below do not include benefits payable under the Company’s 401(k) plan.
| | | | | | | | | | | | | | | | | | | | | | | | | | | |
| Named Executive Officer | | Involuntary Termination Not for Cause ($) | Voluntary Termination for Good Reason ($) | | Involuntary Not for Cause or Voluntary for Good Reason Following a Change in Control ($) | | Death or Disability ($) | Qualified Retirement | |
| Christopher S. Sotos | | 1,681,905 | | 1,681,905 | | | 9,883,885 | | | 5,873,777 | | — | | |
Sarah Rubenstein(1) | | 914,986 | | — | | | 3,005,407 | | | 1,073,620 | | — | | |
Kevin P. Malcarney(2) | | 919,650 | | — | | | 3,209,421 | | | 1,452,469 | | 983,388 | | |
(1) Ms. Rubenstein was appointed as Executive Vice President and Chief Financial Officer in April 2023. Ms. Rubenstein previously served as Senior Vice President and Chief Accounting Officer of the Company.
(2) Mr. Malcarney met the definition of Qualified Retirement in 2022 and is therefore entitled to certain payments and vesting of awards in the event he retires before they vest.
CEO Pay Ratio
As a result of the rules under the Dodd-Frank Act, the SEC requires disclosure of the CEO to median employee pay ratio. The following is a reasonable estimate, prepared under applicable SEC rules, of the ratio of the annual total compensation of our CEO, Mr. Sotos, to the annual total compensation of our median employee.
In light of the sale of the Thermal Business in 2022, a new median employee was identified in 2022. With respect to the 2023 CEO Pay ratio analysis, we determined that we could use the same median employee that we identified in 2022 given that there had been no change in either our employee population or our employee compensation arrangements that we believe would significantly impact our 2023 pay ratio disclosure. Similarly, there has been no change in our median employee’s circumstances that we reasonably believe would result in a significant change to our 2023 pay ratio disclosure. Our median employee’s annual total compensation for 2023 was determined using the same rules that apply to reporting the compensation of our NEOs (including our CEO) in the “Total” column of the “Summary Compensation Table — 2021 — 2023” above. The following total compensation amounts were determined based on that methodology:
•The annual total compensation of the median employee for 2023 was $140,622.
•The annual total compensation of Mr. Sotos for 2023 was $3,458,999.
•As a result, we estimate that Mr. Sotos’ 2023 annual total compensation was approximately 25 times that of our median employee.
Given the different methodologies, exemptions, estimates and assumptions that various public companies use to determine an estimate of their pay ratio, the estimated ratio reported above should not be solely used as a basis for comparison between companies.
Item 12 — Security Ownership of Certain Beneficial Owners and Management and Related Stockholder Matters
Item 12Clearway Energy LLC Ownership
As of December 31, 2023, GIP and TotalEnergies, through CEG, owned 42,738,750 of the Company’s Class B units and 42,336,750 of the Company’s Class D units, and Clearway, Inc. owned 34,613,853 of the Company’s Class A units and 82,391,441 of the Company’s Class C units. As of December 31, 2023, Clearway, Inc., through its holdings of Class A units and Class C units, owned a 57.90% economic interest in the Company. Clearway, Inc. consolidates the results of the Company through its controlling interest as sole managing member. As of December 31, 2023, CEG, through its holdings of Class B units and Class D units, owned a 42.10% economic interest in the Company.
Clearway, Inc. Ownership
Stock Ownership of Executive Officers
The following table sets forth information concerning beneficial ownership of Clearway, Inc.’s Class A and Class C common stock and combined voting power of Class A, Class B, Class C and Class D common stock for: (a) each NEO and (b) all executive officers as a group. The percentage of beneficial ownership is based on 34,613,853 shares of Class A common stock outstanding as of January 31, 2024, and 82,391,441 shares of Class C common stock outstanding as of January 31, 2024, and percentage of combined voting power is based on 78,599,885 votes represented by Clearway, Inc.’s outstanding Class A, Class B, Class C and Class D common stock in the aggregate as of January 31, 2024. The percentage of beneficial ownership and the percentage of combined voting power also include any shares that such person has been omitted from this report pursuantthe right to acquire within 60 days of January 31, 2024. Unless otherwise indicated, each person has sole voting and dispositive power with respect to the reduced disclosure format permittedshares set forth in the following table.
The address of the beneficial owners is Clearway, Inc., 300 Carnegie Center, Suite 300, Princeton, New Jersey 08540.
| | | | | | | | | | | | | | | | | |
| | | Common Stock |
| Class A Common Stock | Class C Common Stock | % of |
| Executive Officers | Number(1) | % of Class A Common Stock | Number(1) | % of Class C Common Stock | Combined Voting Power(2) |
| Christopher S. Sotos | 31,100 | * | 332,616(3) | * | * |
| Sarah Rubenstein | 380 | * | 22,995(4) | * | * |
| Kevin P. Malcarney | 600 | * | 68,082(5) | * | * |
| All executive officers as a group (three people) | 32,080 | * | 423,693(6) | * | * |
* Less than one percent of outstanding Class A common stock, Class C common stock or combined voting power, as applicable.
(1) The number of shares beneficially owned by General Instruction Ieach person or entity is determined under the rules of the SEC, and the information is not necessarily indicative of beneficial ownership for any other purpose. Under such rules, each person or entity is considered the beneficial owner of any: (a) shares to Form 10-K.which such person or entity has sole or shared voting power or dispositive power and (b) shares that such person or entity has the right to acquire within 60 days.
(2) Represents the voting power of all of the classes of Clearway, Inc.’s common stock together as a single class. Each holder of Class A or Class B common stock is entitled to one vote for each share held. Each holder of Class C or Class D common stock is entitled to 1/100th of one vote for each share held. Holders of shares of Clearway, Inc.’s Class A, Class B, Class C and Class D common stock vote together as a single class on all matters presented to its stockholders for their vote or approval, except as otherwise provided by applicable law. (3) Includes 5,228 DERs to be paid in Class C common stock. Excludes 22,998 RSUs, 7,184 DERs and 89,187 RPSUs. Each RSU represents the right to receive one share of Class C common stock upon vesting. Each RPSU represents the potential to receive Class C common stock based upon Clearway, Inc. achieving a certain level of total shareholder return relative to Clearway, Inc.’s peer group over a three-year performance period. Each DER represents the right to receive the dividends and distributions that would have otherwise been paid with respect to a share subject to a RSU or RPSU award (if such share were outstanding rather than being subject to the applicable award).
(4) Includes 535 DERs to be paid in Class C common stock. Excludes 4,668 RSUs, 1,431 DERs and 17,931 RPSUs. Each RSU represents the right to receive one share of Class C common stock upon vesting. Each RPSU represents the potential to receive Class C common stock based upon Clearway, Inc. achieving a certain level of total shareholder return relative to Clearway, Inc.’s peer group over a three-year performance period. Each DER represents the right to receive the dividends and distributions that would have otherwise been paid with respect to a share subject to a RSU or RPSU award (if such share were outstanding rather than being subject to the applicable award).
(5) Includes 1,037 DERs to be paid in Class C common stock. Excludes 5,063 RSUs, 1,805 DERs and 20,421 RPSUs. Each RSU represents the right to receive one share of Class C common stock upon vesting. Each RPSU represents the potential to receive Class C common stock based upon Clearway, Inc. achieving a certain level of total shareholder return relative to Clearway, Inc.’s peer group over a three-year performance period. Each DER represents the right to receive the dividends and distributions that would have otherwise been paid with respect to a share subject to a RSU or RPSU award (if such share were outstanding rather than being subject to the applicable award).
(6) Consists of the total holdings of all executive officers as a group.
Item 13 — Certain Relationships and Related Transactions, and Director Independence
Item 13 has been omittedRelationship with CEG and Clearway, Inc.
CEG owns all of Clearway, Inc.’s outstanding Class B common stock and Class D common stock, which represents, in the aggregate, 54.91% of the voting interest in Clearway, Inc.’s stock, and receives distributions from this reportthe Company through its ownership of the Company’s Class B and Class D units. Holders of Clearway, Inc.’s Class A common stock and Class C common stock hold, in the aggregate, the remaining 45.09% of the voting interest in Clearway, Inc.’s stock. Each holder of Clearway, Inc.’s Class A or Class B common stock is entitled to one vote for each share held. Each holder of Clearway, Inc.’s Class C or Class D common stock is entitled to 1/100th of one vote for each share held. The holders of Clearway, Inc.’s outstanding shares of Class A and Class C common stock are entitled to dividends as declared. Clearway, Inc., through its holdings of the Company’s Class A units and Class C units, owns a 57.90% economic interest in the Company. CEG, through its holdings of the Company’s Class B units and Class D units, owns a 42.10% economic interest in the Company.
CEG Master Services Agreements
The Company is party to the CEG Master Services Agreements, pursuant to which CEG and certain of its affiliates or third-party service providers provide certain services to the Company, including operational and administrative services, which include human resources, information systems, cybersecurity, external affairs, accounting, procurement, and risk management services, and the Company provides certain services to CEG, including accounting, internal audit, tax and treasury services, in exchange for the payment of fees in respect of such services. For the year ended December 31, 2023, the Company paid approximately $4,840,000 under the CEG Master Services Agreements.
CEG Committed Investments
The assets listed below represent the Company’s currently committed investments in projects with CEG:
| | | | | | | | | | | | | | | | | | | | | | | | | | |
| Asset | | Technology | | Gross Capacity (MW) | | State | | Estimated COD |
| Cedar Creek | | Wind | | 160 | | ID | | 1H24 |
| Cedro Hill Repowering | | Wind | | 160 | | TX | | 2H24 |
| | | | | | | | |
Texas Solar Nova 2 (a) | | Solar | | 200 | | TX | | 1H24 |
| | | | | | | | |
(a) Included in a co-investment partnership.
Drop Drown Transactions
Texas Solar Nova 1 Drop Down
On December 28, 2023, the Company, through its indirect subsidiary, Lighthouse Renewable Holdco 2 LLC, acquired TSN1 BL Borrower Holdco LLC, the indirect owner of Texas Solar Nova 1, a 252 MW solar project that is located in Kent County, Texas, from Clearway Renew for cash consideration of $23 million. Lighthouse Renewable Holdco 2 LLC is a partnership between the Company and a cash equity investor. TSN1 BL Borrower Holdco LLC consolidates as primary beneficiary, TSN1 TE Holdco LLC, a tax equity fund that owns the Texas Solar Nova 1 solar project.
In connection with the Texas Solar Nova 1 Drop Down, the Company assumed non-recourse project-level debt, which included a construction loan, sponsor equity bridge loan and tax equity bridge loan. At acquisition date, when the project reached substantial completion, the tax equity investor contributed $148 million, which was utilized, along with the Company’s entire purchase price that was contributed back to the Company by CEG and the proceeds from the cash equity investor, to repay the $109 million sponsor equity bridge loan, to repay the $151 million tax equity bridge loan, to fund $18 million in construction completion reserves, and to pay $5 million in associated fees with the remaining $9 million distributed back to CEG.
Victory Pass and Arica Drop Down
On October 31, 2023, the Company, through its indirect subsidiary, VP-Arica Parent Holdco LLC, acquired the Class A membership interests in VP-Arica TargetCo LLC, a partnership and the indirect owner of Victory Pass, a 200 MW solar project that is paired with 50 MW of energy storage, and Arica, a 263 MW solar project that is paired with 136 MW of energy storage, which are both currently under construction in Riverside, California, from Clearway Renew for initial cash consideration of $46 million. VP-Arica TargetCo LLC consolidates as primary beneficiary, VP-Arica TE Holdco LLC, a tax equity fund that owns the Victory Pass and Arica solar projects.
In connection with the Victory Pass and Arica Drop Down, the Company assumed non-recourse project-level debt, which included a sponsor equity bridge loan and tax equity bridge loan. A partial payment of $133 million was made on the sponsor equity bridge loan at acquisition date utilizing all of the proceeds from the Company, which were contributed back to the Company by CEG, and the contribution from the cash equity investor.
Daggett 2 Drop Down
On August 30, 2023, the Company, through its indirect subsidiary, Daggett Solar Investment LLC, acquired the Class A membership interests in Daggett 2 TargetCo LLC, a partnership and the indirect owner of Daggett 2, a 182 MW solar project that is paired with 131 MW of energy storage and is located in San Bernardino, California, from CEG for cash consideration of $13 million. Daggett 2 TargetCo LLC consolidates as primary beneficiary, Daggett 2 TE Holdco LLC, a tax equity fund that owns the Daggett 2 solar project.
In connection with the Daggett 2 Drop Down, the Company assumed non-recourse project-level debt, which included a construction loan and tax equity bridge loan. On December 22, 2023, when the project reached substantial completion, the tax equity investor contributed an additional $202 million, which was utilized, along with the $120 million in escrow and $10 million in construction loan proceeds, to repay the $204 million tax equity bridge loan, to fund $36 million in construction completion reserves and to pay $1 million in associated fees with the remaining $91 million distributed to CEG.
Rosamond Central BESS Drop Down and Financing Activities
On June 30, 2023, the Company through its indirect subsidiary, Rosie Class B LLC, the indirect owner of the Rosamond Central solar project, became the owner of the Class B membership interests of Rosie Central BESS in order to facilitate and fund the construction of a 147 MW BESS project that is co-located at the Rosamond Central solar facility. Clearway Renew indirectly owns the Class A membership interests and controls Rosie Central BESS. As of December 31, 2023, the Company’s investment consisted of $28 million contributed into Rosie Central BESS, funded through contributions from the Company and its cash equity investor in Rosie TargetCo LLC, which consolidates Rosie Class B LLC. On December 1, 2023, the Rosamond Central solar project acquired the BESS project from Clearway Renew for initial cash consideration of $70 million, $16 million of which was funded by the Company with the remaining $54 million funded through contributions from the cash equity investor in Rosie TargetCo LLC and the tax equity investor in Rosie TE HoldCo LLC.
Also, on July 3, 2023, Rosie Class B LLC, utilizing a portion of the proceeds from borrowings received under its refinanced debt facility, issued a loan to Clearway Renew in order to finance the construction of the BESS project. On December 1, 2023, Clearway Renew partially repaid the loan utilizing the $70 million in proceeds that was paid by the Company to acquire the BESS project. As of December 31, 2023, the loan issued to Clearway Renew had an aggregate principal amount of $174 million. The loan matures when the project reaches substantial completion, which is expected in the first half of 2024.
Daggett 3 Drop Down
On February 17, 2023, the Company, through its indirect subsidiary, Daggett Solar Investment LLC, acquired the Class A membership interests in Daggett TargetCo LLC, the indirect owner of Daggett 3, a 300 MW solar project that is paired with 149 MW of energy storage and located in San Bernardino, California, from Clearway Renew for cash consideration of $21 million. The Company then contributed its Class A membership interests into Daggett Renewable Holdco LLC, a partnership that consolidates Daggett TargetCo LLC. Daggett TargetCo LLC consolidates as primary beneficiary, Daggett TE Holdco LLC, a tax equity fund that owns the Daggett 3 solar project.
In connection with the Daggett 3 Drop Down, the Company assumed non-recourse project-level debt, which included a construction loan, sponsor equity bridge loan and tax equity bridge loan. The $75 million sponsor equity bridge loan was repaid at acquisition date, along with $8 million in associated fees, utilizing all of the proceeds from the Company, which were contributed back by CEG, and the contribution from the cash equity investor. On December 1, 2023, when the project reached substantial completion, the tax equity investor contributed an additional $252 million, which was utilized along with the $69 million in escrow, to repay the $229 million tax equity bridge loan, to fund $40 million in construction completion reserves, which is included in restricted cash on the Company’s consolidated balance sheet, and to pay $7 million in associated fees with the remaining $45 million distributed to CEG.
During the year ended December 31, 2023, the Company also received $54 million from CEG to fund project costs, $22 million of which were incurred after the acquisition date. In October 2023, the $54 million funded by CEG was repaid, along with a distribution of $8 million, which was an estimate of the remaining project costs to be incurred prior to substantial completion.
Waiawa Drop Down
On October 3, 2022, the Company, through its indirect subsidiary, Lighthouse Renewable Holdco LLC, acquired Waiawa BL Borrower Holdco LLC, the indirect owner of the Waiawa solar project, a 36 MW solar project that is paired with 36 MW of energy storage and located in Honolulu, Hawaii, from Clearway Renew. In connection with the Waiawa Drop Down, the Company assumed the project’s financing agreement, which included a construction loan, tax equity bridge loan and sponsor equity bridge loan.
On March 30, 2023, when the project reached substantial completion, the tax equity investor contributed an additional $41 million and CEG contributed an additional $8 million, which was utilized, along with the $17 million in escrow, to repay the $55 million tax equity bridge loan, to fund $10 million in construction completion reserves and to pay $1 million in associated fees.
Cedro Hill Repowering
On December 12, 2023, the Company entered into a financing agreement for non-recourse debt for a total commitment of $254 million, which consists of construction loans, a tax equity bridge loan and a sponsor equity bridge loan, related to the repowering of the Cedro Hill wind project. The Company’s initial borrowing of $165 million was utilized to repay the $72 million of outstanding principal under the original financing agreement, to pay $55 million to Clearway Renew for the future delivery of equipment, to pay $27 million to a third party for the future delivery of equipment, to pay a $4 million development services fee to Clearway Renew, to pay for $4 million in debt issuance costs that were deferred and to pay for $3 million in capital expenditures.
Operations and Maintenance Agreements
CEG provides operations and maintenance (“O&M”) and day‑to‑day operational support to the Company’s utility scale solar and wind facilities in accordance with O&M agreements with the Company. Each of the counterparties to the O&M agreements is an affiliate of CEG. The O&M agreements for which the amount paid to CEG exceeded $120,000 during the year ended December 31, 2023 are described in the table below. Under these O&M agreements, the Company generally pays an annual or monthly fee, which may be subject to annual adjustment, plus any reimbursable expenses.
| | | | | | | | | | | | | | |
| Project | | Agreement Description | | Approximate Amount Paid to CEG |
| Solar | | | | |
| Agua Caliente | | O&M Agreement, dated December 22, 2017 | | $4,412,000 | |
| Borrego | | O&M Agreement, dated August 1, 2012 | | $544,000 | |
| Buckthorn Solar | | O&M Agreement, dated May 22, 2017 | | $2,119,000 | |
| Chestnut Fund LLC | | O&M Agreement, dated February 9, 2018 | | $1,425,000 | |
| Clearway & EFS Distributed Solar LLC | | O&M Agreement, dated October 28, 2016 | | $222,000 | |
| CS4 Fund LLC | | O&M Agreement, dated November 29, 2018 | | $659,000 | |
| CVSR | | O&M Agreement, dated September 30, 2011 | | $4,288,000 | |
| Daggett 3 | | O&M Agreement, dated October 28, 2021 | | $1,168,000 | |
| DG CS Holdco LLC | | O&M Agreement, dated November 2, 2020 | | $318,000 | |
| DGPV Fund 1 LLC | | O&M Agreement, dated June 12, 2015 | | $247,000 | |
| DGPV Fund 2 LLC | | O&M Agreement, dated September 4, 2015 | | $951,000 | |
| DGPV Fund 4 LLC | | O&M Agreement, dated June 16, 2017 | | $1,313,000 | |
| Golden Puma Fund LLC | | O&M Agreement, dated March 30, 2017 | | $745,000 | |
| Kansas South | | O&M Agreement, dated June 13, 2017 | | $907,000 | |
| Lanikuhana Solar LLC | | O&M Agreement, dated December 28, 2017 | | $755,000 | |
| Mililani I | | O&M Agreement, dated May 28, 2021 | | $856,000 | |
| Rosamond Central | | O&M Agreement, dated June 30, 2023 | | $1,941,000 | |
| Solar Blythe | | O&M Agreement, dated November 1, 2017 | | $809,000 | |
| SPP Projects | | O&M Agreement, dated October 31, 2017 | | $913,000 | |
| TA High Desert | | O&M Agreement, dated June 9, 2017 | | $685,000 | |
| Utah Solar Portfolio | | O&M Agreement, dated June 13, 2022 | | $3,029,000 | |
| Waiawa | | O&M Agreement, dated May 28, 2021 | | $773,000 | |
| Waipio PV LLC | | O&M Agreement, dated December 28, 2017 | | $1,098,000 | |
| Wind | | | | |
| Alta Wind I | | O&M Agreement, dated December 12, 2016 | | $1,871,000 | |
| Alta Wind II | | O&M Agreement, dated December 12, 2016 | | $530,000 | |
| Alta Wind III | | O&M Agreement, dated December 12, 2016 | | $654,000 | |
| Alta Wind IV | | O&M Agreement, dated December 12, 2016 | | $484,000 | |
| Alta Wind V | | O&M Agreement, dated December 12, 2016 | | $702,000 | |
| Alta Wind X | | O&M Agreement, dated December 12, 2016 | | $2,252,000 | |
| Alta Wind XI | | O&M Agreement, dated December 12, 2016 | | $1,544,000 | |
| Black Rock | | O&M Agreement, dated December 30, 2020 | | $828,000 | |
| Broken Bow | | O&M Agreement, dated Nov 6, 2017 | | $1,675,000 | |
| Buffalo Bear | | O&M Agreement, dated May 1, 2016 | | $320,000 | |
| Cedro Hill | | O&M Agreement, dated Nov 11, 2015 | | $3,468,000 | |
| Crofton Bluffs | | O&M Agreement, dated February 13, 2012 | | $360,000 | |
| Elbow Creek | | O&M Agreement, dated October 31, 2018 | | $1,499,000 | |
| Forward | | O&M Agreement, dated October 20, 2016 | | $878,000 | |
| Goat Wind | | O&M Agreement, dated February 18, 2008 | | $3,207,000 | |
| Langford | | O&M Agreement, dated July 30, 2018 | | $2,818,000 | |
| Laredo Ridge | | O&M Agreement, dated December 24, 2015 | | $1,613,000 | |
| Lookout | | O&M Agreement, dated February 11, 2008 | | $1,269,000 | |
| Mesquite Sky | | O&M Agreement, dated December 30, 2020 | | $1,133,000 | |
| Mesquite Star | | O&M Agreement, dated May 7, 2019 | | $1,286,000 | |
| Mt. Storm | | O&M Agreement, dated April 23, 2021 | | $1,038,000 | |
| Mountain Wind 1 | | O&M Agreement, dated September 17, 2016 | | $1,343,000 | |
| Mountain Wind 2 | | O&M Agreement, dated September 17, 2016 | | $1,922,000 | |
| Ocotillo | | O&M Agreement, dated November 3, 2020 | | $2,293,000 | |
| Odin | | O&M Agreement, dated September 16, 2016 | | $688,000 | |
| Pinnacle | | O&M Agreement, dated December 1, 2016 | | $1,278,000 | |
| Rattlesnake | | O&M Agreement, dated February 5, 2020 | | $1,608,000 | |
| Sleeping Bear | | O&M Agreement, dated May 1, 2016 | | $2,454,000 | |
| South Trent | | O&M Agreement, dated October 1, 2015 | | $2,023,000 | |
| Spanish Fork | | O&M Agreement, dated September 16, 2016 | | $560,000 | |
| Taloga | | O&M Agreement, dated July 1, 2016 | | $2,682,000 | |
| Wildorado | | O&M Agreement, dated February 11, 2008 | | $2,298,000 | |
Asset Management and Administrative Services Agreements
CEG provides day-to-day administrative support to certain of the Company’s project-level entities in accordance with asset management and administrative services agreements (the “ASAs”). The ASAs for which the amount involved exceeded $120,000 during the year ended December 31, 2023 are described in the table below. Under these agreements, the Company generally pays an annual or monthly fee, which may be subject to annual adjustment, plus any reimbursable expenses.
| | | | | | | | | | | | | | |
| Project | | Agreement Description | | Approximate Amount Paid to CEG |
| Solar | | | | |
| Agua Caliente | | Asset Management Agreement, dated January 18, 2012 | | $521,000 | |
| Alpine | | Asset Management Agreement, dated March 15, 2012 | | $157,000 | |
| Buckthorn Solar | | Asset Management Agreement, dated May 22, 2017 | | $175,000 | |
| Chestnut Fund LLC | | Asset Management Agreement, dated July 31, 2017 | | $217,000 | |
| CS4 Fund LLC | | Asset Management Agreement, dated November 29, 2018 | | $173,000 | |
| CVSR | | Asset Management Agreement, dated April 26, 2016 | | $232,000 | |
| DG CS Holdco LLC | | Asset Management Agreement, dated November 2, 2020 | | $1,821,000 | |
| Daggett 3 | | Project Administration Agreement dated October 28, 2021 | | $294,000 | |
| Mililani I | | Project Administration Agreement, dated May 28, 2021 | | $156,000 | |
| Oahu Solar | | Project Administration Agreement, dated December 28, 2017 | | $217,000 | |
| Rosamond Central | | Project Administration Agreement, dated June 30, 2023 | | $256,000 | |
| SPP Projects | | Asset Management Agreement, dated October 31, 2017 | | $442,000 | |
| Utah Solar Portfolio | | Asset Management Agreement, dated December 1, 2021 | | $909,000 | |
| Waiawa | | Project Administration Agreement, dated May 28, 2021 | | $132,000 | |
| | | | |
| | | | |
| Wind | | | | |
| Black Rock | | Project Administration Agreement, dated December 30, 2020 | | $260,000 | |
| Broken Bow | | Amended and Restated Services Agreement, dated February 13, 2012 | | $251,000 | |
| Buffalo Bear | | Amended and Restated Services Agreement, dated September 15, 2011 | | $175,000 | |
| Cedro Hill | | Management and Administration Agreement, dated March 10, 2010 | | $188,000 | |
| Crofton Bluffs | | Amended and Restated Services Agreement, dated February 13, 2012 | | $251,000 | |
| Elbow Creek | | Project Administration Agreement, dated January 1, 2018 | | $264,000 | |
| Forward | | Services Agreement, dated January 1, 2012 | | $223,000 | |
| Langford | | Project Administration Agreement, dated April 24, 2020 | | $160,000 | |
| Laredo Ridge | | Support Services Agreement, dated May 27, 2010 | | $180,000 | |
| Lighthouse Renewable Holdco LLC | | Management Services Agreement, dated December 17, 2021 | | $217,000 | |
| Lookout | | Services Agreement, dated January 1, 2012 | | $223,000 | |
| Mesquite Sky | | Project Administration Agreement, dated December 30, 2020 | | $331,000 | |
| Mesquite Star | | Services Agreement, dated May 7, 2019 | | $296,000 | |
| Mountain Wind 1 | | Amended and Restated Services Agreement, dated February 13, 2012 | | $231,000 | |
| Mountain Wind 2 | | Amended and Restated Services Agreement, dated February 13, 2012 | | $251,000 | |
| Mt. Storm | | Project Administration Agreement, dated April 23, 2021 | | $217,000 | |
| Pinnacle | | Amended and Restated Services Agreement, dated September 15, 2011 | | $231,000 | |
| Rattlesnake | | Project Administration Agreement, dated February 5, 2020 | | $128,000 | |
| Sleeping Bear | | Services Agreement, dated January 1, 2012 | | $223,000 | |
| South Trent | | Project Administration Agreement, dated October 1, 2015 | | $174,000 | |
| Spanish Fork | | Services Agreement, dated January 1, 2012 | | $223,000 | |
| Taloga | | Services Agreement, dated November 20, 2012 | | $190,000 | |
| Viento Funding II, LLC | | Management and Administration Agreement, dated July 1, 2013 | | $269,000 | |
| Wildorado | | Project Administration Agreement, dated September 25, 2017 | | $270,000 | |
Land Lease Agreements
The Company is party to various land lease agreements with CEG. The land lease agreements for which the amount involved exceeded $120,000 during the year ended December 31, 2023 are described in the table below. Under these agreements, the Company generally pays a quarterly or monthly fee, which may be subject to annual adjustment.
| | | | | | | | | | | | | | |
| Project | | Agreement Description | | Approximate Amount Paid to CEG |
| Solar | | | | |
| Daggett 2 | | Land Lease Agreement, dated October 27, 2021 | | $493,000 | |
| Daggett 3 | | Land Lease Agreement, dated December 18, 2020 | | $1,609,000 | |
| Mililani I | | Land Lease Agreement, dated November 18, 2020 | | $796,000 | |
| Oahu Solar | | Land Lease Agreement, dated September 19, 2019 | | $908,000 | |
| Rosamond Central | | Land Lease Agreement, dated November 18, 2020 | | $566,000 | |
Development Collaboration Agreement
On February 9, 2024, the Company entered into a Development Collaboration Agreement with Clearway Renew (the “Collaboration Agreement”), pursuant to which, among other things, the Company procures substitute RA capacity from Clearway Renew to meet the Company’s contractual obligations to deliver RA capacity to various load-serving entities and to meet certain tariff requirements to provide RA capacity to cover planned outages. Under the Collaboration Agreement, certain subsidiaries of the Company that own and operate the Company’s natural gas-fired generating assets purchase substitute RA capacity from certain subsidiaries of Clearway Renew that operate its BESS development projects (the “BESS Project Companies”), in each case pursuant to separate, five-year purchase agreements (the “RA Agreements”). In addition, pursuant to the reduced disclosure formatCollaboration Agreement, Clearway Renew has offered the Company a right of first offer to acquire an ownership interest in the BESS Project Companies or certain of Clearway Renew’s BESS facilities. Under the Collaboration Agreement and the RA Agreement, the Clearway Renew BESS Project Companies will post approximately $287,000 of security to the Company in 2024 to guarantee the financial obligations of the BESS Project Companies. The value of such security may increase in the future if certain milestones are met.
Other
During 2023, the Company paid approximately $3,683,000 to CEG, consisting primarily of reimbursements of insurance premiums and employee-related benefits that CEG paid on behalf of the Company. The Company also received $3,466,000 from CEG, consisting primarily of employee-related expenses that the Company paid on behalf of CEG.
During 2023, the Company also paid approximately $6,470,000 in annual property insurance premiums to TotalEnergies’ captive insurance affiliate. The Company also paid approximately $449,000 to GIM as reimbursement for professional fees that GIM incurred on behalf of the Company.
Fourth Amended and Restated Limited Liability Company Agreement of Clearway Energy LLC
The following is a description of the material terms of Clearway Energy LLC’s Fourth Amended and Restated Limited Liability Company Agreement (the “LLC Agreement”). For the year ended December 31, 2023, Clearway Energy LLC made approximately $180,354,000 in distributions to Clearway, Inc. (the holder of Class A and Class C units) and $131,169,000 to CEG (the holder of Class B and Class D units). In addition to the quarterly distributions, the Company distributed an additional $29,403,000 to Clearway, Inc. and $21,413,000 to CEG during the year ended December 31, 2023 in order for Clearway, Inc. to make certain additional tax payments associated with the sale of the Thermal Business.
Governance
Clearway, Inc. serves as the sole managing member of the Company. As such, Clearway, Inc. and effectively Clearway, Inc.’s Board, control the business and affairs of the Company and are responsible for the management of the business.
Voting and Economic Rights of Members
The Company has four classes of Units: Class A units, Class B units, Class C units and Class D units. Class A units and Class C units may be issued only to Clearway, Inc. as the sole managing member, and Class B units and Class D units may be issued only to CEG and held by CEG or its permitted transferees. Units of each of the four classes have equivalent economic and other rights, except that upon issuance, each holder of a Class B unit will also be issued a share of Clearway, Inc.’s Class B common stock, and each holder of a Class D unit will also be issued a share of Clearway, Inc.’s Class D common stock. Each Class B unit is exchangeable for a share of Clearway, Inc.’s Class A common stock and each Class D unit is exchangeable for a share of Clearway, Inc.’s Class D common stock, in each case subject to equitable adjustments for stock splits, dividends and reclassifications in accordance with the terms of the Exchange Agreement (as described below).
Net profits and net losses and distributions by General Instruction Ithe Company are allocated and made to Form 10-K.holders of units in accordance with the respective number of membership units of the Company held. Generally, the Company will make distributions to holders of units for the purpose of funding tax obligations in respect of income of the Company that is allocated to the members of the Company.
Clearway, Inc.’s Coordination with Clearway Energy LLC Any time Clearway, Inc. issues a share of Class A common stock or a share of Class C common stock for cash, the net proceeds therefrom will promptly be transferred to the Company, and the Company will either:
• transfer a newly issued Class A unit of the Company to Clearway, Inc. in the case of the issuance of a share of Class A common stock, or a newly issued Class C unit of the Company to Clearway, Inc. in the case of the issuance of a share of Class C common stock; or
• use the net proceeds to purchase a Class B unit of the Company from CEG in the case of the issuance of a share of Class A common stock, which Class B unit will automatically convert into a Class A unit of the Company when transferred to Clearway, Inc., or a Class D unit of the Company from CEG in the case of the issuance of a share of Class C common stock, which Class D unit will automatically convert into a Class C unit of the Company when transferred to Clearway, Inc.
If Clearway, Inc. elects to redeem any shares of their Class A common stock or Class C common stock for cash, the Company will, immediately prior to such redemption, redeem an equal number of Class A units or Class C units, as applicable, held by Clearway, Inc. upon the same terms and for the same price, as the shares of Class A common stock so redeemed.
Exchange Agreement
Clearway, Inc. is party to an Amended and Restated Exchange Agreement with CEG (the “Exchange Agreement”). Under the Exchange Agreement, CEG (and certain permitted assignees and permitted transferees who acquire Class B units or Class D units of the Company) may from time to time cause us to exchange their Class B units for shares of Clearway, Inc.’s Class A common stock on a one‑for‑one basis, subject to adjustments for stock splits, stock dividends and reclassifications, or exchange their Class D units for shares of Clearway, Inc.’s Class C common stock on a one‑for‑one basis, subject to equitable adjustments for stock splits, stock dividends and reclassifications.
When CEG or its permitted transferee exchanges a Class B unit of the Company for a share of Clearway, Inc.’s Class A common stock, Clearway, Inc. will automatically redeem and cancel a corresponding share of their Class B common stock and the Class B unit will automatically convert into a Class A unit when issued to Clearway, Inc.; similarly, when CEG or its permitted transferee exchanges a Class D unit of the Company for a share of Clearway, Inc.’s Class C common stock, Clearway, Inc. will automatically redeem and cancel a corresponding share of their Class D common stock and the Class D unit will automatically convert into a Class C unit when issued to Clearway, Inc. As a result, when a holder exchanges its Class B units for shares of Clearway, Inc.’s Class A common stock, or its Class D units for shares of Clearway, Inc.’s Class C common stock, Clearway, Inc.’s interest in the Company will be correspondingly increased.
Indemnification of Officers
Clearway, Inc. has entered into indemnification agreements with each of its executive officers. The indemnification agreements provide the executive officers with contractual rights to indemnification, expense advancement and reimbursement to the fullest extent permitted under Delaware law.
Registration Rights Agreement
Clearway, Inc. is party to an Amended and Restated Registration Rights Agreement with CEG (the “Registration Rights Agreement”). Under the Registration Rights Agreement, CEG and its affiliates are entitled to demand registration rights, including the right to demand that a shelf registration statement be filed, and “piggyback” registration rights, for shares of Clearway, Inc.’s Class A common stock that are issuable upon exchange of Class B units of the Company that CEG owns and shares of Clearway, Inc.’s Class C common stock that are issuable upon exchange of the Class D units of the Company that CEG owns.
Procedures for Review, Approval and Ratification of Related Person Transactions; Conflicts of Interest
The Company does not have a separate policy regarding related party transactions, as all of its officers are subject to the written Related Person Policy of Clearway, Inc., which provides that the Corporate Governance, Conflicts and Nominating Committee of Clearway, Inc.’s Board of Directors will periodically review all related person transactions that are required to be disclosed under SEC rules and, when appropriate, initially authorize or ratify all such transactions.
The Related Person Policy operates in conjunction with Clearway, Inc.’s Code of Conduct and is applicable to all “Related Person Transactions”, which are all transactions, arrangements or relationships in which:
•the aggregate amount involved will or may be expected to exceed $50,000 in any calendar year;
•Clearway, Inc. is a participant; and
•any Related Person (as that term is defined below) has or will have a direct or indirect interest.
A “Related Person” is:
•any person who is, or at any time during the applicable period was, a director of the Company or a nominee for director or an executive officer;
•any person who is known to Clearway, Inc. to be the beneficial owner of more than 5% of any class of Clearway, Inc.’s voting stock;
•any immediate family member of any of the persons referenced in the preceding two bullets, which means any child, stepchild, parent, stepparent, spouse, sibling, mother‑in‑law, father‑in‑law, son‑in‑law, daughter‑in‑law, brother‑in‑law or sister‑in‑law of the director, nominee for director, executive officer or more than 5% beneficial owner of any class of Clearway, Inc.’s voting stock, and any person (other than a tenant or employee) sharing the household of such director, nominee for director, executive officer or more than 5% beneficial owner of any class of the Company’s voting stock; and
•any firm, corporation or other entity in which any of the foregoing persons is a partner or principal or in a similar position or in which such person has a 10% or greater beneficial ownership interest.
In determining whether to recommend the initial approval or ratification of a Related Person Transaction, the Corporate Governance, Conflicts and Nominating Committee considers all of the relevant facts and circumstances available, including (if applicable) but not limited to: (a) whether there is an appropriate business justification for the transaction; (b) the benefits that accrue to us as a result of the transaction; (c) the terms available to unrelated third parties entering into similar transactions; (d) the impact of the transaction on director independence (in the event the related person is a director, an immediate family member of a director or an entity in which a director or an immediate family member of a director is a partner, stockholder, member or executive officer); (e) the availability of other sources for comparable products or services; (f) whether it is a single transaction or a series of ongoing, related transactions; and (g) whether entering into the transaction would be consistent with the Related Person Transaction Policy.
If the aggregate amount involved is expected to be less than $500,000, the transaction may be approved or ratified by the Chair of the Corporate Governance, Conflicts and Nominating Committee.
As part of its review of each Related Person Transaction, the Corporate Governance, Conflicts and Nominating Committee will take into account, among other factors it deems appropriate, whether the transaction is on terms no less favorable than the terms generally available to an unaffiliated third party under the same or similar circumstances and the extent of the Related Person’s interest in the transaction. This Related Person Policy also provides that certain transactions, based on their nature and/or monetary amount, are deemed to be pre‑approved or ratified by the Corporate Governance, Conflicts and Nominating Committee and do not require separate approval or ratification.
Transactions involving ongoing relationships with a Related Person will be reviewed and assessed at least annually by the Corporate Governance, Conflicts and Nominating Committee to ensure that such Related Person Transactions remain appropriate and in compliance with the Committee’s guidelines.
The Committee’s activities with respect to the review and approval or ratification of all Related Person Transactions are reported periodically to Clearway, Inc.’s Board of Directors. Any transaction between us and any Related Person, including CEG, will be subject to the prior review and approval of the Company’s Corporate Governance, Conflicts and Nominating Committee.
Item 14 — Principal Accounting Fees and Services
Audit and Nonaudit Fees
The following table presents fees for professional services rendered by KPMGErnst & Young LLP, the Company'sCompany’s principal independent registered public accounting firm, for the years ended December 31, 2017 and December 31, 2016.firm:
| | Year Ended December 31, | | | Year Ended December 31, |
| 2023 | | | 2023 | | 2022 |
| Audit Fees | |
| | | Year Ended December 31, |
| | 2017 | | 2016 |
| Audit Fees | $ | 1,916,700 |
| | $ | 1,952,210 |
|
| Audit-Related Fees | — |
| | — |
|
| Tax Fees | |
| Tax Fees | |
| Tax Fees | 12,700 |
| | 79,269 |
|
| All Other Fees | — |
| | — |
|
| Total | $ | 1,929,400 |
| | $ | 2,031,479 |
|
Audit Fees
For 20172023 and 2016 audit services, KPMG2022, Ernst & Young LLP billed the Company approximately $1,916,700$4,665,386 and $1,952,210,$4,484,400, respectively, for the integrated audit of the Company’s annual consolidated financial statements, internal control over financial reporting, and the review of the Company’s quarterly consolidated financial statements on Form 10-Q that are customary under the standards of the Public Company Accounting Oversight Board (United States), and in connection with statutory audits..
Audit-Related Fees
ThereFor 2023 and 2022, there were no audit-related fees billed to the Company by KPMG LLP for 2017 or 2016.Ernst & Young LLP.
Tax Fees
There were approximately $12,700 in tax feesFor 2023 and 2022, Ernst & Young LLP billed to the Company by KPMG LLP for 2017,approximately $1,565,229 and $1,560,400, respectively, relating mainly to compliance work. There were approximately $79,269 in tax fees billed to the Company by KPMG LLP for 2016.
All Other Fees
There were noFor 2023 and 2022, Ernst & Young LLP billed the Company approximately $10,000 and $6,560, respectively, in other fees billedrelating to the Company by KPMG LLP for 2017 or 2016.
online subscription fees.
Policy on Audit Committee Pre-approval
The Audit Committee of Yield,Clearway, Inc. is responsible for appointing, setting compensation for, and overseeing the work of the independent registered public accounting firm of the Company. The Audit Committee of Yield,Clearway, Inc. has established a policy regarding pre-approval of all audit and permissible nonaudit services provided by the independent registered public accounting firm of the Company.
The Audit Committee of Yield,Clearway, Inc. will annually review and pre-approve services that are expected to be provided by the independent registered public accounting firm. The term of the pre-approval will be 12 months from the date of the pre-approval, unless the Audit Committee of Yield,Clearway, Inc. approves a shorter time period. The Audit Committee may periodically amend and/or supplement the pre-approved services based on subsequent determinations.
Unless the Audit Committee of Yield,Clearway, Inc. has pre-approved Audit Services or a specified category of nonaudit services, any engagement to provide such services must be pre-approved by the Audit Committee of Yield,Clearway, Inc. if it is to be provided by the independent registered public accounting firm. The Audit Committee of Yield,Clearway, Inc. must also pre-approve any proposed services exceeding the pre-approved budgeted fee levels for a specified type of service.
The Audit Committee of Yield,Clearway, Inc. has authorized its Chair to pre-approve services in amounts up to $100,000 per engagement. Engagements exceeding $100,000 must be approved by the full Audit Committee of Yield,Clearway, Inc. Engagements pre-approved by the Chair are reported to the Audit Committee of Yield,Clearway, Inc. at its next scheduled meeting. The Audit Committee of Clearway, Inc. approved all of the audit-related fees, tax fees and all other fees disclosed above.
PART IV
Item 15 — Exhibits, Financial Statement Schedules
(a)(1) Financial Statements
The following consolidated financial statements of NRG YieldClearway Energy LLC and related notes thereto, together with the reportsReport of Independent Registered Public Accounting Firm of Ernst & Young LLP (PCAOB ID: 42) thereon, of KPMG LLP, are included herein:
Consolidated Statements of OperationsIncome — Years ended December 31, 2017, 20162023, 2022 and 20152021
Consolidated Statements of Comprehensive Income — Years ended December 31, 2017, 20162023, 2022 and 20152021
Consolidated Balance Sheets — As of December 31, 20172023 and 20162022
Consolidated Statements of Cash Flows — Years ended December 31, 2017, 20162023, 2022 and 20152021
Consolidated Statements of Members'Members’ Equity — Years ended December 31, 2017, 20162023, 2022 and 20152021
Notes to Consolidated Financial Statements
(a)(2) NotFinancial Statement Schedules
The following schedules of Clearway Energy LLC are filed as part of Item 15 of this report and should be read in conjunction with the Consolidated Financial Statements:
Schedule I — Clearway Energy LLC (Parent) Condensed Financial Statements for the years ended December 31, 2023, 2022 and 2021, are included in Clearway Energy LLC’s Annual Report on Form 10-K pursuant to the requirements of Rule 5-04(c) of Regulation S-X
All other schedules for which provision is made in the applicable accounting regulation of the Securities and Exchange Commission are not required under the related instructions or are inapplicable, and therefore, have been omitted
(a)(3) Exhibits: See Exhibit Index submitted as a separate section of this report
(b) Exhibits
See Exhibit Index submitted as a separate section of this report
(c) Not applicable
Report of Independent Registered Public Accounting Firm
TheTo the Members
NRG Yield of Clearway Energy LLC:
Opinion on the Consolidated Financial Statements
We have audited the accompanying consolidated balance sheets of NRG YieldClearway Energy LLC and subsidiaries (the “Company”)Company) as of December 31, 20172023 and 2016,2022, the related consolidated statements of operations,income, comprehensive income, members’ equity and cash flows for each of the three years in the three‑year period ended December 31, 2017,2023, and the related notes and financial statement schedules listed in the Index at Item 15(a)(2) (collectively referred to as the “consolidated financial statements”). In our opinion, the consolidated financial statements present fairly, in all material respects, the financial position of the Company as ofat December 31, 20172023 and 2016,2022 and the results of its operations and its cash flows for each of the three years in the three‑year period ended December 31, 2017,2023, in conformity with U.S. generally accepted accounting principles.
Basis for Opinion
These consolidated financial statements are the responsibility of the Company’s management. Our responsibility is to express an opinion on these consolidatedthe Company’s financial statements based on our audits. We are a public accounting firm registered with the Public Company Accounting Oversight Board (United States) (PCAOB) and are required to be independent with respect to the Company in accordance with the U.S. federal securities laws and the applicable rules and regulations of the Securities and Exchange Commission and the PCAOB.
We conducted our audits in accordance with the standards of the PCAOB.PCAOB and in accordance with auditing standards generally accepted in the United States of America. Those standards require that we plan and perform the audit to obtain reasonable assurance about whether the consolidated financial statements are free of material misstatement, whether due to error or fraud. The Company is not required to have, nor were we engaged to perform, an audit of its internal control over financial reporting. As part of our audits, we are required to obtain an understanding of internal control over financial reporting but not for the purpose of expressing an opinion on the effectiveness of the Company's internal control over financial reporting. Accordingly, we express no such opinion.
Our audits included performing procedures to assess the risks of material misstatement of the consolidated financial statements, whether due to error or fraud, and performing procedures that respond to those risks. Such procedures included examining, on a test basis, evidence regarding the amounts and disclosures in the consolidated financial statements. Our audits also included evaluating the accounting principles used and significant estimates made by management, as well as evaluating the overall presentation of the consolidated financial statements. We believe that our audits provide a reasonable basis for our opinion.
(signed) KPMGCritical Audit Matters
The critical audit matters communicated below are matters arising from the current period audit of the financial statements that were communicated or required to be communicated to the audit committee and that: (1) relate to accounts or disclosures that are material to the financial statements and (2) involved our especially challenging, subjective or complex judgments. The communication of critical audit matters does not alter in any way our opinion on the consolidated financial statements, taken as a whole, and we are not, by communicating the critical audit matters below, providing separate opinions on the critical audit matters or on the accounts or disclosures to which they relate.
| | | | | |
| Allocation of earnings to noncontrolling interests in tax equity arrangements |
| |
| Description of the Matter | As described in Note 5 to the consolidated financial statements, during 2023, tax equity investors purchased noncontrolling interests in Daggett TE Holdco LLC, Daggett 2 TE Holdco LLC, VP-Arica TE Holdco LLC and TSN1 TE Holdco LLC (the “new tax equity arrangements”). Each tax equity investor received Class A membership interests in the respective entity. The Company utilizes the output of a hypothetical liquidation at book value (HLBV) model to determine the earnings allocated to the tax equity noncontrolling interest holders as the contractual agreements between the parties represent substantive profit-sharing arrangements.
Auditing the allocation of earnings using the HLBV method to the new tax equity arrangements was complex due to the judgments required at the inception of the arrangement to evaluate whether the HLBV model appropriately reflects the unique substantive profit-sharing terms and features within each arrangement. A greater extent of audit effort and specialized skill and knowledge was required with respect to evaluating the appropriateness of the tax capital account balances used in the HLBV model for compliance with the provisions of the Internal Revenue Code, as well as compliance with the contractual provisions in each agreement. |
| |
| | | | | |
| How We Addressed the Matter in Our Audit | We obtained an understanding, evaluated the design and tested the operating effectiveness of the control over the Company’s process for establishing the HLBV model for the new tax equity arrangements. For example, we tested a control over management’s review of the substantive profit-sharing terms and features within each arrangement and evaluated whether they are properly reflected in each HLBV model.
To test the allocation of earnings to noncontrolling interest holders in the new tax equity arrangements, we read the related agreements to understand the business purpose and the substantive profit-sharing provisions. We evaluated each HLBV model for consistency with the contractual provisions in the related agreements and tested the initial recognition of the noncontrolling interest balance by agreeing capital contributions to supporting documentation. We involved tax subject matter professionals to assist in evaluating the calculation of the tax capital accounts used in each HLBV model for compliance with the provisions of the Internal Revenue Code, as well as compliance with the contractual provisions in the agreements. Additionally, we tested the year end noncontrolling interest balances for the new tax equity arrangements by agreeing contributions and distributions to supporting documentation and recalculating the allocation of earnings reflected in each HLBV model. |
| |
| Fair value of Level 3 long-term power commodity contracts |
| |
| Description of the Matter | As described in Note 6 to the consolidated financial statements, as of December 31, 2023, the aggregate fair value of long-term power commodity contracts classified as Level 3 derivative instruments was $325 million. The Company’s determination of the fair value of long-term power commodity contracts executed in illiquid markets are considered Level 3 fair value measurements as they contain significant unobservable inputs, including forward market energy pricing curves. The Company uses a discounted cash flow valuation technique to determine the fair value of its long-term power commodity contracts.
Auditing the fair value measurement of long-term power commodity contracts classified as Level 3 financial instruments was complex due to the judgmental nature of the forward market energy pricing curve assumptions used as an input into the valuation models. |
| |
| How We Addressed the Matter in Our Audit | We obtained an understanding, evaluated the design and tested the operating effectiveness of controls over the Company’s processes for reviewing the key assumptions in estimating Level 3 fair values related to long-term power commodity contracts. For example, we tested controls over management’s review of the specific forward market energy pricing curves used as an input into the valuation models.
To test the fair value of Level 3 long-term power commodity contracts, our audit procedures included, among others, evaluating the valuation methodologies used by the Company and testing significant inputs, estimates and the mathematical accuracy of the calculations. In certain instances, with the assistance of our valuation specialists, we independently determined the significant assumptions, calculated the resultant fair values and compared them to the Company’s estimates. We obtained forward market energy prices from independent sources, including pricing service providers and counterparty fair values, and evaluated the Company’s assumptions related to their forward curves and confirmed key inputs with counterparties. We also performed sensitivity analyses using independent sources of market data to evaluate the significance of the change in fair value of Level 3 long-term power commodity contracts that would result from changes in underlying assumptions. |
/s/ Ernst & Young LLP
We have served as the Company’s auditor since 2012.2021.
Philadelphia, Pennsylvania
March 1, 2018February 22, 2024
NRG YIELDCLEARWAY ENERGY LLC
CONSOLIDATED STATEMENTS OF OPERATIONS
|
| | | | | | | | | | | |
| | Year ended December 31, |
| (In millions) | 2017 | | 2016 (a) | | 2015 (a) |
| Operating Revenues | | | | | |
| Total operating revenues | $ | 1,009 |
| | $ | 1,035 |
| | $ | 968 |
|
| Operating Costs and Expenses | | | | | |
| Cost of operations | 326 |
| | 308 |
| | 323 |
|
| Depreciation and amortization | 334 |
| | 303 |
| | 303 |
|
| Impairment losses | 44 |
| | 185 |
| | 1 |
|
| General and administrative | 19 |
| | 14 |
| | 10 |
|
| Acquisition-related transaction and integration costs | 3 |
| | 1 |
| | 3 |
|
| Total operating costs and expenses | 726 |
| | 811 |
| | 640 |
|
| Operating Income | 283 |
| | 224 |
| | 328 |
|
| Other Income (Expense) | | | | | |
| Equity in earnings of unconsolidated affiliates | 71 |
| | 60 |
| | 31 |
|
| Other income, net | 4 |
| | 3 |
| | 3 |
|
| Loss on debt extinguishment | (3 | ) | | — |
| | (9 | ) |
| Interest expense | (293 | ) | | (272 | ) | | (258 | ) |
| Total other expense, net | (221 | ) | | (209 | ) | | (233 | ) |
| Net Income | 62 |
| | 15 |
| | 95 |
|
| Less: Net loss attributable to noncontrolling interests | (75 | ) | | (111 | ) | | (62 | ) |
| Net Income Attributable to NRG Yield LLC | $ | 137 |
| | $ | 126 |
| | $ | 157 |
|
(a) Retrospectively adjusted as discussed in Note 1, Nature of Business.
INCOME | | | | | | | | | | | | | | | | | |
| Year ended December 31, |
| (In millions) | 2023 | | 2022 | | 2021 |
| Operating Revenues | | | | | |
| Total operating revenues | $ | 1,314 | | | $ | 1,190 | | | $ | 1,286 | |
| Operating Costs and Expenses | | | | | |
| Cost of operations, exclusive of depreciation, amortization and accretion shown separately below | 473 | | | 435 | | | 451 | |
| Depreciation, amortization and accretion | 526 | | | 512 | | | 509 | |
| Impairment losses | 12 | | | 16 | | | 6 | |
| General and administrative | 35 | | | 38 | | | 38 | |
| Transaction and integration costs | 4 | | | 7 | | | 7 | |
| Development costs | — | | | 2 | | | 6 | |
| Total operating costs and expenses | 1,050 | | | 1,010 | | | 1,017 | |
| Gain on sale of business | — | | | 1,292 | | | — | |
| Operating Income | 264 | | | 1,472 | | | 269 | |
| Other Income (Expense) | | | | | |
| Equity in earnings of unconsolidated affiliates | 12 | | | 29 | | | 32 | |
| | | | | |
| | | | | |
| Other income, net | 52 | | | 17 | | | 3 | |
| Loss on debt extinguishment | (6) | | | (2) | | | (53) | |
| Interest expense | (337) | | | (232) | | | (312) | |
| Total other expense, net | (279) | | | (188) | | | (330) | |
| (Loss) Income Before Income Taxes | (15) | | | 1,284 | | | (61) | |
| Income tax (benefit) expense | (2) | | | 2 | | | 2 | |
| Net Income (Loss) | (13) | | | 1,282 | | | (63) | |
| Less: Net loss attributable to noncontrolling interests and redeemable noncontrolling interests | (162) | | | (106) | | | (173) | |
| Net Income Attributable to Clearway Energy LLC | $ | 149 | | | $ | 1,388 | | | $ | 110 | |
See accompanying notes to consolidated financial statements.
NRG YIELDCLEARWAY ENERGY LLC
CONSOLIDATED STATEMENTS OF COMPREHENSIVE INCOME
|
| | | | | | | | | | | |
| | Year ended December 31, |
| | 2017 | | 2016 (a) | | 2015 (a) |
| (In millions) | | | | | |
| Net Income | $ | 62 |
| | $ | 15 |
| | $ | 95 |
|
| Other Comprehensive Income (Loss) | | | | | |
| Unrealized gain (loss) on derivatives | 17 |
| | 13 |
| | (17 | ) |
| Other comprehensive income (loss) | 17 |
| | 13 |
| | (17 | ) |
| Comprehensive Income | 79 |
| | 28 |
| | 78 |
|
| Less: Comprehensive loss attributable to noncontrolling interests | (75 | ) | | (111 | ) | | (63 | ) |
| Comprehensive Income Attributable to NRG Yield LLC | $ | 154 |
| | $ | 139 |
| | $ | 141 |
|
(a) Retrospectively adjusted as discussed in Note 1, Nature of Business.
See accompanying notes to consolidated financial statements.
NRG YIELD LLC
CONSOLIDATED BALANCE SHEETS
|
| | | | | | | |
| | December 31, 2017 | | December 31, 2016 (a) |
| ASSETS | (In millions) |
| Current Assets | | | |
| Cash and cash equivalents | $ | 146 |
| | $ | 321 |
|
| Restricted cash | 168 |
| | 176 |
|
| Accounts receivable — trade | 96 |
| | 96 |
|
| Inventory | 39 |
| | 39 |
|
| Notes receivable — current | 13 |
| | 16 |
|
| Prepayments and other current assets | 19 |
| | 22 |
|
| Total current assets | 481 |
| | 670 |
|
| Property, plant and equipment, net | 5,204 |
| | 5,554 |
|
| Other Assets | | | |
| Equity investments in affiliates | 1,178 |
| | 1,152 |
|
| Intangible assets, net | 1,228 |
| | 1,303 |
|
| Other non-current assets | 63 |
| | 67 |
|
| Total other assets | 2,469 |
| | 2,522 |
|
| Total Assets | $ | 8,154 |
| | $ | 8,746 |
|
| LIABILITIES AND MEMBERS' EQUITY | | | |
| Current Liabilities | | | |
| Current portion of long-term debt — external | $ | 306 |
| | $ | 323 |
|
| Accounts payable — trade | 27 |
| | 23 |
|
| Accounts payable — affiliate | 48 |
| | 40 |
|
| Derivative instruments | 17 |
| | 33 |
|
| Accrued expenses and other current liabilities | 87 |
| | 85 |
|
| Total current liabilities | 485 |
| | 504 |
|
| Other Liabilities | | | |
| Long-term debt — external | 4,921 |
| | 5,128 |
|
| Long-term debt — affiliate | 618 |
| | 618 |
|
| Accounts payable — affiliate | — |
| | 9 |
|
| Derivative instruments | 31 |
| | 46 |
|
| Other non-current liabilities | 91 |
| | 77 |
|
| Total non-current liabilities | 5,661 |
| | 5,878 |
|
| Total Liabilities | 6,146 |
| | 6,382 |
|
| Commitments and Contingencies | | | |
| Members' Equity | | | |
| Contributed capital | 1,897 |
| | 2,179 |
|
| Retained earnings | 17 |
| | 44 |
|
| Accumulated other comprehensive loss | (68 | ) | | (85 | ) |
| Noncontrolling interest | 162 |
| | 226 |
|
| Total Members' Equity | 2,008 |
| | 2,364 |
|
| Total Liabilities and Members’ Equity | $ | 8,154 |
| | $ | 8,746 |
|
(a) Retrospectively adjusted as discussed in Note 1, Nature of Business.
See accompanying notes to consolidated financial statements.
NRG YIELD LLC
CONSOLIDATED STATEMENTS OF CASH FLOWS
|
| | | | | | | | | | | |
| | Year ended December 31, |
| | 2017 | | 2016 (a) | | 2015 (a) |
| | (In millions) |
| Cash Flows from Operating Activities | | | | | |
| Net (loss) income | $ | 62 |
| | $ | 15 |
| | $ | 95 |
|
| Adjustments to reconcile net income to net cash provided by operating activities: | | | | | |
| Equity in earnings of unconsolidated affiliates | (71 | ) | | (60 | ) | | (31 | ) |
| Distributions from unconsolidated affiliates | 72 |
| | 58 |
| | 60 |
|
| Depreciation and amortization | 334 |
| | 303 |
| | 303 |
|
| Amortization of financing costs | 13 |
| | 8 |
| | 7 |
|
| Amortization of intangibles and out-of-market contracts | 70 |
| | 76 |
| | 55 |
|
| Loss on debt extinguishment | 3 |
| | — |
| | 9 |
|
| Impairment losses | 44 |
| | 185 |
| | 1 |
|
| Changes in derivative instruments | (16 | ) | | (15 | ) | | (44 | ) |
| Loss on disposal of asset components | 16 |
| | 6 |
| | 3 |
|
| Cash provided by (used in) changes in other working capital: | | | | | |
| Changes in prepaid and accrued capacity payments | (4 | ) | | (8 | ) | | (12 | ) |
| Changes in other working capital | (7 | ) | | 9 |
| | (22 | ) |
| Net Cash Provided by Operating Activities | 516 |
| | 577 |
| | 424 |
|
| Cash Flows from Investing Activities | | | | | |
| Acquisition of businesses, net of cash acquired | — |
| | — |
| | (37 | ) |
| Acquisition of Drop Down Assets, net of cash acquired | (250 | ) | | (77 | ) | | (698 | ) |
| Capital expenditures | (31 | ) | | (20 | ) | | (29 | ) |
| Cash receipts from notes receivable | 17 |
| | 17 |
| | 17 |
|
| Return of investment from unconsolidated affiliates | 47 |
| | 28 |
| | 42 |
|
| Investments in unconsolidated affiliates | (73 | ) | | (83 | ) | | (402 | ) |
| Other | 7 |
| | 4 |
| | 9 |
|
| Net Cash Used in Investing Activities | (283 | ) | | (131 | ) | | (1,098 | ) |
| Cash Flows from Financing Activities | | | | | |
| Net contributions from noncontrolling interests | 13 |
| | 5 |
| | 122 |
|
| Net distributions and return of capital to NRG prior to the acquisition of Drop Down Assets | (20 | ) | | (184 | ) | | (79 | ) |
| Proceeds from the issuance of class C units | 33 |
| | — |
| | 599 |
|
| Payments of distributions | (202 | ) | | (173 | ) | | (139 | ) |
| Proceeds from the revolving credit facility | 55 |
| | 60 |
| | 551 |
|
| Payments for the revolving credit facility | — |
| | (366 | ) | | (245 | ) |
| Proceeds from issuance of long-term debt — external | 41 |
| | 740 |
| | 6 |
|
| Proceeds from issuance of long-term debt — affiliate | — |
| | — |
| | 281 |
|
| Payments of debt issuance costs | (4 | ) | | (15 | ) | | (7 | ) |
| Payments for long-term debt — external | (332 | ) | | (269 | ) | | (735 | ) |
| Net Cash (Used in) Provided by Financing Activities | (416 | ) | | (202 | ) | | 354 |
|
| Net (Decrease) Increase in Cash and Cash Equivalents | (183 | ) | | 244 |
| | (320 | ) |
| Cash, Cash Equivalents and Restricted Cash at Beginning of Period | 497 |
| | 253 |
| | 573 |
|
| Cash, Cash Equivalents and Restricted Cash at End of Period | $ | 314 |
| | $ | 497 |
| | $ | 253 |
|
| | | | | | |
| Supplemental Disclosures | | | | | |
| Interest paid, net of amount capitalized | $ | (297 | ) | | $ | (271 | ) | | $ | (279 | ) |
| Non-cash investing and financing activities: | | | | | |
| Additions to fixed assets for accrued capital expenditures | 4 |
| | 3 |
| | 3 |
|
| Non-cash return of capital and distributions to NRG, net of contributions | $ | (2 | ) | | $ | 65 |
| | $ | (9 | ) |
(a) Retrospectively adjusted as discussed in Note 1, Nature of Business.
See accompanying notes to consolidated financial statements.
NRG YIELD LLC
CONSOLIDATED STATEMENTS OF MEMBERS' EQUITY
|
| | | | | | | | | | | | | | | | | | | | |
| (In millions) | | Contributed Capital | | Retained Earnings | | Accumulated Other Comprehensive Loss | | Noncontrolling Interest | | Total Members' Equity |
Balances at December 31, 2014 (a) | | $ | 2,308 |
| | $ | 133 |
| | $ | (80 | ) | | $ | 334 |
| | $ | 2,695 |
|
| Members' equity - Acquired Drop Down Assets | | 208 |
| | (9 | ) | | (2 | ) | | (135 | ) | | 62 |
|
| Balances at December 31, 2014 | | $ | 2,516 |
| | $ | 124 |
| | $ | (82 | ) | | $ | 199 |
| | $ | 2,757 |
|
Net income (loss) (b) | | — |
| | 157 |
| | — |
| | (62 | ) | | 95 |
|
| Unrealized loss on derivatives | | — |
| | — |
| | (16 | ) | | (1 | ) | | (17 | ) |
| Payment for January 2015 and November 2015 Drop Down Assets | | (698 | ) | | — |
| | — |
| | — |
| | (698 | ) |
Distributions and returns of capital to NRG, net of contributions (b) | | (38 | ) | | (41 | ) | | — |
| | — |
| | (79 | ) |
Capital contributions from NRG, non-cash (b) | | (15 | ) | | 6 |
| | — |
| | — |
| | (9 | ) |
| Capital contributions from tax equity investors | | — |
| | — |
| | — |
| | 122 |
| | 122 |
|
| Noncontrolling interest acquired in Spring Canyon acquisition | | — |
| | — |
| | — |
| | 74 |
| | 74 |
|
| Proceeds from the issuance of Class C units | | 599 |
| | — |
| | — |
| | — |
| | 599 |
|
| Distributions paid to NRG on Class B and Class D units | | — |
| | (70 | ) | | — |
| | — |
| | (70 | ) |
| Distributions paid to Yield, Inc. | | — |
| | (69 | ) | | — |
| | — |
| | (69 | ) |
| Balances at December 31, 2015 | | $ | 2,364 |
| | $ | 107 |
| | $ | (98 | ) | | $ | 332 |
| | $ | 2,705 |
|
Net income (loss) (b) | | — |
| | 126 |
| | — |
| | (111 | ) | | 15 |
|
| Unrealized loss on derivatives | | — |
| | — |
| | 13 |
| | — |
| | 13 |
|
| Payment for CVSR Drop Down Asset | | (77 | ) | | — |
| | — |
| | — |
| | (77 | ) |
| Capital contributions from tax equity investors | | — |
| | — |
| | — |
| | 5 |
| | 5 |
|
Distributions paid to NRG, net of contributions (b) | | (182 | ) | | (2 | ) | | — |
| | — |
| | (184 | ) |
Distributions paid to NRG, net of contributions, non-cash (b) | | 74 |
| | (9 | ) | | — |
| | — |
| | 65 |
|
| Distributions paid to NRG on Class B and Class D units | | — |
| | (81 | ) | | — |
| | — |
| | (81 | ) |
| Distributions paid to Yield, Inc., non-cash | | — |
| | (5 | ) | | — |
| | — |
| | (5 | ) |
| Distributions paid to Yield, Inc. | | — |
| | (92 | ) | | — |
| | — |
| | (92 | ) |
| Balances at December 31, 2016 | | $ | 2,179 |
| | $ | 44 |
| | $ | (85 | ) | | $ | 226 |
| | $ | 2,364 |
|
| Net income (loss) | | — |
| | 137 |
| | — |
| | (75 | ) | | 62 |
|
| Unrealized gain on derivatives | | — |
| | — |
| | 17 |
| | — |
| | 17 |
|
| Payments for the March 2017, August 2017 and November 2017 Drop Down Assets | | (250 | ) | | — |
| | — |
| | — |
| | (250 | ) |
| August 2017 Drop Down Assets contingent consideration | | (8 | ) | | — |
| | — |
| | — |
| | (8 | ) |
| Capital contributions from tax equity investors, net of distributions | | — |
| | — |
| | — |
| | 11 |
| | 11 |
|
| Proceeds from the issuance of Class C units | | 34 |
| | — |
| | — |
| | — |
| | 34 |
|
| Distributions paid to NRG, net of contributions | | (18 | ) | | — |
| | — |
| | — |
| | (18 | ) |
| Distributions paid to NRG, net of contributions, non-cash | | (8 | ) | | 6 |
| | — |
| | — |
| | (2 | ) |
| Distributions paid to NRG on Class B and Class D units | | (6 | ) | | (88 | ) | | — |
| | — |
| | (94 | ) |
| Distributions paid to Yield, Inc. | | (26 | ) | | (82 | ) | | — |
| | — |
| | (108 | ) |
| Balances at December 31, 2017 | | $ | 1,897 |
| | $ | 17 |
| | $ | (68 | ) | | $ | 162 |
| | $ | 2,008 |
|
(a) As previously reported in the Company's consolidated financial statements for the year ended December 31, 2016, included in the Company's May 9, 2017 Form 8-K.
(b) Retrospectively adjusted as discussed in Note 1, Nature of Business.
| | | | | | | | | | | | | | | | | |
| Year ended December 31, |
| 2023 | | 2022 | | 2021 |
| (In millions) | | | | | |
| Net Income (Loss) | $ | (13) | | | $ | 1,282 | | | $ | (63) | |
| Other Comprehensive (Loss) Income | | | | | |
| Unrealized (loss) gain on derivatives and changes in accumulated OCI/OCL | (7) | | | 33 | | | 22 | |
| Other comprehensive (loss) income | (7) | | | 33 | | | 22 | |
| Comprehensive (Loss) Income | (20) | | | 1,315 | | | (41) | |
| Less: Comprehensive loss attributable to noncontrolling interests and redeemable noncontrolling interests | (163) | | | (100) | | | (171) | |
| Comprehensive Income Attributable to Clearway Energy LLC | $ | 143 | | | $ | 1,415 | | | $ | 130 | |
See accompanying notes to consolidated financial statements.
NRG YIELDCLEARWAY ENERGY LLC
CONSOLIDATED BALANCE SHEETS | | | | | | | | | | | |
| (In millions) | December 31, 2023 | | December 31, 2022 |
| ASSETS | |
| Current Assets | | | |
| Cash and cash equivalents | $ | 535 | | | $ | 657 | |
| Restricted cash | 516 | | | 339 | |
| Accounts receivable — trade | 171 | | | 153 | |
| | | |
| Inventory | 55 | | | 47 | |
| | | |
| Derivative instruments | 41 | | | 26 | |
| Note receivable — affiliate | 174 | | | — | |
| | | |
| Prepayments and other current assets | 55 | | | 54 | |
| Total current assets | 1,547 | | | 1,276 | |
| | | |
| | | |
| | | |
| | | |
| | | |
| Property, plant and equipment, net | 9,526 | | | 7,421 | |
| Other Assets | | | |
| Equity investments in affiliates | 360 | | | 364 | |
| Intangible assets for power purchase agreements, net | 2,303 | | | 2,488 | |
| Other intangible assets, net | 71 | | | 77 | |
| Derivative instruments | 82 | | | 63 | |
| Right-of-use assets, net | 597 | | | 527 | |
| Other non-current assets | 202 | | | 96 | |
| Total other assets | 3,615 | | | 3,615 | |
| Total Assets | $ | 14,688 | | | $ | 12,312 | |
| LIABILITIES AND MEMBERS’ EQUITY | | | |
| Current Liabilities | | | |
| Current portion of long-term debt — external | $ | 558 | | | $ | 322 | |
| Current portion of long-term debt — affiliate | 1 | | | 2 | |
| Accounts payable — trade | 130 | | | 55 | |
| Accounts payable — affiliates | 35 | | | 24 | |
| Derivative instruments | 51 | | | 50 | |
| Accrued interest expense | 57 | | | 54 | |
| | | |
| Accrued expenses and other current liabilities | 79 | | | 95 | |
| Total current liabilities | 911 | | | 602 | |
| Other Liabilities | | | |
| Long-term debt — external | 7,479 | | | 6,491 | |
| | | |
| | | |
| | | |
| Deferred income taxes | 2 | | | 4 | |
| Derivative instruments | 281 | | | 303 | |
| Long-term lease liabilities | 627 | | | 548 | |
| Other non-current liabilities | 282 | | | 197 | |
| Total other liabilities | 8,671 | | | 7,543 | |
| Total Liabilities | 9,582 | | | 8,145 | |
| Redeemable noncontrolling interest in subsidiaries | 1 | | | 7 | |
| Commitments and Contingencies | | | |
| Members’ Equity | | | |
| Contributed capital | 1,299 | | | 1,308 | |
| Retained earnings | 1,027 | | | 1,240 | |
| Accumulated other comprehensive income | 15 | | | 21 | |
| Noncontrolling interest | 2,764 | | | 1,591 | |
| Total Members’ Equity | 5,105 | | | 4,160 | |
| Total Liabilities and Members’ Equity | $ | 14,688 | | | $ | 12,312 | |
See accompanying notes to consolidated financial statements.
CLEARWAY ENERGY LLC
CONSOLIDATED STATEMENTS OF CASH FLOWS | | | | | | | | | | | | | | | | | |
| Year ended December 31, |
| 2023 | | 2022 | | 2021 |
| Cash Flows from Operating Activities | (In millions) |
| Net income (loss) | $ | (13) | | | $ | 1,282 | | | $ | (63) | |
| Adjustments to reconcile net income (loss) to net cash provided by operating activities: | | | | | |
| Equity in earnings of unconsolidated affiliates | (12) | | | (29) | | | (32) | |
| Distributions from unconsolidated affiliates | 30 | | | 37 | | | 38 | |
| Depreciation, amortization and accretion | 526 | | | 512 | | | 509 | |
| Amortization of financing costs and debt discounts | 13 | | | 14 | | | 14 | |
| Amortization of intangibles | 185 | | | 172 | | | 146 | |
| Loss on debt extinguishment | 6 | | | 2 | | | 53 | |
| Reduction in carrying amount of right-of-use assets | 15 | | | 14 | | | 11 | |
| | | | | |
| Gain on sale of business | — | | | (1,292) | | | — | |
| Impairment losses | 12 | | | 16 | | | 6 | |
| Change in deferred income taxes | (2) | | | 2 | | | 2 | |
| Changes in derivative instruments and amortization of accumulated OCI/OCL | (2) | | | 69 | | | 28 | |
| | | | | |
| Cash (used in) provided by changes in other working capital | | | | | |
| Changes in prepaid and accrued liabilities for tolling agreements | (32) | | | 10 | | | 5 | |
| Changes in other working capital | 7 | | | (12) | | | (16) | |
| Net Cash Provided by Operating Activities | 733 | | | 797 | | | 701 | |
| Cash Flows from Investing Activities | | | | | |
| Acquisitions, net of cash acquired | — | | | — | | | (533) | |
| Acquisition of Drop Down Assets, net of cash acquired | (45) | | | (71) | | | (229) | |
| Acquisition of Capistrano Wind Portfolio, net of cash acquired | — | | | (223) | | | — | |
| Capital expenditures | (212) | | | (112) | | | (151) | |
| Payment for equipment deposit | (27) | | | — | | | — | |
| Payment for equipment deposit and asset purchase from affiliate | (55) | | | — | | | (21) | |
| | | | | |
| Return of investments from unconsolidated affiliates | 14 | | | 13 | | | 47 | |
| Increase in note receivable — affiliate | (174) | | | — | | | — | |
| Investments in unconsolidated affiliates | (28) | | | — | | | — | |
| | | | | |
| Proceeds from sale of business | — | | | 1,457 | | | — | |
| | | | | |
| | | | | |
| Other | 4 | | | 1 | | | 22 | |
| Net Cash (Used in) Provided by Investing Activities | (523) | | | 1,065 | | | (865) | |
| Cash Flows from Financing Activities | | | | | |
| Contributions from noncontrolling interests, net of distributions | 1,120 | | | 47 | | | 680 | |
| Contributions from CEG, net of distributions | (92) | | | 13 | | | 287 | |
| | | | | |
| Payments of distributions | (311) | | | (289) | | | (268) | |
| Distributions to CEG of escrowed amounts | — | | | (64) | | | — | |
| Tax-related distributions | (51) | | | (19) | | | — | |
| Buyout of noncontrolling interest and redeemable noncontrolling interest | (13) | | | — | | | — | |
| Proceeds from the revolving credit facility | — | | | 80 | | | 622 | |
| Payments for the revolving credit facility | — | | | (325) | | | (377) | |
| Proceeds from issuance of long-term debt — external | 563 | | | 244 | | | 1,728 | |
| Proceeds from issuance of long-term debt — affiliate | — | | | 4 | | | 2 | |
| Payments of debt issuance costs | (18) | | | (4) | | | (20) | |
| Payments for long-term debt — external | (1,349) | | | (1,198) | | | (2,292) | |
| Payments for long-term debt — affiliate | (1) | | | (3) | | | (2) | |
| Other | (3) | | | (6) | | | 7 | |
| Net Cash (Used in) Provided by Financing Activities | (155) | | | (1,520) | | | 367 | |
| Reclassification of Cash to Assets Held-for-Sale | — | | | — | | | (14) | |
| Net Increase in Cash, Cash Equivalents and Restricted Cash | 55 | | | 342 | | | 189 | |
| Cash, Cash Equivalents and Restricted Cash at Beginning of Period | 996 | | | 654 | | | 465 | |
| Cash, Cash Equivalents and Restricted Cash at End of Period | $ | 1,051 | | | $ | 996 | | | $ | 654 | |
| | | | | |
| Supplemental Disclosures: | | | | | |
| Interest paid, net of amount capitalized | $ | (304) | | | $ | (317) | | | $ | (337) | |
| Non-cash investing and financing activities: | | | | | |
| | | | | |
| Non-cash distributions to noncontrolling interests | (7) | | | — | | | — | |
| Non-cash (distributions to), contributions from CEG | — | | | (4) | | | 31 | |
| Non-cash contributions from Clearway, Inc. | 13 | | | — | | | — | |
See accompanying notes to consolidated financial statements.
CLEARWAY ENERGY LLC
CONSOLIDATED STATEMENTS OF MEMBERS’ EQUITY
| | | | | | | | | | | | | | | | | | | | | | | | | | | | | | | | |
| (In millions) | | Contributed Capital | | (Accumulated Deficit) Retained Earnings | | Accumulated
Other
Comprehensive
(Loss) Income | | Noncontrolling Interest | | Total
Members’ Equity |
| Balances at December 31, 2020 | | $ | 1,723 | | | $ | (50) | | | $ | (33) | | | $ | 972 | | | $ | 2,612 | |
| Net income (loss) | | — | | | 110 | | | — | | | (176) | | | (66) | |
| Unrealized gain on derivatives and changes in accumulated OCL | | — | | | — | | | 20 | | | 2 | | | 22 | |
| Contributions from CEG, net of distributions, non-cash | | 2 | | | — | | | — | | | 29 | | | 31 | |
| Contributions from CEG, net of distributions, cash | | 287 | | | — | | | — | | | 9 | | | 296 | |
| Contributions from noncontrolling interests, net of distributions, cash | | — | | | — | | | — | | | 676 | | | 676 | |
| Distributions paid to CEG on Class B and Class D unit holders | | (96) | | | (17) | | | — | | | — | | | (113) | |
| Distributions paid to Clearway, Inc. | | (155) | | | — | | | — | | | — | | | (155) | |
| Lighthouse Partnership Yield Protection Agreement Amendment | | 15 | | | — | | | — | | | — | | | 15 | |
| Agua Caliente Acquisition | | — | | | — | | | — | | | 273 | | | 273 | |
| Transfer of assets under common control | | (281) | | | — | | | — | | | (93) | | | (374) | |
| Balances at December 31, 2021 | | 1,495 | | | 43 | | | (13) | | | 1,692 | | | 3,217 | |
| Net income (loss) | | — | | | 1,388 | | | — | | | (117) | | | 1,271 | |
| Unrealized gain on derivatives and changes in accumulated OCL | | — | | | — | | | 27 | | | 6 | | | 33 | |
| (Distributions to) contributions from CEG, non-cash | | (18) | | | — | | | — | | | 14 | | | (4) | |
| Contributions from (distributions to) CEG, cash | | 48 | | | — | | | — | | | (32) | | | 16 | |
| Contributions from noncontrolling interests, cash | | — | | | — | | | — | | | 51 | | | 51 | |
| Transfer of assets under common control | | (84) | | | — | | | — | | | 26 | | | (58) | |
| Capistrano Wind Portfolio Acquisition | | 4 | | | — | | | 7 | | | — | | | 11 | |
| Kawailoa Sale to Clearway Renew | | (20) | | | — | | | — | | | (49) | | | (69) | |
| Tax-related distributions | | — | | | (19) | | | — | | | — | | | (19) | |
| Distributions paid to Clearway, Inc. | | (82) | | | (85) | | | — | | | — | | | (167) | |
| Distributions paid to CEG Class B and Class D unit holders | | (35) | | | (87) | | | — | | | — | | | (122) | |
| Balances at December 31, 2022 | | 1,308 | | | 1,240 | | | 21 | | | 1,591 | | | 4,160 | |
| Net income (loss) | | — | | | 149 | | | — | | | (179) | | | (30) | |
| Unrealized loss on derivatives and changes in accumulated OCI | | — | | | — | | | (6) | | | (1) | | | (7) | |
| | | | | | | | | | |
| Distributions to CEG, cash | | (78) | | | — | | | — | | | — | | | (78) | |
| Contributions from noncontrolling interests, net of distributions, cash | | — | | | — | | | — | | | 1,123 | | | 1,123 | |
| Distributions to noncontrolling interests, non-cash | | — | | | — | | | — | | | (7) | | | (7) | |
| Contributions from Clearway, Inc., non-cash | | 13 | | | — | | | — | | | — | | | 13 | |
| Tax-related distributions | | — | | | (51) | | | — | | | — | | | (51) | |
| Transfer of assets under common control | | 12 | | | — | | | — | | | 274 | | | 286 | |
| Buyout of noncontrolling interest | | 27 | | | — | | | — | | | (37) | | | (10) | |
| Buyout of redeemable noncontrolling interest | | 17 | | | — | | | — | | | — | | | 17 | |
| Distributions paid to Clearway, Inc. | | — | | | (180) | | | — | | | — | | | (180) | |
| Distributions paid to CEG Class B and Class D unit holders | | — | | | (131) | | | — | | | — | | | (131) | |
| | | | | | | | | | |
| Balances at December 31, 2023 | | $ | 1,299 | | | $ | 1,027 | | | $ | 15 | | | $ | 2,764 | | | $ | 5,105 | |
See accompanying notes to consolidated financial statements.
CLEARWAY ENERGY LLC
NOTES TO CONSOLIDATED FINANCIAL STATEMENTS
Note 1 — Nature of Business
NRG YieldClearway Energy LLC, together with its consolidated subsidiaries, or the Company, is an energy infrastructure investor with a focus on investments in clean energy and owner of modern, sustainable and long-term contracted assets across North America. The Company is sponsored by GIP and TotalEnergies through the primary vehicle throughportfolio company, Clearway Energy Group LLC, or CEG, which NRG owns, operatesis equally owned by GIP and acquires contractedTotalEnergies. GIP is an independent infrastructure fund manager that makes equity and debt investments in infrastructure assets and businesses. TotalEnergies is a global multi-energy company. CEG is a leading developer of renewable and conventional generation and thermalenergy infrastructure assets. NRG owns 100%in the U.S.
The Company is one of the Company's Class B unitslargest renewable energy owners in the U.S. with approximately 6,000 net MW of installed wind, solar and Class D unitsenergy storage projects. The Company’s approximately 8,500 net MW of assets also includes approximately 2,500 net MW of environmentally-sound, highly efficient natural gas-fired generation facilities. Through this environmentally-sound, diversified and receivesprimarily contracted portfolio, the Company endeavors to increase distributions throughto its ownership of these units. NRG Yield, Inc., or Yield, Inc., owns 100%unit holders. The majority of the Company's Class A units and Class C units. NRG Yield LLC, through its wholly owned subsidiary, NRG Yield Operating LLC, or Yield Operating LLC, holds a portfolio of renewable and conventional generation and thermal infrastructure assets, primarily located in the Northeast, Southwest, Midwest and California regions of the U.S.
Yield, Inc. closed its initial public offering of Class A common stock in July 2013, which was then followed by a Class A common stock offering in July 2014, a Recapitalization in May 2015, as described below, and a Class C common stock offering in June 2015.
Effective May 14, 2015, Yield, Inc. amended its certificate of incorporation to create two new classes of capital stock, Class C common stock and Class D common stock, and distributed shares of the Class C common stock and Class D common stock to holders of Yield, Inc.'s outstanding Class A common stock and Class B common stock, respectively, through a stock split. The stock split is referred to as the Recapitalization. The Company also amended its operating agreement to reflect the Recapitalization. Effective May 14, 2015, each Class A unit of the Company was automatically reclassified into one Class A unit and one Class C unit and each Class B unit of the Company was automatically reclassified into one Class B unit and one Class D unit.
The following table represents the structure of the Company as of December 31, 2017:
On July 12, 2017, NRG announced that it had adopted and initiated a three-year, three-part improvement plan, or the NRG Transformation Plan. As part of the NRG Transformation Plan, NRG announced that it is exploring strategic alternatives for its renewables platform and its interest in the Company. NRG, through its holdings of Class B common stock and Class D common stock, has a 55.1% voting interest in the Company and receives distributionsCompany’s revenues are derived from NRG Yield LLC through its ownership of Class B units and Class D units.
On February 6, 2018, Global Infrastructure Partners, or GIP, entered into a purchase and sale agreement with NRG, or the NRG Transaction, for the acquisition of NRG's full ownership interests in the Company and NRG's renewable development and operations platform. The NRG Transaction is subject to certain closing conditions, including customary legal and regulatory approvals. The Company expects the NRG Transaction to close in the second half of 2018. NRG is the Company's controlling stockholder and the Company has been highly dependent on NRG for, among other things, growth opportunities and management and administration services. See Part I, Item 1A, Risk Factors for risks related to the Strategic Sponsorship with GIP and the Company's relationship with NRG.
As of December 31, 2017, the Company's operating assets are comprised of the following projects:
|
| | | | | | | | | | |
| Projects | | Percentage Ownership | | Net Capacity (MW) (a) | | Offtake Counterparty | | Expiration |
| Conventional | | | | | | | | |
| El Segundo | | 100 | % | | 550 |
| | Southern California Edison | | 2023 |
| GenConn Devon | | 50 | % | | 95 |
| | Connecticut Light & Power | | 2040 |
| GenConn Middletown | | 50 | % | | 95 |
| | Connecticut Light & Power | | 2041 |
| Marsh Landing | | 100 | % | | 720 |
| | Pacific Gas and Electric | | 2023 |
| Walnut Creek | | 100 | % | | 485 |
| | Southern California Edison | | 2023 |
| | | | | 1,945 |
| | | | |
| Utility Scale Solar | | | | | | | | |
| Agua Caliente | | 16 | % | | 46 |
| | Pacific Gas and Electric | | 2039 |
| Alpine | | 100 | % | | 66 |
| | Pacific Gas and Electric | | 2033 |
| Avenal | | 50 | % | | 23 |
| | Pacific Gas and Electric | | 2031 |
| Avra Valley | | 100 | % | | 26 |
| | Tucson Electric Power | | 2032 |
| Blythe | | 100 | % | | 21 |
| | Southern California Edison | | 2029 |
| Borrego | | 100 | % | | 26 |
| | San Diego Gas and Electric | | 2038 |
| CVSR | | 100 | % | | 250 |
| | Pacific Gas and Electric | | 2038 |
| Desert Sunlight 250 | | 25 | % | | 63 |
| | Southern California Edison | | 2034 |
| Desert Sunlight 300 | | 25 | % | | 75 |
| | Pacific Gas and Electric | | 2039 |
| Kansas South | | 100 | % | | 20 |
| | Pacific Gas and Electric | | 2033 |
| Roadrunner | | 100 | % | | 20 |
| | El Paso Electric | | 2031 |
| TA High Desert | | 100 | % | | 20 |
| | Southern California Edison | | 2033 |
Utah Solar Portfolio(b)(e) | | 50 | % | | 265 |
| | PacifiCorp | | 2036 |
| | | | | 921 |
| | | | |
| Distributed Solar | | | | | | | | |
| Apple I LLC Projects | | 100 | % | | 9 |
| | Various | | 2032 |
| AZ DG Solar Projects | | 100 | % | | 5 |
| | Various | | 2025-2033 |
| SPP Projects | | 100 | % | | 25 |
| | Various | | 2026-2037 |
| Other DG Projects | | 100 | % | | 13 |
| | Various | | 2023-2039 |
| | | | | 52 |
| | | | |
| Wind | | | | | | | | |
| Alta I | | 100 | % | | 150 |
| | Southern California Edison | | 2035 |
| Alta II | | 100 | % | | 150 |
| | Southern California Edison | | 2035 |
| Alta III | | 100 | % | | 150 |
| | Southern California Edison | | 2035 |
| Alta IV | | 100 | % | | 102 |
| | Southern California Edison | | 2035 |
| Alta V | | 100 | % | | 168 |
| | Southern California Edison | | 2035 |
Alta X (b) | | 100 | % | | 137 |
| | Southern California Edison | | 2038 |
Alta XI (b) | | 100 | % | | 90 |
| | Southern California Edison | | 2038 |
| Buffalo Bear | | 100 | % | | 19 |
| | Western Farmers Electric Co-operative | | 2033 |
|
| | | | | | | | | | |
| Projects | | Percentage Ownership | | Net Capacity (MW) (a) | | Offtake Counterparty | | Expiration |
Crosswinds (b)(f) | | 99 | % | | 21 |
| | Corn Belt Power Cooperative | | 2027 |
Elbow Creek (b)(f) | | 100 | % | | 122 |
| | NRG Power Marketing LLC | | 2022 |
Elkhorn Ridge (b)(f) | | 66.7 | % | | 54 |
| | Nebraska Public Power District | | 2029 |
Forward (b)(f) | | 100 | % | | 29 |
| | Constellation NewEnergy, Inc. | | 2022 |
Goat Wind (b)(f) | | 100 | % | | 150 |
| | Dow Pipeline Company | | 2025 |
Hardin (b)(f) | | 99 | % | | 15 |
| | Interstate Power and Light Company | | 2027 |
| Laredo Ridge | | 100 | % | | 80 |
| | Nebraska Public Power District | | 2031 |
Lookout (b)(f) | | 100 | % | | 38 |
| | Southern Maryland Electric Cooperative | | 2030 |
Odin (b)(f) | | 99.9 | % | | 20 |
| | Missouri River Energy Services | | 2028 |
| Pinnacle | | 100 | % | | 55 |
| | Maryland Department of General Services and University System of Maryland | | 2031 |
San Juan Mesa (b)(f) | | 75 | % | | 90 |
| | Southwestern Public Service Company | | 2025 |
Sleeping Bear (b)(f) | | 100 | % | | 95 |
| | Public Service Company of Oklahoma | | 2032 |
| South Trent | | 100 | % | | 101 |
| | AEP Energy Partners | | 2029 |
Spanish Fork (b)(f) | | 100 | % | | 19 |
| | PacifiCorp | | 2028 |
Spring Canyon II (b) | | 90.1 | % | | 29 |
| | Platte River Power Authority | | 2039 |
Spring Canyon III (b) | | 90.1 | % | | 25 |
| | Platte River Power Authority | | 2039 |
| Taloga | | 100 | % | | 130 |
| | Oklahoma Gas & Electric | | 2031 |
Wildorado (b)(f) | | 100 | % | | 161 |
| | Southwestern Public Service Company | | 2027 |
| | | | | 2,200 |
| | | | |
| Thermal | | | | | | | | |
| NRG Energy Center Dover LLC | | 100 | % | | 103 |
| | NRG Power Marketing LLC | | 2018 |
| Thermal generation | | 100 | % | | 20 |
| | Various | | Various |
| | | | | 123 |
| | | | |
Total net generation capacity(c) | | | | 5,241 |
| | | | |
| | | | | | | | | |
Thermal equivalent MWt(d) | | 100 | % | | 1,319 |
| | Various | | Various |
(a) Net capacity represents the maximum, or rated, generating capacity of the facility multiplied by the Company's percentage ownership in the facility as of December 31, 2017.
(b) Projects are part of tax equity arrangements.
(c) The Company's total generation capacity is net of 6 MWs for noncontrolling interest for Spring Canyon II and III. The Company's generation capacity including this noncontrolling interest was 5,247.
(d)For thermal energy, net capacity represents MWt for steam or chilled water and excludes 134 MWt available under the right-to-use provisions contained in agreements between two of the Company's thermal facilities and certain of its customers.
(e) Represents interests in Four Brothers Solar, LLC, Granite Mountain Holdings, LLC, and Iron Springs Holdings, LLC, all acquired as part of the March 2017 Drop Down Assets acquisition (ownership percentage is based upon cash to be distributed).
(f) Projects are part of NRG Wind TE Holdco portfolio.
In addition to the facilities owned or leased in the table above, the Company entered into partnerships to own or purchase solar power generation projects, as well as other ancillary related assets from a related party via intermediate funds. The Company does not consolidate these partnerships and accounts for them as equity method investments. The Company's net interest in these projects is 247 MW based on cash to be distributed as of December 31, 2017. For further discussions, refer to Note 5, Investments Accounted for by the Equity Method and Variable Interest Entities to the Consolidated Financial Statements.
Substantially all of the Company's generation assets are under long-term contractual arrangements for the output or capacity from these assets. The thermal assets are comprised
Clearway Energy, Inc., or Clearway, Inc., consolidates the results of district energy systems and combined heat and power plants that produce steam, hot water and/or chilled water and, in some instances, electricity at a central plant. Certain district energy systems are subject to rate regulation by state public utility commissions (although they may negotiate certain rates) while the other district energy systems have rates determined by negotiated bilateral contracts.
As described in Note 13, Related Party Transactions to the Consolidated Financial Statements, the Company has a management services agreementthrough its controlling interest, with NRG for various services, including human resources, accounting, tax, legal, information systems, treasury,CEG’s interest shown as contributed capital in the Company’s consolidated financial statements. The holders of Clearway, Inc.’s outstanding shares of Class A and risk management.Class C common stock are entitled to dividends as declared. CEG receives its distributions from the Company through its ownership of the Company’s Class B and Class D units. From time to time, CEG may also hold shares of Clearway Inc’s Class A and/or Class C common stock.
During the years endingAs of December 31, 2017 and 20162023, Clearway, Inc. owned 57.90% of the economic interests of the Company, completed four acquisitions of Drop Down Assets from NRG. The accounting guidance requires retrospective combinationwith CEG owning 42.10% of the entities for all periods presented as if the combination has been in effect from the beginningeconomic interests of the financial statement period or from the date the entities were under common control (if later than the beginning of the financial statement period).Company. For further discussion, see Note 3, Business Acquisitions to11, Members’ Equity.
The diagram below represents a summarized structure of the Consolidated Financial Statements.Company as of December 31, 2023:
Note 2 — Summary of Significant Accounting Policies
Basis of Presentation and Principles of Consolidation
The Company'sCompany’s consolidated financial statements have been prepared in accordance with GAAP. The FASB ASC is the source of authoritative GAAP to be applied by nongovernmental entities. In addition, the rules and interpretative releases of the SEC under authority of federal securities laws are also sources of authoritative GAAP for SEC registrants.
The consolidated financial statements include the Company'sCompany’s accounts and operations and those of its subsidiaries in which it has a controlling financial interest. All significant intercompany transactions and balances have been eliminated in consolidation. The usual condition for a controlling financial interest is ownership of athe majority of the voting interests of an entity. However, a controlling financial interest may also exist through arrangements that do not involve controlling voting interests. As such, the Company applies the guidance of ASC 810, Consolidations, or ASC 810, to determine when an entity that is insufficiently capitalized or not controlled through its voting interests, referred to as a variable interest entity, or VIE, should be consolidated.
Cash, and Cash Equivalents and Restricted Cash
Cash and cash equivalents include highly liquid investments with an original maturity of three months or less at the time of purchase. Cash and cash equivalents held at project subsidiaries was $124$125 million and $111$121 million as of December 31, 20172023 and 2016,2022, respectively.
The following table provides a reconciliation of cash, cash equivalents and restricted cash reported within the consolidated balance sheets that sum to the total of the same such amounts shown in the consolidated statements of cash flows.flows:
| | | |
| | |
| | December 31, |
| | | Year Ended December 31, |
| | 2017 | | 2016 | | 2015 |
| | (In millions) | (In millions) |
| Cash and cash equivalents | $ | 146 |
| | $ | 321 |
| | $ | 110 |
|
| Restricted cash | 168 |
| | 176 |
| | 143 |
|
| Cash, cash equivalents and restricted cash shown in the statement of cash flows | 314 |
| | 497 |
| | 253 |
|
| Restricted cash | |
| Restricted cash | |
| Cash, cash equivalents and restricted cash shown in the consolidated statements of cash flows | |
| Cash, cash equivalents and restricted cash shown in the consolidated statements of cash flows | |
| Cash, cash equivalents and restricted cash shown in the consolidated statements of cash flows | |
Restricted cash consists primarily of funds held to satisfy the requirements of certain debt agreements and funds held within the Company'sCompany’s projects that are restricted in their use. Of these funds asAs of December 31, 2017, approximately $252023, these restricted funds were comprised of $176 million isdesignated to fund operating expenses, $178 million designated for current debt service payments $25 million is designated to fund operating expenses and $36 million is designated for distributions to the Company, with the remaining $82$85 million restricted for reserves including debt service, performance obligations and other reserves as well as capital expenditures. The remaining $77 million is held in distributions reserve accounts.
Supplemental Cash Flow Information
The following table provides a disaggregation of the amounts classified as Acquisition of Drop Down Assets, net of cash acquired, shown in the consolidated statements of cash flows:
| | | | | | | | | | | | | | | | | | | | |
| | Year ended December 31, |
| | 2023 | | 2022 | | 2021 |
| | (In millions) |
| Cash paid to acquire Drop Down Assets | | $ | (173) | | | $ | (71) | | | $ | (230) | |
| Cash acquired from the acquisition of Drop Down Assets | | 128 | | | — | | | 1 | |
| Acquisition of Drop Down Assets, net of cash acquired | | $ | (45) | | | $ | (71) | | | $ | (229) | |
Accounts Receivable — Trade Receivables and Allowance for Doubtful AccountsCredit Losses
Trade receivablesAccounts receivable — trade are reported on the consolidated balance sheet at the invoiced amount adjusted for any write-offs and the allowance for doubtful accounts.credit losses. The majority of the Company’s customers typically receive invoices monthly with payment due within 30 days. The allowance for doubtful accountscredit losses is reviewed periodically based on amounts past due and their significance. The allowance for doubtful accountscredit losses was immaterial as of December 31, 20172023 and 2016.2022.
Inventory
Inventory consists principally of spare parts and fuel oil. Spare parts inventory is valued at weighted average cost, unless evidence indicates that the weighted average cost will not be recovered with a normal profit in the ordinary course of business. Fuel oil inventoryInventory is valued at the lower of weighted average cost or market. The Company removes fuel inventories as they are used in the production of steam, chilled water or electricity. Spare parts inventory are removed when they are used for repairs, maintenance or capital projects.
Property, Plant and Equipment
Property, plant and equipment are stated at cost, or, in the case of third party business acquisitions, fair value; however impairment adjustments are recorded whenever events or changes in circumstances indicate that their carrying valuesamounts may not be recoverable. See Note 3, Business Acquisitions, for more information on acquired property, plant and equipment. Significant additions or improvements extending asset lives are capitalized as incurred, while repairs and maintenance that do not improve or extend the life of the respective asset are charged to expense as incurred. Depreciation is computed using the straight-line method over the estimated useful lives. Certain assets and their related accumulated depreciation amounts are adjusted for asset retirements and disposals with the resulting gain or loss included in cost of operations in the consolidated statements of operations.income. For further discussion of the Company'sCompany’s property, plant and equipment refer to Note 4, Property, Plant and Equipment.
Interest incurred on funds borrowed to finance capital projects is capitalized until the Consolidated Financial Statements.project under construction is ready for its intended use. The amount of interest capitalized for the years ended December 31, 2023, 2022 and 2021 was $36 million, $2 million and $3 million, respectively.
Construction in-progress represents cumulative construction costs, including the costs incurred for the purchase of major equipment and engineering costs and capitalized interest. Once the project achieves commercial operation, the Company reclassifies the amounts recorded in construction in progress to facilities and equipment.
Asset Impairments
Long-lived assets that are held and used are reviewed for impairment whenever events or changes in circumstances indicate their carrying valuesamounts may not be recoverable. Such reviews are performed in accordance with ASC 360.360, Property, Plant and Equipment. An impairment loss is indicated if the total future estimated undiscounted cash flows expected from an asset are less than its carrying value.amount. An impairment charge is measured byas the difference betweenexcess of an asset'sasset’s carrying amount andover its fair value with the difference recorded in operating costs and expenses in the consolidated statements of operations.income. Fair values are determined by a variety of valuation methods, including appraisals, sales prices of similar assets and present value techniques. For further discussion of the Company'sCompany’s long-lived asset impairments, refer to Note 9, Asset Impairmentsto the Consolidated Financial Statements..
Investments accounted for by the equity method are reviewed for impairment in accordance with ASC 323, Investments-Equity Method and Joint Ventures, which requires that a loss in value of an investment that is an other-than-temporary decline should be recognized. The Company identifies and measures losses in the value of equity method investments based upon a comparison of fair value to carrying value.
Debt Issuance Costs
Debt issuance costs are capitalized and amortized as interest expense on a basis which approximates the effective interest method over the term of the related debt. Debt issuance costs related to the long termlong-term debt are presented as a direct deduction from the carrying amount of the related debt in both the current and prior periods.debt. Debt issuance costs related to the senior secured revolving credit facility line of credit are recorded as a non-current asset on the consolidated balance sheet and are amortized over the term of the credit facility.
Intangible Assets
Intangible assets represent contractual rights held by the Company. The Company recognizes specifically identifiable intangible assets including power purchase agreements, leasehold improvements, customer relationships, customer contracts,rights, emission allowances, RECs and development rights when specific rights and contracts are acquired. These intangible assets are amortized primarily on a straight-line basis. For further discussion of the Company'sCompany’s intangible assets, refer to Note 8, Intangible Assets to the Consolidated Financial Statements.
Notes Receivable
Notes receivable consist of receivables related to the financing of required network upgrades. The notes issued with respect to network upgrades will be repaid within a 5-year period following the date each facility reached commercial operations.Assets.
Income Taxes
The Company is classified as a partnership for federal and state income tax purposes. Therefore, federal and most state income taxes are assessed at the partner level. Accordingly, no provision has been made for federalThe franchise tax imposed by the state of Texas, however, is being assessed at the level of certain project subsidiaries of the Company, and therefore reflected as an income tax expense or state income taxes inbenefit of the accompanying financial statements.Company.
For the year ended December 31, 2023, the Company recorded a deferred tax benefit of $2 million and associated deferred tax liability of $2 million with respect to future years. For the year ended December 31, 2022, the Company recorded a deferred tax expense of $2 million and associated deferred tax liability of $4 million with respect to future years.
Revenue Recognition
Revenue from Contracts with Customers
The Company applies the guidance in ASC 606, Revenue from Contracts with Customers, orTopic 606, when recognizing revenue associated with its contracts with customers. The Company’s policies with respect to its various revenue streams are detailed below. In general, the Company applies the invoicing practical expedient to recognize revenue for the revenue streams detailed below, except in circumstances where the invoiced amount does not represent the value transferred to the customer.
Conventional Generation Revenues
The majority of the conventional energy plants commenced merchant operations during 2023 following the expiration of the PPAs. These facilities generate revenues from selling electricity and/or RA to the California Independent System Operator and to public utility and load serving entities, as the power is delivered at the interconnection point.
Thermal Revenues
SteamOn May 1, 2022, the Company completed the sale of 100% of its interests in the Thermal Business to KKR. For further details of the Thermal Disposition refer to Note 3, Acquisitions and Dispositions.
Prior to the Thermal Disposition, steam and chilled water revenue iswas recognized as the Company transferred the product to the customer, based on customer usage as determined by meter readings taken at month-end. Some locations read customer meters throughout the month and recognizerecognized estimated revenue for the period between meter read date and month-end. For thermal contracts, the Company’s performance obligation to deliver steam and chilled water was satisfied over time and revenue was recognized based on the invoiced amount. The Thermal Business subsidiaries collectcollected and remitremitted state and local taxes associated with sales to their customers, as required by governmental authorities. These taxes arewere presented on a net basis in the income statement.
consolidated statements of income.
Power Purchase Agreements, or PPAs
The majority of the Company’s revenues are obtained through PPAs or othersimilar contractual agreements. Energy, capacity and, where applicable, renewable attributes, from the majority of the Company’s renewable energy assets and certain conventional energy plants is sold through long-term PPAs and tolling agreements to a single counterparty, which is often a utility or commercial customer. Certain revenue agreements also provide for the sale of BESS capacity. As discussed above, the majority of the conventional energy plants commenced merchant operations during 2023 following the expiration of the PPAs. The majority of these PPAs are accounted for as operating leases underas the Company retained its historical lease assessments and classification upon adoption of ASC 840.842, Leases. ASC 840842 requires the minimum lease payments received to be amortized over the term of the lease and contingent rentals are recorded when the achievement of the contingency becomes probable. The Company’s BESS arrangements include variable payments not based on an index or rate and sales-type lease treatment would result in a loss at lease commencement. As a result, the Company accounts for these arrangements as operating leases under ASC 842. Judgment is required by management in determining the economic life of each generating facility, in evaluating whether certain lease provisions constitute minimum payments or represent contingent rent and other factors in determining whether a contract contains a lease and whether the lease is an operating lease or capitalfinance lease.
Certain of these leasesPPAs have no minimum lease payments and all of the rental incomelease revenue under these leasesPPAs is recorded as contingent rent on an actual basis when the electricity is delivered. The contingent rental incomelease revenue recognized in the years ended December 31, 2017, 20162023, 2022 and 20152021 was $559$780 million, $583$850 million and $443$741 million, respectively. These balances include intercompanySee Note 15, Leases, for additional information related to the Company’s PPAs accounted for as leases.
Renewable Energy Credits, or RECs
Renewable energy credits, or RECs, are usually sold through long-term PPAs or through REC contracts with counterparties. Revenue from the sale of self-generated RECs is recognized when the related energy is generated and simultaneously delivered even in cases where there is a certification lag as it has been deemed to be perfunctory.
In a bundled contract to sell energy, capacity and/or self-generated RECs, all performance obligations are deemed to be delivered at the same time and hence, timing of recognition of revenue for Elbow Creekall performance obligations is the same and occurs over time. In such cases, it is often unnecessary to allocate transaction price to multiple performance obligations.
Disaggregated Revenues
The following tables represent the Company’s disaggregation of $8 millionrevenue from contracts with customers, along with the reportable segment for each category:
| | | | | | | | | | | | | | | | | | | | |
| Year ended December 31, 2023 |
| (In millions) | Conventional Generation | | Renewables | | | | | Total |
Energy revenue (a) | $ | 81 | | | $ | 942 | | | | | | $ | 1,023 | |
Capacity revenue (a) | 336 | | | 23 | | | | | | 359 | |
Other revenue (a) | 28 | | | 71 | | | | | | 99 | |
| Contract amortization | (20) | | | (166) | | | | | | (186) | |
| Mark-to-market for economic hedges | (5) | | | 24 | | | | | | 19 | |
| Total operating revenues | 420 | | | 894 | | | | | | 1,314 | |
| Less: Contract amortization | 20 | | | 166 | | | | | | 186 | |
| Less: Mark-to-market for economic hedges | 5 | | | (24) | | | | | | (19) | |
| Less: Lease revenue | (274) | | | (780) | | | | | | (1,054) | |
| | | | | | | | |
| Total revenue from contracts with customers | $ | 171 | | | $ | 256 | | | | | | $ | 427 | |
| | | | | | | | |
(a) See Note 15, Leases, for the amounts of energy, capacity and other revenue that relate to leases and are accounted for under ASC 842.
| | | | | | | | | | | | | | | | | | | | | | | | |
| Year ended December 31, 2022 |
| (In millions) | Conventional Generation | | Renewables | | Thermal | | | Total |
Energy revenue (a) | $ | 6 | | | $ | 956 | | | $ | 48 | | | | $ | 1,010 | |
Capacity revenue (a) | 435 | | | 2 | | | 18 | | | | 455 | |
| Other revenue | — | | | 71 | | | 11 | | | | 82 | |
| Contract amortization | (24) | | | (151) | | | — | | | | (175) | |
| Mark-to-market for economic hedges | — | | | (182) | | | — | | | | (182) | |
| Total operating revenues | 417 | | | 696 | | | 77 | | | | 1,190 | |
| Less: Contract amortization | 24 | | | 151 | | | — | | | | 175 | |
| Less: Mark-to-market for economic hedges | — | | | 182 | | | — | | | | 182 | |
| Less: Lease revenue | (441) | | | (809) | | | (1) | | | | (1,251) | |
| Total revenue from contracts with customers | $ | — | | | $ | 220 | | | $ | 76 | | | | $ | 296 | |
(a) See Note 15, Leases, for the years ended December 31, 2017amounts of energy and 2016, as further discussedcapacity revenue that relate to leases and are accounted for under ASC 842.
| | | | | | | | | | | | | | | | | | | | | | | | | |
| Year ended December 31, 2021 | |
| (In millions) | Conventional Generation | | Renewables | | Thermal | | | Total | |
Energy revenue (a) | $ | 9 | | | $ | 784 | | | $ | 122 | | | | $ | 915 | | |
Capacity revenue (a) | 455 | | | 2 | | | 53 | | | | 510 | | |
| Other revenue | — | | | 60 | | | 32 | | | | 92 | | |
| Contract amortization | (23) | | | (118) | | | (3) | | | | (144) | | |
| Mark-to-market for economic hedges | — | | | (87) | | | — | | | | (87) | | |
| Total operating revenues | 441 | | | 641 | | | 204 | | | | 1,286 | | |
| Less: Contract amortization | 23 | | | 118 | | | 3 | | | | 144 | |
| Less: Mark-to-market for economic hedges | — | | | 87 | | | — | | | | 87 | |
| Less: Lease revenue | (464) | | | (716) | | | (2) | | | | (1,182) | | |
| Total revenue from contracts with customers | $ | — | | | $ | 130 | | | $ | 205 | | | | $ | 335 | | |
(a) See Note 15, Leases, for the amounts of energy and capacity revenue that relate to leases and are accounted for under ASC 842.
Contract Amortization
Assets and liabilities recognized from power sales agreements assumed through acquisitions relating to the sale of electric capacity and energy in Note 13 Related Party Transactions.future periods arising from differences in contract and market prices are amortized to revenue over the term of each underlying contract based on actual generation and/or contracted volumes or on a straight-line basis, where applicable.
Contract Balances
The following table reflects the contract assets and liabilities included on the Company’s consolidated balance sheets: | | | | | | | | | | | | | | |
| (In millions) | | December 31, 2023 | | December 31, 2022 |
| Accounts receivable, net - Contracts with customers | | $ | 66 | | | $ | 37 | |
| Accounts receivable, net - Leases | | 105 | | | 116 | |
| Total accounts receivable, net | | $ | 171 | | | $ | 153 | |
Derivative Financial Instruments
The Company accounts for derivative financial instruments under ASC 815, Derivatives and Hedging, or ASC 815, which requires the Company to record all derivatives on the balance sheet at fair value unless they qualify for a NPNS exception. Changes in the fair value of non-hedge derivatives are immediately recognized in earnings. Changes in the fair value of derivatives accounted for as hedges, if elected for hedge accounting, are either:
Recognized in earnings as an offset to the changes in the fair value of the related hedged assets, liabilities and firm commitments; or
Deferreddeferred and recorded as a component of accumulated OCI until the hedged transactions occur and are recognized in earnings.
The Company'sCompany’s primary derivative financial instruments are power purchase or sale contracts used to mitigate variability in earnings due to fluctuations in market prices, fuels purchase contracts used to control customer reimbursable fuel cost, and interest rate instruments used to mitigate variability in earnings due to fluctuations in interest rates.rates and energy-related instruments used to mitigate variability in earnings due to fluctuations in power market prices or natural gas market prices for conventional facilities. Certain derivative contracts contain provisions providing the counterparties a lien on specific assets as collateral. On an ongoing basis, the Company qualitatively assesses the effectiveness of allits derivatives that are designated as hedges for accounting purposes in order to determine that each derivative continues to be highly effective in offsetting changes in fair values or cash flows of hedged items. Internal analyses thatIf necessary, the Company will perform an analysis to measure the statistical correlation between the derivative and the associated hedged item to determine the effectiveness of such a contract designated as a hedge. IfThe Company will discontinue hedge accounting if it is determined that the derivative instrumenthedge is not highly effective as a hedge, hedge accounting will be discontinued prospectively.no longer effective. In this case, the gain or loss previously deferred in accumulated OCI would be frozen until the underlying hedged item is delivered unless the transaction being hedged is no longer probable of occurring in which case the amount in accumulated OCI would be immediately reclassified into earnings. If the derivative financial instrument is terminated, the effective portion of this derivative deferred in accumulated OCI will be frozen until the underlying hedged item is delivered.
Revenues and expenses on contracts that qualify for the NPNS exception are recognized when the underlying physical transaction is delivered. While these contracts are considered derivative financial instruments under ASC 815, they are not recorded at fair value, but on an accrual basis of accounting. If it is determined that a transaction designated as NPNS no longer meets the scope exception, the fair value of the related contract is recorded on the balance sheet and immediately recognized through earnings.
Cash flows from derivative financial instruments, including derivatives designated as cash flow hedges and derivatives not designated as cash flow hedges, are classified as operating activities in the consolidated statements of cash flows.
Concentrations of Credit Risk
Financial instruments which potentially subject the Company to concentrations of credit risk consist primarily of accounts receivable notes receivable— trade and derivative financial instruments, which are concentrated within entities engaged in the energy and financial industry.industries. These industry concentrations may impact the overall exposure to credit risk, either positively or negatively, in that the customers may be similarly affected by changes in economic, industry or other conditions. In addition, many of the Company'sCompany’s projects have only one customer. However,See Item 1A, Risk Factors, Risks Related to the Company believes thatCompany’s Business, for a discussion on the credit risk posed by industry concentration is offset by the diversification and creditworthiness of its customer base.Company’s dependence on major customers. See Note 6, Fair Value of Financial Instruments, for a further discussion of derivative concentrations and Note 12, Segment Reporting, for concentration of counterparties.
Fair Value of Financial Instruments
The carrying amount of cash and cash equivalents, restricted cash, accounts receivable accounts— trade, note receivable -— affiliate, accounts payable current portion of— trade, account payable - affiliate,— affiliates and accrued expenses and other current liabilities approximate fair value because of the short-term maturity of these instruments. See Note 6, Fair Value of Financial Instruments, for a further discussion of fair value of financial instruments.
Asset Retirement Obligations
Asset retirement obligations, or AROs, are accounted for in accordance with ASC 410-20, Asset Retirement Obligations, or ASC 410-20. Retirement obligations associated with long-lived assets included within the scope of ASC 410-20 are those for which a legal obligation exists under enacted laws, statutes, and written or oral contracts, including obligations arising under the doctrine of promissory estoppel, and for which the timing and/or method of settlement may be conditional on a future event. ASC 410-20 requires an entity to recognize the fair value of a liability for an ARO in the period in which it is incurred and a reasonable estimate of fair value can be made.
Upon initial recognition of a liability for an ARO, other than when an ARO is assumed in an acquisition of the related long-lived asset, the asset retirement cost is capitalized by increasing the carrying amount of the related long-lived asset by the same amount. Over time, the liability is accreted to its future value, while the capitalized cost is depreciated over the useful life of the related asset. The Company'sCompany’s AROs are primarily related to the future dismantlement of equipment on leased property and environmental obligations related to site closures and fuel storage facilities. The Company records AROs as part of other non-current liabilities on its consolidated balance sheet.
The following table represents the balance of ARO obligations, as of December 31, 2017 and 2016, along with the additions and accretion related to the Company's ARO obligations for the year ended December 31, 2017:activity:
|
| | | |
| | (In millions) |
| Balance as of December 31, 2016 | $ | 49 |
|
| Revisions in estimates for current obligations/Additions | 2 |
|
| Accretion — expense | 4 |
|
| Balance as of December 31, 2017 | $ | 55 |
|
| | | | | |
| (In millions) | |
| Balance as of December 31, 2022 | $ | 157 | |
| Revisions in estimated cash flows | 3 | |
| Liabilities incurred | 67 | |
| |
| Accretion expense | 12 | |
| Balance as of December 31, 2023 | $ | 239 | |
Guarantees
The Company enters into various contracts that include indemnification and guarantee provisions as a routine part of its business activities. Examples of these contracts include operation and maintenance agreements, service agreements, commercial sales arrangements and other types of contractual agreements with vendors and other third parties as well as affiliates. These contracts generally indemnify the counterparty for tax, environmental liability, litigation and other matters as well as breaches of representations, warranties and covenants set forth in these agreements. Because many of the guarantees and indemnities the Company issues to third parties and affiliates do not limit the amount or duration of its obligations to perform under them, there exists a risk that the Company may have obligations in excess of the amounts agreed upon in the contracts mentioned above. For those guarantees and indemnities that do not limit the liability exposure, the Company may not be able to estimate what the liability would be, until a claim is made for payment or performance, due to the contingent nature of these contracts.
Investments Accounted for by the Equity Method
The Company has investments in various energy projects accounted for by the equity method, several of which are VIEs, where the Company is not a primary beneficiary, as described in Note 5, Investments Accounted for by the Equity Method and Variable Interest Entities. The equity method of accounting is applied to these investments in affiliates because the ownership structure prevents the Company from exercising a controlling influence over the operating and financial policies of the projects. Under this method, equity in pre-tax income or losses of the investments is reflected as equity in earnings of unconsolidated affiliates. Distributions from equity method investments that represent earnings on the Company'sCompany’s investment are included within cash flows from operating activities and distributions from equity method investments that represent a return of the Company'sCompany’s investment are included within cash flows from investing activities.
Sale LeasebackSale-Leaseback Arrangements
The Company is party to sale-leaseback arrangements that provide for the sale of certain assets to a third partythird-party and simultaneous leaseback to the Company. In accordance with ASC 840-40, Sale-Leaseback Transactions, if the seller-lessee retains, through the leaseback, substantially all of the benefits and risks incident to the ownership of the property sold, the sale-leaseback transaction is accounted for as a financing arrangement. An example of this type of continuing involvement would include an option to repurchase the assets or the buyer-lessor having the option to sell the assets back to the Company. This provision is included in most of the Company’s sale-leaseback arrangements. As such, the Company accounts for these arrangements as financings.
Under the financing method, the Company does not recognize as income any of the sale proceeds received from the lessor that contractually constitutes payment to acquire the assets subject to these arrangements. Instead, the sale proceeds received are accounted for as financing obligations and leaseback payments made by the Company are allocated between interest expense and a reduction to the financing obligation. Interest on the financing obligation is calculated using the Company’s incremental borrowing rate at the inception of the arrangement on the outstanding financing obligation. Judgment is required to determine the appropriate borrowing rate for the arrangement and in determining any gain or loss on the transaction that would be recorded either at the end of or over the lease term.
Asset Acquisitions
The Company accounts for its business combinationsacquisitions in accordance with ASC 805, Business Combinations, or ASC 805. For third partythird-party acquisitions, ASC 805 requires an acquirer to recognize and measure in its financial statements the identifiable assets acquired, the liabilities assumed and any noncontrolling interest in the acquiree at fair value at the acquisition date. It also recognizesNo goodwill is recognized, and measuresexcess purchase price or negative goodwill are allocated to the goodwill acquired orassets on a gain from a bargain purchase in the business combination and determines what information to disclose to enable users of an entity's financial statements to evaluate the nature and financial effects of the business combination. In addition, transaction costs are expensed as incurred.relative fair value basis. For acquisitions that relate to entities under common control, ASC 805 requires retrospective combination of the entities for all periods presented as if the combination has been in effect from the beginning of the financial statement period of from the date the entities were under common control (if later than the beginning of the financial statement period). The difference between the cash paid and historical value of the entities'entities’ equity is recorded as a distribution/contribution from/to NRGCEG with the offset to CEG’s contributed capital. Transaction costscapital balance.
Tax Equity Arrangements
Certain portions of the Company’s redeemable noncontrolling interest in subsidiaries and noncontrolling interest represent third-party interests in the net assets under certain tax equity arrangements, which are expensedconsolidated by the Company, that have been entered into to finance the cost of solar and wind facilities eligible for certain tax credits. The Company has determined that the provisions in the contractual agreements of these structures represent substantive profit sharing arrangements. Further, the Company has determined that the appropriate methodology for calculating the redeemable noncontrolling interest and noncontrolling interest that reflects the substantive profit sharing arrangements is a balance sheet approach utilizing the hypothetical liquidation at book value, or HLBV, method. Under the HLBV method, the amounts reported as incurred.redeemable noncontrolling interest and noncontrolling interest represent the amounts the investors to the tax equity arrangements would hypothetically receive at each balance sheet date under the liquidation provisions of the contractual agreements, assuming the net assets of the funding structures were liquidated at their recorded amounts determined in accordance with GAAP. The investors’ interests in the results of operations of the funding structures are determined as the difference in redeemable noncontrolling interest and noncontrolling interest at the start and end of each reporting period, after taking into account any capital transactions between the structures and the funds’ investors. The calculations utilized to apply the HLBV method include estimated calculations of taxable income or losses for each reporting period. In addition, in certain circumstances, the Company and its partners in the tax equity arrangements agree that certain tax benefits are to be utilized outside of the tax equity arrangements, which may result in differences in the amount an investor would hypothetically receive at the initial balance sheet date calculated strictly in accordance with related contractual agreements. These differences are recognized in the consolidated statements of income using a systematic and rational method over the period during which the investor is expected to achieve its target return.
Redeemable Noncontrolling Interest
To the extent that a third party has the right to redeem their interests for cash or other assets, the Company has included the noncontrolling interest attributable to the third party as a component of temporary equity in the mezzanine section of the consolidated balance sheet. During the fourth quarter of 2023, the Company repurchased a partner’s equity interest, as further described in Note 5, Investments Accounted for by the Equity Method and Variable Interest Entities. The following table reflects the changes in the Company’s redeemable noncontrolling interest balance:
| | | | | | | | |
| | (In millions) |
| Balance at December 31, 2021 | | $ | — | |
| Cash distributions to redeemable noncontrolling interests | | (4) | |
| Comprehensive income attributable to redeemable noncontrolling interests | | 11 | |
| Balance at December 31, 2022 | | 7 | |
| Cash distributions to redeemable noncontrolling interests | | (3) | |
| Comprehensive income attributable to redeemable noncontrolling interests | | 17 | |
| Repurchase of redeemable noncontrolling interest | | (20) | |
| Balance at December 31, 2023 | | $ | 1 | |
Use of Estimates
The preparation of consolidated financial statements in accordance with GAAP requires management to make estimates and assumptions. These estimates and assumptions impact the reported amounts of assets and liabilities and disclosures of contingent assets and liabilities as of the date of the consolidated financial statements. They also impact the reported amounts of net earnings during the reporting periods. Actual results could be different from these estimates.
In recording transactions and balances resulting from business operations, the Company uses estimates based on the best information available. Estimates are used for such items as plant depreciable lives, uncollectible accounts, environmental liabilities,AROs, acquisition accounting, fair value of financial instruments and legal costs incurred in connection with recorded loss contingencies, among others. In addition, estimates are used to test long-lived assets for impairment and to determine the fair value of impaired assets. As better information becomes available or actual amounts are determinable, the recorded estimates are revised. Consequently, operating results can be affected by revisions to prior accounting estimates.
Tax Equity Arrangements
Certain portions of the Company’s noncontrolling interests in subsidiaries represent third-party interests in the net assets under certain tax equity arrangements, which are consolidated by the Company, that have been entered into to finance the cost of wind facilities eligible for certain tax credits. Additionally, certain portions of the Company’s investments in unconsolidated affiliates reflect the Company’s interests in tax equity arrangements, that are not consolidated by the Company, that have been entered into to finance the cost of distributed solar energy systems under operating leases or PPAs eligible for certain tax credits. The Company has determined that the provisions in the contractual agreements of these structures represent substantive profit sharing arrangements. Further, the Company has determined that the appropriate methodology for calculating the noncontrolling interest and investment in unconsolidated affiliates that reflects the substantive profit sharing arrangements is a balance sheet approach utilizing the hypothetical liquidation at book value, or HLBV, method. Under the HLBV method, the amounts reported as noncontrolling interests and investment in unconsolidated affiliates represent the amounts the investors to the tax equity arrangements would hypothetically receive at each balance sheet date under the liquidation provisions of the contractual agreements, assuming the net assets of the funding structures were liquidated at their recorded amounts determined in accordance with GAAP. The investors’ interests in the results of operations of the funding structures are determined as the difference in noncontrolling interests and investment in unconsolidated affiliates at the start and end of each reporting period, after taking into account any capital transactions between the structures and the funds’ investors. The calculations utilized to apply the HLBV method include estimated calculations of taxable income or losses for each reporting period.
ReclassificationsReclassification
Certain prior year amounts have been reclassified for comparative purposes.
RecentRecently Adopted Accounting Developments - Adopted in 2017Standards
ASU 2017-12 — In August 2017,March 2020, the FASB issued ASU No. 2017-12, Derivatives2020-4, Facilitation of the Effects of Reference Rate Reform on Financial Reporting. The amendments provide for optional expedients and Hedging (Topic 815), Targeted Improvementsexceptions for applying GAAP to Accountingcontracts, hedging relationships and other transactions affected by reference rate reform if certain criteria are met. These amendments apply only to contracts that reference LIBOR or another reference rate expected to be discontinued because of reference rate reform, which affects certain of the Company’s debt and interest rate swap agreements. The guidance is effective for Hedging Activities, orall entities as of March 12, 2020 through December 31, 2022. In December 2022, the FASB issued ASU No. 2017-12. ASU No. 2017-12 amends ASU No. 2016-15. The amendments2022-6, Deferral of ASU No. 2016-15the Sunset Date of Reference Rate Reform, to extend the end of the transition period to December 31, 2024. As of December 31, 2023, all of the applicable contracts that previously used LIBOR as a reference rate were issuedamended and the Company elected to simplifyapply the application of hedge accounting guidance and more closely aligning financial reporting for hedging relationships with economic results of an entity's risk management activities. The issues addressed by ASU No. 2017-12 include but are not limitedpractical expedient to alignment of risk management activities and financial reporting, risk component hedging, accounting for the hedged item in fair value hedges ofcertain modified cash flow interest rate risk, recognitionswap and presentation of the effects of hedging instruments, amounts excluded from the assessment of hedge effectiveness, and other simplifications of hedge accounting guidance.debt agreements. The amendments of ASU No. 2017-12 are effective for fiscal years beginning after December 15, 2018, and interim periods therein. Early adoption is permitted in any interim period and the effect of the adoption should be reflected as of the beginning of the fiscal year of adoption. The Company early adopted ASU No. 2017-12 during the fourth quarter 2017. The adoption of ASU No. 2017-12 did not have a material impact on our consolidated results of operations, cash flows, and statement ofthe Company’s financial position.statements.
ASU 2016-18 — Recent Accounting Standards Not Yet Adopted
In November 2016,2023, the FASB issued ASU No. 2016-18, Statement2023-7, Segment Reporting (Topic 280): Improvements to Reportable Segment Disclosures. The amendment improves reportable segment disclosure requirements, primarily through enhanced disclosures about significant segment expense categories and details regarding information utilized to assess segment performance. Additionally, the amendment increases the frequency of Cash Flows (Topic 230), Restricted Cash, or ASU No. 2016-18. The amendments of ASU No. 2016-18 require an entitydisclosures by requiring Topic 280 to include amounts generally described as restricted cashbe applied to interim financial statements. This guidance will be applied retrospectively and restricted cash equivalents with cash and cash equivalents when reconciling the beginning of period and end of period total amounts on the statement of cash flows. The amendments of ASU No. 2016-18 areis effective for annual reporting periods in fiscal years beginning after December 15, 2017,2023, and interim reporting periods within those annual periods. Early adoption is permitted and the adoption of ASU No. 2016-18 will be applied retrospectively. The Company early adopted ASU No. 2016-18 during the second quarter of 2017. Net cash flows used in investing activities for the year endedfiscal years beginning after December 31, 2016 decreased by $33 million. The sum of Company's cash and cash equivalents and restricted cash reported within the consolidated balance sheet as2024. As of December 31, 2016 equals2023, the beginning balances of cash, cash equivalents and restricted cash shown in the consolidated statement of cash flows for the year ended December 31, 2017. The sum of Company's cash and cash equivalents and restricted cash reported within the consolidated balance sheet as of December 31, 2017 equalsCompany has not elected to the ending balances of cash, cash equivalents and restricted cash shown in the consolidated statement of cash flows for the year ended December 31, 2017.
Recent Accounting Developments - Not Yet Adopted
ASU 2016-02 — In February 2016, the FASB issued ASU No. 2016-02, Leases (Topic 842), or Topic 842, with the objective to increase transparency and comparability among organizations by recognizing lease assets and lease liabilities on the balance sheet and to improve financial reporting by expanding the related disclosures. The guidance in Topic 842 provides that a lessee that may have previously accounted for a lease as an operating lease under current GAAP should recognize the assets and liabilities that arise from a lease on the balance sheet. In addition, Topic 842 expands the required quantitative and qualitative disclosures with regards to lease arrangements. The Company willearly adopt the standard effective January 1, 2019 and expects to elect certain of the practical expedients permitted, including the expedient that permits the Company to retain its existing lease assessment and classification. The Company is currently working through an adoption plan and evaluating the anticipated impact on the Company's resultseffect of operations, cash flows and financial position. While the Company is currently evaluating the impact the new guidance will have on its financial position and results of operations, the Company expects to recognize lease liabilities and right of use assets. The extent of the increase to assets and liabilities associated with these amounts remains to be determined pending the Company’s review of its existing lease contracts and service contracts which may contain embedded leases. While this review is still in process, the Company believes the adoption of Topic 842 may be material to itsconsolidated financial statements. The Company is continuing to monitor potential changes to Topic 842 that have been proposed by the FASB and will assess any necessary changes to the implementation as the guidance is updated.
ASU 2014-09 — In May 2014, the FASB issued ASU No. 2014-09, Revenue from Contracts with Customers (Topic 606), or Topic 606, which was further amended through various updates issued by the FASB thereafter. The amendments of ASU No. 2014-09 completed the joint effort between the FASB and the IASB, to develop a common revenue standard for GAAP and IFRS, and to improve financial reporting. The guidance under Topic 606 provides that an entity should recognize revenue to depict the transfer of goods or services to customers in an amount that reflects the consideration to which the entity expects to be entitled to in exchange for the goods or services provided and establishes a five step model to be applied by an entity in evaluating its contracts with customers. The Company has elected the practical expedient available under Topic 606 for measuring progress toward complete satisfaction of a performance obligation and for disclosure requirements of remaining performance obligations. The practical expedient allows an entity to recognize revenue in the amount to which the entity has the right to invoice such that the entity has a right to the consideration in an amount that corresponds directly with the value to the customer for performance completed to date by the entity. The majority of the Company's revenues are obtained through PPAs, which are currently accounted for as operating leases. In connection with the implementation of Topic 842, as described above, the Company expects to elect certain of the practical expedients permitted, including the expedient that permits the Company to retain its existing lease assessment and classification. The Company adopted the standard effective January 1, 2018 under the modified retrospective transition method. As leases are excluded from the scope of Topic 606, the adoption of Topic 606 at the date of initial application will not have a material impact on the Company's financial statements. The adoption of Topic 606 also includes additional disclosure requirements beginning in the first quarter of 2018. As a significant portion of the Company's revenue is generated through operating leases, the majority of the new required disclosures will not be relevant or material to the Company.
Note 3 — Business Acquisitions and Dispositions
2017 Acquisitions
November 2017As further described in Note 2, Summary of Significant Accounting Policies, the Company records the assets acquired and liabilities assumed at acquisition-date fair value, except in the case of acquisitions under common control by CEG, for which assets acquired and liabilities assumed are recorded at historical cost on the acquisition date, which in certain circumstances represent the acquired cost.
Texas Solar Nova 1 Drop Down Assets — On November 1, 2017,December 28, 2023, the Company, through its indirect subsidiary, Lighthouse Renewable Holdco 2 LLC, acquired TSN1 BL Borrower Holdco LLC, the indirect owner of Texas Solar Nova 1, a 38252 MW solar portfolio primarily comprised of assetsproject that is located in Kent County, Texas, from NRG's Solar Power Partners (SPP) funds and other projects developed by NRG,Clearway Renew for cash consideration of $74$23 million. Lighthouse Renewable Holdco 2 LLC is a partnership between the Company and a cash equity investor. The cash equity investor also contributed cash consideration of $109 million including working capital adjustmentsto acquire their portion of $3 million, plus assumed non-recourse debt of $26 million.
the acquired entity. TSN1 BL Borrower Holdco LLC consolidates as primary beneficiary, TSN1 TE Holdco LLC, a tax equity fund that owns the Texas Solar Nova 1 solar project, as further described in Note 5, Investments Accounted for by the Equity Method and Variable Interest Entities.Texas Solar Nova 1 has an 18-year PPA with an investment-grade counterparty that commenced in January 2024. The purchase price forTexas Solar Nova 1 operations are reflected in the November 2017 Drop Down AssetsCompany’s Renewables segment and the acquisition was funded with cashexisting sources of liquidity. The acquisition was determined to be an asset acquisition and the Company consolidates Texas Solar Nova 1 on hand.a prospective basis in its financial statements. The assets and liabilities transferred to the Company relate to interests under common control by NRG and were recorded at historical cost in accordance with ASC 805-50, Business Combinations - Related Issues. The difference betweensum of the cash paid of $23 million and the historical valuecost of the entities' equityCompany’s net liabilities assumed of $6 million was recorded as a contribution from NRG and increasedan adjustment to CEG’s contributed capital balance. In addition, the balance of contributed capital. BecauseCompany reflected the transaction constituted a transfer of net assets under common control, the guidance requires retrospective combinationentire $23 million of the entities for all periods presented as ifCompany’s purchase price, which was contributed back to the combination has beenCompany by CEG to pay down the acquired long-term debt, in effect since the inceptionline item distributions to CEG, net of common control.contributions in the consolidated statements of members’ equity.
The following is a summary of assets and liabilities transferred in connection with the acquisition of the November 2017 Drop Down Assets as of November 1, 2017:
|
| | | |
| | (In millions) |
| Assets: | |
| Current assets | $ | 7 |
|
| Property, plant and equipment | 83 |
|
| Non-current assets | 12 |
|
| Total assets | 102 |
|
| Liabilities: | |
Debt (Current and non-current) (a) | 23 |
|
| Other current and non-current liabilities | 3 |
|
| Total liabilities assumed | 26 |
|
| Net assets acquired | $ | 76 |
|
| | | | | | | | |
| (In millions) | | Texas Solar Nova 1 |
| Cash | | $ | 3 | |
| Property, plant and equipment | | 362 | |
| Right-of-use assets, net | | 21 | |
| Derivative assets | | 4 | |
| Other non-current assets | | 6 | |
| | |
| Total assets acquired | | 396 | |
| | |
Long-term debt (a) | | 349 | |
| Long-term lease liabilities | | 19 | |
| Other current and non-current liabilities | | 34 | |
| Total liabilities assumed | | 402 | |
| Net liabilities assumed | | $ | (6) | |
(a)Net of $3 Includes a $90 million of net debt issuance costs.
Since the acquisition date, the November 2017 Drop Down Assets have contributedconstruction loan, $109 million sponsor equity bridge loan and $151 million tax equity bridge loan, offset by $1 million in operating revenues tounamortized debt issuance costs. See Note 10, Long-term Debt, for further discussion of the Company.long-term debt assumed in the acquisition.
Rosamond Central BESS Drop Down Assets — On AugustDecember 1, 2017,2023, the CompanyRosamond Central solar project acquired a 147 MW BESS project that is co-located at the remaining 25% interest in NRG Wind TE Holdco, a portfolio of 12 wind projects,Rosamond Central solar facility from NRGClearway Renew for totalinitial cash consideration of $44$70 million, including working capital adjustment$16 million of $3 million. The purchase agreement also included potential additional payments to NRG dependent upon actual
energy prices for merchant periods beginning in 2027, which were estimated and accrued as contingent consideration in the amount of $8 million as of September 30, 2017.
The Company originally acquired 75% of NRG Wind TE Holdco on November 3, 2015, or November 2015 Drop Down Assets, which were consolidated with 25% of the net assets recorded as noncontrolling interest. The assets and liabilities transferred towas funded by the Company related to interests under common control by NRG and were recorded at historical cost in accordance with ASC 805-50, Business Combination - Related Issues. As the Company had reflected NRG's 25% ownership of NRG Wind TE Holdco in noncontrolling interest, the difference betweenremaining $54 million funded through contributions from the cash paid of $44 million, net of the contingent consideration of $8 million,equity investor in Rosie TargetCo LLC and the historical value of the remaining 25% of $87 million as of July 31, 2017, was recorded as an adjustment to NRG's noncontrolling interest. Since the transaction constituted a transfer of entities under common control, the accounting guidance requires retrospective combination of the entities for all periods presented as if the combination has been in effect from the beginning of the financial statement period or from the date the entities were under common control (if later than the beginning of the financial statement period).
The Class A interests of NRG Wind TE Holdco are owned by a tax equity investor in Rosie TE HoldCo LLC. At substantial completion, which is expected to occur in the first half of 2024, the Company estimates it will pay an additional $279 million to Clearway Renew, $61 million of which will be funded by the Company with the remaining $218 million to be funded through contributions from the cash equity and tax equity investors. In order to facilitate and fund the construction of the BESS project, Rosie Class B LLC, the indirect owner of the Rosamond Central solar project, utilizing the proceeds from borrowings received under the refinanced debt facility, issued a loan to Clearway Renew that is included in note receivable — affiliate on the Company’s consolidated balance sheet, as further discussed in Note 10, Long-term Debt,and also made equity contributions to Rosie BESS Devco LLC, or TE Investor, who receives 99%Rosie Central BESS, which is an investment accounted for under the equity method of allocations of taxable incomeaccounting, as further discussed in Note 5, Investments Accounted for by the Equity Method and other items until the flip point, which occursVariable Interest Entities. The BESS project has a PPA for capacity with an investment-grade utility that has a 15-year contract duration that commences when the TE Investor obtains a specified return on itsproject reaches commercial operations, which is expected to occur in the first half of 2024. The Rosamond Central BESS operations are reflected in the Company’s Renewables segment and the Company’s portion of the initial investment, at which time the allocationsconsideration was funded with existing sources of liquidity. The acquisition was determined to the TE Investor change to 8.53%. The Company generally receives 100% of CAFD until the flip point, at which time the allocations to the Company of CAFD change to 91.47%. If the flip point has not occurred by a specified date, 100% of CAFD is allocated to the TE Investor until the flip point occurs. NRG Wind TE Holdco is a VIEbe an asset acquisition and the Company isconsolidates the primary beneficiary, throughRosamond Central BESS project net assets on a prospective basis in its position as managing member, and consolidates NRG Wind TE Holdco.
The following tables present a summary of the Company's historical information combining the financial information for the November 2017 Drop Down Assets and August 2017 Drop Down Assets transferred in connection with the acquisitions:
|
| | | | | | | | | | | | | | | | | | | | | | | | | | | | | | | |
| | Year ended December 31, 2016 | | Year ended December 31, 2015 |
| | As Previously Reported (a) | | November 2017 Drop Down Assets | | August 2017 Drop Down Assets | | As Currently Reported | | As Previously Reported (a) | | November 2017 Drop Down Assets | | August 2017 Drop Down Assets | | As Currently Reported |
| (In millions) | | | | | | | | | | | | | | | |
| Total operating revenues | $ | 1,021 |
| | $ | 14 |
| | $ | — |
| | $ | 1,035 |
| | $ | 953 |
| | $ | 15 |
| | $ | — |
| | $ | 968 |
|
| Operating income | 220 |
| | 4 |
| | — |
| | 224 |
| | 322 |
| | 6 |
| | — |
| | 328 |
|
| Net income | 15 |
| | — |
| | — |
| | 15 |
| | 93 |
| | 2 |
| | — |
| | 95 |
|
| Net income attributable to Yield LLC | 157 |
| | — |
| | (31 | ) | | 126 |
| | 144 |
| | 3 |
| | 10 |
| | 157 |
|
(a)As previously reported in the May 9, 2017 Form 8-K filed in connection with the March 2017 Drop Down completed on March 27, 2017
|
| | | | | | | | | | | |
| | As of December 31, 2016 |
| (In millions) | As Previously Reported (a) | | November 2017 Drop Down Assets | | As Currently Reported |
| Assets: | | | | | |
| Current assets | $ | 656 |
| | $ | 14 |
| | $ | 670 |
|
| Property, plant and equipment | 5,460 |
| | 94 |
| | 5,554 |
|
| Non-current assets | 2,504 |
| | 18 |
| | 2,522 |
|
| Total assets | 8,620 |
| | 126 |
| | 8,746 |
|
| Liabilities: | | | | | |
| Debt (Current and non-current) | 6,007 |
| | 62 |
| | 6,069 |
|
| Other current and non-current liabilities | 309 |
| | 4 |
| | 313 |
|
| Total liabilities assumed | 6,316 |
| | 66 |
| | 6,382 |
|
| Net assets | $ | 2,304 |
| | $ | 60 |
| | $ | 8,746 |
|
(a)As previously reported in the May 9, 2017 Form 8-K filed in connection with the March 2017 Drop Down completed on March 27, 2017.
March 2017 Drop Down Assets — On March 27, 2017, the Company acquired the following interests from NRG: (i) Agua Caliente Borrower 2 LLC, which owns a 16% interest (approximately 31% of NRG's 51% interest) in the Agua Caliente solar farm, one of the ROFO Assets, representing ownership of approximately 46 net MW of capacity and (ii) NRG's interests in the Utah Solar Portfolio. Agua Caliente is located in Yuma County, AZ and sells power subject to a 25-year PPA with Pacific Gas and Electric, with 22 years remaining on that contract. The seven utility-scale solar farms in the Utah Solar Portfolio are owned by the following entities: Four Brothers Capital, LLC, Iron Springs Capital, LLC, and Granite Mountain Capital, LLC. These utility-scale solar farms achieved commercial operations in 2016, sell power subject to 20-year PPAs with PacifiCorp, a subsidiary of Berkshire Hathaway and are part of a tax equity structure with Dominion Solar Projects III, Inc., or Dominion, through which the Company is entitled to receive 50% of cash to be distributed, as further described below. The Company paid cash consideration of $132 million, including $2 million of working capital. The acquisition of the March 2017 Drop Down Assets was funded with cash on hand. The Company recorded the acquired interests as equity method investments. The Company also assumed non-recourse debt of $41 million and $287 million on Agua Caliente Borrower 2 LLC and the Utah Solar Portfolio, respectively, as further described in Note 10, Long-term Debt, as well as its pro-rata share of non-recourse project-level debt of Agua Caliente Solar LLC.
statements. The assets and liabilities transferred to the Company relate to interests under common control by NRG and were recorded at historical cost in accordance with ASC 805-50, Business CombinationCombinations - Related Issues. Issues. The difference between the historical cost of the Company’s net assets acquired of $266 million and the cash paid and the historical value of the entities' equity of $8$70 million was recorded as an adjustment to NRG's noncontrolling interest. Since the transaction constituted a transfer of entities under common control, the accounting guidance requires retrospective combination of the entities for all periods presented as if the combination has been in effect from the beginning of the financial statement period or from the date the entities were under common control (if later than the beginning of the financial statement period). Accordingly, in connection with the retrospective adjustment of prior periods, the Company adjusted its financial statements to reflect its results of operations, financial position and cash flows as if it recorded its interests in the Agua Caliente Borrower 2 LLC on January 1, 2016, and its interests in the Utah Solar Portfolio on November 2, 2016.CEG’s contributed capital balance.
The following is a summary of assets and liabilities transferred in connection with the acquisition of the March 2017 Drop Down Assets as of March 27, 2017:
|
| | | |
| | (In millions) |
| Assets: | |
| Cash | $ | 6 |
|
| Equity investment in projects | 456 |
|
| Total assets acquired | 462 |
|
| Liabilities: | |
Debt (Current and non-current) (a) | 320 |
|
| Other current and non-current liabilities | 3 |
|
| Total liabilities assumed | 323 |
|
| Net assets acquired | $ | 139 |
|
| | | | | | | | |
| (In millions) | | Rosamond Central BESS |
Property, plant and equipment (a) | | $ | 275 | |
| | |
| Total assets acquired | | 275 | |
| | |
| Other current and non-current liabilities | | 9 | |
| Total liabilities assumed | | 9 | |
| Net assets acquired | | $ | 266 | |
(a)NetIncludes Construction in progress of $8 million of debt issuance costs.$272 million.
2016 Acquisitions
CVSRVictory Pass and Arica Drop Down— Prior to September 1, 2016,On October 31, 2023, the Company, had a 48.95% interest in CVSR, which was accounted for as an equity method investment.On September 1, 2016, the Company acquired from NRG the remaining 51.05% interest of CVSRthrough its indirect subsidiary, VP-Arica Parent Holdco LLC, acquired the Class A membership interests in VP-Arica TargetCo LLC, a partnership and the indirect owner of Victory Pass, a 200 MW solar project that is paired with 50 MW of energy storage, and Arica, a 263 MW solar project that is paired with 136 MW of energy storage, which indirectly owns the CVSR solar facility, or the CVSR Drop Down,are both currently under construction in Riverside, California, from Clearway Renew for totalinitial cash consideration of $78.5$46 million. Simultaneously, a cash equity investor acquired the Class B membership interests in VP-Arica TargetCo LLC from Clearway Renew for initial cash consideration of $87 million. At substantial completion, which is expected to occur in the first half of 2024, the Company estimates it will pay an additional $182 million plusto Clearway Renew and the cash equity investor will contribute an immaterial working capital adjustment.additional $347 million. VP-Arica TargetCo LLC consolidates as primary beneficiary, VP-Arica TE Holdco LLC, a tax equity fund that owns the Victory Pass and Arica solar projects, as further described in Note 5, Investments Accounted for by the Equity Method and Variable Interest Entities.Victory Pass and Arica each have PPAs with investment-grade counterparties that have a 15-year and 14-year weighted average contract duration, respectively, that commence when the underlying operating assets reach commercial operations, which is expected to occur in the first half of 2024. The Victory Pass and Arica operations are reflected in the Company’s Renewables segment and the acquisition was funded with cash on hand. The Company also assumed additional debtexisting sources of $496 million, which represents 51.05% of the CVSR project level debt and 51.05% of the notes issued under the CVSR Holdco Financing Agreement, as of the closing date.liquidity. The acquisition was funded with cashdetermined to be an asset acquisition and the Company consolidates Victory Pass and Arica on hand.
a prospective basis in its financial statements. The assets and liabilities transferred to the Company relate to interests under common control by NRG and were recorded at historical cost in accordance with ASC 805-50, Business Combinations - Related Issues. The difference betweensum of the cash paid of $46 million and the historical valuecost of the CVSR Drop DownCompany’s net liabilities assumed of $112$1 million as well as $6 million of AOCL, was recorded as a distributionan adjustment to NRG with the offset toCEG’s contributed capital. Because the transaction constituted a transfer of net assets under common control, the guidance requires retrospective combination of the entities for all periods presented as if the combination has been in effect since the inception of common control. In connection with the retrospective adjustment of prior periods, the Company now consolidates
CVSR and 100% of its debt, consisting of $771 million of project level debt and $200 million of notes issued under the CVSR Holdco Financing Agreement as of September 1, 2016. capital balance. In addition, the Company has removedreflected the equity method investment from all prior periods and adjusted its financial statements to reflect its results of operations, financial position and cash flows as if it had consolidated CVSR from the beginningentire $46 million of the financial statement period.Company’s purchase price, which was contributed back to the Company by CEG to pay down the acquired long-term debt, in the line item distributions to CEG, net of contributions in the consolidated statements of members’ equity.
November 2015The following is a summary of assets and liabilities transferred in connection with the acquisition as of October 31, 2023:
| | | | | | | | |
| (In millions) | | Victory Pass and Arica |
| Cash | | $ | 1 | |
Property, plant and equipment (a) | | 937 | |
| Right-of-use assets, net | | 4 | |
| Derivative assets | | 1 | |
| Other non-current assets | | 6 | |
| | |
| Total assets acquired | | 949 | |
| | |
Long-term debt (b) | | 864 | |
| Long-term lease liabilities | | 4 | |
| Other current and non-current liabilities | | 82 | |
| Total liabilities assumed | | 950 | |
| Net liabilities assumed | | $ | (1) | |
(a) Includes Construction in progress of $893 million.
(b) Includes a $483 million sponsor equity bridge loan and $385 million tax equity bridge loan, offset by $4 million in unamortized debt issuance costs. See Note 10, Long-term Debt, for further discussion of the long-term debt assumed in the acquisition.
Daggett 2 Drop Down Assets from NRG— On November 3, 2015,August 30, 2023, the Company, through its indirect subsidiary, Daggett Solar Investment LLC, acquired the November 2015 Drop Down Assets,Class A membership interests in Daggett 2 TargetCo LLC, a portfoliopartnership and the indirect owner of 12 wind facilities totaling 814 netDaggett 2, a 182 MW solar project that is paired with 131 MW of energy storage and is located in San Bernardino, California, from NRGCEG for cash consideration of $207$13 million. Daggett 2 TargetCo LLC consolidates as primary beneficiary, Daggett 2 TE Holdco LLC, a tax equity fund that owns the Daggett 2 solar project, as further described in Note 5, Investments Accounted for by the Equity Method and Variable Interest Entities. Daggett 2 has PPAs with investment-grade counterparties that have a 15-year weighted average contract duration that commenced in December 2023. The Daggett 2 operations are reflected in the Company’s Renewables segment and the acquisition was funded with existing sources of liquidity. The acquisition was determined to be an asset acquisition and the Company consolidates Daggett 2 on a prospective basis in its financial statements. The assets, liabilities and noncontrolling interests transferred to the Company relate to interests under common control and were recorded at historical cost in accordance with ASC 805-50, Business Combinations - Related Issues. The sum of the historical cost of the Company’s acquired interests of $29 million and the cash paid of $13 million was recorded as an adjustment to CEG’s contributed capital balance.
The following is a summary of assets and liabilities transferred in connection with the acquisition as of August 30, 2023:
| | | | | | | | |
| (In millions) | | Daggett 2 |
| Cash | | $ | 1 | |
Restricted cash (a) | | 119 | |
| Property, plant and equipment | | 379 | |
| Right-of-use assets, net | | 22 | |
| Derivative assets | | 22 | |
| | |
| Total assets acquired | | 543 | |
| | |
Long-term debt (b) | | 308 | |
| Long-term lease liabilities | | 23 | |
| Other current and non-current liabilities | | 28 | |
| Total liabilities assumed | | 359 | |
| Noncontrolling interests | | 213 | |
| Net assets acquired less noncontrolling interests | | $ | (29) | |
(a) Includes funds that were contributed by the cash equity investor and tax equity investor, which were primarily used to pay off the tax equity bridge loan when the project reached substantial completion on December 22, 2023, as further discussed in Note 10, Long-term Debt.
(b) Includes a $107 million construction loan and $204 million tax equity bridge loan, offset by $3 million in unamortized debt issuance costs. See Note 10, Long-term Debt,for further discussion of the long-term debt assumed in the acquisition.
Daggett 3 Drop Down — On February 17, 2023, the Company, through its indirect subsidiary, Daggett Solar Investment LLC, acquired the Class A membership interests in Daggett TargetCo LLC, the indirect owner of Daggett 3, a 300 MW solar project that is paired with 149 MW of energy storage and located in San Bernardino, California, from Clearway Renew for cash consideration of $21 million. Simultaneously, a cash equity investor acquired the Class B membership interests in Daggett TargetCo LLC from Clearway Renew for cash consideration of $129 million. The Company was responsible for its pro-rata share of non-recourse project debt of $193 million and noncontrolling interest associated withthe cash equity investor then contributed their Class A and B membership interests, respectively, into Daggett Renewable Holdco LLC, a partnership that consolidates Daggett TargetCo LLC. Daggett TargetCo LLC consolidates as primary beneficiary, Daggett TE Holdco LLC, a tax equity structure of $159 million (as offund that owns the Daggett 3 solar project, as further described in Note 5, Investments Accounted for by the Equity Method and Variable Interest Entities. Daggett 3 has PPAs with investment-grade counterparties that have a 15-year weighted average contract duration that commenced between July 2023 and November 2023. The Daggett 3 operations are reflected in the Company’s Renewables segment and the acquisition date).
was funded with existing sources of liquidity. The acquisition was determined to be an asset acquisition and the Company funded the acquisition with borrowings fromconsolidates Daggett 3 on a prospective basis in its revolving credit facility.financial statements. The assets and liabilities transferred to the Company relate to interests under common control by NRG and were recorded at historical cost.cost in accordance with ASC 805-50, Business Combinations - Related Issues. The difference between the cash paid of $21 million and the historical valuecost of the entities' equityCompany’s net assets acquired of $15 million was recorded as an adjustment to CEG’s contributed capital balance. In addition, the Company reflected the entire $21 million of the Company’s purchase price, which was contributed back to the Company by CEG to pay down the acquired long-term debt, in the line item distributions to CEG, net of contributions in the consolidated statements of members’ equity.
The following is a distribution from NRGsummary of assets and liabilities transferred in connection with the acquisition as of February 17, 2023:
| | | | | | | | |
| (In millions) | | Daggett 3 |
| Restricted cash | | $ | 4 | |
| Property, plant and equipment | | 534 | |
| Right-of-use assets, net | | 31 | |
| Derivative assets | | 27 | |
| | |
| Total assets acquired | | 596 | |
| | |
Long-term debt (a) | | 480 | |
| Long-term lease liabilities | | 33 | |
Other current and non-current liabilities (b) | | 68 | |
| Total liabilities assumed | | 581 | |
| Net assets acquired | | $ | 15 | |
(a) Includes a $181 million construction loan, $75 million sponsor equity bridge loan and $229 million tax equity bridge loan, offset by $5 million in unamortized debt issuance costs. See Note 10, Long-term Debt, for further discussion of the long-term debt assumed in the acquisition.
(b) Includes $32 million of project costs that were subsequently funded by CEG. Subsequent to contributed capital.the acquisition date, CEG funded an additional $22 million in project costs. The combined $54 million funded by CEG was repaid to CEG in October 2023.
Desert Sunlight Waiawa Drop Down — On June 29, 2015,October 3, 2022, the Company, through its indirect subsidiary, Lighthouse Renewable Holdco LLC, acquired 25%Waiawa BL Borrower Holdco LLC, the indirect owner of the membership interest in Desert Sunlight Investment Holdings, LLC, which owns twoWaiawa solar photovoltaic facilitiesproject, a 36 MW solar project that total 550is paired with 36 MW of energy storage and located in Desert Center, CaliforniaHonolulu, Hawaii, from EFS Desert Sun,Clearway Renew for cash consideration of $20 million. Lighthouse Renewable Holdco LLC an affiliate of GE Energy Financial Services foris a purchase price of $285 million. Power generated by the facilities is sold to Southern California Edison and Pacific Gas and Electric under long-term PPAs with approximately 20 years and 25 years of remaining contract life, respectively. The Company accounts for its 25% investment as an equity method investment.
Spring Canyon — On May 7, 2015,partnership between the Company and a cash equity investor. The cash equity investor also contributed cash consideration of $12 million, which was utilized to acquire their portion of the acquired a 90.1% interest in Spring Canyon II, a 32 MW wind facility, and Spring Canyon III, a 28 MW wind facility, each located in Logan County, Colorado, from Invenergy Wind Global LLC. The purchase price was funded with cash on hand. Power generated by Spring Canyon II and Spring Canyon III is sold to Platte River Power Authority under long-term PPAs, each with approximately 24 yearsentity. At the time of remaining contract life.
University of Bridgeport Fuel Cell— On April 30, 2015, the Company completed the acquisition, ofWaiawa BL Borrower Holdco LLC consolidated as primary beneficiary, Waiawa TE Holdco LLC, a tax equity fund that held the University of Bridgeport Fuel CellWaiawa solar project. Waiawa has a 20-year PPA with an investment-grade utility that commenced in January 2023. The Waiawa solar project in Bridgeport, Connecticut from FuelCell Energy, Inc. The project added an additional 1.4 MW of thermal capacity to the Company's portfolio, with a 12-year contract, with the option for a 7-year extension. The acquisition is reflected in the Company's Thermal segment.
January 2015 Drop Down Assets from NRG — On January 2, 2015,Company’s Renewables segment and the acquisition was funded with existing sources of liquidity. The acquisition was determined to be an asset acquisition and the Company acquired the following projects from NRG: (i) Laredo Ridge, an 80 MW wind facility locatedconsolidates Waiawa on a prospective basis in Petersburg, Nebraska, (ii) Tapestry, which includes Buffalo Bear, a 19 MW wind facility in Buffalo, Oklahoma; Taloga, a 130 MW wind facility in Putnam, Oklahoma; and Pinnacle, a 55 MW wind facility in Keyser, West Virginia, and (iii) Walnut Creek, a 485 MW natural gas facility located in City of Industry, California, for total cash consideration of $489 million, including $9 million for working capital, plus assumed project-level debt of $737 million. The Company funded the acquisition with cash on hand and drawings under its revolving credit facility.financial statements. The assets and liabilities transferred to the Company relate to interests under common control by NRG and were recorded at historical cost.cost in accordance with ASC 805-50, Business Combinations - Related Issues. The sum of the cash paid of $20 million and the historical cost of the Company’s net liabilities assumed of $1 million was recorded as an adjustment to CEG’s contributed capital balance. In addition, the Company reflected $16 million of the Company’s purchase price, which was contributed back to the Company by CEG to pay down the acquired long-term debt, in the line item distributions to CEG, net of contributions, in the consolidated statement of members’ equity.
The following is a summary of assets and liabilities transferred in connection with the acquisition as of October 3, 2022:
| | | | | | | | |
| (In millions) | | Waiawa |
| Other current and non-current assets | | $ | 7 | |
| Property, plant and equipment | | 118 | |
| | |
| Total assets acquired | | 125 | |
| | |
Long-term debt (a) | | 102 | |
| | |
| Other current and non-current liabilities | | 24 | |
| Total liabilities assumed | | 126 | |
| Net liabilities assumed | | $ | (1) | |
| | |
| | |
(a) Includes a $22 million construction loan, $26 million sponsor equity bridge loan and $55 million tax equity bridge loan, offset by $1 million in unamortized debt issuance costs. See Note 10, Long-term Debt, for further discussion of the long-term debt assumed in the acquisition.
Capistrano Wind Portfolio Acquisition — On August 22, 2022, the Company, through its wholly-owned indirect subsidiary, Capistrano Portfolio Holdco LLC, acquired the Capistrano Wind Portfolio from Capistrano Wind Partners LLC, an indirect subsidiary of CEG, for a base purchase price of approximately $255 million, less working capital adjustments in the net amount of approximately $16 million, representing total net consideration of approximately $239 million. Concurrent with the acquisition, the Company also entered into a development agreement with Clearway Renew, whereby Clearway Renew paid $10 million to the Company at acquisition date for an exclusive right to develop, construct and repower the projects in the Capistrano Wind Portfolio, which was utilized to partially fund the acquisition of the Capistrano Wind Portfolio. The Capistrano Wind Portfolio consists of five wind projects located in Texas, Nebraska and Wyoming with a combined capacity of 413 MW that reached commercial operations between 2008 and 2012. The assets within the portfolio sell power under PPAs with investment-grade counterparties that have a weighted average remaining contract duration of approximately 8 years. The Capistrano Wind Portfolio operations are reflected in the Company’s Renewables segment and the acquisition was funded with existing sources of liquidity. The acquisition was determined to be an asset acquisition and the Company consolidates the Capistrano Wind Portfolio on a prospective basis in its financial statements. The assets and liabilities transferred to the Company relate to interests under common control and were transferred at historical cost in accordance with ASC 805-50, Business Combinations - Related Issues, which reflects GIP’s basis. The difference between the historical cost of the Company’s net assets acquired of $250 million, less the sum of the cash paid of $239 million and the $4 million in accumulated other comprehensive income transferred to the Company, was recorded as an adjustment to CEG’s contributed capital balance.
The following is a summary of assets and liabilities transferred in connection with the acquisition as of August 22, 2022:
| | | | | | | | |
| (In millions) | | Capistrano Wind Portfolio |
Other current and non-current assets (a) | | $ | 39 | |
| Property, plant and equipment, net | | 147 | |
| Intangible assets for power purchase agreements | | 237 | |
| Right-of-use assets, net | | 27 | |
| | |
| Total assets acquired | | 450 | |
| | |
| Long-term debt | | 162 | |
| Long-term lease liabilities | | 28 | |
| Other current and non-current liabilities | | 10 | |
| | |
| Total liabilities assumed | | 200 | |
| | |
| Net assets acquired | | $ | 250 | |
(a) Includes cash of $12 million and restricted cash of $4 million.
Mililani I Drop Down — On March 25, 2022, the Company, through its indirect subsidiary, Lighthouse Renewable Holdco LLC, acquired Mililani BL Borrower Holdco LLC, the indirect owner of the Mililani I solar project, a 39 MW solar project that is paired with 39 MW of energy storage and located in Honolulu, Hawaii, from Clearway Renew for cash consideration of $22 million. The cash equity investor in Lighthouse Renewable Holdco LLC also contributed cash consideration of $14 million utilized to acquire their portion of the acquired entity. Mililani BL Borrower Holdco LLC consolidates as primary beneficiary, Mililani TE Holdco LLC, a tax equity fund that owns the Mililani I solar project. Mililani I has a 20-year PPA with an investment-grade utility that commenced in July 2022. The Mililani I operations are reflected in the Company’s Renewables segment and the acquisition was funded with existing sources of liquidity. The acquisition was determined to be an asset acquisition and the Company consolidates Mililani I on a prospective basis in its financial statements. The assets and liabilities transferred to the Company relate to interests under common control and were recorded at historical cost in accordance with ASC 805-50, Business Combinations - Related Issues. The sum of the cash paid of $22 million and the historical valuecost of the entities' equityCompany’s net liabilities assumed of $61$8 million was recorded as an adjustment to CEG’s contributed capital balance. In addition, the Company reflected $15 million of the Company’s purchase price, which was contributed back to the Company by CEG to pay down the acquired long-term debt, in the line item distributions to CEG, net of contributions, in the consolidated statement of members’ equity.
The following is a distribution to NRGsummary of assets and reducedliabilities transferred in connection with the balanceacquisition as of March 25, 2022:
| | | | | | | | |
| (In millions) | | Mililani I |
| Other current and non-current assets | | $ | 2 | |
| Property, plant and equipment | | 118 | |
| Right-of-use assets | | 19 | |
| | |
| Total assets acquired | | 139 | |
| | |
Long-term debt (a) | | 100 | |
| Long-term lease liabilities | | 20 | |
| Other current and non-current liabilities | | 27 | |
| | |
| Total liabilities assumed | | 147 | |
| | |
| Net liabilities assumed | | $ | (8) | |
(a) Includes a $16 million construction loan, $27 million sponsor equity bridge loan and $60 million tax equity bridge loan, offset by $3 million in unamortized debt issuance costs. See Note 10, Long-term Debt, for further discussion of the long-term debt assumed in the acquisition.
Dispositions
Kawailoa Sale — On August 1, 2022, the Company sold 100% of its contributed capital.Class A membership interests in the Kawailoa Partnership to Clearway Renew for cash proceeds of $9 million, which equals the Company’s initial investment. The Kawailoa Partnership is a partnership that consolidates, through its 51% controlling majority interest, a lower-level partnership that is 49% owned by a cash equity investor, and which consolidates the Kawailoa solar project through its ownership of a controlling interest in the tax equity fund that holds the project. The assets and liabilities transferred to Clearway Renew relate to interests under common control and were transferred at historical cost in accordance with ASC 805-50, Business Combinations - Related Issues. This resulted in the Company removing $69 million from members’ equity, inclusive of the noncontrolling interest related to the Kawailoa Partnership at the time of sale. Noncontrolling interests prior to the sale include the interests of the cash equity investor, tax equity investor and Clearway Renew.
Thermal Disposition — On May 1, 2022, the Company completed the sale of 100% of its interests in the Thermal Business to KKR for net proceeds of approximately $1.46 billion, inclusive of working capital adjustments, which excludes approximately $18 million in transaction expenses that were incurred in connection with the disposition. The Thermal Disposition resulted in a gain on sale of business of approximately $1.29 billion, which is net of the $18 million in transaction expenses referenced above. The proceeds from the sale were utilized to repay certain borrowings outstanding as further described in Note 10, Long-term Debt, with the remaining proceeds invested in short-term investments classified as cash and cash equivalents on the Company’s consolidated balance sheet. The Company’s Thermal segment was comprised solely of the Thermal Business’s results of operations.
Note 4 — Property, Plant and Equipment
The Company’s major classes of property, plant, and equipment were as follows:
|
| | | | | | | | | |
| | December 31, 2017 | | December 31, 2016 | | Depreciable Lives |
| | (In millions) | | |
| Facilities and equipment | $ | 6,289 |
| | $ | 6,339 |
| | 2 - 45 Years |
| Land and improvements | 166 |
| | 167 |
| | |
Construction in progress (a) | 34 |
| | 24 |
| | |
| Total property, plant and equipment | 6,489 |
| | 6,530 |
| | |
| Accumulated depreciation | (1,285 | ) | | (976 | ) | | |
| Net property, plant and equipment | $ | 5,204 |
| | $ | 5,554 |
| | |
| | | | | | | | | | | | | | | | | |
| December 31, 2023 | | December 31, 2022 | | Depreciable Lives |
| (In millions) | | |
| Facilities and equipment | $ | 11,426 | | | $ | 9,992 | | | 3 - 41 Years |
| Land and improvements | 365 | | | 293 | | | |
Construction in progress (a) (b) | 1,220 | | | 160 | | | |
| Total property, plant and equipment | 13,011 | | | 10,445 | | | |
| Accumulated depreciation | (3,485) | | | (3,024) | | | |
| Net property, plant and equipment | $ | 9,526 | | | $ | 7,421 | | | |
(a) As of December 31, 20172023 and 2016,2022, construction in progress includes $24$21 million and $20$17 million, respectively, of capital expenditures that relate to prepaid long-term service agreements in the Conventional segment,segment.
(b) As of December 31, 2023 and 2022, construction in progress includes $72 million and $9 million, respectively, of accrued capital expenditures.
Depreciation expense related to property, plant and equipment during the years ended December 31, 2023, 2022 and 2021 was $514 million, $502 million and $499 million, respectively.
The Company recorded long-lived asset impairments during each of the years ended December 31, 20172023, 2022 and 2016,2021, as further described inNote 9, Asset Impairments.
Note 5 — Investments Accounted for by the Equity Method and Variable Interest Entities
Equity Method Investments
The following table summarizes the Company's equity method investmentsCompany’s maximum exposure to loss as of December 31, 2017:2023 is limited to its equity investment in the unconsolidated entities, as further summarized in the table below:
|
| | | | |
| Name | | Economic Interest | | Investment Balance |
| | | | | (In millions) |
Utah Solar Portfolio (a) | | 50% | | $345 |
| Desert Sunlight | | 25% | | 272 |
GenConn(b) | | 50% | | 102 |
| Agua Caliente Borrower 2 | | 16% | | 92 |
Elkhorn Ridge(c) | | 66.7% | | 73 |
San Juan Mesa(c) | | 75% | | 66 |
NRG DGPV Holdco 1 LLC (d) | | 95% | | 76 |
NRG DGPV Holdco 2 LLC (d) | | 95% | | 61 |
NRG DGPV Holdco 3 LLC (d) | | 99% | | 39 |
NRG RPV Holdco 1 LLC(d) | | 95% | | 58 |
| Avenal | | 50% | | (6) |
| Total equity investments in affiliates | | | | $1,178 |
| | | | | | | | | | | | | | |
| Name | | Economic Interest | | Investment Balance |
| | | | (In millions) |
| Avenal | | 50% | | $ | 7 | |
| Desert Sunlight | | 25% | | 224 | |
| Elkhorn Ridge | | 66.7% | | 15 | |
GenConn (a) | | 50% | | 79 | |
Rosie Central BESS (a) | | 50% | | 28 | |
| San Juan Mesa | | 75% | | 7 | |
| | | | $ | 360 | |
(a) Economic interest based on cash to be distributed. Four Brothers Solar, LLC, Granite Mountain Holdings, LLC GenConn and Iron Springs Holdings, LLCRosie Central BESS are tax equity structures and VIEs. The related allocations are described below.
(b) GenConn is a variable interest entity.
(c) San Juan Mesa and Elkhorn Ridge are part of the Wind TE Holdco tax equity structure, as described below. San Juan Mesa and Elkhorn Ridge are owned 75% and 66.7%, respectively, by Wind TE Holdco. The Company owns 100% of the Class B interests in Wind TE Holdco.
(d) Economic interest based on cash to be distributed. NRG DGPV Holdco 1 LLC, NRG DGPV Holdco 2 LLC, NRG DGPV Holdco 3 LLC and NRG RPV Holdco 1 LLC are tax equity structures and VIEs. The related allocations are described below.
entities.
As of December 31, 20172023 and 2016,2022, the Company had $57$17 million and $51$19 million, respectively, of undistributed earnings from its equity method investments.
The Company acquired its interest in Desert Sunlight on June 30, 2015, for $285 million, which resulted in a difference between the purchase price and the basis of the acquired assets and liabilities of $171$181 million. The difference is attributable to the fair value of the property, plant and equipment and power purchase agreements. In addition, the difference between the basis of the acquired assets and liabilities and the purchase price for the Utah Solar Portfolio (Four Brothers Solar, LLC, Granite Mountain Holdings, LLC and Iron Springs Holdings, LLC) of $106 million is attributable to the fair value of the property, plant and equipment.
The Company is amortizing the related basis differences to equity in earnings (losses)of unconsolidated subsidiaries over the related useful life of the underlying assets acquired.
Non-recourse project-level debt As of unconsolidated affiliatesDecember 31, 2023, the carrying value of the basis difference is $122 million.
The Company'sCompany’s pro-rata share of non-recourse debt held by unconsolidated affiliates was $777$303 million as of December 31, 2017.2023.
Rosie Central BESS — On June 30, 2023, the Company, through its indirect subsidiary, Rosie Class B LLC, the indirect owner of the Rosamond Central solar project, became the owner of the Class B membership interests of Rosie Central BESS in order to facilitate and fund the construction of a BESS project that is co-located at the Rosamond Central solar facility. Clearway Renew indirectly owns the Class A membership interests and controls Rosie Central BESS. The Company accounts for its investment in Rosie Central BESS as an equity method investment. As of December 31, 2023, the Company’s investment consisted of $28 million contributed into Rosie Central BESS, funded through contributions from the Company and its cash equity investor in Rosie TargetCo LLC, which consolidates Rosie Class B LLC. On December 1, 2023, the Rosamond Central solar project acquired the BESS project from Clearway Renew, as further discussed in Note 3, Acquisitions and Dispositions. When the BESS project reaches substantial completion, which is expected to occur in the first half of 2024, Clearway Renew will return Rosie Class B LLC’s equity investment.
The following tables present summarized financial information for the Company's significantCompany’s equity method investments:
|
| | | | | | | | | | | | |
| | Year Ended December 31, |
| | 2017 | | 2016 | | 2015 |
| Income Statement Data: | (In millions) |
| GenConn | | | | | |
| Operating revenues | $ | 71 |
| | $ | 72 |
| | $ | 78 |
|
| Operating income | 36 |
| | 38 |
| | 40 |
|
| Net income | 26 |
| | 26 |
| | 28 |
|
| Desert Sunlight | | | | | |
| Operating revenues | 207 |
| | 211 |
| | 206 |
|
| Operating income | 127 |
| | 129 |
| | 124 |
|
| Net income | 80 |
| | 80 |
| | 73 |
|
Utah Solar Portfolio (a) | | | | | |
| Operating revenues | 75 |
| | 13 |
| | — |
|
| Operating income (loss) | 18 |
| | (6 | ) | | (1 | ) |
| Net income (loss) | 18 |
| | (6 | ) | | (1 | ) |
DGPV entities (b) | | | | | |
| Operating revenues | 37 |
| | 14 |
| | 1 |
|
| Operating income | 7 |
| | 2 |
| | — |
|
| Net loss | (3 | ) | | — |
| | — |
|
| RPV Holdco | | | | | |
| Operating revenues | 16 |
| | 13 |
| | 4 |
|
| Operating income | 3 |
| | 2 |
| | (6 | ) |
| Net income (loss) | 3 |
| | 2 |
| | (6 | ) |
| | | | | | |
| | | | As of December 31, |
| | | | 2017 | | 2016 |
| Balance Sheet Data: | | | (In millions) |
| GenConn | | | | |
| Current assets | | $ | 38 |
| | $ | 36 |
|
| Non-current assets | | 374 |
| | 389 |
|
| Current liabilities | | 18 |
| | 16 |
|
| Non-current liabilities | | 189 |
| | 196 |
|
| Desert Sunlight | | | | |
| Current assets | | 133 |
| | 281 |
|
| Non-current assets | | 1,350 |
| | 1,401 |
|
| Current liabilities | | 64 |
| | 64 |
|
| Non-current liabilities | | 1,003 |
| | 1,043 |
|
Utah Solar Portfolio (a) | | | | |
| Current assets | | 13 |
| | 20 |
|
| Non-current assets | | 1,090 |
| | 1,105 |
|
| Current liabilities | | 5 |
| | 14 |
|
| Non-current liabilities | | 24 |
| | 38 |
|
DGPV entities (b) | | | | |
| Current assets | | 74 |
| | 44 |
|
| Non-current assets | | 671 |
| | 562 |
|
| Current liabilities | | 83 |
| | 112 |
|
| Non-current liabilities | | 216 |
| | 23 |
|
| Redeemable Noncontrolling Interest | | 44 |
| | 28 |
|
| RPV Holdco | | | | |
| Current assets | | 3 |
| | 15 |
|
| Non-current assets | | 183 |
| | 191 |
|
| Current liabilities | | — |
| | 11 |
|
| Non-current liabilities | | 7 |
| | 7 |
|
| Redeemable Noncontrolling Interest | | | 16 |
| — |
| — |
|
| | | | | | | | | | | | | | | | | |
| Year Ended December 31, |
| 2023 | | 2022 | | 2021 |
| Income Statement Data: | (In millions) |
| GenConn | | | | | |
| Operating revenues | $ | 51 | | | $ | 50 | | | $ | 55 | |
| Operating income | 14 | | | 16 | | | 22 | |
| Net income | 6 | | | 7 | | | 13 | |
| Desert Sunlight | | | | | |
| Operating revenues | 202 | | | 203 | | | 205 | |
| Operating income | 144 | | | 137 | | | 146 | |
| Net income | 108 | | | 114 | | | 112 | |
| | | | | |
| | | | | |
| | | | | |
| | | | | |
| | | | | |
| | | | | |
| | | | | |
| | | | | |
| | | | | |
| | | | | |
| | | | | |
| | | | | |
Other (a) | | | | | |
| Operating revenues | 43 | | | 52 | | | 49 | |
| Operating income | 9 | | | 18 | | | 16 | |
| Net income | 7 | | | 15 | | | 13 | |
| | | As of December 31, |
| | | 2023 | | 2022 |
| Balance Sheet Data: | | | (In millions) |
| GenConn | | | | |
| Current assets | | $ | 39 | | | $ | 39 | |
| Non-current assets | | 294 | | | 312 | |
| Current liabilities | | 15 | | | 16 | |
| Non-current liabilities | | 162 | | | 170 | |
| Desert Sunlight | | | | |
| Current assets | | 80 | | | 79 | |
| Non-current assets | | 1,131 | | | 1,175 | |
| Current liabilities | | 61 | | | 61 | |
| Non-current liabilities | | 776 | | | 824 | |
| | | | |
| | | | |
| | | | |
| | | | |
| | | | |
| | | | |
| | | | |
| | | | |
| | | | |
| | | | |
| | | | |
| | | | |
| | | | |
| | | | |
| | | | |
| | | | |
| | | | |
Other (a) | | | | |
| Current assets | | 19 | | | 22 | |
| Non-current assets | | 135 | | | 157 | |
| Current liabilities | | 13 | | | 12 | |
| Non-current liabilities | | 81 | | | 91 | |
| | | | |
(a)Utah Solar Portfolio was acquired by NRG on November 2, 2016.
(b) Includes DGPV Holdco 1, DGPV Holdco 2Avenal, Elkhorn Ridge, San Juan Mesa and DGPV Holdco 3
Rosie Central BESS.
Variable Interest Entities, or VIEs
Entities that are Consolidated
NRG WindThe Company has a controlling financial interest in certain entities which have been identified as VIEs under ASC 810, Consolidations. These arrangements are primarily related to tax equity arrangements entered into with third parties in order to monetize certain tax credits associated with wind and solar facilities. The Company also has a controlling financial interest in certain partnership arrangements with third-party investors, which also have been identified as VIEs. Under the Company’s arrangements that have been identified as VIEs, the third-party investors are allocated earnings, tax attributes and distributable cash in accordance with the respective limited liability company agreements. Many of these arrangements also provide a mechanism to facilitate achievement of the investor’s specified return by providing incremental cash distributions to the investor at a specified date if the specified return has not yet been achieved.
The following is a summary of significant activity during 2023 related to the Company’s consolidated VIEs:
DGPV Funds — On December 29, 2023, the Company, through its indirect subsidiary, DGPV 4 LLC, acquired 100% of the Class A membership interests in DGPV Fund 4 LLC, a tax equity fund that owns several distributed solar projects, from the tax equity investor in DGPV Fund 4 LLC for $3 million. Prior to the acquisition, the Company consolidated DGPV Fund 4 LLC through its ownership of the Class B membership interests and role as managing member and the Class A membership interests were reflected as redeemable noncontrolling interest on the Company’s consolidated balance sheet. The difference between the historical cost of the Company’s redeemable noncontrolling interest of $20 million and the cash paid of $3 million was recorded as an adjustment to CEG’s contributed capital balance.
Alta TE Holdco— On December 6, 2023, the Company, through its indirect subsidiary, Clearway Energy Operating LLC, acquired 100% of the Class A membership interests in Alta X-XI TE Holdco, LLC, or Alta TE Holdco, a tax equity fund that owns the Alta X and XI wind projects, from the tax equity investor in Alta TE Holdco for $10 million. Prior to the acquisition, the Company consolidated Alta TE Holdco through its ownership of the Class B membership interests and role as managing member, and the Class A membership interests were reflected as noncontrolling interest on the Company’s consolidated balance sheet. The difference between the historical cost of the Company’s noncontrolling interest of $37 million and the cash paid of $10 million was recorded as an adjustment to CEG’s contributed capital balance.
Lighthouse Partnerships
As described in Note 3, Business Acquisitions and Dispositions, on August 1, 2017,December 28, 2023, Lighthouse Renewable Holdco 2 LLC, an indirect subsidiary of the Company, acquired from NRGTSN1 BL Borrower Holdco LLC. The Company consolidates Lighthouse Renewable Holdco 2 LLC, a partnership between the remaining 25% interest in NRG Wind TE Holdco. NRG Wind TE Holdco isCompany and a cash equity investor, as a VIE andas the Company is the primary beneficiary, through its positionrole as managing member andmember. The Company recorded the noncontrolling interest of the cash equity investor in TSN1 BL Borrower Holdco LLC at historical carrying amount, with the offset to additional paid-in capital. TSN1 BL Borrower Holdco LLC consolidates NRG Windas primary beneficiary, TSN1 TE Holdco.Holdco LLC, a tax equity fund that owns the Texas Solar Nova 1 solar project. The Class A membership interests of NRG Windin TSN1 TE Holdco LLC are ownedheld by a tax equity investor and are reflected as noncontrolling interest on the Company’s consolidated balance sheet.
On August 30, 2023, the Company and the cash equity investor in Lighthouse Renewable Holdco LLC and Lighthouse Renewable Holdco 2 LLC agreed to transfer Mesquite Star Class B Holdco LLC, the indirect owner of the Mesquite Star wind project, from Lighthouse Renewable Holdco LLC to Lighthouse Renewable Holdco 2 LLC. As the transfer was among entities under common control, the transaction was recognized at historical cost and no gain or TE Investor, who receives 99%loss was recognized.
VP-Arica TargetCo LLC — As described in Note 3, Acquisitions and Dispositions, on October 31, 2023, VP-Arica Parent Holdco LLC, an indirect subsidiary of allocations of taxable income and other items until the flip point,Company, acquired the Class A membership interests in VP-Arica TargetCo LLC, which occurs when the TE Investor obtainsis a specified return on its initial investment, at which time the allocations to the TE Investor change to 8.53%.partnership. The Company generally receives 100% of CAFD until the flip point, at which time the allocations toconsolidates VP-Arica TargetCo LLC as a VIE as the Company is the primary beneficiary. Through its membership interests in VP-Arica TargetCo LLC, the Company receives 40% of CAFD changedistributable cash. The Company recorded the noncontrolling interest of the cash equity investor in VP-Arica TargetCo LLC at historical carrying amount, with the offset to 91.47%. Ifadditional paid-in capital. VP-Arica TargetCo LLC consolidates as primary beneficiary and through its ownership of the flip point has not occurredClass B membership interests, VP-Arica TE Holdco LLC, a tax equity fund that owns the Victory Pass and Arica solar projects. The Class A membership interests in VP-Arica TE Holdco LLC are held by a specified date, 100%tax equity investor and are reflected as noncontrolling interest on the Company’s consolidated balance sheet.
Daggett Partnerships
As described in Note 3, Acquisitions and Dispositions, on August 30, 2023, Daggett Solar Investment LLC, an indirect subsidiary of CAFDthe Company, acquired the Class A membership interests in Daggett 2 TargetCo LLC, which is allocated to the TE Investor until the flip point occurs.a partnership. The Company utilizes the HLBV method to determine the net income or loss allocated to the TE Investor noncontrolling interest.
Alta TE Holdco — On June 30, 2015, the Company sold an economic interest in Alta TE Holdco to a financial institution in order to monetize certain cash and tax attributes, primarily PTCs. The financial institution, or Alta Investor, receives 99% of allocations of taxable income and other items until the flip point, which occurs when the Alta Investor obtains a specified return on its initial investment, at which time the allocations to the Alta Investor change to 5%. The Company receives 94.34% until the flip point, at which time the allocations to the Company of CAFD will change to 97.12%, unless the flip point will not have occurred by a specified date, which would result in 100% of CAFD allocated to the Alta Investor until the flip point occurs. Alta TE Holdco isconsolidates Daggett 2 TargetCo LLC as a VIE andas the Company is the primary beneficiary, through its positionrole as managing member, and therefore consolidates Alta TE Holdco, withmember. Through its membership interests in Daggett 2 TargetCo LLC, the Alta Investor's interest shown as noncontrolling interest.Company receives 25% of distributable cash. The Company utilizesrecorded the HLBV method to determineacquired noncontrolling interest of the net income or loss allocated to the noncontrolling interest.
Spring Canyon — The Company holds a 90.1%cash equity investor in Daggett 2 TargetCo LLC at historical carrying amount. Daggett 2 TargetCo LLC consolidates as primary beneficiary and through its ownership of the Class B membership interests, Daggett 2 TE Holdco LLC, a tax equity fund that owns the Daggett 2 solar project. The Class A membership interests in Spring Canyon II,Daggett 2 TE Holdco LLC are held by a 32 MW wind facility,tax equity investor and Spring Canyon III,are reflected as noncontrolling interest on the Company’s consolidated balance sheet.
As described in Note 3, Acquisitions and Dispositions, on February 17, 2023, Daggett Solar Investment LLC acquired the Class A membership interests in Daggett TargetCo LLC while a 28 MW wind facility, each located in Logan County, Colorado, and Invenergy Wind Global LLC owns 9.9% ofcash equity investor acquired the Class B membership interests. The projects are financed withCompany and the cash equity investor then contributed their Class A and B membership interests, respectively, into Daggett Renewable Holdco LLC, which is a partnership, flip tax-equity structure withand concurrently, Daggett TargetCo LLC became a financial institution, who owns the Class Awholly-owned subsidiary of Daggett Renewable Holdco LLC. Through its membership interests to monetize certain cash and tax attributes, primarily PTCs. Until the flip point, the Class A member receives a variable percentage of cash distributions based on the projects’ production level during the prior year. The Class A member received 34.81% of the cash distributions andin Daggett Renewable Holdco LLC, the Company and Invenergy received 65.19% during the period ended December 31, 2017. After the flip point, cash distributions are allocated 5% to the Class A member and 95% to thereceives 25% of distributable cash. The Company and Invenergy. Spring Canyon isconsolidates Daggett Renewable Holdco LLC as a VIE andas the Company is the primary beneficiary, through its positionrole as managing member,member. The Company recorded the noncontrolling interest of the cash equity investor in Daggett Renewable Holdco LLC at historical carrying amount, with the offset to additional paid-in capital. Daggett TargetCo LLC consolidates as primary beneficiary and therefore consolidates Spring Canyon.through its ownership of the Class B membership interests, Daggett TE Holdco LLC, a tax equity fund that owns the Daggett 3 solar project. The Class A membermembership interests in Daggett TE Holdco LLC are held by a tax equity investor and Invenergy's interests are shownreflected as noncontrolling interest. The Company utilizesinterest on the HLBV method to determine the net income or loss allocated to the Class A member. Net income or loss attributable to the Class B interests is allocated to Invenergy's noncontrolling interest based on its 9.9% ownership interest.Company’s consolidated balance sheet.
Summarized financial information for the Company'sCompany’s consolidated VIEs consisted of the following as of December 31, 2017:2023:
| | | | | | | | | | | | | | | | | | | | | | | | | | | | | | | | | | | |
| (In millions) | Buckthorn Holdings, LLC | | DGPV Funds (a) | | Langford TE Partnership LLC | | Daggett Partnerships (b) | | Lighthouse Renewable Holdco LLC (c) | | Lighthouse Renewable Holdco 2 LLC (d) |
| Other current and non-current assets | $ | 4 | | | $ | 58 | | | $ | 23 | | | $ | 167 | | | $ | 68 | | | $ | 135 | |
| Property, plant and equipment | 185 | | | 381 | | | 115 | | | 988 | | | 415 | | | 1,086 | |
| Intangible assets | — | | | 1 | | | — | | | — | | | — | | | 2 | |
| Total assets | 189 | | | 440 | | | 138 | | | 1,155 | | | 483 | | | 1,223 | |
| Current and non-current liabilities | 12 | | | 50 | | | 63 | | | 464 | | | 139 | | | 447 | |
| Total liabilities | 12 | | | 50 | | | 63 | | | 464 | | | 139 | | | 447 | |
| Noncontrolling interest | 15 | | | 3 | | | 66 | | | 827 | | | 254 | | | 590 | |
| Net assets less noncontrolling interest | $ | 162 | | | $ | 387 | | | $ | 9 | | | $ | (136) | | | $ | 90 | | | $ | 186 | |
| | | | | | | | | | | |
| | | | | | | | | | | |
| | | | | | | | | | | |
|
| | | | | | | | | | | |
| (In millions) | NRG Wind TE Holdco | | Alta TE Holdco | | Spring Canyon |
| Other current and non-current assets | $ | 172 |
| | $ | 17 |
| | $ | 2 |
|
| Property, plant and equipment | 376 |
| | 436 |
| | 95 |
|
| Intangible assets | 2 |
| | 262 |
| | — |
|
| Total assets | 550 |
| | 715 |
| | 97 |
|
| Current and non-current liabilities | 197 |
| | 9 |
| | 5 |
|
| Total liabilities | 197 |
| | 9 |
| | 5 |
|
| Noncontrolling interest | 9 |
| | 93 |
| | 60 |
|
| Net assets less noncontrolling interests | $ | 344 |
| | $ | 613 |
| | $ | 32 |
|
Entities that are not Consolidated
The Company has interests in entities that are considered VIEs under ASC 810, Consolidation, but for which it(a) DGPV Funds is not considered the primary beneficiary. The Company accounts for its interests in these entities under the equity method of accounting.
Utah Solar Portfolio Assets — As described in Note 3, Business Acquisitions, as part of the March 2017 Drop Down Assets acquisition, the Company acquired from NRG 100% of the Class A equity interests in the Utah Solar Portfolio, comprised of Four BrothersClearway & EFS Distributed Solar LLC, Granite Mountain Holdings,Golden Puma Fund LLC, Renew Solar CS4 Fund LLC and Iron Springs Holdings, LLC. The Class B interests of the Utah Solar PortfolioChestnut Fund LLC, which are owned by aall tax equity investor, orfunds.
(b) Daggett Partnerships includes Daggett 2 TargetCo LLC, which consolidates Daggett 2 TE Investor, who receives 99% of allocations of taxable incomeHoldco LLC, a consolidated VIE, and other items until the flip point,Daggett Renewable Holdco LLC, which occurs when theconsolidates Daggett TE Investor obtainsHoldco LLC, a specified return on its initial investment, atconsolidated VIE.
(c) Lighthouse Renewable Holdco LLC consolidates Black Rock TE Holdco LLC and Mililani TE Holdco LLC, which time the allocations to the TE Investor change to 50%. The Company generally receives 50% of distributable cash throughout the term of the tax-equity arrangements. The three entities comprising the Utah Solar Portfolio are consolidated VIEs. As the Company is not the primary beneficiary, the Company uses the equity method of accounting to account for its interests in the Utah Solar Portfolio. The Company utilizes the HLBV method to determine its share of the income or losses in the investees.
NRG DGPV Holdco 1 LLC — The Company and NRG are parties to the NRG DGPV Holdco 1 LLC partnership, or DGPV Holdco 1, the purpose of which is to own or purchase solar power generation projects and other ancillary related assets from NRG Renew LLC or its subsidiaries via intermediate funds. The Company owns approximately 47 MW of distributed solar capacity, based on cash to be distributed, with a weighted average contract life of 18 years. Under this partnership, the Company committed to fund up to $100 million of capital.
NRG DGPV(d) Lighthouse Renewable Holdco 2 LLC — The Companyconsolidates Mesquite Sky TE Holdco LLC, Mesquite Star Tax Equity Holdco LLC and NRGTSN1 TE Holdco LLC, which are parties toconsolidated VIEs.
| | | | | | | | | | | | | | | | | | | | | | | | | | | | | | | | | | | |
| (In millions) | Oahu Solar LLC | | Rattlesnake TE Holdco LLC | | Rosie TargetCo LLC | | VP-Arica TargetCo LLC (a) | | Wildorado TE Holdco LLC | | Other (b) |
| Other current and non-current assets | $ | 38 | | | $ | 13 | | | $ | 298 | | | $ | 101 | | | $ | 20 | | | $ | 24 | |
| Property, plant and equipment | 157 | | | 176 | | | 507 | | | 960 | | | 194 | | | 238 | |
| Intangible assets | — | | | — | | | — | | | — | | | — | | | 16 | |
| Total assets | 195 | | | 189 | | | 805 | | | 1,061 | | | 214 | | | 278 | |
| Current and non-current liabilities | 22 | | | 17 | | | 376 | | | 834 | | | 18 | | | 85 | |
| Total liabilities | 22 | | | 17 | | | 376 | | | 834 | | | 18 | | | 85 | |
| Noncontrolling interest | 23 | | | 77 | | | 181 | | | 67 | | | 99 | | | 95 | |
| Net assets less noncontrolling interest | $ | 150 | | | $ | 95 | | | $ | 248 | | | $ | 160 | | | $ | 97 | | | $ | 98 | |
| | | | | | | | | | | |
| | | | | | | | | | | |
| | | | | | | | | | | |
(a) VP-Arica TargetCo LLC consolidates VP-Arica TE Holdco LLC, a consolidated VIE that owns the NRG DGPV Holdco 2 LLC partnership, or DGPV Holdco 2, the purpose of whichVictory Pass and Arica solar projects.
(b) Other is to own or hold solar power generation projects as well as other ancillary related assets from NRG Renew LLC or its subsidiaries. The Company owns approximately 113 MW of distributed solar capacity, based on cash to be distributed, with a weighted average contract life of 21 years. Under this partnership, the Company committed to fund up to $60 million of capital.
NRG DGPV Holdco 3 LLC— On September 26, 2017, the Company entered into an additional partnership with NRG by forming NRG DGPV Holdco 3 LLC, or DGPV Holdco 3, in which the Company would invest up to $50 million in an operating portfolio of distributed solar assets, primarily comprised of community solar projects, developed by NRG. The Company owns approximately 43 MW of distributed solar capacity, based on cash to be distributed, with a weighted average contract life of approximately 20 years as of December 31, 2017.Elbow Creek TE Holdco LLC, Pinnacle Repowering TE Holdco LLC and the Spring Canyon projects.
The Company's maximum exposure to loss is limited to its equity investment in DGPV Holdco 1, DGPV Holdco 2 and DGPV Holdco 3, which was $176 million on a combined basis.NRG RPV Holdco 1 LLC — The Company and NRG are parties to the NRG RPV Holdco 1 LLC partnership, or RPV Holdco, the purpose of which is to hold operating portfolios of residential solar assets developed by NRG's residential solar business, including: (i) an existing, unlevered portfolio of over 2,200 leases across nine states representing approximately 14 MW, based on cash to be distributed, with a weighted average remaining lease term of approximately 15 years that was acquired outside of the partnership; and (ii) a tax equity-financed portfolio of approximately 5,400 leases representing approximately 30 MW, based on cash to be distributed, with a weighted average remaining lease term for the existing and new leases of approximately 18 years. The Company has fully funded the partnership as of December 31, 2017.
The Company's maximum exposure to loss is limited to its equity investment, which was $58 million as of December 31, 2017.
Note 6 — Fair Value of Financial Instruments
For cash and cash equivalents, restricted cash, accounts receivable — affiliate, accounts receivable, accounts payable, current portion of accounts payable — affiliate, accrued expenses and other liabilities, the carrying amount approximates fair value because of the short-term maturity of those instruments and are classified as Level 1 within the fair value hierarchy.
The estimated carrying amounts and fair values of the Company’s recorded financial instruments not carried at fair market value are as follows:
|
| | | | | | | | | | | | | | | |
| | As of December 31, 2017 | | As of December 31, 2016 |
| | Carrying Amount | | Fair Value | | Carrying Amount | | Fair Value |
| | (In millions) |
| Assets: | | | | | | | |
| Notes receivable, including current portion | $ | 13 |
| | $ | 13 |
| | $ | 30 |
| | $ | 30 |
|
| Liabilities: | | | | | | | |
| Long-term debt, including current portion — affiliate | 618 |
| | 618 |
| | 618 |
| | 608 |
|
| Long-term debt, including current portion — external | $ | 5,281 |
| | $ | 5,297 |
| | $ | 5,516 |
| | $ | 5,500 |
|
Fair Value Accounting under ASC 820
ASC 820 establishes a fair value hierarchy that prioritizes the inputs to valuation techniques used to measure fair value into three levels as follows:
•Level 1—quoted prices (unadjusted) in active markets for identical assets or liabilities that the Company has the ability to access as of the measurement date.
•Level 2—inputs other than quoted prices included within Level 1 that are directly observable for the asset or liability or indirectly observable through corroboration with observable market data.
•Level 3—unobservable inputs for the asset or liability only used when there is little, if any, market activity for the asset or liability at the measurement date.
In accordance with ASC 820, the Company determines the level in the fair value hierarchy within which each fair value measurement in its entirety falls, based on the lowest level input that is significant to the fair value measurement.
For cash and cash equivalents, restricted cash, accounts receivable — trade, note receivable - affiliate, accounts payable — trade, accounts payable — affiliates and accrued expenses and other current liabilities, the carrying amounts approximates fair value because of the short-term maturity of those instruments and are classified as Level 1 within the fair value hierarchy.
The carrying amounts and estimated fair values of the Company’s recorded financial instruments not carried at fair market value or that do not approximate fair value are as follows:
| | | | | | | | | | | | | | | | | | | | | | | |
| As of December 31, 2023 | | As of December 31, 2022 |
| Carrying Amount | | Fair Value | | Carrying Amount | | Fair Value |
| (In millions) |
| | | | | | | |
| | | | | | | |
| Liabilities: | | | | | | | |
| Long-term debt, including current portion — affiliate | $ | 1 | | | $ | 1 | | | $ | 2 | | | $ | 2 | |
Long-term debt, including current portion — external (a) | 8,102 | | | 7,611 | | | 6,874 | | | 6,288 | |
(a) Excludes net debt issuance costs, which are recorded as a reduction to long-term debt on the Company’s consolidated balance sheets.
The fair value of the Company'sCompany’s publicly-traded long-term debt is based on quoted market prices and is classified as Level 2 within the fair value hierarchy. The fair value of debt securities, non-publicly traded long-term debt, affiliate debt and certain notes receivable of the Company are based on expected future cash flows discounted at market interest rates, or current interest rates for similar instruments with equivalent credit quality and are classified as Level 3 within the fair value hierarchy. The following table presents the level within the fair value hierarchy for long-term debt, including current portion as of December 31, 2017 and 2016:portion:
| | | | | | | | | | | | | | | | | | | | | | | |
| As of December 31, 2023 | | As of December 31, 2022 |
| Level 2 | | Level 3 | | Level 2 | | Level 3 |
| | (In millions) |
| Long-term debt, including current portion | $ | 1,940 | | | $ | 5,672 | | | $ | 1,836 | | | $ | 4,454 | |
| | | | | | | |
| | | | | | | |
|
| | | | | | | | | | | | | | | |
| | As of December 31, 2017 | | As of December 31, 2016 |
| | Level 2 | | Level 3 | | Level 2 | | Level 3 |
| | (In millions) |
| Long-term debt, including current portion | $ | 870 |
| | $ | 5,045 |
| | $ | 833 |
| | $ | 5,275 |
|
Recurring Fair Value Measurements
The Company records its derivative assets and liabilities at fair market value on its consolidated balance sheet.sheets. The following table presents assets and liabilities measured and recorded at fair value on the Company'sCompany’s consolidated balance sheets on a recurring basis and their level within the fair value hierarchy:
|
| | | | | | | | | | | | |
| | As of December 31, 2017 | | As of December 31, 2016 |
| | | Fair Value (a) | | Fair Value (a) | | Fair Value (a) |
| (In millions) | | Level 2 | | Level 1 | | Level 2 |
| Derivative assets: | | | | | | |
| Commodity contracts | | $ | 1 |
| | $ | 1 |
| | $ | 1 |
|
| Interest rate contracts | | 1 |
| | — |
| | 1 |
|
| Total assets | | $ | 2 |
| | 1 |
| | 2 |
|
| Derivative liabilities: | | | | | | |
| Commodity contracts | | $ | 1 |
| | — |
| | 1 |
|
| Interest rate contracts | | 47 |
| | — |
| | 78 |
|
| Total liabilities | | $ | 48 |
| | $ | — |
| | $ | 79 |
|
| | | | | | | | | | | | | | | | | | | | | | | | | |
| As of December 31, 2023 | | As of December 31, 2022 |
| Fair Value | | Fair Value (a) | | Fair Value | | | | Fair Value (a) |
| (In millions) | Level 2 (b) | | Level 3 | | Level 2 | | | | Level 3 |
| Derivative assets | | | | | | | | | |
Energy-related commodity contracts (c) | $ | 2 | | | $ | — | | | $ | — | | | | | $ | — | |
| Interest rate contracts | 121 | | | — | | | 89 | | | | | — | |
Other financial instruments (d) | — | | | 13 | | | — | | | | | 17 | |
| Total assets | $ | 123 | | | $ | 13 | | | $ | 89 | | | | | $ | 17 | |
| Derivative liabilities | | | | | | | | | |
Energy-related commodity contracts (e) | $ | — | | | $ | 330 | | | $ | — | | | | | $ | 353 | |
| Interest rate contracts | 2 | | | — | | | — | | | | | — | |
| Total liabilities | $ | 2 | | | $ | 330 | | | $ | — | | | | | $ | 353 | |
(a)There were no derivative assets or liabilities classified as Level 1 as of December 31, 2017. There were no derivative assets or liabilities classified Level 32023 and 2022.
(b)The Company’s interest rate swaps are measured at fair value using an income approach, which use readily observable inputs, such as of December 31, 2017forward interest rates (e.g., SOFR) and 2016.contractual terms to estimate fair value.
(c) Includes long-term backbone transportation service contracts entered into by El Segundo and Walnut Creek during 2023.
(d) Includes SREC contract.
(e) Includes $325 million related to long-term power commodity contracts and $5 million related to short-term heat rate call option contracts entered into by El Segundo, Marsh Landing and Walnut Creek during 2023.
The following table reconciles the beginning and ending balances for instruments that are recognized at fair value in the consolidated financial statements using significant unobservable inputs:
| | | | | | | | | | | | | | | | | | |
| | | | Year ended December 31, |
| | | | | | 2023 | | 2022 |
| (In millions) | | | | Fair Value Measurement Using Significant Unobservable Inputs (Level 3) |
| Beginning balance | | | | | | $ | (336) | | | $ | (154) | |
| Settlements | | | | | | 28 | | | 61 | |
| | | | | | | | |
| Additions due to loss of NPNS exception | | | | | | — | | | (22) | |
| Total losses for the period included in earnings | | | | | | (9) | | | (221) | |
| Ending balance | | | | | | $ | (317) | | | $ | (336) | |
| Change in unrealized losses included in earnings for derivatives and other financial instruments held as of December 31, | | | | | | $ | (9) | | | $ | (221) | |
Derivative and Financial Instruments Fair Value Measurements
The Company'sCompany’s contracts are non-exchange-traded and valued using prices provided by external sources. For the Company’s energy markets, management receives quotes from multiple sources.The Company uses quoted observable forward prices to value its energy-related commodity contracts, which includes long-term power commodity contracts and heat rate call option contracts. To the extent that multiple quotesobservable forward prices are received,not available, the quoted prices reflect the average of the bid-ask mid-pointforward prices obtained from all sources believedthe prior year, adjusted for inflation. As of December 31, 2023, contracts valued with prices provided by models and other valuation techniques make up 99% of derivative liabilities and 100% of other financial instruments.
The Company’s significant positions classified as Level 3 include physical and financial energy-related commodity contracts executed in illiquid markets. The significant unobservable inputs used in developing fair value include illiquid power tenors and location pricing, which is derived by extrapolating pricing as a basis to provideliquid locations. The tenor pricing and basis spread are based on observable market data when available or derived from historic prices and forward market prices from similar observable markets when not available.
The following table quantifies the most liquid market forsignificant unobservable inputs used in developing the commodity.fair value of the Company’s Level 3 positions as of December 31, 2023:
| | | | | | | | | | | | | | | | | | | | | | | |
| December 31, 2023 |
| Fair Value | | Input/Range |
| Assets | Liabilities | Valuation Technique | Significant Unobservable Input | Low | High | Weighted Average |
| (In millions) | | | | | |
| Long-term Power Commodity Contracts | $ | — | | $ | 325 | | Discounted Cash Flow | Forward Market Price (per MWh) | $ | 18.18 | | $ | 81.62 | | $ | 39.91 | |
| Heat Rate Call Option Commodity Contracts | — | | 5 | | Option Model | Forward Market Price (per MWh) | $ | (43.96) | | $ | 343.61 | | $ | 64.34 | |
| | | Option Model | Forward Market Price (per MMBtu) | $ | 1.25 | | $ | 13.69 | | $ | 4.93 | |
| Other Financial Instruments | 13 | | — | | Discounted Cash Flow | Forecast annual generation levels of certain DG solar facilities | 60,801 MWh | 121,602 MWh | 115,622 MWh |
The following table provides the impact on the fair value measurements to increases/(decreases) in significant unobservable inputs as of December 31, 2023:
| | | | | | | | | | | | | | |
| Type | Significant Observable Input | Position | Change In Input | Impact on Fair Value Measurement |
| Energy-Related Commodity Contracts | Forward Market Price Power | Sell | Increase/(Decrease) | Lower/(Higher) |
| Energy-Related Commodity Contracts | Forward Market Price Gas | Sell | Increase/(Decrease) | Higher/(Lower) |
| Other Financial Instruments | Forecast Generation Levels | Sell | Increase/(Decrease) | Higher/(Lower) |
The fair value of each contract is discounted using a risk freerisk-free interest rate. In addition, a credit reserve is applied to reflect credit risk, which is, for interest rate swaps, is calculated based on credit default swaps utilizingusing the bilateral method. For commodities, to the extent that NRG's net exposurethe Net Exposure under a specific master agreement is an asset, the Company uses the counterparty'scounterparty’s default swap rate. If the exposureNet Exposure under a specific master agreement is a liability, the Company uses NRG'sa proxy of its own default swap rate. For interest rate swaps and commodities, the credit reserve is added to the discounted fair value to reflect the exit price that a market participant would be willing to receive to assume the liabilities or that a market participant would be willing to pay for the assets. As of December 31, 2017,2023, the creditnon-performance reserve resultedwas a $15 million gain recorded primarily to total operating revenues in a $1 million increase in fair value in interest expense.the consolidated statements of income. It is possible that future market prices could vary from those used in recording assets and liabilities and such variations could be material.
Concentration of Credit Risk
In addition to the credit risk discussion as disclosed inNote 2, Summary of Significant Accounting Policies, the following item is a discussion of the concentration of credit risk for the Company'sCompany’s financial instruments. Credit risk relates to the risk of loss resulting from non-performance or non-payment by counterparties pursuant to the terms of their contractual obligations. The Company monitors and manages credit risk through credit policies that include: (i) an established credit approval process; (ii) daily monitoring of counterparties'counterparties’ credit limits;limits on as needed basis; (iii) as applicable, the use of credit mitigation measures such as margin, collateral, prepayment arrangements, or volumetric limits; (iv) the use of payment netting agreements; and (v) the use of master netting agreements that allow for the netting of positive and negative exposures of various contracts associated with a single counterparty. Risks surrounding counterparty performance and credit could ultimately impact the amount and timing of expected cash flows. The Company seeks to mitigate counterparty risk by having a diversified portfolio of counterparties.
Counterparty credit exposure includes credit risk exposure under certain long-term agreements, including solar and other PPAs. As external sources or observable market quotes are not available to estimate such exposure, the Company estimates the exposure related to these contracts based on various techniques including, but not limited to, internal models based on a fundamental analysis of the market and extrapolation of observable market data with similar characteristics. Based on these valuation techniques, as of December 31, 2017, credit risk exposure to these counterparties attributable to the Company's ownership interests was approximately $2.7 billion for the next five years. The majorityA significant portion of these powerenergy-related commodity contracts are with utilities with strong credit quality and public utility commission or other regulatory support. However, such regulated utility counterparties can be impacted by changes in government regulations or adverse financial conditions, which the Company is unable to predict. Certain subsidiaries of the Company sell the output of their facilities to PG&E, a significant counterparty of the Company, under long-term PPAs, and PG&E’s credit rating is below investment-grade.
Note 7 — Accounting for Derivative Instruments and Hedging Activities
ASC 815 requires the Company to recognize all derivative instruments on the balance sheet as either assets or liabilities and to measure them at fair value each reporting period unless they qualify for a NPNS exception. The Company may elect to designate certain derivatives as cash flow hedges, if certain conditions are met, and defer the change in fair value of the derivatives to accumulated OCI/OCL, until the hedged transactions occur and are recognized in earnings. For derivatives that are not designated as cash flow hedges or do not qualify for hedge accounting treatment, the changes in the fair value will be immediately recognized in earnings. Certain derivative instruments may qualify for the NPNS exception and are therefore exempt from fair value accounting treatment. ASC 815 applies to the Company's energy relatedCompany’s energy-related commodity contracts and interest rate swaps.
Energy-Related Commodities
To manageThe Company enters into interest rate swap agreements in order to hedge the commodity price risk associated with its competitive supply activities and the price risk associated with wholesale power sales, the Company may enter into derivative hedging instruments, namely, forward contracts that commit the Company to sell energy commodities or purchase fuels/electricity in the future. The objectives for entering into derivatives contracts designated as hedges include fixing the price for a portionvariability of anticipatedexpected future electricity sales and fixing the price of a portion of anticipated fuel/electricity purchases for the operation of its subsidiaries.cash interest payments. As of December 31, 2017,2023, the Company had forward contracts forinterest rate derivative instruments on non-recourse debt extending through 2040, a portion of which were designated as cash flow hedges. Under the purchase of fuel commodities relatinginterest rate swap agreements, the Company pays a fixed rate and the counterparties to the forecasted usageagreements pay a variable interest rate.
Energy-Related Commodity Contracts
As of December 31, 2023, the Company’s district energy centersCompany had energy-related derivative instruments extending through 2020 and electricity contracts to supply retail power to the Company's district energy centers extending through 2020.2033. At December 31, 2017,2023, these contracts were not designated as cash flow or fair value hedges.
Also, as of December 31, 2017, the Company had other energy-related contracts that did not meet the definition of a derivative instrument or qualified for the NPNS exception and were therefore exempt from fair value accounting treatment as follows:
Power tolling contracts through 2039, and
Natural gas transportation contracts through 2028.
Interest Rate Swaps
The Company is exposed to changes in interest rates through the issuance of variable rate debt. In order to manage interest rate risk, it enters into interest rate swap agreements.
As of December 31, 2017, the Company had interest rate derivative instruments on non-recourse debt extending through 2036, a portion of which are designated as cash flow hedges.
Volumetric Underlying Derivative Transactions
The following table summarizes the net notional volume buy/(sell) of the Company'sCompany’s open derivative transactions broken out by commodity as of December 31, 2017 and 2016:commodity:
| | | | | | | | | | | | | | | | | |
| | | Total Volume |
| | | December 31, 2023 | | December 31, 2022 |
| Commodity | Units | | (In millions) |
| Power | MWh | | (23) | | | (18) | |
| Natural Gas | MMBtu | | 17 | | | — | |
| Interest | Dollars | | $ | 2,467 | | | $ | 1,084 | |
|
| | | | | | | | | |
| | | | Total Volume |
| | | | December 31, 2017 | | December 31, 2016 |
| Commodity | Units | | (In millions) |
| Natural Gas | MMBtu | | 2 |
| | 3 |
|
| Interest | Dollars | | $ | 1,940 |
| | $ | 2,090 |
|
Fair Value of Derivative Instruments
The following table summarizes the fair value within the derivative instrument valuation on the consolidated balance sheet:sheets:
|
| | | | | | | | | | | | | | | |
| | Fair Value |
| | Derivative Assets (a) | | Derivative Liabilities |
| | December 31, 2017 | | December 31, 2016 | | December 31, 2017 | | December 31, 2016 |
| | (In millions) |
| Derivatives Designated as Cash Flow Hedges: | | | | | | | |
| Interest rate contracts current | $ | — |
| | $ | — |
| | $ | 4 |
| | $ | 26 |
|
| Interest rate contracts long-term | 1 |
| | 1 |
| | 9 |
| | 39 |
|
| Total Derivatives Designated as Cash Flow Hedges | 1 |
| | 1 |
| | 13 |
| | 65 |
|
| Derivatives Not Designated as Cash Flow Hedges: | | | | | | | |
| Interest rate contracts current | — |
| | — |
| | 12 |
| | 6 |
|
| Interest rate contracts long-term | — |
| | — |
| | 22 |
| | 7 |
|
| Commodity contracts current | 1 |
| | 2 |
| | 1 |
| | 1 |
|
| Total Derivatives Not Designated as Cash Flow Hedges | 1 |
| | 2 |
| | 35 |
| | 14 |
|
| Total Derivatives | $ | 2 |
| | $ | 3 |
| | $ | 48 |
| | $ | 79 |
|
(a) Derivative Asset balances classified as current are included within the prepayments and other current assets line item of the Consolidated Balance Sheet. Derivative Asset balances classified as long-term are included within the other non-current assets line item of the Consolidated Balance Sheet. | | | | | | | | | | | | | | | | | | | | | | | |
| | Fair Value |
| | Derivative Assets | | Derivative Liabilities |
| December 31, 2023 | | December 31, 2022 | | December 31, 2023 | | December 31, 2022 |
| (In millions) |
| Derivatives Designated as Cash Flow Hedges: | | | | | | | |
| Interest rate contracts current | $ | 7 | | | $ | 7 | | | $ | — | | | $ | — | |
| Interest rate contracts long-term | 12 | | | 18 | | | 2 | | | — | |
| Total Derivatives Designated as Cash Flow Hedges | $ | 19 | | | $ | 25 | | | $ | 2 | | | $ | — | |
| Derivatives Not Designated as Cash Flow Hedges: | | | | | | | |
| Interest rate contracts current | $ | 33 | | | $ | 19 | | | $ | — | | | $ | — | |
| Interest rate contracts long-term | 69 | | | 45 | | | — | | | — | |
| Energy-related commodity contracts current | 1 | | | — | | | 51 | | | 50 | |
| Energy-related commodity contracts long-term | 1 | | | — | | | 279 | | | 303 | |
| Total Derivatives Not Designated as Cash Flow Hedges | $ | 104 | | | $ | 64 | | | $ | 330 | | | $ | 353 | |
| Total Derivatives | $ | 123 | | | $ | 89 | | | $ | 332 | | | $ | 353 | |
The Company has elected to present derivative assets and liabilities on the balance sheet on a trade-by-trade basis and does not offset amounts at the counterparty master agreement level. As of December 31, 20172023 and 2016, there was no2022, the amount of outstanding collateral paid or received.received was immaterial. The following tables summarize the offsetting of derivatives by counterparty master agreement level:counterparty:
| | | | | | | | | | | | | | | | | |
| | | | | |
| Gross Amounts Not Offset in the Statement of Financial Position |
| As of December 31, 2023 | Gross Amounts of Recognized Assets/Liabilities | | Derivative Instruments | | Net Amount |
| Energy-related commodity contracts | (In millions) |
| Derivative assets | $ | 2 | | | $ | — | | | $ | 2 | |
| Derivative liabilities | (330) | | | — | | | (330) | |
| Total energy-related commodity contracts | $ | (328) | | | $ | — | | | $ | (328) | |
| Interest rate contracts | | | | | |
| Derivative assets | $ | 121 | | | $ | (2) | | | $ | 119 | |
| Derivative liabilities | (2) | | | 2 | | | — | |
| Total interest rate contracts | $ | 119 | | | $ | — | | | $ | 119 | |
| Total derivative instruments | $ | (209) | | | $ | — | | | $ | (209) | |
| | | | | | | | | | | | | | | | | |
| Gross Amounts Not Offset in the Statement of Financial Position |
| As of December 31, 2022 | Gross Amounts of Recognized Assets/Liabilities | | Derivative Instruments | | Net Amount |
| Energy-related commodity contracts | (In millions) |
| | | | | |
| Derivative liabilities | $ | (353) | | | $ | — | | | $ | (353) | |
| Total energy-related commodity contracts | $ | (353) | | | $ | — | | | $ | (353) | |
| Interest rate contracts | | | | | |
| Derivative assets | $ | 89 | | | $ | — | | | $ | 89 | |
| | | | | |
| Total interest rate contracts | $ | 89 | | | $ | — | | | $ | 89 | |
| Total derivative instruments | $ | (264) | | | $ | — | | | $ | (264) | |
|
| | | | | | | | | | | |
| Gross Amounts Not Offset in the Statement of Financial Position |
| As of December 31, 2017 | Gross Amounts of Recognized Assets/Liabilities | | Derivative Instruments | | Net Amount |
| Commodity contracts: | (In millions) |
| Derivative assets | $ | 1 |
| | $ | — |
| | $ | 1 |
|
| Derivative liabilities | (1 | ) | | — |
| | (1 | ) |
| Total commodity contracts | — |
| | — |
| | — |
|
| Interest rate contracts: | | | | | |
| Derivative assets | 1 |
| | (1 | ) | | — |
|
| Derivative liabilities | (47 | ) | | 1 |
| | (46 | ) |
| Total interest rate contracts | (46 | ) | | — |
| | (46 | ) |
| Total derivative instruments | $ | (46 | ) | | $ | — |
| | $ | (46 | ) |
|
| | | | | | | | | | | |
| | Gross Amounts Not Offset in the Statement of Financial Position |
| As of December 31, 2016 | Gross Amounts of Recognized Assets/Liabilities | | Derivative Instruments | | Net Amount |
| Commodity contracts: | (In millions) |
| Derivative assets | $ | 2 |
| | $ | — |
| | $ | 2 |
|
| Derivative liabilities | (1 | ) | | — |
| | (1 | ) |
| Total commodity contracts | 1 |
| | — |
| | 1 |
|
| Interest rate contracts: | | | | | |
| Derivative assets | 1 |
| | (1 | ) | | — |
|
| Derivative liabilities | (78 | ) | | 1 |
| | (77 | ) |
| Total interest rate contracts | (77 | ) | | — |
| | (77 | ) |
| Total derivative instruments | $ | (76 | ) | | $ | — |
| | $ | (76 | ) |
Accumulated Other Comprehensive LossIncome (Loss)
The following table summarizes the effects on the Company’s accumulated OCLOCI (OCL) balance attributable to interest rate swaps designated as cash flow hedge derivatives:
|
| | | | | | | | | | | |
| | Year ended December 31, |
| | 2017 | | 2016 | | 2015 |
| | (In millions) |
| Accumulated OCL beginning balance | $ | (86 | ) | | $ | (99 | ) | | $ | (82 | ) |
| Reclassified from accumulated OCL to income due to realization of previously deferred amounts | 17 |
| | 17 |
| | 17 |
|
| Mark-to-market of cash flow hedge accounting contracts | — |
| | (4 | ) | | (34 | ) |
| Accumulated OCL ending balance | (69 | ) | | (86 | ) | | (99 | ) |
| Accumulated OCL attributable to noncontrolling interests | (1 | ) | | (1 | ) | | (1 | ) |
| Accumulated OCL attributable to NRG Yield LLC | $ | (68 | ) | | $ | (85 | ) | | $ | (98 | ) |
| Losses expected to be realized from OCL during the next 12 months | $ | 15 |
| | | | |
| | | | | | | | | | | | | | | | | |
| Year ended December 31, |
| 2023 | | 2022 | | 2021 |
| (In millions) |
| Accumulated OCI (OCL) beginning balance | $ | 27 | | | $ | (13) | | | $ | (35) | |
| | | | | |
| Reclassified from accumulated OCI (OCL) to income due to realization of previously deferred amounts | (5) | | | 5 | | | 11 | |
| Capistrano Wind Portfolio Acquisition | — | | | 7 | | | — | |
| Mark-to-market of cash flow hedge accounting contracts | (2) | | | 28 | | | 11 | |
| Accumulated OCI (OCL) ending balance | $ | 20 | | | $ | 27 | | | $ | (13) | |
| Accumulated OCI attributable to noncontrolling interests | 5 | | | 6 | | | — | |
| Accumulated OCI (OCL) attributable to Clearway Energy LLC | $ | 15 | | | $ | 21 | | | $ | (13) | |
| Income expected to be realized from OCI during the next 12 months | $ | 5 | | | | | |
Amounts reclassified from accumulated OCLOCI (OCL) into income are recorded to interest expense.
Accounting guidelines require a high degree of correlation between the derivative and the hedged item throughout the period in order to qualify as a cash flow hedge. As of December 31, 2016, the Company's regression analysis for Viento Funding II interest rate swaps, while positively correlated, did not meet the required threshold for cash flow hedge accounting. As a result, the Company de-designated the Viento Funding II cash flow hedges as of December 31, 2016, and will prospectively mark these derivatives to market through the income statement.
The Company's regression analysis for Marsh Landing, Walnut Creek and Avra Valley interest rate swaps, while positively correlated, no longer contain matching terms for cash flow hedge accounting. As a result, the Company voluntarily de-designated the Marsh Landing, Walnut Creek and Avra Valley cash flow hedges as of April 28, 2017, and will prospectively mark these derivatives to market through the income statement.
Impact of Derivative Instruments on the Consolidated Statements of Income
The Company has interest rate derivative instruments that are not designated as cash flow hedges. The effect of interest rate hedges is recorded to interest expense. For the years ended December 31, 2017, 2016 and 2015 the impactMark-to-market gains/(losses) related to the consolidated statements of income was a gain of $7 million, loss of $2 million and a gain of $17 million, respectively.
A portion of the Company’s derivative commodity contracts relates to its Thermal Business for the purchase of fuel/electricity commodities based on the forecasted usage of the thermal district energy centers. Realized gains and losses on these contractsderivatives are reflected in the costs that are permitted to be billed to customers through the related customer contracts or tariffs and, accordingly, no gains or losses are reflectedrecorded in the consolidated statements of income for these contracts.as follows:
In 2015, | | | | | | | | | | | | | | | | | |
| Year ended December 31, |
| 2023 | | 2022 | | 2021 |
| (In millions) |
| Interest Rate Contracts (Interest expense) | $ | (17) | | | $ | 100 | | | $ | 53 | |
Energy-Related Commodity Contracts (Mark-to-market for economic hedging activities included in Total operating revenues) (a) | 23 | | | (174) | | | (83) | |
Energy-Related Commodity Contracts (Mark-to-market for economic hedging activities included in Cost of operations) (b) | 2 | | | — | | | — | |
(a) Relates to long-term energy-related commodity contracts also hedged the forecasted sale of power for theat Elbow Creek, until the start of the PPA with NRG Power Marketing LLC, or Power Marketing, with effective date of November 1, 2015. The effect of theseMesquite Star, Mt. Storm, Langford and Mesquite Sky and short-term heat rate call option energy-related commodity hedges was recorded to operating revenues. Forcontracts at El Segundo, Marsh Landing and Walnut Creek. During the year ended December 31, 2015,2022, the impactenergy-related commodity contract for Langford, which previously met the NPNS exception, no longer qualified for NPNS treatment and, accordingly, is accounted for as a derivative and marked to the consolidated statements of income was an unrealized loss of $2 million.fair value through operating revenues.
(b) Relates to long-term backbone transportation service energy-related commodity contracts at El Segundo and Walnut Creek.
See Note 6, Fair Value of Financial Instruments, for a discussion regarding concentration of credit risk.
Note 8 — Intangible Assets
Intangible Assets — The Company'sCompany’s intangible assets as of December 31, 20172023 and 20162022 primarily reflect intangible assets established from its business acquisitions and are comprised of the following:
•PPAs — Established predominantly with the acquisitions of the Alta Wind Portfolio, Walnut Creek, Tapestry, and Laredo Ridge, theseCarlsbad Energy Center, Agua Caliente, the Utah Solar Portfolio and the Capistrano Wind Portfolio. These represent the fair value of the PPAs acquired. These are amortized generally on a straight-line basis, over the term of the PPA.
•Leasehold Rights —Established with the acquisition of the Alta Wind Portfolio, this represents the fair value of contractual rights to receive royalty payments equal to a percentage of PPA revenue from certain projects. These are amortized onas a straight-line basis.
Customer relationships — Established with the acquisition of NRG Energy Center Phoenix and NRG Energy Center
Omaha, these intangibles represent the fair value at the acquisition date of the businesses' customer base. The customer relationships are amortizedreduction to depreciation and amortization expense based on the expected discounted future net cash flows by year.
Customer contracts — Established with the acquisition of NRG Energy Center Phoenix, these intangibles represent the fair value at the acquisition date of contracts that primarily provide chilled water, steam and electricity to its customers. These contracts are amortized to revenues based on expected volumes.
| |
• | Emission Allowances — These intangibles primarily consist of SO2 and NOx emission allowances established with the El Segundo and Walnut Creek acquisitions. These emission allowances are held-for-use and are amortized to cost of operations, with NOx allowances amortized on a straight-line basis and SO2 allowances amortized based on units of production.
|
Development rights — Arising primarily from the acquisition of solar businesses in 2010 and 2011, these intangibles are amortized to depreciation and amortization expenseoperating revenue on a straight-line basis over the estimated lifeterm of the related project portfolio.PPAs.
•Emission Allowances —These intangibles primarily consist of SO2 and NOx emission allowances established with the El Segundo, Walnut Creek and Carlsbad Energy Center acquisitions. These emission allowances are held-for-use and are amortized to cost of operations, with NOx allowances amortized on a straight-line basis and SO2 allowances amortized based on units of production.
•Other — Consists primarily of a) the acquisition date fair value of the contractual rights to a ground lease for South Trent and to utilize certain interconnection facilities for Blythe as well as land rights acquired in connection with the acquisition of Elbow Creek.
Creek; b) development rights related to certain solar business acquisitions; c) purchased software for certain solar projects; d) RECs acquired in connection with the acquisition of the Utah Solar Portfolio; and e) favorable land leases acquired in connection with the acquisition of the Utah Star Portfolio.The following tables summarize the components of intangible assets subject to amortization:
| | | | | | | | | | | | | | | | | | | | | | | | | | | | | | | | | |
| Year ended December 31, 2023 | PPAs | | Leasehold Rights | | Emission Allowances | | | | Other | | Total | | |
| (In millions) | | | | | | | | | | | | | |
| January 1, 2023 | $ | 3,321 | | | $ | 86 | | | $ | 17 | | | | | $ | 18 | | | $ | 3,442 | | | |
| Walnut Creek PPA expiration | (50) | | | — | | | — | | | | | — | | | (50) | | | |
| Other | (6) | | | — | | | — | | | | | (3) | | | (9) | | | |
| | | | | | | | | | | | | |
| December 31, 2023 | 3,265 | | | 86 | | | 17 | | | | | 15 | | | 3,383 | | | |
| Less accumulated amortization | (962) | | | (38) | | | (4) | | | | | (5) | | | (1,009) | | | |
| Net carrying amount | $ | 2,303 | | | $ | 48 | | | $ | 13 | | | | | $ | 10 | | | $ | 2,374 | | | |
|
| | | | | | | | | | | | | | | | | | | | | | | | | | | | | | | |
| Year ended December 31, 2017 | PPAs | | Leasehold Rights | | Customer
Relationships | | Customer Contracts | | Emission Allowances | | Development
Rights | | Other | | Total |
| (In millions) | | | |
| January 1, 2017 | $ | 1,286 |
| | $ | 86 |
| | $ | 66 |
| | $ | 15 |
| | $ | 9 |
| | $ | 3 |
| | $ | 6 |
| | $ | 1,471 |
|
Asset impairments (a) | (6 | ) | | — |
| | — |
| | — |
| | — |
| | — |
| | — |
| | (6 | ) |
| December 31, 2017 | 1,280 |
| | 86 |
| | 66 |
| | 15 |
| | 9 |
| | 3 |
| | 6 |
| | 1,465 |
|
| Less accumulated amortization | (205 | ) | | (13 | ) | | (5 | ) | | (8 | ) | | (3 | ) | | (1 | ) | | (2 | ) | | (237 | ) |
| Net carrying amount | $ | 1,075 |
| | $ | 73 |
| | $ | 61 |
| | $ | 7 |
| | $ | 6 |
| | $ | 2 |
| | $ | 4 |
| | $ | 1,228 |
|
| | | | | | | | | | | | | | | | | | | | | | | | | | | | | | | | | | | |
| Year ended December 31, 2022 | PPAs | | Leasehold Rights | | | | | | Emission
Allowances | | | | Other | | Total |
| (In millions) | | | | | | | | | | | | | | | |
| January 1, 2022 | $ | 2,985 | | | $ | 86 | | | | | | | $ | 17 | | | | | $ | 16 | | | $ | 3,104 | |
Acquisitions (a) | 336 | | | — | | | | | | | — | | | | | — | | | 336 | |
| Other | — | | | — | | | | | | | — | | | | | 2 | | | 2 | |
| December 31, 2022 | 3,321 | | | 86 | | | | | | | 17 | | | | | 18 | | | 3,442 | |
| Less accumulated amortization | (833) | | | (34) | | | | | | | (4) | | | | | (6) | | | (877) | |
| Net carrying amount | $ | 2,488 | | | $ | 52 | | | | | | | $ | 13 | | | | | $ | 12 | | | $ | 2,565 | |
(a)$6 millionThe weighted average life of asset impairments relate to one of the November 2017 Drop Down Assets thatacquired intangibles was recorded by NRG during the quarter ended September 30, 2017, as further described in Note 9, Asset Impairments.
|
| | | | | | | | | | | | | | | | | | | | | | | | | | | | | | | |
| Year ended December 31, 2016 | PPAs | | Leasehold Rights | | Customer
Relationships | | Customer Contracts | | Emission Allowances | | Development
Rights | | Other | | Total |
| (In millions) | |
| January 1, 2016 | $ | 1,286 |
| | $ | 86 |
| | $ | 66 |
| | $ | 15 |
| | $ | 15 |
| | $ | 3 |
| | $ | 6 |
| | $ | 1,477 |
|
| Other | — |
| | — |
| | — |
| | — |
| | (6 | ) | | — |
| | — |
| | (6 | ) |
| December 31, 2016 | 1,286 |
| | 86 |
| | 66 |
| | 15 |
| | 9 |
| | 3 |
| | 6 |
| | 1,471 |
|
| Less accumulated amortization | (143 | ) | | (9 | ) | | (4 | ) | | (7 | ) | | (2 | ) | | (1 | ) | | (2 | ) | | (168 | ) |
| Net carrying amount | $ | 1,143 |
| | $ | 77 |
| | $ | 62 |
| | $ | 8 |
| | $ | 7 |
| | $ | 2 |
| | $ | 4 |
| | $ | 1,303 |
|
The Company recorded amortization expense of $71$186 million, during each of years ended December 31, 2017$174 million and 2016, and $56$143 million during the year ended December 31, 2015. Of these amounts, $70 million for each of the years ended December 31, 20172023, 2022 and 2016,2021, respectively. Of these amounts, $181 million, $168 million and $55$135 million forduring the yearyears ended December 31, 2015,2023, 2022 and 2021, respectively, were related to the amortization of intangible assets for power purchase agreements and were recorded to contract amortization expense, andwhich reduced operating revenues in the consolidated statements of operations.income. The Company estimates the future amortization expense for its intangibles to be $71 million for the next five years through 2022.as follows:
Out-of-market contracts — The out-of-market contract liability represents the out-of-market value of the PPAs for the Blythe solar project and Spring Canyon wind projects and the out-of-market value of the land lease for Alta Wind XI, LLC, as of their respective acquisition dates. The Blythe solar project's liability of $7 million was recorded to other non-current liabilities on the consolidated balance sheet and is amortized to revenue in the consolidated statements of income on a units-of-production basis over the twenty-year term of the agreement. Spring Canyon's liability of $3 million was recorded to other non-current liabilities and is amortized to revenue on a straight-line basis over the twenty-five year term of the agreement. The Alta Wind XI, LLC's liability of $5 million was recorded to other non-current liabilities and is amortized as a reduction to cost of operations on a straight-line basis over the thirty-four year term of the land lease. At December 31, 2017, accumulated amortization of out-of-market contracts was $4 million and amortization expense was $1 million for each of the years ended December 31, 2017 and 2016. | | | | | | |
| (In millions) | |
| 2024 | $ | 184 | | |
| 2025 | 184 | | |
| 2026 | 184 | | |
| 2027 | 183 | | |
| 2028 | 183 | | |
Note 9 — Asset Impairments
2023 Impairment Losses
During the fourth quarter ended December 31, 2017, asof 2023, in preparation and review of its annual budget, the Company updated its estimated cash flows in connection withlong-term estimates of operating and capital expenditures and revised its assessment of long-term merchant power prices, which was primarily informed by present conditions and did not contemplate future policy changes, which could impact renewable energy power prices. The impairment analysis reviews certain qualitative factors as well as the preparationresults of long-term operating expectations and review ofits carrying value to determine if impairment indicators are present. The impairment analysis indicated that the Company's annual budget, the Company determined that theprojected future cash flows for Elbow Creek, located in Texas, andcertain projects within the Forward project, located in Pennsylvania, were belowRenewables segment no longer supported the recoverability of the carrying value of the related assets,long-lived assets. As such, the Company recorded an impairment loss of $12 million, which primarily driven by continued declining merchant power prices in post-contract periods,related to property, plant, and thatequipment to reflect the assets were considered impaired.at fair market value. The fair value of the facilities was determined using an income approach by applying a discounted cash flow methodology to the updated long-term budgets for each respective plant. The income approach utilized estimates of discounted future cash flows, which were Level 3 fair value measurement and includeincluded key inputs such as forecasted merchant power prices, operations and maintenance expense, and discount rates. The Company measured the impairment loss as the difference between the carrying amount and theresulting fair value ofis a Level 3 fair value measurement.
2022 Impairment Losses
The impairment analysis indicated that the assets and recorded impairment losses of $26 million and $5 million for Elbow Creek and Forward, respectively.
Additionally, during the quarter ended September 30, 2017, in connection with the preparation of the model for sale of the November 2017 Drop Down Assets, it was identified that undiscounted cash flows were lower than the book value of certain SPP funds and NRG recorded an impairment expense of $13 million, $8 million of which relates to property, plant, and equipment and $5 million to PPAs, as described in Note 8, Intangible Assets. In accordance with the guidance for transfer of assets under common control, the impairment is reflected in the Company's consolidated statements of operations for the period ended December 31, 2017.
During the fourth quarter of 2016, as the Company updated its estimated cash flows in connection with the preparation and review of the Company's annual budget, the Company determined that theprojected future cash flows for certain projects within the Elbow Creek and Goat Wind projects andRenewables segment no longer supported the Forward project were belowrecoverability of the carrying value of the related assets,long-lived assets. As such, the Company recorded an impairment loss of $16 million, which primarily driven by declining merchant power prices in post-contract periods,related to property, plant, and thatequipment to reflect the assets were considered impaired. These projects were acquired in connection with the acquisition of the November 2015 Drop Down Assets and were recorded as part of the Renewables segment of the Company. The projects were recorded at historical cost at acquisition date as they were related to interests under common control by NRG.fair market value. The fair value of the facilities was determined using an income approach by applying a discounted cash flow methodology to the updated long-term budgets for each respective plant. The income approach utilized estimates of discounted future cash flows, which were Level 3 fair value measurement and includeincluded key inputs such as forecasted merchant power prices, operations and maintenance expense, and discount rates. The resulting fair value is a Level 3 fair value measurement.
2021 Impairment Losses
The impairment analysis indicated that the projected future cash flows for several wind projects within the Renewables segment no longer supported the recoverability of the carrying value of the related long-lived assets. As such, the Company measured therecorded an impairment loss asof $6 million, which primarily related to property, plant, and equipment to reflect the difference between the carrying amount and theassets at fair market value. The fair value of the assets and recorded impairment losses of $117 million, $60 million and $6 million for Elbow Creek, Goat Wind, and Forward, respectively.
Other Impairments — During the fourth quarters of 2016 and 2015, NRG recorded impairment losses of approximately $2 million and $1 million, respectively, relatedfacilities was determined using an income approach by applying a discounted cash flow methodology to the projects that were part of the November 2017 Drop Down Assets. Since the acquisition by the Company of the November 2017 Drop Down Assets related to transfer of assets under common control, these impairments were reflected in the Company's consolidated statements ofupdated long-term budgets for each respective plant. The income approach included key inputs such as forecasted merchant power prices, operations for the periods ending December 31, 2016 and 2015.maintenance expense, and discount rates. The resulting fair value is a Level 3 fair value measurement.
Note 10 — Long-term Debt
The Company'sCompany’s borrowings, including short termshort-term and long termlong-term portions, consisted of the following:
|
| | | | | | | | | | | | | |
| | | December 31, 2017 | | December 31, 2016 | | Interest rate % (a) | | Letters of Credit Outstanding at December 31, 2017 |
| | | (In millions, except rates) | | |
| 2026 Senior Notes | | $ | 350 |
| | $ | 350 |
| | 5.000 | | |
| 2024 Senior Notes | | 500 |
| | 500 |
| | 5.375 | | |
| Long-term debt - affiliate, due 2020 | | 281 |
| | 281 |
| | 3.325 | | |
| Long-term debt - affiliate, due 2019 | | 337 |
| | 337 |
| | 3.580 | | |
NRG Yield LLC and NRG Yield Operating LLC Revolving Credit Facility, due 2019 (b) | | 55 |
| | — |
| | L+2.500 | | 74 |
|
| Project-level debt: | | | | | | | | |
| Agua Caliente Borrower 2, due 2038 | | 41 |
| | — |
| | 5.430 | | 17 |
|
| Alpine, due 2022 | | 135 |
| | 145 |
| | L+1.750 | | 16 |
|
| Alta Wind I - V lease financing arrangements, due 2034 and 2035 | | 926 |
| | 965 |
| | 5.696 - 7.015 | | 119 |
|
| CVSR, due 2037 | | 746 |
| | 771 |
| | 2.339 - 3.775 | | — |
|
| CVSR Holdco Notes, due 2037 | | 194 |
| | 199 |
| | 4.680 | | 13 |
|
| El Segundo Energy Center, due 2023 | | 400 |
| | 443 |
| | L+1.75 - L+2.375 | | 102 |
|
| Energy Center Minneapolis, due 2025 | | 83 |
| | 96 |
| | 5.950 | | — |
|
| Energy Center Minneapolis Series D Notes, due 2031 | | 125 |
| | 125 |
| | 3.550 | | — |
|
| Laredo Ridge, due 2028 | | 95 |
| | 100 |
| | L+1.875 | | 10 |
|
| Marsh Landing, due 2023 | | 318 |
| | 370 |
| | L+1.875 | | 22 |
|
| Tapestry, due 2021 | | 162 |
| | 172 |
| | L+1.625 | | 20 |
|
| Utah Solar Portfolio, due 2022 | | 278 |
| | 287 |
| | various | | 13 |
|
| Viento, due 2023 | | 163 |
| | 178 |
| | L+3.00 | | 27 |
|
| Walnut Creek, due 2023 | | 267 |
| | 310 |
| | L+1.625 | | 41 |
|
| Other | | 443 |
| | 505 |
| | various | | 38 |
|
| Subtotal project-level debt | | 4,376 |
| | 4,666 |
| | | | |
| Total debt | | 5,899 |
| | 6,134 |
| | | | |
| Less current maturities | | (306 | ) | | (323 | ) | | | | |
| Less net debt issuance costs | | (54 | ) | | (65 | ) | | | | |
| Total long-term debt | | $ | 5,539 |
| | $ | 5,746 |
| | | | |
| | | | | | | | | | | | | | | | | | | | | | | |
| December 31, 2023 | | December 31, 2022 | | Interest rate % (a)(b) | | Letters of Credit Outstanding at December 31, 2023 |
| (In millions, except rates) | | |
| | | | | | | |
| | | | | | | |
| Intercompany Note with Clearway, Inc. | $ | 1 | | | $ | 2 | | | 5.260 | | | |
| | | | | | | |
| | | | | | | |
| 2028 Senior Notes | 850 | | | 850 | | | 4.750 | | | |
| 2031 Senior Notes | 925 | | | 925 | | | 3.750 | | |
| 2032 Senior Notes | 350 | | | 350 | | | 3.750 | | |
Clearway Energy LLC and Clearway Energy Operating LLC Revolving Credit Facility, due 2023 (b) | — | | | — | | | S+1.850 | | $ | 246 | |
| | | | | | | |
| Non-recourse project-level debt: | — | | | | | | | |
| Agua Caliente Solar LLC, due 2037 | 612 | | | 649 | | | 2.395-3.633 | | 45 | |
| Alta Wind Asset Management LLC, due 2031 | 11 | | | 12 | | | S+2.775 | | — | |
| Alta Wind I-V lease financing arrangements, due 2034 and 2035 | 660 | | | 709 | | | 5.696-7.015 | | 67 | |
| Alta Wind Realty Investments LLC, due 2031 | 20 | | | 22 | | | 7.000 | | — | |
| Borrego, due 2024 and 2038 | 48 | | | 51 | | | Various | | 4 | |
| Broken Bow, due 2031 | 41 | | | 45 | | | S+2.100 | | 6 | |
| Buckthorn Solar, due 2025 | 116 | | | 119 | | | S+2.100 | | 20 | |
| Carlsbad Energy Holdings LLC, due 2027 | 93 | | | 115 | | | S+1.900 | | 63 | |
| Carlsbad Energy Holdings LLC, due 2038 | 407 | | | 407 | | | 4.120 | | — | |
| Carlsbad Holdco, LLC, due 2038 | 195 | | | 197 | | | 4.210 | | 5 | |
| Cedro Hill, due 2024 and 2029 | 165 | | | 82 | | | S+1.375 | | — | |
| Crofton Bluffs, due 2031 | 27 | | | 29 | | | S+2.100 | | 3 | |
| CVSR, due 2037 | 601 | | | 627 | | | 2.339-3.775 | | — | |
| CVSR Holdco Notes, due 2037 | 152 | | | 160 | | | 4.680 | | 12 | |
| Daggett 2, due 2028 | 156 | | | — | | | S+1.762 | | 36 | |
| Daggett 3, due 2028 | 217 | | | — | | | S+1.762 | | 43 | |
| DG-CS Master Borrower LLC, due 2040 | 385 | | | 413 | | | 3.510 | | | 30 | |
| | | | | | | |
| | | | | | | |
Mililani I, due 2027 (c) | — | | | 47 | | | S+1.600 | | — | |
Mililani Class B Member Holdco LLC, due 2028 (c) | 92 | | | — | | | S+1.600 | | 18 | |
| NIMH Solar, due 2024 | 148 | | | 163 | | | S+2.275 | | 10 | |
| Oahu Solar Holdings LLC, due 2026 | 81 | | | 83 | | | S+1.525 | | 9 | |
| | | | | | | |
| Rosie Class B LLC, due 2024 and 2029 | 347 | | | 76 | | | S+ 1.250-1.375 | | 24 | |
| Texas Solar Nova 1, due 2028 | 102 | | | — | | | S+1.750 | | 55 | |
| Utah Solar Portfolio, due 2036 | 242 | | | 257 | | | 3.590 | | | 155 | |
| Viento Funding II, LLC, due 2029 | 175 | | | 184 | | | S+1.475 | | 25 | |
| Victory Pass and Arica, due 2024 | 757 | | | — | | | S+ 1.125 | | 5 | |
Waiawa, due 2028 (c) | — | | | 97 | | | S+ 1.600 | | — | |
| | | | | | | |
| | | | | | | |
| Other | 124 | | | 201 | | | Various | | 63 | |
| Subtotal non-recourse project-level debt | 5,974 | | | 4,745 | | | | | |
| Total debt | 8,100 | | | 6,872 | | | | | |
| Less current maturities | (559) | | | (324) | | | | | |
| Less net debt issuance costs | (65) | | | (61) | | | | | |
Add premiums (d) | 3 | | | 4 | | | | | |
| Total long-term debt | $ | 7,479 | | | $ | 6,491 | | | | | |
(a) As of December 31, 2017, L+2023, S+ equals 3 month LIBORSOFR plus x%, except for Viento, due 2023, where L + equals 6 month LIBOR plus 3.00%.
(b) Applicable rate is determined by the borrower leverage ratio, as defined in the credit agreement.
(c) On July 21, 2023, Mililani I’s financing agreement was amended to merge the project-level debt of Mililani I and Waiawa as a combined term loan under Mililani Class B Member Holdco LLC.
(d) Premiums relate to the 2028 Senior Notes.
The financing arrangements listed above contain certain covenants, including financial covenants that the Company is required to be in compliance with during the term of the respective arrangement. Under the project-level financing arrangements, each project is permitted to pay distributions out of available cash as long as certain conditions are satisfied, including that no default under the applicable arrangements has occurred and that each project is otherwise in compliance with all relevant conditions under the financing agreements, including meeting required financial ratios, where applicable. The Company’s project-level financing arrangements are non-recourse to the Company, thus, each project pledges its underlying assets as collateral, and if a project is in default of its financing arrangement, then the related lender could demand repayment of the project or enforce their security interests with respect to the pledged collateral.
As of December 31, 2017,2023, the Company was in compliance with all of the required covenants.
NRG Yield Operating LLC 2026 Senior Notes
On August 18, 2016, Yield Operating LLC issued $350 million of senior unsecured notes, or the 2026 Senior Notes. The 2026 Senior Notes bear interest at 5.00% and mature on September 15, 2026. Interest on the notes is payable semi-annually on March 15 and September 15 of each year. The 2026 Senior Notes are senior unsecured obligations of Yield OperatingClearway Energy LLC and are guaranteed by the Company, and by certain of Yield Operating LLC's wholly owned current and future subsidiaries. A portion of the proceeds of the 2026 Senior Notes were used to repay the Company's revolving credit facility during 2016, as described below.
Yield, Inc. 2020 Convertible Senior Notes and Related Intercompany Note
On June 29, 2015, Yield, Inc. closed on its offering of $288 million aggregate principal amount of 3.25% Convertible Senior Notes due 2020, or the 2020 Convertible Notes. The 2020 Convertible Notes are convertible, under certain circumstances, into Yield, Inc.'s Class C common stock, cash or a combination thereof at an initial conversion price of $27.50 per Class C common share, which is equivalent to a conversion rate of approximately 36.3636 shares of Class C common stock per $1,000 principal amount of 2020 Convertible Notes. The Company and Yield Operating LLC provided a guarantee to Yield, Inc. with respect to the 2020 Convertible Notes. In addition, Yield Operating LLC and Yield, Inc. entered into an intercompany borrowing arrangement, under which Yield Operating LLC received $281 million of the proceeds of the 2020 Convertible Notes. The intercompany note bears interest at a rate of 3.325% and matures in 2020.
Yield, Inc. 2019 Convertible Senior Notes and Related Intercompany Note
During the first quarter of 2014, Yield, Inc. closed on its offering of $345 million aggregate principal amount of 3.50% Convertible Senior Notes due 2019, or the 2019 Convertible Notes. The 2019 Convertible Notes were convertible, under certain circumstances, into Yield, Inc.’s Class A common stock, cash or a combination thereof at an initial conversion price of $46.55 per Class A common share, which is equivalent to a conversion rate of approximately 42.9644 shares of Class A common stock per $1,000 principal amount of 2019 Convertible Notes in accordance with the terms of the related indenture. The Company and Yield Operating LLC provided a guarantee to Yield, Inc. with respect to the 2019 Convertible Notes. In addition, Yield Operating and Yield, Inc. entered into an intercompany borrowing arrangement, under which Yield Operating borrowed $337 million of the proceeds of the 2019 Convertible Notes. The intercompany note bears interest at a rate of 3.580% and matures in 2019.
NRG Yield LLC and NRG YieldClearway Energy Operating LLC Revolving Credit Facility
The Company borrowed $55On March 15, 2023, Clearway Energy Operating LLC refinanced the Amended and Restated Credit Agreement, which (i) replaced LIBOR with SOFR plus a credit spread adjustment of 0.10% as the applicable reference rate, (ii) increased the available revolving commitments to an aggregate principal amount of $700 million, from(iii) extended the revolvingmaturity date to March 15, 2028, (iv) increased the letter of credit facility during the year endedsublimit to $594 million and (v) implemented certain other technical modifications.
As of December 31, 2017 for general corporate needs as well as to fund dividend payments.
The2023, the Company used its proceeds of $97.5 million from the CVSR Holdco Financing Arrangement, a portion of its proceeds from the issuance of the 2026 Senior Notes, as well as its cash on hand to repay thehad no outstanding borrowings under the revolving credit facility and $246 million in letters of credit outstanding. The facility will continue to be used for general corporate purposes, including financing of future acquisitions and posting letters of credit.
Bridge Loan Agreement
On November 30, 2021, Clearway Energy Operating LLC entered into a senior secured bridge credit agreement, or the Bridge Loan Agreement. The Bridge Loan Agreement provided for a senior secured term loan facility in an aggregate principal amount of $335 million. The borrowings under the term loan facility were used to acquire the Utah Solar Portfolio on December 1, 2021.
On May 3, 2022, the Company repaid the $335 million in outstanding borrowings under the Bridge Loan Agreement utilizing proceeds received from the Thermal Disposition, as further described in Note 3, Acquisitions and Dispositions.
Project-level Debt
Texas Solar Nova 1
On December 28, 2023, as part of the acquisition of Texas Solar Nova 1, as further described in Note 3, Acquisitions and Dispositions, the Company assumed the project’s financing agreement, which included a $90 million construction loan, $109 million sponsor equity bridge loan and $151 million tax equity bridge loan, offset by $1 million in unamortized debt issuance costs. At acquisition date, the tax equity investor contributed $148 million, which was utilized, along with the Company’s entire purchase price that was contributed back to the Company by CEG and the proceeds from the cash equity investor, to repay the $109 million sponsor equity bridge loan, to repay the $151 million tax equity bridge loan, to fund $18 million in construction completion reserves, which is included in restricted cash on the Company’s consolidated balance sheet, and to pay $5 million in associated fees with the remaining $9 million distributed back to CEG. Also at acquisition date, the $90 million construction loan was converted into a term loan in the amount of $102 million, which includes an additional borrowing of $12 million.
Cedro Hill Repowering
On December 12, 2023, the Company entered into a financing agreement for non-recourse debt for a total commitment of $254 million, which consists of construction loans, a tax equity bridge loan and a sponsor equity bridge loan, related to the repowering of the Cedro Hill wind project. The Company’s initial borrowing of $165 million was utilized to repay the $72 million of outstanding principal under the original financing agreement, to pay $55 million to Clearway Renew for the future delivery of equipment, which is included in other non-current assets on the Company’s consolidated balance sheet, to pay $27 million to a third party for the future delivery of equipment, which is included in other non-current assets on the Company’s balance sheet, to pay a $4 million development services fee to Clearway Renew, to pay for $4 million in debt issuance costs that were deferred and to pay for $3 million in capital expenditures.
Victory Pass and Arica
On October 31, 2023, as part of the acquisition of Victory Pass and Arica, as further described in Note 3, Acquisitions and Dispositions, the Company assumed the project’s financing agreement, which included a $483 million sponsor equity bridge loan and a $385 million tax equity bridge loan, offset by $4 million in unamortized debt issuance costs. A partial payment of $133 million was made on the sponsor equity bridge loan at acquisition date utilizing all of the proceeds from the Company, which were contributed back to the Company by CEG, and the contribution from the cash equity investor. The tax equity bridge loan and the remaining sponsor equity bridge loan will be repaid with the final proceeds received from the tax equity investor and cash equity investor upon Victory Pass and Arica reaching substantial completion, which is expected to occur in the first half of 2024, along with the $100 million that was contributed into escrow by the tax equity investor at acquisition date, which is included in restricted cash on the Company’s consolidated balance sheet. Subsequent to the acquisition, the Company borrowed an additional $22 million in tax equity bridge loans.
Daggett 2
On August 30, 2023, as part of the acquisition of Daggett 2, as further described in Note 3, Acquisitions and Dispositions, the Company assumed the project’s financing agreement, which included a $107 million construction loan and a $204 million tax equity bridge loan, offset by $3 million in unamortized debt issuance costs. On December 22, 2023, when the project reached substantial completion, the tax equity investor contributed an additional $202 million, which was utilized, along with the $120 million in escrow and $10 million in construction loan proceeds, to repay the $204 million tax equity bridge loan, to fund $36 million in construction completion reserves, which is included in restricted cash on the Company’s consolidated balance sheet, and to pay $1 million in associated fees with the remaining $91 million distributed to CEG. Subsequent to the acquisition, the Company borrowed an additional $49 million in construction loans and the total outstanding construction loans were converted to a term loan in the amount of $156 million on December 22, 2023.
Rosamond Central (Rosie Class B LLC)
On June 30, 2023, Rosie Class B LLC, the indirect owner of the Rosamond Central solar project, amended its financing agreement to provide for (i) a refinanced term loan in the amount of $77 million, (ii) construction loans up to $115 million, which will convert to a term loan upon the BESS project reaching substantial completion, (iii) tax equity bridge loans up to $188 million, which will be repaid with tax equity proceeds received upon the BESS project reaching substantial completion, (iv) an increase to the letter of credit sublimit to $41 million and (v) an extension of the maturity date of the term loan and construction loans to five years subsequent to term conversions. During the year ended December 31, 2023, Rosie Class B LLC received total loan proceeds of $265 million, which was comprised of $115 million in construction loans and $155 million in tax equity bridge loans, net of $5 million in debt issuance costs that were deferred.
On July 3, 2023, Rosie Class B LLC issued a loan to Clearway Renew, utilizing a portion of the loan proceeds under the amended financing agreement, in order to finance the construction of the BESS project. On December 1, 2023, the Rosamond Central solar project acquired the BESS project from Clearway Renew for initial cash consideration of $70 million, as further discussed in Note 3, Acquisitions and Dispositions, and Clearway Renew utilized the funds to partially repay the loan. As of December 31, 2023, the loan had an aggregate principal amount of $174 million. The loan bears interest at a fixed annual rate of 9.00% and matures when the project reaches substantial completion, which is expected to occur in the first half of 2024 and is included in note receivable — affiliate on the Company’s consolidated balance sheet.
Also, during the year ended December 31, 2016.2023, the Company utilized a portion of the loan proceeds received under the amended financing agreement to contribute $18 million into Rosie Central BESS, which is an investment accounted for under the equity method of accounting, as further described in Note 5, Investments Accounted for by the Equity Method and Variable Interest Entities.
Daggett 3
On February 17, 2023, as part of the acquisition of Daggett 3, as further described in Note 3, Acquisitions and Dispositions, the Company assumed the project’s financing agreement, which included a $181 million construction loan, a $229 million tax equity bridge loan and a $75 million sponsor equity bridge loan, offset by $5 million in unamortized debt issuance costs. The sponsor equity bridge loan was repaid at acquisition date, along with $8 million in associated fees, utilizing all of the proceeds from the Company, which were contributed back to the Company by CEG, and the contribution from the cash equity investor. On December 1, 2023, when the project reached substantial completion, the tax equity investor contributed an additional $252 million, which was utilized along with the $69 million in escrow, to repay the $229 million tax equity bridge loan, to fund $40 million in construction completion reserves, which is included in restricted cash on the Company’s consolidated balance sheet, and to pay $7 million in associated fees with the remaining $45 million distributed to CEG. Subsequent to the acquisition, the Company borrowed an additional $36 million in construction loans and the total outstanding construction loans were converted to a term loan in the amount of $217 million on December 1, 2023.
El Segundo Energy Center
On February 6, 2018, NRG Yield Operating LLC and NRG Yield LLC amendedDecember 15, 2022, the revolving credit facility to modifyCompany repaid the "changeoutstanding project-level debt of control" provisions to permitEl Segundo Energy Center in the consummationamount of approximately $130 million, utilizing cash on hand. The project-level debt had an original maturity of August 2023.
Capistrano Wind Portfolio
On August 22, 2022, as part of the NRG Transaction,acquisition of the Capistrano Wind Portfolio, as further described in Note 3, Acquisitions and also to permit NRG Yield Operating LLC, NRG Yield LLCDispositions, the Company assumed non-recourse project-level debt totaling $164 million held by the Broken Bow, Cedro Hill and certain subsidiaries to incur up to $1.5 billionCrofton Bluffs wind projects, which is net of unsecured indebtedness$2 million in order to repurchase or make other required cash payments, in each case if applicable, with respect to NRG Yield Operating LLC’s outstanding senior notes and NRG Yield's outstanding convertible notespreviously deferred unamortized debt issuance costs. As discussed above, in connection with the NRG Transaction.Company’s entry into a new financing agreement related to the repowering of the Cedro Hill wind project, the Company repaid $72 million of outstanding principal under the original financing agreement.
Project - level DebtMililani I and Waiawa
November 2017 Drop Down Assets Debt
AsOn October 3, 2022, as part of the November 2017 Drop Down acquisition the Company assumed non-recourse debt of $26 million relating to certain SPP funds. The assumed debt consisted of the following: a) a term loan under a credit agreement with a bank, with a maturity date of December 31, 2038 and interest rate of 4.69%. The credit agreement includes a letter of credit supporting debt service requirements and a letter of credit in support of the PPA; b) and financing obligation in connection with a sale-leaseback transaction with a bank for a period through March 31, 2032. The company will accrete the financing obligation over the lease term based on the lease's implicit interest rate of 8%.
Agua Caliente Borrower 2, due 2038
On February 17, 2017, Agua Caliente Borrower 1 LLC, an indirect subsidiary of NRG, and Agua Caliente Borrower 2 LLC, issued $130 million of senior secured notes under the Agua Caliente Borrower 1 LLC and Agua Caliente Borrower 2 LLC financing agreement, or Agua Caliente Holdco Financing Agreement, that bear interest at 5.43% and mature on December 31, 2038. AsWaiawa, as further described in Note 3, Business Acquisitions and Dispositions, the Company assumed the project’s financing agreement, which included a $22 million construction loan, a $55 million tax equity bridge loan and a $27 million sponsor equity bridge loan, offset by $1 million in unamortized debt issuance costs. The sponsor equity bridge loan was repaid at acquisition date, along with $2 million in associated fees, utilizing $12 million from the cash equity investor, as well as $16 million of the Company’s purchase price, which was contributed back by CEG. On March 30, 2023, when the project reached substantial completion, the tax equity investor contributed an additional $41 million and CEG contributed an additional $8 million, which was utilized, along with the $17 million in escrow, to repay the $55 million tax equity bridge loan, to fund $10 million in construction completion reserves and to pay $1 million in associated fees. Subsequent to the acquisition, the Company borrowed an additional $25 million in construction loans and the total outstanding construction loans were converted to a term loan in the amount of $47 million on March 27, 2017, the Company acquired Agua Caliente Borrower 2 LLC from NRG30, 2023.
On March 25, 2022, as part of the March 2017 Drop Down Assets acquisition of Mililani I, as further described in Note 3, Acquisitions and Dispositions, the Company assumed NRG's portion of senior secured notes under the Agua Caliente Holdco Financing Agreement. Agua Caliente Borrower 2 LLC holds $41project’s financing agreement, which included a $16 million construction loan, a $60 million tax equity bridge loan and a $27 million sponsor equity bridge loan, offset by $3 million in unamortized debt issuance costs. The sponsor equity bridge loan was repaid at acquisition date, along with $2 million in associated fees, utilizing $14 million from the cash equity investor, as well as $15 million of the Agua Caliente Holdco debt as ofCompany’s purchase price, which was contributed back by CEG. On December 31, 2017. The debt is joint7, 2022, when the project reached substantial completion, the tax equity investor contributed an additional $42 million and severalCEG contributed an additional $11 million, which was utilized, along with respectthe $18 million in escrow, to Agua Caliente Borrower 1 LLCrepay the $60 million tax equity bridge loan, to fund $7 million in construction completion reserves and Agua Caliente Borrower 2 LLC and is secured byto pay $4 million in associated fees. Subsequent to the equity interests of each borrower in the Agua Caliente solar facility.
Utah Solar Portfolio, due 2022
As part of the March 2017 Drop Down Assets acquisition, the Company assumed non-recourseborrowed an additional $32 million in construction loans and the total outstanding construction loans were converted to a term loan in the amount of $48 million on December 7, 2022.
On July 21, 2023, Mililani I’s financing agreement was amended to merge the project-level debt of $287 million relating to the Utah Solar Portfolio at an interest rate of LIBOR plus 2.625%. The debtMililani I and Waiawa as a combined term loan under Mililani Class B Member Holdco LLC that matures on December 16, 2022. The $287 million consisted of $222 million outstanding at the time of NRG's acquisition of the Utah Solar Portfolio on November 2, 2016, and additional borrowings of $65 million, net of debt issuance costs, incurred during 2016. The Company holds $278 million of the Utah Solar Portfolio debt as of December 31, 2017.July 21, 2028.
Viento Funding II, LLC
On October 31, 2016, NRG Energy Center Minneapolis LLC, a subsidiary ofMarch 16, 2022, the Company, received proceeds of $125 million fromthrough its indirect subsidiary, Viento Funding II, LLC, entered into a financing agreement which included the issuance of 3.55% Series D notes due October 31, 2031, ora $190 million term loan as well as $35 million in letters of credit, supported by the Series D Notes, and entered into a shelf facility for the anticipated issuance of an additional $70 million of Series E notes at a 4.80% fixed rate. The Series D Notes will be secured by substantially all of the assets of NRG Energy Center Minneapolis LLC. NRG Thermal LLC has guaranteed the indebtedness and its guarantee is secured by a pledge of the equityCompany’s interests in all of NRG Thermal LLC’s subsidiaries. NRG Energy Center Minneapolis LLC distributed the Elkhorn Ridge, Laredo Ridge, San Juan Mesa and Taloga wind projects. The proceeds offrom the Series D Notesterm loan were used to NRG Thermal LLC, whichpay off the existing debt in turn distributed the proceeds to NRG Yield Operating LLC to be utilized for general corporate purposes, including potential acquisitions.
On March 16, 2017, NRG Energy Center Minneapolis LLC, a subsidiary of NRG Thermal LLC, amended the shelf facility of its existing Thermal financing arrangement to allow for the issuance of an additional $10 million of Series F notes at a 4.60% interest rate, or Series F Notes, increasing the total principal amount of notes available for$186 million related to Laredo Ridge, Tapestry Wind LLC and Viento Funding II, LLC and to pay related financing costs. The Company recorded a loss on debt extinguishment of $2 million to expense unamortized debt issuance under the shelf facility to $80 million. The Series E and Series F Notes will be secured by substantially all of the assets of NRG Energy Center Minneapolis LLC. NRG Thermal LLC has guaranteed the indebtedness and its guarantee is secured by a pledge of the equity interests in all of NRG Thermal LLC’s subsidiaries.costs.
CVSR Holdco Notes, due 2037
On July 15, 2016, CVSR Holdco, the indirect owner of the CVSR solar facility, issued $200 million of senior secured notes under the CVSR Holdco Financing Agreement, or 2037 CVSR Holdco Notes, that bear interest at 4.68% and mature on March 31, 2037. Net proceeds were distributed to the Company and NRG based on their respective ownership as of July 15, 2016, and, accordingly, the Company received net proceeds of $97.5 million.
As described in Note 3, Business Acquisitions, on September 1, 2016, the Company acquired the remaining 51.05% of CVSR, and assumed additional debt of $496 million, which represents 51.05% of the CVSR project level debt and 51.05% of the 2037 CVSR Holdco Notes. In connection with the retrospective adjustment of prior periods, as described in Note 1, Nature of Business, the Company now consolidates CVSR and 100% of its debt, consisting of $771 million of project level debt and $200 million of 2037 CVSR Holdco Notes as of September 1, 2016.
Interest Rate Swaps — Project Financings
Many of the Company'sCompany’s project subsidiaries entered into interest rate swaps, intended to hedge the risks associated with interest rates on non-recourse project level debt. These swaps amortize in proportion to their respective loans and are floating for a fixed rate where the project subsidiary pays its counterparty the equivalent of a fixed interest payment on a predetermined notional valueamount and will receive quarterly the equivalent of a floating interest payment based on the same notional value.amount. All interest rate swap payments by the project subsidiary and its counterparty are made quarterly and the LIBORSOFR is determined in advance of each interest period.
The following table summarizes the swaps, some of which are forward starting as indicated, related to the Company'sCompany’s project level debt as of December 31, 2017:debt:
| | | | | | | | | | | | | | | | | | | | | | | | | | | | | | | | | | | | | | |
| | % of Principal | | Fixed Interest Rate | | Floating Interest Rate | | Notional Amount at December 31, 2023 (In millions) | | Effective Date | | Maturity Date |
| Avra Valley | | 85 | % | | 2.20 | % | | SOFR | | $ | 29 | | | March 31, 2023 | | January 31, 2031 |
| Alta Wind Asset Management | | 100 | % | | 2.22 | % | | SOFR | | 11 | | | May 22, 2013 | | May 15, 2031 |
| Borrego | | 100 | % | | 0.21 | % | | SOFR | | 3 | | | June 30, 2020 | | December 31, 2024 |
| Broken Bow | | 90 | % | | Various | | SOFR | | 37 | | | Various | | Various |
| Buckthorn Solar | | 80 | % | | Various | | SOFR | | 93 | | | February 28, 2018 | | December 31, 2041 |
| Carlsbad Energy Holdings | | 100 | % | | Various | | SOFR | | 93 | | | Various | | September 30, 2027 |
| Cedro Hill | | 86 | % | | Various | | SOFR | | 142 | | | December 12, 2023 | | Various |
| Crofton Bluffs | | 90 | % | | Various | | SOFR | | 24 | | | Various | | Various |
| Daggett 2 | | 90 | % | | 2.22 | % | | SOFR | | 141 | | | August 3, 2022 | | March 31, 2043 |
| Daggett 3 | | 86 | % | | 1.91 | % | | SOFR | | 186 | | | Various | | September 30, 2043 |
| Kansas South | | 75 | % | | 1.93 | % | | SOFR | | 12 | | | June 28, 2013 | | December 31, 2030 |
| Mililani Class B | | 98 | % | | Various | | SOFR | | 90 | | | Various | | Various |
| NIMH Solar | | 100 | % | | Various | | SOFR | | 148 | | | September 30, 2020 | | Various |
| Oahu Solar | | 96 | % | | 2.47 | % | | SOFR | | 77 | | | November 30, 2019 | | October 31, 2040 |
| Rosie Class B | | 53 | % | | Various | | SOFR | | 182 | | | Various | | Various |
| South Trent | | 90 | % | | Various | | SOFR | | 22 | | | June 14, 2019 | | June 30, 2028 |
| Texas Solar Nova 1 | | 94 | % | | 2.92 | % | | SOFR | | 97 | | | October 31, 2022 | | June 30, 2043 |
| Viento Funding II | | 90 | % | | 2.53 | % | | SOFR | | 158 | | | Various | | December 31, 2032 |
| Victory Pass and Arica | | 122 | % | | 4.18 | % | | SOFR | | 922 | | | November 30, 2022 | | January 31, 2024 |
| Total | | | | | | | | $ | 2,467 | | | | | |
|
| | | | | | | | | | | | | | | | |
| | | % of Principal | | Fixed Interest Rate | | Floating Interest Rate | | Notional Amount at December 31, 2017 (In millions) | | Effective Date | | Maturity Date |
| Alpine | | 85 | % | | various |
| | 3-Month LIBOR | | $ | 115 |
| | various | | various |
| Avra Valley | | 85 | % | | 2.333 | % | | 3-Month LIBOR | | 46 |
| | November 30, 2012 | | November 30, 2030 |
| AWAM | | 100 | % | | 2.47 | % | | 3-Month LIBOR | | 17 |
| | May 22, 2013 | | May 15, 2031 |
| Blythe | | 75 | % | | 3.563 | % | | 3-Month LIBOR | | 13 |
| | June 25, 2010 | | June 25, 2028 |
| Borrego | | 75 | % | | 1.125 | % | | 3-Month LIBOR | | 5 |
| | April 3, 2013 | | June 30, 2020 |
| El Segundo | | 75 | % | | various |
| | 3-Month LIBOR | | 340 |
| | various | | various |
| Kansas South | | 75 | % | | 2.368 | % | | 6-Month LIBOR | | 21 |
| | June 28, 2013 | | December 31, 2030 |
| Laredo Ridge | | 75 | % | | 2.31 | % | | 3-Month LIBOR | | 75 |
| | March 31, 2011 | | March 31, 2026 |
| Marsh Landing | | 75 | % | | 3.244 | % | | 3-Month LIBOR | | 295 |
| | June 28, 2013 | | June 30, 2023 |
| Roadrunner | | 75 | % | | 4.313 | % | | 3-Month LIBOR | | 26 |
| | September 30, 2011 | | December 31, 2029 |
| South Trent | | 75 | % | | 3.265 | % | | 3-Month LIBOR | | 40 |
| | June 15, 2010 | | June 14, 2020 |
| South Trent | | 75 | % | | 4.95 | % | | 3-Month LIBOR | | 21 |
| | June 30, 2020 | | June 14, 2028 |
| Tapestry | | 75 | % | | 2.21 | % | | 3-Month LIBOR | | 146 |
| | December 30, 2011 | | December 21, 2021 |
| Tapestry | | 50 | % | | 3.57 | % | | 3-Month LIBOR | | 60 |
| | December 21, 2021 | | December 21, 2029 |
| Utah Solar Portfolio | | 80 | % | | various |
| | 1-Month LIBOR | | 223 |
| | various | | September 30, 2036 |
| Viento Funding II | | 90 | % | | various |
| | 6-Month LIBOR | | 148 |
| | various | | various |
| Viento Funding II | | 90 | % | | 4.985 | % | | 6-Month LIBOR | | 65 |
| | July 11, 2023 | | June 30, 2028 |
| Walnut Creek Energy | | 75 | % | | various |
| | 3-Month LIBOR | | 239 |
| | June 28, 2013 | | May 31, 2023 |
| WCEP Holdings | | 90 | % | | 4.003 | % | | 3-Month LIBOR | | 45 |
| | June 28, 2013 | | May 31, 2023 |
| Total | | | | | | | | $ | 1,940 |
| | | | |
Annual Maturities
Annual payments based on the maturities of the Company'sCompany’s debt, for the years ending after December 31, 2017,2023, are as follows:
| | | | | |
| (In millions) |
2024 (a) | $ | 1,670 | |
| 2025 | 371 | |
| 2026 | 351 | |
2027 | 288 | |
2028 | 1,662 | |
| Thereafter | 3,758 | |
| Total | $ | 8,100 | |
| |
| |
(a) At December 31, 2023, amount includes $1.11 billion of construction-related financings recorded in long-term debt on the Company’s consolidated balance sheet that is due in 2024 and is either being funded through long-term equity contributions or is converting to long-term debt.
|
| | | |
| | (In millions) |
| 2018 | $ | 306 |
|
| 2019 | 714 |
|
| 2020 | 650 |
|
| 2021 | 455 |
|
| 2022 | 653 |
|
| Thereafter | 3,121 |
|
| Total | $ | 5,899 |
|
Note 11 — Members'Members’ Equity
The following table lists the distributions paid on the Company'sCompany’s Class A, Class B, Class C and Class D units during the year ended December 31, 2017:2023:
| | | | Fourth Quarter 2017 | | Third Quarter 2017 | | Second Quarter 2017 | | First Quarter 2017 |
| Fourth Quarter 2023 | | | Fourth Quarter 2023 | | Third Quarter 2023 | | Second Quarter 2023 | | First Quarter 2023 |
| Distributions per Class A and Class B units | $ | 0.288 |
| | $ | 0.28 |
| | $ | 0.27 |
| | $ | 0.26 |
|
| Distributions per Class C and Class D units | $ | 0.288 |
| | $ | 0.28 |
| | $ | 0.27 |
| | $ | 0.26 |
|
On February 15, 2018,14, 2024, the Company declared a quarterly distribution on its Class A, Class B, Class C and Class D units of $0.298$0.4033 per shareunit payable on March 15, 2018.2024.
During 2017, 2016, and 2015,In addition to the quarterly distributions, the Company acquiredpaid $51 million in additional distributions, $30 million of which was distributed to Clearway, Inc. and $21 million of which was distributed to CEG, during the Drop Down Assets from NRG, as describedyear ended December 31, 2023, in Note 3, Business Acquisitions. The difference betweenorder for Clearway, Inc. to make certain additional tax payments primarily associated with the cash paid and historical valuesale of the acquired Drop Down Assets was recorded as a distribution to/contribution from NRG with the offset to contributed capital. Prior to the date of acquisition, certain of the projects made distributions to NRG and NRG made contributions into certain projects. These amounts are reflected within the Company’s statement of stockholders’ equity as changes in the contributed capital balance.Thermal Business.
Note 12 — Segment Reporting
The Company’s segment structure reflects how management currently operates and allocates resources. The Company'sCompany’s businesses are segregated based on conventional power generation and renewable businesses, which consist of solar, and wind and the thermal and chilled water business.energy storage. The Corporate segment reflects the Company'sCompany’s corporate costs.costs and includes eliminating entries. The Company'sCompany’s chief operating decision maker, its Chief Executive Officer, evaluates the performance of its segments based on operational measures including adjusted earnings before interest, taxes, depreciation and amortization, or Adjusted EBITDA and CAFD, as well as economic gross margin and net income (loss).
TheApproximately 50% of the Company’s operating revenues and assets relate to operations located in California. Also, the Company generated more than 10% of its revenues from the following customers for the years ended December 31, 2017, 20162023, 2022 and 2015:2021:
| | | | | | | | | | | | | | | | | | | | | | | | | | | | | | | | | | | |
| 2023 | | 2022 | | 2021 |
| Customer | Conventional | | Renewables | | Conventional | | Renewables | | Conventional | | Renewables |
| SCE | 11% | | 13% | | 17% | | 17% | | 17% | | 16% |
| PG&E | 4% | | 13% | | 10% | | 15% | | 10% | | 13% |
|
| | | | | | | | | | | |
| | 2017 | | 2016 | | 2015 |
| Customer | Conventional (%) | | Renewables (%) | | Conventional (%) | | Renewables (%) | | Conventional (%) | | Renewables (%) |
| SCE | 21% | | 20% | | 21% | | 21% | | 22% | | 17% |
| PG&E | 12% | | 11% | | 12% | | 11% | | 12% | | 12% |
|
| | | | | | | | | | | | | | | | | | | |
| | Year ended December 31, 2017 |
| (In millions) | Conventional Generation | | Renewables | | Thermal | | Corporate | | Total |
| Operating revenues | $ | 336 |
| | $ | 501 |
| | $ | 172 |
| | $ | — |
| | $ | 1,009 |
|
| Cost of operations | 77 |
| | 133 |
| | 116 |
| | — |
| | 326 |
|
| Depreciation and amortization | 103 |
| | 210 |
| | 21 |
| | — |
| | 334 |
|
| Impairment losses | — |
| | 44 |
| | — |
| | — |
| | 44 |
|
| General and administrative | — |
| | — |
| | — |
| | 19 |
| | 19 |
|
| Acquisition-related transaction and integration costs | — |
| | — |
| | — |
| | 3 |
| | 3 |
|
| Operating income (loss) | 156 |
| | 114 |
| | 35 |
| | (22 | ) | | 283 |
|
| Equity in earnings of unconsolidated affiliates | 12 |
| | 59 |
| | — |
| | — |
| | 71 |
|
| Other income, net | 1 |
| | 2 |
| | — |
| | 1 |
| | 4 |
|
| Loss on debt extinguishment | — |
| | (3 | ) | | — |
| | — |
| | (3 | ) |
| Interest expense | (49 | ) | | (163 | ) | | (10 | ) | | (71 | ) | | (293 | ) |
| Net Income (Loss) | $ | 120 |
| | $ | 9 |
| | $ | 25 |
| | $ | (92 | ) | | $ | 62 |
|
| Balance Sheet | | | | | | | | |
|
|
| Equity investment in affiliates | $ | 102 |
| | $ | 1,076 |
| | $ | — |
| | $ | — |
| | $ | 1,178 |
|
Capital expenditures (a) | 15 |
| | 4 |
| | 16 |
| | — |
| | 35 |
|
| Total Assets | $ | 1,897 |
| | $ | 5,811 |
| | $ | 422 |
| | $ | 24 |
| | $ | 8,154 |
|
| | | | | | | | | | | | | | | | | | | | | | | | | |
| Year ended December 31, 2023 |
| (In millions) | Conventional Generation | | Renewables | | | | Corporate (a) | | Total |
| Operating revenues | $ | 420 | | | $ | 894 | | | | | $ | — | | | $ | 1,314 | |
| Cost of operations, exclusive of depreciation, amortization and accretion shown separately below | 154 | | | 321 | | | | | (2) | | | 473 | |
| Depreciation, amortization and accretion | 129 | | | 397 | | | | | — | | | 526 | |
| Impairment losses | — | | | 12 | | | | | — | | | 12 | |
| General and administrative | — | | | — | | | | | 35 | | | 35 | |
| Transaction and integration costs | — | | | — | | | | | 4 | | | 4 | |
| | | | | | | | | |
| Operating income (loss) | 137 | | | 164 | | | | | (37) | | | 264 | |
| Equity in earnings of unconsolidated affiliates | 3 | | | 9 | | | | | — | | | 12 | |
| | | | | | | | | |
| | | | | | | | | |
| Other income, net | 4 | | | 24 | | | | | 24 | | | 52 | |
| Loss on debt extinguishment | — | | | (6) | | | | | — | | | (6) | |
| Interest expense | (35) | | | (205) | | | | | (97) | | | (337) | |
| Income (loss) before income taxes | 109 | | | (14) | | | | | (110) | | | (15) | |
| Income tax benefit | — | | | (2) | | | | | — | | | (2) | |
| Net Income (Loss) | 109 | | | (12) | | | | | (110) | | | (13) | |
| | | | | | | | | |
| | | | | | | | | |
| Net Income (Loss) Attributable to Clearway Energy LLC | $ | 109 | | | 150 | | | | | $ | (110) | | | $ | 149 | |
| Balance Sheet | | | | | | | | | |
| Equity investments in affiliates | $ | 79 | | | $ | 281 | | | | | $ | — | | | $ | 360 | |
Capital expenditures (b) | 11 | | | 146 | | | | | — | | | 157 | |
| Total Assets | $ | 2,058 | | | $ | 12,205 | | | | | $ | 425 | | | $ | 14,688 | |
(a) Includes eliminations.
(b)Includes accruals.
|
| | | | | | | | | | | | | | | | | | | |
| | Year ended December 31, 2016 |
| (In millions) | Conventional Generation | | Renewables | | Thermal | | Corporate | | Total |
| Operating revenues | $ | 333 |
| | $ | 532 |
| | $ | 170 |
| | $ | — |
| | $ | 1,035 |
|
| Cost of operations | 66 |
| | 128 |
| | 114 |
| | — |
| | 308 |
|
| Depreciation and amortization | 80 |
| | 203 |
| | 20 |
| | — |
| | 303 |
|
| Impairment losses | — |
| | 185 |
| | — |
| | — |
| | 185 |
|
| General and administrative | — |
| | — |
| | — |
| | 14 |
| | 14 |
|
| Acquisition-related transaction and integration costs | — |
| | — |
| | — |
| | 1 |
| | 1 |
|
| Operating income (loss) | 187 |
| | 16 |
| | 36 |
| | (15 | ) | | 224 |
|
| Equity in earnings of unconsolidated affiliates | 13 |
| | 47 |
| | — |
| | — |
| | 60 |
|
| Other income, net | 1 |
| | 2 |
| | — |
| | — |
| | 3 |
|
| Interest expense | (48 | ) | | (151 | ) | | (7 | ) | | (66 | ) | | (272 | ) |
| Net Income (Loss) | $ | 153 |
| | $ | (86 | ) | | $ | 29 |
| | $ | (81 | ) | | $ | 15 |
|
| Balance Sheet | | | | | | | | | |
| Equity investments in affiliates | $ | 106 |
| | $ | 1,046 |
| | $ | — |
| | $ | — |
| | $ | 1,152 |
|
Capital expenditures (a) | 7 |
| | 2 |
| | 14 |
| | — |
| | 23 |
|
| Total Assets | $ | 1,993 |
| | $ | 6,114 |
| | $ | 426 |
| | $ | 213 |
| | $ | 8,746 |
|
| | | | | | | | | | | | | | | | | | | | | | | | | | | | | |
| Year ended December 31, 2022 |
| (In millions) | Conventional Generation | | Renewables | | Thermal | | Corporate (a) | | Total |
| Operating revenues | $ | 417 | | | $ | 696 | | | $ | 77 | | | $ | — | | | $ | 1,190 | |
| Cost of operations, exclusive of depreciation, amortization and accretion shown separately below | 89 | | | 298 | | | 50 | | | (2) | | | 435 | |
| Depreciation, amortization and accretion | 131 | | | 381 | | | — | | | — | | | 512 | |
| Impairment losses | — | | | 16 | | | — | | | — | | | 16 | |
| General and administrative | — | | | — | | | 2 | | | 36 | | | 38 | |
| Transaction and integration costs | — | | | — | | | — | | | 7 | | | 7 | |
| Development costs | — | | | — | | | 2 | | | — | | | 2 | |
| Total operating costs and expenses | 220 | | | 695 | | | 54 | | | 41 | | | 1,010 | |
| Gain on sale of business | — | | | — | | | — | | | 1,292 | | | 1,292 | |
| Operating income | 197 | | | 1 | | | 23 | | | 1,251 | | | 1,472 | |
| Equity in earnings of unconsolidated affiliates | 3 | | | 26 | | | — | | | — | | | 29 | |
| | | | | | | | | |
| | | | | | | | | |
| Other income, net | 1 | | | 6 | | | — | | | 10 | | | 17 | |
| Loss on debt extinguishment | — | | | (2) | | | — | | | — | | | (2) | |
| Interest expense | (40) | | | (87) | | | (6) | | | (99) | | | (232) | |
| Income (loss) before income taxes | 161 | | | (56) | | | 17 | | | 1,162 | | | 1,284 | |
| Income tax expense | — | | | 2 | | | — | | | — | | | 2 | |
| Net Income (Loss) | 161 | | | (58) | | | 17 | | | 1,162 | | | 1,282 | |
| | | | | | | | | |
| Net Income Attributable to Clearway Energy LLC | $ | 161 | | | $ | 49 | | | $ | 17 | | | $ | 1,161 | | | $ | 1,388 | |
| Balance Sheet | | | | | | | | | |
| Equity investments in affiliates | $ | 82 | | | $ | 282 | | | $ | — | | | $ | — | | | $ | 364 | |
Capital expenditures (b)(c) | 11 | | | 33 | | | 11 | | | 1 | | | 56 | |
| Total Assets | $ | 2,251 | | | $ | 9,515 | | | $ | — | | | $ | 546 | | | $ | 12,312 | |
(a) Includes eliminations.
(b)Includes accruals.
(c) Thermal capital expenditures, including accruals, prior to the sale of the Thermal Business on May 1, 2022.
| | | | | | | | | | | | | | | | | | | | | | | | | | | | | |
| Year ended December 31, 2021 |
| (In millions) | Conventional Generation | | Renewables | | Thermal | | Corporate (a) | | Total |
| Operating revenues | $ | 441 | | | $ | 641 | | | $ | 204 | | | $ | — | | | $ | 1,286 | |
| Cost of operations, exclusive of depreciation, amortization and accretion shown separately below | 90 | | | 229 | | | 134 | | | (2) | | | 451 | |
| Depreciation, amortization and accretion | 132 | | | 354 | | | 23 | | | — | | | 509 | |
| Impairment losses | — | | | 6 | | | — | | | — | | | 6 | |
| General and administrative | — | | | — | | | 4 | | | 34 | | | 38 | |
| Transaction and integration costs | — | | | — | | | — | | | 7 | | | 7 | |
| Development costs | — | | | — | | | 4 | | | 2 | | | 6 | |
| Operating income (loss) | 219 | | | 52 | | | 39 | | | (41) | | | 269 | |
| Equity in earnings of unconsolidated affiliates | 6 | | | 26 | | | — | | | — | | | 32 | |
| | | | | | | | | |
| | | | | | | | | |
| Other income, net | — | | | 2 | | | 1 | | | — | | | 3 | |
| Loss on debt extinguishment | — | | | (1) | | | — | | | (52) | | | (53) | |
| Interest expense | (53) | | | (142) | | | (18) | | | (99) | | | (312) | |
| Income (loss) before income taxes | 172 | | | (63) | | | 22 | | | (192) | | | (61) | |
| Income tax expense | — | | | 2 | | | — | | | — | | | 2 | |
| Net Income (Loss) | 172 | | | (65) | | | 22 | | | (192) | | | (63) | |
| | | | | | | | | |
| Net Income (Loss) Attributable to Clearway Energy LLC | $ | 172 | | | $ | 109 | | | $ | 22 | | | $ | (193) | | | $ | 110 | |
(a) Includes eliminations.
|
| | | | | | | | | | | | | | | | | | | |
| | Year ended December 31, 2015 |
| (In millions) | Conventional Generation | | Renewables | | Thermal | | Corporate | | Total |
| Operating revenues | $ | 336 |
| | $ | 458 |
| | $ | 174 |
| | $ | — |
| | $ | 968 |
|
| Cost of operations | 59 |
| | 138 |
| | 126 |
| | — |
| | 323 |
|
| Depreciation and amortization | 81 |
| | 203 |
| | 19 |
| | — |
| | 303 |
|
| Impairment losses | — |
| | 1 |
| | — |
| | — |
| | 1 |
|
| General and administrative | — |
| | — |
| | — |
| | 10 |
| | 10 |
|
| Acquisition-related transaction and integration costs | — |
| | — |
| | — |
| | 3 |
| | 3 |
|
| Operating income (loss) | 196 |
| | 116 |
| | 29 |
| | (13 | ) | | 328 |
|
| Equity in earnings of unconsolidated affiliates | 14 |
| | 17 |
| | — |
| | — |
| | 31 |
|
| Other income, net | 1 |
| | 2 |
| | — |
| | — |
| | 3 |
|
| Loss on debt extinguishment | (7 | ) | | (2 | ) | | — |
| | — |
| | (9 | ) |
| Interest expense | (48 | ) | | (151 | ) | | (7 | ) | | (52 | ) | | (258 | ) |
| Net Income (Loss) | $ | 156 |
| | $ | (18 | ) | | $ | 22 |
| | $ | (65 | ) | | $ | 95 |
|
Note 13 — Related Party Transactions
In addition to the transactions and relationships described elsewhere in the notes to the consolidated financial statements, certain subsidiaries of NRGCEG provide services to the Company'sCompany and its project entities. Amounts due to NRGCEG subsidiaries are recorded as accounts payable — affiliateaffiliates and amounts due to the Company from NRGCEG subsidiaries are recorded as accounts receivable — affiliateaffiliates in the Company'sCompany’s consolidated balance sheet.sheets. The disclosures below summarize the Company'sCompany’s material related party transactions with NRGCEG and its subsidiaries that are included in the Company's operating revenues andCompany’s operating costs.
Power Hedge Contracts by and between Renewable Entities and NRG Texas Power LLC
Certain NRG Wind TE Holdco entities, which are subsidiaries in the Renewables segment, entered into power hedge contracts with NRG Texas Power LLC, a subsidiary of NRG, and generated $16 million of revenue during the year ended December 31, 2015. Effective October 2015, Elbow Creek entered into a PPA with NRG Power Marketing LLC, or NRG Power Marketing, a wholly-owned subsidiary of NRG, as further described below, and the hedge agreement between Elbow Creek and NRG Texas Power LLC was terminated.
Power Purchase Agreements (PPAs) between the Company and NRG Power Marketing
Elbow Creek and Dover are parties to PPAs with NRG Power Marketing and generate revenue under the PPAs, which are recorded to operating revenues in the Company's consolidated statements of operations. For the years ended December 31, 2017 and 2016, Elbow Creek generated revenues of $8 million each year, and Dover generated revenues of $4 million and $5 million, respectively.
Energy Marketing Services Agreement by and between Thermal entities and NRG Power Marketing
NRG Energy Center Dover LLC, NRG Energy Center Minneapolis, NRG Energy Center Phoenix LLC, and NRG Energy Center Paxton LLC, or Thermal entities, are parties to Energy Marketing Services Agreements with NRG Power Marketing, a wholly-owned subsidiary of NRG. Under the agreements, NRG Power Marketing procures fuel and fuel transportation for the operation of Thermal entities. The Thermal entities purchased a total of $9 million of natural gas during each of the years ended December 31, 2017 and 2016. During the year ended December 31, 2015 total purchases of natural gas under the agreement were $13 million.
Operation and Maintenance (O&M) Services Agreements by and between Company's subsidiaries and NRG
Certain of the Company's subsidiaries are party to O&M Services Agreements with NRG, pursuant to which NRG subsidiaries provide necessary and appropriate services to operate and maintain the subsidiaries' plant operations, businesses and thermal facilities. NRG is reimbursed for the provided services, as well as for all reasonable and related expenses and expenditures, and payments to third parties for services and materials rendered to or on behalf of the parties to the agreements. NRG is not entitled to any management fee or mark-up under the agreements. The fees incurred under this agreement were $39 million for the year ended December 31, 2017, and $36 million for each year ended December 31, 2016 and 2015.
The Company had $13 million due to NRG for the services performed during the year ended December 31, 2017 under the O&M Agreements, $5 million of which was paid off as of March 1, 2018. The Company had $22 million due to NRG for the services performed during the year ended December 31, 2016 under the O&M Agreements.
O&MServices Agreements by and between GenConn and NRG
GenConn incurs fees under two O&M agreements with wholly-owned subsidiaries of NRG. The fees incurred under the agreements were $5 million each year for the years ended December 31, 2017 and 2016, and $4 million for the year ended December 31, 2015.
Administrative Services Agreement by and between Marsh Landing and NRG West Coast LLC
On December 19, 2016, Marsh Landing entered into an administrative services agreement with NRG West Coast LLC, a wholly owned subsidiary of NRG. The administrative services agreement was previously between Marsh Landing and GenOn Energy Services, LLC, a wholly-owned subsidiary of NRG and was subsequently assigned to and assumed by NRG West Coast LLC. The Company reimbursed costs under this agreement of approximately $15 million, $14 million and $13 million for the years ended December 31, 2017, 2016 and 2015, respectively. There was a balance of $1 million due to NRG West Coast LLC in accounts payable — affiliate as of December 31, 2017 and 2016.
Administrative Services Agreements by and between the Company and NRG RenewClearway Renewable Operation & Maintenance LLC
Various wholly-owned subsidiaries of the Company in the Renewables segment are party to administrative services agreements with NRG RenewClearway Renewable Operation & Maintenance LLC, or RENOM, a wholly-owned subsidiary of NRG,CEG, which provides operation and maintenance, or O&M, services to these subsidiaries. The Company incurred total expenses for these services in the amount of $23$73 million, $13$71 million and $7$56 million for the years ended December 31, 2017, 20162023, 2022 and 2015,2021, respectively. There was a balance of $5$13 million and $14 million due to RENOM as of December 31, 20172023 and 2016.2022, respectively.
ManagementAdministrative Services AgreementAgreements by and between the Company and NRGCEG
NRG providesVarious wholly-owned subsidiaries of the Company are parties to services agreements with Clearway Asset Services LLC and Clearway Solar Asset Management LLC, two wholly-owned subsidiaries of CEG, which provide various administrative services to the Company’s subsidiaries. The Company incurred expenses under these agreements of $20 million, $16 million and $14 million for the years ended December 31, 2023, 2022 and 2021, respectively. There was a balance of $2 million and $3 million due to CEG as of December 31, 2023 and 2022, respectively.
CEG Master Services Agreements
The Company is a party to the CEG Master Services Agreements, pursuant to which CEG and certain of its affiliates or third-party service providers provide certain services to the Company, including operational management, and administrative services, which include human resources, accounting, tax, legal, information systems, treasury,cybersecurity, external affairs, accounting, procurement and risk management as set forth in the Management Services Agreement. As of December 31, 2017, the base management fee was approximately $8.5 million per year, subject to an inflation-based adjustment annually, at an inflation factor based on the year-over-year U.S. consumer price index. The fee is also subject to adjustments following the consummation of future acquisitions services,and as a result of a change in the scope of services provided under the Management Services Agreement. During the year ended December 31, 2017, the fee was increased by approximately $1 million per year, primarily due to the acquisition of the March 2017, August 2017 and November 2017 Drop Down Assets, as further described in Note 3, Business Acquisitions. In addition to the base management fee, the Company is also responsibleprovides certain services to CEG, including accounting, internal audit, tax and treasury services, in exchange for anythe payment of fees in respect of such services. The Company incurred net expenses that are directly incurred and paid for by NRG on behalf of the Company. Costs incurred$5 million under this agreement were approximately $10 millionthese agreements for each of the years ended December 31, 20172023 and 2016,2022 and $8$4 million for the year ended December 31, 2015. There was a balance of $4 million in accounts payable — affiliate due to NRG as of December 31, 2017, which the Company paid off in January 2018.2021.
EPC Agreement by and between NECP and NRG
On October 31, 2016, NRG Business Services LLC, a subsidiary of NRG, and NECP, a wholly owned subsidiary of the Company, entered into an EPC agreement for the construction of a 73 MWt district energy system for NECP to provide 150 kpph of steam, 6,750 tons of chilled water and 7.5 MW of emergency backup power service to UPMC Mercy. The initial term of the energy services agreement with UPMC Mercy will be for a period of twenty years from the service commencement date. Pursuant to the terms of the EPC agreement, NECP agreed to pay NRG Business Services LLC $79 million, subject to adjustment based upon certain conditions in the EPC agreement, upon substantial completion of the project. The project is expected to reach COD in the first half of 2018. As of December 31, 2017, the parties made a number of amendments to the EPC Agreement, based on customer change orders, to increase the capacity of the district energy system from 73 MWt to 80 MWt, which also increased the payment from $79 million to $88 million.
Note 14 — Commitments and Contingencies
Operating Lease Commitments
The Company leases certain facilities and equipment under operating leases, some of which include escalation clauses, expiring on various dates through 2048. The effects of these scheduled rent increases, leasehold incentives, and rent concessions are recognized on a straight-line basis over the lease term unless another systematic and rational allocation basis is more representative of the time pattern in which the leased property is physically employed. Lease expense under operating leases was $17 million, $15 million and $10 million for the years ended December 31, 2017, 2016 and 2015, respectively.
The Company's future minimum lease commitments under operating leases are $9 million for each of the years ending December 31, 2018 through 2022, and $151 million thereafter.
Gas and Transportation Commitments
The Company haspreviously entered into contractual arrangements to procure power, fuel and associated transportation services. Forservices for the Thermal Business, which was sold to KKR on May 1, 2022, as further discussed in Note 3, Acquisitions and Dispositions. Under these arrangements, the Company purchased $20 million and $40 million for the years ended December 31, 2017, 20162022 and 2015, the Company purchased $34 million, $32 million and $40 million, respectively, under such arrangements. As further described in Note 13 Related Party Transactions, these purchases include intercompany transactions between certain Thermal entities and NRG Power Marketing under the Energy Marketing Services Agreements in the amount of $9 million for each of the years ended December 31, 2017 and 2016. Total intercompany purchases of natural gas under the agreement were $13 million for the year ended December 31, 2015.
As of December 31, 2017, the Company's commitments under such outstanding agreements are estimated as follows:
|
| | | |
| Period | (In millions) |
| 2018 | $ | 11 |
|
| 2019 | 5 |
|
| 2020 | 3 |
|
| 2021 | 3 |
|
| 2022 | 3 |
|
| Thereafter | 16 |
|
| Total | $ | 41 |
|
Contingencies
The Company's material legal proceedings are described below. The Company believes that it has valid defenses to these legal proceedings and intends to defend them vigorously. The Company records reserves for estimated losses from contingencies when information available indicates that a loss is probable and the amount of the loss, or range of loss, can be reasonably estimated. As applicable, the Company has establishedwill establish an adequate reserve for the matters discussed below.ongoing legal matters. In addition, legal costs are expensed as incurred. Management assesses such matters based on current information and makes a judgment concerning its potential outcome, considering the nature of the claim, the amount and nature of damages sought and the probability of success. The Company is unable to predict the outcome of theongoing legal proceedings below or reasonably estimate the scope or amount of any associated costs and potential liabilities. As additional information becomes available, management adjusts its assessment and estimatesestimate of such contingencies accordingly. Because litigation is subject to inherent uncertainties and unfavorable rulings or developments, it is possible that the ultimate resolution of the Company'sCompany’s liabilities and contingencies could be at amounts that are different from its currently recorded reserves and that such difference could be material.
In addition to the legal proceedings noted below, theThe Company and its subsidiaries are party to other litigation or legal proceedings arising in the ordinary course of business. In management'smanagement’s opinion, the disposition of these ordinary course matters will not materially adversely affect the Company'sCompany’s consolidated financial position, results of operations or cash flows.
Braun v. NRG Yield, Inc. —
Buckthorn Solar Litigation
On April 19, 2016, plaintiffsOctober 8, 2019, the City of Georgetown, Texas, or Georgetown, filed a putative class action lawsuit against NRG Yield, Inc.,petition in the currentDistrict Court of Williamson County, Texas naming Buckthorn Westex, LLC, the Company’s subsidiary that owns the Buckthorn Westex solar project, as the defendant, alleging fraud by nondisclosure and former membersbreach of its board of directors individually,contract in connection with the project and other parties in California Superior Court in Kern County, CA. Plaintiffs allege various violationsthe PPA, and seeking (i) rescission and/or cancellation of the Securities ActPPA, (ii) declaratory judgment that the alleged breaches constitute an event of default under the PPA entitling Georgetown to terminate, and (iii) recovery of all damages, costs of court, and attorneys’ fees. On November 15, 2019, Buckthorn Westex filed an original answer and counterclaims (i) denying Georgetown’s claims, (ii) alleging Georgetown has breached its contracts with Buckthorn Westex by failing to pay amounts due, toand (iii) seeking relief in the defendants’form of (x) declaratory judgment that Georgetown’s alleged failure to disclose material factspay amounts due constitute breaches of and an event of default under the PPA and that Buckthorn did not commit any events of default under the PPA, (y) recovery of costs, expenses, interest, and attorneys’ fees, and (z) such other relief to which it is entitled at law or in equity. On November 14, 2023, the two parties entered into a settlement agreement to resolve all claims related to lowthis litigation, following which settlement the claims were dismissed by the court with prejudice. The amounts paid pursuant to the settlement agreement had an immaterial impact to the Company’s financial statements.
Note 15 — Leases
Accounting for Leases
The Company evaluates each arrangement at inception to determine if it contains a lease. Substantially all of the Company’s leases are operating leases.
Lessee
The Company records its operating lease liabilities at the present value of the lease payments over the lease term at lease commencement date. Lease payments include fixed payment amounts as well as variable rate payments based on an index initially measured at lease commencement date. Variable payments, including payments based on future performance and based on index changes, are recorded when the expense is probable. The Company determines the relevant lease term by evaluating whether renewal and termination options are reasonably certain to be exercised. The Company uses its incremental borrowing rate to calculate the present value of the lease payments, based on information available at the lease commencement date.
The Company’s leases consist of land leases for numerous operating asset locations, real estate leases and equipment leases. The terms and conditions for these leases vary by the type of underlying asset. Certain of these leases have both lease and non-lease components and the Company has elected to apply the practical expedient to not separate these components.
Lease expense was comprised of the following:
| | | | | | | | | | | | | | | | | | | | |
| | Year Ended December 31, |
| (In millions) | | 2023 | | 2022 | | 2021 |
| Operating lease cost - Fixed | | $ | 40 | | | $ | 36 | | | $ | 27 | |
| | | | | | |
| Operating lease cost - Variable | | 11 | | | 11 | | | 15 | |
| Total lease cost | | $ | 51 | | | $ | 47 | | | $ | 42 | |
Operating lease information was as follows:
| | | | | | | | | | | | | | |
| (In millions, except term and rate) | | December 31, 2023 | | December 31, 2022 |
Right-of-use assets - operating leases, net (a) | | $ | 597 | | | $ | 527 | |
| | | | |
Short-term lease liability - operating leases (b) | | $ | 7 | | | $ | 6 | |
Long-term lease liability - operating leases (a) | | 627 | | | 548 | |
| Total lease liabilities | | $ | 634 | | | $ | 554 | |
| | | | |
| Weighted average remaining lease term (in years) | | 28 | | 27 |
| Weighted average discount rate | | 4.2 | % | | 4.1 | % |
| | | | |
| Cash paid for operating leases | | $ | 30 | | | $ | 28 | |
(a) Increases in right-of-use assets and long-term lease liabilities are primarily due to Drop Down Asset acquisitions, as further described in Note 3, Acquisitions and Dispositions.
(b) Short-term lease liability balances are included within the accrued expenses and other current liabilities line item of the consolidated balance sheets as of December 31, 2023 and 2022.
Minimum future rental payments of operating lease liabilities as of December 31, 2023 are as follows:
| | | | | | | | |
| | (In millions) |
| 2024 | | $ | 34 | |
| 2025 | | 34 | |
| 2026 | | 35 | |
| 2027 | | 36 | |
| 2028 | | 36 | |
| Thereafter | | 980 | |
Total lease payments | | 1,155 | |
| Less imputed interest | | (521) | |
| Total lease liability - operating leases | | $ | 634 | |
The Company is party to various land lease agreements with wholly-owned subsidiaries of CEG that are accounted for as operating leases. The following table summarizes the land lease agreements:
| | | | | | | | | | | | | | | | | | | | |
| (In millions) | | Right-of-use assets, net | | Long-term lease liabilities | | Lease expiration |
| As of December 31, 2023 | | | | | | |
| Daggett 2 | | $ | 22 | | | $ | 23 | | | June 30, 2058 |
| Daggett 3 | | 31 | | | 33 | | | December 18, 2062 |
| Mililani I | | 19 | | | 20 | | | March 31, 2057 |
Oahu Solar (a) | | 17 | | | 20 | | | August 1, 2057 |
Rosamond Central (a) | | 11 | | | 12 | | | March 31, 2056 |
| As of December 31, 2022 | | | | | | |
| Mililani I | | $ | 19 | | | $ | 20 | | | |
Oahu Solar (a) | | 17 | | | 20 | | | |
Rosamond Central (a) | | 11 | | | 12 | | | |
(a) The Company has the ability to extend each of these leases for two additional five-year periods.
Lessor
The majority of the Company’s revenue is obtained through PPAs or other contractual agreements that are accounted for as leases. These leases are comprised of both fixed payments and variable payments contingent upon volumes or performance metrics. The terms of the Company’s leases are further described in Item 2 — Properties of this Form 10-K. Many of the leases have renewal options at the end of the lease term. Termination may be allowed under specific circumstances in the lease arrangements, such as under an event of default. All but one of the Company’s active leases are operating leases. This sales-type lease is further described below. Certain of these operating leases have both lease and non-lease components, and the Company allocates the transaction price to the components based on standalone selling prices.
The following amounts of energy, capacity and other revenue are related to the Company’s operating leases:
| | | | | | | | | | | | | | | | | | | | | | |
| | Conventional Generation | | Renewables | | | | Total |
| December 31, 2023 | | (In millions) |
| Energy revenue | | $ | 4 | | | $ | 760 | | | | | $ | 764 | |
| Capacity revenue | | 249 | | | 20 | | | | | 269 | |
Other revenue (a) | | 21 | | | — | | | | | 21 | |
| Operating revenues | | $ | 274 | | | $ | 780 | | | | | $ | 1,054 | |
(a) On May 31, 2023, the Marsh Landing Black Start addition reached commercial operations and the Company will receive an annual fixed fee over a five-year term under the related agreement. The agreement was determined to be a sales-type lease resulting in the Company recording a lease receivable of $21 million included in total operating revenues, offset by net investment costs of $13 million included in cost of operations, resulting in a net pre-tax profit of $8 million. The lease receivable is included in other current and non-current assets on the Company’s consolidated balance sheet.
| | | | | | | | | | | | | | | | | | | | | | | | | | |
| | Conventional Generation | | Renewables | | Thermal | | Total |
| December 31, 2022 | | (In millions) |
| Energy revenue | | $ | 6 | | | $ | 809 | | | $ | 1 | | | $ | 816 | |
| Capacity revenue | | 435 | | | — | | | — | | | 435 | |
| Operating revenues | | $ | 441 | | | $ | 809 | | | $ | 1 | | | $ | 1,251 | |
| | | | | | | | | | | | | | | | | | | | | | | | | | |
| | Conventional Generation | | Renewables | | Thermal | | Total |
| December 31, 2021 | | (In millions) |
| Energy revenue | | $ | 9 | | | $ | 716 | | | $ | 2 | | | $ | 727 | |
| Capacity revenue | | 455 | | | — | | | — | | | 455 | |
| Operating revenues | | $ | 464 | | | $ | 716 | | | $ | 2 | | | $ | 1,182 | |
Minimum future rent payments for the remaining periods related to the Company’s operating leases as of December 31, 2023 were as follows:
| | | | | |
| (In millions) |
| 2024 | $ | 146 | |
| 2025 | 147 | |
| 2026 | 148 | |
| 2027 | 149 | |
| 2028 | 150 | |
| Thereafter | 1,635 | |
| Total lease payments | $ | 2,375 | |
Property, plant and equipment, net related to the Company’s operating leases were as follows:
| | | | | | | | | | | |
| (In millions) | December 31, 2023 | | December 31, 2022 |
| Property, plant and equipment | $ | 5,720 | | | $ | 8,630 | |
| Accumulated depreciation | (1,991) | | | (2,855) | |
| Net property, plant and equipment | $ | 3,729 | | | $ | 5,775 | |
Schedule I
Clearway Energy LLC (Parent)
Condensed Financial Information of Registrant
Condensed Statements of Income
| | | | | | | | | | | | | | | | | |
| Year ended December 31, |
| (In millions) | 2023 | | 2022 | | 2021 |
| Total operating costs and expenses | $ | — | | | $ | 1 | | | $ | — | |
| Equity in earnings of consolidated subsidiaries | 126 | | | 1,379 | | | 110 | |
| | | | | |
| | | | | |
| | | | | |
| | | | | |
| Interest income | 23 | | | 10 | | | — | |
| Total other income | 149 | | | 1,389 | | | 110 | |
| | | | | |
| | | | | |
| | | | | |
| | | | | |
| | | | | |
| Net Income Attributable to Clearway Energy LLC | $ | 149 | | | $ | 1,388 | | | $ | 110 | |
See accompanying notes to condensed financial statements.
Schedule I
Clearway Energy LLC (Parent)
Condensed Balance Sheets
| | | | | | | | | | | |
| December 31, | | December 31, |
| 2023 | | 2022 |
| ASSETS | (In millions) |
| Current Assets | | | |
| Cash and cash equivalents | $ | 410 | | | $ | 536 | |
| | | |
| | | |
| | | |
| | | |
| | | |
| | | |
| Other current assets | 1 | | | 1 | |
| | | |
| Other Assets | | | |
| Investment in consolidated subsidiaries | 1,934 | | | 2,034 | |
| | | |
| | | |
| | | |
| | | |
| Total Assets | $ | 2,345 | | | $ | 2,571 | |
| LIABILITIES AND MEMBERS’ EQUITY | | | |
| Current Liabilities | | | |
| | | |
| | | |
| Accounts payable — affiliates | $ | 3 | | | $ | 1 | |
| | | |
| | | |
| | | |
| Other Liabilities | | | |
| | | |
| | | |
| | | |
| Other non-current liabilities | 1 | | | 1 | |
| Total Liabilities | 4 | | | 2 | |
| Commitments and Contingencies | | | |
| Members’ Equity | | | |
| Contributed capital | 1,299 | | | 1,308 | |
| Retained earnings | 1,027 | | | 1,240 | |
| Accumulated other comprehensive income | 15 | | | 21 | |
| | | |
| Total Members’ Equity | 2,341 | | | 2,569 | |
| Total Liabilities and Members’ Equity | $ | 2,345 | | | $ | 2,571 | |
See accompanying notes to condensed financial statements.
Schedule I
Clearway Energy LLC (Parent)
Condensed Statements of Cash Flows
| | | | | | | | | | | | | | | | | |
| Years ended December 31, |
| 2023 | | 2022 | | 2021 |
| (In millions) |
| Cash Flows from Operating Activities | | | | | |
| Net Cash Provided by Operating Activities | $ | 23 | | | $ | 8 | | | $ | — | |
| Cash Flows from Investing Activities | | | | | |
| Investments in consolidated affiliates | 209 | | | 845 | | | 202 | |
| | | | | |
| Net Cash Provided by Investing Activities | 209 | | | 845 | | | 202 | |
| Cash Flows from Financing Activities | | | | | |
| Receipt (transfer) of funds under intercompany cash management arrangement | 4 | | | (42) | | | (20) | |
| | | | | |
| | | | | |
| | | | | |
| | | | | |
| Tax-related distributions | (51) | | | (19) | | | — | |
| Payments of distributions | (311) | | | (289) | | | (268) | |
| Net Cash Used in Financing Activities | (358) | | | (350) | | | (288) | |
| Net (Decrease) Increase in Cash and Cash Equivalents | (126) | | | 503 | | | (86) | |
| Cash and Cash Equivalents at Beginning of Period | 536 | | | 33 | | | 119 | |
| Cash and Cash Equivalents at End of Period | $ | 410 | | | $ | 536 | | | $ | 33 | |
| | | | | |
| | | | | |
| | | | | |
| | | | | |
See accompanying notes to condensed financial statements.
Schedule I
Clearway Energy LLC (Parent)
Notes to Condensed Financial Statements
Note 1 — Background and Basis of Presentation
Background
Clearway Energy LLC, together with its consolidated subsidiaries, or the Company, is an energy infrastructure investor with a focus on investments in clean energy and owner of modern, sustainable and long-term contracted assets across North America. The Company is sponsored by GIP and TotalEnergies through the portfolio company, Clearway Energy Group LLC, or CEG, which is equally owned by GIP and TotalEnergies. GIP is an independent infrastructure fund manager that makes equity and debt investments in infrastructure assets and businesses. TotalEnergies is a global multi-energy company. CEG is a leading developer of renewable energy infrastructure in the U.S.
The Company is one of the largest renewable energy owners in the U.S. with approximately 6,000 net MW of installed wind, production priorsolar and energy storage projects. The Company’s approximately 8,500 net MW of assets includes approximately 2,500 net MW of environmentally-sound, highly efficient natural gas-fired generation facilities. Through this environmentally-sound, diversified and primarily contracted portfolio, the Company endeavors to NRG Yield,increase distributions to its unit holders. The majority of the Company’s revenues are derived from long-term contractual arrangements for the output or capacity from these assets.
Clearway Energy, Inc.'s June 22, 2015, or Clearway, Inc., consolidates the results of Clearway Energy LLC through its controlling interest, with CEG’s interest shown as noncontrolling interest in the financial statements. The holders of Clearway, Inc.’s outstanding shares of Class A and Class C common stock offering. Plaintiffs seek compensatory damages, rescission, attorney’s feesare entitled to dividends as declared. CEG receives its distributions from Clearway Energy LLC through its ownership of Clearway Energy LLC Class B and costs. The defendants filed objections and a motion challenging jurisdiction on October 18, 2016. On December 1, 2017, the parties agreedClass D units. From time to a stipulation which provides the plaintiffs' opposition is due on March 6, 2018 and the defendants' reply is due on May 4, 2018.time, CEG may also hold shares of Clearway Inc’s Class A and/or Class C common stock.
Ahmed v. NRG Energy, Inc. and the NRG Yield Board of Directors — On September 15, 2016, plaintiffs filed a putative class action lawsuit against NRG Energy, Inc., the directors of NRG Yield, Inc., and other parties in the Delaware Chancery Court. The complaint alleges that the defendants breached their respective fiduciary duties with regard to the recapitalization of NRG Yield, Inc. common stock in 2015. The plaintiffs generally seek economic damages, attorney’s fees and injunctive relief. The defendants filed a motion to dismiss the lawsuit on December 21, 2016. Plaintiffs filed their objection to the motion to dismiss on February 15, 2017. The defendants' reply was filed on March 24, 2017. The court heard oral argument on the defendants' motion to dismiss on June 20, 2017. On September 7, 2017, the court requested additional briefing which the parties provided on September 21, 2017. On December 11, 2017, the court dismissed the lawsuit with prejudice, thereby ending the case.
GenOn Noteholders' Lawsuit — On December 13, 2016, certain indenture trustees for an ad hoc group of holders, or the Noteholders, of the GenOn Energy, Inc., or GenOn, 7.875% Senior Notes due 2017, 9.500% Notes due 2018, and 9.875% Notes due 2020, and the GenOn Americas Generation, LLC 8.50% Senior Notes due 2021 and 9.125% Senior Notes due 2031, along with certain of the Noteholders, filed a complaint in the Superior Court of the State of Delaware against NRG and GenOn alleging
certain claims related to the Services Agreement between NRG and GenOn. On April 30, 2017, the Noteholders filed an amended complaint that asserts additional claims of fraudulent transfer, insider preference and breach of fiduciary duties. In addition to NRG and GenOn, the amended complaint names NRG Yield LLC and certain current and former officers and directors of GenOn as defendants. The plaintiffs, among other things, generally seek return of all monies paid under the Services Agreement and any other damages that the court deems appropriate. On April 28, 2017, the bondholders filed an amended complaint adding the GenOn directors and officers as defendants and asserting claims that they breached certain fiduciary duties. Plaintiffs specifically allege that the transfer of Marsh Landing to NRG Yield LLC constituted a fraudulent transfer. On June 12, 2017, certain GenOn entities, NRG and certain holders of the GenOn and GenOn Americas Generation, LLC senior notes entered into a restructuring support and lock-up agreement. On December 14, 2017, a settlement agreement was entered into between GenOn and NRG which should ultimately resolve this lawsuit.
Note 15 — Unaudited Quarterly Data
Refer to Note 2, Summary of Significant Accounting Policies and Note 3, Business Acquisitions for a description of the effect of unusual or infrequently occurring events during the quarterly periods. Below is summarized unaudited quarterly financial data, which includes the results of the November 2017 Drop Down Assets Acquisition and its impact on every quarter of the 2017 and 2016 results, which were recast to include the November 2017 Drop Down Assets, where applicable:
|
| | | | | | | | | | | | | | | |
| | Quarter Ended |
| | December 31, | | September 30, | | June 30, | | March 31, |
| | 2017 |
| | (In millions) |
| Operating Revenues | $ | 231 |
| | $ | 269 |
| | $ | 288 |
| | $ | 221 |
|
| | | | | | | | |
| Operating Revenues (as previously reported) | N/A |
| | 265 |
| | 284 |
| | 218 |
|
| Change | N/A |
| | 4 |
| | 4 |
| | 3 |
|
| | | | | | | | |
| Operating Income | 19 |
| | 85 |
| | 124 |
| | 55 |
|
| | | | | | | | |
| Operating Income (as previously reported) | N/A |
| | 95 |
| | 122 |
| | 54 |
|
| Change | N/A |
| | (10 | ) | | 2 |
| | 1 |
|
| | | | | | | | |
| Net (Loss) Income | (38 | ) | | 41 |
| | 59 |
| | — |
|
| | | | | | | | |
| Net Income (as previously reported) | N/A |
| | 52 |
| | 57 |
| | 1 |
|
| Change | N/A |
| | $ | (11 | ) | | $ | 2 |
| | $ | (1 | ) |
|
| | | | | | | | | | | | | | | |
| | Quarter Ended |
| | December 31, | | September 30, | | June 30, | | March 31, |
| | 2016 |
| | (In millions) |
| Operating Revenues | $ | 235 |
| | $ | 276 |
| | $ | 287 |
| | $ | 237 |
|
| | | | | | | | |
| Operating Revenues (as previously reported) | 232 |
| | 272 |
| | 283 |
| | 234 |
|
| Change | 3 |
| | 4 |
| | 4 |
| | 3 |
|
| | | | | | | | |
| Operating (Loss) Income | (100 | ) | | 120 |
| | 130 |
| | 74 |
|
| | | | | | | | |
| Operating (Loss) Income (as previously reported) | (99 | ) | | 118 |
| | 128 |
| | 73 |
|
| Change | (1 | ) | | 2 |
| | 2 |
| | 1 |
|
| | | | | | | | |
| Net (Loss) Income | (138 | ) | | 68 |
| | 80 |
| | 5 |
|
| | | | | | | | |
| Net (Loss) Income (as previously reported) | (137 | ) | | 67 |
| | 79 |
| | 6 |
|
| Change | $ | (1 | ) | | $ | 1 |
| | $ | 1 |
| | $ | (1 | ) |
Note 16 — Condensed Consolidating Financial Information
As of December 31, 2017, Yield Operating LLC had outstanding $500 million2023, Clearway, Inc. owned 57.90% of the 2024 Senior Notes and $350 millioneconomic interests of the 2026 Senior Notes, collectively Senior Notes, as described in Note 10, Long-term Debt. These Senior Notes are guaranteed by the Company, as well as certainwith CEG owning 42.10% of the Company's subsidiaries, or guarantor subsidiaries. These guarantees are both joint and several. The non-guarantor subsidiaries include the resteconomic interests of the Company's subsidiaries, including the ones that are subject to project financing.Company. For further discussion, see Note 11, Members’ Equity.
Unless otherwise noted below, eachBasis of the following guarantor subsidiaries fully and unconditionally guaranteed the Senior Notes as of December 31, 2017:
|
|
NRG Yield LLC |
Alta Wind 1-5 Holding Company, LLC |
Alta Wind Company, LLC |
NRG Energy Center Omaha Holdings LLC |
NRG Energy Center Omaha LLC |
NYLD Fuel Cell Holdings LLC |
UB Fuel Cell, LLC |
NRG South Trent Holdings LLC |
NRG Yield DGPV Holding LLC |
NRG Yield RPV Holding LLC |
Yield Operating LLC conducts much of its business through and derives much of its income from its subsidiaries. Therefore, its ability to make required payments with respect to its indebtedness and other obligations depends on the financial results and condition of its subsidiaries and Yield Operating LLC's ability to receive funds from its subsidiaries. There are no restrictions on the ability of any of the guarantor subsidiaries to transfer funds to Yield Operating LLC. However, there may be restrictions for certain non-guarantor subsidiaries.Presentation
The following condensed consolidating financial information presents the financial information of Yield LLC, Yield Operating LLC, the issuer of the Senior Notes, the guarantor subsidiaries and the non-guarantor subsidiaries in accordance with Rule 3-10 under the SEC Regulation S-X. The financial information may not necessarily be indicative of results of operations or financial position had the guarantor subsidiaries or non-guarantor subsidiaries operated as independent entities.
In this presentation, Yield LLC consists of parent company operations. Guarantor subsidiaries and non-guarantor subsidiaries of Yield LLC are reported on an equity basis. For companies acquired, the fair values of the assets and liabilities acquired have been presented on a push-down accounting basis. As described in Note 3, Business Acquisitions, the Company completed the acquisition of the November 2017 Drop Down Assets, August 2017 Drop Down Assets, and March 2017 Drop Down Assets from NRG on November 1, 2017, August 1, 2017 and March 27, 2017, respectively. The guidance requires retrospective combination of the entities for all periods presented as if the combination has been in effect since the inception of common control. Accordingly, the Company prepared its condensed consolidating financial statements to reflect the transfers as if they had taken place from the beginning of the financial statements period.
In addition, the condensed parentparent-only company financial statements are providedhave been prepared in accordance with Rule 12-04 Schedule I of Regulation S-X, as the restricted net assets of YieldClearway Energy LLC’s subsidiaries exceed 25 percent25% of the consolidated net assets of YieldClearway Energy LLC. The parent’s 100% investment in its subsidiaries has been recorded using the equity basis of accounting in the accompanying condensed parent-only financial statements. These statements should be read in conjunction with the consolidated financial statements and notes thereto of NRG YieldClearway Energy LLC.
Note 2 — Long-Term Debt
For a discussion of Yield LLC's long-term debt,Clearway Energy LLC’s financing arrangements, see Note 10, Long-term Debt,. Forto the Company’s consolidated financial statements.
Note 3 — Commitments, Contingencies and Guarantees
See Note 14, Commitments and Contingencies, to the Company’s consolidated financial statements for a detailed discussion of Yield LLC'sClearway Energy LLC’s commitments and contingencies, see contingencies.
Note 14, Commitments4 — Distributions
Cash distributions paid on the Company’s Class A, Class B, Class C and Contingencies. For a discussion of Yield LLC's distributions to Yield, Inc.Class D units, were $311 million, $289 million, and NRG Energy, see Note 11, Members' Equity.
NRG YIELD LLC AND SUBSIDIARIES
CONDENSED CONSOLIDATING STATEMENTS OF OPERATIONS
For$268 million for the yearyears ended December 31, 20172023, 2022, and 2021, respectively.
|
| | | | | | | | | | | | | | | | | | | | | | | |
| | NRG Yield LLC (a) | | Other Guarantor Subsidiaries | | Non-Guarantor Subsidiaries | | NRG Yield Operating LLC (Note Issuer) | | Eliminations(b) | | Consolidated |
| | (In millions) |
| Operating Revenues | | | | | | | | | | | |
| Total operating revenues | $ | — |
| | $ | 21 |
| | $ | 988 |
| | $ | 1 |
| | $ | (1 | ) | | $ | 1,009 |
|
| Operating Costs and Expenses | | | | | | | — |
| | | | |
| Cost of operations | — |
| | 14 |
| | 312 |
| | 1 |
| | (1 | ) | | 326 |
|
| Depreciation and amortization | — |
| | 5 |
| | 329 |
| | — |
| | — |
| | 334 |
|
| Impairment losses | — |
| | — |
| | 44 |
| | — |
| | — |
| | 44 |
|
| General and administrative | — |
| | — |
| | — |
| | 19 |
| | — |
| | 19 |
|
| Acquisition-related transaction and integration costs | — |
| | — |
| | — |
| | 3 |
| | — |
| | 3 |
|
| Total operating costs and expenses | — |
| | 19 |
| | 685 |
| | 23 |
| | (1 | ) | | 726 |
|
| Operating (Loss) Income | — |
| | 2 |
| | 303 |
| | (22 | ) | | — |
| | 283 |
|
| Other Income (Expense) | | | | | | | | | | | |
| Equity in earnings (losses) of consolidated affiliates | 136 |
| | (16 | ) | | — |
| | 126 |
| | (246 | ) | | — |
|
| Equity in earnings of unconsolidated affiliates | — |
| | 22 |
| | 21 |
| | 28 |
| | — |
| | 71 |
|
| Other income, net | 1 |
| | — |
| | 3 |
| | — |
| | — |
| | 4 |
|
| Loss on debt extinguishment | — |
| | — |
| | (3 | ) | | — |
| | — |
| | (3 | ) |
| Interest expense | — |
| | — |
| | (222 | ) | | (71 | ) | | — |
| | (293 | ) |
| Total other income (expense), net | 137 |
| | 6 |
| | (201 | ) | | 83 |
| | (246 | ) | | (221 | ) |
| Net Income | 137 |
| | 8 |
| | 102 |
| | 61 |
| | (246 | ) | | 62 |
|
| Less: Net loss attributable to noncontrolling interests | — |
| | — |
| | (5 | ) | | (75 | ) | | 5 |
| | (75 | ) |
| Net Income Attributable to NRG Yield LLC | $ | 137 |
| | $ | 8 |
| | $ | 107 |
| | $ | 136 |
| | $ | (251 | ) | | $ | 137 |
|
(a) Shown separately from the other guarantors in lieu of preparing Schedule I pursuant to the requirements of Rule 5-04(c) of Regulation S-X.
(b) All significant intercompany transactions have been eliminated in consolidation.
NRG YIELD LLC AND SUBSIDIARIES
CONDENSED CONSOLIDATING STATEMENTS OF COMPREHENSIVE INCOME
For the year ended December 31, 2017
|
| | | | | | | | | | | | | | | | | | | | | | | |
| | NRG Yield LLC (a) | | Guarantor Subsidiaries | | Non-Guarantor Subsidiaries | | NRG Yield Operating LLC (Note Issuer) | | Eliminations(b) | | Consolidated |
| | (In millions) |
| Net Income | $ | 137 |
| | $ | 8 |
| | $ | 102 |
| | $ | 61 |
| | $ | (246 | ) | | $ | 62 |
|
| Other Comprehensive Income | | | | | | | | | | | |
| Unrealized gain on derivatives | 17 |
| | 1 |
| | 16 |
| | 17 |
| | (34 | ) | | 17 |
|
| Other comprehensive income | 17 |
| | 1 |
| | 16 |
| | 17 |
| | (34 | ) | | 17 |
|
| Comprehensive Income | 154 |
| | 9 |
| | 118 |
| | 78 |
| | (280 | ) | | 79 |
|
| Less: Comprehensive loss attributable to noncontrolling interests | — |
| | — |
| | (5 | ) | | (75 | ) | | 5 |
| | (75 | ) |
| Comprehensive Income Attributable to NRG Yield LLC | $ | 154 |
| | $ | 9 |
| | $ | 123 |
| | $ | 153 |
| | $ | (285 | ) | | $ | 154 |
|
(a) Shown separately from the other guarantors in lieu of preparing Schedule I pursuant to the requirements of Rule 5-04(c) of Regulation S-X.
(b) All significant intercompany transactions have been eliminated in consolidation.
NRG YIELD LLC AND SUBSIDIARIES
CONDENSED CONSOLIDATING BALANCE SHEETS
December 31, 2017
|
| | | | | | | | | | | | | | | | | | | | | | | | |
| | | NRG Yield LLC (a) | | Other Guarantor Subsidiaries | | Non-Guarantor Subsidiaries | | NRG Yield Operating LLC
(Note Issuer) | | Eliminations(b) | | Consolidated |
| ASSETS | | (In millions) |
| Current Assets | | | | | | | | | | | | |
| Cash and cash equivalents | | $ | 22 |
| | $ | — |
| | $ | 124 |
| | $ | — |
| | $ | — |
| | $ | 146 |
|
| Restricted cash | | — |
| | — |
| | 168 |
| | — |
| | — |
| | 168 |
|
| Accounts receivable — trade | | 1 |
| | 2 |
| | 92 |
| | 1 |
| | — |
| | 96 |
|
| Inventory | | — |
| | 1 |
| | 38 |
| | — |
| | — |
| | 39 |
|
| Notes receivable — current | | — |
| | — |
| | 13 |
| | — |
| | — |
| | 13 |
|
| Prepayments and other current assets | | — |
| | — |
| | 18 |
| | 1 |
| | — |
| | 19 |
|
| Total current assets | | 23 |
| | 3 |
| | 453 |
| | 2 |
| | — |
| | 481 |
|
| | | | | | | | | | | | | |
| Property, plant and equipment, net | | — |
| | 58 |
| | 5,146 |
| | — |
| | — |
| | 5,204 |
|
| Other Assets | | | | | | | | | | | | |
| Investment in consolidated subsidiaries | | 1,823 |
| | 460 |
| | — |
| | 3,177 |
| | (5,460 | ) | | — |
|
| Equity investments in affiliates | | — |
| | 233 |
| | 577 |
| | 368 |
| | — |
| | 1,178 |
|
| Intangible assets, net | | — |
| | 55 |
| | 1,173 |
| | — |
| | — |
| | 1,228 |
|
| Other non-current assets | | — |
| | — |
| | 63 |
| | — |
| | — |
| | 63 |
|
| Total other assets | | 1,823 |
| | 748 |
| | 1,813 |
| | 3,545 |
| | (5,460 | ) | | 2,469 |
|
| Total Assets | | $ | 1,846 |
| | $ | 809 |
| | $ | 7,412 |
| | $ | 3,547 |
| | $ | (5,460 | ) | | $ | 8,154 |
|
(a) Shown separately from the other guarantors in lieu of preparing Schedule I pursuant to the requirements of Rule 5-04(c) of Regulation S-X.
(b) All significant intercompany transactions have been eliminated in consolidation.
NRG YIELD LLC AND SUBSIDIARIES
CONDENSED CONSOLIDATING BALANCE SHEETS
(Continued)
December 31, 2017
|
| | | | | | | | | | | | | | | | | | | | | | | | |
| | | NRG Yield LLC (a) | | Other Guarantor Subsidiaries | | Non-Guarantor Subsidiaries | | NRG Yield Operating LLC
(Note Issuer) | | Eliminations(b) | | Consolidated |
| LIABILITIES AND MEMBERS' EQUITY | | (In millions) |
| Current Liabilities | | | | | | | | | | | | |
| Current portion of long-term debt — external | | $ | — |
| | $ | — |
| | $ | 306 |
| | $ | — |
| | $ | — |
| | $ | 306 |
|
| Accounts payable — trade | | — |
| | 2 |
| | 25 |
| | — |
| | — |
| | 27 |
|
| Accounts payable — affiliate | | — |
| | 5 |
| | 27 |
| | 16 |
| | — |
| | 48 |
|
| Derivative instruments | | — |
| | — |
| | 17 |
| | — |
| | — |
| | 17 |
|
| Accrued expenses and other current liabilities | | — |
| | 1 |
| | 61 |
| | 25 |
| | — |
| | 87 |
|
| Total current liabilities | | — |
| | 8 |
| | 436 |
| | 41 |
| | — |
| | 485 |
|
| Other Liabilities | | | | | | | | | | | | |
| Long-term debt — external | | — |
| | — |
| | 4,025 |
| | 896 |
| | — |
| | 4,921 |
|
| Long-term debt — affiliate | | — |
| | — |
| | — |
| | 618 |
| | — |
| | 618 |
|
| Derivative instruments | | — |
| | — |
| | 31 |
| | — |
| | — |
| | 31 |
|
| Other non-current liabilities | | — |
| | — |
| | 84 |
| | 7 |
| | — |
| | 91 |
|
| Total non-current liabilities | | — |
| | — |
| | 4,140 |
| | 1,521 |
| | — |
| | 5,661 |
|
| Total Liabilities | | — |
| | 8 |
| | 4,576 |
| | 1,562 |
| | — |
| | 6,146 |
|
| Commitments and Contingencies | | | | | | | | | | | | |
| Members' Equity | | | | | | | | | | | | |
| Contributed capital | | 1,897 |
| | 863 |
| | 2,871 |
| | 2,097 |
| | (5,831 | ) | | 1,897 |
|
| Retained earnings (accumulated deficit) | | 17 |
| | (61 | ) | | (21 | ) | | (206 | ) | | 288 |
| | 17 |
|
| Accumulated other comprehensive loss | | (68 | ) | | (1 | ) | | (71 | ) | | (68 | ) | | 140 |
| | (68 | ) |
| Noncontrolling interest | | — |
| | — |
| | 57 |
| | 162 |
| | (57 | ) | | 162 |
|
| Total Members' Equity | | 1,846 |
| | 801 |
| | 2,836 |
| | 1,985 |
| | (5,460 | ) | | 2,008 |
|
| Total Liabilities and Members’ Equity | | $ | 1,846 |
| | $ | 809 |
| | $ | 7,412 |
| | $ | 3,547 |
| | $ | (5,460 | ) | | $ | 8,154 |
|
(a) Shown separately from the other guarantors in lieu of preparing Schedule I pursuant to the requirements of Rule 5-04(c) of Regulation S-X.
(b) All significant intercompany transactions have been eliminated in consolidation.
NRG YIELD LLC AND SUBSIDIARIES
CONDENSED CONSOLIDATING STATEMENTS OF CASH FLOWS
For the year ended December 31, 2017
|
| | | | | | | | | | | | | | | | | | | | |
| | | NRG Yield LLC (a) | | Other Guarantor Subsidiaries | | Non-Guarantor Subsidiaries | | NRG Yield Operating LLC (Note Issuer) | | Consolidated |
| | | (In millions) |
| Net Cash Provided by (Used in) Operating Activities | | $ | — |
| | $ | 58 |
| | $ | 529 |
| | $ | (71 | ) | | $ | 516 |
|
| Cash Flows from Investing Activities | | | | | | | | | | |
| Changes in investments in consolidated subsidiaries | | (15 | ) | | — |
| | — |
| | 15 |
| | — |
|
| Acquisition of Drop Down Assets, net of cash acquired | | — |
| | — |
| | — |
| | (250 | ) | | (250 | ) |
| Capital expenditures | | — |
| | (4 | ) | | (27 | ) | | — |
| | (31 | ) |
| Cash receipts from notes receivable | | — |
| | — |
| | 17 |
| | — |
| | 17 |
|
| Return of investment from unconsolidated affiliates | | — |
| | 10 |
| | 14 |
| | 23 |
| | 47 |
|
| Investments in unconsolidated affiliates | | — |
| | (64 | ) | | (7 | ) | | (2 | ) | | (73 | ) |
| Other | | — |
| | — |
| | 7 |
| | — |
| | 7 |
|
| Net Cash Provided by (Used in) Investing Activities | | (15 | ) | | (58 | ) | | 4 |
| | (214 | ) | | (283 | ) |
| Cash Flows from Financing Activities | | | | | | | | | | |
| Net contributions from noncontrolling interests | | — |
| | — |
| | 2 |
| | 11 |
| | 13 |
|
| Net distributions and return of capital to NRG prior to the acquisition of Drop Down Assets | | — |
| | — |
| | (13 | ) | | (7 | ) | | (20 | ) |
| Transfer of funds under intercompany cash management arrangement | | (5 | ) | | — |
| | (1 | ) | | 6 |
| | — |
|
| Proceeds from the issuance of Class C units | | 33 |
| | — |
| | — |
| | — |
| | 33 |
|
| (Payments of) proceeds from distributions | | (202 | ) | | — |
| | (220 | ) | | 220 |
| | (202 | ) |
| Proceeds from the revolving credit facility | | — |
| | — |
| | — |
| | 55 |
| | 55 |
|
| Proceeds from issuance of long-term debt | | — |
| | — |
| | 41 |
| | — |
| | 41 |
|
| Payments of debt issuance costs | | — |
| | — |
| | (4 | ) | | — |
| | (4 | ) |
| Payments for long-term debt — external | | — |
| | — |
| | (332 | ) | | — |
| | (332 | ) |
| Net Cash (Used in) Provided by Financing Activities | | (174 | ) | | — |
| | (527 | ) | | 285 |
| | (416 | ) |
| Net (Decrease) Increase in Cash, Cash Equivalents and Restricted Cash | | (189 | ) | | — |
| | 6 |
| | — |
| | (183 | ) |
| Cash, Cash Equivalents and Restricted Cash at Beginning of Period | | 211 |
| | — |
| | 286 |
| | — |
| | 497 |
|
| Cash, Cash Equivalents and Restricted Cash at End of Period | | $ | 22 |
| | $ | — |
| | $ | 292 |
| | $ | — |
| | $ | 314 |
|
(a) Shown separately from the other guarantors in lieu of preparing Schedule I pursuant to the requirements of Rule 5-04(c) of Regulation S-X.
NRG YIELD LLC AND SUBSIDIARIES
CONDENSED CONSOLIDATING STATEMENTS OF OPERATIONS
For the Year Ended December 31, 2016
|
| | | | | | | | | | | | | | | | | | | | | | | |
| | NRG Yield LLC (a) (c) | | Other Guarantor Subsidiaries | | Non-Guarantor Subsidiaries (c) | | NRG Yield Operating LLC (Note Issuer) (c) | | Eliminations(b) (c) | | Consolidated |
| | (In millions) |
| Operating Revenues | | | | | | | | | | | |
| Total operating revenues | $ | — |
| | $ | 22 |
| | $ | 1,013 |
| | $ | 1 |
| | $ | (1 | ) | | $ | 1,035 |
|
| Operating Costs and Expenses | | | | | | | | | | | |
| Cost of operations | — |
| | 14 |
| | 294 |
| | 1 |
| | (1 | ) | | 308 |
|
| Depreciation and amortization | — |
| | 5 |
| | 298 |
| | — |
| | — |
| | 303 |
|
| Impairment losses | — |
| | — |
| | 185 |
| | — |
| | — |
| | 185 |
|
| General and administrative | 2 |
| | — |
| | — |
| | 12 |
| | — |
| | 14 |
|
| Acquisition-related transaction and integration costs | — |
| | — |
| | — |
| | 1 |
| | — |
| | 1 |
|
| Total operating costs and expenses | 2 |
| | 19 |
| | 777 |
| | 14 |
| | (1 | ) | | 811 |
|
| Operating Income (Loss) | (2 | ) | | 3 |
| | 236 |
| | (13 | ) | | — |
| | 224 |
|
| Other Income (Expense) | | | | | | | | | | | |
| Equity in earnings (losses) of consolidated affiliates | 128 |
| | 10 |
| | — |
| | 66 |
| | (204 | ) | | — |
|
| Equity in earnings of unconsolidated affiliates | — |
| | 9 |
| | 21 |
| | 30 |
| | — |
| | 60 |
|
| Other income, net | — |
| | — |
| | 3 |
| | — |
| | — |
| | 3 |
|
| Interest expense | — |
| | — |
| | (206 | ) | | (66 | ) | | — |
| | (272 | ) |
| Total other income (expense) | 128 |
| | 19 |
| | (182 | ) | | 30 |
| | (204 | ) | | (209 | ) |
| Net Income | 126 |
| | 22 |
| | 54 |
| | 17 |
| | (204 | ) | | 15 |
|
| Less: Net loss attributable to noncontrolling interests | — |
| | — |
| | (1 | ) | | (111 | ) | | 1 |
| | (111 | ) |
| Net Income Attributable to NRG Yield LLC | $ | 126 |
| | $ | 22 |
| | $ | 55 |
| | $ | 128 |
| | $ | (205 | ) | | $ | 126 |
|
(a) Shown separately from the other guarantors in lieu of preparing Schedule I pursuant to the requirements of Rule 5-04(c) of Regulation S-X.
(b) All significant intercompany transactions have been eliminated in consolidation.
(c) Retrospectively adjusted as discussed in Note 1, Nature of Business.
NRG YIELD LLC AND SUBSIDIARIES
CONDENSED CONSOLIDATING STATEMENTS OF COMPREHENSIVE INCOME
For the Year Ended December 31, 2016
|
| | | | | | | | | | | | | | | | | | | | | | | |
| | NRG Yield LLC (a) (c) | | Other Guarantor Subsidiaries | | Non-Guarantor Subsidiaries (c) | | NRG Yield Operating LLC (Note Issuer) (c) | | Eliminations(b) (c) | | Consolidated |
| | (In millions) |
| Net Income | $ | 126 |
| | $ | 22 |
| | $ | 54 |
| | $ | 17 |
| | $ | (204 | ) | | $ | 15 |
|
| Other Comprehensive Income | | | | | | | | | | | |
| Unrealized gain on derivatives | 13 |
| | 1 |
| | 10 |
| | 13 |
| | (24 | ) | | 13 |
|
| Other comprehensive income | 13 |
| | 1 |
| | 10 |
| | 13 |
| | (24 | ) | | 13 |
|
| Comprehensive Income | 139 |
| | 23 |
| | 64 |
| | 30 |
| | (228 | ) | | 28 |
|
| Less: Comprehensive loss attributable to noncontrolling interests | — |
| | — |
| | (1 | ) | | (111 | ) | | 1 |
| | (111 | ) |
| Comprehensive Income Attributable to NRG Yield LLC | $ | 139 |
| | $ | 23 |
| | $ | 65 |
| | $ | 141 |
| | $ | (229 | ) | | $ | 139 |
|
(a) Shown separately from the other guarantors in lieu of preparing Schedule I pursuant to the requirements of Rule 5-04(c) of Regulation S-X.
(b) All significant intercompany transactions have been eliminated in consolidation.
(c) Retrospectively adjusted as discussed in Note 1, Nature of Business.
NRG YIELD LLC AND SUBSIDIARIES
CONDENSED CONSOLIDATING BALANCE SHEETS
December 31, 2016
|
| | | | | | | | | | | | | | | | | | | | | | | | |
| | | NRG Yield LLC (a)(c) | | Other Guarantor Subsidiaries | | Non-Guarantor Subsidiaries (c) | | NRG Yield Operating LLC
(Note Issuer) (c) | | Eliminations(b)(c) | | Consolidated |
| ASSETS | | (In millions) |
| Current Assets | | | | | | | | | | | | |
| Cash and cash equivalents | | $ | 211 |
| | $ | — |
| | $ | 110 |
| | $ | — |
| | $ | — |
| | $ | 321 |
|
| Restricted cash | | — |
| | — |
| | 176 |
| | — |
| | — |
| | 176 |
|
| Accounts receivable — trade | | — |
| | 2 |
| | 94 |
| | — |
| | — |
| | 96 |
|
| Inventory | | — |
| | 2 |
| | 37 |
| | — |
| | — |
| | 39 |
|
| Notes receivable — current | | — |
| | — |
| | 16 |
| | — |
| | — |
| | 16 |
|
| Prepayments and other current assets | | — |
| | — |
| | 21 |
| | 1 |
| | — |
| | 22 |
|
| Total current assets | | 211 |
| | 4 |
| | 454 |
| | 1 |
| | — |
| | 670 |
|
| | | | | | | | | | | | | |
| Property, plant and equipment, net | | — |
| | 59 |
| | 5,495 |
| | — |
| | — |
| | 5,554 |
|
| Other Assets | | | | | | | | | | | | |
| Investment in consolidated subsidiaries | | 1,927 |
| | 527 |
| | — |
| | 3,272 |
| | (5,726 | ) | | — |
|
| Equity investments in affiliates | | — |
| | 171 |
| | 600 |
| | 381 |
| | — |
| | 1,152 |
|
| Intangible assets, net | | — |
| | 56 |
| | 1,247 |
| | — |
| | — |
| | 1,303 |
|
| Other non-current assets | | — |
| | — |
| | 66 |
| | 1 |
| | — |
| | 67 |
|
| Total other assets | | 1,927 |
| | 754 |
| | 1,913 |
| | 3,654 |
| | (5,726 | ) | | 2,522 |
|
| Total Assets | | $ | 2,138 |
| | $ | 817 |
| | $ | 7,862 |
| | $ | 3,655 |
| | $ | (5,726 | ) | | $ | 8,746 |
|
(a) Shown separately from the other guarantors in lieu of preparing Schedule I pursuant to the requirements of Rule 5-04(c) of Regulation S-X.
(b) All significant intercompany transactions have been eliminated in consolidation.
(c) Retrospectively adjusted as discussed in Note 1, Nature of Business.
NRG YIELD LLC AND SUBSIDIARIES
CONDENSED CONSOLIDATING BALANCE SHEETS
(Continued)
December 31, 2016
|
| | | | | | | | | | | | | | | | | | | | | | | | |
| | | NRG Yield LLC (a) (c) | | Other Guarantor Subsidiaries | | Non-Guarantor Subsidiaries (c) | | NRG Yield Operating LLC
(Note Issuer) (c) | | Eliminations (b) (c) | | Consolidated |
| LIABILITIES AND MEMBERS' EQUITY | | (In millions) |
| Current Liabilities | | | | | | | | | | | | |
| Current portion of long-term debt — external | | $ | — |
| | $ | — |
| | $ | 323 |
| | $ | — |
| | $ | — |
| | $ | 323 |
|
| Accounts payable — trade | | — |
| | 2 |
| | 18 |
| | 3 |
| | — |
| | 23 |
|
| Accounts payable — affiliate | | — |
| | 7 |
| | 15 |
| | 18 |
| | — |
| | 40 |
|
| Derivative instruments | | — |
| | — |
| | 33 |
| | — |
| | — |
| | 33 |
|
| Accrued expenses and other current liabilities | | — |
| | 1 |
| | 60 |
| | 24 |
| | — |
| | 85 |
|
| Total current liabilities | | — |
| | 10 |
| | 449 |
| | 45 |
| | — |
| | 504 |
|
| Other Liabilities | | | | | | | | | | | |
|
|
| Long-term debt — external | | — |
| | — |
| | 4,289 |
| | 839 |
| | — |
| | 5,128 |
|
| Long-term debt — affiliate | | — |
| | — |
| | — |
| | 618 |
| | — |
| | 618 |
|
| Accounts payable — affiliate | | — |
| | — |
| | 9 |
| | — |
| | — |
| | 9 |
|
| Derivative instruments | | — |
| | — |
| | 46 |
| | — |
| | — |
| | 46 |
|
| Other non-current liabilities | | — |
| | — |
| | 77 |
| | — |
| | — |
| | 77 |
|
| Total non-current liabilities | | — |
| | — |
| | 4,421 |
| | 1,457 |
| | — |
| | 5,878 |
|
| Total Liabilities | | — |
| | 10 |
| | 4,870 |
| | 1,502 |
| | — |
| | 6,382 |
|
| Commitments and Contingencies | | | | | | | | | | | | |
| Members' Equity | | | | | | | | | | | | |
| Contributed capital | | 2,179 |
| | 874 |
| | 2,972 |
| | 2,155 |
| | (6,001 | ) | | 2,179 |
|
| Retained earnings (accumulated deficit) | | 44 |
| | (65 | ) | | 43 |
| | (143 | ) | | 165 |
| | 44 |
|
| Accumulated other comprehensive loss | | (85 | ) | | (2 | ) | | (87 | ) | | (85 | ) | | 174 |
| | (85 | ) |
| Noncontrolling interest | | — |
| | — |
| | 64 |
| | 226 |
| | (64 | ) | | 226 |
|
| Total Members' Equity | | 2,138 |
| | 807 |
| | 2,992 |
| | 2,153 |
| | (5,726 | ) | | 2,364 |
|
| Total Liabilities and Members’ Equity | | $ | 2,138 |
| | $ | 817 |
| | $ | 7,862 |
| | $ | 3,655 |
| | $ | (5,726 | ) | | $ | 8,746 |
|
(a) Shown separately from the other guarantors in lieu of preparing Schedule I pursuant to the requirements of Rule 5-04(c) of Regulation S-X.
(b) All significant intercompany transactions have been eliminated in consolidation.
(c) Retrospectively adjusted as discussed in Note 1, Nature of Business.
NRG YIELD LLC AND SUBSIDIARIES
CONDENSED CONSOLIDATING STATEMENTS OF CASH FLOWS
For the Year Ended December 31, 2016
|
| | | | | | | | | | | | | | | | | | | | |
| | | NRG Yield LLC (a) (b) | | Other Guarantor Subsidiaries | | Non-Guarantor Subsidiaries (b) | | NRG Yield Operating LLC (Note Issuer) (b) | | Consolidated |
| | | |
| Net Cash Provided by (Used in) Operating Activities | | $ | — |
| | $ | 62 |
| | $ | 554 |
| | $ | (39 | ) | | $ | 577 |
|
| Cash Flows from Investing Activities | | | | | | | | | | |
| Changes in investments in consolidated subsidiaries | | 325 |
| | — |
| | (21 | ) | | (304 | ) | | — |
|
| Acquisition of Drop Down Assets | | — |
| | — |
| | — |
| | (77 | ) | | (77 | ) |
| Capital expenditures | | — |
| | — |
| | (20 | ) | | — |
| | (20 | ) |
| Cash receipts from notes receivable | | — |
| | — |
| | 17 |
| | — |
| | 17 |
|
| Return of investment from unconsolidated affiliates | | — |
| | 16 |
| | — |
| | 12 |
| | 28 |
|
| Investments in unconsolidated affiliates | | — |
| | (80 | ) | | (3 | ) | | — |
| | (83 | ) |
| Other | | — |
| | — |
| | 4 |
| | — |
| | 4 |
|
| Net Cash Used in Investing Activities | | 325 |
| | (64 | ) | | (23 | ) | | (369 | ) | | (131 | ) |
| Cash Flows from Financing Activities | | | | | | | | |
| | |
|
| Transfer of funds under intercompany cash management arrangement | | 44 |
| | 2 |
| | — |
| | (46 | ) | | — |
|
| Net contributions from noncontrolling interests | | — |
| | — |
| | — |
| | 5 |
| | 5 |
|
| Net distributions and return of capital to NRG prior to the acquisition of Drop Down Assets | | — |
| | — |
| | (174 | ) | | (10 | ) | | (184 | ) |
| (Payments of) proceeds from distributions | | (173 | ) | | — |
| | (420 | ) | | 420 |
| | (173 | ) |
| Proceeds from the revolving credit facility | | — |
| | — |
| | — |
| | 60 |
| | 60 |
|
| Payments for the revolving credit facility | | — |
| | — |
| | — |
| | (366 | ) | | (366 | ) |
| Proceeds from the issuance of long-term debt - external | | — |
| | — |
| | 390 |
| | 350 |
| | 740 |
|
| Payments of debt issuance costs | | — |
| | — |
| | (10 | ) | | (5 | ) | | (15 | ) |
| Payments for long-term debt — external | | — |
| | — |
| | (269 | ) | | — |
| | (269 | ) |
| Net Cash Provided by (Used in) Financing Activities | | (129 | ) | | 2 |
| | (483 | ) | | 408 |
| | (202 | ) |
| Net (Decrease) Increase in Cash, Cash Equivalents and Restricted Cash | | 196 |
| | — |
| | 48 |
| | — |
| | 244 |
|
| Cash, Cash Equivalents and Restricted Cash at Beginning of Period | | 15 |
| | — |
| | 238 |
| | — |
| | 253 |
|
| Cash, Cash Equivalents and Restricted Cash at End of Period | | $ | 211 |
| | $ | — |
| | $ | 286 |
| | $ | — |
| | $ | 497 |
|
(a) Shown separately from the other guarantors in lieu of preparing Schedule I pursuant to the requirements of Rule 5-04(c) of Regulation S-X.
(b) Retrospectively adjusted as discussed in Note 1, Nature of Business.
NRG YIELD LLC AND SUBSIDIARIES
CONDENSED CONSOLIDATING STATEMENTS OF OPERATIONS
For the Year Ended December 31, 2015
|
| | | | | | | | | | | | | | | | | | | | | | | |
| | NRG Yield LLC (a) (c) | | Other Guarantor Subsidiaries | | Non-Guarantor Subsidiaries (c) | | NRG Yield Operating LLC (Note Issuer) (c) | | Eliminations(b) (c) | | Consolidated |
| | (In millions) |
| Operating Revenues | | | | | | | | | | | |
| Total operating revenues | $ | — |
| | $ | 21 |
| | $ | 937 |
| | $ | 10 |
| | $ | — |
| | $ | 968 |
|
| Operating Costs and Expenses | | | | | | | | | | | |
| Cost of operations | — |
| | 14 |
| | 309 |
| | — |
| | — |
| | 323 |
|
| Depreciation and amortization | — |
| | 4 |
| | 299 |
| | — |
| | — |
| | 303 |
|
| Impairment losses | — |
| | — |
| | 1 |
| | — |
| | — |
| | 1 |
|
| General and administrative | — |
| | — |
| | — |
| | 10 |
| | — |
| | 10 |
|
| Acquisition-related transaction and integration costs | — |
| | — |
| | — |
| | 3 |
| | — |
| | 3 |
|
| Total operating costs and expenses | — |
| | 18 |
| | 609 |
| | 13 |
| | — |
| | 640 |
|
| Operating Income (Loss) | — |
| | 3 |
| | 328 |
| | (3 | ) | | — |
| | 328 |
|
| Other Income (Expense) | | | | | | | | | | | |
| Equity in earnings (losses) of consolidated affiliates | 157 |
| | (43 | ) | | — |
| | 125 |
| | (239 | ) | | — |
|
| Equity in (losses) earnings of unconsolidated affiliates | — |
| | (2 | ) | | 8 |
| | 25 |
| | — |
| | 31 |
|
| Other income, net | — |
| | — |
| | 3 |
| | — |
| | — |
| | 3 |
|
| Loss on debt extinguishment | — |
| | — |
| | (9 | ) | | — |
| | — |
| | (9 | ) |
| Interest expense | — |
| | — |
| | (206 | ) | | (52 | ) | | — |
| | (258 | ) |
| Total other income (expense), net | 157 |
| | (45 | ) | | (204 | ) | | 98 |
| | (239 | ) | | (233 | ) |
| Net Income (Loss) | 157 |
| | (42 | ) | | 124 |
| | 95 |
| | (239 | ) | | 95 |
|
| Less: Net loss attributable to noncontrolling interests | — |
| | — |
| | (2 | ) | | (62 | ) | | 2 |
| | (62 | ) |
| Net Income (Loss) Attributable to NRG Yield LLC | $ | 157 |
| | $ | (42 | ) | | $ | 126 |
| | $ | 157 |
| | $ | (241 | ) | | $ | 157 |
|
(a) Shown separately from the other guarantors in lieu of preparing Schedule I pursuant to the requirements of Rule 5-04(c) of Regulation S-X.
(b) All significant intercompany transactions have been eliminated in consolidation.
(c) Retrospectively adjusted as discussed in Note 1, Nature of Business.
NRG YIELD LLC AND SUBSIDIARIES
CONDENSED CONSOLIDATING STATEMENTS OF COMPREHENSIVE INCOME
For the Year Ended December 31, 2015
|
| | | | | | | | | | | | | | | | | | | | | | | |
| | NRG Yield LLC (a) (c) | | Other Guarantor Subsidiaries | | Non-Guarantor Subsidiaries (c) | | NRG Yield Operating LLC (Note Issuer) (c) | | Eliminations (b) (c) | | Consolidated |
| | (In millions) |
| Net Income (Loss) | $ | 157 |
| | $ | (42 | ) | | $ | 124 |
| | $ | 95 |
| | $ | (239 | ) | | $ | 95 |
|
| Other Comprehensive Loss | | | | | | | | | | | |
| Unrealized loss on derivatives | (16 | ) | | — |
| | (16 | ) | | (17 | ) | | 32 |
| | (17 | ) |
| Other comprehensive loss | (16 | ) | | — |
| | (16 | ) | | (17 | ) | | 32 |
| | (17 | ) |
| Comprehensive Income (Loss) | 141 |
| | (42 | ) | | 108 |
| | 78 |
| | (207 | ) | | 78 |
|
| Less: Comprehensive loss attributable to noncontrolling interests | — |
| | — |
| | (2 | ) | | (63 | ) | | 2 |
| | (63 | ) |
| Comprehensive Income (Loss) Attributable to NRG Yield LLC | $ | 141 |
| | $ | (42 | ) | | $ | 110 |
| | $ | 141 |
| | $ | (209 | ) | | $ | 141 |
|
(a) Shown separately from the other guarantors in lieu of preparing Schedule I pursuant to the requirements of Rule 5-04(c) of Regulation S-X.
(b) All significant intercompany transactions have been eliminated in consolidation.
(c) Retrospectively adjusted as discussed in Note 1, Nature of Business.
NRG YIELD LLC AND SUBSIDIARIES
CONDENSED CONSOLIDATING STATEMENTS OF CASH FLOWS
For the Year Ended December 31, 2015
|
| | | | | | | | | | | | | | | | | | | | |
| | | | | | | | | | |
| | NRG Yield LLC (a) (b) | | Other Guarantor Subsidiaries | | Non-Guarantor Subsidiaries (b) | | NRG Yield Operating LLC (Note Issuer) (b) | | Consolidated |
| | (In millions) |
| Net Cash Provided by (Used in) Operating Activities | $ | — |
| | $ | 19 |
| | $ | 423 |
| | $ | (18 | ) | | $ | 424 |
|
| Cash Flows from Investing Activities | | | | | | | | | |
| Changes in investments in consolidated subsidiaries | (464 | ) | | — |
| | 285 |
| | 179 |
| | — |
|
| Acquisition of businesses, net of cash acquired | — |
| | — |
| | — |
| | (37 | ) | | (37 | ) |
| Acquisition of Drop Down Assets, net of cash acquired | — |
| | — |
| | — |
| | (698 | ) | | (698 | ) |
| Capital expenditures | — |
| | — |
| | (29 | ) | | — |
| | (29 | ) |
| Cash receipts from notes receivable | — |
| | — |
| | 17 |
| | — |
| | 17 |
|
| Return of investment from unconsolidated affiliates | — |
| | — |
| | — |
| | 42 |
| | 42 |
|
| Investments in unconsolidated affiliates | — |
| | (28 | ) | — |
| — |
| | (374 | ) | | (402 | ) |
| Other | — |
| | — |
| | 9 |
| | — |
| | 9 |
|
| Net Cash (Used in) Provided by Investing Activities | (464 | ) | | (28 | ) | | 282 |
| | (888 | ) | | (1,098 | ) |
| Cash Flows from Financing Activities | | | | | | | | | |
| Transfer of funds under intercompany cash management arrangement | (309 | ) | | 9 |
| | — |
| | 300 |
| | — |
|
| Net contributions from noncontrolling interests | — |
| | — |
| | — |
| | 122 |
| | 122 |
|
| Net distributions and return of capital to NRG prior to the acquisition of Drop Down Assets | — |
| | — |
| | (79 | ) | | — |
| | (79 | ) |
| Proceeds from the issuance of Class C units | 599 |
| | — |
| | — |
| | — |
| | 599 |
|
| (Payments of) proceeds from distributions | (139 | ) | | — |
| | (392 | ) | | 392 |
| | (139 | ) |
| Proceeds from the revolving credit facility | — |
| | — |
| | — |
| | 551 |
| | 551 |
|
| Payments for the revolving credit facility | — |
| | — |
| | — |
| | (245 | ) | | (245 | ) |
| Proceeds from issuance of long-term debt — external | — |
| | — |
| | 6 |
| | — |
| | 6 |
|
| Proceeds from issuance of long-term debt — affiliate | — |
| | — |
| | — |
| | 281 |
| | 281 |
|
| Payments for long-term debt — external | — |
| | — |
| | (241 | ) | | (494 | ) | | (735 | ) |
| Payment of debt issuance costs | — |
| | — |
| | (6 | ) | | (1 | ) | | (7 | ) |
| Net Cash Provided by (Used in) Financing Activities | 151 |
| | 9 |
| | (712 | ) | | 906 |
| | 354 |
|
| Net (Decrease) Increase in Cash, Cash Equivalents and Restricted Cash | (313 | ) | | — |
| | (7 | ) | | — |
| | (320 | ) |
| Cash, Cash Equivalents and Restricted Cash at Beginning of Period | 328 |
| | — |
| | 245 |
| | — |
| | 573 |
|
| Cash, Cash Equivalents and Restricted Cash at End of Period | $ | 15 |
| | $ | — |
| | $ | 238 |
| | $ | — |
| | $ | 253 |
|
(a) Shown separately from the other guarantors in lieu of preparing Schedule I pursuant to the requirements of Rule 5-04(c) of Regulation S-X.
(b) Retrospectively adjusted as discussed in Note 1, Nature of Business.
EXHIBIT INDEX
|
| Number | | Description | | | |
Number | | Description | | Method of Filing |
| 2.1 | | | | Incorporated herein by reference to Exhibit 2.1 to NRG Yield, Inc.’s Current Report on Form 8-K filed on May 9, 2014.
| 2.2 | | | | Incorporated herein by reference to Exhibit 2.2 to NRG Yield, Inc.’s Current Report on Form 8-K filed on May 9, 2014.
| 2.3 | | | | Incorporated herein by reference to Exhibit 2.3 to NRG Yield, Inc.’s Current Report on Form 8-K filed on May 9, 2014. |
2.4 | | Purchase and Sale Agreement, dated June 3, 2014, by and among NRG Yield, Inc., NRG Yield Operating LLC, Terra-Gen Finance Company, LLC, NTD AWAM Holdings, LLC, CHIPS Alta Wind X Holding Company, LLC and CHIPS Alta Wind XI Holding Company, LLC. | | Incorporated herein by reference to Exhibit 10.1 to NRG Yield, Inc.’s Current Report on Form 8-K filed on June 9, 2014. |
2.5 | | | | Incorporated herein by reference to Exhibit 2.1 to NRG Yield, Inc.’sthe Company’s Current Report on Form 8-K filed on November 7, 2014.20, 2020. |
2.63.1 | | | | Incorporated herein by reference to Exhibit 2.2 to NRG Yield, Inc.’s Current Report on Form 8-K filed on November 7, 2014. |
2.7*^ | | | | Incorporated herein by reference to Exhibit 2.1 to NRG Yield, Inc.’s Quarterly Report on Form 10-Q filed on August 4, 2015. |
2.8 | |
| | Incorporated herein by reference to Exhibit 2.1 to NRG Yield, Inc.’s Current Report on Form 8-K filed on September 21, 2015.
|
2.9 | | | | Incorporated herein by reference to Exhibit 2.1 to NRG Yield, Inc.'s Current Report on Form 8-K, filed on August 9, 2016. |
2.10* | |
| | Incorporated herein by reference to Exhibit 2.10 to NRG Yield, Inc.'s Annual Report on Form 10-K, filed on March 1, 2018.
|
3.1 | | | | Incorporated herein by reference to Exhibit 3.01(a) to the Company'sCompany’s Registration Statement on Form S-4 filed on April 13, 2015. |
| 3.2 | | | | Incorporated herein by reference to Exhibit 3.01(b) to the Company'sCompany’s Registration Statement on Form S-4 filed on April 13, 2015. |
| 3.3 | | | | Incorporated herein by reference to Exhibit 3.023.3. to the Company'sCompany’s Annual Report on Form 10-K filed on February 28, 2019. |
| 3.4 | | | | Incorporated herein by reference to Exhibit 3.03(a) to the Company’s Registration Statement on Form S-4 filed on April 13, 2015. |
3.43.5 | | | | Incorporated herein by reference to Exhibit 3.03(a)3.03(b) to the Company'sCompany’s Registration Statement on Form S-4 filed on April 13, 2015. |
3.53.6 | | | | Incorporated herein by reference to Exhibit 3.03(b) to the Company's Registration Statement on Form S-4 filed on April 13, 2015. |
3.6 | | | | Incorporated herein by reference to Exhibit 10.410.6 to NRG Yield,Clearway Energy, Inc.'s’s Current Report on Form 8-K filed on May 15, 2015.September 5, 2018. |
| 4.1 | | | | Incorporated herein by reference to Exhibit 4.1 to NRG Yield, Inc.'s Current Report on Form 8-K filed on August 5, 2014. |
|
| | | | |
4.2 | | | | Incorporated herein by reference to Exhibit 4.2 to NRG Yield, Inc.'s Current Report on Form 8-K filed on August 5, 2014. |
4.3 | | | | Incorporated herein by reference to Exhibit 4.3 to NRG Yield, Inc.'s Current Report on Form 8-K filed on August 5, 2014. |
4.4 | | | | Incorporated herein by reference to Exhibit 4.1 to NRG Yield, Inc.'s Current Report on Form 8-K filed on November 13, 2014. |
4.5 | | | | Incorporated herein by reference to Exhibit 4.1 to NRG Yield, Inc.'s Current Report on Form 8-K filed on February 27, 2015. |
4.6 | | | | Incorporated herein by reference to Exhibit 4.07 to the Company's Registration Statement on Form S-4 filed on April 13, 2015. |
4.7 | | | | Incorporated herein by reference to Exhibit 4.1 to NRG Yield, Inc.'s Current Report on Form 8-K filed on May 8, 2015. |
4.8 | | | | Incorporated herein by reference to Exhibit 4.1 to NRG Yield, Inc.'s Current Report on Form 8-K filed on June 29, 2015. |
4.9 | |
| | Incorporated herein by reference to Exhibit 4.2 to NRG Yield, Inc.'s Current Report on Form 8-K filed on June 29, 2015.
|
4.10 | | | | Incorporated herein by reference to Exhibit 4.1 to the Registrant's Current Report on Form 8-K, filed on August 18, 2016. |
4.11 | |
| | Incorporated herein by reference to Exhibit 4.2 to the Registrant's Current Report on Form 8-K, filed on August 18, 2016. |
4.12 | | | | Incorporated herein by reference to Exhibit 4.3 to the Registrant's Current Report on Form 8-K, filed on August 18, 2016. |
4.13 | |
| | Incorporated herein by reference to Exhibit 4.1 to the Registrant'sCompany’s Current Report on Form 8-K filed on January 31, 2018.December 12, 2019. |
4.144.2 | | | | Incorporated herein by reference to Exhibit 4.2 to the Registrant'sCompany’s Current Report on Form 8-K filed on December 12, 2019. |
| 4.3 | | | | Incorporated herein by reference to Exhibit 4.3 to the Company’s Current Report on Form 8-K filed on January 31, 2018.
8, 2020. |
10.14.4 | | | | Incorporated herein by reference to Exhibit 10.24.3 to NRG Yield, Inc.'sthe Company’s Current Report on Form 8-K filed on March 3, 2020. |
| 4.5 | | | | Incorporated herein by reference to Exhibit 4.3 to the Company’s Current Report on Form 8-K filed on July 21, 2020. |
| 4.6 | | | | Incorporated herein by reference to Exhibit 4.3 to the Company’s Current Report on Form 8-K filed on August 20, 2020. |
| 4.7 | | | | Incorporated herein by reference to Exhibit 4.3 to the Company’s Current Report on Form 8-K filed on November 19, 2020. |
| 4.8 | | | | Incorporated herein by reference to Exhibit 4.3 to the Company’s Current Report on Form 8-K filed on December 4, 2020. |
| 4.9 | | | | Incorporated herein by reference to Exhibit 4.3 to the Company’s Current Report on Form 8-K filed on December 29, 2020. |
| 4.10 | | | | Incorporated herein by reference to Exhibit 4.3 to the Company’s Current Report on Form 8-K filed on February 5, 2021. |
| 4.11 | | | | Incorporated herein by reference to Exhibit 4.1 to the Company’s Current Report on Form 8-K filed on March 9, 2021. |
| 4.12 | | | | Incorporated herein by reference to Exhibit 4.2 to the Company’s Current Report on Form 8-K filed on March 9, 2021. |
| 4.13 | | | | Incorporated herein by reference to Exhibit 4.2 to the Company’s Current Report on Form 8-K filed on May 15, 2015.19, 2021. |
10.24.14 | | | | Incorporated herein by reference to Exhibit 10.14.3 to NRG Yield, Inc.'sthe Company’s Current Report on Form 8-K filed on May 15, 2015.19, 2021. |
| | | | | | | | | | | | | | |
10.34.15 | | Second AmendedIndenture, dated October 1, 2021, among Clearway Energy Operating LLC, the guarantors named therein and Restated Right of First Offer Agreement, datedDelaware Trust Company, as of February 24, 2017, by and between NRG Energy, Inc. and NRG Yield, Inc.trustee. | | Incorporated herein by reference to Exhibit 10.34.1 to NRG Yield, Inc.'s Annual Report on Form 10-K filed on February 28, 2017. |
10.4 | | | | Incorporated herein by reference to Exhibit 10.4 to NRG Yield, Inc.'sthe Company’s Current Report on Form 8-K filed on July 26, 2013.October 1, 2021. |
10.54.16 | | | | Incorporated herein by reference to Exhibit 10.54.2 to NRG Yield, Inc.'sthe Company’s Current Report on Form 8-K filed on July 26, 2013.October 1, 2021. |
10.64.17 | | | | Incorporated herein by reference to Exhibit 4.2 to the Company’s Current Report on Form 8-K filed on October 8, 2021. |
| 4.18 | | | | Incorporated herein by reference to Exhibit 4.3 to the Company’s Current Report on Form 8-K filed on October 8, 2021. |
| 4.19 | | | | Incorporated herein by reference to Exhibit 4.4 to the Company’s Current Report on Form 8-K filed on October 8, 2021. |
| 4.20 | | | | Incorporated herein by reference to Exhibit 4.1 to the Company’s Current Report on Form 8-K filed on June 1, 2022. |
| 4.21 | | | | Incorporated herein by reference to Exhibit 4.2 to the Company’s Current Report on Form 8-K filed on June 1, 2022. |
| 4.22 | | | | Incorporated herein by reference to Exhibit 4.3 to the Company’s Current Report on Form 8-K filed on June 1, 2022. |
| 4.23 | | | | Incorporated herein by reference to Exhibit 4.1 to the Company’s Current Report on Form 8-K filed on February 21, 2023. |
| 4.24 | | | | Incorporated herein by reference to Exhibit 4.2 to the Company’s Current Report on Form 8-K filed on February 21, 2023. |
| 4.25 | | | | Incorporated herein by reference to Exhibit 4.3 to the Company’s Current Report on Form 8-K filed on February 21, 2023. |
| 10.1 | | Termination Agreement, dated as of September 30, 2011,August 31, 2018, by and among High Plains Ranch II,NRG Yield, Inc., NRG Yield LLC, as borrower, the U.S. Department ofNRG Yield Operating LLC and NRG Energy, as guarantor, and the U.S. Department of Energy, as loan servicer.Inc. | | Incorporated herein by reference to Exhibit 10.810.9 to NRG Yield,Clearway Energy, Inc.'s Draft Registration Statement’s Current Report on Form S-18-K filed on February 13, 2013. |
| September 5, 2018. |
| 10.2.1 | | | | |
10.7 | | | | Incorporated herein by reference to Exhibit 10.11 to NRG Yield, Inc.'s Draft Registration Statement on Form S-1 filed on February 13, 2013. |
10.8 | | | | Incorporated herein by reference to Exhibit 10.12 to NRG Yield, Inc.'s Draft Registration Statement on Form S-1 filed on February 13, 2013. |
10.9 | | | | Incorporated herein by reference to Exhibit 10.13 to NRG Yield, Inc.'s Draft Registration Statement on Form S-1 filed on February 13, 2013. |
10.10 | | | | Incorporated herein by reference to Exhibit 10.14 to NRG Yield, Inc.'s Draft Registration Statement on Form S-1 filed on February 13, 2013. |
10.11 | | | | Incorporated herein by reference to Exhibit 10.15 to NRG Yield, Inc.'s Draft Registration Statement on Form S-1 filed on February 13, 2013. |
10.12 | | | | Incorporated herein by reference to Exhibit 10.16 to NRG Yield, Inc.'s Draft Registration Statement on Form S-1 filed on February 13, 2013. |
10.13 | | | | Incorporated herein by reference to Exhibit 10.15 to NRG Yield, Inc.'s Registration Statement on Form S-1 filed on June 6, 2013. |
10.14 | | | | Incorporated herein by reference to Exhibit 10.16 to NRG Yield, Inc.'s Registration Statement on Form S-1 filed on June 7, 2013. |
10.15 | | | | Incorporated herein by reference to Exhibit 10.17 to NRG Yield, Inc.'s Registration Statement on Form S-1 filed on June 7, 2013. |
10.16 | | | | Incorporated herein by reference to Exhibit 10.20 to NRG Yield, Inc.'s Registration Statement on Form S-1/A filed on June 21, 2013. |
10.17.1 | | Amended and Restated Credit Agreement, dated April 25, 2014, by and among NRG Yield Operating LLC, NRG Yield LLC, Royal Bank of Canada, as Administrative Agent, the lenders party thereto, Royal Bank of Canada, Goldman Sachs Bank USA and Bank of America, N.A., as L/C Issuers and RBC Capital Markets as Sole Left Lead Arranger and Sole Left Lead Book Runner. | | Incorporated by reference to Exhibit 10.1 to NRG Yield,Clearway Energy, Inc.'s’s Current Report on Form 8-K filed on April 28, 2014. |
10.17.210.2.2 | |
| | Incorporated herein by reference to Exhibit 10.9 to NRG Yield,Clearway Energy, Inc.'s’s Quarterly Report on Form 10-Q filed on August 4, 2015.
|
10.17.310.2.3 | |
| | Incorporated herein by reference to Exhibit 10.1 to the Company'sCompany’s Current Report on Form 8-K filed on February 12, 2018.
|
10.18.110.2.4 | | Third Amendment to Amended and Restated Credit Agreement and Administrative Agent Resignation and Appointment Agreement, dated as of August 23, 2011,April 30, 2018, by and among NRG West HoldingsYield Operating LLC, ING CapitalNRG Yield LLC, Unionthe guarantors party thereto, Royal Bank of Canada, as Resigning Administrative Agent, JPMorgan Chase Bank, N.A., Mizuho Corporate Bank, Ltd., RBS Securities Inc., Credit Agricole Corporateas Successor Administrative Agent, and Investment Bank, and each ofthe lenders and issuing banksparty thereto.* | | Incorporated herein by reference to Exhibit 10.210.1 to NRG Yield, Inc.'sthe Company’s Quarterly Report on Form 10-Q filed on August 7, 2014.May 3, 2018.
|
10.18.210.2.5 | | Fourth Amendment No. 1 to theAmended and Restated Credit Agreement, dated October 7, 2011,as of November 30, 2018, by and between NRG West Holdingsamong Clearway Energy Operating LLC, Clearway Energy LLC, the guarantors party thereto, JPMorgan Chase Bank, N.A., as administrative agent, and Credit Agricole Corporate and Investment Bank.the lenders party thereto. | | Incorporated herein by reference to Exhibit 10.310.1 to NRG Yield, Inc.'s Quarterlythe Company’s Current Report on Form 10-Q8-K filed on August 7, 2014.December 6, 2018.
|
10.18.310.2.6 | | Fifth Amendment No. 2 to theAmended and Restated Credit Agreement, dated February 29, 2012,as of December 20, 2019, by and between NRG West Holdingsamong Clearway Energy Operating LLC, Clearway Energy LLC, the guarantors party thereto, JPMorgan Chase Bank, N.A., as administrative agent, and Credit Agricole Corporate and Investment Bank.the lenders party thereto. | | Incorporated herein by reference to Exhibit 10.410.1 to NRG Yield, Inc.'s Quarterlythe Company’s Current Report on Form 10-Q8-K filed on August 7, 2014.December 23, 2019.
|
| | | | | | | | | | | | | | |
10.18.410.2.7 | | Sixth Amendment No. 3 to theAmended and Restated Credit Agreement, datedeffective as of January 27, 2014,November 30, 2021, by and between NRG West Holdingsamong Clearway Energy Operating LLC, Clearway Energy LLC, the guarantors party thereto, JPMorgan Chase Bank, N.A., as administrative agent, and Credit Agricole Corporate and Investment Bank.the lenders party thereto. | | Incorporated herein by reference to Exhibit 10.610.1 to NRG Yield, Inc.'s Quarterlythe Company’s Current Report on Form 10-Q8-K filed on August 4, 2015.December 1, 2021. |
10.18.510.2.8 | | Seventh Amendment No. 4 to theAmended and Restated Credit Agreement, and Amendment No. 1 to the Collateral Agreement, datedentered into as of May 16, 2014,August 15, 2022, by and between NRG West Holdingsamong Clearway Energy Operating LLC, El SegundoClearway Energy Center LLC, the guarantors party thereto, JPMorgan Chase Bank, N.A., as administrative agent, and Credit Agricole Corporate and Investment Bank.the lenders party thereto. | | Incorporated herein by reference to Exhibit 10.710.1 to NRG Yield, Inc.'s Quarterlythe Company’s Current Report on Form 10-Q8-K filed on August 4, 2015.
|
| 19, 2022. |
| 10.2.9 | | | | |
10.18.6 | | Eighth Amendment No. 5 to theAmended and Restated Credit Agreement, datedentered into as of May 29, 2015,March 15, 2023, by and between NRG West Holdingsamong Clearway Energy Operating LLC, Clearway Energy LLC, the guarantors party thereto, JPMorgan Chase Bank, N.A., as administrative agent, and ING Capital LLC.the lenders party thereto.
| | Incorporated herein by reference to Exhibit 10.810.1 to NRG Yield, Inc.'s Quarterlythe Company’s Current Report on Form 10-Q8-K filed on August 4, 2015.
March 20, 2023. |
10.19.110.3^ | | | | Incorporated herein by reference to Exhibit 10.5 to NRG Yield, Inc.'s Quarterly Report on Form 10-Q filed on August 7, 2014. |
10.19.2 | | | | Incorporated herein by reference to Exhibit 10.6 to NRG Yield, Inc.'s Quarterly Report on Form 10-Q filed on August 7, 2014. |
10.20^ | |
| | Incorporated herein by reference to Exhibit 10.1 to NRG Yield,Clearway Energy, Inc.'s’s Quarterly Report on Form 10-Q filed on August 4, 2015. |
10.21^10.4^ | |
| | Incorporated herein by reference to Exhibit 10.2 to NRG Yield,Clearway Energy, Inc.'s’s Quarterly Report on Form 10-Q filed on August 4, 2015. |
10.22^10.5^ | | | | Incorporated herein by reference to Exhibit 10.1 to NRG Yield,Clearway Energy, Inc.'s’s Quarterly Report on Form 10-Q filed on May 5, 2016.
|
10.23^10.6^ | | | | Incorporated herein by reference to Exhibit 10.2 to NRG Yield,Clearway Energy, Inc.'s’s Quarterly Report on Form 10-Q filed on May 5, 2016.
|
10.24^10.7^ | | | | Incorporated herein by reference to Exhibit 10.3 to NRG Yield,Clearway Energy, Inc.'s’s Quarterly Report on Form 10-Q filed on May 5, 2016. |
10.2510.8 | | | | Incorporated herein by reference to Exhibit 10.1 to NRG Yield,Clearway Energy, Inc.'s’s Quarterly Report on Form 10-Q, filed on August 9, 2016.
|
10.26†10.9 | | | | Incorporated herein by reference to Exhibit 10.30 to the Company’s Annual Report on Form 10-K filed on February 28, 2019. |
| 10.10 | | EmploymentAmended and Restated Exchange Agreement, dated as of May 6, 2016, between14, 2015, by and among NRG Energy, Inc., NRG Yield, Inc., and Christopher S. Sotos.NRG Yield LLC and, pursuant to a joinder thereto, dated as of August 31, 2018, Zephyr Renewables LLC.
| | Incorporated herein by reference to Exhibit 10.1 to NRG Yield,Clearway Energy, Inc.'s’s Current Report on Form 8-K/A,8-K filed on August 9, 2016.May 15, 2015. |
10.27†10.11*^ | |
| | Incorporated herein by reference to Exhibit 10.2810.1 to NRG Yield, Inc.'sthe Company’s Current Report on Form 8-K filed on April 20, 2020. |
| 10.12*^ | | | | Incorporated herein by reference to Exhibit 10.2 to the Company’s Current Report on Form 8-K filed on April 20, 2020. |
| 10.13*^ | | | | Incorporated herein by reference to Exhibit 10.3 to the Company’s Current Report on Form 8-K filed on April 20, 2020. |
| 10.14†* | | | | Incorporated herein by reference to Exhibit 10.1 to the Company’s Current Report on Form 8-K filed on December 22, 2020. |
| 10.15†* | | | | Incorporated herein by reference to Exhibit 10.2 to the Company’s Current Report on Form 8-K filed on December 22, 2020. |
| 10.16†* | | | | Incorporated herein by reference to Exhibit 10.3 to the Company’s Current Report on Form 8-K filed on December 22, 2020. |
| 10.17*^ | | | | Incorporated by reference to Exhibit 10.31 to the Company’s Annual Report on Form 10-K, filed on March 1, 2018.2021. |
| | | | | | | | | | | | | | |
10.28^10.18 | | | | Incorporated by reference to Exhibit 10.1 to the Company’s Current Report on Form 8-K, filed on August 23, 2021. |
| 10.19 | | | | Incorporated by reference to Exhibit 10.1 to the Company’s Current Report on Form 8-K, filed on September 23, 2021. |
| 10.20 | | | | Incorporated by reference to Exhibit 10.1 to the Company’s Current Report on Form 8-K, filed on October 26, 2021. |
| 10.21 | | Senior Secured Bridge Credit Agreement, dated as of November 30, 2021, by and among NRGClearway Energy Inc., NRG Repowering Holdings LLC, NRG Yield, Inc., and GIP III Zephyr Acquisition Partners, L.P., and NRG Yield Operating LLC, (solely with respectClearway Energy LLC, the guarantors party thereto, Bank of America, N.A., as administrative agent, and the lenders party thereto. | | Incorporated by reference to Sections E.5, E.6Exhibit 10.2 to the Company’s Current Report on Form 8-K, filed on December 1, 2021. |
| 10.22*^ | |
| | Incorporated herein by reference to Exhibit 10.3410.1 to NRG Yield,the Company’s Current Report on Form 8-K filed on January 18, 2022. |
| 10.23*^ | | | | Incorporated herein by reference to Exhibit 10.2 to the Company’s Current Report on Form 8-K filed on January 18, 2022. |
| 10.24† | | | | Incorporated herein by reference to Exhibit 10.5 to the Company’s Quarterly Report on Form 10-Q filed on May 5, 2022. |
| 10.25† | | | | Incorporated herein by reference to Exhibit 10.6 to the Company’s Quarterly Report on Form 10-Q filed on May 5, 2022. |
| 10.26† | | | | Incorporated herein by reference to Exhibit 10.7 to the Company’s Quarterly Report on Form 10-Q filed on May 5, 2022. |
| 10.27*^ | | | | Incorporated herein by reference to Exhibit 10.1 to the Company’s Current Report on Form 8-K filed on December 29, 2022. |
| 10.28 | | | | Incorporated herein by reference to Exhibit 10.39 to the Company’s Annual Report on Form 10-K, filed on March 1, 2018.
February 23, 2023. |
12.110.29 | | | | Filed herewith.Incorporated by reference to Exhibit 10.40 to the Company’s Annual Report on Form 10-K, filed on February 23, 2023. |
21.110.30*^ | | | | Incorporated herein by reference to Exhibit 10.1 to the Company’s Current Report on Form 8-K filed on May 24, 2023. |
| 10.31† | | | | Filed herewith. |
| 10.32† | | | | Filed herewith. |
| 21.1 | | | | Filed herewith. |
31.124.1 | | | | Included on the signature page of this Annual Report on Form 10-K. |
| 31.1 | | | | Filed herewith. |
| 31.2 | | | | Filed herewith. |
31.332 | | | | Filed herewith. |
32 | | | | Furnished herewith. |
| 97 | | | | Filed herewith. |
| 101 INS | | Inline XBRL Instance Document. | | Filed herewith. |
| 101 SCH | | Inline XBRL Taxonomy Extension Schema. | | Filed herewith. |
| 101 CAL | | Inline XBRL Taxonomy Extension Calculation Linkbase. | | Filed herewith. |
| 101 DEF | | Inline XBRL Taxonomy Extension Definition Linkbase. | | Filed herewith. |
| 101 LAB | | Inline XBRL Taxonomy Extension Label Linkbase. | | Filed herewith. |
| 101 PRE | | Inline XBRL Taxonomy Extension Presentation Linkbase. | | Filed herewith. |
| | | | | | | | | | | | | | |
| 104 | | Cover Page Interactive Data File (the cover page interactive data file does not appear in Exhibit 104 because its Inline XBRL tags are embedded within the Inline XBRL document) | | |
| | | | | | | | |
| † | | Indicates exhibits that constitute compensatory plans or arrangements. |
| * | | This filing excludes schedules pursuant to Item 601(b)(2)601(a)(5) of Regulation S-K, which the registrant agrees to furnish supplementary to the Securities and Exchange Commission upon request by the Commission. |
| ^ | | Portions ofInformation in this exhibit haveidentified by the mark “[***]” is confidential and has been redacted and are subject to a confidential treatment request filed with the Secretary of the Securities and Exchange Commissionexcluded pursuant to Rule 24b-2 underItem 601(b)(10)(iv) of Regulation S-K because it (i) is not material and (ii) would likely cause competitive harm to the Securities Exchange Act of 1934, as amended.
Registrant if disclosed.
|
Item 16 — Form 10-K Summary
None.
SIGNATURES
Pursuant to the requirements of Section 13 or 15 (d) of the Securities Exchange Act of 1934, the registrant has duly caused this report to be signed on its behalf by the undersigned thereunto duly authorized.
| | | | | | | | | | | | | | |
| CLEARWAY ENERGY LLC
(Registrant) | |
| | | | |
| NRG YIELD LLC
(Registrant)
| |
| | |
| /s/ CHRISTOPHER S. SOTOS | |
| Christopher S. Sotos | |
| Chief Executive Officer (Principal Executive Officer) | |
|
Date: March 1, 2018February 22, 2024 | | |
|
POWER OF ATTORNEY
Each person whose signature appears below constitutes and appoints David R. HillChristopher S. Sotos, Kevin P. Malcarney and Brian E. Curci,Amelia McKeithen, each or any of them, such person'sperson’s true and lawful attorney-in-fact and agent with full power of substitution and resubstitution for such person and in such person'sperson’s name, place and stead, in any and all capacities, to sign any and all amendments to this report on Form 10-K, and to file the same with all exhibits thereto, and other documents in connection therewith, with the Securities and Exchange Commission, granting unto said attorneys-in-fact and agents, and each of them, full power and authority to do and perform each and every act and thing necessary or desirable to be done in and about the premises, as fully to all intents and purposes as such person, hereby ratifying and confirming all that said attorneys-in-fact and agents, or any of them or his or their substitute or substitutes, may lawfully do or cause to be done by virtue hereof.
In accordance with Pursuant to the requirements of the Securities Exchange Act of 1934, this report has been signed below by the following persons on behalf of the registrant and in the capacities indicatedand on March 1, 2018.
| | | | | | | | | | | | | | |
| Signatures | | Title | | | |
| Signatures | | Title | |
| /s/ CHRISTOPHER S. SOTOS | | President and Chief Executive Officer | |
| Christopher S. Sotos | | of NRG YieldClearway Energy LLC (Principal Executive Officer) | |
| Date: | March 1, 2018February 22, 2024 | | | |
| | | | |
| | | | |
| | | | |
| | | | |
| | | | |
| /s/ CHAD PLOTKINSARAH RUBENSTEIN | | SeniorExecutive Vice President and Chief Financial Officer | |
| Sarah Rubenstein | | Chad Plotkin | of NRG YieldClearway Energy LLC (Principal Financial Officer)and | |
| Date: | March 1, 2018February 22, 2024 | | Principal Accounting Officer) | | |
| | | | |
| CLEARWAY ENERGY, INC. | | /s/ DAVID CALLEN | Senior Vice President and Chief Accounting Officer | |
| David Callen | | of NRG Yield LLC (Principal Accounting Officer) | |
Date: | March 1, 2018 | | | |
| | | | |
NRG YIELD, INC. | | Sole Managing Member | |
| | | | |
| /s/ CHRISTOPHER S. SOTOS | | President and Chief Executive Officer | |
| Christopher S. Sotos | | of Clearway Energy, Inc. | | of NRG Yield, Inc. |
| Date: | March 1, 2018February 22, 2024 | | | |
| | | | | | | | | | | | | | |
| Signature | | Title | | Date |
| | | | |
| /s/ NATHANIEL ANSCHUETZ | | Director of Clearway Energy, Inc. | | | February 22, 2024 |
SignatureNathaniel Anschuetz | | Title | | Date |
| | | | |
/s/ KIRKLAND B. ANDREWS | | Director of NRG Yield, Inc. | | March 1, 2018 |
Kirkland B. Andrews | | Sole Managing Member of NRG YieldClearway Energy LLC | |
| | | | |
| /s/ JONATHAN BRAM | | Director of Clearway Energy, Inc. | | February 22, 2024 |
| Jonathan Bram | | | | |
/s/ JOHN CHILLEMI | | Director of NRG Yield, Inc. | | March 1, 2018 |
John Chillemi | | Sole Managing Member of NRG YieldClearway Energy LLC | |
| | | | |
| /s/ BRIAN FORD | | Director of Clearway Energy, Inc. | | February 22, 2024 |
| Brian Ford | | | | |
/s/ JOHN CHLEBOWSKI | | Director of NRG Yield, Inc. | | March 1, 2018 |
John Chlebowski | | Sole Managing Member of NRG YieldClearway Energy LLC | |
| | | | |
| /s/ BRUCE MACLENNAN | | Director of Clearway Energy, Inc. | | February 22, 2024 |
| Bruce MacLennan | | | | |
/s/ BRIAN FORD | | Director of NRG Yield, Inc. | | March 1, 2018 |
Brian Ford | | Sole Managing Member of NRG YieldClearway Energy LLC | |
| | | | |
| /s/ DANIEL B. MORE | | Director of Clearway Energy, Inc. | | February 22, 2024 |
| Daniel B. More | | | | |
/s/ MAURICIO GUTIERREZ | | Director of NRG Yield, Inc. | | March 1, 2018 |
Mauricio Gutierrez | | Sole Managing Member of NRG YieldClearway Energy LLC | |
| | | | |
| /s/ E. STANLEY O’NEAL | | Director of Clearway Energy, Inc. | | February 22, 2024 |
| E. Stanley O’Neal | | | | |
/s/ FERRELL MCCLEAN | | Director of NRG Yield, Inc. | | March 1, 2018 |
Ferrell McClean | | Sole Managing Member of NRG YieldClearway Energy LLC | |
| | | | |
| /s/ GUILLAUME HÉDIARD | | Director of Clearway Energy, Inc. | | February 22, 2024 |
| Guillaume Hédiard | | Sole Managing Member of Clearway Energy LLC | |
| | | | |
| /s/ VINCENT STOQUART | | Director of Clearway Energy, Inc. | | February 22, 2024 |
| Vincent Stoquart | | Sole Managing Member of Clearway Energy LLC | |
| | | | |
| /s/ EMMANUEL BARROIS | | Director of Clearway Energy, Inc. | | February 22, 2024 |
| Emmanuel Barrois | | Sole Managing Member of Clearway Energy LLC | |
| | | | |
| /s/ CHRISTOPHER S. SOTOS | | Director of NRG Yield,Clearway Energy, Inc. | | March 1, 2018February 22, 2024 |
| Christopher S. Sotos | | Sole Managing Member of NRG YieldClearway Energy LLC | |
| | | | |
| /s/ JENNIFER LOWRY | | Director of Clearway Energy, Inc. | | February 22, 2024 |
| Jennifer Lowry | | Sole Managing Member of Clearway Energy LLC | |
| | | | |
| | | | |
| | | |
Supplemental Information to be Furnished with Reports Filed Pursuant to
Section 15(d) of the Act by Registrants Which Have Not Registered
Securities Pursuant to Section 12 of the Act
No annual report or proxy materials has been sent to securities holders and no such report or proxy material is to be furnished to securities holders subsequent to the filing of the annual report on this Form 10-K.