UNITED STATES SECURITIES AND EXCHANGE COMMISSION
Washington, D.C. 20549
Form 10-K
|
| | | |
x☒ | | ANNUAL REPORT PURSUANT TO SECTION 13 OR 15(d) OF THE SECURITIES EXCHANGE ACT OF 1934
|
| | For the Fiscal Year ended | December 31, 2018.2019 |
| | | | |
o☐ | | TRANSITION REPORT PURSUANT TO SECTION 13 OR 15(d) OF THE SECURITIES EXCHANGE ACT OF 1934 For the Transition period from to . |
Commission File Number: 333-203369
Clearway Energy LLC
(Exact name of registrant as specified in its charter)
|
| | | |
| Delaware | | Delaware32-0407370
|
(State or other jurisdiction of incorporation or organization)
| | 32-0407370
(I.R.S. Employer Identification No.)
|
| | |
300 Carnegie Center, Suite 300 | Princeton | New Jersey | 08540 |
| (Address of principal executive offices) | | 08540
(Zip Code) |
(609) (609) 608-1525
(Registrant’s telephone number, including area code)
Securities registered pursuant to Section 12(b) of the Act:
None
Securities registered pursuant to Section 12(g) of the Act:
None
Indicate by check mark if the registrant is a well-known seasoned issuer, as defined in Rule 405 of the Securities Act. Yeso No x
Indicate by check mark if the registrant is not required to file reports pursuant to Section 13 or Section 15(d) of the Exchange Act. Yes oNox No o
Indicate by check mark whether the registrant (1) has filed all reports to be filed by Section 13 or 15(d) of the Securities Exchange Act of 1934 during the preceding 12 months (or for such shorter period that the registrant was required to file such reports), and (2) has been subject to such filing requirements for the past 90 days. (Note: The registrant is a voluntary filer and not subject to the filing requirements of Section 13 or 15(d) of the Securities Exchange Act of 1934. Although not subject to these filing requirements, the registrant has filed all reports that would have been required to be filed by Section 13 or 15(d) of the Securities Exchange Act of 1934 during the preceding 12 months had the registrant been subject to such requirements.) Yeso No o
Indicate by check mark whether the registrant has submitted electronically every Interactive Data File required to be submitted pursuant to Rule 405 of Regulation S-T (§232.405 of this chapter) during the preceding 12 months (or for such shorter period that the registrant was required to submit such files). Yesx No o
Indicate by check mark if disclosure of delinquent filers pursuant to Item 405 of Regulation S-K (§ 229.405 of this chapter) is not contained herein, and will not be contained, to the best of the registrant's knowledge, in definitive proxy or information statements incorporated by reference in Part III of this Form 10-K or any amendment to this Form 10-K. x
Indicate by check mark whether the registrant is a large accelerated filer, an accelerated filer, a non-accelerated filer, a smaller reporting company, or emerging growth company. See the definitions of "large accelerated filer," "accelerated filer," "smaller reporting company," and "emerging growth company" in Rule 12b-2 of the Exchange Act.
|
| | | | | | | |
Large accelerated filero | ☐ | Accelerated filer | ☐ |
| Non-accelerated filer | ☒ | Smaller reporting company | ☐ |
| | Accelerated filer o
| | Non-accelerated filer x
| | Smaller reporting company o
| Emerging growth companyo | ☐ |
If an emerging growth company, indicate by check mark if the registrant has elected not to use the extended transition period for complying with any new or revised financial accounting standards provided pursuant to Section 13(a) of the Exchange Act. o
Indicate by check mark whether the registrant is a shell company (as defined in Rule 12b-2 of the Act). Yes o☐ No x
Clearway Energy LLC's outstanding equity interests are held by Clearway Energy, Inc. and Clearway Energy Group LLC and there are no equity interests held by non-affiliates.
Indicate the number of shares outstanding of each of the registrant's classes of common stock as of the latest practicable date. There is no0 public market for the registrant's outstanding units.
|
| | |
| Class | | Outstanding at January 31, 20192020 |
| Class A Units | | 34,599,645 |
| Class B Units | | 42,738,750 |
| Class C Units | | 73,323,46378,849,651 |
| Class D Units | | 42,738,750 |
Documents Incorporated by Reference:
None.
NOTE: WHEREAS CLEARWAY ENERGY LLC MEETS THE CONDITIONS SET FORTH IN GENERAL INSTRUCTION I(1)(a) AND (b) OF FORM 10-K, THIS FORM 10-K IS BEING FILED WITH THE REDUCED DISCLOSURE FORMAT PURSUANT TO GENERAL INSTRUCTION I(2).
TABLE OF CONTENTS
Index
|
| |
| GLOSSARY OF TERMS | |
| PART I | |
| Item 1 — Business | |
| Item 1A — Risk Factors | |
| Item 1B — Unresolved Staff Comments | |
| Item 2 — Properties | |
| Item 3 — Legal Proceedings | |
| Item 4 — Mine Safety Disclosures | |
| PART II | |
| Item 5 — Market for Registrant's Common Equity, Related Stockholder Matters and Issuer Purchases of Equity Securities | |
| Item 6 — Selected Financial Data | |
| Item 7 — Management's Discussion and Analysis of Financial Condition and Results of Operations | |
| Item 7A — Quantitative and Qualitative Disclosures About Market Risk | |
| Item 8 — Financial Statements and Supplementary Data | |
| Item 9 — Changes in Disagreements With Accountants on Accounting and Financial Disclosure | |
| Item 9A — Controls and Procedures | |
| Item 9B — Other Information | |
| PART III | |
| Item 10 — Directors, Executive Officers and Corporate Governance | |
| Item 11 — Executive Compensation | |
| Item 12 — Security Ownership of Certain Beneficial Owners and Management and Related Stockholder Matters | |
| Item 13 — Certain Relationships and Related Transactions, and Director Independence | |
| Item 14 — Principal Accounting Fees and Services | |
| PART IV | |
| Item 15 — Exhibits, Financial Statement Schedules | |
| EXHIBIT INDEX | |
| Item 16 — Form 10-K Summary | |
GLOSSARY OF TERMS
When the following terms and abbreviations appear in the text of this report, they have the meanings indicated below:
|
| | |
| 2019 Convertible Notes | | Clearway, Energy, Inc.'s $345$220 million aggregate principal amount of 3.50% Convertible Notes due 2019 |
| 2020 Convertible Notes | | Clearway, Energy, Inc.'s $287.5$45 million aggregate principal amount of 3.25% Convertible Notes due 2020 |
| 2024 Senior Notes | | $500 million aggregate principal amount of 5.375% unsecured senior notes due 2024, issued by Clearway Energy Operating LLC |
| 2025 Senior Notes | | $600 million aggregate principal amount of 5.750% unsecured senior notes due 2025, issued by Clearway Energy Operating LLC |
| 2026 Senior Notes | | $350 million aggregate principal amount of 5.00% unsecured senior notes due 2026, issued by Clearway Energy Operating LLC |
| 2028 Senior Notes | | $600 million aggregate principal amount of 4.75% unsecured senior notes due 2028, issued by Clearway Energy Operating LLC |
| Adjusted EBITDA | | RepresentsA non-GAAP measure, represents EBITDA adjusted for mark-to-market gains or losses, asset write offs and impairments; and factors which the Company does not consider indicative of future operating performance |
Alta Wind PortfolioAOCI | | Seven wind facilities that total 947 MW located in Tehachapi, California and a portfolio of associated land leases |
AOCL | | Accumulated Other Comprehensive LossIncome
|
| ARO | | Asset Retirement Obligation |
| ARRA | | American Recovery and Reinvestment Act of 2009 |
| ASC | | The FASB Accounting Standards Codification, which the FASB established as the source of authoritative GAAP |
| ASU | | Accounting Standards Updates – updates to the ASC |
| ATM Program | | At-The-Market Equity Offering Program |
| August 2017 Drop Down Assets | | The remaining 25% interest in Wind TE Holdco |
| Bankruptcy Code | | Chapter 11 of Title 11 of the United States Code |
| Bankruptcy Court | | U.S. Bankruptcy Court for the Northern District of California |
Bridge Credit Agreement | | 364-Day Bridge Credit Agreement, entered into by and between Clearway Operating LLC, as borrower, and Clearway Energy LLC, as guarantor, on August 31, 2018 |
| Buckthorn Solar Drop Down Asset | | Buckthorn Renewables, LLC, which owns 100% of Buckthorn Solar Portfolio, LLC, which was acquired by Clearway Energy Operating LLC from NRG on March 30, 2018 |
| CAA | | Clean Air Act |
| CAFD | | A non-GAAP measure, Cash Available for Distribution (CAFD) is Adjusted EBITDA plus cash distributions/return of investment from unconsolidated affiliates, adjustments to reflect CAFD generated by unconsolidated investments that are not able to distribute project dividends due to the PG&E Bankruptcy, cash receipts from notes receivable, cash distributions from noncontrolling interests, less cash distributions to noncontrolling interests, maintenance capital expenditures, pro-rata Adjusted EBITDA from unconsolidated affiliates, cash interest paid, income taxes paid, principal amortization of indebtedness, Walnut Creek investment payments, and changes in prepaid and accrued capacity payments, and adjusted for development expenses |
| Carlsbad Drop Down | | The acquisition by the Company of the Carlsbad Energy Center, a 527 MW natural gas fired project located in Carlsbad, CA |
CDFW | | California Department of Fish and Wildlife
|
| CEG | | Clearway Energy Group LLC (formerly Zephyr Renewables LLC) |
| CEG Master Services Agreement | | Master Services Agreements, entered into as of August 31, 2018, between the Company, Clearway Energy LLC, Clearway Energy Operating LLC, and CEG |
| CEG ROFO Agreement | | Right of First Offer Agreement, entered into as of August 31, 2018, by and amongbetween Clearway Energy Group LLC and Clearway Energy, Inc., and solely for purposes of Section 2.4, GIP III Zephyr Acquisition Partners, L.P., as amended by the First Amendment dated February 14, 2019, the Second Amendment dated August 1, 2019 and the Third Amendment dated December 6, 2019 |
CfDClearway, Inc. | | Contract for DifferencesClearway Energy, Inc., the holder of the Company's Class A and Class C units |
| Clearway Energy Group LLC | | The holder of the Company's Class B and Class D common shares and Clearway Energy LLC's Class B and Class D units |
|
| | |
| Clearway Energy Operating LLC | | Formerly NRG Yield Operating LLC, theThe holder of the project assets that are owned by Clearway Energy LLC |
| COD | | Commercial Operation Date |
|
| Code | | Internal Revenue Code of 1986, as amended |
| Company | | Clearway Energy LLC, together with its consolidated subsidiaries |
| CPUC | | California Public Utilities Commission |
| CVSR | | California Valley Solar Ranch |
CVSR Drop Down | | The Company's acquisition from NRG of the remaining 51.05% interest of CVSR Holdco |
| CVSR Holdco | | CVSR Holdco LLC, the indirect owner of CVSR |
DGCL | | Delaware General Corporation Law |
| DGPV Holdco 1 | | DGPV Holdco 1 LLC |
| DGPV Holdco 2 | | DGPV Holdco 2 LLC |
| DGPV Holdco 3 | | DGPV Holdco 3 LLC |
Distributed Solar
| | Solar power projects, typically less than 20 MW in size, that primarily sell power produced to customers for usage on site, or are interconnected to sell power into the local distribution grid |
| Drop Down Assets | | Collectively, assets under common control acquired by the Company from NRG from January 1, 2014 through the period ended AugustDecember 31, 20182019 |
| Economic Gross Margin | | EnergyA non-GAAP measure, energy and capacity revenue, less cost of fuelsfuels. See Item 7 — Management's Discussion and Analysis of Financial Condition and Results of Operations — Management's discussion of the results of operations for the years ended December 31, 2019 and 2018 for a discussion of this measure.
|
| ECP | | Energy Center Pittsburgh LLC, a subsidiary of the Company |
EGU | | Electric Utility Generating Unit |
| EPA | | United States Environmental Protection Agency |
| EPC | | Engineering, Procurement and Construction |
ERCOT
| | Electric Reliability Council of Texas, the ISO and the regional reliability coordinator of the various electricity systems within Texas |
| EWG | | Exempt Wholesale Generator |
| Exchange Act | | The Securities Exchange Act of 1934, as amended |
| FASB | | Financial Accounting Standards Board |
| FERC | | Federal Energy Regulatory Commission |
| FPA | | Federal Power Act |
| GAAP | | Accounting principles generally accepted in the U.S. |
| GenConn | | GenConn Energy LLC |
| GHG | | Greenhouse gas |
| GIM | | Global Infrastructure Management, LLC |
| GIP | | Collectively, Global Infrastructure Partners III-C Intermediate AIV 3, L.P., Global Infrastructure Partners III-A/B AIV 3, L.P., Global Infrastructure Partners III-C Intermediate AIV 2, L.P., Global Infrastructure Partners III-C2 Intermediate AIV, L.P. and GIP III Zephyr Friends & Family, LLC.
|
| GIP Transaction | | On August 31, 2018, NRG transferred its full ownership interest in the Company to Clearway Energy Group LLC and subsequently sold 100% of its interests in Clearway Energy Group LLC, which includes NRG's renewable energy development and operations platform, to an affiliate of GIP. GIP, NRG and the Company also entered into a consent and indemnity agreement in connection with the purchase and sale agreement, which was signed on February 6, 2018 |
| HLBV | | Hypothetical Liquidation at Book Value |
| IRS | | Internal Revenue Service |
| ISO | | Independent System Operator, also referred to as an RTO |
| ITC | | Investment Tax Credit |
KPPHkWh | | 1,000 Pounds PerKilowatt Hour |
| LIBOR | | London Inter-Bank Offered Rate |
|
| | |
| March 2017 Drop Down Assets | | (i) Agua Caliente Borrower 2 LLC, which owns a 16% interest (approximately 31% of NRG's 51% interest) in the Agua Caliente solar farm and (ii) NRG's 100% ownership in the Class A equity interests in the Utah Solar Portfolio (defined below), both acquired by Clearway Energy Operating LLC on March 27, 2017 |
| MBTA | | Migratory Bird Treaty Act |
| MMBtu | | Million British Thermal Units |
|
| | |
| MW | | Megawatt |
| MWh | | Saleable megawatt hours, net of internal/parasitic load megawatt-hours |
| MWt | | Megawatts Thermal Equivalent |
| NERC | | North American Electric Reliability Corporation |
| Net Exposure | | Counterparty credit exposure to Clearway Energy LLC, net of collateral |
November 2015 Drop Down AssetsNOLs | | 75% of the Class B interests of Wind TE Holdco, which owns a portfolio of 12 wind facilities totaling 814 net MW, which was acquired by Clearway EnergyNet Operating LLC from NRG on November 3, 2015 |
November 2017 Drop Down Assets | | 38 MW portfolio of distributed and small utility-scale solar assets, primarily comprised of assets from NRG's Solar Power Partners (SPP) funds, in addition to other projects developed since the acquisition of SPP by NRG, which was acquired by Clearway Energy Operating LLC from NRG on November 1, 2017Losses |
NOx | | Nitrogen Oxides |
| NPNS | | Normal Purchases and Normal Sales |
| NRG | | NRG Energy, Inc. |
| NRG Power Marketing | | NRG Power Marketing LLC |
NRG ROFO Agreement | | Third Amended and Restated Right of First Offer Agreement, entered into as of August 31, 2018, by and between NRG and the Company |
| NRG TSA | | Transition Services Agreement entered into as of August 31, 2018 by and between NRG and the Company |
| OECD | | The Organization for Economic Co-operation and Development |
| OCI/OCL | | Other comprehensive income/loss |
| O&M | | Operations and Maintenance |
| PG&E | | Pacific Gas and Electric Company |
| PG&E Bankruptcy | | On January 29, 2019, PG&E Corporation and Pacific Gas and Electric Company filed voluntary petitions for relief under the Bankruptcy Code in the U.S. Bankruptcy Court for the Northern District of California |
| PJM | | PJM Interconnection, LLC |
| PPA | | Power Purchase Agreement |
| PTC | | Production Tax Credit |
| PUCT | | Public Utility Commission of Texas |
| PUHCA | | Public Utility Holding Company Act of 2005 |
| PURPA | | Public Utility Regulatory Policies Act of 1978 |
| QF | | Qualifying Facility under PURPA |
RECRENOM | | Clearway Renewable Energy CertificateOperation & Maintenance LLC
|
| ROFO | | Right of First Offer |
| RPS | | Renewable Portfolio Standards |
| RPV Holdco | | RPV Holdco 1 LLC |
| RTO | | Regional Transmission Organization |
| SCE | | Southern California Edison |
| SEC | | U.S. Securities and Exchange Commission |
| Senior Notes | | Collectively, the 2024 Senior Notes, the 2025 Senior Notes, the 2026 Senior Notes and the 20262028 Senior Notes |
SO2 | | Sulfur Dioxide |
| SPP | | Solar Power Partners |
| Tax Act | | Tax Cuts and Jobs Act of 2017 |
Termination Agreement | | Termination Agreement entered into as of August 31, 2018 by and between NRG Energy, Inc. and the Company to terminate the Management Services Agreement between the parties |
| Thermal Business | | The Company's thermal business, which consists of thermal infrastructure assets that provide steam, hot water and/or chilled water, and in some instances electricity, to commercial businesses, universities, hospitals and governmental units |
|
| | |
| UPMC Thermal Project | | The University of Pittsburgh Medical Center Thermal Project, a 73 MWt district energy system that allows ECP to provide steam, chilled water and 7.5 MW of emergency backup power service to UPMC. |
|
| | |
| U.S. | | United States of America |
| U.S. DOE | | U.S. Department of Energy |
| Utah Solar Portfolio | | Collection consists of Four Brothers Solar, LLC, Granite Mountain Holdings, LLC, and Iron Springs Holdings, LLC, which are equity investments owned by Four Brothers Holdings, LLC, Granite Mountain Renewables, LLC, and Iron Springs Renewables, LLC, respectively, and are part of the March 2017 Drop Down Assets acquisition that closed on March 27, 2017 |
Utility Scale Solar
| | Solar power projects, typically 20 MW or greater in size (on an alternating current, or AC, basis), that are interconnected into the transmission or distribution grid to sell power at a wholesale level |
| VaR | | Value at Risk |
| VIE | | Variable Interest Entity |
| Wind TE Holdco | | Wind TE Holdco LLC, an 814 net MW portfolio of twelve wind projects |
PART I
Item 1 — Business
General
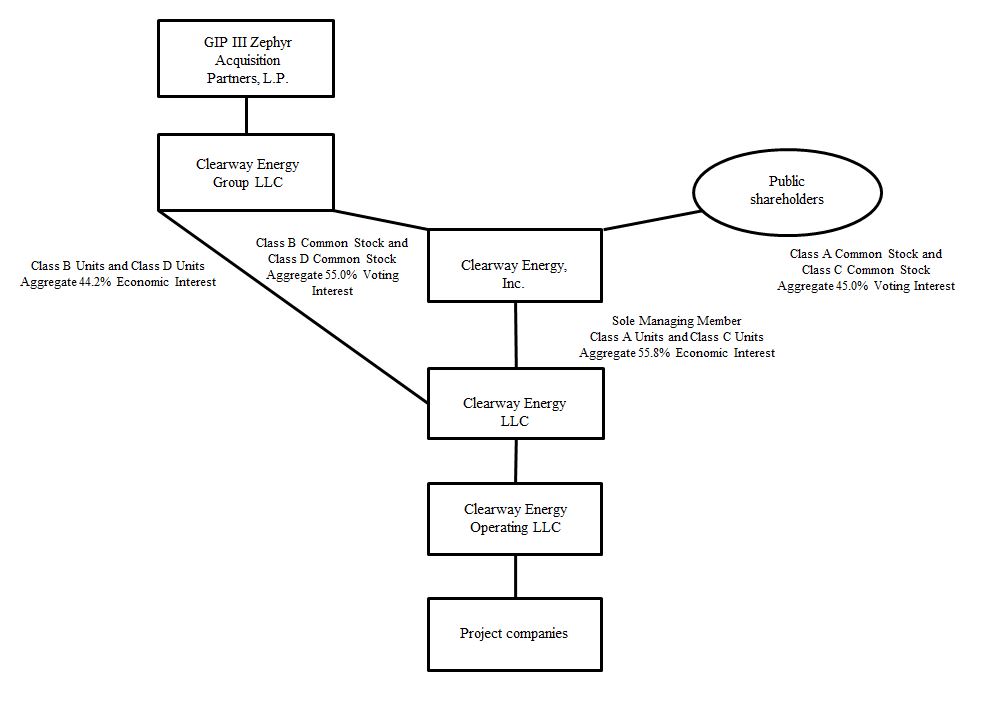
Clearway Energy LLC, (formerly NRG Yield LLC), together with its consolidated subsidiaries, or the Company, is an energy infrastructure investor in and owner of modern, sustainable and long-term contracted assets across North America. On AugustAs of December 31, 2018, NRG2019, GIP indirectly owns approximately 43% of the economic interests in the Company and approximately 55% of the voting interests in Clearway Energy, Inc., or NRG, transferred its full ownership interest in the Company to Clearway, Energy Group LLC, or CEG, which is also the holder of NRG 's renewable energy development and operations platform, and NRG subsequently sold 100% of its interest in CEG to an affiliate of GIP, such transaction referred to hereinafter as the GIP Transaction. As a result of the GIP Transaction, GIP indirectly acquired a 45.2% economic interest in Clearway Energy LLC (formerly NRG Yield LLC) and a 55.0% voting interest in the Company. Global Infrastructure Management, LLCInc. GIM is an independent fund manager of funds that invests in infrastructure assets in the energy, transport and transport sectors and Global Infrastructure Partners III is its third equity fund.water/waste sectors. The Company is sponsored by GIP through GIP'sits portfolio company, CEG.
The Company’s environmentally sound asset portfolio includes over 5,2725,875 MW of wind, solar and natural gas-fired power generation facilities, as well as district energy systems. Through this diversified and contracted portfolio, the Company endeavors to increase distributions to Clearway, Inc. The weighted average remaining contract duration of these offtake agreements, based on CAFD, was approximately 1513 years as of December 31, 2018.2019. The Company also owns thermal infrastructure assets with an aggregate steam and chilled water capacity of 1,3851,530 net MWt and electric generation capacity of 133139 net MW. These thermal infrastructure assets provide steam, hot and/or chilled water, and, in some instances, electricity to commercial businesses, universities, hospitals and governmental units in multiple locations, principally through long-term contracts or pursuant to rates regulated by state utility commissions.
A complete listing of the Company's interests in facilities, operations and/or projects owned or leased as of December 31, 20182019 can be found in Item 2 — Properties.
Pacific Gas and Electric Company Bankruptcy
On January 29, 2019, Pacific Gas and Electric Company, or PG&E filed for reorganization under Chapter 11 of the U.S. Bankruptcy Code in the U.S. Bankruptcy Court for the Northern District of California, or the Bankruptcy Court. Certain subsidiaries of the Company, which hold interests in 6 solar facilities totaling 480 MW and Marsh Landing with capacity of 720 MW, sell the output of their facilities to PG&E under long-term power purchase agreements, or PPAs. The Company consolidates three of the solar facilities and Marsh Landing and records its interest in the other solar facilities as equity method investments. As of December 31, 2018,2019, the Company had $1.5$177 million in restricted cash, $1.4 billion of property, plant and equipment, net, $352$370 million investments in unconsolidated affiliates and $1.4$1.2 billion of long - term debtborrowings with final maturity dates ranging from 2023 to 2038 related to these facilities. The related subsidiaries of the Company have entered intoare parties to financing agreements consisting of non-recourse project levelproject-level debt and, in certain cases, non-recourse holding company debt. The PG&E Bankruptcy filing has triggered defaults under the PPAs with PG&E and such related project-level financing agreements. TheAs a result, the Company recorded $1.2 billion of principal, net of the related unamortized debt issuance costs, as short-term debt as of December 31, 2019.
On September 9, 2019, PG&E filed a Chapter 11 plan of reorganization, or the PG&E Plan, which would provide for PG&E to assume all of its PPAs with the Company. On October 17, 2019, an ad hoc group of senior noteholders filed a competing plan of reorganization, which would also provide for PG&E to assume all of its PPAs with the Company.
On January 22, 2020, PG&E announced it had reached an agreement with a group of senior noteholders, and on January 31, 2020, the PG&E Plan was amended to provide for the eventual implementation of such settlement. On February 4, 2020, the Bankruptcy Court approved such settlement, and the noteholders have accordingly agreed to support the PG&E Plan. On February 5, 2020, the noteholders caused the ad hoc noteholder plan to be withdrawn. There are many conditions that must be satisfied before the PG&E Plan and assumption of the PPAs can become effective, including but not limited to approvals by various classes of creditors, the Bankruptcy Court, and the CPUC. A hearing before the Bankruptcy Court to consider whether the PG&E Plan will be approved and confirmed is currently negotiatingexpected to occur on May 27, 2020.
As of March 2, 2020, the Company's contracts with PG&E have operated in the normal course and the Company currently expects these contracts to continue as such. As of March 2, 2020, the Company has entered into forbearance agreements withfor certain project-level financing arrangements and continues to seek forbearance agreements for its other project-level financing arrangements affected by the lenders for each respective financing arrangement.PG&E Bankruptcy. The Company continues to assess the potential future impacts of the PG&E Bankruptcy as events occur, however, no impact to the Company’s immediate operating activities has occurred as of December 31, 2018. occur.
History
The Company was formed by NRG as a Delaware limited liability company on March 5, 2013. On August 31, 2018, NRG transferred its full ownership interest in Clearway, Inc. and its subsidiaries to CEG, the holder of NRG's renewable energy development and operations platform, and subsequently sold 100% of its interest in CEG to GIP, referred to hereinafter as the GIP Transaction.
Clearway, Inc. sold a total of 5,405,405 shares of Class C common stock for gross proceeds of $101 million on December 2, 2019 and incurred commission fees of $1.3 million. Clearway, Inc. utilized the proceeds of the offering to acquire additional 5,405,405 Class C units of the Company. The Company is a holding company for the companies that directly and indirectly own and operate Clearway, Inc.'s business. As of December 31, 2018,2019, GIP, through CEG, controls Clearway, Inc., and Clearway, Inc. in turn, as the sole managing member of the Company, controls the Company and its subsidiaries.
As of December 31, 2018,2019, GIP, through CEG, owned 42,738,750 of each of the Company's Class B units and Class D units and Clearway, Inc. owned 34,586,25034,599,645 of the Company's Class A units and 73,187,64678,742,854 of the Company's Class C units. Clearway, Inc., through its holdings of Class A units and Class C units, has a 55.8%57.01% economic interest in the Company. Clearway, Inc. consolidates the results of the Company through its controlling interest as sole managing member. GIP, through CEG's holdings of Class B units and Class D units, has a 44.2%42.99% economic interest in the Company.
The diagram below depicts the Company’s organizational structure as of December 31, 2018:2019:
Strategic Sponsorship with Global Infrastructure Partners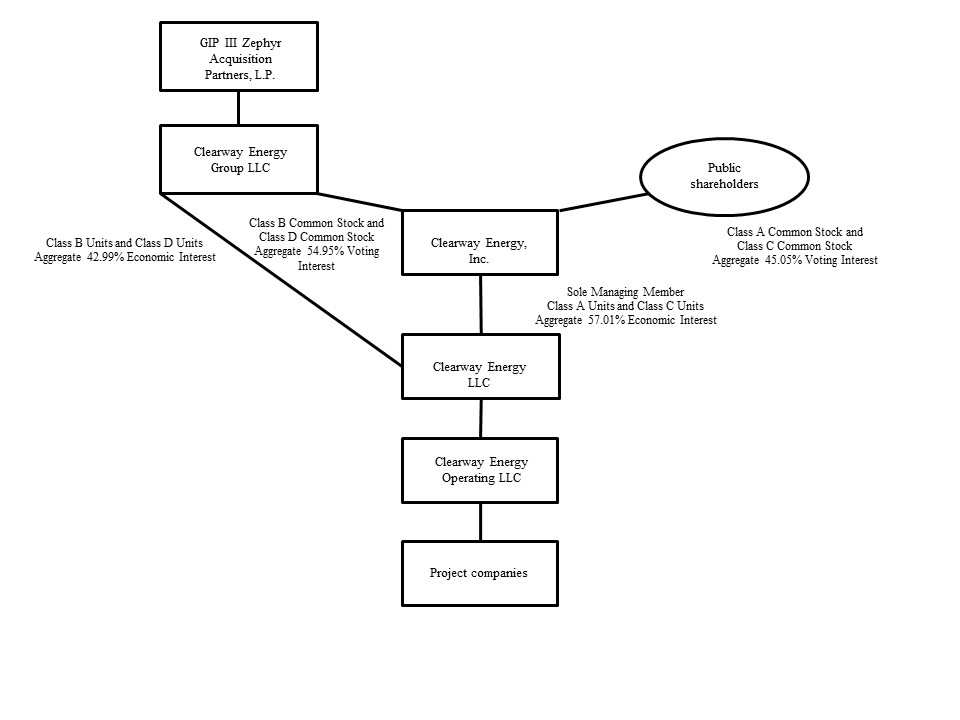
As described above, on August 31, 2018, NRG transferred its full ownership interest in the Company to Clearway Energy Group LLC, or CEG, the holder of NRG's renewable energy development and operations platform and subsequently sold 100% of its interest in CEG to an affiliate of GIP. As a result of the GIP Transaction, GIP indirectly acquired a 45.2% economic interest in the Company and a 55.0% voting interest in Clearway, Inc. as of August 31, 2018.
In connection with the GIP Transaction, Clearway, Inc. entered into a Consent and Indemnity Agreement with NRG and GIP setting forth key terms and conditions of Clearway, Inc.'s consent to the GIP Transaction.
Also in connection with the GIP Transaction, Clearway, Inc. entered into the following agreements on August 31, 2018:
CEG Master Services Agreements
The Company, along with Clearway, Inc. and Clearway Energy Operating LLC, entered into Master Services Agreements with CEG, pursuant to which CEG and certain of its affiliates or third party service providers began providing certain services to Clearway, Inc. and certain of its subsidiaries, and Clearway, Inc. and certain of its subsidiaries began providing certain services to CEG, in exchange for the payment of fees in respect of such services. Additional details regarding the Master Services Agreements are found in Item 15 — Note 13, Related Party Transactions, to the Consolidated Financial Statements.
ROFO Agreements
Clearway, Inc. entered into a ROFO Agreement with CEG, or the CEG ROFO Agreement, and a Third Amended and Restated ROFO Agreement with NRG as further discussed below.
Voting and Governance Agreement
Clearway, Inc. entered into a Voting and Governance Agreement with CEG relating to certain governance matters of Clearway, Inc.
Limited Liability Company Agreement
Clearway, Inc. entered into the Fourth Amended and Restated Limited Liability Company Agreement of the Company with CEG, which sets forth the rights and obligations of Clearway, Inc., as managing member, and CEG, as member, of the Company.
Transition Services Agreement
Clearway, Inc. entered into the NRG TSA, pursuant to which NRG or certain of its affiliates began providing transition services to Clearway, Inc. following the consummation of the GIP Transaction, in exchange for the payment of a fee in respect of such services. The agreement is effective until the earlier of June 30, 2019 or the date that all services are terminated by Clearway, Inc. Clearway, Inc. may extend the term on a month-by-month basis no later than March 31, 2020 for a fixed monthly fee provided for in the agreement.
Business Strategy
The Company's primary business strategy is to focus on the acquisition and ownership of assets with predictable, long-term cash flows in order that it may be able to increase the cash distributions to Clearway, Inc. over time without compromising the ongoing stability of the business. As discussed above, the PG&E Bankruptcy has caused uncertainty around the timing of when certain project-level distributions will be available to the Company and Clearway, Inc. As a result of such timing uncertainty, the Company reduced its quarterly distributions for the first quarter of 2019 to $0.20 per unit, compared to $0.331 per unit in the prior quarter. While the Company views this action as prudent from a financial perspective, it has not changed the Company's long-term business strategy.
The Company's plan for executing its business strategy includes the following key components:
Focus on contracted renewable energy and conventional generation and thermal infrastructure assets. The Company owns and operates utility scale and distributed renewable energy and natural gas-fired generation, thermal and other infrastructure assets with proven technologies, low operating risks and stable cash flows. The Company believes by focusing on this core asset class and leveraging its industry knowledge, it will maximize its strategic opportunities, be a leader in operational efficiency and maximize its overall financial performance.
Growing the business through acquisitions of contracted operating assets. The Company believes that its base of operations provides a platform in the conventional and renewable power generation and thermal sectors for strategic growth through cash accretive and tax advantaged acquisitions complementary to its existing portfolio. In addition to acquiring renewable generation, conventional generation and thermal infrastructure assets from third parties where the Company believes its knowledge of the market and operating expertise provides it with a competitive advantage, the Company entered into the CEG ROFO Agreement. Under the CEG ROFO Agreement, CEG has granted the Company and its affiliates a right of first offer on any proposed sale, transfer or other disposition of certain assets of CEG, or the CEG ROFO Assets, until August 31, 2023. CEG is not obligated to sell the remaining CEG ROFO Assets to the Company and, if offered by CEG, the Company cannot be sure whether these assets will be offered on acceptable terms, or that the Company will choose to consummate such acquisitions. The assets listed below represent the Company's currently committed investments in projects with CEG and the CEG ROFO Assets:
Committed Investments with CEG
|
| | | | | | | | |
| Asset | | Technology | | Net Capacity (MW) | | State | | COD |
Hawaii Solar Phase I(a) | | PV | | 80 | | HI | | 2019 |
$47 MM remaining in distributed and community solar partnerships(b) | | PV | | N/A | | Various | | Various |
Repowering Partnership with CEG (c) | | Wind | | 283 | | TX | | 2020 |
|
| | | | | | | | |
| Asset | | Technology | | Net Capacity (MW) | | State | | COD |
$33 MM remaining in distributed and community solar partnerships(a) | | PV | | N/A | | Various | | Various |
Clearway Energy Group ROFO
| | | Asset | | Technology | | Net Capacity (MW) | | State | | COD | | Technology | | Net Capacity (MW) | | State | | COD |
| Mililani I | | PV | | 39 | | HI | | 2021 | | PV | | 39 | | HI | | 2021 |
| Waiawa | | PV | | 36 | | HI | | 2021 | | PV | | 36 | | HI | | 2021 |
| Langford | | Wind | | 150 | | TX | | 2009 | | Wind | | 150 | | TX | | 2009 |
| Mesquite Star | | Wind | | 419 | | TX | | 2020 | |
Carlsbad(d) | | Natural Gas | | 527 | | CA | | 2018 | |
| Up to $170 MM equity investment in business renewables | | PV | | TBD | | Various | | TBD | | PV | | TBD | | Various | | TBD |
Rattlesnake(b) | | | Wind | | 144 | | WA | | 2020 |
| Black Rock | | | Wind | | 110 | | WV | | 2021 |
| Wildflower | | | Solar | | 100 | | MS | | 2022 |
| Pinnacle Repowering | | | Wind | | 55 | | WV | | 2020 |
(a) On August 31, 2018, Clearway Energy Operating LLC and Clearway Energy Group executed a purchase agreement pursuant to which the Company will acquire effective equity ownership in 80 MW of utility-scale solar projects (Waipao, Mililani II and Kawailoa Solar) located in Oahu, Hawaii.
(b) On December 26, 2018, the Company and CEG amended the DGPV Holdco 3 partnership agreement to increase the capital commitment of $50 million to $70 million.
(c)(b) Investment in the Repowering Partnership withOn January 8, 2020, CEG is contingent upon obtaining related construction and tax equity financing.
(d) The Company maintains the option to purchase Carlsbad from GIP at any time within 18 months after February 27, 2019 at the same economic terms at which it originally agreed to purchase the asset from NRG. Shouldoffered the Company notthe opportunity to acquire Carlsbad within such 18 months, Carlsbad will become a CEG ROFO Asset.
The NRG ROFO Agreement was amended upon the closing of the GIP Transaction to (i) remove the Ivanpah solar facility and (ii) provide the Company and its subsidiaries a right of first offer on any proposed sale or transfer of 100% of the membership interestequity interests in Agua Caliente Borrower 1, LLC, which owns a 35% interest in Agua Caliente, a 290 MW utility-scale solar project located in Dateland, Arizona with PG&E as the project’s customer. Pursuant to the terms of the NRG ROFO Agreement, the Company elected to forgo the acquisition. The Company continues to own a 16% interest in the project through Agua Caliente Borrower 2 LLC.Rattlesnake.
The Company entered into an agreement with NRG to purchase the Carlsbad project on February 6, 2018. The Company elected to exercise the Carlsbad backstop facility provided by GIP; as such, GIP purchased 100% of the membership interest in Carlsbad Energy Holdings LLC on February 27, 2019.
Additionally, the CEG ROFO Agreement was amended on February 14, 2019, to grant to the Company a right of first offer for Hawaii Solar Phase II, which consist of Mililani I and Waiawa solar and storage projects located in Oahu, Hawaii. The projects are expected to reach COD in 2021.
Primary focus on North America. The Company intends to primarily focus its investments in North America (including the unincorporated territories of the U.S.). The Company believes that industry fundamentals in North America present it with significant opportunity to acquire renewable, natural gas-fired generation and thermal infrastructure assets, without creating significant exposure to currency and sovereign risk. By primarily focusing its efforts on North America, the Company believes it will best leverage its regional knowledge of power markets, industry relationships and skill sets to maximize the performance of the Company.
Maintain sound financial practices to grow the distribution. The Company intends to maintain a commitment to disciplined financial analysis and a balanced capital structure to enable it to increase its distribution over time and serve the long-term interests of its stockholders. The Company's financial practices include a risk and credit policy focused on transacting with creditworthy counterparties; a financing policy, which focuses on seeking an optimal capital structure through various capital formation alternatives to minimize interest rate and refinancing risks, and ensure stable distributions and maximize value. The
Company intends to evaluate various alternatives for financing future acquisitions and refinancing of existing project-level debt, in each case, to reduce the cost of debt, extend maturities and maximize CAFD. The Companybelieves it has additional flexibility to seek alternative financing arrangements, including, but not limited to, debt financings and equity-like instruments.
Competition
Power generation is a capital-intensive business with numerous and diverse industry participants. The Company competes on the basis of the location of its plants and on the basis of contract price and terms of individual projects. Within the power industry, there is a wide variation in terms of the capabilities, resources, nature and identity of the companies with whom the Company competes with depending on the market. Competitors for energy supply are utilities, independent power producers and other providers of distributed generation. The Company also competes to acquire new projects with renewable developers who retain renewable power plant ownership, independent power producers, financial investors and other dividend, growth-oriented companies. Competitive conditions may be substantially affected by capital market conditions and by various forms of energy legislation and regulation considered by federal, state and local legislatures and administrative agencies, including tax policy. Such laws and regulations may substantially increase the costs of acquiring, constructing and operating projects, and it could be difficult for the Company to adapt to and operate under such laws and regulations.
The Company's thermal businessThermal Business has certain cost efficiencies that may form barriers to entry. Generally, there is only one district energy system in a given territory, for which the only competition comes from on-site systems. While the district energy system can usually make an effective case for the efficiency of its services, some building owners nonetheless may opt for on-site systems, either due to corporate policies regarding allocation of capital, unique situations where an on-site system might in fact prove more efficient or because of previously committed capital in systems that are already on-site. Growth in existing district energy systems generally comes from new building construction or existing building conversions within the service territory of the district energy provider.
Competitive Strengths
Stable, high quality cash flows. The Company's facilities have a stable, predictable cash flow profile consisting of predominantly long-life electric generation assets that sell electricity under long-term fixed priced contracts or pursuant to regulated rates with investment grade and certain other credit-worthycreditworthy counterparties. As discussed above, PG&E, one of the Company's significant customers, filed for bankruptcy on January 29, 2019. Additionally, theThe Company's facilities have minimal fuel risk. For the Company's conventional assets, fuel is provided by the toll counterparty or the cost thereof is a pass-through cost under the Contract for Differences, or CfD.Differences. Renewable facilities have no fuel costs, and most of the Company's thermal infrastructure assets have contractual or regulatory tariff mechanisms for fuel cost recovery. The offtake agreements for the Company's conventional and renewable generation facilities have a weighted-average remaining duration, based on CAFD, of approximately 1513 years as of December 31, 2018,2019, providing long-term cash flow stability. The Company's generation offtake agreements with counterparties for whom credit ratings are available have a weighted-average Moody’s rating of Ba1 (post PG&E Bankruptcy) based on rated capacity under contract. All of the Company's assets are in the U.S. and accordingly have no currency or repatriation risks.
High quality, long-lived assets with low operating and capital requirements. The Company benefits from a portfolio of relatively younger assets, other than thermal infrastructure assets. The Company's assets are comprised of proven and reliable technologies, provided by leading original solar and wind equipment manufacturers such as General Electric, Siemens AG, SunPower Corporation, or SunPower, First Solar Inc., or First Solar, Vestas, Suzlon and Mitsubishi. Given the modern nature of the portfolio, which includes a substantial number of relatively low operating and maintenance cost solar and wind generation assets, the Company expects to achieve high fleet availability and expend modest maintenance-related capital expenditures.
Significant scale and diversity. The Company owns and operates a large and diverse portfolio of contracted electric generation and thermal infrastructure assets. As of December 31, 2018,2019, the Company's 5,2725,875 net MW contracted generation portfolio benefits from significant diversification in terms of technology, fuel type, counterparty and geography. The Company's thermal businessThermal Business consists of thirteen operations, seven of which are district energy centers that provide steam and chilled water to approximately 695700 customers, and six of which provide generation. The Company believes its scale and access to best practices across the fleet improves its business development opportunities through enhanced industry relationships, reputation and understanding of regional power market dynamics. Furthermore, the Company's diversification reduces its operating risk profile and reliance on any single market.
Relationship with GIP and CEG. The Company believes that its relationship with GIP and CEG provides significant benefits. Global Infrastructure Management, LLC, or GIM, the manager of GIP, is an independent infrastructure fund manager with over $51 billion in assets under management (as of September 30, 2018) that invests in infrastructure assets and businesses in both OECD and select emerging market countries. GIM has a strong track record of investment and value creation in the renewable energy sector. GIM also has extensive experience with publicly traded yield vehicles and development platforms, ranging from Europe's first application of a yield company/development company model to the largest renewable platform in Asia-Pacific. Additionally, the Company believes that CEG provides the Company access to a highly capable renewable development and operations platform that is aligned to support the Company's growth.
Environmentally well-positioned portfolio of assets. The Company's portfolio of electric generation assets consists of 3,3273,403 net MW of renewable generation capacity that are non-emitting sources of power generation. The Company's conventional assets consist of the dual fuel-fired GenConn assets as well as the Carlsbad, Marsh Landing and Walnut Creek simple cycle natural gas-fired peaking generation facilities and the El Segundo combined cycle natural gas-fired peaking facility. The Company does not anticipate having to expend any significant capital expenditures in the foreseeable future to comply with current environmental regulations applicable to its generation assets. Taken as a whole, the Company believes its strategy will be a net beneficiary of current and potential environmental legislation and regulatory requirements that may serve as a catalyst for capacity retirements and improve market opportunities for environmentally well-positioned assets like the Company's assets once its current offtake agreements expire.
Thermal infrastructure business has high entry costs. Significant capital has been invested to construct the Company's thermal infrastructure assets, serving as a barrier to entry in the markets in which such assets operate. As of December 31, 2018,2019, the Company's thermal gross property, plant, and equipment was approximately $583$648 million. The Company's thermal district energy centers are located in urban city areas, with the chilled water and steam delivery systems located underground. Constructing underground delivery systems in urban areas requires long lead times for permitting, rights of way and inspections and is costly. By contrast, the incremental cost to add new customers in existing markets is relatively low. Once thermal infrastructure is established, the Company believes it has the ability to retain customers over long periods of time and to compete effectively for additional business against stand-alone on-site heating and cooling generation facilities. Installation of stand-alone equipment can require significant modification to a building as well as significant space for equipment and funding for capital expenditures. The Company's system technologies often provide economies of scale in terms of fuel procurement, ability to switch between multiple types of fuel to generate thermal energy, and fuel conversion efficiency.
Segment Review
The following tables summarize the Company's operating revenues, net income (loss) and assets by segment for the years ended December 31, 2019, 2018 2017 and 2016,2017, as discussed in Item 15 — Note 12, Segment Reporting, to the Consolidated Financial Statements. All amounts have been recast to include the effect of the acquisitions of the Drop Down Assets, which were accounted for as transfers of entities under common control. The accounting guidance requires retrospective combination of the entities for all periods presented as if the combination has been in effect since the inception of common control. Accordingly, the Company prepared its consolidated financial statements to reflect the transfers as if they had taken place from the beginning of the financial statements period or from the date the entities were under common control (if later than the beginning of the financial statements period).
| | | | Year ended December 31, 2018 | Year ended December 31, 2019 |
| (In millions) | Conventional Generation | | Renewables | | Thermal | | Corporate | | Total | Conventional Generation | | Renewables | | Thermal | | Corporate | | Total |
| Operating revenues | $ | 337 |
| | $ | 526 |
| | $ | 193 |
| | $ | (3 | ) | | $ | 1,053 |
| $ | 346 |
| | $ | 485 |
| | $ | 201 |
| | $ | — |
| | $ | 1,032 |
|
| Net income (loss) | 135 |
| | 86 |
| | 29 |
| | (115 | ) | | 135 |
| 135 |
| | (104 | ) | | (5 | ) | | (127 | ) | | (101 | ) |
| Total assets | 1,788 |
| | 5,836 |
| | 516 |
| | 308 |
| | 8,448 |
| 2,753 |
| | 6,186 |
| | 633 |
| | 33 |
| | 9,605 |
|
|
| | | | | | | | | | | | | | | | | | | |
| | Year ended December 31, 2017 |
| (In millions) | Conventional Generation | | Renewables | | Thermal | | Corporate | | Total |
| Operating revenues | $ | 336 |
| | $ | 501 |
| | $ | 172 |
| | $ | — |
| | $ | 1,009 |
|
| Net income (loss) | 120 |
| | 8 |
| | 25 |
| | (92 | ) | | 61 |
|
| Total assets | 1,897 |
| | 6,017 |
| | 422 |
| | 24 |
| | 8,360 |
|
|
| | | | | | | | | | | | | | | | | | | |
| | Year ended December 31, 2018 |
| (In millions) | Conventional Generation | | Renewables | | Thermal | | Corporate | | Total |
| Operating revenues | $ | 337 |
| | $ | 523 |
| | $ | 193 |
| | $ | — |
| | $ | 1,053 |
|
| Net income (loss) | 135 |
| | 86 |
| | 29 |
| | (115 | ) | | 135 |
|
| Total assets | 1,788 |
| | 5,836 |
| | 516 |
| | 308 |
| | 8,448 |
|
| | | | Year ended December 31, 2016 | Year ended December 31, 2017 |
| (In millions) | Conventional Generation | | Renewables | | Thermal | | Corporate | | Total | Conventional Generation | | Renewables | | Thermal | | Corporate | | Total |
| Operating revenues | $ | 333 |
| | $ | 532 |
| | $ | 170 |
| | $ | — |
| | $ | 1,035 |
| $ | 336 |
| | $ | 501 |
| | $ | 172 |
| | $ | — |
| | $ | 1,009 |
|
| Net income (loss) | 153 |
| | (86 | ) | | 29 |
| | (81 | ) | | 15 |
| 120 |
| | 8 |
| | 25 |
| | (92 | ) | | 61 |
|
Policy Incentives
Policy incentives in the U.S. have the effect of making the development of renewable energy projects more competitive by providing credits and other tax benefits for a portion of the development costs. A loss of or reduction in such incentives could decrease the
attractiveness of renewable energy projects to developers, including CEG, which could reduce the Company's future acquisition opportunities. Such a loss or reduction could also reduce the Company's willingness to pursue or develop certain renewable energy projects due to higher operating costs or decreased revenues under its PPAs.
U.S. federal, state and local governments have established various incentives to support the development of renewable energy projects. These incentives include accelerated tax depreciation, PTCs, ITCs, cash grants, tax abatements and RPS programs. Pursuant to the U.S. federal Modified Accelerated Cost Recovery System, or MACRS, wind and solar projects are fully depreciated for tax purposes over a five-year period even though the useful life of such projects is generally much longer than five years. The Tax Act also provides the ability for wind and solar projects to claim immediate expensing for property acquired and placed in service after September 27, 2017, and before January 1, 2023.
Owners of utility-scale wind facilities are eligible to claim an income tax credit (the PTC, or an ITC in lieu of the PTC) upon initially achieving commercial operation. The PTC is determined based on the amount of electricity produced by the wind facility during the first ten years of commercial operation. This incentive was created under the Energy Policy Act of 1992 and has been extended several times. Alternatively, an ITC equal to 30%a percentage of the cost of a wind facility may be claimed in lieu of the PTC. In order to qualify for the PTC (or ITC in lieu of the PTC), construction of a wind facility must begin before a specified date and the taxpayer must maintain a continuous program of construction or continuous efforts to advance the project to completion. The Internal Revenue Service, or IRS, issued guidance stating that the safe harbor for continuous efforts and continuous construction requirements will generally be satisfied if the facility is placed in service no more than four years after the year in which construction of the facility began. The IRS also confirmed that retrofitted wind facilities may re-qualify for PTCs or ITCs pursuant to the beginbeginning construction requirement, as long as the cost basis of the new investment is at least 80% of the facility’s total fair value.
Owners of solar projects are eligible to claim a 30%an ITC for new solar projects, or could have elected to receive an equivalent cash payment from the U.S. Department of Treasury for the value of the 30% ITC for qualifying solar projects where construction began before the end of 2011 and the projects were placed in service before 2017.projects. Tax credits for qualifying wind and solar projects are subject to the following phase-down schedule.
| | | | Year construction of project begins | Year construction of project begins |
| | 2015 | | 2016 | | 2017 | | 2018 | | 2019 | | 2020 | | 2021 | | 2022 | 2015 | | 2016 | | 2017 | | 2018 | | 2019 | | 2020 | | 2021 | | 2022 |
PTC(a) | 100 | % | | 100 | % | | 80 | % | | 60 | % | | 40 | % | | 0 | | | 0 | | | 0 | | 100 | % | | 100 | % | | 80 | % | | 60 | % | | 40 | % | | 60 |
| %
| | 0 | | | 0 | |
| Wind ITC | 30 | % | | 30 | % | | 24 | % | | 18 | % | | 12 | % | | 0 | | | 0 | | | 0 | | 30 | % | | 30 | % | | 24 | % | | 18 | % | | 12 | % | | 18 |
| %
| | 0 | | | 0 | |
Solar ITC(b) | 30 | % | | 30 | % | | 30 | % | | 30 | % | | 30 | % | | 26 | % | | 22 | % | | 10 | % | 30 | % | | 30 | % | | 30 | % | | 30 | % | | 30 | % | | 26 |
| % | | 22 | % | | 10 | % |
(a) Percentage of the full PTC available for wind projects that begin construction during the applicable year.
(b) ITC is limited to 10% for projects not placed in service before January 1, 2024.
RPS, currently in place in certain states and territories, require electricity providers in the state or territory to meet a certain percentage of their retail sales with energy from renewable sources. Additionally, other states in the U.S. have set renewable energy goals to reduce GHG emissions from historic levels. The Company believes that these standards and goals will create incremental demand for renewable energy in the future.
Regulatory Matters
As owners of power plants and participants in wholesale and thermal energy markets, certain of the Company's subsidiaries are subject to regulation by various federal and state government agencies. These agencies include FERC and the PUCT, as well as other public utility commissions in certain states where the Company's assets are located. Each of the Company's U.S. generating facilities qualifies as an EWG or QF. In addition, the Company is subject to the market rules, procedures and protocols of the various ISO and RTO markets in which it participates. Likewise, certain of the Company's subsidiaries must also comply with the mandatory reliability requirements imposed by NERC and the regional reliability entities in the regions where the Company has generating facilities subject to NERC's reliability authority.The Company's operations within the ERCOT footprint are not subject to rate regulation by FERC, as they are deemed to operate solely within the ERCOT market and not in interstate commerce. These operations are subject to regulation by PUCT.
FERC
FERC, among other things, regulates the transmission and the wholesale sale of electricity in interstate commerce under the authority of the FPA. The transmission and sale of electric energy occurring wholly within ERCOT is not subject to FERC’s jurisdiction. Under existing regulations, FERC determineshas the authority to determine whether an entity owning a generation facility is an EWG, as defined in the PUHCA. FERC also determineshas the authority to determine whether a generation facility meets the applicable criteria of a QF under the PURPA. Each of the Company’s generating facilities qualifies as either an EWG or QF.
The FPA gives FERC exclusive rate-making jurisdiction over the wholesale sale of electricity and transmission of electricity in interstate commerce of public utilities (as defined by the FPA). Under the FPA, FERC, with certain exceptions, regulates owners and operators of facilities used for the wholesale sale of electricity or transmission in interstate commerce as public utilities, and is charged with ensuring that market rules that are just and reasonable.
Public utilities are required to obtain FERC’s acceptance, pursuant to Section 205 of the FPA, of their rate schedules for the wholesale sale of electricity. All of the Company’s non-QF generating entities located outside of ERCOT make sales of electricity pursuant to market-based rates, as opposed to traditional cost-of-service regulated rates. FERC will conductconducts a review of the market basedmarket-based rates of Company public utilities and potential market power every three years according to a regional schedule established by FERC.
In accordance with the Energy Policy Act of 2005, FERC has approved the NERC as the national Energy Reliability Organization, or ERO. As the ERO, NERC is responsible for the development and enforcement of mandatory reliability standards for the wholesale electric power system. In addition to complying with NERC requirements, each entity must comply with the requirements of the regional reliability entity for the region in which it is located.
The PURPA was passed in 1978 in large part to promote increased energy efficiency and development of independent power producers. The PURPA created QFs to further both goals, and FERC is primarily charged with administering the PURPA as it applies to QFs. Certain QFs are exempt from regulation, either in whole or in part,certain regulations under the FPA.
The PUHCA provides FERC with certain authority over and access to books and records of public utility holding companies not otherwise exempt by virtue of their ownership of EWGs, QFs, and Foreign Utility Companies. The Company is exempt from many of the accounting, record retention, and reporting requirements of the PUHCA.
Environmental Matters
The Company is subject to a wide range of environmental laws induring the development, construction, ownership and operation of projects.facilities. These existing and future laws generally require that governmental permits and approvals be obtained before construction and maintained during operation of facilities. The Company is also subjectobligated to comply with all environmental laws regardingand regulations applicable within each jurisdiction and required to implement environmental programs and procedures to monitor and control risks associated with the protectionconstruction, operation and decommissioning of wildlife, including migratory birds, eagles, threatened and endangered species.regulated or permitted energy assets. Federal and state environmental laws have historically become more stringent over time, although this trend could change in the future.
A number of regulations that may affect the Company are under review, including the publishing of the Affordable Clean Energy (ACE) rule and state analogs to MBTA requirements for incidental take. The Company will evaluate the impact of these regulations as they are revised but cannot fully predict the impact of each until anticipated revisions and legal challenges are resolved. To the extent the regulations restrict or otherwise impact the Company's operations, the regulations could have a negative impact on the Company's financial performance.
Clean Air Act
Affordable Clean Energy — The attention in recent years on GHG emissions has resulted in federal regulations and state legislative and regulatory action. In October 2015, the EPA finalized the Clean Power Plan or CPP, addressing(CPP) which addressed GHG emissions from existing EGUs. On February 9,electric utility steam generating units. The CPP was challenged in court and in 2016 the U.S. Supreme Court stayed the CPP. The D.C. Circuit heard oral argument on the legal challenges to the CPP in September 2016. At the EPA's request, the D.C. Circuit agreed on April 28, 2017 to hold the case in abeyance. On October 16, 2017, the EPA proposed a rule to repeal the CPP. Accordingly, the Company believes the CPP is not likely to survive. In August 21, 2018, the EPA published the proposed ACE rule to replace the Affordable Clean Energy (ACE)CPP. The ACE rule which would establishestablishes emission guidelines for states to develop plans to address greenhouse gas emissions from existing coal-fired power plants. The ACE rule would replacealso reinforces the 2015 Clean Power Plan. A public hearing on the proposedstates’ broad discretion in establishing and applying emissions standards to new emission sources. The ACE rule was held on October 1, 2018. Asis currently written,being litigated in the ACE focuses on reducing emissions from existing coal-fired power plants and therefore, would not be applicable to the Company’s EGUs.D.C. Circuit.
Migratory Bird Treaty Act
DuringIn 2019, Senator Lowenthal of New York developed a draft bill — the 2018 California legislative sessionsMigratory Bird Protection Act of 2019 — to reinstate the interpretation that incidental take isprohibited under the MBTA, overriding the recent Trump-administration Solicitor’s Opinion M-37050 that held the MBTA only applies to intentional takings. The draft bill also develops a general permitting program that covers incidental take of migratory birds. To the extent that renewable energy takes migratory birds, it typically is incidental to its operations.
In 2019, Assembly Member Kalra introduced AB 2627 (Kalra), a454 to protect migratory bird species in California. This new bill designedwas intended to backstop the Migratory Bird Treaty Act,MBTA. The bill, which sunsets on January 20, 2025, makes it unlawful to take or MBTA, interpretationpossess any migratory bird in California except as provided by the Obama Administrationpre-2017 federal guidance. The bill was introduced. AB 2627 provided legislative confirmation of the illegality of take of any MBTA species, unless the entity deployed Best Management Practices that had been approved by the California Department of FishState Legislature and Wildlife, or CDFW. The bill was pulledsigned into law by the author at the end of session. However, on November 30, 2018, CDFW issued a legal advisory declaring that the state can still prohibit the unintentional killing of migratory birds even if the Department of the Interior says the federal government cannot. It is expected a revival of the MBTA bill will occurGovernor Newsom in October 2019.
Customers
The Company sells its electricity and environmental attributes, including RECs, primarily to local utilities under long-term, fixed-price PPAs. During the year ended December 31, 2018,2019, the Company derived approximately 40% of its consolidated revenue from Southern California Edison, or SCE, and approximately 23%22% of its consolidated revenue from Pacific Gas and Electric Company, or PG&E. See Pacific Gas and Electric Company Bankruptcy within this Item 1, Business and "Risks Related to the PG&E Bankruptcy" found in Item 1A, Risk Factors, to this Annual Report on Form 10-K for additional information regarding the PG&E Bankruptcy.
Employees
As of December 31, 2018,2019, the Company and its consolidated subsidiaries had 269307 employees.
Available Information
The Company's annual reports on Form 10-K, quarterly reports on Form 10-Q, current reports on Form 8-K, and amendments to those reports filed or furnished pursuant to section 13(a) or 15(d) of the Exchange Act are available free of charge through the "Investor Relations" section of Clearway, Inc.'s website, www.clearwayenergy.com, as soon as reasonably practicable after they are electronically filed with, or furnished to, the SEC. The Company also routinely posts press releases, presentations, webcasts, and other information regarding the Company on Clearway, Energy, Inc.'s website. The information posted on Clearway, Energy, Inc.'s website is not a part of this report.
Item 1A — Risk Factors
Risks related to the PG&E Bankruptcy
The PG&E bankruptcyBankruptcy could adversely affect the Company’s results of operations, financial condition and cash flows.
On January 29, 2019, PG&E filed for reorganization under Chapter 11 of the U.S. Bankruptcy Code in the U.S. Bankruptcy Court for the Northern District of California.California, or the Bankruptcy Court. PG&E is one of the Company's largest customers, representing approximately 23%22% of the Company's consolidated operating revenues during the year ended December 31, 20182019 and 16%14% of total accounts receivable as of December 31, 2018, of which all has been collected as of January 31, 2019. Certain subsidiaries of the Company, which hold interests in six solar facilities totaling 480 MW and Marsh Landing with capacity of 720 MW, sell the output of their facilities to PG&E under long-term PPAs. The Company consolidates three of the solar facilities and Marsh Landing, and records its interest
in the other solar facilities as equity method investments. Most of the PPAs with PG&E have contract prices that are higher than currently estimated market prices. These contracts are subject to review by the bankruptcy court and FERC, pursuant toBankruptcy Court.
On September 9, 2019, PG&E filed a January 2019 FERC order,Chapter 11 plan of reorganization, or the FERC Order. PG&E Plan, which would provide for PG&E to assume all of its PPAs with the Company. On October 17, 2019, an ad hoc group of senior noteholders filed a competing plan of reorganization, which would also provide for PG&E to assume all of its PPAs with the Company.
On January 22, 2020, PG&E announced it had reached an agreement with a group of senior noteholders, and on January 31, 2020, the PG&E Plan was amended to provide for the eventual implementation of such settlement. On February 4, 2020, the Bankruptcy Court approved such settlement, and the noteholders have accordingly agreed to support the PG&E Plan. On February 5, 2020, the noteholders caused the ad hoc noteholder plan to be withdrawn. There are many conditions that must be satisfied before the PG&E Plan and assumption of the PPAs can become effective, including but not limited to approvals by various classes of creditors, the Bankruptcy Court, and the CPUC. A hearing before the Bankruptcy Court to consider whether the PG&E Plan will be approved and confirmed is currently expected to occur on May 27, 2020.
Although the PG&E Bankruptcy filing triggered defaults under the PPAs with the PG&E and under the related financing agreements for each respective facility, as of March 2, 2020, the Company's contracts with PG&E have operated in the normal course and the Company currently expects these contracts to continue as such. As of March 2, 2020, the Company has commenced an adversary proceeding against FERC seeking, amongentered into forbearance agreements for certain project-level financing arrangements and continues to seek forbearance agreements for its other things, an injunction with respectproject-level financing arrangements affected by the PG&E Bankruptcy. The Company continues to assess the FERC Order. potential future impacts of the PG&E Bankruptcy as events occur. For further discussion, see Item 15 — Note 10,Long-term Debt
If PG&E does not have the financial means or refuses to pay the amounts owing to the Company under the PPAs, and if the Company cannot recover the amounts owed through other means, the Company may be required to write-off all, or a portion of, any outstanding accounts receivable, and to impair its fixed assets. Any such results would adversely affect the Company's financial results.
The PG&E bankruptcy filing has triggered defaults under the PPAs with PG&E and under the related financing agreements for each respective facility, all of which have non-recourse project level debt and in certain cases, non-recourse holding company debt. The Company is currently negotiating forbearance agreements with the lenders for each respective financing arrangement, but the Company can provide no assurance that it will be able to successfully negotiate the forbearance agreements.
The Company continues to assess the potential future impacts of the PG&E Bankruptcy on the Company’s operations. The realization of any of the above risks could significantly and adversely affect the Company's ability to meet its financial expectations, its financial condition, results of operations, and cash flows, its ability to make distributions to its stockholders, the market price of its common stock, and its ability to satisfy its debt service obligations.
Counterparties to the Company's offtake agreements may not fulfill their obligations and, as the contracts expire, the Company may not be able to replace them with agreements on similar terms in light of increasing competition in the markets in which the Company operates.
A significant portion of the electric power the Company generates is sold under long-term offtake agreements with public utilities or industrial or commercial end-users, with a weighted average remaining duration, based on CAFD, of approximately 1513 years. As of December 31, 2018,2019, the largest customers of the Company's power generation assets, including assets in which the Company has less than a 100% membership interest, were SCE and PG&E, which represented 40%and 23%22%, respectively, of total consolidated revenues generated by the Company during the year ended December 31, 2018.2019. As previously noted, on January 29, 2019, PG&E filed for reorganization under Chapter 11 of the Bankruptcy Code.
If, for any reason, any of the purchasers of power under these agreements, including PG&E as a result of the PG&E Bankruptcy, are unable or unwilling to fulfill their related contractual obligations or if they refuse to accept delivery of power delivered thereunder or if they otherwise terminate such agreements prior to the expiration thereof, the Company's assets, liabilities, business, financial condition, results of operations and cash flows could be materially and adversely affected. Furthermore, to the extent any of the Company's power purchasers are, or are controlled by, governmental entities, the Company's facilities may be subject to legislative or other political action that may impair their contractual performance.
The power generation industry is characterized by intense competition and the Company's electric generation assets encounter competition from utilities, industrial companies and other independent power producers, in particular with respect to uncontracted output. In recent years, there has been increasing competition among generators for offtake agreements and this has contributed to a reduction in electricity prices in certain markets characterized by excess supply above designated reserve margins. In light of these market conditions, the Company may not be able to replace an expiring or terminated agreement with an agreement on equivalent terms and conditions, including at prices that permit operation of the related facility on a profitable basis. In addition, the Company believes many of its competitors have well-established relationships with the Company's current and potential suppliers, lenders and customers and have extensive knowledge of its target markets. As a result, these competitors may be able to respond more quickly to evolving industry standards and changing customer requirements than the Company will be able to. Adoption of technology more advanced than the Company's could reduce its competitors' power production costs resulting in their having a lower cost structure than is achievable with the technologies currently employed by the Company and adversely affect its ability to compete for offtake agreement renewals. If the Company is unable to replace an expiring or terminated offtake agreement, the affected facility may temporarily or permanently cease operations. External events, such as a severe economic downturn or force majeure events, could also impair the ability of some counterparties to the Company's offtake agreements and other customer agreements to pay for energy and/or other products and services received.
The Company's inability to enter into new or replacement offtake agreements or to compete successfully against current and future competitors in the markets in which the Company operates could have a material adverse effect on the Company's business, financial condition, results of operations and cash flows.
Risks Related to the Company's Business
Certain facilities are newly constructed and may not perform as expected.
Certain of the Company's conventional and renewable assets are newly constructed. The ability of these facilities to meet the Company's performance expectations is subject to the risks inherent in newly constructed power generation facilities and the construction of such facilities, including, but not limited to, degradation of equipment in excess of the Company's expectations, system failures, and outages. The failure of these facilities to perform as the Company expects could have a material adverse effect on the Company's business, financial condition, results of operations, cash flows and its ability to pay distributions to Clearway, Energy, Inc. and CEG.
Pursuant to the Company's cash distribution policy, the Company intends to distribute a significant amount of the CAFD through regular quarterly distributions, and the Company's ability to grow and make acquisitions through cash on hand could be limited.
The Company expects to distribute a significant amount of the CAFD each quarter and to rely primarily upon external financing sources, including the issuance of debt and equity securities and, if applicable, borrowings under the Company's revolving credit facility to fund acquisitions and growth capital expenditures. The Company may be precluded from pursuing otherwise attractive acquisitions if the projected short-term cash flow from the acquisition or investment is not adequate to service the capital raised to fund the acquisition or investment, after giving effect to the Company's available cash reserves. The incurrence of bank borrowings or other debt by Clearway Energy Operating LLC or by the Company's project-level subsidiaries to finance the Company’s growth strategy will result in increased interest expense and the imposition of additional or more restrictive covenants, which, in turn, may impact the cash distributions the Company makes to Clearway, Energy, Inc. and CEG.
The Company may not be able to effectively identify or consummate any future acquisitions on favorable terms, or at all.
The Company's business strategy includes growth through the acquisitions of additional generation assets (including through corporate acquisitions). This strategy depends on the Company’s ability to successfully identify and evaluate acquisition opportunities and consummate acquisitions on favorable terms. However, the number of acquisition opportunities is limited. In addition, the Company will compete with other companies for these limited acquisition opportunities, which may increase the Company’s cost of making acquisitions or cause the Company to refrain from making acquisitions at all. Some of the Company’s competitors for acquisitions are much larger than the Company with substantially greater resources. These companies may be able to pay more for acquisitions and may be able to identify, evaluate, bid for and purchase a greater number of assets than the Company’s financial or human resources permit. If the Company is unable to identify and consummate future acquisitions, it will impede the Company’s ability to execute its growth strategy and limit the Company’s ability to increase the amount of dividends paid to holders of Clearway, Energy, Inc.'s common stock.
Furthermore, the Company’s ability to acquire future renewable facilities may depend on the viability of renewable assets generally. These assets currently are largely contingent on public policy mechanisms including ITCs, cash grants, loan guarantees, accelerated depreciation, RPS and carbon trading plans. These mechanisms have been implemented at the state and federal levels to support the development of renewable generation, demand-side and smart grid and other clean infrastructure technologies. The availability and continuation of public policy support mechanisms will drive a significant part of the economics and viability of the Company’s growth strategy and expansion into clean energy investments.
The Company’s ability to effectively consummate future acquisitions will also depend on the Company’s ability to arrange the required or desired financing for acquisitions.
The Company may not have sufficient availability under the Company’s credit facilities or have access to project-level financing on commercially reasonable terms when acquisition opportunities arise. An inability to obtain the required or desired financing could significantly limit the Company’s ability to consummate future acquisitions and effectuate the Company’s growth strategy. If financing is available, utilization of the Company’s credit facilities or project-level financing for all or a portion of the purchase price of an acquisition could significantly increase the Company’s interest expense, impose additional or more restrictive covenants and reduce CAFD. The Company’s ability to consummate future acquisitions may also depend on the Company’s ability to obtain any required regulatory approvals for such acquisitions, including, but not limited to, approval by FERC under Section 203 of the FPA.
Finally, the acquisition of companies and assets are subject to substantial risks, including the failure to identify material problems during due diligence (for which the Company may not be indemnified post-closing), the risk of overpaying for assets (or not making acquisitions on an accretive basis) and the ability to retain customers. Further, the integration and consolidation of acquisitions requires substantial human, financial and other resources and, ultimately, the Company's acquisitions may divert management’s attention from the Company's existing business concerns, disrupt the Company's ongoing business or not be successfully integrated. There can be no assurances that any future acquisitions will perform as expected or that the returns from such acquisitions will support the financing utilized to acquire them or maintain them. As a result, the consummation of acquisitions may have a material adverse effect on the Company's business, financial condition, results of operations, cash flows and ability to pay distributions to Clearway, Energy, Inc. and CEG.
Even if the Company consummates acquisitions that it believes will be accretive to CAFD, those acquisitions may decrease CAFD as a result of incorrect assumptions in the Company’s evaluation of such acquisitions, unforeseen consequences or other external events beyond the Company’s control.
The acquisition of existing generation assets involves the risk of overpaying for such projects (or not making acquisitions on an accretive basis) and failing to retain the customers of such projects. While the Company will perform due diligence on prospective acquisitions, the Company may not discover all potential risks, operational issues or other issues in such generation assets. Further, the integration and consolidation of acquisitions require substantial human, financial and other resources and, ultimately, the Company’s acquisitions may divert the Company’s management’s attention from its existing business concerns, disrupt its ongoing business or not be successfully integrated. Future acquisitions might not perform as expected or the returns from such acquisitions might not support the financing utilized to acquire them or maintain them. A failure to achieve the financial returns the Company expects when it acquires generation assets could have a material adverse effect on the Company’s ability to grow its business and make cash distributions to its unitholders. Any failure of the Company’s acquired generation assets to be accretive or difficulty in integrating such acquisition into the Company’s business could have a material adverse effect on the Company’s ability to grow its business and make cash distributions to its unitholders.
The Company’s indebtedness could adversely affect its ability to raise additional capital to fund the Company’s operations or pay distributions. It could also expose the Company to the risk of increased interest rates and limit the Company’s ability to react to changes in the economy or the Company’s industry as well as impact the Company’s results of operations, financial condition and cash flows.
As of December 31, 20182019, the Company had approximately $6,038$6,857 million of total consolidated indebtedness, $4,329$5,175 million of which was incurred by the Company's non-guarantor subsidiaries. In addition, the Company’s share of its unconsolidated affiliates’ total indebtedness and letters of credit outstanding as of December 31, 2018,2019, totaled approximately $878$889 million and $80$83 million, respectively (calculated as the Company’s unconsolidated affiliates’ total indebtedness as of such date multiplied by the Company’s percentage membership interest in such assets).
The Company’s substantial debt could have important negative consequences on the Company’s financial condition, including:
increasing the Company’s vulnerability to general economic and industry conditions;
requiring a substantial portion of the Company’s cash flow from operations to be dedicated to the payment of principal and interest on the Company’s indebtedness, therefore reducing the Company’s ability to pay distributions to Clearway, Energy, Inc. and CEG or to use the Company’s cash flow to fund its operations, capital expenditures and future business opportunities;
limiting the Company’s ability to enter into long-term power sales or fuel purchases which require credit support;
limiting the Company’s ability to fund operations or future acquisitions;
restricting the Company’s ability to make certain distributions to Clearway, Energy, Inc. and CEG and the ability of the Company’s subsidiaries to make certain distributions to it, in light of restricted payment and other financial covenants in the Company’s credit facilities and other financing agreements;
exposing the Company to the risk of increased interest rates because certain of the Company’s borrowings, which may include borrowings under the Company’s revolving credit facility, are at variable rates of interest;
limiting the Company’s ability to obtain additional financing for working capital including collateral postings, capital expenditures, debt service requirements, acquisitions and general corporate or other purposes; and
limiting the Company’s ability to adjust to changing market conditions and placing it at a competitive disadvantage compared to the Company’s competitors who have less debt.
The Company's revolving credit facility contains financial and other restrictive covenants that limit the Company’s ability to return capital to stockholders or otherwise engage in activities that may be in the Company’s long-term best interests. The Company’s inability to satisfy certain financial covenants could prevent the Company from paying cash distributions, and the
Company’s failure to comply with those and other covenants could result in an event of default which, if not cured or waived, may entitle the related lenders to demand repayment or enforce their security interests, which could have a material adverse effect
on the Company’s business, financial condition, results of operations and cash flows. In addition, failure to comply with such covenants may entitle the related lenders to demand repayment and accelerate all such indebtedness.
As previously discussed, the PG&E bankruptcyBankruptcy filing has triggered defaults under the PPAs with PG&E and under the related financing agreements for each respective facility, all of which have non-recourse project level debt and in certain cases, holding company debt. The agreements governing the Company’s project-level financing contain financial and other restrictive covenants that limit the Company’s project subsidiaries’ ability to make distributions to the Company or otherwise engage in activities that may be in the Company’s long-term best interests. The project-level financing agreements generally prohibit distributions from the project entities to the Company unless certain specific conditions are met, including the satisfaction of certain financial ratios. The Company’s inability to satisfy certain financial covenants may prevent cash distributions by the particular project(s) to it and, the Company’s failure to comply with those and other covenants could result in an event of default which, if not cured or waived may entitle the related lenders to demand repayment or enforce their security interests, which could have a material adverse effect on the Company’s business, results of operations and financial condition. In addition, failure to comply with such covenants may entitle the related lenders to demand repayment and accelerate all such indebtedness. If the Company is unable to make distributions from the Company’s project-level subsidiaries, it would likely have a material adverse effect on the Company’s ability to pay distributions to Clearway, Inc. and CEG.
Letter of credit facilities to support project-level contractual obligations generally need to be renewed after five to seven years, at which time the Company will need to satisfy applicable financial ratios and covenants. If the Company is unable to renew the Company’s letters of credit as expected or replace them with letters of credit under different facilities on favorable terms or at all, the Company may experience a material adverse effect on its business, financial condition, results of operations and cash flows. Furthermore, such inability may constitute a default under certain project-level financing arrangements, restrict the ability of the project-level subsidiary to make distributions to it and/or reduce the amount of cash available at such subsidiary to make distributions to the Company.
In addition, the Company’s ability to arrange financing, either at the corporate level or at a non-recourse project-level subsidiary, and the costs of such capital, are dependent on numerous factors, including:
general economic and capital market conditions;
credit availability from banks and other financial institutions;
investor confidence in the Company, its partners, Clearway, Inc. (as the Company's sole managing member), or GIP, through CEG, as Clearway, Inc.'s principal stockholder (on a combined voting basis) and the regional wholesale power markets;
the Company’s financial performance and the financial performance of the Company subsidiaries;
the Company’s level of indebtedness and compliance with covenants in debt agreements;
maintenance of acceptable project credit ratings or credit quality;
cash flow; and
provisions of tax and securities laws that may impact raising capital.
The Company may not be successful in obtaining additional capital for these or other reasons. Furthermore, the Company may be unable to refinance or replace project-level financing arrangements or other credit facilities on favorable terms or at all upon the expiration or termination thereof. The Company's failure, or the failure of any of the Company’s projects, to obtain additional capital or enter into new or replacement financing arrangements when due may constitute a default under such existing indebtedness and may have a material adverse effect on the Company's business, financial condition, results of operations and cash flows.
Changes in the method of determining the London Interbank Offered Rate, or the replacement of the London Interbank Offered Rate with an alternative reference rate, may adversely affect interest expense related to outstanding debt.
Amounts drawn under the Company's revolving credit facility and certain of the Company's project-level debt facilitiescurrently bear interest at rates based on the London Interbank Offered Rate, or LIBOR. On July 27, 2017, the Financial Conduct Authority in the United Kingdom announced that it would phase out LIBOR as a benchmark by the end of 2021. It is unclear whether new methods of calculating LIBOR will be established such that it continues to exist after 2021. While the Company's revolving credit facility includes a mechanism to amend the facilities to reflect the establishment of an alternative rate of interest upon the occurrence of certain events related to the phase-out of LIBOR, many of the Company's project-level debt facilities and swap arrangements do not. The Company has not yet pursued any technical amendments or other contractual alternatives to address this matter and is currently evaluating the impact of the potential replacement of LIBOR. If no such amendments or other contractual
alternatives are established on or prior to the phase-out of LIBOR, interest under the Company's revolving credit facility and other project-level debt facilities will bear interest at higher rates based on the prime rate until such amendments or other contractual amendments are established. Even if the Company has entered into interest rate swaps or other derivative instruments for purposes of managing its interest rate exposure, these hedging strategies may not be effective as a result of the replacement or phasing out of LIBOR, and the Company may incur losses as a result. In addition, the overall financial markets may be disrupted as a result of the phase-out or replacement of LIBOR. The potential increase in the Company’s interest expense as a result of the phase-out of LIBOR and uncertainty as to the nature of such potential phase-out and alternative reference rates or disruption in the financial market could have an adverse effect on the Company's business, financial condition, results of operations and cash flows.
Certain of the Company's long-term bilateral contracts result from state-mandated procurements and could be declared invalid by a court of competent jurisdiction.
A significant portion of the Company's revenues are derived from long-term bilateral contracts with utilities that are regulated by their respective states, and have been entered into pursuant to certain state programs. Certain long-term contracts that other companies have with state-regulated utilities have been challenged in federal court and have been declared unconstitutional on the grounds that the rate for energy and capacity established by the contracts impermissibly conflicts with the rate for energy and capacity established by FERC pursuant to the FPA. If certain of the Company's state-mandated agreements with utilities are ever held to be invalid or unenforceable due to the financial conditions or other conditions of such utility, the Company may be unable to replace such contracts, which could have a material adverse effect on the Company's business, financial condition, results of operations and cash flows.
The generation of electric energy from solar and wind energy sources depends heavily on suitable meteorological conditions.
If solar or wind conditions are unfavorable, the Company's electricity generation and revenue from renewable generation facilities may be substantially below the Company's expectations. The electricity produced and revenues generated by a solar or wind energy generation facility is highly dependent on suitable solar or wind conditions, as applicable, and associated weather conditions, which are beyond the Company's control. Furthermore, components of the Company's systems, such as solar panels and inverters, could be damaged by severe weather, such as wildfires, hailstorms or tornadoes. In addition, replacement and spare parts for key components may be difficult or costly to acquire or may be unavailable. Unfavorable weather and atmospheric conditions could impair the effectiveness of the Company's assets or reduce their output beneath their rated capacity or require shutdown of key equipment, impeding operation of the Company's renewable assets. In addition, climate change may have the long-term effect of changing wind patterns at the Company's projects. Changing wind patterns could cause changes in expected electricity generation. These events could also degrade equipment or components and the interconnection and transmission facilities’ lives or maintenance costs.
Although the Company bases its investment decisions with respect to each renewable generation facility on the findings of related wind and solar studies conducted on-site prior to construction or based on historical conditions at existing facilities, actual climatic conditions at a facility site, particularly wind conditions, may not conform to the findings of these studies and may be affected by variations in weather patterns, including any potential impact of climate change. Therefore, the Company's solar and wind energy facilities may not meet anticipated production levels or the rated capacity of the Company's generation assets, which could adversely affect the Company's business, financial condition, results of operations and cash flows.
Operation of electric generation facilities involves significant risks and hazards customary to the power industry that could have a material adverse effect on the Company's business, financial condition, results of operations and cash flows.
The ongoing operation of the Company's facilities involves risks that include the breakdown or failure of equipment or processes or performance below expected levels of output or efficiency due to wear and tear, latent defect, design error or operator error or force majeure events, among other things. Operation of the Company's facilities also involves risks that the Company will be unable to transport its products to its customers in an efficient manner due to a lack of transmission capacity. Unplanned outages of generating units, including extensions of scheduled outages due to mechanical failures or other problems, occur from time to time and are an inherent risk of the business. Unplanned outages typically increase operation and maintenance expenses, capital expenditures and may reduce revenues as a result of selling fewer MWh or require the Company to incur significant costs as a result of obtaining replacement power from third parties in the open market to satisfy forward power sales obligations. The Company's inability to operate its electric generation assets efficiently, manage capital expenditures and costs and generate earnings and cash flow from the Company's asset-based businesses could have a material adverse effect on the Company's business, financial condition, results of operations and cash flows. While the Company maintains insurance, obtains warranties from vendors and obligates contractors to meet certain performance levels, the proceeds of such insurance, warranties or performance guarantees may not cover the Company's lost revenues, increased expenses or liquidated damages payments should it experience equipment breakdown or non-performance by contractors or vendors.
Power generation involves hazardous activities, including acquiring, transporting and unloading fuel, operating large pieces of rotating equipment and delivering electricity to transmission and distribution systems.
In addition to natural risks such as earthquake, flood, lightning, hurricane and wind, other hazards, such as fire, explosion, structural collapse and machinery failure are inherent risks in the Company's operations. These and other hazards can cause significant personal injury or loss of life, severe damage to and destruction of property, plant and equipment and contamination of, or damage to, the environment and suspension of operations. The occurrence of any one of these events may result in the Company being named as a defendant in lawsuits asserting claims for substantial damages, including for environmental cleanup costs, personal injury and property damage and fines and/or penalties. The Company maintains an amount of insurance protection that it considers adequate but cannot provide any assurance that the Company's insurance will be sufficient or effective under all circumstances and against all hazards or liabilities to which the Company may be subject. Furthermore, the Company's insurance coverage is subject to deductibles, caps, exclusions and other limitations. A loss for which the Company is not fully insured (which may include a significant judgment against any facility or facility operator) could have a material adverse effect on the Company's business, financial condition, results of operations or cash flows. Further, due to rising insurance costs and changes in the insurance markets, the Company cannot provide any assurance that its insurance coverage will continue to be available at all or at rates or on terms similar to those presently available. Any losses not covered by insurance could have a material adverse effect on the Company's business, financial condition, results of operations and cash flows.
Maintenance, expansion and refurbishment of electric generation facilities involve significant risks that could result in unplanned power outages or reduced output.
The Company's facilities may require periodic upgrading and improvement. Any unexpected operational or mechanical failure, including failure associated with breakdowns and forced outages, could reduce the Company's facilities' generating capacity below expected levels, reducing the Company's revenues and jeopardizing the Company's ability to pay distributions to Clearway, Inc. and CEG at expected levels or at all. Degradation of the performance of the Company's solar facilities above levels provided for in the related offtake agreements may also reduce the Company's revenues. Unanticipated capital expenditures associated with maintaining, upgrading or repairing the Company's facilities may also reduce profitability.
If the Company makes any major modifications to its conventional power generation facilities, it may be required to install the best available control technology or to achieve the lowest achievable emission rates as such terms are defined under the new source review provisions of the CAA in the future. Any such modifications could likely result in substantial additional capital expenditures. The Company may also choose to repower, refurbish or upgrade its facilities based on its assessment that such activity will provide adequate financial returns. Such facilities require time for development and capital expenditures before commencement of commercial operations, and key assumptions underpinning a decision to make such an investment may prove incorrect, including assumptions regarding construction costs, timing, available financing and future fuel and power prices. These events could have a material adverse effect on the Company's business, financial condition, results of operations and cash flows.
The Company’s facilities may operate, wholly or partially, without long-term power sales agreements.
The Company’s facilities may operate without long-term power sales agreements for some or all of their generating capacity and output and therefore be exposed to market fluctuations. Without the benefit of long-term power sales agreements for the facilities, the Company cannot be sure that it will be able to sell any or all of the power generated by the facilities at commercially attractive rates or that the facilities will be able to operate profitably. This could lead to less predictable revenues, future impairments of the Company's property, plant and equipment or to the closing of certain of its facilities, resulting in economic losses and liabilities, which could have a material adverse effect on the Company's results of operations, financial condition or cash flows.
A portion of the steam and chilled water produced by the Company's thermal assets is sold at regulated rates, and the revenue earned by the Company's GenConn assets is established each year in a rate case; accordingly, the profitability of these assets is dependent on regulatory approval.
Approximately 451 net MWt of capacity from certain of the Company's thermal assets are sold at rates approved by one or more federal or state regulatory commissions, including the Pennsylvania Public Utility Commission and the California Public Utilities Commission for the thermal assets. Similarly, the revenues related to approximately 380 MW of capacity from the GenConn assets are established each year by the Connecticut Public Utilities Regulatory Authority. While such regulatory oversight is generally premised on the recovery of prudently incurred costs and a reasonable rate of return on invested capital, the rates that the Company may charge, or the revenue that the Company may earn with respect to this capacity are subject to authorization of the applicable regulatory authorities. There can be no assurance that such regulatory authorities will consider all of the costs to have been prudently incurred or that the regulatory process by which rates or revenues are determined will always result in rates or revenues that achieve full recovery of costs or an adequate return on the Company's capital investments. While the Company's rates and revenues are generally established based on an analysis of costs incurred in a base year, the rates the Company is allowed to charge, and the revenues the Company is authorized to earn, may or may not match the costs at any given time. If the Company's
costs are not adequately recovered through these regulatory processes, it could have a material adverse effect on the business, financial condition, results of operations and cash flows.
Supplier and/or customer concentration at certain of the Company's facilities may expose the Company to significant financial credit or performance risks.
The Company often relies on a single contracted supplier or a small number of suppliers for the provision of fuel, transportation of fuel, equipment, technology and/or other services required for the operation of certain facilities. In addition, certain of the Company's suppliers provide long-term warranties with respect to the performance of their products or services. If any of these suppliers cannot perform under their agreements with the Company, or satisfy their related warranty obligations, the Company will need to utilize the marketplace to provide or repair these products and services. There can be no assurance that the marketplace can provide these products and services as, when and where required. The Company may not be able to enter into replacement agreements on favorable terms or at all. If the Company is unable to enter into replacement agreements to provide for fuel, equipment, technology and other required services, it would seek to purchase the related goods or services at market prices, exposing the Company to market price volatility and the risk that fuel and transportation may not be available during certain periods at any price. The Company may also be required to make significant capital contributions to remove, replace or redesign equipment that cannot be supported or maintained by replacement suppliers, which could have a material adverse effect on the business, financial condition, results of operations, credit support terms and cash flows.
In addition, potential or existing customers at the Company’s district energy centers and combined heat and power plants, or the Energy Centers, may opt for on-site systems in lieu of using the Company’s Energy Centers, either due to corporate policies regarding the allocation of capital, unique situations where an on-site system might in fact prove more efficient, because of previously committed capital in systems that are already on-site, or otherwise. At times, the Company relies on a single customer or a few customers to purchase all or a significant portion of a facility's output, in some cases under long-term agreements that account for a substantial percentage of the anticipated revenue from a given facility. For instance, during the year ended December 31, 2018, the Company derived approximately 23% of its consolidated revenue from PG&E, which filed for bankruptcy. For additional risks relating to the PG&E Bankruptcy, see "Risks related to the PG&E Bankruptcy" above.
The failure of any supplier to fulfill its contractual obligations to the Company or the Company’s loss of potential or existing customers could have a material adverse effect on its financial results. Consequently, the financial performance of the Company's facilities is dependent on the credit quality of, and continued performance by, the Company's suppliers and vendors and the Company’s ability to solicit and retain customers.
The Company currently owns, and in the future may acquire, certain assets in which the Company has limited control over management decisions and its interests in such assets may be subject to transfer or other related restrictions.
As described in Item 15 — Note 5, Investments Accounted for by the Equity Method and Variable Interest Entities, the Company has limited control over the operation of certain of its assets, because the Company beneficially owns less than a majority of the membership interests in such assets. The Company may seek to acquire additional assets in which it owns less than a majority of the related membership interests in the future. In these investments, the Company will seek to exert a degree of influence with respect to the management and operation of assets in which it owns less than a majority of the membership interests by negotiating to obtain positions on management committees or to receive certain limited governance rights, such as rights to veto significant actions. However, the Company may not always succeed in such negotiations. The Company may be dependent on its co-venturers to operate such assets. The Company's co-venturers may not have the level of experience, technical expertise, human resources management and other attributes necessary to operate these assets optimally. In addition, conflicts of interest may arise in the future between theCompany and its stockholders, on the one hand, and the Company's co-venturers, on the other hand, where the Company's co-venturers' business interests are inconsistent with the interests of the Company and its stockholders. Further, disagreements or disputes between the Company and its co-venturers could result in litigation, which could increase expenses and potentially limit the time and effort the Company's officers and directors are able to devote to the business.
The approval of co-venturers may also be required for the Company to receive distributions of funds from assets or to sell, pledge, transfer, assign or otherwise convey its interest in such assets, or for the Company to acquire GIP's or CEG's interests in such co-ventures as an initial matter. Alternatively, the Company's co-venturers may have rights of first refusal or rights of first offer in the event of a proposed sale or transfer of the Company's interests in such assets. These restrictions may limit the price or interest level for interests in such assets, in the event the Company wants to sell such interests.
Furthermore, certain of the Company's facilities are operated by third-party operators, such as First Solar. To the extent that third-party operators do not fulfill their obligations to manage operations of the facilities or are not effective in doing so, the amount of CAFD may be adversely affected.
The Company's assets are exposed to risks inherent in the use of interest rate swaps and forward fuel purchase contracts and the Company may be exposed to additional risks in the future if it utilizes other derivative instruments.
The Company uses interest rate swaps to manage interest rate risk. In addition, the Company uses forward fuel purchase contracts to hedge its limited commodity exposure with respect to the Company's district energy assets. If the Company elects to enter into such commodity hedges, the related asset could recognize financial losses on these arrangements as a result of volatility in the market values of the underlying commodities or if a counterparty fails to perform under a contract. If actively quoted market prices and pricing information from external sources are not available, the valuation of these contracts would involve judgment or the use of estimates. As a result, changes in the underlying assumptions or use of alternative valuation methods could affect the reported fair value of these contracts. If the values of these financial contracts change in a manner that the Company does not anticipate, or if a counterparty fails to perform under a contract, it could harm the business, financial condition, results of operations and cash flows.
The Company's business is subject to restrictions resulting from environmental, health and safety laws and regulations.
The Company is subject to various federal, state and local environmental and health and safety laws and regulations. In addition, the Company may be held primarily or jointly and severally liable for costs relating to the investigation and clean-up of any property where there has been a release or threatened release of a hazardous regulated material as well as other affected properties, regardless of whether the Company knew of or caused the release. In addition to these costs, which are typically not limited by law or regulation and could exceed an affected property's value, the Company could be liable for certain other costs, including governmental fines and injuries to persons, property or natural resources. Further, some environmental laws provide for the creation of a lien on a contaminated site in favor of the government as security for damages and any costs the government incurs in connection with such contamination and associated clean-up. Although the Company generally requires its operators to undertake to indemnify it for environmental liabilities they cause, the amount of such liabilities could exceed the financial ability of the operator to indemnify the Company. The presence of contamination or the failure to remediate contamination may adversely affect the Company's ability to operate the business.
The Company does not own all of the land on which its power generation or thermal assets are located, which could result in disruption to its operations.
The Company does not own all of the land on which its power generation or thermal assets are located and the Company is, therefore, subject to the possibility of less desirable terms and increased costs to retain necessary land use if it does not have valid leases or rights-of-way or if such rights-of-way lapse or terminate. Although the Company has obtained rights to construct and operate these assets pursuant to related lease arrangements, the rights to conduct those activities are subject to certain exceptions, including the term of the lease arrangement. The Company is also at risk of condemnation on land it owns. The loss of these rights, through the Company's inability to renew right-of-way contracts, condemnation or otherwise, may adversely affect the Company's ability to operate its generation and thermal infrastructure assets.
The Company’s use and enjoyment of real property rights for its projects may be adversely affected by the rights of lienholders and leaseholders that are superior to those of the grantors of those real property rights to the Company.
Solar and wind projects generally are, and are likely to be, located on land occupied by the project pursuant to long-term easements and leases. The ownership interests in the land subject to these easements and leases may be subject to mortgages securing loans or other liens (such as tax liens) and other easement and lease rights of third parties (such as leases of oil or mineral rights) that were created prior to the project’s easements and leases. As a result, the project’s rights under these easements or leases may be subject, and subordinate, to the rights of those third parties. The Company performs title searches and obtains title insurance to protect itself against these risks. Such measures may, however, be inadequate to protect the Company against all risk of loss of its rights to use the land on which the wind projects are located, which could have a material adverse effect on the Company’s business, financial condition and results of operations.
The electric generation business is subject to substantial governmental regulation and may be adversely affected by changes in laws or regulations, as well as liability under, or any future inability to comply with, existing or future regulations or other legal requirements.
The Company's electric generation business is subject to extensive U.S. federal, state and local laws and regulations. Compliance with the requirements under these various regulatory regimes may cause the Company to incur significant additional costs, and failure to comply with such requirements could result in the shutdown of the non-complying facility, the imposition of liens, fines, and/or civil or criminal liability. Public utilities under the FPA are required to obtain FERC acceptance of their rate schedules for wholesale sales of electric energy, capacity and ancillary services. Except for generating facilities located in Hawaii or Texas within the footprint of ERCOT, which are regulated by the PUCT, all of the Company’s assets make wholesale sales of electric energy, capacity and ancillary services in interstate commerce andgenerating companies are public utilities for purposes ofunder the FPA with market-based rate authority unless otherwise exempt from such status.FPA public utility rate regulation. FERC's orders that grant market-based rate authority to wholesale power sellers reserve the right to revoke or revise that authority if FERC subsequently determines that the seller can exercise market power in transmission or generation, create barriers to entry, or engage in abusive affiliate transactions. In addition, public utilities are subject to FERC reporting requirements that impose administrative burdens and that, if violated, can expose the company to criminal and civil penalties or other risks.
The Company's market-based sales are subject to certain rules prohibiting manipulative or deceptive conduct, and if any of the Company's generating companies with market-based rate authority are deemed to have violated those rules, they could be subject to potential disgorgement of profits associated with the violation, penalties, suspension or revocation of market based rate authority. If such generating companies were to lose their market-based rate authority, such companies would be required to obtain FERC's acceptance of a cost-of-service rate schedule and could become subject to the significant accounting, record-keeping, and reporting requirements that are imposed on utilities with cost-based rate schedules. This could have a material adverse effect on the rates the Company is able to charge for power from its facilities.
MostAll of the Company's generating assets are operating either as EWGs as defined under the PUHCA, or as QFs as defined under the PURPA, as amended, and therefore are exempt from certain regulation under the PUHCA and the PURPA.FPA. If a facility fails to maintain its status as an EWG or a QF or there are legislative or regulatory changes revoking or limiting the exemptions to the PUHCA and/or the FPA, then the Company may be subject to significant accounting, record-keeping, access to books and records and reporting requirements, and failure to comply with such requirements could result in the imposition of penalties and additional compliance obligations.
Substantially all of the Company's generation assets are also subject to the reliability standards promulgated by the designated Electric Reliability Organization (currently the North American Electric Reliability Corporation, or NERC) and approved by FERC. If the Company fails to comply with the mandatory reliability standards, it could be subject to sanctions, including substantial monetary penalties and increased compliance obligations. The Company will also be affected by legislative and regulatory changes, as well as changes to market design, market rules, tariffs, cost allocations, and bidding rules that occur in the existing regional markets operated by RTOs or ISOs, such as PJM. The RTOs/ISOs that oversee most of the wholesale power markets impose, and in the future may continue to impose, mitigation, including price limitations, offer caps, non-performance penalties and other mechanisms to address some of the volatility and the potential exercise of market power in these markets. These types of price limitations and other regulatory mechanisms may have a material adverse effect on the profitability of the Company's generation facilities acquired in the future that sell energy, capacity and ancillary products into the wholesale power markets. The regulatory environment for electric generation has undergone significant changes in the last several years due to state and federal policies affecting wholesale competition and the creation of incentives for the addition of large amounts of new renewable generation and, in some cases, transmission assets. These changes are ongoing and the Company cannot predict the future design of the wholesale power markets or the ultimate effect that the changing regulatory environment will have on the Company's business. In addition, in some of these markets, interested parties have proposed to re-regulate the markets or require divestiture of electric generation assets by asset owners or operators to reduce their market share. Other proposals to re-regulate may be made and legislative or other attention to the electric power market restructuring process may delay or reverse the deregulation process. If competitive restructuring of the electric power markets is reversed, discontinued, or delayed, the Company's business prospects and financial results could be negatively impacted.
The Company is subject to environmental laws and regulations that impose extensive and increasingly stringent requirements on its operations, as well as potentially substantial liabilities arising out of environmental contamination.
The Company's assets are subject to numerous and significant federal, state and local laws, including statutes, regulations, guidelines, policies, directives and other requirements governing or relating to, among other things: protection of wildlife, including threatened and endangered species; air emissions; discharges into water; water use; the storage, handling, use, transportation and distribution of dangerous goods and hazardous, residual and other regulated materials, such as chemicals; the prevention of releases of hazardous materials into the environment; the prevention, presence and remediation of hazardous materials in soil and groundwater, both on and offsite; land use and zoning matters; and workers' health and safety matters. The Company's facilities could experience incidents, malfunctions and other unplanned events that could result in spills or emissions in excess of permitted levels and result in personal injury, penalties and property damage. As such, the operation of the Company's facilities carries an inherent risk of environmental, health and safety liabilities (including potential civil actions, compliance or remediation orders, fines and other penalties), and may result in the assets being involved from time to time in administrative and judicial proceedings relating to such matters. The Company has implemented environmental, health and safety management programs designed to continually improve environmental, health and safety performance. Environmental laws and regulations have generally become more stringent over time. Significant costs may be incurred for capital expenditures under environmental programs to keep the assets compliant with such environmental laws and regulations. If it is not economical to make those expenditures, it may be necessary to retire or mothball facilities or restrict or modify the Company's operations to comply with more stringent standards. These environmental requirements and liabilities could have a material adverse effect on the business, financial condition, results of operations and cash flows.
The Company's businesses are subject to physical, market and economic risks relating to potential effects of climate change.
Climate change is producing changescreates uncertainty in weather and other environmental conditions, including temperature and precipitation levels, and thus may affect consumer demand for electricity. In addition, the potential physical effects of climate change, such as increased frequency and severity of storms, cloud coverage, precipitation, floods and other climatic events, could disrupt the Company's operations and supply chain, and cause them to incur significant costs in preparing for or responding to these effects. These or other meteorological changes could lead to increased operating costs, capital expenses or power purchase costs.
GHG regulation could increase the cost of electricity generated by fossil fuels, and such increases could reduce demand for the power the Company's conventional assets generate and market. Legislative and regulatory measures to address climate change and GHG emissions are in various phases of discussion or implementation. The EPA regulates GHG emissions from new and modified facilities that are potential major sources of criteria pollutants under the Clean Air Act's Prevention of Significant Deterioration and Title V programs and has adopted regulations that require, among other things, preconstruction and operating permits for certain large stationary sources and the monitoring and reporting of GHGs from certain onshore oil and natural gas production sources on an annual basis.
In addition, in 2015, the U.S., Canada and the U.K. participated in the United Nations Conference on Climate Change, which led to the creation of the Paris Agreement. The Paris Agreement, which was signed by the U.S. in April 2016, requires countries to review and “represent a progression” in their intended nationally determined contributions (which set GHG emission reduction goals) every five years beginning in 2020. In November 2019, the U.S. submitted formal notification to the United Nations that it intends to withdraw from the Paris Agreement in November 2020. There are no guarantees that the agreement will not be re-implemented in the U.S., or re-implemented in part by specific U.S. states or local governments. The U.S. Congress, along with federal and state agencies, has also considered measures to reduce the emissions of GHGs. Legislation or regulation that restricts carbon emissions could increase the cost of environmental compliance for the Company’s conventional assets by requiring the Company to install new equipment to reduce emissions from larger facilities and/or purchase emission allowances. Climate change and GHG legislation or regulation could also delay or otherwise negatively affect efforts to obtain and maintain permits and other regulatory approvals for the Company’s conventional assets’ existing and new facilities, impose additional monitoring and reporting requirements or adversely affect demand for the natural gas we gather, transport and store. Conversely, legislation or regulation that sets a price on or otherwise restricts carbon emissions could also benefit the Company by increasing demand for solar or wind energy sources. In addition, governmental, scientific and public concern over the threat of climate change arising from GHG emissions has resulted in increasing political risks in the U.S., including climate change related pledges made by certain candidates in the U.S. presidential campaign. The effect on the Company of any new legislative or regulatory measures will depend on the particular provisions that are ultimately adopted.
Risks that are beyond the Company's control, including but not limited to acts of terrorism or related acts of war, natural disaster, hostile cyber intrusions or other catastrophic events, could have a material adverse effect on the business, financial condition, results of operations and cash flows.
The Company's generation facilities that were acquired or those that the Company otherwise acquires or constructs and the facilities of third parties on which they rely may be targets of terrorist activities, as well as events occurring in response to or in connection with them, that could cause environmental repercussions and/or result in full or partial disruption of the facilities ability to generate, transmit, transport or distribute electricity or natural gas. Strategic targets, such as energy-related facilities, may be at greater risk of future terrorist activities than other domestic targets. Hostile cyber intrusions, including those targeting information systems as well as electronic control systems used at the generating plants and for the related distribution systems, could severely disrupt business operations and result in loss of service to customers, as well as create significant expense to repair security breaches or system damage.
Furthermore, certain of the Company's power generation and thermal assets are located in active earthquake zones in California and Arizona, and certain project companies and suppliers conduct their operations in the same region or in other locations that are susceptible to natural disasters. In addition, California and some of the locations where certain suppliers are located, from time to time, have experienced shortages of water, electric power and natural gas. The occurrence of a natural disaster, such as an earthquake, wildfire, drought, flood or localized extended outages of critical utilities or transportation systems, or any critical resource shortages, affecting the Company or its suppliers, could cause a significant interruption in the business, damage or destroy the Company's facilities or those of its suppliers or the manufacturing equipment or inventory of the Company's suppliers. Any such terrorist acts, environmental repercussions or disruptions or natural disasters could result in a significant decrease in revenues or significant reconstruction or remediation costs, beyond what could be recovered through insurance policies, which could have a material adverse effect on the business, financial condition, results of operations and cash flows.
The operation of the Company’s businesses is subject to cyber-based security and integrity risk.
Numerous functions affecting the efficient operation of the Company’s businesses depend on the secure and reliable storage, processing and communication of electronic data and the use of sophisticated computer hardware and software systems. The operation of the Company's generating assets relyrelies on cyber-based technologies and therefore, subject to the risk that such systems could behas been the target of disruptive actions. Potential disruptive actions particularly throughcould result from cyber-attack or cyber intrusion, including by computer hackers, foreign governments and cyber terrorists, or otherwise be compromised by unintentional events. As a result, operations could be interrupted, property could be damaged and sensitive customer information could be lost or stolen, causing the Company to incur significant losses of revenues, other substantial liabilities and damages, costs to replace or repair damaged equipment and damage to the Company's reputation. In addition, the Company may experience increased capital and operating costs to implement increased security for its cyber systems and generating assets.
Government regulations providing incentives for renewable generation could change at any time and such changes may negatively impact the Company's growth strategy.
The Company's growth strategy depends in part on government policies that support renewable generation and enhance the economic viability of owning renewable electric generation assets. Renewable generation assets currently benefit from various federal, state and local governmental incentives such as ITCs, cash grants in lieu of ITCs, loan guarantees, RPS, programs, modified accelerated cost-recovery system of depreciation and bonus depreciation. In December 2015, the U.S. Congress enacted an extension of the 30% solar ITC so that projects that began construction in 2016 through 2019 will continue to qualify for the 30% ITC. Projects beginning construction in 2020 and 2021 will be eligible for the ITC at the rates of 26% and 22%, respectively. The same legislation also extended the 10-year wind PTC for wind projects that began construction in years 2016 through 2019. Wind projects that began construction in 2018 and or begin construction in 2019 are eligible for PTCPTCS at 60% and 40% of the statutory rate per kWh, respectively. In December 2019, the U.S. Congress extended the 10-year wind PTC for wind projects that begin construction in 2020, and such projects are eligible for PTCs at 60% of the statutory rate per kWh. The same legislation also extended an 18% ITC in lieu of the PTC for wind projects that begin construction in 2020.
Many states have adopted RPS programs mandating that a specified percentage of electricity sales come from eligible sources of renewable energy. However, the regulations that govern the RPS programs, including pricing incentives for renewable energy, or reasonableness guidelines for pricing that increase valuation compared to conventional power (such as a projected value for carbon reduction or consideration of avoided integration costs), may change. If the RPS requirements are reduced or eliminated, it could lead to fewer future power contracts or lead to lower prices for the sale of power in future power contracts, which could have a material adverse effect on the Company's future growth prospects. Such material adverse effects may result from decreased revenues, reduced economic returns on certain project company investments, increased financing costs, and/or difficulty obtaining financing. Furthermore, the ARRA included incentives to encourage investment in the renewable energy sector, such as cash
grants in lieu of ITCs, bonus depreciation and expansion of the U.S. DOE loan guarantee program. It is uncertain what loan guarantees may be made by the U.S. DOE loan guarantee program in the future.
If the Company is unable to utilize various federal, state and local government incentives to acquire additional renewable assets in the future, or the terms of such incentives are revised in a manner that is less favorable to the Company, it may suffer a material adverse effect on the business, financial condition, results of operations and cash flows.
The Company relies on electric distribution and transmission facilities that it does not own or control and that are subject to transmission constraints within a number of the Company's regions. If these facilities fail to provide the Company with adequate transmission capacity, it may be restricted in its ability to deliver electric power to its customers and may either incur additional costs or forego revenues.
The Company depends on electric distribution and transmission facilities owned and operated by others to deliver the wholesale power it will sell from its electric generation assets to its customers. A failure or delay in the operation or development of these facilities or a significant increase in the cost of the development of such facilities could result in lost revenues. Such failures or delays could limit the amount of power the Company's operating facilities deliver or delay the completion of the Company's construction projects. Additionally, such failures, delays or increased costs could have a material adverse effect on the business, financial condition and results of operations. If a region's power transmission infrastructure is inadequate, the Company's recovery of wholesale costs and profits may be limited. If restrictive transmission price regulation is imposed, the transmission companies may not have a sufficient incentive to invest in expansion of transmission infrastructure. The Company also cannot predict whether distribution or transmission facilities will be expanded in specific markets to accommodate competitive access to those markets. In addition, certain of the Company's operating facilities' generation of electricity may be curtailed without compensation due to transmission limitations or limitations on the electricity grid's ability to accommodate intermittent and other electricity generating sources, reducing the Company's revenues and impairing its ability to capitalize fully on a particular facility's generating potential. Such curtailments could have a material adverse effect on the business, financial condition, results of operations and cash flows. Furthermore, economic congestion on transmission networks in certain of the markets in which the Company operates may occur and the Company may be deemed responsible for congestion costs. If the Company were liable for such congestion costs, its financial results could be adversely affected.
The Company's costs, results of operations, financial condition and cash flows could be adversely impacted by the disruption of the fuel supplies necessary to generate power at its conventional and thermal power generation facilities.
Delivery of fossil fuels to fuel the Company's conventional and thermal generation facilities is dependent upon the infrastructure (including natural gas pipelines) available to serve each such generation facility as well as upon the continuing financial viability of contractual counterparties. As a result, the Company is subject to the risks of disruptions or curtailments in the production of power at these generation facilities if a counterparty fails to perform or if there is a disruption in the fuel delivery infrastructure.
If the Company is deemed to be an investment company, the Company may be required to institute burdensome compliance requirements and the Company's activities may be restricted, which may make it difficult for the Company to complete strategic acquisitions or effect combinations.
If the Company is deemed to be an investment company under the Investment Company Act of 1940, or the Investment Company Act, the Company's business would be subject to applicable restrictions under the Investment Company Act, which could make it impracticable for the Company to continue its business as contemplated.
The Company believes it is not an investment company under Section 3(b)(1) of the Investment Company Act because the Company is primarily engaged in a non-investment company business. The Company intends to conduct its operations so that the Company will not be deemed an investment company. However, if the Company were to be deemed an investment company, restrictions imposed by the Investment Company Act, including limitations on the Company's capital structure and the Company's ability to transact with affiliates, could make it impractical for the Company to continue its business as contemplated.
The Company depends on key personnel, the loss of any of which could have a material adverse effect on the Company's financial condition and results of operations.
The Company believes its current operations and future success depend largely on the continued services of key personnel that it employs. Although the Company currently has access to the resources of CEG, the loss of key personnel employed by the Company could have a material adverse effect on the Company’s financial condition and results of operations.
Risks Related to the Company's Relationships with GIP and CEG
GIP, through its ownership of CEG, exercises substantial influence over the Company through its position as controlling shareholder of Clearway, Inc. The Company is highly dependent on GIP.
GIP, through its ownership of CEG, owns all of the outstanding Class B and Class D common stock of Clearway, Inc. and owns 55.0%54.95% of the combined voting power of Clearway, Inc. as of December 31, 2018.2019. As a result of GIP's ownership of Clearway, Inc. and Clearway, Inc.'s position as sole managing member of the Company, GIP has a substantial influence on the Company's affairs and its voting power will constitute a large percentage of any quorum of Clearway, Inc.'s stockholders voting on any matter requiring the approval of its stockholders. Such matters include the approval of mergers or sale of all or substantially all of its assets. This concentration of ownership may also have the effect of delaying or preventing a change in control of Clearway, Inc. or discouraging others from making tender offers for their shares. In addition, GIP has the right to elect all of Clearway, Inc.'s directors. GIP may cause corporate actions to be taken even if their interests conflict with the interests of Clearway, Inc.'s other stockholders (including holders of Clearway, Inc.'s Class A and Class C common stock).
Furthermore, the Company depends on certain services provided by or under the direction of CEG under the CEG Master Services Agreement. CEG personnel and support staff that provide services to the Company under the CEG Master Services Agreement are not required to, and the Company does not expect that they will, have as their primary responsibility the management and administration of the Company or to act exclusively for the Company and the CEG Master Services Agreement does not require any specific individuals to be provided by CEG. Under the CEG Master Services Agreement, CEG has the discretion to determine which of its employees perform assignments required to be provided to the Company. Any failure to effectively manage the Company's operations or to implement its strategy could have a material adverse effect on the business, financial condition, results of operations and cash flows. The CEG Master Services Agreement will continue in perpetuity, until terminated in accordance with its terms.
The Company also depends upon CEG and NRG for the provision of management, administration, O&M and certain other services at certain of the Company's facilities. Any failure by CEG or NRG to perform its requirements under these arrangements or the failure by the Company to identify and contract with replacement service providers, if required, could adversely affect the operation of the Company's facilities and have a material adverse effect on the business, financial condition, results of operations and cash flows.
In connection with the GIP Transaction, GIP has agreed to enter into certain agreements with the Company relating to the provision of services and NRG has agreed to enter into certain agreements with the Company relating to transition services and ongoing commercial arrangements. It is uncertain whether, after the transition services end, GIP or its affiliates will continue to provide the same services, or offer the same capabilities and resources, to the Company that the Company currently receives from NRG or whether the Company may have to seek alternative service providers. The Company may not be able to replicate the same level of services, capabilities, experience and familiarity with the Company’s business offered by NRG either through GIP or through alternative service providers or on terms or costs similar to those provided by NRG. The loss of services provided by NRG and the benefits offered to the Company through its relationship with NRG could have an impact on the Company’s business, financial condition, results of operations and cash flows.
GIP and its affiliates control the Company and have the ability to designate a majority of the members of Clearway, Energy, Inc.'s Board.
The governance agreements entered into among NRG, Clearway Energy, Inc., GIP and its affiliates in connection with the GIP Transaction provide GIP the ability to designate a majority of Clearway Energy, Inc.’s Board to the Company’s Corporate Governance, Conflicts and Nominating Committee for nomination for election by Clearway Energy, Inc.’s stockholders and also require that the Company and GIP use their commercially reasonable efforts to submit to Clearway Energy, Inc.’s stockholders at Clearway Energy, Inc.’s 2019 Annual Meeting of Stockholders a charter amendment to classify Clearway Energy, Inc.’s Board into two classes (with the independent directors and directors designated by GIP allocated across the two classes). Due to such agreements and GIP's approximate 55.0%54.95% combined voting power in Clearway, Energy, Inc., the ability of other holders of Clearway, Energy, Inc.’s Class A and Class C common stock to exercise control over the corporate governance of the Company will beis limited. In addition, due to its approximate 55.0% combined voting power in the Company, GIP and its affiliates have a substantial influence on Clearway, Energy, Inc.’s affairs and its voting power constitutes a large percentage of any quorum of Clearway, Energy, Inc.’s stockholders voting on any matter requiring the approval of Clearway, Energy, Inc.’s stockholders, including the classification of Clearway Energy, Inc.'s Board of Directors.stockholders. GIP and its affiliates may hold certain interests that are different from those of the Company or other holders of Clearway, Energy, Inc.'s Class A and Class C common stock and there is no assurance that GIP and its affiliates will exercise its control over the Company in a manner that is consistent with the Company’s interests or those of the holders of Clearway, Energy, Inc.'s Class A and Class C common stock.
The Company may not be able to consummate future acquisitions from CEG.
The Company's ability to grow through acquisitions depends, in part, on CEG's ability to identify and present the Company with acquisition opportunities. Although CEG has agreed, pursuant to the CEG ROFO Agreement, to grant the Company a right of first offer with respect to certain power generation assets that CEG may elect to sell in the future, CEG is under no obligation to sell any such power generation assets or to accept any related offers from the Company. In addition, CEG has not agreed to commit any minimum level of dedicated resources for the pursuit of renewable power-related acquisitions. There are a number of factors which could materially and adversely impact the extent to which suitable acquisition opportunities are made available from CEG, including that the same professionals within CEG's organization that are involved in acquisitions that are suitable for the Company have responsibilities within CEG's broader asset management business, which may include sourcing acquisition opportunities for CEG. Limits on the availability of such individuals will likewise result in a limitation on the availability of acquisition opportunities for the Company. In making these determinations, CEG may be influenced by factors that result in a misalignment with the Company's interests or conflict of interest.
The Company may be unable or unwilling to terminate the CEG Master Services Agreement.Agreement, in certain circumstances.
The CEG Master Services Agreement provides that the Company may terminate the agreement upon 30 days prior written notice to CEG upon the occurrence of any of the following: (i) CEG defaults in the performance or observance of any material term, condition or covenant contained therein in a manner that results in material harm to the Company and the default continues unremedied for a period of 30 days after written notice thereof is given to CEG; (ii) CEG engages in any act of fraud, misappropriation of funds or embezzlement that results in material harm to the Company; (iii) CEG is grossly negligent in the performance of its duties under the agreement and such negligence results in material harm to the Company; or (iv) upon the happening of certain events relating to the bankruptcy or insolvency of CEG. Furthermore, if the Company requests an amendment to the scope of services provided by CEG under the CEG Master Services Agreement and is not able to agree with CEG as to a change to the service fee resulting from a change in the scope of services within 180 days of the request, the Company will be able to terminate the agreement upon 30 days prior notice to CEG. The Company will not be able to terminate the agreement for any other reason, including if CEG experiences a change of control, and the agreement continues in perpetuity, until terminated in accordance with its terms.
If CEG's performance does not meet the expectations of investors, and the Company is unable to terminate the CEG Master Services Agreement, the market price of the Class A and Class C common stock could suffer.
If CEG terminates the CEG Master Services Agreement or defaults in the performance of its obligations under the agreement, or if the transition services to be provided by NRG to the Company are inadequate or end, the Company may be unable to contract with a substitute service provider on similar terms, or at all.
The Company relies on CEG to provide certain services under the CEG Master Services Agreement. The CEG Master Services Agreement provides that CEG may terminate the agreement upon 180 days prior written notice of termination to the Company if itthe Company defaults in the performance or observance of any material term, condition or covenant contained in the agreement in a manner that results in material harm and the default continues unremedied for a period of 30 days after written notice of the breach is given. If CEG terminates the Management Services Agreement or defaults in the performance of its obligations under the agreement, the Company may be unable to contract with CEG or a substitute service provider on similar terms or at all, and the costs of substituting service providers may be substantial. In addition, in light of CEG's familiarity with the Company's assets, a substitute service provider may not be able to provide the same level of service due to lack of pre-existing synergies. Additionally, the Company relies on transition services provided by NRG under the NRG TSA. If the Company cannot locate a service provider that is able to provide substantially similar services as CEG does under the CEG Master Services Agreement, or the services provided by NRG under the NRG TSA, on similar terms, it could have a material adverse effect on the business, financial condition, results of operation and cash flows.
The liability of CEG is limited under the Company's arrangements with it and the Company has agreed to indemnify CEG against claims that it may face in connection with such arrangements, which may lead CEG to assume greater risks when making decisions relating to the Company than it otherwise might if acting solely for its own account.
Under the CEG Master Services Agreement, CEG does not assume any responsibility other than to provide or arrange for the provision of the services described in the CEG Master Services Agreement in good faith. In addition, under the CEG Master Services Agreement, the liability of CEG and its affiliates is limited to the fullest extent permitted by law to conduct involving bad faith, fraud, willful misconduct or gross negligence or, in the case of a criminal matter, action that was known to have been unlawful. In addition, the Company has agreed to indemnify CEG to the fullest extent permitted by law from and against any claims, liabilities, losses, damages, costs or expenses incurred by an indemnified person or threatened in connection with the Company's operations, investments and activities or in respect of or arising from the CEG Master Services Agreement or the services provided by CEG, except to the extent that the claims, liabilities, losses, damages, costs or expenses are determined to have resulted from the conduct in respect of which such persons have liability as described above. These protections may result in CEG tolerating greater risks when making decisions than otherwise might be the case, including when determining whether to use leverage in connection with acquisitions. The indemnification arrangements to which CEG is a party may also give rise to legal claims for indemnification that are adverse to the Company and holders of its common stock.
Certain of the Company’s PPAs and project-level financing arrangements include provisions that would permit the counterparty to terminate the contract or accelerate maturity in the event GIP or its affiliates ceases to control or own, directly or indirectly, a majority of the voting power of the Company.
Certain of the Company’s PPAs and project-level financing arrangements contain change in control provisions that provide the counterparty with a termination right or the ability to accelerate maturity in the event of a change of control of the Company without the counterparty's consent. These provisions are triggered in the event GIP or its affiliates ceases to own, directly or indirectly, capital stock representing more than 50% of the voting power of the Company’s capital stock outstanding on such date, or, in some cases, if GIP or its affiliates ceases to be the majority owner, directly or indirectly, of the applicable project subsidiary. As a result, if GIP or its affiliates ceases to control, or in some cases, own a majority of the voting power of the Company, the counterparties could terminate such contracts or accelerate the maturity of such financing arrangements. The termination of any of the Company’s PPAs or the acceleration of the maturity of any of the Company’s project-level financing could have a material adverse effect on the Company’s business, financial condition, results of operations and cash flow.
CAUTIONARY STATEMENT REGARDING FORWARD-LOOKING INFORMATION
This Annual Report on Form 10-K of Clearway Energy LLC, together with its consolidated subsidiaries, or the Company, includes forward-looking statements within the meaning of Section 27A of the Securities Act of 1933, as amended, or the Securities Act, and Section 21E of the Securities Exchange Act of 1934, as amended, or the Exchange Act. The words "believes," "projects," "anticipates," "plans," "expects," "intends," "estimates" and similar expressions are intended to identify forward-looking statements. These forward-looking statements involve known and unknown risks, uncertainties and other factors that may cause the Company's actual results, performance and achievements, or industry results, to be materially different from any future results, performance or achievements expressed or implied by such forward-looking statements. These factors, risks and uncertainties include the factors described under Item 1A — Risk Factors and the following:
Potential risks related to the PG&E bankruptcy;Bankruptcy;
The Company's ability to maintain and grow its quarterly distributions;
Potential risks related to the Company's relationships with GIP and CEG;
The Company's ability to successfully transition services previously provided by NRG;
The Company's ability to successfully identify, evaluate and consummate acquisitions from third parties;
The Company's ability to acquire assets from GIP or CEG;
The Company's ability to raise additional capital due to its indebtedness, corporate structure, market conditions or otherwise;
Changes in law, including judicial decisions;
Hazards customary to the power production industry and power generation operations such as fuel and electricity price volatility, unusual weather conditions (including wind and solar conditions), catastrophic weather-related or other damage to facilities, unscheduled generation outages, maintenance or repairs, unanticipated changes to fuel supply costs or availability due to higher demand, shortages, transportation problems or other developments, environmental incidents, or electric transmission or gas pipeline system constraints and the possibility that the Company may not have adequate insurance to cover losses as a result of such hazards;
The Company's ability to operate its businesses efficiently, manage maintenance capital expenditures and costs effectively, and generate earnings and cash flows from its asset-based businesses in relation to its debt and other obligations;
The willingness and ability of counterparties to the Company's offtake agreements to fulfill their obligations under such agreements;
The Company's ability to enter into contracts to sell power and procure fuel on acceptable terms and prices as current offtake agreements expire;
Government regulation, including compliance with regulatory requirements and changes in market rules, rates, tariffs and environmental laws;
Operating and financial restrictions placed on the Company that are contained in the project-level debt facilities and other agreements of certain subsidiaries and project-level subsidiaries generally, in the Clearway Energy Operating LLC amended and restated revolving credit facility and in the indentures governing the Senior Notes;
Cyber terrorism and inadequate cybersecurity, or the occurrence of a catastrophic loss and the possibility that the Company may not have adequate insurance to cover losses resulting from such hazards or the inability of the Company's insurers to provide coverage;
The Company's ability to engage in successful mergers and acquisitions activity; and
The Company's ability to borrow additional funds and access capital markets, as well as the Company's substantial indebtedness and the possibility that the Company may incur additional indebtedness going forward.
Forward-looking statements speak only as of the date they were made, and the Company undertakes no obligation to publicly update or revise any forward-looking statements, whether as a result of new information, future events or otherwise. The foregoing review of factors that could cause the Company's actual results to differ materially from those contemplated in any forward-looking statements included in this Annual Report on Form 10-K should not be construed as exhaustive.
Item 1B — Unresolved Staff Comments
None.
Item 2 — Properties
Listed below are descriptions of the Company's interests in facilities, operations and/or projects owned or leased as of December 31, 2018.2019.
| | | | | Capacity | | | | | | Capacity | | | | |
| | | Rated MW | | Net MW(a) | | Owner-ship | | PPA Terms | | Rated MW | | Net MW(a) | | Owner-ship | | PPA Terms |
| Assets | | Location | | Fuel | | COD | | Counterparty | | Expiration | | Location | | Fuel | | COD | | Counterparty | | Expiration |
| Conventional | | | | | | | | | | | | | | |
| Carlsbad | | | Carlsbad, CA | | 527 |
| | 527 |
| | 100 | % | | Natural Gas | | December 2018 | | San Diego Gas & Electric | | 2038 |
| El Segundo | | El Segundo, CA | | 550 |
| | 550 |
| | 100 | % | | Natural Gas | | August 2013 | | Southern California Edison | | 2023 | | El Segundo, CA | | 550 |
| | 550 |
| | 100 | % | | Natural Gas | | August 2013 | | Southern California Edison | | 2023 |
| GenConn Devon | | Milford, CT | | 190 |
| | 95 |
| | 50 | % | | Natural Gas/Oil | | June 2010 | | Connecticut Light & Power | | 2040 | | Milford, CT | | 190 |
| | 95 |
| | 50 | % | | Natural Gas/Oil | | June 2010 | | Connecticut Light & Power | | 2040 |
| GenConn Middletown | | Middletown, CT | | 190 |
| | 95 |
| | 50 | % | | Natural Gas/Oil | | June 2011 | | Connecticut Light & Power | | 2041 | | Middletown, CT | | 190 |
| | 95 |
| | 50 | % | | Natural Gas/Oil | | June 2011 | | Connecticut Light & Power | | 2041 |
| Marsh Landing | | Antioch, CA | | 720 |
| | 720 |
| | 100 | % | | Natural Gas | | May 2013 | | Pacific Gas and Electric | | 2023 | | Antioch, CA | | 720 |
| | 720 |
| | 100 | % | | Natural Gas | | May 2013 | | Pacific Gas and Electric | | 2023 |
| Walnut Creek | | City of Industry, CA | | 485 |
| | 485 |
| | 100 | % | | Natural Gas | | May 2013 | | Southern California Edison | | 2023 | | City of Industry, CA | | 485 |
| | 485 |
| | 100 | % | | Natural Gas | | May 2013 | | Southern California Edison | | 2023 |
| Total Conventional | Total Conventional | | 2,135 |
| | 1,945 |
| | | | Total Conventional | | 2,662 |
| | 2,472 |
| | | |
| Utility Scale Solar | Utility Scale Solar | | | | | | | | Utility Scale Solar | | | | | | | |
| Agua Caliente | | Dateland, AZ | | 290 |
| | 46 |
| | 16 | % | | Solar | | June 2014 | | Pacific Gas and Electric | | 2039 | | Dateland, AZ | | 290 |
| | 46 |
| | 16 | % | | Solar | | June 2014 | | Pacific Gas and Electric | | 2039 |
| Alpine | | Lancaster, CA | | 66 |
| | 66 |
| | 100 | % | | Solar | | January 2013 | | Pacific Gas and Electric | | 2033 | | Lancaster, CA | | 66 |
| | 66 |
| | 100 | % | | Solar | | January 2013 | | Pacific Gas and Electric | | 2033 |
| Avenal | | Avenal, CA | | 45 |
| | 23 |
| | 50 | % | | Solar | | August 2011 | | Pacific Gas and Electric | | 2031 | | Avenal, CA | | 45 |
| | 23 |
| | 50 | % | | Solar | | August 2011 | | Pacific Gas and Electric | | 2031 |
| Avra Valley | | Pima County, AZ | | 26 |
| | 26 |
| | 100 | % | | Solar | | December 2012 | | Tucson Electric Power | | 2032 | | Pima County, AZ | | 26 |
| | 26 |
| | 100 | % | | Solar | | December 2012 | | Tucson Electric Power | | 2032 |
| Blythe | | Blythe, CA | | 21 |
| | 21 |
| | 100 | % | | Solar | | December 2009 | | Southern California Edison | | 2029 | | Blythe, CA | | 21 |
| | 21 |
| | 100 | % | | Solar | | December 2009 | | Southern California Edison | | 2029 |
| Borrego | | Borrego Springs, CA | | 26 |
| | 26 |
| | 100 | % | | Solar | | February 2013 | | San Diego Gas and Electric | | 2038 | | Borrego Springs, CA | | 26 |
| | 26 |
| | 100 | % | | Solar | | February 2013 | | San Diego Gas and Electric | | 2038 |
| Buckthorn Solar | | City of Georgetown, TX | | 154 |
| | 154 |
| | 100 | % | | Solar | | July 2018 | | City of Georgetown, TX | | 2043 | |
Buckthorn Solar (b) | | | City of Georgetown, TX | | 154 |
| | 154 |
| | 100 | % | | Solar | | July 2018 | | City of Georgetown, TX | | 2043 |
| CVSR | | San Luis Obispo, CA | | 250 |
| | 250 |
| | 100 | % | | Solar | | October 2013 | | Pacific Gas and Electric | | 2038 | | San Luis Obispo, CA | | 250 |
| | 250 |
| | 100 | % | | Solar | | October 2013 | | Pacific Gas and Electric | | 2038 |
| Desert Sunlight 250 | | Desert Center, CA | | 250 |
| | 63 |
| | 25 | % | | Solar | | December 2014 | | Southern California Edison | | 2034 | | Desert Center, CA | | 250 |
| | 63 |
| | 25 | % | | Solar | | December 2014 | | Southern California Edison | | 2034 |
| Desert Sunlight 300 | | Desert Center, CA | | 300 |
| | 75 |
| | 25 | % | | Solar | | December 2014 | | Pacific Gas and Electric | | 2039 | | Desert Center, CA | | 300 |
| | 75 |
| | 25 | % | | Solar | | December 2014 | | Pacific Gas and Electric | | 2039 |
| Four Brothers Solar | | New Castle/Milford, UT | | 320 |
| | 160 |
| | 50 | % | | Solar | | July 2016 - August 2016 | | PacifiCorp | | 2036 | |
| Granite Mountain | | Cedar City, UT | | 130 |
| | 65 |
| | 50 | % | | Solar | | September 2016 | | PacifiCorp | | 2036 | |
| Iron Springs | | Cedar City, UT | | 80 |
| | 40 |
| | 50 | % | | Solar | | August 2016 | | PacifiCorp | | 2036 | |
| Kansas South | | Lemoore, CA | | 20 |
| | 20 |
| | 100 | % | | Solar | | June 2013 | | Pacific Gas and Electric | | 2033 | | Lemoore, CA | | 20 |
| | 20 |
| | 100 | % | | Solar | | June 2013 | | Pacific Gas and Electric | | 2033 |
Kawailoa (b) | | | Oahu, HI | | 49 |
| | 24 |
| | 48 | % | | Solar | | November 2019 | | Hawaiian Electric Company | | 2041 |
Oahu Solar Projects (b) | | | Oahu, HI | | 61 |
| | 58 |
| | 95 | % | | Solar | | September 2019 | | Hawaiian Electric Company | | 2041 |
| Roadrunner | | Santa Teresa, NM | | 20 |
| | 20 |
| | 100 | % | | Solar | | August 2011 | | El Paso Electric | | 2031 | | Santa Teresa, NM | | 20 |
| | 20 |
| | 100 | % | | Solar | | August 2011 | | El Paso Electric | | 2031 |
| TA High Desert | | Lancaster, CA | | 20 |
| | 20 |
| | 100 | % | | Solar | | March 2013 | | Southern California Edison | | 2033 | | Lancaster, CA | | 20 |
| | 20 |
| | 100 | % | | Solar | | March 2013 | | Southern California Edison | | 2033 |
Utah Solar Portfolio (b) | | | various | | 530 |
| | 265 |
| | 50 | % | | Solar | | July - September 2016 | | PacifiCorp | | 2036 |
| Total Utility Scale Solar | Total Utility Scale Solar | | 2,018 |
| | 1,075 |
| | | | Total Utility Scale Solar | | 2,128 |
| | 1,157 |
| | | |
| Distributed Solar | Distributed Solar | | | | | | | | Distributed Solar | | | | | | | |
| Apple I LLC Projects | | CA | | 9 |
| | 9 |
| | 100 | % | | Solar | | October 2012 - December 2012 | | Various | | 2032 | | CA | | 3 |
| | 3 |
| | 100 | % | | Solar | | October 2012 - December 2012 | | Various | | 2032 |
| AZ DG Solar Projects | | AZ | | 5 |
| | 5 |
| | 100 | % | | Solar | | December 2010 - January 2013 | | Various | | 2025 - 2033 | | AZ | | 5 |
| | 5 |
| | 100 | % | | Solar | | December 2010 - January 2013 | | Various | | 2025 - 2033 |
| SPP Projects | | Various | | 25 |
| | 25 |
| | 100 | % | | Solar | | June 2008 - June 2012 | | Various | | 2026 - 2037 | | Various | | 25 |
| | 25 |
| | 100 | % | | Solar | | June 2008 - June 2012 | | Various | | 2026 - 2037 |
| Other DG Projects | | Various | | 13 |
| | 13 |
| | 100 | % | | Solar | | October 2012 - October 2015 | | Various | | 2023 - 2039 | | Various | | 13 |
| | 13 |
| | 100 | % | | Solar | | October 2012 - October 2015 | | Various | | 2023 - 2039 |
| Total Distributed Solar | | 52 |
| | 52 |
| | | | |
| Wind | | | | | | | | |
| | | | | Capacity | | | | | | Capacity | | | | |
| | | Rated MW | | Net MW(a) | | Owner-ship | | PPA Terms | | Rated MW | | Net MW(a) | | Owner-ship | | PPA Terms |
| Assets | | Location | | Fuel | | COD | | Counterparty | | Expiration | | Location | | Fuel | | COD | | Counterparty | | Expiration |
| Total Distributed Solar | | Total Distributed Solar | | 46 |
| | 46 |
| | | |
| Wind | | Wind | | | | | | | |
| Alta I | | Tehachapi, CA | | 150 |
| | 150 |
| | 100 | % | | Wind | | December 2010 | | Southern California Edison | | 2035 | | Tehachapi, CA | | 150 |
| | 150 |
| | 100 | % | | Wind | | December 2010 | | Southern California Edison | | 2035 |
| Alta II | | Tehachapi, CA | | 150 |
| | 150 |
| | 100 | % | | Wind | | December 2010 | | Southern California Edison | | 2035 | | Tehachapi, CA | | 150 |
| | 150 |
| | 100 | % | | Wind | | December 2010 | | Southern California Edison | | 2035 |
| Alta III | | Tehachapi, CA | | 150 |
| | 150 |
| | 100 | % | | Wind | | February 2011 | | Southern California Edison | | 2035 | | Tehachapi, CA | | 150 |
| | 150 |
| | 100 | % | | Wind | | February 2011 | | Southern California Edison | | 2035 |
| Alta IV | | Tehachapi, CA | | 102 |
| | 102 |
| | 100 | % | | Wind | | March 2011 | | Southern California Edison | | 2035 | | Tehachapi, CA | | 102 |
| | 102 |
| | 100 | % | | Wind | | March 2011 | | Southern California Edison | | 2035 |
| Alta V | | Tehachapi, CA | | 168 |
| | 168 |
| | 100 | % | | Wind | | April 2011 | | Southern California Edison | | 2035 | | Tehachapi, CA | | 168 |
| | 168 |
| | 100 | % | | Wind | | April 2011 | | Southern California Edison | | 2035 |
Alta X (b) | | Tehachapi, CA | | 137 |
| | 137 |
| | 100 | % | | Wind | | February 2014 | | Southern California Edison | | 2038 | | Tehachapi, CA | | 137 |
| | 137 |
| | 100 | % | | Wind | | February 2014 | | Southern California Edison | | 2038 |
Alta XI (b) | | Tehachapi, CA | | 90 |
| | 90 |
| | 100 | % | | Wind | | February 2014 | | Southern California Edison | | 2038 | | Tehachapi, CA | | 90 |
| | 90 |
| | 100 | % | | Wind | | February 2014 | | Southern California Edison | | 2038 |
| Buffalo Bear | | Buffalo, OK | | 19 |
| | 19 |
| | 100 | % | | Wind | | December 2008 | | Western Farmers Electric Co-operative | | 2033 | | Buffalo, OK | | 19 |
| | 19 |
| | 100 | % | | Wind | | December 2008 | | Western Farmers Electric Co-operative | | 2033 |
Crosswinds (b) | | Ayrshire, IA | | 21 |
| | 21 |
| | 99 | % | | Wind | | June 2007 | | Corn Belt Power Cooperative | | 2027 | | Ayrshire, IA | | 21 |
| | 21 |
| | 99 | % | | Wind | | June 2007 | | Corn Belt Power Cooperative | | 2027 |
Elbow Creek (b) | | Howard County, TX | | 122 |
| | 122 |
| | 100 | % | | Wind | | December 2008 | | NRG Power Marketing LLC | | 2022 | | Howard County, TX | | 122 |
| | 122 |
| | 100 | % | | Wind | | December 2008 | | various | | 2029 |
Elkhorn Ridge (b) | | Bloomfield, NE | | 81 |
| | 54 |
| | 66.7 | % | | Wind | | March 2009 | | Nebraska Public Power District | | 2029 | | Bloomfield, NE | | 81 |
| | 54 |
| | 66.7 | % | | Wind | | March 2009 | | Nebraska Public Power District | | 2029 |
Forward (b) | | Berlin, PA | | 29 |
| | 29 |
| | 100 | % | | Wind | | April 2008 | | Constellation NewEnergy, Inc. | | 2022 | | Berlin, PA | | 29 |
| | 29 |
| | 100 | % | | Wind | | April 2008 | | Constellation NewEnergy, Inc. | | 2022 |
Goat Wind (b) | | Sterling City, TX | | 150 |
| | 150 |
| | 100 | % | | Wind | | April 2008/June 2009 | | Dow Pipeline Company | | 2025 | | Sterling City, TX | | 150 |
| | 150 |
| | 100 | % | | Wind | | April 2008/June 2009 | | Dow Pipeline Company | | 2025 |
Hardin (b) | | Jefferson, IA | | 15 |
| | 15 |
| | 99 | % | | Wind | | May 2007 | | Interstate Power and Light Company | | 2027 | | Jefferson, IA | | 15 |
| | 15 |
| | 99 | % | | Wind | | May 2007 | | Interstate Power and Light Company | | 2027 |
| Laredo Ridge | | Petersburg, NE | | 80 |
| | 80 |
| | 100 | % | | Wind | | February 2011 | | Nebraska Public Power District | | 2031 | | Petersburg, NE | | 80 |
| | 80 |
| | 100 | % | | Wind | | February 2011 | | Nebraska Public Power District | | 2031 |
Lookout (b) | | Berlin, PA | | 38 |
| | 38 |
| | 100 | % | | Wind | | October 2008 | | Southern Maryland Electric Cooperative | | 2030 | | Berlin, PA | | 38 |
| | 38 |
| | 100 | % | | Wind | | October 2008 | | Southern Maryland Electric Cooperative | | 2030 |
Odin (b) | | Odin, MN | | 20 |
| | 20 |
| | 99.9 | % | | Wind | | June 2008 | | Missouri River Energy Services | | 2028 | | Odin, MN | | 20 |
| | 20 |
| | 99.9 | % | | Wind | | June 2008 | | Missouri River Energy Services | | 2028 |
| Pinnacle | | Keyser, WV | | 55 |
| | 55 |
| | 100 | % | | Wind | | December 2011 | | Maryland Department of General Services and University System of Maryland | | 2031 | | Keyser, WV | | 55 |
| | 55 |
| | 100 | % | | Wind | | December 2011 | | Maryland Department of General Services and University System of Maryland | | 2031 |
San Juan Mesa (b) | | Elida, NM | | 120 |
| | 90 |
| | 75 | % | | Wind | | December 2005 | | Southwestern Public Service Company | | 2025 | | Elida, NM | | 120 |
| | 90 |
| | 75 | % | | Wind | | December 2005 | | Southwestern Public Service Company | | 2025 |
Sleeping Bear (b) | | Woodward, OK | | 95 |
| | 95 |
| | 100 | % | | Wind | | October 2007 | | Public Service Company of Oklahoma | | 2032 | | Woodward, OK | | 95 |
| | 95 |
| | 100 | % | | Wind | | October 2007 | | Public Service Company of Oklahoma | | 2032 |
| South Trent | | Sweetwater, TX | | 101 |
| | 101 |
| | 100 | % | | Wind | | January 2009 | | AEP Energy Partners | | 2029 | | Sweetwater, TX | | 101 |
| | 101 |
| | 100 | % | | Wind | | January 2009 | | AEP Energy Partners | | 2029 |
Spanish Fork (b) | | Spanish Fork, UT | | 19 |
| | 19 |
| | 100 | % | | Wind | | July 2008 | | PacifiCorp | | 2028 | | Spanish Fork, UT | | 19 |
| | 19 |
| | 100 | % | | Wind | | July 2008 | | PacifiCorp | | 2028 |
Spring Canyon II (b) | | Logan County, CO | | 32 |
| | 29 |
| | 90.1 | % | | Wind | | October 2014 | | Platte River Power Authority | | 2039 | | Logan County, CO | | 32 |
| | 29 |
| | 90.1 | % | | Wind | | October 2014 | | Platte River Power Authority | | 2039 |
Spring Canyon III(b) | | Logan County, CO | | 28 |
| | 25 |
| | 90.1 | % | | Wind | | December 2014 | | Platte River Power Authority | | 2039 | | Logan County, CO | | 28 |
| | 25 |
| | 90.1 | % | | Wind | | December 2014 | | Platte River Power Authority | | 2039 |
| Taloga | | Putnam, OK | | 130 |
| | 130 |
| | 100 | % | | Wind | | July 2011 | | Oklahoma Gas & Electric | | 2031 | | Putnam, OK | | 130 |
| | 130 |
| | 100 | % | | Wind | | July 2011 | | Oklahoma Gas & Electric | | 2031 |
Wildorado (b) | | Vega, TX | | 161 |
| | 161 |
| | 100 | % | | Wind | | April 2007 | | Southwestern Public Service Company | | 2027 | | Vega, TX | | 161 |
| | 161 |
| | 100 | % | | Wind | | April 2007 | | Southwestern Public Service Company | | 2027 |
| Total Wind | Total Wind | | 2,263 |
| | 2,200 |
| | | | Total Wind | | 2,263 |
| | 2,200 |
| | | |
| Thermal Generation | Thermal Generation | | | | | | | | Thermal Generation | | | | | | | |
| CA Fuel Cell | | | Tulare, CA | | 3 |
| | 3 |
| | 100 | % | | Natural Gas | | May 2018 | | City of Tulare | | 2038 |
| | | | | Capacity | | | | | | Capacity | | | | |
| | | Rated MW | | Net MW(a) | | Owner-ship | | PPA Terms | | Rated MW | | Net MW(a) | | Owner-ship | | PPA Terms |
| Assets | | Location | | Fuel | | COD | | Counterparty | | Expiration | | Location | | Fuel | | COD | | Counterparty | | Expiration |
| CA Fuel Cell | | Tulare, CA | | 3 |
| | 3 |
| | 100 | % | | Natural Gas | | May 2018 | | City of Tulare | | 2038 | |
| Dover | | Dover, DE | | 103 |
| | 103 |
| | 100 | % | | Natural Gas | | June 2013 | | NRG Power Marketing LLC | | 2018 | |
Dover (c) | | | Dover, DE | | 103 |
| | 103 |
| | 100 | % | | Natural Gas | | June 2013 | | various | | N/A |
| ECP Uptown Campus | | | Pittsburgh, PA | | 6 |
| | 6 |
| | 100 | % | | Natural Gas | | May 2019 | | Duquesne University | | 2029 |
| Energy Center - Pittsburgh | | Pittsburgh, PA | | 7 |
| | 7 |
| | 100 | % | | Diesel | | January 2019 | | University of Pittsburgh Medical Center | | 2038 | | Pittsburgh, PA | | 7 |
| | 7 |
| | 100 | % | | Diesel | | January 2019 | | University of Pittsburgh Medical Center | | 2038 |
| Paxton Creek Cogen | | Harrisburg, PA | | 12 |
| | 12 |
| | 100 | % | | Natural Gas | | November 1986 | | Power sold into PJM markets | | Harrisburg, PA | | 12 |
| | 12 |
| | 100 | % | | Natural Gas | | November 1986 | | Power sold into PJM markets |
| Princeton Hospital | | Princeton, NJ | | 5 |
| | 5 |
| | 100 | % | | Natural Gas | | January 2012 | | Excess power sold to local utility | | Princeton, NJ | | 5 |
| | 5 |
| | 100 | % | | Natural Gas | | January 2012 | | Excess power sold to local utility |
| Tucson Convention Center | | Tucson, AZ | | 2 |
| | 2 |
| | 100 | % | | Natural Gas | | January 2003 | | Excess power sold to local utility | | Tucson, AZ | | 2 |
| | 2 |
| | 100 | % | | Natural Gas | | January 2003 | | Excess power sold to local utility |
| University of Bridgeport | | Bridgeport, CT | | 1 |
| | 1 |
| | 100 | % | | Natural Gas | | April 2015 | | University of Bridgeport | | 2034 | | Bridgeport, CT | | 1 |
| | 1 |
| | 100 | % | | Natural Gas | | April 2015 | | University of Bridgeport | | 2034 |
| Total Thermal Generation | Total Thermal Generation | | 133 |
| | 133 |
| | | | Total Thermal Generation | | 139 |
| | 139 |
| | | |
Total Clearway Energy LLC (c)(d) | Total Clearway Energy LLC (c)(d) | | 6,601 |
| | 5,405 |
| | | | Total Clearway Energy LLC (c)(d) | | 7,238 |
| | 6,014 |
| | | |
(a) Net capacity represents the maximum, or rated, generating capacity of the facility multiplied by the Company's percentage ownership in the facility as of December 31, 2018.2019.
(b) Projects are part of tax equity arrangements, as further described in Item 15—Note 2, Summary of Significant Accounting Policies.
(c)Includes assets held for sale as of December 31, 2019, as further described in Item 15—Note 3, Acquisitions and Dispositions.
(d) Clearway Energy LLC's total generation capacity is net of 6 MWs for noncontrolling interest for Spring Canyon II and III. Clearway Energy, LLC's generation capacity including this noncontrolling interest was 5,4116,020 MWs.
In addition to the facilities owned or leased in the table above, the Company entered into partnerships to own or purchase solar power generation projects, as well as other ancillary related assets from a related party via intermediate funds. The Company does not consolidate these partnerships and accounts for them as equity method investments. The Company's net interest in these projects is 268320 MW based on cash to be distributed. For further discussions, refer to Item 15 — Note 5, Investments Accounted for by the Equity Method and Variable Interest Entities to the Consolidated Financial Statements.
The following table summarizes the Company's thermal steam and chilled water facilities as of December 31, 2018:2019:
| | | Name and Location of Facility | | Thermal Energy Purchaser | | % Owned | | Rated Megawatt
Thermal
Equivalent
Capacity (MWt) | | Net Megawatt
Thermal
Equivalent
Capacity (MWt) | | Generating
Capacity | | Thermal Energy Customers (steam/chilled water ) | | % Owned | | Rated Megawatt
Thermal
Equivalent
Capacity (MWt) | | Net Megawatt
Thermal
Equivalent
Capacity (MWt) (c) | | Generating
Capacity |
| Energy Center Minneapolis, MN | | Approx. 95 steam and 55 chilled water customers | | 100 | | 315
136 |
| | 315
136 |
| | Steam: 1,075 MMBtu/hr.
Chilled water: 38,700 tons | | 100 steam | | 100 | | 315 |
| | 315 |
| | Steam: 1,075 MMBtu/hr. |
| | | | 55 chilled water | | 100 | | 136 |
| | 136 |
| | Chilled water: 38,700 tons |
| ECP Uptown Campus | | | Duquesne University | | 100 | | 53 |
| | 53 |
| | Steam: 181 MMBtu/hr. |
| | | | Duquesne University | | 100 | | 20 |
| | 20 |
| | Chilled water: 5,790 tons |
Energy Center
San Francisco, CA | | Approx. 180 steam customers | | 100 | | 133 |
| | 133 |
| | Steam: 454 MMBtu/hr. | | 180 steam | | 100 | | 133 |
| | 133 |
| | Steam: 454 MMBtu/hr. |
Energy Center
Omaha, NE | | Approx. 60 steam and 65 chilled water customers | | 100
16(a)
100
0(a) | | 142
56
77
21 |
| | 142
9
77
0 |
| | Steam: 485 MMBtu/hr
Steam: 190 MMBtu/hr
Chilled water: 22,000 tons
Chilled water: 6,000 tons | | 60 steam | | 100 | | 198 |
| | 198 |
| | Steam: 675 MMBtu/hr. |
| | | | 65 chilled water | | 100 | | 99 |
| | 99 |
| | Chilled water: 28,000 tons |
| Energy Center Harrisburg, PA | | Approx. 125 steam and 5 chilled water customers | | 100 | | 108
13 |
| | 108
13 |
| | Steam: 370 MMBtu/hr.
Chilled water: 3,600 tons | | 125 steam | | 100 | | 108 |
| | 108 |
| | Steam: 370 MMBtu/hr. |
| | | | 5 chilled water | | 100 | | 14 |
| | 14 |
| | Chilled water: 3,900 tons |
| Energy Center Phoenix, AZ | | Approx. 40 chilled water customers | | 24(a)
100
12(a)
0(a) | | 5
104
14
28 |
| | 1
104
2
0 |
| | Steam: 17 MMBtu/hr
Chilled water: 29,600 tons
Chilled water: 3,920 tons
Chilled water: 8,000 tons | | 40 chilled water | | 24 | | 5 |
| | 1 |
| | Steam: 17 MMBtu/hr. |
| | | | 0.12 (a) | | 14 |
| | 2 |
| | Chilled water: 3,920 tons |
| | | | 100 | | 104 |
| | 104 |
| | Chilled water: 29,600 tons |
| | | | 0 (a) | | 28 |
| | 0 |
| | Chilled water: 8,000 tons |
| Energy Center Pittsburgh, PA | | Approx. 25 steam and 25 chilled water customers | | 100 | | 132
78 |
| | 132
78 |
| | Steam: 452 MMBtu/hr.
Chilled water: 22,224 tons | | 25 steam | | 100 | | 132 |
| | 132 |
| | Steam: 452 MMBtu/hr. |
| | | | 25 chilled water | | 100 | | 78 |
| | 78 |
| | Chilled water: 22,224 tons |
Energy Center
San Diego, CA | | Approx. 20 chilled water customers | | 100 | | 31 |
| | 31 |
| | Chilled water: 8,825 tons | | 20 chilled water | | 100 | | 33 |
| | 33 |
| | Chilled water: 9,295 tons |
Energy Center
Dover, DE | | Kraft Heinz Company; Proctor and Gamble | | 100 | | 66 |
| | 66 |
| | Steam: 225 MMBtu/hr. | |
Energy Center Dover, DE (b) | | | Kraft Heinz Company; Proctor and Gamble | | 100 | | 66 |
| | 66 |
| | Steam: 225 MMBtu/hr. |
| Energy Center Princeton, NJ | | Princeton HealthCare System | | 100 | | 21
17 |
| | 21
17 |
| | Steam: 72 MMBtu/hr.
Chilled water: 4,700 tons | | Princeton HealthCare System | | 100 | | 21 |
| | 21 |
| | Steam: 72 MMBtu/hr. |
| | | Total Generating Capacity (MWt) | | 1,497 |
| | 1,385 |
| | | Princeton HealthCare System | | 100 | | 17 |
| | 17 |
| | Chilled water: 4,700 tons |
| Total generating capacity | | | 1,574 |
| | 1,530 |
| |
(a) Net MWt capacity excludes 11219 MWt available under the right-to-use provisions contained in agreements between twoone of the Company's thermal facilities and certain of its customers.
(b) Project is deemed to be held for sale as of December 31, 2019. For further information see Item 15 — Note 3, Acquisitions and Dispositions.
(c) Net megawatt thermal equivalent capacity represents the maximum, or rated, generating capacity of the facility multiplied by the Company's percentage ownership in the facility as of December 31, 2019.
Item 3 — Legal Proceedings
See "Pacific Gas and Electric Company Bankruptcy" found in Item 1—Business, of this Annual Report on Form 10-K and Item 15 — Note 14, Commitments and Contingencies, to the Consolidated Financial Statements for discussion of the material legal proceedings to which the Company is a party or of which any of its properties is subject.
Item 4 — Mine Safety Disclosures
Not applicable.
PART II
Item 5 — Market for Registrant's Common Equity, Related Stockholder Matters and Issuer Purchases of Equity Securities
Market Information and Holders
As of the date of this report, there is no publicly-traded market for the Company's membership units. All of the Company's Class A and Class C units are held by Clearway, Energy, Inc. and all of the Company's Class B and Class D units are held by CEG.
Distributions
The following table lists the distributions paid on the Company's Class A, Class B, Class C and Class D units during the year ended December 31, 2018:2019:
| | | | Fourth Quarter 2018 | | Third Quarter 2018 | | Second Quarter 2018 | | First Quarter 2016 | Fourth Quarter 2019 | | Third Quarter 2019 | | Second Quarter 2019 | | First Quarter 2019 |
| Distributions per Class A and Class B unit | $ | 0.331 |
| | $ | 0.320 |
| | $ | 0.309 |
| | $ | 0.298 |
| $ | 0.20 |
| | $ | 0.20 |
| | $ | 0.20 |
| | $ | 0.20 |
|
| Distributions per Class C and Class D unit | $ | 0.331 |
| | $ | 0.320 |
| | $ | 0.309 |
| | $ | 0.298 |
| $ | 0.20 |
| | $ | 0.20 |
| | $ | 0.20 |
| | $ | 0.20 |
|
On February 12, 2019,18, 2020, the Company declared a quarterly distribution on its Class A, Class B, Class C and Class D units of $0.20$0.21 per unit payable on March 15, 2019.16, 2020.
Item 6 — Selected Financial Data
The following table presents the Company's historical selected financial data, which has been recast to include the Buckthorn Solar Drop Down Asset, as if the transfer had taken place at the beginning of the common control, which was November 9, 2016. The drop down is further described in Item 15 — Note 3, Business Acquisitions, to the Consolidated Financial Statements.
This historical data in the table below should be read in conjunction with the Consolidated Financial Statements and the related notes thereto in Item 15 and Item 7, Management's Discussion and Analysis of Financial Condition and Results of Operations.
| | | | Fiscal year ended December 31, | Fiscal year ended December 31, |
| (In millions) | 2018 | | 2017 | | 2016 | | 2015 | | 2014 | 2019 | | 2018 | | 2017 | | 2016 | | 2015 |
| Statement of Income Data: | | | | | | |
| Operating Revenues | | | | | | | | | | | | | | | | | | |
| Total operating revenues | $ | 1,053 |
| | $ | 1,009 |
| | $ | 1,035 |
| | $ | 968 |
| | $ | 844 |
| $ | 1,032 |
| | $ | 1,053 |
| | $ | 1,009 |
| | $ | 1,035 |
| | $ | 968 |
|
| Operating Costs and Expenses | | | | | | | | | | | | | | | | | | |
| Cost of operations | 332 |
| | 326 |
| | 308 |
| | 323 |
| | 279 |
| 342 |
| | 332 |
| | 326 |
| | 308 |
| | 323 |
|
| Depreciation and amortization | 331 |
| | 334 |
| | 303 |
| | 303 |
| | 240 |
| 396 |
| | 331 |
| | 334 |
| | 303 |
| | 303 |
|
| Impairment losses | — |
| | 44 |
| | 185 |
| | 1 |
| | — |
| 33 |
| | — |
| | 44 |
| | 185 |
| | 1 |
|
| General and administrative | 20 |
| | 19 |
| | 14 |
| | 10 |
| | 8 |
| 27 |
| | 20 |
| | 19 |
| | 14 |
| | 10 |
|
| Acquisition-related transaction and integration costs | 20 |
| | 3 |
| | 1 |
| | 3 |
| | 4 |
| |
| Transaction and integration costs | | 3 |
| | 20 |
| | 3 |
| | 1 |
| | 3 |
|
| Development costs | 3 |
| | — |
| | — |
| | — |
| | — |
| 5 |
| | 3 |
| | — |
| | — |
| | — |
|
| Total operating costs and expenses | 706 |
| | 726 |
|
| 811 |
|
| 640 |
|
| 531 |
| 806 |
| | 706 |
|
| 726 |
|
| 811 |
|
| 640 |
|
| Operating Income | 347 |
| | 283 |
|
| 224 |
|
| 328 |
|
| 313 |
| 226 |
| | 347 |
|
| 283 |
|
| 224 |
|
| 328 |
|
| Other Income (Expense) | | | | | | | | | | | | | | | | | | |
| Equity in earnings of unconsolidated affiliates | 74 |
| | 71 |
| | 60 |
| | 31 |
| | 22 |
| 83 |
| | 74 |
| | 71 |
| | 60 |
| | 31 |
|
| Other income, net | 8 |
| | 4 |
| | 3 |
| | 3 |
| | 6 |
| 9 |
| | 8 |
| | 4 |
| | 3 |
| | 3 |
|
| Loss on debt extinguishment | (7 | ) | | (3 | ) | | — |
| | (9 | ) | | (1 | ) | (16 | ) | | — |
| | (3 | ) | | — |
| | (9 | ) |
| Interest expense | (294 | ) | | (294 | ) | | (272 | ) | | (258 | ) | | (217 | ) | |
| Interest expense, net | | (403 | ) | | (294 | ) | | (294 | ) | | (272 | ) | | (258 | ) |
| Total other expense, net | (212 | ) | | (222 | ) | | (209 | ) | | (233 | ) | | (190 | ) | (327 | ) | | (212 | ) | | (222 | ) | | (209 | ) | | (233 | ) |
| Net Income | 135 |
| | 61 |
| | 15 |
| | $ | 95 |
| | $ | 123 |
| (101 | ) | | 135 |
| | 61 |
| | 15 |
| | 95 |
|
| Less: Net (loss) income attributable to noncontrolling interests | (105 | ) | | (75 | ) | | (111 | ) | | (62 | ) | | 9 |
| (71 | ) | | (105 | ) | | (75 | ) | | (111 | ) | | (62 | ) |
| Net Income Attributable to Clearway Energy LLC | $ | 240 |
| | $ | 136 |
| | $ | 126 |
| | $ | 157 |
| | $ | 114 |
| $ | (30 | ) | | $ | 240 |
| | $ | 136 |
| | $ | 126 |
| | $ | 157 |
|
| | | | | | | | | | | | | | | | | | | |
| Other Financial Data: | | | | | | | | | | | | | | | | | | |
| Capital expenditures | $ | 83 |
| | $ | 190 |
| | $ | 20 |
| | $ | 29 |
| | $ | 79 |
| $ | 228 |
| | $ | 83 |
| | $ | 190 |
| | $ | 20 |
| | $ | 29 |
|
| Cash Flow Data: | | | | | | | | | | | | | | | | | | |
| Net cash provided by (used in): | | | | | | | | | | | | | | | | | | |
| Operating activities | $ | 492 |
| | $ | 517 |
| | $ | 577 |
| | $ | 424 |
| | $ | 363 |
| $ | 469 |
| | $ | 492 |
| | $ | 517 |
| | $ | 577 |
| | $ | 424 |
|
| Investing activities | (185 | ) | | (442 | ) | | (131 | ) | | (1,098 | ) | | (760 | ) | (468 | ) | | (185 | ) | | (442 | ) | | (131 | ) | | (1,098 | ) |
| Financing activities | (38 | ) | | (258 | ) | | (202 | ) | | 354 |
| | 767 |
| (170 | ) | | (38 | ) | | (258 | ) | | (202 | ) | | 354 |
|
| Balance Sheet Data (at period end): | | | | | | | | | | | | | | | | | | |
| Cash and cash equivalents | $ | 407 |
| | $ | 146 |
| | $ | 321 |
| | $ | 110 |
| | $ | 430 |
| $ | 152 |
| | $ | 407 |
| | $ | 146 |
| | $ | 321 |
| | $ | 110 |
|
| Property, plant and equipment, net | 5,245 |
| | 5,410 |
| | 5,579 |
| | 5,980 |
| | 6,119 |
| 6,063 |
| | 5,245 |
| | 5,410 |
| | 5,579 |
| | 5,980 |
|
| Total assets | 8,448 |
| | 8,360 |
| | 8,772 |
| | 8,759 |
| | 8,930 |
| 9,605 |
| | 8,448 |
| | 8,360 |
| | 8,772 |
| | 8,759 |
|
| Long-term debt, including current maturities | 5,762 |
| | 6,006 |
| | 6,069 |
| | 5,692 |
| | 5,828 |
| 6,780 |
| | 5,977 |
| | 6,006 |
| | 6,069 |
| | 5,692 |
|
| Total liabilities | 6,266 |
| | 6,331 |
| | 6,384 |
| | 6,054 |
| | 6,173 |
| 7,432 |
| | 6,266 |
| | 6,331 |
| | 6,384 |
| | 6,054 |
|
| Total members' equity | 2,182 |
| | 2,029 |
| | 2,388 |
| | 2,705 |
| | 2,757 |
| 2,173 |
| | 2,182 |
| | 2,029 |
| | 2,388 |
| | 2,705 |
|
Item 7 — Management's Discussion and Analysis of Financial Condition and the Results of Operations
The following discussion analyzes the Company's historical financial condition and results of operations, which have been recast to include the Buckthorn Solar Drop Down Asset, as if the transfer had taken place at the beginning of the common control, which was November 9, 2016. As further discussed in Item 15 — Note 1, Nature of Business, to the Consolidated Financial Statements, the purchases of these assets were accounted for in accordance with ASC 805-50, Business Combinations - Related Issues, whereas the assets and liabilities transferred to the Company relate to interests under common control by NRG and, accordingly, were recorded at historical cost. The difference between the cash proceeds and historical value of the net assets was recorded as a distribution to/from NRG and offset to the noncontrolling interest on the Company's consolidated balance sheet. In accordance with GAAP, the Company prepares its consolidated financial statements to reflect the transfers as if they had taken place from the beginning of the financial statements period, or from the date the entities were under common control (if later than the beginning of the financial statements period).
As you read this discussion and analysis, refer to the Company's Consolidated Statements of Operations to this Form 10-K, which present the results of operations for the years ended December 31, 2018, 2017 and 2016.10-K. Also refer to Item 1 — Businessand Item 1A — Risk Factors, which include detailed discussions of various items impacting the Company's business, results of operations and financial condition. Discussions of the year ended December 31, 2017 that are not included in this Annual Report on Form 10-K and year-to-year comparisons of the year ended December 31, 2018 and the year ended December 31, 2017 can be found in “Management’s Discussion and Analysis of Financial Condition and the Results of Operations” in Part II, Item 7 of the Company’s Annual Report on Form 10-K for the year ended December 31, 2018.
The discussion and analysis below has been organized as follows:
Executive Summary, including a description of the business and significant events that are important to understanding the results of operations and financial condition;
Results of operations, including an explanation of significant differences between the periods in the specific line items of the consolidated statements of operations;
Financial condition addressing liquidity position, sources and uses of cash, capital resources and requirements, commitments, and off-balance sheet arrangements;
Known trends that may affect the Company’s results of operations and financial condition in the future; and
Critical accounting policies which are most important to both the portrayal of the Company's financial condition and results of operations, and which require management's most difficult, subjective or complex judgment.
Executive Summary
Introduction and Overview
Clearway Energy LLC, together with its consolidated subsidiaries, or the Company, is an energy infrastructure investor in and owner of modern, sustainable and long-term contracted assets across North America. The Company is sponsored by GIP through GIP's portfolio company, CEG.
The Company’s environmentally-sound asset portfolio includes over 5,2725,875 MW of wind, solar and natural gas-fired power generation facilities, as well as district energy systems. Nearly all of these assets sell substantially all of their output pursuant to long-term offtake agreements with creditworthy counterparties. The weighted average remaining contract duration of these offtake agreements was approximately 1513 years as of December 31, 20182019 based on CAFD. The Company also owns thermal infrastructure assets with an aggregate steam and chilled water capacity of 1,3851,530 net MWt and electric generation capacity of 133 139net MW. These thermal infrastructure assets provide steam, hot and/or chilled water, and, in some instances, electricity to commercial businesses, universities, hospitals and governmental units in multiple locations, principally through long-term contracts or pursuant to rates regulated by state utility commissions.
Significant Events
Pacific Gas and Electric Company Bankruptcy
On January 29, 2019, PG&E filed for reorganization under Chapter 11 of the U.S. Bankruptcy Code in the U.S. Bankruptcy Court for the Northern District of California. Certain subsidiaries of the Company, which hold interests in 6 solar facilities totaling 480 MW and Marsh Landing with capacity of 720 MW, sell the output of their facilities to PG&E under long-term PPAs. The Company consolidates three of the solar facilities and Marsh Landing, and records its interest in the other solar facilities as equity method investments. As of December 31, 2018,2019, the Company had $1.5$177 million in restricted cash, $1.4 billion of property, plant and equipment, net, $352$370 million in investments in unconsolidated affiliates and $1.4$1.2 billion of long - term debtborrowings with final maturity dates ranging from 2023 to 2038 related to these facilities. The related subsidiaries of the Company have entered intoare parties to financing agreements consisting of non-recourse project levelproject-level debt and, in certain cases, non-recourse holding company debt. The PG&E bankruptcy filing hasBankruptcy triggered defaults under the PPAs with PG&E and such related project-level financing agreements. TheAs a result, the Company recorded $1.2 billion of principal, net of the related unamortized debt issuance costs, as short-term debt as of December 31, 2019.
On September 9, 2019, PG&E filed a Chapter 11 plan of reorganization, or the PG&E Plan, which would provide for PG&E to assume all of its PPAs with the Company. On October 17, 2019, an ad hoc group of senior noteholders filed a competing plan of reorganization, which would also provide for PG&E to assume all of its PPAs with the Company.
On January 22, 2020, PG&E announced it had reached an agreement with a group of senior noteholders, and on January 31, 2020, the PG&E Plan was amended to provide for the eventual implementation of such settlement. On February 4, 2020, the Bankruptcy Court approved such settlement, and the noteholders have accordingly agreed to support the PG&E Plan. On February 5, 2020, the noteholders caused the ad hoc noteholder plan to be withdrawn. There are many conditions that must be satisfied before the PG&E Plan and assumption of the PPAs can become effective, including but not limited to approvals by various classes of creditors, the Bankruptcy Court, and the CPUC. A hearing before the Bankruptcy Court to consider whether the PG&E Plan will be approved and confirmed is currently negotiatingexpected to occur on May 27, 2020.
As of March 2, 2020, the Company's contracts with PG&E have operated in the normal course and the Company currently expects these contracts to continue as such. As of March 2, 2020, the Company has entered into forbearance agreements withfor certain project-level financing arrangements and continues to seek forbearance agreements for its other project-level financing arrangements affected by the lenders for each respective financing arrangement.PG&E Bankruptcy. The Company continues to assess the potential future impacts of the PG&E bankruptcy filingBankruptcy as events occur, however, no impact to the Company’s immediate operating activities has occurred as of December 31, 2018.occur.
Distribution ReductionJanuary 2020 Drop Down Offer
On February 12, 2019, and as a result of impacts related to the PG&E Bankruptcy, Clearway, Inc.'s Board of Directors declared a quarterly dividend on Class A and Class C common stock of $0.20 per share payable on March 15, 2019, to stockholders of record as of March 1, 2019. This dividend is reduced from the last quarterly dividend paid in December 2018 of $0.331 per share. A similar decrease was made to the Company's distributions to unitholders. The Company will continue to assess the level of the distribution pending developments in the PG&E bankruptcy, including the Company’s ability to receive unrestricted project distributions.
Forgoing Agua Caliente Drop Down
On November 1, 2018, NRGJanuary 8, 2020, CEG offered the Company the opportunity to acquire Agua Caliente Borrower 1and invest in a portfolio of the following projects: (i) 100% of the equity interests in Rattlesnake Flat, LLC, which owns the Rattlesnake Wind Project, a 35%144 net MW wind facility located in Adams County, WA; (ii) CEG's interest in Agua Caliente,Repowering Partnership II LLC (Repowering 1.0), would give the Company a 290100% equity interest in Repowering 1.0; and (iii) a new partnership with CEG to repower the Pinnacle Wind Project, a 55 net MW utility-scale solar projectwind facility located in Dateland, Arizona with PG&E asMineral County, WV. The Company expects to sign binding agreements for the project’s customer. Pursuantdrop down offer in the first half of 2020 though these agreements remain subject to negotiation and approval by the Company's Independent Directors.
CEG ROFO Agreement Amendment
| |
| • | On August 1, 2019, the CEG ROFO Agreement was amended to grant the Company a right of first offer for four additional projects:Rattlesnake, a 144 net MW wind facility located in Adams County, WA with an expected COD in 2020; Repowering 2.0, which will consist of membership interests in one or more partnerships formed to repower certain wind assets owned by the Company using turbines provided by CEG; Black Rock, a 110 MW utility scale wind facility located in West Virginia with an expected COD in 2021; and Wildflower, a 100 MW utility scale solar facility located in Mississippi with an expected COD in 2022. Both Rattlesnake and the Pinnacle repowering were part of January 2020 Drop Down Offer described above. |
Carlsbad Drop Down
| |
| • | On December 6, 2019, the Company acquired 100% of GIP's membership interests in CBAD Holdings, LLC, which indirectly owns Carlsbad Energy Center LLC, a 527 megawatt natural gas fired power project located in Carlsbad, California, or the Carlsbad Drop Down Asset. The purchase price for the Carlsbad Drop Down was $184 million in cash, plus assumption of $803 million in project level financing including non-recourse senior secured notes described below. The acquisition was funded with proceeds from the Clearway Energy, Inc. equity issuance, as described further below, as well as borrowings from the Company's revolving credit facility. The Carlsbad acquisition is the result of the Company having elected its option to purchase Carlsbad pursuant to the ROFO agreement, as amended, by and among the Company, CEG and GIP. For further discussion, see Item 15 — Note 3, Acquisitions and Dispositions. |
Sale of HSD Solar Holdings, LLC Assets
On October 8, 2019, the Company, through HSD Solar Holdings, LLC, or HSD, sold 100% of its interests in certain distributed generation solar facilities totaling 6 MW to the termsofftaker under the PPA, for cash consideration of $20 million, as a result of the NRG ROFO Agreement,offtaker exercising its right to purchase the project pursuant to the PPA. In conjunction with the sale, the Company elected to forgorepaid in full the acquisition.non-recourse lease financing associated with the HSD projects. The Company continues to own a 16% interest in the project through Agua Caliente Borrower 2 LLC.repaid amount was net of cash released at closing and totaled $23 million.
CarlsbadRepowering Transaction
| |
| • | On June 14, 2019, the Company, through an indirect subsidiary, entered into binding equity commitment agreements in the previously announced partnership with CEG to enable the repowering of two of its existing wind assets, Wildorado and Elbow Creek, which total a combined 283 MW. The Company invested $102 million in net corporate capital to fund the repowering of the wind facilities during the fourth quarter of 2019 and the first quarter of 2020. These repowered assets have reached COD. For further discussion, see Item 15 — Note 5, Investments Accounted for by the Equity Method and Variable Interest Entities. |
Hawaii Solar Partnerships
| |
| • | Kawailoa Solar Partnership — On May 1, 2019, the Company entered into a partnership with Clearway Renew LLC, a subsidiary of CEG, to own, finance, operate, and maintain the Kawailoa Solar Partnership, which consists of the Kawailoa Solar project, a 49 MW utility-scale solar generation project located in Oahu, Hawaii. The Company contributed $9 million into the partnership during the year ended December 31, 2019. For further discussion, see Item 15 — Note 5, Investments Accounted for by the Equity Method and Variable Interest Entities. |
| |
| • | Oahu Solar Partnership — On March 8, 2019, the Company entered into a partnership with Clearway Renew LLC, a subsidiary of CEG, to own, finance, operate, and maintain the Oahu Solar projects, which consist of Lanikuhana and Waipio, 15 MW and 46 MW utility-scale solar generation projects, respectively, located in Oahu, Hawaii, which both reached COD in September 2019 and began to sell power to HECO pursuant to the long-term PPAs. The Company contributed $20 million into the partnership during the year ended December 31, 2019. For further discussion, see Item 15 — Note 5, Investments Accounted for by the Equity Method and Variable Interest Entities. |
Corporate-Level Financing and Equity BackstopActivities
On February 6, 2018,December 20, 2019, the Company entered into the Fifth Amendment to Amended and Restated Credit Agreement to provide for an agreement with NRG to purchase 100%increase of the membership interests in Carlsbad Energy Holdings LLC, which indirectly owns the Carlsbad project, a 527 MW natural gas fired project in Carlsbad, CA, pursuant0.50x to the NRG ROFO Agreement. Followingborrower leverage ratio, as defined in the COD of the project in December 2018, the Company elected to utilize the Carlsbad backstop facility provided by GIP; as such, GIP purchased 100% of the membership interest in Carlsbad Energy Holdings LLC on February 27, 2019. The purchase priceAmended and Restated Credit Agreement, for the transaction was $387 million in cash consideration, exclusivelast two fiscal quarters of working capital2020 and to implement certain other adjustments, as well as the assumption of non-recourse debt of $601 million at completion. The Company maintains the option to purchase Carlsbad from GIP at any time within 18 months after February 27, 2019 at the same economic terms at which it originally agreed to purchase the asset from NRG. Should the Company not acquire Carlsbad during such 18 months, the project will become a CEG ROFO Asset.
Strategic Sponsorship with GIPtechnical modifications.
On August 31, 2018, NRG transferred its full ownership interest in the Company to CEG, the holder of NRG's renewable energy development and operations platform, and subsequently sold 100% of its interest in CEG to an affiliate of GIP. As a result of the GIP Transaction, GIP indirectly acquired a 45.2% economic interest inDecember 11, 2019, Clearway Energy Operating LLC and a 55% voting interest incompleted the Company assale of August 31, 2018.
Drop Down Asset Acquisitions
On August 31, 2018, the Company entered into a binding agreement with CEG to acquire the effective equity interest in 80 MW of utility-scale solar projects located in Kawailoa and Oahu, Hawaii for approximately $28 million in cash consideration, subject to customary working capital and other adjustments, as well as the assumption of non-recourse debt of $169 million. The transaction is expected to close in summer of 2019.
On March 30, 2018, the Company acquired 100% of NRG’s interests in Buckthorn Renewables, LLC, or Buckthorn Solar, which owned a 154 MW utility-scale solar generation project for cash consideration of $42 million, plus assumed non-recourse debt of approximately $132 million as of September 30, 2018. The Buckthorn Solar project sells power under a 25-year power purchase agreement to the City of Georgetown, Texas. On July 1, 2018, the project achieved commercial operation.
Financing and Equity Activities
On April 30, 2018, the Company closed on the refinancing of the revolving credit facility, which extended the maturity of the facility to April 28, 2023 and decreased the Company's overall cost of borrowing. The facility will continue to be used for general corporate purposes including financing of future acquisitions and posting letters of credit.
On September 10, 2018, pursuant to the terms of the 2019 Convertible Notes and the 2020 Convertible Notes indentures, the Company delivered to the holders of the Convertible Notes a fundamental change notice and offer to repurchase any and all of the 2019 Convertible Notes and 2020 Convertible Notes for cash at a price equal to 100% of the principal amount of the Convertible Notes plus any accrued and unpaid interest. An aggregate principal amount of $109 million of the 2019 Convertible Notes and $243 million of the 2020 Convertible Notes were tendered on or prior to the expiration date of October 10, 2018 and accepted by the Company for purchase. After the expiration of the tender offer, $220$600 million aggregate principal amount of the 2019 Convertible Notes and $45 million aggregate principal amount of the 2020 Convertible Notes remained outstanding as of December 31, 2018.
In August 2018 and January 2019, the Company completed a series of open market repurchases of 2019 Convertible Notes in aggregate principal amount of $66 million. The repurchases were funded through a partial repayment of the intercompany note between Clearway Energy Operating LLC and Clearway Energy, Inc. which was reduced by $66 million. During the first quarter of 2019, the Company paid off the remaining balance of aggregate principal amount of $220 million, which was funded through the payment of the remaining balance of the intercompany note due 2019 between Clearway Energy Operating LLC and Clearway Energy, Inc.
On October 9, 2018, the Company received a notice of conversion with respect to $395,000 aggregate principal amount of the 2020 Convertible Notes. The Company elected, pursuant to the terms of the 2020 Convertible Notes indenture, to settle the conversion of such 2020 Convertible Notes in Class C common stock, par value $0.01 per share. The conversion of the 2020 Convertible Notes resulted in the issuance by the Company on October 12, 2018 of 14,363 shares of Class C common stock.
On September 27, 2018, Clearway Energy, Inc. issued and sold an additional 3,916,449 shares of Class C common stock for net proceeds of $75 million. The Company utilized the proceeds of the offering to acquire additional 3,916,449 Class C units of Clearway Energy LLC.
On October 1, 2018, Clearway Energy Operating LLC issued $600 million of senior unsecured notes due 2028, or the 20252028 Senior Notes. The 20252028 Senior Notes bear interest at 5.750%4.75% and mature on OctoberMarch 15, 2025.2028. Interest on the notes2028 Senior Notes is payable semi-annually on AprilMarch 15 and OctoberSeptember 15 of each
year, and interest payments will commence on AprilSeptember 15, 2019.2020. The 20252028 Senior Notes are unsecured obligations of Clearway Energy Operating LLC and are guaranteed by Clearway Energy LLC and by certain of Clearway Energy Operating LLC's wholly owned current and future subsidiaries. The proceeds from the 2028 Senior Notes were used to partially fund investments into Repowering 1.0, repay the 2024 Senior Notes as described below, and pay transaction fees and expenses.
| |
| • | On December 13, 2019, the Company repurchased an aggregate principal amount of $412 million or 82.4%, of the 2024 Senior Notes that were validly tendered and not validly withdrawn as part of the previously announced cash tender offer. Concurrently with the launch of the tender offer, the Company exercised its right to optionally redeem any 2024 Senior Notes not validly tendered and purchased in the tender offer, pursuant to the terms of the indenture governing the 2024 Senior Notes. This redemption of the remaining $88 million of outstanding 2024 Senior Notes occurred on January 3, 2020. For further discussion, see Item 15 —Note 10, Long-term Debt. |
On December 2, 2019, Clearway, Inc. issued and sold 5,405,405 shares of Class C common stock for net proceeds of $100 million. Clearway, Inc. utilized the proceeds of the offering to acquire 5,405,405 Class C units of Clearway Energy LLC, which used the proceeds to partially fund the acquisition of the Carlsbad Drop Down Asset to pay transaction fees and for general corporate purposes.
In January 2019, Clearway, Inc. repurchased an aggregate principal amount of $50 million of the 2019 Convertible Notes in open market transactions. The repurchases were funded through a partial repayment of the intercompany note between Clearway Operating LLC and Clearway Energy, Inc. The 2019 Convertible Notes matured on February 1, 2019 and the Company paid off the remaining balance of an aggregate principal amount of $170 million.
Project-Level Financing Activities
On November 4, 2019, Carlsbad Energy Holdings LLC, a subsidiary of GIP and the owner of the Carlsbad Energy Center LLC, issued $216 million of senior secured, non-recourse notes. The notes bear an interest rate of 4.21% and are fully amortizing over 19 years.
On October 21, 2019, the Company, through Agua Caliente Borrower 2 LLC, repaid $40 million of the outstanding notes balance, including accrued interest and premiums, issued under the Agua Caliente Holdco Financing Agreement. The repayment was funded with the Company's existing liquidity.
On April 29, 2019, the Company, through Tapestry Wind LLC, refinanced $147 million of non-recourse debt due 2021 by issuing $164 million of new non-recourse financing due 2031 at an interest rate of LIBOR plus 1.375%. As a result of this refinancing, the Company received $11 million, net of fees and financing costs.
Thermal Activities
| |
| • | On September 29, 2019, the Company entered into a tolling agreement with Cayo Largo LLC to supply electricity, chilled water, hot water and natural gas to Cayo Largo LLC's customer through a dedicated combined heat and power facility to be constructed by the Company. The Company anticipates the project to total $13 million in capital expenditures and is expected to commence commercial operations in the fourth quarter of 2020. The Company incurred $6 million of capital expenditures during the year ended December 31, 2019. |
| |
| • | On September 5, 2019, the Company entered into a purchase and sale agreement with DB Energy Assets, LLC to sell 100% of its interests in Energy Center Dover LLC and Energy Center Smyrna LLC. The transaction is subject to standard regulatory approvals and the completion of certain maintenance activities. The related assets and liabilities are recorded as held for sale as of December 31, 2019. The Company recorded an impairment loss of $19 million related to the project during the second quarter of 2019 and recorded the related assets and liabilities as held for sale as of December 31, 2019. |
| |
| • | The Company is party to an Energy Services Agreement with Mylan LLC to supply chilled water, hot water and electricity through a dedicated combined heat and power facility located at Mylan's Caguas, Puerto Rico facility. The Company incurred $4 million and $7 million in capital expenditures during the years ended December 31, 2019 and December 31, 2018, respectively. The project reached COD in the first quarter of 2020. |
| |
| • | On May 1, 2019, the Company, through its indirect subsidiary ECP Uptown Campus LLC, acquired the Duquesne University district energy system, totaling 82 combined MWt, located in Pittsburgh, Pennsylvania. The total investment for the project is approximately $107 million. This includes $100 million related to the purchase of district energy assets, which was funded through a combination of issuance of non-recourse debt in the amount of $95 million, as well as cash on hand. For further discussion see Item 15 — Note 3, Acquisitions and Dispositions, and Note 10, Long-term Debt. As part of the acquisition, Duquesne University entered into a 40-year Energy Services Agreement through which ECP Uptown Campus LLC will fulfill the university’s electricity, chilled water and steam requirements in exchange for monthly capacity payments. |
Black Start Services at Marsh Landing
On December 1, 2017, the California Independent System Operator selected a proposal by the Company's Marsh Landing project to provide black start capability in the greater San Francisco Bay Area. The black start service would restart Marsh Landing in the event of a blackout to support the California Independent System Operator’s directed restoration of the electrical grid in response to an emergency condition. The Company has advanced the project and will provide additional details dependent on FERC approval rulings.
CVSR Outage
On June 5, 2019, a fire occurred at the California Valley Solar Ranch project, which affected approximately 1,200 acres of property. While the fire did not impact solar arrays, damage occurred to associated infrastructure including distribution poles and cabling. The facility was restored to full operations on July 1, 2019. The full year impact of the fire was approximately $8 million of lost revenue.
Environmental Matters and Regulatory Matters
Details of environmental matters and regulatory matters are presented in Item 1 — Business, Regulatory Matters and Item 1A— Risk Factors. Details of some of this information relate to costs that may impact the Company's financial results.
Trends or Matters Affecting Results of Operations and Future Business Performance
PG&E Bankruptcy
As discussed above, the Company continues to assess the potential future impacts of the PG&E Bankruptcy filing as events occur. However, no impact to the Company’s immediate operating activities has occurred as of December 31, 2019.
Wind and Solar Resource Availability
The availability of the wind and solar resources affects the financial performance of the wind and solar facilities, which may impact the Company’s overall financial performance. Due to the variable nature of the wind and solar resources, the Company cannot predict the availability of the wind and solar resources and the potential variances from expected performance levels from quarter to quarter. To the extent the wind and solar resources are not available at expected levels, it could have a negative impact on the Company’s financial performance for such periods.
Capital Market Conditions
The capital markets in general are often subject to volatility that is unrelated to the operating performance of particular companies. The Company’s growth strategy depends on its ability to identify and acquire additional renewable facilities from CEG and additional conventional and renewable facilities from unaffiliated third parties, which will require access to debt and equity financing to complete such acquisitions or replenish capital for future acquisitions. Any broad market fluctuations may affect the Company’s ability to access such capital through debt or equity financings.
Consolidated Results of Operations
The following table provides selected financial information: |
| | | | | | | | | | | |
| | Year ended December 31, |
| (In millions) | 2019 | | 2018 | | 2017 |
| Operating Revenues | | | | | |
| Energy and capacity revenues | $ | 1,072 |
| | $ | 1,084 |
| | $ | 1,038 |
|
| Other revenues | 40 |
| | 39 |
| | 40 |
|
| Contract amortization | (71 | ) | | (70 | ) | | (69 | ) |
| Mark-to-market for economic hedges | (9 | ) | | — |
| | — |
|
| Total operating revenues | 1,032 |
| | 1,053 |
| | 1,009 |
|
| Operating Costs and Expenses | | | | | |
| Cost of fuels | 74 |
| | 74 |
| | 63 |
|
| Operations and maintenance | 196 |
| | 189 |
| | 197 |
|
| Other costs of operations | 72 |
| | 69 |
| | 66 |
|
| Depreciation and amortization | 396 |
| | 331 |
| | 334 |
|
| Impairment losses | 33 |
| | — |
| | 44 |
|
| General and administrative | 27 |
| | 20 |
| | 19 |
|
| Transaction and integration costs | 3 |
| | 20 |
| | 3 |
|
| Development costs | 5 |
| | 3 |
| | — |
|
| Total operating costs and expenses | 806 |
| | 706 |
| | 726 |
|
| Operating Income | 226 |
| | 347 |
| | 283 |
|
| Other Income (Expense) | | | | | |
| Equity in earnings of unconsolidated affiliates | 83 |
| | 74 |
| | 71 |
|
| Other income, net | 9 |
| | 8 |
| | 4 |
|
| Loss on debt extinguishment | (16 | ) | | — |
| | (3 | ) |
| Interest expense, net | (403 | ) | | (294 | ) | | (294 | ) |
| Total other expense, net | (327 | ) | | (212 | ) | | (222 | ) |
| Net (Loss) Income | (101 | ) | | 135 |
| | 61 |
|
| Less: Net loss attributable to noncontrolling interests | (71 | ) | | (105 | ) | | (75 | ) |
| Net (Loss) Income Attributable to Clearway Energy LLC | $ | (30 | ) | | $ | 240 |
| | $ | 136 |
|
|
| | | | | | | | |
| | Year ended December 31, |
| Business metrics: | 2019 | | 2018 | | 2017 |
Renewables MWh generated/sold (in thousands) (a) | 6,584 |
| | 7,197 |
| | 6,844 |
|
| Thermal MWt sold (in thousands) | 2,153 |
| | 2,042 |
| | 1,926 |
|
Thermal MWh sold (in thousands) (c) | 176 |
| | 48 |
| | 35 |
|
Conventional MWh generated (in thousands) (a)(b) | 1,095 |
| | 1,656 |
| | 1,809 |
|
| Conventional equivalent availability factor | 94.9 | % | | 94.3 | % | | 93.9 | % |
(a) Volumes do not include the MWh generated/sold by the Company's equity method investments.
(b) Volumes generated are not sold as the Conventional facilities sell capacity rather than energy.
(c) MWh sold do not include 108 MWh generated by Dover, a subsidiary of the Company, under the PPA with NRG Power Marketing during the year ended December 31, 2018.
Management’s discussion of the results of operations for the years ended December 31, 2019 and 2018
Gross Margin
The Company calculates gross margin in order to evaluate operating performance as operating revenues less cost of sales, which includes cost of fuel, contract and emission credit amortization and mark-to-market for economic hedging activities.
Economic Gross Margin
In addition to gross margin, the Company evaluates its operating performance using the measure of Economic Gross Margin, which is not a GAAP measure and may not be comparable to other companies’ presentations or deemed more useful than the GAAP information provided elsewhere in this report. Economic Gross Margin should be viewed as a supplement to and not a substitute for the Company's presentation of gross margin, which is the most directly comparable GAAP measure. Economic Gross Margin is not intended to represent gross margin. The Company believes that Economic Gross Margin is useful to investors as it is a key operational measure reviewed by the Company's chief operating decision maker. Economic Gross Margin is defined as energy and capacity revenue, plus other revenues, less cost of fuels. Economic Gross Margin excludes the following components from GAAP gross margin: contract amortization, mark-to-market results, emissions credit amortization and (losses) gains on economic hedging activities. Mark-to-market results consist of unrealized gains and losses on contracts that are not yet settled.
The below tables present the composition of gross margin, as well as the reconciliation to economic gross margin for the years ended December 31, 2019 and 2018:
|
| | | | | | | | | | | | | | | |
| | Conventional | | Renewables | | Thermal | | Total |
| (In millions) | | | | | | | |
| Year ended December 31, 2019 | | | | | | | |
| Energy and capacity revenues | $ | 353 |
| | $ | 545 |
| | $ | 174 |
| | $ | 1,072 |
|
| Other revenues | — |
| | 10 |
| | 30 |
| | 40 |
|
| Cost of fuels | (2 | ) | | — |
| | (72 | ) | | (74 | ) |
| Contract amortization | (7 | ) | | (61 | ) | | (3 | ) | | (71 | ) |
| Mark-to-market for economic hedges | — |
| | (9 | ) | | — |
| | (9 | ) |
| Gross margin | 344 |
| | 485 |
| | 129 |
| | 958 |
|
| Contract amortization | 7 |
| | 61 |
| | 3 |
| | 71 |
|
| Mark-to-market economic hedging activities | — |
| | 9 |
| | — |
| | 9 |
|
| Economic gross margin | $ | 351 |
| | $ | 555 |
| | $ | 132 |
| | $ | 1,038 |
|
| |
|
| |
|
| |
|
| |
|
| Year ended December 31, 2018 | | | | | | |
|
| Energy and capacity revenues | $ | 342 |
| | $ | 572 |
| | $ | 170 |
| | $ | 1,084 |
|
| Other revenues | — |
| | 13 |
| | 26 |
| | 39 |
|
| Cost of fuels | (3 | ) | | — |
| | (71 | ) | | (74 | ) |
| Contract amortization | (5 | ) | | (62 | ) | | (3 | ) | | (70 | ) |
| Gross margin | 334 |
| | 523 |
| | 122 |
| | 979 |
|
| Contract amortization | 5 |
| | 62 |
| | 3 |
| | 70 |
|
| Economic gross margin | $ | 339 |
| | $ | 585 |
| | $ | 125 |
| | $ | 1,049 |
|
Gross margin decreased by $21 million during the year ended December 31, 2019, compared to the same period in 2018, primarily due to:
|
| | | | | | |
| Segment | | (Decrease) Increase | | Reason for (Decrease) Increase |
| (In millions) | | | | |
| Renewables: | | $ | (38 | ) | | Primarily driven by a decrease of $28 million related to unfavorable wind and solar resources across the portfolio, an $8 million decrease at CVSR related to the June 2019 outage and $9 million in mark-to-market loss on the Elbow Creek forward power sale contract entered into during the first quarter of 2019. This decrease was partially offset by $7 million of revenue generated at the Buckthorn Solar project which reached COD in July 2018. |
| Conventional: | | 10 |
| | Increase of $8 million due to the Carlsbad Energy Center acquisition on December 5, 2019 as well as $2 million primarily due to lower outages in 2019 compared to 2018. |
| Thermal | | 7 |
| | Increase of $5 million due to the acquisition of Duquesne University District Energy System on May 1, 2019, as well as $2 million related to the UPMC Thermal Project, which was completed in the second quarter of 2018. |
| | $ | (21 | ) | | |
Operations and Maintenance Expense
Operations and maintenance expense increased by $7 million during the year ended December 31, 2019 compared to the same period in 2018, primarily driven by higher insurance claims, which lowered expense in 2018, as well higher operations and maintenance costs in the Renewables segment in connection with fire damages at CVSR.
Other Costs of Operations
Other costs of operations increased by $3 million primarily due to higher insurance costs across the segments, as well as ARO accretion due to certain Renewables projects, which reached COD in 2019.
Depreciation and Amortization
Depreciation and amortization expense increased by $65 million during the year ended December 31, 2019, compared to 2018, primarily due to accelerated depreciation at the Wildorado Wind and Elbow Creek projects in connection with the repowering activities, which resulted in an additional $54 million of depreciation expense. The remaining increase in depreciation expense is due to several projects in the Renewables segment reaching COD throughout 2018 and 2019, as well as increased acquisition activity in the Thermal and Conventional segments in 2019, as further described in Item 15 — Note 3, Acquisitions and Dispositions.
Impairment Losses
The Company recorded impairment losses of $33 million for the year ended December 31, 2019, of which $19 million relates to a project within Thermal segment and was recorded in connection with the Company entering into a purchase and sale agreement with DB Energy Assets, LLC on September 9, 2019, as further described in Item 15 — Note 3, Acquisitions and Dispositions. The Company also recorded an impairment loss of $14 million related to several wind projects from the Renewables segment, as further described in Item 15 — Note 9, Asset Impairments.
General and Administrative Expenses
General and administrative expenses increased by $7 million for the year ended December 31, 2019 compared to the same period in 2018 due to increase in headcount, primarily in the Corporate and Thermal segments, resulting from the separation from NRG due to the GIP Transaction.
Transaction and Integration Costs
Transaction and integration related costs of $3 million during the year ended December 31, 2019, reflect costs incurred by the Company under the TSA with NRG, as further described in Item 15 — Note 1, Nature of Business, as well as fees paid in connection with the acquisitions that took place in 2019. Transaction and integration costs of $20 million during the year ended December 31, 2018, reflect fees paid to advisors and other costs associated with the GIP Transaction, as well as fees paid in connection with the acquisitions that took place in 2018.
Development Costs
Development costs increased by $2 million during the year ended December 31, 2019 primarily due to higher business development activity within the Thermal segment.
Equity in Earnings of Unconsolidated Affiliates
Equity in earnings of unconsolidated affiliates increased by $9 million during the year ended December 31, 2019 compared to the same period in 2018, primarily due to higher income allocated to RPV Holdco in 2019 compared to 2018, partially offset by higher losses at Desert Sunlight, DGPV Holdco entities, as well as GenConn and Avenal.
Loss on Debt Extinguishment
The Company recorded loss on debt extinguishment of $16 million for the year ended December 31, 2019, $15 million of which relates to the redemption of the 2024 Senior Notes. On December 13, 2019, the Company repurchased an aggregate principal amount of $412 million, or 82.4% of the 2024 Senior Notes, which was effectuated at a premium of 103% for a total consideration of $424 million and as a result, the Company recorded a loss on extinguishment in the amount of $12 million. In addition, the Company recorded a $3 million debt extinguishment loss in connection with the write off of the deferred financing fees related to the 2024 Senior Notes.
Interest Expense
Interest expense increased by $109 million during the year ended December 31, 2019, compared to the same period in 2018 primarily due to:
|
| | | | |
| Reason for Increase (Decrease) | | (In millions) |
| Change in fair value of interest rate swaps as well as reclassification of losses previously deferred in AOCI to the statement of operations in connection with project-level debt financing activities | | $ | 91 |
|
| Issuance of 2025 Senior Notes, partially offset by lower interest expense for the intercompany notes between Clearway Operating LLC and Clearway, Inc., which were partially repaid in connection with the tender offer in October 2018 | | 11 |
|
| Additional interest expense primarily from the issuance of Energy Center Minneapolis Series E, F, G, H Notes in June 2018 and in connection with acquisitions in the Thermal and Conventional segments, partially offset by lower interest expense due to lower principal balances of project level debt across the segments | | 7 |
|
| | | $ | 109 |
|
Net Loss Attributable to Noncontrolling Interests
For the year ended December 31, 2019, the Company had a net loss of $57 million attributable to noncontrolling interests with respect to its tax equity financing arrangements and the application of the HLBV method, as well as a net loss of $21 million attributable to CEG's economic interest in Repowering, Oahu and Kawailoa partnerships. The losses were partially offset by $7 million of income attributable to a third party's interest in Kawailoa partnership.
For the year ended December 31, 2018, the Company had a loss of $1 million attributable to CEG's economic interest in Repowering LLC and a loss of $104 million attributable to noncontrolling interests with respect to its tax equity financing arrangements and the application of the HLBV method.
Liquidity and Capital Resources
The Company's principal liquidity requirements are to meet its financial commitments, finance current operations, fund capital expenditures, including acquisitions from time to time, service debt and pay distributions. As a normal part of the Company's business, depending on market conditions, the Company will from time to time consider opportunities to repay, redeem, repurchase or refinance its indebtedness. Changes in the Company's operating plans, lower than anticipated sales, increased expenses, acquisitions or other events may cause the Company to seek additional debt or equity financing in future periods. There can be no guarantee that financing will be available on acceptable terms or at all. Debt financing, if available, could impose additional cash payment obligations and additional covenants and operating restrictions.
Current Liquidity Position
As of December 31, 2019 and 2018, the Company's liquidity was approximately $839 million and $1,037 million, respectively, comprised of cash, restricted cash and availability under the Company's revolving credit facility.
|
| | | | | | | |
| | As of December 31, |
| | 2019 | | 2018 |
| | (In millions) |
| Cash and cash equivalents: | | | |
| Clearway Energy LLC, excluding subsidiaries | $ | 27 |
| | $ | 298 |
|
| Subsidiaries | 125 |
| | 109 |
|
| Restricted cash: | | | |
| Operating accounts | 129 |
| | 84 |
|
| Reserves, including debt service, distributions, performance obligations and other reserves | 133 |
| | 92 |
|
| Total cash, cash equivalents and restricted cash | $ | 414 |
| | $ | 583 |
|
| Revolving credit facility availability | $ | 425 |
| | $ | 454 |
|
| Total liquidity | $ | 839 |
| | $ | 1,037 |
|
The Company's liquidity includes $262 million and $176 million of restricted cash balances as of December 31, 2019 and 2018, respectively. Restricted cash consists primarily of funds to satisfy the requirements of certain debt arrangements and funds held within the Company's projects that are restricted in their use.As of December 31, 2019, these restricted funds comprised of $129 million designated to fund operating expenses, approximately $24 million designated for current debt service payments, and $30 million restricted for reserves including debt service, performance obligations and other reserves, as well as capital expenditures. The remaining $79 million is held in distribution reserve accounts, of which $58 million related to subsidiaries affected by the PG&E Bankruptcy as discussed further below and may not be distributed during the pendency of the bankruptcy. Such subsidiaries had a total of $177 million in restricted cash as of December 31, 2019.
As of December 31, 2019, the Company had no borrowings under the revolving credit facility and $70 million of letters of credit were outstanding under the revolving credit facility. The Company had $170 million outstanding under the revolving credit facility and a total of $69 million in letters of credit outstanding as of February 24, 2020.
On January 29, 2019, PG&E filed for bankruptcy under Chapter 11 of the U.S. Bankruptcy Code. The PG&E Bankruptcy had no effect on availability under the Company’s revolving credit facility. However, the Company has non-recourse project-level debt related to each of its subsidiaries that sell their output to PG&E under long-term PPAs. The PG&E Bankruptcy filing is an event of default under the related financing agreements which caused uncertainty around the timing of when certain project-level cash distributions will be available to the Company. As of December 31, 2019, all project level cash balances for these subsidiaries were classified as restricted cash.
On December 20, 2019, each of Clearway Energy Operating LLC, as borrower, and Clearway Energy LLC, as guarantor, entered into the Fifth Amendment to Amended and Restated Credit Agreement to provide for an increase of 0.50x to the Borrower Leverage Ratio, as defined in the Amended and Restated Credit Agreement, for the last two fiscal quarters of 2020 and to implement certain other technical modifications.
Management believes that the Company's liquidity position, cash flows from operations and availability under its revolving credit facility will be adequate to meet the Company's financial commitments; debt service obligations; growth, operating and maintenance capital expenditures; and to fund distributions to Clearway, Inc. and Clearway Energy Group, LLC. Management continues to regularly monitor the Company's ability to finance the needs of its operating, financing and investing activity within the dictates of prudent balance sheet management.
Credit Ratings
Credit rating agencies rate a firm's public debt securities. These ratings are utilized by the debt markets in evaluating a firm's credit risk. Ratings influence the price paid to issue new debt securities by indicating to the market the Company's ability to pay principal, interest and preferred dividends. Rating agencies evaluate a firm's industry, cash flow, leverage, liquidity and hedge profile, among other factors, in their credit analysis of a firm's credit risk. As of December 31, 2019, the Company's 2024 Senior Notes, 2025 Senior Notes, 2026 Senior Notes, and 2028 Senior Notes are rated BB by S&P and Ba2 by Moody's.
Sources of Liquidity
The Company's principal sources of liquidity include cash on hand, cash generated from operations, proceeds from sales of assets, borrowings under new and existing financing arrangements and the issuance of additional equity and debt securities by Clearway, Inc. or the Company as appropriate given market conditions. As described in Item 15— Note 10, Long-term Debt, to the Consolidated Financial Statements, and above in Significant Events During the Year Ended December 31, 2019, the Company's financing arrangements consist of Clearway, Inc.'s equity offering of Class C common stock on September 27, 2018, corporate level debt, which includes Senior Notes, intercompany borrowings with Clearway, Inc., and the revolving credit facility; the ATM Program; and project-level financings for its various assets.
2028 Senior Notes — On December 11, 2019, Clearway Energy Operating LLC completed the sale of $600 million aggregate principal amount due 2028, or the 2028 Senior Notes. The 2028 Senior Notes bear interest at 4.75% and mature on March 15, 2028.The proceeds from the 2028 Senior Notes were used to partially fund investments into Repowering 1.0, repay the 2024 Senior Notes, and pay transaction fees and expenses.
2019 Equity Offering — On December 2, 2019, Clearway, Inc. issued and sold 5,405,405 shares of Class C common stock for net proceeds of $100 million. Clearway, Inc. utilized the proceeds of the offering to acquire 5,405,405 Class C units of Clearway Energy LLC.
Revolving Credit Facility — The Company has a total of $425 million available under the revolving credit facility as of December 31, 2019. The facility will continue to be used for general corporate purposes including financing of future acquisitions and posting letters of credit.
ATM Program — As of December 31, 2019, approximately $36 million of Clearway, Inc.'s Class C common stock remains available for issuance under the ATM Program.
Uses of Liquidity
The Company's requirements for liquidity and capital resources, other than for operating its facilities, are categorized as: (i) debt service obligations, as described more fully in Item 15 — Note 10, Long-term Debt to the Consolidated Financial Statements; (ii) capital expenditures; (iii) acquisitions and investments; and (iv) distributions.
Debt Service Obligations
Principal payments on debt as of December 31, 2019, are due in the following periods:
|
| | | | | | | | | | | | | | | | | | | | | | | | | | | |
| Description | 2020 | | 2021 | | 2022 | | 2023 | | 2024 | | There- after | | Total |
| | (In millions) |
| Long-term debt - affiliate, due 2020 | 44 |
| | — |
| | — |
| | — |
| | — |
| | — |
| | 44 |
|
| Clearway Energy Operating LLC Senior Notes, due 2024 | 88 |
| | — |
| | — |
| | — |
| | — |
| | — |
| | 88 |
|
| Clearway Energy Operating LLC Senior Notes, due 2025 | — |
| | — |
| | — |
| | — |
| | — |
| | 600 |
| | 600 |
|
| Clearway Energy Operating LLC Senior Notes, due 2026 | — |
| | — |
| | — |
| | — |
| | — |
| | 350 |
| | 350 |
|
| Clearway Energy Operating LLC Senior Notes, due 2028 | — |
| | — |
| | — |
| | — |
| | — |
| | 600 |
| | 600 |
|
| Total Corporate-level debt | 132 |
| | — |
| | — |
| | — |
| | — |
| | 1,550 |
| | 1,682 |
|
| Project-level debt: | | | | | | | | | | | | |
|
|
Alpine, due 2022 (a) | 119 |
| | — |
| | — |
| | — |
| | — |
| | — |
| | 119 |
|
| Alta Wind I - V lease financing arrangements, due 2034 and 2035 | 43 |
| | 45 |
| | 47 |
| | 49 |
| | 51 |
| | 609 |
| | 844 |
|
| Buckthorn Solar, due 2025 | 3 |
| | 3 |
| | 3 |
| | 3 |
| | 4 |
| | 113 |
| | 129 |
|
| Carlsbad Energy Holdings LLC, due 2027 | 19 |
| | 20 |
| | 21 |
| | 22 |
| | 23 |
| | 477 |
| | 582 |
|
| Carlsbad Holdco, due 2038 | 6 |
| | 6 |
| | 7 |
| | 2 |
| | 2 |
| | 193 |
| | 216 |
|
| CVSR, due 2037 (a) | 696 |
| | — |
| | — |
| | — |
| | — |
| | — |
| | 696 |
|
| CVSR Holdco Notes, due 2037 (a) | 182 |
| | — |
| | — |
| | — |
| | — |
| | — |
| | 182 |
|
| Duquesne, due 2059 | — |
| | — |
| | — |
| | — |
| | — |
| | 95 |
| | 95 |
|
| El Segundo Energy Center, due 2023 | 53 |
| | 57 |
| | 63 |
| | 130 |
| | — |
| | — |
| | 303 |
|
| Energy Center Minneapolis Series D, E, F, G, H Notes, due 2025-2037 | — |
| | — |
| | — |
| | — |
| | — |
| | 328 |
| | 328 |
|
Kansas South, due 2030 (a) | 24 |
| | — |
| | — |
| | — |
| | — |
| | — |
| | 24 |
|
| Kawailoa Solar Holdings LLC, due 2026 | 2 |
| | 2 |
| | 2 |
| | 2 |
| | 2 |
| | 72 |
| | 82 |
|
| Laredo Ridge, due 2028 | 6 |
| | 6 |
| | 7 |
| | 7 |
| | 9 |
| | 49 |
| | 84 |
|
Marsh Landing, due 2023 (a) | 206 |
| | — |
| | — |
| | — |
| | — |
| | — |
| | 206 |
|
| Oahu Solar Holdings LLC, due 2026 | 2 |
| | 3 |
| | 3 |
| | 3 |
| | 3 |
| | 77 |
| | 91 |
|
| Repowering Partnership Holdco LLC, due 2020 | 228 |
| | — |
| | — |
| | — |
| | — |
| | — |
| | 228 |
|
| South Trent Wind, due 2028 | 4 |
| | 4 |
| | 5 |
| | 5 |
| | 5 |
| | 20 |
| | 43 |
|
| Tapestry, due 2031 | 13 |
| | 10 |
| | 11 |
| | 11 |
| | 12 |
| | 99 |
| | 156 |
|
| Utah Solar Portfolio, due 2022 | 14 |
| | 13 |
| | 227 |
| | — |
| | — |
| | — |
| | 254 |
|
| Viento, due 2023 | 8 |
| | 5 |
| | 5 |
| | 24 |
| | — |
| | — |
| | 42 |
|
| Walnut Creek, due 2023 | 49 |
| | 53 |
| | 55 |
| | 18 |
| | — |
| | — |
| | 175 |
|
| Other | 22 |
| | 22 |
| | 22 |
| | 43 |
| | 18 |
| | 169 |
| | 296 |
|
| Total project-level debt | 1,699 |
| | 249 |
| | 478 |
| | 319 |
| | 129 |
| | 2,301 |
| | 5,175 |
|
| Total debt | $ | 1,831 |
| | $ | 249 |
| | $ | 478 |
| | $ | 319 |
| | $ | 129 |
| | $ | 3,851 |
| | $ | 6,857 |
|
(a) Entities affected by PG&E Bankruptcy. The PG&E Bankruptcy triggered defaults under the PPAs with PG&E and such related project-level financing agreements. As a result, the Company classified the affected project-level debt as short-term debt as of December 31, 2019.
Capital Expenditures
The Company's capital spending program is mainly focused on maintenance capital expenditures, consisting of costs to maintain the assets currently operating, such as costs to replace or refurbish assets during routine maintenance, and growth capital expenditures, consisting of costs to construct new assets, costs to complete the construction of assets where construction is in process, and capital expenditures related to acquiring additional thermal customers.
For the years ended December 31, 2019, 2018, and 2017, the Company used approximately $228 million, $83 million, and $190 million, respectively, to fund capital expenditures, includingmaintenance capital expenditures of $22 million,$36 million and $27 million, respectively. Growth capital expenditures in 2019 include $180 million in the Renewables segment, $157 million of which were incurred in connection with the Repowering Partnership entered by the Company in August 2018, as well as $29 million incurred in the Oahu Partnership and the Kawailoa Partnership, as further described in Item 15 — Note 5,Investments Accounted for by the Equity Method and Variable Interest Entities. The source for these capital expenditures was financing obtained in connection with the Repowering Partnership, as well as tax equity investors contributions. The Company also incurred $26 million of growth capital expenditures in the Thermal segment in connection with various development projects.
Growth capital expenditures in 2018 include $33 million in the Renewables segment in connection with the construction of Buckthorn Solar Drop Down Asset, of which $10 million was incurred by NRG during the construction of Buckthorn Solar prior to its acquisition by the Company on March 30, 2018, as described below.
Growth capital expenditures in 2017 primarily relate to $159 million incurred by NRG during the construction of Buckthorn Solar prior to its acquisition by the Company. The Company develops annual capital spending plans based on projected requirements for maintenance and growth capital.
The Company estimates $32 million of maintenance expenditures for 2020. These estimates are subject to continuing review and adjustment and actual capital expenditures may vary from these estimates.
Acquisitions and Investments
The Company intends to acquire generation assets developed and constructed by CEG, as well as generation and thermal infrastructure assets from third parties where the Company believes its knowledge of the market and operating expertise provides a competitive advantage, and to utilize such acquisitions as a means to grow its CAFD.
Carlsbad Drop Down — On December 6, 2019, the Company acquired 100% of GIP's membership interests in CBAD Holdings, LLC, which indirectly owns Carlsbad Energy Center LLC, a 527 megawatt natural gas fired power project located in Carlsbad, California, or the Carlsbad Drop Down Asset. The purchase price for the Carlsbad Drop Down was $184 million in cash, plus assumption of $803 million in project level financing including non-recourse senior notes. For further discussion, see Item 15 — Note 3 , Acquisitions and Dispositions.
Cayo Largo — On September 29, 2019, the Company entered into a tolling agreement with Cayo Largo LLC to supply electricity, chilled water, hot water and natural gas to Cayo Largo LLC's customer through a dedicated combined heat and power facility to be constructed by the Company. The Company incurred $6 million in capital expenditures during the year ended December 31, 2019. The Company anticipates the project to total $13 million in capital expenditures and is expected to commence commercial operations in the fourth quarter of 2020.
Mylan Pharmaceuticals— The Company is party to an Energy Services Agreement with Mylan LLC to supply chilled water, hot water and electricity through a dedicated combined heat and power facility constructed at Mylan's Caguas, Puerto Rico facility. The Company incurred $4 million and $7 million in capital expenditures during the years ended December 31, 2019 and December 31, 2018, respectively, and the project reached COD in the first quarter of 2020.
Repowering Partnership — On June 14, 2019, the Company, through an indirect subsidiary, entered into binding equity commitment agreements in the previously announced partnership with CEG to enable the repowering of two of its existing wind assets, Wildorado and Elbow Creek, which total a combined 283 MW. The Company invested $102 million in net corporate capital to fund the repowering of the wind facilities during the fourth quarter of 2019 and the first quarter of 2020. These assets have reached Repowering COD.
Kawailoa Solar Partnership — On May 1, 2019, the Company entered into a partnership with Clearway Renew LLC, a subsidiary of CEG, to own, finance, operate, and maintain the Kawailoa Solar Partnership, which consists of the Kawailoa Solar Project, a 49 MW utility-scale solar generation project located in Oahu, Hawaii. The Company contributed $9 million into the partnership during the year ended December 31, 2019. For further discussion, see Item 15 — Note 5, Investments Accounted for by the Equity Method and Variable Interest Entities.
Oahu Solar Partnership — On March 8, 2019, the Company entered into a partnership with Clearway Renew LLC, a subsidiary of CEG, to own, finance, operate, and maintain the Oahu Solar projects, which consist of Lanikuhana and Waipio, 15 MW and 46 MW utility-scale solar generation projects, respectively, located in Oahu, Hawaii, which reached COD on September 19, 2019 and began to sell power to HECO pursuant to the long-term PPAs. The Company contributed $20 million into the partnership during the year ended December 31, 2019. For further discussion, see Item 15 — Note 5, Investments Accounted for by the Equity Method and Variable Interest Entities
Duquesne University District Energy Facility — On May 1, 2019, the Company, through its indirect subsidiary ECP Uptown Campus LLC, acquired the Duquesne University district energy system, totaling 87 combined MWt, located in Pittsburgh, Pennsylvania. The total investment for the project is $107 million. As part of the acquisition, Duquesne University entered into a 40-year Energy Services Agreement through which ECP Uptown Campus LLC will fulfill the university’s electricity, chilled water and steam requirements in exchange for monthly capacity payments. For further discussion, see Item 15 — Note 3, Acquisitions and Dispositions.
Wind TE Holdco Buyout — On January 2, 2019, the Company bought out 100% of Class A membership interest from the TE Investor, for cash consideration of $19 million, as further described in Item 15 — Note 5, Investments Accounted for by the Equity Method and Variable Interest Entities.
Agua Caliente Borrower 2 Debt Repayment — OnOctober 21, 2019, the Company, through Agua Caliente Borrower 2 LLC, repaid $40 million of the outstanding notes balance, including accrued interest and premiums, issued under the Agua Caliente Holdco Financing Agreement. The repayment was funded with the Company's existing liquidity.
DG Investment Partnerships with CEG — During the year ended December 31, 2019, the Company invested approximately $14 million in the DG investment partnerships with CEG, bringing total capital invested to $256 million in these investment partnerships.
Senior Notes due 2024 Tender Offer— On December 13, 2019, the Company repurchased an aggregate principal amount of $412 million or 82.4%, of the 2024 Senior Notes as part of the previously cash tender offer announced on December 11, 2019. Concurrently with the launch of the tender offer, the Company exercised its right to optionally redeem any 2024 Senior Notes not validly tendered and purchased in the tender offer, pursuant to the terms of the indenture governing the 2024 Senior Notes. For further discussion, see Item 15 — Note 10, Long-term Debt.
Cash Distributions to Clearway, Inc. and CEG
The Company intends to distribute to its unit holders in the form of a quarterly distribution all of the CAFD that is generated each quarter less reserves for the prudent conduct of the business, including among others, maintenance capital expenditures to maintain the operating capacity of the assets. CAFD is defined as net income before interest expense, income taxes, depreciation and amortization, plus cash distributions from unconsolidated affiliates, adjustments to reflect CAFD generated by unconsolidated investments that are unable to distribute project dividends due to the PG&E Bankruptcy, cash receipts from notes receivable, less cash distributions to noncontrolling interests, maintenance capital expenditures, pro-rata EBITDA from unconsolidated affiliates, cash interest paid, income taxes paid, principal amortization of indebtedness, Walnut Creek investment payments, changes in prepaid and accrued capacity payments, and adjusted for development expenses. Distributions on units are subject to available capital, market conditions, and compliance with associated laws, regulations and other contractual obligations. The Company expects that, based on current circumstances, comparable distributions will continue to be paid in the foreseeable future. The Company will continue to evaluate its capital allocation approach during the pendency of the PG&E Bankruptcy.
The following table lists the distributions paid on the Company's Class A, Class B, Class C and Class D units during the year ended December 31, 2019:
|
| | | | | | | | | | | | | | | |
| | Fourth Quarter 2019 | | Third Quarter 2019 | | Second Quarter 2019 | | First Quarter 2019 |
| Distributions per Class A and Class B unit | $ | 0.20 |
| | $ | 0.20 |
| | $ | 0.20 |
| | $ | 0.20 |
|
| Distributions per Class C and Class D unit | $ | 0.20 |
| | $ | 0.20 |
| | $ | 0.20 |
| | $ | 0.20 |
|
On February 18, 2020, the Company declared a quarterly distribution on its Class A, Class B, Class C and Class D units of $0.21 per unit payable on March 16, 2020.
Cash Flow Discussion
Year Ended December 31, 2019 Compared to Year Ended December 31, 2018
The following table reflects the changes in cash flows for the year ended December 31, 2019, compared to 2018:
|
| | | | | | | | | | | |
| Year ended December 31, | 2019 | | 2018 | | Change |
| (In millions) | |
| Net cash provided by operating activities | $ | 469 |
| | $ | 492 |
| | $ | (23 | ) |
| Net cash used in investing activities | (468 | ) | | (185 | ) | | (283 | ) |
| Net cash used in financing activities | (170 | ) | | (38 | ) | | (132 | ) |
Net Cash Used In Operating Activities
|
| | | |
| Changes to net cash provided by operating activities were driven by: | (In millions) |
| Increase in working capital driven primarily by the timing of accounts receivable collections and payment of accounts payable | $ | 29 |
|
| Lower distribution from unconsolidated affiliates affected by the PG&E Bankruptcy, partially offset by higher distributions from the distributed generation investments | (36 | ) |
| Decrease in operating income adjusted for non-cash items in 2019 compared to 2018 | (16 | ) |
| | $ | (23 | ) |
Net Cash Used In Investing Activities
|
| | | |
| Changes to net cash used in investing activities were driven by: | (In millions) |
| Increase in growth capital expenditures in the Renewables segment driven primarily by the repowering activities at Elbow Creek and Wildorado, as well as the final construction costs for Oahu and Kawailoa, partially offset by lower growth capital expenditures for construction of the Buckthorn Solar project, which went COD in 2018 | $ | (145 | ) |
| Higher payments for Drop Down Asset acquisitions in 2019 compared to 2018, primarily driven by the acquisition of Carlsbad, as well as higher payments in 2019 for the Duquesne acquisition compared to the acquisition of UPMC and Central CA Fuel Cell in 2018 | (153 | ) |
| Increase in investments in unconsolidated affiliates during 2019, primarily for investments in DGPV Holdco 3 LLC | 32 |
|
| Proceeds from sale of HSD Solar Holdings, LLC assets in October of 2019 | 20 |
|
| Payment to buy-out the existing tax equity partner of Wind TE Holdco on January 1, 2019 | (19 | ) |
| Cash proceeds from network upgrades in 2018 | (13 | ) |
| Other | (5 | ) |
| | $ | (283 | ) |
Net Cash Used In Financing Activities
|
| | | |
| Changes in net cash used in financing activities were driven by: | (In millions) |
| Increase in corporate-level debt payments driven primarily by the repayment of the 2024 Senior Notes and Long-term debt - affiliate, due 2019 | $ | (269 | ) |
| Decrease in distributions paid to CEG and Clearway Energy, Inc. | 83 |
|
| Increase in net contributions from noncontrolling interests in 2019 compared to 2018 | 83 |
|
| Higher net payments under the revolving credit facility in 2018 compared to 2019 | 55 |
|
| Lower net proceeds from sale of Class B and D units in 2019 compared to net proceeds from sale of Class B and D units in 2018 | (53 | ) |
| Higher project-level debt amortization in 2019 compared to 2018 | (31 | ) |
| Lower debt proceeds in connection with the Duquesne University District Energy System acquisition in 2019 compared to the Thermal note purchase and private shelf agreement in 2018 | (25 | ) |
| Higher net borrowings in 2019 to fund construction of the repowering activities at Elbow Creek and Wildorado, offset by the repayment of a portion of the construction debt for the Oahu and Kawailoa projects upon reaching COD in September and November 2019, respectively | 25 |
|
| | $ | (132 | ) |
Off-Balance Sheet Arrangements
Obligations under Certain Guarantee Contracts
The Company may enter into guarantee arrangements in the normal course of business to facilitate commercial transactions with third parties.
Retained or Contingent Interests
The Company does not have any material retained or contingent interests in assets transferred to an unconsolidated entity.
Obligations Arising Out of a Variable Interest in an Unconsolidated Entity
Variable interest in equity investments — As of December 31, 2019, the Company has several investments with an ownership interest percentage of 50% or less in energy and energy-related entities that are accounted for under the equity method. DGPV Holdco 1 LLC, DGPV Holdco 2 LLC, DGPV Holdco 3 LLC, RPV Holdco 1 LLC and GenConn are variable interest entities for which the Company is not the primary beneficiary. The Company's pro-rata share of non-recourse debt held by unconsolidated affiliates was approximately $889 million as of December 31, 2019. The Company's pro-rata share of non-recourse debt held by unconsolidated affiliates as it related to the projects affected by PG&E bankruptcy was $411 million. This indebtedness may restrict the ability of these subsidiaries to issue dividends or distributions to the Company. See also Item 15 — Note 5, Investments Accounted for by the Equity Method and Variable Interest Entities, to the Consolidated Financial Statements.
Contractual Obligations and Commercial Commitments
The Company has a variety of contractual obligations and other commercial commitments that represent prospective cash requirements in addition to the Company's capital expenditure programs. The following table summarizes the Company's contractual obligations. See Item 15 — Note 10,Long-term Debt and Note 14, Commitments and Contingencies, to the Consolidated Financial Statements for additional discussion.
|
| | | | | | | | | | | | | | | | | | | | | | | |
| | By Remaining Maturity at December 31, |
| | 2019 | | 2018 |
| Contractual Cash Obligations | Under 1 Year | | 1-3 Years | | 3-5 Years | | Over 5 Years | | Total | | Total |
| | (In millions) |
| Long-term debt (including estimated interest) | $ | 2,129 |
| | $ | 1,235 |
| | $ | 866 |
| | $ | 4,791 |
| | $ | 9,021 |
| | $ | 8,127 |
|
| Operating leases | 16 |
| | 47 |
| | 47 |
| | 272 |
| | 382 |
| | 271 |
|
| Fuel purchase and transportation obligations | 9 |
| | 6 |
| | 6 |
| | 10 |
| | 31 |
| | 36 |
|
Other liabilities (a) | 34 |
| | 47 |
| | 33 |
| | 188 |
| | 302 |
| | 220 |
|
| Total | $ | 2,188 |
| | $ | 1,335 |
| | $ | 952 |
| | $ | 5,261 |
| | $ | 9,736 |
| | $ | 8,654 |
|
(a) Includes water right agreements, service and maintenance agreements, and LTSA commitments.
Fair Value of Derivative Instruments
The Company may enter into fuel purchase contracts and other energy-related financial instruments to mitigate variability in earnings due to fluctuations in spot market prices and to hedge fuel requirements at certain generation facilities. In addition, in order to mitigate interest rate risk associated with the issuance of variable rate debt, the Company enters into interest rate swap agreements.
The tables below disclose the activities of non-exchange traded contracts accounted for at fair value in accordance with ASC 820. Specifically, these tables disaggregate realized and unrealized changes in fair value; disaggregate estimated fair values at December 31, 2019, based on their level within the fair value hierarchy defined in ASC 820; and indicate the maturities of contracts at December 31, 2019. For a full discussion of the Company's valuation methodology of its contracts, see Derivative Fair Value Measurements in Item 15 — Note 6, Fair Value of Financial Instruments, to the Consolidated Financial Statements.
|
| | | |
| Derivative Activity (Losses)/Gains | (In millions) |
| Fair value of contracts as of December 31, 2018 | $ | (10 | ) |
| Contracts realized or otherwise settled during the period | 13 |
|
| Contracts acquired during the period | (19 | ) |
| Changes in fair value | (76 | ) |
| Fair value of contracts as of December 31, 2019 | $ | (92 | ) |
|
| | | | | | | | | | | | | | | | | | | |
| | Fair value of contracts as of December 31, 2019 |
| | Maturity |
| Fair Value Hierarchy (Losses)/Gains | 1 Year or Less | | Greater Than
1 Year to 3 Years | | Greater Than
3 Years to 5 Years | | Greater Than
5 Years | | Total Fair
Value |
| | (In millions) |
| Level 2 | (16 | ) | | (31 | ) | | (14 | ) | | (22 | ) | | (83 | ) |
| Level 3 | — |
| | — |
| | (5 | ) | | (4 | ) | | (9 | ) |
| Total | $ | (16 | ) | | $ | (31 | ) | | $ | (19 | ) | | $ | (26 | ) | | $ | (92 | ) |
The Company has elected to disclose derivative assets and liabilities on a trade-by-trade basis and does not offset amounts at the counterparty master agreement level. As discussed below in Quantitative and Qualitative Disclosures about Market Risk -Commodity Price Risk, the Company measures the sensitivity of the portfolio to potential changes in market prices using VaR, a statistical model which attempts to predict risk of loss based on market price and volatility. The Company's risk management policy places a limit on one-day holding period VaR, which limits the net open position.
Critical Accounting Policies and Estimates
The Company's discussion and analysis of the financial condition and results of operations are based upon the consolidated financial statements, which have been prepared in accordance with GAAP. The preparation of these financial statements and related disclosures in compliance with GAAP requires the application of appropriate technical accounting rules and guidance as well as the use of estimates and judgments that affect the reported amounts of assets, liabilities, revenues and expenses, and related disclosures of contingent assets and liabilities. The application of these policies necessarily involves judgments regarding future events, including the likelihood of success of particular projects, legal and regulatory challenges and the fair value of certain assets and liabilities. These judgments, in and of themselves, could materially affect the financial statements and disclosures based on varying assumptions, which may be appropriate to use. In addition, the financial and operating environment may also have a significant effect, not only on the operation of the business, but on the results reported through the application of accounting measures used in preparing the financial statements and related disclosures, even if the nature of the accounting policies has not changed.
On an ongoing basis, the Company evaluates these estimates, utilizing historic experience, consultation with experts and other methods the Company considers reasonable. Actual results may differ substantially from the Company's estimates. Any effects on the Company's business, financial position or results of operations resulting from revisions to these estimates are recorded in the period in which the information that gives rise to the revision becomes known.
The Company's significant accounting policies are summarized in Item 15 — Note 2, Summary of Significant Accounting Policies, to the Consolidated Financial Statements. The Company identifies its most critical accounting policies as those that are the most pervasive and important to the portrayal of the Company's financial position and results of operations, and that require the most difficult, subjective and/or complex judgments by management regarding estimates about matters that are inherently uncertain. The Company's critical accounting policies include impairment of long lived assets and other intangible assets.
|
| |
| Accounting Policy | Judgments/Uncertainties Affecting Application |
| |
| Impairment of Long Lived Assets | Recoverability of investments through future operations |
| Regulatory and political environments and requirements |
| Estimated useful lives of assets |
| Operational limitations and environmental obligations |
| Estimates of future cash flows |
| Estimates of fair value |
| Judgment about triggering events |
Evaluation of Assets for Impairment and Other-Than-Temporary Decline in Value
In accordance with ASC 360, Property, Plant, and Equipment, or ASC 360, property, plant and equipment and certain intangible assets are evaluated for impairment whenever indicators of impairment exist. Examples of such indicators or events are:
Significant decrease in the market price of a long-lived asset;
Significant adverse change in the manner an asset is being used or its physical condition;
Adverse business climate;
Accumulation of costs significantly in excess of the amount originally expected for the construction or acquisition of an asset;
Current-period loss combined with a history of losses or the projection of future losses; and
Change in the Company's intent about an asset from an intent to hold to a greater than 50% likelihood that an asset will be sold or disposed of before the end of its previously estimated useful life.
Recoverability of assets to be held and used is measured by a comparison of the carrying amount of the assets to the future net cash flows expected to be generated by the asset, through considering project specific assumptions for long-term energy pool prices, escalated future project operating costs and expected plant operations. If such assets are considered to be impaired, the impairment to be recognized is measured by the amount by which the carrying amount of the assets exceeds the fair value of the assets. The fair value may be determined by factoring in the probability weighting of different courses of action available to the Company as appropriate. Generally, fair value will be determined using valuation techniques such as the present value of expected future cash flows or comparable values determined by transactions in the market. The Company uses its best estimates in making these evaluations and considers various factors, including forward price curves for energy, fuel costs and operating costs. However, actual future market prices and project costs could vary from the assumptions used in the Company's estimates, and the impact of such variations could be material.
Annually, during the fourth quarter, the Company revises its views of energy prices, including the Company's fundamental view for long-term power prices, forecasted generation and operating and capital expenditures, in connection with the preparation of its annual budget.
The Company recorded certain long-lived asset impairments in 2019, as described below and in Item 15 — Note 9, Asset Impairments, to the Consolidated Financial Statements, with respect to several wind projects.
The Company recorded an impairment loss of $19 million related to a facility in the Thermal segment during the second quarter of 2019. The impairment was triggered by a potential sale negotiation with a third party which resulted in signing the purchase and sale agreement in September, as further described in Note 3, Acquisitions and Dispositions. The fair value of the facility was determined using an income approach by applying a discounted cash flow methodology to the long-term budgets for each respective plant. The income approach utilized estimates of discounted future cash flows, which were Level 3 fair value measurement and include key inputs, such as forecasted power prices, operations and maintenance expense, and discount rates. The Company measured the impairment loss as the difference between the carrying amount and the fair value of the assets.
Additionally, during the fourth quarter of 2019, as a result of the preparation and review of its annual budget and assessment of long-term merchant prices, the Company updated its estimated future cash flows and determined that the future cash flows for several wind projects from the Renewables segment no longer supported the recoverability of the related long-lived asset. As such, the Company recorded an impairment loss of $14 million to reflect the assets at fair market value. There were no other triggering events identified prior to the fourth quarter annual budget update for these asset groups. The fair value of the facilities was determined using an income approach by applying a discounted cash flow methodology to the long-term budgets for each respective plant. The income approach included key inputs such as forecasted merchant power prices, operations and maintenance expense, and discount rates. The resulting fair value is a Level 3 fair value measurement.
The Company is also required to evaluate its equity method investments to determine whether or not they are impaired. ASC 323, Investments - Equity Method and Joint Ventures, or ASC 323, provides the accounting requirements for these investments. The standard for determining whether an impairment must be recorded under ASC 323 is whether the value is considered to be an other-than-temporary decline in value. The evaluation and measurement of impairments under ASC 323 involves the same uncertainties as described for long-lived assets that the Company owns directly and accounts for in accordance with ASC 360. Similarly, the estimates that the Company makes with respect to its equity method investments are subjective, and the impact of variations in these estimates could be material. Additionally, if the projects in which the Company holds these investments recognize an impairment under the provisions of ASC 360, the Company would record its proportionate share of that impairment loss and would evaluate its investment for an other-than-temporary decline in value under ASC 323.
Certain of the Company’s projects have useful lives that extend well beyond the contract period and therefore, management’s view of long-term energy prices in the post-contract periods may have a significant impact on the expected future cash flows for these projects. Accordingly, if management lowers its view of long-term energy prices in certain markets it is possible that some of the Company’s other long-lived assets may be impaired.
As previously described, on January 29, 2019, PG&E filed for reorganization under Chapter 11 of the U.S. Bankruptcy Code. Certain subsidiaries of the Company sell the output of their facilities to PG&E under long-term PPAs, including interests in 6 solar facilities totaling 480 MW and Marsh Landing with capacity of 720 MW. The Company consolidates three of the solar facilities and Marsh Landing and records its interest in the other solar facilities as equity method investments. The Company has determined that it has no impairment of the long-lived assets or equity method investments associated with these subsidiaries. Assumptions utilized to test these assets for impairment may change based on future events related to the PG&E Bankruptcy, which could result in an impairment loss if the PPAs are rejected or amended, or if the Company is not able to collect its revenues from PG&E in a timely manner.
Recent Accounting Developments
See Item 15 — Note 2, Summary of Significant Accounting Policies, to the Consolidated Financial Statements for a discussion of recent accounting developments.
Item 7A — Quantitative and Qualitative Disclosures About Market Risk
The Company is exposed to several market risks in its normal business activities. Market risk is the potential loss that may result from market changes associated with the Company's power generation or with an existing or forecasted financial or commodity transaction. The types of market risks the Company is exposed to are commodity price risk, interest rate risk, liquidity risk, and credit risk.
Commodity Price Risk
Commodity price risks result from exposures to changes in spot prices, forward prices, volatilities, and correlations between various commodities, such as electricity, natural gas and emissions credits. The Company manages the commodity price risk of its merchant generation operations by entering into derivative or non-derivative instruments to hedge the variability in future cash flows from forecasted power sales or purchases of fuel. The portion of forecasted transactions hedged may vary based upon management's assessment of market, weather, operation and other factors. See Item 15 — Note 7, Accounting for Derivative Instruments and Hedging Activities, to the Consolidated Financial Statements for more information.
Based on a sensitivity analysis using simplified assumptions, the impact of a $0.50 per MMBtu decrease in natural gas prices across the term of the derivative contracts would cause no change to the net value of natural gas derivatives, and an increase of $0.50 MMBtu in natural gas prices across the term of the derivative contracts would cause an increase of approximately $3 million to the net value of natural gas derivatives as of December 31, 2019. The impact of a $0.50 per MWh increase or decrease in power prices across the term of the derivative contracts would cause a change of approximately $1 million to the net value of power derivatives as of December 31, 2019.
Interest Rate Risk
The Company is exposed to fluctuations in interest rates through its issuance of variable rate debt. Exposures to interest rate fluctuations may be mitigated by entering into derivative instruments known as interest rate swaps, caps, collars and put or call options. These contracts reduce exposure to interest rate volatility and result in primarily fixed rate debt obligations when taking into account the combination of the variable rate debt and the interest rate derivative instrument. See Item 15 — Note 7, Accounting for Derivative Instruments and Hedging Activities, to the Consolidated Financial Statements for more information.
Most of the Company's project subsidiaries enter into interest rate swaps, intended to hedge the risks associated with interest rates on non-recourse project level debt. See Item 15 — Note 10,Long-term Debt, to the Consolidated Financial Statements for more information about interest rate swaps of the Company's project subsidiaries.
If all of the above swaps had been discontinued on December 31, 2019, the Company would have owed the counterparties $84 million. Based on the credit ratings of the counterparties, the Company believes its exposure to credit risk due to nonperformance by counterparties to its hedge contracts to be insignificant.
The Company has long-term debt instruments that subject it to the risk of loss associated with movements in market interest rates. As of December 31, 2019, a 1% change in interest rates would result in an approximately $3 million change in interest expense on a rolling twelve-month basis.
As of December 31, 2019, the fair value of the Company's debt was $6,956 million and the carrying value was $6,857 million. The Company estimates that a 1% decrease in market interest rates would have increased the fair value of its long-term debt by $340 million.
Liquidity Risk
Liquidity risk arises from the general funding needs of the Company's activities and in the management of the Company's assets and liabilities.
Counterparty Credit Risk
Credit risk relates to the risk of loss resulting from non-performance or non-payment by counterparties pursuant to the terms of their contractual obligations. The Company monitors and manages credit risk through credit policies that include: (i) an established credit approval process, and (ii) the use of credit mitigation measures such as prepayment arrangements or volumetric limits. Risks surrounding counterparty performance and credit could ultimately impact the amount and timing of expected cash flows. The Company seeks to mitigate counterparty risk by having a diversified portfolio of counterparties. See Item 15 — Note 6, Fair Value of Financial Instruments, to the Consolidated Financial Statements for more information about concentration of credit risk.
As previously described, on January 29, 2019, PG&E filed for reorganization under Chapter 11 of the U.S. Bankruptcy Code. Certain subsidiaries of the Company sell the output of their facilities to PG&E under long-term PPAs, including interests in 6 solar facilities totaling 480 MW and Marsh Landing with capacity of 720 MW. The Company consolidates three of the solar facilities and Marsh Landing and records its interest in the other solar facilities as equity method investments. The Company had $5 million in accounts receivable due from PG&E, which relate to the pre-petition period and therefore were recorded in other non-current assets as of December 31, 2019.
Item 8 — Financial Statements and Supplementary Data
The financial statements and schedules are listed in Part IV, Item 15 of this Form 10-K.
Item 9 — Changes in and Disagreements with Accountants on Accounting and Financial Disclosure
None.
Item 9A — Controls and Procedures
Conclusion Regarding the Effectiveness of Disclosure Controls and Procedures and Internal Control Over Financial Reporting
Under the supervision and with the participation of the Company's management, including its principal executive officer, principal financial officer and principal accounting officer, the Company conducted an evaluation of the effectiveness of the design and operation of its disclosure controls and procedures, as such term is defined in Rules 13a-15(e) or 15d-15(e) of the Exchange Act. Based on this evaluation, the Company's principal executive officer, principal financial officer and principal accounting officer concluded that the disclosure controls and procedures were effective as of the end of the period covered by this Annual Report on Form 10-K.
Changes in Internal Control over Financial Reporting
In connection with the GIP Transaction, the Company entered into a TSA pursuant to which NRG Energy, Inc. provided information technology, systems, applications and business processes to the Company. A material portion of these processes terminated during the second quarter of 2019 and such services were subsequently provided by both the Company and by CEG pursuant to the CEG Master Services Agreements. There were no changes in the Company’s internal control over financial reporting (as such term is defined in Rule 13a-15(f) under the Exchange Act) during the quarter ended December 31, 2019, that materially affected, or are reasonably likely to materially affect, the Company’s internal control over financial reporting.
Inherent Limitations over Internal Controls
The Company's internal control over financial reporting is designed to provide reasonable assurance regarding the reliability of financial reporting and the preparation of consolidated financial statements for external purposes in accordance with GAAP. The Company's internal control over financial reporting includes those policies and procedures that:
1. Pertain to the maintenance of records that, in reasonable detail, accurately and fairly reflect the transactions and dispositions of the Company's assets;
2. Provide reasonable assurance that transactions are recorded as necessary to permit preparation of consolidated financial statements in accordance with GAAP, and that the Company's receipts and expenditures are being made only in accordance with authorizations of its management and directors; and
3. Provide reasonable assurance regarding prevention or timely detection of unauthorized acquisition, use or disposition of the Company's assets that could have a material effect on the consolidated financial statements.
Internal control over financial reporting cannot provide absolute assurance of achieving financial reporting objectives because of its inherent limitations, including the possibility of human error and circumvention by collusion or overriding of controls. Accordingly, even an effective internal control system may not prevent or detect material misstatements on a timely basis. Also, projections of any evaluation of effectiveness to future periods are subject to the risk that controls may become inadequate because of changes in conditions or that the degree of compliance with the policies or procedures may deteriorate.
Management's Report on Internal Control over Financial Reporting
The Company's management is responsible for establishing and maintaining adequate internal control over financial reporting, as such term is defined in Exchange Act Rule 13a-15(f). Under the supervision and with the participation of the Company's management, including its principal executive officer, principal financial officer and principal accounting officer, the Company conducted an evaluation of the effectiveness of its internal control over financial reporting based on the framework in Internal Control — Integrated Framework (2013) issued by the Committee of Sponsoring Organizations of the Treadway Commission. Based on the Company's evaluation under the framework in Internal Control — Integrated Framework (2013), the Company's management concluded that its internal control over financial reporting was effective as of December 31, 2019.
Item 9B — Other Information
None.
PART III
PART III
Item 10 - Directors, Executive Officers and Corporate Governance
The Company is a limited liability company that is managed by Clearway, Inc., as its sole managing member. As a limited liability company managed by Clearway, Inc., the Company does not have a board of directors. References herein to the Company's board of directors are references to the board of directors (the “Board”) of Clearway, Inc. Pursuant to the Fourth Amended and Restated Limited Liability Company Agreement of the Company, Clearway, Inc. has appointed officers of the Company and designated certain of such officers as “Executive Officers.” These executive officers are the same as the executive officers of Clearway, Inc.
The following table shows information for the Company's executive officers. Executive officers serve until their successors are duly appointed or elected.
|
| | |
| Name | Age | Title |
| Christopher S. Sotos | 48 | President and Chief Executive Officer |
| Chad Plotkin | 44 | Senior Vice President and Chief Financial Officer |
| Kevin P. Malcarney | 53 | Senior Vice President, General Counsel and Corporate Secretary |
| Mary-Lee Stillwell | 46 | Vice President and Chief Accounting Officer |
Christopher S. Sotos has served as President and Chief Executive Officer since May 2016, and as a member of the Board since May 2013. Mr. Sotos had also served in various positions at NRG, including most recently as Executive Vice President-Strategy and Mergers and Acquisitions from February 2016 through May 2016 and Senior Vice President-Strategy and Mergers and Acquisitions from November 2012 through February 2016. In this role, he led NRG’s corporate strategy, mergers and acquisitions, strategic alliances and other special projects for NRG. Previously, he served as NRG’s Senior Vice President and Treasurer from March 2008 to September 2012, where he was responsible for all treasury functions, including raising capital, valuation, debt administration and cash management. Mr. Sotos also previously served as a director of FuelCell Energy, Inc. from September 2014 to April 2019. As President and Chief Executive Officer of the Company, Mr. Sotos provides the Board with management’s perspective regarding the Company’s day to day operations and overall strategic plan. Mr. Sotos also brings strong financial and accounting skills to the Board.
Chad Plotkin has served as the Company's Senior Vice President and Chief Financial Officer since November 2016. From January 2016 until his appointment as Senior Vice President and Chief Financial Officer, Mr. Plotkin served as Senior Vice President, Finance and Strategy. Prior to this, he served in varying capacities at NRG, including as Vice President of Investor Relations of both the Company and NRG from September 2015 to January 2016 and from January 2012 to February 2015 and Vice President of Finance of NRG from February 2015 to September 2015. From October 2007 to January 2012, Mr. Plotkin served in various capacities in the Strategy and Mergers and Acquisitions group of NRG, including as Vice President, beginning in December 2010.
Kevin P. Malcarney has served as Senior Vice President, General Counsel and Corporate Secretary since May 11, 2018. He served as Interim General Counsel of the Company from March 16, 2018. Mr. Malcarney was previously Vice President and Deputy General Counsel and served in various other roles at NRG since September 2008. Prior to that, Mr. Malcarney worked at two major law firms in Princeton, New Jersey and Philadelphia, Pennsylvania, and handled mergers and acquisitions, project financing and general corporate matters.
Mary-Lee Stillwell has served as Vice President and Chief Accounting Officer of the Company since August 31, 2018. Ms. Stillwell previously served as Vice President and Assistant Controller of NRG since December 2012, where she was responsible for managing and directing NRG's financial accounting and reporting activities as well as overseeing the accounting for the Renewables business and various shared service functions. Prior to her work at NRG, Ms. Stillwell served as Assistant Controller-Integration and Internal Controls of GenOn Energy, Inc., in Houston, Texas, from September 2010 to December 2012, where she was responsible for all Sarbanes‑Oxley compliance as well as integrations of mergers and acquisitions.
Code of Ethics
The Company has not adopted a separate code of ethics because all of the officers of the Company are subject to the Code of Conduct adopted by the Board of Clearway, Inc. Clearway, Inc.’s Code of Conduct applies to all of its directors and employees, including its and the Company's officers (e.g., the Company's CEO, CFO, and Principal Accounting Officer). Clearway, Inc.’s Code of Conduct is available on its website, www.clearwayenergy.com.
Section 16(a)-Beneficial Ownership Reporting Compliance
The Company does not have equity securities registered pursuant to Section 12 of the Exchange Act, and therefore there are no persons subject to Section 16 of the Exchange Act with respect to the Company that are required to file Forms 3, 4 or 5 with the SEC.
Item 11 — Executive Compensation
Compensation Committee Report
The Company's named executive officers are also named executive officers of Clearway, Inc., and the compensation of the named executive officers disclosed herein reflects total compensation for services with respect to Clearway, Inc. and all of its subsidiaries, including the Company. The Compensation Committee of the Board of Clearway, Inc. (the “Compensation Committee”) has reviewed and discussed the Compensation Discussion and Analysis included in this Annual Report on Form 10-K required by Item 402(b) of Regulation S-K with management and, based upon such review and discussion, the Compensation Committee has recommended to the Board that the Compensation Discussion and Analysis be included in this Annual Report on Form 10-K.
|
|
| Compensation Committee: |
| Ferrell P. McClean, Chair |
| Jonathan Bram |
| Brian R. Ford |
Daniel B. More
|
| E. Stanley O'Neal |
Compensation Discussion and Analysis
Executive Summary
Executive Compensation Program
Clearway, Inc. is a publicly‑traded energy infrastructure investor and owner of modern, sustainable and long‑term contracted assets across North America. As a result of the GIP Transaction which closed on August 31, 2018, GIP, through its portfolio company, CEG, holds all of Clearway, Inc.’s Class B common stock and Class D common stock, and thus has the majority voting interest in the Company. This Compensation Discussion and Analysis (“CD&A”) describes the philosophy, elements, implementation and results of the Clearway, Inc.'s 2019 executive compensation program as it applies to the executive team. As discussed above, Clearway, Inc.'s named executive officers are also named executive officers of Clearway Energy LLC, and the compensation of the named executive officers (“NEOs”) discussed below reflects total compensation for services with respect to Clearway, Inc. issued 4,492,473and all of its subsidiaries, including Clearway Energy LLC. In this CD&A, the term “Company,” as well as the terms “our,” “we,” “us” or like terms, are used to refer to Clearway, Inc. and its consolidated subsidiaries, including Clearway Energy LLC and its consolidated subsidiaries.
Beginning with our first two employees, Messrs. Sotos and Plotkin in 2016, the Compensation Committee’s objectives have been to design a simple yet competitive program, which is aligned with the interests of our stockholders. Since that time, refinements have been made to the combination of long‑term and short‑term compensation features to further align pay with the Company’s annual performance and 3-year total shareholder return (“TSR”), respectively. Our annual incentive program (“AIP”) is based on objective criteria that support the achievement of our short-term objectives, which we believe create long-term shareholder value. Our long-term incentives are comprised of 67% Relative Performance Stock Units (“RPSUs”), which vest based on relative TSR measured over 3 years and 33% Restricted Stock Units (“RSUs”), which vest based on continued service over 3 years. The program incorporates many best practices in compensation design, while being tailored to our business needs and compensation objectives.
In 2019, the Compensation Committee reviewed and did not modify its compensation philosophy behind the compensation program. Thus, NEO compensation continued to be delivered through a mix of (i) base salary, (ii) an annual incentive bonus opportunity under the AIP and (iii) long‑term incentive compensation under our Amended and Restated 2013 Equity Incentive Plan (“LTIP”) in the form of RPSUs, and RSUs.
At our 2019 Annual Meeting of Stockholders, we received 99% support for our say on pay proposal. We believe these results demonstrate our stockholders support our pay practices and that our compensation plans are aligned with their interests.
Key Governance Features of Our Executive Compensation Program
Our compensation program and practices incorporate several key governance features as highlighted in the table below:
|
| |
| What We Do: | What We Don’t Do: |
| Pay for performance by delivering a substantial majority of our CEO’s compensation through equity | No excise tax gross‑ups on change‑in‑control payments and no tax gross‑ups on perquisites or benefits |
| Beginning in 2017, the large majority of our equity compensation for Senior Vice Presidents and above is performance‑based | No pledging or hedging of the Company’s stock by NEOs or directors |
| Target our peer group median for total direct compensation | No employment agreements for executive officers with the exception of our CEO |
| Require a double trigger for the acceleration of equity vesting upon a change‑in‑control | No guaranteed bonus payments for our NEOs |
| Prevent undue risk taking in our compensation practices and engage in robust risk monitoring | No supplemental executive retirement plans |
| Include clawback policies in our compensation plans | No re‑pricing of underwater stock options and no stock option grants with an exercise price below 100% of fair market value |
| Maintain robust stock ownership guidelines for our NEOs | |
| Provide market‑level retirement benefits and limited perquisites | |
| Engage an independent compensation consultant to provide advice to the Compensation Committee with respect to our compensation program | |
| Conduct an annual say on pay vote | |
Business Strategy and Company Performance
The Company’s primary business strategy is to focus on the acquisition and ownership of assets with predictable, long‑term cash flows that allow the Company to increase the cash dividends paid to holders of the Company’s Class A and Class C common stock over time without compromising the ongoing stability of the business. The Company’s plan for executing this strategy includes the following key components: focusing on contracted renewable energy and conventional generation and thermal infrastructure assets; growing our business through acquisitions of contracted operating assets primarily in North America; and maintaining sound financial practices to grow our dividend.
The execution of the Company’s business strategy produced the following results in 2019:
Raised approximately $900 million in new corporate-level formation for growth investments and corporate liability management, which included corporate debt and equity financings, as well as project-level debt optimization
Invested approximately $330 million in new growth investments, including the acquisition of the 527 MW Carlsbad Energy Center from the Company’s sponsor GIP and the Repowering Partnership 1.0
Finalized stand-alone operations including the transition of services away from NRG as the Company’s sponsor
Successful management of the potential impacts from the PG&E bankruptcy
Achieved strong execution from Thermal business, which acquired the district energy assets of Duquesne University in Pittsburgh, PA and successfully completed the Mylan project and secured a contract with Cayo Largo in Puerto Rico
Such results were taken into account by the Compensation Committee in making determinations with respect to the compensation for our NEOs under the 2019 compensation program.
Executive Compensation Program
2019 Named Executive Officers
This CD&A describes the material components of our compensation program for our NEOs in 2019. For the year ending December 31, 2019, our NEOs included the following individuals:
|
| | |
| NEO | | 2019 Title |
| Christopher S. Sotos | | President and Chief Executive Officer |
| Chad Plotkin | | Senior Vice President and Chief Financial Officer |
| Kevin P. Malcarney | | Senior Vice President, General Counsel and Corporate Secretary |
| Mary‑Lee Stillwell | | Vice President and Chief Accounting Officer |
Goals and Objectives of the Program
The Compensation Committee is responsible for the development and implementation of the Company’s executive compensation program. The intent of the program is to reward the achievement of the Company’s annual goals and objectives while supporting the Company’s long‑term business strategy. The Compensation Committee is committed to aligning executives’ compensation with performance. Our Compensation Committee has designed an executive compensation program that:
closely aligns our executive compensation with stockholder value creation, avoiding plans that encourage executives to take excessive risk, while driving long‑term value to stockholders;
supports the Company’s long‑term business strategy, while rewarding our executive team for their individual accomplishments with tailored individual executive compensation metrics and incentives; and
provides a competitive compensation opportunity while adhering to market standards for compensation.
The Compensation Committee’s objectives are achieved through the use of both short‑term and long‑term incentives. The Company currently targets pay at the median of our Compensation Peer Group (defined below), as described under “Elements of Compensation.”
The Compensation Process
Compensation Consultant
Pursuant to its charter, the Compensation Committee is authorized to engage, at the expense of the Company, a compensation consultant to provide independent advice, support and expertise to assist the Compensation Committee in overseeing and reviewing our overall executive compensation strategy, structure, policies and programs, and to assess whether our compensation structure establishes appropriate incentives for management and other key employees. As noted above, Pay Governance served as the Compensation Committee’s independent compensation consultant for the first eight months of fiscal year 2019. Deloitte became the Compensation Committee’s independent compensation consultant for the remainder of fiscal year 2019 and continues to serve in that capacity. Pay Governance worked with the Compensation Committee to formulate the design of the executive and director compensation programs for 2019. Each of Pay Governance and Deloitte provided reports to the Compensation Committee (during the respective periods they served as compensation consultant) containing research, market data, survey information and information regarding trends and developments in executive and director compensation. Each of Pay Governance and Deloitte reported directly to the Compensation Committee (during the respective periods they served as compensation consultant). The Company paid Deloitte $105,992 for the work it performed for the Compensation Committee in 2019. CEG engaged Deloitte and its affiliate, Deloitte & Touche LLP, to provide additional services in 2019, for which CEG paid $2,964,644. These additional services primarily related to financial reporting services, including assistance with the preparation of CEG’s financial statements for the second and third quarters of 2019, and assisting with the transition of enterprise resource planning and financial applications from NRG. Given that these services were provided to CEG, the decision to engage Deloitte and its affiliate for such services was not made, or recommended, by our management, or approved by the Compensation Committee or the Board. Neither Pay Governance nor any of its affiliates provided services for any of our affiliates in 2019. In accordance with SEC rules and requirements, the Company has affirmatively determined that no conflicts of interest exist between the Company and Pay Governance or Deloitte (or any individuals working on the Company’s account on behalf of Pay Governance or Deloitte).
Compensation Peer Group Analysis
The Compensation Committee, with support from its independent compensation consultant, identifies the most appropriate comparator group within relevant industries for purposes of benchmarking compensation. The Compensation Committee aims to
compare our compensation program to a consistent peer group year‑to‑year but given the dynamic nature of our industry and the companies that constitute it, the Compensation Committee annually examines the peer group for appropriateness in terms of size, complexity and industry. As a result of such annual review, the Compensation Committee identified a new peer group for compensation benchmarking purposes in 2019 (the “Compensation Peer Group”).
For these purposes, the Compensation Peer Group, comprised of similarly sized publicly‑owned energy and utility companies, is identified below:
|
| | | | | | |
| Company | | Ticker | | Company | | Ticker |
| Black Hills Corporation | | NYSE: BKH | | NorthWestern Corporation. | | NYSE: NWE |
Boardwalk Pipeline Partners, LP(1) | | | | Ormat Technologies, Inc. | | NYSE: ORA |
| El Paso Electric Company | | NYSE: EE | | Pattern Energy Group Inc. | | NASDAQ: PEGI |
| Genesis Energy, L.P. | | NYSE: GEL | | South Jersey Industries, Inc. | | NYSE: SJI |
| Innergex Renewable Energy Inc. | | TSX: INE | | TransAltaCorporation. | | NYSE:TAC |
| Northland Power Inc. | | TSX: NPI | | | | |
(1)Boardwalk Pipeline Partners, LP became privately-held in July 2018 and was delisted, but was included by Pay Governance (when it was serving as compensation consultant) as part of its 2019 compensation benchmarking analysis, and for that reason, Boardwalk Pipeline Partners, LP is included in the Compensation Peer Group for 2019 but will not be part of the Compensation Peer Group for 2020 or going forward.
For the purposes of determining appropriate NEO pay levels for 2019, the Compensation Committee reviewed NEO compensation from peers, where available and appropriate (e.g., based on an NEO’s position and duties). To supplement this analysis, the Compensation Committee also participated in meetings with its compensation consultant regarding the compensation consultant’s review of relevant third‑party survey data and considered the recommendations of the CEO on NEO and employee compensation matters not involving the CEO. The Compensation Committee may accept or adjust such CEO recommendations at its discretion.
Elements of Compensation
Our compensation program for our NEOs consists of fixed compensation (base salary), performance‑based compensation (AIP bonus and RPSUs) and time‑based compensation (RSUs). We use the median percentile of our Compensation Peer Group as a guidepost in establishing the targeted levels of total direct compensation (cash and equity) for our NEOs. We expect that, over time, targeted total direct compensation for our NEOs will continue to approximate the median of our Compensation Peer Group. Realized pay in a given year depends on the achievement of defined performance‑based compensation metrics. While a portion of our compensation is fixed, a significant percentage is at‑risk and payable and/or realizable only if certain performance objectives are met.
Base Salary
Base salary compensates NEOs for their level of experience and position responsibilities and for the continued expectation of superior performance. Recommendations on increases to base salary take into account, among other factors, the NEO’s individual performance, the general contributions of the NEO to overall corporate performance, the level of responsibility of the NEO with respect to his or her specific position, and their current base salary level compared to the market median. Messrs. Sotos and Plotkin received base salary increases in 2019 based on their performance and peer group benchmarking. The base salary for each NEO for fiscal year 2019 is set forth below:
|
| | | | |
| Named Executive Officer | | 2019 Annualized Base Salary ($)(1) | | Percentage Increase Over 2018 (%)(2) |
| Christopher S. Sotos | | 611,000 | | 22% |
| Chad Plotkin | | 380,000 | | 9% |
| Kevin P. Malcarney | | 300,000 | | 0% |
| Mary‑Lee Stillwell | | 295,000 | | 0% |
(1) Actual 2019 base salary earnings are presented in the Summary Compensation Table.
(2) As compared to the December 31, 2018 annualized base salary.
Annual Incentive Compensation
Overview
Annual incentive compensation awards (AIP bonuses) are made under our AIP. AIP bonuses represent short‑term compensation designed to compensate NEOs for meeting annual Company goals and for their individual performance. The Compensation Committee establishes these annual Company goals after reviewing the Company’s business strategy and other matters. As further discussed below, the annual goals for 2019 relate to the following four areas: (a) CAFD, (b) key financial milestones, (c) key transition milestones and (d) achievement of the Thermal plan. In addition, each NEO’s individual performance may (negatively or positively) affect the bonus amount that he or she ultimately receives under our AIP. However, notwithstanding individual performance or the extent to which the Company goals are achieved, the Compensation Committee retains sole discretion under the AIP to reduce the amount of or eliminate any AIP bonuses that are otherwise payable under the AIP.
AIP bonus opportunities are expressed in terms of threshold, target and maximum bonus opportunities. Different percentages of each NEO’s annual base salary relate to these threshold, target and maximum AIP bonus opportunities. However, in the event threshold performance for 2019 was not achieved with respect to the CAFD performance metric (the “AIP Gate”), no AIP bonuses would have been payable for 2019.
Effective January 1, 2019, the AIP was amended to include designated officers as participants, granting NEOs (other than Mr. Sotos whose severance is governed by his employment agreement) eligibility for a prorated target bonus payment for the year of a qualifying severance termination, based on the portion of the performance period that the NEO was employed.
2019 AIP Bonus Performance Criteria
The AIP bonus performance criteria applicable to all NEOs are based upon the four Company goals described above and individual performance. The table below sets forth the 2019 AIP performance criteria and weightings applicable to all NEOs, assuming the achievement of each goal at target.
|
| |
| Goal | Weight |
CAFD(1) | 32.5% |
| Key Financial Milestones | 32.5% |
| Key Transition Milestones | 25% |
| Achievement of the Thermal Plan | 10% |
| Overall Funding | 100% |
| Individual Performance | +/- 20% |
(1) CAFD is adjusted earnings before interest, taxes, depreciation and amortization (Adjusted EBITDA) plus cash distributions/return of investment from unconsolidated affiliates, cash receipts from notes receivable, cash distributions from noncontrolling interests, less cash distributions to noncontrolling interests, maintenance capital expenditures, pro‑rata Adjusted EBITDA from unconsolidated affiliates, cash interest paid, income taxes paid, principal amortization of indebtedness, Walnut Creek investment payments, and changes in prepaid and accrued capacity payments.
| |
| • | CAFD. As noted above, the threshold CAFD performance metric represents the AIP Gate for 2019. The Compensation Committee set the 2019 AIP Gate at $231 million. The Compensation Committee has removed the AIP Gate as a feature under the AIP for 2020. |
Beyond serving as a “gate” to any payout of AIP bonuses to NEOs, CAFD is also a distinct portion of our annual incentive framework. For 2019, the CAFD goals and the achieved level are set forth in the chart below. The Company achieved CAFD of approximately $254 million, surpassing the CAFD threshold (i.e., the AIP Gate) but less than the CAFD target.
|
| | | |
CAFD Threshold | CAFD Target | CAFD Maximum | CAFD Actual |
| $231 million | $270 million | $309 million | $254 million |
| |
| • | Key Financial Milestones. Achievement of “key financial milestones” performance metrics are established as a defined annual incentive category. The Compensation Committee establishes threshold, target and maximum levels of performance for this category based on the number of milestones achieved. For 2019, a total of eleven milestones were established relating to the Company’s credit rating, adherence to budget, CAFD per share goals, management of certain PG&E related projects, and OSHA recordable incident rate. Additional CAFD and OSHA milestones also were applied as separate milestones with respect |
to the Company’s Thermal business. For 2019, threshold performance required the achievement of three out of the eleven milestones, target performance required the achievement of six out of the eleven milestones, and maximum performance required the achievement of all eleven milestones. Ultimately, target performance was attained with the achievement of six out of the eleven milestones in 2019.
| |
| • | Key Transition Milestones. Achievement of “key transition milestones” performance metrics were specifically established as a defined annual incentive category for 2019. The Compensation Committee establishes threshold, target and maximum levels of performance for this category based on the number of milestones achieved. For 2019, a total of five milestones were established relating to the Company’s cost savings initiatives, reduced use of NRG technology and services, implementation of certain asset management agreements and satisfactory completion of the auditor RFP (request for proposal). For 2019, threshold performance required the achievement of two out of the five milestones, target performance required the achievement of three out of the five milestones, and maximum performance required the achievement of all five milestones. Ultimately, maximum performance was attained with the achievement of five out of the five milestones in 2019. |
| |
| • | Achievement of the Thermal Plan. Achievement of “Thermal Plan” performance metrics was added as an annual incentive category for 2019 based on the view that all elements of the Company’s business should be reflected in the AIP bonus opportunity. The Compensation Committee establishes threshold, target and maximum levels for this category for each of the “Thermal Plan” performance metrics. For 2019, the Thermal Plan performance metrics relate to the Thermal business’s CAFD, capital expenditures, cost controls and system efficiencies. In addition, a separate metric was established for 2019 identifying a total of eleven key Thermal business goals. Similar to the key financial and transitional milestones described above, threshold, target and maximum levels of performance were established for this separate metric based on the number of goals achieved. These goals related tosafety, cost control, customer retention and satisfaction, employee engagement, environmental risk management, good citizenship and growth, in each case, with respect to the Thermal business (threshold, target and maximum performance required the achievement of three, seven and ten goals, respectively, out of a total of eleven). Ultimately, above-target performance was attained (expressed as 153% of target) with respect to the thermal plan in 2019 (including achievement of six out of the eleven key Thermal business goals). |
| |
| • | Individual Performance. As indicated above, individual performance may (negatively or positively) affect the AIP Bonus for an NEO by up to 20%, although no AIP Bonus payments can exceed 200% of the target award. Such individual performance is determined on a discretionary basis based on the Compensation Committee’s assessment of the NEO’s contributions in supporting adherence to budget, support towards the achievement of key milestones, and other contributions towards the successful execution of the Company’s business strategy. In 2019, the Compensation Committee considered the individual performance of the CEO and recommended to the full Board that his AIP Bonus be increased by 20% to account for his individual performance. In a similar manner, the CEO recommended to the Compensation Committee that the AIP Bonus be increased for the other NEOs from 15% to 20%. The full board approved the above recommendation of the Compensation Committee and the Compensation Committee approved the above recommendation of the CEO. |
2019 Annual Incentive Bonus Opportunity
The threshold, target and maximum AIP bonus opportunities for NEOs for 2019, expressed as a percentage of base salary, were:
|
| | | | | |
| Named Executive Officer | Gate Not Met (%) | Threshold (%)(1) | Target (%)(1) | Maximum (%) | Target Amount ($) |
| Christopher S. Sotos | 0 | 50 | 100 | 200 | 611,000 |
| Chad Plotkin | 0 | 30 | 60 | 120 | 228,000 |
| Kevin Malcarney | 0 | 20 | 40 | 80 | 120,000 |
| Mary‑Lee Stillwell | 0 | 20 | 40 | 80 | 118,000 |
(1) This assumes that the CAFD performance metric and all other quantitative and qualitative goals, including the key milestones, are achieved at threshold or target levels, respectively.
2019 Annual Incentive Bonuses
As noted above, with respect to AIP bonuses for 2019, the AIP Gate was $231 million, the CAFD target was $270 million, the key financial milestone target was achievement of six out of eleven key financial milestones, the key transition milestone target was achievement of three out of five key transition milestones and target achievement of the “Thermal Plan” metrics was based on the achievement of various sub-categories, including the achievement of seven out of eleven key Thermal business goals.
For 2019, the AIP Gate was surpassed, CAFD was between threshold and target at approximately $254 million, six out of eleven key financial milestones were achieved, and five out of five key transition milestones were achieved. In addition, overall achievement for the thermal plan for 2019 was above target at 153%. Due to the achievement specified above, 2019 AIP bonuses were paid at levels above target. If performance falls between threshold and target or target and maximum, the bonus opportunity will be determined on an interpolated basis. As a result, the CAFD metric, the key financial milestone, the key transition milestone, and thermal plan metrics were respectively weighted at 79%, 100%, 200% and 153% of target. Individual performance, which is determined on a discretionary basis, resulted in positive adjustments to the AIP Bonuses for the NEOs from 15% to 20%.
The annual incentive bonuses paid to NEOs for 2019 were:
|
| | | | | | |
| Named Executive Officer | | Percentage of Annual Base Salary (%) | | Percent of Target Achieved (%) | | Annual Incentive Payment ($) |
| Christopher S. Sotos | | 148 | | 124 | | 906,235 |
| Chad Plotkin | | 89 | | 124 | | 338,170 |
| Kevin P. Malcarney | | 57 | | 124 | | 170,568 |
| Mary‑Lee Stillwell | | 59 | | 124 | | 175,018 |
Long‑Term Incentive Compensation
We believe that equity awards directly align our NEOs’ interests with those of our stockholders. In 2019, the Compensation Committee granted our NEOs a combination of performance‑based equity awards directly linked to long‑term stockholder value creation and time-based equity awards which also represent a critical component of our long-term incentive compensation due to the retention aspects of the awards. To enhance our compensation program’s focus on Company performance, the large majority of these long‑term incentive awards (67%) were performance‑based (i.e., granted as RPSUs). The remaining 33% of our long-term incentive awards were time-based (i.e., granted as RSUs which vest over 3 years). We believe that our AIP appropriately focuses our NEOs on shorter‑term (one‑year) financial metrics while our LTIP emphasizes long‑term stockholder value creation (i.e. three‑year TSR outperformance). For 2019, Mr. Sotos’ target LTIP award was 250% of his base salary, Mr. Plotkin’s target LTIP award was 125% of his base salary, Mr. Malcarney’s target LTIP award was 100% of his base salary, and Ms. Stillwell’s target LTIP award was 75% of her base salary. The above mix of long‑term incentive compensation applied to all NEOs, except Ms. Stillwell, for 2019, who received 100% RSUs under the terms of her offer letter.
Relative Performance Stock Units
Each RPSU represents the potential to receive one share of Class C common stock based on the Company’s TSR performance ranked against the TSR performance of a comparator group of similar companies (the “Performance Peer Group”) after the completion of a three‑year performance period. Relative measures are designed to normalize for externalities, ensuring the program appropriately reflects management’s impact on the Company’s TSR by including peer companies that the Compensation Committee believes are similarly impacted by market conditions.
The payout of shares of Class C common stock at the end of the three‑year performance period is based on the Company’s TSR performance percentile rank compared with the TSR performance of the Performance Peer Group. To ensure a rigorous program design, the target‑level payout (100% of shares granted) requires the Company to perform at the 50th percentile. To induce management to achieve greater than target‑level performance in a down market, in the event that the Company’s TSR performance declines by more than 20% over the performance period, the target‑level payout (100% of shares granted) will require an even greater achievement of a 60th percentile performance. The Compensation Committee believes that this increased performance requirement addresses the concern that a disproportionate award may be paid in the event that our relative performance is high, but absolute performance is low.
In the event relative performance is below the 25th percentile, the award is forfeited. In the event relative performance is between the 25th percentile and the 50th percentile (or the 60th percentile if our TSR performance declines by more than 20% over the performance period), payouts will be based on an interpolated calculation. In the event relative performance reaches the 50th percentile (or the 60th percentile as described above), 100% of the award will be paid. In the event relative performance is between the 50th percentile (or the 60th percentile as described above) and the 75th percentile, payouts will be based on an interpolated calculation. In the event that relative performance is at or above the 75th percentile, a maximum payout of 150% of the target will be paid with respect to RPSU awards granted in 2019. Beginning with respect to RPSUs granted in 2018 and continuing for grants of 2019 RPSUs, the maximum payout was (and remains) changed from 200% to 150%.
The table below illustrates the design of our RPSUs in 2019.
|
| | | | | | | | |
| Performance Targets | | Performance Requirement | | Payout Opportunity | |
| Maximum | | 75th percentile or above | | 150% | |
| Target | | Standard Target: 50th percentile | | Modified Target: 60th percentile (less than −20% absolute TSR) | | 100% | |
| Threshold | | 25th percentile | | 25% | |
| Below Threshold | | Below 25th percentile | | 0% | |
Restricted Stock Units
Each RSU represents the right to receive one share of our Class C common stock after the completion of the vesting period. The RSUs granted to the NEOs in 2019 vest ratably, meaning that one‑third of the award vests each year on the anniversary of the grant date, over a three‑year period.
Dividend Equivalent Rights
In connection with awards of both RPSUs and RSUs, each NEO also receives DERs, which accrue with respect to the award to which they relate. DERs accrue only to the extent that the shares of Class C common stock underlying each award become vested and deliverable to the NEO. Accrued DERs are paid at the same time such shares are delivered to the NEO. Accordingly, DERs are forfeited if the underlying shares are forfeited.
Clawbacks
The Company has a “clawback” policy with regard to awards made under the ATM ProgramAIP and LTIP in the case of a material financial restatement, including a restatement resulting from employee misconduct, or in the case of fraud, embezzlement or other serious misconduct that is materially detrimental to the Company. The Compensation Committee retains discretion regarding application of the policy. The policy is incremental to other remedies that are available to the Company. In addition to our “clawback” policy, if the Company is required to restate its earnings as a result of noncompliance with a financial reporting requirement due to misconduct, under the Sarbanes‑Oxley Act of 2002 (“SOX”), the CEO and the CFO would also be subject to a “clawback,” as required by SOX.
Benefits
All of our NEOs participate in the same retirement, life insurance, health and welfare plans. To generally support more complicated financial planning and estate planning matters, NEOs are eligible for reimbursement of annual tax return preparation, tax advice, financial planning and estate planning expenses. Mr. Sotos is eligible for a maximum reimbursement of $12,000 per year and the remaining NEOs are eligible for a maximum reimbursement of $3,000 per year.
Potential Severance and Change‑In‑Control Benefits
Each NEO’s RPSU and RSU award agreements under the LTIP provide for special treatment in the event of such NEO’s termination of employment under certain circumstances, including in connection with a change-in-control. Additionally, Mr. Sotos, pursuant to his employment agreement, and the remaining NEOs, pursuant to the Company’s Executive Change‑in‑Control and General Severance Plan for Tier IA and Tier IIA Executives (the “CIC Plan”) as well as pursuant to the Compensation Committee’s discretion under the AIP, are entitled to additional severance payments and benefits in the event of termination of employment under certain circumstances, including following a change‑in‑control.
Change‑in‑control arrangements are considered a market practice among many publicly‑held companies. Most often, these arrangements are utilized to encourage executives to remain with the company during periods of extreme job uncertainty and to ensure that any potential transaction is thoroughly and objectively evaluated. In order to enable a smooth transition during an interim period, change‑in‑control arrangements provide a defined level of security for the executive and the company, enabling a more seamless implementation of a particular merger, acquisition or asset sale or purchase, and subsequent integration.
For a more detailed discussion, including the quantification of potential payments, please see the section entitled “Severance and Change‑in‑Control” following the executive compensation tables below.
Other Matters
Stock Ownership Guidelines
The Compensation Committee and the Board require the CEO to hold Company stock with a value equal to 4.0 times his base salary until his separation from the Company. Senior Vice Presidents are required to hold Company stock with a value equal to 2.0 times their base salary until their separation from the Company. The Chief Accounting Officer is required to hold Company stock with a value of 1.5 times her base salary until her separation from the Company. Personal holdings and vested awards count towards the ownership multiple. Although NEOs are not required to make purchases of our common stock to meet their target ownership multiple, NEOs are restricted from divesting any securities until such ownership multiples are attained, except in the event of hardship or to make a required tax payment, and they must maintain their ownership multiple after any such transactions. Once met, they must maintain their ownership multiple during their service. The current target stock ownership for NEOs as of February 24, 2020 is shown below. Mr. Sotos and Mr. Plotkin became subject to the stock ownership guidelines upon becoming NEOs in 2016. In addition, Mr. Malcarney and Ms. Stillwell became subject to the stock ownership guidelines upon becoming NEOs in 2018. All of our NEOs met or exceeded their stock ownership guidelines as of February 24, 2020.
|
| | | | |
| Named Executive Officer | | Target Ownership Multiple | | Actual Ownership Multiple |
| Christopher S. Sotos | | 4.0x | | 8.8x |
| Chad Plotkin | | 2.0x | | 3.5x |
| Kevin P. Malcarney | | 2.0x | | 3.4x |
| Mary‑Lee Stillwell | | 1.5x | | 2.4x |
Tax and Accounting Considerations
Section 162(m) of the Internal Revenue Code (the “Code”) precludes us, as a public company, from taking a tax deduction for individual compensation to certain of our executive officers in excess of $1 million, subject to certain exemptions. Prior to 2018, the exemptions included an exclusion of performance‑based compensation within the meaning of Section 162(m) of the Code (“Section 162(m)”). The Tax Cuts and Jobs Act, enacted in December 2017, however, amended Section 162(m) and eliminated the exclusion of performance‑based compensation from the $1 million limit, subject to certain new exemptions for performance‑based compensation that is “grandfathered” for purposes of amended Section 162(m). The Compensation Committee believes tax deductibility of compensation is an important consideration and continues to consider the implications of legislative changes to Section 162(m) and the possible effect of exemptions for grandfathered compensation. However, the Compensation Committee also believes that it is important to retain flexibility in designing compensation programs, and as a result, has not adopted a policy that any particular amount of compensation must be deductible to the Company under Section 162(m).
The Compensation Committee also takes into account tax consequences to NEOs in designing the various elements of our compensation program, such as designing the terms of awards to defer immediate income recognition under Section 409A of the Code. The Compensation Committee remains informed of, and takes into account, the accounting implications of its compensation programs. However, the Compensation Committee approves programs based on their total alignment with our strategy and long‑term goals.
Compensation Tables
Summary Compensation Table
Fiscal Year Ended December 31, 2019
|
| | | | | | | | | | | | | | | | | | | | | | | | | |
| Name and Principal Position | | Year | | Salary ($)(1) | | Bonus ($) | | Stock Awards ($)(2) | | Option Awards ($) | | Non‑Equity Incentive Plan Compensation ($)(3) | | Change in Pension Value and Nonqualified Deferred Compensation Earnings ($) | | All Other Compensation ($)(4) | | Total ($) |
| Christopher S. Sotos | | 2019 | | 606,304 |
| | — | | 1,527,522 |
| | — |
| | 906,235 |
| | — |
| | 14,882 |
| | 3,054,942 |
|
| President and Chief | | 2018 | | 500,000 |
| | — | | 1,250,021 |
| | — |
| | 626,809 |
| | — |
| | 21,350 |
| | 2,398,180 |
|
| Executive Officer | | 2017 | | 500,000 |
| | — | | 1,250,008 |
| | — |
| | 685,000 |
| | — |
| | 22,750 |
| | 2,457,758 |
|
| Chad Plotkin | | 2019 | | 378,731 |
| | — | | 475,020 |
| | — |
| | 338,170 |
| | — |
| | 15,200 |
| | 1,207,120 |
|
| Senior Vice President | | 2018 | | 350,000 |
| | — | | 350,019 |
| | — |
| | 219,383 |
| | — |
| | 22,602 |
| | 942,004 |
|
| and Chief Financial | | 2017 | | 350,000 |
| | — | | 350,007 |
| | — |
| | 239,750 |
| | — |
| | 24,248 |
| | 964,005 |
|
| Officer | | | | | | | | | | | | | | | | | | |
Kevin P. Malcarney(5) | | 2019 | | 300,000 |
| | — | | 300,019 |
| | — |
| | 170,568 |
| | — |
| | 11,077 |
| | 781,663 |
|
| Senior Vice President, | | 2018 | | 180,000 |
| | — | | 589,868 |
| | — |
| | 96,855 |
| | — |
| | 500 |
| | 867,223 |
|
| General Counsel and | | 2017 | | — |
| | — | | — |
| | — |
| | — |
| | — |
| | — |
| | — |
|
| Corporate Secretary | | | | | | | | | | | | | | | | | | |
Mary‑Lee Stillwell(6) | | 2019 | | 295,000 |
| | — | | 221,261 |
| | — |
| | 175,018 |
| | — |
| | 10,892 |
| | 702,171 |
|
| Chief Accounting | | 2018 | | 86,231 |
| | — | | 556,336 |
| | — |
| | 49,849 |
| | — |
| | — |
| | 692,416 |
|
| Officer | | 2017 | | — |
| | — | | — |
| | — |
| | — |
| | — |
| | — |
| | — |
|
(1) Reflects base salary earnings.
(2) Reflects the grant date fair value determined in accordance with the Financial Accounting Standards Board Accounting Standards Codification Topic 718, Comparison - Stock Compensation. Clearway Energy, Inc. uses the Company's Class C common stock price on the date of grant as the fair value of the Company's RSUs. The fair value of RPSUs is estimated on the date of grant using a Monte Carlo simulation model. For performance-based RPSUs granted in 2019, if the maximum level of performance is achieved, the fair value will be approximately $1,535,162 for Mr. Sotos, $477,388 for Mr. Plotkin and $301,523 for Mr. Malcarney.
(3) The amounts shown in this column represent the annual incentive bonuses paid to the NEOs. Further information regarding the annual incentive bonuses is included in the “2019 Annual Incentive Bonuses” section of this CD&A.
(4) The amounts provided in the All Other Compensation column represent the additional benefits payable by the Company and include insurance benefits; the employer match under the Company’s 401(k) plan; financial counseling services up to $12,000 per year for Mr. Sotos and up to $3,000 per year for all other NEOs, not including the financial advisor’s travel or out-of-pocket expenses; and when applicable, the Company’s discretionary contribution to the 401(k) plan. The following table identifies the additional compensation for each NEO.
|
| | | | | | | | | | | | | | | | | |
| Name | | Year | | Life and Disability Insurance Reimbursement ($) | | Financial Advisor Services ($) | | 401(k) Employer Matching Contribution ($) | | 401(k) Discretionary Contribution ($) | | Total ($) |
| Christopher S. Sotos | | 2019 | | 1,000 |
| | 2,682 |
| | 11,200 |
| | — |
| | 14,882 |
|
| | | 2018 | | — |
| | 2,250 |
| | 11,000 |
| | 8,100 |
| | 21,350 |
|
| | | 2017 | | 4,000 |
| | — |
| | 10,800 |
| | 7,950 |
| | 22,750 |
|
| Chad Plotkin | | 2019 | | 1,000 |
| | 3,000 |
| | 11,200 |
| | — |
| | 15,200 |
|
| | | 2018 | | — |
| | 3,000 |
| | 11,502 |
| | 8,100 |
| | 22,602 |
|
| | | 2017 | | 3,000 |
| | 3,000 |
| | 10,298 |
| | 7,950 |
| | 24,248 |
|
| Kevin P. Malcarney | | 2019 | | — |
| | — |
| | 11,077 |
| | — |
| | 11,077 |
|
| | | 2018 | | — |
| | 500 |
| | — |
| | — |
| | 500 |
|
| | | 2017 | | — |
| | — |
| | — |
| | — |
| | — |
|
| Mary‑Lee Stillwell | | 2019 | | — |
| | — |
| | 10,892 |
| | — |
| | 10,892 |
|
| | | 2018 | | — |
| | — |
| | — |
| | — |
| | — |
|
| | | 2017 | | — |
| | — |
| | — |
| | — |
| | — |
|
(5) Mr. Malcarney was appointed as Senior Vice President, General Counsel & Corporate Secretary on May 11, 2018.
(6) Ms. Stillwell was appointed as Chief Accounting Officer on August 31, 2018.
Grants of Plan‑Based Awards
Fiscal Year Ended December 31, 2019
|
| | | | | | | | | | | | | | | | | | | | | | | | | | | | |
| | | | | | | | | Estimated Possible Payouts Under Non‑Equity Incentive Plan Awards | | Estimated Future Payouts Under Equity Incentive Plan Awards | | All Other Stock Awards: Number of Shares of Stock | | Grant Date Fair Value of Stock and Option |
| Name | | Award Type | | Grant Date | | Approval Date | | Threshold ($)(1) | Target ($)(2) | Maximum ($)(3) | | Threshold (#) | Target (#) | Maximum (#) | | or Units (#) | | Awards ($)(4) |
| Christopher S. Sotos | | AIP | | — |
| | — |
| | 305,500 |
| 611,000 |
| 1,222,000 |
| | — |
| — |
| — |
| | — |
| | — |
|
| | | RPSU | | 1/2/2019 |
| | 12/6/2018 |
| | — |
| — |
| — |
| | 13,668 |
| 54,671 |
| 82,007 |
| | — |
| | 1,023,441 |
|
| | | RSU | | 1/2/2019 |
| | 12/6/2018 |
| | — |
| — |
| — |
| | — |
| — |
| — |
| | 29,307 |
| | 504,080 |
|
| Chad Plotkin | | AIP | | — |
| | — |
| | 114,000 |
| 228,000 |
| 456,000 |
| | - | — |
| — |
| | — |
| | — |
|
| | | RPSU | | 1/2/2019 |
| | 11/29/2018 |
| | — |
| — |
| — |
| | 4,250 |
| 17,001 |
| 25,502 |
| | — |
| | 318,259 |
|
| | | RSU | | 1/2/2019 |
| | 11/29/2018 |
| | — |
| — |
| — |
| | — |
| — |
| — |
| | 9,114 |
| | 156,761 |
|
| Kevin P. Malcarney | | AIP | | — |
| | — |
| | 60,000 |
| 120,000 |
| 240,000 |
| | — |
| — |
| — |
| | — |
| | — |
|
| | | RPSU | | 1/2/2019 |
| | 12/6/2018 |
| | — |
| — |
| — |
| | 2,685 |
| 10,738 |
| 16,107 |
| | — |
| | 201,015 |
|
| | | RSU | | 1/2/2019 |
| | 12/6/2018 |
| | — |
| — |
| — |
| | — |
| — |
| — |
| | 5,756 |
| | 99,003 |
|
| Mary‑Lee Stillwell | | AIP | | — |
| | — |
| | 59,000 |
| 118,000 |
| 236,000 |
| | — |
| — |
| — |
| | — |
| | — |
|
| | | RPSU | | — |
| | — |
| | — |
| — |
| — |
| | — |
| — |
| — |
| | — |
| | — |
|
| | | RSU | | 1/2/2019 |
| | 12/6/2018 |
| | — |
| — |
| — |
| | — |
| — |
| — |
| | 12,864 |
| | 221,261 |
|
(1) Threshold non-equity incentive plan awards include annual incentive plan threshold payments, as presented in the CD&A.
(2) Target non-equity incentive plan awards include annual incentive plan target payments, as presented in the CD&A.
(3) Maximum non-equity incentive plan awards include annual incentive plan maximum payments, as presented in the CD&A.
(4) Reflects the grant date fair value determined in accordance with the Financial Accounting Standards Board Accounting Standards Codification Topic 718, Comparison-Stock Compensation. The Company uses the Class C common stock price on the date of grant as the fair value of the Company’s RSUs. The fair value of RPSUs is estimated on the date of grant using a Monte Carlo simulation model.
Outstanding Equity Awards at Fiscal Year End
Fiscal Year Ended December 31, 2019
|
| | | | | | | | | | | | | | | | | | | | | | | |
| | | Option Awards | | Stock Awards |
| | | Number of | | Number of | | | | | | Number | | Market Value | | Equity Incentive Plan Awards |
| Name | | Securities Underlying Unexercised Options (#) Exercisable | | Securities Underlying Unexercised Options (#) Unexercisable | | Option Exercise Price ($) | | Option Expiration Date | | of Shares or Units of Stock that Have Not Vested (#) | | of Shares or Units of Stock that Have Not Vested ($) | | Number of Unearned Shares that Have Not Vested (#)(1) | | Market Value of Unearned Shares that Have Not Vested ($)(1) |
| Christopher S. Sotos | | — |
| | — |
| | — |
| | — |
| | 52,266 (2) | | 1,042,707 |
| | 133,645 (3) |
| | 2,666,218 |
|
| Chad Plotkin | | — |
| | — |
| | — |
| | — |
| | 15,544 (4) | | 310,103 |
| | 39,114 (5) |
| | 780,324 |
|
| Kevin P. Malcarney | | — |
| | — |
| | — |
| | — |
| | 20,046 (6) | | 399,918 |
| | 10,738(7) |
| | 214,223 |
|
| Mary‑Lee Stillwell | | — |
| | — |
| | — |
| | — |
| | 24,916 (8) | | 497,074 |
| | — |
| | — |
|
| | | | | | | | | | | | | | | | | |
(1) Assumes achievement at target award level for 2017, 2018 and 2019 RPSU awards as discussed in the CD&A.
(2) This amount represents 16,840 RSUs that vested on January 2, 2020, 8,776 RSUs that vested on January 3, 2020, 16,861 RSUs that will vest on January 2, 2021, and 9,789 RSUs that will vest on January 2, 2022.
(3) This amount represents 39,375 RPSUs that vested on January 3, 2020, 39,599 that will vest on January 2, 2021, and 54,671 that will vest on January 2, 2022. On January 3, 2020, the 2017 RPSU award vested at 157% of target based on the Company’s TSR performance ranked against the TSR performance of the Performance Peer Group.
(4) This amount represents 5,017 RSUs that vested on January 2, 2020, 2,458 RSUs that vested on January 3, 2020, 5,024 RSUs that will vest on January 2, 2021, and 3,045 RSUs that will vest on January 2, 2022.
(5) This amount represents 11,025 RPSUs that vested on January 3, 2020, 11,088 that will vest on January 2, 2021, and 17,001 that will vest on January 2, 2022. On January 3, 2020, the 2017 RPSU award vested at 157% of target based on the Company’s TSR performance ranked against the TSR performance of the Performance Peer Group.
(6) This amount represents 1,916 RSUs that vested on January 2, 2020, 10,967 RSUs that vested on January 3, 2020, 5,240 RSUs that will vest on January 2, 2021, and 1,923 RSUs that will vest on January 2, 2022.
(7) This amount represents 10,738 RPSUs that will vest on January 2, 2022.
(8) This amount represents 4,283 RSUs that vested on January 2, 2020, 9,249 RSUs that vested on January 3, 2020, 7,087 RSUs that will vest on January 2, 2021, and 4,297 RSUs that will vest on January 2, 2022.
Option Exercises and Stock Vested
Fiscal Year Ended December 31, 2019
|
| | | | | | | | | | |
| | Option Awards | | Stock Awards |
| Name | | Number of Shares Acquired on Exercise (#) | | Value Realized on Exercise ($) | | Number of Shares Acquired on Vesting (#)(1) | | Value Realized on Vesting ($) |
| Christopher S. Sotos | | — |
| | — |
| | 95,628 (2) | | 1,676,418 (3) |
| Chad Plotkin | | — |
| | — |
| | 9,801 (4) | | 170,136 (3) |
| Kevin P. Malcarney | | — |
| | — |
| | 19,943(5) | | 351,612(6) |
| Mary‑Lee Stillwell | | — |
| | — |
| | 16,523(7) | | 291,303(6) |
(1) Includes shares and DERs that vested pursuant to underlying awards and converted to Class C common stock in 2019.
(2) Represents 7,080 RSUs and 509 DERs that vested on January 2, 2019 pursuant to the stock compensation award granted on January 2, 2018. Represents 8,749 RSUs and 1,207 DERs that vested on January 3, 2019 pursuant to the stock compensation award granted on January 3, 2017. Represents 66,559 RSUs and 11,524 DERs that vested on January 4, 2019 pursuant to the stock compensation award granted on August 8, 2016.
(3) The values are based on January 2, 2019 Class C common stock closing share price of $17.20 for awards and DERs that vested on January 2, 2019. The values are based on January 3, 2019 Class C common stock closing share price of $17.00 for awards and DERs that vested on January 3, 2019. The values are based on January 4, 2019 Class C common stock closing share price of $17.63 for awards and DERs that vested on January 4, 2019.
(4) Represents1,982 RSUs and 142 DERs that vested on January 2, 2019 pursuant to the stock compensation award granted on January 2, 2018. Represents 2,450 RSUs and 338 DERs that vested on January 3, 2019 pursuant to the stock compensation award granted on January 3, 2017. Represents 4,226 RSUs and 663 DERs that vested on January 4, 2019 pursuant to the stock compensation award granted on November 7, 2016.
(5) Represents 18,942 RSUs and 1,001 DERs that vested on January 4, 2019 pursuant to the stock compensation award granted on May 11, 2018.
(6) The values are based on January 4, 2019 Class C common stock closing share price of $17.63 for awards and DERs that vested on January4, 2019.
(7) Represents 15,975 RSUs and 548 DERs that vested on January 4, 2019 pursuant to the stock compensation award granted on August 31, 2018.
Employment Agreements
The Company has not entered into employment agreements with any officers other than Mr. Sotos.
On August 8, 2016, the Company entered into an employment agreement with Mr. Sotos pursuant to which Mr. Sotos serves as the Company’s President and CEO for the term that began on May 6, 2016 (the “Effective Date”) and ending on the date that his employment is terminated by either party. The employment agreement entitled Mr. Sotos to an annual base salary of $500,000 for the period beginning on the Effective Date and ended on December 31, 2016. For each annual period thereafter, our Board determines whether to increase Mr. Sotos’ annual base salary (as noted in the above Summary Compensation Table, Mr. Sotos’ base salary was increased to over $600,000 for fiscal year 2019). The employment agreement provides that, beginning with the 2016 fiscal year, Mr. Sotos is eligible to receive an annual bonus at a target amount equal to 100% of base salary (i.e., AIP bonus), based on achievement of criteria determined by the Board with input from Mr. Sotos. The maximum award opportunity each year is 200% of the target amount. The employment agreement further provides that Mr. Sotos is eligible to participate in the LTIP, on such terms as are set forth in the plan. Mr. Sotos’ target LTIP award for the 2019 fiscal year was approximately 250% of base salary.
In addition to the compensation and benefits described above, as well as paid vacation and director and officer liability insurance, the employment agreement provides that Mr. Sotos will receive the following:
Reimbursement for annual tax return preparation expenses and tax advice and financial planning, up to a maximum of $12,000 per year;
Eligibility to participate in the Company’s retirement plans, health and welfare plans, and disability insurance plans under the same terms, and to the same extent, as other senior management of the Company;
Reimbursement for the costs of litigation or other disputes incurred in asserting any claims under the employment agreement, unless the court finds in favor of the Company; and
Reimbursement for legal fees and expenses incurred in connection with negotiating the employment agreement and other agreements referenced therein, up to a maximum of $6,000, which reimbursement was completed in 2016.
The employment agreement also entitles him to certain severance payments and benefits in the event his employment terminates under certain circumstances. These severance payments and benefits are described and quantified under the section “Severance and Change‑in‑Control” below. In addition, under the employment agreement, the Company has agreed to indemnify Mr. Sotos against any claims arising as a result of his position with the Company to the maximum extent permitted by law.
The employment agreement includes non‑competition and non‑solicitation restrictions on Mr. Sotos during the term of his employment and for one year after his termination of employment. The employment agreement also includes confidentiality, indemnification obligations and intellectual property restrictions and an obligation for Mr. Sotos to cooperate with the Company in the event of any internal, administrative, regulatory, or judicial proceeding. The provisions of the employment agreement may only be waived with the written consent of the Company and Mr. Sotos.
Severance and Change‑In‑Control
Each NEO’s RPSU and RSU award agreements under the LTIP provide for special treatment in the event of such NEO’s termination of employment under certain circumstances. Upon death or disability, an NEO’s RSUs and RPSUs will vest in full and the performance metrics with respect to the RPSUs will be deemed to be achieved at target levels. Upon retirement, an NEO’s RSUs and RPSUs will remain eligible for vesting pursuant to the award agreement as though the NEO was continuously employed by the Company throughout the relevant period; provided that retirement occurs more than 12 months following the applicable award’s grant date. Further, if an NEO’s employment is involuntarily terminated by the Company without cause (as defined in Mr. Sotos’ employment agreement with respect to Mr. Sotos’ and as defined in the LTIP with respect to the other NEOs) within the six months immediately prior to, or the 12 months immediately following, a change in control of the Company (as defined in the LTIP), (i) such NEO’s RSUs will vest in full immediately upon the later of such change in control or such termination of employment and (ii) the Compensation Committee will, pursuant to the terms and conditions of the LTIP and RPSU award agreement(s), determine the final amount payable to the NEO, if any, pursuant to his or her RPSUs. In general, no RPSU or RSU accelerated vesting applies to any other involuntary termination, although new hire grants of RSUs, such as the grant made to Ms. Stillwell on August 31, 2018, provide pro-rated vesting for certain involuntary terminations of service that occur in connection with certain significant business events.
In addition to the above described treatment of his or her equity awards, Mr. Sotos, pursuant to his employment agreement, and the other NEOs, pursuant to the CIC Plan and in some cases, the AIP, are entitled to certain additional severance payments and benefits in the event of termination of employment under certain circumstances, including following a change‑in‑control.
Mr. Sotos’ Benefits
If Mr. Sotos’ employment is involuntarily terminated by the Company without cause or if he terminates his employment for good reason, subject to Mr. Sotos executing a release of claims, the Company agrees to provide Mr. Sotos with the following severance benefits:
A lump sum payment equal to no less than 1.5 times Mr. Sotos’ annual base salary in effect at the time of the Effective Date;
A lump sum payment equal to the target bonus opportunity under the then‑current bonus plan, which amount will be pro‑rated based on the number of days during the year that he was employed by the Company;
Any unpaid bonus amount for the prior fiscal year to the extent not paid prior to the termination date; and
Reimbursement of COBRA premiums for 18 months after the date of termination, except that such coverage will be discontinued if Mr. Sotos becomes eligible for medical benefits from a subsequent employer or otherwise.
If Mr. Sotos’ employment is involuntarily terminated by the Company without cause or if he terminates his employment for good reason within the six months immediately prior to, or the 12 months immediately following, a change‑in‑control of the Company, in lieu of the severance benefits set forth above, the Company will provide Mr. Sotos with the following severance benefits:
A lump sum payment of no less than three times the sum of (a) Mr. Sotos’ base salary in effect at the Effective Date and (b) Mr. Sotos’ target bonus opportunity for the year of termination;
A lump sum payment equal to the target bonus opportunity under the then‑current bonus plan, which amount will be pro‑rated based on the number of days during the year that he was employed by the Company;
Any unpaid bonus amount for the prior fiscal year to the extent not paid prior to the termination date; and
Reimbursement of COBRA premiums for 18 months after the date of termination, except that such coverage will be discontinued if Mr. Sotos becomes eligible for medical benefits from a subsequent employer or otherwise.
If Mr. Sotos’ employment is terminated as a result of his death or disability, the Company agrees to pay him an amount equal to the target bonus opportunity for the year of termination, which amount will be pro‑rated based on the number of days during the year that Mr. Sotos’ was employed by the Company. In addition, the Company will pay Mr. Sotos any unpaid bonus amount for the prior fiscal year to the extent not paid prior to the termination date.
If an excise tax under Section 4999 of the Code would be triggered by any payments under Mr. Sotos’ employment agreement or otherwise upon a change‑in‑control, the Company will reduce such payments so that no amounts are subject to Section 4999 of the Code, if such reduction would cause the amount to be retained by Mr. Sotos to be greater than if Mr. Sotos were required to pay such excise tax.
NEO Benefits
Eligible NEOs may receive a discretionary payment of the prorated target bonus under the AIP in the event of such NEO’s termination of employment under certain circumstances, including upon his or her termination due to retirement or involuntary termination without cause. Such amount, if payable in the Compensation Committee’s discretion, will be pro-rated based on the number of days during the year that he or she was employed by the Company. In addition, under the CIC Plan, in the event of involuntary termination without cause, eligible NEOs are entitled to a general severance benefit equal to 1.5 times base salary payable in a lump sum amount and reimbursement for COBRA benefits continuation cost for a period of 18 months.
The CIC Plan also provides a change‑in‑control benefit in the event that, within six months prior to, as well as 12 months following, a change‑in‑control, an eligible NEO’s employment is either involuntarily terminated by the Company without cause or voluntarily terminated by such NEO for good reason. Mr. Plotkin’s change‑in‑control benefit consists of an amount equal to 2.99 times the sum of his base salary plus the annual target incentive for the year of termination, payable in a lump sum amount. The change‑in‑control benefit for other eligible NEOs (other than Mr. Plotkin) consists of an amount equal to two times the sum of their base salary plus the annual target incentive for the year of termination, payable in a lump sum amount. All such NEOs are also eligible for an amount equal to their target bonus for the year of termination, prorated for the number of days during the
performance period that such NEO was employed by the Company and reimbursement for COBRA benefits continuation cost for a period of 18 months.
As a condition of receiving severance or change‑in‑control benefits, an eligible NEO must execute a release of claims and acknowledge the restrictive covenants in the CIC Plan. Such restrictive covenants include non‑competition, non‑solicitation and non‑disparagement covenants applicable for one year after termination, confidentiality and intellectual property obligations.
If an excise tax under Section 4999 of the Code would be triggered for an eligible NEO by any payments under the CIC Plan or otherwise upon a change‑in‑control, the Company will reduce such payments so that no amounts are subject to Section 4999 of the Code, if such reduction would cause the amount to be retained such NEO to be greater than if such NEO were required to pay such excise tax.
Definition of Change‑In‑Control, Etc.
In general, under Mr. Sotos’ employment agreement and the CIC Plan, a “change‑in‑control” occurs in the event: (a) any person or entity (with certain exceptions), becomes the direct or indirect beneficial owner of 50% or more of the Company’s voting stock or obtains the power to, directly or indirectly, vote or cause to be voted 50% or more of the Company’s capital stock entitled to vote in the election of directors, including by contract or through proxy, (b) directors serving on the Board as of a specified date cease to constitute at least a majority of the Board unless such directors are approved by a vote of at least two‑thirds (2/3) of the incumbent directors, provided that a person whose assumption of office is in connection with an actual or threatened election contest or actual or threatened solicitation of proxies including by reason of agreement intended to avoid or settle such contest shall not be considered to be an incumbent director, (c) any reorganization, merger, consolidation, sale of all or substantially all of the assets of the Company or other transaction is consummated and the previous stockholders of the Company fail to own at least 50% of the combined voting power of the resulting entity in substantially the same proportions of their ownership in the Company immediately prior to such transaction, or (d) the stockholders approve a plan or proposal to liquidate or dissolve the Company.
An involuntary termination without “cause” means the NEO’s termination by the Company for any reason other than the NEO’s (a) conviction of, or agreement to a plea of nolo contendere to, a felony or other crime involving moral turpitude (including an indictment therefor under the CIC Plan), (b) willful failure to perform his or her duties, (c) willful gross neglect or willful misconduct (including a material act of theft, fraud, malfeasance or dishonesty in connection with his or her performance of duties under the CIC Plan), or (d) breach of any written agreement between the Company or NEO, a violation of the Company’s Code of Conduct or other written policy (or in Mr. Sotos’ case, a material breach of his employment agreement).
A voluntary termination for “good reason” means the resignation of the NEO in the event of (a) a material reduction in his or her compensation or benefits, (b) a material diminution in his or her title, authority, duties or responsibilities, or (c) the failure of a successor to the Company to agree, in writing, to assume the CIC Plan within 15 days after a merger, consolidation, sale or similar transaction. In Mr. Sotos’ case only, “good reason” also includes (i) any material failure by the Company to comply with his employment agreement, (ii) his removal from the Board, (iii) the failure to elect him to the Board during any regular election, (iv) any reduction in his target annual bonus opportunity and long-term incentive award, or (v) a change in reporting structure of the Company requiring Mr. Sotos to report to anyone other than the Board.
Potential Payments Upon Termination or Change‑In‑Control
The amount of compensation payable to each NEO in each circumstance is shown in the table below, assuming that termination of employment occurred as of December 31, 2019, and including payments that would have been earned as of such date. The amounts shown below do not include benefits payable under the Company’s 401(k) plan.
|
| | | | | | | | | | | |
| Named Executive Officer | | Involuntary Termination Not for Cause ($) | Voluntary Termination for Good Reason ($) | | Involuntary Not for Cause or Voluntary for Good Reason Following a Change in Control ($) | | Death or Disability ($) |
| Christopher S. Sotos | | 1,391,643 |
| 1,391,643 |
| | 8,086,500 |
| | 4,722,857 |
|
| Chad Plotkin | | 828,380 |
| — |
| | 3,282,110 |
| | 1,433,810 |
|
| Kevin P. Malcarney | | 601,992 |
| — |
| | 1,652,215 |
| | 780,223 |
|
| Mary‑Lee Stillwell | | 786,806 |
| — |
| | 1,505,044 |
| | 648,222 |
|
CEO Pay Ratio
As a result of the recently adopted rules under the Dodd‑Frank Act, the SEC requires disclosure of the CEO to median employee pay ratio. The following is a reasonable estimate, prepared under applicable SEC rules, of the ratio of the annual total compensation of our CEO, Mr. Sotos, to the annual total compensation of our median employee.
We determined that we could use in our 2019 CEO pay ratio analysis the same median employee that we identified in 2018 given that there has been no change in either our employee population or our employee compensation arrangements that we believe would significantly impact our 2019 pay ratio disclosure. Similarly, there has been no change in our median employee's circumstances that we reasonably believe would result in a significant change to our 2019 pay ratio disclosure. Our median employee’s annual total compensation for 2019 was determined using the same rules that apply to reporting the compensation of our NEOs (including our CEO) in the “Total” column of the “Summary Compensation Table - 2017 - 2019” above. The following total compensation amounts were determined based on that methodology:
The annual total compensation of the median employee for 2019 was $85,913.
The annual total compensation of Mr. Sotos for 2019 was $3,054,942.
As a result, we estimate that Mr. Sotos’ 2019 annual total compensation was approximately 36 times that of our median employee.
Given the different methodologies, exemptions, estimates and assumptions that various public companies use to determine an estimate of their pay ratio, the estimated ratio reported above should not be solely used as a basis for comparison between companies.
Item 12 — Security Ownership of Certain Beneficial Owners and Management and Related Stockholder Matters
Clearway Energy LLC Ownership
As of December 31, 2019, GIP, through CEG, owned 42,738,750 of each of the Company's Class B units and Class D units and Clearway, Inc. owned 34,586,250 of the Company's Class A units and 73,187,646 of the Company's Class C units. Clearway, Inc., through its holdings of Class A units and Class C units, has a 57.01% economic interest in the Company. Clearway, Inc. consolidates the results of the Company through its controlling interest as sole managing member. GIP, through CEG's holdings of Class B units and Class D units, has a 42.99% economic interest in the Company.
Clearway Energy, Inc. Ownership
Stock Ownership of Executive Officers
The following table sets forth information concerning beneficial ownership of Clearway, Inc.’s Class A and Class C common stock and combined voting power of Class A, Class B, Class C and Class D common stock for: (a) each NEO and (b) all executive officers as a group. The percentage of beneficial ownership is based on 34,599,645 shares of Class A common stock outstanding as of February 24, 2020 and 78,850,894 shares of Class C common stock outstanding as of February 24, 2020, and percentage of combined voting power is based on 78,554,291 votes represented by Clearway, Inc.’s outstanding Class A, Class B, Class C and Class D common stock in the aggregate as of February 24, 2020. The percentage of beneficial ownership and the percentage of combined voting power also include any shares that such person has the right to acquire within 60 days of February 24, 2020. Unless otherwise indicated, each person has sole voting and dispositive power with respect to the shares set forth in the following table.
The address of the beneficial owners is Clearway Energy, Inc., 300 Carnegie Center, Suite 300, Princeton, New Jersey 08540.
|
| | | | | | | |
| | | Common Stock |
| Class A Common Stock | Class C Common Stock | % of |
| Executive Officers | Number(1) | % of Class A Common Stock | Number(1) | % of Class C Common Stock | Combined Voting Power(2) |
| Christopher S. Sotos | 23,100(3) |
| * |
| 124,515(3) | * | * |
| Chad Plotkin | 6,697(4) |
| * |
| 30,385(4) | * | * |
| Kevin P. Malcarney | 600(5) |
| * |
| 29,316(5) | * | * |
| Mary‑Lee Stillwell | — |
| — |
| 17,553(6) | * | * |
All executive officers as a group (four people) | 30,397(7) |
| * |
| 201,769 (7) | * | * |
| | | | | |
* Less than one percent of outstanding Class A common stock, Class C common stock or combined voting power, as applicable.
(1) The number of shares beneficially owned by each person or entity is determined under the rules of the SEC, and the information is not necessarily indicative of beneficial ownership for any other purpose. Under such rules, each person or entity is considered the beneficial owner of any: (a) shares to which such person or entity has sole or shared voting power or dispositive power and (b) shares that such person or entity has the right to acquire within 60 days.
(2) Represents the voting power of all of the classes of Clearway, Inc.’s common stock together as a single class. Each holder of Class A or Class B common stock is entitled to one vote for each share held. Each holder of Class C or Class D common stock is entitled to 1/100th of one vote for each share held. Holders of shares of Clearway, Inc.’s Class A, Class B, Class C and Class D common stock vote together as a single class on all matters presented to its stockholders for their vote or approval, except as otherwise provided by applicable law.
(3) Includes 9,489 DERs to be paid in Class C common stock. Excludes 26,650 RSUs and 94,270 RPSUs. Each RSU represents the right to receive one share of Class C common stock upon vesting. Each RPSU represents the potential to receive Class C common stock based upon Clearway, Inc. achieving a certain level of total shareholder return relative to Clearway, Inc.’s peer group over a three-year performance period. Each DER represents the right to receive the dividends and distributions that would have otherwise been paid with respect to a share subject to a RSU or RPSU award (if such share were outstanding rather than being subject to the applicable award).
(4) Includes 2,771 DERs to be paid in Class C common stock. Excludes 8,069 RSUs and 28,089 RPSUs. Each RSU represents the right to receive one share of Class C common stock upon vesting. Each RPSU represents the potential to receive Class C common stock based upon Clearway, Inc. achieving a certain level of total shareholder return relative to Clearway, Inc.’s peer group over a three-year performance period. Each DER represents the right to receive the dividends and distributions that would have otherwise been paid with respect to a share subject to a RSU or RPSU award (if such share were outstanding rather than being subject to the applicable award).
(5) Includes 1,066 DERs to be paid in Class C common stock. Excludes 7,163 RSUs and 10,738 RPSUs. Each RSU represents the right to receive one share of Class C common stock upon vesting. Each RPSU represents the potential to receive Class C common stock based upon Clearway, Inc. achieving a certain level of total shareholder return relative to Clearway, Inc.’s peer group over a three-year performance period. Each DER represents the right to receive the dividends and distributions that would have otherwise been paid with respect to a share subject to a RSU or RPSU award (if such share were outstanding rather than being subject to the applicable award).
(6) Includes 662 DERs to be paid in Class C common stock. Excludes 11,384 RSUs. Each RSU represents the right to receive one share of Class C common stock upon vesting. Each DER represents the right to receive the dividends and distributions that would have otherwise been paid with respect to a share subject to a RSU award (if such share were outstanding rather than being subject to the applicable award).
(7) Consists of the total holdings of all executive officers as a group.
Item 13 — Certain Relationships and Related Transactions, and Director Independence
Relationship with GIP and Clearway Energy, Inc.
GIP, through its ownership of CEG, indirectly owns all of Clearway, Inc.’s outstanding Class B common stock and its Class D common stock, which represents, in the aggregate, 54.95% of the voting interest in its stock and receives distributions from the Company through its ownership of our Class B and Class D units. Holders of Clearway, Inc.’s Class A common stock and Class C common stock hold, in the aggregate, the remaining 45.05% of the voting interest in its stock. Each holder of Class A or Class B common stock is entitled to one vote for each share held. Each holder of Class C or Class D common stock is entitled to 1/100th of one vote for each share held. The holders of Clearway, Inc.’s outstanding shares of Class A and Class C common stock are entitled to dividends as declared. Clearway, Inc., through its holdings of Class A units and Class C units, has a 57.01% economic interest in the Company. Clearway, Inc. consolidates the results of the Company through its controlling interest as sole managing member. GIP, through CEG's holdings of Class B units and Class D units, has a 42.99% economic interest in the Company.
Accordingly, through its voting control of Clearway, Inc., GIP effectively has the ability to control our management.
Related Party Transactions
Strategic Sponsorship with GIP
In connection with the GIP Transaction, Clearway, Inc. entered into a Consent and Indemnity Agreement with NRG and GIP setting forth key terms and conditions of Clearway, Inc.'s consent to the GIP Transaction.
Also, in connection with the GIP Transaction, the Company entered into the following agreements on August 31, 2018:
CEG Master Services Agreements
The Company, along with Clearway, Inc. and Clearway Energy Operating LLC, entered into Master Services Agreements with CEG (the “CEG Master Services Agreements”), pursuant to which CEG and certain of its affiliates or third-party service providers began providing certain services, including operational and administrative services, which include human resources, information systems, external affairs, accounting, procurement, and risk management services, to the Company and certain of its subsidiaries, and the Company and certain of its subsidiaries began providing certain services, including accounting, internal audit, tax and treasury services, to CEG, in exchange for the payment of fees in respect of such services. For the year ended December 31, 2019, the Company paid approximately $1,059,000 under the CEG Master Services Agreements. In addition, certain Thermal segment projects reimbursed CEG approximately $1,433,000 during the year ended December 31, 2019 for costs incurred by CEG on behalf of such entities.
Voting and Governance Agreement
The Company entered into a Voting and Governance Agreement with CEG, relating to certain governance matters of the Company, including the composition of the Board of Clearway, Inc. and employment status of the CEO of the Company.
Limited Liability Company Agreement
Clearway, Inc. entered into the Fourth Amended and Restated Limited Liability Company Agreement of Clearway Energy LLC with CEG, which sets forth the rights and obligations of Clearway, Inc., as managing member, and CEG, as member, of the Company as further described below.
Right of First Offer Agreements
CEG ROFO Agreement
On August 31, 2018, Clearway, Inc. entered into a ROFO Agreement with CEG (the “CEG ROFO Agreement”) and, solely for certain purposes thereof, GIP, pursuant to which CEG granted Clearway, Inc. and its subsidiaries a right of first offer on any proposed sale or transfer of certain assets owned by CEG. On August 1, 2019, the CEG ROFO Agreement was amended to grant Clearway, Inc. and its affiliates a right of first offer on any proposed sale, transfer or other disposition of certain assets of CEG (the “CEG ROFO Assets”) until August 31, 2023, as listed in the table below. CEG is not obligated to sell the remaining CEG ROFO Assets to us and, if offered by CEG, we cannot be sure whether these assets will be offered on acceptable terms or that we will choose to consummate such acquisitions.
The assets listed below represent our currently committed investments in projects with CEG, as well as the assets subject to our ROFO Agreement with CEG:
|
| | | | | | | | |
| Committed Investments |
| Asset | | Technology | | Net Capacity (MW) | | State | | COD |
$33 MM remaining in distributed and community solar partnerships(a) | | PV | | N/A | | Various | | Various |
| | | | | | | | | |
| CEG ROFO |
| Asset | | Technology | | Net Capacity (MW) | | State | | COD |
| Mililani I | | PV | | 39 | | HI | | 2021 |
| Waiawa | | PV | | 36 | | HI | | 2021 |
| Langford | | Wind | | 150 | | TX | | 2009 |
| Up to $170 MM equity investment in business renewables | | PV | | TBD | | Various | | TBD |
Rattlesnake(b) | | Wind | | 144 | | WA | | 2020 |
| Black Rock | | Wind | | 110 | | WV | | 2021 |
| Wildflower | | Solar | | 100 | | MS | | 2021 |
| Pinnacle Repowering | | Wind | | 55 | | WV | | 2020 |
(a)On December 26, 2018, we and CEG amended the DGPV Holdco 3 partnership agreement to increase the capital commitment of $50 million to $70 million.
(b) On January 8, 2020, CEG offered us the opportunity to acquire 100% of the equity interests in Rattlesnake.
Prior to engaging in any negotiation regarding any disposition, sale or other transfer of any of the remaining CEG ROFO Assets, CEG will deliver a written notice to us setting forth the material terms and conditions of the proposed transaction. During the 30‑day period after the delivery of such notice, we will negotiate with CEG in good faith to reach an agreement on the transaction. If we do not reach an agreement within such 30‑day period, CEG will be able within the next 180 calendar days to sell, transfer, dispose or recontract such CEG ROFO Asset to a third party (or to agree in writing to undertake such transaction with a third party) on terms generally no less favorable to CEG than those offered pursuant to the written notice.
Under the CEG ROFO Agreement, CEG is not obligated to sell the remaining CEG ROFO Assets. In addition, any offer to sell under the CEG ROFO Agreement will be subject to an inherent conflict of interest because the same professionals within CEG’s organization that are involved in acquisitions that are suitable for us have responsibilities within CEG’s broader asset management business. Notwithstanding the significance of the services to be rendered by CEG or their designated affiliates on our behalf or of the assets which we may elect to acquire from CEG in accordance with the terms of the CEG ROFO Agreement or otherwise, CEG does not owe fiduciary duties to us or our unitholders. Any material transaction with CEG (including the proposed acquisition of any CEG ROFO Asset) will be subject to Clearway, Inc.’s related person transaction policy, which will require prior approval of such transaction by Clearway, Inc.’s Corporate Governance, Conflicts and Nominating Committee.
Carlsbad Drop Down
On December 6, 2019, the Company acquired 100% of GIP's membership interests in CBAD Holdings, LLC, which indirectly owns Carlsbad Energy Center LLC, a 527 megawatt natural gas fired power project located in Carlsbad, California, or the Carlsbad Drop Down Asset. The purchase price for the Carlsbad Drop Down was $184 million in cash, plus assumption of $803 million in project level financing including non-recourse senior secured notes. The acquisition was funded with proceeds from the Clearway Energy, Inc. equity issuance on December 2, 2019 for net proceeds of $79$100 million, as well as borrowings from the Company's revolving credit facility. The Carlsbad acquisition is the result of the Company having elected its option to purchase Carlsbad pursuant to the ROFO agreement, as amended, by and incurred commission fees of $790 thousand, as described in Sources of Liquidity in this Item 7.
among Clearway, Inc., CEG and GIP.
Partnerships with CEG
DGPV Holdco 1 LLC
DGPV Holding LLC, our wholly‑owned subsidiary, and CEG are parties to the DGPV Holdco 1 LLC partnership (“DGPV Holdco 1”), the purpose of which is to own or purchase solar power generation projects and other ancillary related assets from CEG or its subsidiaries, via intermediate funds. The Company owns approximately 52 MW of distributed solar capacity, based on cash to be distributed, with a weighted average contract life of 16 years. Under this partnership, the Company committed to fund up to $100 million of capital.
DGPV Holdco 2 LLC
DGPV Holding LLC, our wholly‑owned subsidiary, and CEG are parties to the DGPV Holdco 2 LLC partnership (“DGPV Holdco 2”), the purpose of which is to own or purchase solar power generation projects as well as other ancillary related assets from CEG or its subsidiaries, via intermediate funds. The Company owns approximately 113 MW of distributed solar capacity, based on cash to be distributed, with a weighted average contract life of 19 years. Under this partnership, the Company committed to fund up to $60 million of capital.
DGPV Holdco 3 LLC
DGPV Holding LLC, our wholly‑owned subsidiary, and CEG are parties to the DGPV Holdco 3 LLC partnership (“DGPV Holdco 3”), in which the Company plans to invest up to $70 million in an operating portfolio of distributed solar assets, primarily comprised of community solar projects, developed by CEG. The Company owns approximately 112 MW of distributed solar capacity, based on cash to be distributed, with a weighted average contract life of approximately 21 years as of December 31, 2019. The Company had a $14 million payable due to DGPV Holdco 3 LLC as of December 31, 2019.
The Company’s maximum exposure to loss is limited to its equity investment in DGPV Holdco 1, DGPV Holdco 2 and DGPV Holdco 3, which was $318 million on a combined basis as of December 31, 2019.
RPV Holdco 1 LLC
RPV Holding LLC, our wholly‑owned subsidiary, and CEG are parties to the RPV Holdco 1 LLC partnership (“RPV Holdco”) that holds operating portfolios of residential solar assets developed by a subsidiary of CEG, including: (i) an existing, unlevered portfolio of approximately 2,100 leases across nine states representing approximately 14 MW, based on cash to be distributed, with a weighted average remaining lease term of approximately 13 years that was acquired outside the partnership; and (ii) a tax equity‑financed portfolios of approximately 5,300 leases representing approximately 31 MW, based on cash to be distributed, with an average lease term for the existing and new leases of approximately 15 years. The Company had fully funded the partnership as of December 31, 2017.
The Company’s maximum exposure to loss is limited to its equity investment, which was $24 million as of December 31, 2019.
Repowering PartnershipDevelopment Costs
On August 30,Development costs increased by $2 million during the year ended December 31, 2019 primarily due to higher business development activity within the Thermal segment.
Equity in Earnings of Unconsolidated Affiliates
Equity in earnings of unconsolidated affiliates increased by $9 million during the year ended December 31, 2019 compared to the same period in 2018, Wind TEprimarily due to higher income allocated to RPV Holdco entered into a partnership with CEG in order2019 compared to facilitate2018, partially offset by higher losses at Desert Sunlight, DGPV Holdco entities, as well as GenConn and Avenal.
Loss on Debt Extinguishment
The Company recorded loss on debt extinguishment of $16 million for the repoweringyear ended December 31, 2019, $15 million of which relates to the redemption of the Elbow Creek2024 Senior Notes. On December 13, 2019, the Company repurchased an aggregate principal amount of $412 million, or 82.4% of the 2024 Senior Notes, which was effectuated at a premium of 103% for a total consideration of $424 million and Wildorado facilities. as a result, the Company recorded a loss on extinguishment in the amount of $12 million. In addition, the Company recorded a $3 million debt extinguishment loss in connection with the write off of the deferred financing fees related to the 2024 Senior Notes.
Interest Expense
Interest expense increased by $109 million during the year ended December 31, 2019, compared to the same period in 2018 primarily due to:
|
| | | | |
| Reason for Increase (Decrease) | | (In millions) |
| Change in fair value of interest rate swaps as well as reclassification of losses previously deferred in AOCI to the statement of operations in connection with project-level debt financing activities | | $ | 91 |
|
| Issuance of 2025 Senior Notes, partially offset by lower interest expense for the intercompany notes between Clearway Operating LLC and Clearway, Inc., which were partially repaid in connection with the tender offer in October 2018 | | 11 |
|
| Additional interest expense primarily from the issuance of Energy Center Minneapolis Series E, F, G, H Notes in June 2018 and in connection with acquisitions in the Thermal and Conventional segments, partially offset by lower interest expense due to lower principal balances of project level debt across the segments | | 7 |
|
| | | $ | 109 |
|
Net Loss Attributable to Noncontrolling Interests
For the year ended December 31, 2019, the Company had a net loss of $57 million attributable to noncontrolling interests with respect to its tax equity financing arrangements and the application of the HLBV method, as well as a net loss of $21 million attributable to CEG's economic interest in Repowering, Oahu and Kawailoa partnerships. The losses were partially offset by $7 million of income attributable to a third party's interest in Kawailoa partnership.
For the year ended December 31, 2018, the Company had a loss of $1 million attributable to CEG's economic interest in Repowering LLC and a loss of $104 million attributable to noncontrolling interests with respect to its tax equity financing arrangements and the application of the HLBV method.
Liquidity and Capital Resources
The Company's principal liquidity requirements are to meet its financial commitments, finance current operations, fund capital expenditures, including acquisitions from time to time, service debt and pay distributions. As a normal part of the repowering partnership,Company's business, depending on market conditions, the Company bought outwill from time to time consider opportunities to repay, redeem, repurchase or refinance its indebtedness. Changes in the Company's operating plans, lower than anticipated sales, increased expenses, acquisitions or other events may cause the Company to seek additional debt or equity financing in future periods. There can be no guarantee that financing will be available on acceptable terms or at all. Debt financing, if available, could impose additional cash payment obligations and additional covenants and operating restrictions.
Current Liquidity Position
As of December 31, 2019 and 2018, the Company's liquidity was approximately $839 million and $1,037 million, respectively, comprised of cash, restricted cash and availability under the Company's revolving credit facility.
|
| | | | | | | |
| | As of December 31, |
| | 2019 | | 2018 |
| | (In millions) |
| Cash and cash equivalents: | | | |
| Clearway Energy LLC, excluding subsidiaries | $ | 27 |
| | $ | 298 |
|
| Subsidiaries | 125 |
| | 109 |
|
| Restricted cash: | | | |
| Operating accounts | 129 |
| | 84 |
|
| Reserves, including debt service, distributions, performance obligations and other reserves | 133 |
| | 92 |
|
| Total cash, cash equivalents and restricted cash | $ | 414 |
| | $ | 583 |
|
| Revolving credit facility availability | $ | 425 |
| | $ | 454 |
|
| Total liquidity | $ | 839 |
| | $ | 1,037 |
|
The Company's liquidity includes $262 million and $176 million of restricted cash balances as of December 31, 2019 and 2018, respectively. Restricted cash consists primarily of funds to satisfy the requirements of certain debt arrangements and funds held within the Company's projects that are restricted in their use.As of December 31, 2019, these restricted funds comprised of $129 million designated to fund operating expenses, approximately $24 million designated for current debt service payments, and $30 million restricted for reserves including debt service, performance obligations and other reserves, as well as capital expenditures. The remaining $79 million is held in distribution reserve accounts, of which $58 million related to subsidiaries affected by the PG&E Bankruptcy as discussed further below and may not be distributed during the pendency of the bankruptcy. Such subsidiaries had a total of $177 million in restricted cash as of December 31, 2019.
As of December 31, 2019, the Company had no borrowings under the revolving credit facility and $70 million of letters of credit were outstanding under the revolving credit facility. The Company had $170 million outstanding under the revolving credit facility and a total of $69 million in letters of credit outstanding as of February 24, 2020.
On January 29, 2019, PG&E filed for bankruptcy under Chapter 11 of the U.S. Bankruptcy Code. The PG&E Bankruptcy had no effect on availability under the Company’s revolving credit facility. However, the Company has non-recourse project-level debt related to each of its subsidiaries that sell their output to PG&E under long-term PPAs. The PG&E Bankruptcy filing is an event of default under the related financing agreements which caused uncertainty around the timing of when certain project-level cash distributions will be available to the Company. As of December 31, 2019, all project level cash balances for these subsidiaries were classified as restricted cash.
On December 20, 2019, each of Clearway Energy Operating LLC, as borrower, and Clearway Energy LLC, as guarantor, entered into the Fifth Amendment to Amended and Restated Credit Agreement to provide for an increase of 0.50x to the Borrower Leverage Ratio, as defined in the Amended and Restated Credit Agreement, for the last two fiscal quarters of 2020 and to implement certain other technical modifications.
Management believes that the Company's liquidity position, cash flows from operations and availability under its revolving credit facility will be adequate to meet the Company's financial commitments; debt service obligations; growth, operating and maintenance capital expenditures; and to fund distributions to Clearway, Inc. and Clearway Energy Group, LLC. Management continues to regularly monitor the Company's ability to finance the needs of its operating, financing and investing activity within the dictates of prudent balance sheet management.
Credit Ratings
Credit rating agencies rate a firm's public debt securities. These ratings are utilized by the debt markets in evaluating a firm's credit risk. Ratings influence the price paid to issue new debt securities by indicating to the market the Company's ability to pay principal, interest and preferred dividends. Rating agencies evaluate a firm's industry, cash flow, leverage, liquidity and hedge profile, among other factors, in their credit analysis of a firm's credit risk. As of December 31, 2019, the Company's 2024 Senior Notes, 2025 Senior Notes, 2026 Senior Notes, and 2028 Senior Notes are rated BB by S&P and Ba2 by Moody's.
Sources of Liquidity
The Company's principal sources of liquidity include cash on hand, cash generated from operations, proceeds from sales of assets, borrowings under new and existing financing arrangements and the issuance of additional equity and debt securities by Clearway, Inc. or the Company as appropriate given market conditions. As described in Item 15— Note 10, Long-term Debt, to the Consolidated Financial Statements, and above in Significant Events During the Year Ended December 31, 2019, the Company's financing arrangements consist of Clearway, Inc.'s equity offering of Class C common stock on September 27, 2018, corporate level debt, which includes Senior Notes, intercompany borrowings with Clearway, Inc., and the revolving credit facility; the ATM Program; and project-level financings for its various assets.
2028 Senior Notes — On December 11, 2019, Clearway Energy Operating LLC completed the sale of $600 million aggregate principal amount due 2028, or the 2028 Senior Notes. The 2028 Senior Notes bear interest at 4.75% and mature on March 15, 2028.The proceeds from the 2028 Senior Notes were used to partially fund investments into Repowering 1.0, repay the 2024 Senior Notes, and pay transaction fees and expenses.
2019 Equity Offering — On December 2, 2019, Clearway, Inc. issued and sold 5,405,405 shares of Class C common stock for net proceeds of $100 million. Clearway, Inc. utilized the proceeds of the offering to acquire 5,405,405 Class C units of Clearway Energy LLC.
Revolving Credit Facility — The Company has a total of $425 million available under the revolving credit facility as of December 31, 2019. The facility will continue to be used for general corporate purposes including financing of future acquisitions and posting letters of credit.
ATM Program — As of December 31, 2019, approximately $36 million of Clearway, Inc.'s Class C common stock remains available for issuance under the ATM Program.
Uses of Liquidity
The Company's requirements for liquidity and capital resources, other than for operating its facilities, are categorized as: (i) debt service obligations, as described more fully in Item 15 — Note 10, Long-term Debt to the Consolidated Financial Statements; (ii) capital expenditures; (iii) acquisitions and investments; and (iv) distributions.
Debt Service Obligations
Principal payments on debt as of December 31, 2019, are due in the following periods:
|
| | | | | | | | | | | | | | | | | | | | | | | | | | | |
| Description | 2020 | | 2021 | | 2022 | | 2023 | | 2024 | | There- after | | Total |
| | (In millions) |
| Long-term debt - affiliate, due 2020 | 44 |
| | — |
| | — |
| | — |
| | — |
| | — |
| | 44 |
|
| Clearway Energy Operating LLC Senior Notes, due 2024 | 88 |
| | — |
| | — |
| | — |
| | — |
| | — |
| | 88 |
|
| Clearway Energy Operating LLC Senior Notes, due 2025 | — |
| | — |
| | — |
| | — |
| | — |
| | 600 |
| | 600 |
|
| Clearway Energy Operating LLC Senior Notes, due 2026 | — |
| | — |
| | — |
| | — |
| | — |
| | 350 |
| | 350 |
|
| Clearway Energy Operating LLC Senior Notes, due 2028 | — |
| | — |
| | — |
| | — |
| | — |
| | 600 |
| | 600 |
|
| Total Corporate-level debt | 132 |
| | — |
| | — |
| | — |
| | — |
| | 1,550 |
| | 1,682 |
|
| Project-level debt: | | | | | | | | | | | | |
|
|
Alpine, due 2022 (a) | 119 |
| | — |
| | — |
| | — |
| | — |
| | — |
| | 119 |
|
| Alta Wind I - V lease financing arrangements, due 2034 and 2035 | 43 |
| | 45 |
| | 47 |
| | 49 |
| | 51 |
| | 609 |
| | 844 |
|
| Buckthorn Solar, due 2025 | 3 |
| | 3 |
| | 3 |
| | 3 |
| | 4 |
| | 113 |
| | 129 |
|
| Carlsbad Energy Holdings LLC, due 2027 | 19 |
| | 20 |
| | 21 |
| | 22 |
| | 23 |
| | 477 |
| | 582 |
|
| Carlsbad Holdco, due 2038 | 6 |
| | 6 |
| | 7 |
| | 2 |
| | 2 |
| | 193 |
| | 216 |
|
| CVSR, due 2037 (a) | 696 |
| | — |
| | — |
| | — |
| | — |
| | — |
| | 696 |
|
| CVSR Holdco Notes, due 2037 (a) | 182 |
| | — |
| | — |
| | — |
| | — |
| | — |
| | 182 |
|
| Duquesne, due 2059 | — |
| | — |
| | — |
| | — |
| | — |
| | 95 |
| | 95 |
|
| El Segundo Energy Center, due 2023 | 53 |
| | 57 |
| | 63 |
| | 130 |
| | — |
| | — |
| | 303 |
|
| Energy Center Minneapolis Series D, E, F, G, H Notes, due 2025-2037 | — |
| | — |
| | — |
| | — |
| | — |
| | 328 |
| | 328 |
|
Kansas South, due 2030 (a) | 24 |
| | — |
| | — |
| | — |
| | — |
| | — |
| | 24 |
|
| Kawailoa Solar Holdings LLC, due 2026 | 2 |
| | 2 |
| | 2 |
| | 2 |
| | 2 |
| | 72 |
| | 82 |
|
| Laredo Ridge, due 2028 | 6 |
| | 6 |
| | 7 |
| | 7 |
| | 9 |
| | 49 |
| | 84 |
|
Marsh Landing, due 2023 (a) | 206 |
| | — |
| | — |
| | — |
| | — |
| | — |
| | 206 |
|
| Oahu Solar Holdings LLC, due 2026 | 2 |
| | 3 |
| | 3 |
| | 3 |
| | 3 |
| | 77 |
| | 91 |
|
| Repowering Partnership Holdco LLC, due 2020 | 228 |
| | — |
| | — |
| | — |
| | — |
| | — |
| | 228 |
|
| South Trent Wind, due 2028 | 4 |
| | 4 |
| | 5 |
| | 5 |
| | 5 |
| | 20 |
| | 43 |
|
| Tapestry, due 2031 | 13 |
| | 10 |
| | 11 |
| | 11 |
| | 12 |
| | 99 |
| | 156 |
|
| Utah Solar Portfolio, due 2022 | 14 |
| | 13 |
| | 227 |
| | — |
| | — |
| | — |
| | 254 |
|
| Viento, due 2023 | 8 |
| | 5 |
| | 5 |
| | 24 |
| | — |
| | — |
| | 42 |
|
| Walnut Creek, due 2023 | 49 |
| | 53 |
| | 55 |
| | 18 |
| | — |
| | — |
| | 175 |
|
| Other | 22 |
| | 22 |
| | 22 |
| | 43 |
| | 18 |
| | 169 |
| | 296 |
|
| Total project-level debt | 1,699 |
| | 249 |
| | 478 |
| | 319 |
| | 129 |
| | 2,301 |
| | 5,175 |
|
| Total debt | $ | 1,831 |
| | $ | 249 |
| | $ | 478 |
| | $ | 319 |
| | $ | 129 |
| | $ | 3,851 |
| | $ | 6,857 |
|
(a) Entities affected by PG&E Bankruptcy. The PG&E Bankruptcy triggered defaults under the PPAs with PG&E and such related project-level financing agreements. As a result, the Company classified the affected project-level debt as short-term debt as of December 31, 2019.
Capital Expenditures
The Company's capital spending program is mainly focused on maintenance capital expenditures, consisting of costs to maintain the assets currently operating, such as costs to replace or refurbish assets during routine maintenance, and growth capital expenditures, consisting of costs to construct new assets, costs to complete the construction of assets where construction is in process, and capital expenditures related to acquiring additional thermal customers.
For the years ended December 31, 2019, 2018, and 2017, the Company used approximately $228 million, $83 million, and $190 million, respectively, to fund capital expenditures, includingmaintenance capital expenditures of $22 million,$36 million and $27 million, respectively. Growth capital expenditures in 2019 include $180 million in the Renewables segment, $157 million of which were incurred in connection with the Repowering Partnership entered by the Company in August 2018, as well as $29 million incurred in the Oahu Partnership and the Kawailoa Partnership, as further described in Item 15 — Note 5,Investments Accounted for by the Equity Method and Variable Interest Entities. The source for these capital expenditures was financing obtained in connection with the Repowering Partnership, as well as tax equity partnerinvestors contributions. The Company also incurred $26 million of Wind TE Holdcogrowth capital expenditures in the Thermal segment in connection with various development projects.
Growth capital expenditures in 2018 include $33 million in the Renewables segment in connection with the construction of Buckthorn Solar Drop Down Asset, of which $10 million was incurred by NRG during the construction of Buckthorn Solar prior to its acquisition by the Company on March 30, 2018, as described below.
Growth capital expenditures in 2017 primarily relate to $159 million incurred by NRG during the construction of Buckthorn Solar prior to its acquisition by the Company. The Company develops annual capital spending plans based on projected requirements for $19maintenance and growth capital.
The Company estimates $32 million on January 2, 2019.of maintenance expenditures for 2020. These estimates are subject to continuing review and adjustment and actual capital expenditures may vary from these estimates.
Thermal ActivitiesAcquisitions and Investments
The Company intends to acquire generation assets developed and constructed by CEG, as well as generation and thermal infrastructure assets from third parties where the Company believes its knowledge of the market and operating expertise provides a competitive advantage, and to utilize such acquisitions as a means to grow its CAFD.
Carlsbad Drop Down — On June 19, 2018, upon reaching substantial completion,December 6, 2019, the Company acquired from NRG the UPMC Thermal Project for cash consideration100% of $84 million, subject to working capital adjustments. The Company had a payable of $4 million to NRG as of December 31,2018, $3 million ofGIP's membership interests in CBAD Holdings, LLC, which was paid in January 2019 upon final completion of the project pursuant to the EPC agreement. The project adds 73 MWt of thermal equivalent capacity and 7.5 MW of emergency backup electrical capacity to the Company's portfolio. The transaction was accounted for as an asset acquisition and is reflected in the Company's Thermal segment.
As further described in Note 10, Long-term Debt, on June 19, 2018,indirectly owns Carlsbad Energy Center Minneapolis LLC, a subsidiary527 megawatt natural gas fired power project located in Carlsbad, California, or the Carlsbad Drop Down Asset. The purchase price for the Carlsbad Drop Down was $184 million in cash, plus assumption of $803 million in project level financing including non-recourse senior notes. For further discussion, see Item 15 — Note 3 , Acquisitions and Dispositions.
Cayo Largo — On September 29, 2019, the Company entered into an amendeda tolling agreement with Cayo Largo LLC to supply electricity, chilled water, hot water and restated Thermal note purchasenatural gas to Cayo Largo LLC's customer through a dedicated combined heat and private shelf agreement under which it authorizedpower facility to be constructed by the issuance of the Series E Notes, Series F Notes, Series G Notes, and Series H Notes and established a private shelf facility for the further issuance of $40Company. The Company incurred $6 million in notes.
capital expenditures during the year ended December 31, 2019. The Company anticipates the project to total $13 million in capital expenditures and is expected to commence commercial operations in the fourth quarter of 2020.On November 1, 2018, theMylan Pharmaceuticals— The Company entered intois party to an Energy Services Agreement with Mylan LLC to supply chilled water, hot water and electricity through a dedicated combined heat and power facility to be constructed at Mylan's Caguas, Puerto Rico facility. The Company anticipates the project to total $11incurred $4 million and $7 million in capital expenditures during the years ended December 31, 2019 and is expected to commence commercial operationsDecember 31, 2018, respectively, and the project reached COD in the secondfirst quarter of 2019.2020.
Environmental MattersRepowering Partnership — On June 14, 2019, the Company, through an indirect subsidiary, entered into binding equity commitment agreements in the previously announced partnership with CEG to enable the repowering of two of its existing wind assets, Wildorado and Regulatory MattersElbow Creek, which total a combined 283 MW. The Company invested $102 million in net corporate capital to fund the repowering of the wind facilities during the fourth quarter of 2019 and the first quarter of 2020. These assets have reached Repowering COD.
DetailsKawailoa Solar Partnership — On May 1, 2019, the Company entered into a partnership with Clearway Renew LLC, a subsidiary of environmental mattersCEG, to own, finance, operate, and regulatory matters are presentedmaintain the Kawailoa Solar Partnership, which consists of the Kawailoa Solar Project, a 49 MW utility-scale solar generation project located in Oahu, Hawaii. The Company contributed $9 million into the partnership during the year ended December 31, 2019. For further discussion, see Item 15 — Note 5, Investments Accounted for by the Equity Method and Variable Interest Entities.
Oahu Solar Partnership — On March 8, 2019, the Company entered into a partnership with Clearway Renew LLC, a subsidiary of CEG, to own, finance, operate, and maintain the Oahu Solar projects, which consist of Lanikuhana and Waipio, 15 MW and 46 MW utility-scale solar generation projects, respectively, located in Oahu, Hawaii, which reached COD on September 19, 2019 and began to sell power to HECO pursuant to the long-term PPAs. The Company contributed $20 million into the partnership during the year ended December 31, 2019. For further discussion, see Item 15 — Note 5, Investments Accounted for by the Equity Method and Variable Interest Entities
Duquesne University District Energy Facility — On May 1, 2019, the Company, through its indirect subsidiary ECP Uptown Campus LLC, acquired the Duquesne University district energy system, totaling 87 combined MWt, located in Pittsburgh, Pennsylvania. The total investment for the project is $107 million. As part of the acquisition, Duquesne University entered into a 40-year Energy Services Agreement through which ECP Uptown Campus LLC will fulfill the university’s electricity, chilled water and steam requirements in exchange for monthly capacity payments. For further discussion, see Item 15 — Note 3, Acquisitions and Dispositions.
Wind TE Holdco Buyout — On January 2, 2019, the Company bought out 100% of Class A membership interest from the TE Investor, for cash consideration of $19 million, as further described in Item 115 — Business, Regulatory Matters Note 5, Investments Accounted for by the Equity Method and Item 1A— Risk Factors. DetailsVariable Interest Entities.
Agua Caliente Borrower 2 Debt Repayment — OnOctober 21, 2019, the Company, through Agua Caliente Borrower 2 LLC, repaid $40 million of some of this information relate to costs that may impactthe outstanding notes balance, including accrued interest and premiums, issued under the Agua Caliente Holdco Financing Agreement. The repayment was funded with the Company's financial results.existing liquidity.
TrendsDG Investment Partnerships with CEG — During the year ended December 31, 2019, the Company invested approximately $14 million in the DG investment partnerships with CEG, bringing total capital invested to $256 million in these investment partnerships.
Senior Notes due 2024 Tender Offer— On December 13, 2019, the Company repurchased an aggregate principal amount of $412 million or Matters Affecting Results82.4%, of Operationsthe 2024 Senior Notes as part of the previously cash tender offer announced on December 11, 2019. Concurrently with the launch of the tender offer, the Company exercised its right to optionally redeem any 2024 Senior Notes not validly tendered and Future Business Performancepurchased in the tender offer, pursuant to the terms of the indenture governing the 2024 Senior Notes. For further discussion, see Item 15 — Note 10, Long-term Debt.
Cash Distributions to Clearway, Inc. and CEG
The Company intends to distribute to its unit holders in the form of a quarterly distribution all of the CAFD that is generated each quarter less reserves for the prudent conduct of the business, including among others, maintenance capital expenditures to maintain the operating capacity of the assets. CAFD is defined as net income before interest expense, income taxes, depreciation and amortization, plus cash distributions from unconsolidated affiliates, adjustments to reflect CAFD generated by unconsolidated investments that are unable to distribute project dividends due to the PG&E Bankruptcy,
As discussed above,cash receipts from notes receivable, less cash distributions to noncontrolling interests, maintenance capital expenditures, pro-rata EBITDA from unconsolidated affiliates, cash interest paid, income taxes paid, principal amortization of indebtedness, Walnut Creek investment payments, changes in prepaid and accrued capacity payments, and adjusted for development expenses. Distributions on units are subject to available capital, market conditions, and compliance with associated laws, regulations and other contractual obligations. The Company expects that, based on current circumstances, comparable distributions will continue to be paid in the foreseeable future. The Company continueswill continue to assessevaluate its capital allocation approach during the potential future impactspendency of the PG&E bankruptcy filing as events occur. However, no impactBankruptcy.
The following table lists the distributions paid on the Company's Class A, Class B, Class C and Class D units during the year ended December 31, 2019:
|
| | | | | | | | | | | | | | | |
| | Fourth Quarter 2019 | | Third Quarter 2019 | | Second Quarter 2019 | | First Quarter 2019 |
| Distributions per Class A and Class B unit | $ | 0.20 |
| | $ | 0.20 |
| | $ | 0.20 |
| | $ | 0.20 |
|
| Distributions per Class C and Class D unit | $ | 0.20 |
| | $ | 0.20 |
| | $ | 0.20 |
| | $ | 0.20 |
|
On February 18, 2020, the Company declared a quarterly distribution on its Class A, Class B, Class C and Class D units of $0.21 per unit payable on March 16, 2020.
Cash Flow Discussion
Year Ended December 31, 2019 Compared to Year Ended December 31, 2018
The following table reflects the Company’s immediate operating activitieschanges in cash flows for the year ended December 31, 2019, compared to 2018:
|
| | | | | | | | | | | |
| Year ended December 31, | 2019 | | 2018 | | Change |
| (In millions) | |
| Net cash provided by operating activities | $ | 469 |
| | $ | 492 |
| | $ | (23 | ) |
| Net cash used in investing activities | (468 | ) | | (185 | ) | | (283 | ) |
| Net cash used in financing activities | (170 | ) | | (38 | ) | | (132 | ) |
Net Cash Used In Operating Activities
|
| | | |
| Changes to net cash provided by operating activities were driven by: | (In millions) |
| Increase in working capital driven primarily by the timing of accounts receivable collections and payment of accounts payable | $ | 29 |
|
| Lower distribution from unconsolidated affiliates affected by the PG&E Bankruptcy, partially offset by higher distributions from the distributed generation investments | (36 | ) |
| Decrease in operating income adjusted for non-cash items in 2019 compared to 2018 | (16 | ) |
| | $ | (23 | ) |
Net Cash Used In Investing Activities
|
| | | |
| Changes to net cash used in investing activities were driven by: | (In millions) |
| Increase in growth capital expenditures in the Renewables segment driven primarily by the repowering activities at Elbow Creek and Wildorado, as well as the final construction costs for Oahu and Kawailoa, partially offset by lower growth capital expenditures for construction of the Buckthorn Solar project, which went COD in 2018 | $ | (145 | ) |
| Higher payments for Drop Down Asset acquisitions in 2019 compared to 2018, primarily driven by the acquisition of Carlsbad, as well as higher payments in 2019 for the Duquesne acquisition compared to the acquisition of UPMC and Central CA Fuel Cell in 2018 | (153 | ) |
| Increase in investments in unconsolidated affiliates during 2019, primarily for investments in DGPV Holdco 3 LLC | 32 |
|
| Proceeds from sale of HSD Solar Holdings, LLC assets in October of 2019 | 20 |
|
| Payment to buy-out the existing tax equity partner of Wind TE Holdco on January 1, 2019 | (19 | ) |
| Cash proceeds from network upgrades in 2018 | (13 | ) |
| Other | (5 | ) |
| | $ | (283 | ) |
Net Cash Used In Financing Activities
|
| | | |
| Changes in net cash used in financing activities were driven by: | (In millions) |
| Increase in corporate-level debt payments driven primarily by the repayment of the 2024 Senior Notes and Long-term debt - affiliate, due 2019 | $ | (269 | ) |
| Decrease in distributions paid to CEG and Clearway Energy, Inc. | 83 |
|
| Increase in net contributions from noncontrolling interests in 2019 compared to 2018 | 83 |
|
| Higher net payments under the revolving credit facility in 2018 compared to 2019 | 55 |
|
| Lower net proceeds from sale of Class B and D units in 2019 compared to net proceeds from sale of Class B and D units in 2018 | (53 | ) |
| Higher project-level debt amortization in 2019 compared to 2018 | (31 | ) |
| Lower debt proceeds in connection with the Duquesne University District Energy System acquisition in 2019 compared to the Thermal note purchase and private shelf agreement in 2018 | (25 | ) |
| Higher net borrowings in 2019 to fund construction of the repowering activities at Elbow Creek and Wildorado, offset by the repayment of a portion of the construction debt for the Oahu and Kawailoa projects upon reaching COD in September and November 2019, respectively | 25 |
|
| | $ | (132 | ) |
Off-Balance Sheet Arrangements
Obligations under Certain Guarantee Contracts
The Company may enter into guarantee arrangements in the normal course of business to facilitate commercial transactions with third parties.
Retained or Contingent Interests
The Company does not have any material retained or contingent interests in assets transferred to an unconsolidated entity.
Obligations Arising Out of a Variable Interest in an Unconsolidated Entity
Variable interest in equity investments — As of December 31, 2019, the Company has occurredseveral investments with an ownership interest percentage of 50% or less in energy and energy-related entities that are accounted for under the equity method. DGPV Holdco 1 LLC, DGPV Holdco 2 LLC, DGPV Holdco 3 LLC, RPV Holdco 1 LLC and GenConn are variable interest entities for which the Company is not the primary beneficiary. The Company's pro-rata share of non-recourse debt held by unconsolidated affiliates was approximately $889 million as of December 31, 2018.
Wind and Solar Resource Availability
2019. The availabilityCompany's pro-rata share of the wind and solar resources affects the financial performance of the wind and solar facilities, which may impact the Company’s overall financial performance. Duenon-recourse debt held by unconsolidated affiliates as it related to the variable natureprojects affected by PG&E bankruptcy was $411 million. This indebtedness may restrict the ability of these subsidiaries to issue dividends or distributions to the windCompany. See also Item 15 — Note 5, Investments Accounted for by the Equity Method and solar resources,Variable Interest Entities, to the Consolidated Financial Statements.
Contractual Obligations and Commercial Commitments
The Company cannot predicthas a variety of contractual obligations and other commercial commitments that represent prospective cash requirements in addition to the availability of the wind and solar resources and the potential variances from expected performance levels from quarter to quarter. To the extent the wind and solar resources are not available at expected levels, it could have a negative impact on the Company’s financial performance for such periods.
Consolidated Results of Operations
2018 compared to 2017
Company's capital expenditure programs. The following table provides selected financial information: |
| | | | | | | | | | | |
| | Year ended December 31, |
| (In millions) | 2018 | | 2017 | | Change |
| Operating Revenues | | | | | |
| Energy and capacity revenues | $ | 1,084 |
| | $ | 1,038 |
| | $ | 46 |
|
| Other revenues | 39 |
| | 40 |
| | (1 | ) |
| Contract amortization | (70 | ) | | (69 | ) | | (1 | ) |
| Total operating revenues | 1,053 |
| | 1,009 |
| | 44 |
|
| Operating Costs and Expenses | | | | | |
| Cost of fuels | 74 |
| | 63 |
| | 11 |
|
| Operations and maintenance | 189 |
| | 197 |
| | (8 | ) |
| Other costs of operations | 69 |
| | 66 |
| | 3 |
|
| Depreciation and amortization | 331 |
| | 334 |
| | (3 | ) |
| Impairment losses | — |
| | 44 |
| | (44 | ) |
| General and administrative | 20 |
| | 19 |
| | 1 |
|
| Acquisition-related transaction and integration costs | 20 |
| | 3 |
| | 17 |
|
| Development costs | 3 |
| | — |
| | 3 |
|
| Total operating costs and expenses | 706 |
| | 726 |
| | (20 | ) |
| Operating Income | 347 |
| | 283 |
| | 64 |
|
| Other Income (Expense) | | | | |
|
| Equity in earnings of unconsolidated affiliates | 74 |
| | 71 |
| | 3 |
|
| Other income, net | 8 |
| | 4 |
| | 4 |
|
| Loss on debt extinguishment | — |
| | (3 | ) | | 3 |
|
| Interest expense | (294 | ) | | (294 | ) | | — |
|
| Total other expense, net | (212 | ) | | (222 | ) | | 10 |
|
| Net Income | 135 |
| | 61 |
| | 74 |
|
| Less: Net loss attributable to noncontrolling interests | (105 | ) | | (75 | ) | | (30 | ) |
| Net Income Attributable to Clearway Energy LLC | $ | 240 |
| | $ | 136 |
| | $ | 104 |
|
|
| | | | | |
| | Year ended December 31, |
| Business metrics: | 2018 | | 2017 |
Renewables MWh generated/sold (in thousands) (a) | 7,197 |
| | 6,844 |
|
| Thermal MWt sold (in thousands) | 2,042 |
| | 1,926 |
|
Thermal MWh sold (in thousands) (c) | 48 |
| | 35 |
|
Conventional MWh generated (in thousands) (a)(b) | 1,656 |
| | 1,809 |
|
| Conventional equivalent availability factor | 94.3 | % | | 93.9 | % |
|
| | | | | | | | | | | | | | | | | | | | | | | |
| | By Remaining Maturity at December 31, |
| | 2019 | | 2018 |
| Contractual Cash Obligations | Under 1 Year | | 1-3 Years | | 3-5 Years | | Over 5 Years | | Total | | Total |
| | (In millions) |
| Long-term debt (including estimated interest) | $ | 2,129 |
| | $ | 1,235 |
| | $ | 866 |
| | $ | 4,791 |
| | $ | 9,021 |
| | $ | 8,127 |
|
| Operating leases | 16 |
| | 47 |
| | 47 |
| | 272 |
| | 382 |
| | 271 |
|
| Fuel purchase and transportation obligations | 9 |
| | 6 |
| | 6 |
| | 10 |
| | 31 |
| | 36 |
|
Other liabilities (a) | 34 |
| | 47 |
| | 33 |
| | 188 |
| | 302 |
| | 220 |
|
| Total | $ | 2,188 |
| | $ | 1,335 |
| | $ | 952 |
| | $ | 5,261 |
| | $ | 9,736 |
| | $ | 8,654 |
|
(a) Volumes do not includeIncludes water right agreements, service and maintenance agreements, and LTSA commitments.
Fair Value of Derivative Instruments
The Company may enter into fuel purchase contracts and other energy-related financial instruments to mitigate variability in earnings due to fluctuations in spot market prices and to hedge fuel requirements at certain generation facilities. In addition, in order to mitigate interest rate risk associated with the MWh generated/sold byissuance of variable rate debt, the Company enters into interest rate swap agreements.
The tables below disclose the activities of non-exchange traded contracts accounted for at fair value in accordance with ASC 820. Specifically, these tables disaggregate realized and unrealized changes in fair value; disaggregate estimated fair values at December 31, 2019, based on their level within the fair value hierarchy defined in ASC 820; and indicate the maturities of contracts at December 31, 2019. For a full discussion of the Company's equity method investments.valuation methodology of its contracts, see Derivative Fair Value Measurements in Item 15 — Note 6, Fair Value of Financial Instruments, to the Consolidated Financial Statements.
|
| | | |
| Derivative Activity (Losses)/Gains | (In millions) |
| Fair value of contracts as of December 31, 2018 | $ | (10 | ) |
| Contracts realized or otherwise settled during the period | 13 |
|
| Contracts acquired during the period | (19 | ) |
| Changes in fair value | (76 | ) |
| Fair value of contracts as of December 31, 2019 | $ | (92 | ) |
|
| | | | | | | | | | | | | | | | | | | |
| | Fair value of contracts as of December 31, 2019 |
| | Maturity |
| Fair Value Hierarchy (Losses)/Gains | 1 Year or Less | | Greater Than
1 Year to 3 Years | | Greater Than
3 Years to 5 Years | | Greater Than
5 Years | | Total Fair
Value |
| | (In millions) |
| Level 2 | (16 | ) | | (31 | ) | | (14 | ) | | (22 | ) | | (83 | ) |
| Level 3 | — |
| | — |
| | (5 | ) | | (4 | ) | | (9 | ) |
| Total | $ | (16 | ) | | $ | (31 | ) | | $ | (19 | ) | | $ | (26 | ) | | $ | (92 | ) |
The Company has elected to disclose derivative assets and liabilities on a trade-by-trade basis and does not offset amounts at the counterparty master agreement level. As discussed below in Quantitative and Qualitative Disclosures about Market Risk -Commodity Price Risk, the Company measures the sensitivity of the portfolio to potential changes in market prices using VaR, a statistical model which attempts to predict risk of loss based on market price and volatility. The Company's risk management policy places a limit on one-day holding period VaR, which limits the net open position.
Critical Accounting Policies and Estimates
The Company's discussion and analysis of the financial condition and results of operations are not soldbased upon the consolidated financial statements, which have been prepared in accordance with GAAP. The preparation of these financial statements and related disclosures in compliance with GAAP requires the application of appropriate technical accounting rules and guidance as well as the Conventional facilities sell capacity rather than energy.
(c) MWh sold douse of estimates and judgments that affect the reported amounts of assets, liabilities, revenues and expenses, and related disclosures of contingent assets and liabilities. The application of these policies necessarily involves judgments regarding future events, including the likelihood of success of particular projects, legal and regulatory challenges and the fair value of certain assets and liabilities. These judgments, in and of themselves, could materially affect the financial statements and disclosures based on varying assumptions, which may be appropriate to use. In addition, the financial and operating environment may also have a significant effect, not include 108 and 72 MWh generated by NRG Dover, a subsidiaryonly on the operation of the business, but on the results reported through the application of accounting measures used in preparing the financial statements and related disclosures, even if the nature of the accounting policies has not changed.
On an ongoing basis, the Company underevaluates these estimates, utilizing historic experience, consultation with experts and other methods the PPA with NRG Power Marketing duringCompany considers reasonable. Actual results may differ substantially from the years ended December 31, 2018 and December 31, 2017, respectively, as further describedCompany's estimates. Any effects on the Company's business, financial position or results of operations resulting from revisions to these estimates are recorded in the period in which the information that gives rise to the revision becomes known.
The Company's significant accounting policies are summarized in Item 15 — Note 13, Related Party Transactions2, Summary of Significant Accounting Policies, to the Consolidated Financial Statements.
Management’s discussionThe Company identifies its most critical accounting policies as those that are the most pervasive and important to the portrayal of the Company's financial position and results of operations, and that require the most difficult, subjective and/or complex judgments by management regarding estimates about matters that are inherently uncertain. The Company's critical accounting policies include impairment of long lived assets and other intangible assets.
|
| |
| Accounting Policy | Judgments/Uncertainties Affecting Application |
| |
| Impairment of Long Lived Assets | Recoverability of investments through future operations |
| Regulatory and political environments and requirements |
| Estimated useful lives of assets |
| Operational limitations and environmental obligations |
| Estimates of future cash flows |
| Estimates of fair value |
| Judgment about triggering events |
Evaluation of Assets for Impairment and Other-Than-Temporary Decline in Value
In accordance with ASC 360, Property, Plant, and Equipment, or ASC 360, property, plant and equipment and certain intangible assets are evaluated for impairment whenever indicators of impairment exist. Examples of such indicators or events are:
Significant decrease in the market price of a long-lived asset;
Significant adverse change in the manner an asset is being used or its physical condition;
Adverse business climate;
Accumulation of costs significantly in excess of the amount originally expected for the years ended December 31, 2018construction or acquisition of an asset;
Current-period loss combined with a history of losses or the projection of future losses; and 2017
Gross MarginChange in the Company's intent about an asset from an intent to hold to a greater than 50% likelihood that an asset will be sold or disposed of before the end of its previously estimated useful life.
Recoverability of assets to be held and used is measured by a comparison of the carrying amount of the assets to the future net cash flows expected to be generated by the asset, through considering project specific assumptions for long-term energy pool prices, escalated future project operating costs and expected plant operations. If such assets are considered to be impaired, the impairment to be recognized is measured by the amount by which the carrying amount of the assets exceeds the fair value of the assets. The fair value may be determined by factoring in the probability weighting of different courses of action available to the Company as appropriate. Generally, fair value will be determined using valuation techniques such as the present value of expected future cash flows or comparable values determined by transactions in the market. The Company uses its best estimates in making these evaluations and considers various factors, including forward price curves for energy, fuel costs and operating costs. However, actual future market prices and project costs could vary from the assumptions used in the Company's estimates, and the impact of such variations could be material.
Annually, during the fourth quarter, the Company revises its views of energy prices, including the Company's fundamental view for long-term power prices, forecasted generation and operating and capital expenditures, in connection with the preparation of its annual budget.
The Company calculates gross marginrecorded certain long-lived asset impairments in order2019, as described below and in Item 15 — Note 9, Asset Impairments, to the Consolidated Financial Statements, with respect to several wind projects.
The Company recorded an impairment loss of $19 million related to a facility in the Thermal segment during the second quarter of 2019. The impairment was triggered by a potential sale negotiation with a third party which resulted in signing the purchase and sale agreement in September, as further described in Note 3, Acquisitions and Dispositions. The fair value of the facility was determined using an income approach by applying a discounted cash flow methodology to the long-term budgets for each respective plant. The income approach utilized estimates of discounted future cash flows, which were Level 3 fair value measurement and include key inputs, such as forecasted power prices, operations and maintenance expense, and discount rates. The Company measured the impairment loss as the difference between the carrying amount and the fair value of the assets.
Additionally, during the fourth quarter of 2019, as a result of the preparation and review of its annual budget and assessment of long-term merchant prices, the Company updated its estimated future cash flows and determined that the future cash flows for several wind projects from the Renewables segment no longer supported the recoverability of the related long-lived asset. As such, the Company recorded an impairment loss of $14 million to reflect the assets at fair market value. There were no other triggering events identified prior to the fourth quarter annual budget update for these asset groups. The fair value of the facilities was determined using an income approach by applying a discounted cash flow methodology to the long-term budgets for each respective plant. The income approach included key inputs such as forecasted merchant power prices, operations and maintenance expense, and discount rates. The resulting fair value is a Level 3 fair value measurement.
The Company is also required to evaluate operating performanceits equity method investments to determine whether or not they are impaired. ASC 323, Investments - Equity Method and Joint Ventures, or ASC 323, provides the accounting requirements for these investments. The standard for determining whether an impairment must be recorded under ASC 323 is whether the value is considered to be an other-than-temporary decline in value. The evaluation and measurement of impairments under ASC 323 involves the same uncertainties as operating revenues less cost of sales, which includes cost of fuel, contract and emission credit amortization and mark-to-marketdescribed for economic hedging activities.
Economic Gross Margin
In addition to gross margin,long-lived assets that the Company evaluatesowns directly and accounts for in accordance with ASC 360. Similarly, the estimates that the Company makes with respect to its operating performance usingequity method investments are subjective, and the measureimpact of economic gross margin,variations in these estimates could be material. Additionally, if the projects in which the Company holds these investments recognize an impairment under the provisions of ASC 360, the Company would record its proportionate share of that impairment loss and would evaluate its investment for an other-than-temporary decline in value under ASC 323.
Certain of the Company’s projects have useful lives that extend well beyond the contract period and therefore, management’s view of long-term energy prices in the post-contract periods may have a significant impact on the expected future cash flows for these projects. Accordingly, if management lowers its view of long-term energy prices in certain markets it is possible that some of the Company’s other long-lived assets may be impaired.
As previously described, on January 29, 2019, PG&E filed for reorganization under Chapter 11 of the U.S. Bankruptcy Code. Certain subsidiaries of the Company sell the output of their facilities to PG&E under long-term PPAs, including interests in 6 solar facilities totaling 480 MW and Marsh Landing with capacity of 720 MW. The Company consolidates three of the solar facilities and Marsh Landing and records its interest in the other solar facilities as equity method investments. The Company has determined that it has no impairment of the long-lived assets or equity method investments associated with these subsidiaries. Assumptions utilized to test these assets for impairment may change based on future events related to the PG&E Bankruptcy, which could result in an impairment loss if the PPAs are rejected or amended, or if the Company is not able to collect its revenues from PG&E in a timely manner.
Recent Accounting Developments
See Item 15 — Note 2, Summary of Significant Accounting Policies, to the Consolidated Financial Statements for a discussion of recent accounting developments.
Item 7A — Quantitative and Qualitative Disclosures About Market Risk
The Company is exposed to several market risks in its normal business activities. Market risk is the potential loss that may result from market changes associated with the Company's power generation or with an existing or forecasted financial or commodity transaction. The types of market risks the Company is exposed to are commodity price risk, interest rate risk, liquidity risk, and credit risk.
Commodity Price Risk
Commodity price risks result from exposures to changes in spot prices, forward prices, volatilities, and correlations between various commodities, such as electricity, natural gas and emissions credits. The Company manages the commodity price risk of its merchant generation operations by entering into derivative or non-derivative instruments to hedge the variability in future cash flows from forecasted power sales or purchases of fuel. The portion of forecasted transactions hedged may vary based upon management's assessment of market, weather, operation and other factors. See Item 15 — Note 7, Accounting for Derivative Instruments and Hedging Activities, to the Consolidated Financial Statements for more information.
Based on a sensitivity analysis using simplified assumptions, the impact of a $0.50 per MMBtu decrease in natural gas prices across the term of the derivative contracts would cause no change to the net value of natural gas derivatives, and an increase of $0.50 MMBtu in natural gas prices across the term of the derivative contracts would cause an increase of approximately $3 million to the net value of natural gas derivatives as of December 31, 2019. The impact of a $0.50 per MWh increase or decrease in power prices across the term of the derivative contracts would cause a change of approximately $1 million to the net value of power derivatives as of December 31, 2019.
Interest Rate Risk
The Company is exposed to fluctuations in interest rates through its issuance of variable rate debt. Exposures to interest rate fluctuations may be mitigated by entering into derivative instruments known as interest rate swaps, caps, collars and put or call options. These contracts reduce exposure to interest rate volatility and result in primarily fixed rate debt obligations when taking into account the combination of the variable rate debt and the interest rate derivative instrument. See Item 15 — Note 7, Accounting for Derivative Instruments and Hedging Activities, to the Consolidated Financial Statements for more information.
Most of the Company's project subsidiaries enter into interest rate swaps, intended to hedge the risks associated with interest rates on non-recourse project level debt. See Item 15 — Note 10,Long-term Debt, to the Consolidated Financial Statements for more information about interest rate swaps of the Company's project subsidiaries.
If all of the above swaps had been discontinued on December 31, 2019, the Company would have owed the counterparties $84 million. Based on the credit ratings of the counterparties, the Company believes its exposure to credit risk due to nonperformance by counterparties to its hedge contracts to be insignificant.
The Company has long-term debt instruments that subject it to the risk of loss associated with movements in market interest rates. As of December 31, 2019, a 1% change in interest rates would result in an approximately $3 million change in interest expense on a rolling twelve-month basis.
As of December 31, 2019, the fair value of the Company's debt was $6,956 million and the carrying value was $6,857 million. The Company estimates that a 1% decrease in market interest rates would have increased the fair value of its long-term debt by $340 million.
Liquidity Risk
Liquidity risk arises from the general funding needs of the Company's activities and in the management of the Company's assets and liabilities.
Counterparty Credit Risk
Credit risk relates to the risk of loss resulting from non-performance or non-payment by counterparties pursuant to the terms of their contractual obligations. The Company monitors and manages credit risk through credit policies that include: (i) an established credit approval process, and (ii) the use of credit mitigation measures such as prepayment arrangements or volumetric limits. Risks surrounding counterparty performance and credit could ultimately impact the amount and timing of expected cash flows. The Company seeks to mitigate counterparty risk by having a diversified portfolio of counterparties. See Item 15 — Note 6, Fair Value of Financial Instruments, to the Consolidated Financial Statements for more information about concentration of credit risk.
As previously described, on January 29, 2019, PG&E filed for reorganization under Chapter 11 of the U.S. Bankruptcy Code. Certain subsidiaries of the Company sell the output of their facilities to PG&E under long-term PPAs, including interests in 6 solar facilities totaling 480 MW and Marsh Landing with capacity of 720 MW. The Company consolidates three of the solar facilities and Marsh Landing and records its interest in the other solar facilities as equity method investments. The Company had $5 million in accounts receivable due from PG&E, which relate to the pre-petition period and therefore were recorded in other non-current assets as of December 31, 2019.
Item 8 — Financial Statements and Supplementary Data
The financial statements and schedules are listed in Part IV, Item 15 of this Form 10-K.
Item 9 — Changes in and Disagreements with Accountants on Accounting and Financial Disclosure
None.
Item 9A — Controls and Procedures
Conclusion Regarding the Effectiveness of Disclosure Controls and Procedures and Internal Control Over Financial Reporting
Under the supervision and with the participation of the Company's management, including its principal executive officer, principal financial officer and principal accounting officer, the Company conducted an evaluation of the effectiveness of the design and operation of its disclosure controls and procedures, as such term is defined in Rules 13a-15(e) or 15d-15(e) of the Exchange Act. Based on this evaluation, the Company's principal executive officer, principal financial officer and principal accounting officer concluded that the disclosure controls and procedures were effective as of the end of the period covered by this Annual Report on Form 10-K.
Changes in Internal Control over Financial Reporting
In connection with the GIP Transaction, the Company entered into a TSA pursuant to which NRG Energy, Inc. provided information technology, systems, applications and business processes to the Company. A material portion of these processes terminated during the second quarter of 2019 and such services were subsequently provided by both the Company and by CEG pursuant to the CEG Master Services Agreements. There were no changes in the Company’s internal control over financial reporting (as such term is defined in Rule 13a-15(f) under the Exchange Act) during the quarter ended December 31, 2019, that materially affected, or are reasonably likely to materially affect, the Company’s internal control over financial reporting.
Inherent Limitations over Internal Controls
The Company's internal control over financial reporting is designed to provide reasonable assurance regarding the reliability of financial reporting and the preparation of consolidated financial statements for external purposes in accordance with GAAP. The Company's internal control over financial reporting includes those policies and procedures that:
1. Pertain to the maintenance of records that, in reasonable detail, accurately and fairly reflect the transactions and dispositions of the Company's assets;
2. Provide reasonable assurance that transactions are recorded as necessary to permit preparation of consolidated financial statements in accordance with GAAP, measure and that the Company's receipts and expenditures are being made only in accordance with authorizations of its management and directors; and
3. Provide reasonable assurance regarding prevention or timely detection of unauthorized acquisition, use or disposition of the Company's assets that could have a material effect on the consolidated financial statements.
Internal control over financial reporting cannot provide absolute assurance of achieving financial reporting objectives because of its inherent limitations, including the possibility of human error and circumvention by collusion or overriding of controls. Accordingly, even an effective internal control system may not be comparableprevent or detect material misstatements on a timely basis. Also, projections of any evaluation of effectiveness to future periods are subject to the risk that controls may become inadequate because of changes in conditions or that the degree of compliance with the policies or procedures may deteriorate.
Management's Report on Internal Control over Financial Reporting
The Company's management is responsible for establishing and maintaining adequate internal control over financial reporting, as such term is defined in Exchange Act Rule 13a-15(f). Under the supervision and with the participation of the Company's management, including its principal executive officer, principal financial officer and principal accounting officer, the Company conducted an evaluation of the effectiveness of its internal control over financial reporting based on the framework in Internal Control — Integrated Framework (2013) issued by the Committee of Sponsoring Organizations of the Treadway Commission. Based on the Company's evaluation under the framework in Internal Control — Integrated Framework (2013), the Company's management concluded that its internal control over financial reporting was effective as of December 31, 2019.
Item 9B — Other Information
None.
PART III
PART III
Item 10 - Directors, Executive Officers and Corporate Governance
The Company is a limited liability company that is managed by Clearway, Inc., as its sole managing member. As a limited liability company managed by Clearway, Inc., the Company does not have a board of directors. References herein to the Company's board of directors are references to the board of directors (the “Board”) of Clearway, Inc. Pursuant to the Fourth Amended and Restated Limited Liability Company Agreement of the Company, Clearway, Inc. has appointed officers of the Company and designated certain of such officers as “Executive Officers.” These executive officers are the same as the executive officers of Clearway, Inc.
The following table shows information for the Company's executive officers. Executive officers serve until their successors are duly appointed or elected.
|
| | |
| Name | Age | Title |
| Christopher S. Sotos | 48 | President and Chief Executive Officer |
| Chad Plotkin | 44 | Senior Vice President and Chief Financial Officer |
| Kevin P. Malcarney | 53 | Senior Vice President, General Counsel and Corporate Secretary |
| Mary-Lee Stillwell | 46 | Vice President and Chief Accounting Officer |
Christopher S. Sotos has served as President and Chief Executive Officer since May 2016, and as a member of the Board since May 2013. Mr. Sotos had also served in various positions at NRG, including most recently as Executive Vice President-Strategy and Mergers and Acquisitions from February 2016 through May 2016 and Senior Vice President-Strategy and Mergers and Acquisitions from November 2012 through February 2016. In this role, he led NRG’s corporate strategy, mergers and acquisitions, strategic alliances and other companies’ presentationsspecial projects for NRG. Previously, he served as NRG’s Senior Vice President and Treasurer from March 2008 to September 2012, where he was responsible for all treasury functions, including raising capital, valuation, debt administration and cash management. Mr. Sotos also previously served as a director of FuelCell Energy, Inc. from September 2014 to April 2019. As President and Chief Executive Officer of the Company, Mr. Sotos provides the Board with management’s perspective regarding the Company’s day to day operations and overall strategic plan. Mr. Sotos also brings strong financial and accounting skills to the Board.
Chad Plotkin has served as the Company's Senior Vice President and Chief Financial Officer since November 2016. From January 2016 until his appointment as Senior Vice President and Chief Financial Officer, Mr. Plotkin served as Senior Vice President, Finance and Strategy. Prior to this, he served in varying capacities at NRG, including as Vice President of Investor Relations of both the Company and NRG from September 2015 to January 2016 and from January 2012 to February 2015 and Vice President of Finance of NRG from February 2015 to September 2015. From October 2007 to January 2012, Mr. Plotkin served in various capacities in the Strategy and Mergers and Acquisitions group of NRG, including as Vice President, beginning in December 2010.
Kevin P. Malcarney has served as Senior Vice President, General Counsel and Corporate Secretary since May 11, 2018. He served as Interim General Counsel of the Company from March 16, 2018. Mr. Malcarney was previously Vice President and Deputy General Counsel and served in various other roles at NRG since September 2008. Prior to that, Mr. Malcarney worked at two major law firms in Princeton, New Jersey and Philadelphia, Pennsylvania, and handled mergers and acquisitions, project financing and general corporate matters.
Mary-Lee Stillwell has served as Vice President and Chief Accounting Officer of the Company since August 31, 2018. Ms. Stillwell previously served as Vice President and Assistant Controller of NRG since December 2012, where she was responsible for managing and directing NRG's financial accounting and reporting activities as well as overseeing the accounting for the Renewables business and various shared service functions. Prior to her work at NRG, Ms. Stillwell served as Assistant Controller-Integration and Internal Controls of GenOn Energy, Inc., in Houston, Texas, from September 2010 to December 2012, where she was responsible for all Sarbanes‑Oxley compliance as well as integrations of mergers and acquisitions.
Code of Ethics
The Company has not adopted a separate code of ethics because all of the officers of the Company are subject to the Code of Conduct adopted by the Board of Clearway, Inc. Clearway, Inc.’s Code of Conduct applies to all of its directors and employees, including its and the Company's officers (e.g., the Company's CEO, CFO, and Principal Accounting Officer). Clearway, Inc.’s Code of Conduct is available on its website, www.clearwayenergy.com.
Section 16(a)-Beneficial Ownership Reporting Compliance
The Company does not have equity securities registered pursuant to Section 12 of the Exchange Act, and therefore there are no persons subject to Section 16 of the Exchange Act with respect to the Company that are required to file Forms 3, 4 or deemed more useful than5 with the GAAP information provided elsewhereSEC.
Item 11 — Executive Compensation
Compensation Committee Report
The Company's named executive officers are also named executive officers of Clearway, Inc., and the compensation of the named executive officers disclosed herein reflects total compensation for services with respect to Clearway, Inc. and all of its subsidiaries, including the Company. The Compensation Committee of the Board of Clearway, Inc. (the “Compensation Committee”) has reviewed and discussed the Compensation Discussion and Analysis included in this report. Economic gross margin shouldAnnual Report on Form 10-K required by Item 402(b) of Regulation S-K with management and, based upon such review and discussion, the Compensation Committee has recommended to the Board that the Compensation Discussion and Analysis be viewed asincluded in this Annual Report on Form 10-K.
|
|
| Compensation Committee: |
| Ferrell P. McClean, Chair |
| Jonathan Bram |
| Brian R. Ford |
Daniel B. More
|
| E. Stanley O'Neal |
Compensation Discussion and Analysis
Executive Summary
Executive Compensation Program
Clearway, Inc. is a supplement topublicly‑traded energy infrastructure investor and notowner of modern, sustainable and long‑term contracted assets across North America. As a substitute forresult of the Company' presentationGIP Transaction which closed on August 31, 2018, GIP, through its portfolio company, CEG, holds all of gross margin, which isClearway, Inc.’s Class B common stock and Class D common stock, and thus has the most directly comparable GAAP measure. Economic gross margin is not intended to represent gross margin. The Company believes that economic gross margin is useful to investorsmajority voting interest in the Company. This Compensation Discussion and Analysis (“CD&A”) describes the philosophy, elements, implementation and results of the Clearway, Inc.'s 2019 executive compensation program as it is a key operational measure reviewed byapplies to the Company's chief operating decision maker. Economic gross margin is defined as energyexecutive team. As discussed above, Clearway, Inc.'s named executive officers are also named executive officers of Clearway Energy LLC, and capacity revenue, plus other revenues, less costthe compensation of fuels. Economic gross margin excludes the following components from GAAP gross margin: contract amortization, mark-to-market results, emissions credit amortizationnamed executive officers (“NEOs”) discussed below reflects total compensation for services with respect to Clearway, Inc. and (losses) gains on economic hedging activities. Mark-to-market results consistall of unrealized gains and losses on contracts that are not yet settled.
The below tables presentits subsidiaries, including Clearway Energy LLC. In this CD&A, the composition of gross margin,term “Company,” as well as the reconciliationterms “our,” “we,” “us” or like terms, are used to economic gross marginrefer to Clearway, Inc. and its consolidated subsidiaries, including Clearway Energy LLC and its consolidated subsidiaries.
Beginning with our first two employees, Messrs. Sotos and Plotkin in 2016, the Compensation Committee’s objectives have been to design a simple yet competitive program, which is aligned with the interests of our stockholders. Since that time, refinements have been made to the combination of long‑term and short‑term compensation features to further align pay with the Company’s annual performance and 3-year total shareholder return (“TSR”), respectively. Our annual incentive program (“AIP”) is based on objective criteria that support the achievement of our short-term objectives, which we believe create long-term shareholder value. Our long-term incentives are comprised of 67% Relative Performance Stock Units (“RPSUs”), which vest based on relative TSR measured over 3 years and 33% Restricted Stock Units (“RSUs”), which vest based on continued service over 3 years. The program incorporates many best practices in compensation design, while being tailored to our business needs and compensation objectives.
In 2019, the Compensation Committee reviewed and did not modify its compensation philosophy behind the compensation program. Thus, NEO compensation continued to be delivered through a mix of (i) base salary, (ii) an annual incentive bonus opportunity under the AIP and (iii) long‑term incentive compensation under our Amended and Restated 2013 Equity Incentive Plan (“LTIP”) in the form of RPSUs, and RSUs.
At our 2019 Annual Meeting of Stockholders, we received 99% support for our say on pay proposal. We believe these results demonstrate our stockholders support our pay practices and that our compensation plans are aligned with their interests.
Key Governance Features of Our Executive Compensation Program
Our compensation program and practices incorporate several key governance features as highlighted in the table below:
|
| |
| What We Do: | What We Don’t Do: |
| Pay for performance by delivering a substantial majority of our CEO’s compensation through equity | No excise tax gross‑ups on change‑in‑control payments and no tax gross‑ups on perquisites or benefits |
| Beginning in 2017, the large majority of our equity compensation for Senior Vice Presidents and above is performance‑based | No pledging or hedging of the Company’s stock by NEOs or directors |
| Target our peer group median for total direct compensation | No employment agreements for executive officers with the exception of our CEO |
| Require a double trigger for the acceleration of equity vesting upon a change‑in‑control | No guaranteed bonus payments for our NEOs |
| Prevent undue risk taking in our compensation practices and engage in robust risk monitoring | No supplemental executive retirement plans |
| Include clawback policies in our compensation plans | No re‑pricing of underwater stock options and no stock option grants with an exercise price below 100% of fair market value |
| Maintain robust stock ownership guidelines for our NEOs | |
| Provide market‑level retirement benefits and limited perquisites | |
| Engage an independent compensation consultant to provide advice to the Compensation Committee with respect to our compensation program | |
| Conduct an annual say on pay vote | |
Business Strategy and Company Performance
The Company’s primary business strategy is to focus on the acquisition and ownership of assets with predictable, long‑term cash flows that allow the Company to increase the cash dividends paid to holders of the Company’s Class A and Class C common stock over time without compromising the ongoing stability of the business. The Company’s plan for executing this strategy includes the following key components: focusing on contracted renewable energy and conventional generation and thermal infrastructure assets; growing our business through acquisitions of contracted operating assets primarily in North America; and maintaining sound financial practices to grow our dividend.
The execution of the Company’s business strategy produced the following results in 2019:
Raised approximately $900 million in new corporate-level formation for growth investments and corporate liability management, which included corporate debt and equity financings, as well as project-level debt optimization
Invested approximately $330 million in new growth investments, including the acquisition of the 527 MW Carlsbad Energy Center from the Company’s sponsor GIP and the Repowering Partnership 1.0
Finalized stand-alone operations including the transition of services away from NRG as the Company’s sponsor
Successful management of the potential impacts from the PG&E bankruptcy
Achieved strong execution from Thermal business, which acquired the district energy assets of Duquesne University in Pittsburgh, PA and successfully completed the Mylan project and secured a contract with Cayo Largo in Puerto Rico
Such results were taken into account by the Compensation Committee in making determinations with respect to the compensation for our NEOs under the 2019 compensation program.
Executive Compensation Program
2019 Named Executive Officers
This CD&A describes the material components of our compensation program for our NEOs in 2019. For the year ending December 31, 2019, our NEOs included the following individuals:
|
| | |
| NEO | | 2019 Title |
| Christopher S. Sotos | | President and Chief Executive Officer |
| Chad Plotkin | | Senior Vice President and Chief Financial Officer |
| Kevin P. Malcarney | | Senior Vice President, General Counsel and Corporate Secretary |
| Mary‑Lee Stillwell | | Vice President and Chief Accounting Officer |
Goals and Objectives of the Program
The Compensation Committee is responsible for the yearsdevelopment and implementation of the Company’s executive compensation program. The intent of the program is to reward the achievement of the Company’s annual goals and objectives while supporting the Company’s long‑term business strategy. The Compensation Committee is committed to aligning executives’ compensation with performance. Our Compensation Committee has designed an executive compensation program that:
closely aligns our executive compensation with stockholder value creation, avoiding plans that encourage executives to take excessive risk, while driving long‑term value to stockholders;
supports the Company’s long‑term business strategy, while rewarding our executive team for their individual accomplishments with tailored individual executive compensation metrics and incentives; and
provides a competitive compensation opportunity while adhering to market standards for compensation.
The Compensation Committee’s objectives are achieved through the use of both short‑term and long‑term incentives. The Company currently targets pay at the median of our Compensation Peer Group (defined below), as described under “Elements of Compensation.”
The Compensation Process
Compensation Consultant
Pursuant to its charter, the Compensation Committee is authorized to engage, at the expense of the Company, a compensation consultant to provide independent advice, support and expertise to assist the Compensation Committee in overseeing and reviewing our overall executive compensation strategy, structure, policies and programs, and to assess whether our compensation structure establishes appropriate incentives for management and other key employees. As noted above, Pay Governance served as the Compensation Committee’s independent compensation consultant for the first eight months of fiscal year 2019. Deloitte became the Compensation Committee’s independent compensation consultant for the remainder of fiscal year 2019 and continues to serve in that capacity. Pay Governance worked with the Compensation Committee to formulate the design of the executive and director compensation programs for 2019. Each of Pay Governance and Deloitte provided reports to the Compensation Committee (during the respective periods they served as compensation consultant) containing research, market data, survey information and information regarding trends and developments in executive and director compensation. Each of Pay Governance and Deloitte reported directly to the Compensation Committee (during the respective periods they served as compensation consultant). The Company paid Deloitte $105,992 for the work it performed for the Compensation Committee in 2019. CEG engaged Deloitte and its affiliate, Deloitte & Touche LLP, to provide additional services in 2019, for which CEG paid $2,964,644. These additional services primarily related to financial reporting services, including assistance with the preparation of CEG’s financial statements for the second and third quarters of 2019, and assisting with the transition of enterprise resource planning and financial applications from NRG. Given that these services were provided to CEG, the decision to engage Deloitte and its affiliate for such services was not made, or recommended, by our management, or approved by the Compensation Committee or the Board. Neither Pay Governance nor any of its affiliates provided services for any of our affiliates in 2019. In accordance with SEC rules and requirements, the Company has affirmatively determined that no conflicts of interest exist between the Company and Pay Governance or Deloitte (or any individuals working on the Company’s account on behalf of Pay Governance or Deloitte).
Compensation Peer Group Analysis
The Compensation Committee, with support from its independent compensation consultant, identifies the most appropriate comparator group within relevant industries for purposes of benchmarking compensation. The Compensation Committee aims to
compare our compensation program to a consistent peer group year‑to‑year but given the dynamic nature of our industry and the companies that constitute it, the Compensation Committee annually examines the peer group for appropriateness in terms of size, complexity and industry. As a result of such annual review, the Compensation Committee identified a new peer group for compensation benchmarking purposes in 2019 (the “Compensation Peer Group”).
For these purposes, the Compensation Peer Group, comprised of similarly sized publicly‑owned energy and utility companies, is identified below:
|
| | | | | | |
| Company | | Ticker | | Company | | Ticker |
| Black Hills Corporation | | NYSE: BKH | | NorthWestern Corporation. | | NYSE: NWE |
Boardwalk Pipeline Partners, LP(1) | | | | Ormat Technologies, Inc. | | NYSE: ORA |
| El Paso Electric Company | | NYSE: EE | | Pattern Energy Group Inc. | | NASDAQ: PEGI |
| Genesis Energy, L.P. | | NYSE: GEL | | South Jersey Industries, Inc. | | NYSE: SJI |
| Innergex Renewable Energy Inc. | | TSX: INE | | TransAltaCorporation. | | NYSE:TAC |
| Northland Power Inc. | | TSX: NPI | | | | |
(1)Boardwalk Pipeline Partners, LP became privately-held in July 2018 and was delisted, but was included by Pay Governance (when it was serving as compensation consultant) as part of its 2019 compensation benchmarking analysis, and for that reason, Boardwalk Pipeline Partners, LP is included in the Compensation Peer Group for 2019 but will not be part of the Compensation Peer Group for 2020 or going forward.
For the purposes of determining appropriate NEO pay levels for 2019, the Compensation Committee reviewed NEO compensation from peers, where available and appropriate (e.g., based on an NEO’s position and duties). To supplement this analysis, the Compensation Committee also participated in meetings with its compensation consultant regarding the compensation consultant’s review of relevant third‑party survey data and considered the recommendations of the CEO on NEO and employee compensation matters not involving the CEO. The Compensation Committee may accept or adjust such CEO recommendations at its discretion.
Elements of Compensation
Our compensation program for our NEOs consists of fixed compensation (base salary), performance‑based compensation (AIP bonus and RPSUs) and time‑based compensation (RSUs). We use the median percentile of our Compensation Peer Group as a guidepost in establishing the targeted levels of total direct compensation (cash and equity) for our NEOs. We expect that, over time, targeted total direct compensation for our NEOs will continue to approximate the median of our Compensation Peer Group. Realized pay in a given year depends on the achievement of defined performance‑based compensation metrics. While a portion of our compensation is fixed, a significant percentage is at‑risk and payable and/or realizable only if certain performance objectives are met.
Base Salary
Base salary compensates NEOs for their level of experience and position responsibilities and for the continued expectation of superior performance. Recommendations on increases to base salary take into account, among other factors, the NEO’s individual performance, the general contributions of the NEO to overall corporate performance, the level of responsibility of the NEO with respect to his or her specific position, and their current base salary level compared to the market median. Messrs. Sotos and Plotkin received base salary increases in 2019 based on their performance and peer group benchmarking. The base salary for each NEO for fiscal year 2019 is set forth below:
|
| | | | |
| Named Executive Officer | | 2019 Annualized Base Salary ($)(1) | | Percentage Increase Over 2018 (%)(2) |
| Christopher S. Sotos | | 611,000 | | 22% |
| Chad Plotkin | | 380,000 | | 9% |
| Kevin P. Malcarney | | 300,000 | | 0% |
| Mary‑Lee Stillwell | | 295,000 | | 0% |
(1) Actual 2019 base salary earnings are presented in the Summary Compensation Table.
(2) As compared to the December 31, 2018 annualized base salary.
Annual Incentive Compensation
Overview
Annual incentive compensation awards (AIP bonuses) are made under our AIP. AIP bonuses represent short‑term compensation designed to compensate NEOs for meeting annual Company goals and for their individual performance. The Compensation Committee establishes these annual Company goals after reviewing the Company’s business strategy and other matters. As further discussed below, the annual goals for 2019 relate to the following four areas: (a) CAFD, (b) key financial milestones, (c) key transition milestones and (d) achievement of the Thermal plan. In addition, each NEO’s individual performance may (negatively or positively) affect the bonus amount that he or she ultimately receives under our AIP. However, notwithstanding individual performance or the extent to which the Company goals are achieved, the Compensation Committee retains sole discretion under the AIP to reduce the amount of or eliminate any AIP bonuses that are otherwise payable under the AIP.
AIP bonus opportunities are expressed in terms of threshold, target and maximum bonus opportunities. Different percentages of each NEO’s annual base salary relate to these threshold, target and maximum AIP bonus opportunities. However, in the event threshold performance for 2019 was not achieved with respect to the CAFD performance metric (the “AIP Gate”), no AIP bonuses would have been payable for 2019.
Effective January 1, 2019, the AIP was amended to include designated officers as participants, granting NEOs (other than Mr. Sotos whose severance is governed by his employment agreement) eligibility for a prorated target bonus payment for the year of a qualifying severance termination, based on the portion of the performance period that the NEO was employed.
2019 AIP Bonus Performance Criteria
The AIP bonus performance criteria applicable to all NEOs are based upon the four Company goals described above and individual performance. The table below sets forth the 2019 AIP performance criteria and weightings applicable to all NEOs, assuming the achievement of each goal at target.
|
| |
| Goal | Weight |
CAFD(1) | 32.5% |
| Key Financial Milestones | 32.5% |
| Key Transition Milestones | 25% |
| Achievement of the Thermal Plan | 10% |
| Overall Funding | 100% |
| Individual Performance | +/- 20% |
(1) CAFD is adjusted earnings before interest, taxes, depreciation and amortization (Adjusted EBITDA) plus cash distributions/return of investment from unconsolidated affiliates, cash receipts from notes receivable, cash distributions from noncontrolling interests, less cash distributions to noncontrolling interests, maintenance capital expenditures, pro‑rata Adjusted EBITDA from unconsolidated affiliates, cash interest paid, income taxes paid, principal amortization of indebtedness, Walnut Creek investment payments, and changes in prepaid and accrued capacity payments.
| |
| • | CAFD. As noted above, the threshold CAFD performance metric represents the AIP Gate for 2019. The Compensation Committee set the 2019 AIP Gate at $231 million. The Compensation Committee has removed the AIP Gate as a feature under the AIP for 2020. |
Beyond serving as a “gate” to any payout of AIP bonuses to NEOs, CAFD is also a distinct portion of our annual incentive framework. For 2019, the CAFD goals and the achieved level are set forth in the chart below. The Company achieved CAFD of approximately $254 million, surpassing the CAFD threshold (i.e., the AIP Gate) but less than the CAFD target.
|
| | | |
CAFD Threshold | CAFD Target | CAFD Maximum | CAFD Actual |
| $231 million | $270 million | $309 million | $254 million |
| |
| • | Key Financial Milestones. Achievement of “key financial milestones” performance metrics are established as a defined annual incentive category. The Compensation Committee establishes threshold, target and maximum levels of performance for this category based on the number of milestones achieved. For 2019, a total of eleven milestones were established relating to the Company’s credit rating, adherence to budget, CAFD per share goals, management of certain PG&E related projects, and OSHA recordable incident rate. Additional CAFD and OSHA milestones also were applied as separate milestones with respect |
to the Company’s Thermal business. For 2019, threshold performance required the achievement of three out of the eleven milestones, target performance required the achievement of six out of the eleven milestones, and maximum performance required the achievement of all eleven milestones. Ultimately, target performance was attained with the achievement of six out of the eleven milestones in 2019.
| |
| • | Key Transition Milestones. Achievement of “key transition milestones” performance metrics were specifically established as a defined annual incentive category for 2019. The Compensation Committee establishes threshold, target and maximum levels of performance for this category based on the number of milestones achieved. For 2019, a total of five milestones were established relating to the Company’s cost savings initiatives, reduced use of NRG technology and services, implementation of certain asset management agreements and satisfactory completion of the auditor RFP (request for proposal). For 2019, threshold performance required the achievement of two out of the five milestones, target performance required the achievement of three out of the five milestones, and maximum performance required the achievement of all five milestones. Ultimately, maximum performance was attained with the achievement of five out of the five milestones in 2019. |
| |
| • | Achievement of the Thermal Plan. Achievement of “Thermal Plan” performance metrics was added as an annual incentive category for 2019 based on the view that all elements of the Company’s business should be reflected in the AIP bonus opportunity. The Compensation Committee establishes threshold, target and maximum levels for this category for each of the “Thermal Plan” performance metrics. For 2019, the Thermal Plan performance metrics relate to the Thermal business’s CAFD, capital expenditures, cost controls and system efficiencies. In addition, a separate metric was established for 2019 identifying a total of eleven key Thermal business goals. Similar to the key financial and transitional milestones described above, threshold, target and maximum levels of performance were established for this separate metric based on the number of goals achieved. These goals related tosafety, cost control, customer retention and satisfaction, employee engagement, environmental risk management, good citizenship and growth, in each case, with respect to the Thermal business (threshold, target and maximum performance required the achievement of three, seven and ten goals, respectively, out of a total of eleven). Ultimately, above-target performance was attained (expressed as 153% of target) with respect to the thermal plan in 2019 (including achievement of six out of the eleven key Thermal business goals). |
| |
| • | Individual Performance. As indicated above, individual performance may (negatively or positively) affect the AIP Bonus for an NEO by up to 20%, although no AIP Bonus payments can exceed 200% of the target award. Such individual performance is determined on a discretionary basis based on the Compensation Committee’s assessment of the NEO’s contributions in supporting adherence to budget, support towards the achievement of key milestones, and other contributions towards the successful execution of the Company’s business strategy. In 2019, the Compensation Committee considered the individual performance of the CEO and recommended to the full Board that his AIP Bonus be increased by 20% to account for his individual performance. In a similar manner, the CEO recommended to the Compensation Committee that the AIP Bonus be increased for the other NEOs from 15% to 20%. The full board approved the above recommendation of the Compensation Committee and the Compensation Committee approved the above recommendation of the CEO. |
2019 Annual Incentive Bonus Opportunity
The threshold, target and maximum AIP bonus opportunities for NEOs for 2019, expressed as a percentage of base salary, were:
|
| | | | | |
| Named Executive Officer | Gate Not Met (%) | Threshold (%)(1) | Target (%)(1) | Maximum (%) | Target Amount ($) |
| Christopher S. Sotos | 0 | 50 | 100 | 200 | 611,000 |
| Chad Plotkin | 0 | 30 | 60 | 120 | 228,000 |
| Kevin Malcarney | 0 | 20 | 40 | 80 | 120,000 |
| Mary‑Lee Stillwell | 0 | 20 | 40 | 80 | 118,000 |
(1) This assumes that the CAFD performance metric and all other quantitative and qualitative goals, including the key milestones, are achieved at threshold or target levels, respectively.
2019 Annual Incentive Bonuses
As noted above, with respect to AIP bonuses for 2019, the AIP Gate was $231 million, the CAFD target was $270 million, the key financial milestone target was achievement of six out of eleven key financial milestones, the key transition milestone target was achievement of three out of five key transition milestones and target achievement of the “Thermal Plan” metrics was based on the achievement of various sub-categories, including the achievement of seven out of eleven key Thermal business goals.
For 2019, the AIP Gate was surpassed, CAFD was between threshold and target at approximately $254 million, six out of eleven key financial milestones were achieved, and five out of five key transition milestones were achieved. In addition, overall achievement for the thermal plan for 2019 was above target at 153%. Due to the achievement specified above, 2019 AIP bonuses were paid at levels above target. If performance falls between threshold and target or target and maximum, the bonus opportunity will be determined on an interpolated basis. As a result, the CAFD metric, the key financial milestone, the key transition milestone, and thermal plan metrics were respectively weighted at 79%, 100%, 200% and 153% of target. Individual performance, which is determined on a discretionary basis, resulted in positive adjustments to the AIP Bonuses for the NEOs from 15% to 20%.
The annual incentive bonuses paid to NEOs for 2019 were:
|
| | | | | | |
| Named Executive Officer | | Percentage of Annual Base Salary (%) | | Percent of Target Achieved (%) | | Annual Incentive Payment ($) |
| Christopher S. Sotos | | 148 | | 124 | | 906,235 |
| Chad Plotkin | | 89 | | 124 | | 338,170 |
| Kevin P. Malcarney | | 57 | | 124 | | 170,568 |
| Mary‑Lee Stillwell | | 59 | | 124 | | 175,018 |
Long‑Term Incentive Compensation
We believe that equity awards directly align our NEOs’ interests with those of our stockholders. In 2019, the Compensation Committee granted our NEOs a combination of performance‑based equity awards directly linked to long‑term stockholder value creation and time-based equity awards which also represent a critical component of our long-term incentive compensation due to the retention aspects of the awards. To enhance our compensation program’s focus on Company performance, the large majority of these long‑term incentive awards (67%) were performance‑based (i.e., granted as RPSUs). The remaining 33% of our long-term incentive awards were time-based (i.e., granted as RSUs which vest over 3 years). We believe that our AIP appropriately focuses our NEOs on shorter‑term (one‑year) financial metrics while our LTIP emphasizes long‑term stockholder value creation (i.e. three‑year TSR outperformance). For 2019, Mr. Sotos’ target LTIP award was 250% of his base salary, Mr. Plotkin’s target LTIP award was 125% of his base salary, Mr. Malcarney’s target LTIP award was 100% of his base salary, and Ms. Stillwell’s target LTIP award was 75% of her base salary. The above mix of long‑term incentive compensation applied to all NEOs, except Ms. Stillwell, for 2019, who received 100% RSUs under the terms of her offer letter.
Relative Performance Stock Units
Each RPSU represents the potential to receive one share of Class C common stock based on the Company’s TSR performance ranked against the TSR performance of a comparator group of similar companies (the “Performance Peer Group”) after the completion of a three‑year performance period. Relative measures are designed to normalize for externalities, ensuring the program appropriately reflects management’s impact on the Company’s TSR by including peer companies that the Compensation Committee believes are similarly impacted by market conditions.
The payout of shares of Class C common stock at the end of the three‑year performance period is based on the Company’s TSR performance percentile rank compared with the TSR performance of the Performance Peer Group. To ensure a rigorous program design, the target‑level payout (100% of shares granted) requires the Company to perform at the 50th percentile. To induce management to achieve greater than target‑level performance in a down market, in the event that the Company’s TSR performance declines by more than 20% over the performance period, the target‑level payout (100% of shares granted) will require an even greater achievement of a 60th percentile performance. The Compensation Committee believes that this increased performance requirement addresses the concern that a disproportionate award may be paid in the event that our relative performance is high, but absolute performance is low.
In the event relative performance is below the 25th percentile, the award is forfeited. In the event relative performance is between the 25th percentile and the 50th percentile (or the 60th percentile if our TSR performance declines by more than 20% over the performance period), payouts will be based on an interpolated calculation. In the event relative performance reaches the 50th percentile (or the 60th percentile as described above), 100% of the award will be paid. In the event relative performance is between the 50th percentile (or the 60th percentile as described above) and the 75th percentile, payouts will be based on an interpolated calculation. In the event that relative performance is at or above the 75th percentile, a maximum payout of 150% of the target will be paid with respect to RPSU awards granted in 2019. Beginning with respect to RPSUs granted in 2018 and continuing for grants of 2019 RPSUs, the maximum payout was (and remains) changed from 200% to 150%.
The table below illustrates the design of our RPSUs in 2019.
|
| | | | | | | | |
| Performance Targets | | Performance Requirement | | Payout Opportunity | |
| Maximum | | 75th percentile or above | | 150% | |
| Target | | Standard Target: 50th percentile | | Modified Target: 60th percentile (less than −20% absolute TSR) | | 100% | |
| Threshold | | 25th percentile | | 25% | |
| Below Threshold | | Below 25th percentile | | 0% | |
Restricted Stock Units
Each RSU represents the right to receive one share of our Class C common stock after the completion of the vesting period. The RSUs granted to the NEOs in 2019 vest ratably, meaning that one‑third of the award vests each year on the anniversary of the grant date, over a three‑year period.
Dividend Equivalent Rights
In connection with awards of both RPSUs and RSUs, each NEO also receives DERs, which accrue with respect to the award to which they relate. DERs accrue only to the extent that the shares of Class C common stock underlying each award become vested and deliverable to the NEO. Accrued DERs are paid at the same time such shares are delivered to the NEO. Accordingly, DERs are forfeited if the underlying shares are forfeited.
Clawbacks
The Company has a “clawback” policy with regard to awards made under the AIP and LTIP in the case of a material financial restatement, including a restatement resulting from employee misconduct, or in the case of fraud, embezzlement or other serious misconduct that is materially detrimental to the Company. The Compensation Committee retains discretion regarding application of the policy. The policy is incremental to other remedies that are available to the Company. In addition to our “clawback” policy, if the Company is required to restate its earnings as a result of noncompliance with a financial reporting requirement due to misconduct, under the Sarbanes‑Oxley Act of 2002 (“SOX”), the CEO and the CFO would also be subject to a “clawback,” as required by SOX.
Benefits
All of our NEOs participate in the same retirement, life insurance, health and welfare plans. To generally support more complicated financial planning and estate planning matters, NEOs are eligible for reimbursement of annual tax return preparation, tax advice, financial planning and estate planning expenses. Mr. Sotos is eligible for a maximum reimbursement of $12,000 per year and the remaining NEOs are eligible for a maximum reimbursement of $3,000 per year.
Potential Severance and Change‑In‑Control Benefits
Each NEO’s RPSU and RSU award agreements under the LTIP provide for special treatment in the event of such NEO’s termination of employment under certain circumstances, including in connection with a change-in-control. Additionally, Mr. Sotos, pursuant to his employment agreement, and the remaining NEOs, pursuant to the Company’s Executive Change‑in‑Control and General Severance Plan for Tier IA and Tier IIA Executives (the “CIC Plan”) as well as pursuant to the Compensation Committee’s discretion under the AIP, are entitled to additional severance payments and benefits in the event of termination of employment under certain circumstances, including following a change‑in‑control.
Change‑in‑control arrangements are considered a market practice among many publicly‑held companies. Most often, these arrangements are utilized to encourage executives to remain with the company during periods of extreme job uncertainty and to ensure that any potential transaction is thoroughly and objectively evaluated. In order to enable a smooth transition during an interim period, change‑in‑control arrangements provide a defined level of security for the executive and the company, enabling a more seamless implementation of a particular merger, acquisition or asset sale or purchase, and subsequent integration.
For a more detailed discussion, including the quantification of potential payments, please see the section entitled “Severance and Change‑in‑Control” following the executive compensation tables below.
Other Matters
Stock Ownership Guidelines
The Compensation Committee and the Board require the CEO to hold Company stock with a value equal to 4.0 times his base salary until his separation from the Company. Senior Vice Presidents are required to hold Company stock with a value equal to 2.0 times their base salary until their separation from the Company. The Chief Accounting Officer is required to hold Company stock with a value of 1.5 times her base salary until her separation from the Company. Personal holdings and vested awards count towards the ownership multiple. Although NEOs are not required to make purchases of our common stock to meet their target ownership multiple, NEOs are restricted from divesting any securities until such ownership multiples are attained, except in the event of hardship or to make a required tax payment, and they must maintain their ownership multiple after any such transactions. Once met, they must maintain their ownership multiple during their service. The current target stock ownership for NEOs as of February 24, 2020 is shown below. Mr. Sotos and Mr. Plotkin became subject to the stock ownership guidelines upon becoming NEOs in 2016. In addition, Mr. Malcarney and Ms. Stillwell became subject to the stock ownership guidelines upon becoming NEOs in 2018. All of our NEOs met or exceeded their stock ownership guidelines as of February 24, 2020.
|
| | | | |
| Named Executive Officer | | Target Ownership Multiple | | Actual Ownership Multiple |
| Christopher S. Sotos | | 4.0x | | 8.8x |
| Chad Plotkin | | 2.0x | | 3.5x |
| Kevin P. Malcarney | | 2.0x | | 3.4x |
| Mary‑Lee Stillwell | | 1.5x | | 2.4x |
Tax and Accounting Considerations
Section 162(m) of the Internal Revenue Code (the “Code”) precludes us, as a public company, from taking a tax deduction for individual compensation to certain of our executive officers in excess of $1 million, subject to certain exemptions. Prior to 2018, the exemptions included an exclusion of performance‑based compensation within the meaning of Section 162(m) of the Code (“Section 162(m)”). The Tax Cuts and Jobs Act, enacted in December 2017, however, amended Section 162(m) and eliminated the exclusion of performance‑based compensation from the $1 million limit, subject to certain new exemptions for performance‑based compensation that is “grandfathered” for purposes of amended Section 162(m). The Compensation Committee believes tax deductibility of compensation is an important consideration and continues to consider the implications of legislative changes to Section 162(m) and the possible effect of exemptions for grandfathered compensation. However, the Compensation Committee also believes that it is important to retain flexibility in designing compensation programs, and as a result, has not adopted a policy that any particular amount of compensation must be deductible to the Company under Section 162(m).
The Compensation Committee also takes into account tax consequences to NEOs in designing the various elements of our compensation program, such as designing the terms of awards to defer immediate income recognition under Section 409A of the Code. The Compensation Committee remains informed of, and takes into account, the accounting implications of its compensation programs. However, the Compensation Committee approves programs based on their total alignment with our strategy and long‑term goals.
Compensation Tables
Summary Compensation Table
Fiscal Year Ended December 31, 2019
|
| | | | | | | | | | | | | | | | | | | | | | | | | |
| Name and Principal Position | | Year | | Salary ($)(1) | | Bonus ($) | | Stock Awards ($)(2) | | Option Awards ($) | | Non‑Equity Incentive Plan Compensation ($)(3) | | Change in Pension Value and Nonqualified Deferred Compensation Earnings ($) | | All Other Compensation ($)(4) | | Total ($) |
| Christopher S. Sotos | | 2019 | | 606,304 |
| | — | | 1,527,522 |
| | — |
| | 906,235 |
| | — |
| | 14,882 |
| | 3,054,942 |
|
| President and Chief | | 2018 | | 500,000 |
| | — | | 1,250,021 |
| | — |
| | 626,809 |
| | — |
| | 21,350 |
| | 2,398,180 |
|
| Executive Officer | | 2017 | | 500,000 |
| | — | | 1,250,008 |
| | — |
| | 685,000 |
| | — |
| | 22,750 |
| | 2,457,758 |
|
| Chad Plotkin | | 2019 | | 378,731 |
| | — | | 475,020 |
| | — |
| | 338,170 |
| | — |
| | 15,200 |
| | 1,207,120 |
|
| Senior Vice President | | 2018 | | 350,000 |
| | — | | 350,019 |
| | — |
| | 219,383 |
| | — |
| | 22,602 |
| | 942,004 |
|
| and Chief Financial | | 2017 | | 350,000 |
| | — | | 350,007 |
| | — |
| | 239,750 |
| | — |
| | 24,248 |
| | 964,005 |
|
| Officer | | | | | | | | | | | | | | | | | | |
Kevin P. Malcarney(5) | | 2019 | | 300,000 |
| | — | | 300,019 |
| | — |
| | 170,568 |
| | — |
| | 11,077 |
| | 781,663 |
|
| Senior Vice President, | | 2018 | | 180,000 |
| | — | | 589,868 |
| | — |
| | 96,855 |
| | — |
| | 500 |
| | 867,223 |
|
| General Counsel and | | 2017 | | — |
| | — | | — |
| | — |
| | — |
| | — |
| | — |
| | — |
|
| Corporate Secretary | | | | | | | | | | | | | | | | | | |
Mary‑Lee Stillwell(6) | | 2019 | | 295,000 |
| | — | | 221,261 |
| | — |
| | 175,018 |
| | — |
| | 10,892 |
| | 702,171 |
|
| Chief Accounting | | 2018 | | 86,231 |
| | — | | 556,336 |
| | — |
| | 49,849 |
| | — |
| | — |
| | 692,416 |
|
| Officer | | 2017 | | — |
| | — | | — |
| | — |
| | — |
| | — |
| | — |
| | — |
|
(1) Reflects base salary earnings.
(2) Reflects the grant date fair value determined in accordance with the Financial Accounting Standards Board Accounting Standards Codification Topic 718, Comparison - Stock Compensation. Clearway Energy, Inc. uses the Company's Class C common stock price on the date of grant as the fair value of the Company's RSUs. The fair value of RPSUs is estimated on the date of grant using a Monte Carlo simulation model. For performance-based RPSUs granted in 2019, if the maximum level of performance is achieved, the fair value will be approximately $1,535,162 for Mr. Sotos, $477,388 for Mr. Plotkin and $301,523 for Mr. Malcarney.
(3) The amounts shown in this column represent the annual incentive bonuses paid to the NEOs. Further information regarding the annual incentive bonuses is included in the “2019 Annual Incentive Bonuses” section of this CD&A.
(4) The amounts provided in the All Other Compensation column represent the additional benefits payable by the Company and include insurance benefits; the employer match under the Company’s 401(k) plan; financial counseling services up to $12,000 per year for Mr. Sotos and up to $3,000 per year for all other NEOs, not including the financial advisor’s travel or out-of-pocket expenses; and when applicable, the Company’s discretionary contribution to the 401(k) plan. The following table identifies the additional compensation for each NEO.
|
| | | | | | | | | | | | | | | | | |
| Name | | Year | | Life and Disability Insurance Reimbursement ($) | | Financial Advisor Services ($) | | 401(k) Employer Matching Contribution ($) | | 401(k) Discretionary Contribution ($) | | Total ($) |
| Christopher S. Sotos | | 2019 | | 1,000 |
| | 2,682 |
| | 11,200 |
| | — |
| | 14,882 |
|
| | | 2018 | | — |
| | 2,250 |
| | 11,000 |
| | 8,100 |
| | 21,350 |
|
| | | 2017 | | 4,000 |
| | — |
| | 10,800 |
| | 7,950 |
| | 22,750 |
|
| Chad Plotkin | | 2019 | | 1,000 |
| | 3,000 |
| | 11,200 |
| | — |
| | 15,200 |
|
| | | 2018 | | — |
| | 3,000 |
| | 11,502 |
| | 8,100 |
| | 22,602 |
|
| | | 2017 | | 3,000 |
| | 3,000 |
| | 10,298 |
| | 7,950 |
| | 24,248 |
|
| Kevin P. Malcarney | | 2019 | | — |
| | — |
| | 11,077 |
| | — |
| | 11,077 |
|
| | | 2018 | | — |
| | 500 |
| | — |
| | — |
| | 500 |
|
| | | 2017 | | — |
| | — |
| | — |
| | — |
| | — |
|
| Mary‑Lee Stillwell | | 2019 | | — |
| | — |
| | 10,892 |
| | — |
| | 10,892 |
|
| | | 2018 | | — |
| | — |
| | — |
| | — |
| | — |
|
| | | 2017 | | — |
| | — |
| | — |
| | — |
| | — |
|
(5) Mr. Malcarney was appointed as Senior Vice President, General Counsel & Corporate Secretary on May 11, 2018.
(6) Ms. Stillwell was appointed as Chief Accounting Officer on August 31, 2018.
Grants of Plan‑Based Awards
Fiscal Year Ended December 31, 2019
|
| | | | | | | | | | | | | | | | | | | | | | | | | | | | |
| | | | | | | | | Estimated Possible Payouts Under Non‑Equity Incentive Plan Awards | | Estimated Future Payouts Under Equity Incentive Plan Awards | | All Other Stock Awards: Number of Shares of Stock | | Grant Date Fair Value of Stock and Option |
| Name | | Award Type | | Grant Date | | Approval Date | | Threshold ($)(1) | Target ($)(2) | Maximum ($)(3) | | Threshold (#) | Target (#) | Maximum (#) | | or Units (#) | | Awards ($)(4) |
| Christopher S. Sotos | | AIP | | — |
| | — |
| | 305,500 |
| 611,000 |
| 1,222,000 |
| | — |
| — |
| — |
| | — |
| | — |
|
| | | RPSU | | 1/2/2019 |
| | 12/6/2018 |
| | — |
| — |
| — |
| | 13,668 |
| 54,671 |
| 82,007 |
| | — |
| | 1,023,441 |
|
| | | RSU | | 1/2/2019 |
| | 12/6/2018 |
| | — |
| — |
| — |
| | — |
| — |
| — |
| | 29,307 |
| | 504,080 |
|
| Chad Plotkin | | AIP | | — |
| | — |
| | 114,000 |
| 228,000 |
| 456,000 |
| | - | — |
| — |
| | — |
| | — |
|
| | | RPSU | | 1/2/2019 |
| | 11/29/2018 |
| | — |
| — |
| — |
| | 4,250 |
| 17,001 |
| 25,502 |
| | — |
| | 318,259 |
|
| | | RSU | | 1/2/2019 |
| | 11/29/2018 |
| | — |
| — |
| — |
| | — |
| — |
| — |
| | 9,114 |
| | 156,761 |
|
| Kevin P. Malcarney | | AIP | | — |
| | — |
| | 60,000 |
| 120,000 |
| 240,000 |
| | — |
| — |
| — |
| | — |
| | — |
|
| | | RPSU | | 1/2/2019 |
| | 12/6/2018 |
| | — |
| — |
| — |
| | 2,685 |
| 10,738 |
| 16,107 |
| | — |
| | 201,015 |
|
| | | RSU | | 1/2/2019 |
| | 12/6/2018 |
| | — |
| — |
| — |
| | — |
| — |
| — |
| | 5,756 |
| | 99,003 |
|
| Mary‑Lee Stillwell | | AIP | | — |
| | — |
| | 59,000 |
| 118,000 |
| 236,000 |
| | — |
| — |
| — |
| | — |
| | — |
|
| | | RPSU | | — |
| | — |
| | — |
| — |
| — |
| | — |
| — |
| — |
| | — |
| | — |
|
| | | RSU | | 1/2/2019 |
| | 12/6/2018 |
| | — |
| — |
| — |
| | — |
| — |
| — |
| | 12,864 |
| | 221,261 |
|
(1) Threshold non-equity incentive plan awards include annual incentive plan threshold payments, as presented in the CD&A.
(2) Target non-equity incentive plan awards include annual incentive plan target payments, as presented in the CD&A.
(3) Maximum non-equity incentive plan awards include annual incentive plan maximum payments, as presented in the CD&A.
(4) Reflects the grant date fair value determined in accordance with the Financial Accounting Standards Board Accounting Standards Codification Topic 718, Comparison-Stock Compensation. The Company uses the Class C common stock price on the date of grant as the fair value of the Company’s RSUs. The fair value of RPSUs is estimated on the date of grant using a Monte Carlo simulation model.
Outstanding Equity Awards at Fiscal Year End
Fiscal Year Ended December 31, 2019
|
| | | | | | | | | | | | | | | | | | | | | | | |
| | | Option Awards | | Stock Awards |
| | | Number of | | Number of | | | | | | Number | | Market Value | | Equity Incentive Plan Awards |
| Name | | Securities Underlying Unexercised Options (#) Exercisable | | Securities Underlying Unexercised Options (#) Unexercisable | | Option Exercise Price ($) | | Option Expiration Date | | of Shares or Units of Stock that Have Not Vested (#) | | of Shares or Units of Stock that Have Not Vested ($) | | Number of Unearned Shares that Have Not Vested (#)(1) | | Market Value of Unearned Shares that Have Not Vested ($)(1) |
| Christopher S. Sotos | | — |
| | — |
| | — |
| | — |
| | 52,266 (2) | | 1,042,707 |
| | 133,645 (3) |
| | 2,666,218 |
|
| Chad Plotkin | | — |
| | — |
| | — |
| | — |
| | 15,544 (4) | | 310,103 |
| | 39,114 (5) |
| | 780,324 |
|
| Kevin P. Malcarney | | — |
| | — |
| | — |
| | — |
| | 20,046 (6) | | 399,918 |
| | 10,738(7) |
| | 214,223 |
|
| Mary‑Lee Stillwell | | — |
| | — |
| | — |
| | — |
| | 24,916 (8) | | 497,074 |
| | — |
| | — |
|
| | | | | | | | | | | | | | | | | |
(1) Assumes achievement at target award level for 2017, 2018 and 2019 RPSU awards as discussed in the CD&A.
(2) This amount represents 16,840 RSUs that vested on January 2, 2020, 8,776 RSUs that vested on January 3, 2020, 16,861 RSUs that will vest on January 2, 2021, and 9,789 RSUs that will vest on January 2, 2022.
(3) This amount represents 39,375 RPSUs that vested on January 3, 2020, 39,599 that will vest on January 2, 2021, and 54,671 that will vest on January 2, 2022. On January 3, 2020, the 2017 RPSU award vested at 157% of target based on the Company’s TSR performance ranked against the TSR performance of the Performance Peer Group.
(4) This amount represents 5,017 RSUs that vested on January 2, 2020, 2,458 RSUs that vested on January 3, 2020, 5,024 RSUs that will vest on January 2, 2021, and 3,045 RSUs that will vest on January 2, 2022.
(5) This amount represents 11,025 RPSUs that vested on January 3, 2020, 11,088 that will vest on January 2, 2021, and 17,001 that will vest on January 2, 2022. On January 3, 2020, the 2017 RPSU award vested at 157% of target based on the Company’s TSR performance ranked against the TSR performance of the Performance Peer Group.
(6) This amount represents 1,916 RSUs that vested on January 2, 2020, 10,967 RSUs that vested on January 3, 2020, 5,240 RSUs that will vest on January 2, 2021, and 1,923 RSUs that will vest on January 2, 2022.
(7) This amount represents 10,738 RPSUs that will vest on January 2, 2022.
(8) This amount represents 4,283 RSUs that vested on January 2, 2020, 9,249 RSUs that vested on January 3, 2020, 7,087 RSUs that will vest on January 2, 2021, and 4,297 RSUs that will vest on January 2, 2022.
Option Exercises and Stock Vested
Fiscal Year Ended December 31, 2019
|
| | | | | | | | | | |
| | Option Awards | | Stock Awards |
| Name | | Number of Shares Acquired on Exercise (#) | | Value Realized on Exercise ($) | | Number of Shares Acquired on Vesting (#)(1) | | Value Realized on Vesting ($) |
| Christopher S. Sotos | | — |
| | — |
| | 95,628 (2) | | 1,676,418 (3) |
| Chad Plotkin | | — |
| | — |
| | 9,801 (4) | | 170,136 (3) |
| Kevin P. Malcarney | | — |
| | — |
| | 19,943(5) | | 351,612(6) |
| Mary‑Lee Stillwell | | — |
| | — |
| | 16,523(7) | | 291,303(6) |
(1) Includes shares and DERs that vested pursuant to underlying awards and converted to Class C common stock in 2019.
(2) Represents 7,080 RSUs and 509 DERs that vested on January 2, 2019 pursuant to the stock compensation award granted on January 2, 2018. Represents 8,749 RSUs and 1,207 DERs that vested on January 3, 2019 pursuant to the stock compensation award granted on January 3, 2017. Represents 66,559 RSUs and 11,524 DERs that vested on January 4, 2019 pursuant to the stock compensation award granted on August 8, 2016.
(3) The values are based on January 2, 2019 Class C common stock closing share price of $17.20 for awards and DERs that vested on January 2, 2019. The values are based on January 3, 2019 Class C common stock closing share price of $17.00 for awards and DERs that vested on January 3, 2019. The values are based on January 4, 2019 Class C common stock closing share price of $17.63 for awards and DERs that vested on January 4, 2019.
(4) Represents1,982 RSUs and 142 DERs that vested on January 2, 2019 pursuant to the stock compensation award granted on January 2, 2018. Represents 2,450 RSUs and 338 DERs that vested on January 3, 2019 pursuant to the stock compensation award granted on January 3, 2017. Represents 4,226 RSUs and 663 DERs that vested on January 4, 2019 pursuant to the stock compensation award granted on November 7, 2016.
(5) Represents 18,942 RSUs and 1,001 DERs that vested on January 4, 2019 pursuant to the stock compensation award granted on May 11, 2018.
(6) The values are based on January 4, 2019 Class C common stock closing share price of $17.63 for awards and DERs that vested on January4, 2019.
(7) Represents 15,975 RSUs and 548 DERs that vested on January 4, 2019 pursuant to the stock compensation award granted on August 31, 2018.
Employment Agreements
The Company has not entered into employment agreements with any officers other than Mr. Sotos.
On August 8, 2016, the Company entered into an employment agreement with Mr. Sotos pursuant to which Mr. Sotos serves as the Company’s President and CEO for the term that began on May 6, 2016 (the “Effective Date”) and ending on the date that his employment is terminated by either party. The employment agreement entitled Mr. Sotos to an annual base salary of $500,000 for the period beginning on the Effective Date and ended on December 31, 2016. For each annual period thereafter, our Board determines whether to increase Mr. Sotos’ annual base salary (as noted in the above Summary Compensation Table, Mr. Sotos’ base salary was increased to over $600,000 for fiscal year 2019). The employment agreement provides that, beginning with the 2016 fiscal year, Mr. Sotos is eligible to receive an annual bonus at a target amount equal to 100% of base salary (i.e., AIP bonus), based on achievement of criteria determined by the Board with input from Mr. Sotos. The maximum award opportunity each year is 200% of the target amount. The employment agreement further provides that Mr. Sotos is eligible to participate in the LTIP, on such terms as are set forth in the plan. Mr. Sotos’ target LTIP award for the 2019 fiscal year was approximately 250% of base salary.
In addition to the compensation and benefits described above, as well as paid vacation and director and officer liability insurance, the employment agreement provides that Mr. Sotos will receive the following:
Reimbursement for annual tax return preparation expenses and tax advice and financial planning, up to a maximum of $12,000 per year;
Eligibility to participate in the Company’s retirement plans, health and welfare plans, and disability insurance plans under the same terms, and to the same extent, as other senior management of the Company;
Reimbursement for the costs of litigation or other disputes incurred in asserting any claims under the employment agreement, unless the court finds in favor of the Company; and
Reimbursement for legal fees and expenses incurred in connection with negotiating the employment agreement and other agreements referenced therein, up to a maximum of $6,000, which reimbursement was completed in 2016.
The employment agreement also entitles him to certain severance payments and benefits in the event his employment terminates under certain circumstances. These severance payments and benefits are described and quantified under the section “Severance and Change‑in‑Control” below. In addition, under the employment agreement, the Company has agreed to indemnify Mr. Sotos against any claims arising as a result of his position with the Company to the maximum extent permitted by law.
The employment agreement includes non‑competition and non‑solicitation restrictions on Mr. Sotos during the term of his employment and for one year after his termination of employment. The employment agreement also includes confidentiality, indemnification obligations and intellectual property restrictions and an obligation for Mr. Sotos to cooperate with the Company in the event of any internal, administrative, regulatory, or judicial proceeding. The provisions of the employment agreement may only be waived with the written consent of the Company and Mr. Sotos.
Severance and Change‑In‑Control
Each NEO’s RPSU and RSU award agreements under the LTIP provide for special treatment in the event of such NEO’s termination of employment under certain circumstances. Upon death or disability, an NEO’s RSUs and RPSUs will vest in full and the performance metrics with respect to the RPSUs will be deemed to be achieved at target levels. Upon retirement, an NEO’s RSUs and RPSUs will remain eligible for vesting pursuant to the award agreement as though the NEO was continuously employed by the Company throughout the relevant period; provided that retirement occurs more than 12 months following the applicable award’s grant date. Further, if an NEO’s employment is involuntarily terminated by the Company without cause (as defined in Mr. Sotos’ employment agreement with respect to Mr. Sotos’ and as defined in the LTIP with respect to the other NEOs) within the six months immediately prior to, or the 12 months immediately following, a change in control of the Company (as defined in the LTIP), (i) such NEO’s RSUs will vest in full immediately upon the later of such change in control or such termination of employment and (ii) the Compensation Committee will, pursuant to the terms and conditions of the LTIP and RPSU award agreement(s), determine the final amount payable to the NEO, if any, pursuant to his or her RPSUs. In general, no RPSU or RSU accelerated vesting applies to any other involuntary termination, although new hire grants of RSUs, such as the grant made to Ms. Stillwell on August 31, 2018, provide pro-rated vesting for certain involuntary terminations of service that occur in connection with certain significant business events.
In addition to the above described treatment of his or her equity awards, Mr. Sotos, pursuant to his employment agreement, and the other NEOs, pursuant to the CIC Plan and in some cases, the AIP, are entitled to certain additional severance payments and benefits in the event of termination of employment under certain circumstances, including following a change‑in‑control.
Mr. Sotos’ Benefits
If Mr. Sotos’ employment is involuntarily terminated by the Company without cause or if he terminates his employment for good reason, subject to Mr. Sotos executing a release of claims, the Company agrees to provide Mr. Sotos with the following severance benefits:
A lump sum payment equal to no less than 1.5 times Mr. Sotos’ annual base salary in effect at the time of the Effective Date;
A lump sum payment equal to the target bonus opportunity under the then‑current bonus plan, which amount will be pro‑rated based on the number of days during the year that he was employed by the Company;
Any unpaid bonus amount for the prior fiscal year to the extent not paid prior to the termination date; and
Reimbursement of COBRA premiums for 18 months after the date of termination, except that such coverage will be discontinued if Mr. Sotos becomes eligible for medical benefits from a subsequent employer or otherwise.
If Mr. Sotos’ employment is involuntarily terminated by the Company without cause or if he terminates his employment for good reason within the six months immediately prior to, or the 12 months immediately following, a change‑in‑control of the Company, in lieu of the severance benefits set forth above, the Company will provide Mr. Sotos with the following severance benefits:
A lump sum payment of no less than three times the sum of (a) Mr. Sotos’ base salary in effect at the Effective Date and (b) Mr. Sotos’ target bonus opportunity for the year of termination;
A lump sum payment equal to the target bonus opportunity under the then‑current bonus plan, which amount will be pro‑rated based on the number of days during the year that he was employed by the Company;
Any unpaid bonus amount for the prior fiscal year to the extent not paid prior to the termination date; and
Reimbursement of COBRA premiums for 18 months after the date of termination, except that such coverage will be discontinued if Mr. Sotos becomes eligible for medical benefits from a subsequent employer or otherwise.
If Mr. Sotos’ employment is terminated as a result of his death or disability, the Company agrees to pay him an amount equal to the target bonus opportunity for the year of termination, which amount will be pro‑rated based on the number of days during the year that Mr. Sotos’ was employed by the Company. In addition, the Company will pay Mr. Sotos any unpaid bonus amount for the prior fiscal year to the extent not paid prior to the termination date.
If an excise tax under Section 4999 of the Code would be triggered by any payments under Mr. Sotos’ employment agreement or otherwise upon a change‑in‑control, the Company will reduce such payments so that no amounts are subject to Section 4999 of the Code, if such reduction would cause the amount to be retained by Mr. Sotos to be greater than if Mr. Sotos were required to pay such excise tax.
NEO Benefits
Eligible NEOs may receive a discretionary payment of the prorated target bonus under the AIP in the event of such NEO’s termination of employment under certain circumstances, including upon his or her termination due to retirement or involuntary termination without cause. Such amount, if payable in the Compensation Committee’s discretion, will be pro-rated based on the number of days during the year that he or she was employed by the Company. In addition, under the CIC Plan, in the event of involuntary termination without cause, eligible NEOs are entitled to a general severance benefit equal to 1.5 times base salary payable in a lump sum amount and reimbursement for COBRA benefits continuation cost for a period of 18 months.
The CIC Plan also provides a change‑in‑control benefit in the event that, within six months prior to, as well as 12 months following, a change‑in‑control, an eligible NEO’s employment is either involuntarily terminated by the Company without cause or voluntarily terminated by such NEO for good reason. Mr. Plotkin’s change‑in‑control benefit consists of an amount equal to 2.99 times the sum of his base salary plus the annual target incentive for the year of termination, payable in a lump sum amount. The change‑in‑control benefit for other eligible NEOs (other than Mr. Plotkin) consists of an amount equal to two times the sum of their base salary plus the annual target incentive for the year of termination, payable in a lump sum amount. All such NEOs are also eligible for an amount equal to their target bonus for the year of termination, prorated for the number of days during the
performance period that such NEO was employed by the Company and reimbursement for COBRA benefits continuation cost for a period of 18 months.
As a condition of receiving severance or change‑in‑control benefits, an eligible NEO must execute a release of claims and acknowledge the restrictive covenants in the CIC Plan. Such restrictive covenants include non‑competition, non‑solicitation and non‑disparagement covenants applicable for one year after termination, confidentiality and intellectual property obligations.
If an excise tax under Section 4999 of the Code would be triggered for an eligible NEO by any payments under the CIC Plan or otherwise upon a change‑in‑control, the Company will reduce such payments so that no amounts are subject to Section 4999 of the Code, if such reduction would cause the amount to be retained such NEO to be greater than if such NEO were required to pay such excise tax.
Definition of Change‑In‑Control, Etc.
In general, under Mr. Sotos’ employment agreement and the CIC Plan, a “change‑in‑control” occurs in the event: (a) any person or entity (with certain exceptions), becomes the direct or indirect beneficial owner of 50% or more of the Company’s voting stock or obtains the power to, directly or indirectly, vote or cause to be voted 50% or more of the Company’s capital stock entitled to vote in the election of directors, including by contract or through proxy, (b) directors serving on the Board as of a specified date cease to constitute at least a majority of the Board unless such directors are approved by a vote of at least two‑thirds (2/3) of the incumbent directors, provided that a person whose assumption of office is in connection with an actual or threatened election contest or actual or threatened solicitation of proxies including by reason of agreement intended to avoid or settle such contest shall not be considered to be an incumbent director, (c) any reorganization, merger, consolidation, sale of all or substantially all of the assets of the Company or other transaction is consummated and the previous stockholders of the Company fail to own at least 50% of the combined voting power of the resulting entity in substantially the same proportions of their ownership in the Company immediately prior to such transaction, or (d) the stockholders approve a plan or proposal to liquidate or dissolve the Company.
An involuntary termination without “cause” means the NEO’s termination by the Company for any reason other than the NEO’s (a) conviction of, or agreement to a plea of nolo contendere to, a felony or other crime involving moral turpitude (including an indictment therefor under the CIC Plan), (b) willful failure to perform his or her duties, (c) willful gross neglect or willful misconduct (including a material act of theft, fraud, malfeasance or dishonesty in connection with his or her performance of duties under the CIC Plan), or (d) breach of any written agreement between the Company or NEO, a violation of the Company’s Code of Conduct or other written policy (or in Mr. Sotos’ case, a material breach of his employment agreement).
A voluntary termination for “good reason” means the resignation of the NEO in the event of (a) a material reduction in his or her compensation or benefits, (b) a material diminution in his or her title, authority, duties or responsibilities, or (c) the failure of a successor to the Company to agree, in writing, to assume the CIC Plan within 15 days after a merger, consolidation, sale or similar transaction. In Mr. Sotos’ case only, “good reason” also includes (i) any material failure by the Company to comply with his employment agreement, (ii) his removal from the Board, (iii) the failure to elect him to the Board during any regular election, (iv) any reduction in his target annual bonus opportunity and long-term incentive award, or (v) a change in reporting structure of the Company requiring Mr. Sotos to report to anyone other than the Board.
Potential Payments Upon Termination or Change‑In‑Control
The amount of compensation payable to each NEO in each circumstance is shown in the table below, assuming that termination of employment occurred as of December 31, 2019, and including payments that would have been earned as of such date. The amounts shown below do not include benefits payable under the Company’s 401(k) plan.
|
| | | | | | | | | | | |
| Named Executive Officer | | Involuntary Termination Not for Cause ($) | Voluntary Termination for Good Reason ($) | | Involuntary Not for Cause or Voluntary for Good Reason Following a Change in Control ($) | | Death or Disability ($) |
| Christopher S. Sotos | | 1,391,643 |
| 1,391,643 |
| | 8,086,500 |
| | 4,722,857 |
|
| Chad Plotkin | | 828,380 |
| — |
| | 3,282,110 |
| | 1,433,810 |
|
| Kevin P. Malcarney | | 601,992 |
| — |
| | 1,652,215 |
| | 780,223 |
|
| Mary‑Lee Stillwell | | 786,806 |
| — |
| | 1,505,044 |
| | 648,222 |
|
CEO Pay Ratio
As a result of the recently adopted rules under the Dodd‑Frank Act, the SEC requires disclosure of the CEO to median employee pay ratio. The following is a reasonable estimate, prepared under applicable SEC rules, of the ratio of the annual total compensation of our CEO, Mr. Sotos, to the annual total compensation of our median employee.
We determined that we could use in our 2019 CEO pay ratio analysis the same median employee that we identified in 2018 given that there has been no change in either our employee population or our employee compensation arrangements that we believe would significantly impact our 2019 pay ratio disclosure. Similarly, there has been no change in our median employee's circumstances that we reasonably believe would result in a significant change to our 2019 pay ratio disclosure. Our median employee’s annual total compensation for 2019 was determined using the same rules that apply to reporting the compensation of our NEOs (including our CEO) in the “Total” column of the “Summary Compensation Table - 2017 - 2019” above. The following total compensation amounts were determined based on that methodology:
The annual total compensation of the median employee for 2019 was $85,913.
The annual total compensation of Mr. Sotos for 2019 was $3,054,942.
As a result, we estimate that Mr. Sotos’ 2019 annual total compensation was approximately 36 times that of our median employee.
Given the different methodologies, exemptions, estimates and assumptions that various public companies use to determine an estimate of their pay ratio, the estimated ratio reported above should not be solely used as a basis for comparison between companies.
Item 12 — Security Ownership of Certain Beneficial Owners and Management and Related Stockholder Matters
Clearway Energy LLC Ownership
As of December 31, 2019, GIP, through CEG, owned 42,738,750 of each of the Company's Class B units and Class D units and Clearway, Inc. owned 34,586,250 of the Company's Class A units and 73,187,646 of the Company's Class C units. Clearway, Inc., through its holdings of Class A units and Class C units, has a 57.01% economic interest in the Company. Clearway, Inc. consolidates the results of the Company through its controlling interest as sole managing member. GIP, through CEG's holdings of Class B units and Class D units, has a 42.99% economic interest in the Company.
Clearway Energy, Inc. Ownership
Stock Ownership of Executive Officers
The following table sets forth information concerning beneficial ownership of Clearway, Inc.’s Class A and Class C common stock and combined voting power of Class A, Class B, Class C and Class D common stock for: (a) each NEO and (b) all executive officers as a group. The percentage of beneficial ownership is based on 34,599,645 shares of Class A common stock outstanding as of February 24, 2020 and 78,850,894 shares of Class C common stock outstanding as of February 24, 2020, and percentage of combined voting power is based on 78,554,291 votes represented by Clearway, Inc.’s outstanding Class A, Class B, Class C and Class D common stock in the aggregate as of February 24, 2020. The percentage of beneficial ownership and the percentage of combined voting power also include any shares that such person has the right to acquire within 60 days of February 24, 2020. Unless otherwise indicated, each person has sole voting and dispositive power with respect to the shares set forth in the following table.
The address of the beneficial owners is Clearway Energy, Inc., 300 Carnegie Center, Suite 300, Princeton, New Jersey 08540.
|
| | | | | | | |
| | | Common Stock |
| Class A Common Stock | Class C Common Stock | % of |
| Executive Officers | Number(1) | % of Class A Common Stock | Number(1) | % of Class C Common Stock | Combined Voting Power(2) |
| Christopher S. Sotos | 23,100(3) |
| * |
| 124,515(3) | * | * |
| Chad Plotkin | 6,697(4) |
| * |
| 30,385(4) | * | * |
| Kevin P. Malcarney | 600(5) |
| * |
| 29,316(5) | * | * |
| Mary‑Lee Stillwell | — |
| — |
| 17,553(6) | * | * |
All executive officers as a group (four people) | 30,397(7) |
| * |
| 201,769 (7) | * | * |
| | | | | |
* Less than one percent of outstanding Class A common stock, Class C common stock or combined voting power, as applicable.
(1) The number of shares beneficially owned by each person or entity is determined under the rules of the SEC, and the information is not necessarily indicative of beneficial ownership for any other purpose. Under such rules, each person or entity is considered the beneficial owner of any: (a) shares to which such person or entity has sole or shared voting power or dispositive power and (b) shares that such person or entity has the right to acquire within 60 days.
(2) Represents the voting power of all of the classes of Clearway, Inc.’s common stock together as a single class. Each holder of Class A or Class B common stock is entitled to one vote for each share held. Each holder of Class C or Class D common stock is entitled to 1/100th of one vote for each share held. Holders of shares of Clearway, Inc.’s Class A, Class B, Class C and Class D common stock vote together as a single class on all matters presented to its stockholders for their vote or approval, except as otherwise provided by applicable law.
(3) Includes 9,489 DERs to be paid in Class C common stock. Excludes 26,650 RSUs and 94,270 RPSUs. Each RSU represents the right to receive one share of Class C common stock upon vesting. Each RPSU represents the potential to receive Class C common stock based upon Clearway, Inc. achieving a certain level of total shareholder return relative to Clearway, Inc.’s peer group over a three-year performance period. Each DER represents the right to receive the dividends and distributions that would have otherwise been paid with respect to a share subject to a RSU or RPSU award (if such share were outstanding rather than being subject to the applicable award).
(4) Includes 2,771 DERs to be paid in Class C common stock. Excludes 8,069 RSUs and 28,089 RPSUs. Each RSU represents the right to receive one share of Class C common stock upon vesting. Each RPSU represents the potential to receive Class C common stock based upon Clearway, Inc. achieving a certain level of total shareholder return relative to Clearway, Inc.’s peer group over a three-year performance period. Each DER represents the right to receive the dividends and distributions that would have otherwise been paid with respect to a share subject to a RSU or RPSU award (if such share were outstanding rather than being subject to the applicable award).
(5) Includes 1,066 DERs to be paid in Class C common stock. Excludes 7,163 RSUs and 10,738 RPSUs. Each RSU represents the right to receive one share of Class C common stock upon vesting. Each RPSU represents the potential to receive Class C common stock based upon Clearway, Inc. achieving a certain level of total shareholder return relative to Clearway, Inc.’s peer group over a three-year performance period. Each DER represents the right to receive the dividends and distributions that would have otherwise been paid with respect to a share subject to a RSU or RPSU award (if such share were outstanding rather than being subject to the applicable award).
(6) Includes 662 DERs to be paid in Class C common stock. Excludes 11,384 RSUs. Each RSU represents the right to receive one share of Class C common stock upon vesting. Each DER represents the right to receive the dividends and distributions that would have otherwise been paid with respect to a share subject to a RSU award (if such share were outstanding rather than being subject to the applicable award).
(7) Consists of the total holdings of all executive officers as a group.
Item 13 — Certain Relationships and Related Transactions, and Director Independence
Relationship with GIP and Clearway Energy, Inc.
GIP, through its ownership of CEG, indirectly owns all of Clearway, Inc.’s outstanding Class B common stock and its Class D common stock, which represents, in the aggregate, 54.95% of the voting interest in its stock and receives distributions from the Company through its ownership of our Class B and Class D units. Holders of Clearway, Inc.’s Class A common stock and Class C common stock hold, in the aggregate, the remaining 45.05% of the voting interest in its stock. Each holder of Class A or Class B common stock is entitled to one vote for each share held. Each holder of Class C or Class D common stock is entitled to 1/100th of one vote for each share held. The holders of Clearway, Inc.’s outstanding shares of Class A and Class C common stock are entitled to dividends as declared. Clearway, Inc., through its holdings of Class A units and Class C units, has a 57.01% economic interest in the Company. Clearway, Inc. consolidates the results of the Company through its controlling interest as sole managing member. GIP, through CEG's holdings of Class B units and Class D units, has a 42.99% economic interest in the Company.
Accordingly, through its voting control of Clearway, Inc., GIP effectively has the ability to control our management.
Related Party Transactions
Strategic Sponsorship with GIP
In connection with the GIP Transaction, Clearway, Inc. entered into a Consent and Indemnity Agreement with NRG and GIP setting forth key terms and conditions of Clearway, Inc.'s consent to the GIP Transaction.
Also, in connection with the GIP Transaction, the Company entered into the following agreements on August 31, 2018:
CEG Master Services Agreements
The Company, along with Clearway, Inc. and Clearway Energy Operating LLC, entered into Master Services Agreements with CEG (the “CEG Master Services Agreements”), pursuant to which CEG and certain of its affiliates or third-party service providers began providing certain services, including operational and administrative services, which include human resources, information systems, external affairs, accounting, procurement, and risk management services, to the Company and certain of its subsidiaries, and the Company and certain of its subsidiaries began providing certain services, including accounting, internal audit, tax and treasury services, to CEG, in exchange for the payment of fees in respect of such services. For the year ended December 31, 2018 and 2017:
|
| | | | | | | | | | | | | | | | | | | |
| | Conventional | | Renewables | | Thermal | | Eliminations | | Total |
| (In millions) | | | | | | | | | |
| Year ended December 31, 2018 | | | | | | | | | |
| Energy and capacity revenues | $ | 342 |
| | $ | 572 |
| | $ | 170 |
| | $ | — |
| | $ | 1,084 |
|
| Other revenues | — |
| | 16 |
| | 26 |
| | (3 | ) | | 39 |
|
| Cost of fuels | (3 | ) | | — |
| | (71 | ) | | — |
| | (74 | ) |
| Contract amortization | (5 | ) | | (62 | ) | | (3 | ) | | — |
| | (70 | ) |
| Gross margin | 334 |
| | 526 |
| | 122 |
| | (3 | ) | | 979 |
|
| Contract amortization | 5 |
| | 62 |
| | 3 |
| | — |
| | 70 |
|
| Economic gross margin | $ | 339 |
| | $ | 588 |
| | $ | 125 |
| | $ | (3 | ) | | $ | 1,049 |
|
| |
|
| |
|
| |
|
| | | |
|
| Year ended December 31, 2017 | | | | | | | | |
|
| Energy and capacity revenues | $ | 341 |
| | $ | 547 |
| | $ | 150 |
| | $ | — |
| | $ | 1,038 |
|
| Other revenues | — |
| | 16 |
| | 24 |
| | — |
| | 40 |
|
| Cost of fuels | (1 | ) | | — |
| | (62 | ) | | — |
| | (63 | ) |
| Contract amortization | (5 | ) | | (62 | ) | | (2 | ) | | — |
| | (69 | ) |
| Gross margin | 335 |
| | 501 |
| | 110 |
| | — |
| | 946 |
|
| Contract amortization | 5 |
| | 62 |
| | 2 |
| | — |
| | 69 |
|
| Economic gross margin | $ | 340 |
| | $ | 563 |
| | $ | 112 |
| | $ | — |
| | $ | 1,015 |
|
Gross margin increased by $33 million2019, the Company paid approximately $1,059,000 under the CEG Master Services Agreements. In addition, certain Thermal segment projects reimbursed CEG approximately $1,433,000 during the year ended December 31, 2019 for costs incurred by CEG on behalf of such entities.
Voting and Governance Agreement
The Company entered into a Voting and Governance Agreement with CEG, relating to certain governance matters of the Company, including the composition of the Board of Clearway, Inc. and employment status of the CEO of the Company.
Limited Liability Company Agreement
Clearway, Inc. entered into the Fourth Amended and Restated Limited Liability Company Agreement of Clearway Energy LLC with CEG, which sets forth the rights and obligations of Clearway, Inc., as managing member, and CEG, as member, of the Company as further described below.
Right of First Offer Agreements
CEG ROFO Agreement
On August 31, 2018, comparedClearway, Inc. entered into a ROFO Agreement with CEG (the “CEG ROFO Agreement”) and, solely for certain purposes thereof, GIP, pursuant to which CEG granted Clearway, Inc. and its subsidiaries a right of first offer on any proposed sale or transfer of certain assets owned by CEG. On August 1, 2019, the same periodCEG ROFO Agreement was amended to grant Clearway, Inc. and its affiliates a right of first offer on any proposed sale, transfer or other disposition of certain assets of CEG (the “CEG ROFO Assets”) until August 31, 2023, as listed in 2017, primarily due to:the table below. CEG is not obligated to sell the remaining CEG ROFO Assets to us and, if offered by CEG, we cannot be sure whether these assets will be offered on acceptable terms or that we will choose to consummate such acquisitions.
The assets listed below represent our currently committed investments in projects with CEG, as well as the assets subject to our ROFO Agreement with CEG:
|
| | | | | | |
| Segment | | Increase (Decrease) | | Reason for Increase |
| (In millions) | | | | |
| Renewables: | | $ | 22 |
| | An increase of $15 million related to higher wind generation, primarily at the Alta Wind projects, and higher insolation, and a $7 million increase due to the Buckthorn Solar project reaching COD in July 2018 |
| Thermal: | | 12 |
| | $7 million increase due to the acquisition of the UPMC Thermal Project, which was completed in 2018, as well as an increase of $5 million due to higher steam and chilled water usage across the portfolio in 2018 |
| Conventional: | | (1 | ) | | Decrease due to an emission credit reimbursement in 2017 |
| | $ | 33 |
| | |
Operations and Maintenance Expense
Operations and maintenance expense decreased by $8 million during the year ended December 31, 2018, compared to the same period in 2017, primarily due to: |
| | | | | | | | |
| Committed Investments |
| Asset | | Technology | | Net Capacity (MW) | | State | | COD |
$33 MM remaining in distributed and community solar partnerships(a) | | PV | | N/A | | Various | | Various |
| | | | | | | | | |
| CEG ROFO |
| Asset | | Technology | | Net Capacity (MW) | | State | | COD |
| Mililani I | | PV | | 39 | | HI | | 2021 |
| Waiawa | | PV | | 36 | | HI | | 2021 |
| Langford | | Wind | | 150 | | TX | | 2009 |
| Up to $170 MM equity investment in business renewables | | PV | | TBD | | Various | | TBD |
Rattlesnake(b) | | Wind | | 144 | | WA | | 2020 |
| Black Rock | | Wind | | 110 | | WV | | 2021 |
| Wildflower | | Solar | | 100 | | MS | | 2021 |
| Pinnacle Repowering | | Wind | | 55 | | WV | | 2020 |
|
| | | | | | |
| Segment | | Increase (Decrease) | | Reason for Increase (Decrease) |
| (In millions) | | | | |
| Renewables | | $ | 6 |
| | Increase primarily driven by the Buckthorn Solar project being placed in service in July 2018 |
| Conventional | | (14 | ) | | Lower outages in 2018 compared to 2017 |
| | | $ | (8 | ) | |
|
Impairment Losses(a)On December 26, 2018, we and CEG amended the DGPV Holdco 3 partnership agreement to increase the capital commitment of $50 million to $70 million.
(b) On January 8, 2020, CEG offered us the opportunity to acquire 100% of the equity interests in Rattlesnake.
Prior to engaging in any negotiation regarding any disposition, sale or other transfer of any of the remaining CEG ROFO Assets, CEG will deliver a written notice to us setting forth the material terms and conditions of the proposed transaction. During the 30‑day period after the delivery of such notice, we will negotiate with CEG in good faith to reach an agreement on the transaction. If we do not reach an agreement within such 30‑day period, CEG will be able within the next 180 calendar days to sell, transfer, dispose or recontract such CEG ROFO Asset to a third party (or to agree in writing to undertake such transaction with a third party) on terms generally no less favorable to CEG than those offered pursuant to the written notice.
Under the CEG ROFO Agreement, CEG is not obligated to sell the remaining CEG ROFO Assets. In addition, any offer to sell under the CEG ROFO Agreement will be subject to an inherent conflict of interest because the same professionals within CEG’s organization that are involved in acquisitions that are suitable for us have responsibilities within CEG’s broader asset management business. Notwithstanding the significance of the services to be rendered by CEG or their designated affiliates on our behalf or of the assets which we may elect to acquire from CEG in accordance with the terms of the CEG ROFO Agreement or otherwise, CEG does not owe fiduciary duties to us or our unitholders. Any material transaction with CEG (including the proposed acquisition of any CEG ROFO Asset) will be subject to Clearway, Inc.’s related person transaction policy, which will require prior approval of such transaction by Clearway, Inc.’s Corporate Governance, Conflicts and Nominating Committee.
Carlsbad Drop Down
On December 6, 2019, the Company acquired 100% of GIP's membership interests in CBAD Holdings, LLC, which indirectly owns Carlsbad Energy Center LLC, a 527 megawatt natural gas fired power project located in Carlsbad, California, or the Carlsbad Drop Down Asset. The purchase price for the Carlsbad Drop Down was $184 million in cash, plus assumption of $803 million in project level financing including non-recourse senior secured notes. The acquisition was funded with proceeds from the Clearway Energy, Inc. equity issuance on December 2, 2019 for net proceeds of $100 million, as well as borrowings from the Company's revolving credit facility. The Carlsbad acquisition is the result of the Company having elected its option to purchase Carlsbad pursuant to the ROFO agreement, as amended, by and among Clearway, Inc., CEG and GIP.
Partnerships with CEG
DGPV Holdco 1 LLC
DGPV Holding LLC, our wholly‑owned subsidiary, and CEG are parties to the DGPV Holdco 1 LLC partnership (“DGPV Holdco 1”), the purpose of which is to own or purchase solar power generation projects and other ancillary related assets from CEG or its subsidiaries, via intermediate funds. The Company owns approximately 52 MW of distributed solar capacity, based on cash to be distributed, with a weighted average contract life of 16 years. Under this partnership, the Company committed to fund up to $100 million of capital.
DGPV Holdco 2 LLC
DGPV Holding LLC, our wholly‑owned subsidiary, and CEG are parties to the DGPV Holdco 2 LLC partnership (“DGPV Holdco 2”), the purpose of which is to own or purchase solar power generation projects as well as other ancillary related assets from CEG or its subsidiaries, via intermediate funds. The Company owns approximately 113 MW of distributed solar capacity, based on cash to be distributed, with a weighted average contract life of 19 years. Under this partnership, the Company committed to fund up to $60 million of capital.
DGPV Holdco 3 LLC
DGPV Holding LLC, our wholly‑owned subsidiary, and CEG are parties to the DGPV Holdco 3 LLC partnership (“DGPV Holdco 3”), in which the Company plans to invest up to $70 million in an operating portfolio of distributed solar assets, primarily comprised of community solar projects, developed by CEG. The Company owns approximately 112 MW of distributed solar capacity, based on cash to be distributed, with a weighted average contract life of approximately 21 years as of December 31, 2019. The Company had a $14 million payable due to DGPV Holdco 3 LLC as of December 31, 2019.
The Company recorded impairment lossesCompany’s maximum exposure to loss is limited to its equity investment in DGPV Holdco 1, DGPV Holdco 2 and DGPV Holdco 3, which was $318 million on a combined basis as of $44 millionDecember 31, 2019.
RPV Holdco 1 LLC
RPV Holding LLC, our wholly‑owned subsidiary, and CEG are parties to the RPV Holdco 1 LLC partnership (“RPV Holdco”) that holds operating portfolios of residential solar assets developed by a subsidiary of CEG, including: (i) an existing, unlevered portfolio of approximately 2,100 leases across nine states representing approximately 14 MW, based on cash to be distributed, with a weighted average remaining lease term of approximately 13 years that was acquired outside the partnership; and (ii) a tax equity‑financed portfolios of approximately 5,300 leases representing approximately 31 MW, based on cash to be distributed, with an average lease term for the years endedexisting and new leases of approximately 15 years. The Company had fully funded the partnership as of December 31, 2017.
During the fourth quarterThe Company’s maximum exposure to loss is limited to its equity investment, which was $24 million as of 2017, as the Company updated its estimated cash flows in connection with the preparation and review of the Company’s annual budget, it was determined that both Elbow Creek and Forward projects were impaired due to the continued declining merchant power prices in the post contract periods. As a result, the Company recorded impairment losses of $26 million and $5 million for the Elbow Creek and Forward projects, respectively.
In addition, in connection with the sale of the November 2017 Drop Down Assets, it was identified that undiscounted cash flows were lower than the book value of certain SPP funds and NRG recorded an impairment expense of $13 million. In accordance with the guidance for transfer of assets under common control, the impairment is reflected in the Company's consolidated statements of operations for the period ended December 31, 2017.2019.
For further discussion see Item 15 — Note 9, Asset Impairments, to the Consolidated Financial Statements, as well as in Critical Accounting Policies and Estimates in this Item 7.
Acquisition-Related Transaction and Integration Costs
Acquisition-related transaction and integration costs of $20 million during the year ended December 31, 2018, reflect fees paid to advisors and other costs associated with the GIP Transaction, as well as fees paid in connection with the acquisitions that took place in 2018, as further described in Note 3, Business Acquisitions.
Development Costs
The Company incurred $3Development costs increased by $2 million of development cost expense during the year ended December 31, 2018. A total of $2 million of it was for the2019 primarily due to higher business development personnel and benefits costs related to development projectsactivity within the Company's Thermal segment.
Equity in Earnings of Unconsolidated Affiliates
Equity in earnings of unconsolidated affiliates increased by $3$9 million during the year ended December 31, 2018,2019 compared to the same period in 2017,2018, primarily due to higher income allocated to the CompanyRPV Holdco in DGPV Holdco 3, which was formed in September 2017,2019 compared to 2018, partially offset by higher losses allocatedat Desert Sunlight, DGPV Holdco entities, as well as GenConn and Avenal.
Loss on Debt Extinguishment
The Company recorded loss on debt extinguishment of $16 million for the year ended December 31, 2019, $15 million of which relates to the companyredemption of the 2024 Senior Notes. On December 13, 2019, the Company repurchased an aggregate principal amount of $412 million, or 82.4% of the 2024 Senior Notes, which was effectuated at a premium of 103% for a total consideration of $424 million and as a result, the Company recorded a loss on extinguishment in RPV Holdco and the Utah Solar Portfolio. The HLBV methodamount of accounting generally allocates more losses$12 million. In addition, the Company recorded a $3 million debt extinguishment loss in connection with the write off of the deferred financing fees related to the tax equity investors in the first several years after fund formation, and conversely, more income to the Company2024 Senior Notes.
Interest Expense
Interest expense remained flatincreased by $109 million during the year ended December 31, 2018,2019, compared to the same period in 20172018 primarily due to:
|
| | | | |
| (In millions) | | Increase (Decrease) |
| Normal amortization of project-level debt | | $ | (10 | ) |
| Issuance of 2025 Senior Notes, partially offset by lower interest expense for the intercompany notes between Clearway Operating LLC and Clearway Energy, Inc., which were partially repaid in connection with the tender offer in October 2018 | | 6 |
|
| Change in mark-market of interest rate swaps | | (3 | ) |
| Issuance of Energy Center Minneapolis Series E, F, G, H Notes in June 2018 and additional interest expense for the Buckthorn Solar project-level debt | | 7 |
|
| | | $ | — |
|
|
| | | | |
| Reason for Increase (Decrease) | | (In millions) |
| Change in fair value of interest rate swaps as well as reclassification of losses previously deferred in AOCI to the statement of operations in connection with project-level debt financing activities | | $ | 91 |
|
| Issuance of 2025 Senior Notes, partially offset by lower interest expense for the intercompany notes between Clearway Operating LLC and Clearway, Inc., which were partially repaid in connection with the tender offer in October 2018 | | 11 |
|
| Additional interest expense primarily from the issuance of Energy Center Minneapolis Series E, F, G, H Notes in June 2018 and in connection with acquisitions in the Thermal and Conventional segments, partially offset by lower interest expense due to lower principal balances of project level debt across the segments | | 7 |
|
| | | $ | 109 |
|
Net Loss Attributable to Noncontrolling Interests
For the year ended December 31, 2019, the Company had a net loss of $57 million attributable to noncontrolling interests with respect to its tax equity financing arrangements and the application of the HLBV method, as well as a net loss of $21 million attributable to CEG's economic interest in Repowering, Oahu and Kawailoa partnerships. The losses were partially offset by $7 million of income attributable to a third party's interest in Kawailoa partnership.
For the year ended December 31, 2018, the Company had a loss of $1 million attributable to CEG's economic interest in Repowering LLC and a loss of $104 million attributable to noncontrolling interests with respect to its tax equity financing arrangements and the application of the HLBV method.
For the year ended December 31, 2017, the Company had a loss of $75 million attributable to noncontrolling interests with respect to its tax equity financing arrangements and the application of the HLBV method, which was primarily related to the impairment losses described above.
Consolidated Results of Operations
2017 compared to 2016
The following table provides selected financial information:
|
| | | | | | | | | | | |
| | Year ended December 31, |
| (In millions) | 2017 | | 2016 | | Change |
| Operating Revenues | | | | | |
| Energy and capacity revenues | $ | 1,038 |
| | $ | 1,065 |
| | $ | (27 | ) |
| Other revenues | 40 |
| | 39 |
| | 1 |
|
| Contract amortization | (69 | ) | | (69 | ) | | — |
|
| Total operating revenues | 1,009 |
| | 1,035 |
| | (26 | ) |
| Operating Costs and Expenses | | | | | |
| Cost of fuels | 63 |
| | 61 |
| | 2 |
|
| Emissions credit amortization | — |
| | 6 |
| | (6 | ) |
| Operations and maintenance | 197 |
| | 176 |
| | 21 |
|
| Other costs of operations | 66 |
| | 65 |
| | 1 |
|
| Depreciation and amortization | 334 |
| | 303 |
| | 31 |
|
| Impairment losses | 44 |
| | 185 |
| | (141 | ) |
| General and administrative | 19 |
| | 14 |
| | 5 |
|
| Acquisition-related transaction and integration costs | 3 |
| | 1 |
| | 2 |
|
| Total operating costs and expenses | 726 |
| | 811 |
| | (85 | ) |
| Operating Income | 283 |
| | 224 |
| | 59 |
|
| Other Income (Expense) | | | | | |
| Equity in earnings of unconsolidated affiliates | 71 |
| | 60 |
| | 11 |
|
| Other income, net | 4 |
| | 3 |
| | 1 |
|
| Loss on debt extinguishment | (3 | ) | | — |
| | (3 | ) |
| Interest expense | (294 | ) | | (272 | ) | | (22 | ) |
| Total other expense, net | (222 | ) | | (209 | ) | | (13 | ) |
| Net Income | 61 |
| | 15 |
| | 46 |
|
| Less: Net loss attributable to noncontrolling interests | (75 | ) | | (111 | ) | | 36 |
|
| Net Income Attributable to Clearway Energy LLC | $ | 136 |
| | $ | 126 |
| | $ | 10 |
|
|
| | | | | |
| | Year ended December 31, |
| Business metrics: | 2017 | | 2016 |
Renewables MWh generated/sold (in thousands) (a) | 6,844 |
| | 7,291 |
|
| Thermal MWt sold (in thousands) | 1,926 |
| | 1,966 |
|
Thermal MWh sold (in thousands) (c) | 35 |
| | 71 |
|
Conventional MWh generated (in thousands) (a)(b) | 1,809 |
| | 1,697 |
|
| Conventional equivalent availability factor | 93.9 | % | | 95.3 | % |
(a) Volumes do not include the MWh generated/sold by the Company's equity method investments.
(b) Volumes generated are not sold as the Conventional facilities sell capacity rather than energy.
(c) MWh sold do not include 72 and 204 MWh generated by NRG Dover, a subsidiary of the Company, under the PPA with NRG Power Marketing during the years ended December 31, 2017 and 2016,, respectively, as further described in Item 15 — Note 13, Related Party Transactions, to the Consolidated Financial Statements.
Management’s discussion of the results of operations for the years ended December 31, 2017 and 2016
Gross Margin
The Company calculates gross margin in order to evaluate operating performance as operating revenues less cost of sales, which includes cost of fuel, contract and emission credit amortization and mark-to-market for economic hedging activities.
Economic Gross Margin
In addition to gross margin, the Company evaluates its operating performance using the measure of economic gross margin, which is not a GAAP measure and may not be comparable to other companies’ presentations or deemed more useful than the GAAP information provided elsewhere in this report. Economic gross margin should be viewed as a supplement to and not a substitute for the Company' presentation of gross margin, which is the most directly comparable GAAP measure. Economic gross margin is not intended to represent gross margin. The Company believes that economic gross margin is useful to investors as it is a key operational measure reviewed by the Company's chief operating decision maker. Economic gross margin is defined as energy and capacity revenue, plus other revenues, less cost of fuels. Economic gross margin excludes the following components from GAAP gross margin: contract amortization, mark-to-market results, emissions credit amortization and (losses) gains on economic hedging activities. Mark-to-market results consist of unrealized gains and losses on contracts that are not yet settled.
The following tables present the composition of gross margin, as well as the reconciliation to economic gross margin for the years ended December 31, 2017 and 2016:
|
| | | | | | | | | | | | | | | |
| | Conventional | | Renewables | | Thermal | | Total |
| (In millions) | |
| Year ended December 31, 2017 | | | | | | |
|
| Energy and capacity revenues | $ | 341 |
| | $ | 547 |
| | $ | 150 |
| | $ | 1,038 |
|
| Other revenues | — |
| | 16 |
| | 24 |
| | 40 |
|
| Cost of fuels | (1 | ) | | — |
| | (62 | ) | | (63 | ) |
| Contract amortization | (5 | ) | | (62 | ) | | (2 | ) | | (69 | ) |
| Gross margin | $ | 335 |
| | $ | 501 |
| | $ | 110 |
| | $ | 946 |
|
| Contract amortization | 5 |
| | 62 |
| | 2 |
| | 69 |
|
| Economic gross margin | $ | 340 |
| | $ | 563 |
| | $ | 112 |
| | $ | 1,015 |
|
| | | | | | | | |
| Year ended December 31, 2016 | | | | | | | |
| Energy and capacity revenues | $ | 338 |
| | $ | 577 |
| | $ | 150 |
| | $ | 1,065 |
|
| Other revenues | — |
| | 17 |
| | 22 |
| | 39 |
|
| Cost of fuels | (1 | ) | | — |
| | (60 | ) | | (61 | ) |
| Contract amortization | (5 | ) | | (62 | ) | | (2 | ) | | (69 | ) |
| Emissions credit amortization | (6 | ) | | — |
| | — |
| | (6 | ) |
| Gross margin | $ | 326 |
| | $ | 532 |
| | $ | 110 |
| | $ | 968 |
|
| Contract amortization | 5 |
| | 62 |
| | 2 |
| | 69 |
|
| Emissions credit amortization | 6 |
| | — |
| | — |
| | 6 |
|
| Economic gross margin | $ | 337 |
| | $ | 594 |
| | $ | 112 |
| | $ | 1,043 |
|
Gross margin decreased by $22 million and economic gross margin decreased by $28 million during the year ended December 31, 2017, compared to the same period in 2016, primarily due to:
|
| | | | |
| Segment | (Decrease)Increase | Reason for Increase (Decrease) |
| (In millions) | | |
| Renewables: | (31 | ) | A 7% decrease in volume generated by wind projects, due to lower wind resources at the Alta Wind and Wind TE Holdco projects |
| Conventional: | 3 |
| Higher revenues due to 2016 higher peak season forced outages, as well as additional start-up revenue from Marsh Landing in 2017 |
| Economic gross margin | $ | (28 | ) | |
| | 6 |
| Emissions credit amortization of NOx allowances at Walnut Creek and El Segundo in compliance with amendments to the Regional Clean Air Incentives Market program in 2016 |
| Gross margin | $ | (22 | ) | |
Operations and Maintenance Expense
Operations and maintenance expense increased by $21 million during the year ended December 31, 2017, compared to the same period in 2016, due to the forced outages in the Conventional segment. The Company recorded higher operations and maintenance costs in Walnut Creek in connection with the Unit 1 forced outages that took place in April of 2017, including an increase of loss on disposal of assets of $12 million, as well as higher operations and maintenance costs in El Segundo due to the forced outages in Units 5 and Unit 6 that took place in January 2017.Impairment Losses
The Company recorded impairment losses of $44 million and $185 million for the years ended December 31, 2017 and 2016, respectively.
During the fourth quarter of 2017, as the Company updated its estimated cash flows in connection with the preparation and review of the Company’s annual budget, it was determined that both Elbow Creek and Forward projects were impaired due to the continued declining merchant power prices in the post contract periods. As a result, the Company recorded impairment losses of $26 million and $5 million for the Elbow Creek and Forward projects, respectively.
In addition, in connection with the sale of the November 2017 Drop Down Assets, it was identified that undiscounted cash flows were lower than the book value of certain SPP funds and NRG recorded an impairment expense of $13 million. In accordance with the guidance for transfer of assets under common control, the impairment is reflected in the Company's consolidated statements of operations for the period ended December 31, 2017.
During the fourth quarter of 2016, as the Company updated its estimated cash flows in connection with the preparation and review of the Company's annual budget, it was determined that the cash flows for the Elbow Creek and Goat Wind projects and the Forward project were below the carrying value of the related assets, primarily driven by declining merchant power prices in post-contract periods, and that the assets were considered impaired. The Company recorded impairment losses of $117 million, $60 million and $6 million for Elbow Creek, Goat Wind, and Forward, respectively. The other impairments of $2 million related to the projects that were part of the November 2017 Drop Down Assets. Since the acquisition by the Company of the November 2017 Drop Down Assets related to transfer of assets under common control, these impairments were reflected in the Company's consolidated statements of operations for the period ending December 31, 2016. For further discussion see Item 15 — Note 9, Asset Impairments, to the Consolidated Financial Statements, as well as in Critical Accounting Policies and Estimates in this Item 7.
Equity in Earnings of Unconsolidated Affiliates
Equity in earnings of unconsolidated affiliates increased by $11 million during the year ended December 31, 2017, compared to the same period in 2016, primarily due to higher earnings from the solar partnerships with NRG, as well as the acquisition of the Utah Solar Portfolio in November 2016, partially offset by lower earnings from the San Juan Mesa investment.
Interest Expense
Interest expense increased by $22 million during the year ended December 31, 2017, compared to the same period in 2016, due to:
|
| | | |
| | (in millions) |
| Assumption of the Utah Solar Portfolio debt in connection with the March 2017 Drop Down Assets, as well as debt assumed in connection with the Buckthorn Solar Drop Down Asset on March 30, 2018 | $ | 15 |
|
| Issuance of 2026 Senior Notes in the third quarter of 2016 | 11 |
|
| Issuance of new project level debt in the second half of 2016 and 2017 partially offset by the lower principal balances on project level debt in 2017 | 1 |
|
| Higher borrowings in 2016 on the revolving credit facility | (5 | ) |
| | $ | 22 |
|
Net Loss Attributable to Noncontrolling Interests
For the year ended December 31, 2017, the Company had a loss of $75 million attributable to noncontrolling interests with respect to its tax equity financing arrangements and the application of the HLBV method. For the year ended December 31, 2016, the Company had a loss of $111 million attributable to noncontrolling interests with respect to its tax equity financing arrangements and the application of the HLBV method, which was primarily related to the impairment losses described above.
Liquidity and Capital Resources
The Company's principal liquidity requirements are to meet its financial commitments, finance current operations, fund capital expenditures, including acquisitions from time to time, service debt and pay distributions. As a normal part of the Company's business, depending on market conditions, the Company will from time to time consider opportunities to repay, redeem, repurchase or refinance its indebtedness. Changes in the Company's operating plans, lower than anticipated sales, increased expenses, acquisitions or other events may cause the Company to seek additional debt or equity financing in future periods. There can be no guarantee that financing will be available on acceptable terms or at all. Debt financing, if available, could impose additional cash payment obligations and additional covenants and operating restrictions.
Current Liquidity Position
As of December 31, 20182019 and 2017,2018, the Company's liquidity was approximately $1,037$839 million and $680$1,037 million, respectively, comprised of cash, restricted cash and availability under the Company's revolving credit facility.
| | | | As of December 31, | As of December 31, |
| | 2018 | | 2017 | 2019 | | 2018 |
| | (In millions) | (In millions) |
| Cash and cash equivalents: | | | | | | |
| Clearway Energy LLC, excluding subsidiaries | $ | 298 |
| | $ | 22 |
| $ | 27 |
| | $ | 298 |
|
| Subsidiaries | 109 |
| | 124 |
| 125 |
| | 109 |
|
| Restricted cash: | | | | | | |
| Operating accounts | 84 |
| | 25 |
| 129 |
| | 84 |
|
| Reserves, including debt service, distributions, performance obligations and other reserves | 92 |
| | 143 |
| 133 |
| | 92 |
|
| Total cash, cash equivalents and restricted cash | $ | 583 |
| | $ | 314 |
| $ | 414 |
| | $ | 583 |
|
| Revolving credit facility availability | $ | 454 |
| | $ | 366 |
| $ | 425 |
| | $ | 454 |
|
| Total liquidity | $ | 1,037 |
| | $ | 680 |
| $ | 839 |
| | $ | 1,037 |
|
The Company's liquidity includes $176$262 million and $168$176 million of restricted cash balances as of December 31, 20182019 and 20172018, respectively. Restricted cash consists primarily of funds to satisfy the requirements of certain debt arrangements and funds held within the Company's projects that are restricted in their use.As of December 31, 2018,2019, these restricted funds comprised of $84$129 million designated to fund operating expenses, approximately $26$24 million designated for current debt service payments, and $32$30 million restricted for reserves including debt service, performance obligations and other reserves, as well as capital expenditures. The remaining $34$79 million is held in distribution reserve accounts, of which $31$58 million related to subsidiaries affected by the PG&E bankruptcyBankruptcy as discussed further below and may not be distributed during the pendency of the bankruptcy. Such subsidiaries had a total of $177 million in restricted cash as of December 31, 2019.
As of December 31, 20182019, the Company had no borrowings under the revolving credit facility and $41$70 million of letters of credit were outstanding under the revolving credit facility.
Subsequent to December 31, 2018, the Clearway Energy, Inc. repaid the remaining $220 million balance of the 2019 Convertible Notes. which was funded through the payment of the remaining balance of the intercompany note due 2019 between Clearway Energy Operating LLC and Clearway Energy, Inc., and acquired the Class A interest in Wind TE Holdco for $19 million, as further described below in Uses of Liquidity.
In August 2018 and January 2019, theThe Company completed a series of open market repurchases of 2019 Convertible Notes in aggregate principal amount of $66 million. The 2019 Convertible Notes matured on February 1, 2019 and the Company paid off the remaining balance of an aggregate principal amount ofhad $170 million outstanding under the revolving credit facility and a total of $69 million in letters of credit outstanding as further described in Item 15 —Note 10, Long-term Debt, to the Consolidated Financial Statements.of February 24, 2020.
On January 29, 2019, PG&E filed for bankruptcy under Chapter 11 of the U.S. Bankruptcy Code. The PG&E bankruptcyBankruptcy had no effect on availability under the Company’s revolving credit facility. However, the Company has non-recourse project-level debt related to each of its subsidiaries that sell their output to PG&E under long-term PPAs. The PG&E bankruptcyBankruptcy filing is an event of default under the related financing agreements which caused uncertainty around the timing of when certain project-level cash distributions will be available to the Company. As of December 31, 2018,2019, all project level cash balances for these subsidiaries were classified as restricted cash.
On December 20, 2019, each of Clearway Energy Operating LLC, as borrower, and Clearway Energy LLC, as guarantor, entered into the Fifth Amendment to Amended and Restated Credit Agreement to provide for an increase of 0.50x to the Borrower Leverage Ratio, as defined in the Amended and Restated Credit Agreement, for the last two fiscal quarters of 2020 and to implement certain other technical modifications.
Management believes that the Company's liquidity position, cash flows from operations and availability under its revolving credit facility will be adequate to meet the Company's financial commitments; debt service obligations; growth, operating and maintenance capital expenditures; and to fund distributions to Clearway, Energy, Inc. and Clearway Energy Group, LLC. Management continues to regularly monitor the Company's ability to finance the needs of its operating, financing and investing activity within the dictates of prudent balance sheet management.
Credit Ratings
Credit rating agencies rate a firm's public debt securities. These ratings are utilized by the debt markets in evaluating a firm's credit risk. Ratings influence the price paid to issue new debt securities by indicating to the market the Company's ability to pay principal, interest and preferred dividends. Rating agencies evaluate a firm's industry, cash flow, leverage, liquidity and hedge profile, among other factors, in their credit analysis of a firm's credit risk. As of December 31, 2018,2019, the Company's 2024 Senior Notes, 2025 Senior Notes, 2026 Senior Notes, and 20262028 Senior Notes are rated BB by S&P and Ba2 by Moody's.
S&P and Moody's reaffirmed the ratings outlook as stable on February 25, 2019 and on February 15, 2019, respectively.
Sources of Liquidity
The Company's principal sources of liquidity include cash on hand, cash generated from operations, proceeds from sales of assets, borrowings under new and existing financing arrangements and the issuance of additional equity and debt securities by Clearway, Energy, Inc. or the Company as appropriate given market conditions. As described in Item 15— Note 10, Long-term Debt, to the Consolidated Financial Statements, and above in Significant Events During the Year Ended December 31, 2018,2019, the Company's financing arrangements consist of Clearway, Energy, Inc.'s equity offering of Class C common stock on September 27, 2018, corporate level debt, which includes Senior Notes, intercompany borrowings with Clearway, Energy, Inc., and the revolving credit facility; the ATM Program; and project-level financings for its various assets.
20252028 Senior Notes — On October 1, 2018,December 11, 2019, Clearway Energy Operating LLC issuedcompleted the sale of $600 million of senior unsecured notes,aggregate principal amount due 2028, or the 20252028 Senior Notes. The 20252028 Senior Notes bear interest at 5.750%4.75% and mature on OctoberMarch 15, 2025. Interest on2028.The proceeds from the notes is payable semi-annually on April 15 and October 15 of each year, and interest payments will commence on April 15, 2019. The 20252028 Senior Notes are unsecured obligations of Clearway Energy Operating LLCwere used to partially fund investments into Repowering 1.0, repay the 2024 Senior Notes, and are guaranteed by Clearway Energy LLCpay transaction fees and by certain of Clearway Energy Operating LLC's wholly owned current and future subsidiaries.expenses.
20182019 Equity Offering — On September 27, 2018,December 2, 2019, Clearway, Energy, Inc. issued and sold an additional 3,916,4495,405,405 shares of Class C common stock for net proceeds of $75$100 million. The CompanyClearway, Inc. utilized the proceeds of the offering to acquire 3,916,4495,405,405 Class C units of Clearway Energy LLC.
Revolving Credit Facility — On April 30, 2018, theThe Company closed on the refinancinghas a total of $425 million available under the revolving credit facility which extended the maturityas of the facility to April 28, 2023 and decreased the Company's overall cost of borrowing.December 31, 2019. The facility will continue to be used for general corporate purposes including financing of future acquisitions and posting letters of credit.
ATM Sales Program — Clearway Energy, Inc. sold a totalAs of 4,492,473 of Class C common stock under the ATM program for gross proceeds of $79 millionduring the year ended December 31, 2018. Clearway Energy, Inc. incurred commission fees of $790 thousand during the period ended December 31, 2018. Clearway Energy, Inc. used the net proceeds to acquire 4,492,473 Class C units from Clearway Energy LLC.
As of February 28, 2019, approximately $36 million of Clearway, Inc.'s Class C common stock remains available for issuance under the ATM Program.
Thermal Notes — On June 19, 2018, Energy Center Minneapolis LLC, a subsidiary of the Company, completed the issuances of 4.80% Series E notes due June 15, 2033, or the Series E Notes, and 4.60% Series F notes due March 15, 2033, or the Series F Notes, for gross proceeds of $80 million. The proceeds of the Series E Notes and Series F Notes were utilized to finance the acquisition of the UPMC Thermal Project. Also, on June 19, 2018, Energy Center Minneapolis LLC issued $83 million of 5.90% Series G notes due June 15, 2035, or the Series G Notes, which were utilized to refinance its $83 million of outstanding Series C notes. Energy Center Minneapolis LLC also issued 4.83% Series H notes due June 15, 2037, or the Series H Notes for proceeds of $40 million and established a private shelf facility for the future issuance of $40 million in additional notes.
Uses of Liquidity
The Company's requirements for liquidity and capital resources, other than for operating its facilities, are categorized as: (i) debt service obligations, as described more fully in Item 15 — Note 10, Long-term Debt to the Consolidated Financial Statements; (ii) capital expenditures; (iii) acquisitions and investments; and (iv) distributions.
Debt Service Obligations
Principal payments on debt as of December 31, 2018,2019, are due in the following periods:
| | | Description | 2019 | | 2020 | | 2021 | | 2022 | | 2023 | | There- after | | Total | 2020 | | 2021 | | 2022 | | 2023 | | 2024 | | There- after | | Total |
| | (In millions) | (In millions) |
| Long-term debt - affiliate, due 2019 | $ | 215 |
| | $ | — |
| | $ | — |
| | $ | — |
| | $ | — |
| | $ | — |
| | $ | 215 |
| |
| Long-term debt - affiliate, due 2020 | — |
| | 44 |
| | — |
| | — |
| | — |
| | — |
| | 44 |
| 44 |
| | — |
| | — |
| | — |
| | — |
| | — |
| | 44 |
|
| Clearway Energy Operating LLC Senior Notes, due 2024 | — |
| | — |
| | — |
| | — |
| | — |
| | 500 |
| | 500 |
| 88 |
| | — |
| | — |
| | — |
| | — |
| | — |
| | 88 |
|
| Clearway Energy Operating LLC Senior Notes, due 2025 | | | | | | | | | | | 600 |
| | 600 |
| — |
| | — |
| | — |
| | — |
| | — |
| | 600 |
| | 600 |
|
| Clearway Energy Operating LLC Senior Notes, due 2026 | — |
| | — |
| | — |
| | — |
| | — |
| | 350 |
| | 350 |
| — |
| | — |
| | — |
| | — |
| | — |
| | 350 |
| | 350 |
|
| Clearway Energy Operating LLC Senior Notes, due 2028 | | — |
| | — |
| | — |
| | — |
| | — |
| | 600 |
| | 600 |
|
| Total Corporate-level debt | 215 |
| | 44 |
| | — |
| | — |
| | — |
| | 1,450 |
| | 1,709 |
| 132 |
| | — |
| | — |
| | — |
| | — |
| | 1,550 |
| | 1,682 |
|
| Project-level debt: | | | | | | | | | | | | |
|
| | | | | | | | | | | | |
|
|
| Agua Caliente Borrower 2, due 2038 | 1 |
| | 1 |
| | 1 |
| | 1 |
| | 1 |
| | 34 |
| | 39 |
| |
| Alpine, due 2022 | 8 |
| | 8 |
| | 8 |
| | 103 |
| | — |
| | — |
| | 127 |
| |
Alpine, due 2022 (a) | | 119 |
| | — |
| | — |
| | — |
| | — |
| | — |
| | 119 |
|
| Alta Wind I - V lease financing arrangements, due 2034 and 2035 | 41 |
| | 45 |
| | 45 |
| | 47 |
| | 49 |
| | 659 |
| | 886 |
| 43 |
| | 45 |
| | 47 |
| | 49 |
| | 51 |
| | 609 |
| | 844 |
|
| Buckthorn Solar, due 2025 | 3 |
| | 3 |
| | 3 |
| | 3 |
| | 3 |
| | 117 |
| | 132 |
| 3 |
| | 3 |
| | 3 |
| | 3 |
| | 4 |
| | 113 |
| | 129 |
|
| CVSR, due 2037 | 24 |
| | 21 |
| | 23 |
| | 25 |
| | 26 |
| | 601 |
| | 720 |
| |
| CVSR Holdco Notes, due 2037 | 6 |
| | 6 |
| | 7 |
| | 9 |
| | 9 |
| | 151 |
| | 188 |
| |
| Carlsbad Energy Holdings LLC, due 2027 | | 19 |
| | 20 |
| | 21 |
| | 22 |
| | 23 |
| | 477 |
| | 582 |
|
| Carlsbad Holdco, due 2038 | | 6 |
| | 6 |
| | 7 |
| | 2 |
| | 2 |
| | 193 |
| | 216 |
|
| CVSR, due 2037 (a) | | 696 |
| | — |
| | — |
| | — |
| | — |
| | — |
| | 696 |
|
| CVSR Holdco Notes, due 2037 (a) | | 182 |
| | — |
| | — |
| | — |
| | — |
| | — |
| | 182 |
|
| Duquesne, due 2059 | | — |
| | — |
| | — |
| | — |
| | — |
| | 95 |
| | 95 |
|
| El Segundo Energy Center, due 2023 | 49 |
| | 53 |
| | 57 |
| | 63 |
| | 130 |
| | — |
| | 352 |
| 53 |
| | 57 |
| | 63 |
| | 130 |
| | — |
| | — |
| | 303 |
|
| Energy Center Minneapolis Series C, D, E, F, G, H Notes, due 2025-2037 | — |
| | — |
| | — |
| | — |
| | — |
| | 328 |
| | 328 |
| |
| Kansas South, due 2030 | 2 |
| | 2 |
| | 2 |
| | 2 |
| | 2 |
| | 16 |
| | 26 |
| |
| Energy Center Minneapolis Series D, E, F, G, H Notes, due 2025-2037 | | — |
| | — |
| | — |
| | — |
| | — |
| | 328 |
| | 328 |
|
Kansas South, due 2030 (a) | | 24 |
| | — |
| | — |
| | — |
| | — |
| | — |
| | 24 |
|
| Kawailoa Solar Holdings LLC, due 2026 | | 2 |
| | 2 |
| | 2 |
| | 2 |
| | 2 |
| | 72 |
| | 82 |
|
| Laredo Ridge, due 2028 | 5 |
| | 6 |
| | 6 |
| | 7 |
| | 7 |
| | 58 |
| | 89 |
| 6 |
| | 6 |
| | 7 |
| | 7 |
| | 9 |
| | 49 |
| | 84 |
|
| Marsh Landing, due 2023 | 57 |
| | 60 |
| | 62 |
| | 65 |
| | 19 |
| | — |
| | 263 |
| |
| South Trent Wind, due 2020 | 5 |
| | 45 |
| | — |
| | — |
| | — |
| | — |
| | 50 |
| |
| Tapestry, due 2021 | 11 |
| | 11 |
| | 129 |
| | — |
| | — |
| | — |
| | 151 |
| |
Marsh Landing, due 2023 (a) | | 206 |
| | — |
| | — |
| | — |
| | — |
| | — |
| | 206 |
|
| Oahu Solar Holdings LLC, due 2026 | | 2 |
| | 3 |
| | 3 |
| | 3 |
| | 3 |
| | 77 |
| | 91 |
|
| Repowering Partnership Holdco LLC, due 2020 | | 228 |
| | — |
| | — |
| | — |
| | — |
| | — |
| | 228 |
|
| South Trent Wind, due 2028 | | 4 |
| | 4 |
| | 5 |
| | 5 |
| | 5 |
| | 20 |
| | 43 |
|
| Tapestry, due 2031 | | 13 |
| | 10 |
| | 11 |
| | 11 |
| | 12 |
| | 99 |
| | 156 |
|
| Utah Solar Portfolio, due 2022 | 14 |
| | 13 |
| | 13 |
| | 227 |
| | — |
| | — |
| | 267 |
| 14 |
| | 13 |
| | 227 |
| | — |
| | — |
| | — |
| | 254 |
|
| Viento, due 2023 | 18 |
| | 16 |
| | 16 |
| | 17 |
| | 79 |
| | — |
| | 146 |
| 8 |
| | 5 |
| | 5 |
| | 24 |
| | — |
| | — |
| | 42 |
|
| Walnut Creek, due 2023 | 47 |
| | 49 |
| | 52 |
| | 55 |
| | 19 |
| | — |
| | 222 |
| 49 |
| | 53 |
| | 55 |
| | 18 |
| | — |
| | — |
| | 175 |
|
| Other | 23 |
| | 22 |
| | 23 |
| | 22 |
| | 45 |
| | 208 |
| | 343 |
| 22 |
| | 22 |
| | 22 |
| | 43 |
| | 18 |
| | 169 |
| | 296 |
|
| Total project-level debt | 314 |
| | 361 |
| | 447 |
| | 646 |
| | 389 |
| | 2,172 |
| | 4,329 |
| 1,699 |
| | 249 |
| | 478 |
| | 319 |
| | 129 |
| | 2,301 |
| | 5,175 |
|
| Total debt | $ | 529 |
| | $ | 405 |
| | $ | 447 |
| | $ | 646 |
| | $ | 389 |
| | $ | 3,622 |
| | $ | 6,038 |
| $ | 1,831 |
| | $ | 249 |
| | $ | 478 |
| | $ | 319 |
| | $ | 129 |
| | $ | 3,851 |
| | $ | 6,857 |
|
(a) Entities affected by PG&E Bankruptcy. The PG&E Bankruptcy triggered defaults under the PPAs with PG&E and such related project-level financing agreements. As a result, the Company classified the affected project-level debt as short-term debt as of December 31, 2019.
Capital Expenditures
The Company's capital spending program is mainly focused on maintenance capital expenditures, consisting of costs to maintain the assets currently operating, such as costs to replace or refurbish assets during routine maintenance, and growth capital expenditures, consisting of costs to construct new assets, costs to complete the construction of assets where construction is in process, and capital expenditures related to acquiring additional thermal customers.
For the years ended December 31, 20182019, 2017,2018, and 2016,2017, the Company used approximately $228 million, $83 million, $190 million, and $20$190 million, respectively, to fund capital expenditures, includingmaintenance capital expenditures of $36$22 million,$2736 million and $16$27 million, respectively. Growth capital expenditures in 2019 include $180 million in the Renewables segment, $157 million of which were incurred in connection with the Repowering Partnership entered by the Company in August 2018, as well as $29 million incurred in the Oahu Partnership and the Kawailoa Partnership, as further described in Item 15 — Note 5,Investments Accounted for by the Equity Method and Variable Interest Entities. The source for these capital expenditures was financing obtained in connection with the Repowering Partnership, as well as tax equity investors contributions. The Company also incurred $26 million of growth capital expenditures in the Thermal segment in connection with various development projects.
Growth capital expenditures in 2018 include $33 million in the Renewables segment in connection with the construction of Buckthorn Solar Drop Down Asset, of which $10 million was incurred by NRG during the construction of Buckthorn Solar prior to its acquisition by the Company on March 30, 2018, as described below.
Growth capital expenditures in 2017 primarily relate to $159 million incurred by NRG during the construction of Buckthorn Solar prior to its acquisition by the Company. Growth capital expenditures in 2016 primarily related to the servicing new customers in district energy centers within the Thermal segment. The Company develops annual capital spending plans based on projected requirements for maintenance and growth capital.
The Company estimates $30$32 million of maintenance expenditures for 2019. 2020. These estimates are subject to continuing review and adjustment and actual capital expenditures may vary from these estimates.
Acquisitions and Investments
The Company intends to acquire generation assets developed and constructed by CEG, as well as generation and thermal infrastructure assets from third parties where the Company believes its knowledge of the market and operating expertise provides a competitive advantage, and to utilize such acquisitions as a means to grow its CAFD.
Carlsbad Drop Down — On December 6, 2019, the Company acquired 100% of GIP's membership interests in CBAD Holdings, LLC, which indirectly owns Carlsbad Energy Center LLC, a 527 megawatt natural gas fired power project located in Carlsbad, California, or the Carlsbad Drop Down Asset. The purchase price for the Carlsbad Drop Down was $184 million in cash, plus assumption of $803 million in project level financing including non-recourse senior notes. For further discussion, see Item 15 — Note 3 , Acquisitions and Dispositions.
Cayo Largo — On September 29, 2019, the Company entered into a tolling agreement with Cayo Largo LLC to supply electricity, chilled water, hot water and natural gas to Cayo Largo LLC's customer through a dedicated combined heat and power facility to be constructed by the Company. The Company incurred $6 million in capital expenditures during the year ended December 31, 2019. The Company anticipates the project to total $13 million in capital expenditures and is expected to commence commercial operations in the fourth quarter of 2020.
Mylan Pharmaceuticals— The Company is party to an Energy Services Agreement with Mylan LLC to supply chilled water, hot water and electricity through a dedicated combined heat and power facility constructed at Mylan's Caguas, Puerto Rico facility. The Company incurred $4 million and $7 million in capital expenditures during the years ended December 31, 2019 and December 31, 2018, respectively, and the project reached COD in the first quarter of 2020.
Repowering Partnership — On June 14, 2019, the Company, through an indirect subsidiary, entered into binding equity commitment agreements in the previously announced partnership with CEG to enable the repowering of two of its existing wind assets, Wildorado and Elbow Creek, which total a combined 283 MW. The Company invested $102 million in net corporate capital to fund the repowering of the wind facilities during the fourth quarter of 2019 and the first quarter of 2020. These assets have reached Repowering COD.
Kawailoa Solar Partnership — On May 1, 2019, the Company entered into a partnership with Clearway Renew LLC, a subsidiary of CEG, to own, finance, operate, and maintain the Kawailoa Solar Partnership, which consists of the Kawailoa Solar Project, a 49 MW utility-scale solar generation project located in Oahu, Hawaii. The Company contributed $9 million into the partnership during the year ended December 31, 2019. For further discussion, see Item 15 — Note 5, Investments Accounted for by the Equity Method and Variable Interest Entities.
Oahu Solar Partnership — On March 8, 2019, the Company entered into a partnership with Clearway Renew LLC, a subsidiary of CEG, to own, finance, operate, and maintain the Oahu Solar projects, which consist of Lanikuhana and Waipio, 15 MW and 46 MW utility-scale solar generation projects, respectively, located in Oahu, Hawaii, which reached COD on September 19, 2019 and began to sell power to HECO pursuant to the long-term PPAs. The Company contributed $20 million into the partnership during the year ended December 31, 2019. For further discussion, see Item 15 — Note 5, Investments Accounted for by the Equity Method and Variable Interest Entities
Duquesne University District Energy Facility — On May 1, 2019, the Company, through its indirect subsidiary ECP Uptown Campus LLC, acquired the Duquesne University district energy system, totaling 87 combined MWt, located in Pittsburgh, Pennsylvania. The total investment for the project is $107 million. As part of the acquisition, Duquesne University entered into a 40-year Energy Services Agreement through which ECP Uptown Campus LLC will fulfill the university’s electricity, chilled water and steam requirements in exchange for monthly capacity payments. For further discussion, see Item 15 — Note 3, Acquisitions and Dispositions.
Wind TE Holdco Buyout — On January 2, 2019, the Company bought out 100% of Class A membership interest from the TE Investor, for cash consideration of $19 million, as further described in Item 15 — Note 5, Investments Accounted for by the Equity Method and Variable Interest Entities.Entities.
UPMC Thermal Project Agua Caliente Borrower 2 Debt Repayment — On June 19, 2018, upon reaching substantial completion,October 21, 2019, the Company, acquired from NRG the UPMC Thermal Project for cash consideration of $84 million, subject to working capital adjustments. The Company had a payable of $4 million to NRG as of December 31,2018, $3through Agua Caliente Borrower 2 LLC, repaid $40 million of whichthe outstanding notes balance, including accrued interest and premiums, issued under the Agua Caliente Holdco Financing Agreement. The repayment was paid in January 2019 upon final completion of the project pursuant to the EPC agreement. The project adds 73 MWt of thermal equivalent capacity and 7.5 MW of emergency backup electrical capacity tofunded with the Company's portfolio. The transaction was accounted for as an asset acquisition and is reflected in the Company's Thermal segment.existing liquidity.
Central CA Fuel Cell 1, LLC — On April 18, 2018, the Company acquired the Central CA Fuel Cell 1, LLC project in Tulare, California from FuelCell Energy Finance, Inc., for cash consideration of $11 million, subject to working capital adjustments. The project adds 2.8 MW of thermal capacity to the Company's portfolio, with a 20-year PPA contract with the City of Tulare. The transaction is reflected in the Company's Thermal segment.
Buckthorn Solar Drop Down Asset— On March 30, 2018, the Company acquired 100% of NRG's interests in Buckthorn Renewables, LLC, which owns a 154 MW construction-stage utility-scale solar generation project, located in Texas, or the Buckthorn Solar Drop Down Asset, for cash consideration of approximately $42 million, subject to working capital adjustments. The project sells power under a 25-year PPA to the City of Georgetown, Texas which commenced in July 2018.
Carlsbad Project —On February 6, 2018, the Company entered into an agreement with NRG to purchase 100% of the membership interests in Carlsbad Energy Holdings LLC, which indirectly owns the Carlsbad project, a 527 MW natural gas fired project in Carlsbad, CA, pursuant to the NRG ROFO Agreement. Following the COD of the project in December 2018, the Company elected to utilize the Carlsbad backstop facility provided by GIP; as such, GIP purchased 100% of the membership interest in Carlsbad Energy Holdings LLC on February 27, 2019. The purchase price for the transaction was $387 million in cash consideration, exclusive of working capital and other adjustments, as well as the assumption of non-recourse debt of $601 million at completion. The Company maintains the option to purchase Carlsbad from GIP at any time within 18 months after February 27, 2019 at the same economic terms at which it originally agreed to purchase the asset from NRG. Should the Company not acquire Carlsbad during such 18 months, the project will become a CEG ROFO Asset.
Hawaii Solar Assets— On August 31, 2018, the Company entered into a binding agreementDG Investment Partnerships with CEG to acquire 80 MW of utility-scale solar projects located in Kawailoa and Oahu, Hawaii for cash consideration of $28 million, subject to customary working capital and other adjustments, as well as the assumption of non-recourse debt of $169 million. The transaction is expected to close in summer of 2019.
Mylan Pharmaceuticals— On November 1, 2018, the Company entered into an Energy Services Agreement with Mylan LLC to supply chilled water, hot water and electricity through a dedicated combined heat and power facility to be constructed at Mylan's Caguas, Puerto Rico facility. The Company incurred approximately $7 million in construction work in progress costs and anticipates the project to total $11 million in capital expenditures. The project is expected to commence commercial operations in the second quarter of 2019.
Investment Partnership with CEG
During the period of January 1, 2018 toyear ended December 31, 2018,2019, the Company invested $34approximately $14 million in distributed generationthe DG investment partnerships with CEG.CEG, bringing total capital invested to $256 million in these investment partnerships.
Open Market Repurchases andSenior Notes due 2024 Tender Offer
In August 2018, Clearway Energy, Inc.— On December 13, 2019, the Company repurchased an aggregate principal amount of $16$412 million or 82.4%, of the 2019 Convertible2024 Senior Notes in open market transactions. The repurchases were funded through a repaymentas part of the intercompany note between Clearway Operating LLC and Clearway Energy, Inc. which was reduced by $16 million.
On September 10, 2018, pursuant to the 2019 Convertible Notes and the 2020 Convertible Notes indentures, Clearway Energy, Inc. delivered to the holders of the Convertible Notes a fundamental change notice and offer to repurchase any and all of the 2019 Convertible Notes and 2020 Convertible Notes forpreviously cash at a price equal to 100% of the principal amount of the Convertible
Notes plus any accrued and unpaid interest. The tender offer expiredannounced on October 9, 2018. An aggregate principal amount of $109 million ofDecember 11, 2019. Concurrently with the 2019 Convertible Notes and $243 million of the 2020 Convertible Notes were tendered on or prior to the expiration date and accepted by Clearway Energy, Inc. for purchase. After the expirationlaunch of the tender offer, $220 million aggregate principal amountthe Company exercised its right to optionally redeem any 2024 Senior Notes not validly tendered and purchased in the tender offer, pursuant to the terms of the 2019 Convertible Notes and $45 million aggregate principal amount ofindenture governing the 2020 Convertible Notes remained outstanding as of December 31, 2018.2024 Senior Notes. For further discussion, see Item 15 — Note 10, Long-term Debt.
Subsequent to December 31, 2018, Clearway Energy, Inc. repaid the remaining balance of the 2019 Convertible Notes, which was funded through the payment of the remaining balance of the intercompany note due 2019 between Clearway Energy Operating LLC and Clearway Energy, Inc..
Cash Distributions to Clearway, Energy, Inc. and CEG
The Company intends to distribute to its unit holders in the form of a quarterly distribution all of the CAFD that is generated each quarter less reserves for the prudent conduct of the business, including among others, maintenance capital expenditures to maintain the operating capacity of the assets. CAFD is defined as net income before interest expense, income taxes, depreciation and amortization, plus cash distributions from unconsolidated affiliates, adjustments to reflect CAFD generated by unconsolidated investments that are unable to distribute project dividends due to the PG&E Bankruptcy, cash receipts from notes receivable, less cash distributions to noncontrolling interests, maintenance capital expenditures, pro-rata EBITDA from unconsolidated affiliates, cash interest paid, income taxes paid, principal amortization of indebtedness, and Walnut Creek investment payments, changes in prepaid and accrued capacity payments.payments, and adjusted for development expenses. Distributions on units are subject to available capital, market conditions, and compliance with associated laws, regulations and other contractual obligations. The Company expects that, based on current circumstances, comparable distributions will continue to be paid in the foreseeable future. The Company will continue to evaluate its capital allocation approach during the pendency of the PG&E Bankruptcy.
The following table lists the distributions paid on the Company's Class A, Class B, Class C and Class D units during the year ended December 31, 2018:2019:
| | | | Fourth Quarter 2018 | | Third Quarter 2018 | | Second Quarter 2018 | | First Quarter 2018 | Fourth Quarter 2019 | | Third Quarter 2019 | | Second Quarter 2019 | | First Quarter 2019 |
| Distributions per Class A and Class B unit | $ | 0.331 |
| | $ | 0.320 |
| | $ | 0.309 |
| | $ | 0.298 |
| $ | 0.20 |
| | $ | 0.20 |
| | $ | 0.20 |
| | $ | 0.20 |
|
| Distributions per Class C and Class D unit | $ | 0.331 |
| | $ | 0.320 |
| | $ | 0.309 |
| | $ | 0.298 |
| $ | 0.20 |
| | $ | 0.20 |
| | $ | 0.20 |
| | $ | 0.20 |
|
On February 12, 2019,18, 2020, the Company declared a quarterly distribution on its Class A, Class B, Class C and Class D units of $0.20$0.21 per unit payable on March 15, 2019.16, 2020.
Cash Flow Discussion
Year Ended December 31, 20182019 Compared to Year Ended December 31, 20172018
The following table reflects the changes in cash flows for the year ended December 31, 20182019, compared to 20172018:
| | | Year ended December 31, | 2018 | | 2017 | | Change | 2019 | | 2018 | | Change |
| (In millions) | | |
| Net cash provided by operating activities | $ | 492 |
| | $ | 517 |
| | $ | (25 | ) | $ | 469 |
| | $ | 492 |
| | $ | (23 | ) |
| Net cash used in investing activities | (185 | ) | | (442 | ) | | 257 |
| (468 | ) | | (185 | ) | | (283 | ) |
| Net cash used in financing activities | (38 | ) | | (258 | ) | | 220 |
| (170 | ) | | (38 | ) | | (132 | ) |
Net Cash Provided ByUsed In Operating Activities
|
| | | |
| Changes to net cash provided by operating activities were driven by: | (In millions) |
| Increase in operating income adjusted for non-cash items driven in 2018 compared to 2017 | $ | 4 |
|
| Decrease in working capital driven primarily by the timing of accounts receivable collections, paying down accounts payable - affiliate balances to NRG during 2018, as well payments made to reduce certain Alta Wind projects letters of credit | (27 | ) |
| Lower distributions from unconsolidated affiliates | (2 | ) |
| | $ | (25 | ) |
|
| | | |
| Changes to net cash provided by operating activities were driven by: | (In millions) |
| Increase in working capital driven primarily by the timing of accounts receivable collections and payment of accounts payable | $ | 29 |
|
| Lower distribution from unconsolidated affiliates affected by the PG&E Bankruptcy, partially offset by higher distributions from the distributed generation investments | (36 | ) |
| Decrease in operating income adjusted for non-cash items in 2019 compared to 2018 | (16 | ) |
| | $ | (23 | ) |
Net Cash Used In Investing Activities
|
| | | |
| Changes to net cash used in investing activities were driven by: | (In millions) |
| Current year reflects the Buckthorn Solar Drop Down Asset and UPMC Thermal Project compared to the payment made for the March 2017, August 2017, and November 2017 Drop Down Assets in 2017 | $ | 124 |
|
| Lower net investment in unconsolidated affiliates primarily in the DGPV partnerships with CEG during 2018 | 37 |
|
| Payment to acquire Central CA Fuel Cell 1, LLC in 2018 | (11 | ) |
| Lower capital expenditures driven by prior year capital expenditures for the Buckthorn Solar project | 107 |
|
| | $ | 257 |
|
|
| | | |
| Changes to net cash used in investing activities were driven by: | (In millions) |
| Increase in growth capital expenditures in the Renewables segment driven primarily by the repowering activities at Elbow Creek and Wildorado, as well as the final construction costs for Oahu and Kawailoa, partially offset by lower growth capital expenditures for construction of the Buckthorn Solar project, which went COD in 2018 | $ | (145 | ) |
| Higher payments for Drop Down Asset acquisitions in 2019 compared to 2018, primarily driven by the acquisition of Carlsbad, as well as higher payments in 2019 for the Duquesne acquisition compared to the acquisition of UPMC and Central CA Fuel Cell in 2018 | (153 | ) |
| Increase in investments in unconsolidated affiliates during 2019, primarily for investments in DGPV Holdco 3 LLC | 32 |
|
| Proceeds from sale of HSD Solar Holdings, LLC assets in October of 2019 | 20 |
|
| Payment to buy-out the existing tax equity partner of Wind TE Holdco on January 1, 2019 | (19 | ) |
| Cash proceeds from network upgrades in 2018 | (13 | ) |
| Other | (5 | ) |
| | $ | (283 | ) |
Net Cash Used In Financing Activities
|
| | | |
| Changes in net cash used in financing activities were driven by: | (In millions) |
| Net proceeds from the refinancing of the Thermal note purchase and private shelf agreement | $ | 120 |
|
| Net proceeds from corporate-level debt driven by the issuance of the 2025 Senior Notes, partially offset by the repayments of the intercompany notes with Clearway Energy, Inc. | 241 |
|
| Proceeds from borrowings for the Buckthorn Solar project in 2017, as well as higher project level debt amortization in 2018 compared to 2017 | (216 | ) |
| Net payments of $55 million under the revolving credit facility in 2018 compared to proceeds of $55 million in 2017 | (110 | ) |
| Increase in net contributions from noncontrolling interests primarily for the tax equity arrangements for the Buckthorn Solar project which closed in 2018 | 93 |
|
| Lower net payments of distributions to NRG for the Drop Down Assets relating to the pre-acquisition period in 2018 compared to 2017 | 23 |
|
| Higher net proceeds from the Clearway Energy, Inc. common stock offering under the ATM Program in 2018 compared to 2017 | 45 |
|
| Net proceeds from the Class C Common stock offering in September 2018 | 75 |
|
| Increase in distributions paid to unit holders | (51 | ) |
| | $ | 220 |
|
|
| | | |
| Changes in net cash used in financing activities were driven by: | (In millions) |
| Increase in corporate-level debt payments driven primarily by the repayment of the 2024 Senior Notes and Long-term debt - affiliate, due 2019 | $ | (269 | ) |
| Decrease in distributions paid to CEG and Clearway Energy, Inc. | 83 |
|
| Increase in net contributions from noncontrolling interests in 2019 compared to 2018 | 83 |
|
| Higher net payments under the revolving credit facility in 2018 compared to 2019 | 55 |
|
| Lower net proceeds from sale of Class B and D units in 2019 compared to net proceeds from sale of Class B and D units in 2018 | (53 | ) |
| Higher project-level debt amortization in 2019 compared to 2018 | (31 | ) |
| Lower debt proceeds in connection with the Duquesne University District Energy System acquisition in 2019 compared to the Thermal note purchase and private shelf agreement in 2018 | (25 | ) |
| Higher net borrowings in 2019 to fund construction of the repowering activities at Elbow Creek and Wildorado, offset by the repayment of a portion of the construction debt for the Oahu and Kawailoa projects upon reaching COD in September and November 2019, respectively | 25 |
|
| | $ | (132 | ) |
Year Ended December 31, 2017 Compared to Year Ended December 31, 2016
The following table reflects the changes in cash flows for the year ended December 31, 2017, compared to 2016:
|
| | | | | | | | | | | |
| Year ended December 31, | 2017 | | 2016 | | Change |
| (In millions) | |
| Net cash provided by operating activities | $ | 517 |
| | $ | 577 |
| | $ | (60 | ) |
| Net cash used in investing activities | (442 | ) | | (131 | ) | | (311 | ) |
| Net cash (used in) provided by financing activities | (258 | ) | | (202 | ) | | (56 | ) |
Net Cash Provided By Operating Activities
|
| | | |
| Changes to net cash provided by operating activities were driven by: | (In millions) |
| Decrease in operating income adjusted for non-cash items driven by primarily by lower revenues in the Renewables segment in 2017 compared to 2016 | $ | (63 | ) |
| Decrease in working capital driven primarily by the timing of accounts receivable collections, and inventory build up in the Renewables segment in connection with the transition to self operations, as well as higher prepaid expenses in 2017 compared to 2016 | (11 | ) |
| Higher distributions from unconsolidated affiliates primarily due to the acquisition of the Utah Solar Portfolio, which was acquired by the Company in March 2017 and by NRG in November 2016 | 14 |
|
| | $ | (60 | ) |
Net Cash Used In Investing Activities
|
| | | |
| Changes to net cash used in investing activities were driven by: | (In millions) |
| Payments for the acquisition of the March 2017, August 2017, and November 2017 Drop Down Assets in 2017 compared to the CVSR Drop Down in 2016 | $ | (173 | ) |
| Higher return of investment from unconsolidated affiliates combined with lower investments primarily in the DGPV Holdco entities in 2017 | 29 |
|
| Higher capital expenditures primarily related to maintenance capital expenditures at Walnut Creek as a result of the forced outages in 2017 | (11 | ) |
| Capital expenditures incurred by NRG in connection with construction of the Buckthorn Solar Drop Down Asset in 2017, which was acquired by the Company on March 30, 2018 | (159 | ) |
| Higher proceeds in 2017 in the Conventional segment compared to the insurance proceeds received in 2016 in the Renewables segment | 3 |
|
| | $ | (311 | ) |
Net Cash (Used In) Provided By Financing Activities
|
| | | |
| Changes in net cash provided by financing activities were driven by: | (In millions) |
| Lower net payments of distributions to NRG for the Drop Down Assets relating to the pre-acquisition period in 2017 compared to 2016 | $ | 161 |
|
| Increase in net contributions from noncontrolling interests due to higher production-based payments in 2017 compared to 2016 | 8 |
|
| Proceeds from the Clearway Energy, Inc. Class C common stock offerings under the ATM Program, net of underwriting discounts and commissions | 33 |
|
| Increase in distributions paid to unit holders | (29 | ) |
| Net repayments of $306 million under the revolving credit facility in 2016 compared to proceeds of $66 million in 2017 | 361 |
|
| Higher borrowing in 2016, primarily related to the 2026 Senior Notes and CVSR Holdco Notes due 2037, as well as higher repayments of long-term debt in 2017, partially offset by borrowings at Buckthorn Solar Drop Down Asset in 2017 | (590 | ) |
| | $ | (56 | ) |
Off-Balance Sheet Arrangements
Obligations under Certain Guarantee Contracts
The Company may enter into guarantee arrangements in the normal course of business to facilitate commercial transactions with third parties.
Retained or Contingent Interests
The Company does not have any material retained or contingent interests in assets transferred to an unconsolidated entity.
Obligations Arising Out of a Variable Interest in an Unconsolidated Entity
Variable interest in equity investments — As of December 31, 2018,2019, the Company has several investments with an ownership interest percentage of 50% or less in energy and energy-related entities that are accounted for under the equity method. DGPV Holdco 1 LLC, DGPV Holdco 2 LLC, DGPV Holdco 3 LLC, RPV Holdco 1 LLC and GenConn are variable interest entities for which the Company is not the primary beneficiary. The Company's pro-rata share of non-recourse debt held by unconsolidated affiliates was approximately $878$889 million as of December 31, 2018.2019. The Company's pro-rata share of non-recourse debt held by unconsolidated affiliates as it related to the projects affected by PG&E bankruptcy was $411 million. This indebtedness may restrict the ability of these subsidiaries to issue dividends or distributions to the Company. See also Item 15 — Note 5, Investments Accounted for by the Equity Method and Variable Interest Entities, to the Consolidated Financial Statements.
Contractual Obligations and Commercial Commitments
The Company has a variety of contractual obligations and other commercial commitments that represent prospective cash requirements in addition to the Company's capital expenditure programs. The following table summarizes the Company's contractual obligations. See Item 15 — Note 10,Long-term Debt and Note 14, Commitments and Contingencies, to the Consolidated Financial Statements for additional discussion.
| | | | By Remaining Maturity at December 31, | By Remaining Maturity at December 31, |
| | 2018 | | 2017 | 2019 | | 2018 |
| Contractual Cash Obligations | Under 1 Year | | 1-3 Years | | 3-5 Years | | Over 5 Years | | Total | | Total | Under 1 Year | | 1-3 Years | | 3-5 Years | | Over 5 Years | | Total | | Total |
| | (In millions) | (In millions) |
| Long-term debt (including estimated interest) | $ | 831 |
| | $ | 1,388 |
| | $ | 1,467 |
| | $ | 4,441 |
| | $ | 8,127 |
| | $ | 8,026 |
| $ | 2,129 |
| | $ | 1,235 |
| | $ | 866 |
| | $ | 4,791 |
| | $ | 9,021 |
| | $ | 8,127 |
|
| Operating leases | 13 |
| | 26 |
| | 25 |
| | 207 |
| | 271 |
| | 196 |
| 16 |
| | 47 |
| | 47 |
| | 272 |
| | 382 |
| | 271 |
|
| Fuel purchase and transportation obligations | 11 |
| | 6 |
| | 6 |
| | 13 |
| | 36 |
| | 41 |
| 9 |
| | 6 |
| | 6 |
| | 10 |
| | 31 |
| | 36 |
|
Other liabilities (a) | 30 |
| | 51 |
| | 26 |
| | 113 |
| | 220 |
| | 208 |
| 34 |
| | 47 |
| | 33 |
| | 188 |
| | 302 |
| | 220 |
|
| Total | $ | 885 |
| | $ | 1,471 |
| | $ | 1,524 |
| | $ | 4,774 |
| | $ | 8,654 |
| | $ | 8,471 |
| $ | 2,188 |
| | $ | 1,335 |
| | $ | 952 |
| | $ | 5,261 |
| | $ | 9,736 |
| | $ | 8,654 |
|
(a) Includes water right agreements, service and maintenance agreements, and LTSA commitments.
Fair Value of Derivative Instruments
The Company may enter into fuel purchase contracts and other energy-related financial instruments to mitigate variability in earnings due to fluctuations in spot market prices and to hedge fuel requirements at certain generation facilities. In addition, in order to mitigate interest rate risk associated with the issuance of variable rate debt, the Company enters into interest rate swap agreements.
The tables below disclose the activities of non-exchange traded contracts accounted for at fair value in accordance with ASC 820. Specifically, these tables disaggregate realized and unrealized changes in fair value; disaggregate estimated fair values at December 31, 20182019, based on their level within the fair value hierarchy defined in ASC 820; and indicate the maturities of contracts at December 31, 20182019. For a full discussion of the Company's valuation methodology of its contracts, see Derivative Fair Value Measurements in Item 15 — Note 6, Fair Value of Financial Instruments, to the Consolidated Financial Statements.
|
| | | |
| Derivative Activity (Losses)/Gains | (In millions) |
| Fair value of contracts as of December 31, 2017 | $ | (47 | ) |
| Contracts realized or otherwise settled during the period | 18 |
|
| Changes in fair value | 19 |
|
| Fair value of contracts as of December 31, 2018 | $ | (10 | ) |
|
| | | |
| Derivative Activity (Losses)/Gains | (In millions) |
| Fair value of contracts as of December 31, 2018 | $ | (10 | ) |
| Contracts realized or otherwise settled during the period | 13 |
|
| Contracts acquired during the period | (19 | ) |
| Changes in fair value | (76 | ) |
| Fair value of contracts as of December 31, 2019 | $ | (92 | ) |
| | | | Fair value of contracts as of December 31, 2018 | Fair value of contracts as of December 31, 2019 |
| | Maturity | Maturity |
| Fair Value Hierarchy (Losses)/Gains | 1 Year or Less | | Greater Than
1 Year to 3 Years | | Greater Than
3 Years to 5 Years | | Greater Than
5 Years | | Total Fair
Value | 1 Year or Less | | Greater Than
1 Year to 3 Years | | Greater Than
3 Years to 5 Years | | Greater Than
5 Years | | Total Fair
Value |
| | (In millions) | (In millions) |
| Level 2 | (1 | ) | | (7 | ) | | (4 | ) | | 2 |
| | (10 | ) | (16 | ) | | (31 | ) | | (14 | ) | | (22 | ) | | (83 | ) |
| Level 3 | | — |
| | — |
| | (5 | ) | | (4 | ) | | (9 | ) |
| Total | | $ | (16 | ) | | $ | (31 | ) | | $ | (19 | ) | | $ | (26 | ) | | $ | (92 | ) |
The Company has elected to disclose derivative assets and liabilities on a trade-by-trade basis and does not offset amounts at the counterparty master agreement level. As discussed below in Quantitative and Qualitative Disclosures about Market Risk -Commodity Price Risk, NRG, on behalf of the Company measures the sensitivity of the portfolio to potential changes in market prices using VaR, a statistical model which attempts to predict risk of loss based on market price and volatility. NRG'sThe Company's risk management policy places a limit on one-day holding period VaR, which limits the net open position.
Critical Accounting Policies and Estimates
The Company's discussion and analysis of the financial condition and results of operations are based upon the consolidated financial statements, which have been prepared in accordance with GAAP. The preparation of these financial statements and related disclosures in compliance with GAAP requires the application of appropriate technical accounting rules and guidance as well as the use of estimates and judgments that affect the reported amounts of assets, liabilities, revenues and expenses, and related disclosures of contingent assets and liabilities. The application of these policies necessarily involves judgments regarding future events, including the likelihood of success of particular projects, legal and regulatory challenges and the fair value of certain assets and liabilities. These judgments, in and of themselves, could materially affect the financial statements and disclosures based on varying assumptions, which may be appropriate to use. In addition, the financial and operating environment may also have a significant effect, not only on the operation of the business, but on the results reported through the application of accounting measures used in preparing the financial statements and related disclosures, even if the nature of the accounting policies has not changed.
On an ongoing basis, the Company evaluates these estimates, utilizing historic experience, consultation with experts and other methods the Company considers reasonable. Actual results may differ substantially from the Company's estimates. Any effects on the Company's business, financial position or results of operations resulting from revisions to these estimates are recorded in the period in which the information that gives rise to the revision becomes known.
The Company's significant accounting policies are summarized in Item 15 — Note 2, Summary of Significant Accounting Policies, to the Consolidated Financial Statements. The Company identifies its most critical accounting policies as those that are the most pervasive and important to the portrayal of the Company's financial position and results of operations, and that require the most difficult, subjective and/or complex judgments by management regarding estimates about matters that are inherently uncertain. The Company's critical accounting policies include impairment of long lived assets and other intangible assets.
|
| |
| Accounting Policy | Judgments/Uncertainties Affecting Application |
| | |
| Impairment of Long Lived Assets | Recoverability of investments through future operations |
| | Regulatory and political environments and requirements |
| | Estimated useful lives of assets |
| | Operational limitations and environmental obligations |
| | Estimates of future cash flows |
| | Estimates of fair value |
| | Judgment about triggering events |
Evaluation of Assets for Impairment and Other-Than-Temporary Decline in Value
In accordance with ASC 360, Property, Plant, and Equipment, or ASC 360, property, plant and equipment and certain intangible assets are evaluated for impairment whenever indicators of impairment exist. Examples of such indicators or events are:
Significant decrease in the market price of a long-lived asset;
Significant adverse change in the manner an asset is being used or its physical condition;
Adverse business climate;
Accumulation of costs significantly in excess of the amount originally expected for the construction or acquisition of an asset;
Current-period loss combined with a history of losses or the projection of future losses; and
Change in the Company's intent about an asset from an intent to hold to a greater than 50% likelihood that an asset will be sold or disposed of before the end of its previously estimated useful life.
Recoverability of assets to be held and used is measured by a comparison of the carrying amount of the assets to the future net cash flows expected to be generated by the asset, through considering project specific assumptions for long-term powerenergy pool prices, escalated future project operating costs and expected plant operations. If such assets are considered to be impaired, the impairment to be recognized is measured by the amount by which the carrying amount of the assets exceeds the fair value of the assets. The fair value may be determined by factoring in the probability weighting of different courses of action available to the Company as appropriate. Generally, fair value will be determined using valuation techniques such as the present value of expected future cash flows or comparable values determined by transactions in the market. The Company uses its best estimates in making these evaluations and considers various factors, including forward price curves for energy, fuel costs and operating costs. However, actual future market prices and project costs could vary from the assumptions used in the Company's estimates, and the impact of such variations could be material.
Annually, during the fourth quarter, the Company revises its views of powerenergy prices, including the Company's fundamental view for long-term power prices, forecasted generation and operating and capital expenditures, in connection with the preparation of its annual budget.
The Company recorded certain long-lived asset impairments in 2017 and 2016,2019, as described below and in Item 15 — Note 9, Asset Impairments,, to the Consolidated Financial Statements, with respect to several wind projects.
DuringThe Company recorded an impairment loss of $19 million related to a facility in the fourthThermal segment during the second quarter of 2017,2019. The impairment was triggered by a potential sale negotiation with a third party which resulted in signing the purchase and sale agreement in September, as the Company updated its estimated cash flowsfurther described in connection with the preparationNote 3, Acquisitions and review of the Company's annual budget, the Company determined that the cash flows for the Elbow Creek and Forward facilities were below the carrying value of the related assets, primarily driven by continued declining merchant power prices in post-contract periods, and that the assets were considered impaired.Dispositions. The fair value of the facilitiesfacility was determined using an income approach by applying a discounted cash flow methodology to the long-term budgets for each respective plant. The income approach utilizesutilized estimates of discounted future cash flows, which were Level 3 fair value measurement and include key inputs, such as forecasted power prices, operations and maintenance expense, and discount rates. The Company measured the impairment loss as the difference between the carrying amount and the fair value of the assets.
Additionally, during the fourth quarter of 2019, as a result of the preparation and review of its annual budget and assessment of long-term merchant prices, the Company updated its estimated future cash flows and determined that the future cash flows for several wind projects from the Renewables segment no longer supported the recoverability of the related long-lived asset. As such, the Company recorded an impairment loss of $14 million to reflect the assets at fair market value. There were no other triggering events identified prior to the fourth quarter annual budget update for these asset groups. The fair value of the facilities was determined using an income approach by applying a discounted cash flow methodology to the long-term budgets for each respective plant. The income approach included key inputs such as forecasted merchant power prices, operations and recorded impairment losses of $26 millionmaintenance expense, and $5 million for Elbow Creek and Forward, respectively.discount rates. The resulting fair value is a Level 3 fair value measurement.
The Company is also required to evaluate its equity method investments to determine whether or not they are impaired. ASC 323, Investments - Equity Method and Joint Ventures, or ASC 323, provides the accounting requirements for these investments. The standard for determining whether an impairment must be recorded under ASC 323 is whether the value is considered to be an other-than-temporary decline in value. The evaluation and measurement of impairments under ASC 323 involves the same uncertainties as described for long-lived assets that the Company owns directly and accounts for in accordance with ASC 360. Similarly, the estimates that the Company makes with respect to its equity method investments are subjective, and the impact of variations in these estimates could be material. Additionally, if the projects in which the Company holds these investments recognize an impairment under the provisions of ASC 360, the Company would record its proportionate share of that impairment loss and would evaluate its investment for an other-than-temporary decline in value under ASC 323.
Certain of the Company’s projects have useful lives that extend well beyond the contract period and therefore, management’s view of long-term powerenergy prices in the post-contract periods may have a significant impact on the expected future cash flows for these projects. Accordingly, if management’smanagement lowers its view of long-term powerenergy prices in certain markets continues to decrease, it is possible that some of the Company’s other long-lived assets may be impaired.
As previously described, on January 29, 2019, PG&E filed for reorganization under Chapter 11 of the U.S. Bankruptcy Code. Certain subsidiaries of the Company sell the output of their facilities to PG&E under long-term PPAs, including interests in 6 solar facilities totaling 480 MW and Marsh Landing with capacity of 720 MW. The Company consolidates three of the solar facilities and Marsh Landing and records its interest in the other solar facilities as equity method investments. The Company has determined that it has no impairment of the long-lived assets or equity method investments associated with these subsidiaries. Assumptions utilized to test these assets for impairment may change based on future events related to the PG&E bankruptcy,Bankruptcy, which could result in an impairment loss if the PPAs are rejected or amended, or if the Company is not able to collect its revenues from PG&E in a timely manner.
Recent Accounting Developments
See Item 15 — Note 2, Summary of Significant Accounting Policies, to the Consolidated Financial Statements for a discussion of recent accounting developments.
Item 7A — Quantitative and Qualitative Disclosures About Market Risk
The Company is exposed to several market risks in its normal business activities. Market risk is the potential loss that may result from market changes associated with the Company's power generation or with an existing or forecasted financial or commodity transaction. The types of market risks the Company is exposed to are commodity price risk, interest rate risk, liquidity risk, and credit risk.
Commodity Price Risk
Commodity price risks result from exposures to changes in spot prices, forward prices, volatilities, and correlations between various commodities, such as electricity, natural gas and emissions credits. The Company manages the commodity price risk of its merchant generation operations by entering into derivative or non-derivative instruments to hedge the variability in future cash flows from forecasted power sales or purchases of fuel. The portion of forecasted transactions hedged may vary based upon management's assessment of market, weather, operation and other factors. See Item 15 — Note 7, Accounting for Derivative Instruments and Hedging Activities, to the Consolidated Financial Statements for more information.
Based on a sensitivity analysis using simplified assumptions, the impact of a $0.50 per MMBtu increase or decrease in natural gas prices across the term of the derivative contracts would cause no change to the net value of natural gas derivatives, and an increase of $0.50 MMBtu in natural gas prices across the term of the derivative contracts would cause an increase of approximately $3 million to the net value of natural gas derivatives as of December 31, 2019. The impact of a $0.50 per MWh increase or decrease in power prices across the term of the derivative contracts would cause a change of approximately $1$1 million in to the net value of power derivatives as of December 31, 2018.2019.
Interest Rate Risk
The Company is exposed to fluctuations in interest rates through its issuance of variable rate debt. Exposures to interest rate fluctuations may be mitigated by entering into derivative instruments known as interest rate swaps, caps, collars and put or call options. These contracts reduce exposure to interest rate volatility and result in primarily fixed rate debt obligations when taking into account the combination of the variable rate debt and the interest rate derivative instrument. See itemItem 15 — Note 7, Accounting for Derivative Instruments and Hedging Activities, to the Consolidated Financial Statements for more information.
Most of the Company's project subsidiaries enter into interest rate swaps, intended to hedge the risks associated with interest rates on non-recourse project level debt. See Item 15 — Note 10,Long-term Debt, to the Consolidated Financial Statements for more information about interest rate swaps of the Company's project subsidiaries.
If all of the above swaps had been discontinued on December 31, 20182019, the Company would have owed the counterparties $4$84 million. Based on the credit ratings of the counterparties, the Company believes its exposure to credit risk due to nonperformance by counterparties to its hedge contracts to be insignificant.
The Company has long-term debt instruments that subject it to the risk of loss associated with movements in market interest rates. As of December 31, 20182019, a 1% change in interest rates would result in an approximately $3 million change in market interest expense on a rolling twelve-month basis.
As of December 31, 20182019, the fair value of the Company's debt was $5,938$6,956 million and the carrying value was $6,038$6,857 million. The Company estimates that a 1% decrease in market interest rates would have increased the fair value of its long-term debt by $304$340 million.
Liquidity Risk
Liquidity risk arises from the general funding needs of the Company's activities and in the management of the Company's assets and liabilities.
Counterparty Credit Risk
Credit risk relates to the risk of loss resulting from non-performance or non-payment by counterparties pursuant to the terms of their contractual obligations. The Company monitors and manages credit risk through credit policies that include: (i) an established credit approval process, and (ii) the use of credit mitigation measures such as prepayment arrangements or volumetric limits. Risks surrounding counterparty performance and credit could ultimately impact the amount and timing of expected cash flows. The Company seeks to mitigate counterparty risk by having a diversified portfolio of counterparties. See Item 15 — Note 1, Nature of Business, and Note 6, Fair Value of Financial Instruments, to the Consolidated Financial Statements for more information about concentration of credit risk.
As previously described, on January 29, 2019, PG&E filed for reorganization under Chapter 11 of the U.S. Bankruptcy Code. Certain subsidiaries of the Company sell the output of their facilities to PG&E under long-term PPAs, including interests in 6 solar facilities totaling 480 MW and Marsh Landing with capacity of 720 MW. The Company consolidates three of the solar facilities and Marsh Landing and records its interest in the other solar facilities as equity method investments. The Company had $17$5 million in accounts receivable for its consolidated projectsdue from PG&E, which relate to the pre-petition period and therefore were recorded in other non-current assets as of December 31, 2018. All of these amounts were collected in January 2019.
Item 8 — Financial Statements and Supplementary Data
The financial statements and schedules are listed in Part IV, Item 15 of this Form 10-K.
Item 9 — Changes in and Disagreements with Accountants on Accounting and Financial Disclosure
None.
Item 9A — Controls and Procedures
Conclusion Regarding the Effectiveness of Disclosure Controls and Procedures and Internal Control Over Financial Reporting
Under the supervision and with the participation of the Company's management, including its principal executive officer, principal financial officer and principal accounting officer, the Company conducted an evaluation of the effectiveness of the design and operation of its disclosure controls and procedures, as such term is defined in Rules 13a-15(e) or 15d-15(e) of the Exchange Act. Based on this evaluation, the Company's principal executive officer, principal financial officer and principal accounting officer concluded that the disclosure controls and procedures were effective as of the end of the period covered by this Annual Report on Form 10-K.
Changes in Internal Control over Financial Reporting
In connection with the GIP Transaction, the Company entered into a TSA pursuant to which NRG Energy, Inc. provided information technology, systems, applications and business processes to the Company. UnderA material portion of these processes terminated during the TSA with NRG Energy, Inc.,second quarter of 2019 and such services were subsequently provided by both the Company continuedand by CEG pursuant to review, document and evaluate the internal controls over financial reporting through year-end 2018.CEG Master Services Agreements. There were no other changes in the Company’s internal control over financial reporting (as such term is defined in Rule 13a-15(f) under the Exchange Act) during the quarter ended December 31, 2018,2019, that materially affected, or are reasonably likely to materially affect, the Company’s internal control over financial reporting.
Inherent Limitations over Internal Controls
The Company's internal control over financial reporting is designed to provide reasonable assurance regarding the reliability of financial reporting and the preparation of consolidated financial statements for external purposes in accordance with GAAP. The Company's internal control over financial reporting includes those policies and procedures that:
1. Pertain to the maintenance of records that, in reasonable detail, accurately and fairly reflect the transactions and dispositions of the Company's assets;
2. Provide reasonable assurance that transactions are recorded as necessary to permit preparation of consolidated financial statements in accordance with GAAP, and that the Company's receipts and expenditures are being made only in accordance with authorizations of its management and directors; and
3. Provide reasonable assurance regarding prevention or timely detection of unauthorized acquisition, use or disposition of the Company's assets that could have a material effect on the consolidated financial statements.
Internal control over financial reporting cannot provide absolute assurance of achieving financial reporting objectives because of its inherent limitations, including the possibility of human error and circumvention by collusion or overriding of controls. Accordingly, even an effective internal control system may not prevent or detect material misstatements on a timely basis. Also, projections of any evaluation of effectiveness to future periods are subject to the risk that controls may become inadequate because of changes in conditions or that the degree of compliance with the policies or procedures may deteriorate.
Management's Report on Internal Control over Financial Reporting
The Company's management is responsible for establishing and maintaining adequate internal control over financial reporting, as such term is defined in Exchange Act Rule 13a-15(f). Under the supervision and with the participation of the Company's management, including its principal executive officer, principal financial officer and principal accounting officer, the Company conducted an evaluation of the effectiveness of its internal control over financial reporting based on the framework in Internal Control — Integrated Framework (2013) issued by the Committee of Sponsoring Organizations of the Treadway Commission. Based on the Company's evaluation under the framework in Internal Control — Integrated Framework (2013), the Company's management concluded that its internal control over financial reporting was effective as of December 31, 2018.2019.
Item 9B — Other Information
None.
PART III
PART III
Item 10 —- Directors, Executive Officers and Corporate Governance
Item 10The Company is a limited liability company that is managed by Clearway, Inc., as its sole managing member. As a limited liability company managed by Clearway, Inc., the Company does not have a board of directors. References herein to the Company's board of directors are references to the board of directors (the “Board”) of Clearway, Inc. Pursuant to the Fourth Amended and Restated Limited Liability Company Agreement of the Company, Clearway, Inc. has been omittedappointed officers of the Company and designated certain of such officers as “Executive Officers.” These executive officers are the same as the executive officers of Clearway, Inc.
The following table shows information for the Company's executive officers. Executive officers serve until their successors are duly appointed or elected.
|
| | |
| Name | Age | Title |
| Christopher S. Sotos | 48 | President and Chief Executive Officer |
| Chad Plotkin | 44 | Senior Vice President and Chief Financial Officer |
| Kevin P. Malcarney | 53 | Senior Vice President, General Counsel and Corporate Secretary |
| Mary-Lee Stillwell | 46 | Vice President and Chief Accounting Officer |
Christopher S. Sotos has served as President and Chief Executive Officer since May 2016, and as a member of the Board since May 2013. Mr. Sotos had also served in various positions at NRG, including most recently as Executive Vice President-Strategy and Mergers and Acquisitions from February 2016 through May 2016 and Senior Vice President-Strategy and Mergers and Acquisitions from November 2012 through February 2016. In this reportrole, he led NRG’s corporate strategy, mergers and acquisitions, strategic alliances and other special projects for NRG. Previously, he served as NRG’s Senior Vice President and Treasurer from March 2008 to September 2012, where he was responsible for all treasury functions, including raising capital, valuation, debt administration and cash management. Mr. Sotos also previously served as a director of FuelCell Energy, Inc. from September 2014 to April 2019. As President and Chief Executive Officer of the Company, Mr. Sotos provides the Board with management’s perspective regarding the Company’s day to day operations and overall strategic plan. Mr. Sotos also brings strong financial and accounting skills to the Board.
Chad Plotkin has served as the Company's Senior Vice President and Chief Financial Officer since November 2016. From January 2016 until his appointment as Senior Vice President and Chief Financial Officer, Mr. Plotkin served as Senior Vice President, Finance and Strategy. Prior to this, he served in varying capacities at NRG, including as Vice President of Investor Relations of both the Company and NRG from September 2015 to January 2016 and from January 2012 to February 2015 and Vice President of Finance of NRG from February 2015 to September 2015. From October 2007 to January 2012, Mr. Plotkin served in various capacities in the Strategy and Mergers and Acquisitions group of NRG, including as Vice President, beginning in December 2010.
Kevin P. Malcarney has served as Senior Vice President, General Counsel and Corporate Secretary since May 11, 2018. He served as Interim General Counsel of the Company from March 16, 2018. Mr. Malcarney was previously Vice President and Deputy General Counsel and served in various other roles at NRG since September 2008. Prior to that, Mr. Malcarney worked at two major law firms in Princeton, New Jersey and Philadelphia, Pennsylvania, and handled mergers and acquisitions, project financing and general corporate matters.
Mary-Lee Stillwell has served as Vice President and Chief Accounting Officer of the Company since August 31, 2018. Ms. Stillwell previously served as Vice President and Assistant Controller of NRG since December 2012, where she was responsible for managing and directing NRG's financial accounting and reporting activities as well as overseeing the accounting for the Renewables business and various shared service functions. Prior to her work at NRG, Ms. Stillwell served as Assistant Controller-Integration and Internal Controls of GenOn Energy, Inc., in Houston, Texas, from September 2010 to December 2012, where she was responsible for all Sarbanes‑Oxley compliance as well as integrations of mergers and acquisitions.
Code of Ethics
The Company has not adopted a separate code of ethics because all of the officers of the Company are subject to the Code of Conduct adopted by the Board of Clearway, Inc. Clearway, Inc.’s Code of Conduct applies to all of its directors and employees, including its and the Company's officers (e.g., the Company's CEO, CFO, and Principal Accounting Officer). Clearway, Inc.’s Code of Conduct is available on its website, www.clearwayenergy.com.
Section 16(a)-Beneficial Ownership Reporting Compliance
The Company does not have equity securities registered pursuant to Section 12 of the reduced disclosure format permitted by General Instruction IExchange Act, and therefore there are no persons subject to Form 10-K.Section 16 of the Exchange Act with respect to the Company that are required to file Forms 3, 4 or 5 with the SEC.
Item 11 — Executive Compensation
Compensation Committee Report
The Company's named executive officers are also named executive officers of Clearway, Inc., and the compensation of the named executive officers disclosed herein reflects total compensation for services with respect to Clearway, Inc. and all of its subsidiaries, including the Company. The Compensation Committee of the Board of Clearway, Inc. (the “Compensation Committee”) has reviewed and discussed the Compensation Discussion and Analysis included in this Annual Report on Form 10-K required by Item 11402(b) of Regulation S-K with management and, based upon such review and discussion, the Compensation Committee has recommended to the Board that the Compensation Discussion and Analysis be included in this Annual Report on Form 10-K.
|
|
| Compensation Committee: |
| Ferrell P. McClean, Chair |
| Jonathan Bram |
| Brian R. Ford |
Daniel B. More
|
| E. Stanley O'Neal |
Compensation Discussion and Analysis
Executive Summary
Executive Compensation Program
Clearway, Inc. is a publicly‑traded energy infrastructure investor and owner of modern, sustainable and long‑term contracted assets across North America. As a result of the GIP Transaction which closed on August 31, 2018, GIP, through its portfolio company, CEG, holds all of Clearway, Inc.’s Class B common stock and Class D common stock, and thus has the majority voting interest in the Company. This Compensation Discussion and Analysis (“CD&A”) describes the philosophy, elements, implementation and results of the Clearway, Inc.'s 2019 executive compensation program as it applies to the executive team. As discussed above, Clearway, Inc.'s named executive officers are also named executive officers of Clearway Energy LLC, and the compensation of the named executive officers (“NEOs”) discussed below reflects total compensation for services with respect to Clearway, Inc. and all of its subsidiaries, including Clearway Energy LLC. In this CD&A, the term “Company,” as well as the terms “our,” “we,” “us” or like terms, are used to refer to Clearway, Inc. and its consolidated subsidiaries, including Clearway Energy LLC and its consolidated subsidiaries.
Beginning with our first two employees, Messrs. Sotos and Plotkin in 2016, the Compensation Committee’s objectives have been omittedto design a simple yet competitive program, which is aligned with the interests of our stockholders. Since that time, refinements have been made to the combination of long‑term and short‑term compensation features to further align pay with the Company’s annual performance and 3-year total shareholder return (“TSR”), respectively. Our annual incentive program (“AIP”) is based on objective criteria that support the achievement of our short-term objectives, which we believe create long-term shareholder value. Our long-term incentives are comprised of 67% Relative Performance Stock Units (“RPSUs”), which vest based on relative TSR measured over 3 years and 33% Restricted Stock Units (“RSUs”), which vest based on continued service over 3 years. The program incorporates many best practices in compensation design, while being tailored to our business needs and compensation objectives.
In 2019, the Compensation Committee reviewed and did not modify its compensation philosophy behind the compensation program. Thus, NEO compensation continued to be delivered through a mix of (i) base salary, (ii) an annual incentive bonus opportunity under the AIP and (iii) long‑term incentive compensation under our Amended and Restated 2013 Equity Incentive Plan (“LTIP”) in the form of RPSUs, and RSUs.
At our 2019 Annual Meeting of Stockholders, we received 99% support for our say on pay proposal. We believe these results demonstrate our stockholders support our pay practices and that our compensation plans are aligned with their interests.
Key Governance Features of Our Executive Compensation Program
Our compensation program and practices incorporate several key governance features as highlighted in the table below:
|
| |
| What We Do: | What We Don’t Do: |
| Pay for performance by delivering a substantial majority of our CEO’s compensation through equity | No excise tax gross‑ups on change‑in‑control payments and no tax gross‑ups on perquisites or benefits |
| Beginning in 2017, the large majority of our equity compensation for Senior Vice Presidents and above is performance‑based | No pledging or hedging of the Company’s stock by NEOs or directors |
| Target our peer group median for total direct compensation | No employment agreements for executive officers with the exception of our CEO |
| Require a double trigger for the acceleration of equity vesting upon a change‑in‑control | No guaranteed bonus payments for our NEOs |
| Prevent undue risk taking in our compensation practices and engage in robust risk monitoring | No supplemental executive retirement plans |
| Include clawback policies in our compensation plans | No re‑pricing of underwater stock options and no stock option grants with an exercise price below 100% of fair market value |
| Maintain robust stock ownership guidelines for our NEOs | |
| Provide market‑level retirement benefits and limited perquisites | |
| Engage an independent compensation consultant to provide advice to the Compensation Committee with respect to our compensation program | |
| Conduct an annual say on pay vote | |
Business Strategy and Company Performance
The Company’s primary business strategy is to focus on the acquisition and ownership of assets with predictable, long‑term cash flows that allow the Company to increase the cash dividends paid to holders of the Company’s Class A and Class C common stock over time without compromising the ongoing stability of the business. The Company’s plan for executing this strategy includes the following key components: focusing on contracted renewable energy and conventional generation and thermal infrastructure assets; growing our business through acquisitions of contracted operating assets primarily in North America; and maintaining sound financial practices to grow our dividend.
The execution of the Company’s business strategy produced the following results in 2019:
Raised approximately $900 million in new corporate-level formation for growth investments and corporate liability management, which included corporate debt and equity financings, as well as project-level debt optimization
Invested approximately $330 million in new growth investments, including the acquisition of the 527 MW Carlsbad Energy Center from the Company’s sponsor GIP and the Repowering Partnership 1.0
Finalized stand-alone operations including the transition of services away from NRG as the Company’s sponsor
Successful management of the potential impacts from the PG&E bankruptcy
Achieved strong execution from Thermal business, which acquired the district energy assets of Duquesne University in Pittsburgh, PA and successfully completed the Mylan project and secured a contract with Cayo Largo in Puerto Rico
Such results were taken into account by the Compensation Committee in making determinations with respect to the compensation for our NEOs under the 2019 compensation program.
Executive Compensation Program
2019 Named Executive Officers
This CD&A describes the material components of our compensation program for our NEOs in 2019. For the year ending December 31, 2019, our NEOs included the following individuals:
|
| | |
| NEO | | 2019 Title |
| Christopher S. Sotos | | President and Chief Executive Officer |
| Chad Plotkin | | Senior Vice President and Chief Financial Officer |
| Kevin P. Malcarney | | Senior Vice President, General Counsel and Corporate Secretary |
| Mary‑Lee Stillwell | | Vice President and Chief Accounting Officer |
Goals and Objectives of the Program
The Compensation Committee is responsible for the development and implementation of the Company’s executive compensation program. The intent of the program is to reward the achievement of the Company’s annual goals and objectives while supporting the Company’s long‑term business strategy. The Compensation Committee is committed to aligning executives’ compensation with performance. Our Compensation Committee has designed an executive compensation program that:
closely aligns our executive compensation with stockholder value creation, avoiding plans that encourage executives to take excessive risk, while driving long‑term value to stockholders;
supports the Company’s long‑term business strategy, while rewarding our executive team for their individual accomplishments with tailored individual executive compensation metrics and incentives; and
provides a competitive compensation opportunity while adhering to market standards for compensation.
The Compensation Committee’s objectives are achieved through the use of both short‑term and long‑term incentives. The Company currently targets pay at the median of our Compensation Peer Group (defined below), as described under “Elements of Compensation.”
The Compensation Process
Compensation Consultant
Pursuant to its charter, the Compensation Committee is authorized to engage, at the expense of the Company, a compensation consultant to provide independent advice, support and expertise to assist the Compensation Committee in overseeing and reviewing our overall executive compensation strategy, structure, policies and programs, and to assess whether our compensation structure establishes appropriate incentives for management and other key employees. As noted above, Pay Governance served as the Compensation Committee’s independent compensation consultant for the first eight months of fiscal year 2019. Deloitte became the Compensation Committee’s independent compensation consultant for the remainder of fiscal year 2019 and continues to serve in that capacity. Pay Governance worked with the Compensation Committee to formulate the design of the executive and director compensation programs for 2019. Each of Pay Governance and Deloitte provided reports to the Compensation Committee (during the respective periods they served as compensation consultant) containing research, market data, survey information and information regarding trends and developments in executive and director compensation. Each of Pay Governance and Deloitte reported directly to the Compensation Committee (during the respective periods they served as compensation consultant). The Company paid Deloitte $105,992 for the work it performed for the Compensation Committee in 2019. CEG engaged Deloitte and its affiliate, Deloitte & Touche LLP, to provide additional services in 2019, for which CEG paid $2,964,644. These additional services primarily related to financial reporting services, including assistance with the preparation of CEG’s financial statements for the second and third quarters of 2019, and assisting with the transition of enterprise resource planning and financial applications from NRG. Given that these services were provided to CEG, the decision to engage Deloitte and its affiliate for such services was not made, or recommended, by our management, or approved by the Compensation Committee or the Board. Neither Pay Governance nor any of its affiliates provided services for any of our affiliates in 2019. In accordance with SEC rules and requirements, the Company has affirmatively determined that no conflicts of interest exist between the Company and Pay Governance or Deloitte (or any individuals working on the Company’s account on behalf of Pay Governance or Deloitte).
Compensation Peer Group Analysis
The Compensation Committee, with support from its independent compensation consultant, identifies the most appropriate comparator group within relevant industries for purposes of benchmarking compensation. The Compensation Committee aims to
compare our compensation program to a consistent peer group year‑to‑year but given the dynamic nature of our industry and the companies that constitute it, the Compensation Committee annually examines the peer group for appropriateness in terms of size, complexity and industry. As a result of such annual review, the Compensation Committee identified a new peer group for compensation benchmarking purposes in 2019 (the “Compensation Peer Group”).
For these purposes, the Compensation Peer Group, comprised of similarly sized publicly‑owned energy and utility companies, is identified below:
|
| | | | | | |
| Company | | Ticker | | Company | | Ticker |
| Black Hills Corporation | | NYSE: BKH | | NorthWestern Corporation. | | NYSE: NWE |
Boardwalk Pipeline Partners, LP(1) | | | | Ormat Technologies, Inc. | | NYSE: ORA |
| El Paso Electric Company | | NYSE: EE | | Pattern Energy Group Inc. | | NASDAQ: PEGI |
| Genesis Energy, L.P. | | NYSE: GEL | | South Jersey Industries, Inc. | | NYSE: SJI |
| Innergex Renewable Energy Inc. | | TSX: INE | | TransAltaCorporation. | | NYSE:TAC |
| Northland Power Inc. | | TSX: NPI | | | | |
(1)Boardwalk Pipeline Partners, LP became privately-held in July 2018 and was delisted, but was included by Pay Governance (when it was serving as compensation consultant) as part of its 2019 compensation benchmarking analysis, and for that reason, Boardwalk Pipeline Partners, LP is included in the Compensation Peer Group for 2019 but will not be part of the Compensation Peer Group for 2020 or going forward.
For the purposes of determining appropriate NEO pay levels for 2019, the Compensation Committee reviewed NEO compensation from peers, where available and appropriate (e.g., based on an NEO’s position and duties). To supplement this reportanalysis, the Compensation Committee also participated in meetings with its compensation consultant regarding the compensation consultant’s review of relevant third‑party survey data and considered the recommendations of the CEO on NEO and employee compensation matters not involving the CEO. The Compensation Committee may accept or adjust such CEO recommendations at its discretion.
Elements of Compensation
Our compensation program for our NEOs consists of fixed compensation (base salary), performance‑based compensation (AIP bonus and RPSUs) and time‑based compensation (RSUs). We use the median percentile of our Compensation Peer Group as a guidepost in establishing the targeted levels of total direct compensation (cash and equity) for our NEOs. We expect that, over time, targeted total direct compensation for our NEOs will continue to approximate the median of our Compensation Peer Group. Realized pay in a given year depends on the achievement of defined performance‑based compensation metrics. While a portion of our compensation is fixed, a significant percentage is at‑risk and payable and/or realizable only if certain performance objectives are met.
Base Salary
Base salary compensates NEOs for their level of experience and position responsibilities and for the continued expectation of superior performance. Recommendations on increases to base salary take into account, among other factors, the NEO’s individual performance, the general contributions of the NEO to overall corporate performance, the level of responsibility of the NEO with respect to his or her specific position, and their current base salary level compared to the market median. Messrs. Sotos and Plotkin received base salary increases in 2019 based on their performance and peer group benchmarking. The base salary for each NEO for fiscal year 2019 is set forth below:
|
| | | | |
| Named Executive Officer | | 2019 Annualized Base Salary ($)(1) | | Percentage Increase Over 2018 (%)(2) |
| Christopher S. Sotos | | 611,000 | | 22% |
| Chad Plotkin | | 380,000 | | 9% |
| Kevin P. Malcarney | | 300,000 | | 0% |
| Mary‑Lee Stillwell | | 295,000 | | 0% |
(1) Actual 2019 base salary earnings are presented in the Summary Compensation Table.
(2) As compared to the December 31, 2018 annualized base salary.
Annual Incentive Compensation
Overview
Annual incentive compensation awards (AIP bonuses) are made under our AIP. AIP bonuses represent short‑term compensation designed to compensate NEOs for meeting annual Company goals and for their individual performance. The Compensation Committee establishes these annual Company goals after reviewing the Company’s business strategy and other matters. As further discussed below, the annual goals for 2019 relate to the following four areas: (a) CAFD, (b) key financial milestones, (c) key transition milestones and (d) achievement of the Thermal plan. In addition, each NEO’s individual performance may (negatively or positively) affect the bonus amount that he or she ultimately receives under our AIP. However, notwithstanding individual performance or the extent to which the Company goals are achieved, the Compensation Committee retains sole discretion under the AIP to reduce the amount of or eliminate any AIP bonuses that are otherwise payable under the AIP.
AIP bonus opportunities are expressed in terms of threshold, target and maximum bonus opportunities. Different percentages of each NEO’s annual base salary relate to these threshold, target and maximum AIP bonus opportunities. However, in the event threshold performance for 2019 was not achieved with respect to the CAFD performance metric (the “AIP Gate”), no AIP bonuses would have been payable for 2019.
Effective January 1, 2019, the AIP was amended to include designated officers as participants, granting NEOs (other than Mr. Sotos whose severance is governed by his employment agreement) eligibility for a prorated target bonus payment for the year of a qualifying severance termination, based on the portion of the performance period that the NEO was employed.
2019 AIP Bonus Performance Criteria
The AIP bonus performance criteria applicable to all NEOs are based upon the four Company goals described above and individual performance. The table below sets forth the 2019 AIP performance criteria and weightings applicable to all NEOs, assuming the achievement of each goal at target.
|
| |
| Goal | Weight |
CAFD(1) | 32.5% |
| Key Financial Milestones | 32.5% |
| Key Transition Milestones | 25% |
| Achievement of the Thermal Plan | 10% |
| Overall Funding | 100% |
| Individual Performance | +/- 20% |
(1) CAFD is adjusted earnings before interest, taxes, depreciation and amortization (Adjusted EBITDA) plus cash distributions/return of investment from unconsolidated affiliates, cash receipts from notes receivable, cash distributions from noncontrolling interests, less cash distributions to noncontrolling interests, maintenance capital expenditures, pro‑rata Adjusted EBITDA from unconsolidated affiliates, cash interest paid, income taxes paid, principal amortization of indebtedness, Walnut Creek investment payments, and changes in prepaid and accrued capacity payments.
| |
| • | CAFD. As noted above, the threshold CAFD performance metric represents the AIP Gate for 2019. The Compensation Committee set the 2019 AIP Gate at $231 million. The Compensation Committee has removed the AIP Gate as a feature under the AIP for 2020. |
Beyond serving as a “gate” to any payout of AIP bonuses to NEOs, CAFD is also a distinct portion of our annual incentive framework. For 2019, the CAFD goals and the achieved level are set forth in the chart below. The Company achieved CAFD of approximately $254 million, surpassing the CAFD threshold (i.e., the AIP Gate) but less than the CAFD target.
|
| | | |
CAFD Threshold | CAFD Target | CAFD Maximum | CAFD Actual |
| $231 million | $270 million | $309 million | $254 million |
| |
| • | Key Financial Milestones. Achievement of “key financial milestones” performance metrics are established as a defined annual incentive category. The Compensation Committee establishes threshold, target and maximum levels of performance for this category based on the number of milestones achieved. For 2019, a total of eleven milestones were established relating to the Company’s credit rating, adherence to budget, CAFD per share goals, management of certain PG&E related projects, and OSHA recordable incident rate. Additional CAFD and OSHA milestones also were applied as separate milestones with respect |
to the Company’s Thermal business. For 2019, threshold performance required the achievement of three out of the eleven milestones, target performance required the achievement of six out of the eleven milestones, and maximum performance required the achievement of all eleven milestones. Ultimately, target performance was attained with the achievement of six out of the eleven milestones in 2019.
| |
| • | Key Transition Milestones. Achievement of “key transition milestones” performance metrics were specifically established as a defined annual incentive category for 2019. The Compensation Committee establishes threshold, target and maximum levels of performance for this category based on the number of milestones achieved. For 2019, a total of five milestones were established relating to the Company’s cost savings initiatives, reduced use of NRG technology and services, implementation of certain asset management agreements and satisfactory completion of the auditor RFP (request for proposal). For 2019, threshold performance required the achievement of two out of the five milestones, target performance required the achievement of three out of the five milestones, and maximum performance required the achievement of all five milestones. Ultimately, maximum performance was attained with the achievement of five out of the five milestones in 2019. |
| |
| • | Achievement of the Thermal Plan. Achievement of “Thermal Plan” performance metrics was added as an annual incentive category for 2019 based on the view that all elements of the Company’s business should be reflected in the AIP bonus opportunity. The Compensation Committee establishes threshold, target and maximum levels for this category for each of the “Thermal Plan” performance metrics. For 2019, the Thermal Plan performance metrics relate to the Thermal business’s CAFD, capital expenditures, cost controls and system efficiencies. In addition, a separate metric was established for 2019 identifying a total of eleven key Thermal business goals. Similar to the key financial and transitional milestones described above, threshold, target and maximum levels of performance were established for this separate metric based on the number of goals achieved. These goals related tosafety, cost control, customer retention and satisfaction, employee engagement, environmental risk management, good citizenship and growth, in each case, with respect to the Thermal business (threshold, target and maximum performance required the achievement of three, seven and ten goals, respectively, out of a total of eleven). Ultimately, above-target performance was attained (expressed as 153% of target) with respect to the thermal plan in 2019 (including achievement of six out of the eleven key Thermal business goals). |
| |
| • | Individual Performance. As indicated above, individual performance may (negatively or positively) affect the AIP Bonus for an NEO by up to 20%, although no AIP Bonus payments can exceed 200% of the target award. Such individual performance is determined on a discretionary basis based on the Compensation Committee’s assessment of the NEO’s contributions in supporting adherence to budget, support towards the achievement of key milestones, and other contributions towards the successful execution of the Company’s business strategy. In 2019, the Compensation Committee considered the individual performance of the CEO and recommended to the full Board that his AIP Bonus be increased by 20% to account for his individual performance. In a similar manner, the CEO recommended to the Compensation Committee that the AIP Bonus be increased for the other NEOs from 15% to 20%. The full board approved the above recommendation of the Compensation Committee and the Compensation Committee approved the above recommendation of the CEO. |
2019 Annual Incentive Bonus Opportunity
The threshold, target and maximum AIP bonus opportunities for NEOs for 2019, expressed as a percentage of base salary, were:
|
| | | | | |
| Named Executive Officer | Gate Not Met (%) | Threshold (%)(1) | Target (%)(1) | Maximum (%) | Target Amount ($) |
| Christopher S. Sotos | 0 | 50 | 100 | 200 | 611,000 |
| Chad Plotkin | 0 | 30 | 60 | 120 | 228,000 |
| Kevin Malcarney | 0 | 20 | 40 | 80 | 120,000 |
| Mary‑Lee Stillwell | 0 | 20 | 40 | 80 | 118,000 |
(1) This assumes that the CAFD performance metric and all other quantitative and qualitative goals, including the key milestones, are achieved at threshold or target levels, respectively.
2019 Annual Incentive Bonuses
As noted above, with respect to AIP bonuses for 2019, the AIP Gate was $231 million, the CAFD target was $270 million, the key financial milestone target was achievement of six out of eleven key financial milestones, the key transition milestone target was achievement of three out of five key transition milestones and target achievement of the “Thermal Plan” metrics was based on the achievement of various sub-categories, including the achievement of seven out of eleven key Thermal business goals.
For 2019, the AIP Gate was surpassed, CAFD was between threshold and target at approximately $254 million, six out of eleven key financial milestones were achieved, and five out of five key transition milestones were achieved. In addition, overall achievement for the thermal plan for 2019 was above target at 153%. Due to the achievement specified above, 2019 AIP bonuses were paid at levels above target. If performance falls between threshold and target or target and maximum, the bonus opportunity will be determined on an interpolated basis. As a result, the CAFD metric, the key financial milestone, the key transition milestone, and thermal plan metrics were respectively weighted at 79%, 100%, 200% and 153% of target. Individual performance, which is determined on a discretionary basis, resulted in positive adjustments to the AIP Bonuses for the NEOs from 15% to 20%.
The annual incentive bonuses paid to NEOs for 2019 were:
|
| | | | | | |
| Named Executive Officer | | Percentage of Annual Base Salary (%) | | Percent of Target Achieved (%) | | Annual Incentive Payment ($) |
| Christopher S. Sotos | | 148 | | 124 | | 906,235 |
| Chad Plotkin | | 89 | | 124 | | 338,170 |
| Kevin P. Malcarney | | 57 | | 124 | | 170,568 |
| Mary‑Lee Stillwell | | 59 | | 124 | | 175,018 |
Long‑Term Incentive Compensation
We believe that equity awards directly align our NEOs’ interests with those of our stockholders. In 2019, the Compensation Committee granted our NEOs a combination of performance‑based equity awards directly linked to long‑term stockholder value creation and time-based equity awards which also represent a critical component of our long-term incentive compensation due to the retention aspects of the awards. To enhance our compensation program’s focus on Company performance, the large majority of these long‑term incentive awards (67%) were performance‑based (i.e., granted as RPSUs). The remaining 33% of our long-term incentive awards were time-based (i.e., granted as RSUs which vest over 3 years). We believe that our AIP appropriately focuses our NEOs on shorter‑term (one‑year) financial metrics while our LTIP emphasizes long‑term stockholder value creation (i.e. three‑year TSR outperformance). For 2019, Mr. Sotos’ target LTIP award was 250% of his base salary, Mr. Plotkin’s target LTIP award was 125% of his base salary, Mr. Malcarney’s target LTIP award was 100% of his base salary, and Ms. Stillwell’s target LTIP award was 75% of her base salary. The above mix of long‑term incentive compensation applied to all NEOs, except Ms. Stillwell, for 2019, who received 100% RSUs under the terms of her offer letter.
Relative Performance Stock Units
Each RPSU represents the potential to receive one share of Class C common stock based on the Company’s TSR performance ranked against the TSR performance of a comparator group of similar companies (the “Performance Peer Group”) after the completion of a three‑year performance period. Relative measures are designed to normalize for externalities, ensuring the program appropriately reflects management’s impact on the Company’s TSR by including peer companies that the Compensation Committee believes are similarly impacted by market conditions.
The payout of shares of Class C common stock at the end of the three‑year performance period is based on the Company’s TSR performance percentile rank compared with the TSR performance of the Performance Peer Group. To ensure a rigorous program design, the target‑level payout (100% of shares granted) requires the Company to perform at the 50th percentile. To induce management to achieve greater than target‑level performance in a down market, in the event that the Company’s TSR performance declines by more than 20% over the performance period, the target‑level payout (100% of shares granted) will require an even greater achievement of a 60th percentile performance. The Compensation Committee believes that this increased performance requirement addresses the concern that a disproportionate award may be paid in the event that our relative performance is high, but absolute performance is low.
In the event relative performance is below the 25th percentile, the award is forfeited. In the event relative performance is between the 25th percentile and the 50th percentile (or the 60th percentile if our TSR performance declines by more than 20% over the performance period), payouts will be based on an interpolated calculation. In the event relative performance reaches the 50th percentile (or the 60th percentile as described above), 100% of the award will be paid. In the event relative performance is between the 50th percentile (or the 60th percentile as described above) and the 75th percentile, payouts will be based on an interpolated calculation. In the event that relative performance is at or above the 75th percentile, a maximum payout of 150% of the target will be paid with respect to RPSU awards granted in 2019. Beginning with respect to RPSUs granted in 2018 and continuing for grants of 2019 RPSUs, the maximum payout was (and remains) changed from 200% to 150%.
The table below illustrates the design of our RPSUs in 2019.
|
| | | | | | | | |
| Performance Targets | | Performance Requirement | | Payout Opportunity | |
| Maximum | | 75th percentile or above | | 150% | |
| Target | | Standard Target: 50th percentile | | Modified Target: 60th percentile (less than −20% absolute TSR) | | 100% | |
| Threshold | | 25th percentile | | 25% | |
| Below Threshold | | Below 25th percentile | | 0% | |
Restricted Stock Units
Each RSU represents the right to receive one share of our Class C common stock after the completion of the vesting period. The RSUs granted to the NEOs in 2019 vest ratably, meaning that one‑third of the award vests each year on the anniversary of the grant date, over a three‑year period.
Dividend Equivalent Rights
In connection with awards of both RPSUs and RSUs, each NEO also receives DERs, which accrue with respect to the award to which they relate. DERs accrue only to the extent that the shares of Class C common stock underlying each award become vested and deliverable to the NEO. Accrued DERs are paid at the same time such shares are delivered to the NEO. Accordingly, DERs are forfeited if the underlying shares are forfeited.
Clawbacks
The Company has a “clawback” policy with regard to awards made under the AIP and LTIP in the case of a material financial restatement, including a restatement resulting from employee misconduct, or in the case of fraud, embezzlement or other serious misconduct that is materially detrimental to the Company. The Compensation Committee retains discretion regarding application of the policy. The policy is incremental to other remedies that are available to the Company. In addition to our “clawback” policy, if the Company is required to restate its earnings as a result of noncompliance with a financial reporting requirement due to misconduct, under the Sarbanes‑Oxley Act of 2002 (“SOX”), the CEO and the CFO would also be subject to a “clawback,” as required by SOX.
Benefits
All of our NEOs participate in the same retirement, life insurance, health and welfare plans. To generally support more complicated financial planning and estate planning matters, NEOs are eligible for reimbursement of annual tax return preparation, tax advice, financial planning and estate planning expenses. Mr. Sotos is eligible for a maximum reimbursement of $12,000 per year and the remaining NEOs are eligible for a maximum reimbursement of $3,000 per year.
Potential Severance and Change‑In‑Control Benefits
Each NEO’s RPSU and RSU award agreements under the LTIP provide for special treatment in the event of such NEO’s termination of employment under certain circumstances, including in connection with a change-in-control. Additionally, Mr. Sotos, pursuant to his employment agreement, and the remaining NEOs, pursuant to the reduced disclosure formatCompany’s Executive Change‑in‑Control and General Severance Plan for Tier IA and Tier IIA Executives (the “CIC Plan”) as well as pursuant to the Compensation Committee’s discretion under the AIP, are entitled to additional severance payments and benefits in the event of termination of employment under certain circumstances, including following a change‑in‑control.
Change‑in‑control arrangements are considered a market practice among many publicly‑held companies. Most often, these arrangements are utilized to encourage executives to remain with the company during periods of extreme job uncertainty and to ensure that any potential transaction is thoroughly and objectively evaluated. In order to enable a smooth transition during an interim period, change‑in‑control arrangements provide a defined level of security for the executive and the company, enabling a more seamless implementation of a particular merger, acquisition or asset sale or purchase, and subsequent integration.
For a more detailed discussion, including the quantification of potential payments, please see the section entitled “Severance and Change‑in‑Control” following the executive compensation tables below.
Other Matters
Stock Ownership Guidelines
The Compensation Committee and the Board require the CEO to hold Company stock with a value equal to 4.0 times his base salary until his separation from the Company. Senior Vice Presidents are required to hold Company stock with a value equal to 2.0 times their base salary until their separation from the Company. The Chief Accounting Officer is required to hold Company stock with a value of 1.5 times her base salary until her separation from the Company. Personal holdings and vested awards count towards the ownership multiple. Although NEOs are not required to make purchases of our common stock to meet their target ownership multiple, NEOs are restricted from divesting any securities until such ownership multiples are attained, except in the event of hardship or to make a required tax payment, and they must maintain their ownership multiple after any such transactions. Once met, they must maintain their ownership multiple during their service. The current target stock ownership for NEOs as of February 24, 2020 is shown below. Mr. Sotos and Mr. Plotkin became subject to the stock ownership guidelines upon becoming NEOs in 2016. In addition, Mr. Malcarney and Ms. Stillwell became subject to the stock ownership guidelines upon becoming NEOs in 2018. All of our NEOs met or exceeded their stock ownership guidelines as of February 24, 2020.
|
| | | | |
| Named Executive Officer | | Target Ownership Multiple | | Actual Ownership Multiple |
| Christopher S. Sotos | | 4.0x | | 8.8x |
| Chad Plotkin | | 2.0x | | 3.5x |
| Kevin P. Malcarney | | 2.0x | | 3.4x |
| Mary‑Lee Stillwell | | 1.5x | | 2.4x |
Tax and Accounting Considerations
Section 162(m) of the Internal Revenue Code (the “Code”) precludes us, as a public company, from taking a tax deduction for individual compensation to certain of our executive officers in excess of $1 million, subject to certain exemptions. Prior to 2018, the exemptions included an exclusion of performance‑based compensation within the meaning of Section 162(m) of the Code (“Section 162(m)”). The Tax Cuts and Jobs Act, enacted in December 2017, however, amended Section 162(m) and eliminated the exclusion of performance‑based compensation from the $1 million limit, subject to certain new exemptions for performance‑based compensation that is “grandfathered” for purposes of amended Section 162(m). The Compensation Committee believes tax deductibility of compensation is an important consideration and continues to consider the implications of legislative changes to Section 162(m) and the possible effect of exemptions for grandfathered compensation. However, the Compensation Committee also believes that it is important to retain flexibility in designing compensation programs, and as a result, has not adopted a policy that any particular amount of compensation must be deductible to the Company under Section 162(m).
The Compensation Committee also takes into account tax consequences to NEOs in designing the various elements of our compensation program, such as designing the terms of awards to defer immediate income recognition under Section 409A of the Code. The Compensation Committee remains informed of, and takes into account, the accounting implications of its compensation programs. However, the Compensation Committee approves programs based on their total alignment with our strategy and long‑term goals.
Compensation Tables
Summary Compensation Table
Fiscal Year Ended December 31, 2019
|
| | | | | | | | | | | | | | | | | | | | | | | | | |
| Name and Principal Position | | Year | | Salary ($)(1) | | Bonus ($) | | Stock Awards ($)(2) | | Option Awards ($) | | Non‑Equity Incentive Plan Compensation ($)(3) | | Change in Pension Value and Nonqualified Deferred Compensation Earnings ($) | | All Other Compensation ($)(4) | | Total ($) |
| Christopher S. Sotos | | 2019 | | 606,304 |
| | — | | 1,527,522 |
| | — |
| | 906,235 |
| | — |
| | 14,882 |
| | 3,054,942 |
|
| President and Chief | | 2018 | | 500,000 |
| | — | | 1,250,021 |
| | — |
| | 626,809 |
| | — |
| | 21,350 |
| | 2,398,180 |
|
| Executive Officer | | 2017 | | 500,000 |
| | — | | 1,250,008 |
| | — |
| | 685,000 |
| | — |
| | 22,750 |
| | 2,457,758 |
|
| Chad Plotkin | | 2019 | | 378,731 |
| | — | | 475,020 |
| | — |
| | 338,170 |
| | — |
| | 15,200 |
| | 1,207,120 |
|
| Senior Vice President | | 2018 | | 350,000 |
| | — | | 350,019 |
| | — |
| | 219,383 |
| | — |
| | 22,602 |
| | 942,004 |
|
| and Chief Financial | | 2017 | | 350,000 |
| | — | | 350,007 |
| | — |
| | 239,750 |
| | — |
| | 24,248 |
| | 964,005 |
|
| Officer | | | | | | | | | | | | | | | | | | |
Kevin P. Malcarney(5) | | 2019 | | 300,000 |
| | — | | 300,019 |
| | — |
| | 170,568 |
| | — |
| | 11,077 |
| | 781,663 |
|
| Senior Vice President, | | 2018 | | 180,000 |
| | — | | 589,868 |
| | — |
| | 96,855 |
| | — |
| | 500 |
| | 867,223 |
|
| General Counsel and | | 2017 | | — |
| | — | | — |
| | — |
| | — |
| | — |
| | — |
| | — |
|
| Corporate Secretary | | | | | | | | | | | | | | | | | | |
Mary‑Lee Stillwell(6) | | 2019 | | 295,000 |
| | — | | 221,261 |
| | — |
| | 175,018 |
| | — |
| | 10,892 |
| | 702,171 |
|
| Chief Accounting | | 2018 | | 86,231 |
| | — | | 556,336 |
| | — |
| | 49,849 |
| | — |
| | — |
| | 692,416 |
|
| Officer | | 2017 | | — |
| | — | | — |
| | — |
| | — |
| | — |
| | — |
| | — |
|
(1) Reflects base salary earnings.
(2) Reflects the grant date fair value determined in accordance with the Financial Accounting Standards Board Accounting Standards Codification Topic 718, Comparison - Stock Compensation. Clearway Energy, Inc. uses the Company's Class C common stock price on the date of grant as the fair value of the Company's RSUs. The fair value of RPSUs is estimated on the date of grant using a Monte Carlo simulation model. For performance-based RPSUs granted in 2019, if the maximum level of performance is achieved, the fair value will be approximately $1,535,162 for Mr. Sotos, $477,388 for Mr. Plotkin and $301,523 for Mr. Malcarney.
(3) The amounts shown in this column represent the annual incentive bonuses paid to the NEOs. Further information regarding the annual incentive bonuses is included in the “2019 Annual Incentive Bonuses” section of this CD&A.
(4) The amounts provided in the All Other Compensation column represent the additional benefits payable by the Company and include insurance benefits; the employer match under the Company’s 401(k) plan; financial counseling services up to $12,000 per year for Mr. Sotos and up to $3,000 per year for all other NEOs, not including the financial advisor’s travel or out-of-pocket expenses; and when applicable, the Company’s discretionary contribution to the 401(k) plan. The following table identifies the additional compensation for each NEO.
|
| | | | | | | | | | | | | | | | | |
| Name | | Year | | Life and Disability Insurance Reimbursement ($) | | Financial Advisor Services ($) | | 401(k) Employer Matching Contribution ($) | | 401(k) Discretionary Contribution ($) | | Total ($) |
| Christopher S. Sotos | | 2019 | | 1,000 |
| | 2,682 |
| | 11,200 |
| | — |
| | 14,882 |
|
| | | 2018 | | — |
| | 2,250 |
| | 11,000 |
| | 8,100 |
| | 21,350 |
|
| | | 2017 | | 4,000 |
| | — |
| | 10,800 |
| | 7,950 |
| | 22,750 |
|
| Chad Plotkin | | 2019 | | 1,000 |
| | 3,000 |
| | 11,200 |
| | — |
| | 15,200 |
|
| | | 2018 | | — |
| | 3,000 |
| | 11,502 |
| | 8,100 |
| | 22,602 |
|
| | | 2017 | | 3,000 |
| | 3,000 |
| | 10,298 |
| | 7,950 |
| | 24,248 |
|
| Kevin P. Malcarney | | 2019 | | — |
| | — |
| | 11,077 |
| | — |
| | 11,077 |
|
| | | 2018 | | — |
| | 500 |
| | — |
| | — |
| | 500 |
|
| | | 2017 | | — |
| | — |
| | — |
| | — |
| | — |
|
| Mary‑Lee Stillwell | | 2019 | | — |
| | — |
| | 10,892 |
| | — |
| | 10,892 |
|
| | | 2018 | | — |
| | — |
| | — |
| | — |
| | — |
|
| | | 2017 | | — |
| | — |
| | — |
| | — |
| | — |
|
(5) Mr. Malcarney was appointed as Senior Vice President, General Counsel & Corporate Secretary on May 11, 2018.
(6) Ms. Stillwell was appointed as Chief Accounting Officer on August 31, 2018.
Grants of Plan‑Based Awards
Fiscal Year Ended December 31, 2019
|
| | | | | | | | | | | | | | | | | | | | | | | | | | | | |
| | | | | | | | | Estimated Possible Payouts Under Non‑Equity Incentive Plan Awards | | Estimated Future Payouts Under Equity Incentive Plan Awards | | All Other Stock Awards: Number of Shares of Stock | | Grant Date Fair Value of Stock and Option |
| Name | | Award Type | | Grant Date | | Approval Date | | Threshold ($)(1) | Target ($)(2) | Maximum ($)(3) | | Threshold (#) | Target (#) | Maximum (#) | | or Units (#) | | Awards ($)(4) |
| Christopher S. Sotos | | AIP | | — |
| | — |
| | 305,500 |
| 611,000 |
| 1,222,000 |
| | — |
| — |
| — |
| | — |
| | — |
|
| | | RPSU | | 1/2/2019 |
| | 12/6/2018 |
| | — |
| — |
| — |
| | 13,668 |
| 54,671 |
| 82,007 |
| | — |
| | 1,023,441 |
|
| | | RSU | | 1/2/2019 |
| | 12/6/2018 |
| | — |
| — |
| — |
| | — |
| — |
| — |
| | 29,307 |
| | 504,080 |
|
| Chad Plotkin | | AIP | | — |
| | — |
| | 114,000 |
| 228,000 |
| 456,000 |
| | - | — |
| — |
| | — |
| | — |
|
| | | RPSU | | 1/2/2019 |
| | 11/29/2018 |
| | — |
| — |
| — |
| | 4,250 |
| 17,001 |
| 25,502 |
| | — |
| | 318,259 |
|
| | | RSU | | 1/2/2019 |
| | 11/29/2018 |
| | — |
| — |
| — |
| | — |
| — |
| — |
| | 9,114 |
| | 156,761 |
|
| Kevin P. Malcarney | | AIP | | — |
| | — |
| | 60,000 |
| 120,000 |
| 240,000 |
| | — |
| — |
| — |
| | — |
| | — |
|
| | | RPSU | | 1/2/2019 |
| | 12/6/2018 |
| | — |
| — |
| — |
| | 2,685 |
| 10,738 |
| 16,107 |
| | — |
| | 201,015 |
|
| | | RSU | | 1/2/2019 |
| | 12/6/2018 |
| | — |
| — |
| — |
| | — |
| — |
| — |
| | 5,756 |
| | 99,003 |
|
| Mary‑Lee Stillwell | | AIP | | — |
| | — |
| | 59,000 |
| 118,000 |
| 236,000 |
| | — |
| — |
| — |
| | — |
| | — |
|
| | | RPSU | | — |
| | — |
| | — |
| — |
| — |
| | — |
| — |
| — |
| | — |
| | — |
|
| | | RSU | | 1/2/2019 |
| | 12/6/2018 |
| | — |
| — |
| — |
| | — |
| — |
| — |
| | 12,864 |
| | 221,261 |
|
(1) Threshold non-equity incentive plan awards include annual incentive plan threshold payments, as presented in the CD&A.
(2) Target non-equity incentive plan awards include annual incentive plan target payments, as presented in the CD&A.
(3) Maximum non-equity incentive plan awards include annual incentive plan maximum payments, as presented in the CD&A.
(4) Reflects the grant date fair value determined in accordance with the Financial Accounting Standards Board Accounting Standards Codification Topic 718, Comparison-Stock Compensation. The Company uses the Class C common stock price on the date of grant as the fair value of the Company’s RSUs. The fair value of RPSUs is estimated on the date of grant using a Monte Carlo simulation model.
Outstanding Equity Awards at Fiscal Year End
Fiscal Year Ended December 31, 2019
|
| | | | | | | | | | | | | | | | | | | | | | | |
| | | Option Awards | | Stock Awards |
| | | Number of | | Number of | | | | | | Number | | Market Value | | Equity Incentive Plan Awards |
| Name | | Securities Underlying Unexercised Options (#) Exercisable | | Securities Underlying Unexercised Options (#) Unexercisable | | Option Exercise Price ($) | | Option Expiration Date | | of Shares or Units of Stock that Have Not Vested (#) | | of Shares or Units of Stock that Have Not Vested ($) | | Number of Unearned Shares that Have Not Vested (#)(1) | | Market Value of Unearned Shares that Have Not Vested ($)(1) |
| Christopher S. Sotos | | — |
| | — |
| | — |
| | — |
| | 52,266 (2) | | 1,042,707 |
| | 133,645 (3) |
| | 2,666,218 |
|
| Chad Plotkin | | — |
| | — |
| | — |
| | — |
| | 15,544 (4) | | 310,103 |
| | 39,114 (5) |
| | 780,324 |
|
| Kevin P. Malcarney | | — |
| | — |
| | — |
| | — |
| | 20,046 (6) | | 399,918 |
| | 10,738(7) |
| | 214,223 |
|
| Mary‑Lee Stillwell | | — |
| | — |
| | — |
| | — |
| | 24,916 (8) | | 497,074 |
| | — |
| | — |
|
| | | | | | | | | | | | | | | | | |
(1) Assumes achievement at target award level for 2017, 2018 and 2019 RPSU awards as discussed in the CD&A.
(2) This amount represents 16,840 RSUs that vested on January 2, 2020, 8,776 RSUs that vested on January 3, 2020, 16,861 RSUs that will vest on January 2, 2021, and 9,789 RSUs that will vest on January 2, 2022.
(3) This amount represents 39,375 RPSUs that vested on January 3, 2020, 39,599 that will vest on January 2, 2021, and 54,671 that will vest on January 2, 2022. On January 3, 2020, the 2017 RPSU award vested at 157% of target based on the Company’s TSR performance ranked against the TSR performance of the Performance Peer Group.
(4) This amount represents 5,017 RSUs that vested on January 2, 2020, 2,458 RSUs that vested on January 3, 2020, 5,024 RSUs that will vest on January 2, 2021, and 3,045 RSUs that will vest on January 2, 2022.
(5) This amount represents 11,025 RPSUs that vested on January 3, 2020, 11,088 that will vest on January 2, 2021, and 17,001 that will vest on January 2, 2022. On January 3, 2020, the 2017 RPSU award vested at 157% of target based on the Company’s TSR performance ranked against the TSR performance of the Performance Peer Group.
(6) This amount represents 1,916 RSUs that vested on January 2, 2020, 10,967 RSUs that vested on January 3, 2020, 5,240 RSUs that will vest on January 2, 2021, and 1,923 RSUs that will vest on January 2, 2022.
(7) This amount represents 10,738 RPSUs that will vest on January 2, 2022.
(8) This amount represents 4,283 RSUs that vested on January 2, 2020, 9,249 RSUs that vested on January 3, 2020, 7,087 RSUs that will vest on January 2, 2021, and 4,297 RSUs that will vest on January 2, 2022.
Option Exercises and Stock Vested
Fiscal Year Ended December 31, 2019
|
| | | | | | | | | | |
| | Option Awards | | Stock Awards |
| Name | | Number of Shares Acquired on Exercise (#) | | Value Realized on Exercise ($) | | Number of Shares Acquired on Vesting (#)(1) | | Value Realized on Vesting ($) |
| Christopher S. Sotos | | — |
| | — |
| | 95,628 (2) | | 1,676,418 (3) |
| Chad Plotkin | | — |
| | — |
| | 9,801 (4) | | 170,136 (3) |
| Kevin P. Malcarney | | — |
| | — |
| | 19,943(5) | | 351,612(6) |
| Mary‑Lee Stillwell | | — |
| | — |
| | 16,523(7) | | 291,303(6) |
(1) Includes shares and DERs that vested pursuant to underlying awards and converted to Class C common stock in 2019.
(2) Represents 7,080 RSUs and 509 DERs that vested on January 2, 2019 pursuant to the stock compensation award granted on January 2, 2018. Represents 8,749 RSUs and 1,207 DERs that vested on January 3, 2019 pursuant to the stock compensation award granted on January 3, 2017. Represents 66,559 RSUs and 11,524 DERs that vested on January 4, 2019 pursuant to the stock compensation award granted on August 8, 2016.
(3) The values are based on January 2, 2019 Class C common stock closing share price of $17.20 for awards and DERs that vested on January 2, 2019. The values are based on January 3, 2019 Class C common stock closing share price of $17.00 for awards and DERs that vested on January 3, 2019. The values are based on January 4, 2019 Class C common stock closing share price of $17.63 for awards and DERs that vested on January 4, 2019.
(4) Represents1,982 RSUs and 142 DERs that vested on January 2, 2019 pursuant to the stock compensation award granted on January 2, 2018. Represents 2,450 RSUs and 338 DERs that vested on January 3, 2019 pursuant to the stock compensation award granted on January 3, 2017. Represents 4,226 RSUs and 663 DERs that vested on January 4, 2019 pursuant to the stock compensation award granted on November 7, 2016.
(5) Represents 18,942 RSUs and 1,001 DERs that vested on January 4, 2019 pursuant to the stock compensation award granted on May 11, 2018.
(6) The values are based on January 4, 2019 Class C common stock closing share price of $17.63 for awards and DERs that vested on January4, 2019.
(7) Represents 15,975 RSUs and 548 DERs that vested on January 4, 2019 pursuant to the stock compensation award granted on August 31, 2018.
Employment Agreements
The Company has not entered into employment agreements with any officers other than Mr. Sotos.
On August 8, 2016, the Company entered into an employment agreement with Mr. Sotos pursuant to which Mr. Sotos serves as the Company’s President and CEO for the term that began on May 6, 2016 (the “Effective Date”) and ending on the date that his employment is terminated by either party. The employment agreement entitled Mr. Sotos to an annual base salary of $500,000 for the period beginning on the Effective Date and ended on December 31, 2016. For each annual period thereafter, our Board determines whether to increase Mr. Sotos’ annual base salary (as noted in the above Summary Compensation Table, Mr. Sotos’ base salary was increased to over $600,000 for fiscal year 2019). The employment agreement provides that, beginning with the 2016 fiscal year, Mr. Sotos is eligible to receive an annual bonus at a target amount equal to 100% of base salary (i.e., AIP bonus), based on achievement of criteria determined by the Board with input from Mr. Sotos. The maximum award opportunity each year is 200% of the target amount. The employment agreement further provides that Mr. Sotos is eligible to participate in the LTIP, on such terms as are set forth in the plan. Mr. Sotos’ target LTIP award for the 2019 fiscal year was approximately 250% of base salary.
In addition to the compensation and benefits described above, as well as paid vacation and director and officer liability insurance, the employment agreement provides that Mr. Sotos will receive the following:
Reimbursement for annual tax return preparation expenses and tax advice and financial planning, up to a maximum of $12,000 per year;
Eligibility to participate in the Company’s retirement plans, health and welfare plans, and disability insurance plans under the same terms, and to the same extent, as other senior management of the Company;
Reimbursement for the costs of litigation or other disputes incurred in asserting any claims under the employment agreement, unless the court finds in favor of the Company; and
Reimbursement for legal fees and expenses incurred in connection with negotiating the employment agreement and other agreements referenced therein, up to a maximum of $6,000, which reimbursement was completed in 2016.
The employment agreement also entitles him to certain severance payments and benefits in the event his employment terminates under certain circumstances. These severance payments and benefits are described and quantified under the section “Severance and Change‑in‑Control” below. In addition, under the employment agreement, the Company has agreed to indemnify Mr. Sotos against any claims arising as a result of his position with the Company to the maximum extent permitted by General Instruction Ilaw.
The employment agreement includes non‑competition and non‑solicitation restrictions on Mr. Sotos during the term of his employment and for one year after his termination of employment. The employment agreement also includes confidentiality, indemnification obligations and intellectual property restrictions and an obligation for Mr. Sotos to Form 10-K.cooperate with the Company in the event of any internal, administrative, regulatory, or judicial proceeding. The provisions of the employment agreement may only be waived with the written consent of the Company and Mr. Sotos.
Severance and Change‑In‑Control
Each NEO’s RPSU and RSU award agreements under the LTIP provide for special treatment in the event of such NEO’s termination of employment under certain circumstances. Upon death or disability, an NEO’s RSUs and RPSUs will vest in full and the performance metrics with respect to the RPSUs will be deemed to be achieved at target levels. Upon retirement, an NEO’s RSUs and RPSUs will remain eligible for vesting pursuant to the award agreement as though the NEO was continuously employed by the Company throughout the relevant period; provided that retirement occurs more than 12 months following the applicable award’s grant date. Further, if an NEO’s employment is involuntarily terminated by the Company without cause (as defined in Mr. Sotos’ employment agreement with respect to Mr. Sotos’ and as defined in the LTIP with respect to the other NEOs) within the six months immediately prior to, or the 12 months immediately following, a change in control of the Company (as defined in the LTIP), (i) such NEO’s RSUs will vest in full immediately upon the later of such change in control or such termination of employment and (ii) the Compensation Committee will, pursuant to the terms and conditions of the LTIP and RPSU award agreement(s), determine the final amount payable to the NEO, if any, pursuant to his or her RPSUs. In general, no RPSU or RSU accelerated vesting applies to any other involuntary termination, although new hire grants of RSUs, such as the grant made to Ms. Stillwell on August 31, 2018, provide pro-rated vesting for certain involuntary terminations of service that occur in connection with certain significant business events.
In addition to the above described treatment of his or her equity awards, Mr. Sotos, pursuant to his employment agreement, and the other NEOs, pursuant to the CIC Plan and in some cases, the AIP, are entitled to certain additional severance payments and benefits in the event of termination of employment under certain circumstances, including following a change‑in‑control.
Mr. Sotos’ Benefits
If Mr. Sotos’ employment is involuntarily terminated by the Company without cause or if he terminates his employment for good reason, subject to Mr. Sotos executing a release of claims, the Company agrees to provide Mr. Sotos with the following severance benefits:
A lump sum payment equal to no less than 1.5 times Mr. Sotos’ annual base salary in effect at the time of the Effective Date;
A lump sum payment equal to the target bonus opportunity under the then‑current bonus plan, which amount will be pro‑rated based on the number of days during the year that he was employed by the Company;
Any unpaid bonus amount for the prior fiscal year to the extent not paid prior to the termination date; and
Reimbursement of COBRA premiums for 18 months after the date of termination, except that such coverage will be discontinued if Mr. Sotos becomes eligible for medical benefits from a subsequent employer or otherwise.
If Mr. Sotos’ employment is involuntarily terminated by the Company without cause or if he terminates his employment for good reason within the six months immediately prior to, or the 12 months immediately following, a change‑in‑control of the Company, in lieu of the severance benefits set forth above, the Company will provide Mr. Sotos with the following severance benefits:
A lump sum payment of no less than three times the sum of (a) Mr. Sotos’ base salary in effect at the Effective Date and (b) Mr. Sotos’ target bonus opportunity for the year of termination;
A lump sum payment equal to the target bonus opportunity under the then‑current bonus plan, which amount will be pro‑rated based on the number of days during the year that he was employed by the Company;
Any unpaid bonus amount for the prior fiscal year to the extent not paid prior to the termination date; and
Reimbursement of COBRA premiums for 18 months after the date of termination, except that such coverage will be discontinued if Mr. Sotos becomes eligible for medical benefits from a subsequent employer or otherwise.
If Mr. Sotos’ employment is terminated as a result of his death or disability, the Company agrees to pay him an amount equal to the target bonus opportunity for the year of termination, which amount will be pro‑rated based on the number of days during the year that Mr. Sotos’ was employed by the Company. In addition, the Company will pay Mr. Sotos any unpaid bonus amount for the prior fiscal year to the extent not paid prior to the termination date.
If an excise tax under Section 4999 of the Code would be triggered by any payments under Mr. Sotos’ employment agreement or otherwise upon a change‑in‑control, the Company will reduce such payments so that no amounts are subject to Section 4999 of the Code, if such reduction would cause the amount to be retained by Mr. Sotos to be greater than if Mr. Sotos were required to pay such excise tax.
NEO Benefits
Eligible NEOs may receive a discretionary payment of the prorated target bonus under the AIP in the event of such NEO’s termination of employment under certain circumstances, including upon his or her termination due to retirement or involuntary termination without cause. Such amount, if payable in the Compensation Committee’s discretion, will be pro-rated based on the number of days during the year that he or she was employed by the Company. In addition, under the CIC Plan, in the event of involuntary termination without cause, eligible NEOs are entitled to a general severance benefit equal to 1.5 times base salary payable in a lump sum amount and reimbursement for COBRA benefits continuation cost for a period of 18 months.
The CIC Plan also provides a change‑in‑control benefit in the event that, within six months prior to, as well as 12 months following, a change‑in‑control, an eligible NEO’s employment is either involuntarily terminated by the Company without cause or voluntarily terminated by such NEO for good reason. Mr. Plotkin’s change‑in‑control benefit consists of an amount equal to 2.99 times the sum of his base salary plus the annual target incentive for the year of termination, payable in a lump sum amount. The change‑in‑control benefit for other eligible NEOs (other than Mr. Plotkin) consists of an amount equal to two times the sum of their base salary plus the annual target incentive for the year of termination, payable in a lump sum amount. All such NEOs are also eligible for an amount equal to their target bonus for the year of termination, prorated for the number of days during the
performance period that such NEO was employed by the Company and reimbursement for COBRA benefits continuation cost for a period of 18 months.
As a condition of receiving severance or change‑in‑control benefits, an eligible NEO must execute a release of claims and acknowledge the restrictive covenants in the CIC Plan. Such restrictive covenants include non‑competition, non‑solicitation and non‑disparagement covenants applicable for one year after termination, confidentiality and intellectual property obligations.
If an excise tax under Section 4999 of the Code would be triggered for an eligible NEO by any payments under the CIC Plan or otherwise upon a change‑in‑control, the Company will reduce such payments so that no amounts are subject to Section 4999 of the Code, if such reduction would cause the amount to be retained such NEO to be greater than if such NEO were required to pay such excise tax.
Definition of Change‑In‑Control, Etc.
In general, under Mr. Sotos’ employment agreement and the CIC Plan, a “change‑in‑control” occurs in the event: (a) any person or entity (with certain exceptions), becomes the direct or indirect beneficial owner of 50% or more of the Company’s voting stock or obtains the power to, directly or indirectly, vote or cause to be voted 50% or more of the Company’s capital stock entitled to vote in the election of directors, including by contract or through proxy, (b) directors serving on the Board as of a specified date cease to constitute at least a majority of the Board unless such directors are approved by a vote of at least two‑thirds (2/3) of the incumbent directors, provided that a person whose assumption of office is in connection with an actual or threatened election contest or actual or threatened solicitation of proxies including by reason of agreement intended to avoid or settle such contest shall not be considered to be an incumbent director, (c) any reorganization, merger, consolidation, sale of all or substantially all of the assets of the Company or other transaction is consummated and the previous stockholders of the Company fail to own at least 50% of the combined voting power of the resulting entity in substantially the same proportions of their ownership in the Company immediately prior to such transaction, or (d) the stockholders approve a plan or proposal to liquidate or dissolve the Company.
An involuntary termination without “cause” means the NEO’s termination by the Company for any reason other than the NEO’s (a) conviction of, or agreement to a plea of nolo contendere to, a felony or other crime involving moral turpitude (including an indictment therefor under the CIC Plan), (b) willful failure to perform his or her duties, (c) willful gross neglect or willful misconduct (including a material act of theft, fraud, malfeasance or dishonesty in connection with his or her performance of duties under the CIC Plan), or (d) breach of any written agreement between the Company or NEO, a violation of the Company’s Code of Conduct or other written policy (or in Mr. Sotos’ case, a material breach of his employment agreement).
A voluntary termination for “good reason” means the resignation of the NEO in the event of (a) a material reduction in his or her compensation or benefits, (b) a material diminution in his or her title, authority, duties or responsibilities, or (c) the failure of a successor to the Company to agree, in writing, to assume the CIC Plan within 15 days after a merger, consolidation, sale or similar transaction. In Mr. Sotos’ case only, “good reason” also includes (i) any material failure by the Company to comply with his employment agreement, (ii) his removal from the Board, (iii) the failure to elect him to the Board during any regular election, (iv) any reduction in his target annual bonus opportunity and long-term incentive award, or (v) a change in reporting structure of the Company requiring Mr. Sotos to report to anyone other than the Board.
Potential Payments Upon Termination or Change‑In‑Control
The amount of compensation payable to each NEO in each circumstance is shown in the table below, assuming that termination of employment occurred as of December 31, 2019, and including payments that would have been earned as of such date. The amounts shown below do not include benefits payable under the Company’s 401(k) plan.
|
| | | | | | | | | | | |
| Named Executive Officer | | Involuntary Termination Not for Cause ($) | Voluntary Termination for Good Reason ($) | | Involuntary Not for Cause or Voluntary for Good Reason Following a Change in Control ($) | | Death or Disability ($) |
| Christopher S. Sotos | | 1,391,643 |
| 1,391,643 |
| | 8,086,500 |
| | 4,722,857 |
|
| Chad Plotkin | | 828,380 |
| — |
| | 3,282,110 |
| | 1,433,810 |
|
| Kevin P. Malcarney | | 601,992 |
| — |
| | 1,652,215 |
| | 780,223 |
|
| Mary‑Lee Stillwell | | 786,806 |
| — |
| | 1,505,044 |
| | 648,222 |
|
CEO Pay Ratio
As a result of the recently adopted rules under the Dodd‑Frank Act, the SEC requires disclosure of the CEO to median employee pay ratio. The following is a reasonable estimate, prepared under applicable SEC rules, of the ratio of the annual total compensation of our CEO, Mr. Sotos, to the annual total compensation of our median employee.
We determined that we could use in our 2019 CEO pay ratio analysis the same median employee that we identified in 2018 given that there has been no change in either our employee population or our employee compensation arrangements that we believe would significantly impact our 2019 pay ratio disclosure. Similarly, there has been no change in our median employee's circumstances that we reasonably believe would result in a significant change to our 2019 pay ratio disclosure. Our median employee’s annual total compensation for 2019 was determined using the same rules that apply to reporting the compensation of our NEOs (including our CEO) in the “Total” column of the “Summary Compensation Table - 2017 - 2019” above. The following total compensation amounts were determined based on that methodology:
The annual total compensation of the median employee for 2019 was $85,913.
The annual total compensation of Mr. Sotos for 2019 was $3,054,942.
As a result, we estimate that Mr. Sotos’ 2019 annual total compensation was approximately 36 times that of our median employee.
Given the different methodologies, exemptions, estimates and assumptions that various public companies use to determine an estimate of their pay ratio, the estimated ratio reported above should not be solely used as a basis for comparison between companies.
Item 12 — Security Ownership of Certain Beneficial Owners and Management and Related Stockholder Matters
Item 12Clearway Energy LLC Ownership
As of December 31, 2019, GIP, through CEG, owned 42,738,750 of each of the Company's Class B units and Class D units and Clearway, Inc. owned 34,586,250 of the Company's Class A units and 73,187,646 of the Company's Class C units. Clearway, Inc., through its holdings of Class A units and Class C units, has been omitted from this report pursuanta 57.01% economic interest in the Company. Clearway, Inc. consolidates the results of the Company through its controlling interest as sole managing member. GIP, through CEG's holdings of Class B units and Class D units, has a 42.99% economic interest in the Company.
Clearway Energy, Inc. Ownership
Stock Ownership of Executive Officers
The following table sets forth information concerning beneficial ownership of Clearway, Inc.’s Class A and Class C common stock and combined voting power of Class A, Class B, Class C and Class D common stock for: (a) each NEO and (b) all executive officers as a group. The percentage of beneficial ownership is based on 34,599,645 shares of Class A common stock outstanding as of February 24, 2020 and 78,850,894 shares of Class C common stock outstanding as of February 24, 2020, and percentage of combined voting power is based on 78,554,291 votes represented by Clearway, Inc.’s outstanding Class A, Class B, Class C and Class D common stock in the aggregate as of February 24, 2020. The percentage of beneficial ownership and the percentage of combined voting power also include any shares that such person has the right to acquire within 60 days of February 24, 2020. Unless otherwise indicated, each person has sole voting and dispositive power with respect to the reduced disclosure format permittedshares set forth in the following table.
The address of the beneficial owners is Clearway Energy, Inc., 300 Carnegie Center, Suite 300, Princeton, New Jersey 08540.
|
| | | | | | | |
| | | Common Stock |
| Class A Common Stock | Class C Common Stock | % of |
| Executive Officers | Number(1) | % of Class A Common Stock | Number(1) | % of Class C Common Stock | Combined Voting Power(2) |
| Christopher S. Sotos | 23,100(3) |
| * |
| 124,515(3) | * | * |
| Chad Plotkin | 6,697(4) |
| * |
| 30,385(4) | * | * |
| Kevin P. Malcarney | 600(5) |
| * |
| 29,316(5) | * | * |
| Mary‑Lee Stillwell | — |
| — |
| 17,553(6) | * | * |
All executive officers as a group (four people) | 30,397(7) |
| * |
| 201,769 (7) | * | * |
| | | | | |
* Less than one percent of outstanding Class A common stock, Class C common stock or combined voting power, as applicable.
(1) The number of shares beneficially owned by General Instruction Ieach person or entity is determined under the rules of the SEC, and the information is not necessarily indicative of beneficial ownership for any other purpose. Under such rules, each person or entity is considered the beneficial owner of any: (a) shares to Form 10-K.which such person or entity has sole or shared voting power or dispositive power and (b) shares that such person or entity has the right to acquire within 60 days.
(2) Represents the voting power of all of the classes of Clearway, Inc.’s common stock together as a single class. Each holder of Class A or Class B common stock is entitled to one vote for each share held. Each holder of Class C or Class D common stock is entitled to 1/100th of one vote for each share held. Holders of shares of Clearway, Inc.’s Class A, Class B, Class C and Class D common stock vote together as a single class on all matters presented to its stockholders for their vote or approval, except as otherwise provided by applicable law.
(3) Includes 9,489 DERs to be paid in Class C common stock. Excludes 26,650 RSUs and 94,270 RPSUs. Each RSU represents the right to receive one share of Class C common stock upon vesting. Each RPSU represents the potential to receive Class C common stock based upon Clearway, Inc. achieving a certain level of total shareholder return relative to Clearway, Inc.’s peer group over a three-year performance period. Each DER represents the right to receive the dividends and distributions that would have otherwise been paid with respect to a share subject to a RSU or RPSU award (if such share were outstanding rather than being subject to the applicable award).
(4) Includes 2,771 DERs to be paid in Class C common stock. Excludes 8,069 RSUs and 28,089 RPSUs. Each RSU represents the right to receive one share of Class C common stock upon vesting. Each RPSU represents the potential to receive Class C common stock based upon Clearway, Inc. achieving a certain level of total shareholder return relative to Clearway, Inc.’s peer group over a three-year performance period. Each DER represents the right to receive the dividends and distributions that would have otherwise been paid with respect to a share subject to a RSU or RPSU award (if such share were outstanding rather than being subject to the applicable award).
(5) Includes 1,066 DERs to be paid in Class C common stock. Excludes 7,163 RSUs and 10,738 RPSUs. Each RSU represents the right to receive one share of Class C common stock upon vesting. Each RPSU represents the potential to receive Class C common stock based upon Clearway, Inc. achieving a certain level of total shareholder return relative to Clearway, Inc.’s peer group over a three-year performance period. Each DER represents the right to receive the dividends and distributions that would have otherwise been paid with respect to a share subject to a RSU or RPSU award (if such share were outstanding rather than being subject to the applicable award).
(6) Includes 662 DERs to be paid in Class C common stock. Excludes 11,384 RSUs. Each RSU represents the right to receive one share of Class C common stock upon vesting. Each DER represents the right to receive the dividends and distributions that would have otherwise been paid with respect to a share subject to a RSU award (if such share were outstanding rather than being subject to the applicable award).
(7) Consists of the total holdings of all executive officers as a group.
Item 13 — Certain Relationships and Related Transactions, and Director Independence
Item 13Relationship with GIP and Clearway Energy, Inc.
GIP, through its ownership of CEG, indirectly owns all of Clearway, Inc.’s outstanding Class B common stock and its Class D common stock, which represents, in the aggregate, 54.95% of the voting interest in its stock and receives distributions from the Company through its ownership of our Class B and Class D units. Holders of Clearway, Inc.’s Class A common stock and Class C common stock hold, in the aggregate, the remaining 45.05% of the voting interest in its stock. Each holder of Class A or Class B common stock is entitled to one vote for each share held. Each holder of Class C or Class D common stock is entitled to 1/100th of one vote for each share held. The holders of Clearway, Inc.’s outstanding shares of Class A and Class C common stock are entitled to dividends as declared. Clearway, Inc., through its holdings of Class A units and Class C units, has been omitted from this reporta 57.01% economic interest in the Company. Clearway, Inc. consolidates the results of the Company through its controlling interest as sole managing member. GIP, through CEG's holdings of Class B units and Class D units, has a 42.99% economic interest in the Company.
Accordingly, through its voting control of Clearway, Inc., GIP effectively has the ability to control our management.
Related Party Transactions
Strategic Sponsorship with GIP
In connection with the GIP Transaction, Clearway, Inc. entered into a Consent and Indemnity Agreement with NRG and GIP setting forth key terms and conditions of Clearway, Inc.'s consent to the GIP Transaction.
Also, in connection with the GIP Transaction, the Company entered into the following agreements on August 31, 2018:
CEG Master Services Agreements
The Company, along with Clearway, Inc. and Clearway Energy Operating LLC, entered into Master Services Agreements with CEG (the “CEG Master Services Agreements”), pursuant to which CEG and certain of its affiliates or third-party service providers began providing certain services, including operational and administrative services, which include human resources, information systems, external affairs, accounting, procurement, and risk management services, to the Company and certain of its subsidiaries, and the Company and certain of its subsidiaries began providing certain services, including accounting, internal audit, tax and treasury services, to CEG, in exchange for the payment of fees in respect of such services. For the year ended December 31, 2019, the Company paid approximately $1,059,000 under the CEG Master Services Agreements. In addition, certain Thermal segment projects reimbursed CEG approximately $1,433,000 during the year ended December 31, 2019 for costs incurred by CEG on behalf of such entities.
Voting and Governance Agreement
The Company entered into a Voting and Governance Agreement with CEG, relating to certain governance matters of the Company, including the composition of the Board of Clearway, Inc. and employment status of the CEO of the Company.
Limited Liability Company Agreement
Clearway, Inc. entered into the Fourth Amended and Restated Limited Liability Company Agreement of Clearway Energy LLC with CEG, which sets forth the rights and obligations of Clearway, Inc., as managing member, and CEG, as member, of the Company as further described below.
Right of First Offer Agreements
CEG ROFO Agreement
On August 31, 2018, Clearway, Inc. entered into a ROFO Agreement with CEG (the “CEG ROFO Agreement”) and, solely for certain purposes thereof, GIP, pursuant to which CEG granted Clearway, Inc. and its subsidiaries a right of first offer on any proposed sale or transfer of certain assets owned by CEG. On August 1, 2019, the CEG ROFO Agreement was amended to grant Clearway, Inc. and its affiliates a right of first offer on any proposed sale, transfer or other disposition of certain assets of CEG (the “CEG ROFO Assets”) until August 31, 2023, as listed in the table below. CEG is not obligated to sell the remaining CEG ROFO Assets to us and, if offered by CEG, we cannot be sure whether these assets will be offered on acceptable terms or that we will choose to consummate such acquisitions.
The assets listed below represent our currently committed investments in projects with CEG, as well as the assets subject to our ROFO Agreement with CEG:
|
| | | | | | | | |
| Committed Investments |
| Asset | | Technology | | Net Capacity (MW) | | State | | COD |
$33 MM remaining in distributed and community solar partnerships(a) | | PV | | N/A | | Various | | Various |
| | | | | | | | | |
| CEG ROFO |
| Asset | | Technology | | Net Capacity (MW) | | State | | COD |
| Mililani I | | PV | | 39 | | HI | | 2021 |
| Waiawa | | PV | | 36 | | HI | | 2021 |
| Langford | | Wind | | 150 | | TX | | 2009 |
| Up to $170 MM equity investment in business renewables | | PV | | TBD | | Various | | TBD |
Rattlesnake(b) | | Wind | | 144 | | WA | | 2020 |
| Black Rock | | Wind | | 110 | | WV | | 2021 |
| Wildflower | | Solar | | 100 | | MS | | 2021 |
| Pinnacle Repowering | | Wind | | 55 | | WV | | 2020 |
(a)On December 26, 2018, we and CEG amended the DGPV Holdco 3 partnership agreement to increase the capital commitment of $50 million to $70 million.
(b) On January 8, 2020, CEG offered us the opportunity to acquire 100% of the equity interests in Rattlesnake.
Prior to engaging in any negotiation regarding any disposition, sale or other transfer of any of the remaining CEG ROFO Assets, CEG will deliver a written notice to us setting forth the material terms and conditions of the proposed transaction. During the 30‑day period after the delivery of such notice, we will negotiate with CEG in good faith to reach an agreement on the transaction. If we do not reach an agreement within such 30‑day period, CEG will be able within the next 180 calendar days to sell, transfer, dispose or recontract such CEG ROFO Asset to a third party (or to agree in writing to undertake such transaction with a third party) on terms generally no less favorable to CEG than those offered pursuant to the reduced disclosure formatwritten notice.
Under the CEG ROFO Agreement, CEG is not obligated to sell the remaining CEG ROFO Assets. In addition, any offer to sell under the CEG ROFO Agreement will be subject to an inherent conflict of interest because the same professionals within CEG’s organization that are involved in acquisitions that are suitable for us have responsibilities within CEG’s broader asset management business. Notwithstanding the significance of the services to be rendered by CEG or their designated affiliates on our behalf or of the assets which we may elect to acquire from CEG in accordance with the terms of the CEG ROFO Agreement or otherwise, CEG does not owe fiduciary duties to us or our unitholders. Any material transaction with CEG (including the proposed acquisition of any CEG ROFO Asset) will be subject to Clearway, Inc.’s related person transaction policy, which will require prior approval of such transaction by Clearway, Inc.’s Corporate Governance, Conflicts and Nominating Committee.
Carlsbad Drop Down
On December 6, 2019, the Company acquired 100% of GIP's membership interests in CBAD Holdings, LLC, which indirectly owns Carlsbad Energy Center LLC, a 527 megawatt natural gas fired power project located in Carlsbad, California, or the Carlsbad Drop Down Asset. The purchase price for the Carlsbad Drop Down was $184 million in cash, plus assumption of $803 million in project level financing including non-recourse senior secured notes. The acquisition was funded with proceeds from the Clearway Energy, Inc. equity issuance on December 2, 2019 for net proceeds of $100 million, as well as borrowings from the Company's revolving credit facility. The Carlsbad acquisition is the result of the Company having elected its option to purchase Carlsbad pursuant to the ROFO agreement, as amended, by and among Clearway, Inc., CEG and GIP.
Partnerships with CEG
DGPV Holdco 1 LLC
DGPV Holding LLC, our wholly‑owned subsidiary, and CEG are parties to the DGPV Holdco 1 LLC partnership (“DGPV Holdco 1”), the purpose of which is to own or purchase solar power generation projects and other ancillary related assets from CEG or its subsidiaries, via intermediate funds. The Company owns approximately 52 MW of distributed solar capacity, based on cash to be distributed, with a weighted average contract life of 16 years. Under this partnership, the Company committed to fund up to $100 million of capital.
DGPV Holdco 2 LLC
DGPV Holding LLC, our wholly‑owned subsidiary, and CEG are parties to the DGPV Holdco 2 LLC partnership (“DGPV Holdco 2”), the purpose of which is to own or purchase solar power generation projects as well as other ancillary related assets from CEG or its subsidiaries, via intermediate funds. The Company owns approximately 113 MW of distributed solar capacity, based on cash to be distributed, with a weighted average contract life of 19 years. Under this partnership, the Company committed to fund up to $60 million of capital.
DGPV Holdco 3 LLC
DGPV Holding LLC, our wholly‑owned subsidiary, and CEG are parties to the DGPV Holdco 3 LLC partnership (“DGPV Holdco 3”), in which the Company plans to invest up to $70 million in an operating portfolio of distributed solar assets, primarily comprised of community solar projects, developed by CEG. The Company owns approximately 112 MW of distributed solar capacity, based on cash to be distributed, with a weighted average contract life of approximately 21 years as of December 31, 2019. The Company had a $14 million payable due to DGPV Holdco 3 LLC as of December 31, 2019.
The Company’s maximum exposure to loss is limited to its equity investment in DGPV Holdco 1, DGPV Holdco 2 and DGPV Holdco 3, which was $318 million on a combined basis as of December 31, 2019.
RPV Holdco 1 LLC
RPV Holding LLC, our wholly‑owned subsidiary, and CEG are parties to the RPV Holdco 1 LLC partnership (“RPV Holdco”) that holds operating portfolios of residential solar assets developed by a subsidiary of CEG, including: (i) an existing, unlevered portfolio of approximately 2,100 leases across nine states representing approximately 14 MW, based on cash to be distributed, with a weighted average remaining lease term of approximately 13 years that was acquired outside the partnership; and (ii) a tax equity‑financed portfolios of approximately 5,300 leases representing approximately 31 MW, based on cash to be distributed, with an average lease term for the existing and new leases of approximately 15 years. The Company had fully funded the partnership as of December 31, 2017.
The Company’s maximum exposure to loss is limited to its equity investment, which was $24 million as of December 31, 2019.
Repowering Partnership
On August 30, 2018, Wind TE Holdco, an indirect subsidiary of the Company, formed a partnership with Clearway Renew LLC, an indirect subsidiary of CEG, in order to facilitate the repowering of wind facilities of two of its indirect subsidiaries, Elbow Creek Wind Project LLC, or Elbow Creek, and Wildorado Wind LLC, or Wildorado Wind. Wind TE Holdco contributed its interests in the two facilities and Clearway Renew LLC contributed a turbine supply agreement, including title to certain components that qualify for production tax credits.
On June 14, 2019, Repowering Partnership LLC was replaced with Repowering Partnership II LLC as the owner of the Elbow Creek and Wildorado Wind projects, as well as Repowering Partnership Holdco LLC. We invested $101.6 million in net corporate capital to fund the repowering of the wind facilities during the fourth quarter of 2019 and the first quarter of 2020. These assets have reached Repowering COD.
Kawailoa Solar Partnership
On May 1, 2019, the Company entered into a partnership with Clearway Renew LLC, a subsidiary of CEG, to own, finance, operate and maintain the Kawailoa Solar Partnership, which consists of the Kawailoa Solar Project, a 49 MW utility-
scale solar generation project located in Oahu, Hawaii. The Company contributed $9 million into the partnership during the year ended December 31, 2019.
Oahu Solar Partnership
On March 8, 2019, the Company entered into a partnership with Clearway Renew LLC, a subsidiary of CEG, to own, finance, operate and maintain the Oahu Solar projects, which consist of Lanikuhana and Waipio, 15 MW and 46 MW utility-scale solar generation projects, respectively, located in Oahu, Hawaii, which both reached COD in September 2019 and began to sell power to HECO pursuant to the long-term power purchase agreements. The Company contributed $20 million into the partnership during the year ended December 31, 2019.
Operations and Maintenance Agreements
CEG provides operations and maintenance (“O&M”) and day‑to‑day operational support to our utility scale solar and wind facilities in accordance with O&M agreements with us. Each of the counterparties to the O&M agreements is an affiliate of CEG. The O&M agreements for which the amount paid to CEG exceeded $120,000 during fiscal year 2019 are described in the table below. Under these O&M agreements, we generally pay an annual or monthly fee, which may be subject to annual adjustment, plus any reimbursable expenses.
|
| | | | | | |
| Project | | Agreement Description | | Approximate
Amount
Paid to
CEG |
| Utility‑Scale Solar | | | | |
Avenal | | O&M Agreement, dated January 31, 2011 | |
| $467,000 |
|
Borrego | | O&M Agreement, dated August 1, 2012 | |
| $311,000 |
|
Buckthorn Solar | | O&M Agreement, dated May 22, 2017 | |
| $214,000 |
|
CVSR | | O&M Agreement, dated September 30, 2011 | |
| $2,387,000 |
|
Kansas South | | O&M Agreement, dated June 13, 2017 | |
| $625,000 |
|
Solar Blythe | | O&M Agreement, dated November 1, 2017 | |
| $397,000 |
|
TA High Desert | | O&M Agreement, dated June 9, 2017 | |
| $534,000 |
|
| Wind | | | | |
Alta Wind X | | O&M Agreement, dated December 12, 2016 | |
| $1,412,000 |
|
Alta Wind XI | | O&M Agreement, dated December 12, 2016 | |
| $1,043,000 |
|
Alta Wind I | | O&M Agreement, dated December 12, 2016 | |
| $1,437,000 |
|
Alta Wind II | | O&M Agreement, dated December 12, 2016 | |
| $484,000 |
|
Alta Wind III | | O&M Agreement, dated December 12, 2016 | |
| $468,000 |
|
Alta Wind IV | | O&M Agreement, dated December 12, 2016 | |
| $327,000 |
|
Alta Wind V | | O&M Agreement, dated December 12, 2016 | |
| $452,000 |
|
Buffalo Bear | | O&M Agreement, dated May 1, 2016 | |
| $329,000 |
|
Crosswinds | | O&M Agreement, dated May 1, 2016 | |
| $343,000 |
|
Elbow Creek | | O&M Agreement, dated October 31, 2018 | |
| $1,300,000 |
|
Elkhorn Ridge | | O&M Agreement, dated May 9, 2008 | |
| $482,000 |
|
Forward | | O&M Agreement, dated October 20, 2016 | |
| $623,000 |
|
Goat Wind | | O&M Agreement, dated February 18, 2008 | |
| $1,999,000 |
|
Hardin | | O&M Agreement, dated May 1, 2016 | |
| $424,000 |
|
Laredo Ridge | | O&M Agreement, dated December 24, 2015 | |
| $946,000 |
|
Lookout | | O&M Agreement, dated February 11, 2008 | |
| $790,000 |
|
Odin | | O&M Agreement, dated September 16, 2016 | |
| $538,000 |
|
Pinnacle | | O&M Agreement, dated December 1, 2016 | |
| $1,446,000 |
|
San Juan Mesa | | O&M Agreement, dated December 27, 2005 | |
| $1,664,000 |
|
Sleeping Bear | | O&M Agreement, dated May 1, 2016 | |
| $1,343,000 |
|
Spanish Fork | | O&M Agreement, dated September 16, 2016 | |
| $399,000 |
|
South Trent | | Management O&M Agreement, dated October 1, 2015 | |
| $1,042,000 |
|
Taloga | | O&M Agreement, dated July 1, 2016 | |
| $2,485,000 |
|
Wildorado | | O&M Agreement, dated February 11, 2008 | |
| $1,728,000 |
|
Asset Management and Administrative Services Agreements
CEG provides day-to-day administrative support to certain of our project-level entities in accordance with asset management and administrative services agreements (the “ASAs”). The ASAs for which the amount involved exceeded $120,000 during fiscal year 2019 are described in the table below. Under these agreements, we generally pay an annual or monthly fee, which may be subject to annual adjustment, plus any reimbursable expenses.
|
| | | | | | |
| Project | | Agreement Description | | Approximate
Amount
Paid to CEG |
| Utility-Scale Solar | | | | |
Alpine | | Asset Management Agreement, dated March 15, 2012 | |
| $142,000 |
|
CVSR Holdco | | Asset Management Agreement, dated April 26, 2016 | |
| $195,000 |
|
Utah Solar Holdings LLC | | Master Management Agreement, dated March 27, 2017 | |
| $261,000 |
|
SPP Fund III | | Asset Management Agreement, dated October 31, 2017 | |
| $125,000 |
|
SPP P-IV Master Lessee | | Asset Management Agreement, dated July 12, 2012 | |
| $161,000 |
|
| Wind | | | | |
Buffalo Bear | | Amended and Restated Services Agreement, dated September 15, 2011 | |
| $164,000 |
|
Elbow Creek | | Project Administration Agreement, dated | |
| $556,000 |
|
Forward | | Services Agreement, dated January 1, 2012 | |
| $257,000 |
|
Laredo Ridge | | Support Services Agreement, dated May 27, 2010 | |
| $166,000 |
|
Lookout | | Services Agreement, dated January 1, 2012 | |
| $257,000 |
|
Wind TE Holdco LLC | | Services Agreement, dated November 3, 2014 | |
| $897,000 |
|
Pinnacle | | Amended and Restated Services Agreement, dated September 15, 2011 | |
| $177,000 |
|
Sleeping Bear | | Services Agreement, dated | |
| $257,000 |
|
South Trent | | Project Administration Agreement, dated October 1, 2015 | |
| $247,000 |
|
Spanish Fork | | Services Agreement, dated | |
| $257,000 |
|
Taloga | | Services Agreement, dated November 20, 2012 | |
| $164,000 |
|
Viento Funding II, Inc. | | Management and Administration Agreement, dated July 1, 2013 | |
| $134,000 |
|
Insurance Reimbursements
During 2019, we paid approximately $7,839,000 for insurance premium reimbursements to CEG.
Fourth Amended and Restated Limited Liability Company Agreement of Clearway Energy LLC
The following is a description of the material terms of Clearway Energy LLC’s Fourth Amended and Restated Limited Liability Company Agreement (the “LLC Agreement”). For the year ended December 31, 2019, the Company made approximately $86,344,000 in distributions to Clearway, Inc. and $68,382,000 to CEG (the holder of Class B and Class D units).
Governance
Clearway, Inc. serves as the sole managing member of the Company. As such, Clearway, Inc. and effectively Clearway, Inc.’s Board, control the business and affairs of the Company and are responsible for the management of our business.
Voting and Economic Rights of Members
We have four classes of Units: Class A units, Class B units, Class C units and Class D units. Class A units and Class C units may be issued only to Clearway, Inc. as the sole managing member, and Class B units and Class D units may be issued only to CEG and held by CEG or its permitted transferees. Units of each of the four classes have equivalent economic and other rights, except that upon issuance, each holder of a Class B unit will also be issued a share of our Class B common stock, and each holder of a Class D unit will also be issued a share of our Class D common stock. Each Class B unit is exchangeable for a share of our Class A common stock and each Class D unit is exchangeable for a share of our Class D common stock, in each case subject to equitable adjustments for stock splits, dividends and reclassifications in accordance with the terms of the Exchange Agreement (as described below).
Net profits and net losses and distributions by General Instruction Ithe Company are allocated and made to Form 10-K.holders of units in accordance with the respective number of membership units of the Company held. Generally, the Company will make distributions to holders
of units for the purpose of funding tax obligations in respect of income of the Company that is allocated to the members of the Company.
Clearway, Inc.’s Coordination with Clearway Energy LLC
Any time Clearway, Inc. issues a share of Class A common stock or a share of Class C common stock for cash, the net proceeds therefrom will promptly be transferred to us, and we will either:
transfer a newly issued Class A unit of the Company to Clearway, Inc. in the case of the issuance of a share of Class A common stock, or a newly issued Class C unit of the Company to Clearway, Inc. in the case of the issuance of a share of Class C common stock; or
use the net proceeds to purchase a Class B unit of the Company from CEG in the case of the issuance of a share of Class A common stock, which Class B unit will automatically convert into a Class A unit of the Company when transferred to Clearway, Inc., or a Class D unit of the Company from CEG in the case of the issuance of a share of Class C common stock, which Class D unit will automatically convert into a Class C unit of the Company when transferred to Clearway, Inc.
If Clearway, Inc. elects to redeem any shares of their Class A common stock or Class C common stock for cash, the Company will, immediately prior to such redemption, redeem an equal number of Class A units or Class C units, as applicable, held by Clearway, Inc. upon the same terms and for the same price, as the shares of Class A common stock so redeemed.
Exchange Agreement
Clearway, Inc. entered into an Amended and Restated Exchange Agreement with NRG (the “Exchange Agreement”), which was assigned to CEG upon the GIP Transaction. Under the Exchange Agreement, CEG (and certain permitted assignees and permitted transferees who acquire Class B units or Class D units of the Company) may from time to time cause us to exchange their Class B units for shares of Clearway, Inc.’s Class A common stock on a one‑for‑one basis, subject to adjustments for stock splits, stock dividends and reclassifications, or exchange their Class D units for shares of Clearway, Inc.’s Class C common stock on a one‑for‑one basis, subject to equitable adjustments for stock splits, stock dividends and reclassifications.
When CEG or its permitted transferee exchanges a Class B unit of the Company for a share of Clearway, Inc.’s Class A common stock, Clearway, Inc. will automatically redeem and cancel a corresponding share of their Class B common stock and the Class B unit will automatically convert into a Class A unit when issued to Clearway, Inc.; similarly, when CEG or its permitted transferee exchanges a Class D unit of the Company for a share of Clearway, Inc.’s Class C common stock, Clearway, Inc. will automatically redeem and cancel a corresponding share of their Class D common stock and the Class D unit will automatically convert into a Class C unit when issued to Clearway, Inc. As a result, when a holder exchanges its Class B units for shares of Clearway, Inc.’s Class A common stock, or its Class D units for shares of Clearway, Inc.’s Class C common stock, Clearway, Inc.’s interest in the Company will be correspondingly increased.
Registration Rights Agreement
Clearway, Inc. entered into an Amended and Restated Registration Rights Agreement with NRG (the “Registration Rights Agreement”), which was assigned to CEG upon the GIP Transaction. Under the Registration Rights Agreement, CEG and its affiliates are entitled to demand registration rights, including the right to demand that a shelf registration statement be filed, and “piggyback” registration rights, for shares of Clearway, Inc.’s Class A common stock that are issuable upon exchange of Class B units of the Company that CEG owns and shares of Clearway, Inc.’s Class C common stock that are issuable upon exchange of the Class D units of the Company that CEG owns.
Indemnification of Officers
Clearway, Inc. has entered into indemnification agreements with each of our executive officers. The indemnification agreements provide the executive officers with contractual rights to indemnification, expense advancement and reimbursement, to the fullest extent permitted under Delaware law.
Procedures for Review, Approval and Ratification of Related Person Transactions; Conflicts of Interest
The Company does not have a separate policy regarding related party transactions, as all of its officers are subject to the written Related Person Transaction Policy (the “Related Person Policy”) adopted by Clearway, Inc.’s Board. The Related Person
Policy provides that the Corporate Governance, Conflicts and Nominating Committee of the Board will periodically review all related person transactions that are required to be disclosed under SEC rules and, when appropriate, initially authorize or ratify all such transactions.
The Related Person Policy operates in conjunction with Clearway, Inc.’s Code of Conduct and is applicable to all “Related Person Transactions”, which are all transactions, arrangements or relationships in which:
the aggregate amount involved will or may be expected to exceed $50,000 in any calendar year;
Clearway, Inc. is a participant; and
any Related Person (as that term is defined below) has or will have a direct or indirect interest.
A “Related Person” is:
any person who is, or at any time during the applicable period was, a director of Clearway, Inc. or a nominee for director or an executive officer;
any person who is known to Clearway, Inc.to be the beneficial owner of more than 5% of any class of Clearway, Inc.’s voting stock;
any immediate family member of any of the persons referenced in the preceding two bullets, which means any child, stepchild, parent, stepparent, spouse, sibling, mother‑in‑law, father‑in‑law, son‑in‑law, daughter‑in‑law, brother‑in‑law or sister‑in‑law of the director, nominee for director, executive officer or more than 5% beneficial owner of any class of Clearway, Inc.’s voting stock, and any person (other than a tenant or employee) sharing the household of such director, nominee for director, executive officer or more than 5% beneficial owner of any class of Clearway, Inc.’s voting stock; and
any firm, corporation or other entity in which any of the foregoing persons is a partner or principal or in a similar position or in which such person has a 10% or greater beneficial ownership interest.
In determining whether to recommend the initial approval or ratification of a Related Person Transaction, the Corporate Governance, Conflicts and Nominating Committee considers all of the relevant facts and circumstances available, including (if applicable) but not limited to: (a) whether there is an appropriate business justification for the transaction; (b) the benefits that accrue to us as a result of the transaction; (c) the terms available to unrelated third parties entering into similar transactions; (d) the impact of the transaction on director independence (in the event the related person is a director, an immediate family member of a director or an entity in which a director or an immediate family member of a director is a partner, stockholder, member or executive officer); (e) the availability of other sources for comparable products or services; (f) whether it is a single transaction or a series of ongoing, related transactions; and (g) whether entering into the transaction would be consistent with the Related Person Transaction Policy.
If the aggregate amount involved is expected to be less than $500,000, the transaction may be approved or ratified by the Chair of the Corporate Governance, Conflicts and Nominating Committee.
As part of its review of each Related Person Transaction, the Corporate Governance, Conflicts and Nominating Committee will take into account, among other factors it deems appropriate, whether the transaction is on terms no less favorable than the terms generally available to an unaffiliated third‑party under the same or similar circumstances and the extent of the Related Person’s interest in the transaction. This Related Person Policy also provides that certain transactions, based on their nature and/or monetary amount, are deemed to be pre‑approved or ratified by the Corporate Governance, Conflicts and Nominating Committee and do not require separate approval or ratification.
Transactions involving ongoing relationships with a Related Person will be reviewed and assessed at least annually by the Corporate Governance, Conflicts and Nominating Committee to ensure that such Related Person Transactions remain appropriate and in compliance with the Committee’s guidelines.
The Committee’s activities with respect to the review and approval or ratification of all Related Person Transactions are reported periodically to the Board. Any transaction between us and any Related Person, including CEG, will be subject to the prior review and approval of the Corporate Governance, Conflicts and Nominating Committee.
Item 14 — Principal Accounting Fees and Services
Audit and Nonaudit Fees
The following table presents fees for professional services rendered by KPMG LLP, the Company's principal independent registered public accounting firm, for the years ended December 31, 20182019 and December 31, 2017.2018.
| | | | Year Ended December 31, | Year Ended December 31, |
| | 2018 | | 2017 | 2019 | | 2018 |
| Audit Fees | $ | 1,682,000 |
| | $ | 1,916,700 |
| $ | 3,279,000 |
| | $ | 1,682,000 |
|
| Audit-Related Fees | — |
| | — |
| — |
| | — |
|
| Tax Fees | 14,800 |
| | 12,700 |
| 857,840 |
| | 14,800 |
|
| All Other Fees | — |
| | — |
| — |
| | — |
|
| Total | $ | 1,696,800 |
| | $ | 1,929,400 |
| $ | 4,136,840 |
| | $ | 1,696,800 |
|
Audit Fees
For 20182019 and 20172018 audit services, KPMG LLP billed the Company approximately $1,682,000$3,279,000 and $1,916,700,$1,682,000, respectively, for the audit of the Company’s consolidated financial statements and the review of the Company’s quarterly consolidated financial statements on Form 10-Q that are customary under the standards of the Public Company Accounting Oversight Board (United States), and in connection with statutory audits.
Audit-Related Fees
There were no audit-related fees billed to the Company by KPMG LLP for 20182019 or 2017.2018.
Tax Fees
There were approximately $857,840 in tax fees billed to the Company by KPMG LLP for 2019, relating mainly to compliance work. There were approximately $14,800 in tax fees billed to the Company by KPMG LLP for 2018, relating mainly to compliance work. There were approximately $12,700 in tax fees billed to the Company by KPMG LLP for 2017.2018.
All Other Fees
There were no other fees billed to the Company by KPMG LLP for 20182019 or 2017.
2018.
Policy on Audit Committee Pre-approval
The Audit Committee of Clearway Energy, Inc. is responsible for appointing, setting compensation for, and overseeing the work of the independent registered public accounting firm of the Company. The Audit Committee of Clearway Energy, Inc. has established a policy regarding pre-approval of all audit and permissible nonaudit services provided by the independent registered public accounting firm of the Company.
The Audit Committee of Clearway Energy, Inc. will annually review and pre-approve services that are expected to be provided by the independent registered public accounting firm. The term of the pre-approval will be 12 months from the date of the pre-approval, unless the Audit Committee of Clearway Energy, Inc. approves a shorter time period. The Audit Committee may periodically amend and/or supplement the pre-approved services based on subsequent determinations.
Unless the Audit Committee of Clearway Energy, Inc. has pre-approved Audit Services or a specified category of nonaudit services, any engagement to provide such services must be pre-approved by the Audit Committee of Clearway Energy, Inc. if it is to be provided by the independent registered public accounting firm. The Audit Committee of Clearway Energy, Inc. must also pre-approve any proposed services exceeding the pre-approved budgeted fee levels for a specified type of service.
The Audit Committee of Clearway Energy, Inc. has authorized its Chair to pre-approve services in amounts up to $100,000 per engagement. Engagements exceeding $100,000 must be approved by the full Audit Committee of Clearway Energy, Inc. Engagements pre-approved by the Chair are reported to the Audit Committee of Clearway Energy, Inc. at its next scheduled meeting.
PART IV
Item 15 — Exhibits, Financial Statement Schedules
(a)(1) Financial Statements
The following consolidated financial statements of Clearway Energy LLC and related notes thereto, together with the reports thereon of KPMG LLP, are included herein:
Consolidated Statements of Operations — Years ended December 31, 20182019, 20172018 and 20162017
Consolidated Statements of Comprehensive (Loss) Income — Years ended December 31, 20182019, 20172018 and 20162017
Consolidated Balance Sheets — As of December 31, 20182019 and 20172018
Consolidated Statements of Cash Flows — Years ended December 31, 20182019, 20172018 and 20162017
Consolidated Statements of Members' Equity — Years ended December 31, 20182019, 20172018 and 20162017
Notes to Consolidated Financial Statements
(a)(2) Not applicable
(a)(3) Exhibits: See Exhibit Index submitted as a separate section of this report
(b) Exhibits
See Exhibit Index submitted as a separate section of this report
(c) Not applicable
Report of Independent Registered Public Accounting Firm
TheTo the Members
Clearway Energy LLC:
Opinion on the Consolidated Financial Statements
We have audited the accompanying consolidated balance sheets of Clearway Energy LLC (and subsidiaries)and subsidiaries (the Company) as of December 31, 20182019 and 2017,2018, the related consolidated statements of operations, comprehensive (loss) income, stockholders’members’ equity, and cash flows for each of the years in the three‑year period ended December 31, 2018,2019, and the related notes (collectively, the consolidated financial statements). In our opinion, the consolidated financial statements present fairly, in all material respects, the financial position of the Company as of December 31, 20182019 and 2017,2018, and the results of its operations and its cash flows for each of the years in the three‑year period ended December 31, 2018,2019, in conformity with U.S. generally accepted accounting principles.
Change
Changes in Accounting Principle
As discussed in Note 2 to the consolidated financial statements, effective January 1, 2018, the Company adopted the guidance in Accounting Standards Codification Topic 606, has changed its method of accounting for Revenue from Contracts with Customers, and related amendments. as of January 1, 2018 due to the adoption of Topic 606.
As discussed in Note 2 to the consolidated financial statements, the Company has changed its method of accounting for Leases as of January 1, 2019 due to the adoption of Topic 842.
Basis for Opinion
These consolidated financial statements are the responsibility of the Company’s management. Our responsibility is to express an opinion on these consolidated financial statements based on our audits. We are a public accounting firm registered with the Public Company Accounting Oversight Board (United States) (PCAOB) and are required to be independent with respect to the Company in accordance with the U.S. federal securities laws and the applicable rules and regulations of the Securities and Exchange Commission and the PCAOB.
We conducted our audits in accordance with the standards of the PCAOB. Those standards require that we plan and perform the audit to obtain reasonable assurance about whether the consolidated financial statements are free of material misstatement, whether due to error or fraud. The Company is not required to have, nor were we engaged to perform, an audit of its internal control over financial reporting. As part of our audits, we are required to obtain an understanding of internal control over financial reporting but not for the purpose of expressing an opinion on the effectiveness of the Company’s internal control over financial reporting. Accordingly, we express no such opinion.
Our audits included performing procedures to assess the risks of material misstatement of the consolidated financial statements, whether due to error or fraud, and performing procedures that respond to those risks. Such procedures included examining, on a test basis, evidence regarding the amounts and disclosures in the consolidated financial statements. Our audits also included evaluating the accounting principles used and significant estimates made by management, as well as evaluating the overall presentation of the consolidated financial statements. We believe that our audits provide a reasonable basis for our opinion.
Critical Audit Matter
The critical audit matter communicated below is a matter arising from the current period audit of the consolidated financial statements that was communicated or required to be communicated to the audit committee and that: (1) relates to accounts or disclosures that are material to the consolidated financial statements and (2) involved our especially challenging, subjective, or complex judgment. The communication of a critical audit matter does not alter in any way our opinion on the consolidated financial statements, taken as a whole, and we are not, by communicating the critical audit matter below, providing a separate opinion on the critical audit matter or on the accounts or disclosures to which it relates.
Evaluation over the impairment of long-lived assets
As discussed in Notes 2 and 9 to the consolidated financial statements, long-lived assets that are held and used are reviewed for impairment whenever events or changes in circumstances indicate their carrying value may not be recoverable. Recoverability of assets to be held and used is measured by a comparison of the carrying amount of the assets to the
future net cash flows expected to be generated by the asset, through considering project specific assumptions for contracted energy prices, long-term forecasted energy prices, forecasted generation, future project operating costs, future capital expenditures and expected plant operations. An impairment loss is recognized if the total future undiscounted cash flows expected from an asset are less than its carrying value. An impairment charge is measured as the difference between the asset’s carrying value and its fair value. Generally, fair value is determined using valuation techniques such as the present value of expected future cash flows or comparable values determined by transactions in the market. The Company uses its best estimates in making these evaluations and considers various factors, including forward price curves for energy, forecasted generation, future project operating costs, future capital expenditures, expected plant operations and discount rates.
We identified the evaluation over the impairment of certain long-lived assets as a critical audit matter. This was due to the especially subjective auditor judgment in evaluating the forecasted energy prices used in the Company’s undiscounted cash flow estimation model. Specifically, for certain asset groups tested for impairment, the forecasted energy prices used in the undiscounted cash flow estimation models were challenging to evaluate as small changes to this assumption could have a significant effect on the Company’s projected future undiscounted cash flows of long-lived assets.
The primary procedures we performed to address this critical audit matter included the following. We tested certain internal controls over the Company’s selection of forecasted energy prices used in impairment testing. We involved a valuation professional with specialized skills and knowledge, who assisted in evaluating the forecasted energy prices determined by the Company. Our valuation professional evaluated the energy price curves utilized by the Company by comparing them to energy price curves prepared by reputable third-party vendors that provide energy price forecasts in the applicable power markets.
(signed) KPMG LLP
We have served as the Company’s auditor since 2012.
Philadelphia, Pennsylvania
February 28, 2019March 2, 2020
CLEARWAY ENERGY LLC
CONSOLIDATED STATEMENTS OF OPERATIONS
|
| | | | | | | | | | | |
| | Year ended December 31, |
| (In millions) | 2019 | | 2018 | | 2017 |
| Operating Revenues | | | | | |
| Total operating revenues | $ | 1,032 |
| | $ | 1,053 |
| | $ | 1,009 |
|
| Operating Costs and Expenses | | | | | |
| Cost of operations | 342 |
| | 332 |
| | 326 |
|
| Depreciation and amortization | 396 |
| | 331 |
| | 334 |
|
| Impairment losses | 33 |
| | — |
| | 44 |
|
| General and administrative | 27 |
| | 20 |
| | 19 |
|
| Transaction and integration costs | 3 |
| | 20 |
| | 3 |
|
| Development costs | 5 |
| | 3 |
| | — |
|
| Total operating costs and expenses | 806 |
| | 706 |
| | 726 |
|
| Operating Income | 226 |
| | 347 |
| | 283 |
|
| Other Income (Expense) | | | | | |
| Equity in earnings of unconsolidated affiliates | 83 |
| | 74 |
| | 71 |
|
| Other income, net | 9 |
| | 8 |
| | 4 |
|
| Loss on debt extinguishment | (16 | ) | | — |
| | (3 | ) |
| Interest expense, net | (403 | ) | | (294 | ) | | (294 | ) |
| Total other expense, net | (327 | ) | | (212 | ) | | (222 | ) |
| Net (Loss) Income | (101 | ) | | 135 |
| | 61 |
|
| Less: Net loss attributable to noncontrolling interests | (71 | ) | | (105 | ) | | (75 | ) |
| Net (Loss) Income Attributable to Clearway Energy LLC | $ | (30 | ) | | $ | 240 |
| | $ | 136 |
|
|
| | | | | | | | | | | |
| | Year ended December 31, |
| (In millions) | 2018 | | 2017 (a) | | 2016 (a) |
| Operating Revenues | | | | | |
| Total operating revenues | $ | 1,053 |
| | $ | 1,009 |
| | $ | 1,035 |
|
| Operating Costs and Expenses | | | | | |
| Cost of operations | 332 |
| | 326 |
| | 308 |
|
| Depreciation and amortization | 331 |
| | 334 |
| | 303 |
|
| Impairment losses | — |
| | 44 |
| | 185 |
|
| General and administrative | 20 |
| | 19 |
| | 14 |
|
| Acquisition-related transaction and integration costs | 20 |
| | 3 |
| | 1 |
|
| Development costs | 3 |
| | — |
| | — |
|
| Total operating costs and expenses | 706 |
| | 726 |
| | 811 |
|
| Operating Income | 347 |
| | 283 |
| | 224 |
|
| Other Income (Expense) | | | | | |
| Equity in earnings of unconsolidated affiliates | 74 |
| | 71 |
| | 60 |
|
| Other income, net | 8 |
| | 4 |
| | 3 |
|
| Loss on debt extinguishment | — |
| | (3 | ) | | — |
|
| Interest expense | (294 | ) | | (294 | ) | | (272 | ) |
| Total other expense, net | (212 | ) | | (222 | ) | | (209 | ) |
| Net Income | 135 |
| | 61 |
| | 15 |
|
| Less: Net loss attributable to noncontrolling interests | (105 | ) | | (75 | ) | | (111 | ) |
| Net Income Attributable to Clearway Energy LLC | $ | 240 |
| | $ | 136 |
| | $ | 126 |
|
(a) Retrospectively adjusted as discussed in Note 1, Nature of Business.
See accompanying notes to consolidated financial statements.
CLEARWAY ENERGY LLC
CONSOLIDATED STATEMENTS OF COMPREHENSIVE (LOSS) INCOME
|
| | | | | | | | | | | |
| | Year ended December 31, |
| | 2019 | | 2018 | | 2017 |
| (In millions) | | | | | |
| Net (Loss) Income | $ | (101 | ) | | $ | 135 |
| | $ | 61 |
|
| Other Comprehensive Income (Loss) | | | | | |
| Unrealized gain on derivatives | 8 |
| | 24 |
| | 17 |
|
| Other comprehensive income | 8 |
| | 24 |
| | 17 |
|
| Comprehensive (Loss) Income | (93 | ) | | 159 |
| | 78 |
|
| Less: Comprehensive loss attributable to noncontrolling interests | (70 | ) | | (105 | ) | | (75 | ) |
| Comprehensive (Loss) Income Attributable to Clearway Energy LLC | $ | (23 | ) | | $ | 264 |
| | $ | 153 |
|
|
| | | | | | | | | | | |
| | Year ended December 31, |
| | 2018 | | 2017 (a) | | 2016 (a) |
| (In millions) | | | | | |
| Net Income | $ | 135 |
| | $ | 61 |
| | $ | 15 |
|
| Other Comprehensive Income (Loss) | | | | | |
| Unrealized gain (loss) on derivatives | 24 |
| | 17 |
| | 13 |
|
| Other comprehensive income (loss) | 24 |
| | 17 |
| | 13 |
|
| Comprehensive Income | 159 |
| | 78 |
| | 28 |
|
| Less: Comprehensive loss attributable to noncontrolling interests | (105 | ) | | (75 | ) | | (111 | ) |
| Comprehensive Income Attributable to Clearway Energy LLC | $ | 264 |
| | $ | 153 |
| | $ | 139 |
|
(a) Retrospectively adjusted as discussed in Note 1, Nature of Business.
See accompanying notes to consolidated financial statements.
CLEARWAY ENERGY LLC
CONSOLIDATED BALANCE SHEETS
|
| | | | | | | |
| | December 31, 2019 | | December 31, 2018 |
| ASSETS | (In millions) |
| Current Assets | | | |
| Cash and cash equivalents | $ | 152 |
| | $ | 407 |
|
| Restricted cash | 262 |
| | 176 |
|
| Accounts receivable — trade | 116 |
| | 104 |
|
| Accounts receivable — affiliates | 2 |
| | 5 |
|
| Inventory | 40 |
| | 40 |
|
| Prepayments and other current assets | 33 |
| | 29 |
|
| Total current assets | 605 |
| | 761 |
|
| Property, plant and equipment, net | 6,063 |
| | 5,245 |
|
| Other Assets | | | |
| Equity investments in affiliates | 1,183 |
| | 1,172 |
|
| Intangible assets, net | 1,428 |
| | 1,156 |
|
| Derivative instruments | — |
| | 8 |
|
| Right-of-use assets, net | 223 |
| | — |
|
| Other non-current assets | 103 |
| | 106 |
|
| Total other assets | 2,937 |
| | 2,442 |
|
| Total Assets | $ | 9,605 |
| | $ | 8,448 |
|
| LIABILITIES AND MEMBERS' EQUITY | | | |
| Current Liabilities | | | |
| Current portion of long-term debt — external | $ | 1,780 |
| | $ | 314 |
|
| Current portion of long-term debt — affiliate | 44 |
| | 215 |
|
| Accounts payable — trade | 73 |
| | 45 |
|
| Accounts payable — affiliate | 33 |
| | 20 |
|
| Derivative instruments | 16 |
| | 4 |
|
| Accrued interest expense | 41 |
| | 44 |
|
| Accrued expenses and other current liabilities | 71 |
| | 57 |
|
| Total current liabilities | 2,058 |
| | 699 |
|
| Other Liabilities | | | |
| Long-term debt — external | 4,956 |
| | 5,404 |
|
| Long-term debt — affiliate | — |
| | 44 |
|
| Derivative instruments | 76 |
| | 17 |
|
| Long-term lease liabilities | 227 |
| | — |
|
| Other non-current liabilities | 115 |
| | 102 |
|
| Total non-current liabilities | 5,374 |
| | 5,567 |
|
| Total Liabilities | 7,432 |
| | 6,266 |
|
| Commitments and Contingencies | — |
| | — |
|
| Members' Equity | | | |
| Contributed capital | 1,882 |
| | 1,940 |
|
| Retained earnings | 5 |
| | 86 |
|
| Accumulated other comprehensive loss | (37 | ) | | (44 | ) |
| Noncontrolling interest | 323 |
| | 200 |
|
| Total Members' Equity | 2,173 |
| | 2,182 |
|
| Total Liabilities and Members’ Equity | $ | 9,605 |
| | $ | 8,448 |
|
|
| | | | | | | |
| | December 31, 2018 | | December 31, 2017 (a) |
| ASSETS | (In millions) |
| Current Assets | | | |
| Cash and cash equivalents | $ | 407 |
| | $ | 146 |
|
| Restricted cash | 176 |
| | 168 |
|
| Accounts receivable — trade | 104 |
| | 95 |
|
| Accounts receivable — affiliates | 5 |
| | 1 |
|
| Inventory | 40 |
| | 39 |
|
| Notes receivable — current | — |
| | 13 |
|
| Prepayments and other current assets | 29 |
| | 19 |
|
| Total current assets | 761 |
| | 481 |
|
| Property, plant and equipment, net | 5,245 |
| | 5,410 |
|
| Other Assets | | | |
| Equity investments in affiliates | 1,172 |
| | 1,178 |
|
| Intangible assets, net | 1,156 |
| | 1,228 |
|
| Derivative instruments | 8 |
| | 1 |
|
| Other non-current assets | 106 |
| | 62 |
|
| Total other assets | 2,442 |
| | 2,469 |
|
| Total Assets | $ | 8,448 |
| | $ | 8,360 |
|
| LIABILITIES AND MEMBERS' EQUITY | | | |
| Current Liabilities | | | |
| Current portion of long-term debt — external | $ | 314 |
| | $ | 339 |
|
| Current portion of long-term debt — affiliate | 215 |
| | — |
|
| Accounts payable — trade | 45 |
| | 46 |
|
| Accounts payable — affiliate | 20 |
| | 49 |
|
| Derivative instruments | 4 |
| | 18 |
|
| Accrued interest expense | 44 |
| | 38 |
|
| Accrued expenses and other current liabilities | 57 |
| | 49 |
|
| Total current liabilities | 699 |
| | 539 |
|
| Other Liabilities | | | |
| Long-term debt — external | 5,404 |
| | 5,049 |
|
| Long-term debt — affiliate | 44 |
| | 618 |
|
| Derivative instruments | 17 |
| | 31 |
|
| Other non-current liabilities | 102 |
| | 94 |
|
| Total non-current liabilities | 5,567 |
| | 5,792 |
|
| Total Liabilities | 6,266 |
| | 6,331 |
|
| Commitments and Contingencies | — |
| | — |
|
| Members' Equity | | | |
| Contributed capital | 1,940 |
| | 1,919 |
|
| Retained earnings | 86 |
| | 16 |
|
| Accumulated other comprehensive loss | (44 | ) | | (68 | ) |
| Noncontrolling interest | 200 |
| | 162 |
|
| Total Members' Equity | 2,182 |
| | 2,029 |
|
| Total Liabilities and Members’ Equity | $ | 8,448 |
| | $ | 8,360 |
|
(a) Retrospectively adjusted as discussed in Note 1, Nature of Business.
See accompanying notes to consolidated financial statements.
CLEARWAY ENERGY LLC
CONSOLIDATED STATEMENTS OF CASH FLOWS
|
| | | | | | | | | | | |
| | Year ended December 31, |
| | 2019 | | 2018 | | 2017 |
| | (In millions) |
| Cash Flows from Operating Activities | | | | | |
| Net (loss) income | $ | (101 | ) | | $ | 135 |
| | $ | 61 |
|
| Adjustments to reconcile net income to net cash provided by operating activities: | | | | | |
| Equity in earnings of unconsolidated affiliates | (83 | ) | | (74 | ) | | (71 | ) |
| Distributions from unconsolidated affiliates | 34 |
| | 70 |
| | 72 |
|
| Depreciation and amortization | 396 |
| | 331 |
| | 334 |
|
| Amortization of financing costs | 15 |
| | 13 |
| | 13 |
|
| Amortization of intangibles and out-of-market contracts | 71 |
| | 70 |
| | 70 |
|
| Loss on debt extinguishment | 16 |
| | — |
| | 3 |
|
| Right-of-use asset amortization | 7 |
| | — |
| | — |
|
| Impairment losses | 33 |
| | — |
| | 44 |
|
| Changes in derivative instruments | 85 |
| | (16 | ) | | (15 | ) |
| Loss on disposal of asset components | 9 |
| | — |
| | 16 |
|
| Cash provided by (used in) changes in other working capital: | | | | | |
| Changes in prepaid and accrued capacity payments | 1 |
| | — |
| | (4 | ) |
| Changes in other working capital | (14 | ) | | (37 | ) | | (6 | ) |
| Net Cash Provided by Operating Activities | 469 |
| | 492 |
| | 517 |
|
| Cash Flows from Investing Activities | | | | | |
| Acquisition of assets | (100 | ) | | (11 | ) | | — |
|
| Partnership interest acquisition | (29 | ) | | — |
| | — |
|
| Acquisition of Drop Down Assets, net of cash acquired | (161 | ) | | (126 | ) | | (250 | ) |
| Capital expenditures | (228 | ) | | (83 | ) | | (190 | ) |
| Buyout of Wind TE Holdco non-controlling interest | (19 | ) | | — |
| | — |
|
| Cash receipts from notes receivable | — |
| | 13 |
| | 17 |
|
| Return of investment from unconsolidated affiliates | 56 |
| | 45 |
| | 47 |
|
| Investments in unconsolidated affiliates | (13 | ) | | (34 | ) | | (73 | ) |
| Proceeds from sale of HSD Solar Holdings, LLC assets | 20 |
| | — |
| | — |
|
| Other | 6 |
| | 11 |
| | 7 |
|
| Net Cash Used in Investing Activities | (468 | ) | | (185 | ) | | (442 | ) |
| Cash Flows from Financing Activities | | | | | |
| Net contributions from noncontrolling interests | 174 |
| | 91 |
| | 13 |
|
| Net distributions and return of capital to NRG prior to the acquisition of Drop Down Assets | — |
| | — |
| | (23 | ) |
| Proceeds from the issuance of class C units | 100 |
| | 153 |
| | 33 |
|
| Payments of distributions | (155 | ) | | (238 | ) | | (202 | ) |
| Proceeds from the revolving credit facility | 152 |
| | 35 |
| | 55 |
|
| Payments for the revolving credit facility | (152 | ) | | (90 | ) | | — |
|
| Proceeds from issuance of long-term debt — external | 1,215 |
| | 827 |
| | 210 |
|
| Payments of debt issuance costs | (25 | ) | | (14 | ) | | (12 | ) |
| Payments for long-term debt — external | (1,264 | ) | | (443 | ) | | (332 | ) |
| Payments for long-term debt — affiliate | (215 | ) | | (359 | ) | | — |
|
| Net Cash Used in Financing Activities | (170 | ) | | (38 | ) | | (258 | ) |
| Net (Decrease) Increase in Cash, Cash Equivalents and Restricted Cash | (169 | ) | | 269 |
| | (183 | ) |
| Cash, Cash Equivalents and Restricted Cash at Beginning of Period | 583 |
| | 314 |
| | 497 |
|
| Cash, Cash Equivalents and Restricted Cash at End of Period | $ | 414 |
| | $ | 583 |
| | $ | 314 |
|
| | | | | | |
| Supplemental Disclosures | | | | | |
| Interest paid, net of amount capitalized | $ | (307 | ) | | $ | (292 | ) | | $ | (297 | ) |
| Non-cash investing and financing activities: | | | | | |
| (Reductions) Additions to fixed assets for accrued capital expenditures | (2 | ) | | (15 | ) | | 22 |
|
| Non-cash contributions from CEG, NRG, net of distributions | $ | 35 |
| | $ | 36 |
| | $ | (2 | ) |
|
| | | | | | | | | | | |
| | Year ended December 31, |
| | 2018 | | 2017 (a) | | 2016 (a) |
| | (In millions) |
| Cash Flows from Operating Activities | | | | | |
| Net income | $ | 135 |
| | $ | 61 |
| | $ | 15 |
|
| Adjustments to reconcile net income to net cash provided by operating activities: | | | | | |
| Equity in earnings of unconsolidated affiliates | (74 | ) | | (71 | ) | | (60 | ) |
| Distributions from unconsolidated affiliates | 70 |
| | 72 |
| | 58 |
|
| Depreciation and amortization | 331 |
| | 334 |
| | 303 |
|
| Amortization of financing costs | 13 |
| | 13 |
| | 8 |
|
| Amortization of intangibles and out-of-market contracts | 70 |
| | 70 |
| | 76 |
|
| Loss on debt extinguishment | — |
| | 3 |
| | — |
|
| Impairment losses | — |
| | 44 |
| | 185 |
|
| Changes in derivative instruments | (16 | ) | | (15 | ) | | (15 | ) |
| (Gain) loss on disposal of asset components | — |
| | 16 |
| | 6 |
|
| Cash provided by (used in) changes in other working capital: | | | | | |
| Changes in prepaid and accrued capacity payments | — |
| | (4 | ) | | (8 | ) |
| Changes in other working capital | (37 | ) | | (6 | ) | | 9 |
|
| Net Cash Provided by Operating Activities | 492 |
| | 517 |
| | 577 |
|
| Cash Flows from Investing Activities | | | | | |
| Acquisition of business | (11 | ) | | — |
| | — |
|
| Acquisition of Drop Down Assets, net of cash acquired | (126 | ) | | (250 | ) | | (77 | ) |
| Capital expenditures | (83 | ) | | (190 | ) | | (20 | ) |
| Cash receipts from notes receivable | 13 |
| | 17 |
| | 17 |
|
| Return of investment from unconsolidated affiliates | 45 |
| | 47 |
| | 28 |
|
| Investments in unconsolidated affiliates | (34 | ) | | (73 | ) | | (83 | ) |
| Other | 11 |
| | 7 |
| | 4 |
|
| Net Cash Used in Investing Activities | (185 | ) | | (442 | ) | | (131 | ) |
| Cash Flows from Financing Activities | | | | | |
| Net contributions from noncontrolling interests | 106 |
| | 13 |
| | 5 |
|
| Net distributions and return of capital to NRG prior to the acquisition of Drop Down Assets | — |
| | (23 | ) | | (184 | ) |
| Proceeds from the issuance of class C units | 153 |
| | 33 |
| | — |
|
| Payments of distributions | (253 | ) | | (202 | ) | | (173 | ) |
| Proceeds from the revolving credit facility | 35 |
| | 55 |
| | 60 |
|
| Payments for the revolving credit facility | (90 | ) | | — |
| | (366 | ) |
| Proceeds from issuance of long-term debt — external | 827 |
| | 210 |
| | 740 |
|
| Payments of debt issuance costs | (14 | ) | | (12 | ) | | (15 | ) |
| Payments for long-term debt — external | (443 | ) | | (332 | ) | | (269 | ) |
| Payments for long-term debt — affiliate | (359 | ) | | — |
| | — |
|
| Net Cash Used in Financing Activities | (38 | ) | | (258 | ) | | (202 | ) |
| Net Increase (Decrease) in Cash, Cash Equivalents and Restricted Cash | 269 |
| | (183 | ) | | 244 |
|
| Cash, Cash Equivalents and Restricted Cash at Beginning of Period | 314 |
| | 497 |
| | 253 |
|
| Cash, Cash Equivalents and Restricted Cash at End of Period | $ | 583 |
| | $ | 314 |
| | $ | 497 |
|
| | | | | | |
| Supplemental Disclosures | | | | | |
| Interest paid, net of amount capitalized | $ | (292 | ) | | $ | (297 | ) | | $ | (271 | ) |
| Non-cash investing and financing activities: | | | | | |
| (Reductions) Additions to fixed assets for accrued capital expenditures | (15 | ) | | 22 |
| | 3 |
|
| Non-cash contributions from CEG, NRG, net of distributions | $ | 36 |
| | $ | (2 | ) | | $ | 90 |
|
(a) Retrospectively adjusted as discussed in Note 1, Nature of Business.
See accompanying notes to consolidated financial statements.
CLEARWAY ENERGY LLC
CONSOLIDATED STATEMENTS OF MEMBERS' EQUITY
|
| | | | | | | | | | | | | | | | | | | | |
| (In millions) | | Contributed Capital | | Retained Earnings | | Accumulated Other Comprehensive Loss | | Noncontrolling Interest | | Total Members' Equity |
| Balances at December 31, 2016 | | $ | 2,204 |
| | $ | 44 |
| | $ | (85 | ) | | $ | 226 |
| | $ | 2,389 |
|
| Net income (loss) | | $ | — |
| | $ | 136 |
| | $ | — |
| | $ | (75 | ) | | $ | 61 |
|
| Unrealized gain on derivatives | | — |
| | — |
| | 17 |
| | — |
| | 17 |
|
| Payments for the March 2017, August 2017 and November 2017 Drop Down Assets | | (250 | ) | | — |
| | — |
| | — |
| | (250 | ) |
| August 2017 Drop Down Assets contingent consideration | | (8 | ) |
| — |
|
| — |
|
| — |
| | (8 | ) |
| Distributions and returns of capital to NRG, net of contributions | | (21 | ) | | — |
| | — |
| | — |
| | (21 | ) |
| Capital contributions from NRG, net of distributions, non-cash | | (8 | ) | | 6 |
| | — |
| | — |
| | (2 | ) |
| Capital contributions from tax equity investors | | — |
| | — |
| | — |
| | 11 |
| | 11 |
|
| Proceeds from the issuance of Class C units | | 34 |
| | — |
| | — |
| | — |
| | 34 |
|
| Distributions paid to NRG on Class B and Class D units | | (6 | ) | | (88 | ) | | — |
| | — |
| | (94 | ) |
| Distributions paid to Clearway Energy, Inc. | | (26 | ) | | (82 | ) | | — |
| | — |
| | (108 | ) |
| Balances at December 31, 2017 | | $ | 1,919 |
| | $ | 16 |
| | $ | (68 | ) | | $ | 162 |
| | $ | 2,029 |
|
| Net income (loss) | | — |
| | 240 |
| | — |
| | (105 | ) | | 135 |
|
| Unrealized gain on derivatives | | — |
| | — |
| | 24 |
| | — |
| | 24 |
|
| Payments for the March 2017, August 2017 and November 2017 Drop Down Assets | | (52 | ) | | — |
| | — |
| | — |
| | (52 | ) |
| Capital contributions from tax equity investors | | — |
| | — |
| | — |
| | 106 |
| | 106 |
|
| Distributions paid to NRG, net of contributions | | (11 | ) | | — |
| | — |
| | — |
| | (11 | ) |
| Proceeds from the issuance of Class C Common Stock | | 153 |
| | — |
| | — |
| | — |
| | 153 |
|
| Distributions paid to NRG on Class B and Class D units | | — |
| | (108 | ) | | — |
| | — |
| | (108 | ) |
| Contributions from NRG, net of distributions, non-cash | | (1 | ) | | — |
| | — |
| | 37 |
| | 36 |
|
| Distributions paid to Clearway Energy, Inc. | | (68 | ) | | (62 | ) | | — |
| | — |
| | (130 | ) |
| Balances at December 31, 2018 | | $ | 1,940 |
| | $ | 86 |
| | $ | (44 | ) | | $ | 200 |
| | $ | 2,182 |
|
| Net loss | | — |
| | (30 | ) | | — |
| | (71 | ) | | (101 | ) |
| Unrealized gain on derivatives | | — |
| | — |
| | 7 |
| | — |
| | 7 |
|
| Buyout of Wind TE Holdco non-controlling interest | | (9 | ) | | — |
| | — |
| | (10 | ) | | (19 | ) |
| Contributions from CEG net of distributions, non-cash | | 7 |
| | 4 |
| | — |
| | 24 |
| | 35 |
|
| Cumulative effect from change in accounting principle | | — |
| | (3 | ) | | — |
| | — |
| | (3 | ) |
| Distributions paid to CEG on Class B and Class D units | | (38 | ) | | (30 | ) | | — |
| | — |
| | (68 | ) |
| Distributions paid to Clearway Energy, Inc., cash | | (65 | ) | | (22 | ) | | — |
| | — |
| | (87 | ) |
| Distributions paid to Clearway Energy, Inc., non-cash | | (13 | ) | | — |
| | — |
| | — |
| | (13 | ) |
| Contributions to tax equity non-controlling interests, net of distributions, cash | | (5 | ) | | — |
| | — |
| | 248 |
| | 243 |
|
| Distributions to CEG, net of contributions, cash | | — |
| | — |
| | — |
| | (68 | ) | | (68 | ) |
| Proceeds from the issuance of Class C Common Stock | | 100 |
| | — |
| | — |
| | — |
| | 100 |
|
| Carlsbad Drop Down | | (35 | ) | | — |
| | — |
| | — |
| | (35 | ) |
| Balances at December 31, 2019 | | $ | 1,882 |
| | $ | 5 |
| | $ | (37 | ) | | $ | 323 |
| | $ | 2,173 |
|
|
| | | | | | | | | | | | | | | | | | | | |
| (In millions) | | Contributed Capital | | Retained Earnings | | Accumulated Other Comprehensive Loss | | Noncontrolling Interest | | Total Members' Equity |
| Balances at December 31, 2015 | | $ | 2,364 |
| | $ | 107 |
| | $ | (98 | ) | | $ | 332 |
| | $ | 2,705 |
|
Net income (loss) (a) | | — |
| | 126 |
| | — |
| | (111 | ) | | 15 |
|
| Unrealized gain on derivatives | | — |
| | — |
| | 13 |
| | — |
| | 13 |
|
| Payment for CVSR Drop Down Asset | | (77 | ) | | — |
| | — |
| | — |
| | (77 | ) |
Distributions and returns of capital to NRG, net of contributions (b) | | (182 | ) | | (2 | ) | | — |
| | — |
| | (184 | ) |
Capital contributions from NRG, net of distributions, non-cash (a) | | 99 |
| | (9 | ) | | — |
| | — |
| | 90 |
|
| Capital contributions from tax equity investors | | — |
| | — |
| | — |
| | 5 |
| | 5 |
|
| Distributions paid to NRG on Class B and Class D units | | — |
| | (81 | ) | | — |
| | — |
| | (81 | ) |
| Distributions paid to Clearway Energy, Inc., non-cash | | — |
| | (5 | ) | | — |
| | — |
| | (5 | ) |
| Distributions paid to Clearway Energy, Inc. | | — |
| | (92 | ) | | — |
| | — |
| | (92 | ) |
| Balances at December 31, 2016 | | $ | 2,204 |
| | $ | 44 |
| | $ | (85 | ) | | $ | 226 |
| | $ | 2,389 |
|
Net income (loss) (a) | | — |
| | 136 |
| | — |
| | (75 | ) | | 61 |
|
| Unrealized gain on derivatives | | — |
| | — |
| | 17 |
| | — |
| | 17 |
|
| Payments for the March 2017, August 2017 and November 2017 Drop Down Assets | | (250 | ) | | — |
| | — |
| | — |
| | (250 | ) |
| August 2017 Drop Down Assets contingent consideration | | (8 | ) | | — |
| | — |
| | — |
| | (8 | ) |
| Capital contributions from tax equity investors | | — |
| | — |
| | — |
| | 11 |
| | 11 |
|
Distributions paid to NRG, net of contributions (a) | | (21 | ) | | — |
| | — |
| | — |
| | (21 | ) |
Distributions paid to NRG, net of contributions, non-cash (a) | | (8 | ) | | 6 |
| | — |
| | — |
| | (2 | ) |
| Proceeds from the issuance of Class C Common Stock | | 34 |
| | — |
| | — |
| | — |
| | 34 |
|
| Distributions paid to NRG on Class B and Class D units | | (6 | ) | | (88 | ) | | — |
| | — |
| | (94 | ) |
| Distributions paid to Clearway Energy, Inc. | | (26 | ) | | (82 | ) | | — |
| | — |
| | (108 | ) |
| Balances at December 31, 2017 | | $ | 1,919 |
| | $ | 16 |
| | $ | (68 | ) | | $ | 162 |
| | $ | 2,029 |
|
| Net income (loss) | | — |
| | 240 |
| | — |
| | (105 | ) | | 135 |
|
| Unrealized gain on derivatives | | — |
| | — |
| | 24 |
| | — |
| | 24 |
|
| Payment for the Buckthorn Solar Drop Down Asset and UPMC | | (52 | ) | | — |
| | — |
| | — |
| | (52 | ) |
| Capital contributions from tax equity investors, net of distributions | | — |
| | — |
| | — |
| | 106 |
| | 106 |
|
| Proceeds from the issuance of Class C units | | 153 |
| | — |
| | — |
| | — |
| | 153 |
|
| Distributions paid to NRG, net of contributions | | (11 | ) | | — |
| | — |
| | — |
| | (11 | ) |
| Contributions from CEG, NRG, net of distributions, non-cash | | (1 | ) | | — |
| | — |
| | 37 |
| | 36 |
|
| Distributions paid to NRG/CEG on Class B and Class D units | | — |
| | (108 | ) | | — |
| | — |
| | (108 | ) |
| Distributions paid to Clearway Energy, Inc. | | (68 | ) | | (62 | ) | | — |
| | — |
| | (130 | ) |
| Balances at December 31, 2018 | | $ | 1,940 |
| | $ | 86 |
| | $ | (44 | ) | | $ | 200 |
| | $ | 2,182 |
|
(a) Retrospectively adjusted as discussed in Note 1, Nature of Business.
See accompanying notes to consolidated financial statements.
CLEARWAY ENERGY LLC
NOTES TO CONSOLIDATED FINANCIAL STATEMENTS
Note 1 — Nature of Business
Clearway Energy LLC, (formerly NRG Yield LLC), together with its consolidated subsidiaries, or the Company, was formed by NRG as a Delaware limited liability company on March 5, 2013, to serve as the primary vehicle through which NRG owns, operatesis an investor in and acquiresowner of modern, sustainable and long-term contracted renewable and conventional generation and thermal infrastructure assets.assets across North America. On August 31, 2018, NRG Energy, Inc., or NRG, transferred its full ownership interest in Clearway Energy, Inc. (formerly NRG Yield, Inc.)the Company to Clearway Energy Group LLC, or CEG, the holder of NRG's renewable energy development and operations platform, and subsequently sold 100% of its interest in CEG to Global Infrastructure Partners III, or GIP, referred to hereinafter as the GIP Transaction. As a result of the GIP Transaction, GIP indirectly acquired a 45.2% economic interest in the Company and a 55% voting interest in the Clearway, Energy, Inc. GIP is an independent fund manager that invests in infrastructure assets in energy and transport sectors. The Company is sponsored by GIP through GIP'sits portfolio company, Clearway Energy Group.CEG.
The Company’s environmentally-sound asset portfolio includes over 5,2725,875 MW of wind, solar and natural gas-fired power generation facilities, as well as district energy systems. facilities. Nearly all of these assets sell substantially all of their output pursuant to long-term offtake agreements with creditworthy counterparties. The weighted average remaining contract duration of these offtake agreements was approximately 1513 years as of December 31, 20182019 based on CAFD. The Company also owns thermal infrastructure assets with an aggregate steam and chilled water capacity of 1,3851,530 net MWt and electric generation capacity of 133139 net MW. These thermal infrastructure assets provide steam, hot and/or chilled water, and, in some instances, electricity to commercial businesses, universities, hospitals and governmental units in multiple locations, principally through long-term contracts or pursuant to rates regulated by state utility commissions.
The CompanyClearway Energy Inc. consolidates the results of Clearway Energy LLC through its controlling interest, with CEG's interest shown as noncontrolling interest in the financial statements. The holders of Clearway, Energy, Inc.'s outstanding shares of Class A and Class C common stock are entitled to dividends as declared. CEG receives its distributions from Clearway Energy LLC through its ownership of Clearway Energy LLC Class B and Class D units.
As a result of the Clearway, Energy, Inc. Class C common stock issuances during the year ended December 31, 2018,2019, Clearway, Energy, Inc. currently owns 55.8%57.01% of the economic interests of the Company, with CEG retaining 44.2%42.99% of the economic interests of the Company. For further discussion, see Item 15 — Note 11, Members' Equity.
The following table represents the structure of the Company as of December 31, 2018:2019:
PG& E Bankruptcy
On January 29, 2019, Pacific Gas and Electric, or PG&E filed voluntary petitions for reliefreorganization under Chapter 11 of the United StatesU.S. Bankruptcy Code.Code in the U.S. Bankruptcy Court for the Northern District of California, or the Bankruptcy Court. Certain subsidiaries of the Company,, holding which hold interests in 6 solar facilities totaling 480 MW and Marsh Landing with capacity of 720 MW, sell the output of their facilities to PG&E under long-term PPAs. The Company consolidates three of the solar facilities and Marsh Landing and records its interest in the other solar facilities as equity method investments. As of December 31, 2019, the Company had $177 million in restricted cash, $1.4 billion of property, plant and equipment, net, $370 million investments in unconsolidated affiliates and $1.2 billion of borrowings with final maturity dates ranging from 2023 - 2038 related to these facilities. The related subsidiaries of the Company have entered intoare parties to financing agreements consisting of non-recourse project levelproject-level debt and, in certain cases, non-recourse holding company debt. The effectPG&E Bankruptcy triggered defaults under the PPAs with PG&E and such related project-level financing agreements. As a result, the Company recorded $1.2 billion of principal, net of the bankruptcy filing on the Company's operations is further described in Note 2, Summaryrelated unamortized debt issuance costs, as short-term debt as of Significant Accounting Policies, Note 5, Investments Accounted for by the Equity Method and Variable Interest Entities, and Note 10, Long-Term Debt to the Consolidated Financial Statements.December 31, 2019.
Substantially all of the Company's generation assets are under long-term contractual arrangements for the output or capacity from these assets. The thermal assets are comprised of district energy systems and combined heat and power plants that produce steam, hot water and/or chilled water and, in some instances, electricity at a central plant. Certain district energy systems are subject to rate regulation by state public utility commissions (although they may negotiate certain rates) while the other district energy systems have rates determined by negotiated bilateral contracts. For the complete listing of the company's generation assets, refer to Item 2 - Properties to this Form 10-K.
Recast of the Historical Financial Statements
Prior to the GIP Transaction on August 31, 2018, the Company completed several acquisitions of Drop Down Assets from NRG, which were accounted for as transfer of entities under common control, and are further described in Note 3, Business Acquisitions. The accounting guidance for transfers of entities under common control requires retrospective combination of the entities for all periods presented as if the combinations had been in effect from the beginning of the financial statement period or from the date the entities were under common control (if later than the beginning of the financial statement period).
Transition Services Agreement
As a result of the GIP Transaction, the Company entered into a Transition Services Agreement with NRG, or the NRG TSA, pursuant to which NRG or certain of its affiliates began providing transitional services to the Company following the consummation of the GIP Transaction, in exchange for the payment of a fee in respect of such services. The agreement is effective untilA material portion of these processes terminated during the earliersecond quarter of June 30, 2019 orand such services were subsequently provided by both the date that all services are terminatedCompany and by CEG pursuant to the Company. TheCEG Master Services Agreements. During the second quarter of 2019, the Company mayexercised its option to extend the term on a month-by-month basis no later than March 31,of the NRG TSA through April 30, 2020 for a fixed monthly fee provided for in the agreement. Expensesremaining services, some of which will be billed at an hourly rate as agreed between the parties. The Company incurred approximately $1.5 million of expense related to the NRG TSA areduring the year ended December 31, 2019, which was recorded in generaltransaction and administrative expensesintegration costs in the consolidated statements of operations.
Note 2 — Summary of Significant Accounting Policies
Basis of Presentation and Principles of Consolidation
The Company's consolidated financial statements have been prepared in accordance with GAAP. The ASC is the source of authoritative GAAP to be applied by nongovernmental entities. In addition, the rules and interpretative releases of the SEC under authority of federal securities laws are also sources of authoritative GAAP for SEC registrants.
The consolidated financial statements include the Company's accounts and operations and those of its subsidiaries in which it has a controlling interest. All significant intercompany transactions and balances have been eliminated in consolidation. The usual condition for a controlling financial interest is ownership of a majority of the voting interests of an entity. However, a controlling financial interest may also exist through arrangements that do not involve controlling voting interests. As such, the Company applies the guidance of ASC 810, Consolidations, or ASC 810, to determine when an entity that is insufficiently capitalized or not controlled through its voting interests, referred to as a variable interest entity, or VIE, should be consolidated.
Cash and Cash Equivalents, and Restricted Cash
Cash and cash equivalents include highly liquid investments with an original maturity of three months or less at the time of purchase. Cash and cash equivalents held at project subsidiaries was $109$125 million and $124$109 million as of December 31, 20182019 and 2017,2018, respectively.
The following table provides a reconciliation of cash, cash equivalents and restricted cash reported within the consolidated balance sheets that sum to the total of the same such amounts shown in the statements of cash flows.
|
| | | | | | | |
| | Year ended December 31, |
| | 2019 | | 2018 |
| | (In millions) |
| Cash and cash equivalents | $ | 152 |
| | $ | 407 |
|
| Restricted cash | 262 |
| | 176 |
|
| Cash, cash equivalents and restricted cash shown in the statements of cash flows | 414 |
| | 583 |
|
|
| | | | | | | | | | | |
| | Year ended December 31, |
| | 2018 | | 2017 | | 2016 |
| | (In millions) |
| Cash and cash equivalents | $ | 407 |
| | $ | 146 |
| | $ | 321 |
|
| Restricted cash | 176 |
| | 168 |
| | 176 |
|
| Cash, cash equivalents and restricted cash shown in the statement of cash flows | 583 |
| | 314 |
| | 497 |
|
Restricted cash consists primarily of funds held to satisfy the requirements of certain debt agreements and funds held within the Company's projects that are restricted in their use. As of December 31, 2018,2019, these restricted funds comprised of $84$129 million designated to fund operating expenses, approximately $26$24 million designated for current debt service payments, and $32$30 million restricted for reserves including debt service, performance obligations and other reserves, as well as capital expenditures. The remaining $34$79 million is held in distributiondistributions reserve accounts, of which $31$58 million related to subsidiaries affected by the PG&E Bankruptcy as discussed further below and may not be distributed during the pendency of the bankruptcy. Such subsidiaries had a total of $177 million in restricted cash as of December 31, 2019.
On January 29, 2019, PG&E filed for reorganization under Chapter 11 of the U.S. Bankruptcy Code. The Company has non-recourse project-level debt related to each of its subsidiaries that sell their output to PG&E under long-term PPAs. The PG&E bankruptcyBankruptcy filing is an event of default under the related financing agreements. As of December 31, 2018,2019, all project level cash balances for these subsidiaries were classified as restricted cash.
Accounts Receivable — Trade Receivables and Allowance for Doubtful Accounts
Trade receivablesAccounts receivable— trade are reported on the balance sheet at the invoiced amount adjusted for any write-offs and the allowance for doubtful accounts. The allowance for doubtful accounts is reviewed periodically based on amounts past due and significance. The allowance for doubtful accounts was immaterial as of December 31, 20182019 and 2017.
2018.
Inventory
Inventory consists principally of spare parts and fuel oil. Spare parts inventory is valued at weighted average cost, unless evidence indicates that the weighted average cost will not be recovered with a normal profit in the ordinary course of business. Fuel oil inventory is valued at the lower of weighted average cost or market. The Company removes fuel inventories as they are used in the production of steam, chilled water or electricity. Spare parts inventory are removed when they are used for repairs, maintenance or capital projects.
Property, Plant and Equipment
Property, plant and equipment are stated at cost or, in the case of third party business acquisitions, fair value; however impairment adjustments are recorded whenever events or changes in circumstances indicate that their carrying values may not be recoverable. Significant additions or improvements extending asset lives are capitalized as incurred, while repairs and maintenance that do not improve or extend the life of the respective asset are charged to expense as incurred. Depreciation is computed using the straight-line method over the estimated useful lives. Certain assets and their related accumulated depreciation amounts are adjusted for asset retirements and disposals with the resulting gain or loss included in cost of operations in the consolidated statements of operations. For further discussion of the Company's property, plant and equipment refer to Note 4, Property, Plant and Equipment, to the Consolidated Financial Statements.
Construction in-progress represents cumulative construction costs, including the costs incurred for the purchase of major equipment and engineering costs and capitalized interest. Once the project achieves commercial operation, the Company reclassifies the amounts recorded in construction in progress to facilities and equipment.
Development costs include project development costs, which are expensed in the preliminary stages of a project and
capitalized when the project is deemed to be commercially viable. Commercial viability is determined by one or a series of actions including, among others, Board of Director approval pursuant to a formal project plan that subjects the Company to significant future obligations that can only be discharged by the use of a Company asset. When a project is available for operations, capitalized interest and capitalized project development costs are reclassified to property, plant and equipment and depreciated on a straightline basis over the estimated useful life of the project's related assets. Capitalized costs are charged to expense if a project is abandoned or management otherwise determines the costs to be unrecoverable.
Asset Impairments
Long-lived assets that are held and used are reviewed for impairment whenever events or changes in circumstances indicate their carrying values may not be recoverable. Such reviews are performed in accordance with ASC 360. An impairment loss is indicated if the total future estimated undiscounted cash flows expected from an asset are less than its carrying value. An impairment charge is measured by the difference between an asset's carrying amount and fair value with the difference recorded in operating costs and expenses in the statements of operations. Fair values are determined by a variety of valuation methods, including appraisals, sales prices of similar assets and present value techniques. For further discussion of the Company's long-lived asset impairments, refer to Item 15 — Note 9, Asset Impairments, to the Consolidated Financial Statements.
Investments accounted for by the equity method are reviewed for impairment in accordance with ASC 323, Investments-Equity Method and Joint Ventures, which requires that a loss in value of an investment that is an other-than-temporary decline should be recognized. The Company identifies and measures losses in the value of equity method investments based upon a comparison of fair value to carrying value.
Debt Issuance Costs
Debt issuance costs are capitalized and amortized as interest expense on a basis which approximates the effective interest method over the term of the related debt. Debt issuance costs related to the long term debt are presented as a direct deduction from the carrying amount of the related debt in both the current and prior periods. Debt issuance costs related to the senior secured revolving credit facility line of credit are recorded as a non-current asset on the balance sheet and are amortized over the term of the credit facility.
Notes Receivable
Notes receivable consist of receivables related to the financing of required network upgrades. The notes issued with respect to network upgrades will be repaid within a 5-year period following the date each facility reached commercial operations.
Intangible Assets
Intangible assets represent contractual rights held by the Company. The Company recognizes specifically identifiable intangible assets including power purchase agreements, leasehold improvements, customer relationships, customer contracts and development rights when specific rights and contracts are acquired. These intangible assets are amortized primarily on a straight-line basis. For further discussion of the Company's intangible assets, refer to Note 8, Intangible Assets, to the Consolidated Financial Statements.
Income Taxes
The Company is classified as a partnership for federal and state income tax purposes. Therefore, federal and state income taxes are assessed at the partner level. Accordingly, no provision has been made for federal or state income taxes in the accompanying financial statements.
Revenue Recognition
Revenue from Contracts with Customers
On January 1, 2018, the Company adopted the guidance in ASC 606, Revenue from Contracts with Customers, orTopic 606, using the modified retrospective method applied to contracts which were not completed as of the adoption date, with no adjustment required to the financial statements upon adoption. Following the adoption of the new standard, the Company’s revenue recognition of its contracts with customers remains materially consistent with its historical practice. The comparative information has not been restated and continues to be reported under the accounting standards in effect for those periods. The Company's policies with respect to its various revenue streams are detailed below. In general, the Company applies the invoicing practical expedient to recognize revenue for the revenue streams detailed below, except in circumstances where the invoiced amount does not represent the value transferred to the customer.
Thermal Revenues
Steam and chilled water revenue is recognized as the Company transfers the product to the customer, based on customer usage as determined by meter readings taken at month-end. Some locations read customer meters throughout the month, and recognize estimated revenue for the period between meter read date and month-end. For thermal contracts, the Company’s performance obligation to deliver steam and chilled water is satisfied over time and revenue is recognized based on the invoiced amount. The Thermal Business subsidiaries collect and remit state and local taxes associated with sales to their customers, as required by governmental authorities. These taxes are presented on a net basis in the income statement.
As contracts for steam and chilled water are long-term contracts, the Company has performance obligations under these contracts that have not yet been satisfied. These performance obligations have transaction prices that are both fixed and variable, and that vary based on the contract duration, customer type, inception date and other contract-specific factors. For the fixed price contracts, the Company cannot accurately estimate the amount of its unsatisfied performance obligations as it will vary based on customer usage, which will depend on factors such as weather and customer activity.
Power Purchase Agreements, or PPAs
The majority of the Company’s revenues are obtained through PPAs or other contractual agreements. Energy, capacity and, where applicable, renewable attributes, from the majority of the Company’s renewable energy assets and certain conventional energy plants is sold through long-term PPAs and tolling agreements to a single counterparty, which is often a utility or commercial customer. The majority of these PPAs are accounted for as leases. Previously ASC 840, and currently, ASC 842, requires the minimum lease payments received to be amortized over the term of the lease and contingent rentals are recorded when the achievement of the contingency becomes probable. Judgment is required by management in determining the economic life of each generating facility, in evaluating whether certain lease provisions constitute minimum payments or represent contingent rent and other factors in determining whether a contract contains a lease and whether the lease is an operating lease or capital lease.
Certain of these leases have no minimum lease payments and all of the rental income under these leases is recorded as contingent rent on an actual basis when the electricity is delivered. The contingent rental income recognized in the years ended December 31, 2019, 2018 and 2017 and 2016 was $537 million, $583 million and $559 million, and $583 million, respectively. These balances include intercompany revenue See Note 15, Leases for Elbow Creek of $6 millionadditional information related to the Company's PPAs accounted for the eight months ended August 31, 2018 and $8 million for each of the years ended December 31, 2017 and 2016, as further discussed in Note 13 Related Party Transactions.leases.
Renewable Energy Credits, or RECs
As stated above, renewable energy credits, or RECs, are usually sold through long-term PPAs. Revenue from the sale of self-generated RECs is recognized when the related energy is generated and simultaneously delivered even in cases where there is a certification lag as it has been deemed to be perfunctory.
In a bundled contract to sell energy, capacity and/or self-generated RECs, all performance obligations are deemed to be delivered at the same time and hence, timing of recognition of revenue for all performance obligations is the same and occurs over time. In such cases, it is often unnecessary to allocate transaction price to multiple performance obligations.
Sale of Emission AllowancesDisaggregated Revenues
The Company records its bankfollowing tables represent the Company’s disaggregation of emission allowances as partrevenue from contracts with customers for the year ended December 31, 2019, along with the reportable segment for each category:
|
| | | | | | | | | | | | | | | |
| | Year ended December 31, 2019 |
| (In millions) | Conventional Generation | | Renewables | | Thermal | | Total |
Energy revenue(a) | $ | 5 |
| | $ | 545 |
| | $ | 120 |
| | $ | 670 |
|
Capacity revenue(a) | 348 |
| | — |
| | 54 |
| | 402 |
|
| Other revenues | — |
| | 10 |
| | 30 |
| | 40 |
|
| Contract amortization | (7 | ) | | (61 | ) | | (3 | ) | | (71 | ) |
| Mark-to-market for economic hedges | — |
| | (9 | ) | | — |
| | (9 | ) |
| Total operating revenue | 346 |
| | 485 |
| | 201 |
| | 1,032 |
|
| Less: Lease revenue | (353 | ) | | (509 | ) | | (2 | ) | | (864 | ) |
| Less: Contract amortization | 7 |
| | 61 |
| | 3 |
| | 71 |
|
| Total revenue from contracts with customers | $ | — |
| | $ | 37 |
| | $ | 202 |
| | $ | 239 |
|
(a) See Note 17, Leases for the amounts of intangible assets. From timeenergy and capacity revenue that relate to time, management may authorize the transfer of emission allowances in excess of usage from the Company's emission bank to intangible assets held-for-saleleases and are accounted for trading purposes. The Company records the sale of emission allowances on a net basis within operating revenue in the Company's consolidated statements of operations.
Disaggregated Revenuesunder ASC 842
The following tables represent the Company’s disaggregation of revenue from contracts with customers for the year ended December 31, 2018, along with the reportable segment for each category:
| | | | Year ended December 31, 2018 | Year ended December 31, 2018 |
| (In millions) | Conventional Generation | | Renewables | | Thermal | | Corporate | | Total | Conventional Generation | | Renewables | | Thermal | | Total |
Energy revenue(a) | $ | 5 |
| | $ | 572 |
| | $ | 4 |
| | — |
| | $ | 581 |
| $ | 5 |
| | $ | 572 |
| | $ | 120 |
| | $ | 697 |
|
Capacity revenue(a) | 337 |
| | — |
| | 166 |
| | — |
| | 503 |
| 337 |
| | — |
| | 50 |
| | 387 |
|
| Other revenues | — |
| | 16 |
| | 26 |
| | (3 | ) | | 39 |
| — |
| | 13 |
| | 26 |
| | 39 |
|
| Contract amortization | (5 | ) | | (62 | ) | | (3 | ) | | — |
| | (70 | ) | (5 | ) | | (62 | ) | | (3 | ) | | (70 | ) |
| Total operating revenue | 337 |
| | 526 |
| | 193 |
| | (3 | ) | | 1,053 |
| 337 |
| | 523 |
| | 193 |
| | 1,053 |
|
| Less: Lease revenue | (342 | ) | | (534 | ) | | (2 | ) | | — |
| | (878 | ) | (342 | ) | | (534 | ) | | (2 | ) | | (878 | ) |
| Less: Contract amortization | 5 |
| | 62 |
| | 3 |
| | — |
| | 70 |
| 5 |
| | 62 |
| | 3 |
| | 70 |
|
| Total revenue from contracts with customers | $ | — |
| | $ | 54 |
| | $ | 194 |
| | (3 | ) | | $ | 245 |
| $ | — |
| | $ | 51 |
| | $ | 194 |
| | $ | 245 |
|
(a) The followingSee Note 17, Leases for the amounts of energy and capacity revenue that relate to leases and are accounted for under ASC 840:
|
| | | | | | | | | | | | | | | | |
| | | Conventional Generation | | Renewables | | Thermal | | Total |
| Energy Revenue | | $ | 5 |
| | $ | 534 |
| | $ | 2 |
| | $ | 541 |
|
| Capacity Revenue | | 337 |
| | — |
| | — |
| | 337 |
|
| | | 342 |
| | 534 |
| | 2 |
| | 878 |
|
Contract Amortization
Assets and liabilities recognized from power sales agreements assumed through acquisitions related to the sale of electric capacity and energy in future periods for which the fair value has been determined to be significantly less (more) than market are amortized to revenue over the term of each underlying contract based on actual generation and/or contracted volumes or on a straight-line basis, where applicable.
Contract Balances
The following table reflects the contract assets and liabilities included on the Company’s balance sheet as of December 31, 2018:2019:
|
| | | | | | | | |
| (In millions) | | December 31, 2019 | | December 31, 2018 |
| Accounts receivable, net - Contracts with customers | | $ | 34 |
| | $ | 35 |
|
| Accounts receivable, net - Leases | | 82 |
| | 69 |
|
| Total accounts receivable, net | | $ | 116 |
| | $ | 104 |
|
|
| | | | | | | | |
| (In millions) | | December 31, 2018 | | December 31, 2017 |
| Accounts receivable, net - Contracts with customers | | $ | 35 |
| | $ | 28 |
|
| Accounts receivable, net - Leases | | 69 |
| | 67 |
|
| Total accounts receivable, net | | $ | 104 |
| | $ | 95 |
|
Derivative Financial Instruments
The Company accounts for derivative financial instruments under ASC 815, Derivatives and Hedging, or ASC 815, which requires the Company to record all derivatives on the balance sheet at fair value unless they qualify for a NPNS exception. Changes in the fair value of non-hedge derivatives are immediately recognized in earnings. Changes in the fair value of derivatives accounted for as hedges, if elected for hedge accounting, are either:
Recognized in earnings as an offset to the changes in the fair value of the related hedged assets, liabilities and firm commitments; or
Deferred and recorded as a component of accumulated OCI until the hedged transactions occur and are recognized in earnings.
The Company's primary derivative instruments are interest rate instruments used to mitigate variability in earnings due to fluctuations in interest rates, power purchase or sale contracts used to mitigate variability in earnings due to fluctuations in market prices and fuels purchase contracts used to control customer reimbursable fuel cost. On an ongoing basis, the Company qualitatively assesses the effectiveness of its derivatives that are designated as hedges for accounting purposes in order to determine that each derivative continues to be highly effective in offsetting changes in cash flows of hedged items. If necessary, the Company will perform an analysesanalysis to measure the statistical correlation between the derivative and the associated hedged item to determine the effectiveness of such a contract designated as a hedge. The Company will discontinue hedge accounting if it is determined that the hedge is no longer effective. In this case, the gain or loss previously deferred in accumulated OCI would be frozen until the underlying hedged item is delivered unless the transaction being hedged is no longer probable of occurring in which case the amount in OCI would be immediately reclassified into earnings. If the derivative instrument is terminated, the effective portion of this derivative deferred in accumulated OCI will be frozen until the underlying hedged item is delivered.
Revenues and expenses on contracts that qualify for the NPNS exception are recognized when the underlying physical transaction is delivered. While these contracts are considered derivative financial instruments under ASC 815, they are not recorded at fair value, but on an accrual basis of accounting. If it is determined that a transaction designated as NPNS no longer meets the scope exception, the fair value of the related contract is recorded on the balance sheet and immediately recognized through earnings.
Concentrations of Credit Risk
Financial instruments which potentially subject the Company to concentrations of credit risk consist primarily of accounts receivable, notes receivable and derivative instruments, which are concentrated within entities engaged in the energy and financial industry. These industry concentrations may impact the overall exposure to credit risk, either positively or negatively, in that the customers may be similarly affected by changes in economic, industry or other conditions. In addition, many of the Company's projects have only one customer. See Item 1A, Risk Factors, Risks related to the PG&E Bankruptcy, for a discussion on the Company’s dependence on major customers. See Note 6, Fair Value of Financial Instruments, for a further discussion of derivative concentrations and Note 12, Segment Reporting, for concentration of counterparties.
Fair Value of Financial Instruments
The carrying amount of cash and cash equivalents, restricted cash, accounts receivable, accounts receivable - affiliate, accounts payable, current portion of account payable - affiliate, and accrued expenses and other current liabilities approximate fair value because of the short-term maturity of these instruments. See Item 15 — Note 6, Fair Value of Financial Instruments, for a further discussion of fair value of financial instruments.
Asset Retirement Obligations
Asset retirement obligations, or AROs, are accounted for in accordance with ASC 410-20, Asset Retirement Obligations, or ASC 410-20. Retirement obligations associated with long-lived assets included within the scope of ASC 410-20 are those for which a legal obligation exists under enacted laws, statutes, and written or oral contracts, including obligations arising under the doctrine of promissory estoppel, and for which the timing and/or method of settlement may be conditional on a future event. ASC 410-20 requires an entity to recognize the fair value of a liability for an ARO in the period in which it is incurred and a reasonable estimate of fair value can be made.
Upon initial recognition of a liability for an ARO, the asset retirement cost is capitalized by increasing the carrying amount of the related long-lived asset by the same amount. Over time, the liability is accreted to its future value, while the capitalized cost is depreciated over the useful life of the related asset. The Company's AROs are primarily related to the future dismantlement of equipment on leased property and environmental obligations related to site closures and fuel storage facilities. The Company records AROs as part of other non-current liabilities on its balance sheet.
The following table represents the balance of ARO obligations as of December 31, 20182019 and 2017,2018, along with the additions and accretion related to the Company's ARO obligations for the year ended December 31, 2018:2019:
|
| | | |
| (In millions) | |
| Balance as of December 31, 2018 | $ | 67 |
|
| Revisions in estimates for current obligations/Additions | 3 |
|
| Accretion — expense | 5 |
|
| Balance as of December 31, 2019 | $ | 75 |
|
|
| | | |
| | (In millions) |
| Balance as of December 31, 2017 | $ | 58 |
|
| Revisions in estimates for current obligations/Additions | 5 |
|
| Accretion — expense | 4 |
|
| Balance as of December 31, 2018 | $ | 67 |
|
Guarantees
The Company enters into various contracts that include indemnification and guarantee provisions as a routine part of its business activities. Examples of these contracts include operation and maintenance agreements, service agreements, commercial sales arrangements and other types of contractual agreements with vendors and other third parties, as well as affiliates. These contracts generally indemnify the counterparty for tax, environmental liability, litigation and other matters, as well as breaches of representations, warranties and covenants set forth in these agreements. Because many of the guarantees and indemnities the Company issues to third parties and affiliates do not limit the amount or duration of its obligations to perform under them, there exists a risk that the Company may have obligations in excess of the amounts agreed upon in the contracts mentioned above. For those guarantees and indemnities that do not limit the liability exposure, the Company may not be able to estimate what the liability would be, until a claim is made for payment or performance, due to the contingent nature of these contracts.
Investments Accounted for by the Equity Method
The Company has investments in various energy projects accounted for by the equity method, several of which are VIEs, where the Company is not a primary beneficiary, as described in Note 5, Investments Accounted for by the Equity Method and Variable Interest Entities.Entities. The equity method of accounting is applied to these investments in affiliates because the ownership structure prevents the Company from exercising a controlling influence over the operating and financial policies of the projects. Under this method, equity in pre-tax income or losses of the investments is reflected as equity in earnings of unconsolidated affiliates. Distributions from equity method investments that represent earnings on the Company's investment are included within cash flows from operating activities and distributions from equity method investments that represent a return of the Company's investment are included within cash flows from investing activities.
Sale LeasebackSale-Leaseback Arrangements
The Company is party to sale-leaseback arrangements that provide for the sale of certain assets to a third party and simultaneous leaseback to the Company. In accordance with ASC 840-40, Sale-Leaseback Transactions, if the seller-lessee retains, through the leaseback, substantially all of the benefits and risks incident to the ownership of the property sold, the sale-leaseback transaction is accounted for as a financing arrangement. An example of this type of continuing involvement would include an option to repurchase the assets or the buyer-lessor having the option to sell the assets back to the Company. This provision is included in most of the Company’s sale-leaseback arrangements. As such, the Company accounts for these arrangements as financings.
Under the financing method, the Company does not recognize as income any of the sale proceeds received from the lessor that contractually constitutes payment to acquire the assets subject to these arrangements. Instead, the sale proceeds received are accounted for as financing obligations and leaseback payments made by the Company are allocated between interest expense and a reduction to the financing obligation. Interest on the financing obligation is calculated using the Company’s incremental borrowing rate at the inception of the arrangement on the outstanding financing obligation. Judgment is required to determine the appropriate borrowing rate for the arrangement and in determining any gain or loss on the transaction that would be recorded either at the end of or over the lease term.
Business Combinations
The Company accounts for its business combinations in accordance with ASC 805, Business Combinations, or ASC 805. For third party acquisitions, ASC 805 requires an acquirer to recognize and measure in its financial statements the identifiable assets acquired, the liabilities assumed, and any noncontrolling interest in the acquiree at fair value at the acquisition date. It also recognizes and measures the goodwill acquired or a gain from a bargain purchase in the business combination and determines what information to disclose to enable users of an entity's financial statements to evaluate the nature and financial effects of the business combination. In addition, transaction costs are expensed as incurred. For business acquisitions that relate to entities under common control, ASC 805 requires retrospective combination of the entities for all periods presented as if the combination has been in effect from the beginning of the financial statement period of from the date the entities were under common control (if later than the beginning of the financial statement period). The difference between the cash paid and historical value of the entities' equity is recorded as a distribution/contribution from/to NRGCEG with the offset to contributed capital.noncontrolling interest. Transaction costs are expensed as incurred.
Use of Estimates
The preparation of consolidated financial statements in accordance with GAAP requires management to make estimates and assumptions. These estimates and assumptions impact the reported amounts of assets and liabilities and disclosures of contingent assets and liabilities as of the date of the consolidated financial statements. They also impact the reported amounts of net earnings during the reporting periods. Actual results could be different from these estimates.
In recording transactions and balances resulting from business operations, the Company uses estimates based on the best information available. Estimates are used for such items as plant depreciable lives, uncollectible accounts, environmental liabilities,AROs, acquisition accounting and legal costs incurred in connection with recorded loss contingencies, among others. In addition, estimates are used to test long-lived assets for impairment and to determine the fair value of impaired assets. As better information becomes available or actual amounts are determinable, the recorded estimates are revised. Consequently, operating results can be affected by revisions to prior accounting estimates.
Tax Equity Arrangements
Certain portions of the Company’s noncontrolling interests in subsidiaries represent third-party interests in the net assets under certain tax equity arrangements, which are consolidated by the Company, that have been entered into to finance the cost of wind facilities eligible for certain tax credits. Additionally, certain portions of the Company’s investments in unconsolidated affiliates reflect the Company’s interests in tax equity arrangements, that are not consolidated by the Company, that have been entered into to finance the cost of distributed solar energy systems, under operating leases or PPAs, eligible for certain tax credits. The Company has determined that the provisions in the contractual agreements of these structures represent substantive profit sharing arrangements. Further, the Company has determined that the appropriate methodology for calculating the noncontrolling interest and investment in unconsolidated affiliates that reflects the substantive profit sharing arrangements is a balance sheet approach utilizing the hypothetical liquidation at book value, or HLBV, method. Under the HLBV method, the amounts reported as noncontrolling interests and investment in unconsolidated affiliates represent the amounts the investors to the tax equity arrangements would hypothetically receive at each balance sheet date under the liquidation provisions of the contractual agreements, assuming the net assets of the funding structures were liquidated at their recorded amounts determined in accordance with GAAP. The investors’ interests in the results of operations of the funding structures are determined as the difference in noncontrolling interests and investment in unconsolidated affiliates at the start and end of each reporting period, after taking into account any capital transactions between the structures and the funds’ investors. The calculations utilized to apply the HLBV method include estimated calculations of taxable income or losses for each reporting period.
Reclassification
Certain prior year amounts have been reclassified for comparative purposes.
Recent Accounting Developments - Adopted in 2019
ASU 2016-02 — In February 2016, the FASB issued ASU No. 2016-02, Leases (Topic 842), or Topic 842, as amended, with the objective to increase transparency and comparability among organizations by recognizing lease assets and lease liabilities on the balance sheet and to improve financial reporting by expanding the related disclosures. The guidance in Topic 842 provides that a lessee that may have previously accounted for a lease as an operating lease under current GAAP should recognize the assets and liabilities that arise from a lease on the balance sheet. In addition, Topic 842 expands the required quantitative and qualitative disclosures with regards to lease arrangements.
TheAs further described in Note 15, Leases, the Company adopted the standard effective January 1, 2019 using the modified retrospective transition method and will not restate prior periods for the impact of Topic 842. In addition,
Note 3 — Acquisitions and Dispositions
2019 Acquisitions
Carlsbad Drop Down— On December 6, 2019, the Company elected certainacquired 100% of GIP's membership interests in CBAD Holdings, LLC, which indirectly owns Carlsbad Energy Center LLC, a 527 megawatt natural gas fired power project located in Carlsbad, California, or the permitted practical expedients,Carlsbad Drop Down Asset. The project has a 20-year power purchase and tolling agreement with San Diego Gas and Electric Company, which expires in 2038. The purchase price for the Carlsbad Drop Down was $184 million in cash, plus assumption of $803 million in project level financing including non-recourse senior notes, as further described in Note 10, Long-term Debt. The acquisition was funded with proceeds from the expedient that permits the Company to retain its existing lease assessment and classification. The company will not record a right-of-use asset and related lease liability for leases with an initial term of 12 months or less and will account for lease and non-lease components for specific asset classesClearway Energy, Inc. equity issuance, as a single lease component.
The Company's leases consist mainly of land leases for many operating asset locations,described Note 11, Members' Equity, as well as leasesborrowings from the Company's revolving credit facility. The Carlsbad acquisition is the result of office spacethe Company having elected its option to purchase Carlsbad pursuant to the ROFO agreement, as amended, by and office equipment.among the Company, CEG and GIP. The transaction is reflected in the Company's Conventional segment. The assets and liabilities transferred to the Company estimates itrelate to interests under common control by GIP and were recorded at historical cost in accordance with ASC 805-50, Business Combinations - Related Issues. The difference between the cash paid and the historical value of the entities' equity was recorded as a distribution to GIP and decreased the balance of its noncontrolling interest. The acquisition was determined to be an asset acquisition and not a business combination, therefore no recast of the historical financial information was deemed necessary.
The following is a summary of assets and liabilities transferred in connection with the acquisition as of December 6, 2019:
|
| | |
| | CBAD Holdings, LLC |
| | (In millions) |
| Current Assets | | $36 |
| Property, plant and equipment | | 572 |
| Intangible assets, net | | 337 |
| Other non-current assets | | 51 |
| Total assets | | 996 |
| | |
Debt (a) | | 791 |
Other current and non-current liabilities (b) | | 56 |
| Total liabilities | | 847 |
| Net assets acquired | | $149 |
(a)Excludes net debt issuance costs of $12 million.
(b) Other current liabilities and non-current liabilities include a contingent liability of $5 million assumed by the Company during the acquisition.
Duquesne University District Energy System Acquisition — On May 1, 2019, the Company, through its indirect subsidiary ECP Uptown Campus LLC, acquired the Duquesne University district energy system, totaling 82 combined MWt, located in Pittsburgh, PA. As part of the acquisition, Duquesne University entered into a 40-year Energy Services Agreement through which ECP Uptown Campus LLC will record lease liabilitiesfulfill the university's electricity, chilled water and steam requirements in exchange
for monthly capacity payments. The transaction is reflected in the Company's Thermal segment. The total investment for the project is $107 million. This includes $100 million related to the purchase of approximately $160 million to $170 million and right-of-usedistrict energy assets, which was funded through a combination of approximately $155 million to $165issuance of non-recourse debt in the amount of $95 million, as further discussed in Note 10, Long-term Debt, as well as cash on hand. The remaining $7 million related to $3 million of January 1, 2019,restricted cash funded as part of acquisition, as well as $4 million related to future capital expenditures. The acquisition was determined to be an asset acquisition under ASC 805, with an immaterial impact estimated to retained earnings. The actual amounts recorded may vary from this estimate as the Company completes its adoptiona significant majority of the guidance. Other than disclosed,purchase price allocated to property, plant and equipment as of the Company does not expect that there will be a material impact to the consolidated statements of operations, comprehensive income or consolidated cash flows as a result of adoption of this new guidance.
Note 3 — Business Acquisitionsacquisition date.
2018 Acquisitions
UPMC Thermal Project Asset Acquisition— On June 19, 2018, upon reaching substantial completion, the Company acquired from NRG the UPMC Thermal Project for cash consideration of $84 million, subject to working capital adjustments. Themillion. In addition, the Company had a payable of $4 million to NRG as of December 31,2018,31, 2018, $3 million of which was paid in January 2019 upon final completion of the project pursuant to the EPC agreement.agreement and $1 million was paid in January 2020. The project addsadded 73 MWt of thermal equivalent capacity and 7.5 MW of emergency backup electrical capacity to the Company's portfolio. The transaction iswas reflected in the Company's Thermal segment. The acquisition was funded with the proceeds from the sale of the Series E Notes and Series F Notes, as further described in Item 15 — Note 7, 10, Long-term Debt. The assets transferred to the Company relate to interests under common control by NRG and were recorded at book value in accordance with ASC 805-50, Business Combinations - Related Issues. The difference between the purchase price and book value of the assets was recorded as a distribution to NRG and decreased the balance of contributed capital. The acquisition was determined to be an asset acquisition and not a business combination, therefore no recast of the historical financial information was deemed necessary.
Central CA Fuel Cell 1, LLC — On April 18, 2018, the Company acquired the Central CA Fuel Cell 1, LLC project in Tulare, California from FuelCell Energy Finance, Inc., for cash consideration of $11 million, subject to working capital adjustments.million. The project addsadded 2.8 MW of thermal capacity to the Company's portfolio, with a 20-year PPA contract with the City of Tulare. The transaction iswas reflected in the Company's Thermal segment.
Buckthorn Solar Drop Down Asset — On March 30, 2018, the Company acquired 100% of NRG's interests in Buckthorn Renewables, LLC, which owns a 154 MW construction-stage utility-scale solar generation project located in Texas, or the Buckthorn Solar Drop Down Asset, for cash consideration of approximately $42 million, subject to working capital adjustments.million. The Company also assumed non-recourse debt of $183 million and non-controlling interest of $19 million (as of acquisition date) attributable to the Class A member, as further described below.member. The Company converted $132 million of non-recourse debt to a term loan and the remainder of the outstanding debt was paid down with the contribution from the Class A member in the amount of $80 million upon the project reaching substantial completion in May 2018. The purchase price for the Buckthorn Solar Drop Down Asset was funded with cash on hand and borrowings from the Company's revolving credit facility. The assets and liabilities transferred to the Company related to interests under common control by NRG and were recorded at historical cost in accordance with ASC 805-50, Business Combinations - Related Issues. The difference between the cash paid and historical value of the entities' equity was recorded as a distribution to NRG and decreased the balance of contributed capital. Since the transaction constituted a transfer of net assetsasset under common control, the guidance requiresrequired retrospective combination of the entities for all periods presented as if the combination had been in effect since the inception of common control.
Buckthorn Solar Portfolio, LLC, a wholly owned subsidiary of Buckthorn Renewables, LLC, is the Class B member in a tax equity partnership, Buckthorn Holdings, LLC, the owner of the Buckthorn Solar Drop Down Asset. The Class A member is a tax equity investor, or TE investor, who receives 99% of allocations of taxable income and other items through the six month anniversary of the placed in service date, at which time the allocations change to 67% through the last calendar year before the flip point, and then back to 99% through the flip point (which occurs when the TE Investor obtains a specified return on its initial investment), at which time the allocations to the TE Investor change to 5% for all the periods thereafter. Before the flip point, the TE investor would receive a priority distribution of distributable cash, as defined, plus a percentage of remaining distributable cash after the priority distribution subject to a percentage cap.
The project sells power under a 25-year PPA to the City of Georgetown, Texas, which commenced in July 2018.
The following is a summary of net assets transferred in connection with the acquisition of the Buckthorn Solar Drop Down Asset as of March 31, 2018:
|
| | | |
| | (In millions) |
| Assets: | |
| Current assets | $ | 20 |
|
| Property, plant and equipment | 212 |
|
| Non-current assets | 3 |
|
| Total assets | 235 |
|
| Liabilities: | |
Debt (Current and non-current) (a) | 176 |
|
| Other current and non-current liabilities | 15 |
|
| Total liabilities | 191 |
|
Less: noncontrolling interest | 19 |
|
| Net assets acquired | $ | 25 |
|
(a)Net of $7 million of net debt issuance costs.
The following table presents a summary of the Company's historical information for the year ended December 31, 2017, which combines the financial information for the Buckthorn Solar Drop Down Asset transferred in connection with the acquisition.
|
| | | | | | | | | | | |
| | Year ended December 31, 2017 |
| | As Previously Reported | | Buckthorn Solar Drop Down Asset | | As Currently Reported |
| (In millions) | | | | | |
| Total operating revenues | $ | 1,009 |
| | $ | — |
| | $ | 1,009 |
|
| Operating income | 283 |
| | — |
| | 283 |
|
| Net income | 62 |
| | (1 | ) | | 61 |
|
| Net income attributable to Clearway Energy LLC | 137 |
| | (1 | ) | | 136 |
|
The Buckthorn Solar Drop Down Asset had no impact on the Company's consolidated statements of operations for the year end ended December 31, 2016.
2017 Acquisitions
November 2017 Drop Down Assets — On November 1, 2017, the Company acquired a 38 MW solar portfolio primarily comprised of assets from NRG's Solar Power Partners (SPP) funds and other projects developed by NRG, for cash consideration of $74 million, including working capital adjustments, plus assumed non-recourse debt of $26 million.
The purchase price for the November 2017 Drop Down Assets was funded with cash on hand. The assets and liabilities transferred to the Company relate to interests under common control by NRG and were recorded at historical cost in accordance with ASC 805-50, Business Combinations - Related Issues. The difference between the cash paid and historical value of the entities' equity was recorded as a contribution from NRG and increased the balance of contributed capital. Since the transaction constituted a transfer of net assets under common control, the guidance requiresrequired retrospective combination of the entities for all periods presented as if the combination hashad been in effect since the inception of common control.
August 2017 Drop Down Assets — On August 1, 2017, the Company acquired the remaining 25% interest in Wind TE Holdco, a portfolio of 12 wind projects, from NRG for total cash consideration of $44 million, including working capital adjustments.million. The purchase agreement also included potential additional payments to NRG dependent upon actual energy prices for merchant periods beginning in 2027, which were estimated and accrued as contingent consideration in the amount of $8 million.
The Company originally acquired 75% of Wind TE Holdco on November 3, 2015, or November 2015 Drop Down Assets, which were consolidated with 25% of the net assets recorded as noncontrolling interest. The assets and liabilities transferred to the Company related to interests under common control by NRG and were recorded at historical cost in accordance with ASC
805-50, Business Combination - Related Issues. As the Company had reflected NRG's 25% ownership of Wind TE Holdco in
noncontrolling interest, the difference between the cash paid of $44 million, net of the contingent consideration of $8 million, and the historical value of the remaining 25% of $87 million as of July 31, 2017, was recorded as an adjustment to NRG's noncontrolling interest. Since the transaction constituted a transfer of entities under common control, the accounting guidance requires retrospective combination of the entities for all periods presented as if the combination has been in effect from the beginning of the financial statement period or from the date the entities were under common control (if later than the beginning of the financial statement period).
March 2017 Drop Down Assets — On March 27, 2017, the Company acquired the following interests from NRG: (i) Agua Caliente Borrower 2 LLC, which owns a 16% interest (approximately 31% of NRG's 51% interest) in the Agua Caliente solar farm, one of the ROFO Assets, representing ownership of approximately 46 net MW of capacity and (ii) NRG's interests in the Utah Solar Portfolio. Agua Caliente is located in Yuma County, AZ and sells power subject to a 25-year PPA with Pacific Gas and Electric, with 22 years remaining on that contract.Electric. The seven utility-scale solar farms in the Utah Solar Portfolio are owned by the following entities: Four Brothers Capital, LLC, Iron Springs Capital, LLC, and Granite Mountain Capital, LLC. These utility-scale solar farms achieved commercial operations in 2016, sell power subject to 20-year PPAs with PacifiCorp, a subsidiary of Berkshire Hathaway and are part of a tax equity structure with Dominion Solar Projects III, Inc., or Dominion, through which the Company is entitled to receive 50% of cash to be distributed. The Company paid cash consideration of $128 million, which includes $3 million of final net working capital adjustment received by the Company from NRG.million. The acquisition of the March 2017 Drop Down Assets was funded with cash on hand. The Company recorded the acquired interests as equity method investments. The Company also assumed non-recourse debt of $41 million and $287 million on Agua Caliente Borrower 2 LLC and the Utah Solar Portfolio, respectively, as well as its pro-rata share of non-recourse project-level debt of Agua Caliente Solar LLC.
The assets and liabilities transferred to the Company relate to interests under common control by NRG and were recorded at historical cost in accordance with ASC 805-50, Business Combination - Related Issues. The difference between the cash paid and the historical value of the entities' equity of $8 million was recorded as an adjustment to contributed capital. Since the transaction constituted a transfer
2019 Dispositions and Assets Held for Sale
Sale of entities under common control, the accounting guidance requires retrospective combination of the entities for all periods presented as if the combination has been in effect from the beginning of the financial statement period or from the date the entities were under common control (if later than the beginning of the financial statement period).
2016 Acquisitions
CVSR Drop Down Energy Center Dover LLC and Energy Center Smyrna LLC Assets — Prior toOn September 1, 2016,5, 2019, the Company hadentered into a 48.95% interestpurchase and sale agreement with DB Energy Assets, LLC to sell 100% of its interests in CVSR, which was accountedEnergy Center Dover LLC and Energy Center Smyrna LLC, Energy Center Dover LLC owns a 103 MW natural gas-fired cogeneration facility located in Dover, DE (Energy Center Dover). The transaction is subject to standard regulatory approvals and the completion of certain maintenance activities. The related assets and liabilities were classified as held for sale and recorded to other current assets and non-current assets, as an equity method investment.well as current liabilities on the Company’s consolidated balance sheets as of December 31, 2019.
Sale of HSD Solar Holdings, LLC Assets — On September 1, 2016,October 8, 2019, the Company, acquired from NRGthrough HSD Solar Holdings, LLC, or HSD, sold 100% of its interests in certain distributed generation solar facilities totaling 6 MW to the remaining 51.05% interest of CVSR Holdco LLC, which indirectly ownsofftaker under the CVSR solar facility, or the CVSR Drop Down,PPA, for total cash consideration of $78.5$20 million, plus an immaterial working capital adjustment. The acquisition was funded with cash on hand. The Company also assumed additional debt of $496 million, which represents 51.05%as a result of the CVSRofftaker exercising its right to purchase the project level debt and 51.05% of the notes issued under the CVSR Holdco Financing Agreement, as of the closing date.
The assets and liabilities transferredpursuant to the Company related to interests under common control by NRG and were recorded at historical cost in accordance with ASC 805-50, Business Combinations - Related Issues. The difference between the cash paid and historical value of the CVSR Drop Down of $112 million, as well as $6 million of AOCL, was recorded as a distribution to NRGPPA. In conjunction with the offset to contributed capital. Becausesale, the transaction constituted a transfer of net assets under common control,Company repaid in full the guidance requires retrospective combination of the entities for all periods presented as if the combination has been in effect since the inception of common control. In connectionnon-recourse lease financing associated with the retrospective adjustmentHSD projects. The repaid amount was net of prior periods, the Company now consolidates CVSRcash released at closing and 100% of its debt, consisting of $771 million of project level debt and $200 million of notes issued under the CVSR Holdco Financing Agreement as of September 1, 2016. In addition, the Company has removed the equity method investment from all prior periods and adjusted its financial statements to reflect its results of operations, financial position and cash flows as if it had consolidated CVSR from the beginning of the financial statement period.totaled $23 million.
Note 4 — Property, Plant and Equipment
The Company’s major classes of property, plant, and equipment were as follows:
|
| | | | | | | | | |
| | December 31, 2019 | | December 31, 2018 | | Depreciable Lives |
| | (In millions) | | |
| Facilities and equipment | $ | 7,676 |
| | $ | 6,638 |
| | 2 - 45 Years |
| Land and improvements | 173 |
| | 171 |
| | |
Construction in progress (a) | 94 |
| | 26 |
| | |
| Total property, plant and equipment | 7,943 |
| | 6,835 |
| | |
| Accumulated depreciation | (1,880 | ) | | (1,590 | ) | | |
| Net property, plant and equipment | $ | 6,063 |
| | $ | 5,245 |
| | |
|
| | | | | | | | | |
| | December 31, 2018 | | December 31, 2017 | | Depreciable Lives |
| | (In millions) | | |
| Facilities and equipment | $ | 6,638 |
| | $ | 6,291 |
| | 2 - 45 Years |
| Land and improvements | 171 |
| | 166 |
| | |
Construction in progress (a) | 26 |
| | 238 |
| | |
| Total property, plant and equipment | 6,835 |
| | 6,695 |
| | |
| Accumulated depreciation | (1,590 | ) | | (1,285 | ) | | |
| Net property, plant and equipment | $ | 5,245 |
| | $ | 5,410 |
| | |
(a) As of December 31, 20182019 and 2017,2018, construction in progress includes $6$10 million and $24$6 million of capital expenditures that relate to prepaid long-term service agreements in the Conventional segment, respectively.
Depreciation expense related to property, plant and equipment during the years ended December 31, 2019 and December 31, 2018 was $395 million and $330 million, respectively. The Company accelerated depreciation of the Wildorado Wind and
Elbow Creek projects in connection with the repowering project, which resulted in additional depreciation expense in the amount of$54 million.
The Company recorded long-lived asset impairments during the year ended December 31, 2017,2019, as further described in Note 9, Asset Impairments.
Note 5 — Investments Accounted for by the Equity Method and Variable Interest Entities
Equity Method Investments
The following table summarizes the Company's equity method investments as of December 31, 2018:2019:
| | | Name | | Economic Interest | | Investment Balance | | Economic Interest | | Investment Balance |
| | | (In millions) | | (In millions) |
Utah Solar Portfolio (a) | | 50% | | $317 | | 50% | | $285 |
Desert Sunlight(e)(d) | | 25% | | 264 | | 25% | | 274 |
GenConn(b) | | 50% | | 98 | | 50% | | 94 |
Agua Caliente Solar(e)(d) | | 16% | | 90 | | 16% | | 96 |
Elkhorn Ridge(c) | | 66.7% | | 59 | | 66.7% | | 48 |
San Juan Mesa(c) | | 75% | | 57 | | 75% | | 49 |
DGPV Holdco 1 LLC (d)(c) | | 95% | | 81 | | 95% | | 81 |
DGPV Holdco 2 LLC (d)(c) | | 95% | | 63 | | 95% | | 68 |
DGPV Holdco 3 LLC (d)(c) | | 99% | | 116 | | 99% | | 169 |
RPV Holdco 1 LLC(d)(c) | | 95% | | 29 | | 95% | | 24 |
Avenal(e)(d) | | 50% | | (2) | | 50% | | (5) |
| | | $1,172 | | $1,183 |
(a) Economic interest based on cash to be distributed. Four Brothers Solar, LLC, Granite Mountain Holdings, LLC and Iron Springs Holdings, LLC are tax equity structures and VIEs. The related allocations are described below.
(b) GenConn is a variable interest entity.
(c) San Juan Mesa and Elkhorn Ridge are part of the Wind TE Holdco tax equity structure, as described below. San Juan Mesa and Elkhorn Ridge are owned 75% and 66.7%, respectively, by Wind TE Holdco. The Company owns 100% of the Class B interests in Wind TE Holdco.
(d) Economic interest based on cash to be distributed. DGPV Holdco 1 LLC, DGPV Holdco 2 LLC, DGPV Holdco 3 LLC and RPV Holdco 1 LLC are tax equity structures and VIEs. The related allocations are described below.
(e)(d) Entities that have PPAs with PG&E. On January 29, 2019, PG&E filed for bankruptcy under Chapter 11 of the U.S. Bankruptcy Code. The Company has non-recourse project-level debt, and in some cases holding company debt, related to each of its subsidiaries that sell their output to PG&E under long-term PPAs. The PG&E bankruptcyBankruptcy filing is an event of default under the related financing agreements, and as a result, the respective lenders under these arrangements may accelerate the repayment of these debt balances. In addition, the event of default may have an impact on the Company’s ability to distribute cash from the project-level cash accounts to the parent entities. The Company continues to operate the projects in the normal course of business and is currently in the process of negotiating forbearance agreements with the related lenders.
As of December 31, 20182019 and 2017,2018, the Company had $87$138 million and $57$87 million, respectively, of undistributed earnings from its equity method investments.
The Company acquired its interest in Desert Sunlight on June 30, 2015, for $285 million, which resulted in a difference between the purchase price and the basis of the acquired assets and liabilities of $171 million. The difference is attributable to the fair value of the property, plant and equipment and power purchase agreements. In addition, the difference between the basis of the acquired assets and liabilities and the purchase price for the Utah Solar Portfolio (Four Brothers Solar, LLC, Granite Mountain Holdings, LLC and Iron Springs Holdings, LLC) of $106 million is attributable to the fair value of the property, plant and equipment. The Company is amortizing the related basis differences to equity in earnings (losses) over the related useful life of the underlying assets acquired.
Non-recourse project-level debt of unconsolidated affiliates
The Company's pro-rata share of non-recourse debt held by unconsolidated affiliates was $878$889 million as of December 31, 2018.2019. This included $432$411 million attributable to Desert Sunlight, Agua Caliente Solar, and Avenal, the unconsolidated affiliates that sell output to PG&E under long-term PPAs.
The following tables present summarized financial information for the Company's significant equity method investments:
|
| | | | | | | | | | | |
| | Year Ended December 31, |
| | 2019 | | 2018 | | 2017 |
| Income Statement Data: | (In millions) |
| GenConn | | | | | |
| Operating revenues | $ | 60 |
| | $ | 65 |
| | $ | 71 |
|
| Operating income | 27 |
| | 32 |
| | 36 |
|
| Net income | 17 |
| | 22 |
| | 26 |
|
| Desert Sunlight | | | | | |
| Operating revenues | 205 |
| | 208 |
| | 207 |
|
| Operating income | 123 |
| | 129 |
| | 127 |
|
| Net income | 58 |
| | 84 |
| | 80 |
|
DGPV entities (a) | | | | | |
| Operating revenues | 77 |
| | 69 |
| | 37 |
|
| Operating income | 25 |
| | 23 |
| | 7 |
|
| Net income (loss) | (14 | ) | | 11 |
| | (3 | ) |
Other (b) | | | | | |
| Operating revenues | 241 |
| | 263 |
| | 263 |
|
| Operating income | 85 |
| | 103 |
| | 92 |
|
| Net income | $ | 64 |
| | $ | 75 |
| | $ | 59 |
|
| | | | | | |
| | | | As of December 31, |
| | | | 2019 | | 2018 |
| Balance Sheet Data: | | | (In millions) |
| GenConn | | | | |
| Current assets | | $ | 37 |
| | $ | 43 |
|
| Non-current assets | | 342 |
| | 358 |
|
| Current liabilities | | 16 |
| | 22 |
|
| Non-current liabilities | | 176 |
| | 182 |
|
| Desert Sunlight | | | | |
| Current assets | | 209 |
| | 133 |
|
| Non-current assets | | 1,296 |
| | 1,298 |
|
| Current liabilities | | 545 |
| | 58 |
|
| Non-current liabilities | | 484 |
| | 962 |
|
DGPV entities (a) | | | | |
| Current assets | | 84 |
| | 79 |
|
| Non-current assets | | 898 |
| | 784 |
|
| Current liabilities | | 42 |
| | 84 |
|
| Non-current liabilities | | 411 |
| | 314 |
|
| Redeemable Noncontrolling Interest | | (1 | ) | | — |
|
Other (b) | | | | |
| Current assets | | 195 |
| | 150 |
|
| Non-current assets | | 2,514 |
| | 2,684 |
|
| Current liabilities | | 767 |
| | 59 |
|
| Non-current liabilities | | $ | 89 |
| | $ | 897 |
|
|
| | | | | | | | | | | |
| | Year Ended December 31, |
| | 2018 | | 2017 | | 2016 |
| Income Statement Data: | (In millions) |
| GenConn | | | | | |
| Operating revenues | $ | 65 |
| | $ | 71 |
| | $ | 72 |
|
| Operating income | 32 |
| | 36 |
| | 38 |
|
| Net income | 22 |
| | 26 |
| | 26 |
|
| Desert Sunlight | | | | | |
| Operating revenues | 208 |
| | 207 |
| | 211 |
|
| Operating income | 129 |
| | 127 |
| | 129 |
|
| Net income | 84 |
| | 80 |
| | 80 |
|
DGPV entities (a) | | | | | |
| Operating revenues | 69 |
| | 37 |
| | 14 |
|
| Operating income | 23 |
| | 7 |
| | 2 |
|
| Net income (loss) | 11 |
| | (3 | ) | | — |
|
| RPV Holdco | | | | | |
| Operating revenues | 14 |
| | 16 |
| | 13 |
|
| Operating income | — |
| | 3 |
| | 2 |
|
| Net income | — |
| | 3 |
| | 2 |
|
Other (b) | | | | | |
| Operating revenues | 249 |
| | 247 |
| | 193 |
|
| Operating income | 103 |
| | 89 |
| | 71 |
|
| Net income | $ | 75 |
| | $ | 56 |
| | $ | 38 |
|
| | | | | | |
| | | | As of December 31, |
| | | | 2018 | | 2017 |
| Balance Sheet Data: | | | (In millions) |
| GenConn | | | | |
| Current assets | | $ | 43 |
| | $ | 38 |
|
| Non-current assets | | 358 |
| | 374 |
|
| Current liabilities | | 22 |
| | 18 |
|
| Non-current liabilities | | 182 |
| | 189 |
|
| Desert Sunlight | | | | |
| Current assets | | 133 |
| | 133 |
|
| Non-current assets | | 1,298 |
| | 1,350 |
|
| Current liabilities | | 58 |
| | 64 |
|
| Non-current liabilities | | 962 |
| | 1,003 |
|
DGPV entities (a) | | | | |
| Current assets | | 79 |
| | 74 |
|
| Non-current assets | | 784 |
| | 671 |
|
| Current liabilities | | 84 |
| | 83 |
|
| Non-current liabilities | | 314 |
| | 216 |
|
| Redeemable Noncontrolling Interest | | — |
| | 44 |
|
| RPV Holdco | | | | |
| Current assets | | 2 |
| | 3 |
|
| Non-current assets | | 173 |
| | 183 |
|
| Current liabilities | | 1 |
| | — |
|
| Non-current liabilities | | 8 |
| | 7 |
|
| Redeemable Noncontrolling Interest | | 26 |
| | 16 |
|
Other (b) | | | | |
| Current assets | | 148 |
| | 139 |
|
| Non-current assets | | 2,511 |
| | 2,621 |
|
| Current liabilities | | 58 |
| | 60 |
|
| Non-current liabilities | | $ | 889 |
| | $ | 932 |
|
(a) Includes DGPV Holdco 1, DGPV Holdco 2 and DGPV Holdco 3
(b) Includes Agua Caliente, Elkhorn Ridge, RPV Holdco 1, Utah Solar Portfolio Avenal, Elkhorn Ridge and San Juan Mesa
Variable Interest Entities, or VIEs
Entities that are Consolidated
The Company has a controlling financial interest in certain entities which have been identified as VIEs under ASC 810, Consolidations, or ASC 810. These arrangements are primarily related to tax equity arrangements entered into with third parties in order to monetize certain tax credits associated with wind facilities and are further described below.
Kawailoa Partnership — On August 31, 2018, the Company entered into an agreement with Clearway Renew LLC, a subsidiary of CEG, to acquire the Class A membership interests in the Kawailoa Solar Partnership LLC, or Kawailoa Partnership, for $9 million in cash consideration. The purpose of the partnership is to own, finance, operate, and maintain the Kawailoa Solar
project, a 49 MW utility-scale solar generation project, an indirect subsidiary of the Kawailoa Partnership, located in Oahu, Hawaii. The Kawailoa Solar project is contracted to sell power under a 22-year PPA with Hawaiian Electric Company, or HECO. The Kawailoa Solar project is 51% owned by the Kawailoa Partnership, with the remaining 49% owned by a third-party investor. The Kawailoa Partnership consolidates the Kawailoa Solar project through its controlling majority interest. On May 7, 2019, the Company made an initial capital contribution of $2 million, which represents 20% of its total anticipated capital contributions. The Company assumed non-recourse debt of $120 million, as further described in Note 10, Long-term Debt, and non-controlling interests attributable to third parties in the amount of $21 million. Effective May 1, 2019, the Company, as a Class A member, is the primary beneficiary through its position as managing member and consolidates Kawailoa Partnership. Allocations of income and taxable items are equal to the distributions of available cash, which is currently 95% to the Company and 5% to Clearway Renew LLC. The Company's acquisition of the Class A membership interests in the Kawailoa Partnership was accounted for as a transfer of assets under common control and was recorded at historical cost in accordance with ASC 805-50, Business Combinations — Related Issues. The difference between the cash paid and payable recorded and the historical value of the assets was recorded as a distribution to CEG and decreased the balance of its noncontrolling interest.
Upon reaching COD in November of 2019, the Kawailoa Solar project's fixed assets were placed in service and began to depreciate. On December 22, 2019, Kawailoa Solar Holdings LLC, a tax equity fund, received its final equity contribution of $61 million. The proceeds were utilized to repay the ITC bridge loan in the amount of $57 million, and the construction debt was converted to term debt (and upsized, with an additional $5 million drawn). Distributions were paid to the third-party investor and Clearway Renew LLC, funded by the excess of the tax equity investment and the term loan upsizing above the amount of the bridge loan repayment and related fees. On December 27, 2019, the Company made its substantial completion contribution of $7 million into the Kawailoa Partnership, which was also utilized to make a distribution to Clearway Renew LLC. In addition, the Company started applying HLBV to allocate income attributable to the tax equity investor during the fourth quarter. The Company recorded $14 million of loss attributable to noncontrolling interest during the period ended December 31, 2019.
Oahu Partnership —- On August 31, 2018, the Company entered into an agreement with Clearway Renew LLC, a subsidiary of CEG, to acquire the Class A membership interests in the Zephyr Oahu Partnership LLC, or Oahu Partnership, for $20 million in cash consideration. The purpose of the partnership is to own, finance, operate, and maintain the Oahu Solar projects, which consist of Lanikuhana and Waipio, utility-scale solar generation projects which represent 15 MW and 46 MW, respectively, the indirect subsidiaries of the Oahu Partnership, located in Oahu, Hawaii. The Oahu Solar projects are contracted to sell power under a 22-year PPA with HECO. The Oahu Partnership consolidates the Oahu Solar projects through its controlling majority interest. On March 8, 2019, the Company made an initial capital contribution of $4 million, which represents 20% of its total anticipated capital contributions. The Company also assumed non-recourse debt of $143 million, as further described in Item 15 — Note 10, Long-term Debt, and $18 million of non-controlling interest attributable to a tax equity investor's initial contribution. Effective March 8, 2019, the Company, as a Class A member, is the primary beneficiary through its position as managing member and consolidates Oahu Partnership. Allocations of income and taxable items are equal to the distributions of available cash, which is currently 95% to the Company and 5% to Clearway Renew LLC. The Company's acquisition of the Class A membership interests in the Oahu Partnership was accounted for as a transfer of assets under common control and was recorded at historical cost in accordance with ASC 805-50, Business Combinations - Related Issues. The difference between the cash paid and payable recorded and the historical value of the assets was recorded as a contribution from CEG and increased the balance of its noncontrolling interest.
Upon reaching COD in September 2019, the Oahu Solar projects' fixed assets were placed in service and began to depreciate and on November 12, 2019 the tax equity investor made its final tax-equity contribution of $71 million. The proceeds were utilized to repay the related ITC bridge loan in the amount of $67 million, and the construction loan was converted to term debt. The Company paid the remaining 80% of the equity commitment in the amount of $16 million to Clearway Renew LLC when the Oahu Solar projects reached certain milestones in December 2019. In addition, the Company started applying HLBV to allocate income attributable to the tax equity investor during the third quarter. The Company recorded $32 million of loss attributable to noncontrolling interest during the period ended December 31, 2019.
Repowering Partnership II LLC — On August 30, 2018, Wind TE Holdco, an indirect subsidiary of the Company, formed Repowering Partnership LLC with Clearway Renew LLC, an indirect subsidiary of CEG, in order to facilitate the repowering of wind facilities of two of its indirect subsidiaries, Elbow Creek Wind Project LLC, or Elbow Creek, and Wildorado Wind LLC, or Wildorado Wind. Wind TE Holdco contributed its interests in the two facilities and Clearway Renew LLC contributed a turbine supply agreement, including title to certain components that qualify for production tax credits. Wind TE Holdco is the managing member of the partnership and consolidates the entity, which is a VIE. Clearway Renew LLC is initially entitled to allocations of 21% of income, which is reflected in Wind TE Holdco’s noncontrolling interests.
On June 14, 2019, Repowering Partnership LLC was replaced with Repowering Partnership II LLC as the owner of the Elbow Creek and Wildorado Wind projects, as well as Repowering Partnership Holdco LLC, which concurrently entered into a
financing agreement for construction debt of total commitment of $352 million, as further described in Item 15 — Note 10,Long-term Debt.
Repowering of the Elbow Creek project was completed and on November 26, 2019, a third party tax equity investor purchased 100% of the Class A membership interests in Elbow Creek Repowering Tax Equity Holdco LLC, or Elbow TE Holdco, for $89 million pursuant to a membership interest purchase agreement dated June 14, 2019. The Company also contributed $4 million. In connection with the completion of the Elbow Creek repowering, the construction loan of $93 million was repaid with the proceeds from the tax equity investor. The Company began applying HLBV during the fourth quarter to allocate income between the partners of Elbow TE Holdco. In connection with the closing, the allocations of income at Repowering Partnership II LLC (which indirectly consolidates both projects) changed to 59.63% for Wind TE Holdco LLC (the Company member) and 40.37% for CWSP Wildorado Elbow Holding LLC (the CEG member). In addition, approximately half of the repowered Wildorado equipment was placed in service in December 2019, with the remaining equipment being placed in service in January of 2020. In connection with repowering of the projects, the Company revised the remaining useful life of the property, plant and equipment, that was replaced, resulting in additional expense of $54 million during the year ended December 31, 2019 related to accelerated depreciation.
On February 7, 2020, the same third party tax equity investor purchased 100% of the Class A membership interests in Wildorado Repowering tax equity Holdco LLC, or Wildorado Holdco LLC, for $148 million. The Company also contributed $112 million. The repowering of the Elbow Creek and Wildorado assets is being referred to as Repowering 1.0 in Item 7 — Management's Discussion and Analysis of Financial Condition and the Results of Operations.
Buckthorn Renewables, LLC — As described in Item 15 — Note 3, Business Acquisitions and Dispositions, on March 30, 2018, the Company acquired 100% of NRG’s interest in a 154 MW construction-stage utility-scale solar generation project, Buckthorn Renewables, LLC, which owns 100% interest in Buckthorn Solar Portfolio, LLC, which in turn owns 100% of the Class B membership interests in Buckthorn Holdings, LLC. Buckthorn Holdings, LLC is a tax equity fund, which is a variable interest entity that is consolidated by Buckthorn Solar Portfolio, LLC. The Company is the primary beneficiary, through its position as managing member, and indirectly consolidates Buckthorn Holdings, LLC through Buckthorn Solar Portfolio, LLC. The Class A member is a tax equity investor who made its initial contribution of $19 million on March 30, 2018, which is reflected as noncontrolling interest on the Company’sCompany's consolidated balance sheet. The project achieved substantial completion in May 2018, at which time the remaining tax equity contributions of $80 million were funded. The Company utilizes the HLBV method to determine the netfor loss or income or loss allocatedallocation to the tax equity investorinvestor's noncontrolling interest. The Company recorded $55$25 million of lossincome attributable to noncontrolling interest in Buckthorn Renewables, LLC during the period ended December 31, 2018.2019.
Wind TE Holdco — As of December 31, 2018, Wind TE Holdco was a VIE and the Company, as the holder of Class B shares and the primary beneficiary through its position as managing member consolidated Wind TE Holdco. The Class A shares of Wind TE Holdco were owned by a tax equity investor, who received 99% of allocations of taxable income and other items.
On January 2, 2019, the Company bought out 100% of the Class A membership interests from the TE Investor, for cash consideration of $19 million.
On August 30, 2018, Wind TE Holdco, entered into a partnership with Clearway Renew LLC, an indirect subsidiary of CEG, in order to facilitate The Company recorded the repowering of wind facilitiesdifference between the value of the two of its indirect subsidiaries, Elbow Creek Wind Project LLCinterest bought and Wildorado Wind LLC. Wind TE Holdco contributed its intereststhe cash received to equity and allocated it between non-controlling interest and additional paid in the two facilities and Clearway Renew LLC contributed a turbine supply agreement, including title to certain components that qualify for production tax credits. Clearway Renew LLC paid a total of $35 million to the service provider, which was recorded to other non current assetscapital based on the Company's consolidated balance sheetseconomic ownership interest between CEG and public interest as of December 31, 2018. Wind TE Holdco is the managing member of Repowering Partnership LLC and consolidates the entity, which is a VIE. Clearway Renew LLC is entitled to allocations of 21% of income, which is reflected in Wind TE Holdco’s noncontrolling interests.January 2, 2019.
Alta TE Holdco — On June 30, 2015, the Company sold an economic interest in Alta TE Holdco to a financial institution in order to monetize certain cash and tax attributes, primarily PTCs. The financial institution, or Alta Investor, receives 99% of allocations of taxable income and other items until the flip point, which occurs when the Alta Investor obtains a specified return on its initial investment, at which time the allocations to the Alta Investor change to 5%. The Company receives 94.34% until the flip point, at which time the allocations to the Company of CAFD will change to 97.12%, unless the flip point will not have occurred by a specified date, which would result in 100% of CAFD allocated to the Alta Investor until the flip point occurs. Alta TE Holdco is a VIE and the Company is the primary beneficiary through its position as managing member, and therefore consolidates Alta TE Holdco, with the Alta Investor's interest shown as noncontrolling interest. The Company utilizes the HLBV method to determine the net income or loss allocated to the noncontrolling interest.
Spring Canyon — The Company holds 90.1% of the Class B interests in Spring Canyon II, a 32 MW wind facility, and Spring Canyon III, a 28 MW wind facility, each located in Logan County, Colorado, and Invenergy Wind Global LLC owns 9.9% of the Class B interests. The projects are financed with a partnership flip tax-equity structure with a financial institution, who owns the Class A interests, to monetize certain cash and tax attributes, primarily PTCs. Until the flip point, the Class A member receives a variable percentage of cash distributions based on the projects’ production level during the prior year. The Class A member received 34.81% of the cash distributions and the Company and Invenergy received 65.19% during the period ended December 31, 2017. After the flip point, cash distributions are allocated 5% to the Class A member and 95% to the Company and Invenergy. Spring Canyon is a VIE and the Company is the primary beneficiary through its position as managing member, and
therefore consolidates Spring Canyon. The Class A member and Invenergy's interests are shown as noncontrolling interest. The Company utilizes the HLBV method to determine the net income or loss allocated to the Class A member. Net income or loss attributable to the Class B interests is allocated to Invenergy's noncontrolling interest based on its 9.9% ownership interest.
Summarized financial information for the Company's consolidated VIEs consisted of the following as of December 31, 2018:2019:
|
| | | | | | | | | | | | | | | | | | | | | | | | | | | |
| (In millions) | Oahu Solar Partnership | | Kawailoa Partnership | | Repowering Partnership II LLC | | Alta TE Holdco | | Spring Canyon | | Buckthorn Renewables, LLC | | Other (a) |
| Other current and non-current assets | $ | 27 |
| | $ | 24 |
| | $ | 31 |
| | $ | 55 |
| | $ | 3 |
| | $ | 6 |
| | $ | 4 |
|
| Property, plant and equipment | 188 |
| | 147 |
| | 340 |
| | 381 |
| | 86 |
| | 214 |
| | 9 |
|
| Intangible assets | — |
| | — |
| | 1 |
| | 237 |
| | — |
| | — |
| | — |
|
| Total assets | 215 |
| | 171 |
| | 372 |
| | 673 |
| | 89 |
| | 220 |
| | 13 |
|
| Current and non-current liabilities | 120 |
| | 109 |
| | 273 |
| | 44 |
| | 6 |
| | 11 |
| | 3 |
|
| Total liabilities | 120 |
| | 109 |
| | 273 |
| | 44 |
| | 6 |
| | 11 |
| | 3 |
|
| Noncontrolling interest | 42 |
| | 52 |
| | 77 |
| | 48 |
| | 32 |
| | 66 |
| | — |
|
| Net assets less noncontrolling interests | $ | 53 |
| | $ | 10 |
| | $ | 22 |
| | $ | 581 |
| | $ | 51 |
| | $ | 143 |
| | $ | 10 |
|
|
| | | | | | | | | | | | | | | |
| (In millions) | Wind TE Holdco | | Alta TE Holdco | | Spring Canyon | | Buckthorn Renewables, LLC |
| Other current and non-current assets | $ | 215 |
| | $ | 17 |
| | $ | 2 |
| | $ | 15 |
|
| Property, plant and equipment | 346 |
| | 410 |
| | 91 |
| | 223 |
|
| Intangible assets | 2 |
| | 249 |
| | — |
| | — |
|
| Total assets | 563 |
| | 676 |
| | 93 |
| | 238 |
|
| Current and non-current liabilities | 210 |
| | 9 |
| | 4 |
| | |
| Total liabilities | 210 |
| | 9 |
| | 4 |
| | 135 |
|
| Noncontrolling interest | 45 |
| | 63 |
| | 49 |
| | 43 |
|
| Net assets less noncontrolling interests | $ | 308 |
| | $ | 604 |
| | $ | 40 |
| | $ | 60 |
|
(a)Other is comprised of Crosswinds and Hardin projects, that were determined to be VIEs during the year ended December 31, 2019. Previously reported as part of Wind TE Holdco that is no longer a VIE in 2019.
Entities that are not Consolidated
The Company has interests in entities that are considered VIEs under ASC 810, Consolidation, but for which it is not considered the primary beneficiary. The Company accounts for its interests in these entities under the equity method of accounting.
Utah Solar Portfolio Assets — As described in Item 15 — Note 3, Business Acquisitions, as part of the March 2017 Drop Down Assets acquisition, the Company acquired from NRG 100% of the Class A equity interests in the Utah Solar Portfolio, comprised of Four Brothers Solar, LLC, Granite Mountain Holdings, LLC, and Iron Springs Holdings, LLC. The Class B interests of the Utah Solar Portfolio are owned by a tax equity investor, or TE Investor, who receives 99% of allocations of taxable income and other items until the flip point, which occurs on the last day of the calendar month on which the Class B member does not have an agreed upon adjusted capital account deficit, but not prior to the 10th day after the five year anniversary of the last project to achieve its placed in service date, at which time the allocations to the TE Investor change to 50%. The Company generally receives 50% of distributable cash throughout the term of the tax-equity arrangements. The three entities comprising the Utah Solar Portfolio are VIEs. As the Company is not the primary beneficiary, the Company uses the equity method of accounting to account for its interests in the Utah Solar Portfolio. The Company utilizes the HLBV method to determine its share of the income or losses in the investees.
DGPV Holdco 1 LLC — The Company and CEG are parties to the DGPV Holdco 1 LLC partnership, or DGPV Holdco 1, the purpose of which is to own or purchase solar power generation projects and other ancillary related assets from Clearway Energy Group LLC or its subsidiaries via intermediate funds. The Company owns approximately 52 MW of distributed solarDistributed Solar capacity, based on cash to be distributed, with a weighted average contract life of 1716 years. Under this partnership, the Company committed to fund up to $100 million of capital.
DGPV Holdco 2 LLC — The Company and CEG are parties to the DGPV Holdco 2 LLC partnership, or DGPV Holdco 2, the purpose of which is to own or hold solar power generation projects as well as other ancillary related assets from Clearway Energy Group LLC or its subsidiaries. The Company owns approximately 113 MW of distributed solarDistributed Solar capacity, based on cash to be distributed, with a weighted average contract life of 2019 years. Under this partnership, the Company committed to fund up to $60 million of capital.
DGPV Holdco 3 LLC— The Company and CEG are parties to the DGPV Holdco 3 LLC partnership, or DGPV Holdco 3, in which the Company would invest up to $50$70 million in an operating portfolio of distributed solar assets, primarily comprised of community solar projects, developed by CEG. The Company owns approximately 59112 MW of distributed solar capacity, based on cash to be distributed, with a weighted average contract life of approximately 21 years as of December 31, 2018. In December 2018, the Company and CEG amended the DGPV Holdco 3 partnership agreement to increase the capital commitment of $50 million to $70 million.2019. The Company had a $9$14 million payable due to DGPV Holdco 3 LLC as of December 31, 2018.2019.
The Company's maximum exposure to loss is limited to its equity investment in DGPV Holdco 1, DGPV Holdco 2 and DGPV Holdco 3, which was $260$318 million on a combined basis.
RPV Holdco 1 LLC — The Company and CEG are parties to the RPV Holdco 1 LLC partnership, or RPV Holdco, the purpose of which is to hold operating portfolios of residential solar assets developed by NRG's residential solar business, including: (i) an existing, unlevered portfolio of overapproximately 2,200 leases across nine states representing approximately 14 MW, based on cash to be distributed, with a weighted average remaining lease term of approximately 1413 years that was acquired outside of the partnership; and (ii) a tax equity-financed portfolio of approximately 5,4005,300 leases representing approximately 3031 MW, based on cash to be distributed, with a weighted average remaining lease term for the existing and new leases of approximately 1715 years. The Company has fully funded the partnership as of December 31, 2017.
The Company's maximum exposure to loss is limited to its equity investment, which was $29$24 million as of December 31, 2018.2019.
Note 6 — Fair Value of Financial Instruments
For cash and cash equivalents, restricted cash, accounts receivable — affiliate, accounts receivable, accounts payable, current portion of accounts payable — affiliate, accrued expenses and other liabilities, the carrying amount approximates fair value because of the short-term maturity of those instruments and are classified as Level 1 within the fair value hierarchy.
The estimated carrying amounts and fair values of the Company’s recorded financial instruments not carried at fair market value are as follows:
|
| | | | | | | | | | | | | | | |
| | As of December 31, 2018 | | As of December 31, 2017 |
| | Carrying Amount | | Fair Value | | Carrying Amount | | Fair Value |
| | (In millions) |
| Assets: | | | | | | | |
| Notes receivable, including current portion | $ | — |
| | $ | — |
| | $ | 13 |
| | $ | 13 |
|
| Liabilities: | | | | | | | |
| Long-term debt, including current portion — affiliate | 259 |
| | 257 |
| | 618 |
| | 618 |
|
| Long-term debt, including current portion — external | $ | 5,779 |
| | $ | 5,681 |
| | $ | 5,450 |
| | $ | 5,466 |
|
Fair Value Accounting under ASC 820
ASC 820 establishes a fair value hierarchy that prioritizes the inputs to valuation techniques used to measure fair value into three levels as follows:
Level 1—quoted prices (unadjusted) in active markets for identical assets or liabilities that the Company has the ability to access as of the measurement date.
Level 2—inputs other than quoted prices included within Level 1 that are directly observable for the asset or liability or indirectly observable through corroboration with observable market data.
Level 3—unobservable inputs for the asset or liability only used when there is little, if any, market activity for the asset or liability at the measurement date.
In accordance with ASC 820, the Company determines the level in the fair value hierarchy within which each fair value measurement in its entirety falls, based on the lowest level input that is significant to the fair value measurement.
For cash and cash equivalents, restricted cash, accounts receivable — affiliate, accounts receivable, accounts payable, current portion of accounts payable — affiliate, accrued expenses and other liabilities, the carrying amount approximates fair value because of the short-term maturity of those instruments and are classified as Level 1 within the fair value hierarchy
The estimated carrying amounts and fair values of the Company’s recorded financial instruments not carried at fair market value are as follows:
|
| | | | | | | | | | | | | | | |
| | As of December 31, 2019 | | As of December 31, 2018 |
| | Carrying Amount | | Fair Value | | Carrying Amount | | Fair Value |
| | (In millions) |
| Liabilities: | | | | | | | |
| Long-term debt, including current portion — affiliate | 44 |
| | 43 |
| | 259 |
| | 257 |
|
Long-term debt, including current portion — external (a) | $ | 6,813 |
| | $ | 6,913 |
| | $ | 5,779 |
| | $ | 5,681 |
|
(a) Excludes net debt issuance costs, which are recorded as a reduction to long-term debt on the Company's consolidated balance sheets.
The fair value of the Company's publicly-traded long-term debt is based on quoted market prices and is classified as Level 2 within the fair value hierarchy. The fair value of debt securities, non-publicly traded long-term debt, affiliate debt and certain notes receivable of the Company are based on expected future cash flows discounted at market interest rates, or current interest rates for similar instruments with equivalent credit quality and are classified as Level 3 within the fair value hierarchy. The following table presents the level within the fair value hierarchy for long-term debt, including current portion as of December 31, 20182019 and 2017:2018:
|
| | | | | | | | | | | | | | | |
| | As of December 31, 2019 | | As of December 31, 2018 |
| | Level 2 | | Level 3 | | Level 2 | | Level 3 |
| | (In millions) |
| Long-term debt, including current portion | $ | 1,735 |
| | $ | 5,221 |
| | $ | 1,358 |
| | $ | 4,580 |
|
|
| | | | | | | | | | | | | | | |
| | As of December 31, 2018 | | As of December 31, 2017 |
| | Level 2 | | Level 3 | | Level 2 | | Level 3 |
| | (In millions) |
| Long-term debt, including current portion | $ | 1,358 |
| | $ | 4,580 |
| | $ | 870 |
| | $ | 5,214 |
|
Recurring Fair Value Measurements
The Company records its derivative assets and liabilities at fair market value on its consolidated balance sheet. The following table presents assets and liabilities measured and recorded at fair value on the Company's consolidated balance sheets on a recurring basis and their level within the fair value hierarchy:
| | | | As of December 31, 2018 | | As of December 31, 2017 | As of December 31, 2019 | | As of December 31, 2019 | | As of December 31, 2018 |
| | Fair Value (a) | | Fair Value (a) | Fair Value (a) | | Fair Value (a) | | Fair Value (a) |
| (In millions) | Level 2 | | Level 2 | Level 2 | | Level 3 | | Level 2 |
| Derivative assets: | | | | | | | | |
Commodity contracts (b) | $ | — |
| | $ | 1 |
| |
| Interest rate contracts | 11 |
| | 1 |
| — |
| | — |
| | 11 |
|
| Total assets | $ | 11 |
| | $ | 2 |
| $ | — |
| | $ | — |
| | $ | 11 |
|
| Derivative liabilities: | | | | | | | | |
Commodity contracts (b) | $ | — |
| | 1 |
| $ | — |
| | $ | 9 |
| | $ | — |
|
| Interest rate contracts | 21 |
| | 48 |
| 83 |
| | — |
| | 21 |
|
| Total liabilities | $ | 21 |
| | $ | 49 |
| $ | 83 |
| | $ | 9 |
| | $ | 21 |
|
(a) There were no0 derivative assets or liabilities classified as Level 1 December 31, 2019 and 2018.
The following table reconciles the beginning and ending balances for instruments that are recognized at fair value in the condensed consolidated financial statements using significant unobservable inputs:
|
| | | | | | | | |
| | | Twelve months ended December 31, |
| | | 2019 | | 2018 |
| (In millions) | | Fair Value Measurement Using Significant Unobservable Inputs (Level 3) |
| Beginning balance | | $ | — |
| | $ | — |
|
| Total losses for the period included in earnings | | (3 | ) | | — |
|
| Purchases | | (6 | ) | | — |
|
| Ending balance | | $ | (9 | ) | | $ | — |
|
There were losses of $3 million for the period included in earnings attributable to the change in unrealized losses relating to assets or 3liabilities still held as of December 31, 2018 and 2017.2019.
(b) The fair value of commodities was not material as of December 31, 2018.
Derivative Fair Value Measurements
The Company's contracts are non-exchange-traded and valued using prices provided by external sources. For some of the Company’s energy markets,contracts, management receives quotes from multiple sources. To the extent that multiple quotes are received, the prices reflect the average of the bid-ask mid-point prices obtained from all sources believed to provide the most liquid market for the commodity. The remainder of the assets and liabilities represent contracts for which external sources or observable market quotes are not available. These contracts are valued based on various valuation techniques including, but not limited to, internal models based on a fundamental analysis of the market and extrapolation of the observable market data with similar characteristics. As of December 31, 2019, contracts valued with prices provided by models and other valuation techniques make up 10% of derivative liabilities.
The Company’s significant position classified as Level 3 includes physical power executed in illiquid markets. The significant unobservable inputs used in developing fair value include illiquid power tenors and location pricing, which is derived by extrapolating pricing and as a basis to liquid locations. The tenor pricing and basis spread are based on observable market data, when available, or derived from historic prices and forward market prices from similar observable markets, when not available.
The following tables quantify the significant unobservable inputs used in developing the fair value of the Company's Level 3 positions as of December 31, 2019:
|
| | | | | | | | | | | | | |
| | December 31, 2019 |
| | Fair Value | | Input/Range |
| | Assets | Liabilities | Valuation Technique | Significant Unobservable Input | Low | High | Weighted Average |
| (In millions) | | | | | | | |
| Power Contracts | $ | — |
| (9 | ) | Discounted Cash Flow | Forward Market Price (per MWh) | 5 |
| 33 |
| 12 |
|
The following table provides sensitivity of fair value measurements to increases/(decreases) in significant unobservable inputs as of December 31, 2019:
|
| | | |
| Significant Observable Input | Position | Change In Input | Impact on Fair Value Measurement |
| Forward Market Price Power | Buy | Increase/(Decrease) | Higher/(Lower) |
| Forward Market Price Power | Sell | Increase/(Decrease) | Lower/(Higher) |
The fair value of each contract is discounted using a risk freerisk-free interest rate. In addition, a credit reserve is applied to reflect credit risk, which is, for interest rate swaps, is calculated based on credit default swaps utilizingusing the bilateral method. For commodities, to the extent that the Company's net exposureNet Exposure under a specific master agreement is an asset, the Company uses the counterparty'scounterparty’s default swap rate. If the exposureNet Exposure under a specific master agreement is a liability, the Company uses a proxy of its own default swap rate. For interest rate swaps and commodities, the credit reserve is added to the discounted fair value to reflect the exit price that a market participant would be willing to receive to assume the liabilities or that a market participant would be willing to pay for the assets. As of December 31, 2018,2019, the creditnon-performance reserve was not material.$4 million gain recorded primarily to interest expense in the consolidated statement of operations. It is possible that future market prices could vary from those used in recording assets and liabilities and such variations could be material.
Concentration of Credit Risk
In addition to the credit risk discussion as disclosed in Item 15 — Note 2, Summary of Significant Accounting Policies, the following item is a discussion of the concentration of credit risk for the Company's financial instruments. Credit risk relates to the risk of loss resulting from non-performance or non-payment by counterparties pursuant to the terms of their contractual obligations. The Company monitors and manages credit risk through credit policies that include: (i) an established credit approval process; (ii) daily monitoring of counterparties' credit limits;limits on as needed basis; (iii) as applicable, the use of credit mitigation measures such as margin, collateral, prepayment arrangements, or volumetric limits; (iv) the use of payment netting agreements; and (v) the use of master netting agreements that allow for the netting of positive and negative exposures of various contracts associated with a single counterparty. Risks surrounding counterparty performance and credit could ultimately impact the amount and timing of expected cash flows. The Company seeks to mitigate counterparty risk by having a diversified portfolio of counterparties.
Counterparty credit exposure includes credit risk exposure under certain long-term agreements, including solar and other PPAs. As external sources or observable market quotes are not available to estimate such exposure, the Company estimates the exposure related to these contracts based on various techniques including, but not limited to, internal models based on a fundamental analysis of the market and extrapolation of observable market data with similar characteristics. Based on these valuation techniques, as of December 31, 2018, credit risk exposure to these counterparties attributable to the Company's ownership interests was approximately $2.3 billion for the next five years. The majority of these power contracts are with utilities with strong credit quality and public utility commission or other regulatory support. However, such regulated utility counterparties can be impacted by changes in government regulations or adverse financial conditions, which the Company is unable to predict.
As previously described, onOn January 29, 2019, PG&E filed for reorganization under Chapter 11 of the U.S. Bankruptcy Code. Certain subsidiaries of the Company sell the output of their facilities to PG&E under long-term PPAs, including interests in 6 solar facilities totaling 480 MW and Marsh Landing with a capacity of 720 MW. The Company consolidates three of the solar facilities and Marsh Landing and records its interest in the other solar facilities as equity method investments. The Company had $17$16 million in accounts receivable due from PG&E for its consolidated projects, of which $5 million was recorded to non-current assets as of December 31, 2018. All2019. As of March 2, 2020, the Company's contracts with PG&E have operated in the normal course and the Company currently expects these amounts were collected in January 2019.contracts to continue as such. As of March 2, 2020, the Company has entered into forbearance agreements for certain
project-level financing arrangements and continues to seek forbearance agreements for its other project-level financing arrangements affected by the PG&E Bankruptcy. The Company continues to assess the potential future impacts of the PG&E Bankruptcy as events occur.
Note 7 — Accounting for Derivative Instruments and Hedging Activities
ASC 815 requires the Company to recognize all derivative instruments on the balance sheet as either assets or liabilities and to measure them at fair value each reporting period unless they qualify for a NPNS exception. The Company may elect to designate certain derivatives as cash flow hedges, if certain conditions are met, and defer the change in fair value of the derivatives to accumulated OCI/OCL, until the hedged transactions occur and are recognized in earnings. For derivatives that are not designated as cash flow hedges or do not qualify for hedge accounting treatment, the changes in the fair value will be immediately recognized in earnings. Certain derivative instruments may qualify for the NPNS exception and are therefore exempt from fair value accounting treatment. ASC 815 applies to the Company's energy related commodity contracts and interest rate swaps.
Energy-Related Commodities
To manage the commodity price risk associated with its competitive supply activities and the price risk associated with wholesale power sales, the Company may enter into derivative hedging instruments, namely, forward contracts that commit the Company to sell energy commodities or purchase fuels/electricity in the future. The objectives for entering into derivatives contracts designated as hedges include fixing the price for a portion of anticipated future electricity sales and fixing the price of a portion of anticipated fuel/electricity purchases for the operation of its subsidiaries. As of December 31, 2018,2019, the Company had forward contracts for the sale of electricity from renewable energy assets through 2029, forward contracts for the purchase of fuel commodities relating to the forecasted usage of the Company’s district energy centers extending through 20202021, and electricity contracts to supply retail power to the Company's district energy centers extending through 2020. At December 31, 2018,2019, these contracts were not designated as cash flow or fair value hedges.
Also, as of December 31, 2018,2019, the Company had other energy-related contracts that did not meet the definition of a derivative instrument or qualified for the NPNS exception and were therefore exempt from fair value accounting treatment as follows:
Power purchase agreements through 2043, and
Natural gas transportation contracts through 2028.
Interest Rate Swaps
The Company is exposed to changes in interest rates through the issuance of variable rate debt. In order to manage interest rate risk, it enters into interest rate swap agreements.
As of December 31, 20182019, the Company had interest rate derivative instruments on non-recourse debt extending through 2041, a portion of which are designated as cash flow hedges.
Volumetric Underlying Derivative Transactions
The following table summarizes the net notional volume buy/(sell) of the Company's open derivative transactions broken out by commodity as of December 31, 20182019 and 2017:2018:
| | | | | Total Volume | | Total Volume |
| | | December 31, 2018 | | December 31, 2017 | | December 31, 2019 | | December 31, 2018 |
| Commodity | Units | | (In millions) | Units | | (In millions) |
| Natural Gas | MMBtu | | 1 |
| | 2 |
| MMBtu | | 2 |
| | 1 |
|
| Power | | MWh | | (2 | ) | | — |
|
| Interest | Dollars | | $ | 1,862 |
| | $ | 2,050 |
| Dollars | | $ | 1,788 |
| | $ | 1,862 |
|
Fair Value of Derivative Instruments
The following table summarizes the fair value within the derivative instrument valuation on the balance sheet:
| | | | Fair Value | Fair Value |
| | Derivative Assets (a) | | Derivative Liabilities | | Derivative Assets (a) | | Derivative Liabilities |
| | December 31, 2018 | | December 31, 2017 | | December 31, 2018 | | December 31, 2017 | | December 31, 2018 | | December 31, 2019 | | December 31, 2018 |
| | (In millions) | (In millions) |
| Derivatives Designated as Cash Flow Hedges: | | | | | | | | | | | | | |
| Interest rate contracts current | $ | 2 |
| | $ | — |
| | $ | 1 |
| | $ | 4 |
| | $ | 2 |
| | $ | 3 |
| | $ | 1 |
|
| Interest rate contracts long-term | 3 |
| | 1 |
| | 6 |
| | 9 |
| | 3 |
| | 11 |
| | 6 |
|
| Total Derivatives Designated as Cash Flow Hedges | 5 |
| | 1 |
| | 7 |
| | 13 |
| | 5 |
| | 14 |
| | 7 |
|
| Derivatives Not Designated as Cash Flow Hedges: | | | | | | | | | | | | | |
| Interest rate contracts current | 1 |
| | — |
| | 3 |
| | 13 |
| | 1 |
| | 13 |
| | 3 |
|
| Interest rate contracts long-term | 5 |
| | — |
| | 11 |
| | 22 |
| | 5 |
| | 56 |
| | 11 |
|
Commodity contracts current (b) | — |
| | 1 |
| | — |
| | 1 |
| |
| Commodity contracts long-term | | | — |
| | 9 |
| | — |
|
| Total Derivatives Not Designated as Cash Flow Hedges | 6 |
| | 1 |
| | 14 |
| | 36 |
| | 6 |
| | 78 |
| | 14 |
|
| Total Derivatives | $ | 11 |
| | $ | 2 |
| | $ | 21 |
| | $ | 49 |
| | $ | 11 |
| | $ | 92 |
| | $ | 21 |
|
(a) Derivative Asset balances classified as current are included within the prepayments and other current assets line item of the Consolidated Balance Sheet.
(b) The fair value of commodities was not material as of December 31, 2018
The Company has elected to present derivative assets and liabilities on the balance sheet on a trade-by-trade basis and does not offset amounts at the counterparty master agreement level. As of December 31, 20182019 and 2017,2018, there was no outstanding collateral paid or received. As of December 31, 2018, the commodity balances were not material. The following tables summarize the offsetting of derivatives by counterparty master agreement level:
| |
| Gross Amounts Not Offset in the Statement of Financial Position | Gross Amounts Not Offset in the Statement of Financial Position |
| As of December 31, 2018 | Gross Amounts of Recognized Assets/Liabilities | | Derivative Instruments | | Net Amount | |
| As of December 31, 2019 | | Gross Amounts of Recognized Assets/Liabilities | | Derivative Instruments | | Net Amount |
| Commodity contracts: | | (In millions) |
| Derivative liabilities | | (9 | ) | | (1 | ) | | (10 | ) |
| Total commodity contracts | | (9 | ) | | (1 | ) | | (10 | ) |
| Interest rate contracts: | | | | | | | | | | |
| Derivative assets | $ | 11 |
| | $ | (1 | ) | | $ | 10 |
| |
| Derivative liabilities | (21 | ) | | 1 |
| | (20 | ) | (83 | ) | | 1 |
| | (82 | ) |
| Total interest rate contracts | (10 | ) | | — |
| | (10 | ) | (83 | ) | | 1 |
| | (82 | ) |
| Total derivative instruments | $ | (10 | ) | | $ | — |
| | $ | (10 | ) | $ | (92 | ) | | $ | — |
| | $ | (92 | ) |
|
| | | | | | | | | | | |
| | Gross Amounts Not Offset in the Statement of Financial Position |
| As of December 31, 2018 | Gross Amounts of Recognized Assets/Liabilities | | Derivative Instruments | | Net Amount |
| Interest rate contracts: | | | | | |
| Derivative assets | 11 |
| | (1 | ) | | 10 |
|
| Derivative liabilities | (21 | ) | | 1 |
| | (20 | ) |
| Total interest rate contracts | (10 | ) | | — |
| | (10 | ) |
| Total derivative instruments | $ | (10 | ) | | $ | — |
| | $ | (10 | ) |
|
| | | | | | | | | | | |
| | Gross Amounts Not Offset in the Statement of Financial Position |
| As of December 31, 2017 | Gross Amounts of Recognized Assets/Liabilities | | Derivative Instruments | | Net Amount |
| Commodity contracts: | (In millions) |
| Derivative assets | $ | 1 |
| | $ | — |
| | $ | 1 |
|
| Derivative liabilities | (1 | ) | | — |
| | (1 | ) |
| Total commodity contracts | — |
| | — |
| | — |
|
| Interest rate contracts: | | | | | |
| Derivative assets | 1 |
| | (1 | ) | | — |
|
| Derivative liabilities | (48 | ) | | 1 |
| | (47 | ) |
| Total interest rate contracts | (47 | ) | | — |
| | (47 | ) |
| Total derivative instruments | $ | (47 | ) | | $ | — |
| | $ | (47 | ) |
Accumulated Other Comprehensive Loss
The following table summarizes the effects on the Company’s accumulated OCL balance attributable to interest rate swaps designated as cash flow hedge derivatives:
|
| | | | | | | | | | | |
| | Year ended December 31, |
| | 2019 | | 2018 | | 2017 |
| | (In millions) |
| Accumulated OCL beginning balance | $ | (45 | ) | | $ | (69 | ) | | $ | (86 | ) |
| Reclassified from accumulated OCL to income due to realization of previously deferred amounts | 22 |
| | 15 |
| | 17 |
|
| Mark-to-market of cash flow hedge accounting contracts | (14 | ) | | 9 |
| | — |
|
| Accumulated OCL ending balance | (37 | ) | | (45 | ) | | (69 | ) |
| Accumulated OCL attributable to noncontrolling interests | — |
| | (1 | ) | | (1 | ) |
| Accumulated OCL attributable to Clearway Energy LLC | $ | (37 | ) | | $ | (44 | ) | | $ | (68 | ) |
| Losses expected to be realized from OCL during the next 12 months | $ | (10 | ) | | $ | — |
| | $ | — |
|
|
| | | | | | | | | | | |
| | Year ended December 31, |
| | 2018 | | 2017 | | 2016 |
| | (In millions) |
| Accumulated OCL beginning balance | $ | (69 | ) | | $ | (86 | ) | | $ | (99 | ) |
| Reclassified from accumulated OCL to income due to realization of previously deferred amounts | 15 |
| | 17 |
| | 17 |
|
| Mark-to-market of cash flow hedge accounting contracts | 9 |
| | — |
| | (4 | ) |
| Accumulated OCL ending balance | (45 | ) | | (69 | ) | | (86 | ) |
| Accumulated OCL attributable to noncontrolling interests | (1 | ) | | (1 | ) | | (1 | ) |
| Accumulated OCL attributable to Clearway Energy LLC | $ | (44 | ) | | $ | (68 | ) | | $ | (85 | ) |
| Losses expected to be realized from OCL during the next 12 months | $ | 9 |
| | | | |
Amounts reclassified from accumulated OCL into income are recorded to interest expense.
The Company's regression analysis for Marsh Landing, Walnut Creek and Avra Valley interest rate swaps, while positively correlated, no longer contain matching terms for cash flow hedge accounting. As a result, the Company voluntarily de-designated the Marsh Landing, Walnut Creek and Avra Valley cash flow hedges as of April 28, 2017, and will prospectively markmarks these derivatives to market through the income statement.statement of operations.
Impact of Derivative Instruments on the Statements of Income
The Company has interest rate derivative instruments that are not designated as cash flow hedges. The effect of interest rate hedges is recorded to interest expense. For the years ended December 31, 2019, 2018 2017 and 20162017 the impact to the consolidated statements of income was a loss of $65 million, a gain of $15 million and a gain of $6 million, respectively.
During the year ended December 31, 2019, Elbow Creek entered into a new long-term power hedge, and the impact to the Company's consolidated statement of operations was a $9 million loss of $2 million, respectively.for the period recorded in total operating revenues.
A portion of the Company’s derivative commodity contracts relates to its Thermal Business for the purchase of fuel/electricity commodities based on the forecasted usage of the thermal district energy centers. Realized gains and losses on these contracts are reflected in the costs that are permitted to be billed to customers through the related customer contracts or tariffs and, accordingly, no gains or losses are reflected in the consolidated statements of incomeoperations for these contracts.
See Item 15 — Note 6, Fair Value of Financial Instruments, for a discussion regarding concentration of credit risk.
Note 8 — Intangible Assets
Intangible Assets — The Company's intangible assets as of December 31, 20182019 and 20172018 primarily reflect intangible assets established from its business acquisitions and are comprised of the following:
PPAs — Established predominantly with the acquisitions of the Alta Wind Portfolio, Walnut Creek, Tapestry and Laredo Ridge, these | |
| • | PPAs — Established predominantly with the acquisitions of the Alta Wind Portfolio, Walnut Creek, Tapestry, Laredo Ridge and Carlsbad Energy Center. These represent the fair value of the PPAs acquired. These are amortized generally on a straight-line basis, over the term of the PPA. |
| |
| • | Leasehold Rights —Established with the acquisition of the Alta Wind Portfolio, this represents the fair value of contractual rights to receive royalty payments equal to a percentage of PPA revenue from certain projects. These are amortized as a reduction to operating revenue on a straight-line basis over the term of the PPAs. |
| |
| • | Customer relationships — Established with the acquisition of Energy Center Omaha and Energy Center Phoenix, these intangibles represent the fair value at the acquisition date of the businesses' customer base. The customer relationships related to Energy Center Omaha are amortized as a reduction to operating revenue, which approximates the expected discounted future net cash flows by year. |
| |
| • | Customer contracts — Established with the acquisition of Energy Center Phoenix,these intangibles represent the fair value at the acquisition date of contracts that primarily provide chilled water, steam and electricity to its customers. |
Leasehold Rights — Established with the acquisition of the Alta Wind Portfolio, this represents the fair value of contractual rights to receive royalty payments equal to a percentage of PPA revenue from certain projects. These are amortized on a straight-line basis.
Customer relationships — Established with the acquisition of Energy Center Phoenix and Energy Center Omaha, these intangibles represent the fair value at the acquisition date of the businesses' customer base. The customer relationships are amortized to depreciation and amortization expense based on the expected discounted future net cash flows by year.
Customer contracts — Established with the acquisition of Energy Center Phoenix, these intangibles represent the fair value at the acquisition date of contracts that primarily provide chilled water, steam and electricity to its customers. These contracts are amortized to revenues based on expected volumes.
| |
| • | Emission Allowances —These intangibles primarily consist of SO2 and NOx emission allowances established with the El Segundo, and Walnut Creek and Carlsbad Energy Center acquisitions. These emission allowances are held-for-use and are amortized to cost of operations, with NOx allowances amortized on a straight-line basis and SO2 allowances amortized based on units of production. |
operations, with NOx allowances amortized on a straight-line basis and SO2 allowances amortized based on units of production.
Other — Consists of a) the acquisition date fair value of the contractual rights to a ground lease for South Trent and to utilize certain interconnection facilities for Blythe, as well as land rights acquired in connection with the acquisition of Elbow Creek, and b) development rights related to certain solar businesses acquired in 2010 and 2011.
The following tables summarize the components of intangible assets subject to amortization:
|
| | | | | | | | | | | | | | | | | | | | | | | | | | | |
| Year ended December 31, 2019 | PPAs | | Leasehold Rights | | Customer
Relationships | | Customer Contracts | | Emission Allowances | | Other | | Total |
| (In millions) | | | |
| January 1, 2019 | $ | 1,280 |
| | $ | 86 |
| | $ | 66 |
| | $ | 15 |
| | $ | 9 |
| | $ | 8 |
| | $ | 1,464 |
|
| Acquisition of Carlsbad Energy Center | 350 |
| | — |
| | — |
| | — |
| | 8 |
| | — |
| | 358 |
|
| December 31, 2019 | $ | 1,630 |
| | $ | 86 |
| | $ | 66 |
| | $ | 15 |
| | $ | 17 |
| | $ | 8 |
| | $ | 1,822 |
|
| Less accumulated amortization | (347 | ) | | (22 | ) | | (9 | ) | | (10 | ) | | (2 | ) | | (4 | ) | | (394 | ) |
| Net carrying amount | $ | 1,283 |
| | $ | 64 |
| | $ | 57 |
| | $ | 5 |
| | $ | 15 |
| | $ | 4 |
| | $ | 1,428 |
|
|
| | | | | | | | | | | | | | | | | | | | | | | | | | | |
| Year ended December 31, 2018 | PPAs | | Leasehold Rights | | Customer
Relationships | | Customer Contracts | | Emission Allowances | | Other | | Total |
| (In millions) | |
| December 31, 2018 | $ | 1,280 |
| | $ | 86 |
| | $ | 66 |
| | $ | 15 |
| | $ | 9 |
| | $ | 8 |
| | $ | 1,464 |
|
| Less accumulated amortization | (269 | ) | | (18 | ) | | (7 | ) | | (9 | ) | | (2 | ) | | (3 | ) | | (308 | ) |
| Net carrying amount | $ | 1,011 |
| | $ | 68 |
| | $ | 59 |
| | $ | 6 |
| | $ | 7 |
| | $ | 5 |
| | $ | 1,156 |
|
|
| | | | | | | | | | | | | | | | | | | | | | | | | | | |
| Year ended December 31, 2017 | PPAs | | Leasehold Rights | | Customer
Relationships | | Customer Contracts | | Emission Allowances | | Other | | Total |
| (In millions) | |
| January 1, 2017 | $ | 1,286 |
| | $ | 86 |
| | $ | 66 |
| | $ | 15 |
| | $ | 9 |
| | $ | 9 |
| | $ | 1,471 |
|
Asset Impairments (a) | (6 | ) | | — |
| | — |
| | — |
| | — |
| | — |
| | (6 | ) |
| December 31, 2017 | 1,280 |
| | 86 |
| | 66 |
| | 15 |
| | 9 |
| | 9 |
| | 1,465 |
|
| Less accumulated amortization | (205 | ) | | (13 | ) | | (5 | ) | | (8 | ) | | (3 | ) | | (3 | ) | | (237 | ) |
| Net carrying amount | $ | 1,075 |
| | $ | 73 |
| | $ | 61 |
| | $ | 7 |
| | $ | 6 |
| | $ | 6 |
| | $ | 1,228 |
|
(a)$6 million of asset impairments relate to one of the November 2017 Drop Down Assets that was recorded by NRG during the quarter ended September 30, 2017, as further described in Note 9, Asset Impairments.
The Company recorded amortization expense of $71$73 million during the yearsyear ended December 31, 2018, 20172019 and 2016. Of these amounts, $70$71 million for the years ended December 31, 2018 2017 and 2016December 31, 2017. Of these amounts, $72 million for the year ended December 31, 2019 and $70 million for the years ended December 31, 2018 and December 31, 2017, were recorded to contract amortization expense and reduced operating revenues in the consolidated statements of operations. The Company estimates the future amortization expense for its intangibles to be $71 million for the next five years through 2023.as follows:
Out-of-market contracts |
| | | |
| | (In millions) |
| | |
| 2020 | $ | 90 |
|
| 2021 | 90 |
|
| 2022 | 90 |
|
| 2023 | 87 |
|
| 2024 | $ | 84 |
|
Note 9 — Asset Impairments
2019 Impairment Losses
The out-of-market contract liability representsCompany recorded an impairment loss of $19 million related to a facility in the out-of-marketThermal segment during the second quarter of 2019. The impairment was triggered by a potential sale negotiation with a third party which resulted in signing the purchase and sale agreement in September, as further described in Note 3, Acquisitions and Dispositions. The fair value of the PPAsfacility was determined using an income approach by applying a discounted cash flow methodology to the long-term budgets for each respective plant. The income approach utilized estimates of discounted future cash flows, which were Level 3 fair value measurement and include key inputs, such as forecasted power prices, operations and maintenance expense, and discount rates. The Company measured the Blythe solar project and Spring Canyon wind projectsimpairment loss as the difference between the carrying amount and the out-of-marketfair value of the land lease for Alta Wind XI, LLC,assets.
Additionally, during the fourth quarter of 2019, as of their respective acquisition dates. The Blythe solar project's liability of $7 million was recorded to other non-current liabilities on the consolidated balance sheet and is amortized to revenue in the consolidated statements of income on a units-of-production basis over the twenty-year termresult of the agreement. Spring Canyon's liabilitypreparation and review of $3 million was recorded to other non-current liabilitiesits annual budget and is amortized to revenue on a straight-line basis overassessment of long-term merchant power prices, the twenty-five year termCompany updated its estimated future cash flows and determined that the future cash flows for several wind projects from the Renewables segment no longer supported the recoverability of the agreement.related long-lived asset. As such, the Company recorded an impairment loss of $14 million to reflect the assets at fair market value. The Alta Wind XI, LLC's liability of $5 million was recorded to other non-current liabilities and is amortized as a reduction to cost of operations on a straight-line basis over the thirty-four year termfair value of the land lease. At December 31, 2018, accumulated amortization of out-of-market contractsfacilities was $4 million and amortization expense was $1 milliondetermined using an income approach by applying a discounted cash flow methodology to the long-term budgets for each of the years ended December 31, 2018respective plant. The income approach included key inputs such as forecasted merchant power prices, operations and 2017.maintenance expense, and discount rates. The resulting fair value is a Level 3 fair value measurement.
Note 9 — Asset Impairments2017 Impairment Losses
During the fourth quarter of 2017, as the Company updated its estimated cash flows in connection with the preparation and review of the Company's annual budget, the Company determined that the cash flows for Elbow Creek, located in Texas, and the Forward project, located in Pennsylvania, were below the carrying value of the related assets, primarily driven by continued declining merchant power prices in post-contract periods, and that the assets were considered impaired. The fair value of the facilities was determined using an income approach by applying a discounted cash flow methodology to the long-term budgets for each respective plant. The income approach utilized estimates of discounted future cash flows, which were Level 3 fair value measurement and include key inputs, such as forecasted power prices, operations and maintenance expense, and discount rates. The Company measured the impairment loss as the difference between the carrying amount and the fair value of the assets and recorded impairment losses of $26 million and $5 million for Elbow Creek and Forward, respectively.
Additionally, during the quarter ended September 30, 2017, in connection with the preparation of the model for sale of the November 2017 Drop Down Assets, it was identified that undiscounted cash flows were lower than the book value of certain SPP funds and NRG recorded an impairment expense of $13 million, $8 million of which relates to property, plant, and equipment and $5 million to PPAs, as described in Note 8, Intangible Assets. In accordance with the guidance for transfer of assets under common
control, the impairment is reflected in the pre-acquisition net income of Drop Down Assets of the Company's consolidated statements of operations for the period ended December 31, 2018.2017.
During the fourth quarter of 2016, as the Company updated its estimated cash flows in connection with the preparation and review of the Company's annual budget, the Company determined that the cash flows for the Elbow Creek and Goat Wind projects and the Forward project were below the carrying value of the related assets, primarily driven by declining merchant power prices in post-contract periods, and that the assets were considered impaired. These projects were acquired in connection with the acquisition of the November 2015 Drop Down Assets and were recorded as part of the Renewables segment of the Company. The projects were recorded at historical cost at acquisition date as they were related to interests under common control by NRG. The fair value of the facilities was determined using an income approach by applying a discounted cash flow methodology to the long-term budgets for each respective plant. The income approach utilized estimates of discounted future cash flows, which were Level 3 fair value measurement and include key inputs, such as forecasted power prices, operations and maintenance expense, and discount rates. The Company measured the impairment loss as the difference between the carrying amount and the fair value of the assets and recorded impairment losses of $117 million, $60 million and $6 million for Elbow Creek, Goat Wind, and Forward, respectively.
Other Impairments — During the fourth quarter of 2016, NRG recorded impairment losses of approximately $2 million related to the projects that were part of the November 2017 Drop Down Assets. Since the acquisition by the Company of the November 2017 Drop Down Assets related to transfer of assets under common control, these impairments were reflected in the Company's consolidated statements of operations for the periods ending December 31, 2016.
Note 10 — Long-term Debt
The Company's borrowings, including short term and long term portions consisted of the following:
|
| | | | | | | | | | | | | |
| | December 31, 2019 | | December 31, 2018 | | Interest rate % (a) | | Letters of Credit Outstanding at December 31, 2019 |
| | (In millions, except rates) | | |
| Long-term debt - affiliate, due 2019 | $ | — |
| | $ | 215 |
| | 3.500 | | |
| Long-term debt - affiliate, due 2020 | 44 |
| | 44 |
| | 3.325 | | |
2024 Senior Notes (b) | 88 |
| | 500 |
| | 5.375 | | |
| 2025 Senior Notes | 600 |
| | 600 |
| | 5.750 | | |
| 2026 Senior Notes | 350 |
| | 350 |
| | 5.000 | | |
| 2028 Senior Notes | 600 |
| | — |
| | 4.750 | | |
Clearway Energy LLC and Clearway Energy Operating LLC Revolving Credit Facility, due 2019 (c) | — |
| | — |
| | L+1.75 | | $ | 70 |
|
| Project-level debt: | | | | | | | |
Agua Caliente Borrower 2, due 2038 (d) | — |
| | 39 |
| | 5.430 | | 14 |
|
Alpine, due 2022 (d) | 119 |
| | 127 |
| | L+2.00 | | 16 |
|
| Alta Wind I - V lease financing arrangements, due 2034 and 2035 | 844 |
| | 886 |
| | 5.696 - 7.015 | | 45 |
|
| Buckthorn Solar, due 2025 | 129 |
| | 132 |
| | L+1.750 | | 26 |
|
| Carlsbad Holdco, due 2038 | 216 |
| | — |
| | 4.210 | | 5 |
|
| Carlsbad Energy Holdings LLC, due 2027 | 582 |
| | — |
| | L+1.625/4.12 | | 87 |
|
CVSR, due 2037 (d) | 696 |
| | 720 |
| | 2.339 - 3.775 | | — |
|
CVSR Holdco Notes, due 2037 (d) | 182 |
| | 188 |
| | 4.680 | | 13 |
|
| Duquesne, due 2059 | 95 |
| | — |
| | 4.620 | | — |
|
| El Segundo Energy Center, due 2023 | 303 |
| | 352 |
| | L+1.75 - L+2.375 | | 138 |
|
| Energy Center Minneapolis Series D, E, F, G, H Notes, due 2025-2037 | 328 |
| | 328 |
| | various | | — |
|
| Laredo Ridge, due 2028 | 84 |
| | 89 |
| | L+2.125 | | 10 |
|
Kansas South, due 2030 (d) | 24 |
| | 26 |
| | L+2.25 | | 2 |
|
| Kawailoa Solar Holdings LLC, due 2026 | 82 |
| | — |
| | L+1.375 | | 13 |
|
Marsh Landing, due 2023 (d) | 206 |
| | 263 |
| | L+2.125 | | 27 |
|
| Oahu Solar Holdings LLC, due 2026 | 91 |
| | — |
| | L+1.375 | | 17 |
|
| Repowering Partnership Holdco LLC, due 2020 | 228 |
| | — |
| | L+.85 | | 4 |
|
| South Trent Wind, due 2028 | 43 |
| | 50 |
| | L+1.350 | | 12 |
|
| Tapestry, due 2031 | 156 |
| | 151 |
| | L+1.375 | | 18 |
|
| Utah Solar Portfolio, due 2022 | 254 |
| | 267 |
| | L+2.625 | | 13 |
|
| Viento, due 2023 | 42 |
| | 146 |
| | L+2.00 | | 14 |
|
| Walnut Creek, due 2023 | 175 |
| | 222 |
| | L+1.75 | | 74 |
|
| Other | 296 |
| | 343 |
| | various | | 24 |
|
| Subtotal project-level debt | 5,175 |
| | 4,329 |
| | | | |
| Total debt | 6,857 |
| | 6,038 |
| | | | |
| Less current maturities | (1,824 | ) | | (529 | ) | | | | |
| Less net debt issuance costs | (77 | ) | | (61 | ) | | | | |
| Total long-term debt | $ | 4,956 |
| | $ | 5,448 |
| | | | |
|
| | | | | | | | | | | | |
| | December 31, 2018 | | December 31, 2017 | | Interest rate % (a) | | Letters of Credit Outstanding at December 31, 2018 |
| | (In millions, except rates) | | |
| Long-term debt - affiliate, due 2019 | $ | 215 |
| | $ | 337 |
| | 3.580 | | |
| Long-term debt - affiliate, due 2020 | 44 |
| | 281 |
| | 3.325 | | |
| 2024 Senior Notes | 500 |
| | 500 |
| | 5.375 | | |
| 2025 Senior Notes | 600 |
| | — |
| | 5.750 | | |
| 2026 Senior Notes | 350 |
| | 350 |
| | 5.000 | | |
Clearway Energy LLC and Clearway Energy Operating LLC Revolving Credit Facility, due 2019 (b) | — |
| | 55 |
| | L+1.75 | | 41 |
|
| Project-level debt: | | | | | | | |
Agua Caliente Borrower 2, due 2038 (c) | 39 |
| | 41 |
| | 5.430 | | 17 |
|
Alpine, due 2022 (c) | 127 |
| | 135 |
| | L+1.750 | | 16 |
|
| Alta Wind I - V lease financing arrangements, due 2034 and 2035 | 886 |
| | 926 |
| | 5.696 - 7.015 | | 44 |
|
| Buckthorn Solar, due 2025 | 132 |
| | 169 |
| | L+1.750 | | 26 |
|
CVSR, due 2037 (c) | 720 |
| | 746 |
| | 2.339 - 3.775 | | — |
|
CVSR Holdco Notes, due 2037 (c) | 188 |
| | 194 |
| | 4.680 | | 13 |
|
| El Segundo Energy Center, due 2023 | 352 |
| | 400 |
| | L+1.75 - L+2.375 | | 138 |
|
| Energy Center Minneapolis Series C, D, E, F, G, H Notes, due 2025-2037 | 328 |
| | 208 |
| | various | | — |
|
| Laredo Ridge, due 2028 | 89 |
| | 95 |
| | L+1.875 | | 10 |
|
Kansas South, due 2030 (c) | 26 |
| | 29 |
| | L+2.00 | | 2 |
|
Marsh Landing, due 2023 (c) | 263 |
| | 318 |
| | L+2.125 | | 60 |
|
| South Trent Wind, due 2020 | 50 |
| | 53 |
| | L+1.625 | | |
| Tapestry, due 2021 | 151 |
| | 162 |
| | L+1.625 | | 20 |
|
| Utah Solar Portfolio, due 2022 | 267 |
| | 278 |
| | various | | 13 |
|
| Viento, due 2023 | 146 |
| | 163 |
| | L+2.00 | | 26 |
|
| Walnut Creek, due 2023 | 222 |
| | 267 |
| | L+1.75 | | 74 |
|
| Other | 343 |
| | 361 |
| | various | | 24 |
|
| Subtotal project-level debt | 4,329 |
| | 4,545 |
| | | | |
| Total debt | 6,038 |
| | 6,068 |
| | | | |
| Less current maturities | (529 | ) | | (339 | ) | | | | |
| Less net debt issuance costs | (61 | ) | | (62 | ) | | | | |
| Total long-term debt | $ | 5,448 |
| | $ | 5,667 |
| | | | |
(a) As of December 31, 2018,2019, L+ equals 3 month LIBOR plus x%, except for Viento, due 2023 and Kansas South, due 2030,2030; where L + equals 6 month LIBOR plus 2.00% and Utah Solar Portfolio and Repowering Partnership Holdco LLC, where L+equals 1 month LIBOR plus x%.
(b) Repurchased in January 2020 as part of the 2024 Senior Notes Tender Offer, as further described below.
(c) Applicable rate is determined by the borrower leverage ratio, as defined in the credit agreement.
(c)(d) On January 29, 2019,Entities affected by PG&E filed for bankruptcy under Chapter 11 of the U.S. Bankruptcy, Code. The Company has non-recourse project-level debt, and in some cases holding company debt, related to each of its subsidiaries that sell their output to PG&E under long-term PPAs. The PG&E bankruptcy filing is an event of default under the related financing agreements, and as a result, the respective lenders under these arrangements may accelerate the repayment of these debt balances. In addition, the event of default may have an impact on the Company’s ability to distribute cash from the project-level cash accounts to the parent entities. The Company continues to operate the projects in the normal course of business and is currently in the process of negotiating forbearance agreements with the related lenders. see further discussion below.
The financing arrangements listed above contain certain covenants, including financial covenants, that the Company is required to be in compliance with during the term of the respective arrangement. As of December 31, 2018,2019, the Company was in compliance with all of the required covenants.
Clearway Energy LLC and Clearway Energy Operating LLC Revolving Credit Facility
The Company borrowed $55 million from the revolving credit facility during the year ended December 31, 2017 for general corporate needs as well as to fund dividend payments.
On April 30, 2018, the Company closed on the refinancing of the revolving credit facility, which extended the maturity of the facility to April 28, 2023, and decreased the Company's overall cost of borrowing from L+2.50% to L+1.75%. The applicable rate is determined by the borrower leverage ratio, as defined in the credit agreement, and was L+1.75% as of December 31, 2018.2019. The facility will continue to be used for general corporate purposes including financing of future acquisitions and posting letters of credit.
On October 9, 2018,December 20, 2019, the Company terminatedentered into the Fifth Amendment to Amended and Restated Credit Agreement to provide for an increase of 0.50x to the borrower leverage ratio, as defined in the Amended and Restated Credit Agreement, for the last two fiscal quarters of 2020 and to implement certain letters of credit relating to certain project PPAsother technical modifications.
The Company made borrowings in exchange for a one-time payment, which reduced the outstanding letters of creditamount $152 million during the year ended December 31, 2019 under the revolving credit facility. facility in order to partially finance the Carlsbad Drop Down acquisition, as well as for general business purposes. As of December 31, 20182019, there were no0 outstanding borrowings under the revolving credit facility and the Company had $41$70 million of letters of credit outstanding.The Company had $170 million outstanding under the revolving credit facility and a total of $69 million in letters of credit outstanding as of February 24, 2020.
Bridge Credit Agreement2028 Senior Notes
On August 31, 2018,December 11, 2019, Clearway Energy Operating LLC completed the sale of $600 million aggregate principal amount of Senior Unsecured Notes due 2028, or the 2028 Senior Notes. The 2028 Senior Notes bear interest at 4.75% and mature on March 15, 2028. Interest on the 2028 Senior Notes is payable semi-annually on March 15 and September 15 of each year, and interest payments will commence on September 15, 2020. The 2028 Senior Notes are unsecured obligations of Clearway Energy Operating LLC and are guaranteed by Clearway Energy LLC and by certain of Clearway Energy Operating LLC's wholly owned current and future subsidiaries. The proceeds from the 2028 Senior Notes were partially used to repay the 2024 Senior Notes, as further described below.
2024 Senior Notes Tender Offer
On December 13, 2019, the Company entered into a senior unsecured 364-day bridge credit agreement, or the Bridge Credit Agreement, which provided total borrowings of up to a maximumrepurchased an aggregate principal amount of $1.5 billion$412 million or 82.4%, of the 2024 Senior Notes as part of the previously cash tender offer announced on December 11, 2019. Concurrently with the launch of the tender offer, the Company exercised its right to optionally redeem any 2024 Senior Notes not validly tendered and purchased in the tender offer, pursuant to the terms of the indenture governing the 2024 Senior Notes. The redemption of the Senior Notes due 2024 in December were effectuated at a rate per annum equal to LIBOR orpremium of 103% for a base rate plus an applicable margin equal to 3.00%total consideration of $424 million and as a result, the Company recorded a loss on extinguishment in the caseamount of LIBOR loans and 2.00% in the case of base rate loans.
$12 million. In October 2018,addition, the Company reducedrecorded a $2 million debt extinguishment loss in connection with the lenders' commitments under the bridge agreement from $1.5 billion to $867.5 million following the offeringwrite off of the 2025deferred financing fees related to the 2024 Senior Notes. The redemption of the remaining $88 million of outstanding 2024 Senior Notes and the convertible notes tender offer results, each described below. On October 31, 2018, the Company terminated the Bridge Credit Agreement.occurred on January 3, 2020.
2025 Senior Notes
On October 1, 2018, Clearway Energy Operating LLC issued $600 million of senior unsecured notes, or the 2025 Senior Notes. The 2025 Senior Notes bear interest at 5.750% and mature on October 15, 2025. Interest on the 2025 Senior Notes is payable semi-annually on April 15 and October 15 of each year, and interest payments will commence on April 15, 2019. The 2025 Senior Notes are unsecured obligations of Clearway Energy Operating LLC and are guaranteed by Clearway Energy LLC and by certain of Clearway Energy Operating LLC's wholly owned current and future subsidiaries. The proceeds from the 2025 Senior Notes were partially used to repay the 2019 Convertible Notes.
2019 Convertible Notes Open Market Repurchases
In August 2018, the Company repurchased an aggregate principal amount of $16 million of the 2019 Convertible Notes in open market transactions. The repurchases were funded through a partial repayment of the intercompany note between Clearway Energy Operating LLC and Clearway Energy, Inc., which was reduced by $16 million.
In January 2019, the Company repurchased an additional aggregate principal amount of $50 million of the 2019 Convertible Notes in open market transactions. The repurchase was funded through a partial repayment of the intercompany note between Clearway Energy Operating LLC and Clearway Energy, Inc., which was reduced by $50 million.
2019 Convertible Notes and 2020 Convertible Notes Tender Offer
On September 10, 2018, pursuant to the 2019 Convertible Notes and the 2020 Convertible Notes indentures, Clearway, Energy, Inc. delivered to the holders of the 2019 Convertible Notes and the 2020 Convertible Notes a fundamental change notice and offer to repurchase any and all of the 2019 Convertible Notes and 2020 Convertible Notes for cash at a price equal to 100% of the principal amount of the Convertible Notes plus any accrued and unpaid interest. The tender offer expired on October 9, 2018. An aggregate principal amount of $109 million of the 2019 Convertible Notes and $243 million of the 2020 Convertible Notes were tendered on or prior to the expiration date and accepted by the Company for purchase. After the expiration of the tender offer, $216 million aggregate principal amount of the intercompany note due 2019 remained outstanding and $44 million aggregate principal amount of the intercompany note due 2020 remained outstanding as of December 31, 2018. The 2019 Convertible Notes matured on February 1, 2019 and Clearway, Energy, Inc. paid off the remaining balance of an aggregate principal amount of $170 million, which
was funded through the payment of the remaining balance of the intercompany note due 2019 between Clearway Energy Operating LLC and Clearway, Energy, Inc..
Inc.
Project - level Debt
PG&E Bankruptcy
As discussed in Note 1 — Nature of Business, onJanuary 29, 2019, PG&E filed for reorganization under Chapter11 of the U.S. Bankruptcy Code in the U.S. Bankruptcy Court for the Northern District of California, or the Bankruptcy Court. Certain subsidiaries of the Company are parties to financing agreements consisting of non-recourse project-level debt and, in certain cases, non-recourse holding company debt. The PG&E Bankruptcy triggered defaults under the PPAs with PG&E and such related project-level financing agreements. As a result, the Company recorded $1.2 billion of principal, net of the related unamortized debt issuance costs, as short-term debt as of December 31, 2019. In addition, distributions from these projects to Clearway Operating LLC are prohibited under the related debt agreements. As of March 2, 2020, the Company has entered into forbearance agreements for certain project-level financing arrangements and continues to seek forbearance agreements for its other project-level financing arrangements affected by the PG&E Bankruptcy. The Company continues to assess the potential future impacts of the PG&E Bankruptcy as events occur.
Carlsbad Drop Down Asset Debt
On December 6, 2019, as part of the Carlsbad Drop Down acquisition, as further described in Note 3, Acquisitions and Dispositions, the Company assumed $803 million of senior secured, non-recourse notes related to Carlsbad Holdco, LLC and Carlsbad Energy Holding LLC. The Carlsbad Holdco LLC notes bear an interest rate of 4.21%, and are fully amortizing over 19 years. In addition, Carlsbad Holdco LLC is party to a letter of credit facility agreement with the issuing banks for an aggregate principal amount not to exceed $10 million. Fees on the unused commitment are 0.65%. As of December 31, 2019, there were $5 million in letters of credit in support of the project issued and $216 million of notes were outstanding.
Carlsbad Energy Holdings, LLC is party to a note payable agreement with financial institutions for the issuance of up to $407 million of senior secured notes that bear interest at a rate of 4.12%, and mature on October 31, 2038. Carlsbad Energy Holdings, LLC is also party to a term loan agreement with issuing banks for an aggregate principal amount of $194 million at an issuance rate of LIBOR plus an applicable margin of 1.625% until February 25, 2022, 1.750% until February 25, 2025, and 1.875% until maturity. Fees on the unused commitment are 0.50%. upon completion of the project. The agreement also includes a letter of credit facility with an aggregate principal amount not to exceed $83 million, and a working capital loan facility with an aggregate principal amount not to exceed $4 million. As of December 31, 2019, $175 million was outstanding under the term loan and $87 million of letters of credit were issued.
Agua Caliente Borrower 2 Debt Repayment
OnOctober 21, 2019, the Company, through Agua Caliente Borrower 2 LLC, repaid $40 million of the outstanding notes balance, including accrued interest and premiums, issued under the Agua Caliente Holdco Financing Agreement. The repayment was funded with Company's existing liquidity.
Repowering Partnership Holdco LLC, due 2020
On June 14, 2019, as part of the Repowering Partnership, the Company entered into a financing agreement for non-recourse debt for a total commitment amount of $352 million related to the construction for the repowering activities at Wildorado and Elbow Creek. The debt consists of a construction loan at an interest rate of LIBOR plus 0.85%. The Company borrowings were utilized to repay $109 million of the outstanding balance, including accrued interest, under the Viento financing agreement, to reimburse Clearway Renew LLC for previous contributions into the Repowering Partnership and pay construction invoices. On November 26, 2019, the construction loan of $93 million related to the repowering activities at Elbow Creek was repaid with the proceeds from the tax equity investor. On February 7, 2020 the construction loan of $260 million related to the repowering activities at Wildorado was repaid with the proceeds from the tax equity investor.
Duquesne University
OnMay 1, 2019, as part of the Duquesne University district energy system acquisition, ECP Uptown Campus LLC issued non-recourse debt of $95 million, excluding financing fees. The debt consists of senior notes at an interest rate of 4.62% that mature onMay 1, 2059. Interest on the notes are payable semi-annually in arrears. The proceeds of the debt, along with cash on hand, were utilized to fund the purchase price of the acquisition
Oahu Solar Holdings LLC
Due to the Company consolidating the Oahu Partnership, as further described in Note 5, Investments Accounted for by the Equity Method and Variable Interest Entities, the Company assumed non-recourse debt of $143 million related to Oahu Solar Holdings, LLC. The debt consists of a construction loan and an ITC bridge loan with a total commitment amount of $162 million, both at an interest rate of LIBOR plus 1.375%.On November 13, 2019, $90 million of non-recourse debt was converted to a term loan with an expected maturity of November 2026, and the remainder of the non-recourse debt was repaid with the final contribution from the tax equity investor in the amount of $67 million upon the project reaching substantial completion. Interest on the term loan is payable quarterly in arrears.
Kawailoa Solar Holdings LLC
Due to the Company consolidating the Kawailoa Partnership, as further described in Item Note 5, Investments Accounted for by the Equity Method and Variable Interest Entities, the Company assumed non-recourse debt of $120 million related to Kawailoa Solar Holdings, LLC. The debt consists of a construction loan and an ITC bridge loan, with a total commitment amount of $137 million��both at an interest rate of LIBOR plus 1.375%. On December 23, 2019, $82 million of non-recourse debt was converted to a term loan with an expected maturity of December 2026, and the remainder of the non-recourse debt was repaid with the final contribution from the tax equity investor in the amount of $57 million upon the project reaching substantial completion. Interest on the term loan is payable quarterly in arrears.
South Trent Refinancing
On June 14, 2019, the Company, through South Trent Wind LLC, refinanced $49 million of non-recourse debt due 2020 at interest rate of LIBOR plus 1.625% by issuing $46 million of new non-recourse financing due 2028 at an interest rate of LIBOR plus 1.350%.
Tapestry Refinancing
On April 29, 2019, the Company, through Tapestry Wind LLC, refinanced $147 million of non-recourse debt due 2021 at interest rate of LIBOR plus 1.75% by issuing $164 million of new non-recourse financing due 2031 at an interest rate of LIBOR plus 1.375%.
Energy Center Minneapolis Series E, F, G, H Notes
On June 19, 2018, Energy Center Minneapolis LLC, a subsidiary of the Company, entered into an amended and restated Thermal note purchase and private shelf agreement under which it authorized the issuance of the Series E Notes, Series F Notes, Series G Notes, and Series H Notes, as further described in the table below:
|
| | | | | | | |
| (In millions) | | Amount | | Interest Rate |
| Energy Center Minneapolis Series E Notes, due 2033 | | $ | 70 |
| | 4.80 | % |
| Energy Center Minneapolis Series F Notes, due 2033 | | 10 |
| | 4.60 | % |
Energy Center Minneapolis Series G Notes, due 2035 | | 83 |
| | 5.90 | % |
| Energy Center Minneapolis Series H Notes, due 2037 | | 40 |
| | 4.83 | % |
| Total proceeds | | $ | 203 |
| | |
| Repayment of Energy Center Minneapolis Series C Notes, due 2025 | | (83 | ) | | 5.95 | % |
| Net borrowings | | $ | 120 |
| | |
The proceeds from the sale of the Series E Notes and the Series F Notes were utilized to finance the acquisition of the UPMC Thermal Project as described inNote 3,Business Acquisitions and Dispositions. The Series G Notes were used to refinance the Series C Notes as noted above in the table. The Series H Notes were used to make a dividend to Clearway Energy Operating LLC.
The amended and restated Thermal note purchase and private shelf agreement also established a private shelf facility for the future issuance of notes in the amount of $40 million.
Buckthorn Solar Drop Down Asset Debt
As part of the Buckthorn Solar Drop Down Asset acquisition, as further described in Note 3,Business Acquisitions and Dispositions, the Company assumed non-recourse debt of $183 million relating to Buckthorn Solar Portfolio, LLC as of the date of the acquisition, March 30, 2018. The assumed debt consisted of a construction loan and an Investment Tax Credits, or ITC, bridge loan, both at an
interest rate of LIBOR plus 1.75%. On May 31, 2018, $132 million of non-recourse debt was converted to a term loan with an expected maturity of May 2025, and the remainder of the non-recourse debt was repaid with the final contribution from the Class A member in the amount of $80 million upon the project reaching substantial completion in May 2018.
Buckthorn Solar entered into a series of fixed for floating interest rate swaps that would fix the interest rate for a minimum of 80% of the outstanding notional amount. All interest rate swap payments by Buckthorn Solar and its counterparties are made quarterly and LIBOR is determined in advance of each interest period.
November 2017 Drop Down Assets Debt
As part of the November 2017 Drop Down acquisition, the Company assumed non-recourse debt of $26 million relating to certain SPP funds. The assumed debt consisted of the following: a) a term loan under a credit agreement with a bank, with a maturity date of December 31, 2038 and interest rate of 4.69%. The credit agreement includes a letter of credit supporting debt service requirements and a letter of credit in support of the PPA; b) and financing obligation in connection with a sale-leaseback transaction with a bank for a period through March 31, 2032. The company will accrete the financing obligation over the lease term based on the lease's implicit interest rate of 8%.
Agua Caliente Borrower 2, due 2038
On February 17, 2017, Agua Caliente Borrower 1 LLC, an indirect subsidiary of NRG, and Agua Caliente Borrower 2 LLC, issued $130 million of senior secured notes under the Agua Caliente Borrower 1 LLC and Agua Caliente Borrower 2 LLC financing agreement, or Agua Caliente Holdco Financing Agreement, that bear interest at 5.43% and mature on December 31, 2038. As described in Note 3, Business Acquisitions, on March 27, 2017, the Company acquired Agua Caliente Borrower 2 LLC from NRG as part of the March 2017 Drop Down Assets acquisition and assumed NRG's portion of senior secured notes under the Agua Caliente Holdco Financing Agreement. Agua Caliente Borrower 2 LLC held $39 million of the Agua Caliente Holdco debt as of December 31, 2018.
The debt is joint and several with respect to Agua Caliente Borrower 1 LLC and Agua Caliente Borrower 2 LLC and is secured by the equity interests of each borrower in the Agua Caliente solar facility.
Utah Solar Portfolio, due 2022
As part of the March 2017 Drop Down Assets acquisition, the Company assumed non-recourse debt of $287 million relating to the Utah Solar Portfolio at an interest rate of LIBOR plus 2.625%. The debt matures on December 16, 2022. The $287 million consisted of $222 million outstanding at the time of NRG's acquisition of the Utah Solar Portfolio on November 2, 2016, and additional borrowings of $65 million, net of debt issuance costs, incurred during 2016. The Company held $267 million of the Utah Solar Portfolio debt as of December 31, 2018.
Interest Rate Swaps — Project Financings
Many of the Company's project subsidiaries entered into interest rate swaps, intended to hedge the risks associated with interest rates on non-recourse project level debt. These swaps amortize in proportion to their respective loans and are floating for fixed where the project subsidiary pays its counterparty the equivalent of a fixed interest payment on a predetermined notional value and will receive quarterly the equivalent of a floating interest payment based on the same notional value. All interest rate swap payments by the project subsidiary and its counterparty are made quarterly and the LIBOR is determined in advance of each interest period.
The following table summarizes the swaps, some of which are forward starting as indicated, related to the Company's project level debt as of December 31, 2018:2019:
|
| | | | | | | | | | | | | | | | |
| | | % of Principal | | Fixed Interest Rate | | Floating Interest Rate | | Notional Amount at December 31, 2019 (In millions) | | Effective Date | | Maturity Date |
| Alpine | | 85 | % | | various |
| | 3-Month LIBOR | | $ | 101 |
| | various | | various |
| Avra Valley | | 86 | % | | 2.333 | % | | 3-Month LIBOR | | 41 |
| | November 30, 2012 | | November 30, 2030 |
| AWAM | | 100 | % | | 2.47 | % | | 3-Month LIBOR | | 15 |
| | May 22, 2013 | | May 15, 2031 |
| Blythe | | 75 | % | | 3.563 | % | | 3-Month LIBOR | | 11 |
| | June 25, 2010 | | June 25, 2028 |
| Buckthorn Solar | | 82 | % | | various |
| | 3-Month LIBOR | | 106 |
| | February 28, 2018 | | December 31, 2041 |
| El Segundo | | 95 | % | | various |
| | 3-Month LIBOR | | 288 |
| | various | | various |
| Kansas South | | 75 | % | | 2.368 | % | | 6-Month LIBOR | | 18 |
| | June 28, 2013 | | December 31, 2030 |
| Laredo Ridge | | 80 | % | | 2.31 | % | | 3-Month LIBOR | | 67 |
| | December 17, 2014 | | December 31, 2028 |
| Marsh Landing | | 94 | % | | 3.244 | % | | 3-Month LIBOR | | 195 |
| | June 28, 2013 | | June 30, 2023 |
| Roadrunner | | 76 | % | | 4.313 | % | | 3-Month LIBOR | | 22 |
| | September 30, 2011 | | December 31, 2029 |
| South Trent | | 95 | % | | 3.847 | % | | 3-Month LIBOR | | 39 |
| | June 14, 2019 | | June 30, 2028 |
| Tapestry | | 75 | % | | various |
| | 3-Month LIBOR | | 117 |
| | April 19, 2019 | | December 31, 2031 |
| Tapestry | | 50 | % | | 3.57 | % | | 3-Month LIBOR | | 12 |
| | December 21, 2021 | | December 21, 2029 |
| Utah Solar Portfolio | | 80 | % | | various |
| | 1-Month LIBOR | | 203 |
| | various | | September 30, 2036 |
| Viento Funding II | | 93 | % | | various |
| | 6-Month LIBOR | | 39 |
| | various | | various |
| Viento Funding II | | 100 | % | | 4.985 | % | | 6-Month LIBOR | | 21 |
| | July 11, 2023 | | June 30, 2028 |
| Walnut Creek Energy | | 90 | % | | various |
| | 3-Month LIBOR | | 158 |
| | June 28, 2013 | | May 31, 2023 |
| WCEP Holdings | | 100 | % | | 4.003 | % | | 3-Month LIBOR | | 39 |
| | June 28, 2013 | | May 31, 2023 |
| Oahu Solar | | 96 | % | | various |
| | 3-Month LIBOR | | 88 |
| | November 30, 2019 | | October 31, 2040 |
| Kawailoa Renew | | 94 | % | | various |
| | 3-Month LIBOR | | 77 |
| | November 30, 2019 | | October 31, 2040 |
| Carlsbad | | 75 | % | | various |
| | 3-Month LIBOR | | 131 |
| | October 31, 2018 | | September 30, 2027 |
| Total | | | | | | | | $ | 1,788 |
| | | | |
|
| | | | | | | | | | | | | | | | |
| | | % of Principal | | Fixed Interest Rate | | Floating Interest Rate | | Notional Amount at December 31, 2018 (In millions) | | Effective Date | | Maturity Date |
| Alpine | | 85 | % | | various |
| | 3-Month LIBOR | | $ | 108 |
| | various | | various |
| Avra Valley | | 87 | % | | 2.333 | % | | 3-Month LIBOR | | 44 |
| | November 30, 2012 | | November 30, 2030 |
| AWAM | | 100 | % | | 2.47 | % | | 3-Month LIBOR | | 16 |
| | May 22, 2013 | | May 15, 2031 |
| Blythe | | 75 | % | | 3.563 | % | | 3-Month LIBOR | | 12 |
| | June 25, 2010 | | June 25, 2028 |
| Borrego | | 75 | % | | 1.125 | % | | 3-Month LIBOR | | 3 |
| | April 3, 2013 | | June 30, 2020 |
| Buckthorn Solar | | 83 | % | | various |
| | 3-Month LIBOR | | 109 |
| | February 28, 2018 | | December 31, 2041 |
| El Segundo | | 85 | % | | various |
| | 3-Month LIBOR | | 299 |
| | various | | various |
| Kansas South | | 75 | % | | 2.368 | % | | 6-Month LIBOR | | 20 |
| | June 28, 2013 | | December 31, 2030 |
| Laredo Ridge | | 80 | % | | 2.31 | % | | 3-Month LIBOR | | 71 |
| | March 31, 2011 | | March 31, 2026 |
| Marsh Landing | | 94 | % | | 3.244 | % | | 3-Month LIBOR | | 246 |
| | June 28, 2013 | | June 30, 2023 |
| Roadrunner | | 75 | % | | 4.313 | % | | 3-Month LIBOR | | 24 |
| | September 30, 2011 | | December 31, 2029 |
| South Trent | | 75 | % | | 3.265 | % | | 3-Month LIBOR | | 37 |
| | June 15, 2010 | | June 14, 2020 |
| South Trent | | 75 | % | | 4.95 | % | | 3-Month LIBOR | | 21 |
| | June 30, 2020 | | June 14, 2028 |
| Tapestry | | 90 | % | | 2.21 | % | | 3-Month LIBOR | | 136 |
| | December 30, 2011 | | December 21, 2021 |
| Tapestry | | 50 | % | | 3.57 | % | | 3-Month LIBOR | | 60 |
| | December 21, 2021 | | December 21, 2029 |
| Utah Solar Portfolio | | 80 | % | | various |
| | 1-Month LIBOR | | 214 |
| | various | | September 30, 2036 |
| Viento Funding II | | 91 | % | | various |
| | 6-Month LIBOR | | 134 |
| | various | | various |
| Viento Funding II | | 90 | % | | 4.985 | % | | 6-Month LIBOR | | 65 |
| | July 11, 2023 | | June 30, 2028 |
| Walnut Creek Energy | | 90 | % | | various |
| | 3-Month LIBOR | | 200 |
| | June 28, 2013 | | May 31, 2023 |
| WCEP Holdings | | 100 | % | | 4.003 | % | | 3-Month LIBOR | | 43 |
| | June 28, 2013 | | May 31, 2023 |
| Total | | | | | | | | $ | 1,862 |
| | | | |
Annual Maturities
Annual payments based on the maturities of the Company's debt, for the years ending after December 31, 2018,2019, are as follows:
|
| | | |
| | (In millions) |
| 2020 | $ | 1,832 |
|
| 2021 | 257 |
|
| 2022 | 476 |
|
| 2023 | 320 |
|
| 2024 | 130 |
|
| Thereafter | 3,842 |
|
| Total | $ | 6,857 |
|
|
| | | |
| | (In millions) |
| 2019 | $ | 529 |
|
| 2020 | 405 |
|
| 2021 | 447 |
|
| 2022 | 646 |
|
| 2023 | 389 |
|
| Thereafter | 3,622 |
|
| Total | $ | 6,038 |
|
Note 11 — Members' Equity
The following table lists the distributions paid on the Company's Class A, Class B, Class C and Class D units during the year ended December 31, 2018:2019:
|
| | | | | | | | | | | | | | | |
| | Fourth Quarter 2019 | | Third Quarter 2019 | | Second Quarter 2019 | | First Quarter 2019 |
| Distributions per Class A and Class B units | $ | 0.20 |
| | $ | 0.20 |
| | $ | 0.20 |
| | $ | 0.20 |
|
| Distributions per Class C and Class D units | $ | 0.20 |
| | $ | 0.20 |
| | $ | 0.20 |
| | $ | 0.20 |
|
|
| | | | | | | | | | | | | | | |
| | Fourth Quarter 2018 | | Third Quarter 2018 | | Second Quarter 2018 | | First Quarter 2018 |
| Distributions per Class A and Class B units | $ | 0.331 |
| | $ | 0.320 |
| | $ | 0.309 |
| | $ | 0.298 |
|
| Distributions per Class C and Class D units | $ | 0.331 |
| | $ | 0.320 |
| | $ | 0.309 |
| | $ | 0.298 |
|
On February 12, 2019,18, 2020, the Company declared a quarterly distribution on its Class A, Class B, Class C and Class D units of $0.20$0.21 per share payable on March 15, 2019.16, 2020.
Distributions/Contributions to/from NRG in 2018
During 2018 2017, and 2016, the Company acquired the Drop Down Assets from NRG, as described in Note 3, Business Acquisitions and Dispositions. The difference between the cash paid and historical value of the acquired Drop Down Assets was recorded as a distribution to/contribution from NRG with the offset to contributed capital. As the projects were owned by NRG prior to the Drop Down Assets acquisitions, the pre-acquisition income (loss) of such projects were recorded as attributable to NRG's noncontrolling interest. Prior to the date of acquisition, certain of the projects made distributions to NRG and NRG made contributions into certain projects. These amounts are reflected within the Company’s statement of members’members' equity as changes in the contributed capital balance.
Note 12 — Segment Reporting
The Company’s segment structure reflects how management currently operates and allocates resources. The Company's businesses are segregated based on conventional power generation, renewable businesses which consist of solar and wind, and the thermal and chilled water business. The Corporate segment reflects the Company's corporate costs and includes eliminating entries. The Company's chief operating decision maker, its Chief Executive Officer, evaluates the performance of its segments based on operational measures including adjusted earnings before interest, taxes, depreciation and amortization, or Adjusted EBITDA, and CAFD, as well as economic gross margin and net income (loss).
The Company generated more than 10% of its revenues from the following customers for the years ended December 31, 2019, 2018 2017 and 2016:2017:
|
| | | | | | | | | | | |
| | 2019 | | 2018 | | 2017 |
| Customer | Conventional (%) | | Renewables (%) | | Conventional (%) | | Renewables (%) | | Conventional (%) | | Renewables (%) |
| SCE | 21% | | 19% | | 20% | | 20% | | 21% | | 20% |
| PG&E | 12% | | 10% | | 12% | | 11% | | 12% | | 11% |
|
| | | | | | | | | | | |
| | 2018 | | 2017 | | 2016 |
| Customer | Conventional (%) | | Renewables (%) | | Conventional (%) | | Renewables (%) | | Conventional (%) | | Renewables (%) |
| SCE | 20% | | 20% | | 21% | | 20% | | 21% | | 21% |
| PG&E | 12% | | 11% | | 12% | | 11% | | 12% | | 11% |
| | | | Year ended December 31, 2018 | Year ended December 31, 2019 |
| (In millions) | Conventional Generation | | Renewables | | Thermal | | Corporate | | Total | Conventional Generation | | Renewables | | Thermal | | Corporate | | Total |
Operating revenues (a) | $ | 337 |
| | $ | 526 |
| | $ | 193 |
| | $ | (3 | ) | | $ | 1,053 |
| $ | 346 |
| | $ | 485 |
| | $ | 201 |
| | $ | — |
| | $ | 1,032 |
|
Cost of operations (a) | 62 |
| | 146 |
| | 127 |
| | (3 | ) | | 332 |
| 61 |
| | 147 |
| | 134 |
| | — |
| | 342 |
|
| Depreciation and amortization | 101 |
| | 207 |
| | 23 |
| | — |
| | 331 |
| 102 |
| | 267 |
| | 27 |
| | — |
| | 396 |
|
| Impairment losses | | — |
| | 14 |
| | 19 |
| | — |
| | 33 |
|
| General and administrative | — |
| | — |
| | 1 |
| | 19 |
| | 20 |
| — |
| | 1 |
| | 3 |
| | 23 |
| | 27 |
|
| Acquisition-related transaction and integration costs | — |
| | — |
| | — |
| | 20 |
| | 20 |
| — |
| | — |
| | — |
| | 3 |
| | 3 |
|
| Development costs | — |
| | — |
| | 2 |
| | 1 |
| | 3 |
| — |
| | — |
| | 5 |
| | — |
| | 5 |
|
| Operating income (loss) | 174 |
| | 173 |
| | 40 |
| | (40 | ) | | 347 |
| 183 |
| | 56 |
| | 13 |
| | (26 | ) | | 226 |
|
| Equity in earnings of unconsolidated affiliates | 11 |
| | 63 |
| | — |
| | — |
| | 74 |
| 9 |
| | 74 |
| | — |
| | — |
| | 83 |
|
| Other income, net | 1 |
| | 4 |
| | 1 |
| | 2 |
| | 8 |
| 2 |
| | 6 |
| | — |
| | 1 |
| | 9 |
|
| Interest expense | (51 | ) | | (154 | ) | | (12 | ) | | (77 | ) | | (294 | ) | |
| Loss on debt extinguishment | | — |
| | (1 | ) | | — |
| | (15 | ) | | (16 | ) |
| Interest expense, net | | (59 | ) | | (239 | ) | | (18 | ) | | (87 | ) | | (403 | ) |
| Net Income (Loss) | 135 |
| | 86 |
| | 29 |
| | (115 | ) | | 135 |
| 135 |
| | (104 | ) | | (5 | ) | | (127 | ) | | (101 | ) |
| Less: Net loss attributable to noncontrolling interests | — |
| | (104 | ) | | — |
| | (1 | ) | | (105 | ) | |
| Net Income (Loss) Attributable to Clearway Energy LLC | $ | 135 |
| | $ | 190 |
| | $ | 29 |
| | $ | (114 | ) | | $ | 240 |
| $ | 135 |
| | $ | (33 | ) | | $ | (5 | ) | | $ | (127 | ) | | $ | (30 | ) |
| Balance Sheet | | | | | | | | |
|
| | | | | | | | |
|
|
| Equity investment in affiliates | $ | 98 |
| | $ | 1,074 |
| | $ | — |
| | $ | — |
| | $ | 1,172 |
| $ | 94 |
| | $ | 1,089 |
| | $ | — |
| | $ | — |
| | $ | 1,183 |
|
Capital expenditures (a) | 14 |
| | 26 |
| | 28 |
| | — |
| | 68 |
| 4 |
| | 185 |
| | 34 |
| | — |
| | 223 |
|
| Total Assets | $ | 1,788 |
| | $ | 5,836 |
| | $ | 516 |
| | $ | 308 |
| | $ | 8,448 |
| $ | 2,753 |
| | $ | 6,186 |
| | $ | 633 |
| | $ | 33 |
| | $ | 9,605 |
|
(a) Inter-segment revenues and cost of operations include operations and maintenance fee revenue and related costs recorded in the Renewables segment.
(b) Includes accruals.
| | | | Year ended December 31, 2017 | Year ended December 31, 2018 |
| (In millions) | Conventional Generation | | Renewables | | Thermal | | Corporate | | Total | Conventional Generation | | Renewables | | Thermal | | Corporate | | Total |
| Operating revenues | $ | 336 |
| | $ | 501 |
| | $ | 172 |
| | $ | — |
| | $ | 1,009 |
| $ | 337 |
| | $ | 523 |
| | $ | 193 |
| | $ | — |
| | $ | 1,053 |
|
| Cost of operations | 77 |
| | 133 |
| | 116 |
| | — |
| | 326 |
| 62 |
| | 143 |
| | 127 |
| | — |
| | 332 |
|
| Depreciation and amortization | 103 |
| | 210 |
| | 21 |
| | — |
| | 334 |
| 101 |
| | 207 |
| | 23 |
| | — |
| | 331 |
|
| Impairment losses | — |
| | 44 |
| | — |
| | — |
| | 44 |
| |
| General and administrative | — |
| | — |
| | — |
| | 19 |
| | 19 |
| — |
| | — |
| | 1 |
| | 19 |
| | 20 |
|
| Acquisition-related transaction and integration costs | — |
| | — |
| | — |
| | 3 |
| | 3 |
| — |
| | — |
| | — |
| | 20 |
| | 20 |
|
| Development costs | | — |
|
| — |
|
| 2 |
|
| 1 |
| | 3 |
|
| Operating income (loss) | 156 |
| | 114 |
| | 35 |
| | (22 | ) | | 283 |
| 174 |
| | 173 |
| | 40 |
| | (40 | ) | | 347 |
|
| Equity in earnings of unconsolidated affiliates | 12 |
| | 59 |
| | — |
| | — |
| | 71 |
| 11 |
| | 63 |
| | — |
| | — |
| | 74 |
|
| Other income, net | 1 |
| | 2 |
| | — |
| | 1 |
| | 4 |
| 1 |
| | 4 |
| | 1 |
| | 2 |
| | 8 |
|
| Loss on debt extinguishment | — |
| | (3 | ) | | — |
| | — |
| | (3 | ) | |
| Interest expense | (49 | ) | | (164 | ) | | (10 | ) | | (71 | ) | | (294 | ) | |
| Interest expense, net | | (51 | ) | | (154 | ) | | (12 | ) | | (77 | ) | | (294 | ) |
| Net Income (Loss) | 120 |
| | 8 |
| | 25 |
| | (92 | ) | | 61 |
| 135 |
| | 86 |
| | 29 |
| | (115 | ) | | 135 |
|
| Less: Net loss attributable to noncontrolling interests | — |
| | (75 | ) | | — |
| | — |
| | (75 | ) | |
| Net Income (Loss) Attributable to Clearway Energy LLC | $ | 120 |
| | $ | 83 |
| | $ | 25 |
| | $ | (92 | ) | | $ | 136 |
| $ | 135 |
| | $ | 190 |
| | $ | 29 |
| | $ | (114 | ) | | $ | 240 |
|
| Balance Sheet | | | | | | | | | | | | | | | | | | |
| Equity investments in affiliates | $ | 102 |
| | $ | 1,076 |
| | $ | — |
| | $ | — |
| | $ | 1,178 |
| $ | 98 |
| | $ | 1,074 |
| | $ | — |
| | $ | — |
| | $ | 1,172 |
|
Capital expenditures (a) | 15 |
| | 181 |
| | 16 |
| | — |
| | 212 |
| 14 |
| | 26 |
| | 28 |
| | — |
| | 68 |
|
| Total Assets | $ | 1,897 |
| | $ | 6,017 |
| | $ | 422 |
| | $ | 24 |
| | $ | 8,360 |
| $ | 1,788 |
| | $ | 5,836 |
| | $ | 516 |
| | $ | 308 |
| | $ | 8,448 |
|
(a) Includes accruals.
|
| | | | | | | | | | | | | | | | | | | |
| | Year ended December 31, 2016 |
| (In millions) | Conventional Generation | | Renewables | | Thermal | | Corporate | | Total |
| Operating revenues | $ | 333 |
| | $ | 532 |
| | $ | 170 |
| | $ | — |
| | $ | 1,035 |
|
| Cost of operations | 66 |
| | 128 |
| | 114 |
| | — |
| | 308 |
|
| Depreciation and amortization | 80 |
| | 203 |
| | 20 |
| | — |
| | 303 |
|
| Impairment losses | — |
| | 185 |
| | — |
| | — |
| | 185 |
|
| General and administrative | — |
| | — |
| | — |
| | 14 |
| | 14 |
|
| Acquisition-related transaction and integration costs | — |
| | — |
| | — |
| | 1 |
| | 1 |
|
| Operating income (loss) | 187 |
| | 16 |
| | 36 |
| | (15 | ) | | 224 |
|
| Equity in earnings of unconsolidated affiliates | 13 |
| | 47 |
| | — |
| | — |
| | 60 |
|
| Other income, net | 1 |
| | 2 |
| | — |
| | — |
| | 3 |
|
| Interest expense | (48 | ) | | (151 | ) | | (7 | ) | | (66 | ) | | (272 | ) |
| Net Income (Loss) | 153 |
| | (86 | ) | | 29 |
| | (81 | ) | | 15 |
|
| Less: Net loss attributable to noncontrolling interests | — |
| | (111 | ) | | — |
| | — |
| | (111 | ) |
| Net Income (Loss) Attributable to Clearway Energy LLC | $ | 153 |
| | $ | 25 |
| | $ | 29 |
| | $ | (81 | ) | | $ | 126 |
|
|
| | | | | | | | | | | | | | | | | | | |
| | Year ended December 31, 2017 |
| (In millions) | Conventional Generation | | Renewables | | Thermal | | Corporate | | Total |
| Operating revenues | $ | 336 |
| | $ | 501 |
| | $ | 172 |
| | $ | — |
| | $ | 1,009 |
|
| Cost of operations | 77 |
| | 133 |
| | 116 |
| | — |
| | 326 |
|
| Depreciation and amortization | 103 |
| | 210 |
| | 21 |
| | — |
| | 334 |
|
| Impairment losses | — |
| | 44 |
| | — |
| | — |
| | 44 |
|
| General and administrative | — |
| | — |
| | — |
| | 19 |
| | 19 |
|
| Acquisition-related transaction and integration costs | — |
| | — |
| | — |
| | 3 |
| | 3 |
|
| Operating income (loss) | 156 |
| | 114 |
| | 35 |
| | (22 | ) | | 283 |
|
| Equity in earnings of unconsolidated affiliates | 12 |
| | 59 |
| | — |
| | — |
| | 71 |
|
| Other income, net | 1 |
| | 2 |
| | — |
| | 1 |
| | 4 |
|
| Loss on debt extinguishment | — |
| | (3 | ) | | — |
| | — |
| | (3 | ) |
| Interest expense, net | (49 | ) | | (164 | ) | | (10 | ) | | (71 | ) | | (294 | ) |
| Net Income (Loss) | 120 |
| | 8 |
| | 25 |
| | (92 | ) | | 61 |
|
| Less: Net loss attributable to noncontrolling interests | — |
| | (75 | ) | | — |
| | — |
| | (75 | ) |
| Net Income (Loss) Attributable to Clearway Energy LLC | $ | 120 |
| | $ | 83 |
| | $ | 25 |
| | $ | (92 | ) | | $ | 136 |
|
Note 13 — Related Party Transactions
In addition to the transactions and relationships described elsewhere in the notes to the consolidated financial statements, certain subsidiaries of CEG provide services to the Company's project entities. Amounts due to CEG subsidiaries are recorded as accounts payable - affiliate and amounts due to the Company from CEG subsidiaries are recorded as accounts receivable - affiliate in the Company's balance sheet. The disclosures below summarize the Company's material related party transactions with CEG and its subsidiaries that are included in the Company's operating revenues and operating costs.
As discussed in Item 15 — Note 1, Nature of Business, on August 31, 2018, NRG sold 100% of its interest in CEG to GIP, and as a result, CEG and its subsidiaries are considered related parties during the year ended December 31, 2019 , and NRG and its subsidiaries were considered related parties during the first eight months of the year ended December 31, 2018.
Related Party Transactions with CEG entities
AdministrativeO&M Services Agreements by and between the Company and Clearway Renewable Operation & Maintenance LLC (formerly NRG Renew Operation & Maintenance LLC)
Various wholly-owned subsidiaries of the Company in the Renewables segment are party to administrative services agreements with Clearway Renewable Operation & Maintenance LLC (formerly NRG Renew Operation & Maintenance LLC), or RENOM, a wholly-owned subsidiary of CEG, which provides Operationoperation and Maintenance,maintenance, or O&M, services to these subsidiaries. The Company incurred total expenses for these services of $30 million, $23 million and $13$31 million for the yearsyear ended December 31, 2019. The Company incurred total expenses of $11 million for the period from September 1, 2018 2017 and 2016, respectively.to December 31, 2018. There was a balance of $6$7 million and $5$6 million due to RENOM as of December 31, 2019 and 2018, respectively.
Administrative Services Agreements by and 2017, respectively.between the Company and CEG
Various wholly-owned subsidiaries of the Company are parties to administrative services agreements with Clearway Asset Services (formerly NRG Asset Services) and Clearway Solar Asset Management (formerly NRG Solar Asset Management), two wholly-owned subsidiaries of CEG, which provide various administrative services to the Company's subsidiaries. The Company incurred expenses under these agreements of $7 million for the year ended December 31, 2019. The Company incurred expenses under these agreements of $3 million for the period from September 1, 2018 to December 31, 2018.
CEG Master Services Agreements
Following the consummation of the GIP Transaction, Clearway Energy, Inc. along with Clearway Energy LLC and Clearway Energy Operating LLC entered into Master Services Agreements with CEG, pursuant to which CEG and certain of its affiliates or third party service providers began providing certain services to the Company,including operational and administrative services, which include human resources, information systems, external affairs, accounting, procurement and risk management services, and the Company began providing certain services to CEG, including accounting, internal audit, tax and treasury services, in exchange for the payment of fees in respect of such services.
Amounts There was a balance of $1 million in accounts payable — affiliate due to CEG or its subsidiaries are recordedunder the Master Services Agreement as accounts payable - affiliate and amounts due to the Company from CEG and subsidiaries are recorded as accounts receivable - affiliate on the Company's consolidated balance sheet.of December 31, 2019, which was paid in January 2020.
Related Party Transactions with NRG entities prior to the GIP Transaction
The following transactions relate to the period prior to sale of NRG's interest in CEG to GIP on August 31, 2018 and therefore were considered to be related party transactions for all the periods prior to August 31, 2018:
O&M Services Agreements by and between the Company and NRG Renew Operation & Maintenance LLC
Various wholly-owned subsidiaries of the Company in the Renewables segment were party to administrative services agreements with NRG Renew Operation & Maintenance LLC, or RENOM, formerly wholly-owned subsidiary of NRG, which provided O&M, services to these subsidiaries. The Company incurred total expenses for these services of $29 million for the eight months ended August 31, 2018. The Company incurred total expenses of $23 million for the year ended December 31, 2017.
Administrative Services Agreements by and between the Company and NRG
Various wholly-owned subsidiaries of the Company were parties to administrative services agreements with Clearway Asset Services (formerly NRG Asset Services) and Clearway Solar Asset Management (formerly NRG Solar Asset Management), two wholly-owned subsidiaries of CEG, which provided various administrative asset services to the Company's subsidiaries prior to GIP Transaction. The Company reimbursed costs under this agreement of $6 million for the eight months ended August 31, 2018. The Company reimbursed costs under this agreement of $6 million for the year ended December 31, 2017.
Power Purchase Agreements (PPAs) between the Company and NRG Power Marketing
Elbow Creek and Dover arewere parties to PPAs with NRG Power Marketing and generate revenue under the PPAs, which arewere recorded to operating revenues in the Company's consolidated statements of operations. For the eight months ended August 31, 2018, Elbow Creek and Dover, collectively, generated revenues of $8 million. For the yearsyear ended December 31, 2017, and 2016, Elbow Creek and Dover, collectively, generated revenues of $12 million and $13 million, respectively.million.
Energy Marketing Services Agreement by and between Thermal entities and NRG Power Marketing
Energy Center Dover LLC, Energy Center Minneapolis, Energy Center Phoenix LLC and Energy Center Paxton LLC, or Thermal entities, are parties to Energy Marketing Services Agreements with NRG Power Marketing, a wholly-owned subsidiary of NRG. Under the agreements, NRG Power Marketing procures fuel and fuel transportation for the operation of Thermal entities. For the eight months ended August 31, 2018, the Thermal entities purchased $7 million of natural gas from NRG Power Marketing. The Thermal entities purchased a total of $9 million of natural gas during each of the yearsyear ended December 31, 2017 and 2016..
Operation and Maintenance (O&M) Services Agreements by and between the Company's subsidiaries and NRG
Certain of the Company's subsidiaries are party to O&M Services Agreements with NRG, pursuant to which NRG subsidiaries provide necessary and appropriate services to operate and maintain the subsidiaries' plant operations, businesses and thermal facilities. NRG is reimbursed for the provided services, as well as for all reasonable and related expenses and expenditures, and payments to third parties for services and materials rendered to or on behalf of the parties to the agreements. NRG is not entitled to any management fee or mark-up under the agreements. The fees incurred under these agreements waswere $27 million for the eight months ended August 31, 2018. The fees incurred under this agreement were2018 and $39 million and $36 million for the yearsyear ended December 31, 2017 and 2016, respectively.2017.
O&MServices Agreements by and between GenConn and NRG
GenConn incurs fees under two O&M agreements with wholly-owned subsidiaries of NRG. For the eight months ended August 31, 2018, the aggregate fees incurred under the agreements were $4 million. The fees incurred under the agreements were $5 million during each offor the yearsyear ended December 31, 2017 and 2016.
2017.
Administrative Services Agreement by and between Marsh Landing and NRG West Coast LLC
Marsh Landing is a party to an administrative services agreement with NRG West Coast LLC, a wholly owned subsidiary of NRG. The Company reimbursed costs under this agreement of $11 million for the eight months ended August 31, 2018. The Company reimbursed costs under this agreement of approximately $15 million and $14 million for the yearsyear ended December 31, 2017 and 2016, respectively.2017.
Project Administrative Services Agreement by and between ESEC and NRG West Coast LLC
During 2018, ESEC, NRG West Coast LLC and NRG Power Marketing LLC, or PML, entered into confirmation agreements under the Project Administration Services Agreement between ESEC and NRG West Coast LLC, whereby PML purchased California Carbon Allowances which ESEC could subsequently purchase for the purposes of ESEC’s compliance with the California Cap-and-Trade Program. ESEC reimbursed costs under these agreements of $11 million for the eight months ended August 31, 2018.
Management Services Agreement by and between the Company and NRG
Prior to the GIP Transaction, NRG provided the Company with various operational, management, and administrative services, which include human resources, accounting, tax, legal, information systems, treasury, and risk management, as set forth in the Management Services Agreement. Costs incurred under this agreement were $7 million for the eight months ended August 31, 2018. Costs incurred under this agreement were approximately $10 million during each offor the yearsyear ended December 31, 2017 and 2016, respectively.2017. The costs incurred under the Management Services Agreement included certain direct expenses incurred by NRG on behalf of the Company in addition to the base management fee.
On August 31, 2018, in connection with the consummation of the GIP Transaction, the Company entered into a Termination Agreement with Clearway Energy LLC, Clearway Energy Operating LLC and NRG terminating the Management Services Agreement, dated as of July 22, 2013, by and among the Company, Clearway Energy LLC, Clearway Energy Operating LLC and NRG. Concurrently with entering into the Termination Agreement on August 31, 2018, the Company entered into a Transition Services Agreement with NRG, as further described in Note 1, Nature of Business.
Subsequent to the GIP Transaction, the Company entered into a Transition Services Agreement with NRG, or the NRG TSA, pursuant to which NRG or certain of its affiliates began providing transitional services to the Company following the consummation of the GIP Transaction, in exchange for the payment of a fee in respect of such services. Expenses related to the NRG TSA are recorded in acquisition-related transaction and integration costs in the consolidated statements of operations.
EPC Agreement by and between ECP and NRG
NRG Business Services LLC, a subsidiary of NRG, and Energy Center Pittsburgh LLC, or ECP, a wholly owned subsidiary of the Company, entered into an EPC agreement for the construction of a 73 MWt district energy system for ECP to provide 150 kpphpph of steam, 6,750 tons of chilled water and 7.5 MW of emergency backup power service to UPMC Mercy. The initial term of the energy services agreement with UPMC Mercy will be for a period of twenty years from the service commencement date. On June 19, 2018, as discussed in Note 3, Business Acquisitions and Dispositions, ECP purchased the UPMC Thermal Project assets from NRG Business Services LLC for cash consideration of $84 million, subject to working capital adjustments. The Company paid an additional $3 million to NRG upon final completion of the project in January 2019 pursuant to the EPC agreement.
Note 14 — Commitments and Contingencies
Operating Lease Commitments
The Company leases certain facilities and equipment under operating leases, some of which include escalation clauses, expiring on various dates through 2048. The effects of these scheduled rent increases, leasehold incentives, and rent concessions are recognized on a straight-line basis over the lease term unless another systematic and rational allocation basis is more representative of the time pattern in which the leased property is physically employed. Lease expense under operating leases was $18 million, $17 million and $15 million for the years ended December 31, 2018, 2017 and 2016, respectively.
Future minimum lease commitments under operating leases for the years ending after December 31, 2018 are as follows:
|
| | | |
| | (In millions) |
| 2019 | $ | 13 |
|
| 2020 | 13 |
|
| 2021 | 13 |
|
| 2022 | 13 |
|
| 2023 | 12 |
|
| Thereafter | 207 |
|
| Total | $ | 271 |
|
Gas and Transportation Commitments
The Company has entered into contractual arrangements to procure power, fuel and associated transportation services. For the years ended December 31, 2019, 2018 2017 and 2016,2017, the Company purchased $38 million, $39 million $34 million and $32$34 million, respectively, under such arrangements. As further described in Note 13 Related Party Transactions, these purchases include intercompany transactions through August 31, 2018 between certain Thermal entities and NRG Power Marketing under the Energy Marketing Services Agreements in the amount of $7 million for the eight months ended August 31, 2018 and $9 million during each of the yearsyear ended December 31, 2017 and 2016.2017.
As of December 31, 2018,2019, the Company's commitments under such outstanding agreements are estimated as follows:
|
| | | |
| Period | (In millions) |
| 2020 | $ | 9 |
|
| 2021 | 3 |
|
| 2022 | 3 |
|
| 2023 | 3 |
|
| 2024 | 3 |
|
| Thereafter | 10 |
|
| Total | $ | 31 |
|
|
| | | |
| Period | (In millions) |
| 2019 | $ | 11 |
|
| 2020 | 3 |
|
| 2021 | 3 |
|
| 2022 | 3 |
|
| 2023 | 3 |
|
| Thereafter | 13 |
|
| Total | $ | 36 |
|
Contingencies
The Company's material legal proceedings are described below. The Company believes that it has valid defenses to these legal proceedings and intends to defend them vigorously. The Company records reserves for estimated losses from contingencies when information available indicates that a loss is probable and the amount of the loss, or range of loss, can be reasonably estimated. As applicable, the Company has established an adequate reserve for the matters discussed below. In addition, legal costs are expensed as incurred. Management assesses such matters based on current information and makes a judgment concerning its potential outcome, considering the nature of the claim, the amount and nature of damages sought and the probability of success. The Company is unable to predict the outcome of the legal proceedings below or reasonably estimate the scope or amount of any associated costs and potential liabilities. As additional information becomes available, management adjusts its assessment and estimates of such contingencies accordingly. Because litigation is subject to inherent uncertainties and unfavorable rulings or developments, it is possible that the ultimate resolution of the Company's liabilities and contingencies could be at amounts that are different from its currently recorded reserves and that such difference could be material.
In addition to the legal proceedings noted below, the Company and its subsidiaries are party to other litigation or legal proceedings arising in the ordinary course of business. In management's opinion, the disposition of these ordinary course matters will not materially adversely affect the Company's consolidated financial position, results of operations, or cash flows.
Nebraska Public Power District Litigation
On January 11, 2019, Nebraska Public Power District, or NPPD, sent written notice to certain of the Company’s subsidiaries which own the Laredo Ridge and Elkhorn Ridge wind projects alleging an event of default under each of the power purchase agreementsPPAs between NPPD and the projects. NPPD alleges that the Company moved forward with certain transactions without obtaining the consent of NPPD. NPPD threatened to terminate the applicable power purchase agreementsPPAs by February 11, 2019 if the alleged default was not cured. The Company filed a motion for a temporary restraining order and preliminary injunction in the U.S. District Court for the District of Nebraska relating to the Laredo Ridge project, and a similar motion in the District Court
of Knox County, Nebraska for the Elkhorn Ridge project, to enjoin NPPD from taking any actions related to the power purchase agreements.PPAs. On February 19, 2019, the U.S. District Court in the Laredo Ridge matter approved a stipulation between the parties to provide for an injunction preventing NPPD from terminating the PPA pending disposition of the litigation. On February 26, 2019, the Knox County District Court approved a similar stipulation relating to the Elkhorn Ridge project. Additionally, Elkhorn Ridge was added as a third-party defendant to the litigation in the U.S. District Court. On September 23, 2019, NPPD filed amended complaints in the U.S. District Court, to which Laredo Ridge and Elkhorn Ridge responded on October 7, 2019. A motion for summary judgment was filed by the Company on December 19, 2019, which was opposed by NPPD on February 12, 2020. Judicial review is pending. The Company believes the allegations of NPPD are meritless and the Company is vigorously defending its rights under the power purchase agreements.PPAs.
Buckthorn Solar Litigation
On October 8, 2019, the City of Georgetown, Texas, or Georgetown, filed a petition in the District Court of Williamson County, Texas naming Buckthorn Westex, LLC, the Company’s subsidiary that owns the Buckthorn Westex solar project, as the defendant, alleging fraud by nondisclosure and breach of contract in connection with the project and the PPA, and seeking (i) rescission and/or cancellation of the PPA, (ii) declaratory judgment that the alleged breaches constitute an event of default under the PPA entitling Georgetown to terminate, and (iii) recovery of all damages, costs of court, and attorneys’ fees. On November 15, 2019, Buckthorn Westex filed an original answer and counterclaims (i) denying Georgetown’s claims, (ii) alleging Georgetown has breached its contracts with Buckthorn Westex by failing to pay amounts due, and (iii) seeking relief in the form of (x) declaratory judgment that Georgetown’s alleged failure to pay amounts due constitute breaches of and an event of default under the PPA and that Buckthorn did not commit any events of default under the PPA, (y) recovery of costs, expenses, interest, and attorneys’ fees, and (z) such other relief to which it is entitled at law or in equity.Buckthorn Westex believes the allegations of Georgetown are meritless, and Buckthorn Westex is vigorously defending its rights under the PPA.
Note 15 — Leases
Adoption of Topic 842
The Company adopted ASU No. 2016-02, Leases (Topic 842), or Topic 842, on January 1, 2019 using the modified retrospective transition method and therefore, prior period financial information has not been adjusted and continues to be reflected in accordance with the Company’s historical accounting policy. Topic 842 requires the establishment of a lease liability and related right-of-use, or ROU, asset for all leases with a term longer than 12 months. The Company elected certain of the permitted practical expedients, including the expedient that permits the Company to retain its existing lease assessment and classification. The Company also elected to account for lease and non-lease components for specific asset classes as a single lease component.
The adoption of the standard resulted in the recording of operating lease liabilities of $165 million and related ROU assets of $159 million. There was no impact to the Company’s consolidated statement of operations or cash flows. The Company utilized its incremental borrowing rate at adoption date, ranging from 4.04% - 4.67%, to determine the amount of the lease liabilities.
Accounting for Leases
The Company evaluates each arrangement at inception to determine if it contains a lease. All of the Company’s leases are operating leases as of December 31, 2019.
Lessee
The Company records its operating lease liabilities at the present value at lease commencement date of the lease payments over the lease term. Lease payments include fixed payment amounts, as well as variable rate payments based on an index initially measured at lease commencement date. Variable payments, including payments based on future performance and based on index changes, are recorded as the expense is incurred. The Company determines the relevant lease term by evaluating whether renewal and termination options are reasonably certain to be exercised. The Company uses its incremental borrowing rate to calculate the present value of the lease payments, based on information available at the lease commencement date.
The Company’s leases consist of land leases for numerous operating asset locations, real estate leases and equipment leases. The terms and conditions for these leases vary by the type of underlying asset.
Lease expense for the year ended December 31, 2019 was comprised of the following:
|
| | | | |
| (In millions) | | |
| Operating lease cost | | $ | 13 |
|
| Variable lease cost | | 8 |
|
| Total lease cost | | $ | 21 |
|
Lease expense under operating leases was $18 million and $17 million for the years ended December 31, 2018 and 2017, respectively.
Operating lease information as of December 31, 2019 was as follows:
|
| | | | |
| (In millions, except term and rate) | | |
| ROU Assets - operating leases, net | | $ | 223 |
|
| | | |
Short-term lease liability - operating leases (a) | | 7 |
|
| Long-term lease liability - operating leases | | 227 |
|
| Total lease liability | | $ | 234 |
|
| | | |
| Cash paid for operating leases | | $ | 15 |
|
| Weighted average remaining lease term | | 25 |
|
| Weighted average discount rate | | 4.4% |
(a) Short-term lease liability balances are included within the accrued expenses and other current liabilities line item of the consolidated balance sheets as of December 31, 2019.
Maturities of operating lease liabilities as of December 31, 2019 are as follows: |
| | | | |
| (In millions) | | |
| 2020 | | $ | 16 |
|
| 2021 | | 16 |
|
| 2022 | | 16 |
|
| 2023 | | 15 |
|
| 2024 | | 16 |
|
| Thereafter | | 303 |
|
| Total lease payments | | 382 |
|
| Less imputed interest | | (148 | ) |
| Total lease liability - operating leases | | $ | 234 |
|
Maturities of operating lease liabilities as of December 31, 2018 under the ASC 840 were as follows:
|
| | | | |
| (In millions) | | |
| 2019 | | 13 |
|
| 2020 | | 13 |
|
| 2021 | | 13 |
|
| 2022 | | 13 |
|
| 2023 | | 12 |
|
| Thereafter | | 207 |
|
| Total lease payments | | $ | 271 |
|
Oahu Solar Lease Agreements
The Oahu Solar projects are party to various land lease agreements with a wholly owned subsidiary of CEG. the projects are leasing the land for a period of 35 years, with the ability to renew the lease for 2 additional five year periods. the Company has a lease liability of $21 million and corresponding right-of-use asset of $19 million related to the leases as of December 31, 2019.
Lessor
The majority of the Company’s revenue is obtained through PPAs or other contractual agreements that are accounted for as leases. These leases are comprised of both fixed payments and variable payments contingent upon volumes or performance metrics. The terms of the leases are further described in Item 2 — Properties of this Form 10-K. Many of the leases have renewal options at the end of the lease term. Termination may be allowed under specific circumstances in the lease arrangements, such as under an event of default. All of the Company’s leases are operating leases. Certain of these leases have both lease and non-lease components, and the Company allocates the transaction price to the components based on standalone selling prices. The following amounts of energy and capacity revenue are related to the Company’s leases:
|
| | | | | | | | | | | | | | | | |
| Period ended December 31, 2019 | | | | | | | | |
| (In millions) | | Conventional Generation | | Renewables | | Thermal | | Total |
| Energy revenue | | $ | 5 |
| | $ | 509 |
| | $ | 2 |
| | $ | 516 |
|
| Capacity revenue | | 348 |
| | — |
| | — |
| | 348 |
|
| Operating revenue | | $ | 353 |
| | $ | 509 |
| | $ | 2 |
| | $ | 864 |
|
|
| | | | | | | | | | | | | | | | |
| Period ended December 31, 2018 | | | | | | | | |
| (In millions) | | Conventional Generation | | Renewables | | Thermal | | Total |
| Energy revenue | | $ | 5 |
| | $ | 534 |
| | $ | 2 |
| | $ | 541 |
|
| Capacity revenue | | 337 |
| | — |
| | — |
| | 337 |
|
| Operating revenue | | $ | 342 |
| | $ | 534 |
| | $ | 2 |
| | $ | 878 |
|
Minimum future rent payments for the remaining periods relate to the Conventional segment and were as follows as of December 31, 2019:
|
| | | |
| (In millions) | |
| 2020 | 439 |
|
| 2021 | 444 |
|
| 2022 | 450 |
|
| 2023 | 259 |
|
| 2024 | 106 |
|
| Thereafter | 1,605 |
|
| Total lease payments | $ | 3,303 |
|
Property, plant and equipment, net related to the Company’s operating leases were as follows as of December 31, 2019:
|
| | | |
| (In millions) | |
| Property, plant and equipment | $ | 6,942 |
|
| Accumulated depreciation | (1,649 | ) |
| Net property, plant and equipment | $ | 5,293 |
|
Note 16 — Unaudited Quarterly Data
Below is summarized unaudited quarterly financial data for the periods ending December 31, 20182019 and 2017. The Company's historical financial results for the four quarters of 2017 were recast to include the results of the Buckthorn Solar Drop Down Asset acquisition, which took place on March 30, 2018, and is further described in Note 3, Business Acquisitions. The Company originally recast its historical quarterly financial statements to include the result of the Buckthorn Drop Down Asset acquisition in its Form 10-Q for the period ended September 30, 2018. Additionally, the quarterly results for the period ended December 31, 2017, as presented below in the table, were recast to include the quarterly operating results of the Buckthorn Solar Drop Down Asset for the period ending December 31, 2017.
|
| | | | | | | | | | | | | | | |
| | Quarter Ended |
| | December 31, | | September 30, | | June 30, | | March 31, |
| | 2019 |
| | (In millions) |
| Operating Revenues | $ | 235 |
| | $ | 296 |
| | $ | 284 |
| | $ | 217 |
|
| | | | | | | | |
| Operating Income | 7 |
| | 90 |
| | 88 |
| | 41 |
|
| | | | | | | | |
| Net (Loss) Income | (41 | ) | | 25 |
| | (31 | ) | | (54 | ) |
|
| | | | | | | | | | | | | | | |
| | Quarter Ended |
| | December 31, | | September 30, | | June 30, | | March 31, |
| | 2018 |
| | (In millions) |
| Operating Revenues | $ | 229 |
| | $ | 292 |
| | $ | 307 |
| | $ | 225 |
|
| | | | | | | | |
| Operating Income | 54 |
| | 100 |
| | 144 |
| | 49 |
|
| | | | | | | | |
| Net (Loss) Income | (37 | ) | | 64 |
| | 106 |
| | 2 |
|
|
| | | | | | | | | | | | | | | |
| | Quarter Ended |
| | December 31, | | September 30, | | June 30, | | March 31, |
| | 2017 |
| | (In millions) |
| Operating Revenues | $ | 231 |
| | $ | 269 |
| | $ | 288 |
| | $ | 221 |
|
| | | | | | | | |
| Operating Income | 20 |
| | 84 |
| | 125 |
| | 54 |
|
| | | | | | | | |
| Net (Loss) Income | (37 | ) | (a) | 42 |
| | 56 |
| | — |
|
(a) The Company reported Net loss of $38 million for the quarter ending December 31, 2017, as previously reported in the
Note 17 , Unaudited Quarterly Financial Data of its Form 2017 10-K. The recast results in the table above include $1 million of Net Income attributable to the Buckthorn Solar Drop Down Asset acquisition.
Note 16 — Condensed Consolidating Financial Information
As of December 31, 2018,2019, Clearway Energy Operating LLC had outstanding $500$88 million of the 2024 Senior Notes, $600 million of the 2025 Senior Notes and, $350 million of the 2026 Senior Notes and $600 million of the 2028 Senior Notes, collectively Senior Notes, as further described in Note 10, Long-term Debt. These Senior Notes are guaranteed by the Company, as well as certain of the Company's subsidiaries, or guarantor subsidiaries. These guarantees are both joint and several. The non-guarantor subsidiaries include the rest of the Company's subsidiaries, including the ones that are subject to project financing.
Unless otherwise noted below, each of the following guarantor subsidiaries fully and unconditionally guaranteed the Senior Notes as of December 31, 2018:
2019:
|
|
| Alta Wind 1-5 Holding Company, LLC |
| Alta Wind Company, LLC |
| Central CA Fuel Cell 1, LLC |
| Clearway Energy LLC |
| Clearway Energy Operating LLC |
| Clearway Solar Star LLC |
| DGPV Holding LLC |
| ECP Uptown Campus Holdings LLC |
| Energy Center Caguas Holdings LLC |
| Energy Center Fajardo Holdings LLC |
| Fuel Cell Holdings LLC |
| Portfolio Solar I, LLC |
| RPV Holding LLC |
| Solar Flagstaff One LLC |
| Solar Iguana LLC |
| Solar Las Vegas MB 1 LLC |
| Solar Tabernacle LLC |
| South Trent Holdings LLC |
| SPP Asset Holdings, LLC |
| SPP Fund II Holdings, LLC |
| SPP Fund II, LLC |
| SPP Fund II-B, LLC |
| SPP Fund III, LLC |
| Thermal Canada Infrastructure Holdings LLC |
| Thermal Hawaii Development Holdings LLC |
| Thermal Infrastructure Development Holdings LLC |
| UB Fuel Cell, LLC |
Clearway Energy Operating LLC conducts much of its business through and derives much of its income from its subsidiaries. Therefore, its ability to make required payments with respect to its indebtedness and other obligations depends on the financial results and condition of its subsidiaries and Clearway Energy Operating LLC's ability to receive funds from its subsidiaries. There are no restrictions on the ability of any of the guarantor subsidiaries to transfer funds to Clearway Energy Operating LLC. However, there may be restrictions for certain non-guarantor subsidiaries.
On January 29, 2019, PG&E filed for bankruptcy under Chapter 11 of the U.S. Bankruptcy Code. PG&E is one of the Company's largest customers, representing approximately 23%22% of the Company's consolidated operating revenues during the year ended December 31, 20182019 and 16%9% of total accounts receivable as of December 31, 2018, of which all has been collected as of January 31, 2019. The PG&E bankruptcy filing is an event of default under the related financing agreements which caused uncertainty around the timing of when certain project-level cash distributions will be available to the Company. As of December 31, 2018,2019, all project level cash balances for these subsidiaries were classified as restricted cash. None of the subsidiaries affected by the PG&E bankruptcy are guarantors of the Senior Notes as of December 31, 2018.2019.
The following condensed consolidating financial information presents the financial information of Clearway Energy LLC, Clearway Energy Operating LLC, the issuer of the Senior Notes, the guarantor subsidiaries and the non-guarantor subsidiaries in accordance with Rule 3-10 under the SEC Regulation S-X. The financial information may not necessarily be indicative of results of operations or financial position had the guarantor subsidiaries or non-guarantor subsidiaries operated as independent entities.
In this presentation, Clearway Energy LLC consists of parent company operations. Guarantor subsidiaries and non-guarantor subsidiaries of Clearway Energy LLC are reported on an equity basis. For companies acquired, the fair values of the assets and liabilities acquired have been presented on a push-down accounting basis.
As described in Note 3,Business Acquisitions and Dispositions, the Company completed the acquisition of the Buckthorn SolarCarlsbad Drop Down Asset acquisition on March 30, 2018.December 6, 2019. The guidance requires retrospective combinationCarlsbad acquisition is the result of the entities for all periods presentedCompany having elected its option to purchase Carlsbad pursuant to the ROFO agreement, as if the combination has been in effect since the inception of common control. Accordingly,amended, by and among the Company, prepared its condensed consolidating financial statements to reflectCEG and GIP. The transaction is reflected in the transfers as if they had taken place from the beginning of the financial statements period.
The Company also completed the UPMC Thermal Project Asset Acquisition on June 19, 2018, which was an asset acquisition.Company's Conventional segment. The assets transferred to the Company relate to interests under common control by NRGGIP and were recorded at book value in accordance with ASC 805-50, Business Combinations - Related Issues. The difference between the purchase price and book value of the assets was recorded as a distribution to NRGCEG and decreased the balance of contributed capital.its noncontrolling interest. The acquisition was determined to be an asset acquisition and not a business combination, therefore no recast of the historical financial information was deemed necessary.
During the first six months of 2018, the Company added certain subsidiaries to the list of guarantors under the Senior Notes indentures, and as a result, the Company recast the historical financial statements to allow for the comparability between the reported periods as required by GAAP.
In addition, the condensed parent company financial statements are provided in accordance with Rule 12-04, Schedule I of Regulation S-X, as the restricted net assets of Clearway Energy LLC’s subsidiaries exceed 25 percent of the consolidated net assets of Clearway Energy LLC. These statements should be read in conjunction with the consolidated statements and notes thereto of Clearway Energy LLC. For a discussion of Clearway Energy LLC's long-term debt, see Note 10, Long-term Debt. For a discussion of Clearway Energy LLC's commitments and contingencies, see Note 14, Commitments and Contingencies.
For a discussion of Clearway Energy LLC's distributions to Clearway, Energy, Inc., NRG Energy, (and subsequent to August 31, 2018, CEG),CEG, see Note 11, Members' Equity.
In addition, Clearway Energy LLC’s cash and cash equivalents represents corporate cash held in overnight investment accounts and is used for general corporate purposes for Clearway LLC and Clearway Operating LLC.
CLEARWAY ENERGY LLC AND SUBSIDIARIES
CONDENSED CONSOLIDATING STATEMENTS OF OPERATIONS
For the Year Ended December 31, 20182019
| | | | Clearway Energy LLC (a) | | Other Guarantor Subsidiaries | | Non-Guarantor Subsidiaries | | Clearway Energy Operating LLC (Senior Notes Issuer) | | Eliminations(b) | | Consolidated | Clearway Energy LLC (a) | | Other Guarantor Subsidiaries | | Non-Guarantor Subsidiaries | | Clearway Energy Operating LLC (Senior Notes Issuer) | | Eliminations(b) | | Consolidated |
| | (In millions) | (In millions) |
| Operating Revenues | | | | | | | | | | | | | | | | | | | | | | |
| Total operating revenues | $ | — |
| | $ | 11 |
| | $ | 1,042 |
| | $ | 3 |
| | $ | (3 | ) | | $ | 1,053 |
| $ | — |
| | $ | 11 |
| | $ | 1,021 |
| | $ | — |
| | $ | — |
| | $ | 1,032 |
|
| Operating Costs and Expenses | | | | | | | — |
| | | | | | | | | | | — |
| | | | |
| Cost of operations | — |
| | 3 |
| | 329 |
| | 3 |
| | (3 | ) | | 332 |
| — |
| | 3 |
| | 339 |
| | — |
| | — |
| | 342 |
|
| Depreciation and amortization | — |
| | 6 |
| | 325 |
| | — |
| | — |
| | 331 |
| — |
| | 6 |
| | 390 |
| | — |
| | — |
| | 396 |
|
| Impairment losses | | — |
| | — |
| | 33 |
| | — |
| | — |
| | 33 |
|
| General and administrative | — |
| | — |
| | — |
| | 20 |
| | — |
| | 20 |
| — |
| | — |
| | — |
| | 27 |
| | — |
| | 27 |
|
| Acquisition-related transaction and integration costs | — |
| | — |
| | — |
| | 20 |
| | — |
| | 20 |
| — |
| | — |
| | — |
| | 3 |
| | — |
| | 3 |
|
| Development costs | — |
| | — |
| | — |
| | 3 |
| | — |
| | 3 |
| — |
| | — |
| | — |
| | 5 |
| | — |
| | 5 |
|
| Total operating costs and expenses | — |
| | 9 |
| | 654 |
| | 46 |
| | (3 | ) | | 706 |
| — |
| | 9 |
| | 762 |
| | 35 |
| | — |
| | 806 |
|
| Operating Income (Loss) | — |
| | 2 |
| | 388 |
| | (43 | ) | | — |
| | 347 |
| — |
| | 2 |
| | 259 |
| | (35 | ) | | — |
| | 226 |
|
| Other Income (Expense) | | | | | | | | | | | | | | | | | | | | | | |
| Equity in earnings of consolidated affiliates | 237 |
| | — |
| | — |
| | 224 |
| | (461 | ) | | — |
| |
| Equity in (losses) earnings of consolidated affiliates | | (32 | ) | | (15 | ) | | — |
| | 15 |
| | 32 |
| | — |
|
| Equity in earnings of unconsolidated affiliates | — |
| | 43 |
| | 3 |
| | 28 |
| | — |
| | 74 |
| — |
| | 61 |
| | 3 |
| | 19 |
| | — |
| | 83 |
|
| Other income, net | 3 |
| | — |
| | 5 |
| | — |
| | — |
| | 8 |
| 2 |
| | 1 |
| | 6 |
| | — |
| | — |
| | 9 |
|
| Loss on debt extinguishment | | — |
| | — |
| | (1 | ) | | (15 | ) | | — |
| | (16 | ) |
| Interest expense | — |
| | — |
| | (217 | ) | | (77 | ) | | — |
| | (294 | ) | — |
| | — |
| | (316 | ) | | (87 | ) | | — |
| | (403 | ) |
| Total other income (expense), net | 240 |
| | 43 |
| | (209 | ) | | 175 |
| | (461 | ) | | (212 | ) | (30 | ) | | 47 |
| | (308 | ) | | (68 | ) | | 32 |
| | (327 | ) |
| Net Income | 240 |
| | 45 |
| | 179 |
| | 132 |
| | (461 | ) | | 135 |
| |
| Net (Loss) Income | | (30 | ) | | 49 |
| | (49 | ) | | (103 | ) | | 32 |
| | (101 | ) |
| Less: Net loss attributable to noncontrolling interests | — |
| | — |
| | (69 | ) | | (105 | ) | | 69 |
| | (105 | ) | — |
| | — |
| | (58 | ) | | (71 | ) | | 58 |
| | (71 | ) |
| Net Income Attributable to Clearway Energy LLC | $ | 240 |
| | $ | 45 |
| | $ | 248 |
| | $ | 237 |
| | $ | (530 | ) | | $ | 240 |
| |
| Net (Loss) Income Attributable to Clearway Energy LLC | | $ | (30 | ) | | $ | 49 |
| | $ | 9 |
| | $ | (32 | ) | | $ | (26 | ) | | $ | (30 | ) |
(a) Shown separately from the other guarantors in lieu of preparing Schedule I pursuant to the requirements of Rule 5-04(c) of Regulation S-X.
(b) All significant intercompany transactions have been eliminated in consolidation.
CLEARWAY ENERGY LLC AND SUBSIDIARIES
CONDENSED CONSOLIDATING STATEMENTS OF COMPREHENSIVE (LOSS) INCOME
For the Year Ended December 31, 20182019
|
| | | | | | | | | | | | | | | | | | | | | | | |
| | Clearway Energy LLC (a) | | Guarantor Subsidiaries | | Non-Guarantor Subsidiaries | | Clearway Energy Operating LLC (Note Issuer) | | Eliminations(b) | | Consolidated |
| | (In millions) |
| Net Income | $ | 240 |
| | $ | 45 |
| | $ | 179 |
| | $ | 132 |
| | $ | (461 | ) | | $ | 135 |
|
| Other Comprehensive Income | | | | | | | | | | | |
| Unrealized gain on derivatives | 24 |
| | 1 |
| | 20 |
| | 24 |
| | (45 | ) | | 24 |
|
| Other comprehensive income | 24 |
| | 1 |
| | 20 |
| | 24 |
| | (45 | ) | | 24 |
|
| Comprehensive Income | 264 |
| | 46 |
| | 199 |
| | 156 |
| | (506 | ) | | 159 |
|
| Less: Comprehensive loss attributable to noncontrolling interests | — |
| | — |
| | (69 | ) | | (105 | ) | | 69 |
| | (105 | ) |
| Comprehensive Income Attributable to Clearway Energy LLC | $ | 264 |
| | $ | 46 |
| | $ | 268 |
| | $ | 261 |
| | $ | (575 | ) | | $ | 264 |
|
|
| | | | | | | | | | | | | | | | | | | | | | | |
| | Clearway Energy LLC (a) | | Guarantor Subsidiaries | | Non-Guarantor Subsidiaries | | Clearway Energy Operating LLC (Note Issuer) | | Eliminations(b) | | Consolidated |
| | (In millions) |
| Net (Loss) Income | $ | (30 | ) | | $ | 49 |
| | $ | (49 | ) | | $ | (103 | ) | | $ | 32 |
| | $ | (101 | ) |
| Other Comprehensive Income | | | | | | | | | | | |
| Unrealized gain on derivatives | 8 |
| | — |
| | 9 |
| | 8 |
| | (17 | ) | | 8 |
|
| Other comprehensive income | 8 |
| | — |
| | 9 |
| | 8 |
| | (17 | ) | | 8 |
|
| Comprehensive (Loss) Income | (22 | ) | | 49 |
| | (40 | ) | | (95 | ) | | 15 |
| | (93 | ) |
| Less: Comprehensive income (loss) attributable to noncontrolling interests | 1 |
| | — |
| | (58 | ) | | (70 | ) | | 57 |
| | (70 | ) |
| Comprehensive (Loss) Income Attributable to Clearway Energy LLC | $ | (23 | ) | | $ | 49 |
| | $ | 18 |
| | $ | (25 | ) | | $ | (42 | ) | | $ | (23 | ) |
(a) Shown separately from the other guarantors in lieu of preparing Schedule I pursuant to the requirements of Rule 5-04(c) of Regulation S-X.
(b) All significant intercompany transactions have been eliminated in consolidation.
CLEARWAY ENERGY LLC AND SUBSIDIARIES
CONDENSED CONSOLIDATING BALANCE SHEETS
December 31, 20182019
| | | | Clearway Energy LLC (a) | | Other Guarantor Subsidiaries | | Non-Guarantor Subsidiaries | | Clearway Energy Operating LLC
(Senior Notes Issuer) | | Eliminations(b) | | Consolidated | Clearway Energy LLC (a) | | Other Guarantor Subsidiaries | | Non-Guarantor Subsidiaries | | Clearway Energy Operating LLC
(Senior Notes Issuer) | | Eliminations(b) | | Consolidated |
| ASSETS | (In millions) | (In millions) |
| Current Assets | | | | | | | | | | | | | | | | | | | | | | |
| Cash and cash equivalents | $ | 298 |
| | $ | — |
| | $ | 109 |
| | $ | — |
| | $ | — |
| | $ | 407 |
| $ | 27 |
| | $ | — |
| | $ | 125 |
| | $ | — |
| | $ | — |
| | $ | 152 |
|
| Restricted cash | — |
| | — |
| | 176 |
| | — |
| | — |
| | 176 |
| — |
| | — |
| | 262 |
| | — |
| | — |
| | 262 |
|
| Accounts receivable — trade | — |
| | 1 |
| | 103 |
| | — |
| | — |
| | 104 |
| — |
| | 2 |
| | 114 |
| | — |
| | — |
| | 116 |
|
| Accounts receivable — affiliates | 8 |
| | — |
| | — |
| | 11 |
| | (14 | ) | | 5 |
| — |
| | 1 |
| | — |
| | 1 |
| | — |
| | 2 |
|
| Inventory | — |
| | — |
| | 40 |
| |
|
| |
|
| | 40 |
| — |
| | — |
| | 40 |
| | — |
| | — |
| | 40 |
|
| Prepayments and other current assets |
|
| |
|
| | 27 |
| | 2 |
| | — |
| | 29 |
|
|
| | 1 |
| | 31 |
| | 1 |
| | — |
| | 33 |
|
| Total current assets | 306 |
| | 1 |
| | 455 |
| | 13 |
| | (14 | ) | | 761 |
| 27 |
| | 4 |
| | 572 |
| | 2 |
| | — |
| | 605 |
|
| | | | | | | | | | | | | | | | | | | | | | | |
| Property, plant and equipment, net | — |
| | 65 |
| | 5,180 |
| | — |
| | — |
| | 5,245 |
| — |
| | 63 |
| | 6,000 |
| | — |
| | — |
| | 6,063 |
|
| Other Assets | | | | | | | | | | | | | | | | | | | | | | |
| Investment in consolidated subsidiaries | 1,676 |
| | 417 |
| | — |
| | 3,250 |
| | (5,343 | ) | | — |
| 1,824 |
| | 402 |
| | — |
| | 3,492 |
| | (5,718 | ) | | — |
|
| Equity investments in affiliates | — |
| | 289 |
| | 522 |
| | 361 |
| | — |
| | 1,172 |
| — |
| | 342 |
| | 479 |
| | 362 |
| | — |
| | 1,183 |
|
| Intangible assets, net | — |
| | 11 |
| | 1,145 |
| | — |
| | — |
| | 1,156 |
| — |
| | 10 |
| | 1,418 |
| | — |
| | — |
| | 1,428 |
|
| Derivative instruments | — |
| | — |
| | 8 |
| | — |
| | — |
| | 8 |
| |
| Right-of-use assets, net | | — |
| | — |
| | 222 |
| | 1 |
| | — |
| | 223 |
|
| Other non-current assets | — |
| | — |
| | 103 |
| | 3 |
| | — |
| | 106 |
| — |
| | — |
| | 100 |
| | 3 |
| | — |
| | 103 |
|
| Total other assets | 1,676 |
| | 717 |
| | 1,778 |
| | 3,614 |
| | (5,343 | ) | | 2,442 |
| 1,824 |
| | 754 |
| | 2,219 |
| | 3,858 |
| | (5,718 | ) | | 2,937 |
|
| Total Assets | $ | 1,982 |
| | $ | 783 |
| | $ | 7,413 |
| | $ | 3,627 |
| | $ | (5,357 | ) | | $ | 8,448 |
| $ | 1,851 |
| | $ | 821 |
| | $ | 8,791 |
| | $ | 3,860 |
| | $ | (5,718 | ) | | $ | 9,605 |
|
(a) Shown separately from the other guarantors in lieu of preparing Schedule I pursuant to the requirements of Rule 5-04(c) of Regulation S-X.
(b) All significant intercompany transactions have been eliminated in consolidation.
CLEARWAY ENERGY LLC AND SUBSIDIARIES
CONDENSED CONSOLIDATING BALANCE SHEETS
(Continued)
December 31, 20182019
| | | | Clearway Energy LLC (a) | | Other Guarantor Subsidiaries | | Non-Guarantor Subsidiaries | | Clearway Energy Operating LLC
(Senior Notes Issuer) | | Eliminations(b) | | Consolidated | Clearway Energy LLC (a) | | Other Guarantor Subsidiaries | | Non-Guarantor Subsidiaries | | Clearway Energy Operating LLC
(Senior Notes Issuer) | | Eliminations(b) | | Consolidated |
| LIABILITIES AND MEMBERS' EQUITY | (In millions) | (In millions) |
| Current Liabilities | | | | | | | | | | | | | | | | | | | | | | |
| Current portion of long-term debt — external | $ | — |
| | $ | — |
| | $ | 314 |
| | $ | — |
| | $ | — |
| | $ | 314 |
| $ | — |
| | $ | — |
| | $ | 1,692 |
| | $ | 88 |
| | $ | — |
| | $ | 1,780 |
|
| Current portion of long-term debt — affiliate | — |
| | — |
| | — |
| | 215 |
| | — |
| | 215 |
| — |
| | — |
| | — |
| | 44 |
| | — |
| | 44 |
|
| Accounts payable — trade | — |
| | 1 |
| | 36 |
| | 8 |
| | — |
| | 45 |
| — |
| | — |
| | 64 |
| | 9 |
| | — |
| | 73 |
|
| Accounts payable — affiliate | — |
| | — |
| | 23 |
| | 11 |
| | (14 | ) | | 20 |
| 1 |
| | 6 |
| | 20 |
| | 6 |
| | — |
| | 33 |
|
| Derivative instruments | — |
| | — |
| | 4 |
| | — |
| | — |
| | 4 |
| — |
| | — |
| | 16 |
| | — |
| | — |
| | 16 |
|
| Accrued interest expense | — |
| | — |
| | 17 |
| | 27 |
| | — |
| | 44 |
| — |
| | — |
| | 24 |
| | 17 |
| | — |
| | 41 |
|
| Accrued expenses and other current liabilities | — |
| | — |
| | 53 |
| | 4 |
| | — |
| | 57 |
| — |
| | — |
| | 65 |
| | 6 |
| | — |
| | 71 |
|
| Total current liabilities | — |
| | 1 |
| | 447 |
| | 265 |
| | (14 | ) | | 699 |
| 1 |
| | 6 |
| | 1,881 |
| | 170 |
| | — |
| | 2,058 |
|
| Other Liabilities | | | | | | | | | | | | | | | | | | | | | | |
| Long-term debt — external | — |
| | — |
| | 3,970 |
| | 1,434 |
| | — |
| | 5,404 |
| — |
| | — |
| | 3,424 |
| | 1,532 |
| | — |
| | 4,956 |
|
| Long-term debt — affiliate | — |
| | — |
| | — |
| | 44 |
| | — |
| | 44 |
| |
| Derivative instruments | — |
| | — |
| | 17 |
| | — |
| | — |
| | 17 |
| — |
| | — |
| | 76 |
| | — |
| | — |
| | 76 |
|
| Long-term lease liabilities | | — |
| | — |
| | 226 |
| | 1 |
| | — |
| | 227 |
|
| Other non-current liabilities | — |
| | 2 |
| | 92 |
| | 8 |
| | — |
| | 102 |
| — |
| | 2 |
| | 105 |
| | 8 |
| | — |
| | 115 |
|
| Total non-current liabilities | — |
| | 2 |
| | 4,079 |
| | 1,486 |
| | — |
| | 5,567 |
| — |
| | 2 |
| | 3,831 |
| | 1,541 |
| | — |
| | 5,374 |
|
| Total Liabilities | — |
| | 3 |
| | 4,526 |
| | 1,751 |
| | (14 | ) | | 6,266 |
| 1 |
| | 8 |
| | 5,712 |
| | 1,711 |
| | — |
| | 7,432 |
|
| Commitments and Contingencies | | | | | | | | | | | | | | | | | | | | | | |
| Members' Equity | | | | | | | | | | | | | | | | | | | | | | |
| Contributed capital | 1,940 |
| | 804 |
| | 2,708 |
| | 1,930 |
| | (5,442 | ) | | 1,940 |
| 1,882 |
| | 794 |
| | 2,808 |
| | 2,257 |
| | (5,859 | ) | | 1,882 |
|
| Retained earnings (accumulated deficit) | 86 |
| | (24 | ) | | 108 |
| | (210 | ) | | 126 |
| | 86 |
| 5 |
| | 19 |
| | 23 |
| | (396 | ) | | 354 |
| | 5 |
|
| Accumulated other comprehensive loss | (44 | ) | | — |
| | (51 | ) | | (44 | ) | | 95 |
| | (44 | ) | (37 | ) | | — |
| | (42 | ) | | (37 | ) | | 79 |
| | (37 | ) |
| Noncontrolling interest | — |
| | — |
| | 122 |
| | 200 |
| | (122 | ) | | 200 |
| — |
| | — |
| | 290 |
| | 325 |
| | (292 | ) | | 323 |
|
| Total Members' Equity | 1,982 |
| | 780 |
| | 2,887 |
| | 1,876 |
| | (5,343 | ) | | 2,182 |
| 1,850 |
| | 813 |
| | 3,079 |
| | 2,149 |
| | (5,718 | ) | | 2,173 |
|
| Total Liabilities and Members’ Equity | $ | 1,982 |
| | $ | 783 |
| | $ | 7,413 |
| | $ | 3,627 |
| | $ | (5,357 | ) | | $ | 8,448 |
| $ | 1,851 |
| | $ | 821 |
| | $ | 8,791 |
| | $ | 3,860 |
| | $ | (5,718 | ) | | $ | 9,605 |
|
(a) Shown separately from the other guarantors in lieu of preparing Schedule I pursuant to the requirements of Rule 5-04(c) of Regulation S-X.
(b) All significant intercompany transactions have been eliminated in consolidation.
CLEARWAY ENERGY LLC AND SUBSIDIARIES
CONDENSED CONSOLIDATING STATEMENTS OF CASH FLOWS
For the Year Ended December 31, 20182019
| | | | | Clearway Energy LLC (a) | | Other Guarantor Subsidiaries | | Non-Guarantor Subsidiaries | | Clearway Energy Operating LLC (Note Issuer) | | Consolidated | | Clearway Energy LLC (a) | | Other Guarantor Subsidiaries | | Non-Guarantor Subsidiaries | | Clearway Energy Operating LLC (Note Issuer) | | Consolidated |
| | | (In millions) | | (In millions) |
| Net Cash Provided by (Used in) Operating Activities | | $ | — |
| | $ | 23 |
| | $ | 550 |
| | $ | (81 | ) | | $ | 492 |
| | $ | — |
| | $ | 17 |
| | $ | 477 |
| | $ | (25 | ) | | $ | 469 |
|
| Cash Flows from Investing Activities | | | | | | | | | | | | | | | | | | | | |
| Changes in investments in consolidated subsidiaries | | 361 |
| | — |
| | — |
| | (361 | ) | | — |
| |
| Acquisition of business, net of cash acquired | | — |
| | — |
| | — |
| | (11 | ) | | (11 | ) | |
| Intercompany transactions between Clearway Energy LLC and subsidiaries | | | (211 | ) | | — |
| | — |
| | 211 |
| | — |
|
| Acquisition of assets | | | — |
| | — |
| | — |
| | (100 | ) | | (100 | ) |
| Partnership interests acquisition | | | — |
| | — |
| | — |
| | (29 | ) | | (29 | ) |
| Acquisition of Drop Down Assets, net of cash acquired | | — |
| | — |
| | — |
| | (126 | ) | | (126 | ) | | — |
| | — |
| | — |
| | (161 | ) | | (161 | ) |
| Capital expenditures | | — |
| | — |
| | (83 | ) | | — |
| | (83 | ) | |
| Cash receipts from notes receivable | | — |
| | — |
| | 13 |
| | — |
| | 13 |
| |
| Buyout of Wind TE Holdco non-controlling interest | | | — |
| | — |
| | — |
| | (19 | ) | | (19 | ) |
| Capital Expenditures | | | — |
| | — |
| | (228 | ) | | — |
| | (228 | ) |
| Return of investment from unconsolidated affiliates | | — |
| | 11 |
| | 20 |
| | 14 |
| | 45 |
| | — |
| | 12 |
| | 39 |
| | 5 |
| | 56 |
|
| Investments in unconsolidated affiliates | | — |
| | (34 | ) | | — |
| | — |
| | (34 | ) | |
| Net investments in unconsolidated affiliates | | | — |
| | (13 | ) | | — |
| | — |
| | (13 | ) |
| Proceeds from sale of HSD Solar Holdings, LLC assets | | | — |
| | — |
| | — |
| | 20 |
| | 20 |
|
| Other | | — |
| | — |
| | 11 |
| | — |
| | 11 |
| | — |
| | — |
| | 6 |
| | — |
| | 6 |
|
| Net Cash Provided by (Used in) Investing Activities | | 361 |
| | (23 | ) | | (39 | ) | | (484 | ) | | (185 | ) | |
| Net Cash (Used in) Provided by Investing Activities | | | (211 | ) | | (1 | ) | | (183 | ) | | (73 | ) | | (468 | ) |
| Cash Flows from Financing Activities | | | | | | | | | | | | | | | | | | | | |
| Transfer of funds under intercompany cash management arrangement | | | (5 | ) | | — |
| | 4 |
| | 1 |
| | — |
|
| Net contributions from noncontrolling interests | | — |
| | — |
| | 97 |
| | 9 |
| | 106 |
| | — |
| | — |
| | 248 |
| | (74 | ) | | 174 |
|
| Transfer of funds under intercompany cash management arrangement | | — |
| | — |
| | 4 |
| | (4 | ) | | — |
| |
| Proceeds from the issuance of Class C units | | 153 |
| | — |
| | — |
| | — |
| | 153 |
| | 100 |
| | — |
| | — |
| | — |
| | 100 |
|
| (Payments of) proceeds from distributions | | (238 | ) | | — |
| | (400 | ) | | 385 |
| | (253 | ) | | (155 | ) | | (16 | ) | | (193 | ) | | 209 |
| | (155 | ) |
| Proceeds from the revolving credit facility | | — |
| | — |
| | — |
| | 35 |
| | 35 |
| | — |
| | — |
| | — |
| | 152 |
| | 152 |
|
| Payments for the revolving credit facility | | — |
| | — |
| | — |
| | (90 | ) | | (90 | ) | | — |
| | — |
| | — |
| | (152 | ) | | (152 | ) |
| Payments of debt issuance costs | | — |
| | — |
| | (3 | ) | | (11 | ) | | (14 | ) | | — |
| | — |
| | (14 | ) | | (11 | ) | | (25 | ) |
| Proceeds from issuance of long-term debt | | — |
| | — |
| | 227 |
| | 600 |
| | 827 |
| | — |
| | — |
| | 615 |
| | 600 |
| | 1,215 |
|
| Payments for long-term debt — external | | — |
| | — |
| | (443 | ) | | — |
| | (443 | ) | | — |
| | — |
| | (852 | ) | | (412 | ) | | (1,264 | ) |
| Payments for long-term debt — affiliate | | — |
| | — |
| | — |
| | (359 | ) | | (359 | ) | | — |
| | — |
| | — |
| | (215 | ) | | (215 | ) |
| Net Cash (Used in) Provided by Financing Activities | | (85 | ) | | — |
| | (518 | ) | | 565 |
| | (38 | ) | | (60 | ) | | (16 | ) | | (192 | ) | | 98 |
| | (170 | ) |
| Net Increase (Decrease) in Cash, Cash Equivalents and Restricted Cash | | 276 |
| | — |
| | (7 | ) | | — |
| | 269 |
| |
| Net (Decrease) Increase in Cash, Cash Equivalents and Restricted Cash | | | (271 | ) | | — |
| | 102 |
| | — |
| | (169 | ) |
| Cash, Cash Equivalents and Restricted Cash at Beginning of Period | | 22 |
| | — |
| | 292 |
| | — |
| | 314 |
| | 298 |
| | — |
| | 285 |
| | — |
| | 583 |
|
| Cash, Cash Equivalents and Restricted Cash at End of Period | | $ | 298 |
| | $ | — |
| | $ | 285 |
| | $ | — |
| | $ | 583 |
| | $ | 27 |
| | $ | — |
| | $ | 387 |
| | $ | — |
| | $ | 414 |
|
(a) Shown separately from the other guarantors in lieu of preparing Schedule I pursuant to the requirements of Rule 5-04(c) of Regulation S-X.
CLEARWAY ENERGY LLC AND SUBSIDIARIES
CONDENSED CONSOLIDATING STATEMENTS OF OPERATIONS
For the Year Ended December 31, 20172018
| | | | Clearway Energy LLC (a) (c) | | Other Guarantor Subsidiaries | | Non-Guarantor Subsidiaries (c) | | Clearway Energy Operating LLC (Note Issuer) (c) | | Eliminations(b) (c) | | Consolidated | Clearway Energy LLC (a) | | Other Guarantor Subsidiaries | | Non-Guarantor Subsidiaries | | Clearway Energy Operating LLC (Note Issuer) | | Eliminations(b) | | Consolidated |
| | (In millions) | (In millions) |
| Operating Revenues | | | | | | | | | | | | | | | | | | | | | | |
| Total operating revenues | $ | — |
| | $ | 10 |
| | $ | 999 |
| | $ | 1 |
| | $ | (1 | ) | | $ | 1,009 |
| $ | — |
| | $ | 11 |
| | $ | 1,042 |
| | $ | 3 |
| | $ | (3 | ) | | $ | 1,053 |
|
| Operating Costs and Expenses | | | | | | | | | | | | | | | | | | | | | | |
| Cost of operations | — |
| | 2 |
| | 324 |
| | 1 |
| | (1 | ) | | 326 |
| — |
| | 3 |
| | 329 |
| | 3 |
| | (3 | ) | | 332 |
|
| Depreciation and amortization | — |
| | 6 |
| | 328 |
| | — |
| | — |
| | 334 |
| — |
| | 6 |
| | 325 |
| | — |
| | — |
| | 331 |
|
| Impairment losses | — |
| | 12 |
| | 32 |
| | — |
| | — |
| | 44 |
| — |
| | — |
| | — |
| | — |
| | — |
| | — |
|
| General and administrative | — |
| | — |
| | — |
| | 19 |
| | — |
| | 19 |
| — |
| | — |
| | — |
| | 20 |
| | — |
| | 20 |
|
| Acquisition-related transaction and integration costs | — |
| | — |
| | — |
| | 3 |
| | — |
| | 3 |
| — |
| | — |
| | — |
| | 20 |
| | — |
| | 20 |
|
| Development Costs | | — |
| | — |
| | — |
| | 3 |
| | — |
| | 3 |
|
| Total operating costs and expenses | — |
| | 20 |
| | 684 |
| | 23 |
| | (1 | ) | | 726 |
| — |
| | 9 |
| | 654 |
| | 46 |
| | (3 | ) | | 706 |
|
| Operating Income (Loss) | — |
| | (10 | ) | | 315 |
| | (22 | ) | | — |
| | 283 |
| — |
| | 2 |
| | 388 |
| | (43 | ) | | — |
| | 347 |
|
| Other Income (Expense) | | | | | | | | | | | | | | | | | | | | | | |
| Equity in earnings (losses) of consolidated affiliates | 135 |
| | (16 | ) | | — |
| | 125 |
| | (244 | ) | | — |
| 237 |
| | — |
| | — |
| | 224 |
| | (461 | ) | | — |
|
| Equity in earnings of unconsolidated affiliates | — |
| | 22 |
| | 21 |
| | 28 |
| | — |
| | 71 |
| — |
| | 43 |
| | 3 |
| | 28 |
| | — |
| | 74 |
|
| Loss on debt extinguishment | — |
| | (3 | ) | | — |
| | — |
| | — |
| | (3 | ) | — |
| | — |
| | — |
| | — |
| | — |
| | — |
|
| Other income, net | 1 |
| | — |
| | 3 |
| | — |
| | — |
| | 4 |
| 3 |
| | — |
| | 5 |
| | — |
| | — |
| | 8 |
|
| Interest expense | — |
| | 1 |
| | (224 | ) | | (71 | ) | | — |
| | (294 | ) | — |
| | — |
| | (217 | ) | | (77 | ) | | — |
| | (294 | ) |
| Total other income (expense) | 136 |
| | 4 |
| | (200 | ) | | 82 |
| | (244 | ) | | (222 | ) | 240 |
| | 43 |
| | (209 | ) | | 175 |
| | (461 | ) | | (212 | ) |
| Net Income (Loss) | 136 |
| | (6 | ) | | 115 |
| | 60 |
| | (244 | ) | | 61 |
| |
| Net Income | | 240 |
| | 45 |
| | 179 |
| | 132 |
| | (461 | ) | | 135 |
|
| Less: Net loss attributable to noncontrolling interests | — |
| | — |
| | (5 | ) | | (75 | ) | | 5 |
| | (75 | ) | — |
| | — |
| | (69 | ) | | (105 | ) | | 69 |
| | (105 | ) |
| Net Income (Loss) Attributable to Clearway Energy LLC | $ | 136 |
| | $ | (6 | ) | | $ | 120 |
| | $ | 135 |
| | $ | (249 | ) | | $ | 136 |
| |
| Net Income Attributable to Clearway Energy LLC | | $ | 240 |
| | $ | 45 |
| | $ | 248 |
| | $ | 237 |
| | $ | (530 | ) | | $ | 240 |
|
(a) Shown separately from the other guarantors in lieu of preparing Schedule I pursuant to the requirements of Rule 5-04(c) of Regulation S-X.
(b) All significant intercompany transactions have been eliminated in consolidation.
(c) Retrospectively adjusted as discussed in Note 1, Nature of Business.
CLEARWAY ENERGY LLC AND SUBSIDIARIES
CONDENSED CONSOLIDATING STATEMENTS OF COMPREHENSIVE INCOME
For the Year Ended December 31, 20172018
| | | | Clearway Energy LLC (a) (c) | | Other Guarantor Subsidiaries | | Non-Guarantor Subsidiaries (c) | | Clearway Energy Operating LLC (Note Issuer) (c) | | Eliminations(b) (c) | | Consolidated | Clearway Energy LLC (a) | | Other Guarantor Subsidiaries | | Non-Guarantor Subsidiaries | | Clearway Energy Operating LLC (Note Issuer) | | Eliminations(b) | | Consolidated |
| | (In millions) | (In millions) |
| Net Income (Loss) | $ | 136 |
| | $ | (6 | ) | | $ | 115 |
| | $ | 60 |
| | $ | (244 | ) | | $ | 61 |
| |
| Net Income | | $ | 240 |
| | $ | 45 |
| | $ | 179 |
| | $ | 132 |
| | $ | (461 | ) | | $ | 135 |
|
| Other Comprehensive Income | | | | | | | | | | | | | | | | | | | | | | |
| Unrealized gain on derivatives | 17 |
| | 1 |
| | 16 |
| | 17 |
| | (34 | ) | | 17 |
| 24 |
| | 1 |
| | 20 |
| | 24 |
| | (45 | ) | | 24 |
|
| Other comprehensive income | 17 |
| | 1 |
| | 16 |
| | 17 |
| | (34 | ) | | 17 |
| 24 |
| | 1 |
| | 20 |
| | 24 |
| | (45 | ) | | 24 |
|
| Comprehensive Income (Loss) | 153 |
| | (5 | ) | | 131 |
| | 77 |
| | (278 | ) | | 78 |
| |
| Comprehensive Income | | 264 |
| | 46 |
| | 199 |
| | 156 |
| | (506 | ) | | 159 |
|
| Less: Comprehensive loss attributable to noncontrolling interests | — |
| | — |
| | (5 | ) | | (75 | ) | | 5 |
| | (75 | ) | — |
| | — |
| | (69 | ) | | (105 | ) | | 69 |
| | (105 | ) |
| Comprehensive Income (Loss) Attributable to Clearway Energy LLC | $ | 153 |
| | $ | (5 | ) | | $ | 136 |
| | $ | 152 |
| | $ | (283 | ) | | $ | 153 |
| |
| Comprehensive Income Attributable to Clearway Energy LLC | | $ | 264 |
| | $ | 46 |
| | $ | 268 |
| | $ | 261 |
| | $ | (575 | ) | | $ | 264 |
|
(a) Shown separately from the other guarantors in lieu of preparing Schedule I pursuant to the requirements of Rule 5-04(c) of Regulation S-X.
(b) All significant intercompany transactions have been eliminated in consolidation.
(c) Retrospectively adjusted as discussed in Note 1, Nature of Business.
CLEARWAY ENERGY LLC AND SUBSIDIARIES
CONDENSED CONSOLIDATING BALANCE SHEETS
December 31, 20172018
| | | | Clearway Energy LLC (a) (c) | | Other Guarantor Subsidiaries | | Non-Guarantor Subsidiaries (c) | | Clearway Energy Operating LLC
(Note Issuer) (c) | | Eliminations(b)(c) | | Consolidated | Clearway Energy LLC (a) | | Other Guarantor Subsidiaries | | Non-Guarantor Subsidiaries | | Clearway Energy Operating LLC
(Note Issuer) | | Eliminations(b) | | Consolidated |
| ASSETS | (In millions) | (In millions) |
| Current Assets | | | | | | | | | | | | | | | | | | | | | | |
| Cash and cash equivalents | $ | 22 |
| | $ | — |
| | $ | 124 |
| | $ | — |
| | $ | — |
| | $ | 146 |
| $ | 298 |
| | $ | — |
| | $ | 109 |
| | $ | — |
| | $ | — |
| | $ | 407 |
|
| Restricted cash | — |
| | — |
| | 168 |
| | — |
| | — |
| | 168 |
| — |
| | — |
| | 176 |
| | — |
| | — |
| | 176 |
|
| Accounts receivable — trade | — |
| | 1 |
| | 93 |
| | 1 |
| | — |
| | 95 |
| — |
| | 1 |
| | 103 |
| | — |
| | — |
| | 104 |
|
| Accounts receivable — affiliates | 1 |
| | — |
| | — |
| | — |
| | — |
| | 1 |
| 8 |
| | — |
| | — |
| | 11 |
| | (14 | ) | | 5 |
|
| Inventory | — |
| | — |
| | 39 |
| | — |
| | — |
| | 39 |
| — |
| | — |
| | 40 |
| | — |
| | — |
| | 40 |
|
| Notes receivable — current | — |
| | — |
| | 13 |
| | — |
| | — |
| | 13 |
| |
| Prepayments and other current assets | — |
| | — |
| | 18 |
| | 1 |
| | — |
| | 19 |
| — |
| | — |
| | 27 |
| | 2 |
| | — |
| | 29 |
|
| Total current assets | 23 |
| | 1 |
| | 455 |
| | 2 |
| | — |
| | 481 |
| 306 |
| | 1 |
| | 455 |
| | 13 |
| | (14 | ) | | 761 |
|
| | | | | | | | | | | | | | | | | | | | | | | |
| Property, plant and equipment, net | — |
| | 59 |
| | 5,351 |
| | — |
| | — |
| | 5,410 |
| — |
| | 65 |
| | 5,180 |
| | — |
| | — |
| | 5,245 |
|
| Other Assets | | | | | | | | | | | | | | | | | | | | | | |
| Investment in consolidated subsidiaries | 1,844 |
| | 460 |
| | — |
| | 3,198 |
| | (5,502 | ) | | — |
| 1,676 |
| | 417 |
| | — |
| | 3,250 |
| | (5,343 | ) | | — |
|
| Equity investments in affiliates | — |
| | 233 |
| | 577 |
| | 368 |
| | — |
| | 1,178 |
| — |
| | 289 |
| | 522 |
| | 361 |
| | — |
| | 1,172 |
|
| Intangible assets, net | — |
| | 12 |
| | 1,216 |
| | — |
| | — |
| | 1,228 |
| — |
| | 11 |
| | 1,145 |
| | — |
| | — |
| | 1,156 |
|
| Derivative instruments | — |
| | — |
| | 1 |
| | — |
| | — |
| | 1 |
| — |
| | — |
| | 8 |
| | — |
| | — |
| | 8 |
|
| Other non-current assets | — |
| | — |
| | 62 |
| | — |
| | — |
| | 62 |
| — |
| | — |
| | 103 |
| | 3 |
| | — |
| | 106 |
|
| Total other assets | 1,844 |
| | 705 |
| | 1,856 |
| | 3,566 |
| | (5,502 | ) | | 2,469 |
| 1,676 |
| | 717 |
| | 1,778 |
| | 3,614 |
| | (5,343 | ) | | 2,442 |
|
| Total Assets | $ | 1,867 |
| | $ | 765 |
| | $ | 7,662 |
| | $ | 3,568 |
| | $ | (5,502 | ) | | $ | 8,360 |
| $ | 1,982 |
| | $ | 783 |
| | $ | 7,413 |
| | $ | 3,627 |
| | $ | (5,357 | ) | | $ | 8,448 |
|
(a) Shown separately from the other guarantors in lieu of preparing Schedule I pursuant to the requirements of Rule 5-04(c) of Regulation S-X.
(b) All significant intercompany transactions have been eliminated in consolidation.
(c) Retrospectively adjusted as discussed in Note 1, Nature of Business.
CLEARWAY ENERGY LLC AND SUBSIDIARIES
CONDENSED CONSOLIDATING BALANCE SHEETS
(Continued)
December 31, 20172018
| | | | Clearway Energy LLC (a) (c) | | Other Guarantor Subsidiaries | | Non-Guarantor Subsidiaries (c) | | Clearway Energy Operating LLC
(Note Issuer) (c) | | Eliminations (b) (c) | | Consolidated | Clearway Energy LLC (a) | | Other Guarantor Subsidiaries | | Non-Guarantor Subsidiaries | | Clearway Energy Operating LLC
(Note Issuer) | | Eliminations (b) | | Consolidated |
| LIABILITIES AND MEMBERS' EQUITY | (In millions) | (In millions) |
| Current Liabilities | | | | | | | | | | | | | | | | | | | | | | |
| Current portion of long-term debt — external | $ | — |
| | $ | — |
| | $ | 339 |
| | $ | — |
| | $ | — |
| | $ | 339 |
| $ | — |
| | $ | — |
| | $ | 314 |
| | $ | — |
| | $ | — |
| | $ | 314 |
|
| Current portion of long-term debt — affiliate | | — |
|
| — |
|
| — |
|
| 215 |
|
| — |
| | 215 |
|
| Accounts payable — trade | — |
| | — |
| | 46 |
| | — |
| | — |
| | 46 |
| — |
| | 1 |
| | 36 |
| | 8 |
| | — |
| | 45 |
|
| Accounts payable — affiliate | — |
| | — |
| | 33 |
| | 16 |
| | — |
| | 49 |
| — |
| | — |
| | 23 |
| | 11 |
| | (14 | ) | | 20 |
|
| Derivative instruments | — |
| | — |
| | 18 |
| | — |
| | — |
| | 18 |
| — |
| | — |
| | 4 |
| | — |
| | — |
| | 4 |
|
| Accrued interest expense | — |
| | — |
| | 16 |
| | 22 |
| | — |
| | 38 |
| — |
| | — |
| | 17 |
| | 27 |
| | — |
| | 44 |
|
| Accrued expenses and other current liabilities |
|
| |
|
| | 46 |
| | 3 |
| |
|
| | 49 |
| — |
| | — |
| | 53 |
| | 4 |
| | — |
| | 57 |
|
| Total current liabilities | — |
| | — |
| | 498 |
| | 41 |
| | — |
| | 539 |
| — |
| | 1 |
| | 447 |
| | 265 |
| | (14 | ) | | 699 |
|
| Other Liabilities | | | | | | | | | | |
|
| | | | | | | | | | |
|
|
| Long-term debt — external | — |
| | — |
| | 4,153 |
| | 896 |
| | — |
| | 5,049 |
| — |
| | — |
| | 3,970 |
| | 1,434 |
| | — |
| | 5,404 |
|
| Long-term debt — affiliate | — |
| | — |
| | — |
| | 618 |
| | — |
| | 618 |
| — |
| | — |
| | — |
| | 44 |
| | — |
| | 44 |
|
| Derivative instruments | — |
| | — |
| | 31 |
| | — |
| | — |
| | 31 |
| — |
| | — |
| | 17 |
| | — |
| | — |
| | 17 |
|
| Other non-current liabilities | — |
| | 2 |
| | 85 |
| | 7 |
| | — |
| | 94 |
| — |
| | 2 |
| | 92 |
| | 8 |
| | — |
| | 102 |
|
| Total non-current liabilities | — |
| | 2 |
| | 4,269 |
| | 1,521 |
| | — |
| | 5,792 |
| — |
| | 2 |
| | 4,079 |
| | 1,486 |
| | — |
| | 5,567 |
|
| Total Liabilities | — |
| | 2 |
| | 4,767 |
| | 1,562 |
| | — |
| | 6,331 |
| — |
| | 3 |
| | 4,526 |
| | 1,751 |
| | (14 | ) | | 6,266 |
|
| Commitments and Contingencies | | | | | | | | | | | | | | | | | | | | | | |
| Members' Equity | | | | | | | | | | | | | | | | | | | | | | |
| Contributed capital | 1,919 |
| | 822 |
| | 2,934 |
| | 2,119 |
| | (5,875 | ) | | 1,919 |
| 1,940 |
| | 804 |
| | 2,708 |
| | 1,930 |
| | (5,442 | ) | | 1,940 |
|
| Retained earnings (accumulated deficit) | 16 |
| | (58 | ) | | (25 | ) | | (207 | ) | | 290 |
| | 16 |
| 86 |
| | (24 | ) | | 108 |
| | (210 | ) | | 126 |
| | 86 |
|
| Accumulated other comprehensive loss | (68 | ) | | (1 | ) | | (71 | ) | | (68 | ) | | 140 |
| | (68 | ) | (44 | ) | | — |
| | (51 | ) | | (44 | ) | | 95 |
| | (44 | ) |
| Noncontrolling interest | — |
| | — |
| | 57 |
| | 162 |
| | (57 | ) | | 162 |
| — |
| | — |
| | 122 |
| | 200 |
| | (122 | ) | | 200 |
|
| Total Members' Equity | 1,867 |
| | 763 |
| | 2,895 |
| | 2,006 |
| | (5,502 | ) | | 2,029 |
| 1,982 |
| | 780 |
| | 2,887 |
| | 1,876 |
| | (5,343 | ) | | 2,182 |
|
| Total Liabilities and Members’ Equity | $ | 1,867 |
| | $ | 765 |
| | $ | 7,662 |
| | $ | 3,568 |
| | $ | (5,502 | ) | | $ | 8,360 |
| $ | 1,982 |
| | $ | 783 |
| | $ | 7,413 |
| | $ | 3,627 |
| | $ | (5,357 | ) | | $ | 8,448 |
|
(a) Shown separately from the other guarantors in lieu of preparing Schedule I pursuant to the requirements of Rule 5-04(c) of Regulation S-X.
(b) All significant intercompany transactions have been eliminated in consolidation.
(c) Retrospectively adjusted as discussed in Note 1, Nature of Business.
CLEARWAY ENERGY LLC AND SUBSIDIARIES
CONDENSED CONSOLIDATING STATEMENTS OF CASH FLOWS
For the Year Ended December 31, 20172018
| | | | | Clearway Energy LLC (a) | | Other Guarantor Subsidiaries | | Non-Guarantor Subsidiaries (b) | | Clearway Energy Operating LLC (Note Issuer) | | Consolidated | | Clearway Energy LLC (a) | | Other Guarantor Subsidiaries | | Non-Guarantor Subsidiaries | | Clearway Energy Operating LLC (Note Issuer) | | Consolidated |
| | | | | |
| Net Cash Provided by (Used in) Operating Activities | | $ | — |
| | $ | 51 |
| | $ | 537 |
| | $ | (71 | ) | | $ | 517 |
| | $ | — |
| | $ | 23 |
| | $ | 550 |
| | $ | (81 | ) | | $ | 492 |
|
| Cash Flows from Investing Activities | | | | | | | | | | | | | | | | | | | | |
| Acquisition of businesses, net of cash acquired | | | — |
| | — |
| | — |
| | (11 | ) | | (11 | ) |
| Changes in investments in consolidated subsidiaries | | (15 | ) | | — |
| | — |
| | 15 |
| | — |
| | 361 |
| | — |
| | — |
| | (361 | ) | | — |
|
| Acquisition of Drop Down Assets | | — |
| | — |
| | — |
| | (250 | ) | | (250 | ) | | — |
| | — |
| | — |
| | (126 | ) | | (126 | ) |
| Capital expenditures | | — |
| | — |
| | (190 | ) | | — |
| | (190 | ) | | — |
| | — |
| | (83 | ) | | — |
| | (83 | ) |
| Cash receipts from notes receivable | | — |
| | — |
| | 17 |
| | — |
| | 17 |
| | — |
| | — |
| | 13 |
| | — |
| | 13 |
|
| Return of investment from unconsolidated affiliates | | — |
| | 10 |
| | 14 |
| | 23 |
| | 47 |
| | — |
| | 11 |
| | 20 |
| | 14 |
| | 45 |
|
| Investments in unconsolidated affiliates | | — |
| | (64 | ) | | (7 | ) | | (2 | ) | | (73 | ) | | — |
| | (34 | ) | | — |
| | — |
| | (34 | ) |
| Other | | — |
| | — |
| | 7 |
| | — |
| | 7 |
| | — |
| | — |
| | 11 |
| | — |
| | 11 |
|
| Net Cash Used in Investing Activities | | (15 | ) | | (54 | ) | | (159 | ) | | (214 | ) | | (442 | ) | | 361 |
| | (23 | ) | | (39 | ) | | (484 | ) | | (185 | ) |
| Cash Flows from Financing Activities | | | | | | | | |
| | |
| | | | | | | | |
| | |
|
| Transfer of funds under intercompany cash management arrangement | | (5 | ) | | — |
| | (1 | ) | | 6 |
| | — |
| | — |
| | — |
| | 4 |
| | (4 | ) | | — |
|
| Net contributions from noncontrolling interests | | — |
| | — |
| | 2 |
| | 11 |
| | 13 |
| | — |
| | — |
| | 97 |
| | (6 | ) | | 91 |
|
| Net distributions and return of capital to NRG prior to the acquisition of Drop Down Assets | | — |
| | 30 |
| | (46 | ) | | (7 | ) | | (23 | ) | | — |
| | — |
| | — |
| | — |
| | — |
|
| Proceeds from the issuance of Class C units | | 33 |
| | — |
| | — |
| | — |
| | 33 |
| | 153 |
| | — |
| | — |
| | — |
| | 153 |
|
| (Payments of) proceeds from distributions | | (202 | ) | | — |
| | (220 | ) | | 220 |
| | (202 | ) | | (238 | ) | | — |
| | (400 | ) | | 400 |
| | (238 | ) |
| Proceeds from the revolving credit facility | | — |
| | — |
| | — |
| | 55 |
| | 55 |
| | — |
| | — |
| | — |
| | 35 |
| | 35 |
|
| Payments for the revolving credit facility | | | — |
| | — |
| | — |
| | (90 | ) | | (90 | ) |
| Proceeds from the issuance of long-term debt - external | | — |
| | — |
| | 210 |
| | — |
| | 210 |
| | — |
| | — |
| | 227 |
| | 600 |
| | 827 |
|
| Proceeds from issuance of long-term debt affiliate | | | — |
| | — |
| | — |
| | — |
| | — |
|
| Payments of debt issuance costs | | — |
| | — |
| | (12 | ) | | — |
| | (12 | ) | | — |
| | — |
| | (3 | ) | | (11 | ) | | (14 | ) |
| Payments for long-term debt — external | | — |
| | (36 | ) | | (296 | ) | | — |
| | (332 | ) | | — |
| | — |
| | (443 | ) | | — |
| | (443 | ) |
| Payments for long-term debt — affiliate | | | — |
|
| — |
|
| — |
|
| (359 | ) | | (359 | ) |
| Net Cash Provided by (Used in) Financing Activities | | (174 | ) | | (6 | ) | | (363 | ) | | 285 |
| | (258 | ) | | (85 | ) | | — |
| | (518 | ) | | 565 |
| | (38 | ) |
| Net (Decrease) Increase in Cash, Cash Equivalents and Restricted Cash | | (189 | ) | | (9 | ) | | 15 |
| | — |
| | (183 | ) | | 276 |
| | — |
| | (7 | ) | | — |
| | 269 |
|
| Cash, Cash Equivalents and Restricted Cash at Beginning of Period | | 211 |
| | 9 |
| | 277 |
| | — |
| | 497 |
| | 22 |
| | — |
| | 292 |
| | — |
| | 314 |
|
| Cash, Cash Equivalents and Restricted Cash at End of Period | | $ | 22 |
| | $ | — |
| | $ | 292 |
| | $ | — |
| | $ | 314 |
| | $ | 298 |
| | $ | — |
| | $ | 285 |
| | $ | — |
| | $ | 583 |
|
(a) Shown separately from the other guarantors in lieu of preparing Schedule I pursuant to the requirements of Rule 5-04(c) of Regulation S-X.
(b) Retrospectively adjusted as discussed in Note 1, Nature of Business.
CLEARWAY ENERGY LLC AND SUBSIDIARIES
CONDENSED CONSOLIDATING STATEMENTS OF OPERATIONS
For the Year Ended December 31, 20162017
| | | | Clearway Energy LLC (a) | | Other Guarantor Subsidiaries | | Non-Guarantor Subsidiaries | | Clearway Energy Operating LLC (Note Issuer) | | Eliminations(b) | | Consolidated | Clearway Energy LLC (a) | | Other Guarantor Subsidiaries | | Non-Guarantor Subsidiaries | | Clearway Energy Operating LLC (Note Issuer) | | Eliminations(b) | | Consolidated |
| | (In millions) | (In millions) |
| Operating Revenues | | | | | | | | | | | | | | | | | | | | | | |
| Total operating revenues | $ | — |
| | $ | 10 |
| | $ | 1,025 |
| | $ | 1 |
| | $ | (1 | ) | | $ | 1,035 |
| $ | — |
| | $ | 10 |
| | $ | 999 |
| | $ | 1 |
| | $ | (1 | ) | | $ | 1,009 |
|
| Operating Costs and Expenses | | | | | | | | | | | | | | | | | | | | | | |
| Cost of operations | — |
| | 3 |
| | 305 |
| | 1 |
| | (1 | ) | | 308 |
| — |
| | 2 |
| | 324 |
| | 1 |
| | (1 | ) | | 326 |
|
| Depreciation and amortization | — |
| | 5 |
| | 298 |
| | — |
| | — |
| | 303 |
| — |
| | 6 |
| | 328 |
| | — |
| | — |
| | 334 |
|
| Impairment losses | — |
| | 2 |
| | 183 |
| | — |
| | — |
| | 185 |
| — |
| | 12 |
| | 32 |
| | — |
| | — |
| | 44 |
|
| General and administrative | 2 |
| | — |
| | — |
| | 12 |
| | — |
| | 14 |
| — |
| | — |
| | — |
| | 19 |
| | — |
| | 19 |
|
| Acquisition-related transaction and integration costs | — |
| | — |
| | — |
| | 1 |
| | — |
| | 1 |
| — |
| | — |
| | — |
| | 3 |
| | — |
| | 3 |
|
| Total operating costs and expenses | 2 |
| | 10 |
| | 786 |
| | 14 |
| | (1 | ) | | 811 |
| — |
| | 20 |
| | 684 |
| | 23 |
| | (1 | ) | | 726 |
|
| Operating (Loss) Income | (2 | ) | | — |
| | 239 |
| | (13 | ) | | — |
| | 224 |
| — |
| | (10 | ) | | 315 |
| | (22 | ) | | — |
| | 283 |
|
| Other Income (Expense) | | | | | | | | | | | | | | | | | | | | | | |
| Equity in earnings of consolidated affiliates | 128 |
| | 10 |
| | — |
| | 66 |
| | (204 | ) | | — |
| 135 |
| | (16 | ) | | — |
| | 125 |
| | (244 | ) | | — |
|
| Equity in (losses) earnings of unconsolidated affiliates | — |
| | 9 |
| | 21 |
| | 30 |
| | — |
| | 60 |
| — |
| | 22 |
| | 21 |
| | 28 |
| | — |
| | 71 |
|
| Other income, net | — |
| | — |
| | 3 |
| | — |
| | — |
| | 3 |
| 1 |
| | — |
| | 3 |
| | — |
| | — |
| | 4 |
|
| Loss on debt extinguishment | | — |
| | (3 | ) | | — |
| | — |
| | — |
| | (3 | ) |
| Interest expense | — |
| | (2 | ) | | (204 | ) | | (66 | ) | | — |
| | (272 | ) | — |
| | 1 |
| | (224 | ) | | (71 | ) | | — |
| | (294 | ) |
| Total other income (expense), net | 128 |
| | 17 |
| | (180 | ) | | 30 |
| | (204 | ) | | (209 | ) | 136 |
| | 4 |
| | (200 | ) | | 82 |
| | (244 | ) | | (222 | ) |
| Net Income | 126 |
| | 17 |
| | 59 |
| | 17 |
| | (204 | ) | | 15 |
| 136 |
| | (6 | ) | | 115 |
| | 60 |
| | (244 | ) | | 61 |
|
| Less: Net loss attributable to noncontrolling interests | — |
| | — |
| | (1 | ) | | (111 | ) | | 1 |
| | (111 | ) | — |
| | — |
| | (5 | ) | | (75 | ) | | 5 |
| | (75 | ) |
| Net Income Attributable to Clearway Energy LLC | $ | 126 |
| | $ | 17 |
| | $ | 60 |
| | $ | 128 |
| | $ | (205 | ) | | $ | 126 |
| $ | 136 |
| | $ | (6 | ) | | $ | 120 |
| | $ | 135 |
| | $ | (249 | ) | | $ | 136 |
|
(a) Shown separately from the other guarantors in lieu of preparing Schedule I pursuant to the requirements of Rule 5-04(c) of Regulation S-X.
(b) All significant intercompany transactions have been eliminated in consolidation.
CLEARWAY ENERGY LLC AND SUBSIDIARIES
CONDENSED CONSOLIDATING STATEMENTS OF COMPREHENSIVE INCOME
For the Year Ended December 31, 20162017
| | | | Clearway Energy LLC (a) | | Other Guarantor Subsidiaries | | Non-Guarantor Subsidiaries | | Clearway Energy Operating LLC (Senior Notes Issuer) | | Eliminations (b) | | Consolidated | Clearway Energy LLC (a) | | Other Guarantor Subsidiaries | | Non-Guarantor Subsidiaries | | Clearway Energy Operating LLC (Senior Notes Issuer) | | Eliminations (b) | | Consolidated |
| | (In millions) | (In millions) |
| Net Income | $ | 126 |
| | $ | 17 |
| | $ | 59 |
| | $ | 17 |
| | $ | (204 | ) | | $ | 15 |
| $ | 136 |
| | $ | (6 | ) | | $ | 115 |
| | $ | 60 |
| | $ | (244 | ) | | $ | 61 |
|
| Other Comprehensive Income | | | | | | | | | | | | | | | | | | | | | | |
| Unrealized gain on derivatives | 13 |
| | 1 |
| | 10 |
| | 13 |
| | (24 | ) | | 13 |
| 17 |
| | 1 |
| | 16 |
| | 17 |
| | (34 | ) | | 17 |
|
| Other comprehensive income | 13 |
| | 1 |
| | 10 |
| | 13 |
| | (24 | ) | | 13 |
| 17 |
| | 1 |
| | 16 |
| | 17 |
| | (34 | ) | | 17 |
|
| Comprehensive Income | 139 |
| | 18 |
| | 69 |
| | 30 |
| | (228 | ) | | 28 |
| 153 |
| | (5 | ) | | 131 |
| | 77 |
| | (278 | ) | | 78 |
|
| Less: Comprehensive loss attributable to noncontrolling interests | — |
| | — |
| | (1 | ) | | (111 | ) | | 1 |
| | (111 | ) | — |
| | — |
| | (5 | ) | | (75 | ) | | 5 |
| | (75 | ) |
| Comprehensive Income Attributable to Clearway Energy LLC | $ | 139 |
| | $ | 18 |
| | $ | 70 |
| | $ | 141 |
| | $ | (229 | ) | | $ | 139 |
| $ | 153 |
| | $ | (5 | ) | | $ | 136 |
| | $ | 152 |
| | $ | (283 | ) | | $ | 153 |
|
(a) Shown separately from the other guarantors in lieu of preparing Schedule I pursuant to the requirements of Rule 5-04(c) of Regulation S-X.
(b) All significant intercompany transactions have been eliminated in consolidation.
CLEARWAY ENERGY LLC AND SUBSIDIARIES
CONDENSED CONSOLIDATING STATEMENTS OF CASH FLOWS
For the Year Ended December 31, 20162017
| | | | Clearway Energy LLC (a) | | Other Guarantor Subsidiaries | | Non-Guarantor Subsidiaries | | Clearway Energy Operating LLC (Note Issuer) | | Consolidated | Clearway Energy LLC (a) | | Other Guarantor Subsidiaries | | Non-Guarantor Subsidiaries | | Clearway Energy Operating LLC (Note Issuer) | | Consolidated |
| | (In millions) | (In millions) |
| Net Cash Provided by (Used in) Operating Activities | $ | — |
| | $ | 67 |
| | $ | 549 |
| | $ | (39 | ) | | $ | 577 |
| $ | — |
| | $ | 51 |
| | $ | 537 |
| | $ | (71 | ) | | $ | 517 |
|
| Cash Flows from Investing Activities | | | | | | | | | | | | | | | | | | |
| Changes in investments in consolidated subsidiaries | 325 |
| | — |
| | (21 | ) | | (304 | ) | | — |
| (15 | ) | | — |
| | — |
| | 15 |
| | — |
|
| Acquisition of Drop Down Assets, net of cash acquired | — |
| | — |
| | — |
| | (77 | ) | | (77 | ) | — |
| | — |
| | — |
| | (250 | ) | | (250 | ) |
| Capital expenditures | — |
| | — |
| | (20 | ) | | — |
| | (20 | ) | — |
| | — |
| | (190 | ) | | — |
| | (190 | ) |
| Cash receipts from notes receivable | — |
| | — |
| | 17 |
| | — |
| | 17 |
| — |
| | — |
| | 17 |
| | — |
| | 17 |
|
| Return of investment from unconsolidated affiliates | — |
| | 16 |
| | — |
| | 12 |
| | 28 |
| — |
| | 10 |
| | 14 |
| | 23 |
| | 47 |
|
| Investments in unconsolidated affiliates | — |
| | (80 | ) | | (3 | ) | | — |
| | (83 | ) | — |
| | (64 | ) | | (7 | ) | | (2 | ) | | (73 | ) |
| Other | — |
| | — |
| | 4 |
| | — |
| | 4 |
| — |
| | — |
| | 7 |
| | — |
| | 7 |
|
| Net Cash (Used in) Provided by Investing Activities | 325 |
| | (64 | ) | | (23 | ) | | (369 | ) | | (131 | ) | |
| Net Cash Used in Investing Activities | | (15 | ) | | (54 | ) | | (159 | ) | | (214 | ) | | (442 | ) |
| Cash Flows from Financing Activities | | | | | | | | | | | | | | | | | | |
| Transfer of funds under intercompany cash management arrangement | 44 |
| | 2 |
| | — |
| | (46 | ) | | — |
| (5 | ) | | — |
| | (1 | ) | | 6 |
| | — |
|
| Net contributions from noncontrolling interests | — |
| | — |
| | — |
| | 5 |
| | 5 |
| — |
| | — |
| | 2 |
|
| 11 |
| | 13 |
|
| Net distributions and return of capital to NRG prior to the acquisition of Drop Down Assets | — |
| | (3 | ) | | (171 | ) | | (10 | ) | | (184 | ) | — |
| | 30 |
| | (46 | ) | | (7 | ) | | (23 | ) |
| Proceeds from the issuance of Class C units | | 33 |
| | — |
| | — |
| | — |
| | 33 |
|
| (Payments of) proceeds from distributions | (173 | ) | | — |
| | (420 | ) | | 420 |
| | (173 | ) | (202 | ) | | — |
| | (220 | ) | | 220 |
| | (202 | ) |
| Proceeds from the revolving credit facility | — |
| | — |
| | — |
| | 60 |
| | 60 |
| — |
| | — |
| | — |
| | 55 |
| | 55 |
|
| Payments for the revolving credit facility | — |
| | — |
| | — |
| | (366 | ) | | (366 | ) | |
| Proceeds from issuance of long-term debt — external | — |
| | — |
| | 390 |
| | 350 |
| | 740 |
| — |
| | — |
| | 210 |
| | — |
| | 210 |
|
| Payments for long-term debt — external | — |
| | (3 | ) | | (266 | ) | | — |
| | (269 | ) | — |
| | (36 | ) | | (296 | ) | | — |
| | (332 | ) |
| Payment of debt issuance costs | — |
| | — |
| | (10 | ) | | (5 | ) | | (15 | ) | — |
| | — |
| | (12 | ) | | — |
| | (12 | ) |
| Net Cash (Used in) Provided by Financing Activities | (129 | ) | | (4 | ) | | (477 | ) | | 408 |
| | (202 | ) | (174 | ) | | (6 | ) | | (363 | ) | | 285 |
| | (258 | ) |
| Net Increase (Decrease) in Cash, Cash Equivalents and Restricted Cash | 196 |
| | (1 | ) | | 49 |
| | — |
| | 244 |
| |
| Net (Decrease) Increase in Cash, Cash Equivalents and Restricted Cash | | (189 | ) | | (9 | ) | | 15 |
| | — |
| | (183 | ) |
| Cash, Cash Equivalents and Restricted Cash at Beginning of Period | 15 |
| | 10 |
| | 228 |
| | — |
| | 253 |
| 211 |
| | 9 |
| | 277 |
| | — |
| | 497 |
|
| Cash, Cash Equivalents and Restricted Cash at End of Period | $ | 211 |
| | $ | 9 |
| | $ | 277 |
| | $ | — |
| | $ | 497 |
| $ | 22 |
| | $ | — |
| | $ | 292 |
| | $ | — |
| | $ | 314 |
|
(a) Shown separately from the other guarantors in lieu of preparing Schedule I pursuant to the requirements of Rule 5-04(c) of Regulation S-X.
EXHIBIT INDEX
|
| | | | |
| Number | | Description | | Method of Filing |
| 2.1 | | | | Incorporated herein by reference to Exhibit 2.1 to Clearway Energy, Inc.’s Current Report on Form 8-K filed on May 9, 2014. |
| 2.2 | | | | Incorporated herein by reference to Exhibit 2.2 to Clearway Energy, Inc.’s Current Report on Form 8-K filed on May 9, 2014. |
| 2.3 | | | | Incorporated herein by reference to Exhibit 2.3 to Clearway Energy, Inc.’s Current Report on Form 8-K filed on May 9, 2014. |
| 2.4 | | Purchase and Sale Agreement, dated June 3, 2014, by and among NRG Yield, Inc., NRG Yield Operating LLC, Terra-Gen Finance Company, LLC, NTD AWAM Holdings, LLC, CHIPS Alta Wind X Holding Company, LLC and CHIPS Alta Wind XI Holding Company, LLC. | | Incorporated herein by reference to Exhibit 10.1 to Clearway Energy, Inc.’s Current Report on Form 8-K filed on June 9, 2014. |
| 2.5 | | | | Incorporated herein by reference to Exhibit 2.1 to Clearway Energy, Inc.’s Current Report on Form 8-K filed on November 7, 2014. |
| 2.6 | | | | Incorporated herein by reference to Exhibit 2.2 to Clearway Energy, Inc.’s Current Report on Form 8-K filed on November 7, 2014. |
| 2.7*^ | | | | Incorporated herein by reference to Exhibit 2.1 to Clearway Energy, Inc.’s Quarterly Report on Form 10-Q filed on August 4, 2015. |
| 2.8 | |
| | Incorporated herein by reference to Exhibit 2.1 to Clearway Energy, Inc.’s Current Report on Form 8-K filed on September 21, 2015.
|
| 2.9 | | | | Incorporated herein by reference to Exhibit 2.1 to Clearway Energy, Inc.'s Current Report on Form 8-K filed on August 9, 2016. |
| 2.10* | | | | Incorporated herein by reference to Exhibit 2.10 to Clearway Energy, Inc.'s Annual Report on Form 10-K filed on March 1, 2018. |
| 2.11* | |
| | Incorporated herein by reference to Exhibit 2.1 to the Registrant's Current Report on Form 8-K, filed on December 9, 2019.
|
| 3.1 | | | | Incorporated herein by reference to Exhibit 3.01(a) to the Company's Registration Statement on Form S-4 filed on April 13, 2015. |
| 3.2 | | | | Incorporated herein by reference to Exhibit 3.01(b) to the Company's Registration Statement on Form S-4 filed on April 13, 2015. |
| 3.3 | | | | Filed herewith.Incorporated herein by reference to Exhibit 3.3. to the Company's Annual Report on Form 10-K filed on February 28, 2019. |
| 3.4 | | | | Incorporated herein by reference to Exhibit 3.03(a) to the Company's Registration Statement on Form S-4 filed on April 13, 2015. |
| 3.5 | | | | Incorporated herein by reference to Exhibit 3.03(b) to the Company's Registration Statement on Form S-4 filed on April 13, 2015. |
| 3.6 | |
| | Incorporated herein by reference to Exhibit 10.6 to Clearway Energy, Inc.'s Current Report on Form 8-K filed on September 5, 2018. |
|
| | | | |
| 4.1 | | | | Incorporated herein by reference to Exhibit 4.1 to Clearway Energy, Inc.'s Current Report on Form 8-K filed on August 5, 2014. |
|
| | | | |
| 4.2 | | | | Incorporated herein by reference to Exhibit 4.2 to Clearway Energy, Inc.'s Current Report on Form 8-K filed on August 5, 2014. |
| 4.3 | |
| | Incorporated herein by reference to Exhibit 4.3 to the Company's Current Report on Form 8-K filed on October 2, 2018.
|
| 4.4 | | | | Incorporated herein by reference to Exhibit 4.1 to Clearway Energy, Inc.'s Current Report on Form 8-K filed on November 13, 2014. |
| 4.5 | | | | Incorporated herein by reference to Exhibit 4.1 to Clearway Energy, Inc.'s Current Report on Form 8-K filed on February 27, 2015. |
| 4.6 | | | | Incorporated herein by reference to Exhibit 4.07 to the Company's Registration Statement on Form S-4 filed on April 13, 2015. |
| 4.7 | | | | Incorporated herein by reference to Exhibit 4.1 to Clearway Energy, Inc.'s Current Report on Form 8-K filed on May 8, 2015. |
| 4.8 | | | | Incorporated herein by reference to Exhibit 4.1 to Clearway Energy, Inc.'s Current Report on Form 8-K filed on June 29, 2015. |
| 4.9 | |
| | Incorporated herein by reference to Exhibit 4.2 to Clearway Energy, Inc.'s Current Report on Form 8-K filed on June 29, 2015. |
| 4.10 | | | | Incorporated herein by reference to Exhibit 4.1 to the Registrant's Current Report on Form 8-K, filed on August 18, 2016. |
| 4.11 | |
| | Incorporated herein by reference to Exhibit 4.2 to the Registrant's Current Report on Form 8-K, filed on August 18, 2016. |
| 4.12 | | | | Incorporated herein by reference to Exhibit 4.3 to the Registrant's Current Report on Form 8-K, filed on August 18, 2016. |
| 4.13 | | | | Incorporated herein by reference to Exhibit 4.1 to the Registrant's Current Report on Form 8-K, filed on January 31, 2018. |
| 4.14 | |
| | Incorporated herein by reference to Exhibit 4.1 to the Company's Current Report on Form 8-K filed on June 12, 2018.
|
| 4.15 | | | | Incorporated herein by reference to Exhibit 4.2 to the Registrant's Current Report on Form 8-K, filed on January 31, 2018.
|
| 4.16 | |
| | Incorporated herein by reference to Exhibit 4.2 to the Company's Current Report on Form 8-K filed on June 12, 2018.
|
| 4.17 | | Seventh Supplemental Indenture, dated as of July 17, 2018, among NRG Yield Operating LLC, the guarantors named therein and Delaware Trust Company (as successor in interest to Law Debenture Trust Company of New York).
| | Incorporated herein by reference to Exhibit 4.3 to the Company's Quarterly Report on Form 10-Q filed on August 2, 2018.
|
|
| | | | |
| 4.18 | |
| | Incorporated herein by reference to Exhibit 4.4 to the Company's Quarterly Report on Form 10-Q filed on August 2, 2018.
|
|
| | | | |
| 4.19 | |
| | Incorporated herein by reference to Exhibit 4.1 to the Company's Current Report on Form 8-K filed on September 6, 2018.
|
| 4.20 | |
| | Incorporated herein by reference to Exhibit 4.2 to the Company's Current Report on Form 8-K filed on September 6, 2018.
|
| 4.21 | |
| | Incorporated herein by reference to Exhibit 4.1 to the Company's Current Report on Form 8-K filed on October 2, 2018.
|
| 4.22 | |
| | Incorporated herein by reference to Exhibit 4.2 to the Company's Current Report on Form 8-K filed on October 2, 2018.
|
| 4.23 | |
| | Incorporated herein by reference to Exhibit 4.1 to the Company's Current Report on Form 8-K filed on October 31, 2018.
|
| 4.24 | |
| | Incorporated herein by reference to Exhibit 4.2 to the Company's Current Report on Form 8-K filed on October 31, 2018.
|
| 4.25 | |
| | Incorporated herein by reference to Exhibit 4.3 to the Registrant's Current Report on Form 8-K filed on October 31, 2018.
|
| 4.26 | | | | Incorporated herein by reference to Exhibit 4.1 to the Company's Current Report on Form 8-K filed on December 12, 2018. |
| 4.27 | | | | Incorporated herein by reference to Exhibit 4.2 to the Company's Current Report on Form 8-K filed on December 12, 2018. |
| 4.28 | | | | Incorporated herein by reference to Exhibit 4.3 to the Company's Current Report on Form 8-K filed on December 12, 2018. |
| 4.29 | | | | Incorporated herein by reference to Exhibit 4.1 to the Company's Current Report on Form 8-K filed on September 12, 2019. |
| 4.30 | | | | Incorporated herein by reference to Exhibit 4.2 to the Company's Current Report on Form 8-K filed on September 12, 2019. |
| 4.31 | | | | Incorporated herein by reference to Exhibit 4.3 to the Company's Current Report on Form 8-K filed on September 12, 2019.
|
| 4.32 | | | | Incorporated herein by reference to Exhibit 4.1 to the Company's Current Report on Form 8-K filed on November 22, 2019. |
|
| | | | |
| 4.33 | | | | Incorporated herein by reference to Exhibit 4.2 to the Company's Current Report on Form 8-K filed on November 22, 2019.
|
| 4.34 | | | | Incorporated herein by reference to Exhibit 4.3 to the Company's Current Report on Form 8-K filed on November 22, 2019.
|
| 4.35 | | | | Incorporated herein by reference to Exhibit 4.1 to the Company's Current Report on Form 8-K filed on December 12, 2019. |
| 4.36 | | | | Incorporated herein by reference to Exhibit 4.1 to the Company's Current Report on Form 8-K filed on December 12, 2019.
|
| 4.37 | |
| | Filed herewith. |
| 10.1 | |
| | Incorporated herein by reference to Exhibit 10.5 to Clearway Energy, Inc.'s Current Report on Form 8-K filed on September 5, 2018.
|
| 10.2.1 | |
| | Incorporated herein by reference to Exhibit 10.3 to Clearway Energy, Inc.'s Current Report on Form 8-K filed on September 5, 2018.
|
| 10.2.2 | |
| | Incorporated herein by reference to Exhibit 10.1 to Clearway Energy, Inc.'s Current Report on Form 8-K filed on February 14, 2019. |
| 10.2.3 | |
| | Incorporated herein by reference to Exhibit 10.1 to the Company’s Quarterly Report on Form 10-Q filed on August 6, 2019.
|
| 10.2.4 | |
| | Incorporated herein by reference to Exhibit 10.1 to the Company’s Current Report on Form 8-K filed on December 9, 2019.
|
| 10.3 | |
| | Incorporated herein by reference to Exhibit 10.1 to Clearway Energy, Inc.'s Current Report on Form 8-K filed on September 5, 2018.
|
| 10.4 | |
| | Incorporated herein by reference to Exhibit 10.2 to Clearway Energy, Inc.'s Current Report on Form 8-K filed on September 5, 2018.
|
| 10.5 | |
| | Incorporated herein by reference to Exhibit 10.9 to Clearway Energy, Inc.'s Current Report on Form 8-K filed on September 5, 2018.
|
| 10.6.1 | | Amended and Restated Credit Agreement, dated April 25, 2014, by and among NRG Yield Operating LLC, NRG Yield LLC, Royal Bank of Canada, as Administrative Agent, the lenders party thereto, Royal Bank of Canada, Goldman Sachs Bank USA and Bank of America, N.A., as L/C Issuers and RBC Capital Markets as Sole Left Lead Arranger and Sole Left Lead Book Runner. | | Incorporated by reference to Exhibit 10.1 to Clearway Energy, Inc.'s Current Report on Form 8-K filed on April 28, 2014. |
| 10.6.2 | | | | Incorporated herein by reference to Exhibit 10.9 to Clearway Energy, Inc.'s Quarterly Report on Form 10-Q filed on August 4, 2015.
|
| 10.6.3 | | | | Incorporated herein by reference to Exhibit 10.1 to the Company's Current Report on Form 8-K filed on February 12, 2018.
|
|
| | | | |
| 10.6.4 | | Third Amendment to Amended and Restated Credit Agreement and Administrative Agent Resignation and Appointment Agreement, dated as of April 30, 2018, by and among NRG Yield Operating LLC, NRG Yield LLC, the guarantors party thereto, Royal Bank of Canada, as Resigning Administrative Agent, JPMorgan Chase Bank, N.A., as Successor Administrative Agent, and the lenders party thereto.
| | Incorporated herein by reference to Exhibit 10.1 to the Company's Quarterly Report on Form 10-Q filed on May 3, 2018.
|
|
| | | | |
| 10.6.5 | |
| | Incorporated herein by reference to Exhibit 10.1 to the Company's Current Report on Form 8-K filed on December 6, 2018.
|
| 10.6.6 | |
| | Incorporated herein by reference to Exhibit 10.1 to the Company's Current Report on Form 8-K filed on December 23, 2019.
|
| 10.7^ | | | | Incorporated herein by reference to Exhibit 10.1 to Clearway Energy, Inc.'s Quarterly Report on Form 10-Q filed on August 4, 2015. |
| 10.8^ | | | | Incorporated herein by reference to Exhibit 10.2 to Clearway Energy, Inc.'s Quarterly Report on Form 10-Q filed on August 4, 2015. |
| 10.9^ | | | | Incorporated herein by reference to Exhibit 10.1 to Clearway Energy, Inc.'s Quarterly Report on Form 10-Q filed on May 5, 2016.
|
| 10.10^ | | | | Incorporated herein by reference to Exhibit 10.2 to Clearway Energy, Inc.'s Quarterly Report on Form 10-Q filed on May 5, 2016.
|
| 10.11^ | | | | Incorporated herein by reference to Exhibit 10.3 to Clearway Energy, Inc.'s Quarterly Report on Form 10-Q filed on May 5, 2016. |
| 10.12 | | | | Incorporated herein by reference to Exhibit 10.1 to Clearway Energy, Inc.'s Quarterly Report on Form 10-Q, filed on August 9, 2016.
|
| 10.13† | | | | Incorporated herein by reference to Exhibit 10.1 to Clearway Energy, Inc.'s Current Report on Form 8-K/A, filed on August 9, 2016. |
| 10.14† | | | | Incorporated herein by reference to Exhibit 10.28 to Clearway Energy, Inc.'s Annual Report on Form 10-K, filed on March 1, 2018. |
| 10.15 | | | | Incorporated herein by reference to Exhibit 10.30 to the Company's Annual Report on Form 10-K filed on February 28, 2019.
|
| 10.16*+ | |
| | Filed herewith. |
| 10.17*+ | |
| | Filed herewith. |
| 10.18 | | Amended and Restated Exchange Agreement, dated as of May 14, 2015, by and among NRG Energy, Inc., NRG Yield, Inc., and NRG Yield LLC and, pursuant to a joinder thereto, dated as of August 31, 2018, Zephyr Renewables LLC.
| | Incorporated herein by reference to Exhibit 10.1 to Clearway Energy, Inc.'s Current Report on Form 8-K filed on May 15, 2015.
|
| 21.1 | | | | Filed herewith. |
| 24.1 | | | | Included on the signature page of this Annual Report on Form 10-K. |
| 31.1 | | | | Filed herewith. |
| 31.2 | | | | Filed herewith. |
| 31.3 | | | | Filed herewith. |
| 32 | | | | Furnished herewith. |
| 101 INS | | Inline XBRL Instance Document. | | Filed herewith. |
|
| | | | |
| 101 SCH | | Inline XBRL Taxonomy Extension Schema. | | Filed herewith. |
| 101 CAL | | Inline XBRL Taxonomy Extension Calculation Linkbase. | | Filed herewith. |
| 101 DEF | | Inline XBRL Taxonomy Extension Definition Linkbase. | | Filed herewith. |
| 101 LAB | | Inline XBRL Taxonomy Extension Label Linkbase. | | Filed herewith. |
| 101 PRE | | Inline XBRL Taxonomy Extension Presentation Linkbase. | | Filed herewith. |
| 104 | | Cover Page Interactive Data File (the cover page interactive data file does not appear in Exhibit 104 because its Inline XBRL tags are embedded within the Inline XBRL document)
| | |
|
| | |
| † | | Indicates exhibits that constitute compensatory plans or arrangements. |
| * | | This filing excludes schedules pursuant to Item 601(b)(2) of Regulation S-K, which the registrant agrees to furnish supplementary to the Securities and Exchange Commission upon request by the Commission. |
| ^ | | Portions of this exhibit have been redacted and are subject to a confidential treatment request filed with the Secretary of the Securities and Exchange Commission pursuant to Rule 24b-2 under the Securities Exchange Act of 1934, as amended.
|
| + | | Information in this exhibit identified by the mark “[***]” is confidential and has been excluded pursuant to Item 601(b)(10)(iv) of Regulation S-K because it (i) is not material and (ii) would likely cause competitive harm to the Registrant if disclosed.
|
Item 16 — Form 10-K Summary
None.
SIGNATURES
Pursuant to the requirements of Section 13 or 15 (d) the Securities Exchange Act of 1934, the registrant has duly caused this report to be signed on its behalf by the undersigned thereunto duly authorized.
|
| | | | |
| | CLEARWAY ENERGY LLC (Registrant) | |
| | | |
| | /s/ CHRISTOPHER S. SOTOS | |
| | Christopher S. Sotos | |
| | Chief Executive Officer (Principal Executive Officer) | |
| |
Date: February 28, 2019March 2, 2020 | | |
| |
POWER OF ATTORNEY
Each person whose signature appears below constitutes and appoints Christopher S. Sotos, Kevin P. Malcarney and Michael A. Brown, each or any of them, such person's true and lawful attorney-in-fact and agent with full power of substitution and resubstitution for such person and in such person's name, place and stead, in any and all capacities, to sign any and all amendments to this report on Form 10-K, and to file the same with all exhibits thereto, and other documents in connection therewith, with the Securities and Exchange Commission, granting unto said attorneys-in-fact and agents, and each of them, full power and authority to do and perform each and every act and thing necessary or desirable to be done in and about the premises, as fully to all intents and purposes as such person, hereby ratifying and confirming all that said attorneys-in-fact and agents, or any of them or his or their substitute or substitutes, may lawfully do or cause to be done by virtue hereof.
In accordance with the Securities Exchange Act of 1934, this report has been signed below by the following persons on behalf of the registrant and in the capacities indicatedand on February 28, 2019.the dates indicated.
|
| | | | |
| | Signatures | | Title | |
| | /s/ CHRISTOPHER S. SOTOS | | President and Chief Executive Officer | |
| | Christopher S. Sotos | | of Clearway Energy LLC (Principal Executive Officer) | |
| Date: | February 28, 2019March 2, 2020 | | | |
| | | | | |
| | /s/ CHAD PLOTKIN | | Senior Vice President and Chief Financial Officer | |
| | Chad Plotkin | | of Clearway Energy LLC (Principal Financial Officer) | |
| Date: | February 28, 2019March 2, 2020 | | | |
| | | | | |
| | /s/ MARY-LEE STILLWELL | | Vice President and Chief Accounting Officer | |
| | Mary-Lee Stillwell | | of Clearway Energy LLC (Principal Accounting Officer) | |
| Date: | February 28, 2019March 2, 2020 | | | |
| | | | | |
| CLEARWAY ENERGY, INC. | | Sole Managing Member | |
| | | | | |
| | /s/ CHRISTOPHER S. SOTOS | | President and Chief Executive Officer | |
| | Christopher S. Sotos | | of Clearway Energy, Inc. | |
| Date: | February 28, 2019March 2, 2020 | | | |
|
| | | | |
| Signature | | Title | | Date |
| | | | | |
| /s/ NATHANIEL ANSCHUETZ | | Director of Clearway Energy, Inc. | | February 28, 2019March 2, 2020 |
| Nathaniel Anschuetz | | Sole Managing Member of Clearway Energy LLC | |
| | | | | |
| /s/ JONATHAN BRAM | | Director of Clearway Energy, Inc. | | February 28, 2019March 2, 2020 |
| Jonathan Bram | | Sole Managing Member of Clearway Energy LLC | |
| | | | | |
| /s/ BRIAN FORD | | Director of Clearway Energy, Inc. | | February 28, 2019March 2, 2020 |
| Brian Ford | | Sole Managing Member of Clearway Energy LLC | |
| | | | | |
| /s/ BRUCE MACLENNAN | | Director of Clearway Energy, Inc. | | February 28, 2019March 2, 2020 |
| Bruce MacLennan | | Sole Managing Member of Clearway Energy LLC | |
| | | | | |
| /s/ FERRELL MCCLEAN | | Director of Clearway Energy, Inc. | | February 28, 2019March 2, 2020 |
| Ferrell McClean | | Sole Managing Member of Clearway Energy LLC | |
| | | | | |
| /s/ DANIEL B. MORE | | Director of Clearway Energy, Inc. | | February 28, 2019March 2, 2020 |
| Daniel B. More | | Sole Managing Member of Clearway Energy LLC | |
| | | | | |
| /s/ E. STANLEY O'NEAL | | Director of Clearway Energy, Inc. | | February 28, 2019March 2, 2020 |
| E. Stanley O'Neal | | Sole Managing Member of Clearway Energy LLC | |
| | | | | |
| /s/ CHRISTOPHER S. SOTOS | | Director of Clearway Energy, Inc. | | February 28, 2019March 2, 2020 |
| Christopher S. Sotos | | Sole Managing Member of Clearway Energy LLC | |
| | | | | |
| /s/ SCOTT STANLEY | | Director of Clearway Energy, Inc. | | February 28, 2019March 2, 2020 |
| Scott Stanley | | Sole Managing Member of Clearway Energy LLC | |
Supplemental Information to be Furnished with Reports Filed Pursuant to
Section 15(d) of the Act by Registrants Which Have Not Registered
Securities Pursuant to Section 12 of the Act
No annual report or proxy materials has been sent to securities holders and no such report or proxy material is to be furnished to securities holders subsequent to the filing of the annual report on this Form 10-K.