UNITED STATES SECURITIES AND EXCHANGE COMMISSION
Washington, D.C. 20549
Form 10-K
| | | | | | | | | | | |
| ☒ | | ANNUAL REPORT PURSUANT TO SECTION 13 OR 15(d) OF THE SECURITIES EXCHANGE ACT OF 1934 |
| | For the Fiscal Year ended | December 31, 20222023 |
| ☐ | | TRANSITION REPORT PURSUANT TO SECTION 13 OR 15(d) OF THE SECURITIES EXCHANGE ACT OF 1934 For the Transition period from to . |
Commission File Number: 333-203369
Clearway Energy LLC
(Exact name of registrant as specified in its charter) | | | | | | | | | | | |
| Delaware | | 32-0407370 |
| (State or other jurisdiction of incorporation or organization) | | (I.R.S. Employer Identification No.) |
| 300 Carnegie Center, Suite 300 | Princeton | New Jersey | 08540 |
| (Address of principal executive offices) | (Zip Code) |
(609) 608-1525
(Registrant’s telephone number, including area code)
Securities registered pursuant to Section 12(b) of the Act:
None
Securities registered pursuant to Section 12(g) of the Act:
None
Indicate by check mark if the registrant is a well-known seasoned issuer, as defined in Rule 405 of the Securities Act. Yes o No x
Indicate by check mark if the registrant is not required to file reports pursuant to Section 13 or Section 15(d) of the Exchange Act. Yes x No o
Indicate by check mark whether the registrant (1) has filed all reports required to be filed by Section 13 or 15(d) of the Securities Exchange Act of 1934 during the preceding 12 months (or for such shorter period that the registrant was required to file such reports), and (2) has been subject to such filing requirements for the past 90 days. Yes x No o
Indicate by check mark whether the registrant has submitted electronically every Interactive Data File required to be submitted pursuant to Rule 405 of Regulation S-T (§232.405 of this chapter) during the preceding 12 months (or for such shorter period that the registrant was required to submit such files). Yes x No o
Indicate by check mark whether the registrant is a large accelerated filer, an accelerated filer, a non-accelerated filer, a smaller reporting company or an emerging growth company. See the definitions of “large accelerated filer,” “accelerated filer,” “smaller reporting company,” and “emerging growth company” in Rule 12b-2 of the Exchange Act.
| | | | | | | | | | | |
| Large accelerated filer | ☐ | Accelerated filer | ☐ |
| Non-accelerated filer | ☒ | Smaller reporting company | ☐ |
| | Emerging growth company | ☐ |
If an emerging growth company, indicate by check mark if the registrant has elected not to use the extended transition period for complying with any new or revised financial accounting standards provided pursuant to Section 13(a) of the Exchange Act. o
Indicate by check mark whether the registrant is a shell company (as defined in Rule 12b-2 of the Act). Yes ☐ No x
Indicate by check mark whether the registrant has filed a report on and attestation to its management’s assessment of the effectiveness of its internal control over financial reporting under section 404(b) of the Sarbanes-Oxley Act (15 U.S.C. 7262(b)) by the registered public accounting firm that prepared or issued its audit report. ☐
If securities are registered pursuant to Section 12(b) of the Act, indicate by check mark whether the financial statements of the registrant included in the filing reflect the correction of an error to previously issued financial statements. ☐
Indicate by check mark whether any of those error corrections are restatements that required a recovery analysis of incentive-based compensation received by any of the registrant’s executive officers during the relevant recovery period pursuant to §240.10D-1(b). ☐
Clearway Energy LLC’s outstanding equity interests are held by Clearway Energy, Inc. and Clearway Energy Group LLC and there are no equity interests held by non-affiliates.
Indicate the number of shares outstanding of each of the registrant’s classes of common stock as of the latest practicable date. There is no public market for the registrant’s outstanding units.
| | | | | |
| Class | Outstanding at January 31, 20232024 |
| Class A Units | 34,613,853 |
| Class B Units | 42,738,750 |
| Class C Units | 82,283,46082,391,441 |
| Class D Units | 42,336,750 |
Documents Incorporated by Reference:
None.
TABLE OF CONTENTS
Index | | | | | |
| GLOSSARY OF TERMS | |
| PART I | |
| Item 1 — Business | |
| Item 1A — Risk Factors | |
| Item 1B — Unresolved Staff Comments | |
| Item 1C — Cybersecurity | |
| Item 2 — Properties | |
| Item 3 — Legal Proceedings | |
| Item 4 — Mine Safety Disclosures | |
| PART II | |
| Item 5 — Market for Registrant’s Common Equity, Related Stockholder Matters and Issuer Purchases of Equity Securities | |
| Item 6 — Reserved | |
| Item 7 — Management’s Discussion and Analysis of Financial Condition and Results of Operations | |
| Item 7A — Quantitative and Qualitative Disclosures About Market Risk | |
| Item 8 — Financial Statements and Supplementary Data | |
| Item 9 — Changes in and Disagreements with Accountants on Accounting and Financial Disclosure | |
| Item 9A — Controls and Procedures | |
| Item 9B — Other Information | |
| PART III | |
| Item 10 — Information about Directors, Executive Officers and Corporate Governance | |
| Item 11 — Executive Compensation | |
| Item 12 — Security Ownership of Certain Beneficial Owners and Management and Related Stockholder Matters | |
| Item 13 — Certain Relationships and Related Transactions, and Director Independence | |
| Item 14 — Principal Accounting Fees and Services | |
| PART IV | |
| Item 15 — Exhibits, Financial Statement Schedules | |
| EXHIBIT INDEX | |
| Item 16 — Form 10-K Summary | |
GLOSSARY OF TERMS
When the following terms and abbreviations appear in the text of this report, they have the meanings indicated below:
| | | | | |
| |
2025 Senior Notes | $600 million aggregate principal amount of 5.75% unsecured senior notes due 2025, issued by Clearway Energy Operating LLC, which were repaid in March 2021 |
2026 Senior Notes | $350 million aggregate principal amount of 5.00% unsecured senior notes due 2026, issued by Clearway Energy Operating LLC, which were repaid in October 2021 |
| 2028 Senior Notes | $850 million aggregate principal amount of 4.75% unsecured senior notes due 2028, issued by Clearway Energy Operating LLC |
| 2031 Senior Notes | $925 million aggregate principal amount of 3.75% unsecured senior notes due 2031, issued by Clearway Energy Operating LLC |
| 2032 Senior Notes | $350 million aggregate principal amount of 3.75% unsecured senior notes due 2032, issued by Clearway Energy Operating LLC |
| Adjusted EBITDA | A non-GAAP measure, represents earnings before interest (including loss on debt extinguishment), tax, depreciation and amortization adjusted for mark-to-market gains or losses, asset write offs and impairments; and factors which the Company does not consider indicative of future operating performance |
| ARO | Asset Retirement Obligation |
| |
| ASC | The FASB Accounting Standards Codification, which the FASB established as the source of authoritative GAAP |
| ASU | Accounting Standards Updates – updates to the ASC |
| ATM Program | At-The-Market Equity Offering Program |
| BESS | Battery energy storage system |
| BlackRock | BlackRock, Inc. |
| Black Start | The capability of a generating asset to restore the grid in the event of a blackout without relying on the external electric power transmission network |
| Bridge Loan Agreement | Senior secured bridge credit agreement entered into by Clearway Energy Operating LLC that provides a term loan facility in an aggregate principal amount of $335 million that was repaid on May 3, 2022 |
| CAFD | A non-GAAP measure, Cash Available for Distribution is defined as of December 31, 20222023 as Adjusted EBITDA plus cash distributions/return of investment from unconsolidated affiliates, cash receipts from notes receivable, cash contributions from noncontrolling interests, adjustments to reflect sales-type lease cash payments and payments for lease expenses, less cash distributions to noncontrolling interests, maintenance capital expenditures, pro-rata Adjusted EBITDA from unconsolidated affiliates, cash interest paid, income taxes paid, principal amortization of indebtedness, changes in prepaid and accrued capacity payments, and adjusted for development expenses |
| Capistrano Wind Portfolio | Five wind projects representing 413 MW of capacity, which includes Broken Bow and Crofton Bluffs located in Nebraska, Cedro Hill located in Texas and Mountain Wind Power I1 and II2 located in Wyoming |
CARES Act | The Coronavirus Aid, Relief, and Economic Security Act |
| CEG | Clearway Energy Group LLC (formerly Zephyr Renewables LLC) |
| CEG Master Services Agreement | Amended and Restated Master Services Agreements, entered intodated as of August 31, 2018 and amended on February 2, 2023, betweenamong the Company, Clearway Energy, LLC andInc., Clearway Energy Operating LLC and CEG |
CEG ROFO Agreement | Right of First Offer Agreement, entered into as of August 31, 2018, by and between Clearway Energy Group LLC and Clearway Energy, Inc., and solely for purposes of Section 2.4, GIP III Zephyr Acquisition Partners, L.P., as amended by the First Amendment dated February 14, 2019, the Second Amendment dated August 1, 2019, the Third Amendment dated December 6, 2019, the Fourth Amendment dated November 2, 2020 and the Fifth Amendment dated August 2, 2021 |
| Clearway, Inc. | Clearway Energy, Inc., the holder of the Company’s Class A and Class C units |
| Clearway Energy Group LLC | The holder of all shares of Clearway, Inc.’s Class B and Class D common sharesstock and the Company’s Class B and Class D units and, from time to time, possibly shares of Clearway, Inc.’s Class A and/or Class C common stock |
| Clearway Energy Operating LLC | The holder of the project assets that are owned by the Company |
| Clearway Renew | Clearway Renew LLC, a subsidiary of CEG, and its wholly-owned subsidiaries |
| COD | Commercial Operation Date |
| Code | Internal Revenue Code of 1986, as amended |
| Company | Clearway Energy LLC, together with its consolidated subsidiaries |
| CVSR | California Valley Solar Ranch |
| | | | | |
| CVSR Holdco | CVSR Holdco LLC, the indirect owner of CVSR |
DGPV Holdco 1 | DGPV Holdco 1 LLC |
DGPV Holdco 2 | DGPV Holdco 2 LLC |
DGPV Holdco 3 | DGPV Holdco 3 LLC |
Distributed Solar
| Solar power projects, typically less than 20 MW in size (on an alternating current, or AC, basis), that primarily sell power produced to customers for usage on site, or are interconnected to sell power into the local distribution grid |
| Drop Down Assets | Assets under common control acquired by the Company from CEG |
| | | | | |
| EPA | United States Environmental Protection Agency |
ERCOT
| Electric Reliability Council of Texas, the ISO and the regional reliability coordinator of the various electricity systems within Texas |
| EWG | Exempt Wholesale Generator |
| Exchange Act | The Securities Exchange Act of 1934, as amended |
| FASB | Financial Accounting Standards Board |
| FERC | Federal Energy Regulatory Commission |
| FPA | Federal Power Act |
| FWS | U.S. Fish & Wildlife Service |
| GAAP | Accounting principles generally accepted in the U.S. |
| GenConn | GenConn Energy LLC |
| GHG | Greenhouse gas |
| GIM | Global Infrastructure Management, LLC, the manager of GIP |
| GIP | Global Infrastructure Partners |
GIP Transaction | On August 31, 2018, NRG transferred its full ownership interest in the Company to Clearway Energy Group LLC and subsequently sold 100% of its interests in Clearway Energy Group LLC, which includes NRG's renewable energy development and operations platform, to an affiliate of GIP. GIP, NRG and the Company also entered into a consent and indemnity agreement in connection with the purchase and sale agreement, which was signed on February 6, 2018 |
| HLBV | Hypothetical Liquidation at Book Value |
| IRA | Inflation Reduction Act of 2022 |
| IRS | Internal Revenue Service |
| ISO | Independent System Operator, also referred to as an RTO |
| ITC | Investment Tax Credit |
| KKR | KKR Thor Bidco, LLC, an affiliate of Kohlberg Kravis Roberts & Co. L.P. |
| kWh | Kilowatt Hour |
| LIBOR | London Inter-Bank Offered Rate |
| |
| MBTA | Migratory Bird Treaty Act |
| Mesquite Star | Mesquite Star Special, LLC |
| MMBtu | Million British Thermal Units |
| Mt. Storm | NedPower Mount Storm LLC |
| MW | Megawatt |
| MWh | Saleable megawatt hours, net of internal/parasitic load megawatt-hours |
| MWt | Megawatts Thermal Equivalent |
| NEPA | National Environmental Policy Act |
| NERC | North American Electric Reliability Corporation |
| Net Exposure | Counterparty credit exposure to Clearway Energy LLC, net of collateral |
| |
| NOLs | Net Operating Losses |
NOx | Nitrogen Oxides |
| NPNS | Normal Purchases and Normal Sales |
| | | | | |
NPPD | Nebraska Public Power District |
| NRG | NRG Energy, Inc. |
| OCI/OCL | Other comprehensive income/loss |
| O&M | Operations and Maintenance |
| PG&E | Pacific Gas and Electric Company |
| |
| PJM | PJM Interconnection, LLC |
| PPA | Power Purchase Agreement |
| PTC | Production Tax Credit |
| PUCT | Public Utility Commission of Texas |
| PUHCA | Public Utility Holding Company Act of 2005 |
| PURPA | Public Utility Regulatory Policies Act of 1978 |
| QF | Qualifying Facility under PURPA |
| RA | Resource adequacy |
| | | | | |
| RENOM | Clearway Renewable Operation & Maintenance LLC, a wholly-owned subsidiary of CEG |
ROFORosie Central BESS | Right of First OfferRosie BESS Devco LLC |
| |
| RPS | Renewable Portfolio Standards |
RPV Holdco | RPV Holdco 1 LLC |
| RTO | Regional Transmission Organization |
| SCE | Southern California Edison |
| SEC | U.S. Securities and Exchange Commission |
| Senior Notes | Collectively, the 2028 Senior Notes, the 2031 Senior Notes and the 2032 Senior Notes |
SO2 | Sulfur Dioxide |
| SOFR | Secured Overnight Financing Rate |
| SPP | Solar Power Partners |
| SREC | Solar Renewable Energy Credit |
| Tax Act | Tax Cuts and Jobs Act of 2017
| Thermal Business | The Company’s thermal business, which consistsconsisted of thermal infrastructure assets that provideprovided steam, hot water and/or chilled water, and in some instances electricity, to commercial businesses, universities, hospitals and governmental units |
| Thermal Disposition | On May 1, 2022, the Company completed theThe Company’s sale of 100% of its interests in the Thermal Business to KKR, which was completed on May 1, 2022 |
| TotalEnergies | TotalEnergies SE |
| U.S. | United States of America |
U.S. DOE | U.S. Department of Energy |
| Utah Solar Portfolio | Seven utility-scale solar farms located in Utah, representing 530 MW of capacity |
Utility Scale Solar
| Solar power projects, typically 20 MW or greater in size (on an alternating current, or AC, basis), that are interconnected into the transmission or distribution grid to sell power at a wholesale level |
| VIE | Variable Interest Entity |
| |
PART I
Item 1 — Business
General
Clearway Energy LLC, together with its consolidated subsidiaries, or the Company, is an energy infrastructure investor with a focus on investments in clean energy and owner of modern, sustainable and long-term contracted assets across North America. The Company was formed as a Delaware limited liability company on March 5, 2013. The Company is sponsored by GIP and TotalEnergies through the portfolio company, Clearway Energy Group LLC, or CEG, which becameis equally owned by GIP and TotalEnergies as of September 12, 2022, when TotalEnergies acquired, through its investment in an intermediate holding company, 50% of GIP’s interest in CEG.TotalEnergies. GIP is an independent infrastructure fund manager that makes equity and debt investments in infrastructure assets and businesses. TotalEnergies is a global multi-energy company. CEG is a leading developer of renewable energy infrastructure in the U.S. On January 12, 2024, BlackRock entered into a definitive agreement to acquire 100% of the business and assets of GIM, which is the investment manager of the GIP funds that own an interest in CEG. BlackRock has indicated that the transaction is expected to close in the third quarter of 2024, subject to regulatory approvals and other customary closing conditions. BlackRock is a publicly-traded global investment management firm.
The Company is one of the largest renewable energy owners in the U.S. with over 5,500approximately 6,000 net MW of installed wind, solar and solar generationenergy storage projects. The Company’s over 8,000approximately 8,500 net MW of assets also includes approximately 2,500 net MW of environmentally-sound, highly efficient natural gas-fired generation facilities. Through this environmentally-sound, diversified and primarily contracted portfolio, the Company endeavors to increase distributions to its unit holders. The majority of the Company’s revenues are derived from long-term contractual arrangements for the output or capacity from these assets. The weighted average remaining contract duration of these offtake agreements was approximately 1110 years as of December 31, 20222023 based on CAFD.
On May 1, 2022, the Company completed the sale of 100% of its interests in the Thermal Business to KKR. For further details of the Thermal Disposition, refer to Item 15 — Note 3, Acquisitions and Dispositions.
A complete listing of the Company’s interests in facilities, operations and/or projects owned or leased as of December 31, 20222023 can be found in Item 2 — Properties.
History
The Company was formed as a Delaware limited liability company by NRG on March 5, 2013. On August 31, 2018, NRG transferred its full ownership interest in Clearway Energy, Inc, or Clearway, Inc., and its subsidiaries to CEG, the holder of NRG’s renewable energy development and operations platform, and subsequently sold 100% of its interest in CEG to GIP. On September 12, 2022, GIP sold 50% of its interest in CEG through an intermediate holding company to TotalEnergies.
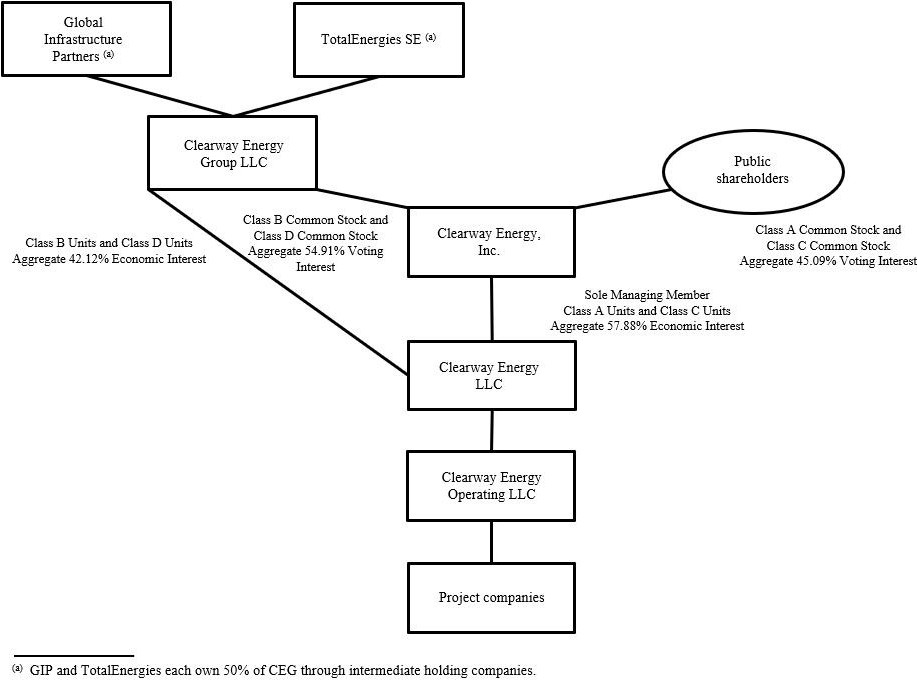
The Company is a holding company for the companies that directly and indirectly own and operate Clearway Energy, Inc.’s, or Clearway, Inc., business. As of December 31, 2022, CEG which is equally owned by GIP and TotalEnergies, controls Clearway, Inc., and Clearway, Inc. in turn, as the sole managing member of the Company, controls the Company and its subsidiaries. Clearway, Inc. consolidates the results of the Company through its controlling interest, with CEG’s interest shown as contributed capital in the Company’s consolidated financial statements. The holders of Clearway, Inc.’s outstanding shares of Class A and Class C common stock are entitled to dividends as declared. CEG receives its distributions from the Company through its ownership of the Company’s Class B and Class D units. From time to time, CEG may also hold shares of Clearway Inc’s Class A and/or Class C common stock.
As of December 31, 2022,2023, CEG owned 42,738,750 of the Company’s Class B units and 42,336,750 of the Company’s Class D units, while Clearway, Inc. owned 34,613,853 of the Company’s Class A units and 82,283,46082,391,441 of the Company’s Class C units. Clearway, Inc., through its holdings of Class A units and Class C units, owned a 57.88%57.90% economic interest in the Company as of December 31, 2022.2023. Additionally, GIP,CEG, through CEG’sits holdings of Class B units and Class D units, owned a 42.12%42.10% economic interest in the Company as of December 31, 2022.2023.
The diagram below represents a summarized structure of the Company as of December 31, 2022:2023:
Business Strategy
The Company’s primary business strategy is to focus on the acquisition and ownership of assets with predictable, long-term cash flows in order that it may be able to increase the distributions to Clearway, Inc. over time without compromising the ongoing stability of the business.
The Company’s plan for executing its business strategy includes the following key components:
Focus on contracted renewable energy and conventional generation. The Company owns and operates utility scale and distributed renewable energy and natural gas-fired generation assets, as well as energy storage assets, with proven technologies, generally low operating risks and stable cash flows. The Company believes by focusing on this core asset class and leveraging its industry knowledge, it will maximize its strategic opportunities, be a leader in operational efficiency and maximize its overall financial performance.
Growing the business through acquisitions of contracted operating assets. The Company believes that its base of operations provides a platform for strategic growth through cash accretive and tax advantaged acquisitions complementary to its existing portfolio. In addition to acquiring generation facilities from third parties where the Company believes its knowledge of the market and operating expertise provides it with a competitive advantage, the Company may consummate future acquisitions from CEG. The Company believes that CEG’s project development expertise provides the Company access to a development platform with an extensive pipeline of potential renewable energy and energy storage projects that are aligned to support the Company’s growth. The Company and CEG work collaboratively in considering new assets to be acquired by the Company. The assets listed below all of which are included in co-investment partnerships, represent the Company’s currently committed investments in projects with CEG:
| | | | | | | | | | | | | | | | | | | | | | | | | | | | | | | | |
| Asset | | Technology | | Gross Capacity (MW) | | State | | Estimated COD | | Status |
Daggett Solar 3Cedar Creek | | Solar/StorageWind | | 300160 | | CAID | | 1H23 | | Committed1H24 |
Daggett Solar 2Cedro Hill Repowering | | Solar/StorageWind | | 182160 | | CATX | | 2H23 | | Committed2H24 |
| | | | | | | | |
AricaTexas Solar Nova 2 (a)
| | Solar | | Solar/Storage | | 263 | | CA | | 2H23 | | Committed |
Victory Pass | | Solar/Storage | | 200 | | CATX | | 2H23 | | Committed1H24 |
(a) Included in a co-investment partnership.
Primary focus on North America. The Company intends to focus its investments in North America. The Company believes that industry fundamentals in North America present it with significant opportunity to grow its portfolio without creating significant exposure to currency and sovereign risk. By focusing its efforts on North America, the Company believes it will best leverage its regional knowledge of power markets, industry relationships and skill sets to maximize the performance of the Company.
Maintain sound financial practices to grow the distributions. The Company intends to maintain a commitment to disciplined financial analysis and a balanced capital structure to enable it to increase its distributions over time and serve the long-term interests of its unit holders. The Company’s financial practices include a risk and credit policy focused on transacting with creditworthy counterparties; a financing policy, which focuses on seeking an optimal capital structure through various capital formation alternatives to minimize interest rate and refinancing risks, ensure stable distributions and maximize value. The Company intends to evaluate various alternatives for financing future acquisitions and refinancing of existing project-level debt, in each case, to reduce the cost of debt, extend maturities and maximize CAFD.
Competition
Power generation is a capital-intensive business with numerous and diverse industry participants. The Company competes on the basis of the location of its plants and on the basis of contract price and terms of individual projects. Within the power industry, there is a wide variation in terms of the capabilities, resources, nature and identity of the companies with whom the Company competes depending on the market. Competitors for energy supply are utilities, independent power producers and other providers of distributed generation. The Company also competes to acquire new projects with renewable developers who retain renewable power plant ownership, independent power producers, financial investors and other growth-oriented companies. Competitive conditions may be substantially affected by capital market conditions and by various forms of energy legislation and regulation considered by federal, state and local legislatures and administrative agencies, including tax policy. Such laws and regulations may substantially increase the costs of acquiring, constructing and operating projects, and it could be difficult for the Company to adapt to and operate under such laws and regulations.
Competitive Strengths
Stable, high quality cash flows. The Company’s facilities have a stable, predictable cash flow profile consisting of predominantly long-life electric generation assets that primarily sell electricity under long-term fixed priced contracts or pursuant to regulated rates with investment-grade and certain other creditworthy counterparties. The majority of the Company’s facilities have minimal fuel risk. Forrisk, as the Renewables facilities have no fuel costs, however, the Company’s merchant conventional assets currently contracted under tolling agreements, fuel is provided by the toll counterparty or the cost thereof is a pass-through cost under the Contract for Differences. When the tolling agreements expire, the conventional assets will need to procure their own fuel. The Renewable facilities have no fuel costs. The offtake agreements for the Company’s conventional and renewable generation facilities have a weighted-average remaining duration, based on CAFD, of approximately 1110 years as of December 31, 2022,2023, providing long-term cash flow stability. The Company’s generation offtake agreements with counterparties for whom credit ratings are available have a weighted-average Moody’s rating of Ba1 based on rated capacity under contract. All of the Company’s assets are in the U.S. and accordingly have no currency or repatriation risks.
Environmentally well-positioned portfolio of assets. The Company’s portfolio of electric generation assets consists of over 5,500approximately 6,000 net MW of renewable generation capacityinstalled wind, solar and energy storage projects that are predominantly non-emitting sources of power generation. Additionally, the Company’s California conventional assets consist of efficient gas generation facilities that support electric system reliability. The Company does not anticipate having to expend any significant capital expenditures in the foreseeable future to comply with current environmental regulations applicable to its generation assets. Taken as a whole, the Company believes its strategy will be a net beneficiary of current and potential environmental legislation and regulatory requirements that may serve as a catalyst for capacity retirements and improve market opportunities for environmentally well-positioned assets like the Company’s assets once its current offtake agreements expire.
High quality, long-lived assets with low operating and capital requirements. The Company benefits from a portfolio of relatively youngernewer assets. The Company’s assets are largely comprised of proven and reliable technologies, provided by leading original wind, solar and windenergy storage equipment manufacturers, such asincluding First Solar, General Electric, Siemens Energy AG, SunPower, Corporation, or SunPower, First Solar Inc., or First Solar, Vestas Mitsubishi, Trina Solar, JA Solar and Siemens Gamesa.Wärtsilä. Given the modern nature of the portfolio, which includes a substantial number of relatively low operating and maintenance cost wind, solar and wind generation assets,energy storage projects, the Company expects to achieve high fleet availability and expend modest maintenance-related capital expenditures.
Significant scale and diversity. The Company is one of the largest renewable energy owners in the U.S. with over 5,500approximately 6,000 net MW of installed wind, solar and solar generationenergy storage projects. The Company’s over 8,000approximately 8,500 net MW of assets also includes approximately 2,500 net MW of environmentally-sound, highly efficient natural gas-fired generation facilities. The Company’s contracted renewable and conventional generation assets benefit from significant diversification in terms of technology, fuel type, counterparty and geography. The Company believes its scale and access to best practices across the fleet improves its business development opportunities through enhanced industry relationships, reputation and understanding of regional power market dynamics. Furthermore, the Company’s diversification reduces its operating risk profile and reliance on any single market.
Relationship with GIP, TotalEnergies and CEG. The Company believes that its relationship with GIP, TotalEnergies and CEG provides significant benefits. Global Infrastructure Management, LLC, or GIM, the manager of GIP, is an independent infrastructure fund manager that makes equity and debt investments in infrastructure assets and businesses in both the Organization for Economic Co-operation and Development (OECD) and select emerging market countries. GIM has a strong track record of investment and value creation in the renewable energy sector. GIM also has extensive experience with publicly traded yield vehicles and development platforms, ranging from Europe’s first application of a yield company/development company model to the largest renewable platform in Asia-Pacific. TotalEnergies is a global multi-energy company that produces and markets energies in more than 130 countries. Additionally, the Company believes that CEG provides the Company access to a highly capable renewable development and operations platform that is aligned to support the Company’s growth.
Segment Review
The following tables summarize the Company’s operating revenues, net income (loss) and assets by segment, for the years ended December 31, 2022, 2021 and 2020, as discussed in Item 15 — Note 13,12, Segment Reporting.
| | | | | | | | | | | | | | | | | | | | | | | | |
| Year ended December 31, 2023 | |
| (In millions) | Conventional Generation | | Renewables | | Corporate | | Total | |
| Operating revenues | $ | 420 | | | $ | 894 | | | $ | — | | | $ | 1,314 | | |
| | | | | | | | |
| Net income (loss) | 109 | | | (12) | | | (110) | | | (13) | | |
| Total assets | 2,058 | | | 12,205 | | | 425 | | | 14,688 | | |
| | | | | | | | | | | | | | | | | | | | | | | | | | | | | |
| Year ended December 31, 2022 |
| (In millions) | Conventional Generation | | Renewables | | Thermal | | Corporate | | Total |
| Operating revenues | $ | 417 | | | $ | 696 | | | $ | 77 | | | $ | — | | | $ | 1,190 | |
| | | | | | | | | |
Net income (loss) (a) | 161 | | | (58) | | | 17 | | | 1,162 | | | 1,282 | |
| Total assets | 2,251 | | | 9,515 | | | — | | | 546 | | | 12,312 | |
(a) Corporate net income includes the $1.29 millionbillion gain on the sale of the Thermal Business to KKR, which was completed on May 1, 2022.
| | | | | | | | | | | | | | | | | | | | | | | | | | | | | |
| Year ended December 31, 2021 |
| (In millions) | Conventional Generation | | Renewables | | Thermal | | Corporate | | Total |
| Operating revenues | $ | 441 | | | $ | 641 | | | $ | 204 | | | $ | — | | | $ | 1,286 | |
| | | | | | | | | |
| Net income (loss) | 172 | | | (65) | | | 22 | | | (192) | | | (63) | |
| Total assets | 2,442 | | | 9,603 | | | 631 | | | 42 | | | 12,718 | |
| | Year ended December 31, 2020 |
| Year ended December 31, 2021 | | | Year ended December 31, 2021 |
| (In millions) | (In millions) | Conventional Generation | | Renewables | | Thermal | | Corporate | | Total | (In millions) | Conventional Generation | | Renewables | | Thermal | | Corporate | | Total |
| Operating revenues | Operating revenues | $ | 437 | | | $ | 569 | | | $ | 193 | | | $ | — | | | $ | 1,199 | |
| | Net income (loss) | Net income (loss) | 140 | | | (108) | | | 3 | | | (87) | | | (52) | |
| Net income (loss) | |
| Net income (loss) | |
Policy Incentives
U.S. federal, state and local governments have established various policy incentives to support the development, financing, ownership and operation of renewable energy projects. These incentives include PTCs, ITCs, accelerated tax depreciation, cash grants, tax abatements and RPS programs which have the effect of decreasing the costs and risks associated with developing and operating such projects or creating demand for renewable energy assets. In particular,
•Owners of wind facilities are eligible to claim the PTC, or an ITC in lieu of the PTC, provided that certain requirements are met. Similarly, owners of solar facilities are eligible to claim the ITC or, for facilities placed in service after August 16, 2022, the PTC, or an ITC in lieu of the PTC, provided certain requirements are met. Additionally, owners of energy storage facilities are eligible to claim the ITC for facilities placed in service after December 31, 2022, provided certain requirements are met. The PTC is an annual credit that is based on the amount of electricity sold by the facility during the first ten years after the facility is first placed in service. The ITC is a one-time credit that is based on a percentage of the cost of the facility and is claimed for the tax year in which the facility is first placed in service. Depending on the type of taxpayer, the PTC or ITC may be sold to an unrelated third party for cash, or in certain cases, direct payment from the government may be received. In order to qualify for the full amount of these credits in the case of facilities whose construction beginsbegan on or after January 29,30, 2023, certain prevailing wage and apprenticeship requirements generally must be satisfied, the details of which have been released only in part with additional details expected in future guidance.satisfied. For facilities that begin construction after December 31, 2024, the PTC and ITC will no longer apply and such facilities may instead be eligible for the clean electricity production credit or clean electricity investment credit, respectively. In order to qualify for these new credits, the facility’s greenhouse gas emissions cannot be greater than zero.
•Pursuant to the U.S. federal Modified Accelerated Cost Recovery System, or MACRS, wind and solar projects are generally depreciable for tax purposes over a five-year period (before taking into account certain conventions) even though the useful life of such projects is generally much longer than five years. The Tax ActFederal income tax law also provides for immediate and 100% expensing and deductibility for eligible property acquired and placed in service after September 27, 2017, and before January 1, 2023, with phase downs permitting 80%, 60%, 40% and 20% expensing and deductibility for property acquired and placed in service during 2023, 2024, 2025 and 2026, respectively.
•RPS programs, currently in place in certain states and territories, require electricity providers in the state or territory to meet a certain percentage of their retail sales with energy from renewable sources. Additionally, other states in the U.S. have set renewable energy goals to reduce GHG emissions from historic levels. The Company believes that these standards and goals will create incremental demand for renewable energy in the future.
The elimination of, loss of, or reduction in, the incentives discussed above could decrease the attractiveness of renewable energy projects to developers, including, but not limited to, CEG, which could reduce the Company'sCompany’s acquisition or development opportunities. Such an elimination, loss or reduction could also reduce the Company’s willingness to pursue or develop certain renewable energy projects due to higher operating costs or decreased revenues under its PPAs.
Regulatory Matters
As owners of power plants and participants in wholesale energy markets, certain of the Company’s subsidiaries are subject to regulation by various federal and state government agencies. These agencies include FERC and the PUCT, as well as other public utility commissions in certain states where the Company’s assets are located. Each of the Company’s U.S. generating facilities qualifies as an EWG or QF. In addition, the Company is subject to the market rules, procedures and protocols of the various ISO and RTO markets in which it participates. Likewise, certain of the Company’s subsidiaries must also comply with the mandatory reliability requirements imposed by NERC and the regional reliability entities in the regions where the Company has generating facilities subject to NERC’s reliability authority.The Company’s operations within the ERCOT footprint are not subject to rate regulation by FERC, as they are deemed to operate solely within the ERCOT market and not in interstate commerce. These operations are subject to regulation by PUCT. Similarly, the Company’s operations within Hawaii are not subject to rate regulation by FERC, as they are deemed to operate solely within the State of Hawaii and not in interstate commerce.
FERC
FERC, among other things, regulates the transmission and the wholesale sale of electricity in interstate commerce under the authority of the FPA. The transmission and sale of electric energy occurring wholly within ERCOT and Hawaii is not subject to FERC’s jurisdiction. Under existing regulations, FERC has the authority to determine whether an entity owning a generation facility is an EWG, as defined in the PUHCA. FERC also has the authority to determine whether a generation facility meets the applicable criteria of a QF under the PURPA. Each of the Company’s U.S. generating facilities qualifies as either an EWG or QF.
The FPA gives FERC exclusive rate-making jurisdiction over the wholesale sale of electricity and transmission of electricity in interstate commerce of public utilities (as defined by the FPA). Under the FPA, FERC, with certain exceptions, regulates owners and operators of facilities used for the wholesale sale of electricity or transmission in interstate commerce as public utilities, and is charged with ensuring that market rules are just and reasonable.
Public utilities are required to obtain FERC’s acceptance, pursuant to Section 205 of the FPA, of their rate schedules for the wholesale sale of electricity. Several of the Company’s QF generating facilities and all of the Company’s non-QF generating facilities located in the U.S. outside of ERCOT and Hawaii make sales of electricity pursuant to market-based rates, as opposed to traditional cost-of-service regulated rates. FERC conducts a review of the market-based rates of Company public utilities and potential market power every three years according to a regional schedule established by FERC.
In accordance with the Energy Policy Act of 2005, FERC has approved the NERC as the national Energy Reliability Organization, or ERO. As the ERO, NERC is responsible for the development and enforcement of mandatory reliability standards for the wholesale electric power system, with such authority delegated in part to regional reliability entities charged with enforcement of mandatory reliability standards for the region which they are responsible for overseeing.
The PURPA was passed in 1978 in large part to promote increased energy efficiency and development of independent power producers. The PURPA created QFs to further both goals, and FERC is primarily charged with administering the PURPA as it applies to QFs. QFs are exempt from certain regulations under the FPA.
The PUHCA provides FERC with certain authority over and access to books and records of public utility holding companies not otherwise exempt by virtue of their ownership of EWGs and QFs. The Company is exempt from many of the accounting, record retention, and reporting requirements of the PUHCA.
Environmental Matters
The Company is subject to a wide range of environmental laws during the development, construction, ownership and operation of facilities. These existing and future laws generally require that governmental permits and approvals be obtained before construction and maintained during operation of facilities. The Company is obligated to comply with all environmental laws and regulations applicable within each jurisdiction and required to implement environmental programs and procedures to monitor and control risks associated with the construction, operation and decommissioning of regulated or permitted energy assets. Federal and state environmental laws have historically become more stringent over time, although this trend could change in the future.
A number of regulations that may affect the Company are under review for potential revision or rescission in 2023.2024. The Company will evaluate the impact of the legislation and regulations as they are revised but cannot fully predict the impact of each until anticipated revisions and legal challenges are resolved. To the extent that proposed legislation and new or revised regulations restrict or otherwise impact the Company’s operations, the proposed legislation and regulations could have a negative impact on the Company’s financial performance.
Proposed Federal MBTA Incidental Take Legislation and Regulations— On October 4, 2021, U.S. Fish and Wildlife Service, (FWS)or FWS, issued the final MBTA rule, effective December 3, 2021, restoring the MBTA to prohibit the incidental take of migratory birds. In 2021, FWS issued an advance notice of proposed rulemaking (ANPR) advising that it intends to gather information necessary to develop proposed regulations to authorize the incidental take of migratory birds under prescribed conditions and prepare a draft environmental review pursuant to the National Environmental Policy Act.Act, or NEPA. Throughout 2022, FWS sought comments on the content of the proposed rule. The Company worked with renewable industry groupsIn November 2023, FWS withdrew the draft MBTA permit program rule from the Office of Information and Regulatory Affairs to provideaddress technical comments on the proposed rule development.received from agencies. FWS is currently considering how to drafthas indicated that the rule and expectsis likely to issuebe published in the noticesecond half of proposed rulemaking early in 2023.2024.
Proposed Federal Eagle Incidental Take Permit Proposed Rule — On September 30, 2022, FWS published in the Federal Register a draft rule revising the eagle incidental take permit program. Comments on the revised rule were due by the end of November 2022, but a 30-day extension was issued withcontinued to be accepted during 2023. The final comments due by December 30, 2022. The Company worked with renewable industry groups to provide comments on the proposed rule in advance of the cut-off date. FWS is currently reviewing comments and it is not clear how the comments will be incorporated into the final rule or how FWS will structure the revisions to the eagle incidental take permit program.rule was published in the Federal Register on February 12, 2024 and will become effective on April 13, 2024. The final rule is anticipated to provide an expedited eagle take permitting and lower cost path for many wind facilities.
Local California Air District Rules — Air districts, including the Bay Area Air Quality Management District and the San Diego Air Pollution Control District, have recently proposed and/or updated new source review permitting requirements, including to incorporate public notice requirements as well as updates to its respective rules to amend, as applicable, Best Available Control Technology criteria for stationary emissions sources including gas turbines, Toxic Air Contaminant Health Risk reporting and general reporting requirements.programs addressing toxic air contaminants. Rulemaking in the Los Angeles Air Basin, as regulated by South Coast Air Quality Management District, or SCAQMD, continues to update command-and-control regulations that limit NOx emissions for stationary sources in preparation for sunsetting SCAQMD’s Regional Clean Air Market, or RECLAIM, NOx cap and trade program in the next few years. The Company’s conventional generation plants meet the district’s existing and proposed amendments to command-and-control regulations. Proposed updates to local California Air District Rules are not expected to affect the operations nor compliance of the Company’s conventional generation plants.
Amendments to NEPA — On June 3, 2023, President Biden signed the Fiscal Responsibility Act of 2023, or FRA, into law, which includes amendments to the NEPA, aimed at streamlining the environmental review process. Following the FRA, on July 31, 2023, the White House Council on Environmental Quality, or CEQ, published a proposed rule, the Bipartisan Permitting Reform Implementation Rule, which seeks to revise, update and modernize the existing regulations under the NEPA and includes provisions regarding robust public involvement, environmental justice, and climate change, or the Phase 2 Proposed Rule. The public comment period on the Phase 2 Proposed Rule closed on September 29, 2023 and the final rule has not yet been published.
Customers
The Company sells its electricity and environmental attributes, including RECs, primarily to local utilities under contractual arrangements. During the year ended December 31, 2022,2023, the Company derived approximately 33%24% of its consolidated revenue from Southern California Edison, or SCE, and approximately 25%17% of its consolidated revenue from PG&E.
Human Capital
As of December 31, 2022,2023, the Company had 5861 employees. The Company also depends upon personnel of CEG for the provision of asset management, administration and O&M services.
The Company focuses on attracting, developing and retaining a team of highly talented and motivated employees. The Company regularly conducts assessments of its compensation and benefit practices and pay levels to help ensure that staff members are compensated equitably and competitively. The Company devotes extensive resources to staff development and training, including tuition assistance for career-enhancing academic and professional programs. Employee performance is measured in part based on goals that are aligned with the Company’s annual objectives. The Company recognizes that its success is based on the talents and dedication of those it employs, and the Company is highly invested in their success.
The Company is committed to maintaining a workplace that acknowledges, encourages, and values diversity and inclusion and provides its employees with unconscious bias training. The Company believes that individual differences, experiences, and strengths enrich the culture and fabric of its organization. Having employees with backgrounds and orientations that reflect a variety of viewpoints and experiences also helps the Company to better understand the needs of its customers and the communities in which it operates.
By leveraging the multitude of backgrounds and perspectives of its team and developing ongoing relationships with diverse vendors, the Company achieves a collective strength that enhances the workplace and makes the Company a better business partner to its customers and others with a stake in the Company’s success.
The Company also has an Equity, Partnership & Inclusion Council, or EPIC. As part of its commitment, the Company provides education on topics related to diversity, inclusion and equity. The Company identified three areas of focus: Our People,People; Our Product &Brand, Customers and Community; and Our Purchasing. With the involvement of its employees, EPIC is advancing efforts in each of these areas to identify and implement opportunities for the Company to address equity, partnership and inclusion issues in its business activities.
Our People focuses on education and training; diversity, equity and inclusion policies and recruitment strategies; community and industry partnerships; and maintaining high employee engagement and retention.
Our ProductBrand, Customers & CustomersCommunity focuses on pursuing opportunities that provide more equitable access to renewable energyenergy; broadening participation for low-to-moderate income customers;small to medium enterprises; supporting the diversity, equity and inclusion goals of the Company’s offtakers; building robust community engagement relationships; and meaningfully representing that work in the external market.
Our Purchasing focuses on establishing a non-discriminatory practices standard for the Company’s suppliers, diverse vendor sourcing and benchmarking.
In addition to the personnel of CEG, the Company relies on other third-party service providers in the daily operations of its conventional facilities and certain renewable facilities.
Environmental, Social and Governance (ESG)
The Company is committed to engaging with its stakeholders on environmental, social and governance, or ESG, matters in a proactive, holistic and integrated manner. The Company strives to provide recent, credible and comparable data to ESG agencies while engaging institutional investors and investor advocacy organizations around ESG issues. The Company’s Corporate Governance, Conflictsissues and Nominating Committeeto comply with ESG disclosure requirements. Clearway, Inc.’s Board of Directors reviews developing trends and emerging ESG matters as well as the Company’s strategies, activities, policies and communications regarding ESG matters, and makes recommendations to the Company’s Board of Directors regardingreviews and considers potential actions by the Company.Company could take regarding ESG matters.
Aligned with the Company’s strategy of owning and acquiring environmentally-sound power generation and energy storage assets, the Company has issued $2.1 billion of corporate green bonds under a green bond framework that applies the net proceeds to finance or refinance, in part or in full, new and existing projects and assets meeting certain criteria focused on the supply of energy from renewable resources, including solar energy and wind energy. The Company’s projects and alignment of its Green Bond Principles (2018) are reviewed by Sustainalytics, an outside consultant with recognized expertise in ESG research and analysis.
As discussed in greater detail above, the Company, through EPIC, has focused its diversity, equity and inclusion efforts in three areas: Our People,People; Our Product &Brand, Customers and Community; and Our Purchasing – through its launch of EPIC.Purchasing. With the involvement of the Company’s employees, EPIC is advancing efforts in each of these areas to identify and implement opportunities for the Company to address equity, partnership and inclusion issues in its business activities.
Available Information
The Company’s annual reports on Form 10-K, quarterly reports on Form 10-Q, current reports on Form 8-K, and amendments to those reports filed or furnished pursuant to section 13(a) or 15(d) of the Exchange Act are available free of charge through the SEC’s website, www.sec.gov, and through the “Investor Relations” section of Clearway, Inc.’s website, www.clearwayenergy.com, as soon as reasonably practicable after they are electronically filed with, or furnished to, the SEC. The Company also routinely posts press releases, presentations, webcasts, and other information regarding the Company on Clearway, Inc.’s website. The information posted on Clearway, Inc.’s website is not a part of this report.
Item 1A — Risk Factors
Summary of Risk Factors
The Company’s business is subject to numerous risks and uncertainties, discussed in more detail in the following section. These risks include, among others, the following key risks:
Risks Related to the Company’s Business
•The Company’s ability to grow and make acquisitions through cash on hand is limited.
•The Company may not be able to effectively identify or consummate any future acquisitions on favorable terms, or at all, and future acquisitions may not be accretive as a result of incorrect assumptions in the Company’s evaluation of such acquisitions, unforeseen consequences or other external events beyond the Company’s control.
•Counterparties to the Company’s offtake agreements may not fulfill their obligations and, as the contracts expire, the Company may not be able to replace them with agreements on similar terms in light of increasing competition in the markets in which the Company operates.
•The Company’s ability to effectively consummate future acquisitions will also depend on the Company’s ability to arrange the required or desired financing for acquisitions.
•The Company’s indebtedness could adversely affect its ability to raise additional capital to fund the Company’s operations or pay distributions.
•The operation of electric generation facilities depends on suitable meteorological conditions and involves significant risks and hazards customary to the power industry that could have a material adverse effect on the Company’s business, financial condition, results of operations and cash flows. These facilities may operate without long-term power sales agreements.
•Maintenance, expansion and refurbishment of electric generation facilities involve significant risks that could result in unplanned power outages or reduced output.
•Supplier and/or customer concentration at certain of the Company’s facilities may expose the Company to significant financial credit or performance risks.
•The Company currently owns, and in the future may acquire, certain assets in which the Company has limited control over management decisions and its interests in such assets may be subject to transfer or other related restrictions.
•The Company’s assets areCompany is exposed to risks inherent in the use of interest rate swaps and theenergy-related financial instruments. The Company may be exposed to additional risks in the future if it utilizes other derivative instruments.
•The Company does not own all of the land on which its power generation and energy storage assets are located, which could result in disruption to its operations. The Company’s use and enjoyment of real property rights for its projects may be adversely affected by the rights of lienholders and leaseholders that are superior to those of the grantors of those real property rights to the Company.
•The Company’s businesses are subject to physical, market and economic risks relating to potential effects of climate change and public and governmental initiatives to address climate change.
•Risks that are beyond the Company’s control, including but not limited to acts of terrorism or related acts of war, natural disaster,disasters, severe weather, changes in weather patterns, flooding, pandemics (such as the COVID-19 pandemic), inflation, supply chain disruptions, hostile cyber intrusions or other catastrophic events, could have a material adverse effect on the business, financial condition, results of operations and cash flows.
•The operation of the Company’s businesses is subject to cyber-based security and integrity risk.
•The Company relies on electric distribution and transmission facilities that it does not own or control and that are subject to transmission constraints within a number of the Company’s regions.If these facilities fail to provide the Company with adequate transmission capacity, it may be restricted in its ability to deliver electric power to its customers and may either incur additional costs or forego revenues.
•The Company’s costs, results of operations, financial condition and cash flows could be adversely impacted by the disruption of the fuel supplies necessary to generate power at its conventional generation facilities.
•The Company depends on key personnel and its ability to attract and retain additional skilled management and other personnel, the loss of any of which could have a material adverse effect on the Company’s financial condition and results of operations.
•The Company may potentially be adversely affected by emerging technologies that may over time impact capacity markets and the energy industry overall.
Risks Related to the Company’s Relationship with GIP, TotalEnergies and CEG
•GIP and TotalEnergies, through their equal ownership of CEG, the Company’s controlling shareholder of Clearway, Inc., exercise substantial influence over the Company. The Company is highly dependent on GIP, TotalEnergies and CEG.
•CEG controls the Company and has the ability to designate a majority of the members of Clearway, Inc.’s Board.
•The Company may not be able to consummate future acquisitions from CEG.
•The Company may be unable to terminate the CEG Master Services Agreement, in certain circumstances.
•If CEG terminates the CEG Master Services Agreement or defaults in the performance of its obligations under the agreement, the Company may be unable to contract with a substitute service provider on similar terms, or at all.
Risks Related to Regulation
•The Company’s business is subject to restrictions resulting from environmental, health and safety laws and regulations.
•The electric generation business is subject to substantial governmental regulation, including environmental laws, and may be adversely affected by changes in laws or regulations, as well as liability under, or any future inability to comply with, existing or future regulations or other legal requirements.
•The Company’s business is subject to complex and evolving U.S. laws and regulations regarding privacy and data protection.
•Government regulations providing incentives for renewable power generation could change at any time and such changes may negatively impact the Company’s growth strategy.
Risks Related to the Company’s Business
Pursuant to the Company’s cash distribution policy, the Company intends to distribute a significant amount of the CAFD through regular quarterly distributions, and the Company’s ability to grow and make acquisitions through cash on hand is limited.
The Company expects to distribute a significant amount of the CAFD each quarter and to rely primarily upon external financing sources, including the issuance of debt and equity securities and, if applicable, borrowings under the Company’s revolving credit facility to fund acquisitions and growth capital expenditures. The Company may be precluded from pursuing otherwise attractive acquisitions if the projected short-term cash flow from the acquisition or investment is not adequate to service the capital raised to fund the acquisition or investment, after giving effect to the Company’s available cash reserves. The incurrence of bank borrowings or other debt by Clearway Energy Operating LLC or by the Company’s project-level subsidiaries to finance the Company’s growth strategy will result in increased interest expense and the imposition of additional or more restrictive covenants, which, in turn, may impact the cash distributions the Company makes to Clearway, Inc. and CEG.
The Company may not be able to effectively identify or consummate any future acquisitions on favorable terms, or at all, and future acquisitions may not be accretive as a result of incorrect assumptions in the Company’s evaluation of such acquisitions, unforeseen consequences or other external events beyond the Company’s control.
The Company’s business strategy includes growth through the acquisitions of additional generation assets (including through corporate acquisitions). This strategy depends on the Company’s ability to successfully identify and evaluate acquisition opportunities and consummate acquisitions on favorable terms. However, the number of acquisition opportunities is limited. In addition, the Company will compete with other companies for these limited acquisition opportunities, which may increase the Company’s cost of making acquisitions or cause the Company to refrain from making acquisitions at all. Some of the Company’s competitors for acquisitions are much larger than the Company with substantially greater resources. These companies may be able to pay more for acquisitions and may be able to identify, evaluate, bid for and purchase a greater number of assets than the Company’s financial or human resources permit. If the Company is unable to identify and consummate future acquisitions, it will impede the Company’s ability to execute its growth strategy and limit the Company’s ability to increase the amount of distributions paid to holders of Clearway, Inc.’s common stock.
The Company’s ability to acquire future renewable facilities may depend on the viability of renewable assets generally. These assets currently are largely contingent on public policy mechanisms including ITCs, cash grants, loan guarantees, accelerated depreciation, RPS and carbon trading plans. These mechanisms have been implemented at the state and federal levels to support the development of renewable generation, demand-side and smart grid and other clean infrastructure technologies. The availability and continuation of public policy support mechanisms will drive a significant part of the economics and viability of the Company’s growth strategy and expansion into clean energy investments.
The acquisition of companies and assets are subject to substantial risks, including the failure to identify material problems during due diligence (for which the Company may not be indemnified post-closing) and the risk of overpaying for assets (or not making acquisitions on an accretive basis). The integration and consolidation of acquisitions requires substantial human, financial and other resources and, ultimately, the Company’s acquisitions may divert management’s attention from the Company’s existing business concerns, disrupt the Company’s ongoing business or not be successfully integrated. There can be no assurances that any future acquisitions will perform as expected or that the returns from such acquisitions will support the financing utilized to acquire them or maintain them. A failure to achieve the financial returns the Company expects when it acquires generation assets could have a material adverse effect on the Company’s ability to grow its business and make cash distributions to its unit holders. Any failure of the Company’s acquired generation assets to be accretive or difficulty in integrating such acquisition into the Company’s business could have a material adverse effect on the Company’s ability to grow its business and make cash distributions to its unit holders. As a result, the consummation of acquisitions could have a material adverse effect on the Company’s business, financial condition, results of operations, cash flows and ability to pay distributions to its unit holders.
Counterparties to the Company’s offtake agreements may not fulfill their obligations and, as the contracts expire, the Company may not be able to replace them with agreements on similar terms in light of increasing competition in the markets in which the Company operates.
A significant portion of the electric power the Company generates is sold under long-term offtake agreements with public utilities or industrial or commercial end-users, with a weighted average remaining duration, based on CAFD, of approximately 11 years. As of December 31, 2022, the largest customers of the Company’s power generation assets, including assets in which the Company has less than a 100% membership interest, were SCE and PG&E, which represented 33% and 25%, respectively, of total consolidated revenues generated by the Company during the year ended December 31, 2022.
If, for any reason, any of the purchasers of power under these agreements are unable or unwilling to fulfill their related contractual obligations or if they refuse to accept delivery of power delivered thereunder or if they otherwise terminate such agreements prior to the expiration thereof, the Company’s assets, liabilities, business, financial condition, results of operations and cash flows could be materially and adversely affected. Furthermore, to the extent any of the Company’s power purchasers are, or are controlled by, governmental entities, the Company’s facilities may be subject to legislative or other political action that may impair their contractual performance.
The power generation industry is characterized by intense competition and the Company’s electric generation assets encounter competition from utilities, industrial companies and independent power producers, in particular with respect to uncontracted output. In recent years, there has been increasing competition among generators for offtake agreements and this has contributed to a reduction in electricity prices in certain markets characterized by excess supply above designated reserve margins. In light of these market conditions, the Company may not be able to replace an expiring or terminated agreement with an agreement on equivalent terms and conditions, including at prices that permit operation of the related facility on a profitable basis. In addition, the Company believes many of its competitors have well-established relationships with the Company’s current and potential suppliers, lenders and customers, and have extensive knowledge of its target markets. As a result, these competitors may be able to respond more quickly than the Company to evolving industry standards and changing customer requirements. The adoption of more advanced technology could reduce its competitors’ power production costs resulting in their having a lower cost structure than is achievable with the technologies currently employed by the Company and adversely affect its ability to compete for offtake agreement renewals. If the Company is unable to replace an expiring or terminated offtake agreement, the affected facility may temporarily or permanently cease operations. External events, such as a severe economic downturn or force majeure events, could also impair the ability of some counterparties to the Company’s offtake agreements and other customer agreements to pay for energy and/or other products and services received.
The Company’s inability to enter into new or replacement offtake agreements or to compete successfully against current and future competitors in the markets in which the Company operates could have a material adverse effect on the Company’s business, financial condition, results of operations and cash flows.
The Company’s ability to effectively consummate future acquisitions will also depend on the Company’s ability to arrange the required or desired financing for acquisitions.
The Company may not have sufficient availability under the Company’s credit facilities or have access to project-level financing on commercially reasonable terms when acquisition opportunities arise. An inability to obtain the required or desired financing could significantly limit the Company’s ability to consummate future acquisitions and effectuate the Company’s growth strategy. If financing is available, utilization of the Company’s credit facilities or project-level financing for all or a portion of the purchase price of an acquisition could significantly increase the Company’s interest expense, impose additional or more restrictive covenants and reduce CAFD. The Company’s ability to consummate future acquisitions may also depend on the Company’s ability to obtain any required regulatory approvals for such acquisitions.
The Company’s indebtedness could adversely affect its ability to raise additional capital to fund the Company’s operations or pay distributions. It could also expose the Company to the risk of increased interest rates and limit the Company’s ability to react to changes in the economy or the Company’s industry as well as impact the Company’s results of operations, financial condition and cash flows.
As of December 31, 2022, the Company had approximately $6,872 million of total consolidated indebtedness, $4,745 million of which was incurred by the Company’s non-guarantor subsidiaries. In addition, the Company’s share of its unconsolidated affiliates’ total indebtedness and letters of credit outstanding as of December 31, 2022, totaled approximately $325 million and $37 million, respectively (calculated as the Company’s unconsolidated affiliates’ total indebtedness as of such date multiplied by the Company’s percentage membership interest in such assets).
The Company’s substantial debt could have important negative consequences on the Company’s financial condition, including:
•increasing the Company’s vulnerability to general economic and industry conditions;
•requiring a substantial portion of the Company’s cash flow from operations to be dedicated to the payment of principal and interest on the Company’s indebtedness, therefore reducing the Company’s ability to pay distributions to Clearway, Inc. and CEG or to use the Company’s cash flow to fund its operations, capital expenditures and future business opportunities;
•limiting the Company’s ability to enter into long-term power sales or fuel purchases which require credit support;
•limiting the Company’s ability to fund operations or future acquisitions;
•restricting the Company’s ability to make certain distributions to Clearway, Inc. and CEG and the ability of the Company’s subsidiaries to make certain distributions to it, in light of restricted payment and other financial covenants in the Company’s credit facilities and other financing agreements;
•exposing the Company to the risk of increased interest rates because certain of the Company’s borrowings, which may include borrowings under the Company’s revolving credit facility, are at variable rates of interest;
•limiting the Company’s ability to obtain additional financing for working capital including collateral postings, capital expenditures, debt service requirements, acquisitions and general corporate or other purposes; and
•limiting the Company’s ability to adjust to changing market conditions and placing it at a competitive disadvantage compared to the Company’s competitors who have less debt.
The Company’s revolving credit facility contains financial and other restrictive covenants that limit the Company’s ability to return capital to unit holders or otherwise engage in activities that may be in the Company’s long-term best interests. The Company’s inability to satisfy certain financial covenants could prevent the Company from paying cash distributions, and the Company’s failure to comply with those and other covenants could result in an event of default which, if not cured or waived, may entitle the related lenders to demand repayment or enforce their security interests, which could have a material adverse effect on the Company’s business, financial condition, results of operations and cash flows. In addition, failure to comply with such covenants may entitle the related lenders to demand repayment and accelerate all such indebtedness.
The agreements governing the Company’s project-level financing contain financial and other restrictive covenants that limit the Company’s project subsidiaries’ ability to make distributions to the Company or otherwise engage in activities that may be in the Company’s long-term best interests. The project-level financing agreements generally prohibit distributions from the project entities to the Company unless certain specific conditions are met, including the satisfaction of certain financial ratios. The Company’s inability to satisfy certain financial covenants may prevent cash distributions by the particular project(s) to it and, the Company’s failure to comply with those and other covenants could result in an event of default which, if not cured or waived may entitle the related lenders to demand repayment or enforce their security interests, which could have a material adverse effect on the Company’s business, results of operations and financial condition. In addition, failure to comply with such covenants may entitle the related lenders to demand repayment and accelerate all such indebtedness. If the Company is unable to make distributions from the Company’s project-level subsidiaries, it would likely have a material adverse effect on the Company’s ability to pay distributions to Clearway, Inc. and CEG.
Letter of credit facilities to support project-level contractual obligations generally have a limited term that may require future renewal, at which time the Company or relevant project-level subsidiary will need to satisfy applicable financial ratios and covenants. If the Company is unable to renew the Company’s letters of credit as expected or replace them with letters of credit under different facilities on favorable terms or at all, the Company may experience a material adverse effect on its business, financial condition, results of operations and cash flows. Furthermore, such inability may constitute a default under certain project-level financing arrangements, restrict the ability of the project-level subsidiary to make distributions to it and/or reduce the amount of cash available at such subsidiary to make distributions to the Company.
In addition, the Company’s ability to arrange financing, either at the corporate level or at a non-recourse project-level subsidiary, and the costs of such capital, are dependent on numerous factors, including:
•general economic and capital market conditions;
•credit availability from banks and other financial institutions;
•investor confidence in the Company, its partners, Clearway, Inc. (as the Company’s sole managing member), or GIP and TotalEnergies, through CEG, as Clearway, Inc.’s principal stockholder (on a combined voting basis) and the regional wholesale power markets;
•the Company’s financial performance and the financial performance of the Company subsidiaries;
•the Company’s level of indebtedness and compliance with covenants in debt agreements;
•maintenance of acceptable project credit ratings or credit quality;
•cash flow; and
•provisions of tax and securities laws that may impact raising capital.
The Company may not be successful in obtaining additional capital for these or other reasons. Furthermore, the Company may be unable to refinance or replace project-level financing arrangements or other credit facilities on favorable terms or at all upon the expiration or termination thereof. The Company’s failure, or the failure of any of the Company’s projects, to obtain additional capital or enter into new or replacement financing arrangements when due may constitute a default under such existing indebtedness and may have a material adverse effect on the Company’s business, financial condition, results of operations and cash flows.
Certain of the Company’s long-term bilateral contracts result from state-mandated procurements and could be declared invalid by a court of competent jurisdiction.
A portion of the Company’s revenues are derived from long-term bilateral contracts with utilities that are regulated by their respective states and have been entered into pursuant to certain state programs. Certain long-term contracts that other companies have with state-regulated utilities have been challenged in federal court and have been declared unconstitutional on the grounds that the rate for energy and capacity established by the contracts impermissibly conflicts with the rate for energy and capacity established by FERC pursuant to the FPA. If certain of the Company’s state-mandated agreements with utilities are ever held to be invalid or unenforceable due to the financial conditions or other conditions of such utility, the Company may be unable to replace such contracts, which could have a material adverse effect on the Company’s business, financial condition, results of operations and cash flows.
The generation of electric energy from solar and wind energy sources depends heavily on suitable meteorological conditions.
If solar or wind conditions are unfavorable, the Company’s electricity generation and revenue from renewable generation facilities may be substantially below the Company’s expectations. The electricity produced and revenues generated by a solar or wind energy generation facility is highly dependent on suitable solar or wind conditions, as applicable, and associated weather conditions, which are beyond the Company’s control. Disruption in the generation of solar or wind energy could limit a facility’s ability to generate electricity at its desired level. Should a generation facility fail to perform at the required levels, or other unplanned disruptions occur, the facility may be forced to fulfill an underlying contractual obligation by purchasing electricity at higher prices. In addition, the Company’s facilities may be exposed, based on specific contractual terms, to a locational basis risk resulting from a difference in the price received for generation sold at the location where the power is generated and the price paid for generation purchased at the contracted delivery point, which could lead to potential lower revenues in circumstances where the price received is lower than the price that is paid. Furthermore, components of the Company’s systems, such as solar panels and inverters, could be damaged by severe weather, such as wildfires, hailstorms, lightning, tornadoes or freezing temperatures and other winter weather conditions. In addition, replacement and spare parts for key components may be difficult or costly to acquire or may be unavailable. Unfavorable weather and atmospheric conditions could impair the effectiveness of the Company’s assets or reduce their output beneath their rated capacity or require shutdown of key equipment, impeding operation of the Company’s renewable assets. For example, in February 2021, the Company’s wind projects in Texas were unable to operate and experienced outages for a few days as a result of the extreme winter weather conditions. In addition, climate change may have the long-term effect of changing wind patterns at the Company’s projects. Changing wind patterns could cause changes in expected electricity generation. These events could also degrade equipment or components and the interconnection and transmission facilities’ lives or maintenance costs.
Although the Company bases its investment decisions with respect to each renewable generation facility on the findings of related wind and solar studies conducted on-site prior to construction or based on historical conditions at existing facilities, actual climatic conditions at a facility site, particularly wind conditions, may not conform to the findings of these studies and may be affected by variations in weather patterns, including any potential impact of climate change. Therefore, the Company’s solar and wind energy facilities may not meet anticipated production levels or the rated capacity of the Company’s generation assets, which could adversely affect the Company’s business, financial condition, results of operations and cash flows.
Operation of electric generation facilities involves significant risks and hazards customary to the power industry that could have a material adverse effect on the Company’s business, financial condition, results of operations and cash flows.
The ongoing operation of the Company’s facilities involves risks that include the breakdown or failure of equipment or processes or performance below expected levels of output or efficiency due to wear and tear, latent defect, design error or operator error or force majeure events, among other things. The Company’s facilities are subject to the risks inherent with power generation facilities, including, but not limited to, degradation of equipment in excess of the Company’s expectations, system failures and outages, which could impair the ability of the facilities to meet the Company’s performance expectations. Operation of the Company’s facilities also involves risks that the Company will be unable to transport its products to its customers in an efficient manner due to a lack of transmission capacity. Unplanned outages of generating units, including extensions of scheduled outages due to mechanical failures or other problems, occur from time to time and are an inherent risk of the business. Unplanned outages typically increase operation and maintenance expenses, capital expenditures and may reduce revenues as a result of selling fewer MWh or require the Company to incur significant costs as a result of obtaining replacement power from third parties in the open market to satisfy forward power sales obligations. The Company’s inability to operate its electric generation assets efficiently, manage capital expenditures and costs and generate earnings and cash flow from the Company’s asset-based businesses could have a material adverse effect on the Company’s business, financial condition, results of operations and cash flows. While the Company maintains insurance, obtains warranties from vendors and obligates contractors to meet certain performance levels, the proceeds of such insurance, warranties or performance guarantees may not cover the Company’s lost revenues, increased expenses or liquidated damages payments should it experience equipment breakdown or non-performance by contractors or vendors. The Company maintains an amount of insurance protection that it considers adequate but cannot provide any assurance that the Company’s insurance will be sufficient or effective under all circumstances and against all hazards or liabilities to which the Company may be subject. Furthermore, the Company’s insurance coverage is subject to deductibles, caps, exclusions and other limitations. A loss for which the Company is not fully insured (which may include a significant judgment against any facility or facility operator) could have a material adverse effect on the Company’s business, financial condition, results of operations or cash flows. Further, due to rising insurance costs and changes in the insurance markets, the Company cannot provide any assurance that its insurance coverage will continue to be available at all or at rates or on terms similar to those presently available. Any losses not covered by insurance could have a material adverse effect on the Company’s business, financial condition, results of operations and cash flows.
Power generation involves hazardous activities, including acquiring, transporting and unloading fuel, operating large pieces of rotating equipment and delivering electricity to transmission and distribution systems. In addition to natural risks such as earthquake, flood, lightning, hurricane and wind, other hazards, such as fire, explosion, structural collapse and machinery failure are inherent risks in the Company’s operations. These and other hazards can cause significant personal injury or loss of life, severe damage to and destruction of property, plant and equipment and contamination of, or damage to, the environment and suspension of operations. To the extent an event was not covered by insurance policies, such incidents could subject the Company to substantial liabilities arising from emergency response, environmental cleanup and restoration costs, claims made by neighboring landowners and other third parties for personal injury and property damage, and fines or penalties for any related violations of environmental laws or regulations.
The Company’s facilities may operate, wholly or partially, without long-term power sales agreements.
The Company’s facilities may operate without long-term power sales agreements for some or all of their generating capacity and output and therefore be exposed to market fluctuations. Without the benefit of long-term power sales agreements for the facilities, the Company cannot be sure that it will be able to sell any or all of the power generated by the facilities at commercially attractive rates or that the facilities will be able to operate profitably. This could lead to less predictable revenues, future impairments of the Company’s property, plant and equipment or to the closing of certain of its facilities, resulting in economic losses and liabilities, which could have a material adverse effect on the Company’s results of operations, financial condition or cash flows.
Maintenance, expansion and refurbishment of electric generation facilities involve significant risks that could result in unplanned power outages or reduced output.
The Company’s facilities may require periodic upgrading and improvement. Any unexpected operational or mechanical failure, including failure associated with breakdowns and forced outages, could reduce the Company’s facilities’ generating capacity below expected levels, reducing the Company’s revenues and jeopardizing the Company’s ability to pay distributions to Clearway, Inc. and CEG at expected levels or at all. Degradation of the performance of the Company’s solar facilities above levels provided for in the related offtake agreements may also reduce the Company’s revenues. Unanticipated capital expenditures associated with maintaining, upgrading or repairing the Company’s facilities may also reduce profitability.
If the Company makes any major modifications to its conventional power generation facilities, it may be required to install the best available control technology or to achieve the lowest achievable emission rates as such terms are defined under the new source review provisions of the Clean Air Act in the future. Any such modifications could likely result in substantial additional capital expenditures. The Company may also choose to repower, refurbish or upgrade its facilities based on its assessment that such activity will provide adequate financial returns. Such facilities require time for development and capital expenditures before commencement of commercial operations, and key assumptions underpinning a decision to make such an investment may prove incorrect, including assumptions regarding construction costs, timing, available financing and future fuel and power prices. These events could have a material adverse effect on the Company’s business, financial condition, results of operations and cash flows.
Supplier and/or customer concentration at certain of the Company’s facilities may expose the Company to significant financial credit or performance risks.
The Company often relies on a single contracted supplier or a small number of suppliers for the provision of fuel, transportation of fuel, equipment, technology and/or other services required for the operation of certain facilities. In addition, certain of the Company’s suppliers provide long-term warranties with respect to the performance of their products or services. If any of these suppliers cannot perform under their agreements with the Company, or satisfy their related warranty obligations, the Company will need to utilize the marketplace to provide or repair these products and services. There can be no assurance that the marketplace can provide these products and services as, when and where required. The Company may not be able to enter into replacement agreements on favorable terms or at all. If the Company is unable to enter into replacement agreements to provide for fuel, equipment, technology and other required services, it would seek to purchase the related goods or services at market prices, exposing the Company to market price volatility and the risk that fuel and transportation may not be available during certain periods at any price. The Company may also be required to make significant capital contributions to remove, replace or redesign equipment that cannot be supported or maintained by replacement suppliers, which could have a material adverse effect on the business, financial condition, results of operations, credit support terms and cash flows.
In addition, potential or existing customers at the Company’s district energy centers and combined heat and power plants, or the Energy Centers, may opt for on-site systems in lieu of using the Company’s Energy Centers, either due to corporate policies regarding the allocation of capital, unique situations where an on-site system might in fact prove more efficient, because of previously committed capital in systems that are already on-site, or otherwise. At times, the Company relies on a single customer or a few customers to purchase all or a significant portion of a facility’s output, in some cases under long-term agreements that account for a substantial percentage of the anticipated revenue from a given facility.
The failure of any supplier to fulfill its contractual obligations to the Company or the Company’s loss of potential or existing customers could have a material adverse effect on its financial results. Consequently, the financial performance of the Company’s facilities is dependent on the credit quality of, and continued performance by, the Company’s suppliers and vendors and the Company’s ability to solicit and retain customers.
The Company currently owns, and in the future may acquire, certain assets in which the Company has limited control over management decisions and its interests in such assets may be subject to transfer or other related restrictions.
As described in Item 15 — Note 5, Investments Accounted for by the Equity Method and Variable Interest Entities, the Company has limited control over the operation of certain of its assets, because the Company beneficially owns less than a majority of the membership interests in such assets. The Company may seek to acquire additional assets in which it owns less than a majority of the related membership interests in the future. In these investments, the Company will seek to exert a degree of influence with respect to the management and operation of assets in which it owns less than a majority of the membership interests by negotiating to obtain positions on management committees or to receive certain limited governance rights, such as rights to veto significant actions. However, the Company may not always succeed in such negotiations. The Company may be dependent on its co-venturers to operate such assets. The Company’s co-venturers may not have the level of experience, technical expertise, human resources management and other attributes necessary to operate these assets optimally. In addition, conflicts of interest may arise in the future between theCompany and its unit holders, on the one hand, and the Company’s co-venturers, on the other hand, where the Company’s co-venturers’ business interests are inconsistent with the interests of the Company and its unit holders. Further, disagreements or disputes between the Company and its co-venturers could result in litigation, which could increase expenses and potentially limit the time and effort the Company’s officers and directors are able to devote to the business.
The approval of co-venturers may also be required for the Company to receive distributions of funds from assets or to sell, pledge, transfer, assign or otherwise convey its interest in such assets, or for the Company to acquire CEG’s interests in such co-ventures as an initial matter. Alternatively, the Company’s co-venturers may have rights of first refusal or rights of first offer in the event of a proposed sale or transfer of the Company’s interests in such assets. These restrictions may limit the price or interest level for interests in such assets, in the event the Company wants to sell such interests.
Furthermore, certain of the Company’s facilities are operated by third-party operators. To the extent that third-party operators do not fulfill their obligations to manage operations of the facilities or are not effective in doing so, the amount of CAFD may be adversely affected.
The Company’s assets are exposed to risks inherent in the use of interest rate swaps and the Company may be exposed to additional risks in the future if it utilizes other derivative instruments.
The Company uses interest rate swaps to manage interest rate risk. As a result, changes in the underlying assumptions or use of alternative valuation methods could affect the reported fair value of these contracts. If the values of these financial contracts change in a manner that the Company does not anticipate, or if a counterparty fails to perform under a contract, it could harm the business, financial condition, results of operations and cash flows.
The Company does not own all of the land on which its power generation assets are located, which could result in disruption to its operations.
The Company does not own all of the land on which its power generation assets are located, and the Company is, therefore, subject to the possibility of less desirable terms and increased costs to retain necessary land use if it does not have valid leases or rights-of-way or if such rights-of-way lapse or terminate. Although the Company has obtained rights to construct and operate these assets pursuant to related lease arrangements, the rights to conduct those activities are subject to certain exceptions, including the term of the lease arrangement. The Company is also at risk of condemnation on land it owns. The loss of these rights, through the Company’s inability to renew right-of-way contracts, condemnation or otherwise, may adversely affect the Company’s ability to operate its generation assets.
The Company’s use and enjoyment of real property rights for its projects may be adversely affected by the rights of lienholders and leaseholders that are superior to those of the grantors of those real property rights to the Company.
Solar and wind projects generally are, and are likely to be, located on land occupied by the project pursuant to long-term easements and leases. The ownership interests in the land subject to these easements and leases may be subject to mortgages securing loans or other liens (such as tax liens) and other easement and lease rights of third parties (such as leases of oil or mineral rights) that were created prior to the project’s easements and leases. As a result, the project’s rights under these easements or leases may be subject, and subordinate, to the rights of those third parties. The Company performs title searches and obtains title insurance to protect itself against these risks. Such measures may, however, be inadequate to protect the Company against all risk of loss of its rights to use the land on which the wind projects are located, which could have a material adverse effect on the Company’s business, financial condition and results of operations.
The Company’s businesses are subject to physical, market and economic risks relating to potential effects of climate change and public and governmental initiatives to address climate change.
Climate change creates uncertainty in weather and other environmental conditions, including temperature and precipitation levels, and thus may affect consumer demand for electricity. For example, deviations from normal weather may reduce demand or availability of electricity and gas distribution services. In addition, the potential physical effects of climate change, such as increased frequency and severity of storms, cloud coverage, precipitation, floods and other climatic events, could disrupt the Company’s operations and supply chain, and cause them to incur significant costs in preparing for or responding to these effects. These or other meteorological changes could lead to increased operating costs, capital expenses or power purchase costs.
Furthermore, governmental, scientific and public concern over the threat of climate change arising from GHG emissions may limit the Company’s access to natural gas or decrease demand for energy generated by the Company’s conventional assets. State, national and foreign governments and agencies continue to evaluate, and in some instances adopt, climate-related legislation and other regulatory initiatives that would restrict GHG emissions. Changes in environmental requirements related to GHG, climate change and alternative energy sources may impact demand for the Company’s services. For example, recently enacted H.R. 5376, commonly known as the Inflation Reduction Act of 2022, or IRA, includes incentives to increase wind and solar electric generation and encourage consumers to use these alternative energy sources. While this could benefit the Company by increasing the demand for the Company’s solar or wind energy, the Company could experience delayed or cancelled projects and/or reduced production and demand for energy generated by the Company’s conventional assets. However, the clean energy incentives included in the IRA or similar state or federal initiatives to incentivize a shift away from fossil fuels could reduce demand for energy generated by fossil fuels, and therefore have an adverse effect on the Company’s natural gas generation business, financial condition and results of operations.
Lastly, companies across all industries are facing increased scrutiny from the public, stakeholders and government agencies related to their environmental, social, and governance (ESG) practices and commitments to address climate change. In recent years, investor advocacy groups, institutional investors, investment funds, and other influential investors have placed increasing importance on ESG practices. Increased focus and activism related to ESG and similar matters may hinder access to capital, as investors may decide to reallocate capital or to not commit capital as a result of their assessment of a company’s ESG practices. While the Company is committed to engaging with its stakeholders on ESG practices in a proactive, holistic and integrated manner, changes in the public or stakeholder sentiment could impact the Company’s ability to fund its conventional assets or decrease the demand for the energy generated by these assets.
Risks that are beyond the Company’s control, including but not limited to acts of terrorism or related acts of war, natural disaster, pandemics(such as the COVID-19 pandemic), inflation, supply chain disruptions, hostile cyber intrusions or other catastrophic events, could have a material adverse effect on the business, financial condition, results of operations and cash flows.
The Company’s generation facilities that were acquired or those that the Company otherwise acquires or constructs and the facilities of third parties on which they rely may be targets of terrorist activities, as well as events occurring in response to or in connection with them, that could cause environmental repercussions and/or result in full or partial disruption of the facilities ability to generate, transmit, transport or distribute electricity or natural gas. Strategic targets, such as energy-related facilities, may be at greater risk of future terrorist activities than other domestic targets. Inflation, disruption in global and domestic supply chains, and other economic conditions could negatively impact the Company’s business in a manner that could adversely affect the Company’s results of operations and financial condition. Hostile cyber intrusions, including those targeting information systems as well as electronic control systems used at the generating plants and for the related distribution systems, could severely disrupt business operations and result in loss of service to customers, as well as create significant expense to repair security breaches or system damage.
Furthermore, certain of the Company’s power generation assets are located in active earthquake zones in California and Arizona, and certain project companies and suppliers conduct their operations in the same region or in other locations that are susceptible to natural disasters. In addition, California and some of the locations where certain suppliers are located, from time to time, have experienced shortages of water, electric power and natural gas. Catastrophic events, such as an earthquake, wildfire, drought, flood, pandemics (such as the COVID-19 pandemic) or localized extended outages of critical utilities or transportation systems, or any critical resource shortages, affecting the Company or its suppliers, could cause a significant interruption in the business, damage or destroy the Company’s facilities or those of its suppliers or the manufacturing equipment or inventory of the Company’s suppliers. The Company has a limited number of highly skilled employees for some of its operations and relies on certain independent contractors and other service providers. If a large proportion of the Company’s employees in those critical positions, or independent contractors or other service providers to the Company or its customers were to be negatively impacted by a catastrophic event at the same time, the Company would rely upon its business continuity plans in an effort to continue operations at its facilities, but there is no certainty that such measures will be sufficient to mitigate the adverse impact to its operations that could result from shortages of highly skilled employees, independent contractors or service providers. Any such terrorist acts, environmental repercussions or disruptions or natural disasters could result in a significant decrease in revenues or significant reconstruction or remediation costs, beyond what could be recovered through insurance policies, which could have a material adverse effect on the business, financial condition, results of operations and cash flows.
The operation of the Company’s businesses is subject to cyber-based security and integrity risk.
Numerous functions affecting the efficient operation of the Company’s businesses depend on the secure and reliable storage, processing and communication of electronic data and the use of sophisticated computer hardware and software systems. The operation of the Company’s generating assets relies on cyber-based technologies and has been the target of disruptive actions. In addition, our business is dependent upon the computer systems of third-party providers to process certain data necessary to conduct our business, including sensitive employee information, credit card transaction information and other sensitive data.
Potential disruptive actions could result from cyber-attack or cyber intrusion, including by computer hackers, foreign governments and cyber terrorists, or otherwise be compromised by unintentional events with respect to the Company or any of its contractors or customers. As a result, operations could be interrupted, property could be damaged and sensitive employee, customer or supplier information could be lost or stolen, causing the Company to incur significant losses of revenues, other substantial liabilities and damages, costs to replace or repair damaged equipment and damage to the Company’s reputation. Our insurance may not fully protect us against such losses. In addition, the Company may experience increased capital and operating costs to implement increased security for its cyber systems and generating assets.
In addition, cyberattacks against us or others in our industry could result in additional regulations, which could lead to increased regulatory compliance costs, insurance coverage cost or capital expenditures. Any failure by us to comply with these additional regulations could result in significant penalties and liability to us. We cannot predict the potential impact to our business or the energy industry resulting from such additional regulations.
The Company relies on electric distribution and transmission facilities that it does not own or control and that are subject to transmission constraints within a number of the Company’s regions. If these facilities fail to provide the Company with adequate transmission capacity, it may be restricted in its ability to deliver electric power to its customers and may either incur additional costs or forego revenues.
The Company depends on electric distribution and transmission facilities owned and operated by others to deliver the wholesale power it will sell from its electric generation assets to its customers. A failure or delay in the operation or development of these facilities or a significant increase in the cost of the development of such facilities could result in lost revenues. Such failures or delays could limit the amount of power the Company’s operating facilities deliver or delay the completion of the Company’s construction projects. Additionally, such failures, delays or increased costs could have a material adverse effect on the business, financial condition and results of operations. If a region’s power transmission infrastructure is inadequate, the Company’s recovery of wholesale costs and profits may be limited. If restrictive transmission price regulation is imposed, the transmission companies may not have a sufficient incentive to invest in expansion of transmission infrastructure. The Company also cannot predict whether distribution or transmission facilities will be expanded in specific markets to accommodate competitive access to those markets. In addition, certain of the Company’s operating facilities’ generation of electricity may be curtailed without compensation due to transmission limitations or limitations on the electricity grid’s ability to accommodate intermittent and other electricity generating sources, reducing the Company’s revenues and impairing its ability to capitalize fully on a particular facility’s generating potential. Such curtailments could have a material adverse effect on the business, financial condition, results of operations and cash flows. Furthermore, economic congestion on transmission networks in certain of the markets in which the Company operates may occur and the Company may be deemed responsible for congestion costs. If the Company were liable for such congestion costs, its financial results could be adversely affected.
The Company’s costs, results of operations, financial condition and cash flows could be adversely impacted by the disruption of the fuel supplies necessary to generate power at its conventional power generation facilities.
Delivery of fossil fuels to fuel the Company’s conventional generation facilities is dependent upon the infrastructure (including natural gas pipelines) available to serve each such generation facility as well as upon the continuing financial viability of contractual counterparties. As a result, the Company is subject to the risks of disruptions or curtailments in the production of power at these generation facilities if a counterparty fails to perform or if there is a disruption in the fuel delivery infrastructure.
The Company depends on key personnel and its ability to attract and retain additional skilled management and other personnel, the loss of any of which could have a material adverse effect on the Company’s financial condition and results of operations.
The Company believes its current operations and future success depend largely on the continued services of key personnel that it employs. Although the Company currently has access to the resources of CEG, the loss of key personnel employed by the Company or CEG could have a material adverse effect on the Company’s financial condition and results of operations.
The Company may potentially be adversely affected by emerging technologies that may over time impact capacity markets and the energy industry overall.
Research and development activities are ongoing in the Company’s industry to provide alternative and more efficient technologies to produce power, including wind, photovoltaic (solar) cells, hydrogen, energy storage, and improvements in traditional technologies and equipment, such as more efficient gas turbines. Advances in these or other technologies could reduce the costs of power production to a level below what the Company has currently forecasted, which could adversely affect its cash flows, results of operations or competitive position.
Some emerging technologies, such as distributed renewable energy technologies, broad consumer adoption of electric vehicles and energy storage devices, could affect the price of energy. These emerging technologies may affect the financial viability of utility counterparties and could have significant impacts on market prices, which could ultimately have a material adverse effect on the Company’s financial condition, results of operations and cash flows.
Risks Related to the Company’s Relationships with GIP, TotalEnergies and CEG
GIP and TotalEnergies, through their equal ownership of CEG, exercise substantial influence over the Company through CEG’s position as controlling shareholder of Clearway, Inc. The Company is highly dependent on GIP, TotalEnergies and CEG.
CEG owns all of Clearway, Inc.’s outstanding Class B and Class D common stock. Clearway, Inc.’s outstanding Class B and Class D common stock is entitled to one vote per share and 1/100th of a vote per share, respectively. As a result of its ownership of Clearway, Inc.’s Class B and Class D common stock, CEG owns 54.91% of the combined voting power of Clearway, Inc.’s common stock as of December 31, 2022. CEG is equally owned by GIP and TotalEnergies. Clearway, Inc., through its holdings of Class A units and Class C units, owned a 57.88% economic interest in the Company as of December 31, 2022. Additionally, GIP and TotalEnergies, through CEG’s holdings of Class B units and Class D units, owned the remaining 42.12% economic interest in the Company as of December 31, 2022. As a result of this ownership, GIP and TotalEnergies have a substantial influence on the Company’s affairs.
Furthermore, the Company depends on certain services provided by or under the direction of CEG under the CEG Master Services Agreement, including numerous processes related to the Company’s internal control over financial reporting. CEG personnel and support staff that provide services to the Company under the CEG Master Services Agreement are not required to, and the Company does not expect that they will, have as their primary responsibility the management and administration of the Company or to act exclusively for the Company and the CEG Master Services Agreement does not require any specific individuals to be provided by CEG. Under the CEG Master Services Agreement, CEG has the discretion to determine which of its employees perform assignments required to be provided to the Company. Any failure to effectively manage the Company’s processes related to internal controls over financial reporting, operations or to implement its strategy could have a material adverse effect on the business, financial condition, results of operations and cash flows. The CEG Master Services Agreement will continue in perpetuity, until terminated in accordance with its terms.
The Company also depends upon CEG and third parties for the provision of management, administration, O&M and certain other services at certain of the Company’s facilities. Any failure by CEG or third parties to perform its requirements under these arrangements or the failure by the Company to identify and contract with replacement service providers, if required, could adversely affect the operation of the Company’s facilities and have a material adverse effect on the business, financial condition, results of operations and cash flows.
CEG controls the Company and has the ability to designate a majority of the members of Clearway, Inc.’s Board.
Due to CEG’s approximate 54.91% combined voting power in Clearway, Inc., the ability of other holders of Clearway, Inc.’s Class A and Class C common stock to exercise control over the corporate governance of the Company is limited. GIP and TotalEnergies, through their equal ownership of CEG, have a substantial influence on Clearway, Inc.’s affairs, and CEG’s voting power constitutes a large percentage of any quorum of Clearway, Inc.’s stockholders voting on any matter requiring the approval of Clearway, Inc.’s stockholders. Such matters include the election of directors, the adoption of amendments to Clearway, Inc.’s amended and restated certificate of incorporation and fourth amended and restated bylaws and approval of mergers or sale of all or substantially all of its assets. This concentration of ownership may also have the effect of delaying or preventing a change in control of Clearway, Inc. or discouraging others from making tender offers for Clearway, Inc.’s shares. In addition, GIP, TotalEnergies and their respective affiliates have the right to elect all of Clearway, Inc.’s directors. It is possible that the interests of GIP, TotalEnergies and their respective affiliates may in certain circumstances differ from the interests of the Company or other holders of Clearway, Inc.’s Class A and Class C common stock.
The Company may not be able to consummate future acquisitions from CEG.
The Company’s ability to grow through acquisitions depends, in part, on CEG’s ability to identify and present the Company with acquisition opportunities. Although CEG has agreed, pursuant to the CEG ROFO Agreement, to grant the Company a right of first offer with respect to certain power generation assets that CEG may elect to sell in the future, CEG is under no obligation to sell any such power generation assets or to accept any related offers from the Company. In addition, CEG has not agreed to commit any minimum level of dedicated resources for the pursuit of renewable power-related acquisitions. There are a number of factors which could materially and adversely impact the extent to which suitable acquisition opportunities are made available from CEG, including that the same professionals within CEG’s organization that are involved in acquisitions that are suitable for the Company have responsibilities within CEG’s broader asset management business, which may include sourcing acquisition opportunities for CEG. Limits on the availability of such individuals will likewise result in a limitation on the availability of acquisition opportunities for the Company. In making these determinations, CEG may be influenced by factors that result in a misalignment with the Company’s interests or conflict of interest.
The Company may be unable to terminate the CEG Master Services Agreement, in certain circumstances.
The CEG Master Services Agreement provides that the Company may terminate the agreement upon 30 days prior written notice to CEG upon the occurrence of any of the following: (i) CEG defaults in the performance or observance of any material term, condition or covenant contained therein in a manner that results in material harm to the Company and the default continues unremedied for a period of 30 days after written notice thereof is given to CEG; (ii) CEG engages in any act of fraud, misappropriation of funds or embezzlement that results in material harm to the Company; (iii) CEG is grossly negligent in the performance of its duties under the agreement and such negligence results in material harm to the Company; or (iv) upon the happening of certain events relating to the bankruptcy or insolvency of CEG. Furthermore, if the Company requests an amendment to the scope of services provided by CEG under the CEG Master Services Agreement and is not able to agree with CEG as to a change to the service fee resulting from a change in the scope of services within 180 days of the request, the Company will be able to terminate the agreement upon 30 days prior notice to CEG. The Company will not be able to terminate the agreement for any other reason, including if CEG experiences a change of control, and the agreement continues in perpetuity, until terminated in accordance with its terms. If CEG’s performance does not meet the expectations of investors, and the Company is unable to terminate the CEG Master Services Agreement, the market price of the Class A and Class C common stock could suffer.
If CEG terminates the CEG Master Services Agreement or defaults in the performance of its obligations under the agreement, the Company may be unable to contract with a substitute service provider on similar terms, or at all.
The Company relies on CEG to provide certain services under the CEG Master Services Agreement. The CEG Master Services Agreement provides that CEG may terminate the agreement upon 180 days prior written notice of termination to the Company if the Company defaults in the performance or observance of any material term, condition or covenant contained in the agreement in a manner that results in material harm and the default continues unremedied for a period of 30 days after written notice of the breach is given. If CEG terminates the Management Services Agreement or defaults in the performance of its obligations under the agreement, the Company may be unable to contract with CEG or a substitute service provider on similar terms or at all, and the costs of substituting service providers may be substantial. In addition, in light of CEG’s familiarity with the Company’s assets, a substitute service provider may not be able to provide the same level of service due to lack of pre-existing synergies.
The liability of CEG is limited under the Company’s arrangements with it and the Company has agreed to indemnify CEG against claims that it may face in connection with such arrangements, which may lead CEG to assume greater risks when making decisions relating to the Company than it otherwise might if acting solely for its own account.
Under the CEG Master Services Agreement, CEG does not assume any responsibility other than to provide or arrange for the provision of the services described in the CEG Master Services Agreement in good faith. In addition, under the CEG Master Services Agreement, the liability of CEG and its affiliates is limited to the fullest extent permitted by law to conduct involving bad faith, fraud, willful misconduct or gross negligence or, in the case of a criminal matter, action that was known to have been unlawful. In addition, the Company has agreed to indemnify CEG to the fullest extent permitted by law from and against any claims, liabilities, losses, damages, costs or expenses incurred by an indemnified person or threatened in connection with the Company’s operations, investments and activities or in respect of or arising from the CEG Master Services Agreement or the services provided by CEG, except to the extent that the claims, liabilities, losses, damages, costs or expenses are determined to have resulted from the conduct in respect of which such persons have liability as described above. These protections may result in CEG tolerating greater risks when making decisions than otherwise might be the case, including when determining whether to use leverage in connection with acquisitions. The indemnification arrangements to which CEG is a party may also give rise to legal claims for indemnification that are adverse to the Company and its unit holders.
Certain of the Company’s PPAs and project-level financing arrangements include provisions that would permit the counterparty to terminate the contract or accelerate maturity in the event GIP, TotalEnergies or their respective affiliates cease to control or own, directly or indirectly, a majority of the voting power of the Company.
Certain of the Company’s PPAs and project-level financing arrangements contain change in control provisions that provide the counterparty with a termination right or the ability to accelerate maturity in the event of a change of control of the Company without the counterparty’s consent. These provisions are triggered in the event GIP, TotalEnergies or their respective affiliates cease to own, directly or indirectly, capital stock representing more than 50% of the voting power of the Company’s capital stock outstanding on such date, or, in some cases, if GIP, TotalEnergies or their respective affiliates cease to be the majority owner, directly or indirectly, of the applicable project subsidiary. As a result, if GIP, TotalEnergies or their respective affiliates cease to control, or in some cases, own a majority of the voting power of the Company, the counterparties could terminate such contracts or accelerate the maturity of such financing arrangements. The termination of any of the Company’s PPAs or the acceleration of the maturity of any of the Company’s project-level financing could have a material adverse effect on the Company’s business, financial condition, results of operations and cash flow.
Risks Related to Regulation
•The Company’s business is subject to restrictions resulting from environmental, health and safety laws and regulations.
•The electric generation business is subject to substantial governmental regulation, including environmental laws, and may be adversely affected by changes in laws or regulations, as well as liability under, or any future inability to comply with, existing or future regulations or other legal requirements.
•The Company’s business is subject to complex and evolving U.S. laws and regulations regarding privacy and data protection.
•Government regulations providing incentives for renewable power generation could change at any time and such changes may negatively impact the Company’s growth strategy.
•The Company’s ability to comply with tax laws and policies may depend on its contractual arrangements and information provided by third parties and may require significant resources.
Risks Related to the Company’s Business
Pursuant to the Company’s cash distribution policy, the Company intends to distribute a significant amount of the CAFD through regular quarterly distributions, and the Company’s ability to grow and make acquisitions through cash on hand is limited.
The Company expects to distribute a significant amount of the CAFD each quarter and to rely primarily upon external financing sources, including the issuance of debt and equity securities and, if applicable, borrowings under the Company’s revolving credit facility to fund acquisitions and growth capital expenditures. The Company may be precluded from pursuing otherwise attractive acquisitions if the projected short-term cash flow from the acquisition or investment is not adequate to service the capital raised to fund the acquisition or investment, after giving effect to the Company’s available cash reserves. The incurrence of bank borrowings or other debt by Clearway Energy Operating LLC or by the Company’s project-level subsidiaries to finance the Company’s growth strategy will result in increased interest expense and the imposition of additional or more restrictive covenants, which, in turn, may impact the cash distributions the Company makes to Clearway, Inc. and CEG.
The Company may not be able to effectively identify or consummate any future acquisitions on favorable terms, or at all, and future acquisitions may not be accretive as a result of incorrect assumptions in the Company’s evaluation of such acquisitions, unforeseen consequences or other external events beyond the Company’s control.
The Company’s business strategy includes growth through the acquisitions of additional generation assets (including through corporate acquisitions). This strategy depends on the Company’s ability to successfully identify and evaluate acquisition opportunities and consummate acquisitions on favorable terms. However, the number of acquisition opportunities is limited. In addition, the Company will compete with other companies for these limited acquisition opportunities, which may increase the Company’s cost of making acquisitions or cause the Company to refrain from making acquisitions at all. Some of the Company’s competitors for acquisitions are much larger than the Company with substantially greater resources. These companies may be able to pay more for acquisitions and may be able to identify, evaluate, bid for and purchase a greater number of assets than the Company’s financial or human resources permit. If the Company is unable to identify and consummate future acquisitions, it will impede the Company’s ability to execute its growth strategy and limit the Company’s ability to increase the amount of distributions paid to Clearway, Inc. and CEG.
The Company’s ability to acquire future renewable facilities may depend on the viability of renewable assets generally. These assets currently are largely contingent on public policy mechanisms including ITCs, cash grants, loan guarantees, accelerated depreciation, RPS and carbon trading plans. These mechanisms have been implemented at the state and federal levels to support the development of renewable generation, demand-side and smart grid and other clean infrastructure technologies. The availability and continuation of public policy support mechanisms will drive a significant part of the economics and viability of the Company’s growth strategy and expansion into clean energy investments.
The acquisition of companies and assets are subject to substantial risks, including the failure to identify material problems during due diligence (for which the Company may not be indemnified post-closing) and the risk of overpaying for assets (or not making acquisitions on an accretive basis). The integration and consolidation of acquisitions requires substantial human, financial and other resources and, ultimately, the Company’s acquisitions may divert management’s attention from the Company’s existing business concerns, disrupt the Company’s ongoing business or not be successfully integrated. There can be no assurances that any future acquisitions will perform as expected or that the returns from such acquisitions will support the financing utilized to acquire them or maintain them. A failure to achieve the financial returns the Company expects when it acquires generation assets could have a material adverse effect on the Company’s ability to grow its business and make cash distributions to its unit holders. Any failure of the Company’s acquired generation assets to be accretive or difficulty in integrating such acquisition into the Company’s business could have a material adverse effect on the Company’s ability to grow its business and make cash distributions to its unit holders. As a result, the consummation of acquisitions could have a material adverse effect on the Company’s business, financial condition, results of operations, cash flows and ability to pay distributions to its unit holders.
Counterparties to the Company’s offtake agreements may not fulfill their obligations and, as the contracts expire, the Company may not be able to replace them with agreements on similar terms in light of increasing competition in the markets in which the Company operates.
The majority of the electric power the Company generates is sold under long-term offtake agreements with public utilities or industrial or commercial end-users, with a weighted average remaining duration, based on CAFD, of approximately 10 years. As of December 31, 2023, the largest customers of the Company’s power generation and energy storage assets, including assets in which the Company has less than a 100% membership interest, were SCE and PG&E, which represented 24% and 17%, respectively, of total consolidated revenues generated by the Company during the year ended December 31, 2023.
If, for any reason, any of the purchasers of power under these agreements are unable or unwilling to fulfill their related contractual obligations or if they refuse to accept delivery of power delivered thereunder or if they otherwise terminate such agreements prior to the expiration thereof, the Company’s assets, liabilities, business, financial condition, results of operations and cash flows could be materially and adversely affected. Furthermore, to the extent any of the Company’s power purchasers are, or are controlled by, governmental entities, the Company’s facilities may be subject to legislative or other political action that may impair their contractual performance.
The power generation industry is characterized by intense competition and the Company’s electric generation assets encounter competition from utilities, industrial companies and independent power producers, in particular with respect to uncontracted output. In recent years, there has been increasing competition among generators for offtake agreements and this has contributed to a reduction in electricity prices in certain markets characterized by excess supply above designated reserve margins. In light of these market conditions, the Company may not be able to replace an expiring or terminated agreement with an agreement on equivalent terms and conditions, including at prices that permit operation of the related facility on a profitable basis. In addition, the Company believes many of its competitors have well-established relationships with the Company’s current and potential suppliers, lenders and customers, and have extensive knowledge of its target markets. As a result, these competitors may be able to respond more quickly than the Company to evolving industry standards and changing customer requirements. The adoption of more advanced technology could reduce its competitors’ power production costs resulting in their having a lower cost structure than is achievable with the technologies currently employed by the Company and adversely affect its ability to compete for offtake agreement renewals. If the Company is unable to replace an expiring or terminated offtake agreement, the affected facility may temporarily or permanently cease operations. External events, such as a severe economic downturn or force majeure events, could also impair the ability of some counterparties to the Company’s offtake agreements and other customer agreements to pay for energy and/or other products and services received.
The Company’s inability to enter into new or replacement offtake agreements or to compete successfully against current and future competitors in the markets in which the Company operates could have a material adverse effect on the Company’s business, financial condition, results of operations and cash flows.
The Company’s ability to effectively consummate future acquisitions will also depend on the Company’s ability to arrange the required or desired financing for acquisitions.
The Company may not have sufficient availability under the Company’s credit facilities or have access to project-level financing on commercially reasonable terms when acquisition opportunities arise. An inability to obtain the required or desired financing could significantly limit the Company’s ability to consummate future acquisitions and effectuate the Company’s growth strategy. If financing is available, utilization of the Company’s credit facilities or project-level financing for all or a portion of the purchase price of an acquisition could significantly increase the Company’s interest expense, impose additional or more restrictive covenants and reduce CAFD. The Company’s ability to consummate future acquisitions may also depend on the Company’s ability to obtain any required regulatory approvals for such acquisitions.
The Company’s indebtedness could adversely affect its ability to raise additional capital to fund the Company’s operations or pay distributions. It could also expose the Company to the risk of increased interest rates and limit the Company’s ability to react to changes in the economy or the Company’s industry as well as impact the Company’s results of operations, financial condition and cash flows.
As of December 31, 2023, the Company had approximately $8.10 billion of total consolidated indebtedness, $5.97 billion of which was incurred by the Company’s non-guarantor subsidiaries. In addition, the Company’s share of its unconsolidated affiliates’ total indebtedness and letters of credit outstanding as of December 31, 2023, totaled approximately $303 million and $37 million, respectively (calculated as the Company’s unconsolidated affiliates’ total indebtedness as of such date multiplied by the Company’s percentage membership interest in such assets).
The Company’s substantial debt could have important negative consequences on the Company’s financial condition, including:
•increasing the Company’s vulnerability to general economic and industry conditions;
•requiring a substantial portion of the Company’s cash flow from operations to be dedicated to the payment of principal and interest on the Company’s indebtedness, therefore reducing the Company’s ability to pay distributions to Clearway, Inc. and CEG or to use the Company’s cash flow to fund its operations, capital expenditures and future business opportunities;
•limiting the Company’s ability to enter into long-term power sales or fuel purchases which require credit support;
•limiting the Company’s ability to fund operations or future acquisitions;
•restricting the Company’s ability to make certain distributions to Clearway, Inc. and CEG and the ability of the Company’s subsidiaries to make certain distributions to it, in light of restricted payment and other financial covenants in the Company’s credit facilities and other financing agreements;
•exposing the Company to the risk of increased interest rates because certain of the Company’s borrowings, which may include borrowings under the Company’s revolving credit facility, are at variable rates of interest;
•limiting the Company’s ability to obtain additional financing for working capital including collateral postings, capital expenditures, debt service requirements, acquisitions and general corporate or other purposes; and
•limiting the Company’s ability to adjust to changing market conditions and placing it at a competitive disadvantage compared to the Company’s competitors who have less debt.
The Company’s revolving credit facility contains financial and other restrictive covenants that limit the Company’s ability to return capital to unit holders or otherwise engage in activities that may be in the Company’s long-term best interests. The Company’s inability to satisfy certain financial covenants could prevent the Company from paying cash distributions, and the Company’s failure to comply with those and other covenants could result in an event of default which, if not cured or waived, may entitle the related lenders to demand repayment or enforce their security interests, which could have a material adverse effect on the Company’s business, financial condition, results of operations and cash flows. In addition, failure to comply with such covenants may entitle the related lenders to demand repayment and accelerate all such indebtedness.
The agreements governing the Company’s project-level financing contain financial and other restrictive covenants that limit the Company’s project subsidiaries’ ability to make distributions to the Company or otherwise engage in activities that may be in the Company’s long-term best interests. The project-level financing agreements generally prohibit distributions from the project entities to the Company unless certain specific conditions are met, including the satisfaction of certain financial ratios. The Company’s inability to satisfy certain financial covenants may prevent cash distributions by the particular project(s) to it and, the Company’s failure to comply with those and other covenants could result in an event of default which, if not cured or waived may entitle the related lenders to demand repayment or enforce their security interests, which could have a material adverse effect on the Company’s business, results of operations and financial condition. In addition, failure to comply with such covenants may entitle the related lenders to demand repayment and accelerate all such indebtedness. If the Company is unable to make distributions from the Company’s project-level subsidiaries, it would likely have a material adverse effect on the Company’s ability to pay distributions to Clearway, Inc. and CEG.
Letter of credit facilities to support project-level contractual obligations generally have a limited term that may require future renewal, at which time the Company or relevant project-level subsidiary will need to satisfy applicable financial ratios and covenants. If the Company is unable to renew the Company’s letters of credit as expected or replace them with letters of credit under different facilities on favorable terms or at all, the Company may experience a material adverse effect on its business, financial condition, results of operations and cash flows. Furthermore, such inability may constitute a default under certain project-level financing arrangements, restrict the ability of the project-level subsidiary to make distributions to it and/or reduce the amount of cash available at such subsidiary to make distributions to the Company.
In addition, the Company’s ability to arrange financing, either at the corporate level or at a non-recourse project-level subsidiary, and the costs of such capital, are dependent on numerous factors, including:
•general economic and capital market conditions;
•credit availability from banks and other financial institutions;
•investor confidence in the Company, its partners, Clearway, Inc. (as the Company’s sole managing member), or GIP and TotalEnergies, through CEG, as Clearway, Inc.’s principal stockholder (on a combined voting basis) and the regional wholesale power markets;
•the Company’s financial performance and the financial performance of the Company subsidiaries;
•the Company’s level of indebtedness and compliance with covenants in debt agreements;
•maintenance of acceptable project credit ratings or credit quality;
•cash flow; and
•provisions of tax and securities laws that may impact raising capital.
The Company may not be successful in obtaining additional capital for these or other reasons. Furthermore, the Company may be unable to refinance or replace project-level financing arrangements or other credit facilities on favorable terms or at all upon the expiration or termination thereof. The Company’s failure, or the failure of any of the Company’s projects, to obtain additional capital or enter into new or replacement financing arrangements when due may constitute a default under such existing indebtedness and may have a material adverse effect on the Company’s business, financial condition, results of operations and cash flows.
Certain of the Company’s long-term bilateral contracts result from state-mandated procurements and could be declared invalid by a court of competent jurisdiction.
A portion of the Company’s revenues are derived from long-term bilateral contracts with utilities that are regulated by their respective states and have been entered into pursuant to certain state programs. Certain long-term contracts that other companies have with state-regulated utilities have been challenged in federal court and have been declared unconstitutional on the grounds that the rate for energy and capacity established by the contracts impermissibly conflicts with the rate for energy and capacity established by FERC pursuant to the FPA. If certain of the Company’s state-mandated agreements with utilities are ever held to be invalid or unenforceable due to the financial conditions or other conditions of such utility, the Company may be unable to replace such contracts, which could have a material adverse effect on the Company’s business, financial condition, results of operations and cash flows.
The generation of electric energy from solar and wind energy sources depends heavily on suitable meteorological conditions.
If solar or wind conditions are unfavorable, the Company’s electricity generation and revenue from renewable generation facilities may be substantially below the Company’s expectations. The electricity produced and revenues generated by a solar or wind energy generation facility is highly dependent on suitable solar or wind conditions, as applicable, and associated weather conditions, which are beyond the Company’s control. Disruption in the generation of solar or wind energy could limit a facility’s ability to generate electricity at its desired level. Should a generation facility fail to perform at the required levels, or other unplanned disruptions occur, the facility may be forced to fulfill an underlying contractual obligation by purchasing electricity at higher prices. In addition, the Company’s facilities may be exposed, based on specific contractual terms, to a locational basis risk resulting from a difference in the price received for generation sold at the location where the power is generated and the price paid for generation purchased at the contracted delivery point, which could lead to potential lower revenues in circumstances where the price received is lower than the price that is paid. Furthermore, components of the Company’s systems, such as solar panels and inverters, could be damaged by severe weather, such as wildfires, hailstorms, lightning, tornadoes or freezing temperatures and other winter weather conditions. Unfavorable weather and atmospheric conditions could impair the effectiveness of the Company’s assets or reduce their output beneath their rated capacity or require shutdown of key equipment, impeding operation of the Company’s renewable assets. For example, in February 2021, the Company’s wind projects in Texas were unable to operate and experienced outages for a few days as a result of the extreme winter weather conditions. In addition, climate change may have the long-term effect of changing wind patterns at the Company’s projects. Changing wind patterns could cause changes in expected electricity generation. These events could also degrade equipment or components and the interconnection and transmission facilities’ lives or maintenance costs.
Although the Company bases its investment decisions with respect to each renewable generation facility on the findings of related wind and solar studies conducted on-site prior to construction or based on historical conditions at existing facilities, actual climatic conditions at a facility site, particularly wind conditions, may not conform to the findings of these studies and may be affected by variations in weather patterns, including any potential impact of climate change. Therefore, the Company’s solar and wind energy facilities may not meet anticipated production levels or the rated capacity of the Company’s generation assets, which could adversely affect the Company’s business, financial condition, results of operations and cash flows.
Operation of electric generation facilities involves significant risks and hazards customary to the power industry that could have a material adverse effect on the Company’s business, financial condition, results of operations and cash flows.
The ongoing operation of the Company’s facilities involves risks that include the breakdown or failure of equipment or processes or performance below expected levels of output or efficiency due to wear and tear, latent defect, design error, operator error or force majeure events, among other things. The Company’s facilities are subject to the risks inherent with power generation facilities, including, but not limited to, degradation of equipment in excess of the Company’s expectations, system failures and outages, which could impair the ability of the facilities to meet the Company’s performance expectations. In addition, replacement and spare parts for key components may be difficult or costly to acquire or may be unavailable. Operation of the Company’s facilities also involves risks that the Company will be unable to transport its products to its customers in an efficient manner due to a lack of transmission capacity. Unplanned outages of generating units, including extensions of scheduled outages due to mechanical failures or other problems, occur from time to time and are an inherent risk of the business. Unplanned outages typically increase operation and maintenance expenses, capital expenditures and may reduce revenues as a result of selling fewer MWh or require the Company to incur significant costs as a result of obtaining substitute RA or replacement power from third parties in the open market to satisfy forward power sales obligations. The Company’s inability to operate its electric generation assets efficiently, manage capital expenditures and costs and generate earnings and cash flow from the Company’s asset-based businesses could have a material adverse effect on the Company’s business, financial condition, results of operations and cash flows. While the Company maintains insurance, obtains warranties from vendors and obligates contractors to meet certain performance levels, the proceeds of such insurance, warranties or performance guarantees may not cover the Company’s lost revenues, increased expenses or liquidated damages payments should it experience equipment breakdown or non-performance by contractors or vendors. The Company maintains an amount of insurance protection that it considers adequate but cannot provide any assurance that the Company’s insurance will be sufficient or effective under all circumstances and against all hazards or liabilities to which the Company may be subject. Furthermore, the Company’s insurance coverage is subject to deductibles, caps, exclusions and other limitations. A loss for which the Company is not fully insured (which may include a significant judgment against any facility or facility operator) could have a material adverse effect on the Company’s business, financial condition, results of operations or cash flows. Further, due to rising insurance costs and changes in the insurance markets, the Company cannot provide any assurance that its insurance coverage will continue to be available at all or at rates or on terms similar to those presently available. Any losses not covered by insurance could have a material adverse effect on the Company’s business, financial condition, results of operations and cash flows.
Power generation involves hazardous activities, including acquiring, transporting and unloading fuel, operating large pieces of rotating equipment and delivering electricity to transmission and distribution systems. In addition to natural risks such as earthquakes, floods, lightning, hurricanes and strong wind, other hazards, such as fire, explosion, structural collapse and machinery failure are inherent risks in the Company’s operations. These and other hazards can cause significant personal injury or loss of life, severe damage to and destruction of property, plant and equipment and contamination of, or damage to, the environment and suspension of operations. To the extent an event was not covered by insurance policies, such incidents could subject the Company to substantial liabilities arising from emergency response, environmental cleanup and restoration costs, claims made by neighboring landowners and other third parties for personal injury and property damage, and fines or penalties for any related violations of environmental laws or regulations.
The Company’s facilities may operate, wholly or partially, without long-term power sales agreements.
The Company’s facilities may operate without long-term power sales agreements for some or all of their generating capacity and output and therefore be exposed to market fluctuations. Without the benefit of long-term power sales agreements for the facilities, the Company cannot be sure that it will be able to sell any or all of the power generated by the facilities at economic rates or that the facilities will be able to operate profitably. This could lead to less predictable revenues, future impairments of the Company’s property, plant and equipment or to the closing of certain of its facilities, resulting in economic losses and liabilities, which could have a material adverse effect on the Company’s results of operations, financial condition or cash flows.
Maintenance, expansion and refurbishment of electric generation facilities involve significant risks that could result in unplanned power outages or reduced output.
The Company’s facilities may require periodic upgrading and improvement. Any unexpected operational or mechanical failure, including failure associated with breakdowns and forced outages, could reduce the Company’s facilities’ generating capacity below expected levels, reducing the Company’s revenues and jeopardizing the Company’s ability to pay distributions to Clearway, Inc. and CEG at expected levels or at all. Degradation of the performance of the Company’s solar facilities above levels provided for in the related offtake agreements may also reduce the Company’s revenues. Unanticipated capital expenditures associated with maintaining, upgrading or repairing the Company’s facilities may also reduce profitability.
If the Company makes any major modifications to its conventional power generation facilities, it may be required to install the best available control technology or to achieve the lowest achievable emission rates as such terms are defined under the new source review provisions of the Clean Air Act in the future. Any such modifications could likely result in substantial additional capital expenditures. The Company may also choose to repower, refurbish or upgrade its facilities based on its assessment that such activity will provide adequate financial returns. Such facilities require time for development and capital expenditures before commencement of commercial operations, and key assumptions underpinning a decision to make such an investment may prove incorrect, including assumptions regarding construction costs, timing, available financing and future fuel and power prices. These events could have a material adverse effect on the Company’s business, financial condition, results of operations and cash flows.
Supplier and/or customer concentration at certain of the Company’s facilities may expose the Company to significant financial credit or performance risks.
The Company often relies on a single contracted supplier or a small number of suppliers for the provision of fuel, transportation of fuel, equipment, technology and/or other services required for the operation of certain facilities. In addition, certain of the Company’s suppliers provide long-term warranties with respect to the performance of their products or services. If any of these suppliers cannot perform under their agreements with the Company, or satisfy their related warranty obligations, the Company will need to utilize the marketplace to provide or repair these products and services. There can be no assurance that the marketplace can provide these products and services as, when and where required. The Company may not be able to enter into replacement agreements on favorable terms or at all. If the Company is unable to enter into replacement agreements to provide for fuel, equipment, technology and other required services, it would seek to purchase the related goods or services at market prices, exposing the Company to market price volatility and the risk that fuel and transportation may not be available during certain periods at any price. The Company may also be required to make significant capital contributions to remove, replace or redesign equipment that cannot be supported or maintained by replacement suppliers, which could have a material adverse effect on the business, financial condition, results of operations, credit support terms and cash flows.
The failure of any supplier to fulfill its contractual obligations to the Company or the Company’s loss of potential or existing customers could have a material adverse effect on its financial results. Consequently, the financial performance of the Company’s facilities is dependent on the credit quality of, and continued performance by, the Company’s suppliers and vendors and the Company’s ability to solicit and retain customers.
The Company currently owns, and in the future may acquire, certain assets in which the Company has limited control over management decisions and its interests in such assets may be subject to transfer or other related restrictions.
As described in Item 15 — Note 5, Investments Accounted for by the Equity Method and Variable Interest Entities, the Company has limited control over the operation of certain of its assets, because the Company beneficially owns less than a majority of the membership interests in such assets. The Company may seek to acquire additional assets in which it owns less than a majority of the related membership interests in the future. In these investments, the Company will seek to exert a degree of influence with respect to the management and operation of assets in which it owns less than a majority of the membership interests by negotiating to obtain positions on management committees or to receive certain limited governance rights, such as rights to veto significant actions. However, the Company may not always succeed in such negotiations. The Company may be dependent on its co-venturers to operate such assets. The Company’s co-venturers may not have the level of experience, technical expertise, human resources management and other attributes necessary to operate these assets optimally. In addition, conflicts of interest may arise in the future between theCompany and its unit holders, on the one hand, and the Company’s co-venturers, on the other hand, where the Company’s co-venturers’ business interests are inconsistent with the interests of the Company and its unit holders. Further, disagreements or disputes between the Company and its co-venturers could result in litigation, which could increase expenses and potentially limit the time and effort the Company’s officers and directors are able to devote to the business.
The approval of co-venturers may also be required for the Company to receive distributions of funds from assets or to sell, pledge, transfer, assign or otherwise convey its interest in such assets, or for the Company to acquire CEG’s interests in such co-ventures as an initial matter. Alternatively, the Company’s co-venturers may have rights of first refusal or rights of first offer in the event of a proposed sale or transfer of the Company’s interests in such assets. These restrictions may limit the price or interest level for interests in such assets, in the event the Company wants to sell such interests.
Furthermore, certain of the Company’s facilities are operated by third-party operators. To the extent that third-party operators do not fulfill their obligations to manage operations of the facilities or are not effective in doing so, the amount of CAFD may be adversely affected.
The Company is exposed to risks inherent in the use of interest rate swaps and energy-related financial instruments. The Company may be exposed to additional risks in the future if it utilizes other derivative instruments.
The Company uses interest rate swaps to manage interest rate risk and uses energy-related financial instruments to manage variability in earnings due to fluctuations in market prices. As a result, changes in the underlying assumptions or use of alternative valuation methods could affect the reported fair value of these contracts. If the values of these financial contracts change in a manner that the Company does not anticipate, or if a counterparty fails to perform under a contract, it could harm the business, financial condition, results of operations and cash flows.
The Company does not own all of the land on which its power generation and energy storage assets are located, which could result in disruption to its operations.
The Company does not own all of the land on which its power generation and energy storage assets are located, and the Company is, therefore, subject to the possibility of less desirable terms and increased costs to retain necessary land use if it does not have valid leases or rights-of-way or if such rights-of-way lapse or terminate. Although the Company has obtained rights to construct and operate these assets pursuant to related lease arrangements, the rights to conduct those activities are subject to certain exceptions, including the term of the lease arrangement. The Company is also at risk of condemnation on land it owns. The loss of these rights, through the Company’s inability to renew right-of-way contracts, condemnation or otherwise, may adversely affect the Company’s ability to operate its assets.
The Company’s use and enjoyment of real property rights for its projects may be adversely affected by the rights of lienholders and leaseholders that are superior to those of the grantors of those real property rights to the Company.
Wind, solar and energy storage projects generally are, and are likely to be, located on land occupied by the project pursuant to long-term easements and leases. The ownership interests in the land subject to these easements and leases may be subject to mortgages securing loans or other liens (such as tax liens) and other easement and lease rights of third parties (such as leases of oil or mineral rights) that were created prior to the project’s easements and leases. As a result, the project’s rights under these easements or leases may be subject, and subordinate, to the rights of those third parties. The Company performs title searches and obtains title insurance to protect itself against these risks. Such measures may, however, be inadequate to protect the Company against all risk of loss of its rights to use the land on which the wind projects are located, which could have a material adverse effect on the Company’s business, financial condition and results of operations.
The Company’s businesses are subject to physical, market and economic risks relating to potential effects of climate change and public and governmental initiatives to address climate change.
Climate change creates uncertainty in weather and other environmental conditions, including temperature and precipitation levels, and thus may affect consumer demand for electricity. For example, deviations from normal weather may reduce demand or availability of electricity and gas distribution services. In addition, the potential physical effects of climate change, such as increased frequency and severity of storms, cloud coverage, precipitation, floods and other climatic events, could disrupt the Company’s operations and supply chain, and cause them to incur significant costs in preparing for or responding to these effects. These or other meteorological changes could lead to increased operating costs, capital expenses or power purchase costs.
Furthermore, governmental, scientific and public concern over the threat of climate change arising from GHG emissions may limit the Company’s access to natural gas or decrease demand for energy generated by the Company’s conventional assets. State, national and foreign governments and agencies continue to evaluate, and in some instances adopt, climate-related legislation and other regulatory initiatives that would restrict GHG emissions. Changes in environmental requirements related to GHG, climate change and alternative energy sources may impact demand for the Company’s services. For example, the Inflation Reduction Act of 2022, or IRA, includes incentives to promote the construction of wind and solar electric generation, as well as energy storage, and encourages consumers to use these alternative energy sources. While this could benefit the Company by increasing the demand for the Company’s solar or wind energy, the clean energy incentives included in the IRA or similar state or federal initiatives to incentivize a shift away from fossil fuels could reduce demand for energy generated by fossil fuels, and therefore have an adverse effect on the Company’s natural gas generation business, financial condition and results of operations.
Risks that are beyond the Company’s control, including but not limited to acts of terrorism or related acts of war, natural disasters, severe weather, changes in weather patterns, flooding, pandemics(such as the COVID-19 pandemic), inflation, supply chain disruptions, hostile cyber intrusions or other catastrophic events, could have a material adverse effect on the business, financial condition, results of operations and cash flows.
The Company’s generation facilities that were acquired or those that the Company otherwise acquires or constructs and the facilities of third parties on which they rely may be targets of terrorist activities, as well as events occurring in response to or in connection with them, that could cause environmental repercussions and/or result in full or partial disruption of the facilities ability to generate, transmit, transport or distribute electricity or natural gas. Strategic targets, such as energy-related facilities, may be at greater risk of future terrorist activities than other domestic targets. Inflation, disruption in global and domestic supply chains, and other economic conditions could negatively impact the Company’s business in a manner that could adversely affect the Company’s results of operations and financial condition. Hostile cyber intrusions, including those targeting information systems as well as electronic control systems used at the generating plants and for the related distribution systems, could severely disrupt business operations and result in loss of service to customers, as well as create significant expense to repair security breaches or system damage.
Furthermore, certain of the Company’s power generation and energy storage assets are located in active earthquake zones in California and Arizona, and certain project companies and suppliers conduct their operations in the same region or in other locations that are susceptible to natural disasters. In addition, California and some of the locations where certain suppliers are located, from time to time, have experienced shortages of water, electric power and natural gas. Catastrophic events, such as an earthquake, wildfire, drought, flood, pandemics (such as the COVID-19 pandemic) or localized extended outages of critical utilities or transportation systems, or any critical resource shortages, affecting the Company or its suppliers, could cause a significant interruption in the business, damage or destroy the Company’s facilities or those of its suppliers or the manufacturing equipment or inventory of the Company’s suppliers. The Company has a limited number of highly skilled employees for some of its operations and relies on certain independent contractors and other service providers. If a large proportion of the Company’s employees in those critical positions, or independent contractors or other service providers to the Company or its customers were to be negatively impacted by a catastrophic event at the same time, the Company would rely upon its business continuity plans in an effort to continue operations at its facilities, but there is no certainty that such measures will be sufficient to mitigate the adverse impact to its operations that could result from shortages of highly skilled employees, independent contractors or service providers. Any such terrorist acts, environmental repercussions or disruptions or natural disasters could result in a significant decrease in revenues or significant reconstruction or remediation costs, beyond what could be recovered through insurance policies, which could have a material adverse effect on the business, financial condition, results of operations and cash flows.
The operation of the Company’s businesses is subject to cyber-based security and integrity risk.
Numerous functions affecting the efficient operation of the Company’s businesses depend on the secure and reliable storage, processing and communication of electronic data and the use of sophisticated computer hardware and software systems. The operation of the Company’s generating assets relies on cyber-based technologies and has been the target of disruptive actions. In addition, our business is dependent upon the computer systems of third-party providers to process certain data necessary to conduct our business, including sensitive employee information, credit card transaction information and other sensitive data.
Potential disruptive actions could result from cyber-attack or cyber intrusion, including by computer hackers, foreign governments and cyber terrorists, or otherwise be compromised by unintentional events with respect to the Company or any of its contractors or customers. As a result, operations could be interrupted, property could be damaged and sensitive employee, customer or supplier information could be lost or stolen, causing the Company to incur significant losses of revenues, other substantial liabilities and damages, costs to replace or repair damaged equipment and damage to the Company’s reputation. Our insurance may not fully protect us against such losses. In addition, the Company may experience increased capital and operating costs to implement increased security for its cyber systems and generating assets.
In addition, cyberattacks against us or others in our industry could result in additional regulations, which could lead to increased regulatory compliance costs, insurance coverage cost or capital expenditures. Any failure by us to comply with these additional regulations could result in significant penalties and liability to us. We cannot predict the potential impact to our business or the energy industry resulting from such additional regulations.
The Company relies on electric distribution and transmission facilities that it does not own or control and that are subject to transmission constraints within a number of the Company’s regions. If these facilities fail to provide the Company with adequate transmission capacity, it may be restricted in its ability to deliver electric power to its customers and may either incur additional costs or forego revenues.
The Company depends on electric distribution and transmission facilities owned and operated by others to deliver the wholesale power it will sell from its electric generation assets to its customers. A failure or delay in the operation or development of these facilities or a significant increase in the cost of the development of such facilities could result in lost revenues. Such failures or delays could limit the amount of power the Company’s operating facilities deliver or delay the completion of the Company’s construction projects. Additionally, such failures, delays or increased costs could have a material adverse effect on the business, financial condition and results of operations. If a region’s power transmission infrastructure is inadequate, the Company’s recovery of wholesale costs and profits may be limited. If restrictive transmission price regulation is imposed, the transmission companies may not have a sufficient incentive to invest in expansion of transmission infrastructure. The Company also cannot predict whether distribution or transmission facilities will be expanded in specific markets to accommodate competitive access to those markets. In addition, certain of the Company’s operating facilities’ generation of electricity may be curtailed without compensation due to transmission limitations or limitations on the electricity grid’s ability to accommodate intermittent and other electricity generating sources, reducing the Company’s revenues and impairing its ability to capitalize fully on a particular facility’s generating potential. Such curtailments could have a material adverse effect on the business, financial condition, results of operations and cash flows. Furthermore, economic congestion on transmission networks in certain of the markets in which the Company operates may occur and the Company may be deemed responsible for congestion costs. If the Company were liable for such congestion costs, its financial results could be adversely affected.
The Company’s costs, results of operations, financial condition and cash flows could be adversely impacted by the disruption of the fuel supplies necessary to generate power at its conventional power generation facilities.
Delivery of fossil fuels to fuel the Company’s conventional generation facilities is dependent upon the infrastructure (including natural gas pipelines) available to serve each such generation facility as well as upon the continuing financial viability of contractual counterparties. As a result, the Company is subject to the risks of disruptions or curtailments in the production of power at these generation facilities if a counterparty fails to perform or if there is a disruption in the fuel delivery infrastructure.
The Company depends on key personnel and its ability to attract and retain additional skilled management and other personnel, the loss of any of which could have a material adverse effect on the Company’s financial condition and results of operations.
The Company believes its current operations and future success depend largely on the continued services of key personnel that it employs. Although the Company currently has access to the resources of CEG, the loss of key personnel employed by the Company or CEG could have a material adverse effect on the Company’s financial condition and results of operations.
The Company may potentially be adversely affected by emerging technologies that may over time impact capacity markets and the energy industry overall.
Research and development activities are ongoing in the Company’s industry to provide alternative and more efficient technologies to produce power, including wind, photovoltaic (solar) cells, hydrogen, energy storage, and improvements in traditional technologies and equipment, such as more efficient gas turbines. Advances in these or other technologies could reduce the costs of power production to a level below what the Company has currently forecasted, which could adversely affect its cash flows, results of operations or competitive position.
Some emerging technologies, such as distributed renewable energy technologies, broad consumer adoption of electric vehicles and energy storage devices, could affect the price of energy. These emerging technologies may affect the financial viability of utility counterparties and could have significant impacts on market prices, which could ultimately have a material adverse effect on the Company’s financial condition, results of operations and cash flows.
Risks Related to the Company’s Relationships with GIP, TotalEnergies and CEG
GIP and TotalEnergies, through their equal ownership of CEG, exercise substantial influence over the Company through CEG’s position as controlling shareholder of Clearway, Inc. The Company is highly dependent on CEG.
CEG owns all of Clearway, Inc.’s outstanding Class B and Class D common stock. Clearway, Inc.’s outstanding Class B and Class D common stock is entitled to one vote per share and 1/100th of a vote per share, respectively. As a result of its ownership of Clearway, Inc.’s Class B and Class D common stock, CEG owns 54.91% of the combined voting power of Clearway, Inc.’s common stock as of December 31, 2023. CEG is equally owned by GIP and TotalEnergies. On January 12, 2024, BlackRock entered into a definitive agreement to acquire 100% of the business and assets of GIM, which is the investment manager of the GIP funds that own an interest in CEG. BlackRock has indicated that the transaction is expected to close in the third quarter of 2024, subject to regulatory approvals and other customary closing conditions. Clearway, Inc., through its holdings of Class A units and Class C units, owned a 57.90% economic interest in the Company as of December 31, 2023. Additionally, CEG, through its holdings of Class B units and Class D units, owned the remaining 42.10% economic interest in the Company as of December 31, 2023. As a result of this ownership, CEG has a substantial influence on the Company’s affairs.
Furthermore, the Company depends on certain services provided by or under the direction of CEG under the CEG Master Services Agreement, including numerous processes related to the Company’s internal control over financial reporting. CEG personnel and support staff that provide services to the Company under the CEG Master Services Agreement are not required to, and the Company does not expect that they will, have as their primary responsibility the management and administration of the Company or to act exclusively for the Company and the CEG Master Services Agreement does not require any specific individuals to be provided by CEG. Under the CEG Master Services Agreement, CEG has the discretion to determine which of its employees perform assignments required to be provided to the Company. Any failure to effectively manage the Company’s processes related to internal controls over financial reporting, operations or to implement its strategy could have a material adverse effect on the business, financial condition, results of operations and cash flows. The CEG Master Services Agreement will continue in perpetuity, until terminated in accordance with its terms.
The Company also depends upon CEG and third parties for the provision of management, administration, O&M and certain other services at certain of the Company’s facilities. Any failure by CEG or third parties to perform its requirements under these arrangements or the failure by the Company to identify and contract with replacement service providers, if required, could adversely affect the operation of the Company’s facilities and have a material adverse effect on the business, financial condition, results of operations and cash flows.
CEG controls the Company and has the ability to designate a majority of the members of Clearway, Inc.’s Board.
Due to CEG’s approximate 54.91% combined voting power in Clearway, Inc., the ability of other holders of Clearway, Inc.’s Class A and Class C common stock to exercise control over the corporate governance of the Company is limited. CEG has a substantial influence on Clearway, Inc.’s affairs, and CEG’s voting power constitutes a large percentage of any quorum of Clearway, Inc.’s stockholders voting on any matter requiring the approval of Clearway, Inc.’s stockholders. Such matters include the election of directors, the adoption of amendments to Clearway, Inc.’s amended and restated certificate of incorporation and fourth amended and restated bylaws and approval of mergers or sale of all or substantially all of its assets. This concentration of ownership may also have the effect of delaying or preventing a change in control of Clearway, Inc. or discouraging others from making tender offers for Clearway, Inc.’s shares. In addition, CEG and its affiliates have the right to elect all of Clearway, Inc.’s directors. It is possible that the interests of CEG and its affiliates may in certain circumstances differ from the interests of the Company or other holders of Clearway, Inc.’s Class A and Class C common stock.
The Company may not be able to consummate future acquisitions from CEG.
The Company’s ability to grow through acquisitions depends, in part, on CEG’s ability to identify and present the Company with acquisition opportunities. CEG has not agreed to commit a specific level of dedicated resources for the pursuit of renewable power-related acquisitions. There are a number of factors which could materially and adversely impact the extent to which suitable acquisition opportunities are made available from CEG, including that the same professionals within CEG’s organization that are involved in acquisitions that are suitable for the Company have responsibilities within CEG’s broader asset management business, which may include sourcing acquisition opportunities for CEG. Limits on the availability of such individuals will likewise result in a limitation on the availability of acquisition opportunities for the Company. In making these determinations, CEG may be influenced by factors that result in a misalignment with the Company’s interests or conflict of interest.
The Company may be unable to terminate the CEG Master Services Agreement, in certain circumstances.
The CEG Master Services Agreement provides that the Company may terminate the agreement upon 30 days prior written notice to CEG upon the occurrence of any of the following: (i) CEG defaults in the performance or observance of any material term, condition or covenant contained therein in a manner that results in material harm to the Company and the default continues unremedied for a period of 30 days after written notice thereof is given to CEG; (ii) CEG engages in any act of fraud, misappropriation of funds or embezzlement that results in material harm to the Company; (iii) CEG is grossly negligent in the performance of its duties under the agreement and such negligence results in material harm to the Company; or (iv) upon the happening of certain events relating to the bankruptcy or insolvency of CEG. Furthermore, if the Company requests an amendment to the scope of services provided by CEG under the CEG Master Services Agreement and is not able to agree with CEG as to a change to the service fee resulting from a change in the scope of services within 180 days of the request, the Company will be able to terminate the agreement upon 30 days prior notice to CEG. The Company will not be able to terminate the agreement for any other reason, including if CEG experiences a change of control, and the agreement continues in perpetuity, until terminated in accordance with its terms. If CEG’s performance does not meet the expectations of investors, and the Company is unable to terminate the CEG Master Services Agreement, the market price of the Class A and Class C common stock could suffer.
If CEG terminates the CEG Master Services Agreement or defaults in the performance of its obligations under the agreement, the Company may be unable to contract with a substitute service provider on similar terms, or at all.
The Company relies on CEG to provide certain services under the CEG Master Services Agreement. The CEG Master Services Agreement provides that CEG may terminate the agreement upon 180 days prior written notice of termination to the Company if the Company defaults in the performance or observance of any material term, condition or covenant contained in the agreement in a manner that results in material harm and the default continues unremedied for a period of 30 days after written notice of the breach is given. If CEG terminates the Management Services Agreement or defaults in the performance of its obligations under the agreement, the Company may be unable to contract with CEG or a substitute service provider on similar terms or at all, and the costs of substituting service providers may be substantial. In addition, in light of CEG’s familiarity with the Company’s assets, a substitute service provider may not be able to provide the same level of service due to lack of pre-existing synergies.
The liability of CEG is limited under the Company’s arrangements with it and the Company has agreed to indemnify CEG against claims that it may face in connection with such arrangements, which may lead CEG to assume greater risks when making decisions relating to the Company than it otherwise might if acting solely for its own account.
Under the CEG Master Services Agreement, CEG does not assume any responsibility other than to provide or arrange for the provision of the services described in the CEG Master Services Agreement in good faith. In addition, under the CEG Master Services Agreement, the liability of CEG and its affiliates is limited to the fullest extent permitted by law to conduct involving bad faith, fraud, willful misconduct or gross negligence or, in the case of a criminal matter, action that was known to have been unlawful. In addition, the Company has agreed to indemnify CEG to the fullest extent permitted by law from and against any claims, liabilities, losses, damages, costs or expenses incurred by an indemnified person or threatened in connection with the Company’s operations, investments and activities or in respect of or arising from the CEG Master Services Agreement or the services provided by CEG, except to the extent that the claims, liabilities, losses, damages, costs or expenses are determined to have resulted from the conduct in respect of which such persons have liability as described above. These protections may result in CEG tolerating greater risks when making decisions than otherwise might be the case, including when determining whether to use leverage in connection with acquisitions. The indemnification arrangements to which CEG is a party may also give rise to legal claims for indemnification that are adverse to the Company and its unit holders.
Certain of the Company’s PPAs and project-level financing arrangements include provisions that would permit the counterparty to terminate the contract or accelerate maturity in the event CEG ceases to control or own, directly or indirectly, a majority of the voting power of the Company.
Certain of the Company’s PPAs and project-level financing arrangements contain change in control provisions that provide the counterparty with a termination right or the ability to accelerate maturity in the event of a change of control of the Company without the counterparty’s consent. These provisions are triggered in the event CEG ceases to own, directly or indirectly, capital stock representing more than 50% of the voting power of the Company’s capital stock outstanding on such date, or, in some cases, if CEG ceases to be the majority owner, directly or indirectly, of the applicable project subsidiary. As a result, if CEG ceases to control, or in some cases, own a majority of the voting power of the Company, the counterparties could terminate such contracts or accelerate the maturity of such financing arrangements. The termination of any of the Company’s PPAs or the acceleration of the maturity of any of the Company’s project-level financing could have a material adverse effect on the Company’s business, financial condition, results of operations and cash flow.
Risks Related to Regulation
The Company’s business is subject to restrictions resulting from environmental, health and safety laws and regulations.
The Company is subject to various federal, state and local environmental and health and safety laws and regulations. In addition, the Company may be held primarily or jointly and severally liable for costs relating to the investigation and clean-up of any property where there has been a release or threatened release of a hazardous regulated material as well as other affected properties, regardless of whether the Company knew of or caused the release. In addition to these costs, which are typically not limited by law or regulation and could exceed an affected property’s value, the Company could be liable for certain other costs, including governmental fines and injuries to persons, property or natural resources. Further, some environmental laws provide for the creation of a lien on a contaminated site in favor of the government as security for damages and any costs the government incurs in connection with such contamination and associated clean-up. Although the Company generally requires its operators to undertake to indemnify it for environmental liabilities theythe operators cause, the amount of such liabilities could exceed the financial ability of the operator to indemnify the Company. The presence of contamination or the failure to remediate contamination may adversely affect the Company’s ability to operate the business.
GreenhouseLocal, state, federal and international regulatory bodies have increasingly focused on greenhouse gas (GHG) regulation, which could also increase the cost of electricity generated by fossil fuels and such increases could reduce demand for the power the Company’s conventional assets generate and market. Legislative and regulatory measures to address climate change and GHG emissions are in various phases of discussion or implementation. The EPA regulates GHG emissions from new and modified facilities that are potential major sources of criteria pollutants under the Clean Air Act’s Prevention of Significant Deterioration and Title V programsAct and has adopted regulations that require, among other things, preconstruction and operating permits for certain large stationary sources and the monitoring and reporting of GHGs from certain onshore oil and natural gas production sources on an annual basis. The United States Environmental Protection Agency has proposedfacilities. Further, the EPA recently announced strict new methane emissions regulations for certain oil and natural gas facilities. Thefacilities, and the IRA establishesestablished a charge on excess methane emissions above certain limits from the same facilities.
On the international level, under the Paris Agreement, the U.S. established an economy-wide target of reducing its net GHG emissions by 50-52 percent below 2005 levels by 2030 and achieving net zero GHG emissions economy-wide by no later than 2050. In addition, in 2015,December 2023, the United Nations Climate Change Conference issued a call on parties to the Paris Agreement, including the U.S., Canadato contribute to the transitioning away from fossil fuels, reduction of methane emissions, and increase in renewable energy capacity to achieve net zero emissions by 2050. Many state and local officials have stated their intent to intensify efforts to uphold the U.K. participatedcommitments set forth in the United Nations Conference on Climate Change, which led to the creation of the Paris Agreement. The Paris Agreement, which was signed by the U.S. in April 2016, requires countries to review and “represent a progression” in their intended nationally determined contributions (which set GHG emission reduction goals) every five years beginning in 2020. In November 2020, the U.S. officially withdrew from the Paris Agreement in November 2020. However, on January 20, 2021, President Biden signed an “Acceptance on Behalf of the United States of America” that will allow the U.S. to rejoin the Paris Agreement. The newly signed acceptance, deposited with the United Nations on January 20, reverses the prior withdrawal. The U.S. officially rejoined the Paris Agreement on February 19, 2021.international accord.
The U.S. Congress, along with federal and state agencies, has also considered measures to reduce the emissions of GHGs. Legislation or regulation that restricts carbon emissions could increase the cost of environmental compliance for the Company’s conventional assets by requiring the Company to install new equipment to reduce emissions from larger facilities and/or purchase emission allowances. Climate change and GHG legislation or regulation could also delay or otherwise negatively affect efforts to obtain and maintain permits and other regulatory approvals for the Company’s conventional assets’ existing and new facilities, impose additional monitoring and reporting requirements or adversely affect demand for the natural gas the Company gathers, transports and stores. Conversely, legislation or regulation that sets a priceThe effect on or otherwise restricts carbon emissions could also benefit the Company by increasing demand for solarof any new legislative or wind energy sources. In addition, governmental,regulatory measures will depend on the particular provisions that are ultimately adopted.
Governmental, scientific and public concern over the threat of climate change arising from GHG emissions has resulted in increasing political risks in the U.S, including climate changeUnited States. Companies across all industries are facing increased scrutiny from the public, stakeholders and government agencies related pledges made by the Biden Administration. Shortly after taking office in January 2021, President Biden issued a series of executive orders designedto their environmental, social, and governance, or ESG, practices and commitments to address climate changechange. For example, the SEC proposed enhanced climate-related disclosures in March 2022, which are expected to be finalized in the first half of 2024, and suspend, revise,in September 2023, California passed climate-related disclosure mandates, which are broader than the SEC’s proposed rules. In recent years, investor advocacy groups, institutional investors, investment funds, and other influential investors have placed increasing importance on ESG practices. Increased focus and activism related to ESG and similar matters may hinder access to capital, as investors may decide to reallocate capital or rescind, prior agency actions that are identifiedto not commit capital as conflictinga result of their assessment of a company’s ESG practices. While the Company is committed to engaging with its stakeholders on ESG practices in a proactive, holistic and integrated manner, changes in the Biden Administration’s climate policies. Furthermore, as part of rejoiningpublic or stakeholder sentiment could impact the Paris Agreement, President Biden announced thatCompany’s ability to fund its conventional assets or decrease the United States would commit todemand for the energy generated by these assets. In addition, the additional disclosure requirements involve a 50 to 52 percent reduction from 2005 levels of GHG emissions by 2030 and set the goal of reaching net-zero GHG emissions by 2050. Reentry into the Paris Agreement and President Biden’s executive orders maysignificant recordkeeping requirement, which could result in the development ofneed for additional regulations or changesresources to existing regulations.support compliance. The effect onCompany will also be reliant upon its vendors in providing the Company of any new legislative or regulatory measures will depend on the particular provisions that are ultimately adopted.necessary information for compliance, which may provide additional challenges in meeting compliance requirements.
The electric generation business is subject to substantial governmental regulation and may be adversely affected by changes in laws or regulations, as well as liability under, or any future inability to comply with, existing or future regulations or other legal requirements.
The Company’s electric generation business is subject to extensive U.S. federal, state and local laws and regulations. Compliance with the requirements under these various regulatory regimes may cause the Company to incur significant additional costs, and failure to comply with such requirements could result in the shutdown of the non-complying facility, the imposition of liens, fines, and/or civil or criminal liability. Public utilities under the FPA are required to obtain FERC acceptance of their rate schedules for wholesale sales of electric energy, capacity and ancillary services. Except for generating facilities located in Hawaii or in Texas within the footprint of ERCOT, all of the Company’s generating companies are public utilities under the FPA with market-based rate authority unless exempt from FPA public utility rate regulation. FERC’s orders that grant market-based rate authority to wholesale power sellers reserve the right to revoke or revise that authority if FERC subsequently determines that the seller can exercise market power in transmission or generation, create barriers to entry, or engage in abusive affiliate transactions. In addition, public utilities are subject to FERC reporting requirements that impose administrative burdens and that, if violated, can expose the company to criminal and civil penalties or other risks.
The Company’s market-based sales are subject to certain rules prohibiting manipulative or deceptive conduct, and if any of the Company’s generating companies with market-based rate authority are deemed to have violated those rules, they could be subject to potential disgorgement of profits associated with the violation, penalties, suspension or revocation of market-based rate authority. If such generating companies were to lose their market-based rate authority, such companies would be required to obtain FERC’s acceptance of a cost-of-service rate schedule and could become subject to the significant accounting, record-keeping, and reporting requirements that are imposed on utilities with cost-based rate schedules. This could have a material adverse effect on the rates the Company is able to charge for power from its facilities.
All of the Company’s generating assets are operating either as EWGs as defined under the PUHCA, or as QFs as defined under the PURPA, as amended, and therefore are exempt from certain regulation under the PUHCA and the FPA. If a facility fails to maintain its status as an EWG or a QF or there are legislative or regulatory changes revoking or limiting the exemptions to the PUHCA and/or the FPA, then the Company may be subject to significant accounting, record-keeping, access to books and records and reporting requirements, and failure to comply with such requirements could result in the imposition of penalties and additional compliance obligations.
Substantially all of the Company’s generation assets are also subject to the reliability standards promulgated by the designated Electric Reliability Organization (currently the North American Electric Reliability Corporation, or NERC) and approved by FERC. If the Company fails to comply with the mandatory reliability standards, it could be subject to sanctions, including substantial monetary penalties and increased compliance obligations. The Company will also be affected by legislative and regulatory changes, as well as changes to market design, market rules, tariffs, cost allocations and bidding rules that occur in the existing regional markets operated by RTOs or ISOs, such as PJM. The RTOs/ISOs that oversee most of the wholesale power markets impose, and in the future may continue to impose, mitigation, including price limitations, offer caps, non-performance penalties and other mechanisms to address some of the volatility and the potential exercise of market power in these markets. These types of price limitations and other regulatory mechanisms may have a material adverse effect on the profitability of the Company’s generation facilities acquired in the future that sell energy, capacity and ancillary products into the wholesale power markets. The regulatory environment for electric generation has undergone significant changes in the last several years due to state and federal policies affecting wholesale competition and the creation of incentives for the addition of large amounts of new renewable generation and, in some cases, transmission assets. These changes are ongoing, and the Company cannot predict the future design of the wholesale power markets or the ultimate effect that the changing regulatory environment will have on the Company’s business. In addition, in some of these markets, interested parties have proposed to re-regulate the markets or require divestiture of electric generation assets by asset owners or operators to reduce their market share. Other proposals to re-regulate may be made and legislative or other attention to the electric power market restructuring process may delay or reverse the deregulation process. If competitive restructuring of the electric power markets is reversed, discontinued, or delayed, the Company’s business prospects and financial results could be negatively impacted.
The Company is subject to environmental laws and regulations that impose extensive and increasingly stringent requirements on its operations, as well as potentially substantial liabilities arising out of environmental contamination.
The Company’s assets are subject to numerous and significant federal, state and local laws, including statutes, regulations, guidelines, policies, directives and other requirements governing or relating to, among other things: protection of wildlife, including threatened and endangered species; air emissions; discharges into water; water use; the storage, handling, use, transportation and distribution of dangerous goods and hazardous, residual and other regulated materials, such as chemicals; the prevention of releases of hazardous materials into the environment; the prevention, presence and remediation of hazardous materials in soil and groundwater, both on and offsite; land use and zoning matters; and workers’ health and safety matters. The Company’s facilities could experience incidents, malfunctions and other unplanned events that could result in spills or emissions in excess of permitted levels and result in personal injury, penalties and property damage. Any failure to comply with applicable environmental laws and regulations, including those relating to equipment failures, or obtain required governmental approvals and permits, may result in the assessment of administrative, civil or criminal penalties, imposition of investigatory or remedial activities and, in certain, less common circumstances, issuance of temporary or permanent injunctions, or construction or operation bans or delays. As such, the operation of the Company’s facilities carries an inherent risk of environmental, health and safety liabilities (including potential civil actions, compliance or remediation orders, fines and other penalties), and may result in the assets being involved from time to time in administrative and judicial proceedings relating to such matters. The Company has implemented environmental, health and safety management programs designed to continually improve environmental, health and safety performance. Environmental laws and regulations have generally become more stringent over time. Significant costs may be incurred for capital expenditures under environmental programs to keep the assets compliant with such environmental laws and regulations. If it is not economical to make those expenditures, it may be necessary to retire or mothball facilities or restrict or modify the Company’s operations to comply with more stringent standards. These environmental requirements and liabilities could have a material adverse effect on the business, financial condition, results of operations and cash flows.
The Company’s business is subject to complex and evolving U.S. laws and regulations regarding privacy and data protection (“data protection laws”). Many of these laws and regulations are subject to change and uncertain interpretation, and could result in claims, increased cost of operations, or otherwise harm the Company’s business.
The regulatory environment surrounding data privacy and protection is constantly evolving and can be subject to significant change. New data protection laws pose increasingly complex compliance challenges and potentially elevate the Company’s costs. Complying with varying jurisdictional requirements could increase the costs and complexity of compliance, and violations of applicable data protection laws can result in significant penalties. Any failure, or perceived failure, by the Company to comply with applicable data protection laws could result in proceedings or actions against the Company by governmental entities or others, subject the Company to significant fines, penalties, judgments, and negative publicity, require the Company to change its business practices, increase the costs and complexity of compliance, and adversely affect the Company’s business. As noted above, the Company is also subject to the possibility of cyberattacks, which themselves may result in a violation of these laws. Additionally, if the Company acquires a company that has violated or is not in compliance with applicable data protection laws, the Company may incur significant liabilities and penalties as a result.
Government regulations providing incentives for renewable power generation could change at any time and such changes may negatively impact the Company’s growth strategy.
The Company’s growth strategy depends in part on government policies that support renewable generation and energy storage and enhance the economic viability of owning renewable power generation assets. Renewable power generation assets currently benefit from various federal, state and local governmental incentives such as ITCs, PTCs, loan guarantee programs, RPS programs and accelerated depreciation for tax purposes. These laws, regulations and policies have had a significant impact on the development of renewable power generation projects and they could be changed, reduced or eliminated at any time. These incentives make the development of renewable power generation projects more competitive by providing tax credits or grants and accelerated depreciation for a portion of the development costs, decreasing the costs and risks associated with developing such projects or creating demand for renewable power assets through RPS programs.
The elimination or loss of, or reduction in, such incentives could (i) decrease the attractiveness of renewable power generation projects to developers, including, but not limited to, CEG, which could reduce the Company’s acquisition opportunities, (ii) reduce the Company’s willingness to pursue or develop certain renewable power projects due to higher operating costs or decreased revenues under its PPAs, (iii) cause the market for future renewable energy PPAs to be smaller and the prices for future renewable energy PPAs to be lower and/or (iv) result in increased financing costs and difficulty in obtaining financing on acceptable terms.
Any of the foregoing could have a material adverse effect on the Company’s business, financial condition, results of operations and ability to grow its business and make cash distributions.
Revenue earned by the Company’s GenConn assets is established each year in a rate case; accordingly, the profitability of theseits assets is dependent on regulatory approval.
Revenues related to the GenConn assets are established each year by the Connecticut Public Utilities Regulatory Authority. While such regulatory oversight is generally premised on the recovery of prudently incurred costs and a reasonable rate of return on invested capital, the rates that the CompanyGenConn may charge, or the revenue that the Company may earn through its GenConn investment, which is accounted for under the equity method, with respect to this capacity are subject to authorization of the applicable regulatory authorities. There can be no assurance that such regulatory authorities will consider all of the costs to have been prudently incurred or that the regulatory process by which rates or revenues are determined will always result in rates or revenues that achieve full recovery of costs or an adequate return on the Company’s capital investments. While the Company’sGenConn’s rates and revenues are generally established based on an analysis of costs incurred in a base year, the rates the CompanyGenConn is allowed to charge, and the revenues the CompanyGenConn is authorized to earn, may or may not match the costs at any given time. If the Company’sGenConn’s costs are not adequately recovered through these regulatory processes, it could have a material adverse effect on the Company’s business, financial condition, results of operations and cash flows.
The Company’s ability to comply with tax laws and policies may depend on its contractual arrangements and information provided by third parties and may require significant resources.
The IRA contains stringent compliance, recordkeeping and certification requirements in order to claim tax credits and incentives available. Additionally, in order to avoid possibly losing available credits, the Company must comply with prevailing wage and apprenticeship requirements applicable to projects on which construction began on or after December 31, 2022. The IRA does permit that certain defects in meeting the requirements may be timely cured under certain conditions rather than causing a loss of the tax credits.
Moreover, the documentation required for this compliance will come from third-party vendors, including equipment manufacturers and engineering, procurement and construction contractors and subcontractors as well as the Company’s internal sources. In addition, if there are defects in compliance with the prevailing wages and apprenticeship requirements, the payments to cure such deficiencies will need to be made by these third parties to their employees. The conduct of these third parties can also impact the right to claim tax credits and/or the exposure to penalties if they fail to adequately comply with the tax laws.
While the Company has secured and will continue to attempt to secure the necessary access to the information required to meet its compliance and certification requirements under the tax law and has included and will continue to include in contracts with third parties rights to have third parties make cure payments if necessary, the Company may not be able to control whether appropriate documentation is actually available or provided in a timely manner and/or whether cure actions are taken by a third party in a timely fashion. This may result in the incurrence of penalties and loss of tax credits. It is also possible that the terms negotiated with third parties fail to meet the requirements of tax law either with respect to compliance requirements, documentation or conduct of third-parties. The impact of such noncompliance could materially adversely affect the Company’s business, financial condition and results of operations.
Moreover, the costs and resources required to adequately comply with the requirements of the IRA and to monitor the activities of third parties are still to be determined as the Company puts in place its compliance and documentation program and as guidance from the Treasury in the form of notices and regulations continues to be issued.
CAUTIONARY STATEMENT REGARDING FORWARD-LOOKING INFORMATION
This Annual Report on Form 10-K of Clearway Energy LLC, together with its consolidated subsidiaries, or the Company, includes forward-looking statements within the meaning of Section 27A of the Securities Act of 1933, as amended, or the Securities Act, and Section 21E of the Securities Exchange Act of 1934, as amended, or the Exchange Act. The words “believes,” “projects,” “anticipates,” “plans,” “expects,” “intends,” “estimates” and similar expressions are intended to identify forward-looking statements. These forward-looking statements involve known and unknown risks, uncertainties and other factors that may cause the Company’s actual results, performance and achievements, or industry results, to be materially different from any future results, performance or achievements expressed or implied by such forward-looking statements. These factors, risks and uncertainties include the factors described under Item 1A — Risk Factors and the following:
•The Company’s ability to maintain and grow its quarterly distributions;
•Potential risks related to the Company’s relationships with GIP, TotalEnergiesCEG and CEG;its owners;
•The Company’s ability to successfully identify, evaluate and consummate acquisitions from, and dispositions to, third parties;
•The Company’s ability to acquire assets from CEG;
•The Company’s ability to borrow additional funds and access capital markets, as well as the Company’s substantial indebtedness and the possibility that the Company may incur additional indebtedness going forward;
•Changes in law, including judicial decisions;
•Hazards customary to the power production industry and power generation operations such as fuel and electricity price volatility, unusual weather conditions (including wind and solar conditions), catastrophic weather-related or other damage to facilities, unscheduled generation outages, maintenance or repairs, unanticipated changes to fuel supply costs or availability due to higher demand, shortages, transportation problems or other developments, environmental incidents, or electric transmission or gas pipeline system constraints and the possibility that the Company may not have adequate insurance to cover losses as a result of such hazards;
•The Company’s ability to operate its businesses efficiently, manage maintenance capital expenditures and costs effectively, and generate earnings and cash flows from its asset-based businesses in relation to its debt and other obligations;
•The willingness and ability of counterparties to the Company’s offtake agreements to fulfill their obligations under such agreements;
•The Company’s ability to enter into contracts to sell power and procure fuel on acceptable terms and prices as current offtake agreements expire;prices;
•Government regulation, including compliance with regulatory requirements and changes in market rules, rates, tariffs and environmental laws;
•Operating and financial restrictions placed on the Company that are contained in the project-level debt facilities and other agreements of certain subsidiaries and project-level subsidiaries generally, in the Clearway Energy Operating LLC amended and restated revolving credit facility and in the indentures governing the Senior Notes; and
•Cyber terrorism and inadequate cybersecurity, or the occurrence of a catastrophic loss and the possibility that the Company may not have adequate insurance to cover losses resulting from such hazards or the inability of the Company’s insurers to provide coverage.
Forward-looking statements speak only as of the date they were made, and the Company undertakes no obligation to publicly update or revise any forward-looking statements, whether as a result of new information, future events or otherwise. The foregoing review of factors that could cause the Company’s actual results to differ materially from those contemplated in any forward-looking statements included in this Annual Report on Form 10-K should not be construed as exhaustive.
Item 1B — Unresolved Staff Comments
None.
Item 1C — Cybersecurity
Risk Management and Strategy
The Company recognizes the critical importance of developing, implementing and maintaining robust cybersecurity measures to safeguard information systems and protect the confidentiality, integrity and availability of data.
Managing Material Risks & Integrated Overall Risk Management
The Company has strategically integrated cybersecurity risk management into its broader risk management framework to promote a company-wide culture of cybersecurity risk management. The Company’s risk management team works closely with the IT department to continuously evaluate and address cybersecurity risks in alignment with business objectives and operational needs. In addition, the Company follows the National Institute of Standards and Technology (NIST) 800-53 Cybersecurity Framework.
Engage Third Parties on Risk Management
Recognizing the complexity and evolving nature of cybersecurity threats, the Company engages with a range of external experts, including cybersecurity consultants in evaluating and testing its risk management systems. The Company’s collaboration with these third parties includes regular audits; threat and vulnerability assessments; incident response plan testing; company-wide monitoring of cybersecurity risks; and consultation on security enhancements.
Oversee Third-Party Risk
Due to the risks associated with the engagement of third-party vendors, service providers and business partners, the Company applies stringent processes to manage these risks. Thorough security assessments of all third-party providers with access to internal data and information systems occurs before engagement, as well as ongoing monitoring to ensure compliance with relevant cybersecurity standards. The monitoring includes annual assessments by CEG’s Vice President of Information Technology and its Director of Cybersecurity and assessments on an ongoing basis by the internal cybersecurity team. These services are provided to the Company pursuant to the CEG Master Services Agreement. This approach is designed to mitigate risks related to data breaches or other security incidents originating from third parties.
Risks from Cybersecurity Threats
The Company has not been subject to cybersecurity challenges or incidents that have materially affected, or are reasonably likely to materially affect the Company, its operations or financial standing.
Governance
Board of Directors Oversight
Clearway, Inc.’s Board of Directors has oversight of cybersecurity risks and is well informed with respect to the nature and scope of such risks. The Board of Directors is acutely aware of the critical nature of managing risks associated with cybersecurity threats. The Board has established oversight mechanisms to ensure effective governance in managing risks associated with cybersecurity as they recognize the significance of these risks and threats to operational integrity and stakeholder confidence.
Reporting to Board of Directors
The Vice President of Information Technology and Director of Cybersecurity play a pivotal role in informing Clearway, Inc.’s Board of Directors on cybersecurity risks. They provide briefings to the Board of Directors on a regular basis, with a minimum frequency of once per year. These briefings encompass a broad range of topics, including:
•Current cybersecurity threat landscape and emerging threats;
•Status of ongoing cybersecurity initiatives and strategies;
•Incident reports and learnings from any meaningful cybersecurity events; and
•Compliance status and efforts with regulatory requirements and industry standards.
In addition to scheduled meetings, the Board of Directors of Clearway, Inc., the Vice President of Information Technology and the Director of Cybersecurity maintain an ongoing dialogue regarding emerging cybersecurity risks. Together, they receive updates on significant developments in the cybersecurity domain. The Board of Directors actively participates in strategic decisions related to cybersecurity, offering guidance and approval for major strategic decisions and initiatives. This involvement advances the Company’s overall strategy that cybersecurity considerations are integrated into its broader strategic objectives. The Board of Directors conducts an annual review of the Company’s cybersecurity posture and the effectiveness of its risk management strategies through the information, findings and recommendations from the Company’s internal cybersecurity team as well as third-party audits, penetration tests and incident response plan testing outcomes. This review helps identify areas for improvement and helps align cybersecurity efforts with the overall risk management framework.
Cybersecurity Risk Management Personnel
Primary responsibility for assessing, monitoring and managing cybersecurity risks is overseen by the Vice President of Information Technology and Director of Cybersecurity, whose services are provided to the Company under the CEG Master Services Agreement.
With over 20 years of experience in the field of cybersecurity, the current Vice President of Information Technology brings a wealth of expertise to their role. Their background includes extensive experience in information technology, and their in-depth knowledge and experience are instrumental in developing and executing the Company’s cybersecurity strategies. They oversee the Company’s IT governance programs; test compliance with internal, industry and regulatory standards; remediate known risks; and lead the Company’s employee training program.
The current Director of Cybersecurity has over 30 years of experience in information technology across a variety of industries and compliance programs. The Director of Cybersecurity has been heavily focused on cybersecurity in regulated industries for the past 10 years.
Management’s Role Managing Cybersecurity Risk
The Vice President of Information Technology and Director of Cybersecurity regularly inform the Company’s management of all aspects related to cybersecurity risks and incidents. This ensures that the highest levels of management are kept abreast of the cybersecurity posture and potential risks facing the Company. Furthermore, significant cybersecurity matters and strategic risk management decisions are escalated to Clearway, Inc.’s Board of Directors, ensuring that they have insight and can provide guidance on critical cybersecurity issues.
Monitor Cybersecurity Incidents
The Vice President of Information Technology and Director of Cybersecurity are continually informed about the latest developments in cybersecurity, including emerging threats and innovative risk management techniques. They implement and oversee processes for the regular monitoring of the Company’s information systems. This includes the deployment of advanced security measures and regular system audits to identify potential vulnerabilities. In the event of a cybersecurity incident, the Company is equipped with a defined and practiced incident response plan, which includes retainers from respected third parties. This plan includes immediate actions to mitigate the impact of the incident, long-term strategies for remediation and the prevention of future incidents.
Item 2 — Properties
Listed below are descriptions of the Company’s interests in facilities, operations and/or projects owned or leased that were operating as of December 31, 2022.2023.
| | Capacity | | |
| Rated MW | | Net MW(a) | | Ownership | | PPA Terms |
| | | | Capacity | |
| | | | Rated MW | |
| | | | Rated MW | |
| | | | Rated MW | | | Net MW(a) | | Ownership | | | | | | Long-term Contract Terms |
| Assets | Assets | | Location | | Rated MW | | Net MW(a) | | Ownership | | Fuel | | COD | | Counterparty | | Expiration | Assets | | Location | | | | | Fuel | | COD | | Counterparty | | Expiration |
| Conventional | Conventional | | | | | | | | | | |
| Carlsbad | |
| Carlsbad | |
| Carlsbad | Carlsbad | | Carlsbad, CA | | 527 | | | 527 | | | 100 | % | | Natural Gas | | December 2018 | | San Diego Gas & Electric | | 2038 | | Carlsbad, CA | | 527 | | | 527 | | 527 | | | 100 | | 100 | % | | Natural Gas | | December 2018 | | San Diego Gas & Electric | | 2038 |
| El Segundo | El Segundo | | El Segundo, CA | | 550 | | | 550 | | | 100 | % | | Natural Gas | | August 2013 | | SCE | | 2023 - 2026 | El Segundo | | El Segundo, CA | | 550 | | | 550 | | 550 | | | 100 | | 100 | % | | Natural Gas | | August 2013 | | SCE | | 2026 - 2027 |
| GenConn Devon | GenConn Devon | | Milford, CT | | 190 | | | 95 | | | 50 | % | | Natural Gas/Oil | | June 2010 | | Connecticut Light & Power | | 2040 | GenConn Devon | | Milford, CT | | 190 | | | 95 | | 95 | | | 50 | | 50 | % | | Natural Gas/Oil | | June 2010 | | Connecticut Light & Power | | 2040 |
| GenConn Middletown | GenConn Middletown | | Middletown, CT | | 190 | | | 95 | | | 50 | % | | Natural Gas/Oil | | June 2011 | | Connecticut Light & Power | | 2041 | GenConn Middletown | | Middletown, CT | | 190 | | | 95 | | 95 | | | 50 | | 50 | % | | Natural Gas/Oil | | June 2011 | | Connecticut Light & Power | | 2041 |
| Marsh Landing | Marsh Landing | | Antioch, CA | | 720 | | | 720 | | | 100 | % | | Natural Gas | | May 2013 | | Various | | 2023 - 2030 | Marsh Landing | | Antioch, CA | | 720 | | | 720 | | 720 | | | 100 | | 100 | % | | Natural Gas | | May 2013 | | Various | | 2026 - 2030 |
| Walnut Creek | Walnut Creek | | City of Industry, CA | | 485 | | | 485 | | | 100 | % | | Natural Gas | | May 2013 | | SCE | | 2023 - 2026 | Walnut Creek | | City of Industry, CA | | 485 | | | 485 | | 485 | | | 100 | | 100 | % | | Natural Gas | | May 2013 | | SCE | | 2026 |
| Total Conventional | Total Conventional | | 2,662 | | | 2,472 | | |
| Utility Scale Solar | Utility Scale Solar | |
| Utility Scale Solar | |
| Utility Scale Solar | |
| Agua Caliente | |
| Agua Caliente | |
| Agua Caliente | Agua Caliente | | Dateland, AZ | | 290 | | | 148 | | | 51 | % | | Solar | | June 2014 | | PG&E | | 2039 | | Dateland, AZ | | 290 | | | 148 | | 148 | | | 51 | | 51 | % | | Solar | | June 2014 | | PG&E | | 2039 |
| Alpine | Alpine | | Lancaster, CA | | 66 | | | 66 | | | 100 | % | | Solar | | January 2013 | | PG&E | | 2033 | Alpine | | Lancaster, CA | | 66 | | | 66 | | 66 | | | 100 | | 100 | % | | Solar | | January 2013 | | PG&E | | 2033 |
| Avenal | Avenal | | Avenal, CA | | 45 | | | 23 | | | 50 | % | | Solar | | August 2011 | | PG&E | | 2031 | Avenal | | Avenal, CA | | 45 | | | 23 | | 23 | | | 50 | | 50 | % | | Solar | | August 2011 | | PG&E | | 2031 |
| Avra Valley | Avra Valley | | Pima County, AZ | | 27 | | | 27 | | | 100 | % | | Solar | | December 2012 | | Tucson Electric Power | | 2032 | Avra Valley | | Pima County, AZ | | 27 | | | 27 | | 27 | | | 100 | | 100 | % | | Solar | | December 2012 | | Tucson Electric Power | | 2032 |
| Blythe | Blythe | | Blythe, CA | | 21 | | | 21 | | | 100 | % | | Solar | | December 2009 | | SCE | | 2029 | Blythe | | Blythe, CA | | 21 | | | 21 | | 21 | | | 100 | | 100 | % | | Solar | | December 2009 | | SCE | | 2029 |
| Borrego | Borrego | | Borrego Springs, CA | | 26 | | | 26 | | | 100 | % | | Solar | | February 2013 | | San Diego Gas and Electric | | 2038 | Borrego | | Borrego Springs, CA | | 26 | | | 26 | | 26 | | | 100 | | 100 | % | | Solar | | February 2013 | | San Diego Gas and Electric | | 2038 |
Buckthorn Solar (b) | Buckthorn Solar (b) | | Fort Stockton, TX | | 150 | | | 150 | | | 100 | % | | Solar | | July 2018 | | City of Georgetown, TX | | 2043 | Buckthorn Solar (b) | | Fort Stockton, TX | | 150 | | | 150 | | 150 | | | 100 | | 100 | % | | Solar | | July 2018 | | City of Georgetown, TX | | 2043 |
| CVSR | CVSR | | San Luis Obispo, CA | | 250 | | | 250 | | | 100 | % | | Solar | | October 2013 | | PG&E | | 2038 | CVSR | | San Luis Obispo, CA | | 250 | | | 250 | | 250 | | | 100 | | 100 | % | | Solar | | October 2013 | | PG&E | | 2038 |
Daggett 2 (b) | | Daggett 2 (b) | | San Bernardino, CA | | 182 | | | 46 | | | 25 | % | | Solar | | December 2023 | | Various | | 2038 |
| | | | 131 | |
Daggett 3 (b) | |
Daggett 3 (b) | |
Daggett 3 (b) | | | San Bernardino, CA | | 300 | | | 75 | | | 25 | % | | Solar | | July - November 2023 | | Various | | 2033 - 2038 |
| | | | 149 | |
| Desert Sunlight 250 | |
| Desert Sunlight 250 | |
| Desert Sunlight 250 | Desert Sunlight 250 | | Desert Center, CA | | 250 | | | 63 | | | 25 | % | | Solar | | December 2014 | | SCE | | 2034 | | Desert Center, CA | | 250 | | | 63 | | 63 | | | 25 | | 25 | % | | Solar | | December 2014 | | SCE | | 2034 |
| Desert Sunlight 300 | Desert Sunlight 300 | | Desert Center, CA | | 300 | | | 75 | | | 25 | % | | Solar | | December 2014 | | PG&E | | 2039 | Desert Sunlight 300 | | Desert Center, CA | | 300 | | | 75 | | 75 | | | 25 | | 25 | % | | Solar | | December 2014 | | PG&E | | 2039 |
| Kansas South | Kansas South | | Lemoore, CA | | 20 | | | 20 | | | 100 | % | | Solar | | June 2013 | | PG&E | | 2033 | Kansas South | | Lemoore, CA | | 20 | | | 20 | | 20 | | | 100 | | 100 | % | | Solar | | June 2013 | | PG&E | | 2033 |
Mililani I (b) (c) | | Honolulu, HI | | 39 | | | 20 | | | 50 | % | | Solar | | July 2022 | | Hawaiian Electric Company | | 2042 |
Mililani I (b) | | Mililani I (b) | | Honolulu, HI | | 39 | | | 20 | | | 50 | % | | Solar | | July 2022 | | Hawaiian Electric Company | | 2042 |
| | | | 39 | |
Oahu Solar Projects (b) | |
Oahu Solar Projects (b) | |
Oahu Solar Projects (b) | Oahu Solar Projects (b) | | Oahu, HI | | 61 | | | 61 | | | 100 | % | | Solar | | September 2019 | | Hawaiian Electric Company | | 2041 | | Oahu, HI | | 61 | | | 61 | | 61 | | | 100 | | 100 | % | | Solar | | September 2019 | | Hawaiian Electric Company | | 2041 |
| Roadrunner | Roadrunner | | Santa Teresa, NM | | 20 | | | 20 | | | 100 | % | | Solar | | August 2011 | | El Paso Electric | | 2031 | Roadrunner | | Santa Teresa, NM | | 20 | | | 20 | | 20 | | | 100 | | 100 | % | | Solar | | August 2011 | | El Paso Electric | | 2031 |
Rosamond Central (b) | Rosamond Central (b) | | Rosamond, CA | | 192 | | | 96 | | | 50 | % | | Solar | | December 2020 | | Various | | 2035 - 2047 | Rosamond Central (b) | | Rosamond, CA | | 192 | | | 96 | | 96 | | | 50 | | 50 | % | | Solar | | December 2020 | | Various | | 2035 - 2047 |
| TA High Desert | TA High Desert | | Lancaster, CA | | 20 | | | 20 | | | 100 | % | | Solar | | March 2013 | | SCE | | 2033 | TA High Desert | | Lancaster, CA | | 20 | | | 20 | | 20 | | | 100 | | 100 | % | | Solar | | March 2013 | | SCE | | 2033 |
Texas Solar Nova 1 (b) | | Texas Solar Nova 1 (b) | | Kent County, TX | | 252 | | | 126 | | | 50 | % | | Solar | | December 2023 | | Verizon | | 2042 |
| Utah Solar Portfolio | Utah Solar Portfolio | | Various | | 530 | | | 530 | | | 100 | % | | Solar | | July - September 2016 | | PacifiCorp | | 2036 | Utah Solar Portfolio | | Various | | 530 | | | 530 | | 530 | | | 100 | | 100 | % | | Solar | | July - September 2016 | | PacifiCorp | | 2036 |
Total Utility Scale Solar (d) | | 2,307 | | | 1,616 | | |
| Distributed Solar | |
DGPV Fund Projects (b) | | Various | | 286 | | | 286 | | | 100 | % | | Solar | | September 2015 - March 2019 | | Various | | 2030 - 2044 |
| Solar Power Partners (SPP) Projects | | Various | | 25 | | | 25 | | | 100 | % | | Solar | | June 2008 - June 2012 | | Various | | 2026 - 2037 |
| Other DG Projects | | Various | | 21 | | | 21 | | | 100 | % | | Solar | | December 2010 - October 2015 | | Various | | 2023 - 2039 |
Total Distributed Solar (d) | | 332 | | | 332 | | |
| Wind | |
| Alta I | | Tehachapi, CA | | 150 | | | 150 | | | 100 | % | | Wind | | December 2010 | | SCE | | 2035 |
| Alta II | | Tehachapi, CA | | 150 | | | 150 | | | 100 | % | | Wind | | December 2010 | | SCE | | 2035 |
| Alta III | | Tehachapi, CA | | 150 | | | 150 | | | 100 | % | | Wind | | February 2011 | | SCE | | 2035 |
| Alta IV | | Tehachapi, CA | | 102 | | | 102 | | | 100 | % | | Wind | | March 2011 | | SCE | | 2035 |
| Alta V | | Tehachapi, CA | | 168 | | | 168 | | | 100 | % | | Wind | | April 2011 | | SCE | | 2035 |
Waiawa (b) | | Waiawa (b) | | Honolulu, HI | | 36 | | | 18 | | | 50 | % | | Solar | | January 2023 | | Hawaiian Electric Company | | 2043 |
| | | | 36 | |
| Total Utility Scale Solar | |
| Total Utility Scale Solar | |
| Total Utility Scale Solar | |
| | Capacity | | |
| Rated MW | | Net MW(a) | | Ownership | | PPA Terms |
| | | | Capacity | |
| | | | Rated MW | |
| | | | Rated MW | |
| | | | Rated MW | | | Net MW(a) | | Ownership | | | | | | Long-term Contract Terms |
| Assets | Assets | | Location | | Rated MW | | Net MW(a) | | Ownership | | Fuel | | COD | | Counterparty | | Expiration | Assets | | Location | | | | | Fuel | | COD | | Counterparty | | Expiration |
Alta X (b) | | Tehachapi, CA | | Wind | | February 2014 | | SCE | | 2038 |
Alta XI (b) | | Tehachapi, CA | | 90 | | | 90 | | | 100 | % | | Wind | | February 2014 | | SCE | | 2038 |
| Distributed Solar | |
DGPV Fund Projects (b) | |
DGPV Fund Projects (b) | |
DGPV Fund Projects (b) | | | Various | | 286 | | | 286 | | | 100 | % | | Solar | | September 2015 - March 2019 | | Various | | 2030 - 2044 |
| Solar Power Partners (SPP) Projects | | Solar Power Partners (SPP) Projects | | Various | | 25 | | | 25 | | | 100 | % | | Solar | | June 2008 - June 2012 | | Various | | 2024 - 2037 |
| Other DG Projects | | Other DG Projects | | Various | | 21 | | | 21 | | | 100 | % | | Solar | | December 2010 - October 2015 | | Various | | 2025 - 2039 |
| Total Distributed Solar | |
| Wind | |
| Wind | |
| Wind | |
| Alta I | |
| Alta I | |
| Alta I | | | Tehachapi, CA | | 150 | | | 150 | | | 100 | % | | Wind | | December 2010 | | SCE | | 2035 |
| Alta II | | Alta II | | Tehachapi, CA | | 150 | | | 150 | | | 100 | % | | Wind | | December 2010 | | SCE | | 2035 |
| Alta III | | Alta III | | Tehachapi, CA | | 150 | | | 150 | | | 100 | % | | Wind | | February 2011 | | SCE | | 2035 |
| Alta IV | | Alta IV | | Tehachapi, CA | | 102 | | | 102 | | | 100 | % | | Wind | | March 2011 | | SCE | | 2035 |
| Alta V | | Alta V | | Tehachapi, CA | | 168 | | | 168 | | | 100 | % | | Wind | | April 2011 | | SCE | | 2035 |
| Alta X | | Alta X | | Tehachapi, CA | | 137 | | | 137 | | | 100 | % | | Wind | | February 2014 | | SCE | | 2038 |
| Alta XI | | Alta XI | | Tehachapi, CA | | 90 | | | 90 | | | 100 | % | | Wind | | February 2014 | | SCE | | 2038 |
Black Rock (b) | Black Rock (b) | | Mineral and Grant Counties, WV | | 115 | | | 58 | | | 50 | % | | Wind | | December 2021 | | Toyota and AEP | | 2036 | Black Rock (b) | | Mineral and Grant Counties, WV | | 115 | | | 58 | | 58 | | | 50 | | 50 | % | | Wind | | December 2021 | | Toyota and AEP | | 2036 |
| Broken Bow | | Broken Bow | | Custer County, NE | | 80 | | | 80 | | | 100 | % | | Wind | | December 2012 | | Nebraska Public Power District | | 2032 |
| Buffalo Bear | Buffalo Bear | | Buffalo, OK | | 19 | | | 19 | | | 100 | % | | Wind | | December 2008 | | Western Farmers Electric Co-operative | | 2033 | Buffalo Bear | | Buffalo, OK | | 19 | | | 19 | | 19 | | | 100 | | 100 | % | | Wind | | December 2008 | | Western Farmers Electric Co-operative | | 2033 |
| Capistrano Wind Portfolio | | Various | | 413 | | | 413 | | | 100 | % | | Wind | | 2008-2012 | | Various | | 2030 - 2033 |
| Cedro Hill | | Cedro Hill | | Webb County, TX | | 150 | | | 150 | | | 100 | % | | Wind | | November 2010 | | CPS Energy | | 2030 |
| Crofton Bluffs | | Crofton Bluffs | | Knox County, NE | | 42 | | | 42 | | | 100 | % | | Wind | | November 2012 | | Nebraska Public Power District | | 2032 |
Elbow Creek (b) | Elbow Creek (b) | | Howard County, TX | | 122 | | | 122 | | | 100 | % | | Wind | | December 2008 | | Various | | 2029 | Elbow Creek (b) | | Howard County, TX | | 122 | | | 122 | | 122 | | | 100 | | 100 | % | | Wind | | November 2019 | | Various | | 2029 |
| Elkhorn Ridge | Elkhorn Ridge | | Bloomfield, NE | | 81 | | | 54 | | | 66.7 | % | | Wind | | March 2009 | | Nebraska Public Power District | | 2029 | Elkhorn Ridge | | Bloomfield, NE | | 81 | | | 54 | | 54 | | | 66.7 | | 66.7 | % | | Wind | | March 2009 | | Nebraska Public Power District | | 2029 |
| Forward | Forward | | Berlin, PA | | 29 | | | 29 | | | 100 | % | | Wind | | April 2008 | | Constellation NewEnergy, Inc. | | 2025 | Forward | | Berlin, PA | | 29 | | | 29 | | 29 | | | 100 | | 100 | % | | Wind | | April 2008 | | Constellation NewEnergy, Inc. | | 2025 |
| Goat Wind | Goat Wind | | Sterling City, TX | | 150 | | | 150 | | | 100 | % | | Wind | | April 2008/June 2009 | | Dow Pipeline Company | | 2025 | Goat Wind | | Sterling City, TX | | 150 | | | 150 | | 150 | | | 100 | | 100 | % | | Wind | | April 2008/June 2009 | | Dow Pipeline Company | | 2025 |
| Langford (b) | Langford (b) | | Christoval, TX | | 160 | | | 160 | | | 100 | % | | Wind | | December 2009/November 2020 | | Goldman Sachs | | 2033 |
Langford (b) | |
Langford (b) | | | Christoval, TX | | 160 | | | 160 | | | 100 | % | | Wind | | November 2020 | | Goldman Sachs | | 2033 |
| Laredo Ridge | Laredo Ridge | | Petersburg, NE | | 81 | | | 81 | | | 100 | % | | Wind | | February 2011 | | Nebraska Public Power District | | 2031 | Laredo Ridge | | Petersburg, NE | | 81 | | | 81 | | 81 | | | 100 | | 100 | % | | Wind | | February 2011 | | Nebraska Public Power District | | 2031 |
| Lookout | Lookout | | Berlin, PA | | 38 | | | 38 | | | 100 | % | | Wind | | October 2008 | | Southern Maryland Electric Cooperative | | 2030 | Lookout | | Berlin, PA | | 38 | | | 38 | | 38 | | | 100 | | 100 | % | | Wind | | October 2008 | | Southern Maryland Electric Cooperative | | 2030 |
Mesquite Sky (b) | Mesquite Sky (b) | | Callahan County, TX | | 340 | | | 170 | | | 50 | % | | Wind | | December 2021 | | Various | | 2033 - 2036 | Mesquite Sky (b) | | Callahan County, TX | | 340 | | | 170 | | 170 | | | 50 | | 50 | % | | Wind | | December 2021 | | Various | | 2033 - 2036 |
Mesquite Star (b) | Mesquite Star (b) | | Fisher County, TX | | 419 | | | 210 | | | 50 | % | | Wind | | May 2020 | | Various | | 2032 - 2035 | Mesquite Star (b) | | Fisher County, TX | | 419 | | | 210 | | 210 | | | 50 | | 50 | % | | Wind | | May 2020 | | Various | | 2032 - 2035 |
| Mountain Wind 1 | | Mountain Wind 1 | | Uinta County, Wyoming | | 61 | | | 61 | | | 100 | % | | Wind | | July 2008 | | PacifiCorp | | 2033 |
| Mountain Wind 2 | | Mountain Wind 2 | | Uinta County, Wyoming | | 80 | | | 80 | | | 100 | % | | Wind | | September 2008 | | PacifiCorp | | 2033 |
| Mt. Storm | Mt. Storm | | Grant County, WV | | 264 | | | 264 | | | 100 | % | | Wind | | October 2008 | | Citigroup | | 2031 | Mt. Storm | | Grant County, WV | | 264 | | | 264 | | 264 | | | 100 | | 100 | % | | Wind | | October 2008 | | Citigroup | | 2031 |
| Ocotillo | Ocotillo | | Forsan, TX | | 55 | | | 55 | | | 100 | % | | Wind | | November 2008 | | N/A | |
| Odin | Odin | | Mountain Lake, MN | | 21 | | | 21 | | | 100 | % | | Wind | | June 2008 | | Missouri River Energy Services | | 2028 |
| Odin | |
| Odin | | | Mountain Lake, MN | | 21 | | | 21 | | | 100 | % | | Wind | | June 2008 | | Missouri River Energy Services | | 2028 |
Pinnacle (b) | Pinnacle (b) | | Keyser, WV | | 54 | | | 54 | | | 100 | % | | Wind | | December 2011/December 2021 | | Maryland Department of General Services and University System of Maryland | | 2031 | Pinnacle (b) | | Keyser, WV | | 54 | | | 54 | | 54 | | | 100 | | 100 | % | | Wind | | December 2021 | | Maryland Department of General Services and University System of Maryland | | 2031 |
Rattlesnake (b) (e) | | Ritzville, WA | | 160 | | | 160 | | | 100 | % | | Wind | | December 2020 | | Avista Corporation | | 2040 |
Rattlesnake (b) (c) | | Rattlesnake (b) (c) | | Ritzville, WA | | 160 | | | 160 | | | 100 | % | | Wind | | December 2020 | | Avista Corporation | | 2040 |
| San Juan Mesa | San Juan Mesa | | Elida, NM | | 120 | | | 90 | | | 75 | % | | Wind | | December 2005 | | Southwestern Public Service Company | | 2025 | San Juan Mesa | | Elida, NM | | 120 | | | 90 | | 90 | | | 75 | | 75 | % | | Wind | | December 2005 | | Southwestern Public Service Company | | 2025 |
| Sleeping Bear | | Woodward, OK | | 95 | | | 95 | | | 100 | % | | Wind | | October 2007 | | Public Service Company of Oklahoma | | 2032 |
| South Trent | | Sweetwater, TX | | 101 | | | 101 | | | 100 | % | | Wind | | January 2009 | | AEP Energy Partners | | 2029 |
| Spanish Fork | | Spanish Fork, UT | | 19 | | | 19 | | | 100 | % | | Wind | | July 2008 | | PacifiCorp | | 2028 |
Spring Canyon II (b) | | Logan County, CO | | 34 | | | 31 | | | 90.1 | % | | Wind | | October 2014 | | Platte River Power Authority | | 2039 |
Spring Canyon III (b) | | Logan County, CO | | 29 | | | 26 | | | 90.1 | % | | Wind | | December 2014 | | Platte River Power Authority | | 2039 |
| Taloga | | Putnam, OK | | 130 | | | 130 | | | 100 | % | | Wind | | July 2011 | | Oklahoma Gas & Electric | | 2031 |
Wildorado (b) | | Vega, TX | | 161 | | | 161 | | | 100 | % | | Wind | | April 2007 | | Southwestern Public Service Company | | 2027 |
Total Wind (d) | | 4,157 | | | 3,658 | | |
| | Total Clearway Energy LLC | | 9,458 | | | 8,078 | | |
| | | | | | | | | | | | | | | | | | | | | | | | | | | | | | | | | | | | | | | | | | | | | | | | | | |
| | | | Capacity | | | | | | | | |
| | | | Rated MW | | Net MW(a) | | Ownership | | | | | | Long-term Contract Terms |
| Assets | | Location | | | | | Fuel | | COD | | Counterparty | | Expiration |
| Sleeping Bear | | Woodward, OK | | 95 | | | 95 | | | 100 | % | | Wind | | October 2007 | | Public Service Company of Oklahoma | | 2032 |
| South Trent | | Sweetwater, TX | | 101 | | | 101 | | | 100 | % | | Wind | | January 2009 | | AEP Energy Partners | | 2029 |
| Spanish Fork | | Spanish Fork, UT | | 19 | | | 19 | | | 100 | % | | Wind | | July 2008 | | PacifiCorp | | 2028 |
Spring Canyon II (b) | | Logan County, CO | | 34 | | | 31 | | | 90.1 | % | | Wind | | October 2014 | | Platte River Power Authority | | 2039 |
Spring Canyon III (b) | | Logan County, CO | | 29 | | | 26 | | | 90.1 | % | | Wind | | December 2014 | | Platte River Power Authority | | 2039 |
| Taloga | | Putnam, OK | | 130 | | | 130 | | | 100 | % | | Wind | | July 2011 | | Oklahoma Gas & Electric | | 2031 |
Wildorado (b) | | Vega, TX | | 161 | | | 161 | | | 100 | % | | Wind | | December 2019 - January 2020 | | Southwestern Public Service Company | | 2027 |
| Total Wind | | 4,157 | | | 3,658 | | | | | | | | | | | |
| | | | | | | | | | | | | | | | |
| Total Clearway Energy LLC | | 10,583 | | | 8,451 | | | | | | | | | | | |
(a) Net capacity represents the maximum, or rated, generating capacity or storage capacity of the facility multiplied by the Company’s percentage ownership in the facility as of December 31, 2022.2023.
(b) Projects are part of tax equity arrangements, as further described in Item 15 — Note 2, Summary of Significant Accounting Policies.
(c) Includes storage capacity that matches the facility’s rated generating capacity.
(d) Typical average capacity factors are 25% for solar facilities and 25-45% for wind facilities. For the year ended December 31, 2022, the Company's solar and wind facilities had weighted-average capacity factors of 28% and 30%, respectively.
(e)Rattlesnake has a deliverable capacity of 144 MW.
Item 3 — Legal Proceedings
See Item 15 — Note 14, Commitments and Contingencies, to the Consolidated Financial Statements for discussion of the material legal proceedings to which the Company is a party or of which any of its properties is subject.
Item 4 — Mine Safety Disclosures
Not applicable.
PART II
Item 5 — Market for Registrant’s Common Equity, Related Stockholder Matters and Issuer Purchases of Equity Securities
Market Information and Holders
As of the date of this report, there is no publicly-traded market for the Company’s membership units. All of the Company’s Class A and Class C units are held by Clearway, Inc. and all of the Company’s Class B and Class D units are held by CEG.
Distributions
The following table lists the distributions paid on the Company’s Class A, Class B, Class C and Class D units during the year ended December 31, 2022:2023:
| | Fourth Quarter 2022 | | Third Quarter 2022 | | Second Quarter 2022 | | First Quarter 2022 |
| Fourth Quarter 2023 | | | Fourth Quarter 2023 | | Third Quarter 2023 | | Second Quarter 2023 | | First Quarter 2023 |
| Distributions per Class A and Class B unit | Distributions per Class A and Class B unit | $ | 0.3672 | | | $ | 0.3604 | | | $ | 0.3536 | | | $ | 0.3468 | |
| Distributions per Class C and Class D unit | Distributions per Class C and Class D unit | 0.3672 | | | 0.3604 | | | 0.3536 | | | 0.3468 | |
On February 15, 2023,14, 2024, the Company declared a quarterly distribution on its Class A, Class B, Class C and Class D units of $0.3745$0.4033 per unit payable on March 15, 2023.2024.
In addition to the quarterly distributions, the Company paid $51 million in additional distributions, $30 million of which was distributed to Clearway, Inc. and $21 million of which was distributed to CEG, during the year ended December 31, 2023, in order for Clearway, Inc. to make certain additional tax payments primarily associated with the sale of the Thermal Business.
Item 6 — Reserved
Item 7 — Management’s Discussion and Analysis of Financial Condition and the Results of Operations
As you read this discussion and analysis, refer to the Company’s Consolidated Statements of Income to this Form 10-K. Also refer to Item 1 — Business and Item 1A — Risk Factors, which include detailed discussions of various items impacting the Company’s business, results of operations and financial condition. Discussions of the year ended December 31, 20202021 that are not included in this Annual Report on Form 10-K and year-to-year comparisons of the year ended December 31, 20212022 and the year ended December 31, 20202021 can be found in “Management’s Discussion and Analysis of Financial Condition and the Results of Operations” in Part II, Item 7 of the Company’s Annual Report on Form 10-K for the year ended December 31, 2021.2022.
The discussion and analysis below has been organized as follows:
•Executive Summary, including a description of the business and significant events that are important to understanding the results of operations and financial condition;
•Results of operations, including an explanation of significant differences between the periods in the specific line items of the consolidated statements of income;
•Financial condition addressing liquidity position, sources and uses of cash, capital resources and requirements, commitments and off-balance sheet arrangements;
•Known trends that may affect the Company’s results of operations and financial condition in the future; and
•Critical accounting policies which are most important to both the portrayal of the Company’s financial condition and results of operations, and which require management’s most difficult, subjective or complex judgment.
Executive Summary
Introduction and Overview
Clearway Energy LLC, together with its consolidated subsidiaries, or the Company, is an energy infrastructure investor with a focus on investments in clean energy and owner of modern, sustainable and long-term contracted assets across North America. The Company is sponsored by GIP and TotalEnergies through the portfolio company, Clearway Energy Group LLC, or CEG, which becameis equally owned by GIP and TotalEnergies as of September 12, 2022, when TotalEnergies acquired, through its investment in an intermediate holding company, 50% of GIP’s interest in CEG.TotalEnergies. GIP is an independent infrastructure fund manager that makes equity and debt investments in infrastructure assets and businesses. TotalEnergies is a global multi-energy company. CEG is a leading developer of renewable energy infrastructure in the U.S. On January 12, 2024, BlackRock entered into a definitive agreement to acquire 100% of the business and assets of GIM, which is the investment manager of the GIP funds that own an interest in CEG. BlackRock has indicated that the transaction is expected to close in the third quarter of 2024, subject to regulatory approvals and other customary closing conditions. BlackRock is a publicly-traded global investment management firm.
The Company is one of the largest renewable energy owners in the U.S. with over 5,500approximately 6,000 net MW of installed wind, solar and solar generationenergy storage projects. The Company’s over 8,000approximately 8,500 net MW of assets also includes approximately 2,500 net MW of environmentally-sound, highly efficient natural gas-fired generation facilities. Through this environmentally-sound, diversified and primarily contracted portfolio, the Company endeavors to increase distributions to its unit holders. The majority of the Company’s revenues are derived from long-term contractual arrangements for the output or capacity from these assets. The weighted average remaining contract duration of these offtake agreements was approximately 1110 years as of December 31, 20222023 based on CAFD.
Significant Events
Thermal DispositionDrop Down Transactions
•On May 1, 2022,December 28, 2023, the Company, completedthrough its indirect subsidiary, Lighthouse Renewable Holdco 2 LLC, acquired TSN1 BL Borrower Holdco LLC, the saleindirect owner of 100%Texas Solar Nova 1, a 252 MW solar project that is located in Kent County, Texas, from Clearway Renew for cash consideration of its interests in$23 million. Lighthouse Renewable Holdco 2 LLC is a partnership between the Thermal BusinessCompany and a cash equity investor. The cash equity investor also contributed cash consideration of $109 million to KKR for net proceeds of approximately $1.46 billion, inclusive of working capital adjustments, which excludes approximately $18 million in transaction expenses that were incurred in connection with the disposition. The transaction resulted in a gain on sale of business of approximately $1.29 billion, which is netacquire their portion of the $18 million in transaction expenses referenced above.acquired entity. TSN1 BL Borrower Holdco LLC consolidates as primary beneficiary, TSN1 TE Holdco LLC, a tax equity fund that owns the Texas Solar Nova 1 solar project. See Item 15 — Note 3, Acquisitions and Dispositions, for further discussion.discussion of the transaction.
Capistrano Wind Portfolio Acquisition
•On August 22, 2022,October 31, 2023, the Company, through its indirect subsidiary, VP-Arica Parent Holdco LLC, acquired the Capistrano Wind Portfolio,Class A membership interests in VP-Arica TargetCo LLC, a partnership and the indirect owner of Victory Pass, a 200 MW solar project that is paired with 50 MW of energy storage, and Arica, a 263 MW solar project that is paired with 136 MW of energy storage, which consists of five wind projects locatedare both currently under construction in Nebraska, Texas and Wyoming with a combined capacity of 413 MW,Riverside, California, from Capistrano Wind Partners LLC, an indirect subsidiary of CEG,Clearway Renew for total netinitial cash consideration of approximately $239$46 million. Simultaneously, a cash equity investor acquired the Class B membership interests in VP-Arica TargetCo LLC from Clearway Renew for initial cash consideration of $87 million. At substantial completion, which is expected to occur in the first half of 2024, the Company estimates it will pay an additional $182 million to Clearway Renew and the cash equity investor will contribute an additional $347 million. VP-Arica TargetCo LLC consolidates as primary beneficiary, VP-Arica TE Holdco LLC, a tax equity fund that owns the Victory Pass and Arica solar projects. See Item 15 — Note 3, Acquisitions and Dispositions, for further discussion.discussion of the transaction.
Drop Down Transactions•On August 30, 2023, the Company, through an indirect subsidiary, entered into an agreement with Clearway Renew to acquire the Class A membership interests in Texas Solar Nova 2, a 200 MW solar project currently under construction in Kent County, Texas, upon the project meeting certain milestones. The Company expects to invest approximately $17 million, subject to closing adjustments. Commercial operations of the facilities and the Company’s investment is expected in the first half of 2024.
•On August 30, 2023, the Company, through its indirect subsidiary, Daggett Solar Investment LLC, acquired the Class A membership interests in Daggett 2 TargetCo LLC, a partnership and the indirect owner of Daggett 2, a 182 MW solar project that is paired with 131 MW of energy storage and is located in San Bernardino, California, from CEG for cash consideration of $13 million. Daggett 2 TargetCo LLC consolidates as primary beneficiary, Daggett 2 TE Holdco LLC, a tax equity fund that owns the Daggett 2 solar project. See Item 15 — Note 3, Acquisitions and Dispositions, for further discussion of the transaction.
•On June 30, 2023, the Company, through its indirect subsidiary, Rosie Class B LLC, the indirect owner of the Rosamond Central solar project, became the owner of the Class B membership interests of Rosie Central BESS in order to facilitate and fund the construction of a 147 MW BESS project that is co-located at the Rosamond Central solar facility. Clearway Renew indirectly owns the Class A membership interests and controls Rosie Central BESS. As of December 31, 2023, the Company’s investment consisted of $28 million contributed into Rosie Central BESS, funded through contributions from the Company and its cash equity investor in Rosie TargetCo LLC, which consolidates Rosie Class B LLC. On December 1, 2023, the Rosamond Central solar project acquired the BESS project from Clearway Renew for initial cash consideration of $70 million, $16 million of which was funded by the Company with the remaining $54 million funded through contributions from third-party investors. At substantial completion, which is expected to occur in the first half of 2024, the Company estimates it will pay an additional $279 million to Clearway Renew, $61 million of which will be funded by the Company with the remaining $218 million to be funded through contributions from third-party investors. Also at substantial completion, Clearway Renew will return Rosie Class B LLC’s equity investment. See Item 15 — Note 3, Acquisitions and Dispositions and Note 5, Investments Accounted for by the Equity Method and Variable Interest Entities, for further discussion of the transactions.
•On May 19, 2023, the Company, through an indirect subsidiary, entered into an agreement with Clearway Renew to acquire Cedar Creek Holdco LLC, which is the indirect owner of Cedar Creek, a 160 MW wind project under construction in Bingham County, Idaho, for $107 million in cash, subject to customary working capital adjustments. Upon the closing of the transaction, the Company will indirectly own all of the Class B membership interests in Cedar Creek TE Holdco LLC, a tax equity fund which will consolidate the Cedar Creek wind project, while a tax equity investor will own all of the Class A membership interests. The consummation of the transaction is subject to customary closing conditions and certain third-party approvals and is expected in the first half of 2024.
•On May 3, 2023, the Company entered into an agreement with Clearway Renew to repower the Cedro Hill wind project, which is included in the Capistrano Wind Portfolio and is located in Bruni, Texas. The Company expects to invest approximately $36 million in net corporate capital, subject to closing adjustments. Contingent upon achieving repowering commercial operations in the second half of 2024, the 160 MW project will sell power to its existing counterparty, an investment-grade utility, for an additional 15 years ending in 2045 under an amended PPA.
•On February 17, 2023, the Company, through its indirect subsidiary, Daggett Solar Investment LLC, acquired the Class A membership interests in Daggett TargetCo LLC, the indirect owner of Daggett 3, a partnership300 MW solar project that is paired with 149 MW of energy storage and located in San Bernardino, California, from Clearway Renew for cash consideration of $21 million. Simultaneously, a third-partycash equity investor acquired an interestthe Class B membership interests in Daggett TargetCo LLC from Clearway Renew LLC, a subsidiary of CEG, for cash consideration of $21$129 million. The third-partyCompany and the cash equity investor alsothen contributed cash consideration of $129 million, which was utilized to acquire their portion of the acquired entity.Class A and B membership interests, respectively, into Daggett Renewable Holdco LLC, a partnership that consolidates Daggett TargetCo LLC. Daggett TargetCo LLC is theconsolidates as primary beneficiary, and consolidates its interests inDaggett TE Holdco LLC, a tax equity fund Daggett TE Holdco LLC, the owner ofthat owns the Daggett 3 solar project, a 300 MW solar project with matching storage capacity that is currently under construction and located in San Bernardino, California.project. See Item 15 — Note 3, Acquisitions and Dispositions, for further discussion.
•On December 23, 2022, the Company, through an indirect subsidiary, entered into an agreement with CEG to acquire the Class A membership interests in a partnership formed to hold the interests in the Victory Pass and Arica solar and energy storage projects, which are both located in Riverside, California, upon the projects reaching certain milestones for a total purchase price of approximately $228 million in cash, subject to customary working capital adjustments. Victory Pass is a 200 MW solar facility and Arica is a 263 MW solar facility, each with an energy storage system. Upon the closingdiscussion of the transaction, which is expected in the second half of 2023, the Company will own 40% of the partnership holding interests in Victory Pass and Arica, which are anticipated to be held in a tax equity fund with another third-party investor.transaction.
•On October 3, 2022, the Company, through a partnership with a third-party investor, acquired Waiawa BL Borrower Holdco LLC, the indirect owner, through its ownership interests in and consolidation of a tax equity fund, of the Waiawa solar project, a 36 MW solar project with matching storage capacity located in Honolulu, Hawaii, from Clearway Renew LLC for cash consideration of $20 million. The third-party investor also contributed cash consideration of $12 million, which was utilized to acquire their portion of the acquired entity. See Item 15 — Note 3, Acquisitions and Dispositions, for further discussion.
•On March 25, 2022, the Company, through a partnership with a third-party investor, acquired Mililani BL Borrower Holdco LLC, the indirect owner, through its ownership interests in and consolidation of a tax equity fund, of the Mililani I solar project, a 39 MW solar project with matching storage capacity located in Honolulu, Hawaii, from Clearway Renew LLC for cash consideration of $22 million. The third-party investor also contributed cash consideration of $14 million, which was utilized to acquire their portion of the acquired entity. See Item 15 — Note 3, Acquisitions and Dispositions, for further discussion.
•In February 2022, in connection with 2021 Black Rock Drop Down, the Company paid an additional $23 million to Clearway Renew LLC as final funding after all remaining turbines of the project became operational. Concurrent with the final funding, the $59 million that was contributed in 2021 by third-party investors was released to Clearway Renew LLC. See Item 15 — Note 3, Acquisitions and Dispositions, for further discussion.
Resource Adequacy Agreements
•In August 2022,October 2023, the Company contracted with SCEa load serving entity to sell 100%approximately 400 MW of El Segundo’s available capacityMarsh Landing’s RA commencing in August 2023September 2026 and ending in August 2026.December 2027. Marsh Landing is now contracted for 100% of its capacity through the majority of 2026 and 63% of its capacity in 2027.
•In July 2022,October 2023, the Company contracted with severala load serving entitiesentity to sell the remaining 20%approximately 274 MW of Marsh Landing’s available capacityEl Segundo’s RA commencing in May 2023. The agreements are for approximately threeAugust 2026 and a half years. Marsh Landing’s capacityending in December 2027. El Segundo is now 100% contracted for a weighted average contract tenor100% of approximately four years commencingits capacity through the majority of 2026 and 50% of its capacity in May 2023.2027.
Corporate Financing Activities
•On May 3, 2022,March 15, 2023, Clearway Energy Operating LLC refinanced the Company repaid (i) $305 million in outstanding borrowings under the revolving credit facilityAmended and (ii) $335 million in outstanding borrowings under the Bridge Loan Agreement utilizing proceeds received from the Thermal Disposition.Restated Credit Agreement. See Item 15 — Note 10, Long-term Debt, for further discussion.discussion of the amendment.
Project-level Financing Activities
•In connection with the Capistrano Wind Portfolio acquisition and the 2022 Drop Downs of WaiawaDaggett 3, Daggett 2, Victory Pass, Arica and Mililani I,Texas Solar Nova 1, the Company assumed non-recourse project-level debt. See Item 15 — Note 10, Long-term Debt, for further discussion of the non-recourse project-level debt associated with each project.
•On December 15, 2022, the Company repaid the outstanding project-level debt of El Segundo Energy Center in the amount of approximately $130 million, utilizing cash on hand. The project-level debt had an original maturity of August 2023.
•On March 16, 2022,12, 2023, the Company entered into a financing agreement which included the issuancefor non-recourse debt for a total commitment of a $190 million term loan as well as $35 million in letters of credit, supported by the Company’s interests in the Elkhorn Ridge, Laredo Ridge, San Juan Mesa and Taloga wind projects. The proceeds from the term loan were used to pay off the existing debt in the amount of $186$254 million related to Laredo Ridge, Tapestry Wind LLC and Viento Funding II, LLC and to pay related financing costs.the repowering of the Cedro Hill wind project. The Company’s initial borrowing under the agreement was $165 million. See Item 15 — Note 10, Long-term Debt, for further discussion.discussion of the project financing activities.
•On June 30, 2023, Rosie Class B LLC amended its financing agreement. During the year ended December 31, 2023, Rosie Class B LLC received total loan proceeds of $265 million under the amended financing agreement. On July 3, 2023, Rosie Class B LLC issued a loan to Clearway Renew, utilizing a portion of the loan proceeds under the amended financing agreement, in order to finance the construction of the BESS project. On December 1, 2023, Clearway Renew partially repaid the loan utilizing the $70 million in proceeds that was paid by the Company to acquire the BESS project. As of December 31, 2023, the loan had an aggregate principal amount of $174 million. The loan matures when the project reaches substantial completion, which is expected in the first half of 2024. See Item 15 — Note 10, Long-term Debt, for further discussion of the project financing activities. Also, during the year ended December 31, 2023, the Company utilized a portion of the loan proceeds received under the amended financing agreement to contribute $18 million into Rosie Central BESS, which is an investment accounted for under the equity method of accounting, as further described above and in Item 15 — Note 5, Investments Accounted for by the Equity Method and Variable Interest Entities.
Environmental Matters and Regulatory Matters
Details of environmental matters and regulatory matters are presented in Item 1 — Business, Regulatory Matters and Item 1A — Risk Factors. Details of some of this information relate to costs that may impact the Company’s financial results.
Consolidated Results of Operations
The following table provides selected financial information: | | Year ended December 31, |
| Year ended December 31, | | | Year ended December 31, |
| (In millions) | (In millions) | 2022 | | 2021 | | 2020 | (In millions) | 2023 | | 2022 | | 2021 |
| Operating Revenues | Operating Revenues | | | | | |
| Energy and capacity revenues | Energy and capacity revenues | $ | 1,465 | | | $ | 1,425 | | | $ | 1,234 | |
| Other revenues | 82 | | | 92 | | | 53 | |
| Energy and capacity revenues | |
| Energy and capacity revenues | |
| Other revenue | |
| Contract amortization | Contract amortization | (175) | | | (144) | | | (88) | |
| Mark-to-market for economic hedges | Mark-to-market for economic hedges | (182) | | | (87) | | | — | |
| Total operating revenues | Total operating revenues | 1,190 | | | 1,286 | | | 1,199 | |
| Operating Costs and Expenses | Operating Costs and Expenses | | | | | |
| Cost of fuels | Cost of fuels | 29 | | | 75 | | | 73 | |
| | Cost of fuels | |
| Cost of fuels | |
| Operations and maintenance | Operations and maintenance | 295 | | | 279 | | | 219 | |
| Mark-to-market for economic hedges | |
| Other costs of operations | Other costs of operations | 111 | | | 97 | | | 74 | |
| Depreciation, amortization and accretion | Depreciation, amortization and accretion | 512 | | | 509 | | | 428 | |
| Impairment losses | Impairment losses | 16 | | | 6 | | | 24 | |
| General and administrative | General and administrative | 38 | | | 38 | | | 33 | |
| Transaction and integration costs | Transaction and integration costs | 7 | | | 7 | | | 9 | |
| Development costs | Development costs | 2 | | | 6 | | | 5 | |
| Total operating costs and expenses | Total operating costs and expenses | 1,010 | | | 1,017 | | | 865 | |
| Gain on sale of business | Gain on sale of business | 1,292 | | | — | | | — | |
| Operating Income | Operating Income | 1,472 | | | 269 | | | 334 | |
| Other Income (Expense) | Other Income (Expense) | | | | | |
| Equity in earnings of unconsolidated affiliates | Equity in earnings of unconsolidated affiliates | 29 | | | 32 | | | 7 | |
| Impairment loss on investment | — | | | — | | | (8) | |
| Gain on sale of unconsolidated affiliate | — | | | — | | | 49 | |
| Equity in earnings of unconsolidated affiliates | |
| Equity in earnings of unconsolidated affiliates | |
| | Other income, net | |
| | Other income, net | |
| | Other income, net | Other income, net | 17 | | | 3 | | | 4 | |
| Loss on debt extinguishment | Loss on debt extinguishment | (2) | | | (53) | | | (24) | |
| Derivative interest income | 100 | | | 53 | | | (38) | |
| Derivative interest (expense) income | |
| Other interest expense | Other interest expense | (332) | | | (365) | | | (376) | |
| Total other expense, net | Total other expense, net | (188) | | | (330) | | | (386) | |
| Income (Loss) Before Income Taxes | 1,284 | | | (61) | | | (52) | |
| Income tax expense | 2 | | | 2 | | | — | |
| Net Loss | 1,282 | | | (63) | | | (52) | |
| Less: Net loss attributable to noncontrolling interests and redeemable interests | (106) | | | (173) | | | (113) | |
| (Loss) Income Before Income Taxes | |
| Income tax (benefit) expense | |
| Net (Loss) Income | |
| Less: Net loss attributable to noncontrolling interests and redeemable noncontrolling interests | |
| Net Income Attributable to Clearway Energy LLC | Net Income Attributable to Clearway Energy LLC | $ | 1,388 | | | $ | 110 | | | $ | 61 | |
| | Year ended December 31, |
| Year ended December 31, | | | Year ended December 31, |
| Business metrics: | Business metrics: | 2022 | | 2021 | | 2020 | Business metrics: | 2023 | | 2022 | | 2021 |
Solar MWh generated/sold (in thousands) (a) | Solar MWh generated/sold (in thousands) (a) | 4,991 | | | 3,585 | | | 1,894 | |
Wind MWh generated/sold (in thousands) (a) | Wind MWh generated/sold (in thousands) (a) | 9,343 | | | 7,728 | | | 5,566 | |
Renewables MWh generated/sold (in thousands) (a) | Renewables MWh generated/sold (in thousands) (a) | 14,334 | | | 11,313 | | | 7,460 | |
Thermal MWt sold (in thousands) (b) | 835 | | | 2,035 | | | 1,927 | |
Thermal MWh sold (in thousands) (b) | 19 | | | 59 | | | 68 | |
Conventional MWh generated (in thousands) (a)(c) | 1,236 | | | 1,108 | | | 1,475 | |
Solar weighted-average capacity factor (b) (c) | | Solar weighted-average capacity factor (b) (c) | 27.5 | % | | 28.4 | % | | 24.2 | % |
Wind weighted-average capacity factor (d) | | Wind weighted-average capacity factor (d) | 28.3 | % | | 29.9 | % | | 29.1 | % |
Thermal MWt sold (in thousands) (e) | |
Thermal MWh sold (in thousands) (e) | |
Conventional MWh generated (in thousands) (a)(f) | |
| Conventional equivalent availability factor | Conventional equivalent availability factor | 92.2 | % | | 94.7 | % | | 94.9 | % | Conventional equivalent availability factor | 90.2 | % | | 92.2 | % | | 94.7 | % |
(a)Volumes do not include the MWh generated/sold by the Company’s equity method investments.
(b) Typical average capacity factors for solar facilities is 25%. The weighted-average capacity factors can vary based on seasonality and weather.
(c) The 2021 solar weighted-average capacity factor is lower, due to the Company owning the Utah Solar Portfolio for one month.
(d) Typical average capacity factors for wind facilities is 25-45%. The weighted-average capacity factors can vary based on seasonality and weather.
(e)On May 1, 2022, the Company completed the sale of 100% of its interests in the Thermal Business to KKR.
(c) (f)Volumes generated arein 2022 and 2021 were not sold as the Conventional facilities sellsold only capacity rather than energy.
Management’s discussion of the results of operations for the years ended December 31, 20222023 and 20212022
Operating Revenues
Operating revenues decreasedincreased by $96$124 million for the year ended December 31, 2022,2023, compared to the same period in 2021,2022, due to a combination of the drivers summarized in the table below:
| | | | | | | | |
| | (In millions) |
| Renewables Segment | Increase for solar acquisitions due to the 2021 acquisitions of the Utah Solar Portfolio and Agua Caliente and the 2022 acquisition of Mililani I, slightly offsetdriven by the 2022 disposition of Kawailoa. | $ | 88 | |
| Increase for wind acquisitions due to the 2021 acquisitions of Mt. Storm, Mesquite Sky and Black Rock and the 2022 acquisition of the Capistrano Wind Portfolio along with the 2021 repowering of the Pinnacle wind project.in August 2022. | 48 | |
| Favorable impact from the loss in February 2021 related to net settlements of obligations for wind facilities that were unable to produce the required output during extreme weather conditions in Texas.$ | 5044 | |
| Increase for solar acquisitions driven by Mililani I, Waiawa and Daggett 3, which reached commercial operations in July 2022, January 2023 and July 2023, respectively, offset by the disposition of Kawailoa in August 2022. | 22 | |
| Decrease driven primarily by lower than average wind production primarily during the second quarter of 2023, compared with higher than average wind production during the second quarter of 2022. | (43) | |
| Decrease driven primarily by lower solar generation due to weather. | (16) | |
| Conventional Segment | Increase primarily driven by higher average realized pricesenergy revenue due to the commencement of merchant operations following the expiration of PPAs at the wind facilities.Walnut Creek and Marsh Landing facilities during the second quarter of 2023 and the El Segundo facility during the third quarter of 2023. | 481 | |
| Increase driven by the sales-type lease revenue recognition of the Marsh Landing Black Start addition that commenced operations on May 31, 2023. | 21 | |
| Increase primarily driven by increased availability at the El Segundo facility in 2023 due to longer maintenance outages in 2022. | 7 | |
| Decrease primarily driven by lower wind generation.prices for capacity revenue due to the expiration of PPAs and commencement of RA capacity revenue at the Walnut Creek, Marsh Landing and El Segundo facilities during 2023. | (7)(105) | |
| Thermal Segment | Decrease primarily driven by the sale of the Thermal Business on May 1, 2022. | (130)(77) | |
Conventional SegmentContract amortization | DecreaseIncrease primarily driven by forced outages ata full year of amortization for intangible assets related to PPAs from the El Segundo andacquisition of the Capistrano Wind Portfolio in August 2022, partially offset by the Walnut Creek facilitiesPPA, which was fully amortized in 2022, resulting in lower capacity revenue.the first half of 2023. | (23)(11) | |
| Mark-to-market economic hedges | Increase in unrealized losses due to changes in the fair value of commodity contracts, primarily driven by the acquisition of Mesquite Sky in 2021 and mark-to-market losses of the Langford commodity contract, which previously qualified for the NPNS exception. | (76) | |
| Increase in unrealized losses due to increasesdecreases in forward power prices in the ERCOT and PJM markets. | (19)196 | |
| Contract amortizationIncrease due to heat rate call option entered into by El Segundo, Marsh Landing and Walnut Creek during 2023. | Increase primarily driven by amortization of the intangible assets for PPAs related to the 2021 acquisitions of Agua Caliente and the Utah Solar Portfolio and the 2022 acquisition of the Capistrano Wind Portfolio.5 | | (31) |
| | $ | (96)124 | |
Cost of Fuels
Cost of fuels decreasedincreased by $46$33 million during the year ended December 31, 2022,2023, compared to the same period in 2021, primarily due to the sale of the Thermal Business on May 1, 2022, as further described in Item 15 — Note 3, Acquisitions and Dispositions.
Operations and Maintenance Expense
Operations and maintenance expense increased by $16 million during the year ended December 31, 2022, compared to the same period in 2021, due to a combination of the drivers summarized in the table below:
| | | | | | | | |
| | (In millions) |
Renewables Segment | Increase for wind acquisitions due to the 2021 acquisitions of Mt Storm, Mesquite Sky and Black Rock and the 2022 acquisition of the Capistrano Wind Portfolio. | $ | 30 | |
| Increase for solar acquisitions due to the 2021 acquisition of the Utah Solar Portfolio and the 2022 acquisition of Mililani I. | 14 | |
| Increase primarily driven by timing of maintenance activities, as well as increasing material costs largely at the solar and wind facilities. | 6 | |
| Conventional Segment | Increase primarily driven by fuel purchases and the related cost of emissions obligations at the Walnut Creek, Marsh Landing and El Segundo facilities as a result of the expiration of PPAs and the facilities commencing merchant operations during 2023. | $ | 48 | |
| Increase due to the forced outages at El Segundo and Walnut Creek primarily inassociated costs of the third quartersales-type lease recognition of 2022.the Marsh Landing Black Start addition that commenced operations on May 31, 2023. | 513 | |
| Thermal Segment | Decrease primarily driven by the sale of the Thermal Business on May 1, 2022. | (39)(28) | |
| | $ | 1633 | |
Other Costs of Operations and Maintenance Expense
Other costs of operationsOperations and maintenance expense which primarily consists of insurance and property taxes, increased by $14$19 million during the year ended December 31, 2022,2023, compared to the same period in 2021, primarily due an increase in property taxes2022, due to the acquisitionsa combination of the Utah Solar Portfolio, Mesquite Sky and Black Rock in 2021 and the acquisition of the Capistrano Wind Portfolio in 2022, as well as an increase in property taxes at certain wind projects.
Impairment Losses
The Company recorded impairment losses of $16 million and $6 million for the years ended December 31, 2022 and 2021, respectively, related to certain projectsdrivers summarized in the Renewables segment as further described in Item 15— Note 9, Asset Impairments.table below:
| | | | | | | | |
| | (In millions) |
| Renewables Segment | Increase driven by the acquisition of the Capistrano Wind Portfolio in August 2022. | $ | 16 | |
| Increase for solar acquisitions driven by Daggett 3 in February 2023, Mililani I in March 2022 and Waiawa in November 2022, partially offset by the disposition of Kawailoa in August 2022. | 8 | |
| Increase primarily driven by maintenance activities at the wind facilities. | 4 | |
| Conventional Segment | Increase primarily driven by higher costs related to outages at the Walnut Creek and Marsh Landing facilities. | 5 | |
| Increase primarily driven by higher costs related to planned maintenance outages at the Carlsbad and El Segundo facilities. | 4 | |
| Thermal Segment | Decrease primarily driven by the sale of the Thermal Business on May 1, 2022. | (18) | |
| | $ | 19 | |
Gain on Sale of Business
On May 1, 2022, the Company completed the sale of 100% of its interests in the Thermal Business to KKR resulting in a gain on sale of business of approximately $1.29 billion, as further described in Item 15 — Note 3, Acquisitions and Dispositions.
Equity in Earnings of Unconsolidated Affiliates
Equity in earnings of unconsolidated affiliates decreased by $17 million during the year ended December 31, 2023, compared to the same period in 2022, primarily due to the change in fair value of interest swaps and higher depreciation expense, as well as lower wind production during the second quarter of 2023.
Other Income, Net
Other income, net increased $14$35 million during the year ended December 31, 2022,2023, compared to the same period in 2021,2022, primarily due to higher interest income earned on larger cash balances with investments in money market and time deposit accounts.
Loss on Debt Extinguishment
The Company recorded loss on debt extinguishment of $2 million during the year ended December 31, 2022,accounts, which reflects the write-off of previously deferred finance costs related to the Laredo Ridge, Tapestry Wind LLC and Viento Funding II, LLC,have retained larger balances as further described in Item 15 — Note 10, Long-term Debt.
The Company recorded loss on debt extinguishment of $53 million during the year ended December 31, 2021, primarily driven by the write-off of previously deferred finance costs and payment of premiums related to the redemptiona result of the 2026 Senior Notes andproceeds received from the 2025 Senior Notes in 2021,sale of the Thermal Business on May 1, 2022, along with higher interest income earned across the portfolio as further described in Item 15 — Note 10, Long-term Debt.a result of higher interest rates.
Interest Expense
Interest expense decreasedincreased by $80$105 million during the year ended December 31, 2022,2023, compared to the same period in 20212022, primarily due to:to the following:
| | | | | |
| (In millions) |
Change in fair value of interest rate swaps due to higherchanges in interest rates | $ | (47)117 | |
| Increase in interest expense due to an increase in principal balances of Renewables segment project-level debt | 14 | |
Decrease in interest expense due to decreaseda decrease in principal balances of Conventional segment project-level debt | (20)(17) | |
| Decrease in interest expense due to the sale of the Thermal Business on May 1, 2022 | (12)(6) | |
| Decrease in interest expense due to decreased principal balances of Corporate debt, which includes repayment of the outstanding borrowings under the Bridge Loan Agreement and the revolving credit facility on May 3, 2022 | (2)(3) | |
| Amortization of deferred financing costs related to the Bridge Loan that was entered into during the fourth quarter of 2021 and paid in full on May 3, 20221 | |
| $ | (80)105 | |
Income Tax (Benefit) Expense
For the year ended December 31, 2022,2023, the Company recorded an income tax expensebenefit of $2 million on pretax incomeloss of $1,283$15 million. For the same period in 2021,2022, the Company recorded an income tax expense of $2 million on pretax lossincome of $61$1,284 million. The Company is classified as a partnership for federal and state income tax purposes. Therefore, federal and most state income taxes are assessed at the partner level. The franchise tax imposed by the state of Texas, however, is being assessed at the level of certain project subsidiaries of the Company, and therefore reflected as an income tax expense or benefit of the Company.
The Company is subject to examination by taxing authorities for income tax returns filed in the U.S. federal and various state jurisdictions. All tax returns filed by the Company for the year ended December 31, 2013 and forward remain subject to audit.
Net Loss Attributable to Noncontrolling Interests and Redeemable Noncontrolling Interests
For the year ended December 31, 2023, the Company had a net loss of $162 million attributable to noncontrolling interests and redeemable noncontrolling interests comprised of the following:
| | | | | | | | |
| | (In millions) |
| Losses attributable to tax equity financing arrangements and the application of the HLBV method (primarily due to Daggett TE Holdco LLC and Daggett 2 TE Holdco LLC HLBV losses) | | $ | (388) | |
| Income attributable to third-party partnerships (primarily due to Daggett TE Holdco LLC and Daggett 2 TE Holdco LLC HLBV losses) | | 226 | |
| | $ | (162) | |
For the year ended December 31, 2022, the Company had a net loss of $106 million attributable to noncontrolling interests and redeemable noncontrolling interests comprised of the following:
| | | | | | | | |
| | (In millions) |
| Losses attributable to tax equity financing arrangements and the application of HLBV | | $ | (87) | |
LossLosses attributable to third-party partnerships | | (19) | |
| | |
| | |
| | $ | (106) | |
For the year ended December 31, 2021, the Company had a net loss of $173 million attributable to noncontrolling interests and redeemable noncontrolling interests comprised of the following:
| | | | | | | | |
| | (In millions) |
Losses attributable to tax equity financing arrangements and the application of HLBV | | $ | (174) | |
Losses attributable to CEG’s interest in partnerships | | (3) | |
Income attributable to third-party partnerships | | 4 | |
| | $ | (173) | |
Liquidity and Capital Resources
The Company’s principal liquidity requirements are to meet its financial commitments, finance current operations, fund capital expenditures, including acquisitions from time to time, service debt and pay distributions. As a normal part of the Company’s business, depending on market conditions, the Company will from time to time consider opportunities to repay, redeem, repurchase or refinance its indebtedness. Changes in the Company’s operating plans, lower than anticipated sales, increased expenses, acquisitions or other events may cause the Company to seek additional debt or equity financing in future periods. There can be no guarantee that financing will be available on acceptable terms or at all. Debt financing, if available, could impose additional cash payment obligations and additional covenants and operating restrictions.
Current Liquidity Position
As of December 31, 20222023 and 2021,2022, the Company’s liquidity was approximately $1.37$1.51 billion and $821 million,$1.37 billion, respectively, comprised of cash, restricted cash and availability under the Company’s revolving credit facility.
| | As of December 31, |
| 2022 | | 2021 |
| (In millions) |
| As of December 31, | | | As of December 31, |
| 2023 | | | 2023 | | 2022 |
| (In millions) | | | (In millions) |
| Cash and cash equivalents: | Cash and cash equivalents: | | | |
| Clearway Energy LLC, excluding subsidiaries | |
| Clearway Energy LLC, excluding subsidiaries | |
| Clearway Energy LLC, excluding subsidiaries | Clearway Energy LLC, excluding subsidiaries | $ | 536 | | | $ | 33 | |
| Subsidiaries | Subsidiaries | 121 | | | 146 | |
| Restricted cash: | Restricted cash: | |
| Operating accounts | |
| Operating accounts | |
| Operating accounts | Operating accounts | 109 | | | 246 | |
| Reserves, including debt service, distributions, performance obligations and other reserves | Reserves, including debt service, distributions, performance obligations and other reserves | 230 | | | 229 | |
| Total cash, cash equivalents and restricted cash | Total cash, cash equivalents and restricted cash | 996 | | | 654 | |
| Revolving credit facility availability | Revolving credit facility availability | 370 | | | 167 | |
| Total liquidity | Total liquidity | $ | 1,366 | | | $ | 821 | |
|
The Company’s liquidity includes $339$516 million and $475$339 million of restricted cash balances as of December 31, 20222023 and 20212022, respectively. Restricted cash consists primarily of funds to satisfy the requirements of certain debt arrangements and funds held within the Company’s projects that are restricted in their use. As of December 31, 2022,2023, these restricted funds were comprised of $109$176 million designated to fund operating expenses, approximately $55$178 million designated for current debt service payments, and$105and $85 million restricted for reserves including debt service, performance obligations and other reserves, as well as capital expenditures. The remaining $70$77 million is held in distribution reserve accounts.
Clearway Energy LLC and Clearway Energy Operating LLC Revolving Credit Facility
On March 15, 2023, Clearway Energy Operating LLC refinanced the Amended and Restated Credit Agreement, which (i) replaced LIBOR with SOFR plus a credit spread adjustment of 0.10% as the applicable reference rate, (ii) increased the available revolving commitments to an aggregate principal amount of $700 million, (iii) extended the maturity date to March 15, 2028, (iv) increased the letter of credit sublimit to $594 million and (v) implemented certain other technical modifications.
As of December 31, 2022,2023, the Company had no outstanding borrowings under the revolving credit facility and $125$246 million in letters of credit outstanding. During the year ended December 31, 2022, the Company borrowed $80 million under the revolving credit facility, and subsequently repaid $325 million, $305 million of which was repaid on May 3, 2022, utilizing the proceeds received from the Thermal Disposition. The facility which the Company expects to refinance prior to its expiration in April 2023, will continue to be used for general corporate purposes, including financing of future acquisitions and posting letters of credit.
Management believes that the Company’s liquidity position, cash flows from operations and availability under its revolving credit facility will be adequate to meet the Company’s financial commitments; debt service obligations; growth, operating and maintenance capital expenditures; and to fund distributions to Clearway, Inc. and CEG. Management continues to regularly monitor the Company’s ability to finance the needs of its operating, financing and investing activity within the dictates of prudent balance sheet management.
Credit Ratings
Credit rating agencies rate a firm’s public debt securities. These ratings are utilized by the debt markets in evaluating a firm’s credit risk. Ratings influence the price paid to issue new debt securities by indicating to the market the Company’s ability to pay principal, interest and preferred dividends. Rating agencies evaluate a firm’s industry, cash flow, leverage, liquidity and hedge profile, among other factors, in their credit analysis of a firm’s credit risk. As of December 31, 2022,2023, the Company’s 2028 Senior Notes, 2031 Senior Notes and 2032 Senior Notes arewere rated BB by S&P and Ba2 by Moody’s.
Sources of Liquidity
The Company’s principal sources of liquidity include cash on hand, cash generated from operations, proceeds from sales of assets, borrowings under new and existing financing arrangements and the issuance of additional equity and debt securities by Clearway, Inc. or the Company as appropriate given market conditions. As described in Item 15 — Note 10, Long-term Debt, the Company’s financing arrangements consist of corporate level debt, which includes Senior Notes, intercompany borrowings with Clearway, Inc. and the revolving credit facility,facility; the ATM Program,Program; and project-level financings for its various assets.
Thermal Disposition
Cedro Hill Repowering Financing — On May 1, 2022,December 12, 2023, the Company completedentered into a financing agreement for non-recourse debt for a total commitment of $254 million related to the salerepowering of 100%the Cedro Hill wind project. The Company’s initial borrowing of its interests in$165 million was utilized to repay the Thermal Business$72 million of outstanding principal under the original financing agreement, to KKRpay $55 million to Clearway Renew for net proceedsthe future delivery of approximately $1.46 billion, inclusiveequipment, to pay $27 million to a third party for the future delivery of working capital adjustments, which excludes approximately $18equipment, to pay a $4 million development services fee to Clearway Renew, to pay for $4 million in transaction expensesdebt issuance costs that were incurreddeferred and to pay for $3 million in connection with the disposition. See Item 15 —Note 3, Acquisitions and Dispositions,for further discussion.capital expenditures.
Uses of Liquidity
The Company’s requirements for liquidity and capital resources, other than for operating its facilities, are categorized as: (i) debt service obligations, as described more fully in Item 15 — Note 10, Long-term Debt; (ii) capital expenditures; (iii) off-balance sheet arrangements; (iv) acquisitions and investments, as described more fully in Item 15 — Note 3, Acquisitions and Dispositionsand Note 5, Investments Accounted for by the Equity Method and Variable Interest Entities; and (v) distributions.
Debt Service Obligations
Principal payments on debt as of December 31, 2022,2023, are due in the following periods:
| | Description | Description | 2023 | | 2024 | | 2025 | | 2026 | | 2027 | | There- after | | Total | |
| (In millions) | |
| Description | |
| Description | |
| (In millions) | |
| (In millions) | |
| (In millions) | |
| Corporate-level debt: | Corporate-level debt: | | |
| Intercompany Note with Clearway Energy, Inc. | $ | 2 | | | $ | — | | | $ | — | | | $ | — | | | $ | — | | | $ | — | | | $ | 2 | | |
| Corporate-level debt: | |
| Corporate-level debt: | |
| Intercompany Note with Clearway, Inc. | |
| Intercompany Note with Clearway, Inc. | |
| Intercompany Note with Clearway, Inc. | |
| Clearway Energy Operating LLC Senior Notes, due 2028 | |
| Clearway Energy Operating LLC Senior Notes, due 2028 | |
| Clearway Energy Operating LLC Senior Notes, due 2028 | Clearway Energy Operating LLC Senior Notes, due 2028 | — | | | — | | | — | | | — | | | — | | | 850 | | | 850 | | |
| Clearway Energy Operating LLC Senior Notes, due 2031 | Clearway Energy Operating LLC Senior Notes, due 2031 | — | | | — | | | — | | | — | | | — | | | 925 | | | 925 | | |
| Clearway Energy Operating LLC Senior Notes, due 2031 | |
| Clearway Energy Operating LLC Senior Notes, due 2031 | |
| Clearway Energy Operating LLC Senior Notes, due 2032 | |
| Clearway Energy Operating LLC Senior Notes, due 2032 | |
| Clearway Energy Operating LLC Senior Notes, due 2032 | Clearway Energy Operating LLC Senior Notes, due 2032 | — | | | — | | | — | | | — | | | — | | | 350 | | | 350 | | |
| | Total Corporate-level debt | Total Corporate-level debt | 2 | | | — | | | — | | | — | | | — | | | 2,125 | | | 2,127 | | |
| | Total Corporate-level debt | |
| | Total Corporate-level debt | |
| Project-level debt: | |
| Project-level debt: | |
| Project-level debt: | Project-level debt: | | |
| Agua Caliente Solar LLC, due 2037 | Agua Caliente Solar LLC, due 2037 | 37 | | | 38 | | | 39 | | | 40 | | | 41 | | | 454 | | | 649 | | |
| Agua Caliente Solar LLC, due 2037 | |
| Agua Caliente Solar LLC, due 2037 | |
| Alta Wind Asset Management LLC, due 2031 | |
| Alta Wind Asset Management LLC, due 2031 | |
| Alta Wind Asset Management LLC, due 2031 | Alta Wind Asset Management LLC, due 2031 | 1 | | | 1 | | | 1 | | | 1 | | | 1 | | | 7 | | | 12 | | |
| Alta Wind I-V lease financing arrangements, due 2034 and 2035 | Alta Wind I-V lease financing arrangements, due 2034 and 2035 | 49 | | | 51 | | | 54 | | | 55 | | | 57 | | | 443 | | | 709 | | |
| Alta Wind I-V lease financing arrangements, due 2034 and 2035 | |
| Alta Wind I-V lease financing arrangements, due 2034 and 2035 | |
| Alta Wind Realty Investments LLC, due 2031 | Alta Wind Realty Investments LLC, due 2031 | 2 | | | 2 | | | 2 | | | 3 | | | 3 | | | 10 | | | 22 | | |
| | Alta Wind Realty Investments LLC, due 2031 | |
| Alta Wind Realty Investments LLC, due 2031 | |
| Borrego, due 2024 and 2038 | Borrego, due 2024 and 2038 | 3 | | | 3 | | | 2 | | | 3 | | | 3 | | | 37 | | | 51 | | |
| Borrego, due 2024 and 2038 | |
| Borrego, due 2024 and 2038 | |
| Broken Bow, due 2031 | |
| Broken Bow, due 2031 | |
| Broken Bow, due 2031 | |
| Buckthorn Solar, due 2025 | Buckthorn Solar, due 2025 | 3 | | | 4 | | | 112 | | | — | | | — | | | — | | | 119 | | |
| Capistrano Wind Portfolio, due 2029 and 2031 | 19 | | | 20 | | | 21 | | | 22 | | | 22 | | | 52 | | | 156 | | |
| Buckthorn Solar, due 2025 | |
| Buckthorn Solar, due 2025 | |
| Carlsbad Energy Holdings LLC, due 2027 | Carlsbad Energy Holdings LLC, due 2027 | 22 | | | 23 | | | 25 | | | 26 | | | 19 | | | — | | | 115 | | |
| | Carlsbad Energy Holdings LLC, due 2027 | |
| Carlsbad Energy Holdings LLC, due 2027 | |
| Carlsbad Energy Holdings LLC, due 2038 | |
| Carlsbad Energy Holdings LLC, due 2038 | |
| Carlsbad Energy Holdings LLC, due 2038 | Carlsbad Energy Holdings LLC, due 2038 | — | | | — | | | — | | | — | | | 7 | | | 400 | | | 407 | | |
| Carlsbad Holdco, LLC, due 2038 | Carlsbad Holdco, LLC, due 2038 | 2 | | | 2 | | | 3 | | | 9 | | | 11 | | | 170 | | | 197 | | |
| Carlsbad Holdco, LLC, due 2038 | |
| Carlsbad Holdco, LLC, due 2038 | |
Cedro Hill, due 2024 and 2029 (a) | |
Cedro Hill, due 2024 and 2029 (a) | |
Cedro Hill, due 2024 and 2029 (a) | |
| Crofton Bluffs, due 2031 | |
| Crofton Bluffs, due 2031 | |
| Crofton Bluffs, due 2031 | |
| CVSR, due 2037 | |
| CVSR, due 2037 | |
| CVSR, due 2037 | CVSR, due 2037 | 26 | | | 28 | | | 30 | | | 32 | | | 35 | | | 476 | | | 627 | | |
| CVSR Holdco Notes, due 2037 | CVSR Holdco Notes, due 2037 | 9 | | | 9 | | | 9 | | | 9 | | | 9 | | | 115 | | | 160 | | |
| CVSR Holdco Notes, due 2037 | |
| CVSR Holdco Notes, due 2037 | |
| Daggett 2, due 2028 | |
| Daggett 2, due 2028 | |
| Daggett 2, due 2028 | |
| Daggett 3, due 2028 | |
| Daggett 3, due 2028 | |
| Daggett 3, due 2028 | |
| DG-CS Master Borrower LLC, due 2040 | DG-CS Master Borrower LLC, due 2040 | 28 | | | 29 | | | 30 | | | 30 | | | 28 | | | 268 | | | 413 | | |
| Marsh Landing, due 2023 | 19 | | | — | | | — | | | — | | | — | | | — | | | 19 | | |
| Mililani I, due 2027 | 1 | | | 1 | | | 2 | | | 1 | | | 42 | | | — | | | 47 | | |
| DG-CS Master Borrower LLC, due 2040 | |
| DG-CS Master Borrower LLC, due 2040 | |
| Mililani Class B Member Holdco LLC, due 2028 | |
| Mililani Class B Member Holdco LLC, due 2028 | |
| Mililani Class B Member Holdco LLC, due 2028 | |
| NIMH Solar, due 2024 | |
| NIMH Solar, due 2024 | |
| NIMH Solar, due 2024 | NIMH Solar, due 2024 | 15 | | | 148 | | | — | | | — | | | — | | | — | | | 163 | | |
| Oahu Solar Holdings LLC, due 2026 | Oahu Solar Holdings LLC, due 2026 | 2 | | | 3 | | | 3 | | | 75 | | | — | | | — | | | 83 | | |
| Rosie Class B LLC, due 2027 | 2 | | | 3 | | | 3 | | | 3 | | | 65 | | | — | | | 76 | | |
| Utah Solar Holdings, due 2036 | 15 | | | 15 | | | 14 | | | 16 | | | 16 | | | 181 | | | 257 | | |
| Oahu Solar Holdings LLC, due 2026 | |
| Oahu Solar Holdings LLC, due 2026 | |
Rosie Class B LLC, due 2024 and 2029 (a) | |
Rosie Class B LLC, due 2024 and 2029 (a) | |
Rosie Class B LLC, due 2024 and 2029 (a) | |
| Texas Solar Nova 1, due 2028 | |
| Texas Solar Nova 1, due 2028 | |
| Texas Solar Nova 1, due 2028 | |
| Utah Solar Portfolio, due 2036 | |
| Utah Solar Portfolio, due 2036 | |
| Utah Solar Portfolio, due 2036 | |
| Viento Funding II, LLC, due 2029 | Viento Funding II, LLC, due 2029 | 8 | | | 16 | | | 17 | | | 20 | | | 24 | | | 99 | | | 184 | | |
Waiawa, due 2023 (a) | 97 | | | — | | | — | | | — | | | — | | | — | | | 97 | | |
| Walnut Creek, due 2023 | 19 | | | — | | | — | | | — | | | — | | | — | | | 19 | | |
| WCEP Holdings, LLC, due 2023 | 26 | | | — | | | — | | | — | | | — | | | — | | | 26 | | |
| Viento Funding II, LLC, due 2029 | |
| Viento Funding II, LLC, due 2029 | |
Victory Pass and Arica, due 2024 (a) | |
Victory Pass and Arica, due 2024 (a) | |
Victory Pass and Arica, due 2024 (a) | |
| Other | |
| Other | |
| Other | Other | 14 | | | 14 | | | 15 | | | 16 | | | 16 | | | 62 | | | 137 | | |
| Total project-level debt | Total project-level debt | 419 | | | 410 | | | 382 | | | 361 | | | 399 | | | 2,774 | | | 4,745 | | |
| Total project-level debt | |
| Total project-level debt | |
| Total debt | Total debt | $ | 421 | | | $ | 410 | | | $ | 382 | | | $ | 361 | | | $ | 399 | | | $ | 4,899 | | | $ | 6,872 | | |
| Total debt | |
| Total debt | |
(a) At December 31, 2022,2023, amount includes $97 million$1.11 billion of construction-related financings recorded in long-term debt on the Company’s consolidated balance sheet that is due in 20232024 and is either being funded through long-term equity contributions or is converting to long-term debt.
El Segundo Energy Center
On December 15, 2022, the Company repaid the outstanding project-level debt of El Segundo Energy Center in the amount of approximately $130 million utilizing cash on hand.
Bridge Loan Agreement
On May 3, 2022, the Company repaid the $335 million in outstanding borrowings under the Bridge Loan Agreement utilizing proceeds received from the Thermal Disposition.
Capital Expenditures
The Company’s capital spending program is mainly focused on maintenance capital expenditures, consisting of costs to maintain the assets currently operating, such as costs to replace or refurbish assets during routine maintenance, and growth capital expenditures consisting of costs to construct new assets, and costs to complete the construction of assets where construction is in process.
For the years ended December 31, 20222023 and 2021,2022, the Company used approximately $112$212 million and $151$112 million, respectively, to fund capital expenditures, including maintenance capital expenditures of $22 million and $25 million, for both years.respectively. Growth capital expenditures in 20222023 of $83$190 million in the Renewables segment were funded through construction-related financing. Renewables segment capital expenditures included $34$121 million incurred in connection with the Mililani IDaggett 3 solar project, $26$23 million incurred in connection with the Mesquite Sky windDaggett 2 solar project, $10$20 million incurred in connection with the Black Rock wind project, $5Victory Pass and Arica solar projects, $11 million incurred in connection with the Rattlesnake windWaiawa solar project and $8$15 million incurred by other wind and solar projects. Prior to the sale of the Thermal Business on May 1, 2022, the Company incurred $4 million of growth capital expenditures in the Thermal segment in connection with various development projects.
The Company estimates $35$40 million of maintenance capital expenditures for 2023.2024. These estimates are subject to continuing review and adjustment and actual capital expenditures may vary from these estimates.
Off-Balance Sheet Arrangements
Obligations under Certain Guarantee Contracts
The Company may enter into guarantee arrangements in the normal course of business to facilitate commercial transactions with third parties.
Retained or Contingent Interests
The Company does not have any material retained or contingent interests in assets transferred to an unconsolidated entity.
Obligations Arising Out of a Variable Interest in an Unconsolidated Entity
Variable interest in equity investments — As of December 31, 2022,2023, the Company has several investments with an ownership interest percentage of 50% or less. GenConn is aand Rosie Central BESS are variable interest entityentities for which the Company is not the primary beneficiary. The Company’s pro-rata share of non-recourse debt held by unconsolidated affiliates was approximately $325$303 million as of December 31, 2022.2023. This indebtedness may restrict the ability of these subsidiaries to issue dividends or distributions to the Company. See also Item 15 — Note 5, Investments Accounted for by the Equity Method and Variable Interest Entities.
Contractual Obligations and Commercial Commitments
In addition to the Company’s capital expenditure programs, the Company has a variety of contractual obligations and other commercial commitments that represent prospective cash requirements. The following table summarizes the Company’s contractual obligations. See Item 15 — Note 10, Long-term Debt Note 14, Commitments and Contingencies, and Note 15, Leases, for additional discussion.
| | By Remaining Maturity at December 31, |
| 2022 | | 2021 |
| By Remaining Maturity at December 31, | | | By Remaining Maturity at December 31, |
| 2023 | | | 2023 | | 2022 |
| Contractual Cash Obligations | Contractual Cash Obligations | Under
1 Year | | 1-3 Years | | 3-5 Years | | Over
5 Years | | Total | | Total | Contractual Cash Obligations | Under
1 Year | | 1-3 Years | | 3-5 Years | | Over
5 Years | | Total |
| (In millions) |
| (In millions) | | | (In millions) |
| Long-term debt (including estimated interest) | Long-term debt (including estimated interest) | $ | 710 | | | $ | 1,309 | | | $ | 1,209 | | | $ | 5,635 | | | $ | 8,863 | | | $ | 10,796 | |
| Operating leases | Operating leases | 28 | | | 60 | | | 63 | | | 831 | | | 982 | | | 942 | |
Fuel purchase and transportation obligations (a) | — | | | — | | | — | | | — | | | — | | | 8 | |
Natural gas transportation obligations (a) | |
Other liabilities (b) | Other liabilities (b) | 25 | | | 47 | | | 40 | | | 188 | | | 300 | | | 310 | |
| Total | Total | $ | 763 | | | $ | 1,416 | | | $ | 1,312 | | | $ | 6,654 | | | $ | 10,145 | | | $ | 12,056 | |
(a)These contractual cash obligations were relatedrelate to reservation charges under the Thermal Business, which was sold on May 1, 2022.backbone transportation service contracts.
(b) Includes water right agreements, service and maintenance agreements and LTSA commitments.
Acquisitions and Investments
The Company intends to acquire generation assets developed and constructed by CEG as well as generation assets from third parties where the Company believes its knowledge of the market and operating expertise provides a competitive advantage, and to utilize such acquisitions as a means to grow its business.
Texas Solar Nova 1 Drop Down— On December 28, 2023, the Company, through its indirect subsidiary, Lighthouse Renewable Holdco 2 LLC, acquired TSN1 BL Borrower Holdco LLC, the indirect owner of Texas Solar Nova 1, a 252 MW solar project that is located in Kent County, Texas, from Clearway Renew for cash consideration of $23 million. Lighthouse Renewable Holdco 2 LLC is a partnership between the Company and a cash equity investor. The cash equity investor also contributed cash consideration of $109 million to acquire their portion of the acquired entity. TSN1 BL Borrower Holdco LLC consolidates as primary beneficiary, TSN1 TE Holdco LLC, a tax equity fund that owns the Texas Solar Nova 1 solar project.Texas Solar Nova 1 has an 18-year PPA with an investment-grade counterparty that commenced in January 2024. The acquisition was funded with existing sources of liquidity. Additionally, the Company assumed the project’s financing agreement, which included a construction loan that converted to a term loan at acquisition date along with a sponsor equity bridge loan and tax equity bridge loan that were both repaid at acquisition date.
Victory Pass and Arica Drop Down — On October 31, 2023, the Company, through its indirect subsidiary, VP-Arica Parent Holdco LLC, acquired the Class A membership interests in VP-Arica TargetCo LLC, a partnership and the indirect owner of the Victory Pass and Arica solar projects, from Clearway Renew for initial cash consideration of $46 million. At substantial completion, which is expected to occur in the first half of 2024, the Company estimates it will pay an additional $182 million to Clearway Renew. VP Arica TargetCo LLC consolidates as primary beneficiary, VP-Arica TE Holdco LLC, a tax equity fund that owns the Victory Pass and Arica solar projects. Victory Pass and Arica each have PPAs with investment-grade counterparties that have a 15-year and 14-year weighted average contract duration, respectively, that commence when the underlying operating assets reach commercial operations, which is expected to occur in the first half of 2024. The acquisition was funded with existing sources of liquidity. As part of the acquisition of Victory Pass and Arica, the Company assumed the project’s financing agreement, which included a sponsor equity bridge loan that was partially paid off at acquisition date, and a tax equity bridge loan, both of which will be completely paid off when the projects reach substantial completion. Subsequent to the acquisition, the Company borrowed an additional $22 million in tax equity bridge loans.
Daggett 2 Drop Down — On August 30, 2023, the Company, through its indirect subsidiary, Daggett Solar Investment LLC, acquired the Class A membership interests in Daggett 2 TargetCo LLC, a partnership and the indirect owner of the Daggett 2 solar project, from CEG for cash consideration of $13 million. Daggett 2 TargetCo LLC consolidates as primary beneficiary, Daggett 2 TE Holdco LLC, a tax equity fund that owns the Daggett 2 solar project. Daggett 2 has PPAs with investment-grade counterparties that have a 15-year weighted average contract duration that commenced in December 2023. The acquisition was funded with existing sources of liquidity. Additionally, the Company assumed the project’s financing agreement, which included a construction loan, a tax equity bridge loan and a sponsor equity bridge loan that was repaid at acquisition date. Subsequent to the acquisition, the Company borrowed an additional $49 million in construction loans. Upon the project reaching substantial completion on December 22, 2023, the tax equity bridge loan was repaid and the total outstanding construction loans were converted to a term loan in the amount of $156 million.
Rosamond Central BESS Drop Down and Financing Activities — On June 30, 2023, the Company, through its indirect subsidiary, Rosie Class B LLC, the indirect owner of the Rosamond Central solar project, became the owner of the Class B membership interests of Rosie Central BESS in order to facilitate and fund the construction of a BESS project that is co-located at the Rosamond Central solar facility. Clearway Renew indirectly owns the Class A membership interests and controls Rosie Central BESS. As of December 31, 2023, the Company’s investment, which is accounted for under the equity method of accounting, consisted of $28 million contributed into Rosie Central BESS, funded through contributions from the Company and its cash equity investor in Rosie TargetCo LLC, which consolidates Rosie Class B LLC. On December 1, 2023, the Rosamond Central solar project acquired the BESS project from Clearway Renew for initial cash consideration of $70 million, $16 million of which was funded by the Company with the remaining $54 million funded through contributions from third-party investors. At substantial completion, which is expected to occur in the first half of 2024, the Company estimates it will pay an additional $279 million to Clearway Renew, $61 million of which will be funded by the Company with the remaining $218 million to be funded through contributions from the third-party investors. Also, at substantial completion, Clearway Renew will return Rosie Class B LLC’s equity investment. The BESS project has a PPA for capacity with an investment-grade utility that has a 15-year contract duration that commences when the project reaches commercial operations, which is expected to occur in the first half of 2024. The Company’s portion of the initial consideration was funded with existing sources of liquidity.
On June 30, 2023, Rosie Class B LLC amended its financing agreement. During the year ended December 31, 2023, Rosie Class B LLC received total loan proceeds of $265 million under the amended financing agreement. On July 3, 2023, Rosie Class B LLC issued a loan to Clearway Renew, utilizing a portion of the loan proceeds under the amended financing agreement, in order to finance the construction of the BESS project. On December 1, 2023, Clearway Renew partially repaid the loan utilizing the $70 million in proceeds that was paid by the Company to acquire the BESS project. As of December 31, 2023, the loan had an aggregate principal amount of $174 million and matures when the project reaches substantial completion. Also, during the year ended December 31, 2023, the Company utilized a portion of the loan proceeds received under the amended financing agreement to contribute $18 million into Rosie Central BESS.
Waiawa Drop Down —In connection with the 2022 Drop Down of Waiawa, the Company assumed the project’s financing agreement, which includes a construction loan that converted to a term loan on March 30, 2023 upon the project reaching substantial completion and a tax equity bridge loan that was repaid on March 30, 2023.
Daggett 3 Drop Down — On February 17, 2023, the Company, through a partnership with a third-party investor,its indirect subsidiary, Daggett Solar Investment LLC, acquired an interestthe Class A membership interests in Daggett TargetCo LLC, the indirect owner of the Daggett 3 solar project, from Clearway Renew LLC for cash consideration of $21 million.million and then contributed its Class A membership interests into Daggett Renewable Holdco LLC, a partnership that consolidates Daggett TargetCo LLC. Daggett TargetCo LLC is theconsolidates as primary beneficiary, and consolidates its interest inDaggett TE Holdco LLC, a tax equity fund Daggett TE Holdco LLC, the owner ofthat owns the Daggett 3 solar project. Daggett 3 has PPAs with investment-grade counterparties that have a 15-year weighted average contract duration that commence when the project reaches commercial operations, which is expected to occur in the first half ofcommenced between July 2023 and November 2023. The acquisition was funded with existing sources of liquidity.
Waiawa Drop Down — On October 3, 2022, the Company, through a partnership with a third-party investor, acquired Waiawa BL Borrower Holdco LLC, the indirect owner, through its ownership interests in and consolidation of a tax equity fund, of the Waiawa solar project, from Clearway Renew LLC for cash consideration of $20 million. Waiawa has a 20-year PPA with an investment-grade utility that commenced in January 2023. The acquisition was funded with existing sources of liquidity. As part of the acquisition, Additionally, the Company assumed the project’s financing agreement, which includesincluded a construction loan, that converts to a term loan upon the project reaching substantial completion, which is expected to occur in the first half of 2023, a tax equity bridge loan that will be repaid upon the project reaching substantial completion and a sponsor equity bridge loan that was repaid at acquisition date.
Capistrano Wind Portfolio Acquisition — On August 22, 2022, the Company acquired the Capistrano Wind Portfolio from Capistrano Wind Partners LLC for total net consideration of approximately $239 million. The assets within the portfolio sell power under PPAs with investment-grade counterparties that have a weighted average remaining contract duration of approximately 10 years. The acquisition was funded with existing sources of liquidity. As part of Subsequent to the acquisition, the Company assumed non-recourse project-level debt held byborrowed an additional $36 million in construction loans. Upon the projects inproject reaching substantial completion on December 1, 2023, the portfolio.
Mililani I Drop Down — On March 25, 2022, the Company, through a partnership with a third-party investor, acquired Mililani BL Borrower Holdco LLC, the indirect owner, through its ownership interests in and consolidation of a tax equity fund, ofbridge loan was repaid and the Mililani I solar project from Clearway Renew LLC for cash consideration of $22 million. Mililani I has a 20-year PPA with an investment-grade utility that commenced in July 2022. The acquisition was funded with existing sources of liquidity. As part of the acquisition, the Company assumed the project’s financing agreement, which includes atotal outstanding construction loan thatloans were converted to a term loan on December 7, 2022 uponin the amount of $217 million. CEG also funded an additional $54 million in project reaching substantial completion a tax equity bridge loan thatcosts subsequent to the acquisition, which was repaid on December 7, 2022 and a sponsor equity bridge loan that was repaid at acquisition date.
Black Rock Drop Down— In February 2022,to CEG in connection with the 2021 Black Rock Drop Down, the Company paid an additional $23 million to Clearway Renew, LLC as final funding after all remaining turbines of the project became operational.October 2023.
Cash Distributions to Clearway, Inc. and CEG
The Company intends to distribute to its unit holders in the form of a quarterly distribution all of the CAFD that is generated each quarter less reserves for the prudent conduct of the business, including among others, maintenance capital expenditures to maintain the operating capacity of the assets. Distributions on units are subject to available capital, market conditions and compliance with associated laws, regulations and other contractual obligations. The Company expects that, based on current circumstances, comparable distributions will continue to be paid in the foreseeable future.
The following table lists the distributions paid on the Company’s Class A, Class B, Class C and Class D units during the year ended December 31, 2022:2023:
| | Fourth Quarter 2022 | | Third Quarter 2022 | | Second Quarter 2022 | | First Quarter 2022 |
| Fourth Quarter 2023 | | | Fourth Quarter 2023 | | Third Quarter 2023 | | Second Quarter 2023 | | First Quarter 2023 |
| Distributions per Class A and Class B units | Distributions per Class A and Class B units | $ | 0.3672 | | | $ | 0.3604 | | | $ | 0.3536 | | | $ | 0.3468 | |
| Distributions per Class C and Class D units | Distributions per Class C and Class D units | 0.3672 | | | 0.3604 | | | 0.3536 | | | 0.3468 | |
On February 15, 2023,14, 2024, the Company declared a quarterly distribution on its Class A, Class B, Class C and Class D units of $0.3745$0.4033 per unit payable on March 15, 2023.2024.
Cash Flow Discussion
Year Ended December 31, 2022 Compared to Year Ended December 31, 2021
The following table reflects the changes in cash flows for the year ended December 31, 2022 compared to 2021:comparative periods:
| | Year ended December 31, | Year ended December 31, | 2022 | | 2021 | | Change |
| (In millions) |
| 2023 | |
| 2023 | |
| 2023 | | | 2022 | | Change |
| (In millions) | | | (In millions) |
| Net cash provided by operating activities | Net cash provided by operating activities | $ | 797 | | | $ | 701 | | | $ | 96 | |
| Net cash provided by (used in) investing activities | 1,065 | | | (865) | | | 1,930 | |
| Net cash (used in) provided by financing activities | (1,520) | | | 367 | | | (1,887) | |
| Net cash (used in) provided by investing activities | |
| Net cash used in financing activities | |
Net Cash Provided by Operating Activities
| | | | | |
| Changes to net cash provided by operating activities were driven by: | (In millions) |
Increase in operating income adjusted for non-cash items | $ | 88 | |
IncreaseDecrease in working capital primarily driven by the timing of accounts receivable collections and payments of accounts payable | 27 $ | (41) | |
| Decrease in operating income after adjusting for non-cash items | (34) | |
| Decrease in distributions from unconsolidated affiliates | (7) | |
| Transaction expenses paid on May 1, 2022 in connection with the sale of the Thermal Business | (18)18 | |
| Decrease in distributions from unconsolidated affiliates(1) | |
| $ | 96 (64) | |
Net Cash (Used In) Provided by (Used In) Investing Activities
| | | | | |
Changes to net cash (used in) provided by (used) in investing activities were driven by: | (In millions) |
| Proceeds from the sale of the Thermal Business in 2022 | $ | 1,457 (1,457) | |
Cash paid for acquisitions, net of cash acquired,Increase in 2021note receivable — affiliate | 533 (174) | |
| Increase in capital expenditures | (100) | |
| Payment for equipment deposit from affiliate in 2023 | (55) | |
| Increase in investments in unconsolidated affiliates | (28) | |
| Payment for equipment deposit in 2023 | (27) | |
| Acquisition of the Capistrano Wind Portfolio in 2022 | 223 | |
| Decrease in cash paid for Drop Down assets, net of cash acquired | 15826 | |
Decrease in capital expenditures | 39 | |
Cash paid to CEG in 2021 for equipment for the Pinnacle wind project repowering | 21 | |
Cash paid to CEG in 2022 for Capistrano Wind Portfolio | (223) | |
Decrease in the return of investment from unconsolidated affiliates | (34) | |
| Other | (21)4 | |
| $ | 1,930 (1,588) | |
Net Cash (Used In) Provided byUsed In Financing Activities
| | | | | |
Changes in net cash (used in) provided byused in financing activities were driven by: | (In millions) |
DecreaseIncrease in contributions from noncontrolling interests and CEG, net of distributions | $ | (907)968 | |
Decrease in proceeds frompayments for the revolving credit facility, net of paymentsproceeds | (490)245 | |
DecreaseIncrease in paymentsproceeds for long-term debt, net of proceedsan increase in payments | (389)166 | |
| Cash released from escrow distributed to CEG in 2022 | (64)64 | |
| Increase in tax-related distributions | (32) | |
Increase in distributions paid to unit holders in 2022 | (21)(22) | |
Tax-related distributionsIncrease in 2022payments of debt issuance costs | (19)(14) | |
| Buyout of noncontrolling interest and redeemable noncontrolling interest in 2023 | (13) | |
| Other | 3 | |
| $ | (1,887)1,365 | |
Fair Value of Derivative Instruments
The Company may enter into energy-related commodity purchase contracts and other energy-related financial instruments to mitigate variability in earnings due to fluctuations in spot market prices. In addition, in order to mitigate interest rate risk associated with the issuance of variable rate debt, the Company enters into interest rate swap agreements.
The tables below disclose the activities of non-exchange traded contracts accounted for at fair value in accordance with ASC 820. Specifically, these tables disaggregate realized and unrealized changes in fair value; disaggregate estimated fair values at December 31, 20222023, based on their level within the fair value hierarchy defined in ASC 820; and indicate the maturities of contracts at December 31, 20222023. For a full discussion of the Company’s valuation methodology of its contracts, see Derivative Fair Value Measurements in Item 15 — Note 6, Fair Value of Financial Instruments.
| | | | | |
| Derivative Activity ( Losses)/Gains | (In millions) |
Fair value of contracts as of December 31, 20212022 | $ | (236)(264) | |
| Contracts realized or otherwise settled during the period | 11834 | |
| Contracts acquired during the period | 2447 | |
| Contracts added due to loss of NPNS exception | (22) |
| Contracts removed during the period | 1 |
| Changes in fair value | (149)(26) | |
Fair value of contracts as of December 31, 20222023 | $ | (264)(209) | |
| | Fair value of contracts as of December 31, 2023 | | | Fair value of contracts as of December 31, 2023 |
| Maturity | | | Maturity |
| Fair Value Hierarchy Losses | | Fair Value Hierarchy Losses | 1 Year or Less | | Greater Than 1 Year to 3 Years | | Greater Than 3 Years to 5 Years | | Greater Than 5 Years | | Total Fair Value |
| (In millions) | | | (In millions) |
| | Fair value of contracts as of December 31, 2022 |
| Maturity |
| Fair Value Hierarchy Losses | 1 Year or Less | | Greater Than 1 Year to 3 Years | | Greater Than 3 Years to 5 Years | | Greater Than 5 Years | | Total Fair Value |
| (In millions) |
| | Level 2 | |
| Level 2 | |
| Level 2 | Level 2 | $ | 26 | | | $ | 36 | | | $ | 16 | | | $ | 11 | | | $ | 89 | |
| Level 3 | Level 3 | (50) | | | (92) | | | (76) | | | (135) | | | (353) | |
| Total | Total | $ | (24) | | | $ | (56) | | | $ | (60) | | | $ | (124) | | | $ | (264) | |
The Company has elected to disclose derivative assets and liabilities on a trade-by-trade basis and does not offset amounts at the counterparty master agreement level.
Critical Accounting Policies and Estimates
The Company’s discussion and analysis of the financial condition and results of operations are based upon the consolidated financial statements, which have been prepared in accordance with GAAP. The preparation of these financial statements and related disclosures in compliance with GAAP requires the application of appropriate technical accounting rules and guidance as well as the use of estimates and judgments that affect the reported amounts of assets, liabilities, revenues and expenses, and related disclosures of contingent assets and liabilities. The application of these policies necessarily involves judgments regarding future events, including the likelihood of success of particular projects, legal and regulatory challenges and the fair value of certain assets and liabilities. These judgments, in and of themselves, could materially affect the financial statements and disclosures based on varying assumptions, which may be appropriate to use. In addition, the financial and operating environment may also have a significant effect, not only on the operation of the business, but on the results reported through the application of accounting measures used in preparing the financial statements and related disclosures, even if the nature of the accounting policies has not changed.
On an ongoing basis, the Company evaluates these estimates, utilizing historic experience, consultation with experts and other methods the Company considers reasonable. Actual results may differ substantially from the Company’s estimates. Any effects on the Company’s business, financial position or results of operations resulting from revisions to these estimates are recorded in the period in which the information that gives rise to the revision becomes known.
The Company’s significant accounting policies are summarized in Item 15 — Note 2, Summary of Significant Accounting Policies. The Company identifies its most critical accounting policies as those that are the most pervasive and important to the portrayal of the Company’s financial position and results of operations, and that require the most difficult, subjective and/or complex judgments by management regarding estimates about matters that are inherently uncertain. The Company’s critical accounting policies include accounting utilizing Hypothetical Liquidation at Book Value, or HLBV, acquisition accounting and determining the fair value of financial instruments.
| | | | | |
| Accounting Policy | Judgments/Uncertainties Affecting Application |
| |
| |
| |
| |
| |
| |
| Hypothetical Liquidation at Book Value (HLBV) | Estimates of taxable income (loss) and tax capital accounts |
| Estimated calculation of specified target investor returns |
| Application of liquidation provisions of operating agreements |
| |
| |
| |
| |
| Acquisition Accounting | Identification of assets acquired |
| Inputs for fair values of assets and liabilities acquired |
| Application of appropriate fair value methodologies |
| Financial Instruments | Use of unobservable market inputs such as future electricity prices, future interest rates and discount rates |
|
Hypothetical Liquidation at Book Value (HLBV)
Certain portions of the Company’s redeemable noncontrolling interest and noncontrolling interest represent third-party interests in the net assets under certain tax equity arrangements, which are consolidated by the Company, that were established to finance the cost of facilities eligible for certain tax credits and benefits. The Company has determined that the provisions in the contractual agreements of these structures represent substantive profit sharing arrangements. Further, the Company has determined that the appropriate methodology for calculating the redeemable noncontrolling interest and noncontrolling interest that reflects the substantive profit sharing arrangements is a balance sheet approach utilizing the HLBV method. Under the HLBV method, the amounts reported as redeemable noncontrolling interest and noncontrolling interest represent the amounts the investors to the tax equity arrangements would hypothetically receive at each balance sheet date under the liquidation provisions of the contractual agreements, assuming the net assets of the funding structures were liquidated at their recorded amounts determined in accordance with GAAP. The investors’ interests in the results of operations of the funding structures are determined as the difference in redeemable noncontrolling interest and noncontrolling interest at the start and end of each reporting period, after taking into account any capital transactions between the structures and the funds’ investors. The calculations utilized to apply the HLBV method include estimated calculations of taxable income or losses for each reporting period as well as estimated calculations of tax capital accounts based on the relevant provisions of each agreement and the related tax guidance. In addition, these calculations often take into account the stipulated targeted investor return specified in the subsidiaries’ operating agreement and agreed by the members of the arrangement. In certain circumstances, the Company and its partners in the tax equity arrangements agree that certain tax benefits are to be utilized outside of the tax equity arrangements, which may result in differences in the amount an investor would hypothetically receive at the initial balance sheet date calculated strictly in accordance with related contractual agreements. These differences are recognized in the consolidated statementstatements of income using a systematic and rational method over the period during which the investor is expected to achieve its target return. In certain cases, the Company must apply judgment in determining the methodology for applying these concepts in the HLBV method and changes in certain factors may have a significant impact on the amounts that an investor would receive upon a hypothetical liquidation. The use of the HLBV method to allocate income (loss) to the noncontrolling interest holders may create volatility in the consolidated statements of income.
Acquisition Accounting
The Company applies ASC 805, Business Combinations, when accounting for acquisitions, with identifiable assets acquired and liabilities assumed recorded at their estimated fair values at acquisition date. For many of the Company’s acquisitions, the Company applies ASC 805-50, which provides that acquisitions of entities under common control are recorded at historical cost, except in the case where the ultimate parent has a different basis, such as when an acquiree did not elect to apply pushdown accounting. In those circumstances, the Company may also be required to record its acquired assets and liabilities at acquisition date fair value.
Significant judgment is required in determining the acquisition date fair value of the assets acquired and liabilities assumed, predominantly with respect to property, plant and equipment, power purchase agreements, asset retirement obligations and other contractual arrangements for third-party acquisitions. Evaluations include numerous inputs including forecasted cash flows that incorporate the specific attributes of each asset including age, useful life, equipment condition and technology as well as current replacement costs for similar assets. Other key inputs that require judgment include discount rates, comparable market transactions, estimated useful lives and probability of future transactions. The Company evaluates all available information as well as all appropriate methodologies, when determining the fair value of assets acquired and liabilities assumed in a business combination. In addition, once the appropriate fair values are determined, the Company must determine the remaining useful life for property, plant and equipment and the amortization period and method of amortization for each finite-lived intangible asset.
Financial Instruments
The Company records its financial instruments, which primarily consist of derivative financial instruments, at fair value. The Company determines the fair value of its financial instruments using discounted cash flow models that require the use of assumptions concerning the amount of estimated future cash flows. The assumptions are determined using external, observable market inputs when available. When observable market inputs are not available, the Company must apply significant judgment to determine market participant assumptions such as future electricity prices, future natural gas prices, future interest rates and discount rates. As these inputs are based on estimates, fair values may not reflect the amounts actually realized from the related transaction.
Recent Accounting Developments
See Item 15 — Note 2, Summary of Significant Accounting Policies, for a discussion of recent accounting developments.
Item 7A — Quantitative and Qualitative Disclosures About Market Risk
The Company is exposed to several market risks in its normal business activities. Market risk is the potential loss that may result from market changes associated with the Company’s power generation or with an existing or forecasted financial or commodity transaction. The types of market risks the Company is exposed to are commodity price risk, interest rate risk, liquidity risk and credit risk.
Commodity Price Risk
Commodity price risks result from exposures to changes in spot prices, forward prices, volatilities, and correlations between various commodities, such as electricity, natural gas and emissions credits. The Company manages the commodity price risk of certain of its merchant generation operations by entering into derivative or non-derivative instruments to hedge the variability in future cash flows from forecasted power sales. The portion of forecasted transactions hedged may vary based upon management’s assessment of market, weather, operation and other factors. See Item 15 — Note 7, Accounting for Derivative Instruments and Hedging Activities, for more information.
Based on a sensitivity analysis using simplified assumptions, the impact of a $0.50 per MWh increase or decrease in power prices across the term of the derivativelong-term power commodity contracts would cause a change of approximately $76 million to the net value of powerthe related derivatives as of December 31, 2022.2023.
Interest Rate Risk
The Company is exposed to fluctuations in interest rates through its issuance of variable rate debt. Exposures to interest rate fluctuations may be mitigated by entering into derivative instruments known as interest rate swaps, caps, collars and put or call options. These contracts reduce exposure to interest rate volatility and result in primarily fixed rate debt obligations when taking into account the combination of the variable rate debt and the interest rate derivative instrument. See Item 15 — Note 7, Accounting for Derivative Instruments and Hedging Activities, for more information.
Most of the Company’s project subsidiaries enter into interest rate swaps intended to hedge the risks associated with interest rates on non-recourse project level debt. See Item 15 — Note 10, Long-term Debt, for more information about interest rate swaps of the Company’s project subsidiaries.
If all of the above swaps had been discontinued on December 31, 20222023, the counterparties would have owed the Company $93127 million. Based on the credit ratings of the counterparties, the Company believes its exposure to credit risk due to nonperformance by counterparties to its hedge contracts to be insignificant.
The Company has long-term debt instruments that subject it to the risk of loss associated with movements in market interest rates. As of December 31, 20222023, a 1% change in interest rates would result in an approximately $1$4 million change in interest expense on a rolling twelve-month basis.
As of December 31, 20222023, the fair value of the Company’s debt was $6,288 million$7.61 billion and the carrying value was $6,874 million. $8.10 billion. The Company estimates that a 1% decrease in market interest rates would have increased the fair value of its long-term debt by $358$338 million.
Liquidity Risk
Liquidity risk arises from the general funding needs of the Company’s activities and in the management of the Company’s assets and liabilities.
Counterparty Credit Risk
Credit risk relates to the risk of loss resulting from non-performance or non-payment by counterparties pursuant to the terms of their contractual obligations. The Company monitors and manages credit risk through credit policies that include: (i) an established credit approval process, and (ii) the use of credit mitigation measures such as prepayment arrangements or volumetric limits. Risks surrounding counterparty performance and credit could ultimately impact the amount and timing of expected cash flows. The Company seeks to mitigate counterparty risk by having a diversified portfolio of counterparties. See Item 15 — Note 6, Fair Value of Financial Instruments, for more information about concentration of credit risk.
Item 8 — Financial Statements and Supplementary Data
The financial statements and schedules are listed in Part IV, Item 15 of this Form 10-K.
Item 9 — Changes in and Disagreements with Accountants on Accounting and Financial Disclosure
As previously reported in the Company’s Current Report on Form 8-K filed on March 15, 2021, on March 9, 2021, the Audit Committee of the Board of Directors of the Company dismissed KPMG LLP as the Company’s independent registered public accounting firm and appointed Ernst & Young LLP, an independent registered public accounting firm, to audit the consolidated financial statements of the Company and its subsidiaries for the fiscal year ending December 31, 2021. For more information, please refer to the Company’s Current Report on Form 8-K filed on March 15, 2021.None.
Item 9A — Controls and Procedures
Conclusion Regarding the Effectiveness of Disclosure Controls and Procedures and Internal Control Over Financial Reporting
Under the supervision and with the participation of the Company’s management, including its principal executive officer, principal financial officer and principal accounting officer, the Company conducted an evaluation of the effectiveness of the design and operation of its disclosure controls and procedures, as such term is defined in Rules 13a-15(e) or 15d-15(e) of the Exchange Act. Based on this evaluation, the Company’s principal executive officer, principal financial officer and principal accounting officer concluded that the disclosure controls and procedures were effective as of the end of the period covered by this Annual Report on Form 10-K.
Changes in Internal Control over Financial Reporting
There were no changes in the Company’s internal control over financial reporting (as such term is defined in Rule 13a-15(f) under the Exchange Act) during the quarter ended December 31, 2022,2023, that materially affected, or are reasonably likely to materially affect, the Company’s internal control over financial reporting.
Inherent Limitations over Internal Controls
The Company’s internal control over financial reporting is designed to provide reasonable assurance regarding the reliability of financial reporting and the preparation of consolidated financial statements for external purposes in accordance with GAAP. The Company’s internal control over financial reporting includes those policies and procedures that:
1. Pertain to the maintenance of records that, in reasonable detail, accurately and fairly reflect the transactions and dispositions of the Company’s assets;
2. Provide reasonable assurance that transactions are recorded as necessary to permit preparation of consolidated financial statements in accordance with GAAP, and that the Company’s receipts and expenditures are being made only in accordance with authorizations of its management and directors; and
3. Provide reasonable assurance regarding prevention or timely detection of unauthorized acquisition, use or disposition of the Company’s assets that could have a material effect on the consolidated financial statements.
Internal control over financial reporting cannot provide absolute assurance of achieving financial reporting objectives because of its inherent limitations, including the possibility of human error and circumvention by collusion or overriding of controls. Accordingly, even an effective internal control system may not prevent or detect material misstatements on a timely basis. Also, projections of any evaluation of effectiveness to future periods are subject to the risk that controls may become inadequate because of changes in conditions or that the degree of compliance with the policies or procedures may deteriorate.
Management’s Report on Internal Control over Financial Reporting
The Company’s management is responsible for establishing and maintaining adequate internal control over financial reporting, as such term is defined in Exchange Act Rule 13a-15(f). Under the supervision and with the participation of the Company’s management, including its principal executive officer, principal financial officer and principal accounting officer, the Company conducted an evaluation of the effectiveness of its internal control over financial reporting based on the framework in Internal Control — Integrated Framework (2013) issued by the Committee of Sponsoring Organizations of the Treadway Commission. Based on the Company’s evaluation under the framework in Internal Control — Integrated Framework (2013), the Company’s management concluded that its internal control over financial reporting was effective as of December 31, 2022.2023.
Item 9B — Other Information
None.During the three months ended December 31, 2023, no director or officer (as defined in Rule 16a-1(f) under the Exchange Act) of the Company adopted, modified or terminated a “Rule 10b5-1 trading arrangement” or “non-Rule 10b5-1 trading arrangement,” as each term is defined in Item 408(a) of Regulation S-K.
PART III
Item 10 — Information about Directors, Executive Officers and Corporate Governance
The Company is a limited liability company that is managed by Clearway, Inc., as its sole managing member. As a limited liability company managed by Clearway, Inc., the Company does not have a board of directors. References herein to the Company’s board of directors are references to the board of directors (the “Board”) of Clearway, Inc. Pursuant to the Fourth Amended and Restated Limited Liability Company Agreement of the Company, Clearway, Inc. has appointed officers of the Company and designated certain of such officers as “Executive Officers.” These executive officers are the same as the executive officers of Clearway, Inc.
The following table shows information for the Company’s executive officers. Executive officers serve until their successors are duly appointed or elected.
| | | | | | | | |
| Name | Age | Title |
| Christopher S. Sotos | 5152 | President and Chief Executive Officer |
| Sarah Rubenstein | 4546 | SeniorExecutive Vice President, Chief AccountingFinancial Officer |
| Kevin P. Malcarney | 5657 | SeniorExecutive Vice President, General Counsel and Corporate Secretary |
Christopher S. Sotos has served as President and Chief Executive Officer since May 2016, and as a member of the Board of Clearway, Inc. since May 2013. Mr. Sotos had also served in various positions at NRG, including most recently as Executive Vice President-Strategy and Mergers and Acquisitions from February 2016 through May 2016 and Senior Vice President-Strategy and Mergers and Acquisitions from November 2012 through February 2016. In this role, he led NRG’s corporate strategy, mergers and acquisitions, strategic alliances and other special projects for NRG. Previously, he served as NRG’s Senior Vice President and Treasurer from March 2008 to September 2012, where he was responsible for all treasury functions, including raising capital, valuation, debt administration and cash management. Mr. Sotos also previously served as a director of FuelCell Energy, Inc. from September 2014 to April 2019. As President and Chief Executive Officer of the Company, Mr. Sotos provides the Board of Clearway, Inc. with management’s perspective regarding the Company’s day to day operations and overall strategic plan. Mr. Sotos also brings strong financial and accounting skills to the Board of Clearway, Inc.
Sarah Rubenstein has served as Executive Vice President and Chief Financial Officer of the Company since April 2023 and previously served as Senior Vice President and Chief Accounting Officer of the Company sincefrom January 2022 to March 2023 and previously served as Vice President, Accounting and Controller from November 2020 through December 2021.2021, where she was responsible for providing oversight of the Company’s financial accounting and reporting functions. Ms. Rubenstein previously served as Assistant Controller of the Company sincefrom August 2018 through November 2020, where she was responsible for managing corporate accounting and financial reporting activities, and immediately prior to that, as Director of Accounting Research and Financial Reporting at NRG Energy, Inc. from August 2012 through August 2018. Ms. Rubenstein’s prior roles include Director of Finance at EPV Solar, Inc. and Senior Director of Financial Reporting at Warner Music Group. Ms. Rubenstein began her career as an auditor with PricewaterhouseCoopers.
Kevin P. Malcarney has served as the Company’s General Counsel and Corporate Secretary since May 11, 2018, and was promoted from Senior Vice President to Executive Vice President in January 2022. Mr. Malcarney served as Interim General Counsel of the Company from March 16, 2018 to May 11, 2018. Mr. Malcarney was previously Vice President and Deputy General Counsel and served in various other roles at NRG since September 2008. Prior to NRG, Mr. Malcarney worked at two major law firms in Princeton, New Jersey and Philadelphia, Pennsylvania, and handled mergers and acquisitions, project financing and general corporate matters.
Code of Ethics
The Company has not adopted a separate code of ethics because all of the officers of the Company are subject to the Code of Conduct adopted by the Board of Clearway, Inc. The Code of Conduct of Clearway, Inc. applies to all of its directors and employees, including its and the Company’s officers (e.g., the Company’s CEO, CFO, and Principal Accounting Officer). Clearway, Inc.’s Code of Conduct is available on its website, www.clearwayenergy.com.
Item 11 — Executive Compensation
Compensation Committee Report
The Company’s named executive officers are also named executive officers of Clearway, Inc., and the compensation of the named executive officers disclosed herein reflects total compensation for services with respect to Clearway, Inc. and all of its subsidiaries, including the Company. The Compensation Committee of the Board of Clearway, Inc. (the “Compensation Committee”) has reviewed and discussed the Compensation Discussion and Analysis included in this Annual Report on Form 10-K required by Item 402(b) of Regulation S-K with management and, based upon such review and discussion, the Compensation Committee has recommended to the Board that the Compensation Discussion and Analysis be included in this Annual Report on Form 10-K.
| | | |
| Compensation Committee: |
| E. Stanley O’Neal, Chair |
| Jonathan Bram |
| Brian R. Ford |
| Jennifer Lowry |
| Daniel B. More |
Compensation Discussion and Analysis
Executive Summary
Executive Compensation Program
Clearway, Inc. is a publicly-traded energy infrastructure investor and owner of modern, sustainable and long-term contracted assets across North America. The Company is sponsored by GIP and TotalEnergies through the portfolio company, CEG, and, together, GIP and TotalEnergies hold all of Clearway, Inc.’s Class B common stock and Class D common stock and thus collectively have the majority voting interest in the Company. This Compensation Discussion and Analysis (this “CD&A”) describes the philosophy, elements, implementation and results of Clearway, Inc.’s 2022 executive compensation program as it applies to the executive team. As discussed above, Clearway, Inc.’s named executive officers are also named executive officers of Clearway Energy LLC, and the compensation of the named executive officers (“NEOs”) discussed below reflects total compensation for services with respect to Clearway, Inc. and all of its subsidiaries, including Clearway Energy LLC. In this CD&A, the term “Company,” as well as the terms “our,” “we,” “us” or like terms, are used to refer to Clearway, Inc. and its consolidated subsidiaries, including Clearway Energy LLC and its consolidated subsidiaries.
The Compensation Committee’s objectives are to design a simple yet competitive program, which is aligned with the interests of our stockholders. This program is designed to align short-term and long-term compensation with the Company’s annual performance and three-year total stockholder return (“TSR”), respectively. Our annual incentive program (“AIP”) is primarily based on objective criteria that support the achievement of our short-term objectives, which we believe create long-term stockholder value. Our long-term incentives are comprised of 67% Relative Performance Stock Units (“RPSUs”), which vest based on relative TSR measured over three years and 33% Restricted Stock Units (“RSUs”), which vest based on continued service over three years. The program incorporates many best practices in compensation design, while being tailored to our business needs and compensation objectives.
In 2022, the Compensation Committee reviewed and did not modify its philosophy related to the compensation program. Thus, NEO compensation continued to be delivered through a mix of (i) base salary, (ii) an annual incentive bonus opportunity under the AIP and (iii) long-term incentive compensation under our Amended and Restated 2013 Equity Incentive Plan (“LTIP”) in the form of RPSUs and RSUs.
At our 2022 Annual Meeting of Stockholders, we received approximately 99% support for our say on pay proposal. We believe these results demonstrate our stockholders support our pay practices and that our compensation program is aligned with their interests.
Key Governance Features of Our Executive Compensation Program
Our compensation program and practices incorporate several key governance features as highlighted in the table below.
| | | | | |
What We Do: | What We Don’t Do: |
•Pay for performance by delivering a substantial majority of our President and CEO’s compensation through equity
| •No excise tax gross‑ups on change‑in‑control payments and no tax gross‑ups on perquisites or benefits
|
•The large majority of our equity compensation for Senior Vice Presidents and above is performance‑based
| •No pledging or hedging of the Company’s stock by NEOs or directors
|
•Target our peer group median for total direct compensation
| •No employment agreements for executive officers with the exception of our President and CEO
|
•Require a double trigger for the acceleration of equity vesting in connection with a change‑in‑control
| •No guaranteed bonus payments for our NEOs
|
•Prevent undue risk taking in our compensation practices and engage in robust risk monitoring
| •No supplemental executive retirement plans
|
•Include clawback policies in our compensation plans
| •No re‑pricing of underwater stock options and no stock option grants with an exercise price below 100% of fair market value
|
•Maintain robust stock ownership guidelines for our NEOs
| |
•Provide market‑level retirement benefits and limited perquisites
| |
•Engage an independent compensation consultant to provide advice to the Compensation Committee with respect to our compensation program
| |
•Conduct an annual say on pay vote
| |
Business Strategy and Company Performance
The Company’s primary business strategy is to focus on the acquisition and ownership of assets with predictable, long-term cash flows that allow the Company to increase the cash dividends paid to holders of the Company’s Class A and Class C common stock over time without compromising the ongoing stability of the business. The Company’s plan for executing this strategy includes the following key components: focusing on contracted renewable energy and conventional generation; growing our business through acquisitions of contracted operating assets primarily in North America; and maintaining sound financial practices to grow our dividend.
The execution of the Company’s business strategy produced the following results in 2022:
•Closed the sale of its Thermal Business to KKR for $1.9 billion
•Invested approximately $255 million in the acquisition of the Capistrano Wind Portfolio, which consists of five wind projects representing 413 MW of capacity
•Invested or committed approximately $309 million in new growth investments with CEG, including the commitment to acquire Victory Pass and Arica solar and energy storage projects and funding the Company’s interest in the Mililani and Waiawa solar projects, as well as incremental fundings for the Black Rock, Mesquite Sky and Pinnacle wind projects
•Entered into resource adequacy contracts for El Segundo and Marsh Landing, resulting in both assets having capacity sales fully contracted on a weighted average basis through the majority of 2026
Such results were taken into account by the Compensation Committee in making determinations with respect to the compensation for our NEOs under the 2022 compensation program.
Executive Compensation Program
2022Clearway, Inc. is a publicly-traded energy infrastructure investor and owner of modern, sustainable and long-term contracted assets across North America. The Company is sponsored by GIP and TotalEnergies through the portfolio company, CEG, and, together, GIP and TotalEnergies indirectly hold all of Clearway, Inc.’s Class B common stock and Class D common stock and thus collectively have the majority voting interest in the Company. This Compensation Discussion and Analysis (this “CD&A”) describes the philosophy, elements, implementation and results of Clearway, Inc.’s 2023 executive compensation program as it applies to the executive team. As discussed above, Clearway, Inc.’s named executive officers are also named executive officers of Clearway Energy LLC, and the compensation of the named executive officers (“NEOs”) discussed below reflects total compensation for services with respect to Clearway, Inc. and all of its subsidiaries, including Clearway Energy LLC. In this CD&A, the term “Company,” as well as the terms “our,” “we,” “us” or like terms, are used to refer to Clearway, Inc. and its consolidated subsidiaries, including Clearway Energy LLC and its consolidated subsidiaries.
The Compensation Committee’s objectives are to design a simple, yet competitive, executive compensation program, which is aligned with the interests of our stockholders. This program is designed to align short-term and long-term compensation with the Company’s annual performance and three-year total stockholder return (“TSR”), respectively. Our annual incentive program (“AIP”) is primarily based on objective criteria that support the achievement of our short-term objectives, which we believe create long-term stockholder value. Our long-term incentives are comprised of 67% Relative Performance Stock Units (“RPSUs”), which vest based on relative TSR measured over three years and 33% Restricted Stock Units (“RSUs”), which vest based on continued service over three years. The program is intended to incorporate many best practices in compensation design, while being tailored to our business needs and compensation objectives.
In 2023, the Compensation Committee reviewed and did not modify its philosophy related to the compensation program. Thus, NEO compensation continued to be delivered through a mix of (i) base salary, (ii) an annual incentive bonus opportunity under the AIP and (iii) long-term incentive compensation under our Amended and Restated 2013 Equity Incentive Plan (“LTIP”) in the form of RPSUs and RSUs.
At our 2023 Annual Meeting of Stockholders, we received approximately 98% support for our say on pay proposal. We believe these results demonstrate our stockholders support our pay practices and that our compensation program is aligned with their interests.
Key Governance Features of Our Executive Compensation Program
Our compensation program and practices incorporate several key governance features as highlighted in the table below.
| | | | | |
| What We Do: | What We Don’t Do: |
•Pay for performance by delivering a substantial majority of our President and CEO’s compensation through equity | •No excise tax gross‑ups on change‑in‑control payments and no tax gross‑ups on perquisites or benefits |
•The large majority of our equity compensation for Senior Vice Presidents and above is performance‑based | •No pledging or hedging of the Company’s stock by NEOs or directors |
•Target our peer group median for total direct compensation | •No employment agreements for executive officers with the exception of our President and CEO |
•Require a double trigger for the acceleration of equity vesting in connection with a change‑in‑control | •No guaranteed bonus payments for our NEOs |
•Prevent undue risk taking in our compensation practices and engage in robust risk monitoring | •No supplemental executive retirement plans |
•Include legally-required and Company-specific clawback policies in our compensation plans | •No re‑pricing of underwater stock options and no stock option grants with an exercise price below 100% of fair market value |
•Maintain robust stock ownership guidelines for our NEOs | |
•Provide market‑level retirement benefits and limited perquisites | |
•Engage an independent compensation consultant to provide advice to the Compensation Committee with respect to our compensation program | |
•Conduct an annual say on pay vote | |
Business Strategy and Company Performance
The Company’s primary business strategy is to focus on the acquisition and ownership of assets with predictable, long-term cash flows that allow the Company to increase the cash distributions paid to its unit holders over time without compromising the ongoing stability of the business. The Company’s plan for executing this strategy includes the following key components: focusing on contracted renewable energy and conventional generation; growing our business through acquisitions of contracted operating assets primarily in North America; and maintaining sound financial practices to increase distributions to our unit holders.
The execution of the Company’s business strategy produced the following results in 2023:
•Closed on the Drop Downs for the Victory Pass and Arica solar projects that are paired with energy storage, the Daggett 2 and Daggett 3 solar projects that are paired with energy storage, the Texas Solar Nova 1 solar project and the Rosamond Central BESS project
•Invested or committed approximately $160 million in new growth investments with CEG, including the commitments to acquire the Cedar Creek wind project, Texas Solar Nova 1 and 2 solar projects and the Daggett 2 solar project
•Acquired a membership interest in Rosie Central BESS and amended the financing agreement for the Rosamond Central solar project to facilitate and fund the construction of a BESS project that is co-located at the Rosamond Central solar facility
•Entered into an agreement with Clearway Renew to repower the Cedro Hill wind project for an expected investment of $36 million in net corporate capital and entered into a $254 million non-recourse debt facility related to the repowering
•Acquired 100% of the Class A membership interests in DGPV Fund 4 LLC and Alta X-XI TE HoldCo, LLC for an aggregate $13 million
•Signed a 400 MW resource adequacy contract for sixteen months at Marsh Landing and a 274 MW resource adequacy contract for seventeen months at El Segundo, resulting in both assets having at least 50% of capacity contracted in 2027
Such results were taken into account by the Compensation Committee in making determinations with respect to the compensation for our NEOs under the 2023 compensation program.
Executive Compensation Program
2023 Named Executive Officers
This CD&A describes the material components of our compensation program for our NEOs in 2022.2023. For the year ending December 31, 2022,2023, our NEOs included the following individuals:
| | | | | | | | |
| NEO | | 20222023 Title |
| Christopher S. Sotos | | President and Chief Executive Officer |
| Sarah Rubenstein | | SeniorExecutive Vice President and Chief AccountingFinancial Officer(1)
|
| Kevin P. Malcarney | | Executive Vice President, General Counsel and Corporate Secretary(2) |
| | |
| Chad Plotkin | Executive Vice President and Chief Financial Officer(3)
|
(1) Ms. Rubenstein was promoted to Senior Vice President and Chief Accounting Officer in January 2022 and appointed as the principal financial officer for the Company in August 2022.
(2) Mr. Malcarney was promoted to Executive Vice President, General Counsel and Corporate Secretary in January 2022.
(3) Mr. Plotkin was promoted to Executive Vice President and Chief Financial Officer in January 2022. Mr. Plotkin voluntarily resigned from his employment withApril 2023 and previously served as Senior Vice President and Chief Accounting Officer of the Company in August 2022.Company.
Goals and Objectives of the Program
The Compensation Committee is responsible for the development and implementation of the Company’s executive compensation program, subject to Board approval for equity awards to certain officers, and references to Compensation Committee actions described below should be read in a manner that contemplates the requisite Board approval, as applicable, is in effect (see “Board Committees—Compensation Committee” above). The intent of the program is to reward the achievement of the Company’s annual goals and objectives while supporting the Company’s long-term business strategy. The Compensation Committee is committed to aligning executives’ compensation with performance. Our Compensation Committee has designed an executive compensation program that:that is intended to:
•closely alignsalign our executive compensation with stockholder value creation, avoiding plans that encourage executives to take excessive risk, while driving long-term value to stockholders;
•supportssupport the Company’s long-term business strategy, while rewarding our executive team for their individual accomplishments with tailored individual executive compensation metrics and incentives; and
•providesprovide a competitive compensation opportunity while aligning with market standards for compensation.
The Compensation Committee’s objectives are achieved through the use of both short-term and long-term incentives. The Company currently targets total direct compensation at the median of our Compensation Peer Group (defined below), as described below under “Elements of Compensation.”
The Compensation Process
Compensation Consultant
Pursuant to its charter, the Compensation Committee is authorized to engage, at the expense of the Company, a compensation consultant to provide independent advice, support and expertise to assist the Compensation Committee in overseeing and reviewing our overall executive compensation strategy, structure, policies and programs, and to assess whether our compensation structure establishes appropriate incentives for management and other key employees. Pay Governance has been the Compensation Committee’s independent compensation consultant since August 2020, and Pay Governance has continued to serve in that capacity to the present date. Pay Governance worked with the Compensation Committee to formulate the design of the executive and director compensation programs for 2022.2023. As part of its work with the Compensation Committee, Pay Governance provided reports to the Compensation Committee containing research, market data, survey information and information regarding trends and developments in executive and director compensation, and Pay Governance reported directly to the Compensation Committee. Neither Pay Governance, nor any of their affiliates provided any other services for us or any of our affiliates in 2022.2023. In accordance with SEC rules and requirements, the Company has affirmatively determined that no conflicts of interest exist between the Company and Pay Governance (or any individuals working on the Company’s account on behalf of Pay Governance).
Compensation Peer Group Analysis
The Compensation Committee, with support from its independent compensation consultant, identifies the most appropriate comparator group within relevant industries for purposes of benchmarking compensation. The Compensation Committee aims to compare our compensation program to a consistent peer group year-to‑year but given the dynamic nature of our industry and the companies that constitute it, the Compensation Committee annually examines the peer group for appropriateness in terms of size, complexity, and industry. As a result of suchIn connection with this annual review, the Compensation Committee reviewed the peer group identified a newfor 2022 and adjusted it to remove Covanta Holding Corporation due to its acquisition and delisting, but otherwise maintained the same peer group for compensation benchmarking purposes in 20222023 (the “Compensation Peer Group”).
For these purposes, the Compensation Peer Group, comprised of similarly sized publicly-ownedpublicly owned energy and utility companies, is identified below:
| | | | | | | | | | | | | | | | | | | | |
| Company | | Ticker | | Company | | Ticker |
| Algonquin Power & Utilities Corp. | | NYSE: AQN | | MGE Energy, Inc. | | NASDAQ: MGEE |
| Alliant Energy Corporation | | NASDAQ: LNT | | Northland Power Inc. | | TSX: NPI |
| Atmos Energy Corporation | | NYSE: ATO | | NorthWestern Corporation | | NYSE: NWE |
| Avista Corporation | | NYSE: AVA | | Ormat Technologies, Inc. | | NYSE: ORA |
| Black Hills Corporation | | NYSE: BKH | | Portland General Electric Company | | NYSE: POR |
Covanta Holding Corporation(1)
| | NYSE: CVA | | South Jersey Industries, Inc. | | NYSE: SJI |
| Equitrans Midstream Corporation | | NYSE: ETRN | | TransAltaCorporation.South Jersey Industries, Inc. | | NYSE:TAC SJI(1) |
| Genesis Energy, L.P. | | NYSE: GEL | | TransAltaCorporation | | | NYSE: TAC |
| Innergex Renewable Energy Inc. | | TSX: INE | | | | |
(1) Covanta Holding CorporationSouth Jersey Industries, Inc. was acquired by the EQT Infrastructure VInvestments Fund in November 2021February 2023 and was delisted, but was included by Pay Governance as part of its 20222023 compensation benchmarking analysis, and for that reason, Covanta Holding CorporationSouth Jersey Industries, Inc. is included in the Compensation Peer Group for 20222023 but will not be part of the Compensation Peer Group for 20232024 or going forward.
For the purposes of determining appropriate NEO pay levels for 2022,2023, the Compensation Committee reviewed NEO compensation from peers, where available and appropriate (e.g., based on an NEO’s position and duties). To supplement this analysis, the Compensation Committee reviewed relevant third-party survey data and considered the recommendations of the CEO on NEO and employee compensation matters not involving the CEO. The Compensation Committee may accept or adjust such CEO recommendations at its discretion. The NEOs did not participate in Compensation Committee discussions regarding their own compensation.
Elements of Compensation
Our compensation program for our NEOs consists of fixed compensation (base salary), performance-based compensation (AIP bonus and RPSUs) and time-based compensation (RSUs). We use the median percentile of our Compensation Peer Group as a guidepost in establishing the targeted levels of total direct compensation (cash and equity) for our NEOs. We expect that, over time, targeted total direct compensation for our NEOs will continue to approximate the median of our Compensation Peer Group. Realized pay in a given year depends on the achievement of defined performance-based compensation metrics. While a portion of our NEOs’ compensation is fixed, a significant percentage is at-risk and payable and/or realizable only if certain performance objectives are met.
Base Salary
Base salary compensates NEOs for their level of experience and position responsibilities and for the continued expectation of superior performance. Recommendations on increases to base salary take into account, among other factors, the NEO’s individual performance, the general contributions of the NEO to overall corporate performance, the level of responsibility of the NEO with respect to his or her specific position, and the NEO’s current base salary level compared to the market median. In lieu of an increase to Mr. SotosSotos’ base salary, the Board increased Mr. Sotos’ target LTIP award to recognize his performance, better align his total direct compensation with the market median, and cause a higher percentage of Mr. Sotos’ compensation to be performance-based. Each of Ms. Rubenstein and Mr. Malcarney received a base salary increase in 20222023 based on hissuch executive’s performance and peer group benchmarking. Messrs. Malcarney and Plotkin and Ms. Rubenstein received a subsequent base salary increasesincrease in 2022 based on their promotions, performance2023 in connection with her appointment as Executive Vice President and peer group benchmarking.Chief Financial Officer. The base salary for each NEO for fiscal year 20222023 as of December 31, 2023 is set forth below:
| | Named Executive Officer | Named Executive Officer | | 2022 Annualized Base Salary ($)(1) | | Percentage Increase Over 2021 (%)(2) | Named Executive Officer | | 2023 Annualized Base Salary ($)(1) | | Percentage Increase Over 2022 (%)(2) |
| Christopher S. Sotos | Christopher S. Sotos | | 665,201 | | | 6% | Christopher S. Sotos | | 665,201 | | | 0% | | 0% |
Sarah Rubenstein(3) | Sarah Rubenstein(3) | | 325,000 | | | 15% | Sarah Rubenstein(3) | | 385,000 | | | 18% | | 18% |
Kevin P. Malcarney(4) | | 400,000 | | | 25% |
Chad Plotkin(5) | | 460,000 | | | 18% |
| Kevin P. Malcarney | | Kevin P. Malcarney | | 412,000 | | | 3% |
(1) Actual 20222023 base salary earnings are presented in the Summary Compensation Table.
(2) As compared to the December 31, 20212022 annualized base salary.
(3) Ms. Rubenstein’s base salary was increased from $325,000 to $340,000 in February 2023 to recognize her performance and to better align her total direct compensation with the market median. Ms. Rubenstein’s base salary was subsequently increased from $340,000 to $385,000 in April 2023 in connection with her appointment as Executive Vice President and Chief Financial Officer. Ms. Rubenstein was promoted topreviously served as Senior Vice President and Chief Accounting Officer in January 2022 and appointed asof the principal financial officer for the Company in August 2022.
(4) Mr. Malcarney was promoted to Executive Vice President, General Counsel and Corporate Secretary in January 2022.
(5) Mr. Plotkin was promoted to Executive Vice President and Chief Financial Officer in January 2022. Mr. Plotkin voluntarily resigned from his employment with the Company in August 2022. Mr. Plotkin earned $278,219 prior to his departure.Company.
Annual Incentive Compensation
Overview
Annual incentive compensation awards (AIP bonuses) are made under our AIP. AIP bonuses represent short-term compensation designed to compensate NEOs for meeting annual Company goals and for their individual performance over the course of the year. The Compensation Committee establishes these annual Company goals after reviewing the Company’s business strategy and other matters. As further discussed below, the annual goals for 20222023 relate to: (a) CAFD and (b) key performance milestones. In addition, the overall bonus payout is negatively adjusted for any OSHA recordable injuries that occur during the year, and each NEO’s individual performance may (negatively or positively) affect the bonus amount that he or she ultimately receives under our AIP. However, notwithstanding individual performance or the extent to which the Company goals are achieved, the Compensation Committee retains sole discretion under the AIP to reduce the amount of or eliminate any AIP bonuses that are otherwise payable under the AIP.
AIP bonus opportunities are expressed in terms of threshold, target and maximum bonus opportunities. Different percentages of each NEO’s annual base salary relate to these threshold, target and maximum AIP bonus opportunities. However, in the event threshold performance for 20222023 was not achieved with respect to one of the AIP performance metrics, no AIP bonuses would have been payable for that component for 2022.2023.
The AIP provides NEOs (other than Mr. Sotos whose severance is governed by his amended and restated employment agreement) eligibility for a pro-rated target bonus payment for the year of a qualifying severance termination, based on the portion of the performance period that the NEO was employed.
20222023 AIP Bonus Performance Criteria
The 20222023 AIP bonus performance criteria applicable to all NEOs are based upon the two Company goals described above and adjusted, as discussed, based on OSHA recordable injuries and individual performance, as applicable. As a result of the announcement of Company’s sale of its Thermal Business to KKR in the fourth quarter of 2021, and the closing of such sale in the second quarter of 2022, the 2021 AIP metrics that related to the Thermal Plan were removed for 2022. The table below sets forth the 20222023 AIP performance criteria and weightings applicable to all NEOs, assuming the achievement of each goal at target.
| | | | | |
| Goal | Weight |
CAFD(1) | 40% |
| Key Performance Milestones | 60% |
| |
| Overall Funding | 100% |
| OSHA Recordables (per recordable injury) | -5% |
| Individual Performance | +/- 20% |
(1) A non-GAAP measure, CAFD is defined as adjusted earnings before interest, taxes, depreciation and amortization (Adjusted EBITDA) plus cash distributions/return of investment from unconsolidated affiliates, and subsequent release post-bankruptcy, cash receipts from notes receivable, cash distributions from noncontrolling interests, adjustments to reflect sales-type lease cash payments, less cash distributions to noncontrolling interests, maintenance capital expenditures, pro-rata Adjusted EBITDA from unconsolidated affiliates, cash interest paid, income taxes paid, principal amortization of indebtedness, changes in prepaid and accrued capacity payments, and adjusted for development expenses.
•CAFD. The Compensation Committee set the 20222023 threshold, target and maximum CAFD performance metric at $292$360 million, $365$410 million and $438$460 million, respectively. For 2022,2023, the CAFD goals and the achieved level are set forth in the chart below. TheDue to lower-than-expected merchant energy margin caused by milder than normal temperatures during the first half of 2023, the Company achieveddid not achieve threshold CAFD of approximately $326 million, surpassing the CAFD threshold but less than the CAFD target.performance.
| | | | | | | | | | | |
CAFD Threshold | CAFD Target | CAFD Maximum | CAFD Actual |
$292360 million | $365410 million | $438460 million | $326342 million |
•Key Performance Milestones. “Key performance milestones” performance metrics are established as a defined annual incentive category. The Compensation Committee establishes threshold, target and maximum levels of performance for this category based on the number of milestones achieved. For 2022,2023, a total of sevenfive milestones were established relating to ESG matters, adherence to budget, CAFD per share goals, restructuring of Lighthouse Renewable Holdco LLC and Lighthouse Renewable Holdco 2 LLC, ratio of administrative costs to CAFD and natural gas strategic plan and execution. For 2022,2023, threshold performance required the achievement of two out of the sevenfive milestones, target performance required the achievement of fourthree out of the sevenfive milestones, and maximum performance required the achievement of all sevenfive milestones. Ultimately, above target performance was attained with the achievement of fivethree out of the sevenfive milestones in 2022.2023.
•Individual Performance. As indicated above, an NEO’s individual performance may (negatively or positively) affect his or her AIP bonus by up to 20%, of such NEO’s target award, although no AIP bonus payments can exceed 200% of the target award. Such individual performance is determined on a subjective basis based on the Compensation Committee’s assessment of the NEO’s contributions in supporting adherence to budget, support towards the achievement of key milestones, and other contributions towards the successful execution of the Company’s business strategy. The Compensation Committee recommended, toand the full Board approved, that the CEO’s AIP bonusan individual performance modifier of +20% be paid based on the overall 2022 AIP achievement without additional modification. Similarly, the CEO recommendedapplied to the Compensation Committee that the AIP bonus target award for each NEO’s individual performance, including the other NEOs be based oncompletion of several key initiatives that position the overall 2022 AIP achievement without additional modification. The full board approved theCompany for future long-term success, as described more fully above recommendationunder “Business Strategy and Company Performance”, despite a challenging environment attributable to a year of the Compensation Committee for the CEO and the Compensation Committee approved the above recommendation of the CEO for the other NEOs.low renewable energy resource.
20222023 Annual Incentive Bonus Opportunity
The threshold, target and maximum AIP bonus opportunities for NEOs for 2022,2023, expressed as a percentage of base salary, were:
| | Named Executive Officer | |
| Named Executive Officer | |
| Named Executive Officer | Named Executive Officer | | Threshold (%)(1) | Target (%)(1) | Maximum (%)(1) | Target Amount ($) | | Threshold (%)(1) | Target (%)(1) | Maximum (%)(1) | Target Amount ($) |
| Christopher S. Sotos | Christopher S. Sotos | | 50 | 100 | 200 | 665,201 | Christopher S. Sotos | | 50 | 100 | 200 | 665,201 |
Sarah Rubenstein(2) | Sarah Rubenstein(2) | | 25 | 50 | 100 | 162,500 | Sarah Rubenstein(2) | | 32.5 | 65 | 130 | 250,250 |
Kevin Malcarney(3) | | 32.5 | 65 | 130 | 260,000 |
Chad Plotkin(4) | | 35 | 70 | 140 | 322,000 |
| Kevin P. Malcarney | | Kevin P. Malcarney | | 32.5 | 65 | 130 | 267,800 |
(1) This assumes that the CAFD performance metric and all other quantitative and qualitative goals, including the key milestones, are achieved at threshold, target and maximum levels, as applicable.
(2) Ms. Rubenstein’s threshold, target and maximum AIP award opportunities were increased in February 2023 to recognize her performance and to better align her total direct compensation with the market median. Ms. Rubenstein’s threshold, target and maximum AIP award opportunities were subsequently increased in April 2023 in connection with her appointment as Executive Vice President and Chief Financial Officer. Ms. Rubenstein was promoted topreviously served as Senior Vice President and Chief Accounting Officer in January 2022 and appointed asof the principal financial officer for the Company in August 2022.Company.
(3) Mr. Malcarney’s threshold, target and maximum AIP award were increased in 2022 in connection with his promotion, to recognize his performance, and better align his total direct compensation with the market median.
(4) Mr. Plotkin’s threshold, target and maximum AIP award were increased in 2022 in connection with his promotion, to recognize his performance, and better align his total direct compensation with the market median. Mr. Plotkin voluntarily resigned from his employment with the Company in August 2022. Accordingly, no AIP bonus was paid to Mr. Plotkin for 2022.
20222023 Annual Incentive Bonuses
As noted above, with respect to AIP bonuses for 2022,2023, the CAFD target was $365$410 million and the key performance milestone target was achievement of fivethree out of sevenfive key performance milestones.
For 2022,2023, CAFD achievement was betweenbelow threshold and target at approximately $326$342 million, fivethree out of sevenfive key performance milestones were achieved, and there were no OSHA recordable injuries. Due to the achievement specified above, 2022after taking into account the application of the individual performance modifier, 2023 AIP bonuses were paid at levels abovebetween threshold and target. If performance falls between threshold and target or target and maximum, the bonus opportunity will be determined on an interpolated basis. As a result, the CAFD metric and the key performance milestone metrics were respectively weighted at 73%0% and 133%100% of target.
The annual incentive bonuses paid to NEOs for 20222023 were:
| | Named Executive Officer | Named Executive Officer | | Percentage of Annual Base Salary Achieved (%) | | Percent of Target Achieved (%) | | Annual Incentive Payment ($) | Named Executive Officer | | Percentage of Annual Base Salary Achieved (%) | | Individual Performance Modifier (+/- 20%) | | Percentage of Target Achieved (%) | | Annual Incentive Payment ($) |
| Christopher S. Sotos | Christopher S. Sotos | | 109 | | 109 | | 725,069 | |
Sarah Rubenstein(1) | Sarah Rubenstein(1) | | 55 | | 109 | | 177,125 | |
Kevin P. Malcarney(2) | | 71 | | 109 | | 283,400 | |
Chad Plotkin(3) | | N/A | | N/A | | N/A |
| Kevin P. Malcarney | |
(1) Ms. Rubenstein was promoted to Senior Vice President and Chief Accounting Officer in January 2022 and appointed as the principal financial officer for the Company in August 2022. Ms. Rubenstein’s AIP target increased from 40% to 50% in connection with her promotion.
(2) Mr. Malcarney was promoted to Executive Vice President, General Counsel and Corporate Secretary in January 2022. Mr. Malcarney’s AIP target increased from 60% to 65% in connection with his promotion.
(3) Mr. Plotkin was promoted to Executive Vice President and Chief Financial Officer in January 2022. Mr. Plotkin’s AIP target increase from 60% to 70% in connection with his promotion. Mr. Plotkin voluntarily resigned from his employment withApril 2023. Ms. Rubenstein previously served as Senior Vice President and Chief Accounting Officer of the Company in August 2022. Accordingly, no AIP bonus was paid to Mr. Plotkin for 2022.Company.
Long‑Term Incentive Compensation
We believe that equity awards directly align our NEOs’ interests with those of our stockholders. In 2022,2023, the Compensation Committee granted our NEOs a combination of performance-based equity awards directly linked to long-term stockholder value creation and time-based equity awards which also represent a critical component of our long-term incentive compensation due to the retention aspects of the awards. To enhance our compensation program’s focus on Company performance, the majority of these long-term incentive awards (67%) were performance-based (i.e., granted as RPSUs). The remainder of our long-term incentive awards (33%) were time-based (i.e., granted as RSUs which vest over three years). We believe that our AIP appropriately focuses our NEOs on shorter-term (one-year) financial metrics while our LTIP emphasizes long-term stockholder value creation (i.e., three-year TSR outperformance). For 2022,2023, Mr. Sotos’ target LTIP award was 315%350% of his base salary and Ms. Rubenstein and Mr. Malcarney’s target LTIP awards were 125% of their respective base salaries, and Mr. Plotkin’s target LTIP award was 150% of his base salary.salaries. Mr. Sotos’ target LTIP award increased from 280% in 2021 to 315% in 2022 to 350% in 2023 to recognize his performance and better align his total direct compensation with the market median. Ms. Rubenstein’sRubenstein and Mr. Malcarney’s target LTIP award increasedawards remained unchanged from 75% in 2021 to 125% in 2022 and Mr. Plotkin’s target LTIP award increased from 125% in 2021 to 150% in 2022. These changes were made in connection with promotional matters and intended to recognize their performance and better align their total direct compensation with the market median. The above mix of long-term incentive compensation applied to all NEOs for 2022. Mr. Plotkin’s outstanding RPSUs and RSUs were forfeited as of the time of his resignation in August 2022.2023.
Relative Performance Stock Units
Each RPSU represents the potential to receive one share of Class C common stock, as adjusted, based on the Company’s TSR performance ranked against the TSR performance of a comparator group of similar companies (the “Performance Peer Group”) after the completion of a three-year performance period. Relative measures are designed to normalize for externalities, ensuring the program appropriately reflects management’s impact on the Company’s TSR by including peer companies that the Compensation Committee believes are similarly impacted by market conditions.
The payout of shares of Class C common stock at the end of the three-year performance period is based on the Company’s TSR performance percentile rank compared with the TSR performance of the Performance Peer Group. To ensure a rigorous program design, the target-level payout (100% of shares granted) generally requires the Company to perform at the 50th percentile. ToHowever, to induce management to achieve greater than target-leveltarget level (i.e., 50th percentile) performance in a down market, in the event that the Company’s TSR performance declines by more than 20% over the performance period, the target-leveltarget level payout (100% of shares granted) will require achievement of 60th percentile performance. The Compensation Committee believes that this increased performance requirement addresses the concern that a disproportionate award may be paid in the event that our relative performance is high, but absolute performance is low.
In the event relative performance is below the 25th percentile, the award is forfeited. In the event relative performance is between the 25th percentile and the 50th percentile (or the 60th percentile if our TSR performance declines by more than 20% over the performance period), payouts will be based on an interpolated calculation. In the event relative performance reaches the 50th percentile (or the 60th percentile as described above), 100% of the award will be paid. In the event relative performance is between the 50th percentile (or the 60th percentile as described above) and the 75th percentile, payouts will be based on an interpolated calculation. In the event that relative performance is at or above the 75th percentile, a maximum payout of 150% of the target will be paid with respect to RPSU awards granted in 2022.2023. Based on the Company’s TSR performance ranked against the TSR performance of the Performance Peer Group over the three yearthree-year performance period ending on December 31, 2022,2023, the RPSUs granted in 20202021 will vest on April 15, 20232024 at 150%58% of target.
The table below illustrates the design of our RPSUs in 2022.2023.
| | | | | | | | | | | | | | | | | | | | | | | | | | |
| Performance Targets | | Performance Requirement | | Payout Opportunity | |
| Maximum | | 75th percentile or above | | 150% | |
| Target | | Standard Target: 50th percentile | | Modified Target: 60th percentile (less than −20% absolute TSR) | | 100% | |
| Threshold | | 25th percentile | | 25% | |
| Below Threshold | | Below 25th percentile | | 0% | |
Restricted Stock Units
Each RSU represents the right to receive one share of our Class C common stock after the completion of the vesting period. The RSUs granted to the NEOs in 20222023 vest ratably, meaning that one‑third of the award vests each year on the anniversary of the grant date, over a three‑year period.
Dividend Equivalent Rights (DERs)
In connection with awards of both RPSUs and RSUs, each NEO also receives DERs, which accrue with respect to the award to which they relate. Accrued DERs are only paid outcredited as additional shares that will be subject to the extent thatvesting and payment terms of the corresponding award of the RPSUs or RSUs, as applicable. Accordingly, accrued DERs are paid at the same time the shares of Class C common stock underlying each award become vested and deliverable to the NEO. Accrued DERs are paid at the same time such shares are delivered to the NEO. Accordingly,NEO, and accrued DERs are forfeited if, or to the extent that, the underlying shares areaward is forfeited.
Clawbacks
In 2023, the Compensation Committee adopted a “clawback” policy that is intended to comply with the requirements under the federal securities laws, including the Dodd-Frank Wall Street Reform and Consumer Protection Act of 2010. The policy requires the Company to seek recoupment of any cash or equity-based incentive compensation payment or award made or granted to any current or former executive officer of the Company during the three completed fiscal years immediately preceding the date on which the Company is required to prepare a restatement of its financial statements due to material noncompliance of the Company with any financial reporting requirement under the federal securities laws or similar revision of performance indicators on which cash or equity-based incentive compensation was based, if: (i) the payment or award was made or granted based wholly or in part upon the attainment of a Company financial reporting measure (including, without limitation, (a) any measure that is determined and presented in accordance with the accounting principles used in preparing the Company’s financial statements, (b) any measure that is derived wholly or in part from such measure and/or (c) any measure of stock price or total stockholder return); and (ii) a lower payment or award would have been made or granted to the executive officer based upon the restated financial results had there not been a restatement. In each such instance, the amount required to be returned, repaid, or forfeited will be the amount by which the executive officer’s payment or award for the relevant period exceeded the lower payment or award that would have been made or granted based on the restated results.In addition to the above “Dodd-Frank” clawback policy, the Company has long maintained a “clawback”separate clawback policy that the Compensation Committee may apply with regard to awards made under the AIP and LTIP in the case of a material financial restatement, including a restatement resulting from employee misconduct, or in the case of fraud, embezzlement or other serious misconduct that is materially detrimental to the Company. The Compensation Committee retains discretion regarding application of this separate policy. Each of the policy. The policyabove policies is incremental to other remedies that are available to the Company. In addition to our “clawback” policy,the above policies, if the Company is required to restate its earnings as a result of noncompliance with a financial reporting requirement due to misconduct, under the Sarbanes‑Oxley Act of 2002 (“SOX”), the CEO and the CFO would also be subject to a “clawback,” as required by SOX.
Benefits
All of our NEOs are eligible to participate in the same retirement, life insurance, health and welfare plans as other employees. To generally support more complicated financial planning and estate planning matters, NEOs are eligible for reimbursement of annual tax return preparation, tax advice, financial planning and estate planning expenses. Mr. Sotos is eligible for a maximum reimbursement of $12,000 per year and the remaining NEOs are eligible for a maximum reimbursement of $3,000 per year.
Potential Severance and Change‑In‑Control Benefits
Each NEO’s RPSU and RSU award agreements under the LTIP provide for certain treatment in the event of such NEO’s termination of employment under certain circumstances, including in connection with a change-in-control. Additionally, Mr. Sotos, pursuant to his amended and restated employment agreement (as described below), and the remaining NEOs, pursuant to the Company’s Executive Change-in-Control and General Severance Plan (the “CIC Plan”) as well as pursuant to the Compensation Committee’s discretion under the AIP, are entitled to additional severance payments and benefits in the event of termination of employment under certain circumstances, including following a change-in-control.
Change-in-controlWe believe change-in-control arrangements are considered a market practice among many publicly held companies. Most often, these arrangements are utilized to encourage executives to remain with the company during periods of extreme job uncertainty and to ensure that any potential transaction is thoroughly and objectively evaluated. In order to enable a smooth transition during an interim period, change-in-control arrangements provide a defined level of security for the executive and the company, enabling a more seamless implementation of a particular merger, acquisition or asset sale or purchase, and subsequent integration. In addition, such agreements include restrictive covenants, such as non-compete, non-solicitation and confidentiality provisions that protect the interests of the Company.
For a more detailed discussion, including the quantification of potential payments, please see the section entitled “Severance and Change-in-Control” following the executive compensation tables below.
Other Matters
Stock Ownership Guidelines
The Compensation Committee and the Board require the CEO to hold Company stock with a value equal to 5.0 times his base salary until his separation from the Company. Executive Vice Presidents are required to hold Company stock with a value equal to 3.0 times their base salary until their separation from the Company.Senior Vice Presidents are required to hold Company stock with a value equal to 2.0 times their base salary until their separation from the Company. Personal holdings, and vested awards and unvested RSUs count towards the ownership multiple. Beginning in 2022, unvested RSUs also count towards the ownership multiple. This change in determining attainment of the ownership multiple was implemented after reviewing the compensation practices of Compensation Peer Group Companies. Although NEOs are not required to make purchases of our common stock to meet their target ownership multiple, NEOs are restricted from divesting any securities until such ownership multiples are attained, except in the event of hardship or to make a required tax payment, and they must maintain their ownership multiple after any such transactions. Once met, they must maintain their ownership multiple during their service. The current target stock ownership for NEOs as of January 31, 20232024 is shown below. All of our NEOsMr. Sotos and Mr. Malcarney each met or exceeded theirhis stock ownership guidelines as of January 31, 2023, or2024. Ms. Rubenstein’s stock ownership guideline was increased from a 2.0 to 3.0 multiple in the case of Mr. Plotkin,connection with her appointment as Executive Vice President and Chief Financial Officer in April 2023. Therefore, Ms. Rubenstein did not meet this increased stock ownership guideline as of January 31, 2024, and the date of his separation fromabove divestiture restrictions and related exceptions will apply to Ms. Rubenstein during periods in which, and to the Company.extent that, the above guidelines are not met.
| | | | | | | | | | | | | | | |
| Named Executive Officer | | Target Ownership Multiple | | | Actual Ownership Multiple |
| Christopher S. Sotos | | 5.0x | | | 23.6x21.5x |
Sarah Rubenstein(1) | | 2.0x3.0x | | | 3.3x2.4x |
| Kevin P. Malcarney | | 3.0x | | | 7.4x6.6x |
| Chad Plotkin | | 3.0x | | | 9.3x(2)
(1) Ms. Rubenstein was promoted toappointed as Executive Vice President and Chief Financial Officer in April 2023. Ms. Rubenstein previously served as Senior Vice President and Chief Accounting Officer in January 2022 and appointed as the principal financial officer for the Company in August 2022.
(2) Reported for Mr. Plotkin as of the date of his voluntary resignation from his employment with the Company in August 2022.Company.
Tax and Accounting Considerations
Section 162(m) of the Internal Revenue Code (the “Code”) precludes Clearway, Inc., as a public company, from taking a tax deduction for individual compensation to certain of our executive officers in excess of $1 million, subject to certain exemptions. Prior to 2018, the exemptions included an exclusion of performance-based compensation within the meaning of Section 162(m) of the Code (“Section 162(m)”). The Tax Cuts and Jobs Act, enacted in December 2017, however, amended Section 162(m) and eliminated the exclusion of performance-based compensation from the $1 million limit, subject to certain exemptions. The Compensation Committee believes tax deductibility of compensation is an important consideration and continues to consider the implications of legislative changes to Section 162(m). However, the Compensation Committee also believes that it is important to retain flexibility in designing compensation programs, and as a result, has not adopted a policy that any particular amount of compensation must be deductible to the Company under Section 162(m).
The Compensation Committee also takes into account tax consequences to NEOs in designing the various elements of our compensation program, such as designing the terms of awards to defer immediate income recognition under Section 409A of the Code. The Compensation Committee remains informed of, and takes into account, the accounting implications of its compensation programs. However, the Compensation Committee approves programs based on their total alignment with our strategy and long‑term goals.
Compensation Tables
Summary Compensation Table
Fiscal Year Ended December 31, 20222023
| | Name and Principal Position | Name and Principal Position | | Year | | Salary ($)(1) | | Bonus ($) | | Stock Awards ($)(2) | | Option Awards ($) | | Non‑Equity Incentive Plan Compensation ($)(3) | | Change in Pension Value and Nonqualified Deferred Compensation Earnings ($) | | All Other Compensation ($)(4) | | Total ($) | Name and Principal Position | | Year | | Salary ($)(1) | | Bonus ($) | | Stock Awards ($)(2) | | Option Awards ($) | | Non‑Equity Incentive Plan Compensation ($)(3) | | Change in Pension Value and Nonqualified Deferred Compensation Earnings ($) | | All Other Compensation ($)(4) | | Total ($) |
| Christopher S. Sotos | Christopher S. Sotos | | 2022 | | 659,682 | | | — | | | 1,951,273 | | | — | | | 725,069 | | | — | | | 12,200 | | | 3,348,224 | |
| President and Chief | President and Chief | | 2021 | | 638,260 | | | — | | | 1,535,147 | | | — | | | 899,312 | | | — | | | 19,790 | | | 3,092,509 | |
| Executive Officer | Executive Officer | | 2020 | | 634,500 | | | — | | | 1,900,423 | | | — | | | 699,534 | | | — | | | 14,111 | | | 3,248,568 | |
| | Sarah Rubenstein | Sarah Rubenstein | | 2022 | | 324,197 | | | — | | | 378,417 | | | — | | | 177,125 | | | — | | | 12,200 | | | 891,939 | |
| Sarah Rubenstein | |
| Sarah Rubenstein | |
| Senior Vice President and | Senior Vice President and | | 2021 | | — | | | — | | | — | | | — | | | — | | | — | | | — | | | — | |
| Chief Accounting Officer | Chief Accounting Officer | | 2020 | | — | | | — | | | — | | | — | | | — | | | — | | | — | | | — | |
| | Kevin P. Malcarney | Kevin P. Malcarney | | 2022 | | 398,461 | | | — | | | 465,703 | | | — | | | 283,400 | | | — | | | 12,850 | | | 1,160,414 | |
| Kevin P. Malcarney | |
| Kevin P. Malcarney | |
| Senior Vice President, | Senior Vice President, | | 2021 | | 323,991 | | | — | | | 348,772 | | | — | | | 274,368 | | | — | | | 12,550 | | | 959,681 | |
| General Counsel and | General Counsel and | | 2020 | | 317,885 | | | — | | | 362,301 | | | — | | | 151,889 | | | — | | | 10,550 | | | 842,625 | |
| Corporate Secretary | Corporate Secretary | |
| Chad Plotkin(5) | | 2022 | | 278,219 | | | — | | | 642,691 | | | — | | | — | | | — | | | 77,372 | | | 998,282 | |
| Executive Vice President | | 2021 | | 396,954 | | | — | | | 426,560 | | | — | | | 335,586 | | | — | | | 14,600 | | | 1,173,700 | |
| and Chief Financial Officer | | 2020 | | 394,615 | | | — | | | 559,631 | | | — | | | 281,551 | | | — | | | 14,169 | | | 1,249,966 | |
|
(1) Reflects base salary earnings.
(2) Reflects the grant date fair value determined in accordance with the Financial Accounting Standards Board Accounting Standards Codification Topic 718, Comparison — Stock Compensation. Clearway, Energy, Inc. uses the Company’s Class C common stock price on the date of grant as the fair value of the Company’s RSUs. The fair value of RPSUs is estimated on the date of grant using a Monte Carlo simulation model. Beginning with awards granted in 2020, theThe number of RPSUs granted is based on the 10-day average closing price of the Company’sClearway, Inc.’s Class C common stock ending on the date of grant, which is intended to more closely reflect the compensation practices of the Compensation Peer Group companies. For RPSUs granted in 2022,2023, if the maximum level of performance is achieved, the fair value will be approximately $1,889,849 $2,214,738for Mr. Sotos, $366,500$457,868 for Ms. Rubenstein and $451,050$489,941 for Mr. Malcarney.
(3) The amounts shown in this column represent the annual incentive bonuses paid to the NEOs. Further information regarding the annual incentive bonuses is included in the “2022‘‘2023 Annual Incentive Bonuses”Bonuses’’ section of this CD&A.
(4) The amounts provided in the All Other Compensation column represent the additional benefits payable by the Company and include insurance benefits; the employer match under the Company’s 401(k) plan; financial counseling services up to $12,000 per year for Mr. Sotos and up to $3,000 per year for all other NEOs, not including the financial advisor’s travel or out-of-pocket expenses; legal fees incurred by Mr. Sotos in 2021 in connection with reviewing and finalizing his amended and restated employment agreement; and when applicable, the Company’s discretionary contribution to the 401(k) plan, as well as, a payout upon termination of accrued but unused paid time off for Mr. Plotkin.plan. The following table identifies the additional compensation for each NEO.
(5) Mr. Plotkin voluntarily resigned from his employment with the Company in August 2022.
| | Name | Name | | Year | | Financial Advisor Services ($) | | 401(k) Employer Matching Contribution ($) | | | Legal Fees ($) | | PTO Supplemental Payout ($) | | Total ($) |
| Name | |
| Name | | | Year | | Financial Advisor Services ($) | | 401(k) Employer Matching Contribution ($) | | | | Legal Fees ($) | | PTO Supplemental Payout ($) | | Total ($) |
| Christopher S. Sotos | Christopher S. Sotos | | 2022 | | — | | | 12,200 | | | | — | | | — | | | 12,200 | |
| | 2022 | |
| | 2021 | |
| Sarah Rubenstein | |
| | 2022 | |
| | 2021 | |
| Kevin P. Malcarney | |
| | 2022 | |
| | 2021 | |
| | 2021 | | — | | | 11,600 | | | | 8,190 | | | — | | | 19,790 | |
| 2020 | | 2,711 | | | 11,400 | | | | — | | | — | | | 14,111 | |
| Sarah Rubenstein | | 2022 | | — | | | 12,200 | | | | — | | | — | | | 12,200 | |
| 2021 | | — | | | — | | | | — | | | — | | | — | |
| 2020 | | — | | | — | | | | — | | | — | | | — | |
| Kevin P. Malcarney | | 2022 | | 650 | | | 12,200 | | | | — | | | — | | | 12,850 | |
| 2021 | | 950 | | | 11,600 | | | | — | | | — | | | 12,550 | |
| 2020 | | — | | | 10,550 | | | | — | | | — | | | 10,550 | |
| Chad Plotkin | | 2022 | | — | | | 12,200 | | | | — | | | 65,172 | | | 77,372 | |
| 2021 | | 3,000 | | | 11,600 | | | | — | | | — | | | 14,600 | |
| 2020 | | 3,000 | | | 11,169 | | | | — | | | — | | | 14,169 | |
|
Grants of Plan‑Based Awards
Fiscal Year Ended December 31, 20222023
| | Estimated Possible Payouts Under Non‑Equity Incentive Plan Awards | | Estimated Future Payouts Under Equity Incentive Plan Awards | | All Other Stock Awards: Number of Shares of Stock | | Grant Date Fair Value of Stock and Option |
| | | | | | | | Estimated Possible Payouts Under Non‑Equity Incentive Plan Awards | |
| | | | | | | | Estimated Possible Payouts Under Non‑Equity Incentive Plan Awards | |
| | | | | | | | Estimated Possible Payouts Under Non‑Equity Incentive Plan Awards | |
| Name | |
| Name | |
| Name | Name | | Award Type | | Grant Date | | Approval Date | | Threshold ($)(1) | Target ($)(2) | Maximum ($)(3) | | Threshold (#) | Target (#) | Maximum (#) | | or Units (#) | | Awards ($)(4) |
| Christopher S. Sotos | Christopher S. Sotos | | AIP | | — | | | — | | | 332,601 | | 665,201 | | 1,330,402 | | | — | | — | | — | | | — | | | — | |
| RPSU | | 4/15/2022 | | 2/22/2022 | | — | | — | | — | | | 9,902 | | 39,607 | | 59,411 | | | — | | | 1,259,899 | |
| RSU | | 4/15/2022 | | 2/22/2022 | | — | | — | | — | | | — | | — | | — | | | 20,192 | | | 691374 |
| Christopher S. Sotos | |
| Christopher S. Sotos | |
| | RPSU | |
| | RPSU | |
| | RPSU | |
| | RSU | |
| | RSU | |
| | RSU | |
| Sarah Rubenstein | Sarah Rubenstein | | AIP | | — | | | — | | | 81,250 | | 162,500 | | 325,000 | | | — | | — | | — | | | — | | | — | |
| RPSU | | 4/15/2022 | | 2/22/2022 | | — | | — | | — | | | 1,920 | | 7,681 | | 11,522 | | | — | | | 244,333 | |
| RSU | | 4/15/2022 | | 2/22/2022 | | — | | — | | — | | | — | | — | | — | | | 3,916 | | | 134,084 | |
| Sarah Rubenstein | |
| Sarah Rubenstein | |
| | RPSU | |
| | RPSU | |
| | RPSU | |
| | RSU | |
| | RSU | |
| | RSU | |
| Kevin P. Malcarney | Kevin P. Malcarney | | AIP | | — | | | — | | | 130,000 | | 260,000 | | 520,000 | | | — | | — | | — | | | — | | | — | |
| RPSU | | 4/15/2022 | | 2/22/2022 | | — | | — | | — | | | 2,363 | | 9,453 | | 14,180 | | | — | | | 300,700 | |
| RSU | | 4/15/2022 | | 2/22/2022 | | — | | — | | — | | | — | | — | | — | | | 4,819 | | | 165,003 | |
Chad Plotkin(5) | | AIP | | — | | | — | | | 161,000 | | 322,000 | | 644,000 | | | — | | — | | — | | | — | | | — | |
| RPSU | | 4/15/2022 | | 2/22/2022 | | — | | — | | — | | | 3,261 | | 13,045 | | 19,568 | | | — | | | 414,961 | |
| RSU | | 4/15/2022 | | 2/22/2022 | | — | | — | | — | | | — | | — | | — | | | 6,651 | | | 227,730 | |
| Kevin P. Malcarney | |
| Kevin P. Malcarney | |
| | RPSU | |
| | RPSU | |
| | RPSU | |
| | RSU | |
| | RSU | |
| | RSU | |
(1) Threshold non-equity incentive plan awards include annual incentive plan threshold payments, as presented in the CD&A.
(2) Target non-equity incentive plan awards include annual incentive plan target payments, as presented in the CD&A.
(3) Maximum non-equity incentive plan awards include annual incentive plan maximum payments, as presented in the CD&A.
(4) Reflects the grant date fair value determined in accordance with the Financial Accounting Standards Board Accounting Standards Codification Topic 718, Comparison—Stock Compensation. The Company uses the Class C common stock price on the date of grant as the fair value of the Company’s RSUs. The fair value of RPSUs is estimated on the date of grant using a Monte Carlo simulation model. For years preceding 2020, the number of RPSUs granted was based on the fair value of RPSUs estimated on the date of grant using a Monte Carlo simulation model. Beginning with awards granted in 2020, theThe number of RPSUs granted is based on the 10-day average closing price of the Company’s Class C common stock ending on the date of grant. This change in determining fair value of the RPSUs was implemented after reviewing the compensation practices of Compensation Peer Group companies.
(5) Mr. Plotkin voluntarily resigned from his employment with the Company in August 2022.
Outstanding Equity Awards at Fiscal Year End
Fiscal Year Ended December 31, 20222023
| | Option Awards | | Stock Awards |
| Number of | | Number of | | | Number | | Market Value | | Equity Incentive Plan Awards |
| | Option Awards | | | | Option Awards | | Stock Awards |
| | Number of | | | | Number of | | Number of | | | | | | Number | | Market Value | | Equity Incentive Plan Awards |
| Name | Name | | Securities Underlying Unexercised Options (#) Exercisable | | Securities Underlying Unexercised Options (#) Unexercisable | | Option Exercise Price ($) | | Option Expiration Date | | of Shares or Units of Stock that Have Not Vested (#) | | of Shares or Units of Stock that Have Not Vested ($) | | Number of Unearned Shares that Have Not Vested (#)(1) | | Market Value of Unearned Shares that Have Not Vested ($)(1) | Name | | Securities Underlying Unexercised Options (#) Exercisable | | Securities Underlying Unexercised Options (#) Unexercisable | | Option Exercise Price ($) | | Option Expiration Date | | of Shares or Units of Stock that Have Not Vested (#) | | of Shares or Units of Stock that Have Not Vested ($) | | Number of Unearned Shares that Have Not Vested (#)(1) | | Market Value of Unearned Shares that Have Not Vested ($)(1) |
| Christopher S. Sotos | Christopher S. Sotos | | — | | | — | | | — | | | — | | | 45,836(2) | | 1,460,793 | | 149,062(3) | | 4,750,606 | Christopher S. Sotos | | — | | | — | | — | | | — | | — | | | — | | — | | | 47,847 (2) | | 47,847 (2) | | 1,312,443 | | 142,034 (3) | | 3,895,993 |
| Sarah Rubenstein | Sarah Rubenstein | | — | | | — | | | — | | | — | | | 12,735(4) | | 405,864 | | 7,916(5) | | 252,283 | Sarah Rubenstein | | — | | | — | | — | | | — | | — | | | — | | — | | | 10,924 (4) | | 10,924 (4) | | 299,645 | | 19,090 (5) | | 523,639 |
| Kevin P. Malcarney | Kevin P. Malcarney | | — | | | — | | | — | | | — | | | 10,115(6) | | 322,365 | | 32,001(7) | | 1,019,872 | Kevin P. Malcarney | | — | | | — | | — | | | — | | — | | | — | | — | | | 10,730 (6) | | 10,730 (6) | | 294,324 | | 32,454 (7) | | 890,213 |
Chad Plotkin(8) | | — | | | — | | | — | | | — | | | — | | | — | | | — | | | — | |
|
(1) Assumes achievement at target award level for 2020, 2021, 2022 and 20222023 RPSU awards as discussed in the CD&A.
(2) This amount represents 22,81921,595 RSUs and 1,868 DERs that will vest on April 15, 2023, 13,482 RSUs and 7151,907 DERs that will vest on April 15, 2024, and 6,74514,859 RSUs and 207978 DERs that will vest on April 15, 2025.2025, and 8,139 RSUs and 369 DERs that will vest on April 15, 2026.
(3) This amount represents 56,792 RPSUs and 7,014 DERs that will vest on April 15, 2023, 41,319 RPSUs and 3,1145,694 DERs that will vest on April 15, 2024, and 39,607 RPSUs and 1,2163,586 DERs that will vest on April 15, 2025.2025, and 49,580 RPSUs and 2,248 DERs that will vest on April 15, 2026.
(4) This amount represents 5,1155,452 RSUs and 391534 DERs that will vest on April 15, 2023, 1,7112024, 2,985 RSUs and 169194 DERs that will vest on November 2, 2023, 3,775April 15, 2025, and 1,683 RSUs and 76 DERs that will vest on April 15, 2026.
(5) This amount represents 7,681 RPSUs and 695 DERs that will vest on April 15, 2025, 10,250 RPSUs and 464 DERs that will vest on April 15, 2026.
(6) This amount represents 4,793 RSUs and 424 DERs that will vest on April 15, 2024, 3,405 RSUs and 226 DERs that will vest on April 15, 2024,2025, and 1,3081,801 RSUs and 4081 DERs that will vest on April 15, 2025.
(5) This amount represents 7,681 RPSUs and 235 DERs that will vest on April 15, 2025.
(6) This amount represents 4,778 RSUs and 373 DERs that will vest on April 15, 2023, 3,141 RSUs and 164 DERs that will vest on April 15, 2024, and 1,610 RSUs and 49 DERs that will vest on April 15, 2025.2026. Amounts do not include shares withheld for payment of taxes due to retirement eligibility.
(7) This amount represents 10,827 RPSUs and 1,337 DERs that will vest on April 15, 2023, 9,387 RPSUs and 7071,293 DERs that will vest on April 15, 2024, and 9,453 RPSUs and 290856 DERs that will vest on April 15, 2025.2025, and 10,968 RPSUs and 497 DERs that will vest on April 15, 2026.
(8) Mr. Plotkin voluntarily resigned from his employment with the Company in August 2022.
Option Exercises and Stock Vested
Fiscal Year Ended December 31, 20222023
| | | | | | | | | | | | | | | | | | | | | | | | | | |
| | Option Awards | | Stock Awards |
| Name | | Number of Shares Acquired on Exercise (#) | | Value Realized on Exercise ($) | | Number of Shares Acquired on Vesting (#)(1) | | Value Realized on Vesting ($)(2) |
| Christopher S. Sotos | | — | | | — | | | 122,092121,861(3)
| | 4,368,2983,842,342 | |
| Sarah Rubenstein | | — | | | — | | | 6,6687,531(4)
| | 227,324220,360 | |
| Kevin P. Malcarney | | — | | | — | | | 24,28323,830(5)
| | 868,759751,455 | |
Chad Plotkin(7)
| | — | | | — | | | 37,567(6)
| | 1,344,742 | |
(1) Includes shares and DERs that vested pursuant to underlying awards and converted to Class C common stock in 2022.2023.
(2) The values are based on the December 31, 2021April 14, 2023 Class C common stock closing share price of $36.03 for awards and DERs that vested on January 2, 2022, the April 14, 2022 Class C common stock closing share price of $34.24$31.53 for awards and DERs that vested on April 15, 2022,2023, the October 14, 2022November 2, 2023 Class C common stock closing share price of $31.26 for awards and DERs that vested on October 15, 2022, the November 2, 2022 Class C common stock closing share price of $34.91$22.77 for awards and DERs that vested on November 2, 2022.2023. The values for retirement eligible NEOs are based on the Class C common stock closing share price on the dates the awards became eligible for continued vesting and shares and DERs were withheld to cover certain tax withholding obligations.
(3) Represents 9,7899,358 RSUs, 82,00785,188 RPSUs and 13,10012,968 DERs that vested on January 2, 2022April 15, 2023 pursuant to the stock compensation awards granted on January 2, 2019.April 15, 2020. Represents 9,3296,738 RSUs and 839596 DERs that vested on April 15, 20222023 pursuant to the stock compensation award granted on April 15, 2021. Represents 6,723 RSUs and 290 DERs that vested on April 15, 2023 pursuant to the stock compensation award granted on April 15, 2022.
(4) Represents 1,348 RSUs and 184 DERs that vested on April 15, 2023 pursuant to the stock compensation award granted on April 15, 2020. Represents 6,7371,711 RSUs and 291 DERs that vested on April 15, 2022 pursuant to the stock compensation award granted on April 15, 2021.
(4) Represents 689 RSUs and 92 DERs that vested on October 15, 2022 pursuant to the stock compensation award granted on October 15, 2019. Represents 1,343 RSUs and 120 DERs that vested on April 15, 2022 pursuant to the stock compensation award granted on April 15, 2020. Represents 1,706 RSUs and 149248 DERs that vested on November 2, 20222023 pursuant to the stock compensation award granted on November 2, 2020. Represents 2,463 RSUs and 106217 DERs that vested on April 15, 2022 pursuant to the stock compensation award granted on April 15, 2021.
(5) Represents 1,923 RSUs, 16,107 RPSUs and 2,572 DERs that vested on January 2, 2022 pursuant to the stock compensation awards granted on January 2, 2019. Represents 1,615 RSUs and 145 DERs that vested on April 15, 2022 pursuant to the stock compensation award granted on April 15, 2020. Represents 1,530 RSUs and 66 DERs that vested on April 15, 20222023 pursuant to the stock compensation award granted on April 15, 2021. Represents 3051,304 RSUs and 56 DERs that vested on April 15, 2023 pursuant to the stock compensation award granted on April 15, 2022.
(5) Represents 1,784 RSUs, 16,241 RPSUs and 2,471 DERs that vested on April 15, 2023 pursuant to the stock compensation awards granted on April 15, 2020. Represents 1,390 RSUs and 122 DERs that vested on April 15, 2023 pursuant to the stock compensation award granted on April 15, 2021. Represents 1,604 RSUs and 69 DERs that vested on April 15, 2023 pursuant to the stock compensation award granted on April 15, 2022. Represents 143 shares and 206 DERs that were withheld to cover certain tax obligations in 20222023 due to awards becoming eligible for continued vesting in the event of the NEO’s retirement.
(6) Represents 3,045 RSUs, 25,502 RPSUs and 4,073 DERs that vested on January 2, 2022 pursuant to the stock compensation awards granted on January 2, 2019. Represents 2,747 RSUs and 247 DERs that vested on April 15, 2022 pursuant to the stock compensation award granted on April 15, 2020. Represents 1,872 RSUs and 81 DERs that vested on April 15, 2022 pursuant to the stock compensation award granted on April 15, 2021.
(7) Mr. Plotkin voluntarily resigned from his employment with the Company in August 2022.
Employment Agreements
The Company has not entered into employment agreements with any executive officers other than Mr. Sotos.
On September 23, 2021, the Company and Mr. Sotos entered into an agreement amending and restating Mr. Sotos’ employment agreement, dated as of May 6, 2016, as previously amended, pursuant to which Mr. Sotos continues to serve as the Company’s President and CEO for a new term that began on September 23, 2021 (the “Effective Date”). Under this amended and restated employment agreement, the term of Mr. Sotos’ employment will continue until the earlier of the date that his employment is terminated by either party or December 31, 2024; provided that such employment period will automatically renew on the same terms and conditions for additional one-year terms unless either party provides the other party with written notice of its election not to renew the then-current employment period at least 90 days before such period’s expiration date. The amended and restated employment agreement originally entitled Mr. Sotos to an annual base salary of $629,330 for the period beginning on the Effective Date and ending on December 31, 2021. For each annual period thereafter, our Board will determine whether to increase Mr. Sotos’ annual base salary. For the 2022 fiscal year, the Board increased Mr. Sotos’ annual base salary to $665,201.$665,201 and it remained unchanged for the 2023 fiscal year. The amended and restated employment agreement further provides that Mr. Sotos is eligible to receive an annual bonus at a target amount equal to 100% of base salary (i.e., AIP bonus), with it being understood that such percentage may be increased by the Company from time to time, in each case based on achievement of criteria determined by the Board with input from Mr. Sotos. The maximum award opportunity each year is 200% of the target amount. The amended and restated employment agreement further provides that Mr. Sotos is eligible to participate in the LTIP, on such terms as are set forth in the plan. Mr. Sotos’ target LTIP award for the 20222023 fiscal year was approximately 315%350% of base salary.
In addition to the compensation and benefits described above, as well as paid vacation and director and officer liability insurance, the amended and restated employment agreement provides that Mr. Sotos will receive the following:
•Reimbursement for annual tax return preparation expenses and tax advice and financial planning, up to a maximum of $12,000 per year;
•Eligibility to participate in the Company’s retirement plans, health and welfare plans, and disability insurance plans under the same terms, and to the same extent, as other senior management of the Company; and
•Reimbursement for the costs of litigation or other disputes incurred in asserting any claims under the amended and restated employment agreement, unless the court finds in favor of the Company.
The amended and restated employment agreement also provided Mr. Sotos with a reimbursement for legal fees incurred in connection with reviewing and finalizing his amended and restated employment agreement, up to a maximum of $12,000 (as noted above, Mr. Sotos received a reimbursement of $8,190 in 2021 under this provision of his employment agreement).$12,000.
The amended and restated employment agreement further entitles Mr. Sotos to certain severance payments and benefits in the event his employment terminates under certain circumstances. These severance payments and benefits are described and quantified under the section “Severance and Change‑in‑Control” below. In addition, under the amended and restated employment agreement, the Company has agreed to indemnify Mr. Sotos against any claims arising as a result of his position with the Company to the fullest extent permitted by the Company’s certificate of incorporation, bylaws or Board resolutions or, if greater, Delaware law.
The amended and restated employment agreement includes non‑competition and non‑solicitation restrictions on Mr. Sotos during the term of his employment and for one year after his termination of employment. The amended and restated employment agreement also includes confidentiality, indemnification obligations and intellectual property restrictions and an obligation for Mr. Sotos to cooperate with the Company in the event of any internal, administrative, regulatory, or judicial proceeding. The provisions of the amended and restated employment agreement may only be waived with the written consent of the Company and Mr. Sotos.
Severance and Change‑In‑Control
Each NEO’s RPSU and RSU award agreements under the LTIP provide for special treatment in the event of such NEO’s termination of employment under certain circumstances. Upon death or disability, an NEO’s RSUs and RPSUs will vest in full and the performance metrics with respect to the RPSUs will be deemed to be achieved at target levels. Upon retirement, an NEO’s RSUs and RPSUs will remain eligible for vesting pursuant to the award agreement as though the NEO was continuously employed by the Company throughout the relevant period; provided that retirement occurs more than 12 months following the applicable award’s grant date. Further, if an NEO’s employment is involuntarily terminated by the Company without cause“cause” (as defined in Mr. Sotos’ amended and restated employment agreement with respect to Mr. Sotos, and as defined in the LTIP with respect to the other NEOs) during the “Change in Control Period” (as defined below), (i) such NEO’s RSUs will vest in full immediately upon the later of such change in control or such termination of employment and (ii) the Compensation Committee will, pursuant to the terms and conditions of the LTIP and RPSU award agreement(s), determine the final amount payable to the NEO, if any, pursuant to his or her RPSUs. In general, no RPSU or RSU that is granted to an NEO provides for accelerated vesting upon any other involuntary termination. RSUs granted to Ms. Rubenstein prior to her promotion to Senior Vice President and Chief Accounting Officer in 2022 provide pro-rated vesting for certain involuntary terminations of service that occur in connection with certain significant business events. Mr. Plotkin’s outstanding RPSUs and RSUs were forfeited as of the time of his resignation in August 2022.
The “Change in Control Period” is the period commencing six months immediately prior to, and ending 24 months immediately following, a change“change in controlcontrol” of the Company (as “change in control” is defined in Mr. Sotos’ amended and restated employment agreement with respect to Mr. Sotos, and in the LTIP and Mr. Sotos’ employment agreement as applicable)with respect to the other NEOs).
In addition to the above-describedabove described treatment of the equity awards, Mr. Sotos, pursuant to his amended and restated employment agreement, and the other NEOs, pursuant to the CIC Plan and in some cases, the AIP, are entitled to certain additional severance payments and benefits in the event of termination of employment under certain circumstances, including following a change‑in‑control.
Mr. Sotos’ Benefits
If Mr. Sotos’ employment is involuntarily terminated by the Company without cause (including by reason of the Company’s non-renewal of Mr. Sotos’ employment term under his employment agreement) or if he terminates his employment for good reason, subject to Mr. Sotos executing a release of claims, the Company agrees to provide Mr. Sotos with the following severance benefits:
•A lump sum payment equal to no less than 1.5 times Mr. Sotos’ annual base salary in effect at the time of Mr. Sotos’ termination of employment;
•A lump sum payment equal to the bonus that Mr. Sotos would have earned if his employment had not terminated (i.e., contingent on satisfaction of the performance goals applicable to such bonus) under the then‑current bonus plan, which amount will be pro‑rated based on the number of days during the year that he was employed by the Company and paid at the time annual bonus payments are generally made to the Company’s executive officers;
•Any unpaid bonus amount for the prior fiscal year to the extent not paid prior to the termination date; and
•Reimbursement of the portion of COBRA premiums based on the monthly premium cost that would have been paid by the Company immediately prior to Mr. Sotos’ termination of employment for a period of 18 months after the date of termination, except that such coverage will be discontinued if Mr. Sotos becomes eligible for medical benefits from a subsequent employer or otherwise.
If Mr. Sotos’ employment is involuntarily terminated by the Company without cause (including by reason of the Company’s non-renewal of Mr. Sotos’ employment term under his employment agreement) or if he terminates his employment for good reason within the six months immediately prior to, or the 24 months immediately following, a change in control of the Company (i.e., the Change in Control Period with respect to Mr. Sotos), in lieu of the severance benefits set forth above, the Company will provide Mr. Sotos with the following severance benefits:
•A lump sum payment of no less than three times the sum of (a) Mr. Sotos’ base salary in effect at the time of Mr. Sotos’ termination of employment, or if greater, at such time that is immediately prior to the change in control and (b) Mr. Sotos’ target bonus opportunity under the then-current bonus plan for the year of termination;
•A lump sum payment equal to the target bonus opportunity under the then‑current bonus plan, which amount will be pro‑rated based on the number of days during the year that he was employed by the Company;
•Any unpaid bonus amount for the prior fiscal year to the extent not paid prior to the termination date; and
•Reimbursement of the portion of COBRA premiums based on the monthly premium cost that would have been paid by the Company immediately prior to Mr. Sotos’ termination of employment for a period of 18 months after the date of termination, except that such coverage will be discontinued if Mr. Sotos becomes eligible for medical benefits from a subsequent employer or otherwise.
If Mr. Sotos’ employment is terminated as a result of his death or disability, the Company agrees to pay him an amount equal to the target bonus opportunity for the year of termination, which amount will be pro‑rated based on the number of days during the year that Mr. Sotos was employed by the Company. In addition, the Company will pay Mr. Sotos any unpaid bonus amount for the prior fiscal year to the extent not paid prior to the termination date.
If an excise tax under Section 4999 of the Code would be triggered by any payments under Mr. Sotos’ amended and restated employment agreement or otherwise upon a change‑in‑control, the Company will reduce such payments so that no amounts are subject to Section 4999 of the Code, if such reduction would cause the amount to be retained by Mr. Sotos to be greater than if Mr. Sotos were required to pay such excise tax.
NEO Benefits
Eligible NEOs may receive a discretionary payment of the pro-rated target bonus under the AIP in the event of such NEO’s termination of employment under certain circumstances, including upon his or her termination due to retirement or involuntary termination without cause. Such amount, if payable in the Compensation Committee’s discretion, will be pro-rated based on the number of days during the year that he or she was employed by the Company. In addition, under the CIC Plan, in the event of involuntary termination without cause, eligible NEOs are entitled to a general severance benefit equal to 1.5 times base salary payable in a lump sum amount and reimbursement for COBRA benefits continuation cost for a period of 18 months.
The CIC Plan also provides a change-in-control benefit in the event that, within six months prior to, as well as 24 months following, a change-in-control, an eligible NEO’s employment is either involuntarily terminated by the Company without cause or voluntarily terminated by such NEO for good reason. Mr. Plotkin’s change-in-control benefit consisted of an amount equal to 2.99 times the sum of his base salary plus the annual target incentive for the year of termination, payable in a lump sum amount. The change-in-control benefit for Mr. Malcarney consists of an amount equal to 2.99 times the sum of his base salary plus the annual target incentive for the year of termination. In connection with Ms. Rubenstein became eligible to participate in the CIC Plan upon her promotion to SeniorRubenstein’s appointment as Executive Vice President and Chief AccountingFinancial Officer in January 2022. TheApril 2023, the change-in-control benefit for Ms. Rubenstein consistswas increased to an amount equal to 2.99 times the sum of anher base salary plus the annual target incentive for the year of termination (prior to such appointment such amount was equal to 2.0 times the sum of her base salary plus the annual target incentive for the year of termination. Prior to her promotion, Ms. Rubenstein was eligible for change-in-control and severance benefits under the Key Management Change-in-Control and General Severance Plan.termination). All such NEOs are also eligible for an amount equal to their target bonus for the year of termination, pro-rated for the number of days during the performance period that such NEO was employed by the Company and reimbursement for all or a portion of such NEO’s COBRA benefits continuation cost for a period of 18 months, such that the NEO maintains the same coverage level and cost, on an after-tax basis, as in effect immediately prior to his or her termination of employment.
As a condition of receiving severance or change-in-control benefits, an eligible NEO must execute a release of claims and acknowledge the restrictive covenants in the CIC Plan. Such restrictive covenants include non-competition, non-solicitation and non-disparagement covenants applicable for one year after termination, confidentiality and intellectual property obligations. The provisions of the CIC Plan may only be waived by the written consent of the Compensation Committee and the applicable NEO.
If an excise tax under Section 4999 of the Code would be triggered for an eligible NEO by any payments under the CIC Plan or otherwise upon a change-in-control, the Company will reduce such payments so that no amounts are subject to Section 4999 of the Code, if such reduction would cause the amount to be retained by such NEO to be greater than if such NEO were required to pay such excise tax.
Definition of Change-In-Control, Etc.
In general, under Mr. Sotos’ amended and restated employment agreement and the CIC Plan, a “change-in-control” occurs in the event: (a) any person or entity (with certain exceptions), becomes the direct or indirect beneficial owner of 50% or more of the Company’s then-outstanding voting or common stock or obtains the power to, directly or indirectly, vote or cause to be voted 50% or more of the Company’s capital stock entitled to vote in the election of directors, including by contract or through proxy, (b) directors serving on the Board as of a specified date cease to constitute at least a majority of the Board unless such directors are approved by a vote of at least a majority of the incumbent directors; provided that a person whose assumption of office is in connection with an actual or threatened election contest or actual or threatened solicitation of proxies including by reason of agreement intended to avoid or settle such contest shall not be considered to be an incumbent director, (c) any reorganization, merger, consolidation, sale of all or substantially all of the assets of the Company or other transaction is consummated unless the previous stockholders of the Company own more than 50% of the then-outstanding common stock and combined voting power of the company resulting from such change-in-control transaction, or (d) the stockholders approve a plan or proposal to liquidate or dissolve the Company.
An involuntary termination without “cause” means the NEO’s termination by the Company for any reason other than the NEO’s (a) conviction of, or agreement to a plea of nolo contendere to, a felony or other crime involving moral turpitude (including an indictment therefore under the CIC Plan), (b) willful failure to perform his or her duties (or in Mr. Sotos’ case, his material duties pursuant to his amended and restated employment agreement), (c) willful gross neglect or willful misconduct (including a material act of theft, fraud, malfeasance or dishonesty in connection with his or her performance of duties under the CIC Plan), or (d) breach of any written agreement between the Company or NEO, a violation of the Company’s Code of Conduct or other written policy (or in Mr. Sotos’ case, a material breach of such a written agreement or material violation of the Company’s Code of Conduct).
A voluntary termination for “good reason” means the resignation of the NEO in the event of (a) a reduction in his or her base salary or target total compensation by more than 15%, excluding across-the-board reductions to his or her base salary or annual bonus target, or if during the Change in Control Period, any reduction of base salary or target total compensation (without regard to whether the reduction applies on an across-the-board basis), (b) a material reduction in his or her benefits under or relative level of participation in the Company’s employee benefit plans, (c) a material diminution in his or her title, authority, duties or responsibilities, (d) a relocation of his or her principal place of employment by more than 50 miles or (e) the failure of a successor to the Company to agree, in writing, to assume the CIC Plan, or in the case of Mr. Sotos, his amended and restated employment agreement, within 15 days after a merger, consolidation, sale or similar transaction. In Mr. Sotos’ case only, “good reason” also includes (i) in lieu of the event described in the preceding subclause (a), a reduction in his base salary, annual bonus target, or target long-term incentive awards by more than 15%, excluding across-the-board reductions to his base salary, annual bonus target, and/or target long-term incentive awards, or if during the period that is within the six months immediately prior to, or 24 months immediately following a change in control of the Company, any reduction of base salary, annual bonus target, or target long-term incentive awards (without regard to whether the reduction applies on an across-the-board basis), (ii) any material failure by the Company to comply with his amended and restated employment agreement, (iii) his removal from the Board, (iv) the failure to elect him to the Board during any regular election, or (v) a change in reporting structure of the Company requiring Mr. Sotos to report to anyone other than the Board.
Potential Payments Upon Termination or Change‑In‑Control
The amount of compensation payable to each NEO in each circumstance is shown in the table below, assuming that termination of employment occurred as of December 31, 2022,2023, and including payments that would have been earned as of such date. The amounts shown below do not include benefits payable under the Company’s 401(k) plan.
| | Named Executive Officer | Named Executive Officer | | Involuntary Termination Not for Cause ($) | Voluntary Termination for Good Reason ($) | | Involuntary Not for Cause or Voluntary for Good Reason Following a Change in Control ($) | | Death or Disability ($) | Qualified Retirement | |
| Named Executive Officer | |
| Named Executive Officer | |
| Christopher S. Sotos | |
| Christopher S. Sotos | |
| Christopher S. Sotos | Christopher S. Sotos | | 1,683,534 | | 1,683,534 | | | 10,888,490 | | | 6,876,752 | | — | | |
Sarah Rubenstein(1) | Sarah Rubenstein(1) | | 789,655 | | — | | | 1,830,963 | | | 820,750 | | — | | |
Sarah Rubenstein(1) | |
Sarah Rubenstein(1) | |
Kevin P. Malcarney(2) | Kevin P. Malcarney(2) | | 897,351 | | — | | | 3,613,118 | | | 1,602,367 | | 1,133,550 | | |
Chad Plotkin(3) | | — | | — | | | — | | | — | | — | | |
Kevin P. Malcarney(2) | |
Kevin P. Malcarney(2) | |
(1) Ms. Rubenstein was promoted toappointed as Executive Vice President and Chief Financial Officer in April 2023. Ms. Rubenstein previously served as Senior Vice President and Chief Accounting Officer in January 2022 and appointed asof the principal financial officer for the Company in August 2022.Company.
(2) Mr. Malcarney was promoted to Executive Vice President, General Counsel and Corporate Secretary in January 2022. He met the definition of Qualified Retirement in 2022 and is therefore entitled to certain payments and vesting of awards in the event he retires before they vest.
(3) Mr. Plotkin was promoted to Executive Vice President and Chief Financial Officer in January 2022. Mr. Plotkin voluntarily resigned from his employment with the Company in August 2022. Accordingly, disclosure is limited to the voluntary termination event (without good reason) that actually occurred, such that, no termination benefits were due or owing to Mr. Plotkin in connection with such voluntary termination event.
CEO Pay Ratio
As a result of the rules under the Dodd-Frank Act, the SEC requires disclosure of the CEO to median employee pay ratio. The following is a reasonable estimate, prepared under applicable SEC rules, of the ratio of the annual total compensation of our CEO, Mr. Sotos, to the annual total compensation of our median employee.
WeIn light of the sale of the Thermal Business in 2022, a new median employee was identified in 2022. With respect to the 2023 CEO Pay ratio analysis, we determined that we could use in our 2022 CEO pay ratio analysis the same median employee that we identified in 20212022 given that there washad been no change in either our employee population or our employee compensation arrangements that we believe would significantly impact our 2023 pay ratio disclosure. In light of the Thermal saleSimilarly, there has been no change in our median employee’s circumstances that occurredwe reasonably believe would result in 2022, a new median employee was identified in 2022.significant change to our 2023 pay ratio disclosure. Our median employee’s annual total compensation for 20222023 was determined using the same rules that apply to reporting the compensation of our NEOs (including our CEO) in the “Total” column of the “Summary Compensation Table — 20202021 — 2022”2023” above. The following total compensation amounts were determined based on that methodology:
•The annual total compensation of the median employee for 20222023 was $136,464.$140,622.
•The annual total compensation of Mr. Sotos for 20222023 was $3,348,224.$3,458,999.
•As a result, we estimate that Mr. Sotos’ 20222023 annual total compensation was approximately 25 times that of our median employee.
Given the different methodologies, exemptions, estimates and assumptions that various public companies use to determine an estimate of their pay ratio, the estimated ratio reported above should not be solely used as a basis for comparison between companies.
Item 12 — Security Ownership of Certain Beneficial Owners and Management and Related Stockholder Matters
Clearway Energy LLC Ownership
As of December 31, 2022,2023, GIP and TotalEnergies, through CEG, owned 42,738,750 of each of the Company’s Class B units and 42,336,750 of the Company’s Class D units, and Clearway, Inc. owned 34,613,853 of the Company’s Class A units and 82,283,46082,391,441 of the Company’s Class C units. As of December 31, 2022,2023, Clearway, Inc., through its holdings of Class A units and Class C units, owned a 57.88%57.90% economic interest in the Company. Clearway, Inc. consolidates the results of the Company through its controlling interest as sole managing member. As of December 31, 2022,2023, CEG, through its holdings of Class B units and Class D units, owned a 42.12%42.10% economic interest in the Company.
Clearway, Energy, Inc. Ownership
Stock Ownership of Executive Officers
The following table sets forth information concerning beneficial ownership of Clearway, Inc.’s Class A and Class C common stock and combined voting power of Class A, Class B, Class C and Class D common stock for: (a) each NEO and (b) all executive officers as a group. The percentage of beneficial ownership is based on 34,613,853 shares of Class A common stock outstanding as of January 31, 2023,2024, and 82,283,46082,391,441 shares of Class C common stock outstanding as of January 31, 2023,2024, and percentage of combined voting power is based on 78,598,80578,599,885 votes represented by Clearway, Inc.’s outstanding Class A, Class B, Class C and Class D common stock in the aggregate as of January 31, 2023.2024. The percentage of beneficial ownership and the percentage of combined voting power also include any shares that such person has the right to acquire within 60 days of January 31, 2023.2024. Unless otherwise indicated, each person has sole voting and dispositive power with respect to the shares set forth in the following table.
The address of the beneficial owners is Clearway, Energy, Inc., 300 Carnegie Center, Suite 300, Princeton, New Jersey 08540.
| | | | | | | | | | | | | | | | | |
| | | Common Stock |
| Class A Common Stock | Class C Common Stock | % of |
| Executive Officers | Number(1) | % of Class A Common Stock | Number(1) | % of Class C Common Stock | Combined Voting Power(2) |
| Christopher S. Sotos | 27,10031,100(3)
| * | 331,940332,616(3)
| * | * |
| Sarah Rubenstein | 380(4) | * | 18,53222,995(4)
| * | * |
| Kevin P. Malcarney | 600(5) | * | 67,88168,082(5)
| * | * |
| All executive officers as a group (three people) | 28,08032,080(6)
| * | 418,353423,693(6)
| * | * |
* Less than one percent of outstanding Class A common stock, Class C common stock or combined voting power, as applicable.
(1) The number of shares beneficially owned by each person or entity is determined under the rules of the SEC, and the information is not necessarily indicative of beneficial ownership for any other purpose. Under such rules, each person or entity is considered the beneficial owner of any: (a) shares to which such person or entity has sole or shared voting power or dispositive power and (b) shares that such person or entity has the right to acquire within 60 days.
(2) Represents the voting power of all of the classes of Clearway, Inc.’s common stock together as a single class. Each holder of Class A or Class B common stock is entitled to one vote for each share held. Each holder of Class C or Class D common stock is entitled to 1/100th of one vote for each share held. Holders of shares of Clearway, Inc.’s Class A, Class B, Class C and Class D common stock vote together as a single class on all matters presented to its stockholders for their vote or approval, except as otherwise provided by applicable law.
(3) Includes 12,3915,228 DERs to be paid in Class C common stock. Excludes 20,22722,998 RSUs, 12,2687,184 DERs and 80,92689,187 RPSUs. Each RSU represents the right to receive one share of Class C common stock upon vesting. Each RPSU represents the potential to receive Class C common stock based upon Clearway, Inc. achieving a certain level of total shareholder return relative to Clearway, Inc.’s peer group over a three-year performance period. Each DER represents the right to receive the dividends and distributions that would have otherwise been paid with respect to a share subject to a RSU or RPSU award (if such share were outstanding rather than being subject to the applicable award).
(4) Includes 392535 DERs to be paid in Class C common stock. Excludes 6,7944,668 RSUs, 6721,431 DERs and 7,68117,931 RPSUs. Each RSU represents the right to receive one share of Class C common stock upon vesting. Each RPSU represents the potential to receive Class C common stock based upon Clearway, Inc. achieving a certain level of total shareholder return relative to Clearway, Inc.’s peer group over a three-year performance period. Each DER represents the right to receive the dividends and distributions that would have otherwise been paid with respect to a share subject to a RSU or RPSU award (if such share were outstanding rather than being subject to the applicable award).
(5) Includes 2,3801,037 DERs to be paid in Class C common stock. Excludes 4,7515,063 RSUs, 2,5501,805 DERs and 18,84020,421 RPSUs. Each RSU represents the right to receive one share of Class C common stock upon vesting. Each RPSU represents the potential to receive Class C common stock based upon Clearway, Inc. achieving a certain level of total shareholder return relative to Clearway, Inc.’s peer group over a three-year performance period. Each DER represents the right to receive the dividends and distributions that would have otherwise been paid with respect to a share subject to a RSU or RPSU award (if such share were outstanding rather than being subject to the applicable award).
(6) Consists of the total holdings of all executive officers as a group.
Item 13 — Certain Relationships and Related Transactions, and Director Independence
Relationship with GIPCEG and Clearway, Energy, Inc.
GIP, through its ownership of CEG indirectly owns all of Clearway, Inc.’s outstanding Class B common stock and Class D common stock, which represents, in the aggregate, 54.91% of the voting interest in Clearway, Inc.’s stock, and receives distributions from the Company through its ownership of the Company’s Class B and Class D units. Holders of Clearway, Inc.’s Class A common stock and Class C common stock hold, in the aggregate, the remaining 45.09% of the voting interest in Clearway, Inc.’s stock. Each holder of Clearway, Inc.’s Class A or Class B common stock is entitled to one vote for each share held. Each holder of Clearway, Inc.’s Class C or Class D common stock is entitled to 1/100th of one vote for each share held. The holders of Clearway, Inc.’s outstanding shares of Class A and Class C common stock are entitled to dividends as declared. Clearway, Inc., through its holdings of the Company’s Class A units and Class C units, owns a 57.88%57.90% economic interest in the Company. GIP,CEG, through CEG’sits holdings of the Company’s Class B units and Class D units, owns a 42.12%42.10% economic interest in the Company.
CEG Master Services Agreements
The Company along with Clearway, Inc. and Clearway Energy Operating LLC, entered intois party to the CEG Master Services Agreements, with CEG (the “CEG Master Services Agreements”), pursuant to which CEG and certain of its affiliates or third-party service providers provide certain services to the Company, including operational and administrative services, which include human resources, information systems, cybersecurity, external affairs, accounting, procurement, and risk management services, to the Company and certain of its subsidiaries, and the Company andprovides certain of its subsidiaries provide certain services to CEG, including accounting, internal audit, tax and treasury services, to CEG, in exchange for the payment of fees in respect of such services. For the year ended December 31, 2022,2023, the Company paid approximately $4,810,000$4,840,000 under the CEG Master Services Agreements. In addition, certain Thermal segment projects reimbursed CEG approximately $228,000 during the year ended December 31, 2022 for costs incurred by CEG on behalf of such entities.
CEG ROFO Agreement and Committed Investments
On August 31, 2018, the Company entered into a ROFO Agreement with CEG, or the CEG ROFO Agreement, and, solely for certain purposes thereof, GIP, pursuant to which CEG granted the Company and its subsidiaries a right of first offer on any proposed sale or transfer of certain assets owned by CEG. On August 1, 2019, the CEG ROFO Agreement was amended to grant the Company and its affiliates a right of first offer on any proposed sale, transfer or other disposition of certain assets of CEG, or the CEG ROFO Assets, until August 31, 2023, as listed in the table below. CEG is not obligated to sell the remaining CEG ROFO Assets to the Company and, if offered by CEG, the Company cannot be sure whether these assets will be offered on acceptable terms or that the Company will choose to consummate such acquisitions.
The assets listed below all of which are included in co-investment partnerships, represent the Company’s currently committed investments in projects with CEG and the CEG ROFO Assets:CEG:
| | | | | | | | | | | | | | | | | | | | | | | | | | | | | | | | |
| Asset | | Technology | | Gross Capacity (MW) | | State | | Estimated COD | | Status |
Daggett Solar 3Cedar Creek | | Solar/StorageWind | | 300160 | | CAID | | 1H23 | | Committed1H24 |
Daggett Solar 2Cedro Hill Repowering | | Solar/StorageWind | | 182160 | | CATX | | 2H23 | | Committed2H24 |
| | | | | | | | |
AricaTexas Solar Nova 2 (a)
| | Solar | | Solar/Storage | | 263 | | CA | | 2H23 | | Committed |
Victory Pass | | Solar/Storage | | 200 | | CATX | | 2H23 | | Committed1H24 |
| | | | | | | | |
Prior to engaging(a) Included in any negotiation regarding any disposition, sale or other transfer of any of the remaining CEG ROFO Assets, CEG will deliver a written notice to the Company setting forth the material terms and conditions of the proposed transaction. During the 30‑day period after the delivery of such notice, the Company will negotiate with CEG in good faith to reach an agreement on the transaction. If the Company and CEG do not reach an agreement within such 30‑day period, CEG will be able to within the next 180 calendar days, sell, transfer, dispose or recontract such CEG ROFO Asset to a third-party (or to agree in writing to undertake such transaction with a third-party on terms generally no less favorable to CEG than those offered pursuant to the written notice).
Under the CEG ROFO Agreement, CEG is not obligated to sell the remaining CEG ROFO Assets. In addition, any offer to sell under the CEG ROFO Agreement will be subject to an inherent conflict of interest because the same professionals within CEG’s organization that are involved in acquisitions that are suitable for the Company have responsibilities within CEG’s broader asset management business. Notwithstanding the significance of the services to be rendered by CEG or their designated affiliates on the Company’s behalf or of the assets which the Company may elect to acquire from CEG in accordance with the terms of the CEG ROFO Agreement or otherwise, CEG does not owe fiduciary duties to the Company or its unit holders. Any material transaction with CEG (including the proposed acquisition of any CEG ROFO Asset) will be subject to the Company’s related person transaction policy, which will require prior approval of such transaction by the Company’s Corporate Governance, Conflicts and Nominating Committee.
The Company and CEG work collaboratively in considering new assets to be added under the CEG ROFO Agreement or to be acquired by the Company outside of the CEG ROFO Agreement.co-investment partnership.
Drop Drown Transactions and Partnerships with CEG
Daggett 3Texas Solar Nova 1 Drop Down
On February 17,December 28, 2023, Daggett Solar Investment LLC, a subsidiary of the Company, acquired the Class A membership interests in Daggettthrough its indirect subsidiary, Lighthouse Renewable Holdco LLC from Clearway Renew LLC, a subsidiary of CEG, for cash consideration of $21 million. Simultaneously, Daggett Renewable Holdco2 LLC, acquired Daggett TargetCoTSN1 BL Borrower Holdco LLC, the indirect owner of the Daggett 3 solar project,Texas Solar Nova 1, a 300252 MW solar project with matching storage capacity that is currently under construction and located in San Bernardino, California. DaggettKent County, Texas, from Clearway Renew for cash consideration of $23 million. Lighthouse Renewable Holdco 2 LLC is a partnership between the Company and a third-partycash equity investor. TSN1 BL Borrower Holdco LLC consolidates as primary beneficiary, TSN1 TE Holdco LLC, a tax equity fund that owns the Texas Solar Nova 1 solar project.
In connection with the Texas Solar Nova 1 Drop Down, the Company assumed non-recourse project-level debt, which included a construction loan, sponsor equity bridge loan and tax equity bridge loan. At acquisition date, when the project reached substantial completion, the tax equity investor contributed $148 million, which was utilized, along with the Company’s entire purchase price that was contributed back to the Company by CEG and the proceeds from the cash equity investor, to repay the $109 million sponsor equity bridge loan, to repay the $151 million tax equity bridge loan, to fund $18 million in construction completion reserves, and to pay $5 million in associated fees with the remaining $9 million distributed back to CEG.
Victory Pass and Arica Drop Down
On October 31, 2023, the Company, through its indirect subsidiary, VP-Arica Parent Holdco LLC, acquired the Class A membership interests in VP-Arica TargetCo LLC, a partnership and the indirect owner of Victory Pass, a 200 MW solar project that is paired with 50 MW of energy storage, and Arica, a 263 MW solar project that is paired with 136 MW of energy storage, which are both currently under construction in Riverside, California, from Clearway Renew for initial cash consideration of $46 million. VP-Arica TargetCo LLC consolidates as primary beneficiary, VP-Arica TE Holdco LLC, a tax equity fund that owns the Victory Pass and Arica solar projects.
In connection with the Victory Pass and Arica Drop Down, the Company assumed non-recourse project-level debt, which included a sponsor equity bridge loan and tax equity bridge loan. A partial payment of $133 million was made on the sponsor equity bridge loan at acquisition date utilizing all of the proceeds from the Company, which were contributed back to the Company by CEG, and the contribution from the cash equity investor.
Daggett 2 Drop Down
On August 30, 2023, the Company, through its indirect subsidiary, Daggett Solar Investment LLC, acquired the Class A membership interests in Daggett 2 TargetCo LLC, a partnership and the indirect owner of Daggett 2, a 182 MW solar project that is paired with 131 MW of energy storage and is located in San Bernardino, California, from CEG for cash consideration of $13 million. Daggett 2 TargetCo LLC consolidates as primary beneficiary, Daggett 2 TE Holdco LLC, a tax equity fund that owns the Daggett 2 solar project.
In connection with the Daggett 2 Drop Down, the Company assumed non-recourse project-level debt, which included a construction loan and tax equity bridge loan. On December 22, 2023, when the project reached substantial completion, the tax equity investor contributed an additional $202 million, which was utilized, along with the $120 million in escrow and $10 million in construction loan proceeds, to repay the $204 million tax equity bridge loan, to fund $36 million in construction completion reserves and to pay $1 million in associated fees with the remaining $91 million distributed to CEG.
Rosamond Central BESS Drop Down and Financing Activities
On June 30, 2023, the Company through its indirect subsidiary, Rosie Class B LLC, the indirect owner of the Rosamond Central solar project, became the owner of the Class B membership interests of Rosie Central BESS in order to facilitate and fund the construction of a 147 MW BESS project that is co-located at the Rosamond Central solar facility. Clearway Renew indirectly owns the Class A membership interests and controls Rosie Central BESS. As of December 31, 2023, the Company’s investment consisted of $28 million contributed into Rosie Central BESS, funded through contributions from the Company and its cash equity investor in Rosie TargetCo LLC, which consolidates Rosie Class B LLC. On December 1, 2023, the Rosamond Central solar project acquired the BESS project from Clearway Renew for initial cash consideration of $70 million, $16 million of which was funded by the Company with the remaining $54 million funded through contributions from the cash equity investor in Rosie TargetCo LLC and the tax equity investor in Rosie TE HoldCo LLC.
Also, on July 3, 2023, Rosie Class B LLC, utilizing a portion of the proceeds from borrowings received under its refinanced debt facility, issued a loan to Clearway Renew in order to finance the construction of the BESS project. On December 1, 2023, Clearway Renew partially repaid the loan utilizing the $70 million in proceeds that was paid by the Company to acquire the BESS project. As of December 31, 2023, the loan issued to Clearway Renew had an aggregate principal amount of $174 million. The loan matures when the project reaches substantial completion, which is expected in the first half of 2024.
Daggett 3 Drop Down
On February 17, 2023, the Company, through its indirect subsidiary, Daggett Solar Investment LLC, acquired the Class A membership interests in Daggett TargetCo LLC, the indirect owner of Daggett 3, a 300 MW solar project that is paired with 149 MW of energy storage and located in San Bernardino, California, from Clearway Renew for cash consideration of $21 million. The Company then contributed its Class A membership interests into Daggett Renewable Holdco LLC, a partnership that consolidates Daggett TargetCo LLC. Daggett TargetCo LLC consolidates as the direct owner of the primary beneficiary, Daggett TE Holdco LLC, a tax equity fund Daggett TE Holdco LLC, which holdsthat owns the Daggett 3 solar project.
In connection with the Daggett 3 has PPAsDrop Down, the Company assumed non-recourse project-level debt, which included a construction loan, sponsor equity bridge loan and tax equity bridge loan. The $75 million sponsor equity bridge loan was repaid at acquisition date, along with investment-grade counterparties that have a 15-year weighted average contract duration that will commence$8 million in associated fees, utilizing all of the proceeds from the Company, which were contributed back by CEG, and the contribution from the cash equity investor. On December 1, 2023, when the project reaches commercial operations,reached substantial completion, the tax equity investor contributed an additional $252 million, which was utilized along with the $69 million in escrow, to repay the $229 million tax equity bridge loan, to fund $40 million in construction completion reserves, which is expectedincluded in restricted cash on the Company’s consolidated balance sheet, and to occurpay $7 million in associated fees with the first halfremaining $45 million distributed to CEG.
During the year ended December 31, 2023, the Company also received $54 million from CEG to fund project costs, $22 million of 2023. Thewhich were incurred after the acquisition date. In October 2023, the $54 million funded by CEG was fundedrepaid, along with existing sourcesa distribution of liquidity.$8 million, which was an estimate of the remaining project costs to be incurred prior to substantial completion.
Waiawa Drop Down
On October 3, 2022, the Company, through its indirect subsidiary, Lighthouse Renewable Holdco LLC, acquired Waiawa BL Borrower Holdco LLC, the indirect owner of the Waiawa solar project, a 36 MW solar project that is paired with matching36 MW of energy storage capacityand located in Honolulu, Hawaii, from Clearway Renew LLC for cash consideration of $20 million. Lighthouse Renewable Holdco LLC is a partnership between the Company and a third-party investor. Waiawa BL Borrower Holdco LLC consolidates, as the direct owner of the primary beneficiary, a tax equity fund, Waiawa TE Holdco LLC, which directly holds the Waiawa solar project . Waiawa has a 20-year PPA with an investment-grade utility that commenced in January 2023.
Renew. In connection with the Waiawa Drop Down, the Company assumed non-recourse project-level debt,the project’s financing agreement, which included a construction loan, sponsortax equity bridge loan and taxsponsor equity bridge loan. The $26 million sponsor equity bridge loan was repaid at acquisition date, along with $2 million in associated fees, utilizing $12 million from the cash equity investor, as well as $16 million of the Company's purchase price, which was contributed back to the Company by CEG.
Capistrano Wind Portfolio Acquisition
On August 22, 2022, the Company, through its wholly-owned indirect subsidiary, Capistrano Portfolio Holdco LLC, acquired the Capistrano Wind Portfolio from Capistrano Wind Partners LLC, an indirect subsidiary of CEG, for a base purchase price of approximately $255 million, less working capital adjustments in the net amount of approximately $16 million, representing total net consideration of approximately $239 million. Concurrent with the acquisition, the Company also entered into a development agreement with Clearway Renew LLC, whereby Clearway Renew LLC paid $10 million to the Company at acquisition date for an exclusive right to develop, construct and repower the projects in the Capistrano Wind Portfolio, which was utilized to partially fund the acquisition of the Capistrano Wind Portfolio. The Capistrano Wind Portfolio consists of five wind projects located in Texas, Nebraska and Wyoming with a combined capacity of 413 MW. The assets within the portfolio sell power under PPAs with investment-grade counterparties that have a weighted average remaining contract duration of approximately 9 years.
Mililani I Drop Down
On March 25, 2022, the Company, through its indirect subsidiary, Lighthouse Renewable Holdco LLC, acquired Mililani BL Borrower Holdco LLC, the indirect owner of the Mililani I solar project, a 39 MW solar project with matching storage capacity located in Honolulu, Hawaii, from Clearway Renew LLC for cash consideration of $22 million. Lighthouse Renewable Holdco LLC is a partnership between the Company and a third-party investor. Mililani BL Borrower Holdco LLC consolidates, as the direct owner of the primary beneficiary, a tax equity fund, Mililani TE Holdco LLC, which directly holds the Mililani I solar project. Mililani I has a 20-year PPA with an investment-grade utility that commenced in July 2022.
In connection with the Mililani I Drop Down, the Company assumed non-recourse project-level debt, which included a construction loan, sponsor equity bridge loan and tax equity bridge loan. The $27 million sponsor equity bridge loan was repaid at acquisition date, along with $2 million in associated fees, utilizing $14 million from the cash equity investor, as well as $15 million of the Company's purchase price, which was contributed back to the Company by CEG. On December 7, 2022,30, 2023, when the project reached substantial completion, the tax equity investor contributed an additional $42$41 million and CEG contributed an additional $11$8 million, which was utilized, along with the $18$17 million in escrow, to repay the $60$55 million tax equity bridge loan, to fund $7$10 million in construction completion reserves and to pay $4$1 million in associated fees.
Cedro Hill Repowering
On December 12, 2023, the Company entered into a financing agreement for non-recourse debt for a total commitment of $254 million, which consists of construction loans, a tax equity bridge loan and a sponsor equity bridge loan, related to the repowering of the Cedro Hill wind project. The Company also paid an additional $3Company’s initial borrowing of $165 million was utilized to repay the $72 million of outstanding principal under the original financing agreement, to pay $55 million to Clearway Renew LLC for construction management fees.
Black Rock Drop Down
On December 29, 2021, the Company, through its indirect subsidiary, Lighthouse Renewable Holding Sub LLC, acquiredfuture delivery of equipment, to pay $27 million to a third party for the Class B membership interests in Black Rock Wind Holding LLC from Clearway Renew LLC. During the year ended December 31, 2022, the Company paid an additional $23future delivery of equipment, to pay a $4 million development services fee to Clearway Renew, LLC as final cash consideration.
Mesquite Sky Drop Down
On December 17, 2021, the Company, through its indirect subsidiary Lighthouse Renewable Holdco 2 LLC, acquired the Class B membership intereststo pay for $4 million in Mesquite Sky Holding LLC from Clearway Renew LLC. During the year ended December 31, 2022, the Company paid an additional $7debt issuance costs that were deferred and to pay for $3 million to Clearway Renew LLC as final cash consideration.
Pinnacle Repowering Partnership
On February 26, 2021, the Company entered into an amended agreement with CWSP Pinnacle Holding LLC, an indirect subsidiary of CEG, with respect to Pinnacle Repowering Partnership LLC in order to facilitate the repowering of the Pinnacle wind project, a wind facility located in Mineral County, West Virginia. On March 10, 2021, the Company contributed its interest in the Pinnacle wind project to Pinnacle Repowering Partnership LLC concurrent with entering into a financing agreement. The Company owns 100% of the Class A membership interests in Pinnacle Repowering Partnership LLC, which is a VIE, and the Company consolidates its interest as the primary beneficiary and managing member. CWSP Pinnacle Holding LLC owns 100% of the Class B membership interests in Pinnacle Repowering Partnership LLC. On April 15, 2022, the Company acquired the Class B membership interests of Pinnacle Repowering Partnership LLC from CWSP Pinnacle Holding LLC for cash consideration of $10 million and the Company now owns and consolidates 100% of the membership interests in Pinnacle Repowering Partnership LLC.capital expenditures.
Additionally during the year ended December 31, 2022, the Company paid $172,000 in project distributions.
Kawailoa Solar Partnership
On August 1, 2022, the Company sold 100% of its Class A membership interests in Kawailoa Solar Partnership LLC, or the Kawailoa Partnership LLC, to Clearway Renew LLC for cash proceeds of $9 million. There were no project contributions from or distributions to Clearway Renew LLC during the year ended December 31, 2022.
Oahu Solar Partnership
On August 1, 2022, the Company acquired the Class B membership interests of Zephyr Oahu Partnership LLC, or the Oahu Solar Partnership, from Clearway Renew LLC for cash consideration of $1 million and the Company now owns and consolidates 100% of the membership interests in the Oahu Solar Partnership. During the year ended December 31, 2022, Clearway Renew LLC contributed $1 million into the Oahu Partnership.
Operations and Maintenance Agreements
CEG provides operations and maintenance (“O&M”) and day‑to‑day operational support to the Company’s utility scale solar and wind facilities in accordance with O&M agreements with the Company. Each of the counterparties to the O&M agreements is an affiliate of CEG. The O&M agreements for which the amount paid to CEG exceeded $120,000 during the year ended December 31, 20222023 are described in the table below. Under these O&M agreements, the Company generally pays an annual or monthly fee, which may be subject to annual adjustment, plus any reimbursable expenses.
| | | | | | | | | | | | | | |
| Project | | Agreement Description | | Approximate Amount Paid to CEG |
| Solar | | | | |
| Agua Caliente | | O&M Agreement, dated December 22, 2017 | | $4,439,0004,412,000 | |
| Borrego | | O&M Agreement, dated August 1, 2012 | | $473,000544,000 | |
| Buckthorn Solar | | O&M Agreement, dated May 22, 2017 | | $2,350,0002,119,000 | |
| Chestnut Fund LLC | | O&M Agreement, dated FebFebruary 9, 2018 | | $997,0001,425,000 | |
| Clearway & EFS Distributed Solar LLC | | O&M Agreement, dated October 28, 2016 | | $201,000222,000 | |
| CS4 Fund LLC | | O&M Agreement, dated November 29, 2018 | | $972,000659,000 | |
| CVSR | | O&M Agreement, dated September 30, 2011 | | $3,442,0004,288,000 | |
| Daggett 3 | | O&M Agreement, dated October 28, 2021 | | $1,168,000 | |
| DG CS Holdco LLC | | O&M Agreement, dated November 2, 2020 | | $360,000318,000 | |
| DGPV Fund 1 LLC | | O&M Agreement, dated June 12, 2015 | | $241,000247,000 | |
| DGPV Fund 2 LLC | | O&M Agreement, dated September 4, 2015 | | $1,038,000951,000 | |
| DGPV Fund 4 LLC | | O&M Agreement, dated June 16, 2017 | | $1,031,0001,313,000 | |
Golden Fields Solar III LLC | | O&M Agreement, dated February 25, 2020 | | $1,643,000 | |
| Golden Puma Fund LLC | | O&M Agreement, dated March 30, 2017 | | $694,000745,000 | |
| Kansas South | | O&M Agreement, dated June 13, 2017 | | $635,000907,000 | |
Kawailoa | | O&M Agreement, dated December 14, 2017 | | $1,565,000 | |
| Lanikuhana Solar LLC | | O&M Agreement, dated December 28, 2017 | | $656,000755,000 | |
| Mililani I | | O&M Agreement, dated May 28, 2021 | | $255,000856,000 | |
| Rosamond Central | | O&M Agreement, dated June 30, 2023 | | $1,941,000 | |
| Solar Blythe | | O&M Agreement, dated November 1, 2017 | | $267,000809,000 | |
Solar Blythe II | | O&M Agreement, dated March 1, 2017 | | $670,000 | |
Solar Community 1 LLC | | O&M Agreement, dated February 9, 2018 | | $135,000 | |
SPP Fund IIProjects | | O&M Agreement, dated October 31, 2017 | | $206,000913,000 | |
SPP Fund III | | O&M Agreement, dated October 31, 2017 | | $217,000 | |
| TA High Desert | | O&M Agreement, dated June 9, 2017 | | $645,000685,000 | |
| Utah Solar Portfolio | | O&M Agreement, dated June 13, 2022 | | $1,298,0003,029,000 | |
Utah Solar Holdings II LLCWaiawa | | O&M Agreement, dated December 1,May 28, 2021 | | $178,000773,000 | |
| Waipio PV LLC | | O&M Agreement, dated December 28, 2017 | | $1,282,0001,098,000 | |
| Wind | | | | |
| Alta Wind I | | O&M Agreement, dated December 12, 2016 | | $1,584,0001,871,000 | |
| Alta Wind II | | O&M Agreement, dated December 12, 2016 | | $869,000530,000 | |
| Alta Wind III | | O&M Agreement, dated December 12, 2016 | | $754,000654,000 | |
| Alta Wind IV | | O&M Agreement, dated December 12, 2016 | | $558,000484,000 | |
| Alta Wind V | | O&M Agreement, dated December 12, 2016 | | $854,000702,000 | |
| Alta Wind X | | O&M Agreement, dated December 12, 2016 | | $2,627,0002,252,000 | |
| Alta Wind XI | | O&M Agreement, dated December 12, 2016 | | $1,690,0001,544,000 | |
| Black Rock | | O&M Agreement, dated December 30, 2020 | | $914,000828,000 | |
| Broken Bow | | O&M Agreement, dated Nov 6, 2017 | | $584,0001,675,000 | |
| Buffalo Bear | | O&M Agreement, dated May 1, 2016 | | $286,000320,000 | |
| Cedro Hill | | O&M Agreement, dated Nov 11, 2015 | | $1,450,0003,468,000 | |
CrosswindsCrofton Bluffs | | O&M Agreement, dated February 13, 2012 | | $360,000 | |
| Elbow Creek | | O&M Agreement, dated October 31, 2018 | | $1,499,000 | |
| Forward | | O&M Agreement, dated October 20, 2016 | | $878,000 | |
| Goat Wind | | O&M Agreement, dated February 18, 2008 | | $3,207,000 | |
| Langford | | O&M Agreement, dated July 30, 2018 | | $2,818,000 | |
| Laredo Ridge | | O&M Agreement, dated December 24, 2015 | | $1,613,000 | |
| Lookout | | O&M Agreement, dated February 11, 2008 | | $1,269,000 | |
| Mesquite Sky | | O&M Agreement, dated December 30, 2020 | | $1,133,000 | |
| Mesquite Star | | O&M Agreement, dated May 7, 2019 | | $1,286,000 | |
| Mt. Storm | | O&M Agreement, dated April 23, 2021 | | $1,038,000 | |
| Mountain Wind 1 | | O&M Agreement, dated September 17, 2016 | | $1,343,000 | |
| Mountain Wind 2 | | O&M Agreement, dated September 17, 2016 | | $1,922,000 | |
| Ocotillo | | O&M Agreement, dated November 3, 2020 | | $2,293,000 | |
| Odin | | O&M Agreement, dated September 16, 2016 | | $688,000 | |
| Pinnacle | | O&M Agreement, dated December 1, 2016 | | $1,278,000 | |
| Rattlesnake | | O&M Agreement, dated February 5, 2020 | | $1,608,000 | |
| Sleeping Bear | | O&M Agreement, dated May 1, 2016 | | $702,0002,454,000 | |
Elbow CreekSouth Trent | | O&M Agreement, dated October 31, 20181, 2015 | | $1,491,0002,023,000 | |
ForwardSpanish Fork | | O&M Agreement, dated October 20,September 16, 2016 | | $482,000560,000 | |
Goat WindTaloga | | O&M Agreement, dated February 18, 2008 | | $2,682,000 | |
Hardin | | O&M Agreement, dated May 1, 2016 | | $452,000 | |
Langford | | O&M Agreement, dated July 30, 20181, 2016 | | $2,734,0002,682,000 | |
Laredo RidgeWildorado | | O&M Agreement, dated December 24, 2015 | | $1,575,000 | |
Lookout | | O&M Agreement, dated February 11, 2008 | | $1,057,0002,298,000 | |
Mesquite Sky | | O&M Agreement, dated December 30, 2020 | | $1,602,000 | |
Mesquite Star | | O&M Agreement, dated May 7, 2019 | | $1,874,000 | |
Mt. Storm | | O&M Agreement, dated April 23, 2021 | | $783,000 | |
Mountain Wind Power I & II | | O&M Agreement, dated September 17, 2016 | | $1,016,000 | |
Ocotillo | | O&M Agreement, dated November 3, 2020 | | $732,000 | |
Odin | | O&M Agreement, dated September 16, 2016 | | $474,000 | |
Pinnacle | | O&M Agreement, dated December 1, 2016 | | $1,335,000 | |
Rattlesnake | | O&M Agreement, dated February 5, 2020 | | $1,459,000 | |
Sleeping Bear | | O&M Agreement, dated May 1, 2016 | | $1,872,000 | |
Spanish Fork | | O&M Agreement, dated September 16, 2016 | | $364,000 | |
South Trent | | Management O&M Agreement, dated October 1, 2015 | | $1,732,000 | |
Taloga | | O&M Agreement, dated July 1, 2016 | | $2,679,000 | |
Wildorado | | O&M Agreement, dated February 11, 2008 | | $2,172,000 | |
Asset Management and Administrative Services Agreements
CEG provides day-to-day administrative support to certain of the Company’s project-level entities in accordance with asset management and administrative services agreements (the “ASAs”). The ASAs for which the amount involved exceeded $120,000 during the year ended December 31, 20222023 are described in the table below. Under these agreements, the Company generally pays an annual or monthly fee, which may be subject to annual adjustment, plus any reimbursable expenses.
| | | | | | | | | | | | | | |
| Project | | Agreement Description | | Approximate Amount Paid to CEG |
| Solar | | | | |
| Agua Caliente | | Asset Management Agreement, dated January 18, 2012 | | $577,000521,000 | |
| Alpine | | Asset Management Agreement, dated March 15, 2012 | | $153,000157,000 | |
| Buckthorn Solar | | Asset Management Agreement, dated May 22, 2017 | | $171,000175,000 | |
| Chestnut Fund LLC | | Asset Management Agreement, dated July 31, 2017 | | $209,000217,000 | |
| CS4 Fund LLC | | Asset Management Agreement, dated November 29, 2018 | | $168,000173,000 | |
| CVSR | | Asset Management Agreement, dated April 26, 2016 | | $227,000232,000 | |
| DG CS Holdco LLC | | Asset Management Agreement, dated November 2, 2020 | | $2,067,0001,821,000 | |
DGPV Fund 2 LLCDaggett 3 | | Asset ManagementProject Administration Agreement dated April 28,2017October 28, 2021 | | $294,000 | |
| Mililani I | | Project Administration Agreement, dated May 28, 2021 | | $156,000 | |
Kawailoa | | Asset Management Agreement, dated December 14, 2017 | | $177,000 | |
| Oahu Solar | | Asset ManagementProject Administration Agreement, dated December 28, 2017 | | $213,000217,000 | |
| Rosamond Central | | Project Administration Agreement, dated February 25, 2020June 30, 2023 | | $156,000256,000 | |
SPP P-IV Master LesseeProjects | | Asset Management Agreement, dated July 12, 2012October 31, 2017 | | $191,000442,000 | |
Utah Solar Holdings LLCPortfolio | | Asset Management Agreement, dated December 1, 2021 | | $429,000909,000 | |
Utah Solar Holdings II LLCWaiawa | | Asset ManagementProject Administration Agreement, dated December 1,May 28, 2021 | | $429,000132,000 | |
| | | | |
| | | | |
| Wind | | | | |
| Black Rock | | Project Administration Agreement, dated December 30, 2020 | | $275,000260,000 | |
| Broken Bow | | Amended and Restated Services Agreement, dated February 13, 2012 | | $251,000 | |
| Buffalo Bear | | Amended and Restated Services Agreement, dated September 15, 2011 | | $175,000 | |
| Cedro Hill | | Management and Administration Agreement, dated March 10, 2010 | | $188,000 | |
| Crofton Bluffs | | Amended and Restated Services Agreement, dated February 13, 2012 | | $251,000 | |
| Elbow Creek | | Project Administration Agreement, dated January 1, 2018 | | $238,000264,000 | |
| Forward | | Services Agreement, dated January 1, 2012 | | $219,000223,000 | |
| Langford | | Project Administration Agreement, dated April 24, 2020 | | $157,000160,000 | |
| Laredo Ridge | | Support Services Agreement, dated May 27, 2010 | | $176,000180,000 | |
| Lighthouse Renewable Holdco LLC | | Management Services Agreement, dated December 17, 2021 | | $217,000 | |
| Lookout | | Services Agreement, dated January 1, 2012 | | $219,000223,000 | |
| Mesquite Sky | | Project Administration Agreement, dated December 30, 2020 | | $350,000331,000 | |
| Mesquite Star | | Services Agreement, dated May 7, 2019 | | $267,000296,000 | |
| Mountain Wind 1 | | Amended and Restated Services Agreement, dated February 13, 2012 | | $231,000 | |
| Mountain Wind 2 | | Amended and Restated Services Agreement, dated February 13, 2012 | | $251,000 | |
| Mt. Storm | | Project Administration Agreement, dated April 23th,23, 2021 | | $255,000217,000 | |
| Pinnacle | | Amended and Restated Services Agreement, dated September 15, 2011 | | $226,000231,000 | |
| Rattlesnake | | Project Administration Agreement, dated February 5, 2020 | | $125,000128,000 | |
| Sleeping Bear | | Services Agreement, dated January 1, 2012 | | $219,000223,000 | |
| South Trent | | Project Administration Agreement, dated October 1, 2015 | | $243,000174,000 | |
| Spanish Fork | | Services Agreement, dated January 1, 2012 | | $219,000223,000 | |
| Taloga | | Services Agreement, dated November 20, 2012 | | $174,000190,000 | |
| Viento Funding II, LLC | | Management and Administration Agreement, dated July 1, 2013 | | $269,000 | |
| Wildorado | | Project Administration Agreement, dated September 25, 2017 | | $243,000270,000 | |
Land Lease Agreements
The Company is party to various land lease agreements with CEG. The land lease agreements for which the amount involved exceeded $120,000 during the year ended December 31, 20222023 are described in the table below. Under these agreements, the Company generally pays a quarterly or monthly fee, which may be subject to annual adjustment.
| | | | | | | | | | | | | | |
| Project | | Agreement Description | | Approximate Amount Paid to CEG |
| Solar | | | | |
| Daggett 2 | | Land Lease Agreement, dated October 27, 2021 | | $493,000 | |
| Daggett 3 | | Land Lease Agreement, dated December 18, 2020 | | $1,609,000 | |
| Mililani I | | Land Lease Agreement, dated November 19,18, 2020 | | $780,000796,000 | |
| Oahu Solar | | Land Lease Agreement, dated September 19, 2019 | | $895,000908,000 | |
| Rosamond Central | | Land Lease Agreement, dated November 18, 2020 | | $552,000566,000 | |
Insurance ReimbursementsDevelopment Collaboration Agreement
On February 9, 2024, the Company entered into a Development Collaboration Agreement with Clearway Renew (the “Collaboration Agreement”), pursuant to which, among other things, the Company procures substitute RA capacity from Clearway Renew to meet the Company’s contractual obligations to deliver RA capacity to various load-serving entities and to meet certain tariff requirements to provide RA capacity to cover planned outages. Under the Collaboration Agreement, certain subsidiaries of the Company that own and operate the Company’s natural gas-fired generating assets purchase substitute RA capacity from certain subsidiaries of Clearway Renew that operate its BESS development projects (the “BESS Project Companies”), in each case pursuant to separate, five-year purchase agreements (the “RA Agreements”). In addition, pursuant to the Collaboration Agreement, Clearway Renew has offered the Company a right of first offer to acquire an ownership interest in the BESS Project Companies or certain of Clearway Renew’s BESS facilities. Under the Collaboration Agreement and the RA Agreement, the Clearway Renew BESS Project Companies will post approximately $287,000 of security to the Company in 2024 to guarantee the financial obligations of the BESS Project Companies. The value of such security may increase in the future if certain milestones are met.
Other
During 2022,2023, the Company paid approximately $1,210,000$3,683,000 to CEG, consisting primarily of reimbursements of insurance premiums and employee-related benefits that CEG paid on behalf of the Company. The Company also received $3,466,000 from CEG, consisting primarily of employee-related expenses that the Company paid on behalf of CEG.
During 2023, the Company also paid approximately $6,470,000 in annual property insurance premiums to TotalEnergies’ captive insurance affiliate. The Company also paid approximately $449,000 to GIM as reimbursement for insurance premium reimbursements to CEG.professional fees that GIM incurred on behalf of the Company.
Fourth Amended and Restated Limited Liability Company Agreement of Clearway Energy LLC
The following is a description of the material terms of Clearway Energy LLC’s Fourth Amended and Restated Limited Liability Company Agreement (the “LLC Agreement”). For the year ended December 31, 2022,2023, Clearway Energy LLC made approximately $166,708,000$180,354,000 in distributions to Clearway, Inc. (the holder of Class A and Class C units) and $121,590,000$131,169,000 to CEG (the holder of Class B and Class D units). In addition to the quarterly distributions, the Company distributed an additional $11,100,000$29,403,000 to Clearway, Inc. and $8,111,000$21,413,000 to CEG during the third quarter of 2022year ended December 31, 2023 in order for Clearway, Inc. to make certain additional tax payments associated with the sale of the Thermal Business.
Governance
Clearway, Inc. serves as the sole managing member of the Company. As such, Clearway, Inc. and effectively Clearway, Inc.’s Board, control the business and affairs of the Company and are responsible for the management of the business.
Voting and Economic Rights of Members
The Company has four classes of Units: Class A units, Class B units, Class C units and Class D units. Class A units and Class C units may be issued only to Clearway, Inc. as the sole managing member, and Class B units and Class D units may be issued only to CEG and held by CEG or its permitted transferees. Units of each of the four classes have equivalent economic and other rights, except that upon issuance, each holder of a Class B unit will also be issued a share of Clearway, Inc.’s Class B common stock, and each holder of a Class D unit will also be issued a share of Clearway, Inc.’s Class D common stock. Each Class B unit is exchangeable for a share of Clearway, Inc.’s Class A common stock and each Class D unit is exchangeable for a share of Clearway, Inc.’s Class D common stock, in each case subject to equitable adjustments for stock splits, dividends and reclassifications in accordance with the terms of the Exchange Agreement (as described below).
Net profits and net losses and distributions by the Company are allocated and made to holders of units in accordance with the respective number of membership units of the Company held. Generally, the Company will make distributions to holders of units for the purpose of funding tax obligations in respect of income of the Company that is allocated to the members of the Company.
Clearway, Inc.’s Coordination with Clearway Energy LLC
Any time Clearway, Inc. issues a share of Class A common stock or a share of Class C common stock for cash, the net proceeds therefrom will promptly be transferred to the Company, and the Company will either:
• transfer a newly issued Class A unit of the Company to Clearway, Inc. in the case of the issuance of a share of Class A common stock, or a newly issued Class C unit of the Company to Clearway, Inc. in the case of the issuance of a share of Class C common stock; or
• use the net proceeds to purchase a Class B unit of the Company from CEG in the case of the issuance of a share of Class A common stock, which Class B unit will automatically convert into a Class A unit of the Company when transferred to Clearway, Inc., or a Class D unit of the Company from CEG in the case of the issuance of a share of Class C common stock, which Class D unit will automatically convert into a Class C unit of the Company when transferred to Clearway, Inc.
If Clearway, Inc. elects to redeem any shares of their Class A common stock or Class C common stock for cash, the Company will, immediately prior to such redemption, redeem an equal number of Class A units or Class C units, as applicable, held by Clearway, Inc. upon the same terms and for the same price, as the shares of Class A common stock so redeemed.
Exchange Agreement
Clearway, Inc. entered intois party to an Amended and Restated Exchange Agreement with NRGCEG (the “Exchange Agreement”), which was assigned to CEG upon the GIP Transaction.. Under the Exchange Agreement, CEG (and certain permitted assignees and permitted transferees who acquire Class B units or Class D units of the Company) may from time to time cause us to exchange their Class B units for shares of Clearway, Inc.’s Class A common stock on a one‑for‑one basis, subject to adjustments for stock splits, stock dividends and reclassifications, or exchange their Class D units for shares of Clearway, Inc.’s Class C common stock on a one‑for‑one basis, subject to equitable adjustments for stock splits, stock dividends and reclassifications.
When CEG or its permitted transferee exchanges a Class B unit of the Company for a share of Clearway, Inc.’s Class A common stock, Clearway, Inc. will automatically redeem and cancel a corresponding share of their Class B common stock and the Class B unit will automatically convert into a Class A unit when issued to Clearway, Inc.; similarly, when CEG or its permitted transferee exchanges a Class D unit of the Company for a share of Clearway, Inc.’s Class C common stock, Clearway, Inc. will automatically redeem and cancel a corresponding share of their Class D common stock and the Class D unit will automatically convert into a Class C unit when issued to Clearway, Inc. As a result, when a holder exchanges its Class B units for shares of Clearway, Inc.’s Class A common stock, or its Class D units for shares of Clearway, Inc.’s Class C common stock, Clearway, Inc.’s interest in the Company will be correspondingly increased.
Indemnification of Officers
Clearway, Inc. has entered into indemnification agreements with each of its executive officers. The indemnification agreements provide the executive officers with contractual rights to indemnification, expense advancement and reimbursement to the fullest extent permitted under Delaware law.
Registration Rights Agreement
Clearway, Inc. entered intois party to an Amended and Restated Registration Rights Agreement with NRGCEG (the “Registration Rights Agreement”), which was assigned to CEG upon the GIP Transaction.. Under the Registration Rights Agreement, CEG and its affiliates are entitled to demand registration rights, including the right to demand that a shelf registration statement be filed, and “piggyback” registration rights, for shares of Clearway, Inc.’s Class A common stock that are issuable upon exchange of Class B units of the Company that CEG owns and shares of Clearway, Inc.’s Class C common stock that are issuable upon exchange of the Class D units of the Company that CEG owns.
Procedures for Review, Approval and Ratification of Related Person Transactions; Conflicts of Interest
The Company does not have a separate policy regarding related party transactions, as all of its officers are subject to the written Related Person Policy of Clearway, Inc., which provides that the Corporate Governance, Conflicts and Nominating Committee of Clearway, Inc.’s Board of Directors will periodically review all related person transactions that are required to be disclosed under SEC rules and, when appropriate, initially authorize or ratify all such transactions.
The Related Person Policy operates in conjunction with Clearway, Inc.’s Code of Conduct and is applicable to all “Related Person Transactions”, which are all transactions, arrangements or relationships in which:
•the aggregate amount involved will or may be expected to exceed $50,000 in any calendar year;
•Clearway, Inc. is a participant; and
•any Related Person (as that term is defined below) has or will have a direct or indirect interest.
A “Related Person” is:
•any person who is, or at any time during the applicable period was, a director of the Company or a nominee for director or an executive officer;
•any person who is known to Clearway, Inc. to be the beneficial owner of more than 5% of any class of Clearway, Inc.’s voting stock;
•any immediate family member of any of the persons referenced in the preceding two bullets, which means any child, stepchild, parent, stepparent, spouse, sibling, mother‑in‑law, father‑in‑law, son‑in‑law, daughter‑in‑law, brother‑in‑law or sister‑in‑law of the director, nominee for director, executive officer or more than 5% beneficial owner of any class of Clearway, Inc.’s voting stock, and any person (other than a tenant or employee) sharing the household of such director, nominee for director, executive officer or more than 5% beneficial owner of any class of the Company’s voting stock; and
•any firm, corporation or other entity in which any of the foregoing persons is a partner or principal or in a similar position or in which such person has a 10% or greater beneficial ownership interest.
In determining whether to recommend the initial approval or ratification of a Related Person Transaction, the Corporate Governance, Conflicts and Nominating Committee considers all of the relevant facts and circumstances available, including (if applicable) but not limited to: (a) whether there is an appropriate business justification for the transaction; (b) the benefits that accrue to us as a result of the transaction; (c) the terms available to unrelated third parties entering into similar transactions; (d) the impact of the transaction on director independence (in the event the related person is a director, an immediate family member of a director or an entity in which a director or an immediate family member of a director is a partner, stockholder, member or executive officer); (e) the availability of other sources for comparable products or services; (f) whether it is a single transaction or a series of ongoing, related transactions; and (g) whether entering into the transaction would be consistent with the Related Person Transaction Policy.
If the aggregate amount involved is expected to be less than $500,000, the transaction may be approved or ratified by the Chair of the Corporate Governance, Conflicts and Nominating Committee.
As part of its review of each Related Person Transaction, the Corporate Governance, Conflicts and Nominating Committee will take into account, among other factors it deems appropriate, whether the transaction is on terms no less favorable than the terms generally available to an unaffiliated third‑third party under the same or similar circumstances and the extent of the Related Person’s interest in the transaction. This Related Person Policy also provides that certain transactions, based on their nature and/or monetary amount, are deemed to be pre‑approved or ratified by the Corporate Governance, Conflicts and Nominating Committee and do not require separate approval or ratification.
Transactions involving ongoing relationships with a Related Person will be reviewed and assessed at least annually by the Corporate Governance, Conflicts and Nominating Committee to ensure that such Related Person Transactions remain appropriate and in compliance with the Committee’s guidelines.
The Committee’s activities with respect to the review and approval or ratification of all Related Person Transactions are reported periodically to Clearway, Inc.’s Board of Directors. Any transaction between us and any Related Person, including CEG, will be subject to the prior review and approval of the Company’s Corporate Governance, Conflicts and Nominating Committee.
Item 14 — Principal Accounting Fees and Services
Audit and Nonaudit Fees
The following table presents fees for professional services rendered by Ernst & Young LLP, the Company’s principal independent registered public accounting firm, for the years ended December 31, 2022 and December 31, 2021:firm:
| | Year Ended December 31, |
| 2022 | | 2021 |
| Year Ended December 31, | | | Year Ended December 31, |
| 2023 | | | 2023 | | 2022 |
| Audit Fees | Audit Fees | $ | 4,484,400 | | | $ | 4,424,556 | |
| | Tax Fees | Tax Fees | 1,560,400 | | | 1,605,408 | |
| Tax Fees | |
| Tax Fees | |
| All Other Fees | All Other Fees | 6,560 | | | 6,560 | |
| Total | Total | $ | 6,051,360 | | | $ | 6,036,524 | |
Audit Fees
For 20222023 and 2021,2022, Ernst & Young LLP billed the Company approximately $4,484,400$4,665,386 and $4,424,556,$4,484,400, respectively, for the integrated audit of the Company’s annual consolidated financial statements, internal control over financial reporting, and the review of the Company’s quarterly consolidated financial statements on Form 10-Q that are customary under the standards of the Public Company Accounting Oversight Board (United States).
Audit-Related Fees
For 20222023 and 2021,2022, there were no audit-related fees billed to the Company by Ernst & Young LLP.
Tax Fees
For 20222023 and 2021,2022, Ernst & Young LLP billed the Company approximately $1,560,400$1,565,229 and $1,605,408,$1,560,400, respectively, relating mainly to compliance work.
All Other Fees
For each of2023 and 2022, and 2021, Ernst & Young LLP billed the Company approximately $10,000 and $6,560, respectively, in other fees relating to online subscription fees.
Policy on Audit Committee Pre-approval
The Audit Committee of Clearway, Energy, Inc. is responsible for appointing, setting compensation for, and overseeing the work of the independent registered public accounting firm of the Company. The Audit Committee of Clearway, Energy, Inc. has established a policy regarding pre-approval of all audit and permissible nonaudit services provided by the independent registered public accounting firm of the Company.
The Audit Committee of Clearway, Energy, Inc. will annually review and pre-approve services that are expected to be provided by the independent registered public accounting firm. The term of the pre-approval will be 12 months from the date of the pre-approval, unless the Audit Committee of Clearway, Energy, Inc. approves a shorter time period. The Audit Committee may periodically amend and/or supplement the pre-approved services based on subsequent determinations.
Unless the Audit Committee of Clearway, Energy, Inc. has pre-approved Audit Services or a specified category of nonaudit services, any engagement to provide such services must be pre-approved by the Audit Committee of Clearway, Energy, Inc. if it is to be provided by the independent registered public accounting firm. The Audit Committee of Clearway, Energy, Inc. must also pre-approve any proposed services exceeding the pre-approved budgeted fee levels for a specified type of service.
The Audit Committee of Clearway, Energy, Inc. has authorized its Chair to pre-approve services in amounts up to $100,000 per engagement. Engagements exceeding $100,000 must be approved by the full Audit Committee of Clearway, Energy, Inc. Engagements pre-approved by the Chair are reported to the Audit Committee of Clearway, Energy, Inc. at its next scheduled meeting. The Audit Committee of Clearway, Energy, Inc. approved all of the audit-related fees, tax fees and all other fees disclosed above.
PART IV
Item 15 — Exhibits, Financial Statement Schedules
(a)(1) Financial Statements
The following consolidated financial statements of Clearway Energy LLC and related notes thereto, together with the Report of Independent Registered Public Accounting Firm of Ernst & Young LLP (PCAOB ID: 42) and Report of Independent Registered Public Accounting Firm of KPMG LLP (PCAOB ID: 185) thereon, are included herein:
Consolidated Statements of Income — Years ended December 31, 2023, 2022 2021 and 20202021
Consolidated Statements of Comprehensive Income — Years ended December 31, 2023, 2022 2021 and 20202021
Consolidated Balance Sheets — As of December 31, 20222023 and 20212022
Consolidated Statements of Cash Flows — Years ended December 31, 2023, 2022 2021 and 20202021
Consolidated Statements of Members’ Equity — Years ended December 31, 2023, 2022 2021 and 20202021
Notes to Consolidated Financial Statements
(a)(2) Financial Statement Schedules
The following schedules of Clearway Energy Inc.LLC are filed as part of Item 15 of this report and should be read in conjunction with the Consolidated Financial Statements:
Schedule I — Clearway Energy LLC (Parent) Condensed Financial Statements for the years ended December 31, 2023, 2022 2021 and 2020,2021, are included in Clearway Energy LLC’s Annual Report on Form 10-K pursuant to the requirements of Rule 5-04(c) of Regulation S-X
All other schedules for which provision is made in the applicable accounting regulation of the Securities and Exchange Commission are not required under the related instructions or are inapplicable, and therefore, have been omitted
(a)(3) Exhibits: See Exhibit Index submitted as a separate section of this report
(b) Exhibits
See Exhibit Index submitted as a separate section of this report
(c) Not applicable
Report of Independent Registered Public Accounting Firm
To the Members of Clearway Energy LLC:
Opinion on the Financial Statements
We have audited the accompanying consolidated balance sheets of Clearway Energy LLC (the Company) as of December 31, 20222023 and 2021,2022, the related consolidated statements of income, comprehensive income, members’ equity and cash flows for each of the twothree years in the period ended December 31, 2022,2023, and the related notes and financial statement scheduleschedules listed in the Index at Item 15(a)(2) (collectively referred to as the “consolidated financial statements”). In our opinion, the consolidated financial statements present fairly, in all material respects, the financial position of the Company at December 31, 20222023 and 20212022 and the results of its operations and its cash flows for each of the twothree years in the period ended December 31, 2022,2023, in conformity with U.S. generally accepted accounting principles.
Basis for Opinion
These financial statements are the responsibility of the Company'sCompany’s management. Our responsibility is to express an opinion on the Company’s financial statements based on our audits. We are a public accounting firm registered with the Public Company Accounting Oversight Board (United States) (PCAOB) and are required to be independent with respect to the Company in accordance with the U.S. federal securities laws and the applicable rules and regulations of the Securities and Exchange Commission and the PCAOB.
We conducted our audits in accordance with the standards of the PCAOB and in accordance with auditing standards generally accepted in the United States of America. Those standards require that we plan and perform the audit to obtain reasonable assurance about whether the financial statements are free of material misstatement, whether due to error or fraud. The Company is not required to have, nor were we engaged to perform, an audit of its internal control over financial reporting. As part of our audits, we are required to obtain an understanding of internal control over financial reporting but not for the purpose of expressing an opinion on the effectiveness of the Company's internal control over financial reporting. Accordingly, we express no such opinion.
Our audits included performing procedures to assess the risks of material misstatement of the financial statements, whether due to error or fraud, and performing procedures that respond to those risks. Such procedures included examining, on a test basis, evidence regarding the amounts and disclosures in the financial statements. Our audits also included evaluating the accounting principles used and significant estimates made by management, as well as evaluating the overall presentation of the financial statements. We believe that our audits provide a reasonable basis for our opinion.
Critical Audit Matters
The critical audit matters communicated below are matters arising from the current period audit of the financial statements that were communicated or required to be communicated to the audit committee and that: (1) relate to accounts or disclosures that are material to the financial statements and (2) involved our especially challenging, subjective or complex judgments. The communication of critical audit matters does not alter in any way our opinion on the consolidated financial statements, taken as a whole, and we are not, by communicating the critical audit matters below, providing separate opinions on the critical audit matters or on the accounts or disclosures to which they relate.
| | | | | |
| Allocation of earnings to noncontrolling interests in tax equity arrangements |
| |
| Description of the Matter | As described in Note 5 to the consolidated financial statements, during 2022,2023, tax equity investors purchased noncontrolling interests in MililaniDaggett TE Holdco LLC, Daggett 2 TE Holdco LLC, VP-Arica TE Holdco LLC and WaiawaTSN1 TE Holdco LLC (the “new tax equity arrangements”). Each tax equity investor received Class A membership interests in the respective entity. The Company utilizes the output of a hypothetical liquidation at book value (HLBV) model to determine the earnings allocated to the tax equity noncontrolling interest holders as the contractual agreements between the parties represent substantive profit-sharing arrangements.
Auditing the allocation of earnings using the HLBV method to the new tax equity arrangements was complex due to the judgments required at the inception of the arrangement to evaluate whether the HLBV model appropriately reflects the unique substantive profit-sharing terms and features within each arrangement. A greater extent of audit effort and specialized skill and knowledge was required with respect to evaluating the appropriateness of the tax capital account balances used in the HLBV model for compliance with the provisions of the Internal Revenue Code, as well as compliance with the contractual provisions in each agreement. |
| |
| | | | | |
| How We Addressed the Matter in Our Audit | We obtained an understanding, evaluated the design and tested the operating effectiveness of the control over the Company’s process for establishing the HLBV model for the new tax equity arrangements. For example, we tested a control over management’s review of the substantive profit-sharing terms and features within each arrangement and evaluated whether they are properly reflected in each HLBV model.
To test the allocation of earnings to noncontrolling interest holders in the new tax equity arrangements, we read the related agreements to understand the business purpose and the substantive profit-sharing provisions. We evaluated each HLBV model for consistency with the contractual provisions in the related agreements and tested the initial recognition of the noncontrolling interest balance by agreeing capital contributions to supporting documentation. We involved tax subject matter professionals to assist in evaluating the calculation of the tax capital accounts used in each HLBV model for compliance with the provisions of the Internal Revenue Code, as well as compliance with the contractual provisions in the agreements. Additionally, we tested the year end noncontrolling interest balances for the new tax equity arrangements by agreeing contributions and distributions to supporting documentation and recalculating the allocation of earnings usingreflected in each HLBV model. |
| |
| Fair value of Level 3 energy relatedlong-term power commodity contracts |
| |
| Description of the Matter | As described in Note 6 to the consolidated financial statements, as of December 31, 2022,2023, the aggregate fair value of energy relatedlong-term power commodity contracts classified as Level 3 derivative instruments was $353$325 million. The Company’s determination of the fair value of long-term power commodity contracts executed in illiquid markets are considered Level 3 fair value measurements as they contain significant unobservable inputs, including forward market energy pricing curves. The Company uses a discounted cash flow valuation technique to determine the fair value of its energy relatedlong-term power commodity contracts.
Auditing the fair value measurement of energy relatedlong-term power commodity contracts classified as Level 3 financial instruments was complex due to the judgmental nature of the forward market energy pricing curve assumptions used as an input into the valuation models. |
| |
| How We Addressed the Matter in Our Audit | We obtained an understanding, evaluated the design and tested the operating effectiveness of controls over the Company’s processes for reviewing the key assumptions in estimating Level 3 fair values.values related to long-term power commodity contracts. For example, we tested controls over management’s review of the specific forward market energy pricing curves used as an input into the valuation models.
To test the fair value of Level 3 energy relatedlong-term power commodity contracts, our audit procedures included, among others, evaluating the valuation methodologies used by the Company and testing significant inputs, estimates and the mathematical accuracy of the calculations. In certain instances, with the assistance of our valuation specialists, we independently determined the significant assumptions, calculated the resultant fair values and compared them to the Company’s estimates. We obtained forward market energy prices from independent sources, including pricing service providers and counterparty fair values, and evaluated the Company’s assumptions related to their forward curves and confirmed key inputs with counterparties. We also performed sensitivity analyses using independent sources of market data to evaluate the significance of the change in fair value of Level 3 energy relatedlong-term power commodity contracts that would result from changes in underlying assumptions. |
/s/ Ernst & Young LLP
We have served as the Company’s auditor since 2021.
Philadelphia, Pennsylvania
February 23, 2023
Report of Independent Registered Public Accounting Firm
To the Members
Clearway Energy LLC:
Opinion on the Consolidated Financial Statements
We have audited the accompanying consolidated statements of income, comprehensive income, members’ equity, and cash flows of Clearway Energy, LLC and subsidiaries (the Company) for the year ended December 31, 2020, and the related notes and financial statement schedule “Schedule I-Condensed Financial Information of Registrant” (collectively, the consolidated financial statements). In our opinion, the consolidated financial statements present fairly, in all material respects, the results of operations of the Company and its cash flows for the year ended December 31, 2020, in conformity with U.S. generally accepted accounting principles.
Basis for Opinion
These consolidated financial statements are the responsibility of the Company’s management. Our responsibility is to express an opinion on these consolidated financial statements based on our audit. We are a public accounting firm registered with the Public Company Accounting Oversight Board (United States) (PCAOB) and are required to be independent with respect to the Company in accordance with the U.S. federal securities laws and the applicable rules and regulations of the Securities and Exchange Commission and the PCAOB.
We conducted our audit in accordance with the standards of the PCAOB. Those standards require that we plan and perform the audit to obtain reasonable assurance about whether the consolidated financial statements are free of material misstatement, whether due to error or fraud. Our audit included performing procedures to assess the risks of material misstatement of the consolidated financial statements, whether due to error or fraud, and performing procedures that respond to those risks. Such procedures included examining, on a test basis, evidence regarding the amounts and disclosures in the consolidated financial statements. Our audit also included evaluating the accounting principles used and significant estimates made by management, as well as evaluating the overall presentation of the consolidated financial statements. We believe that our audit provides a reasonable basis for our opinion.
/s/ KPMG LLP
We served as the Company’s auditor from 2012 to 2021.
Philadelphia, Pennsylvania
March 1, 202122, 2024
CLEARWAY ENERGY LLC
CONSOLIDATED STATEMENTS OF INCOME | | | | | | | | | | | | | | | | | |
| Year ended December 31, |
| (In millions) | 2022 | | 2021 | | 2020 |
| Operating Revenues | | | | | |
| Total operating revenues | $ | 1,190 | | | $ | 1,286 | | | $ | 1,199 | |
| Operating Costs and Expenses | | | | | |
| Cost of operations, exclusive of depreciation, amortization and accretion shown separately below | 435 | | | 451 | | | 366 | |
| Depreciation, amortization and accretion | 512 | | | 509 | | | 428 | |
| Impairment losses | 16 | | | 6 | | | 24 | |
| General and administrative | 38 | | | 38 | | | 33 | |
| Transaction and integration costs | 7 | | | 7 | | | 9 | |
| Development costs | 2 | | | 6 | | | 5 | |
| Total operating costs and expenses | 1,010 | | | 1,017 | | | 865 | |
| Gain on sale of business | 1,292 | | | — | | | — | |
| Operating Income | 1,472 | | | 269 | | | 334 | |
| Other Income (Expense) | | | | | |
| Equity in earnings of unconsolidated affiliates | 29 | | | 32 | | | 7 | |
| Impairment loss on investment | — | | | — | | | (8) | |
| Gain on sale of unconsolidated affiliate | — | | | — | | | 49 | |
| Other income, net | 17 | | | 3 | | | 4 | |
| Loss on debt extinguishment | (2) | | | (53) | | | (24) | |
| Interest expense | (232) | | | (312) | | | (414) | |
| Total other expense, net | (188) | | | (330) | | | (386) | |
| Income (Loss) Before Income Taxes | 1,284 | | | (61) | | | (52) | |
| Income tax expense | 2 | | | 2 | | | — | |
| Net Income (Loss) | 1,282 | | | (63) | | | (52) | |
| Less: Net loss attributable to noncontrolling interests and redeemable interests | (106) | | | (173) | | | (113) | |
| Net Income Attributable to Clearway Energy LLC | $ | 1,388 | | | $ | 110 | | | $ | 61 | |
| | | | | | | | | | | | | | | | | |
| Year ended December 31, |
| (In millions) | 2023 | | 2022 | | 2021 |
| Operating Revenues | | | | | |
| Total operating revenues | $ | 1,314 | | | $ | 1,190 | | | $ | 1,286 | |
| Operating Costs and Expenses | | | | | |
| Cost of operations, exclusive of depreciation, amortization and accretion shown separately below | 473 | | | 435 | | | 451 | |
| Depreciation, amortization and accretion | 526 | | | 512 | | | 509 | |
| Impairment losses | 12 | | | 16 | | | 6 | |
| General and administrative | 35 | | | 38 | | | 38 | |
| Transaction and integration costs | 4 | | | 7 | | | 7 | |
| Development costs | — | | | 2 | | | 6 | |
| Total operating costs and expenses | 1,050 | | | 1,010 | | | 1,017 | |
| Gain on sale of business | — | | | 1,292 | | | — | |
| Operating Income | 264 | | | 1,472 | | | 269 | |
| Other Income (Expense) | | | | | |
| Equity in earnings of unconsolidated affiliates | 12 | | | 29 | | | 32 | |
| | | | | |
| | | | | |
| Other income, net | 52 | | | 17 | | | 3 | |
| Loss on debt extinguishment | (6) | | | (2) | | | (53) | |
| Interest expense | (337) | | | (232) | | | (312) | |
| Total other expense, net | (279) | | | (188) | | | (330) | |
| (Loss) Income Before Income Taxes | (15) | | | 1,284 | | | (61) | |
| Income tax (benefit) expense | (2) | | | 2 | | | 2 | |
| Net Income (Loss) | (13) | | | 1,282 | | | (63) | |
| Less: Net loss attributable to noncontrolling interests and redeemable noncontrolling interests | (162) | | | (106) | | | (173) | |
| Net Income Attributable to Clearway Energy LLC | $ | 149 | | | $ | 1,388 | | | $ | 110 | |
See accompanying notes to consolidated financial statements.
CLEARWAY ENERGY LLC
CONSOLIDATED STATEMENTS OF COMPREHENSIVE INCOME
| | | | | | | | | | | | | | | | | |
| Year ended December 31, |
| 2022 | | 2021 | | 2020 |
| (In millions) | | | | | |
| Net Income (Loss) | $ | 1,282 | | | $ | (63) | | | $ | (52) | |
| Other Comprehensive Income | | | | | |
| Unrealized gain on derivatives and changes in accumulated OCI/OCL | 33 | | 22 | | 2 |
| Other comprehensive income | 33 | | | 22 | | | 2 | |
| Comprehensive Income (Loss) | 1,315 | | | (41) | | | (50) | |
| Less: Comprehensive loss attributable to noncontrolling interests and redeemable interests | (100) | | | (171) | | | (115) | |
| Comprehensive Income Attributable to Clearway Energy LLC | $ | 1,415 | | | $ | 130 | | | 65 | |
| | | | | | | | | | | | | | | | | |
| Year ended December 31, |
| 2023 | | 2022 | | 2021 |
| (In millions) | | | | | |
| Net Income (Loss) | $ | (13) | | | $ | 1,282 | | | $ | (63) | |
| Other Comprehensive (Loss) Income | | | | | |
| Unrealized (loss) gain on derivatives and changes in accumulated OCI/OCL | (7) | | | 33 | | | 22 | |
| Other comprehensive (loss) income | (7) | | | 33 | | | 22 | |
| Comprehensive (Loss) Income | (20) | | | 1,315 | | | (41) | |
| Less: Comprehensive loss attributable to noncontrolling interests and redeemable noncontrolling interests | (163) | | | (100) | | | (171) | |
| Comprehensive Income Attributable to Clearway Energy LLC | $ | 143 | | | $ | 1,415 | | | $ | 130 | |
See accompanying notes to consolidated financial statements.
CLEARWAY ENERGY LLC
CONSOLIDATED BALANCE SHEETS | | December 31, 2022 | | December 31, 2021 |
| (In millions) | | (In millions) | December 31, 2023 | | December 31, 2022 |
| ASSETS | ASSETS | (In millions) |
| Current Assets | Current Assets | |
| Current Assets | |
| Current Assets | |
| Current Assets | |
| Current Assets | |
| Current Assets | |
| Current Assets | |
| Current Assets | |
| Current Assets | |
| Cash and cash equivalents | |
| Cash and cash equivalents | |
| Cash and cash equivalents | Cash and cash equivalents | $ | 657 | | | $ | 179 | |
| Restricted cash | Restricted cash | 339 | | | 475 | |
| Accounts receivable — trade | Accounts receivable — trade | 153 | | | 144 | |
| | Inventory | Inventory | 47 | | | 37 | |
| Current assets held-for-sale | — | | | 631 | |
| Inventory | |
| Inventory | |
| | Derivative instruments | Derivative instruments | 26 | | | — | |
| Derivative instruments | |
| Derivative instruments | |
| Note receivable — affiliate | |
| | Prepayments and other current assets | |
| Prepayments and other current assets | |
| Prepayments and other current assets | Prepayments and other current assets | 54 | | | 65 | |
| Total current assets | Total current assets | 1,276 | | | 1,531 | |
| | Property, plant and equipment, net | Property, plant and equipment, net | 7,421 | | | 7,650 | |
| | Property, plant and equipment, net | |
| | Property, plant and equipment, net | |
| Other Assets | Other Assets | |
| Equity investments in affiliates | |
| Equity investments in affiliates | |
| Equity investments in affiliates | Equity investments in affiliates | 364 | | | 381 | |
| Intangible assets for power purchase agreements, net | Intangible assets for power purchase agreements, net | 2,488 | | | 2,419 | |
| Other intangible assets, net | Other intangible assets, net | 77 | | | 80 | |
| Derivative instruments | Derivative instruments | 63 | | | 6 | |
| Right-of-use assets, net | Right-of-use assets, net | 527 | | | 550 | |
| Other non-current assets | Other non-current assets | 96 | | | 101 | |
| Total other assets | Total other assets | 3,615 | | | 3,537 | |
| Total Assets | Total Assets | $ | 12,312 | | | $ | 12,718 | |
| LIABILITIES AND MEMBERS’ EQUITY | LIABILITIES AND MEMBERS’ EQUITY | | | |
| Current Liabilities | Current Liabilities | |
| Current Liabilities | |
| Current Liabilities | |
| Current portion of long-term debt — external | |
| Current portion of long-term debt — external | |
| Current portion of long-term debt — external | Current portion of long-term debt — external | $ | 322 | | | $ | 772 | |
| Current portion of long-term debt — affiliate | Current portion of long-term debt — affiliate | 2 | | | 1 | |
| Accounts payable — trade | Accounts payable — trade | 55 | | | 74 | |
| Accounts payable — affiliates | Accounts payable — affiliates | 24 | | | 110 | |
| Derivative instruments | Derivative instruments | 50 | | | 46 | |
| Accrued interest expense | Accrued interest expense | 54 | | | 54 | |
| Current liabilities held-for-sale | — | | | 494 | |
| | Accrued expenses and other current liabilities | |
| Accrued expenses and other current liabilities | |
| Accrued expenses and other current liabilities | Accrued expenses and other current liabilities | 95 | | | 84 | |
| Total current liabilities | Total current liabilities | 602 | | | 1,635 | |
| Other Liabilities | Other Liabilities | | | |
| Long-term debt — external | Long-term debt — external | 6,491 | | | 6,939 | |
| Long-term debt — external | |
| Long-term debt — external | |
| | | Deferred income taxes | |
| | Deferred income taxes | |
| | Deferred income taxes | Deferred income taxes | 4 | | | 2 | |
| Derivative instruments | Derivative instruments | 303 | | | 196 | |
| Long-term lease liabilities | Long-term lease liabilities | 548 | | | 561 | |
| Other non-current liabilities | Other non-current liabilities | 197 | | | 168 | |
| Total other liabilities | Total other liabilities | 7,543 | | | 7,866 | |
| Total Liabilities | Total Liabilities | 8,145 | | | 9,501 | |
| Redeemable noncontrolling interest in subsidiaries | Redeemable noncontrolling interest in subsidiaries | 7 | | | — | |
| Commitments and Contingencies | Commitments and Contingencies | | | | Commitments and Contingencies | | | |
| Members’ Equity | Members’ Equity | |
| Contributed capital | Contributed capital | 1,308 | | | 1,495 | |
| Contributed capital | |
| Contributed capital | |
| Retained earnings | Retained earnings | 1,240 | | | 43 | |
| Accumulated other comprehensive income (loss) | 21 | | | (13) | |
| Accumulated other comprehensive income | |
| Noncontrolling interest | Noncontrolling interest | 1,591 | | | 1,692 | |
| Total Members’ Equity | Total Members’ Equity | 4,160 | | | 3,217 | |
| Total Liabilities and Members’ Equity | Total Liabilities and Members’ Equity | $ | 12,312 | | | $ | 12,718 | |
See accompanying notes to consolidated financial statements.
CLEARWAY ENERGY LLC
CONSOLIDATED STATEMENTS OF CASH FLOWS | | Year ended December 31, |
| 2022 | | 2021 | | 2020 |
| Year ended December 31, | | | Year ended December 31, |
| 2023 | | | 2023 | | 2022 | | 2021 |
| Cash Flows from Operating Activities | Cash Flows from Operating Activities | (In millions) | Cash Flows from Operating Activities | (In millions) |
| Net income (loss) | Net income (loss) | $ | 1,282 | | | $ | (63) | | | $ | (52) | |
| Adjustments to reconcile net income (loss) to net cash provided by operating activities: | Adjustments to reconcile net income (loss) to net cash provided by operating activities: | | |
| Equity in earnings of unconsolidated affiliates | |
| Equity in earnings of unconsolidated affiliates | |
| Equity in earnings of unconsolidated affiliates | Equity in earnings of unconsolidated affiliates | (29) | | | (32) | | | (7) | |
| Distributions from unconsolidated affiliates | Distributions from unconsolidated affiliates | 37 | | | 38 | | | 61 | |
| Depreciation, amortization and accretion | Depreciation, amortization and accretion | 512 | | | 509 | | | 428 | |
| Amortization of financing costs and debt discounts | Amortization of financing costs and debt discounts | 14 | | | 14 | | | 15 | |
| Amortization of intangibles | Amortization of intangibles | 172 | | | 146 | | | 90 | |
| Loss on debt extinguishment | Loss on debt extinguishment | 2 | | | 53 | | | 24 | |
| Reduction in carrying amount of right-of-use assets | Reduction in carrying amount of right-of-use assets | 14 | | | 11 | | | 4 | |
| Gain on sale of unconsolidated affiliate | — | | | — | | | (49) | |
| | Gain on sale of business | |
| Gain on sale of business | |
| Gain on sale of business | Gain on sale of business | (1,292) | | | — | | | — | |
| Impairment losses | Impairment losses | 16 | | | 6 | | | 32 | |
| Change in deferred income taxes | Change in deferred income taxes | 2 | | | 2 | | | — | |
| Changes in derivative instruments and amortization of accumulated OCI/OCL | Changes in derivative instruments and amortization of accumulated OCI/OCL | 69 | | | 28 | | | 44 | |
| Loss on disposal of asset components | — | | | — | | | 3 | |
| Cash provided (used) in changes in other working capital | |
| | Cash (used in) provided by changes in other working capital | |
| Cash (used in) provided by changes in other working capital | |
| Cash (used in) provided by changes in other working capital | |
| Changes in prepaid and accrued liabilities for tolling agreements | |
| Changes in prepaid and accrued liabilities for tolling agreements | |
| Changes in prepaid and accrued liabilities for tolling agreements | Changes in prepaid and accrued liabilities for tolling agreements | 10 | | | 5 | | | (1) | |
| Changes in other working capital | Changes in other working capital | (12) | | | (16) | | | (47) | |
| Net Cash Provided by Operating Activities | Net Cash Provided by Operating Activities | 797 | | | 701 | | | 545 | |
| Cash Flows from Investing Activities | Cash Flows from Investing Activities | | | | | |
| Acquisitions, net of cash acquired | Acquisitions, net of cash acquired | — | | | (533) | | | — | |
| Acquisitions, net of cash acquired | |
| Acquisitions, net of cash acquired | |
| Acquisition of Drop Down Assets, net of cash acquired | Acquisition of Drop Down Assets, net of cash acquired | (71) | | | (229) | | | (122) | |
| Acquisition of Capistrano Wind Portfolio, net of cash acquired | Acquisition of Capistrano Wind Portfolio, net of cash acquired | (223) | | | — | | | — | |
| Capital expenditures | Capital expenditures | (112) | | | (151) | | | (124) | |
| Asset purchase from affiliate | — | | | (21) | | | — | |
| Payment for equipment deposit | |
| Payment for equipment deposit and asset purchase from affiliate | |
| | Return of investment from unconsolidated affiliates | 13 | | | 47 | | | 79 | |
| Return of investments from unconsolidated affiliates | |
| Return of investments from unconsolidated affiliates | |
| Return of investments from unconsolidated affiliates | |
| Increase in note receivable — affiliate | |
| Investments in unconsolidated affiliates | Investments in unconsolidated affiliates | — | | | — | | | (11) | |
| Proceeds from sale of assets | — | | | — | | | 90 | |
| | Proceeds from sale of business | Proceeds from sale of business | 1,457 | | | — | | | — | |
| Consolidation of DGPV Holdco 3 LLC | — | | | — | | | 17 | |
| Proceeds from sale of business | |
| Proceeds from sale of business | |
| | | Other | Other | 1 | | | 22 | | | 9 | |
| Net Cash Provided by (Used in) Investing Activities | 1,065 | | | (865) | | | (62) | |
| | Other | |
| | Other | |
| Net Cash (Used in) Provided by Investing Activities | |
| Cash Flows from Financing Activities | Cash Flows from Financing Activities | | | | | |
| Contributions from noncontrolling interests, net of distributions | Contributions from noncontrolling interests, net of distributions | 47 | | | 680 | | | 247 | |
| Contributions from noncontrolling interests, net of distributions | |
| Contributions from noncontrolling interests, net of distributions | |
| Contributions from CEG, net of distributions | Contributions from CEG, net of distributions | 13 | | | 287 | | | — | |
| Buyout of Repowering Partnership II LLC noncontrolling interest | — | | | — | | | (70) | |
| Proceeds from the issuance of class C units | — | | | — | | | 62 | |
| | Payments of distributions | |
| Payments of distributions | |
| Payments of distributions | Payments of distributions | (289) | | | (268) | | | (211) | |
| Distributions to CEG of escrowed amounts | Distributions to CEG of escrowed amounts | (64) | | | — | | | — | |
| Tax-related distributions | Tax-related distributions | (19) | | | — | | | — | |
| Buyout of noncontrolling interest and redeemable noncontrolling interest | |
| Proceeds from the revolving credit facility | Proceeds from the revolving credit facility | 80 | | | 622 | | | 265 | |
| Payments for the revolving credit facility | Payments for the revolving credit facility | (325) | | | (377) | | | (265) | |
| Proceeds from issuance of long-term debt — external | Proceeds from issuance of long-term debt — external | 244 | | | 1,728 | | | 1,084 | |
| Proceeds from issuance of long-term debt — affiliate | Proceeds from issuance of long-term debt — affiliate | 4 | | | 2 | | | 3 | |
| Payments of debt issuance costs | Payments of debt issuance costs | (4) | | | (20) | | | (20) | |
| Payments for long-term debt — external | Payments for long-term debt — external | (1,198) | | | (2,292) | | | (1,482) | |
| Payments for long-term debt — affiliate | Payments for long-term debt — affiliate | (3) | | | (2) | | | (45) | |
| Other | Other | (6) | | | 7 | | | — | |
| Net Cash (Used in) Provided by Financing Activities | Net Cash (Used in) Provided by Financing Activities | (1,520) | | | 367 | | | (432) | |
| Reclassification of Cash to Assets Held-for-Sale | Reclassification of Cash to Assets Held-for-Sale | — | | | (14) | | | — | |
| Net Increase in Cash, Cash Equivalents and Restricted Cash | Net Increase in Cash, Cash Equivalents and Restricted Cash | 342 | | | 189 | | | 51 | |
| Cash, Cash Equivalents and Restricted Cash at Beginning of Period | Cash, Cash Equivalents and Restricted Cash at Beginning of Period | 654 | | | 465 | | | 414 | |
| Cash, Cash Equivalents and Restricted Cash at End of Period | Cash, Cash Equivalents and Restricted Cash at End of Period | $ | 996 | | | $ | 654 | | | $ | 465 | |
| | Supplemental Disclosures: | Supplemental Disclosures: | |
| Supplemental Disclosures: | |
| Supplemental Disclosures: | |
| Interest paid, net of amount capitalized | |
| Interest paid, net of amount capitalized | |
| Interest paid, net of amount capitalized | Interest paid, net of amount capitalized | $ | (317) | | | $ | (337) | | | $ | (325) | |
| Non-cash investing and financing activities: | Non-cash investing and financing activities: | |
| | Non-cash distributions to noncontrolling interests | |
| | Non-cash distributions to noncontrolling interests | |
| | Non-cash distributions to noncontrolling interests | |
| Non-cash (distributions to), contributions from CEG | Non-cash (distributions to), contributions from CEG | (4) | | | 31 | | | 7 | |
| Non-cash contributions from Clearway, Inc. | |
See accompanying notes to consolidated financial statements.
CLEARWAY ENERGY LLC
CONSOLIDATED STATEMENTS OF MEMBERS’ EQUITY
| | (In millions) | (In millions) | | Contributed Capital | | Retained Earnings (Accumulated Deficit) | | Accumulated
Other
Comprehensive
(Loss) Income | | Noncontrolling Interest | | Total
Members’ Equity | (In millions) | | Contributed Capital | | (Accumulated Deficit) Retained Earnings | | Accumulated
Other
Comprehensive
(Loss) Income | | Noncontrolling Interest | | Total
Members’ Equity |
| Balances at December 31, 2019 | | $ | 1,882 | | | $ | 5 | | | $ | (37) | | | $ | 323 | | | $ | 2,173 | |
| Net income (loss) | | — | | | 61 | | | — | | | (113) | | | (52) | |
| Unrealized gain on derivatives and changes in accumulated OCL | | — | | | — | | | 4 | | | (2) | | | 2 | |
| Contributions from CEG, non-cash | | 8 | | | — | | | — | | | (1) | | | 7 | |
| Contributions from CEG, cash | | — | | | — | | | — | | | 6 | | | 6 | |
| Distributions to noncontrolling interests, non-cash | | — | | | — | | | — | | | (3) | | | (3) | |
| Contributions from noncontrolling interests, net of distributions, cash | | — | | | — | | | — | | | 361 | | | 361 | |
| DGPV Drop Down and Consolidation | | (33) | | | — | | | — | | | 13 | | | (20) | |
| Mesquite Star Drop Down and Consolidation | | 15 | | | — | | | — | | | 346 | | | 361 | |
| Langford Drop Down | | (44) | | | — | | | — | | | — | | | (44) | |
| Rosamond Central Drop Down | | 3 | | | — | | | — | | | 52 | | | 55 | |
| Lighthouse Partnership Yield Protection Agreement | | (15) | | | — | | | — | | | — | | | (15) | |
| Buyout of Repowering Partnership II LLC non-controlling interest | | (60) | | | — | | | — | | | (10) | | | (70) | |
| Net proceeds from the sales of units, Clearway Energy, Inc. | | 62 | | | — | | | — | | | — | | | 62 | |
| Distributions paid to CEG on Class B and Class D unit holders | | (36) | | | (54) | | | — | | | — | | | (90) | |
| Distributions paid to Clearway, Inc. | | (59) | | | (62) | | | — | | | — | | | (121) | |
| Balances at December 31, 2020 | Balances at December 31, 2020 | | 1,723 | | | (50) | | | (33) | | | 972 | | | 2,612 | |
| Net income (loss) | Net income (loss) | | — | | | 110 | | | — | | | (176) | | | (66) | |
| Unrealized gain on derivatives and changes in accumulated OCL | Unrealized gain on derivatives and changes in accumulated OCL | | — | | | — | | | 20 | | | 2 | | | 22 | |
| Contributions from CEG, net of distributions, non-cash | Contributions from CEG, net of distributions, non-cash | | 2 | | | — | | | — | | | 29 | | | 31 | |
| Contributions from CEG, net of distributions, cash | Contributions from CEG, net of distributions, cash | | 287 | | | — | | | — | | | 9 | | | 296 | |
| Contributions from noncontrolling interests, net of distributions, cash | Contributions from noncontrolling interests, net of distributions, cash | | — | | | — | | | — | | | 676 | | | 676 | |
| Distributions paid to CEG on Class B and Class D unit holders | Distributions paid to CEG on Class B and Class D unit holders | | (96) | | | (17) | | | — | | | — | | | (113) | |
| Distributions paid to Clearway, Inc. | Distributions paid to Clearway, Inc. | | (155) | | | — | | | — | | | — | | | (155) | |
| Lighthouse Partnership Yield Protection Agreement Amendment | Lighthouse Partnership Yield Protection Agreement Amendment | | 15 | | | — | | | — | | | — | | | 15 | |
| Agua Caliente Acquisition | Agua Caliente Acquisition | | — | | | — | | | — | | | 273 | | | 273 | |
| Rattlesnake Drop Down | | (117) | | | — | | | — | | | — | | | (117) | |
| Mesquite Sky Drop Down | | (42) | | | — | | | — | | | (78) | | | (120) | |
| Black Rock Drop Down | | (122) | | | — | | | — | | | (15) | | | (137) | |
| Transfer of assets under common control | |
| Balances at December 31, 2021 | Balances at December 31, 2021 | | 1,495 | | | 43 | | | (13) | | | 1,692 | | | 3,217 | |
| Net income (loss) | Net income (loss) | | — | | | 1,388 | | | — | | | (117) | | | 1,271 | |
| Unrealized gain on derivatives and changes in accumulated OCI | | — | | | — | | | 27 | | | 6 | | | 33 | |
| Unrealized gain on derivatives and changes in accumulated OCL | |
| (Distributions to) contributions from CEG, non-cash | (Distributions to) contributions from CEG, non-cash | | (18) | | | — | | | — | | | 14 | | | (4) | |
| Contributions from (distributions to) CEG, cash | Contributions from (distributions to) CEG, cash | | 48 | | | — | | | — | | | (32) | | | 16 | |
| | (Distributions to) contributions from noncontrolling interests, cash | | — | | | — | | | — | | | 51 | | | 51 | |
| Mesquite Sky Drop Down | | (7) | | | — | | | — | | | (1) | | | (8) | |
| Black Rock Drop Down | | 2 | | | — | | | — | | | (1) | | | 1 | |
| Mililani I Drop Down | | (41) | | | — | | | — | | | 11 | | | (30) | |
| Waiawa Drop Down | | (38) | | | — | | | — | | | 17 | | | (21) | |
| Contributions from noncontrolling interests, cash | |
| Transfer of assets under common control | |
| Capistrano Wind Portfolio Acquisition | Capistrano Wind Portfolio Acquisition | | 4 | | | — | | | 7 | | | — | | | 11 | |
| Kawailoa Sale to Clearway Renew LLC | | (20) | | | — | | | — | | | (49) | | | (69) | |
| Kawailoa Sale to Clearway Renew | |
| Tax-related distributions | Tax-related distributions | | — | | | (19) | | | — | | | — | | | (19) | |
| Distributions paid to Clearway, Inc. | Distributions paid to Clearway, Inc. | | (82) | | | (85) | | | — | | | — | | | (167) | |
| Distributions paid to CEG Class B and Class D unit holders | Distributions paid to CEG Class B and Class D unit holders | | (35) | | | (87) | | | — | | | — | | | (122) | |
| Balances at December 31, 2022 | Balances at December 31, 2022 | | $ | 1,308 | | | $ | 1,240 | | | $ | 21 | | | $ | 1,591 | | | $ | 4,160 | |
| Net income (loss) | |
| Unrealized loss on derivatives and changes in accumulated OCI | |
| | Distributions to CEG, cash | |
| Distributions to CEG, cash | |
| Distributions to CEG, cash | |
| Contributions from noncontrolling interests, net of distributions, cash | |
| Distributions to noncontrolling interests, non-cash | |
| Contributions from Clearway, Inc., non-cash | |
| Tax-related distributions | |
| Transfer of assets under common control | |
| Buyout of noncontrolling interest | |
| Buyout of redeemable noncontrolling interest | |
| Distributions paid to Clearway, Inc. | |
| Distributions paid to CEG Class B and Class D unit holders | |
| | Balances at December 31, 2023 | |
| Balances at December 31, 2023 | |
| Balances at December 31, 2023 | |
See accompanying notes to consolidated financial statements.
CLEARWAY ENERGY LLC
NOTES TO CONSOLIDATED FINANCIAL STATEMENTS
Note 1 — Nature of Business
Clearway Energy LLC, together with its consolidated subsidiaries, or the Company, is an energy infrastructure investor with a focus on investments in clean energy and owner of modern, sustainable and long-term contracted assets across North America. The Company is sponsored by GIP and TotalEnergies through the portfolio company, Clearway Energy Group LLC, or CEG, which becameis equally owned by GIP and TotalEnergies as of September 12, 2022, when TotalEnergies acquired, through its investment in an intermediate holding company, 50% of GIP’s interest in CEG.TotalEnergies. GIP is an independent infrastructure fund manager that makes equity and debt investments in infrastructure assets and businesses. TotalEnergies is a global multi-energy company. CEG is a leading developer of renewable energy infrastructure in the U.S.
The Company is one of the largest renewable energy owners in the U.S. with over 5,500approximately 6,000 net MW of installed wind, solar and solar generationenergy storage projects. The Company’s over 8,000approximately 8,500 net MW of assets also includes approximately 2,500 net MW of environmentally-sound, highly efficient natural gas-fired generation facilities. Through this environmentally-sound, diversified and primarily contracted portfolio, the Company endeavors to increase distributions to its unit holders. The majority of the Company’s revenues are derived from long-term contractual arrangements for the output or capacity from these assets.
On May 1, 2022, the Company completed the sale of 100% of its interests in the Thermal Business to KKR. For further details of the Thermal Disposition, refer to Note 3, Acquisitions and Dispositions.
Clearway Energy, Inc., or Clearway, Inc., consolidates the results of the Company through its controlling interest, with CEG’s interest shown as contributed capital in the Company’s consolidated financial statements. The holders of Clearway, Inc.’s outstanding shares of Class A and Class C common stock are entitled to dividends as declared. CEG receives its distributions from the Company through its ownership of the Company’s Class B and Class D units. From time to time, CEG may also hold shares of Clearway Inc’s Class A and/or Class C common stock.
As of December 31, 2022,2023, Clearway, Inc. owned 57.88%57.90% of the economic interests of the Company, with CEG owning 42.12%42.10% of the economic interests of the Company. For further discussion, see Note 11, Members’ Equity.
The diagram below represents a summarized structure of the Company as of December 31, 2022:2023:
Note 2 — Summary of Significant Accounting Policies
Basis of Presentation and Principles of Consolidation
The Company’s consolidated financial statements have been prepared in accordance with GAAP. The FASB ASC is the source of authoritative GAAP to be applied by nongovernmental entities. In addition, the rules and interpretative releases of the SEC under authority of federal securities laws are also sources of authoritative GAAP for SEC registrants.
The consolidated financial statements include the Company’s accounts and operations and those of its subsidiaries in which it has a controlling financial interest. All significant intercompany transactions and balances have been eliminated in consolidation. The usual condition for a controlling financial interest is ownership of athe majority of the voting interests of an entity. However, a controlling financial interest may also exist through arrangements that do not involve controlling voting interests. As such, the Company applies the guidance of ASC 810, Consolidations, to determine when an entity that is insufficiently capitalized or not controlled through its voting interests, referred to as a variable interest entity, or VIE, should be consolidated.
Cash, Cash Equivalents and Restricted Cash
Cash and cash equivalents include highly liquid investments with an original maturity of three months or less at the time of purchase. Cash and cash equivalents held at project subsidiaries was $121$125 million and $146$121 million as of December 31, 20222023 and 2021,2022, respectively.
The following table provides a reconciliation of cash, cash equivalents and restricted cash reported within the consolidated balance sheets that sum to the total of the same such amounts shown in the consolidated statements of cash flows:
| | | |
| | |
| | | December 31, |
| | | | December 31, |
| | | 2022 | | 2021 | |
| | | (In millions) | (In millions) |
| Cash and cash equivalents | Cash and cash equivalents | $ | 657 | | | $ | 179 | | |
| Restricted cash | Restricted cash | 339 | | | 475 | | |
| Restricted cash | |
| Restricted cash | |
| Cash, cash equivalents and restricted cash shown in the consolidated statements of cash flows | Cash, cash equivalents and restricted cash shown in the consolidated statements of cash flows | $ | 996 | | | $ | 654 | | |
| Cash, cash equivalents and restricted cash shown in the consolidated statements of cash flows | |
| Cash, cash equivalents and restricted cash shown in the consolidated statements of cash flows | |
Restricted cash consists primarily of funds held to satisfy the requirements of certain debt agreements and funds held within the Company’s projects that are restricted in their use. As of December 31, 2022,2023, these restricted funds were comprised of $109$176 million designated to fund operating expenses, $55$178 million designated for current debt service payments and $105$85 million restricted for reserves including debt service, performance obligations and other reserves as well as capital expenditures. The remaining $70$77 million is held in distributions reserve accounts.
In 2020, the membersSupplemental Cash Flow Information
The following table provides a disaggregation of the partnerships holding the Oahu Solar and Kawailoa Solar projects submitted applications to the stateamounts classified as Acquisition of Hawaii for refundable tax credits based on the costDrop Down Assets, net of construction of the projects. In 2021, the members of the partnerships contributed their respective portions of the tax creditscash acquired, shown in the amountconsolidated statements of $27 million to the Oahu Solar and $22 million to the Kawailoa Solar project companies, which were recorded to restricted cash on the Company’s consolidated balance sheet with an offsetting adjustment to noncontrolling interests. In accordance with the projects’ related agreements, the cash is held in a restricted account and utilized to offset invoiced amounts under the projects’ PPAs. On August 1, 2022, the Company sold its Class A membership interests in the Kawailoa Partnership, which consolidates the Kawailoa Solar project, to Clearway Renew LLC, as further described in Note 3, Acquisitions and Dispositions, resulting in the removal of $7 million that remained in restricted cash at the time of sale. As of December 31, 2022, $26 million of the $27 million previously contributed to the Oahu Solar projects has been utilized to offset invoiced amounts under the projects’ PPAs.flows:
| | | | | | | | | | | | | | | | | | | | |
| | Year ended December 31, |
| | 2023 | | 2022 | | 2021 |
| | (In millions) |
| Cash paid to acquire Drop Down Assets | | $ | (173) | | | $ | (71) | | | $ | (230) | |
| Cash acquired from the acquisition of Drop Down Assets | | 128 | | | — | | | 1 | |
| Acquisition of Drop Down Assets, net of cash acquired | | $ | (45) | | | $ | (71) | | | $ | (229) | |
Accounts Receivable — Trade and Allowance for Credit Losses
Accounts receivable — trade are reported on the consolidated balance sheet at the invoiced amount adjusted for any write-offs and the allowance for credit losses. The majority of the Company’s customers typically receive invoices monthly with payment due within 30 days. The allowance for credit losses is reviewed periodically based on amounts past due and their significance. The allowance for credit losses was immaterial as of December 31, 20222023 and 2021.2022.
Inventory
Inventory consists of spare parts and is valued at weighted average cost, unless evidence indicates that the weighted average cost will not be recovered with a normal profit in the ordinary course of business. Inventory is removed when used for repairs, maintenance or capital projects.
Property, Plant and Equipment
Property, plant and equipment are stated at cost, however impairment adjustments are recorded whenever events or changes in circumstances indicate that their carrying amounts may not be recoverable. Significant additions or improvements extending asset lives are capitalized as incurred, while repairs and maintenance that do not improve or extend the life of the respective asset are charged to expense as incurred. Depreciation is computed using the straight-line method over the estimated useful lives. Certain assets and their related accumulated depreciation amounts are adjusted for asset retirements and disposals with the resulting gain or loss included in cost of operations in the consolidated statements of income. For further discussion of the Company’s property, plant and equipment refer to Note 4, Property, Plant and Equipment.
Interest incurred on funds borrowed to finance capital projects is capitalized until the project under construction is ready for its intended use. The amount of interest capitalized for the years ended December 31, 2023, 2022 and 2021 was $36 million, $2 million and $3 million, respectively.
Construction in-progress represents cumulative construction costs, including the costs incurred for the purchase of major equipment and engineering costs and capitalized interest. Once the project achieves commercial operation, the Company reclassifies the amounts recorded in construction in progress to facilities and equipment.
Development costs include project development costs, which are expensed in the preliminary stages of a project and capitalized when the project is deemed to be commercially viable. Commercial viability is determined by one or a series of actions including, among others, Board of Director approval pursuant to a formal project plan that subjects the Company to significant future obligations that can only be discharged by the use of a Company asset. When a project is available for operations, capitalized interest and capitalized project development costs are reclassified to property, plant and equipment and depreciated on a straight-line basis over the estimated useful life of the project’s related assets. Capitalized costs are charged to expense if a project is abandoned or management otherwise determines the costs to be unrecoverable.
Asset Impairments
Long-lived assets that are held and used are reviewed for impairment whenever events or changes in circumstances indicate their carrying amounts may not be recoverable. Such reviews are performed in accordance with ASC 360, Property, Plant and Equipment. An impairment loss is indicated if the total future estimated undiscounted cash flows expected from an asset are less than its carrying amount. An impairment charge is measured as the excess of an asset’s carrying amount over its fair value with the difference recorded in operating costs and expenses in the consolidated statements of income. Fair values are determined by a variety of valuation methods, including appraisals, sales prices of similar assets and present value techniques. For further discussion of the Company’s long-lived asset impairments, refer to Note 9, Asset Impairments.
Investments accounted for by the equity method are reviewed for impairment in accordance with ASC 323, Investments-Equity Method and Joint Ventures, which requires that a loss in value of an investment that is an other-than-temporary decline should be recognized. The Company identifies and measures losses in the value of equity method investments based upon a comparison of fair value to carrying value.
Debt Issuance Costs
Debt issuance costs are capitalized and amortized as interest expense on a basis which approximates the effective interest method over the term of the related debt. Debt issuance costs related to the long-term debt are presented as a direct deduction from the carrying amount of the related debt. Debt issuance costs related to the senior secured revolving credit facility line of credit are recorded as a non-current asset on the consolidated balance sheet and are amortized over the term of the credit facility.
Intangible Assets
Intangible assets represent contractual rights held by the Company. The Company recognizes specifically identifiable intangible assets including power purchase agreements, leasehold rights, emission allowances, RECs and development rights when specific rights and contracts are acquired. These intangible assets are amortized primarily on a straight-line basis. For further discussion of the Company’s intangible assets, refer to Note 8, Intangible Assets.
Income Taxes
The Company is classified as a partnership for federal and state income tax purposes. Therefore, federal and most state income taxes are assessed at the partner level.The franchise tax imposed by the state of Texas, however, is being assessed at the level of certain project subsidiaries of the Company, and therefore reflected as an income tax expense or benefit of the Company.
For the year ended December 31, 2023, the Company recorded a deferred tax benefit of $2 million and associated deferred tax liability of $2 million with respect to future years. For the year ended December 31, 2022, the Company recorded a deferred tax expense of $2 million and associated deferred tax liability of $4 million with respect to future years. At December 31, 2021, the Company recorded a deferred tax expense and associated deferred tax liability of $2 million with respect to future years.
Revenue Recognition
Revenue from Contracts with Customers
The Company applies the guidance in ASC 606, Revenue from Contracts with Customers, or Topic 606, when recognizing revenue associated with its contracts with customers. The Company’s policies with respect to its various revenue streams are detailed below. In general, the Company applies the invoicing practical expedient to recognize revenue for the revenue streams detailed below, except in circumstances where the invoiced amount does not represent the value transferred to the customer.
Conventional Generation Revenues
The majority of the conventional energy plants commenced merchant operations during 2023 following the expiration of the PPAs. These facilities generate revenues from selling electricity and/or RA to the California Independent System Operator and to public utility and load serving entities, as the power is delivered at the interconnection point.
Thermal Revenues
SteamOn May 1, 2022, the Company completed the sale of 100% of its interests in the Thermal Business to KKR. For further details of the Thermal Disposition refer to Note 3, Acquisitions and Dispositions.
Prior to the Thermal Disposition, steam and chilled water revenue iswas recognized as the Company transferstransferred the product to the customer, based on customer usage as determined by meter readings taken at month-end. Some locations read customer meters throughout the month and recognizerecognized estimated revenue for the period between meter read date and month-end. For thermal contracts, the Company’s performance obligation to deliver steam and chilled water iswas satisfied over time and revenue iswas recognized based on the invoiced amount. The Thermal Business subsidiaries collectcollected and remitremitted state and local taxes associated with sales to their customers, as required by governmental authorities. These taxes arewere presented on a net basis in the consolidated statements of income.
On May 1, 2022, the Company completed the sale of 100% of its interests in the Thermal business to KKR. For further details of the Thermal Disposition refer to Note 3, Acquisitions and Dispositions.
Power Purchase Agreements, or PPAs
The majority of the Company’s revenues are obtained through PPAs or similar contractual agreements. Energy, capacity and, where applicable, renewable attributes, from the majority of the Company’s renewable energy assets and certain conventional energy plants is sold through long-term PPAs and tolling agreements to a single counterparty, which is often a utility or commercial customer. Certain revenue agreements also provide for the sale of BESS capacity. As discussed above, the majority of the conventional energy plants commenced merchant operations during 2023 following the expiration of the PPAs. The majority of these PPAs are accounted for as operating leases as the Company retained its historical lease assessments and classification upon adoption of ASC 842, Leases. ASC 842 requires the minimum lease payments received to be amortized over the term of the lease and contingent rentals are recorded when the achievement of the contingency becomes probable. The Company’s BESS arrangements include variable payments not based on an index or rate and sales-type lease treatment would result in a loss at lease commencement. As a result, the Company accounts for these arrangements as operating leases under ASC 842. Judgment is required by management in determining the economic life of each generating facility, in evaluating whether certain lease provisions constitute minimum payments or represent contingent rent and other factors in determining whether a contract contains a lease and whether the lease is an operating lease or capitalfinance lease.
Certain of these PPAs have no minimum lease payments and all of the lease revenue under these PPAs is recorded as contingent rent on an actual basis when the electricity is delivered. The contingent lease revenue recognized in the years ended December 31, 2023, 2022 and 2021 and 2020 was $780 million, $850 million $741 million and $589$741 million, respectively. See Note 15, Leases, for additional information related to the Company’s PPAs accounted for as leases.
Renewable Energy Credits, or RECs
Renewable energy credits, or RECs, are usually sold through long-term PPAs or through REC contracts with counterparties. Revenue from the sale of self-generated RECs is recognized when the related energy is generated and simultaneously delivered even in cases where there is a certification lag as it has been deemed to be perfunctory.
In a bundled contract to sell energy, capacity and/or self-generated RECs, all performance obligations are deemed to be delivered at the same time and hence, timing of recognition of revenue for all performance obligations is the same and occurs over time. In such cases, it is often unnecessary to allocate transaction price to multiple performance obligations.
Disaggregated Revenues
The following tables represent the Company’s disaggregation of revenue from contracts with customers, for the year ended December 31, 2022, along with the reportable segment for each category:
| | Year ended December 31, 2022 |
| Year ended December 31, 2023 | |
| Year ended December 31, 2023 | |
| Year ended December 31, 2023 | |
| (In millions) | (In millions) | Conventional Generation | | Renewables | | Thermal | | | Total | (In millions) | Conventional Generation | | Renewables | | | | | Total |
Energy revenue (a) | Energy revenue (a) | $ | 6 | | | $ | 956 | | | $ | 48 | | | | $ | 1,010 | |
Capacity revenue (a) | Capacity revenue (a) | 435 | | | 2 | | | 18 | | | | 455 | |
| Other revenues | — | | | 71 | | | 11 | | | | 82 | |
Other revenue (a) | |
| Contract amortization | Contract amortization | (24) | | | (151) | | | — | | | | (175) | |
| Mark-to-market for economic hedges | Mark-to-market for economic hedges | — | | | (182) | | | — | | | | (182) | |
| Total operating revenues | Total operating revenues | 417 | | | 696 | | | 77 | | | | 1,190 | |
| Less: Contract amortization | Less: Contract amortization | 24 | | | 151 | | | — | | | | 175 | |
| Less: Mark-to-market for economic hedges | Less: Mark-to-market for economic hedges | — | | | 182 | | | — | | | | 182 | |
| Less: Lease revenue | Less: Lease revenue | (441) | | | (809) | | | (1) | | | | (1,251) | |
| | Total revenue from contracts with customers | Total revenue from contracts with customers | $ | — | | | $ | 220 | | | $ | 76 | | | | $ | 296 | |
| Total revenue from contracts with customers | |
| Total revenue from contracts with customers | |
|
(a) See Note 15,, Leases, for the amounts of energy, capacity and capacityother revenue that relate to leases and are accounted for under ASC 842.
The following tables represent the Company’s disaggregation of revenue from contracts with customers for the year ended December 31, 2021, along with the reportable segment for each category:
| | Year ended December 31, 2021 |
| Year ended December 31, 2022 | |
| Year ended December 31, 2022 | |
| Year ended December 31, 2022 | |
| (In millions) | (In millions) | Conventional Generation | | Renewables | | Thermal | | | Total | (In millions) | Conventional Generation | | Renewables | | Thermal | | | Total |
Energy revenue (a) | Energy revenue (a) | $ | 9 | | | $ | 784 | | | $ | 122 | | | | $ | 915 | |
Capacity revenue (a) | Capacity revenue (a) | 455 | | | 2 | | | 53 | | | | 510 | |
| Other revenues | — | | | 60 | | | 32 | | | | 92 | |
| Other revenue | |
| Contract amortization | Contract amortization | (23) | | | (118) | | | (3) | | | | (144) | |
| Mark-to-market for economic hedges | Mark-to-market for economic hedges | — | | | (87) | | | — | | | | (87) | |
| Total operating revenues | Total operating revenues | 441 | | | 641 | | | 204 | | | | 1,286 | |
| Less: Contract amortization | Less: Contract amortization | 23 | | | 118 | | | 3 | | | | 144 | |
| Less: Mark-to-market for economic hedges | Less: Mark-to-market for economic hedges | — | | | 87 | | | — | | | | 87 | |
| Less: Lease revenue | Less: Lease revenue | (464) | | | (716) | | | (2) | | | | (1,182) | |
| Total revenue from contracts with customers | Total revenue from contracts with customers | $ | — | | | $ | 130 | | | $ | 205 | | | | $ | 335 | |
(a) See Note 15,, Leases, for the amounts of energy and capacity revenue that relate to leases and are accounted for under ASC 842.
The following tables represent the Company’s disaggregation of revenue from contracts with customers for the year ended December 31, 2020, along with the reportable segment for each category: | | | | | | | | | | | | | | | | | | | | | | | | | |
| Year ended December 31, 2021 | |
| (In millions) | Conventional Generation | | Renewables | | Thermal | | | Total | |
Energy revenue (a) | $ | 9 | | | $ | 784 | | | $ | 122 | | | | $ | 915 | | |
Capacity revenue (a) | 455 | | | 2 | | | 53 | | | | 510 | | |
| Other revenue | — | | | 60 | | | 32 | | | | 92 | | |
| Contract amortization | (23) | | | (118) | | | (3) | | | | (144) | | |
| Mark-to-market for economic hedges | — | | | (87) | | | — | | | | (87) | | |
| Total operating revenues | 441 | | | 641 | | | 204 | | | | 1,286 | | |
| Less: Contract amortization | 23 | | | 118 | | | 3 | | | | 144 | |
| Less: Mark-to-market for economic hedges | — | | | 87 | | | — | | | | 87 | |
| Less: Lease revenue | (464) | | | (716) | | | (2) | | | | (1,182) | | |
| Total revenue from contracts with customers | $ | — | | | $ | 130 | | | $ | 205 | | | | $ | 335 | | |
| | | | | | | | | | | | | | | | | | | | | | | | | |
| Year ended December 31, 2020 | |
| (In millions) | Conventional Generation | | Renewables | | Thermal | | | Total | |
Energy revenue (a) | $ | 10 | | | $ | 609 | | | $ | 101 | | | | $ | 720 | | |
Capacity revenue (a) | 451 | | | — | | | 63 | | | | 514 | | |
| Other revenues | — | | | 21 | | | 32 | | | | 53 | | |
| Contract amortization | (24) | | | (61) | | | (3) | | | | (88) | | |
| | | | | | | | | |
| Total operating revenues | 437 | | | 569 | | | 193 | | | | 1,199 | | |
| Less: Contract amortization | 24 | | | 61 | | | 3 | | | | 88 | |
| | | | | | | | | |
| Less: Lease revenue | (461) | | | (554) | | | (2) | | | | (1,017) | | |
| Total revenue from contracts with customers | $ | — | | | $ | 76 | | | $ | 194 | | | | $ | 270 | | |
(a) See Note 15,, Leases, for the amounts of energy and capacity revenue that relate to leases and are accounted for under ASC 842.
Contract Amortization
Assets and liabilities recognized from power sales agreements assumed through acquisitions relating to the sale of electric capacity and energy in future periods arising from differences in contract and market prices are amortized to revenue over the term of each underlying contract based on actual generation and/or contracted volumes or on a straight-line basis, where applicable.
Contract Balances
The following table reflects the net amount of contract assets and liabilities included on the Company’s consolidated balance sheets as of December 31, 2022 and December 31, 2021:sheets: | | (In millions) | (In millions) | | December 31, 2022 | | December 31, 2021 | (In millions) | | December 31, 2023 | | December 31, 2022 |
| Accounts receivable, net - Contracts with customers | Accounts receivable, net - Contracts with customers | | $ | 37 | | | $ | 44 | |
| Accounts receivable, net - Leases | Accounts receivable, net - Leases | | 116 | | | 100 | |
| Total accounts receivable, net | Total accounts receivable, net | | $ | 153 | | | $ | 144 | |
Derivative Financial Instruments
The Company accounts for derivative financial instruments under ASC 815, Derivatives and Hedging, or ASC 815, which requires the Company to record all derivatives on the balance sheet at fair value unless they qualify for a NPNS exception. Changes in the fair value of non-hedge derivatives are immediately recognized in earnings. Changes in the fair value of derivatives accounted for as hedges, if elected for hedge accounting, are either:
•Recognized in earnings as an offset to the changes in the fair value of the related hedged assets, liabilities and firm commitments; or
•Deferreddeferred and recorded as a component of accumulated OCI until the hedged transactions occur and are recognized in earnings.
The Company’s primary derivative financial instruments are interest rate instruments used to mitigate variability in earnings due to fluctuations in interest rates and power sale contractsenergy-related instruments used to mitigate variability in earnings due to fluctuations in power market prices.prices or natural gas market prices for conventional facilities. Certain derivative contracts contain provisions providing the counterparties a lien on specific assets as collateral. On an ongoing basis, the Company qualitatively assesses the effectiveness of its derivatives that are designated as hedges for accounting purposes in order to determine that each derivative continues to be highly effective in offsetting changes in cash flows of hedged items. If necessary, the Company will perform an analysis to measure the statistical correlation between the derivative and the associated hedged item to determine the effectiveness of such a contract designated as a hedge. The Company will discontinue hedge accounting if it is determined that the hedge is no longer effective. In this case, the gain or loss previously deferred in accumulated OCI would be frozen until the underlying hedged item is delivered unless the transaction being hedged is no longer probable of occurring in which case the amount in accumulated OCI would be immediately reclassified into earnings. If the derivative financial instrument is terminated, the effective portion of this derivative deferred in accumulated OCI will be frozen until the underlying hedged item is delivered.
Revenues and expenses on contracts that qualify for the NPNS exception are recognized when the underlying physical transaction is delivered. While these contracts are considered derivative financial instruments under ASC 815, they are not recorded at fair value, but on an accrual basis of accounting. If it is determined that a transaction designated as NPNS no longer meets the scope exception, the fair value of the related contract is recorded on the balance sheet and immediately recognized through earnings.
Cash flows from derivative financial instruments, including derivatives designated as cash flow hedges and derivatives not designated as cash flow hedges, are classified as operating activities in the consolidated statements of cash flows.
Concentrations of Credit Risk
Financial instruments which potentially subject the Company to concentrations of credit risk consist primarily of accounts receivable — trade and derivative financial instruments, which are concentrated within entities engaged in the energy and financial industries. These industry concentrations may impact the overall exposure to credit risk, either positively or negatively, in that the customers may be similarly affected by changes in economic, industry or other conditions. In addition, many of the Company’s projects have only one customer. See Item 1A, Risk Factors, Risks Related to the Company’s Business, for a discussion on the Company’s dependence on major customers. See Note 6, Fair Value of Financial Instruments, for a further discussion of derivative concentrations and Note 12, Segment Reporting, for concentration of counterparties.
Fair Value of Financial Instruments
The carrying amount of cash and cash equivalents, restricted cash, accounts receivable — trade, note receivable — affiliate, accounts payable — trade, account payable — affiliates and accrued expenses and other current liabilities approximate fair value because of the short-term maturity of these instruments. See Note 6, Fair Value of Financial Instruments, for a further discussion of fair value of financial instruments.
Asset Retirement Obligations
Asset retirement obligations, or AROs, are accounted for in accordance with ASC 410-20, Asset Retirement Obligations, or ASC 410-20. Retirement obligations associated with long-lived assets included within the scope of ASC 410-20 are those for which a legal obligation exists under enacted laws, statutes, and written or oral contracts, including obligations arising under the doctrine of promissory estoppel, and for which the timing and/or method of settlement may be conditional on a future event. ASC 410-20 requires an entity to recognize the fair value of a liability for an ARO in the period in which it is incurred and a reasonable estimate of fair value can be made.
Upon initial recognition of a liability for an ARO, other than when an ARO is assumed in an acquisition of the related long-lived asset, the asset retirement cost is capitalized by increasing the carrying amount of the related long-lived asset by the same amount. Over time, the liability is accreted to its future value, while the capitalized cost is depreciated over the useful life of the related asset. The Company’s AROs are primarily related to the future dismantlement of equipment on leased property and environmental obligations related to site closures and fuel storage facilities. The Company records AROs as part of other non-current liabilities on its consolidated balance sheet.
The following table represents the balance of ARO obligations, along with the related activity for the year ended December 31, 2022:activity:
| | | | | |
| (In millions) | |
Balance as of December 31, 2021 | $ | 146 | |
| |
Liabilities incurred | 6 | |
Liabilities settled | (5) | |
Accretion expense | 10 | |
| Balance as of December 31, 2022 | $ | 157 | |
| Revisions in estimated cash flows | 3 | |
| Liabilities incurred | 67 | |
| |
| Accretion expense | 12 | |
| Balance as of December 31, 2023 | $ | 239 | |
Guarantees
The Company enters into various contracts that include indemnification and guarantee provisions as a routine part of its business activities. Examples of these contracts include operation and maintenance agreements, service agreements, commercial sales arrangements and other types of contractual agreements with vendors and other third parties as well as affiliates. These contracts generally indemnify the counterparty for tax, environmental liability, litigation and other matters as well as breaches of representations, warranties and covenants set forth in these agreements. Because many of the guarantees and indemnities the Company issues to third parties and affiliates do not limit the amount or duration of its obligations to perform under them, there exists a risk that the Company may have obligations in excess of the amounts agreed upon in the contracts mentioned above. For those guarantees and indemnities that do not limit the liability exposure, the Company may not be able to estimate what the liability would be, until a claim is made for payment or performance, due to the contingent nature of these contracts.
Investments Accounted for by the Equity Method
The Company has investments in various energy projects accounted for by the equity method, several of which are VIEs, where the Company is not a primary beneficiary, as described in Note 5, Investments Accounted for by the Equity Method and Variable Interest Entities.Entities. The equity method of accounting is applied to these investments in affiliates because the ownership structure prevents the Company from exercising a controlling influence over the operating and financial policies of the projects. Under this method, equity in pre-tax income or losses of the investments is reflected as equity in earnings of unconsolidated affiliates. Distributions from equity method investments that represent earnings on the Company’s investment are included within cash flows from operating activities and distributions from equity method investments that represent a return of the Company’s investment are included within cash flows from investing activities.
Sale-Leaseback Arrangements
The Company is party to sale-leaseback arrangements that provide for the sale of certain assets to a third-party and simultaneous leaseback to the Company. In accordance with ASC 840-40, Sale-Leaseback Transactions, if the seller-lessee retains, through the leaseback, substantially all of the benefits and risks incident to the ownership of the property sold, the sale-leaseback transaction is accounted for as a financing arrangement. An example of this type of continuing involvement would include an option to repurchase the assets or the buyer-lessor having the option to sell the assets back to the Company. This provision is included in most of the Company’s sale-leaseback arrangements. As such, the Company accounts for these arrangements as financings.
Under the financing method, the Company does not recognize as income any of the sale proceeds received from the lessor that contractually constitutes payment to acquire the assets subject to these arrangements. Instead, the sale proceeds received are accounted for as financing obligations and leaseback payments made by the Company are allocated between interest expense and a reduction to the financing obligation. Interest on the financing obligation is calculated using the Company’s incremental borrowing rate at the inception of the arrangement on the outstanding financing obligation. Judgment is required to determine the appropriate borrowing rate for the arrangement and in determining any gain or loss on the transaction that would be recorded either at the end of or over the lease term.
Asset Acquisitions
The Company accounts for its acquisitions in accordance with ASC 805, Business Combinations, or ASC 805. For third-party acquisitions, ASC 805 requires an acquirer to recognize and measure in its financial statements the identifiable assets acquired, the liabilities assumed and any noncontrolling interest in the acquiree at fair value at the acquisition date. No goodwill is recognized, and excess purchase price or negative goodwill are allocated to the acquired assets on a relative fair value basis. For acquisitions that relate to entities under common control, the difference between the cash paid and historical value of the entities’ equity is recorded as a distribution/contribution from/to CEG with the offset to CEG’s contributed capital balance.
Tax Equity Arrangements
Certain portions of the Company’s redeemable noncontrolling interest in subsidiaries and noncontrolling interest represent third-party interests in the net assets under certain tax equity arrangements, which are consolidated by the Company, that have been entered into to finance the cost of solar and wind facilities eligible for certain tax credits. The Company has determined that the provisions in the contractual agreements of these structures represent substantive profit sharing arrangements. Further, the Company has determined that the appropriate methodology for calculating the redeemable noncontrolling interest and noncontrolling interest that reflects the substantive profit sharing arrangements is a balance sheet approach utilizing the hypothetical liquidation at book value, or HLBV, method. Under the HLBV method, the amounts reported as redeemable noncontrolling interest and noncontrolling interest represent the amounts the investors to the tax equity arrangements would hypothetically receive at each balance sheet date under the liquidation provisions of the contractual agreements, assuming the net assets of the funding structures were liquidated at their recorded amounts determined in accordance with GAAP. The investors’ interests in the results of operations of the funding structures are determined as the difference in redeemable noncontrolling interest and noncontrolling interest at the start and end of each reporting period, after taking into account any capital transactions between the structures and the funds’ investors. The calculations utilized to apply the HLBV method include estimated calculations of taxable income or losses for each reporting period. In addition, in certain circumstances, the Company and its partners in the tax equity arrangements agree that certain tax benefits are to be utilized outside of the tax equity arrangements, which may result in differences in the amount an investor would hypothetically receive at the initial balance sheet date calculated strictly in accordance with related contractual agreements. These differences are recognized in the consolidated statementstatements of income using a systematic and rational method over the period during which the investor is expected to achieve its target return.
Redeemable Noncontrolling Interest
To the extent that a third party has the right to redeem their interests for cash or other assets, the Company has included the noncontrolling interest attributable to the third party as a component of temporary equity in the mezzanine section of the consolidated balance sheet. During the fourth quarter of 2023, the Company repurchased a partner’s equity interest, as further described in Note 5, Investments Accounted for by the Equity Method and Variable Interest Entities. The following table reflects the changes in the Company’s redeemable noncontrolling interest balance for the year ended December 31, 2022:balance:
| | | | | | | | |
| | (In millions) |
| Balance at December 31, 2021 | | $ | — | |
| Cash distributions to redeemable noncontrolling interests | | (4) | |
| Comprehensive income attributable to redeemable noncontrolling interests | | 11 | |
| Balance at December 31, 2022 | | 7 | |
| Cash distributions to redeemable noncontrolling interests | | (3) | |
| Comprehensive income attributable to redeemable noncontrolling interests | | 17 | |
| Repurchase of redeemable noncontrolling interest | | (20) | |
| Balance at December 31, 2023 | | $ | 71 | |
Use of Estimates
The preparation of consolidated financial statements in accordance with GAAP requires management to make estimates and assumptions. These estimates and assumptions impact the reported amounts of assets and liabilities and disclosures of contingent assets and liabilities as of the date of the consolidated financial statements. They also impact the reported amounts of net earnings during the reporting periods. Actual results could be different from these estimates.
In recording transactions and balances resulting from business operations, the Company uses estimates based on the best information available. Estimates are used for such items as plant depreciable lives, uncollectible accounts, AROs, acquisition accounting, fair value of financial instruments and legal costs incurred in connection with recorded loss contingencies, among others. In addition, estimates are used to test long-lived assets for impairment and to determine the fair value of impaired assets. As better information becomes available or actual amounts are determinable, the recorded estimates are revised. Consequently, operating results can be affected by revisions to prior accounting estimates.
Reclassification
Certain prior year amounts have been reclassified for comparative purposes.
Recently Adopted Accounting Standards
In March 2020, the FASB issued ASU No. 2020-4, Facilitation of the Effects of Reference Rate Reform on Financial Reporting. The amendments provide for optional expedients and exceptions for applying GAAP to contracts, hedging relationships and other transactions affected by reference rate reform if certain criteria are met. These amendments apply only to contracts that reference LIBOR or another reference rate expected to be discontinued because of reference rate reform, which affects certain of the Company’s debt and interest rate swap agreements. The guidance is effective for all entities as of March 12, 2020 through December 31, 2022. In December 2022, the FASB issued ASU No. 2022-6, Deferral of the Sunset Date of Reference Rate Reform, to extend the end of the transition period to December 31, 2024. As of December 31, 2022,2023, all of the applicable contracts that previously used LIBOR as a reference rate were amended and the Company intendselected to apply the amendmentspractical expedient to all its eligible contract modifications, where applicable, no later than June 30,certain modified cash flow interest rate swap and debt agreements. The adoption did not have a material impact on the Company’s financial statements.
Recent Accounting Standards Not Yet Adopted
In November 2023, the LIBOR cessation date.FASB issued ASU No. 2023-7, Segment Reporting (Topic 280): Improvements to Reportable Segment Disclosures. The amendment improves reportable segment disclosure requirements, primarily through enhanced disclosures about significant segment expense categories and details regarding information utilized to assess segment performance. Additionally, the amendment increases the frequency of disclosures by requiring Topic 280 to be applied to interim financial statements. This guidance will be applied retrospectively and is effective for annual reporting periods in fiscal years beginning after December 15, 2023, and interim reporting periods in fiscal years beginning after December 31, 2024. As of December 31, 2023, the Company has not elected any optional expedients provided into early adopt the standard.standard and is evaluating the effect of the new guidance on its consolidated financial statements.
Note 3 — Acquisitions and Dispositions
Acquisitions
As further described in Note 2, Summary of Significant Accounting Policies, the Company records the assets acquired and liabilities assumed at acquisition-date fair value, except in the case of acquisitions under common control by CEG, for which assets acquired and liabilities assumed are recorded at historical cost on the acquisition date, which in certain circumstances represent the acquired cost.
The fair value of property, plant and equipment for third-party acquisitions was determined primarily based on an income method using discounted cash flows and validated using a cost approach based on the replacement cost of the assets less economic depreciation. This methodology was utilized as the forecasted cash flows incorporate specific attributes of each asset including age, useful life, equipment condition and technology. The fair value of intangible assets was determined utilizing a variation of the income approach determined by discounting incremental cash flows associated with the contracts to present value. Primary assumptions utilized included estimates of generation, contractual prices, operating expenses and the weighted average cost of capital reflective of a market participant. These assumptions are considered to be a Level 3 measurement as defined in ASC 820, as they utilize inputs that are not observable in the market.
Daggett 3Texas Solar Nova 1 Drop Down — On February 17,December 28, 2023, Daggett Solar Investment LLC, a subsidiary of the Company, acquired the Class A membership interests in Daggettthrough its indirect subsidiary, Lighthouse Renewable Holdco LLC from Clearway Renew LLC, a subsidiary of CEG, for cash consideration of $21 million. Simultaneously, Daggett Renewable Holdco2 LLC, acquired Daggett TargetCoTSN1 BL Borrower Holdco LLC, the indirect owner of the Daggett 3 solar project,Texas Solar Nova 1, a 300252 MW solar project with matching storage capacity that is currently under construction and located in San Bernardino, California. DaggettKent County, Texas, from Clearway Renew for cash consideration of $23 million. Lighthouse Renewable Holdco 2 LLC is a partnership between the Company and a third-partycash equity investor. The third-partycash equity investor also paidcontributed cash consideration of $129$109 million to acquire their portion of the acquired entity. TSN1 BL Borrower Holdco LLC consolidates as primary beneficiary, TSN1 TE Holdco LLC, a tax equity fund that owns the Texas Solar Nova 1 solar project, as further described in Note 5, Investments Accounted for by the Equity Method and Variable Interest Entities.Texas Solar Nova 1 has an 18-year PPA with an investment-grade counterparty that commenced in January 2024. The Texas Solar Nova 1 operations are reflected in the Company’s Renewables segment and the acquisition was funded with existing sources of liquidity. The acquisition was determined to be an asset acquisition and the Company consolidates Texas Solar Nova 1 on a prospective basis in its financial statements. The assets and liabilities transferred to the Company relate to interests under common control and were recorded at historical cost in accordance with ASC 805-50, Business Combinations - Related Issues. The sum of the cash paid of $23 million and the historical cost of the Company’s net liabilities assumed of $6 million was recorded as an adjustment to CEG’s contributed capital balance. In addition, the Company reflected the entire $23 million of the Company’s purchase price, which was utilizedcontributed back to acquirethe Company by CEG to pay down the acquired long-term debt, in the line item distributions to CEG, net of contributions in the consolidated statements of members’ equity.
The following is a summary of assets and liabilities transferred in connection with the acquisition as of December 28, 2023:
| | | | | | | | |
| (In millions) | | Texas Solar Nova 1 |
| Cash | | $ | 3 | |
| Property, plant and equipment | | 362 | |
| Right-of-use assets, net | | 21 | |
| Derivative assets | | 4 | |
| Other non-current assets | | 6 | |
| | |
| Total assets acquired | | 396 | |
| | |
Long-term debt (a) | | 349 | |
| Long-term lease liabilities | | 19 | |
| Other current and non-current liabilities | | 34 | |
| Total liabilities assumed | | 402 | |
| Net liabilities assumed | | $ | (6) | |
(a) Includes a $90 million construction loan, $109 million sponsor equity bridge loan and $151 million tax equity bridge loan, offset by $1 million in unamortized debt issuance costs. See Note 10, Long-term Debt, for further discussion of the long-term debt assumed in the acquisition.
Rosamond Central BESS Drop Down — On December 1, 2023, the Rosamond Central solar project acquired a 147 MW BESS project that is co-located at the Rosamond Central solar facility from Clearway Renew for initial cash consideration of $70 million, $16 million of which was funded by the Company with the remaining $54 million funded through contributions from the cash equity investor in Rosie TargetCo LLC and the tax equity investor in Rosie TE HoldCo LLC. At substantial completion, which is expected to occur in the first half of 2024, the Company estimates it will pay an additional $279 million to Clearway Renew, $61 million of which will be funded by the Company with the remaining $218 million to be funded through contributions from the cash equity and tax equity investors. In order to facilitate and fund the construction of the BESS project, Rosie Class B LLC, the indirect owner of the Rosamond Central solar project, utilizing the proceeds from borrowings received under the refinanced debt facility, issued a loan to Clearway Renew that is included in note receivable — affiliate on the Company’s consolidated balance sheet, as further discussed in Note 10, Long-term Debt,and also made equity contributions to Rosie BESS Devco LLC, or Rosie Central BESS, which is an investment accounted for under the equity method of accounting, as further discussed in Note 5, Investments Accounted for by the Equity Method and Variable Interest Entities. The BESS project has a PPA for capacity with an investment-grade utility that has a 15-year contract duration that commences when the project reaches commercial operations, which is expected to occur in the first half of 2024. The Rosamond Central BESS operations are reflected in the Company’s Renewables segment and the Company’s portion of the initial consideration was funded with existing sources of liquidity. The acquisition was determined to be an asset acquisition and the Company consolidates the Rosamond Central BESS project net assets on a prospective basis in its financial statements. The assets and liabilities transferred to the Company relate to interests under common control and were recorded at historical cost in accordance with ASC 805-50, Business Combinations - Related Issues. The difference between the historical cost of the Company’s net assets acquired of $266 million and the cash paid of $70 million was recorded as an adjustment to CEG’s contributed capital balance.
The following is a summary of assets and liabilities transferred in connection with the acquisition as of December 1, 2023:
| | | | | | | | |
| (In millions) | | Rosamond Central BESS |
Property, plant and equipment (a) | | $ | 275 | |
| | |
| Total assets acquired | | 275 | |
| | |
| Other current and non-current liabilities | | 9 | |
| Total liabilities assumed | | 9 | |
| Net assets acquired | | $ | 266 | |
(a) Includes Construction in progress of $272 million.
Victory Pass and Arica Drop Down — On October 31, 2023, the Company, through its indirect subsidiary, VP-Arica Parent Holdco LLC, acquired the Class A membership interests in VP-Arica TargetCo LLC, a partnership and the indirect owner of Victory Pass, a 200 MW solar project that is paired with 50 MW of energy storage, and Arica, a 263 MW solar project that is paired with 136 MW of energy storage, which are both currently under construction in Riverside, California, from Clearway Renew for initial cash consideration of $46 million. Simultaneously, a cash equity investor acquired the Class B membership interests in VP-Arica TargetCo LLC from Clearway Renew for initial cash consideration of $87 million. At substantial completion, which is expected to occur in the first half of 2024, the Company estimates it will pay an additional $182 million to Clearway Renew and the cash equity investor will contribute an additional $347 million. VP-Arica TargetCo LLC consolidates as primary beneficiary, VP-Arica TE Holdco LLC, a tax equity fund that owns the Victory Pass and Arica solar projects, as further described in Note 5, Investments Accounted for by the Equity Method and Variable Interest Entities.Victory Pass and Arica each have PPAs with investment-grade counterparties that have a 15-year and 14-year weighted average contract duration, respectively, that commence when the underlying operating assets reach commercial operations, which is expected to occur in the first half of 2024. The Victory Pass and Arica operations are reflected in the Company’s Renewables segment and the acquisition was funded with existing sources of liquidity. The acquisition was determined to be an asset acquisition and the Company consolidates Victory Pass and Arica on a prospective basis in its financial statements. The assets and liabilities transferred to the Company relate to interests under common control and were recorded at historical cost in accordance with ASC 805-50, Business Combinations - Related Issues. The sum of the cash paid of $46 million and the historical cost of the Company’s net liabilities assumed of $1 million was recorded as an adjustment to CEG’s contributed capital balance. In addition, the Company reflected the entire $46 million of the Company’s purchase price, which was contributed back to the Company by CEG to pay down the acquired long-term debt, in the line item distributions to CEG, net of contributions in the consolidated statements of members’ equity.
The following is a summary of assets and liabilities transferred in connection with the acquisition as of October 31, 2023:
| | | | | | | | |
| (In millions) | | Victory Pass and Arica |
| Cash | | $ | 1 | |
Property, plant and equipment (a) | | 937 | |
| Right-of-use assets, net | | 4 | |
| Derivative assets | | 1 | |
| Other non-current assets | | 6 | |
| | |
| Total assets acquired | | 949 | |
| | |
Long-term debt (b) | | 864 | |
| Long-term lease liabilities | | 4 | |
| Other current and non-current liabilities | | 82 | |
| Total liabilities assumed | | 950 | |
| Net liabilities assumed | | $ | (1) | |
(a) Includes Construction in progress of $893 million.
(b) Includes a $483 million sponsor equity bridge loan and $385 million tax equity bridge loan, offset by $4 million in unamortized debt issuance costs. See Note 10, Long-term Debt, for further discussion of the long-term debt assumed in the acquisition.
Daggett 2 Drop Down — On August 30, 2023, the Company, through its indirect subsidiary, Daggett Solar Investment LLC, acquired the Class A membership interests in Daggett 2 TargetCo LLC, a partnership and the indirect owner of Daggett 2, a 182 MW solar project that is paired with 131 MW of energy storage and is located in San Bernardino, California, from CEG for cash consideration of $13 million. Daggett 2 TargetCo LLC consolidates as primary beneficiary, Daggett 2 TE Holdco LLC, a tax equity fund that owns the Daggett 2 solar project, as further described in Note 5, Investments Accounted for by the Equity Method and Variable Interest Entities. Daggett 2 has PPAs with investment-grade counterparties that have a 15-year weighted average contract duration that commenced in December 2023. The Daggett 2 operations are reflected in the Company’s Renewables segment and the acquisition was funded with existing sources of liquidity. The acquisition was determined to be an asset acquisition and the Company consolidates Daggett 2 on a prospective basis in its financial statements. The assets, liabilities and noncontrolling interests transferred to the Company relate to interests under common control and were recorded at historical cost in accordance with ASC 805-50, Business Combinations - Related Issues. The sum of the historical cost of the Company’s acquired interests of $29 million and the cash paid of $13 million was recorded as an adjustment to CEG’s contributed capital balance.
The following is a summary of assets and liabilities transferred in connection with the acquisition as of August 30, 2023:
| | | | | | | | |
| (In millions) | | Daggett 2 |
| Cash | | $ | 1 | |
Restricted cash (a) | | 119 | |
| Property, plant and equipment | | 379 | |
| Right-of-use assets, net | | 22 | |
| Derivative assets | | 22 | |
| | |
| Total assets acquired | | 543 | |
| | |
Long-term debt (b) | | 308 | |
| Long-term lease liabilities | | 23 | |
| Other current and non-current liabilities | | 28 | |
| Total liabilities assumed | | 359 | |
| Noncontrolling interests | | 213 | |
| Net assets acquired less noncontrolling interests | | $ | (29) | |
(a) Includes funds that were contributed by the cash equity investor and tax equity investor, which were primarily used to pay off the tax equity bridge loan when the project reached substantial completion on December 22, 2023, as further discussed in Note 10, Long-term Debt.
(b) Includes a $107 million construction loan and $204 million tax equity bridge loan, offset by $3 million in unamortized debt issuance costs. See Note 10, Long-term Debt,for further discussion of the long-term debt assumed in the acquisition.
Daggett 3 Drop Down — On February 17, 2023, the Company, through its indirect subsidiary, Daggett Solar Investment LLC, acquired the Class A membership interests in Daggett TargetCo LLC, the indirect owner of Daggett 3, a 300 MW solar project that is paired with 149 MW of energy storage and located in San Bernardino, California, from Clearway Renew for cash consideration of $21 million. Simultaneously, a cash equity investor acquired the Class B membership interests in Daggett TargetCo LLC from Clearway Renew for cash consideration of $129 million. The Company and the cash equity investor then contributed their Class A and B membership interests, respectively, into Daggett Renewable Holdco LLC, a partnership that consolidates Daggett TargetCo LLC. Daggett TargetCo LLC consolidates as the direct owner of the primary beneficiary, Daggett TE Holdco LLC, a tax equity fund Daggett TE Holdco LLC, which holdsthat owns the Daggett 3 solar project.project, as further described in Note 5, Investments Accounted for by the Equity Method and Variable Interest Entities. Daggett 3 has PPAs with investment-grade counterparties that have a 15-year weighted average contract duration that will commence when the project reaches commercialcommenced between July 2023 and November 2023. The Daggett 3 operations which is expected to occurare reflected in the first half of 2023. TheCompany’s Renewables segment and the acquisition was funded with existing sources of liquidity. The acquisition was determined to be an asset acquisition and the Company consolidates Daggett 3 on a prospective basis in its financial statements. The assets and liabilities transferred to the Company relate to interests under common control and were recorded at historical cost in accordance with ASC 805-50,
The following is a summary of assets and liabilities transferred in connection with the acquisition as of February 17, 2023:
| | | | | | | | |
| (In millions) | | Daggett 3 |
| Restricted cash | | $ | 4 | |
| Property, plant and equipment | | 534 | |
| Right-of-use assets, net | | 31 | |
| Derivative assets | | 27 | |
| | |
| Total assets acquired | | 596 | |
| | |
Long-term debt (a) | | 480 | |
| Long-term lease liabilities | | 33 | |
Other current and non-current liabilities (b) | | 68 | |
| Total liabilities assumed | | 581 | |
| Net assets acquired | | $ | 15 | |
(a) Includes a $181 million construction loan, $75 million sponsor equity bridge loan and $229 million tax equity bridge loan, offset by $5 million in unamortized debt issuance costs. See Note 10, Long-term Debt, for further discussion of the long-term debt assumed in the acquisition.
(b) Includes $32 million of project costs that were subsequently funded by CEG. Subsequent to the acquisition date, CEG funded an additional $22 million in project costs. The combined $54 million funded by CEG was repaid to CEG in October 2023.
Waiawa Drop Down — On October 3, 2022, the Company, through its indirect subsidiary, Lighthouse Renewable Holdco LLC, acquired Waiawa BL Borrower Holdco LLC, the indirect owner of the Waiawa solar project, a 36 MW solar project that is paired with matching36 MW of energy storage capacityand located in Honolulu, Hawaii, from Clearway Renew LLC for cash consideration of $20 million. Lighthouse Renewable Holdco LLC is a partnership between the Company and a third-partycash equity investor. The third-partycash equity investor also contributed cash consideration of $12 million, which was utilized to acquire their portion of the acquired entity. At the time of the acquisition, Waiawa BL Borrower Holdco LLC consolidates,consolidated as the direct owner of the primary beneficiary, Waiawa TE Holdco LLC, a tax equity fund Waiawa TE Holdco LLC, which directly holdsthat held the Waiawa solar project, as further described in Note 5, Investments Accounted for by the Equity Method and Variable Interest Entities.project. Waiawa has a 20-year PPA with an investment-grade utility that commenced in January 2023. The Waiawa solar project is reflected in the Company’s Renewables segment and the acquisition was funded with existing sources of liquidity. The acquisition was determined to be an asset acquisition and the Company consolidates Waiawa on a prospective basis in its financial statements. The assets and liabilities transferred to the Company relate to interests under common control and were recorded at historical cost in accordance with ASC 805-50, Business Combinations - Related Issues. The sum of the cash paid of $20 million and the historical cost of the Company’s net liabilities assumed of $1 million was recorded as an adjustment to CEG’s contributed capital balance. In addition, the Company reflected $16 million of the Company’s purchase price, which was contributed back to the Company by CEG to pay down the acquired long-term debt, in the line item distributions to CEG, net of contributions, in the consolidated statement of members’ equity.
The following is a summary of assets and liabilities transferred in connection with the acquisition as of October 3, 2022:
| | | | | | | | |
| (In millions) | | Waiawa |
| Other current and non-current assets | | $ | 7 | |
| Property, plant and equipment | | 118 | |
| | |
| Total assets acquired | | 125 | |
| | |
Long-term debt (a) | | 102 | |
| | |
| Other current and non-current liabilities | | 24 | |
| Total liabilities assumed | | 126 | |
| Net liabilities assumed | | $ | (1) | |
| | |
| | |
(a)Includes a $22 million construction loan, $26 million sponsor equity bridge loan and $55 million tax equity bridge loan, offset by $1 million in unamortized debt issuance costs. The sponsor equity bridge loan was repaid at acquisition date, along with $2 million in associated fees, utilizing $12 million from the cash equity investor, as well as $16 millionSee Note 10, Long-term Debt, for further discussion of the Company's purchase price, which was contributed back to the Company by CEG. Also at acquisition date, the tax equity investor contributed $17 million into escrow, which is included in restricted cash on the Company's consolidated balance sheet at December 31, 2022. The tax equity investor will contribute an additional $41 million when the project reaches substantial completion, which will be utilized, along with the $17 million in escrow, to repay the $55 million tax equity bridge loan. The project is expected to reach substantial completionlong-term debt assumed in the first half of 2023.acquisition.
Capistrano Wind Portfolio Acquisition — On August 22, 2022, the Company, through its wholly-owned indirect subsidiary, Capistrano Portfolio Holdco LLC, acquired the Capistrano Wind Portfolio from Capistrano Wind Partners LLC, an indirect subsidiary of CEG, for a base purchase price of approximately $255 million, less working capital adjustments in the net amount of approximately $16 million, representing total net consideration of approximately $239 million. Concurrent with the acquisition, the Company also entered into a development agreement with Clearway Renew, LLC, whereby Clearway Renew LLC paid $10 million to the Company at acquisition date for an exclusive right to develop, construct and repower the projects in the Capistrano Wind Portfolio, which was utilized to partially fund the acquisition of the Capistrano Wind Portfolio. The Capistrano Wind Portfolio consists of five wind projects located in Texas, Nebraska and Wyoming with a combined capacity of 413 MW that reached commercial operations between 2008 and 2012. The assets within the portfolio sell power under PPAs with investment-grade counterparties that have a weighted average remaining contract duration of approximately 98 years. The Capistrano Wind Portfolio operations are reflected in the Company’s Renewables segment and the acquisition was funded with existing sources of liquidity. The acquisition was determined to be an asset acquisition and the Company consolidates the Capistrano Wind Portfolio on a prospective basis in its financial statements. The assets and liabilities transferred to the Company relate to interests under common control and were transferred at historical cost in accordance with ASC 805-50, Business Combinations - Related Issues, which reflects GIP’s basis. The difference between the historical cost of the Company’s net assets acquired of $250 million, less the sum of the cash paid of $239 million and the $4 million in accumulated other comprehensive income transferred to the Company, was recorded as an adjustment to CEG’s contributed capital balance.
The following is a summary of assets and liabilities transferred in connection with the acquisition as of August 22, 2022:
| | | | | | | | |
| (In millions) | | Capistrano Wind Portfolio |
Other current and non-current assets (a) | | $ | 39 | |
| Property, plant and equipment, net | | 147 | |
| Intangible assets for power purchase agreements | | 237 | |
Right-of-use-assets,Right-of-use assets, net | | 27 | |
| | |
| Total assets acquired | | 450 | |
| | |
| Long-term debt | | 162 | |
| Long-term lease liabilities | | 28 | |
| Other current and non-current liabilities | | 10 | |
| | |
| Total liabilities assumed | | 200 | |
| | |
| Net assets acquired | | $ | 250 | |
(a) Includes cash of $12 million and restricted cash of $4 million.
Mililani I Drop Down — On March 25, 2022, the Company, through its indirect subsidiary, Lighthouse Renewable Holdco LLC, acquired Mililani BL Borrower Holdco LLC, the indirect owner of the Mililani I solar project, a 39 MW solar project that is paired with matching39 MW of energy storage capacityand located in Honolulu, Hawaii, from Clearway Renew LLC for cash consideration of $22 million. The cash equity investor in Lighthouse Renewable Holdco LLC is a partnership between the Company and a third-party investor. The third-party investor also contributed cash consideration of $14 million utilized to acquire their portion of the acquired entity. Mililani BL Borrower Holdco LLC consolidates as the direct owner of the primary beneficiary, Mililani TE Holdco LLC, a tax equity fund Mililani TE Holdco LLC, which directly holdsthat owns the Mililani I solar project, as further described in Note 5, Investments Accounted for by the Equity Method and Variable Interest Entities.project. Mililani I has a 20-year PPA with an investment-grade utility that commenced in July 2022. The Mililani I operations are reflected in the Company’s Renewables segment and the acquisition was funded with existing sources of liquidity. The acquisition was determined to be an asset acquisition and the Company consolidates Mililani I on a prospective basis in its financial statements. The assets and liabilities transferred to the Company relate to interests under common control and were recorded at historical cost in accordance with ASC 805-50, Business Combinations - Related Issues. The sum of the cash paid of $22 million and the historical cost of the Company’s net liabilities assumed of $8 million was recorded as an adjustment to CEG’s contributed capital balance. In addition, the Company reflected $15 million of the Company’s purchase price, which was contributed back to the Company by CEG to pay down the acquired long-term debt, in the line item distributions to CEG, net of contributions, in the consolidated statement of members’ equity.
The following is a summary of assets and liabilities transferred in connection with the acquisition as of March 25, 2022:
| | | | | | | | |
| (In millions) | | Mililani I |
| Other current and non-current assets | | $ | 2 | |
| Property, plant and equipment | | 118 | |
Right-of-use-assetsRight-of-use assets | | 19 | |
| | |
| Total assets acquired | | 139 | |
| | |
Long-term debt (a) | | 100 | |
| Long-term lease liabilities | | 20 | |
| Other current and non-current liabilities | | 27 | |
| | |
| Total liabilities assumed | | 147 | |
| | |
| Net liabilities assumed | | $ | (8) | |
(a)Includes a $16 million construction loan, $27 million sponsor equity bridge loan and $60 million tax equity bridge loan, offset by $3 million in unamortized debt issuance costs. The sponsor equity bridge loan was repaid at acquisition date, along with $2 million in associated fees, utilizing $14 million from the cash equity investor, as well as $15 million of the Company’s purchase price, which was contributed back to the Company by CEG. Also at acquisition date, the tax equity investor contributed $18 million into escrow, which was included in restricted cash on the Company’s consolidated balance sheet. On December 7, 2022, when the project reached substantial completion, the tax equity investor contributed an additional $42 million and CEG contributed an additional $11 million, which was utilized, along with the $18 million in escrow, to repay the $60 million tax equity bridge loan, to fund $7 million in construction completion reserves and to pay $4 million in associated fees.
Black Rock Drop Down — On December 29, 2021, the Company, through its indirect subsidiary Lighthouse Renewable Holding Sub LLC, acquired the Class B membership interests in Black Rock Wind Holding LLC from Clearway Renew LLC for $60 million in cash consideration, $37 million of which was paid on December 29, 2021 with the remaining $23 million paid in February 2022 after all remaining turbines were operational. Lighthouse Renewable Holding Sub LLC is a wholly-owned subsidiary of Lighthouse Renewable Holdco LLC, which is a partnership between the Company and a third-party investor. The third-party investor also contributed cash consideration utilized to acquire their portion of the Class B membership interests. The Class A membership interests in Black Rock Wind Holding LLC were acquired by another third-party investor in 2020, which sold their interest back to the Company on March 31, 2022. Black Rock Wind Holding LLC, through its wholly-owned subsidiary, Black Rock Class B Holdco LLC, is the primary beneficiary and consolidates its interests in a tax equity fund, Black Rock TE Holdco LLC, that holds the Black Rock wind project, a 115 MW utility scale wind project located in Mineral County and Grant County, West Virginia, which achieved commercial operations in December 2021, as further described in Note 5, Investments Accounted for by the Equity Method and Variable Interest Entities. A majority of the project’s output is backed by contracts with investment-grade counterparties with a 15-year weighted average contract life. The Black Rock operations are reflected in the Company’s Renewables segment and the acquisition was funded with existing sources of liquidity. The acquisition was determined to be an asset acquisition and not a business combination, therefore the Company consolidated the financial information for Black Rock on a prospective basis. The assets and liabilities transferred to the Company relate to interests under common control and were recorded at historical cost in accordance with ASC 805-50, Business Combinations - Related Issues. The difference between the cash paid of $60 million and the historical cost of the Company’s acquired interests of $19 million was recorded as an adjustment to CEG’s contributed capital balance. In addition, the Company reflected additional contributions paid by CEG and the portion of the Company’s purchase price utilized to repay long-term debt, totaling $133 million, as contributions from CEG in the statement of members’ equity, and as an impact of the Black Rock Drop Down in noncontrolling interest.
The following is a summary of assets and liabilities transferred in connection with the acquisition as of December 29, 2021:
| | | | | | | | |
(In millions) | | Black Rock |
Current assets (a)
| | $ | 36 | |
Property, plant and equipment | | 178 | |
Right-of-use-assets | | 7 | |
Other non-current assets | | 2 | |
Total assets acquired | | 223 | |
| | |
| | |
Long-term debt (b)
| | 186 | |
Long-term lease liabilities | | 7 | |
Other current and non-current liabilities | | 11 | |
| | |
Total liabilities assumed (c)
| | 204 | |
| | |
Net assets acquired | | $ | 19 | |
(a) Includes $35 million reserved for project completion costs included in restricted cash on the Company’s balance sheet at acquisition date, which is included within the $133 million contributed by CEG described above.
(b)Repaid at acquisition date utilizing $56 million contributed by the tax equity investor, $36 million from the cash equity investor and $61 million contributed by CEG, all recorded as contributions in noncontrolling interest, as well as $37 million of the Company’s acquisition price. Of the $190 million contributed, $186 million was utilized to pay down the acquired debt and $4 million was utilized to pay associated fees. The $61 million contributed by CEG and the Company’s initial acquisition price of $37 million are also included within the $133 million contributed by CEG described above.
(c) Total liabilities assumed excludes amounts due to CEG as of the acquisition date for the remaining turbines that became operational in January 2022. The liabilities totaled $83 million, of which $59 million was received from the tax equity and cash equity investors and was held in escrow accounts as of the acquisition date.
Mesquite Sky Drop Down — On December 17, 2021, the Company, through its indirect subsidiary Lighthouse Renewable Holdco 2 LLC, acquired the Class B membership interests of Mesquite Sky Holding LLC from Clearway Renew LLC for $61 million in cash consideration. Lighthouse Renewable Holdco 2 LLC is a partnership between the Company and a third-party investor. The third-party investor also contributed cash consideration utilized to acquire their portion of the Class B membership interests. The Class A membership interests of Mesquite Sky Holding LLC were acquired by another third-party investor in 2020, which sold their interest back to the Company on March 18, 2022. Mesquite Sky Holding LLC, through its wholly-owned subsidiary, Mesquite Sky Class B Holdco LLC, is the primary beneficiary and consolidates its interests in a tax equity fund, Mesquite Sky TE Holdco LLC, that holds the Mesquite Sky wind project, a 340 MW utility scale wind project located in Callahan County, Texas, which achieved commercial operations in December 2021, as further described in Note 5, Investments Accounted for by the Equity Method and Variable Interest Entities. A majority of the project’s output is backed by contracts with investment-grade counterparties with a 12-year weighted average contract life. The Mesquite Sky operations are reflected in the Company’s Renewables segment and the acquisition was funded with existing sources of liquidity. The acquisition was determined to be an asset acquisition and not a business combination, therefore the Company consolidated the financial information for Mesquite Sky on a prospective basis. The assets and liabilities transferred to the Company relate to interests under common control and were recorded at historical cost in accordance with ASC 805-50, Business Combinations - Related Issues. The sum of the cash paid of $61 million and the historical cost of the Company’s net liabilities assumed of $7 million was recorded as an adjustment to CEG’s contributed capital balance. The difference between cash paid, interests acquired, and the balance in equity is capital reserved for project completion. In addition, the Company reflected additional contributions paid by CEG and the portion of the Company’s purchase price utilized to repay long-term debt, totaling $52 million, as contributions from CEG in the statement of members’ equity, and as an impact of the Mesquite Sky drop down in noncontrolling interest.
The following is a summary of assets and liabilities transferred in connection with the acquisition as of December 17, 2021:
| | | | | | | | |
(In millions) | | Mesquite Sky |
Current assets (a)
| | $ | 46 | |
Property, plant and equipment | | 377 | |
Right-of use assets | | 45 | |
Other non-current assets | | 7 | |
| | |
| | |
Total assets acquired | | 475 | |
| | |
Long-term debt (b)
| | 355 | |
Long-term lease liabilities | | 45 | |
Derivative liabilities | | 43 | |
Other current and non-current liabilities | | 39 | |
Total liabilities assumed (c)
| | 482 | |
Net liabilities assumed | | $ | (7) | |
(a)Includes $44 million reserved for project completion costs included in restricted cash on the Company’s balance sheet at acquisition date, which is included within the $52 million contributed by CEG described above.
(b)Repaid at acquisition date utilizing $241 million contributed by the tax equity investor and $107 million contributed by the cash equity investor, both recorded as contributions in noncontrolling interest, as well as the Company’s $61 million acquisition price. Of the $409 million contributed, $355 million was utilized to pay down the acquired debt and $1 million was utilized to pay associated fees. The remaining $53 million was distributed to CEG for the acquisition. The net of the Company’s $61 million acquisition price and the distribution to CEG of $53 million are included within the $52 million contributed by CEG described above.
(c) Total liabilities assumed excludes amounts due to CEG as of the acquisition date of $6 million, of which $5 million was received from the tax equity and cash equity investors and was held in escrow accounts as of the acquisition date.
Utah Solar Portfolio Acquisition — On December 1, 2021, the Company acquired the remaining 50% equity interest in the Utah Solar Portfolio from Dominion Solar Projects III, Inc., for approximately $335 million before working capital and purchase price adjustments in the net amount of $5 million, representing total net consideration of $330 million. The Utah Solar Portfolio consists of seven utility-scale solar farms located in Utah, representing 530 MW of capacity. The assets within the portfolio sell power subject to 20-year PPAs with PacifiCorp that have approximately 15 years remaining under the agreements. Following the close of the transaction, the Company owns 100% of the membership interests in the Utah Solar Portfolio and consolidates the Utah Solar Portfolio. The Utah Solar Portfolio operations are included in the Company’s Renewables segment. The acquisition was determined to be an asset acquisition and the cash consideration of $330 million, net of restricted cash acquired of $8 million, represented a net cash outflow of $322 million, which was allocated to the fair value of the assets acquired and liabilities assumed on the acquisition date. The acquisition was funded with the borrowings under the Bridge Loan Agreement, as described inSee Note 10, Long-term Debt.
The following is a summary of assets and liabilities transferred in connection with the acquisition as of December 1, 2021:
| | | | | | | | |
(In millions) | | Utah Solar Portfolio |
Current assets | | $ | 20 | |
Property, plant and equipment | | 258 | |
Intangible assets for power purchase agreement | | 302 | |
Other intangible assets | | 4 | |
Right-of use assets | | 163 | |
Total assets acquired | | 747 | |
| | |
Long-term lease liabilities | | 163 | |
Other current and non-current liabilities | | 24 | |
| | |
| | |
| | |
Total liabilities assumed | | 187 | |
Equity method investment removed | | (230) | |
Net assets acquired | | $ | 330 | |
Mt. Storm Wind Acquisition — Debt,On April 23, 2021, the Company acquired 100% for further discussion of the equity interests in NedPower Mount Storm LLC, or Mt. Storm, from Castleton Commodities International for approximately $96 million before working capital and purchase price adjustmentslong-term debt assumed in the net amount of $4 million, representing a total net consideration of $100 million. Mt. Storm is a 264 MW wind project located in Grant County, West Virginia. Mt. Storm has a 10-year energy hedge with an investment-grade counterparty. The acquisition was determined to be an asset acquisition and the purchase price was allocated to the fair value of the assets acquired and liabilities assumed on the acquisition date as follows:acquisition.
| | | | | | | | |
(In millions) | | Mt. Storm |
| | |
Current assets | | $ | 3 | |
Property, plant and equipment | | 108 | |
Other non-current assets | | 2 | |
| | |
| | |
Total assets acquired | | 113 | |
| | |
Derivative instruments | | 9 | |
Other current and non-current liabilities | | 4 | |
| | |
Total liabilities assumed | | 13 | |
| | |
Net assets acquired | | $ | 100 | |
Agua Caliente Acquisition — On February 3, 2021, the Company acquired an additional 35% equity interest in the Agua Caliente solar project from NRG for $202 million. Agua Caliente is a 290 MW solar project located in Dateland, Arizona in which Clearway previously owned a 16% equity interest. The project has a 25-year PPA with PG&E, with approximately 17 years remaining under the agreement. Following the close of the transaction, the Company owns a 51% equity interest in Agua Caliente. The Agua Caliente operations are included in the Company’s Renewables segment. The acquisition was determined to be an asset acquisition and the cash consideration of $202 million, net of restricted cash acquired of $91 million, represented a net cash outflow of $111 million, which was allocated to the fair value of the assets acquired and liabilities assumed on the acquisition date. A third-party investor holds the remaining 49% equity interest in Agua Caliente, which is reflected in noncontrolling interest at fair value at the acquisition date.
The following is a summary of assets and liabilities obtained in connection with the acquisition as of February 3, 2021:
| | | | | | | | |
(In millions) | | Agua Caliente |
Restricted cash | | $ | 91 | |
Property, plant and equipment | | 154 | |
Intangible asset for power purchase agreement | | 1,022 | |
| | |
Other current assets | | 9 | |
Total assets acquired | | 1,276 | |
| | |
Long-term debt | | 716 | |
Other current and non-current liabilities | | 5 | |
| | |
Total liabilities assumed | | 721 | |
Noncontrolling interest | | 273 | |
Equity method investment removed | | (80) | |
Net assets acquired less noncontrolling interest | | $ | 202 | |
Rattlesnake Drop Down — On January 12, 2021, the Company acquired CEG’s equity interest and a third-party investor’s minority interest in CWSP Rattlesnake Holding, LLC for $132 million in cash consideration. CWSP Rattlesnake Holding LLC indirectly consolidates the Rattlesnake wind project, a 160 MW wind facility with 144 MW of deliverable capacity in Adams County, Washington, as further described in Note 5, Investments Accounted for by the Equity Method and Variable Interest Entities. The project has a 20-year PPA with Avista Corporation, which began when the facility reached commercial operations in December 2020. The Rattlesnake operations are included in the Company’s Renewables segment. The acquisition was determined to be an asset acquisition and not a business combination, therefore, the Company consolidated the financial information for Rattlesnake on a prospective basis. The assets and liabilities transferred to the Company relate to interests under common control and were recorded at historical cost in accordance with ASC 805-50, Business Combinations - Related Issues. The difference between the cash paid of $132 million and the historical cost of the Company’s acquired interests of $14 million was recorded as an adjustment to CEG’s contributed capital balance.
The following is a summary of assets and liabilities transferred in connection with the acquisition as of January 12, 2021:
| | | | | | | | |
(In millions) | | Rattlesnake |
Current assets | | $ | 8 | |
Property, plant and equipment | | 200 | |
Right-of-use assets | | 12 | |
Total assets acquired | | 220 | |
| | |
Long-term debt (a)
| | 176 | |
Long-term lease liabilities | | 12 | |
Other current and non-current liabilities | | 18 | |
Total liabilities assumed | | 206 | |
| | |
Net assets acquired | | $ | 14 | |
(a) Repaid at acquisition date utilizing $107 million contributed by tax equity investor and $103 million contributed by CEG, both recorded as contributions in noncontrolling interest. Of the $210 million contributed, $176 million was utilized to pay down the acquired debt, $29 million was utilized to fund project reserve accounts and $5 million was utilized to pay associated fees.
Dispositions
Kawailoa Sale — On August 1, 2022, the Company sold 100% of its Class A membership interests in the Kawailoa Partnership to Clearway Renew LLC for cash proceeds of $9 million, which equals the Company’s initial investment. The Kawailoa Partnership is a partnership that consolidates, through its 51% controlling majority interest, a lower-level partnership that is 49% owned by a third-partycash equity investor, and which consolidates the Kawailoa solar project through its ownership of a controlling interest in the tax equity fund that holds the project, as further described in Note 5, Investments Accounted for by the Equity Method and Variable Interest Entities.project. The assets and liabilities transferred to Clearway Renew LLC relate to interests under common control and were transferred at historical cost in accordance with ASC 805-50, Business Combinations - Related Issues. This resulted in the Company removing $69 million from members’ equity, inclusive of the noncontrolling interest related to the Kawailoa Partnership at the time of sale. Noncontrolling interests prior to the sale include the interests of the third-partycash equity investor, tax equity investor and Clearway Renew LLC.Renew.
Thermal Disposition — On May 1, 2022, the Company completed the sale of 100% of its interests in the Thermal Business to KKR for net proceeds of approximately $1.46 billion, inclusive of working capital adjustments, which excludes approximately $18 million in transaction expenses that were incurred in connection with the disposition. The Thermal Disposition resulted in a gain on sale of business of approximately $1.29 billion, which is net of the $18 million in transaction expenses referenced above. The proceeds from the sale were utilized to repay certain borrowings outstanding as further described in Note 10, Long-term Debt, with the remaining proceeds invested in short-term investments classified as cash and cash equivalents on the Company’s consolidated balance sheet as of September 30, 2022. Effective with the approval by the Board of Directors and signing of the agreement to sell the Thermal Business on October 22, 2021, the Company concluded that all entities that are included within the Thermal Business would be treated as held for sale on a prospective basis, thus the assets and liabilities were reported as separate held for sale line items on the Company’s consolidated balance sheet as of December 31, 2021. As of December 31, 2021, property, plant and equipment represented 78% and intangible assets represented 9% of assets classified as held for sale while long-term debt represented 85% of liabilities classified as held for sale.sheet. The Company’s Thermal segment iswas comprised solely of the Thermal Business'sBusiness’s results of operations.
Note 4 — Property, Plant and Equipment
The Company’s major classes of property, plant, and equipment were as follows:
| | December 31, 2022 | | December 31, 2021 | | Depreciable Lives |
| (In millions) | | |
| December 31, 2023 | | | December 31, 2023 | | December 31, 2022 | | Depreciable Lives |
| (In millions) | |
| Facilities and equipment | |
| Facilities and equipment | |
| Facilities and equipment | Facilities and equipment | $ | 9,992 | | | $ | 9,747 | | | 3 - 40 Years | $ | 11,426 | | | $ | | $ | 9,992 | | | 3 - 41 Years | | 3 - 41 Years |
| Land and improvements | Land and improvements | 293 | | | 320 | | |
Construction in progress (a) | 160 | | | 84 | | |
Construction in progress (a) (b) | |
Construction in progress (a) (b) | |
Construction in progress (a) (b) | |
| Total property, plant and equipment | |
| Total property, plant and equipment | |
| Total property, plant and equipment | Total property, plant and equipment | 10,445 | | | 10,151 | | |
| Accumulated depreciation | Accumulated depreciation | (3,024) | | | (2,501) | | |
| Accumulated depreciation | |
| Accumulated depreciation | |
| Net property, plant and equipment | Net property, plant and equipment | $ | 7,421 | | | $ | 7,650 | | |
| Net property, plant and equipment | |
| Net property, plant and equipment | |
(a) As of December 31, 20222023 and 2021,2022, construction in progress includes $17$21 million and $15$17 million, respectively, of capital expenditures that relate to prepaid long-term service agreements in the Conventional segment.
(b) As of December 31, 2023 and 2022, construction in progress includes $72 million and $9 million, respectively, of accrued capital expenditures.
Depreciation expense related to property, plant and equipment during the years ended December 31, 2023, 2022 and 2021 and 2020 was $514 million, $502 million and $499 million, and $420 million, respectively. The Company accelerated depreciation of the Pinnacle wind project in connection with the repowering project, which resulted in additional depreciation expense in the amount of $34 million in 2021.
The Company recorded long-lived asset impairments during each of the years ended December 31, 2023, 2022 and December 31, 2021, as further described inNote 9, Asset Impairments.
Note 5 — Investments Accounted for by the Equity Method and Variable Interest Entities
Equity Method Investments
The Company’s maximum exposure to loss as of December 31, 20222023 is limited to its equity investment in the unconsolidated entities, as further summarized in the table below:
| | Name | Name | | Economic Interest | | Investment Balance | Name | | Economic Interest | | Investment Balance |
| | | | (In millions) |
| | | | (In millions) | | | | | | (In millions) |
| Avenal | Avenal | | 50% | | $ | 9 | |
| Desert Sunlight | Desert Sunlight | | 25% | | 235 | |
| Elkhorn Ridge | Elkhorn Ridge | | 66.7% | | 22 | |
GenConn (a) | GenConn (a) | | 50% | | 82 | |
Rosie Central BESS (a) | |
| San Juan Mesa | San Juan Mesa | | 75% | | 16 | |
| $ | 364 | |
| | | | $ | |
(a) GenConn is aand Rosie Central BESS are variable interest entity.entities.
As of December 31, 20222023 and 2021,2022, the Company had $19$17 million and $14$19 million, respectively, of undistributed earnings from its equity method investments.
The Company acquired its interest in Desert Sunlight on June 30, 2015, for $285 million, which resulted in a difference between the purchase price and the basis of the acquired assets and liabilities of $181 million. The difference is attributable to the fair value of the property, plant and equipment and power purchase agreements. The Company is amortizing the related basis differences to equity in earnings of unconsolidated subsidiaries over the related useful life of the underlying assets acquired. As of December 31, 2022,2023, the carrying value of the basis difference is $129$122 million.
The Company’s pro-rata share of non-recourse debt held by unconsolidated affiliates was $325$303 million as of December 31, 2022.2023.
The following tables present summarized financial information for the Company’s equity method investments:
| | Year Ended December 31, |
| 2022 | | 2021 | | 2020 |
| Year Ended December 31, | | | Year Ended December 31, |
| 2023 | | | 2023 | | 2022 | | 2021 |
| Income Statement Data: | Income Statement Data: | (In millions) | Income Statement Data: | (In millions) |
| GenConn | GenConn | |
| Operating revenues | |
| Operating revenues | |
| Operating revenues | Operating revenues | $ | 50 | | | $ | 55 | | | $ | 60 | |
| Operating income | Operating income | 16 | | | 22 | | | 26 | |
| Net income | Net income | 7 | | | 13 | | | 17 | |
| Desert Sunlight | Desert Sunlight | |
| Operating revenues | |
| Operating revenues | |
| Operating revenues | Operating revenues | 203 | | | 205 | | | 209 | |
| Operating income | Operating income | 137 | | | 146 | | | 142 | |
| Net income | Net income | 114 | | | 112 | | | 88 | |
| Other (a) (b) | |
Other (a) | |
| Other (a) | |
| Other (a) | |
| Operating revenues | |
| Operating revenues | |
| Operating revenues | Operating revenues | 52 | | | 49 | | | 299 | |
| Operating income | Operating income | 18 | | | 16 | | | 138 | |
| Net income | Net income | 15 | | | 13 | | | 60 | |
| | As of December 31, |
| 2022 | | 2021 |
| | | As of December 31, | | | | | As of December 31, |
| | | 2023 | | | | | 2023 | | 2022 |
| Balance Sheet Data: | Balance Sheet Data: | | (In millions) | Balance Sheet Data: | | | (In millions) |
| GenConn | GenConn | |
| Current assets | |
| Current assets | |
| Current assets | Current assets | | $ | 39 | | | $ | 38 | |
| Non-current assets | Non-current assets | | 312 | | | 328 | |
| Current liabilities | Current liabilities | | 16 | | | 15 | |
| Non-current liabilities | Non-current liabilities | | 170 | | | 178 | |
| Desert Sunlight | Desert Sunlight | |
| Current assets | |
| Current assets | |
| Current assets | Current assets | | 79 | | | 131 | |
| Non-current assets | Non-current assets | | 1,175 | | | 1,228 | |
| Current liabilities | Current liabilities | | 61 | | | 64 | |
| Non-current liabilities | Non-current liabilities | | 824 | | | 904 | |
| Other (a) | Other (a) | |
| Other (a) | |
| Other (a) | |
| Current assets | |
| Current assets | |
| Current assets | Current assets | | 22 | | | 26 | |
| Non-current assets | Non-current assets | | 157 | | | 172 | |
| Current liabilities | Current liabilities | | 12 | | | 24 | |
| Non-current liabilities | Non-current liabilities | | 91 | | | 98 | |
|
(a) Includes Avenal, Elkhorn Ridge, San Juan Mesa DGPV Holdco 1, DGPV Holdco 2 and DGPV Holdco 3. DGPV Holdco 1, DGPV Holdco 2 and DGPV Holdco 3 were consolidated by the Company during 2020 and are therefore only included in the summarized income statement data for the year ended December 31, 2020.
(b) On February 3, 2021, the Company acquired an additional 35% equity interest in Agua Caliente and removed its equity investment in Agua Caliente and, on December 1, 2021, the Company acquired the remaining 50% equity investment in the Utah Solar Portfolio and removed its equity investment in the Utah Solar Portfolio. As a result, both Agua Caliente and the Utah Solar Portfolio are excluded from the summarized income statement data for the years ended December 31, 2022 and December 31, 2021.Rosie Central BESS.
Variable Interest Entities, or VIEs
Entities that are Consolidated
The Company has a controlling financial interest in certain entities which have been identified as VIEs under ASC 810, Consolidations. These arrangements are primarily related to tax equity arrangements entered into with third parties in order to monetize certain tax credits associated with wind and solar facilities. The Company also has a controlling financial interest in certain partnership arrangements with third-party investors, which also have been identified as VIEs. Under the Company’s arrangements that have been identified as VIEs, the third-party investors are allocated earnings, tax attributes and distributable cash in accordance with the respective limited liability company agreements. Many of these arrangements also provide a mechanism to facilitate achievement of the investor’s specified return by providing incremental cash distributions to the investor at a specified date if the specified return has not yet been achieved.
The following is a summary of significant activity during 20222023 related to the Company’s consolidated VIEs:
Lighthouse Renewable Holdco LLC DGPV Funds — TheOn December 29, 2023, the Company, through its indirect wholly-owned subsidiary, Lighthouse Renewable Class ADGPV 4 LLC, holdsacquired 100% of the Class A membership interests of Lighthouse Renewable Holdcoin DGPV Fund 4 LLC, while a third-partytax equity fund that owns several distributed solar projects, from the tax equity investor holdsin DGPV Fund 4 LLC for $3 million. Prior to the acquisition, the Company consolidated DGPV Fund 4 LLC through its ownership of the Class B membership interests.interests and role as managing member and the Class A membership interests were reflected as redeemable noncontrolling interest on the Company’s consolidated balance sheet. The difference between the historical cost of the Company’s redeemable noncontrolling interest of $20 million and the cash paid of $3 million was recorded as an adjustment to CEG’s contributed capital balance.
Alta TE Holdco — On December 6, 2023, the Company, through its indirect subsidiary, Clearway Energy Operating LLC, acquired 100% of the Class A membership interests in Alta X-XI TE Holdco, LLC, or Alta TE Holdco, a tax equity fund that owns the Alta X and XI wind projects, from the tax equity investor in Alta TE Holdco for $10 million. Prior to the acquisition, the Company consolidated Alta TE Holdco through its ownership of the Class B membership interests and role as managing member, and the Class A membership interests were reflected as noncontrolling interest on the Company’s consolidated balance sheet. The difference between the historical cost of the Company’s noncontrolling interest of $37 million and the cash paid of $10 million was recorded as an adjustment to CEG’s contributed capital balance.
Lighthouse Partnerships
As described in Note 3, Acquisitions and Dispositions, on December 28, 2023, Lighthouse Renewable Holdco 2 LLC, an indirect subsidiary of the Company, acquired TSN1 BL Borrower Holdco LLC. The Company consolidates Lighthouse Renewable Holdco 2 LLC, which isa partnership between the Company and a cash equity investor, as a VIE as the Company is the primary beneficiary, through its role as managing member.
In addition, Lighthouse Renewable Holdco LLC indirectly holds The Company recorded the Class B membership interestsnoncontrolling interest of the cash equity investor in several tax equity funds, including Mesquite Star Tax Equity Holdco LLC, Black Rock TE Holdco LLC, Mililani TE Holdco LLC and Waiawa TE Holdco LLC, as further described below.
As described in Note 3, Acquisitions and Dispositions, on March 25, 2022, Lighthouse Renewable Holdco LLC acquired MililaniTSN1 BL Borrower Holdco LLC at historical carrying amount, with the indirect owner of the Class B membership interests of a tax equity fund, Mililani TE Holdco LLC, that holds the Mililani I solar project. Mililanioffset to additional paid-in capital. TSN1 BL Borrower Holdco LLC consolidates Mililanias primary beneficiary, TSN1 TE Holdco LLC, which is a VIE, as it istax equity fund that owns the primary beneficiary through its role as managing member.Texas Solar Nova 1 solar project. The Class A membership interests in TSN1 TE Holdco LLC are held by a tax equity investor and are reflected as noncontrolling interest on the Company’s consolidated balance sheet. The third-party
On August 30, 2023, the Company and the cash equity investor in Lighthouse Renewable Holdco LLC also acquired and contributed an interest in Mililani BL BorrowerLighthouse Renewable Holdco 2 LLC agreed to transfer Mesquite Star Class B Holdco LLC, the indirect owner of the Mesquite Star wind project, from Lighthouse Renewable Holdco LLC to Lighthouse Renewable Holdco 2 LLC. The Company recordedAs the related noncontrolling interesttransfer was among entities under common control, the transaction was recognized at historical carrying amount, with the offset to contributed capital.cost and no gain or loss was recognized.
VP-Arica TargetCo LLC — As described in Note 3, Acquisitions and Dispositions, on October 3, 2022, Lighthouse Renewable31, 2023, VP-Arica Parent Holdco LLC, an indirect subsidiary of the Company, acquired Waiawa BL Borrower Holdcothe Class A membership interests in VP-Arica TargetCo LLC, which is a partnership. The Company consolidates VP-Arica TargetCo LLC as a VIE as the Company is the primary beneficiary. Through its membership interests in VP-Arica TargetCo LLC, the indirect ownerCompany receives 40% of distributable cash. The Company recorded the noncontrolling interest of the cash equity investor in VP-Arica TargetCo LLC at historical carrying amount, with the offset to additional paid-in capital. VP-Arica TargetCo LLC consolidates as primary beneficiary and through its ownership of the Class B membership interests, ofVP-Arica TE Holdco LLC, a tax equity fund Waiawa TE Holdco LLC, that holdsowns the WaiawaVictory Pass and Arica solar project. Waiawa BL Borrower Holdco LLC consolidates Waiawa TE Holdco LLC, which is a VIE, as it is the primary beneficiary through its role as managing member.projects. The Class A membership interests in VP-Arica TE Holdco LLC are held by a tax equity investor and are reflected as noncontrolling interest on the Company’s consolidated balance sheet. The third-party investor in Lighthouse Renewable Holdco LLC also acquired and contributed an interest in Waiawa BL Borrower Holdco LLC to Lighthouse Renewable Holdco LLC. The Company recorded the related noncontrolling interest at historical carrying amount, with the offset to contributed capital.
Kawailoa Partnership — Daggett Partnerships
As described in Note 3,,Acquisitions and Dispositions,on August 1, 2022,30, 2023, Daggett Solar Investment LLC, an indirect subsidiary of the Company, sold 100% of itsacquired the Class A membership interests in Kawailoa Solar PartnershipDaggett 2 TargetCo LLC, orwhich is a partnership. The Company consolidates Daggett 2 TargetCo LLC as a VIE as the Kawailoa Partnership, to Clearway Renew LLC. Prior toCompany is the sale,primary beneficiary, through its role as managing member. Through its membership interests in Daggett 2 TargetCo LLC, the Kawailoa Partnership owned 51%Company receives 25% of distributable cash. The Company recorded the acquired noncontrolling interest of the Kawailoa solar project, with the remaining 49% owned by a third-party investor. The Kawailoa Partnership consolidated the Kawailoa solar projectcash equity investor in Daggett 2 TargetCo LLC at historical carrying amount. Daggett 2 TargetCo LLC consolidates as primary beneficiary and through its ownership of the Class B membership interests, and role as managing member in Kawailoa Solar HoldingsDaggett 2 TE Holdco LLC, a tax equity fund whichthat owns the KawailoaDaggett 2 solar project. The Class A membership interests in Kawailoa Solar HoldingsDaggett 2 TE Holdco LLC are held by a tax equity investor and wereare reflected as noncontrolling interest on the Company’s consolidated balance sheet. The Company, as
As described in Note 3, Acquisitions and Dispositions, on February 17, 2023, Daggett Solar Investment LLC acquired the Class A member, wasmembership interests in Daggett TargetCo LLC while a cash equity investor acquired the Class B membership interests. The Company and the cash equity investor then contributed their Class A and B membership interests, respectively, into Daggett Renewable Holdco LLC, which is a partnership, and concurrently, Daggett TargetCo LLC became a wholly-owned subsidiary of Daggett Renewable Holdco LLC. Through its membership interests in Daggett Renewable Holdco LLC, the Company receives 25% of distributable cash. The Company consolidates Daggett Renewable Holdco LLC as a VIE as the Company is the primary beneficiary, through its role as managing membermember. The Company recorded the noncontrolling interest of the cash equity investor in Daggett Renewable Holdco LLC at historical carrying amount, with the offset to additional paid-in capital. Daggett TargetCo LLC consolidates as primary beneficiary and through its ownership of the Class B membership interests, Daggett TE Holdco LLC, a tax equity fund that owns the Daggett 3 solar project. The Class A membership interests in Daggett TE Holdco LLC are held by a tax equity investor and are reflected as noncontrolling interest on the Company’s consolidated the Kawailoa Partnership.balance sheet.
Summarized financial information for the Company’s consolidated VIEs consisted of the following as of December 31, 2022:2023:
| | (In millions) | (In millions) | Alta TE Holdco | | Buckthorn Holdings, LLC | | DGPV Funds (a) | | Langford TE Partnership LLC | | Lighthouse Renewable Holdco LLC (b) | | Lighthouse Renewable Holdco 2 LLC (c) | (In millions) | Buckthorn Holdings, LLC | | DGPV Funds (a) | | Langford TE Partnership LLC | | Daggett Partnerships (b) | | Lighthouse Renewable Holdco LLC (c) | | Lighthouse Renewable Holdco 2 LLC (d) |
| Other current and non-current assets | Other current and non-current assets | $ | 51 | | | $ | 2 | | | $ | 75 | | | $ | 13 | | | $ | 134 | | | $ | 49 | |
| Property, plant and equipment | Property, plant and equipment | 306 | | | 194 | | | 493 | | | 123 | | | 828 | | | 358 | |
| Intangible assets | Intangible assets | 200 | | | — | | | 14 | | | 2 | | | — | | | — | |
| Total assets | Total assets | 557 | | | 196 | | | 582 | | | 138 | | | 962 | | | 407 | |
| Current and non-current liabilities | Current and non-current liabilities | 38 | | | 11 | | | 66 | | | 53 | | | 364 | | | 134 | |
| Total liabilities | Total liabilities | 38 | | | 11 | | | 66 | | | 53 | | | 364 | | | 134 | |
| Noncontrolling interest | Noncontrolling interest | 39 | | | 29 | | | 13 | | | 59 | | | 487 | | | 230 | |
| Net assets less noncontrolling interests | $ | 480 | | | $ | 156 | | | $ | 503 | | | $ | 26 | | | $ | 111 | | | $ | 43 | |
| Net assets less noncontrolling interest | |
|
(a) DGPV Funds is comprised of Clearway & EFS Distributed Solar LLC, DGPV Fund 4 LLC, Golden Puma Fund LLC, Renew Solar CS4 Fund LLC and Chestnut Fund LLC, which are all tax equity funds.
(b) Daggett Partnerships includes Daggett 2 TargetCo LLC, which consolidates Daggett 2 TE Holdco LLC, a consolidated VIE, and Daggett Renewable Holdco LLC, which consolidates Daggett TE Holdco LLC, a consolidated VIE.
(c)Lighthouse Renewable Holdco LLC consolidates Mesquite Star Tax Equity Holdco LLC, Black Rock TE Holdco LLC Mililani TE Holdco LLC and WaiawaMililani TE Holdco LLC, which are consolidated VIEs.
(c)(d) Lighthouse Renewable Holdco 2 LLC consolidates Mesquite Sky TE Holdco LLC, Mesquite Star Tax Equity Holdco LLC and TSN1 TE Holdco LLC, which is aare consolidated VIE.VIEs.
| | (In millions) | (In millions) | Oahu Solar LLC | | Pinnacle Repowering TE Holdco | | Rattlesnake TE Holdco LLC | | Rosie TargetCo LLC | | Wildorado TE Holdco | | Other (a) | (In millions) | Oahu Solar LLC | | Rattlesnake TE Holdco LLC | | Rosie TargetCo LLC | | VP-Arica TargetCo LLC (a) | | Wildorado TE Holdco LLC | | Other (b) |
| Other current and non-current assets | Other current and non-current assets | $ | 39 | | | $ | 9 | | | $ | 13 | | | $ | 43 | | | $ | 20 | | | $ | 15 | |
| Property, plant and equipment | Property, plant and equipment | 164 | | | 102 | | | 185 | | | 238 | | | 209 | | | 154 | |
| Intangible assets | Intangible assets | — | | | 16 | | | — | | | — | | | — | | | 1 | |
| Total assets | Total assets | 203 | | | 127 | | | 198 | | | 281 | | | 229 | | | 170 | |
| Current and non-current liabilities | Current and non-current liabilities | 22 | | | 5 | | | 17 | | | 101 | | | 18 | | | 69 | |
| Total liabilities | Total liabilities | 22 | | | 5 | | | 17 | | | 101 | | | 18 | | | 69 | |
| Noncontrolling interest | Noncontrolling interest | 26 | | | 43 | | | 91 | | | 133 | | | 110 | | | 70 | |
| Net assets less noncontrolling interests | $ | 155 | | | $ | 79 | | | $ | 90 | | | $ | 47 | | | $ | 101 | | | $ | 31 | |
| Net assets less noncontrolling interest | |
|
(a) VP-Arica TargetCo LLC consolidates VP-Arica TE Holdco LLC, a consolidated VIE that owns the Victory Pass and Arica solar projects.
(b)Other is comprised of Elbow Creek TE Holdco LLC, Pinnacle Repowering TE Holdco LLC and the Spring Canyon TE Holdco projects.
Note 6 — Fair Value of Financial Instruments
Fair Value Accounting under ASC 820
ASC 820 establishes a fair value hierarchy that prioritizes the inputs to valuation techniques used to measure fair value into three levels as follows:
•Level 1—quoted prices (unadjusted) in active markets for identical assets or liabilities that the Company has the ability to access as of the measurement date.
•Level 2—inputs other than quoted prices included within Level 1 that are directly observable for the asset or liability or indirectly observable through corroboration with observable market data.
•Level 3—unobservable inputs for the asset or liability only used when there is little, if any, market activity for the asset or liability at the measurement date.
In accordance with ASC 820, the Company determines the level in the fair value hierarchy within which each fair value measurement in its entirety falls, based on the lowest level input that is significant to the fair value measurement.
For cash and cash equivalents, restricted cash, accounts receivable — trade, note receivable - affiliate, accounts payable — trade, accounts payable — affiliates and accrued expenses and other current liabilities, the carrying amounts approximates fair value because of the short-term maturity of those instruments and are classified as Level 1 within the fair value hierarchy.
The carrying amounts and estimated fair values of the Company’s recorded financial instruments not carried at fair market value or that do not approximate fair value are as follows:
| | As of December 31, 2022 | | As of December 31, 2021 |
| Carrying Amount | | Fair Value | | Carrying Amount | | Fair Value |
| (In millions) |
| As of December 31, 2023 | | | As of December 31, 2023 | | As of December 31, 2022 |
| Carrying Amount | | | Carrying Amount | | Fair Value | | Carrying Amount | | Fair Value |
| (In millions) | | | (In millions) |
| | Liabilities: | Liabilities: | |
| | Liabilities: | |
| | Liabilities: | |
| Long-term debt, including current portion — affiliate | |
| Long-term debt, including current portion — affiliate | |
| Long-term debt, including current portion — affiliate | Long-term debt, including current portion — affiliate | $ | 2 | | | $ | 2 | | | $ | 1 | | | $ | 1 | |
Long-term debt, including current portion — external (a) | Long-term debt, including current portion — external (a) | 6,874 | | | 6,288 | | | 7,782 | | | 7,997 | |
(a) Excludes net debt issuance costs, which are recorded as a reduction to long-term debt on the Company’s consolidated balance sheets.
The fair value of the Company’s publicly-traded long-term debt is based on quoted market prices and is classified as Level 2 within the fair value hierarchy. The fair value of debt securities, non-publicly traded long-term debt and certain notes receivable of the Company are based on expected future cash flows discounted at market interest rates, or current interest rates for similar instruments with equivalent credit quality and are classified as Level 3 within the fair value hierarchy. The following table presents the level within the fair value hierarchy for long-term debt, including current portion as of December 31, 2022 and 2021:portion:
| | | | | | | | | | | | | | | | | | | | | | | |
| As of December 31, 2022 | | As of December 31, 2021 |
| Level 2 | | Level 3 | | Level 2 | | Level 3 |
| | (In millions) |
| Long-term debt, including current portion | $ | 1,836 | | | $ | 4,454 | | | $ | 2,160 | | | $ | 5,838 | |
| | | | | | | |
| | | | | | | |
| | | | | | | | | | | | | | | | | | | | | | | |
| As of December 31, 2023 | | As of December 31, 2022 |
| Level 2 | | Level 3 | | Level 2 | | Level 3 |
| | (In millions) |
| Long-term debt, including current portion | $ | 1,940 | | | $ | 5,672 | | | $ | 1,836 | | | $ | 4,454 | |
| | | | | | | |
| | | | | | | |
Recurring Fair Value Measurements
The Company records its derivative assets and liabilities at fair market value on its consolidated balance sheets. The following table presents assets and liabilities measured and recorded at fair value on the Company’s consolidated balance sheets on a recurring basis and their level within the fair value hierarchy:
| | As of December 31, 2022 | | As of December 31, 2021 |
| Fair Value | | Fair Value (a) | | Fair Value | | | Fair Value (a) |
| As of December 31, 2023 | |
| As of December 31, 2023 | |
| As of December 31, 2023 | | | As of December 31, 2022 |
| Fair Value | | | Fair Value | | Fair Value (a) | | Fair Value | | | | Fair Value (a) |
| (In millions) | (In millions) | Level 2 (b) | | Level 3 | | Level 2 | | | Level 3 | (In millions) | Level 2 (b) | | Level 3 | | Level 2 | | | | Level 3 |
| Derivative assets | Derivative assets | | | | | | | |
| Energy-related commodity contracts (c) | |
Energy-related commodity contracts (c) | |
Energy-related commodity contracts (c) | |
| Interest rate contracts | Interest rate contracts | $ | 89 | | | $ | — | | | $ | 6 | | | | $ | — | |
Other financial instruments (c) | — | | | 17 | | | — | | | | 25 | |
Other financial instruments (d) | |
| Total assets | Total assets | $ | 89 | | | $ | 17 | | | $ | 6 | | | | $ | 25 | |
| Derivative liabilities | Derivative liabilities | | | | | | | |
| Commodity contracts | $ | — | | | $ | 353 | | | $ | — | | | | $ | 179 | |
Energy-related commodity contracts (e) | |
Energy-related commodity contracts (e) | |
Energy-related commodity contracts (e) | |
| Interest rate contracts | Interest rate contracts | — | | | — | | | 63 | | | | — | |
| Total liabilities | Total liabilities | $ | — | | | $ | 353 | | | $ | 63 | | | | $ | 179 | |
(a) There were no derivative assets classified as Level 1 or Level 3 and no liabilities classified as Level 1 as of December 31, 20222023 and December 31, 2021.2022.
(b) The Company’s interest rate swaps are measured at fair value using an income approach, which use readily observable inputs, such as forward interest rates (e.g., LIBOR and SOFR) and contractual terms to estimate fair value.
(c) Includes long-term backbone transportation service contracts entered into by El Segundo and Walnut Creek during 2023.
(d)Includes SREC contract.
(e) Includes $325 million related to long-term power commodity contracts and $5 million related to short-term heat rate call option contracts entered into by El Segundo, Marsh Landing and Walnut Creek during 2023.
The following table reconciles the beginning and ending balances for instruments that are recognized at fair value in the consolidated financial statements using significant unobservable inputs:
| | | Year ended December 31, |
| | 2022 | | 2021 |
| | | | Year ended December 31, | |
| | | | Year ended December 31, | |
| | | | Year ended December 31, | |
| | | | | | 2023 | | | | | | | | 2023 | | 2022 |
| (In millions) | (In millions) | | | Fair Value Measurement Using Significant Unobservable Inputs (Level 3) | (In millions) | | | | Fair Value Measurement Using Significant Unobservable Inputs (Level 3) |
| Beginning balance | Beginning balance | | | $ | (154) | | | $ | (15) | |
| Settlements | Settlements | | | 61 | | | 60 | |
| Contracts acquired | | | — | | | (52) | |
| | Additions due to loss of NPNS exception | |
| Additions due to loss of NPNS exception | |
| Additions due to loss of NPNS exception | Additions due to loss of NPNS exception | | | (22) | | | — | |
| Total losses for the period included in earnings | Total losses for the period included in earnings | | | (221) | | | (147) | |
| Ending balance | Ending balance | | | $ | (336) | | | $ | (154) | |
| Change in unrealized losses included in earnings for derivatives and other financial instruments held as of December 31, | Change in unrealized losses included in earnings for derivatives and other financial instruments held as of December 31, | | | $ | (221) | | | $ | (147) | |
Derivative and Financial Instruments Fair Value Measurements
The Company’s contracts are non-exchange-traded and valued using prices provided by external sources. The Company uses quoted observable forward prices to value its energyenergy-related commodity contracts, which includes long-term power commodity contracts and heat rate call option contracts. To the extent that observable forward prices are not available, the quoted prices reflect the average of the forward prices from the prior year, adjusted for inflation. As of December 31, 2022,2023, contracts valued with prices provided by models and other valuation techniques make up 100%99% of derivative liabilities and 100% of other financial instruments.
The Company’s significant positions classified as Level 3 include physical and financial energy-related commodity contracts executed in illiquid markets. The significant unobservable inputs used in developing fair value include illiquid power tenors and location pricing, which is derived by extrapolating pricing as a basis to liquid locations. The tenor pricing and basis spread are based on observable market data when available or derived from historic prices and forward market prices from similar observable markets when not available.
The following table quantifies the significant unobservable inputs used in developing the fair value of the Company’s Level 3 positions as of December 31, 2022:2023:
| | December 31, 2022 |
| Fair Value | | Input/Range |
| Assets | Liabilities | Valuation Technique | Significant Unobservable Input | Low | High | Weighted Average |
| (In millions) | |
| Commodity Contracts | $ | — | | $ | (353) | | Discounted Cash Flow | Forward Market Price (per MWh) | $ | 21.25 | | $ | 100.66 | | $ | 41.09 | |
| December 31, 2023 | | | December 31, 2023 |
| Fair Value | | | Fair Value | | Input/Range |
| Assets | | | Assets | Liabilities | Valuation Technique | Significant Unobservable Input | Low | High | Weighted Average |
| (In millions) | |
| Long-term Power Commodity Contracts | |
| Long-term Power Commodity Contracts | |
| Long-term Power Commodity Contracts | |
| Heat Rate Call Option Commodity Contracts | |
| | | Option Model | |
| Other Financial Instruments | Other Financial Instruments | 17 | | — | | Discounted Cash Flow | Forecast annual generation levels of certain DG solar facilities | 58,539 MWh | 117,078 MWh | 112,897 MWh | Other Financial Instruments | 13 | | — | — | | Discounted Cash Flow | Discounted Cash Flow | Forecast annual generation levels of certain DG solar facilities | 60,801 MWh | 121,602 MWh | 115,622 MWh |
The following table provides the impact on the fair value measurements to increases/(decreases) in significant unobservable inputs as of December 31, 2022:2023:
| | | | | | | | | | | | | | |
| Type | Significant Observable Input | Position | Change In Input | Impact on Fair Value Measurement |
Forward Market Price PowerEnergy-Related Commodity Contracts | Buy | Increase/(Decrease) | Higher/(Lower) |
| Forward Market Price Power | Sell | Increase/(Decrease) | Lower/(Higher) |
| Energy-Related Commodity Contracts | Forward Market Price Gas | Sell | Increase/(Decrease) | Higher/(Lower) |
| Other Financial Instruments | Forecast Generation Levels | Sell | Increase/(Decrease) | Higher/(Lower) |
The fair value of each contract is discounted using a risk-free interest rate. In addition, a credit reserve is applied to reflect credit risk, which is, for interest rate swaps, calculated based on credit default swaps using the bilateral method. For commodities, to the extent that the Net Exposure under a specific master agreement is an asset, the Company uses the counterparty’s default swap rate. If the Net Exposure under a specific master agreement is a liability, the Company uses a proxy of its own default swap rate. For interest rate swaps and commodities, the credit reserve is added to the discounted fair value to reflect the exit price that a market participant would be willing to receive to assume the liabilities or that a market participant would be willing to pay for the assets. As of December 31, 2022,2023, the non-performance reserve was a $4015 million gain recorded primarily to total operating revenues in the consolidated statementstatements of income. It is possible that future market prices could vary from those used in recording assets and liabilities and such variations could be material.
Concentration of Credit Risk
In addition to the credit risk discussion as disclosed in Note 2, Summary of Significant Accounting Policies, the following item is a discussion of the concentration of credit risk for the Company’s financial instruments. Credit risk relates to the risk of loss resulting from non-performance or non-payment by counterparties pursuant to the terms of their contractual obligations. The Company monitors and manages credit risk through credit policies that include: (i) an established credit approval process; (ii) monitoring of counterparties’ credit limits on as needed basis; (iii) as applicable, the use of credit mitigation measures such as margin, collateral, prepayment arrangements, or volumetric limits; (iv) the use of payment netting agreements; and (v) the use of master netting agreements that allow for the netting of positive and negative exposures of various contracts associated with a single counterparty. Risks surrounding counterparty performance and credit could ultimately impact the amount and timing of expected cash flows. The Company seeks to mitigate counterparty risk by having a diversified portfolio of counterparties.
Counterparty credit exposure includes credit risk exposure under certain long-term agreements, including solar and other PPAs. As external sources or observable market quotes are not available to estimate such exposure, the Company estimates the exposure related to these contracts based on various techniques including, but not limited to, internal models based on a fundamental analysis of the market and extrapolation of observable market data with similar characteristics. A significant portion of these energy-related commodity contracts are with utilities with strong credit quality and public utility commission or other regulatory support. However, such regulated utility counterparties can be impacted by changes in government regulations or adverse financial conditions, which the Company is unable to predict. Certain subsidiaries of the Company sell the output of their facilities to PG&E, a significant counterparty of the Company, under long-term PPAs, and PG&E’s credit rating is below investment-grade.
Note 7 — Accounting for Derivative Instruments and Hedging Activities
ASC 815 requires the Company to recognize all derivative instruments on the balance sheet as either assets or liabilities and to measure them at fair value each reporting period unless they qualify for a NPNS exception. The Company may elect to designate certain derivatives as cash flow hedges, if certain conditions are met, and defer the change in fair value of the derivatives to accumulated OCI/OCL, until the hedged transactions occur and are recognized in earnings. For derivatives that are not designated as cash flow hedges or do not qualify for hedge accounting treatment, the changes in the fair value will be immediately recognized in earnings. Certain derivative instruments may qualify for the NPNS exception and are therefore exempt from fair value accounting treatment. ASC 815 applies to the Company’s energy relatedenergy-related commodity contracts and interest rate swaps.
Interest Rate Swaps
The Company enters into interest rate swap agreements in order to hedge the variability of expected future cash interest payments. As of December 31, 2022,2023, the Company had interest rate derivative instruments on non-recourse debt extending through 2031,2040, a portion of which were designated as cash flow hedges. Under the interest rate swap agreements, the Company pays a fixed rate and the counterparties to the agreements pay a variable interest rate.
Energy Related CommoditiesEnergy-Related Commodity Contracts
As of December 31, 2022,2023, the Company had energy-related derivative instruments extending through 2033. At December 31, 2022,2023, these contracts were not designated as cash flow or fair value hedges.
Volumetric Underlying Derivative Transactions
The following table summarizes the net notional volume buy/(sell) of the Company’s open derivative transactions broken out by commodity as of December 31, 2022 and 2021:commodity:
| | Total Volume |
| December 31, 2022 | | December 31, 2021 |
| | | Total Volume | | | | | Total Volume |
| | | December 31, 2023 | | | | | December 31, 2023 | | December 31, 2022 |
| Commodity | Commodity | Units | | (In millions) | Commodity | Units | | (In millions) |
| Power | |
| Natural Gas | Natural Gas | MMBtu | | — | | | 2 | |
| Power | MWh | | (18) | | | (17) | |
| Interest | Interest | Dollars | | $ | 1,084 | | | $ | 1,326 | |
Fair Value of Derivative Instruments
The following table summarizes the fair value within the derivative instrument valuation on the consolidated balance sheets:
| | | | | | | | | | | | | | | | | | | | | | | |
| | Fair Value |
| | Derivative Assets | | Derivative Liabilities |
| December 31, 2022 | | December 31, 2021 | | December 31, 2022 | | December 31, 2021 |
| (In millions) |
| Derivatives Designated as Cash Flow Hedges: | | | | | | | |
| Interest rate contracts current | $ | 7 | | | $ | — | | | $ | — | | | $ | 5 | |
| Interest rate contracts long-term | 18 | | | 2 | | | — | | | 3 | |
| Total Derivatives Designated as Cash Flow Hedges | $ | 25 | | | $ | 2 | | | $ | — | | | $ | 8 | |
| Derivatives Not Designated as Cash Flow Hedges: | | | | | | | |
| Interest rate contracts current | $ | 19 | | | $ | — | | | $ | — | | | $ | 17 | |
| Interest rate contracts long-term | 45 | | | 4 | | | — | | | 38 | |
| Commodity contracts current | — | | | — | | | 50 | | | 24 | |
| Commodity contracts long-term | — | | | — | | | 303 | | | 155 | |
| Total Derivatives Not Designated as Cash Flow Hedges | $ | 64 | | | $ | 4 | | | $ | 353 | | | $ | 234 | |
| Total Derivatives | $ | 89 | | | $ | 6 | | | $ | 353 | | | $ | 242 | |
| | | | | | | | | | | | | | | | | | | | | | | |
| | Fair Value |
| | Derivative Assets | | Derivative Liabilities |
| December 31, 2023 | | December 31, 2022 | | December 31, 2023 | | December 31, 2022 |
| (In millions) |
| Derivatives Designated as Cash Flow Hedges: | | | | | | | |
| Interest rate contracts current | $ | 7 | | | $ | 7 | | | $ | — | | | $ | — | |
| Interest rate contracts long-term | 12 | | | 18 | | | 2 | | | — | |
| Total Derivatives Designated as Cash Flow Hedges | $ | 19 | | | $ | 25 | | | $ | 2 | | | $ | — | |
| Derivatives Not Designated as Cash Flow Hedges: | | | | | | | |
| Interest rate contracts current | $ | 33 | | | $ | 19 | | | $ | — | | | $ | — | |
| Interest rate contracts long-term | 69 | | | 45 | | | — | | | — | |
| Energy-related commodity contracts current | 1 | | | — | | | 51 | | | 50 | |
| Energy-related commodity contracts long-term | 1 | | | — | | | 279 | | | 303 | |
| Total Derivatives Not Designated as Cash Flow Hedges | $ | 104 | | | $ | 64 | | | $ | 330 | | | $ | 353 | |
| Total Derivatives | $ | 123 | | | $ | 89 | | | $ | 332 | | | $ | 353 | |
The Company has elected to present derivative assets and liabilities on the balance sheet on a trade-by-trade basis and does not offset amounts at the counterparty level. As of December 31, 20222023 and 2021,2022, the amount of outstanding collateral paid or received was immaterial. The following tables summarize the offsetting of derivatives by counterparty:
| | | Gross Amounts Not Offset in the Statement of Financial Position |
| As of December 31, 2022 | Gross Amounts of Recognized Assets/Liabilities | | Derivative Instruments | | Net Amount |
| Commodity contracts | (In millions) |
| | Gross Amounts Not Offset in the Statement of Financial Position | |
| Gross Amounts Not Offset in the Statement of Financial Position | |
| Gross Amounts Not Offset in the Statement of Financial Position | |
| As of December 31, 2023 | | As of December 31, 2023 | Gross Amounts of Recognized Assets/Liabilities | | Derivative Instruments | | Net Amount |
| Energy-related commodity contracts | | Energy-related commodity contracts | (In millions) |
| Derivative assets | |
| Derivative liabilities | Derivative liabilities | $ | (353) | | | $ | — | | | $ | (353) | |
| Total commodity contracts | $ | (353) | | | $ | — | | | $ | (353) | |
| Total energy-related commodity contracts | |
| Interest rate contracts | Interest rate contracts | | | | | |
| Derivative assets | Derivative assets | $ | 89 | | | $ | — | | | $ | 89 | |
| | Derivative assets | |
| Derivative assets | |
| Derivative liabilities | |
| Total interest rate contracts | Total interest rate contracts | $ | 89 | | | $ | — | | | $ | 89 | |
| Total derivative instruments | Total derivative instruments | $ | (264) | | | $ | — | | | $ | (264) | |
| | | | | | | | | | | | | | | | | |
| Gross Amounts Not Offset in the Statement of Financial Position |
| As of December 31, 2022 | Gross Amounts of Recognized Assets/Liabilities | | Derivative Instruments | | Net Amount |
| Energy-related commodity contracts | (In millions) |
| | | | | |
| Derivative liabilities | $ | (353) | | | $ | — | | | $ | (353) | |
| Total energy-related commodity contracts | $ | (353) | | | $ | — | | | $ | (353) | |
| Interest rate contracts | | | | | |
| Derivative assets | $ | 89 | | | $ | — | | | $ | 89 | |
| | | | | |
| Total interest rate contracts | $ | 89 | | | $ | — | | | $ | 89 | |
| Total derivative instruments | $ | (264) | | | $ | — | | | $ | (264) | |
| | | | | | | | | | | | | | | | | |
| Gross Amounts Not Offset in the Statement of Financial Position |
| As of December 31, 2021 | Gross Amounts of Recognized Assets/Liabilities | | Derivative Instruments | | Net Amount |
| Commodity contracts | (In millions) |
| | | | | |
| Derivative liabilities | $ | (179) | | | $ | — | | | $ | (179) | |
| Total commodity contracts | $ | (179) | | | $ | — | | | $ | (179) | |
| Interest rate contracts | | | | | |
| Derivative assets | $ | 6 | | | $ | (5) | | | $ | 1 | |
| Derivative liabilities | (63) | | | 5 | | | (58) | |
| Total interest rate contracts | $ | (57) | | | $ | — | | | $ | (57) | |
| Total derivative instruments | $ | (236) | | | $ | — | | | $ | (236) | |
Accumulated Other Comprehensive Income (Loss)
The following table summarizes the effects on the Company’s accumulated OCI (OCL) balance attributable to interest rate swaps designated as cash flow hedge derivatives:
| | Year ended December 31, |
| 2022 | | 2021 | | 2020 |
| (In millions) |
| Year ended December 31, | | | Year ended December 31, |
| 2023 | | | 2023 | | 2022 | | 2021 |
| (In millions) | | | (In millions) |
| Accumulated OCI (OCL) beginning balance | Accumulated OCI (OCL) beginning balance | $ | (13) | | | $ | (35) | | | $ | (37) | |
| | Reclassified from accumulated OCI/OCL to income due to realization of previously deferred amounts | 5 | | | 11 | | | 11 | |
| Reclassified from accumulated OCI (OCL) to income due to realization of previously deferred amounts | |
| Reclassified from accumulated OCI (OCL) to income due to realization of previously deferred amounts | |
| Reclassified from accumulated OCI (OCL) to income due to realization of previously deferred amounts | |
| Capistrano Wind Portfolio Acquisition | Capistrano Wind Portfolio Acquisition | 7 | | | — | | | — | |
| Mark-to-market of cash flow hedge accounting contracts | Mark-to-market of cash flow hedge accounting contracts | 28 | | | 11 | | | (9) | |
| Accumulated OCI (OCL) ending balance | Accumulated OCI (OCL) ending balance | $ | 27 | | | $ | (13) | | | $ | (35) | |
| Accumulated OCI (OCL) attributable to noncontrolling interests | 6 | | | — | | | (2) | |
| Accumulated OCI attributable to noncontrolling interests | |
| Accumulated OCI (OCL) attributable to Clearway Energy LLC | Accumulated OCI (OCL) attributable to Clearway Energy LLC | $ | 21 | | | $ | (13) | | | $ | (33) | |
| Income expected to be realized from OCI during the next 12 months | Income expected to be realized from OCI during the next 12 months | $ | 5 | | | | | | Income expected to be realized from OCI during the next 12 months | $ | 5 | | | | | |
Amounts reclassified from accumulated OCI/OCLOCI (OCL) into income are recorded to interest expense.
Impact of Derivative Instruments on the Consolidated Statements of Income
Mark-to-market gains/(losses) related to the Company’s derivatives are recorded in the consolidated statements of income as follows:
| | Year ended December 31, |
| 2022 | | 2021 | | 2020 |
| (In millions) |
| Year ended December 31, | | | Year ended December 31, |
| 2023 | | | 2023 | | 2022 | | 2021 |
| (In millions) | | | (In millions) |
| Interest Rate Contracts (Interest expense) | Interest Rate Contracts (Interest expense) | $ | 100 | | | $ | 53 | | | $ | (38) | |
Commodity Contracts (Operating revenue) (a) | (174) | | | (83) | | | (4) | |
Energy-Related Commodity Contracts (Mark-to-market for economic hedging activities included in Total operating revenues) (a) | |
Energy-Related Commodity Contracts (Mark-to-market for economic hedging activities included in Cost of operations) (b) | |
(a) Relates to long-term energy-related commodity contracts at Elbow Creek, Mesquite Star, Mt. Storm, Langford and Mesquite Sky.Sky and short-term heat rate call option energy-related commodity contracts at El Segundo, Marsh Landing and Walnut Creek. During the year ended December 31, 2022, the energy-related commodity contract for Langford, which previously met the NPNS exception, no longer qualified for NPNS treatment and, accordingly, is accounted for as a derivative and marked to fair value through operating revenues.
Prior(b) Relates to the Thermal Disposition, which is further described in Note 3, Acquisitions and Dispositions, a portion of the Company’s derivativelong-term backbone transportation service energy-related commodity contracts were related to its Thermal Business for the purchase of fuel/electricity commodities based on the forecasted usage of the thermal district energy centers. Realized gainsat El Segundo and losses on these contracts were reflected in the fuel costs that were permitted to be billed to customers through the related customer contracts or tariffs and, accordingly, no gains or losses were reflected in the consolidated statements of income for these contracts through the period that the Company owned the Thermal Business.Walnut Creek.
See Note 6, Fair Value of Financial Instruments, for a discussion regarding concentration of credit risk.
Note 8 — Intangible Assets
Intangible Assets — The Company’s intangible assets as of December 31, 20222023 and 20212022 primarily reflect intangible assets established from its business acquisitions and are comprised of the following:
•PPAs — Established predominantly with the acquisitions of the Alta Wind Portfolio, Walnut Creek, Tapestry, Laredo Ridge, Carlsbad Energy Center, Agua Caliente, the Utah Solar Portfolio and the Capistrano Wind Portfolio. These represent the fair value of the PPAs acquired. These are amortized on a straight-line basis, over the term of the PPA.
•Leasehold Rights — Established with the acquisition of the Alta Wind Portfolio, this represents the fair value of contractual rights to receive royalty payments equal to a percentage of PPA revenue from certain projects. These are amortized as a reduction to operating revenue on a straight-line basis over the term of the PPAs.
•Customer relationships — Established with the acquisition of Energy Center Omaha and Energy Center Phoenix, these intangibles were included in the Thermal Business and were classified as held for sale at December 31, 2021. The Thermal Business was sold on May 1, 2022.
•Customer contracts — Established with the acquisition of Energy Center Phoenix,these intangibles were included in the Thermal Business and were classified as held for sale at December 31, 2021. The Thermal Business was sold on May 1, 2022.
•Emission Allowances — These intangibles primarily consist of SO2 and NOx emission allowances established with the El Segundo, Walnut Creek and Carlsbad Energy Center acquisitions. These emission allowances are held-for-use and are amortized to cost of operations, with NOx allowances amortized on a straight-line basis and SO2 allowances amortized based on units of production.
•Other — Consists of a) the acquisition date fair value of the contractual rights to a ground lease for South Trent and to utilize certain interconnection facilities for Blythe as well as land rights acquired in connection with the acquisition of Elbow Creek and Langford Wind;Creek; b) development rights related to certain solar business acquisitions; c) purchased software for certain solar projects; d) RECs acquired in connection with the acquisition of the Utah Solar Portfolio; and d)e) favorable land leases acquired in connection with the acquisition of the Utah Star Portfolio.
The following tables summarize the components of intangible assets subject to amortization:
| | Year ended December 31, 2022 | PPAs | | Leasehold Rights | | Emission Allowances | | | Other | | Total |
| Year ended December 31, 2023 | |
| Year ended December 31, 2023 | |
| Year ended December 31, 2023 | |
| (In millions) | (In millions) | | | |
| January 1, 2022 | $ | 2,985 | | | $ | 86 | | | $ | 17 | | | | $ | 16 | | | $ | 3,104 | |
Acquisitions (a) | 336 | | | — | | | — | | | | — | | | 336 | |
| (In millions) | |
| (In millions) | |
| January 1, 2023 | |
| January 1, 2023 | |
| January 1, 2023 | |
| Walnut Creek PPA expiration | |
| Walnut Creek PPA expiration | |
| Walnut Creek PPA expiration | |
| Other | |
| Other | |
| Other | Other | — | | | — | | | — | | | | 2 | | | 2 | |
| | December 31, 2022 | 3,321 | | | 86 | | | 17 | | | | 18 | | | 3,442 | |
| December 31, 2023 | |
| | December 31, 2023 | |
| | December 31, 2023 | |
| Less accumulated amortization | |
| Less accumulated amortization | |
| Less accumulated amortization | Less accumulated amortization | (833) | | | (34) | | | (4) | | | | (6) | | | (877) | |
| Net carrying amount | Net carrying amount | $ | 2,488 | | | $ | 52 | | | $ | 13 | | | | $ | 12 | | | $ | 2,565 | |
| Net carrying amount | |
| Net carrying amount | |
(
| | | | | | | | | | | | | | | | | | | | | | | | | | | | | | | | | | | |
| Year ended December 31, 2022 | PPAs | | Leasehold Rights | | | | | | Emission
Allowances | | | | Other | | Total |
| (In millions) | | | | | | | | | | | | | | | |
| January 1, 2022 | $ | 2,985 | | | $ | 86 | | | | | | | $ | 17 | | | | | $ | 16 | | | $ | 3,104 | |
Acquisitions (a) | 336 | | | — | | | | | | | — | | | | | — | | | 336 | |
| Other | — | | | — | | | | | | | — | | | | | 2 | | | 2 | |
| December 31, 2022 | 3,321 | | | 86 | | | | | | | 17 | | | | | 18 | | | 3,442 | |
| Less accumulated amortization | (833) | | | (34) | | | | | | | (4) | | | | | (6) | | | (877) | |
| Net carrying amount | $ | 2,488 | | | $ | 52 | | | | | | | $ | 13 | | | | | $ | 12 | | | $ | 2,565 | |
a)(a) The weighted average life of acquired intangibles was 10 years for PPAs.
| | | | | | | | | | | | | | | | | | | | | | | | | | | | | | | | | | | | | | | | | | | |
| Year ended December 31, 2021 | PPAs | | Leasehold Rights | | Customer Relationships | | Customer Contracts | | Emission
Allowances | | | | Other | | Total |
| (In millions) | | | | | | | | | | | | | | | |
| January 1, 2021 | $ | 1,661 | | | $ | 86 | | | $ | 66 | | | $ | 15 | | | $ | 17 | | | | | $ | 12 | | | $ | 1,857 | |
Acquisitions (a) | 1,324 | | | — | | | — | | | — | | | — | | | | | 4 | | | 1,328 | |
Reclassified to held for sale (b) | — | | | — | | | (66) | | | (15) | | | — | | | | | — | | | (81) | |
| December 31, 2021 | 2,985 | | | 86 | | | — | | | — | | | 17 | | | | | 16 | | | 3,104 | |
| Less accumulated amortization | (566) | | | (30) | | | — | | | — | | | (3) | | | | | (6) | | | (605) | |
| Net carrying amount | $ | 2,419 | | | $ | 56 | | | $ | — | | | $ | — | | | $ | 14 | | | | | $ | 10 | | | $ | 2,499 | |
(a) The weighted average life of acquired intangibles was 17 years for PPAs, 15 years for RECs and 15 years for favorable leases.
(b)Thermal Business intangible assets were classified as held for sale at December 31, 2021, and the Thermal Business was subsequently sold on May 1, 2022.
The Company recorded amortization expense of $186 million, $174 million and $143 million during the yearyears ended December 31, 2023, 2022 $143and 2021, respectively. Of these amounts, $181 million, for$168 million and $135 million during the yearyears ended December 31, 2023, 2022 and 2021, and $91 million for the year ended December 31, 2020. Of these amounts, $168 million for the year ended December 31, 2022, $135 million for the year ended December 31, 2021 and $88 million for the year ended December 31, 2020,respectively, were related to the amortization of intangible assets for power purchase agreements and were recorded to contract amortization expense, which reduced operating revenues in the consolidated statements of income. The Company estimates the future amortization expense for its intangibles for the next five years as follows:
| | (In millions) | |
| | 2023 | $ | 182 | | |
| (In millions) | |
| (In millions) | |
| (In millions) | |
| 2024 | |
| 2024 | |
| 2024 | 2024 | 180 | | |
| 2025 | 2025 | 180 | | |
| 2025 | |
| 2025 | |
| 2026 | |
| 2026 | |
| 2026 | 2026 | 180 | | |
| 2027 | 2027 | 180 | | |
| 2027 | |
| 2027 | |
| 2028 | |
| 2028 | |
| 2028 | |
Note 9 — Asset Impairments
20222023 Impairment Losses
During the fourth quarter of 2022,2023, in preparation and review of its annual budget, the Company updated its long-term estimates of operating and capital expenditures and revised its assessment of long-term merchant power prices, which was primarily informed by present conditions and did not contemplate future policy changes, which could impact renewable energy power prices. The impairment analysis reviews certain qualitative factors as well as the results of long-term operating expectations and its carrying value to determine if impairment indicators are present. The impairment analysis indicated that the projected future cash flows for certain projects within the Renewables segment no longer supported the recoverability of the carrying value of the related long-lived assets. As such, the Company recorded an impairment loss of $12 million, which primarily related to property, plant, and equipment to reflect the assets at fair market value. The fair value of the facilities was determined using an income approach by applying a discounted cash flow methodology to the updated long-term budgets for each respective plant. The income approach included key inputs such as forecasted merchant power prices, operations and maintenance expense, and discount rates. The resulting fair value is a Level 3 fair value measurement.
2022 Impairment Losses
The impairment analysis indicated that the projected future cash flows for certain projects within the Renewables segment no longer supported the recoverability of the carrying value of the related long-lived assets. As such, the Company recorded an impairment loss of $16 million, which primarily related to property, plant, and equipment to reflect the assets at fair market value. The fair value of the facilities was determined using an income approach by applying a discounted cash flow methodology to the updated long-term budgets for each respective plant. The income approach included key inputs such as forecasted merchant power prices, operations and maintenance expense, and discount rates. The resulting fair value is a Level 3 fair value measurement.
2021 Impairment Losses
The impairment analysis indicated that the projected future cash flows for several wind projects within the Renewables segment no longer supported the recoverability of the carrying value of the related long-lived assets. As such, the Company recorded an impairment loss of $6 million, which primarily related to property, plant, and equipment to reflect the assets at fair market value. The fair value of the facilities was determined using an income approach by applying a discounted cash flow methodology to the updated long-term budgets for each respective plant. The income approach included key inputs such as forecasted merchant power prices, operations and maintenance expense, and discount rates. The resulting fair value is a Level 3 fair value measurement.
2020 Impairment Losses
The impairment analysis indicated that the projected future cash flows for several wind projects within the Renewables segment no longer supported the recoverability of the carrying value of the related long-lived assets. As such, the Company recorded an impairment loss of $24 million, which primarily related to property, plant, and equipment to reflect the assets at fair market value. The fair value of the facilities was determined using an income approach by applying a discounted cash flow methodology to the updated long-term budgets for each respective plant. The income approach included key inputs such as forecasted merchant power prices, operations and maintenance expense, and discount rates. The resulting fair value is a Level 3 fair value measurement.
Additionally, during the fourth quarter of 2020, as the Company updated its estimated cash flows in connection with the preparation and review of the Company’s annual budget, the Company determined that there was a significant decrease in the estimated future cash flows for its equity method investment in San Juan Mesa, a facility in the Renewables segment located in Elida, New Mexico. The decrease in the forecasted cash flows which was primarily driven by a decline in forecasted revenue in future merchant periods, was significant enough to be considered an indication of a decline in value of the investment that was not temporary. The Company concluded there was an other-than-temporary impairment of its investment and recorded an impairment loss of $8 million to reflect the investment at fair market value. The resulting fair value is a Level 3 fair value measurement.
Note 10 — Long-term Debt
The Company’s borrowings, including short-term and long-term portions, consisted of the following:
| | December 31, 2023 | | | December 31, 2023 | | December 31, 2022 | | Interest rate % (a)(b) | | Letters of Credit Outstanding at December 31, 2023 |
| (In millions, except rates) | |
| | | December 31, 2022 | | December 31, 2021 | | Interest rate % (a)(b) | | Letters of Credit Outstanding at December 31, 2022 |
| Intercompany Note with Clearway, Inc. | |
| | (In millions, except rates) | | |
| | Intercompany Note with Clearway, Inc. | |
| | Intercompany Note with Clearway Energy, Inc. | $ | 2 | | | $ | 1 | | | 4.550 | | |
| | Intercompany Note with Clearway, Inc. | |
| | 2028 Senior Notes | |
| | 2028 Senior Notes | |
| | 2028 Senior Notes | 2028 Senior Notes | 850 | | | 850 | | | 4.750 | | |
| 2031 Senior Notes | 2031 Senior Notes | 925 | | | 925 | | | 3.750 | |
| 2031 Senior Notes | |
| 2031 Senior Notes | |
| 2032 Senior Notes | 2032 Senior Notes | 350 | | | 350 | | | 3.750 | |
Clearway Energy LLC and Clearway Energy Operating LLC Revolving Credit Facility, due 2023 (c) | — | | | 245 | | | 1.750 | | $ | 125 | |
| Bridge Loan, due 2022 | — | | | 335 | | | S+1.250 | |
| 2032 Senior Notes | |
| 2032 Senior Notes | |
Clearway Energy LLC and Clearway Energy Operating LLC Revolving Credit Facility, due 2023 (b) | |
Clearway Energy LLC and Clearway Energy Operating LLC Revolving Credit Facility, due 2023 (b) | |
Clearway Energy LLC and Clearway Energy Operating LLC Revolving Credit Facility, due 2023 (b) | |
| | Non-recourse project-level debt: | Non-recourse project-level debt: | |
| Non-recourse project-level debt: | |
| Non-recourse project-level debt: | |
| Agua Caliente Solar LLC, due 2037 | |
| Agua Caliente Solar LLC, due 2037 | |
| Agua Caliente Solar LLC, due 2037 | Agua Caliente Solar LLC, due 2037 | 649 | | | 684 | | | 2.395-3.633 | | 45 | |
| Alta Wind Asset Management LLC, due 2031 | Alta Wind Asset Management LLC, due 2031 | 12 | | | 13 | | | L+2.625 | | — | |
| Alta Wind I-V lease financing arrangements, due 2034 and 2035 | Alta Wind I-V lease financing arrangements, due 2034 and 2035 | 709 | | | 756 | | | 5.696-7.015 | | 23 | |
| Alta Wind Realty Investments LLC, due 2031 | Alta Wind Realty Investments LLC, due 2031 | 22 | | | 24 | | | 7.000 | | — | |
| Borrego, due 2024 and 2038 | Borrego, due 2024 and 2038 | 51 | | | 54 | | | Various | | — | |
| Broken Bow, due 2031 | |
| Buckthorn Solar, due 2025 | Buckthorn Solar, due 2025 | 119 | | | 123 | | | L+1.750 | | 21 | |
| Capistrano Wind Portfolio, due 2029 and 2031 | 156 | | | — | | | L+2.000 | | 36 | |
| Carlsbad Energy Holdings LLC, due 2027 | Carlsbad Energy Holdings LLC, due 2027 | 115 | | | 136 | | | L+1.750 | | 63 | |
| Carlsbad Energy Holdings LLC, due 2038 | Carlsbad Energy Holdings LLC, due 2038 | 407 | | | 407 | | | 4.120 | | — | |
| Carlsbad Holdco, LLC, due 2038 | Carlsbad Holdco, LLC, due 2038 | 197 | | | 205 | | | 4.210 | | 5 | |
| Cedro Hill, due 2024 and 2029 | |
| Crofton Bluffs, due 2031 | |
| CVSR, due 2037 | CVSR, due 2037 | 627 | | | 652 | | | 2.339-3.775 | | — | |
| CVSR Holdco Notes, due 2037 | CVSR Holdco Notes, due 2037 | 160 | | | 169 | | | 4.680 | | 12 | |
| Daggett 2, due 2028 | |
| Daggett 3, due 2028 | |
| DG-CS Master Borrower LLC, due 2040 | DG-CS Master Borrower LLC, due 2040 | 413 | | | 441 | | | 3.510 | | 30 | |
| | El Segundo Energy Center, due 2023 | — | | | 193 | | | L+1.875-2.500 | | 80 | |
| | Kawailoa Solar Portfolio LLC, due 2026 | — | | | 78 | | | L+1.375 | | — | |
| Laredo Ridge, due 2028 | — | | | 72 | | | L+2.125 | | — | |
| Marsh Landing, due 2023 | 19 | | | 84 | | | L+2.375 | | 45 | |
| Mililani I, due 2027 | 47 | | | — | | | L+1.500 | | 6 | |
Mililani I, due 2027 (c) | |
| Mililani I, due 2027 (c) | |
| Mililani I, due 2027 (c) | |
Mililani Class B Member Holdco LLC, due 2028 (c) | |
| NIMH Solar, due 2024 | NIMH Solar, due 2024 | 163 | | | 176 | | | L+2.000 | | 10 | |
| Oahu Solar Holdings LLC, due 2026 | Oahu Solar Holdings LLC, due 2026 | 83 | | | 86 | | | L+1.375 | | 9 | |
| | Rosie Class B LLC, due 2027 | 76 | | | 78 | | | L+1.750 | | 17 | |
| Tapestry Wind LLC, due 2031 | — | | | 85 | | | L+1.375 | | — | |
| Utah Solar Holdings, due 2036 | 257 | | | 273 | | | 3.590 | | | 9 | |
Viento Funding II, LLC, due 2023 and 2029 (d) | 184 | | | 29 | | | S+1.475 | | 26 | |
| Waiawa, due 2023 and 2028 | 97 | | | — | | | L+1.000-1.250 | | 10 | |
| Walnut Creek, due 2023 | 19 | | | 74 | | | L+1.875 | | 74 | |
| WCEP Holdings, LLC, due 2023 | 26 | | | 30 | | | L+3.000 | | — | |
| Rosie Class B LLC, due 2024 and 2029 | |
| Rosie Class B LLC, due 2024 and 2029 | |
| Rosie Class B LLC, due 2024 and 2029 | |
| Texas Solar Nova 1, due 2028 | |
| Utah Solar Portfolio, due 2036 | |
| Viento Funding II, LLC, due 2029 | |
| Victory Pass and Arica, due 2024 | |
Waiawa, due 2028 (c) | |
| | Other | |
| | Other | |
| | Other | Other | 137 | | | 151 | | | Various | | 200 | |
| Subtotal non-recourse project-level debt | Subtotal non-recourse project-level debt | 4,745 | | | 5,073 | | |
| Total debt | Total debt | 6,872 | | | 7,779 | | |
| Total debt | |
| Total debt | |
| Less current maturities | |
| Less current maturities | |
| Less current maturities | Less current maturities | (324) | | | (773) | | |
| Less net debt issuance costs | Less net debt issuance costs | (61) | | | (71) | | |
Add premiums (e) | 4 | | | 4 | | |
| Less net debt issuance costs | |
| Less net debt issuance costs | |
Add premiums (d) | |
Add premiums (d) | |
Add premiums (d) | |
| Total long-term debt | Total long-term debt | $ | 6,491 | | | $ | 6,939 | | |
| Total long-term debt | |
| Total long-term debt | |
(a) As of December 31, 2022, L+2023, S+ equals 3 month LIBOR plus x%, except Marsh Landing, due 2023, Waiawa, due 2023, and Walnut Creek, due 2023, where L+ equals 1 month LIBORSOFR plus x%.
(b)S+ equals SOFR, plus x%
(c) Applicable rate is determined by the borrower leverage ratio, as defined in the credit agreement.
(c) On July 21, 2023, Mililani I’s financing agreement was amended to merge the project-level debt of Mililani I and Waiawa as a combined term loan under Mililani Class B Member Holdco LLC.
(d) Laredo Ridge, due 2028; Tapestry Wind LLC, due 2031; and Viento Funding II, LLC, due 2023 project-level debt were repaid on March 16, 2022 totaling $186 million and was replaced with $190 million in new project-level debt under Viento Funding II, LLC that was obtained on March 16, 2022 and is due in 2029, as discussed further below.
(e) Premiums relate to the 2028 Senior NotesNotes.
The financing arrangements listed above contain certain covenants, including financial covenants that the Company is required to be in compliance with during the term of the respective arrangement. Under the project-level financing arrangements, each project is permitted to pay distributions out of available cash as long as certain conditions are satisfied, including that no default under the applicable arrangements has occurred and that each project is otherwise in compliance with all relevant conditions under the financing agreements, including meeting required financial ratios, where applicable. The Company’s project-level financing arrangements are non-recourse to the Company, thus, each project pledges its underlying assets as collateral, and if a project is in default of its financing arrangement, then the related lender could demand repayment of the project or enforce their security interests with respect to the pledged collateral.
As of December 31, 2022,2023, the Company was in compliance with all of the required covenants.
Clearway Energy LLC and Clearway Energy Operating LLC Revolving Credit Facility
On March 15, 2023, Clearway Energy Operating LLC refinanced the Amended and Restated Credit Agreement, which (i) replaced LIBOR with SOFR plus a credit spread adjustment of 0.10% as the applicable reference rate, (ii) increased the available revolving commitments to an aggregate principal interest, sinking fundamount of $700 million, (iii) extended the maturity date to March 15, 2028, (iv) increased the letter of credit sublimit to $594 million and redemption covenants.(v) implemented certain other technical modifications.
As of December 31, 2023, the Company had no outstanding borrowings under the revolving credit facility and $246 million in letters of credit outstanding. The facility will continue to be used for general corporate purposes, including financing of future acquisitions and posting letters of credit.
Bridge Loan Agreement
On November 30, 2021, Clearway Energy Operating LLC entered into a senior secured bridge credit agreement, or the Bridge Loan Agreement. The Bridge Loan Agreement provided for a senior secured term loan facility in an aggregate principal amount of $335 million. The borrowings under the term loan facility were used to acquire the Utah Solar Portfolio on December 1, 2021, as further described in Note 3, Acquisitions and Dispositions.2021.
On May 3, 2022, the Company repaid the $335 million in outstanding borrowings under the Bridge Loan Agreement utilizing proceeds received from the Thermal Disposition, as further described in Note 3, Acquisitions and Dispositions.
Project-level Debt
Texas Solar Nova 1
On December 28, 2023, as part of the acquisition of Texas Solar Nova 1, as further described in Note 3, Acquisitions and Dispositions., the Company assumed the project’s financing agreement, which included a $90 million construction loan, $109 million sponsor equity bridge loan and $151 million tax equity bridge loan, offset by $1 million in unamortized debt issuance costs. At acquisition date, the tax equity investor contributed $148 million, which was utilized, along with the Company’s entire purchase price that was contributed back to the Company by CEG and the proceeds from the cash equity investor, to repay the $109 million sponsor equity bridge loan, to repay the $151 million tax equity bridge loan, to fund $18 million in construction completion reserves, which is included in restricted cash on the Company’s consolidated balance sheet, and to pay $5 million in associated fees with the remaining $9 million distributed back to CEG. Also at acquisition date, the $90 million construction loan was converted into a term loan in the amount of $102 million, which includes an additional borrowing of $12 million.
Clearway Energy LLC and Clearway Energy Operating LLC Revolving Credit FacilityCedro Hill Repowering
On November 30, 2021, Clearway Energy Operating LLCDecember 12, 2023, the Company entered into a financing agreement for non-recourse debt for a total commitment of $254 million, which consists of construction loans, a tax equity bridge loan and a sponsor equity bridge loan, related to the Sixth Amendmentrepowering of the Cedro Hill wind project. The Company’s initial borrowing of $165 million was utilized to Amended and Restated Credit Agreement,repay the $72 million of outstanding principal under the original financing agreement, to pay $55 million to Clearway Renew for the future delivery of equipment, which amendedis included in other non-current assets on the Company’s revolving credit facilityconsolidated balance sheet, to pay $27 million to a third party for the future delivery of equipment, which is included in other non-current assets on the Company’s balance sheet, to pay a $4 million development services fee to Clearway Renew, to pay for $4 million in debt issuance costs that were deferred and to pay for $3 million in capital expenditures.
Victory Pass and Arica
On October 31, 2023, as part of the acquisition of Victory Pass and Arica, as further described in Note 3, Acquisitions and Dispositions, the Company assumed the project’s financing agreement, which included a $483 million sponsor equity bridge loan and a $385 million tax equity bridge loan, offset by $4 million in unamortized debt issuance costs. A partial payment of $133 million was made on the sponsor equity bridge loan at acquisition date utilizing all of the proceeds from the Company, which were contributed back to the Company by CEG, and the contribution from the cash equity investor. The tax equity bridge loan and the remaining sponsor equity bridge loan will be repaid with the final proceeds received from the tax equity investor and cash equity investor upon Victory Pass and Arica reaching substantial completion, which is expected to occur in the first half of 2024, along with the $100 million that was contributed into escrow by the tax equity investor at acquisition date, which is included in restricted cash on the Company’s consolidated balance sheet. Subsequent to the acquisition, the Company borrowed an additional $22 million in tax equity bridge loans.
Daggett 2
On August 30, 2023, as part of the acquisition of Daggett 2, as further described in Note 3, Acquisitions and Dispositions, the Company assumed the project’s financing agreement, which included a $107 million construction loan and a $204 million tax equity bridge loan, offset by $3 million in unamortized debt issuance costs. On December 22, 2023, when the project reached substantial completion, the tax equity investor contributed an additional $202 million, which was utilized, along with the $120 million in escrow and $10 million in construction loan proceeds, to repay the $204 million tax equity bridge loan, to fund $36 million in construction completion reserves, which is included in restricted cash on the Company’s consolidated balance sheet, and to pay $1 million in associated fees with the remaining $91 million distributed to CEG. Subsequent to the acquisition, the Company borrowed an additional $49 million in construction loans and the total outstanding construction loans were converted to a term loan in the amount of $156 million on December 22, 2023.
Rosamond Central (Rosie Class B LLC)
On June 30, 2023, Rosie Class B LLC, the indirect owner of the Rosamond Central solar project, amended its financing agreement to provide for (i) a refinanced term loan in the amount of $77 million, (ii) construction loans up to $115 million, which will convert to a term loan upon the BESS project reaching substantial completion, (iii) tax equity bridge loans up to $188 million, which will be repaid with tax equity proceeds received upon the BESS project reaching substantial completion, (iv) an increase to the letter of credit sublimit to $41 million and (v) an extension of the maximum permitted Borrower Leverage Ratio (as defined in the credit agreement governing the Company’s revolving credit facility) to 6.00 to 1.00 from November 30, 2021 through May 2, 2022. The Sixth Amendment also (i) permits the incurrencematurity date of the term loan facility under the Bridge Loan Agreement, (ii) permits the incurrence of hedging obligations, subjectand construction loans to certain conditions, and provides for a $40 million basket for cash collateral which may be providedfive years subsequent to secure hedging obligations (iii) permits the prepayment of unsecured, junior or subordinated indebtedness at any time following May 3, 2022, subject to certain conditions, including that, after giving effect to such payment, the Borrower Leverage Ratio would not be greater than 5.50 to 1.00 and the Borrower Interest Coverage Ratio (as defined in the credit agreement governing the Company’s revolving credit facility) would not be less than 1.75 to 1.00 and (iv) implements certain other technical modifications.
As of December 31, 2022, the Company had no outstanding borrowings under the revolving credit facility and $125 million in letters of credit outstanding.term conversions. During the year ended December 31, 2022,2023, Rosie Class B LLC received total loan proceeds of $265 million, which was comprised of $115 million in construction loans and $155 million in tax equity bridge loans, net of $5 million in debt issuance costs that were deferred.
On July 3, 2023, Rosie Class B LLC issued a loan to Clearway Renew, utilizing a portion of the Company borrowed $80 millionloan proceeds under the revolving credit facilityamended financing agreement, in order to finance the construction of the BESS project. On December 1, 2023, the Rosamond Central solar project acquired the BESS project from Clearway Renew for initial cash consideration of $70 million, as further discussed in Note 3, Acquisitions and repaid $325 million, $305 millionDispositions, and Clearway Renew utilized the funds to partially repay the loan. As of which was repaid on May 3, 2022, utilizingDecember 31, 2023, the proceeds received from the Thermal Disposition. The facility will continue to be used for general corporate purposes including financing of future acquisitions and posting letters of credit.
2032 Senior Notes
On October 1, 2021, Clearway Energy Operating LLC completed the sale of $350 million of senior unsecured notes due 2032, or the 2032 Senior Notes. The 2032 Senior Notes bear interest at 3.750% and mature on January 15, 2032. Interest on the 2032 Senior Notes is payable semi-annually on January 15 and July 15 of each year. The 2032 Senior Notes are unsecured obligations of Clearway Energy Operating LLC and are guaranteed by Clearway Energy LLC and by certain of Clearway Energy Operating LLC’s wholly-owned current and future subsidiaries. The net proceeds from the 2032 Senior Notes were used, together with existing corporate liquidity, to repurchase the 2026 Senior Notes, as described below.
2026 Senior Notes Tender Offer and Redemption
In October 2021, the Company repurchased and redeemedloan had an aggregate principal amount of $350 million$174 million. The loan bears interest at a fixed annual rate of 9.00% and matures when the project reaches substantial completion, which is expected to occur in the first half of 2024 and is included in note receivable — affiliate on the Company’s consolidated balance sheet.
Also, during the year ended December 31, 2023, the Company utilized a portion of the 2026 Senior Notes, throughloan proceeds received under the cash tender offer announced on September 24, 2021amended financing agreement to contribute $18 million into Rosie Central BESS, which is an investment accounted for under the equity method of accounting, as further described in Note 5, Investments Accounted for by the Equity Method and the redemption of the remaining principal amount of $227 million on October 25, 2021. The 2026 Senior Notes repurchased and redeemed in October 2021 were effectuated at a premium of approximately 103% for total consideration of $359 million and, as a result, the Company recorded a loss on extinguishment in the amount of $9 million. The Company recorded an additional $3 million loss on extinguishment to write off the remaining unamortized deferred financing fees related to the 2026 Senior Notes.Variable Interest Entities.
2031 Senior NotesDaggett 3
On March 9, 2021, Clearway Energy Operating LLC completedFebruary 17, 2023, as part of the saleacquisition of $925Daggett 3, as further described in Note 3, Acquisitions and Dispositions, the Company assumed the project’s financing agreement, which included a $181 million construction loan, a $229 million tax equity bridge loan and a $75 million sponsor equity bridge loan, offset by $5 million in unamortized debt issuance costs. The sponsor equity bridge loan was repaid at acquisition date, along with $8 million in associated fees, utilizing all of senior unsecured notes due 2031, or the 2031 Senior Notes. The 2031 Senior Notes bear interest at 3.750% and mature on February 15, 2031. Interest on the 2031 Senior Notes is payable semi-annually on February 15 and August 15 of each year. The 2031 Senior Notes are unsecured obligations of Clearway Energy Operating LLC and are guaranteed by Clearway Energy LLC and by certain of Clearway Energy Operating LLC’s wholly-owned current and future subsidiaries. The net proceeds from the 2031 Senior NotesCompany, which were usedcontributed back to repurchase the 2025 Senior Notes, as described below, as well asCompany by CEG, and the contribution from the cash equity investor. On December 1, 2023, when the project reached substantial completion, the tax equity investor contributed an additional $252 million, which was utilized along with the $69 million in escrow, to repay amounts outstanding underthe $229 million tax equity bridge loan, to fund $40 million in construction completion reserves, which is included in restricted cash on the Company’s revolving credit facilityconsolidated balance sheet, and for general corporate purposes.
2025 Senior Notes Tender Offer and Redemption
In March 2021,to pay $7 million in associated fees with the remaining $45 million distributed to CEG. Subsequent to the acquisition, the Company repurchased and redeemedborrowed an aggregate principal amount of $600additional $36 million of the 2025 Senior Notes, through the cash tender offer announced on March 2, 2021in construction loans and the redemption of the remaining principal amount of $183 million on March 17, 2021. The 2025 Senior Notes repurchased and redeemed in March 2021total outstanding construction loans were effectuated atconverted to a premium of approximately 106% for total consideration of $636 million and, as a result, the Company recorded a loss on extinguishmentterm loan in the amount of $36 million. The Company recorded an additional $5$217 million loss on extinguishment to write off the remaining unamortized deferred financing fees related to the 2025 Senior Notes.
Project-level DebtDecember 1, 2023.
El Segundo Energy Center
On December 15, 2022, the Company repaid the outstanding project-level debt of El Segundo Energy Center in the amount of approximately $130 million, utilizing cash on hand. The project-level debt had an original maturity of August 2023.
Waiawa
On October 3, 2022, as part of the acquisition of Waiawa, as further described in Note 3, Acquisitions and Dispositions, the Company assumed the project’s financing agreement, which included a $22 million construction loan that converts to a term loan upon the project reaching substantial completion, a $55 milliontax equity bridge loan and a $26 million sponsor equity bridge loan. The sponsor equity bridge loan was repaid at acquisition date, along with $2 million in associated fees, utilizing $12 million from the cash equity investor, as well as $16 million of the Company’s purchase price, which was contributed back by CEG. The tax equity bridge loan will be repaid with the final proceeds from the tax equity investor that will be received upon Waiawa reaching substantial completion, which is expected to occur in the first half of 2023. Subsequent to the Waiawa acquisition, the Company borrowed an additional $20 million in construction loans. As of December 31, 2022, the Company had $42 million in outstanding construction loans in addition to the $55 million tax equity bridge loan referenced above.
Capistrano Wind Portfolio
On August 22, 2022, as part of the acquisition of the Capistrano Wind Portfolio, as further described in Note 3, Acquisitions and Dispositions, the Company assumed non-recourse project-level debt totaling $164 million held by the Broken Bow, Cedro Hill and Crofton Bluffs wind projects, which is net of $2 million in previously deferred unamortized debt issuance costs. The non-recourse project-level debt bears interest atAs discussed above, in connection with the Company’s entry into a ratenew financing agreement related to the repowering of LIBOR plus an applicable margin, which is currently 2.00% per annum, and maturities range from September 30, 2029 to July 14, 2031.the Cedro Hill wind project, the Company repaid $72 million of outstanding principal under the original financing agreement.
Mililani I and Waiawa
On October 3, 2022, as part of the acquisition of Waiawa, as further described in Note 3, Acquisitions and Dispositions, the Company assumed the project’s financing agreement, which included a $22 million construction loan, a $55 million tax equity bridge loan and a $27 million sponsor equity bridge loan, offset by $1 million in unamortized debt issuance costs. The sponsor equity bridge loan was repaid at acquisition date, along with $2 million in associated fees, utilizing $12 million from the cash equity investor, as well as $16 million of the Company’s purchase price, which was contributed back by CEG. On March 30, 2023, when the project reached substantial completion, the tax equity investor contributed an additional $41 million and CEG contributed an additional $8 million, which was utilized, along with the $17 million in escrow, to repay the $55 million tax equity bridge loan, to fund $10 million in construction completion reserves and to pay $1 million in associated fees. Subsequent to the acquisition, the Company borrowed an additional $25 million in construction loans and the total outstanding construction loans were converted to a term loan in the amount of $47 million on March 30, 2023.
On March 25, 2022, as part of the acquisition of Mililani I, as further described in Note 3, Acquisitions and Dispositions, the Company assumed the project’s financing agreement, which included a $16 million construction loan, that converts to a term loan upon the project reaching substantial completion, a $60 million tax equity bridge loan and a $27 million sponsor equity bridge loan.loan, offset by $3 million in unamortized debt issuance costs. The sponsor equity bridge loan was repaid at acquisition date, along with $2 million in associated fees, utilizing $14 million from the cash equity investor, as well as $15 million of the Company’s purchase price, which was contributed back by CEG. On December 7, 2022, when the project reached substantial completion, the tax equity investor contributed an additional $42 million and CEG contributed an additional $11 million, which was utilized, along with the $18 million in escrow, to repay the $60 million tax equity bridge loan, to fund $7 million in construction completion reserves and to pay $4 million in associated fees. Subsequent to the Mililani I acquisition, the Company had borrowed an additional $32 million in construction loans that wasand the total outstanding construction loans were converted to a term loan in the amount of $48 million. Asmillion on December 7, 2022.
On July 21, 2023, Mililani I’s financing agreement was amended to merge the project-level debt of December 31, 2022, the Company hadMililani I and Waiawa as a $47 millioncombined term loan outstanding, as $1 million was paid in December 2022.under Mililani Class B Member Holdco LLC that matures on July 21, 2028.
Viento Funding II, LLC
On March 16, 2022, the Company, through its indirect subsidiary, Viento Funding II, LLC, entered into a financing agreement which included the issuance of a $190 million term loan as well as $35 million in letters of credit, supported by the Company’s interests in the Elkhorn Ridge, Laredo Ridge, San Juan Mesa and Taloga wind projects. The term loan bears annual interest at a rate of SOFR plus a spread of 0.10% and an applicable margin, which is 1.375% per annum through the fourth anniversary of the term loan and 1.50% per annum thereafter through the maturity date of March 16, 2029. The proceeds from the term loan were used to pay off the existing debt in the amount of $186 million related to Laredo Ridge, Tapestry Wind LLC and Viento Funding II, LLC and to pay related financing costs. The Company recorded a loss on debt extinguishment of $2 million to expense unamortized debt issuance costs.
Agua Caliente Solar LLC
As part of the acquisition of Agua Caliente Borrower 1 LLC and the consolidation of Agua Caliente, as further described in Note 3, Acquisitions and Dispositions, the Company consolidated non-recourse debt of $716 million related to Agua Caliente Solar, LLC on February 3, 2021. The debt consists of a credit agreement with the Federal Financing Bank and accrues interest at fixed rates between 2.395% and 3.633%, which matures in 2037.
Pinnacle Repowering Partnership HoldCo LLC
On March 10, 2021, the Company entered into a financing agreement for non-recourse debt for a total commitment of $126 million related to the repowering of the Pinnacle wind project. The debt consists of a construction loan at an interest rate of LIBOR plus 1.00%. The Company’s initial borrowings of $79 million were utilized to repay $53 million of the outstanding balance under the Tapestry Wind LLC financing agreement, which related to the Pinnacle wind project, to pay vendor invoices and fees and to acquire certain equipment from Clearway Renew LLC to be utilized in the repowering project. On December 15, 2021, the Company repaid the outstanding principal amount of $117 million.
Interest Rate Swaps — Project Financings
Many of the Company’s project subsidiaries entered into interest rate swaps, intended to hedge the risks associated with interest rates on non-recourse project level debt. These swaps amortize in proportion to their respective loans and are floating for a fixed rate where the project subsidiary pays its counterparty the equivalent of a fixed interest payment on a predetermined notional amount and will receive quarterly the equivalent of a floating interest payment based on the same notional amount. All interest rate swap payments by the project subsidiary and its counterparty are made quarterly and the LIBOR or SOFR is determined in advance of each interest period.
The following table summarizes the swaps, some of which are forward starting as indicated, related to the Company’s project level debt as of December 31, 2022:debt:
| | % of Principal | | Fixed Interest Rate | | Floating Interest Rate | | Notional Amount at December 31, 2022 (In millions) | | Effective Date | | Maturity Date |
| | % of Principal | | | | % of Principal | | Fixed Interest Rate | | Floating Interest Rate | | Notional Amount at December 31, 2023 (In millions) | | Effective Date | | Maturity Date |
| Avra Valley | Avra Valley | | 88 | % | | 2.333 | % | | 3-Month LIBOR | | $ | 32 | | | November 30, 2012 | | November 30, 2030 | Avra Valley | | 85 | % | | 2.20 | % | | SOFR | | $ | 29 | | | March 31, 2023 | | March 31, 2023 | | January 31, 2031 |
| Alta Wind Asset Management | Alta Wind Asset Management | | 100 | % | | 2.470 | % | | 3-Month LIBOR | | 12 | | | May 22, 2013 | | May 15, 2031 | Alta Wind Asset Management | | 100 | % | | 2.22 | % | | SOFR | | 11 | | | May 22, 2013 | | May 22, 2013 | | May 15, 2031 |
| Borrego | Borrego | | 100 | % | | 0.476 | % | | 3-Month LIBOR | | 6 | | | June 30, 2020 | | December 31, 2024 | Borrego | | 100 | % | | 0.21 | % | | SOFR | | 3 | | | June 30, 2020 | | June 30, 2020 | | December 31, 2024 |
| Broken Bow | | Broken Bow | | 90 | % | | Various | | SOFR | | 37 | | | Various |
| Buckthorn Solar | Buckthorn Solar | | 81 | % | | Various | | 3-Month LIBOR | | 96 | | | February 28, 2018 | | December 31, 2041 | Buckthorn Solar | | 80 | % | | Various | | SOFR | | 93 | | | February 28, 2018 | | February 28, 2018 | | December 31, 2041 |
| Carlsbad Energy Holdings | Carlsbad Energy Holdings | | 100 | % | | Various | | 3-Month LIBOR | | 115 | | | Various | | September 30, 2027 | Carlsbad Energy Holdings | | 100 | % | | Various | | SOFR | | 93 | | | Various | | Various | | September 30, 2027 |
| Capistrano Wind Portfolio | | 95 | % | | Various | | 3-Month LIBOR | | 148 | | | Various | | Various |
| Cedro Hill | | Cedro Hill | | 86 | % | | Various | | SOFR | | 142 | | | December 12, 2023 | | Various |
| Crofton Bluffs | | Crofton Bluffs | | 90 | % | | Various | | SOFR | | 24 | | | Various |
| Daggett 2 | | Daggett 2 | | 90 | % | | 2.22 | % | | SOFR | | 141 | | | August 3, 2022 | | March 31, 2043 |
| Daggett 3 | | Daggett 3 | | 86 | % | | 1.91 | % | | SOFR | | 186 | | | Various | | September 30, 2043 |
| Kansas South | Kansas South | | 75 | % | | 2.368 | % | | 6-Month LIBOR | | 14 | | | June 28, 2013 | | December 31, 2030 | Kansas South | | 75 | % | | 1.93 | % | | SOFR | | 12 | | | June 28, 2013 | | June 28, 2013 | | December 31, 2030 |
| Marsh Landing | | 100 | % | | Various | | 3-Month LIBOR | | 19 | | | June 28, 2013 | | June 30, 2023 |
| Mililani I | | 94 | % | | 2.041 | % | | 3-Month LIBOR | | 44 | | | September 30, 2022 | | September 30, 2042 |
| Mililani Class B | | Mililani Class B | | 98 | % | | Various | | SOFR | | 90 | | | Various |
| NIMH Solar | NIMH Solar | | 100 | % | | Various | | 3-Month LIBOR | | 163 | | | September 30, 2020 | | Various | NIMH Solar | | 100 | % | | Various | | SOFR | | 148 | | | September 30, 2020 | | September 30, 2020 | | Various |
| Oahu Solar | Oahu Solar | | 96 | % | | Various | | 3-Month LIBOR | | 80 | | | November 30, 2019 | | October 31, 2040 | Oahu Solar | | 96 | % | | 2.47 | % | | SOFR | | 77 | | | November 30, 2019 | | November 30, 2019 | | October 31, 2040 |
| Rosie Class B | Rosie Class B | | 95 | % | | 1.446 | % | | 3-Month LIBOR | | 73 | | | December 31, 2020 | | Various | Rosie Class B | | 53 | % | | Various | | SOFR | | 182 | | | Various | | Various |
| South Trent | South Trent | | 90 | % | | 3.847 | % | | 3-Month LIBOR | | 27 | | | June 14, 2019 | | June 30, 2028 | South Trent | | 90 | % | | Various | | SOFR | | 22 | | | June 14, 2019 | | June 14, 2019 | | June 30, 2028 |
| Texas Solar Nova 1 | | Texas Solar Nova 1 | | 94 | % | | 2.92 | % | | SOFR | | 97 | | | October 31, 2022 | | June 30, 2043 |
| Viento Funding II | Viento Funding II | | 90 | % | | 2.530 | % | | 3-Month SOFR | | 165 | | | Various | | Various | Viento Funding II | | 90 | % | | 2.53 | % | | SOFR | | 158 | | | Various | | Various | | December 31, 2032 |
| Waiawa | | 50 | % | | 2.088 | % | | 3-Month LIBOR | | 48 | | | December 31, 2022 | | December 31, 2042 |
| Walnut Creek | | 94 | % | | 3.543 | % | | 3-Month LIBOR | | 18 | | | June 28, 2013 | | May 31, 2023 |
| WCEP Holdings | | 92 | % | | 4.003 | % | | 3-Month LIBOR | | 24 | | | June 28, 2013 | | May 31, 2023 |
| Victory Pass and Arica | | Victory Pass and Arica | | 122 | % | | 4.18 | % | | SOFR | | 922 | | | November 30, 2022 | | January 31, 2024 |
| Total | Total | | $ | 1,084 | | |
Annual Maturities
Annual payments based on the maturities of the Company’s debt, for the years ending after December 31, 2022,2023, are as follows:
| | (In millions) |
2023 (a) | $ | 421 | |
| 2024 | 410 | |
| (In millions) | | | (In millions) |
2024 (a) | |
| 2025 | 2025 | 382 | |
2026 | 2026 | 361 | |
2027 | 2027 | 399 | |
2028 | |
| Thereafter | Thereafter | 4,899 | |
| Total | Total | $ | 6,872 | |
|
(a) At December 31, 2022,2023, amount includes $97 million$1.11 billion of construction-related financings recorded in long-term debt on the Company’s consolidated balance sheet that is due in 20232024 and is either being funded through long-term equity contributions or is converting to long-term debt.
Note 11 — Members’ Equity
The following table lists the distributions paid on the Company’s Class A, Class B, Class C and Class D units during the year ended December 31, 2022:2023:
| | Fourth Quarter 2022 | | Third Quarter 2022 | | Second Quarter 2022 | | First Quarter 2022 |
| Fourth Quarter 2023 | | | Fourth Quarter 2023 | | Third Quarter 2023 | | Second Quarter 2023 | | First Quarter 2023 |
| Distributions per Class A and Class B units | Distributions per Class A and Class B units | $ | 0.3672 | | | $ | 0.3604 | | | $ | 0.3536 | | | $ | 0.3468 | |
| Distributions per Class C and Class D units | Distributions per Class C and Class D units | 0.3672 | | | 0.3604 | | | 0.3536 | | | 0.3468 | |
On February 15, 2023,14, 2024, the Company declared a quarterly distribution on its Class A, Class B, Class C and Class D units of $0.3745$0.4033 per unit payable on March 15, 2023.
In addition to the quarterly distributions, the Company paid $19$51 million in additional distributions, $11$30 million of which was distributed to Clearway, Inc. and $8$21 million of which was distributed to CEG, during the third quarter of 2022year ended December 31, 2023, in order for Clearway, Inc. to make certain additional tax payments primarily associated with the sale of the Thermal Business.
Note 12 — Segment Reporting
The Company’s segment structure reflects how management currently operates and allocates resources. The Company’s businesses are segregated based on conventional power generation and renewable businesses, which consist of solar, and wind and the Thermal Business, which was sold on May 1, 2022, as further described in Note 3, Acquisitions and Dispositions.energy storage. The Corporate segment reflects the Company’s corporate costs and includes eliminating entries. The Company’s chief operating decision maker, its Chief Executive Officer, evaluates the performance of its segments based on operational measures including adjusted earnings before interest, taxes, depreciation and amortization, or Adjusted EBITDA and CAFD, as well as net income (loss).
TheApproximately 50% of the Company’s operating revenues and assets relate to operations located in California. Also, the Company generated more than 10% of its revenues from the following customers for the years ended December 31, 2023, 2022 2021 and 2020:2021:
| | 2022 | | 2021 | | 2020 |
| 2023 | | | 2023 | | 2022 | | 2021 |
| Customer | Customer | Conventional | | Renewables | | Conventional | | Renewables | | Conventional | | Renewables | Customer | Conventional | | Renewables | | Conventional | | Renewables | | Conventional | | Renewables |
| SCE | SCE | 17% | | 17% | | 17% | | 16% | | 18% | | 16% | SCE | 11% | | 13% | | 17% | | 16% |
| PG&E | PG&E | 10% | | 15% | | 10% | | 13% | | 10% | | 8% | PG&E | 4% | | 13% | | 10% | | 15% | | 10% | | 13% |
| | | | | | | | | | | | | | | | | | | | | | | | | | | | | |
| Year ended December 31, 2022 |
| (In millions) | Conventional Generation | | Renewables | | Thermal | | Corporate (a) | | Total |
| Operating revenues | $ | 417 | | | $ | 696 | | | $ | 77 | | | $ | — | | | $ | 1,190 | |
| Cost of operations, exclusive of depreciation, amortization and accretion shown separately below | 89 | | | 298 | | | 50 | | | (2) | | | 435 | |
| Depreciation, amortization and accretion | 131 | | | 381 | | | — | | | — | | | 512 | |
| Impairment losses | — | | | 16 | | | — | | | — | | | 16 | |
| General and administrative | — | | | — | | | 2 | | | 36 | | | 38 | |
| Transaction and integration costs | — | | | — | | | — | | | 7 | | | 7 | |
| Development costs | — | | | — | | | 2 | | | — | | | 2 | |
| Total operating costs and expenses | 220 | | | 695 | | | 54 | | | 41 | | | 1,010 | |
| Gain on sale of business | — | | | — | | | — | | | 1,292 | | | 1,292 | |
| Operating income | 197 | | | 1 | | | 23 | | | 1,251 | | | 1,472 | |
| Equity in earnings of unconsolidated affiliates | 3 | | | 26 | | | — | | | — | | | 29 | |
| | | | | | | | | |
| | | | | | | | | |
| Other income, net | 1 | | | 6 | | | — | | | 10 | | | 17 | |
| Loss on debt extinguishment | — | | | (2) | | | — | | | — | | | (2) | |
| Interest expense | (40) | | | (87) | | | (6) | | | (99) | | | (232) | |
| Income (loss) before income taxes | 161 | | | (56) | | | 17 | | | 1,162 | | | 1,284 | |
| Income tax expense | — | | | 2 | | | — | | | — | | | 2 | |
| Net Income (Loss) | 161 | | | (58) | | | 17 | | | 1,162 | | | 1,282 | |
| | | | | | | | | |
| Net Income Attributable to Clearway Energy LLC | $ | 161 | | | $ | 49 | | | $ | 17 | | | $ | 1,161 | | | $ | 1,388 | |
| Balance Sheet | | | | | | | | | |
| Equity investments in affiliates | $ | 82 | | | $ | 282 | | | $ | — | | | $ | — | | | $ | 364 | |
Capital expenditures (b)(c) | 11 | | | 33 | | | 11 | | | 1 | | | 56 | |
| Total Assets | $ | 2,251 | | | $ | 9,515 | | | $ | — | | | $ | 546 | | | $ | 12,312 | |
| | | | | | | | | | | | | | | | | | | | | | | | | |
| Year ended December 31, 2023 |
| (In millions) | Conventional Generation | | Renewables | | | | Corporate (a) | | Total |
| Operating revenues | $ | 420 | | | $ | 894 | | | | | $ | — | | | $ | 1,314 | |
| Cost of operations, exclusive of depreciation, amortization and accretion shown separately below | 154 | | | 321 | | | | | (2) | | | 473 | |
| Depreciation, amortization and accretion | 129 | | | 397 | | | | | — | | | 526 | |
| Impairment losses | — | | | 12 | | | | | — | | | 12 | |
| General and administrative | — | | | — | | | | | 35 | | | 35 | |
| Transaction and integration costs | — | | | — | | | | | 4 | | | 4 | |
| | | | | | | | | |
| Operating income (loss) | 137 | | | 164 | | | | | (37) | | | 264 | |
| Equity in earnings of unconsolidated affiliates | 3 | | | 9 | | | | | — | | | 12 | |
| | | | | | | | | |
| | | | | | | | | |
| Other income, net | 4 | | | 24 | | | | | 24 | | | 52 | |
| Loss on debt extinguishment | — | | | (6) | | | | | — | | | (6) | |
| Interest expense | (35) | | | (205) | | | | | (97) | | | (337) | |
| Income (loss) before income taxes | 109 | | | (14) | | | | | (110) | | | (15) | |
| Income tax benefit | — | | | (2) | | | | | — | | | (2) | |
| Net Income (Loss) | 109 | | | (12) | | | | | (110) | | | (13) | |
| | | | | | | | | |
| | | | | | | | | |
| Net Income (Loss) Attributable to Clearway Energy LLC | $ | 109 | | | 150 | | | | | $ | (110) | | | $ | 149 | |
| Balance Sheet | | | | | | | | | |
| Equity investments in affiliates | $ | 79 | | | $ | 281 | | | | | $ | — | | | $ | 360 | |
Capital expenditures (b) | 11 | | | 146 | | | | | — | | | 157 | |
| Total Assets | $ | 2,058 | | | $ | 12,205 | | | | | $ | 425 | | | $ | 14,688 | |
(a) Includes eliminationseliminations.
(b) Includes accrualsaccruals.
| | | | | | | | | | | | | | | | | | | | | | | | | | | | | |
| Year ended December 31, 2022 |
| (In millions) | Conventional Generation | | Renewables | | Thermal | | Corporate (a) | | Total |
| Operating revenues | $ | 417 | | | $ | 696 | | | $ | 77 | | | $ | — | | | $ | 1,190 | |
| Cost of operations, exclusive of depreciation, amortization and accretion shown separately below | 89 | | | 298 | | | 50 | | | (2) | | | 435 | |
| Depreciation, amortization and accretion | 131 | | | 381 | | | — | | | — | | | 512 | |
| Impairment losses | — | | | 16 | | | — | | | — | | | 16 | |
| General and administrative | — | | | — | | | 2 | | | 36 | | | 38 | |
| Transaction and integration costs | — | | | — | | | — | | | 7 | | | 7 | |
| Development costs | — | | | — | | | 2 | | | — | | | 2 | |
| Total operating costs and expenses | 220 | | | 695 | | | 54 | | | 41 | | | 1,010 | |
| Gain on sale of business | — | | | — | | | — | | | 1,292 | | | 1,292 | |
| Operating income | 197 | | | 1 | | | 23 | | | 1,251 | | | 1,472 | |
| Equity in earnings of unconsolidated affiliates | 3 | | | 26 | | | — | | | — | | | 29 | |
| | | | | | | | | |
| | | | | | | | | |
| Other income, net | 1 | | | 6 | | | — | | | 10 | | | 17 | |
| Loss on debt extinguishment | — | | | (2) | | | — | | | — | | | (2) | |
| Interest expense | (40) | | | (87) | | | (6) | | | (99) | | | (232) | |
| Income (loss) before income taxes | 161 | | | (56) | | | 17 | | | 1,162 | | | 1,284 | |
| Income tax expense | — | | | 2 | | | — | | | — | | | 2 | |
| Net Income (Loss) | 161 | | | (58) | | | 17 | | | 1,162 | | | 1,282 | |
| | | | | | | | | |
| Net Income Attributable to Clearway Energy LLC | $ | 161 | | | $ | 49 | | | $ | 17 | | | $ | 1,161 | | | $ | 1,388 | |
| Balance Sheet | | | | | | | | | |
| Equity investments in affiliates | $ | 82 | | | $ | 282 | | | $ | — | | | $ | — | | | $ | 364 | |
Capital expenditures (b)(c) | 11 | | | 33 | | | 11 | | | 1 | | | 56 | |
| Total Assets | $ | 2,251 | | | $ | 9,515 | | | $ | — | | | $ | 546 | | | $ | 12,312 | |
(a) Includes eliminations.
(b) Includes accruals.
(c) Thermal capital expenditures, including accruals, prior to the sale of the Thermal Business on May 1, 2022.
| | Year ended December 31, 2021 |
| Year ended December 31, 2021 | | | Year ended December 31, 2021 |
| (In millions) | (In millions) | Conventional Generation | | Renewables | | Thermal | | Corporate (a) | | Total | (In millions) | Conventional Generation | | Renewables | | Thermal | | Corporate (a) | | Total |
| Operating revenues | Operating revenues | $ | 441 | | | $ | 641 | | | $ | 204 | | | $ | — | | | $ | 1,286 | |
| Cost of operations, exclusive of depreciation, amortization and accretion shown separately below | Cost of operations, exclusive of depreciation, amortization and accretion shown separately below | 90 | | | 229 | | | 134 | | | (2) | | | 451 | |
| Depreciation, amortization and accretion | Depreciation, amortization and accretion | 132 | | | 354 | | | 23 | | | — | | | 509 | |
| Impairment losses | Impairment losses | — | | | 6 | | | — | | | — | | | 6 | |
| General and administrative | General and administrative | — | | | — | | | 4 | | | 34 | | | 38 | |
| Transaction and integration costs | Transaction and integration costs | — | | | — | | | — | | | 7 | | | 7 | |
| Development costs | Development costs | — | | | — | | | 4 | | | 2 | | | 6 | |
| Operating income (loss) | Operating income (loss) | 219 | | | 52 | | | 39 | | | (41) | | | 269 | |
| Equity in earnings of unconsolidated affiliates | Equity in earnings of unconsolidated affiliates | 6 | | | 26 | | | — | | | — | | | 32 | |
| | Other income, net | Other income, net | — | | | 2 | | | 1 | | | — | | | 3 | |
| | Other income, net | |
| | Other income, net | |
| Loss on debt extinguishment | Loss on debt extinguishment | — | | | (1) | | | — | | | (52) | | | (53) | |
| Interest expense | Interest expense | (53) | | | (142) | | | (18) | | | (99) | | | (312) | |
| Income (loss) before income taxes | Income (loss) before income taxes | 172 | | | (63) | | | 22 | | | (192) | | | (61) | |
| Income tax expense | Income tax expense | — | | | 2 | | | — | | | — | | | 2 | |
| Net Income (Loss) | Net Income (Loss) | 172 | | | (65) | | | 22 | | | (192) | | | (63) | |
| | Net Income (Loss) Attributable to Clearway Energy LLC | Net Income (Loss) Attributable to Clearway Energy LLC | $ | 172 | | | $ | 109 | | | $ | 22 | | | $ | (193) | | | $ | 110 | |
| Balance Sheet | | | | | | | | | |
| Equity investments in affiliates | $ | 86 | | | $ | 295 | | | $ | — | | | $ | — | | | $ | 381 | |
Capital expenditures (b) | 12 | | | 77 | | | 29 | | | 1 | | | 119 | |
| Total Assets | $ | 2,442 | | | $ | 9,603 | | | $ | 631 | | | $ | 42 | | | $ | 12,718 | |
| Net Income (Loss) Attributable to Clearway Energy LLC | |
| Net Income (Loss) Attributable to Clearway Energy LLC | |
(a) Includes eliminations
(b) Includes accruals
| | | | | | | | | | | | | | | | | | | | | | | | | | | | | |
| Year ended December 31, 2020 |
| (In millions) | Conventional Generation | | Renewables | | Thermal | | Corporate (a) | | Total |
| Operating revenues | $ | 437 | | | $ | 569 | | | $ | 193 | | | $ | — | | | $ | 1,199 | |
| Cost of operations, exclusive of depreciation, amortization and accretion shown separately below | 90 | | | 147 | | | 131 | | | (2) | | | 366 | |
| Depreciation, amortization and accretion | 132 | | | 264 | | | 32 | | | — | | | 428 | |
| Impairment losses | — | | | 24 | | | — | | | — | | | 24 | |
| General and administrative | — | | | — | | | 3 | | | 30 | | | 33 | |
| Transaction and integration costs | — | | | — | | | — | | | 9 | | | 9 | |
| Development costs | — | | | — | | | 5 | | | — | | | 5 | |
| Operating income (loss) | 215 | | | 134 | | | 22 | | | (37) | | | 334 | |
| Equity in earnings (losses) of unconsolidated affiliates | 8 | | | (1) | | | — | | | — | | | 7 | |
| Impairment loss on investment | — | | | (8) | | | — | | | — | | | (8) | |
| Gain on sale of unconsolidated affiliates | — | | | — | | | — | | | 49 | | | 49 | |
| Other income, net | 1 | | | 4 | | | — | | | (1) | | | 4 | |
| Loss on debt extinguishment | — | | | (21) | | | — | | | (3) | | | (24) | |
| Interest expense | (84) | | | (216) | | | (19) | | | (95) | | | (414) | |
| Net Income (Loss) | 140 | | | (108) | | | 3 | | | (87) | | | (52) | |
| | | | | | | | | |
| Net Income (Loss) Attributable to Clearway Energy LLC | $ | 140 | | | $ | 4 | | | $ | 3 | | | $ | (86) | | | $ | 61 | |
(a) Includes eliminationseliminations.
Note 13 — Related Party Transactions
In addition to the transactions and relationships described elsewhere in the notes to the consolidated financial statements, certain subsidiaries of CEG provide services to the Company and its project entities. Amounts due to CEG subsidiaries are recorded as accounts payable — affiliates and amounts due to the Company from CEG subsidiaries are recorded as accounts receivable — affiliates in the Company’s consolidated balance sheets. The disclosures below summarize the Company’s material related party transactions with CEG and its subsidiaries that are included in the Company’s operating costs.
O&M Services Agreements by and between the Company and Clearway Renewable Operation & Maintenance LLC
Various wholly-owned subsidiaries of the Company in the Renewables segment are party to services agreements with Clearway Renewable Operation & Maintenance LLC, or RENOM, a wholly-owned subsidiary of CEG, which provides operation and maintenance, or O&M, services to these subsidiaries. The Company incurred total expenses for these services of $73 million, $71 million $56 million and $37$56 million for the years ended December 31, 2023, 2022 2021 and 2020,2021, respectively. There was a balance of $14$13 million and $9$14 million due to RENOM as of December 31, 20222023 and 2021,2022, respectively.
Administrative Services Agreements by and between the Company and CEG
Various wholly-owned subsidiaries of the Company are parties to services agreements with Clearway Asset Services LLC and Clearway Solar Asset Management LLC, two wholly-owned subsidiaries of CEG, which provide various administrative services to the Company’s subsidiaries. The Company incurred expenses under these agreements of $20 million, $16 million $14 million and $10$14 million for the years ended December 31, 2023, 2022 2021 and 2020,2021, respectively. There was a balance of $3$2 million and $2$3 million due to CEG as of December 31, 20222023 and 2021,2022, respectively.
CEG Master Services Agreements
The Company is a party to the CEG Master Services Agreements, with CEG, or MSAs, pursuant to which CEG and certain of its affiliates or third-party service providers provide certain services to the Company, including operational and administrative services, which include human resources, information systems, cybersecurity, external affairs, accounting, procurement and risk management services, and the Company provides certain services to CEG, including accounting, internal audit, tax and treasury services, in exchange for the payment of fees in respect of such services. The Company incurred net expenses of $5 million $4 million and $2 million under these agreements for each of the years ended December 31, 2023 and 2022 2021 and 2020, respectively.$4 million for the year ended December 31, 2021.
Note 14 — Commitments and Contingencies
Gas and Transportation Commitments
The Company haspreviously entered into contractual arrangements to procure power, fuel and associated transportation services for the Thermal Business. ForBusiness, which was sold to KKR on May 1, 2022, as further discussed in Note 3, Acquisitions and Dispositions. Under these arrangements, the Company purchased $20 million and $40 million for the years ended December 31, 2022 and 2021, and 2020, the Company purchased $20 million, $40 million, and $32 million, respectively, under such arrangements.
On May 1, 2022, the Company completed the sale of 100% of its interests in the Thermal Business to KKR. For further details of the Thermal Disposition, refer to Note 3, Acquisitions and Dispositions.respectively.
Contingencies
The Company’s material legal proceeding is described below. The Company believes that it has a valid defense to this legal proceeding and intends to defend it vigorously. The Company records reserves for estimated losses from contingencies when information available indicates that a loss is probable and the amount of the loss, or range of loss, can be reasonably estimated. As applicable, the Company has establishedwill establish an adequate reserve for the matter discussed below.ongoing legal matters. In addition, legal costs are expensed as incurred. Management assesses such matters based on current information and makes a judgment concerning its potential outcome, considering the nature of the claim, the amount and nature of damages sought and the probability of success. The Company is unable to predict the outcome of theongoing legal proceeding belowproceedings or reasonably estimate the scope or amount of any associated costs and potential liabilities. As additional information becomes available, management adjusts its assessment and estimate of the contingencycontingencies accordingly. Because litigation is subject to inherent uncertainties and unfavorable rulings or developments, it is possible that the ultimate resolution of the Company’s liabilities and contingencies could be at amounts that are different from its currently recorded reserves and that such difference could be material.
In addition to the legal proceeding noted below, theThe Company and its subsidiaries are party to other litigation or legal proceedings arising in the ordinary course of business. In management’s opinion, the disposition of these ordinary course matters will not materially adversely affect the Company’s consolidated financial position, results of operations or cash flows.
Buckthorn Solar Litigation
On October 8, 2019, the City of Georgetown, Texas, or Georgetown, filed a petition in the District Court of Williamson County, Texas naming Buckthorn Westex, LLC, the Company’s subsidiary that owns the Buckthorn Westex solar project, as the defendant, alleging fraud by nondisclosure and breach of contract in connection with the project and the PPA, and seeking (i) rescission and/or cancellation of the PPA, (ii) declaratory judgment that the alleged breaches constitute an event of default under the PPA entitling Georgetown to terminate, and (iii) recovery of all damages, costs of court, and attorneys’ fees. On November 15, 2019, Buckthorn Westex filed an original answer and counterclaims (i) denying Georgetown’s claims, (ii) alleging Georgetown has breached its contracts with Buckthorn Westex by failing to pay amounts due, and (iii) seeking relief in the form of (x) declaratory judgment that Georgetown’s alleged failure to pay amounts due constitute breaches of and an event of default under the PPA and that Buckthorn did not commit any events of default under the PPA, (y) recovery of costs, expenses, interest, and attorneys’ fees, and (z) such other relief to which it is entitled at law or in equity. On November 14, 2023, the two parties entered into a settlement agreement to resolve all claims related to this litigation, following which settlement the claims were dismissed by the court with prejudice. The case is currently in discovery and is expectedamounts paid pursuant to proceedthe settlement agreement had an immaterial impact to trial in June 2023. Buckthorn Westex believes the allegations of Georgetown are meritless, and Buckthorn Westex is vigorously defending its rights under the PPA.Company’s financial statements.
Note 15 — Leases
Accounting for Leases
The Company evaluates each arrangement at inception to determine if it contains a lease. Substantially all of the Company’s leases are operating leases.
Lessee
The Company records its operating lease liabilities at the present value of the lease payments over the lease term at lease commencement date. Lease payments include fixed payment amounts as well as variable rate payments based on an index initially measured at lease commencement date. Variable payments, including payments based on future performance and based on index changes, are recorded when the expense is probable. The Company determines the relevant lease term by evaluating whether renewal and termination options are reasonably certain to be exercised. The Company uses its incremental borrowing rate to calculate the present value of the lease payments, based on information available at the lease commencement date.
The Company’s leases consist of land leases for numerous operating asset locations, real estate leases and equipment leases. The terms and conditions for these leases vary by the type of underlying asset. Certain of these leases have both lease and non-lease components and the Company has elected to apply the practical expedient to not separate these components.
Lease expense for the years ended December 31, 2022, 2021 and 2020 was comprised of the following:
| | | Year Ended December 31, | | | | Year Ended December 31, |
| (In millions) | (In millions) | | December 31, 2022 | | December 31, 2021 | | December 31, 2020 | (In millions) | | 2023 | | 2022 | | 2021 |
| Operating lease cost - Fixed | Operating lease cost - Fixed | | $ | 36 | | | $ | 27 | | | $ | 19 | |
| | Operating lease cost - Variable | Operating lease cost - Variable | | 11 | | | 15 | | | 9 | |
| Operating lease cost - Variable | |
| Operating lease cost - Variable | |
| Total lease cost | Total lease cost | | $ | 47 | | | $ | 42 | | | $ | 28 | |
Operating lease information as of December 31, 2022 and 2021 was as follows:
| | (In millions, except term and rate) | (In millions, except term and rate) | | December 31, 2022 | | December 31, 2021 | (In millions, except term and rate) | | December 31, 2023 | | December 31, 2022 |
Right-of-use assets - operating leases, net | | $ | 527 | | | $ | 550 | |
Right-of-use assets - operating leases, net (a) | |
| Short-term lease liability - operating leases (a) | | $ | 6 | | | $ | 8 | |
| Long-term lease liability - operating leases | | 548 | | | 561 | |
Short-term lease liability - operating leases (b) | |
Short-term lease liability - operating leases (b) | |
Short-term lease liability - operating leases (b) | |
Long-term lease liability - operating leases (a) | |
| Total lease liabilities | Total lease liabilities | | $ | 554 | | | $ | 569 | |
| | Weighted average remaining lease term (in years) | |
| Weighted average remaining lease term (in years) | |
| Weighted average remaining lease term (in years) | Weighted average remaining lease term (in years) | | 27 | | 28 | | 28 | | 27 |
| Weighted average discount rate | Weighted average discount rate | | 4.1 | % | | 3.5 | % | Weighted average discount rate | | 4.2 | % | | 4.1 | % |
| | Cash paid for operating leases | Cash paid for operating leases | | $ | 28 | | | $ | 26 | |
| Cash paid for operating leases | |
| Cash paid for operating leases | |
(a) Increases in right-of-use assets and long-term lease liabilities are primarily due to Drop Down Asset acquisitions, as further described in Note 3, Acquisitions and Dispositions.
(b) Short-term lease liability balances are included within the accrued expenses and other current liabilities line item of the consolidated balance sheets as of December 31, 20222023 and 2021.2022.
Minimum future rental payments of operating lease liabilities as of December 31, 20222023 are as follows:
| | | | | | | | |
| | (In millions) |
| 2023 | | $ | 28 | |
| 2024 | | 30 | |
| 2025 | | 30 | |
| 2026 | | 31 | |
| 2027 | | 32 | |
| Thereafter | | 831 | |
Total lease payments | | 982 | |
| Less imputed interest | | (428) | |
| Total lease liability - operating leases | | $ | 554 | |
Mililani I Lease Agreement | | | | | | | | |
| | (In millions) |
| 2024 | | $ | 34 | |
| 2025 | | 34 | |
| 2026 | | 35 | |
| 2027 | | 36 | |
| 2028 | | 36 | |
| Thereafter | | 980 | |
Total lease payments | | 1,155 | |
| Less imputed interest | | (521) | |
| Total lease liability - operating leases | | $ | 634 | |
The Mililani I projectCompany is party to a land lease agreement with a wholly-owned subsidiary of CEG. The project is leasing the land for a period of 36 years. The Company has a lease liability of $20 million as of December 31, 2022 and a corresponding right-of-use asset of $19 million related to the lease as of December 31, 2022.
Oahu Solar Lease Agreements
The Oahu Solar projects are party to various land lease agreements with a wholly-owned subsidiarysubsidiaries of CEG.CEG that are accounted for as operating leases. The projects are leasingfollowing table summarizes the land for a period of 35 years, withlease agreements:
| | | | | | | | | | | | | | | | | | | | |
| (In millions) | | Right-of-use assets, net | | Long-term lease liabilities | | Lease expiration |
| As of December 31, 2023 | | | | | | |
| Daggett 2 | | $ | 22 | | | $ | 23 | | | June 30, 2058 |
| Daggett 3 | | 31 | | | 33 | | | December 18, 2062 |
| Mililani I | | 19 | | | 20 | | | March 31, 2057 |
Oahu Solar (a) | | 17 | | | 20 | | | August 1, 2057 |
Rosamond Central (a) | | 11 | | | 12 | | | March 31, 2056 |
| As of December 31, 2022 | | | | | | |
| Mililani I | | $ | 19 | | | $ | 20 | | | |
Oahu Solar (a) | | 17 | | | 20 | | | |
Rosamond Central (a) | | 11 | | | 12 | | | |
(a) The Company has the ability to renew the leaseextend each of these leases for two additional five-year periods. The Company has a lease liability of $20 million as of both December 31, 2022 and 2021 and a corresponding right-of-use asset related to the lease of $17 million and $18 million as of December 31, 2022 and 2021, respectively.
Rosamond Central Lease Agreement
The Rosamond Central project is party to a land lease agreement with a wholly-owned subsidiary of CEG. The project is leasing the land for a period of 35 years, with the ability to renew the lease for two additional five-year periods. The Company has a lease liability of $12 million as of both December 31, 2022 and 2021 and a corresponding right-of-use asset of $11 million related to the lease as of both December 31, 2022 and 2021.
Lessor
The majority of the Company’s revenue is obtained through PPAs or other contractual agreements that are accounted for as leases. These leases are comprised of both fixed payments and variable payments contingent upon volumes or performance metrics. The terms of the Company’s leases are further described in Item 2 — Properties of this Form 10-K. Many of the leases have renewal options at the end of the lease term. Termination may be allowed under specific circumstances in the lease arrangements, such as under an event of default. All but one of the Company’s active leases are operating leases. This sales-type lease is further described below. Certain of these operating leases have both lease and non-lease components, and the Company allocates the transaction price to the components based on standalone selling prices.
The following amounts of energy, capacity and capacityother revenue are related to the Company’s operating leases:
| | Conventional Generation | | Renewables | | Thermal | | Total |
| December 31, 2022 | | (In millions) |
| | Conventional Generation | |
| | Conventional Generation | |
| | Conventional Generation | | | Renewables | | | | Total |
| December 31, 2023 | | December 31, 2023 | | (In millions) |
| Energy revenue | Energy revenue | | $ | 6 | | | $ | 809 | | | $ | 1 | | | $ | 816 | |
| Capacity revenue | Capacity revenue | | 435 | | | — | | | — | | | 435 | |
| Operating revenue | | $ | 441 | | | $ | 809 | | | $ | 1 | | | $ | 1,251 | |
Other revenue (a) | |
| Operating revenues | |
| | | | | | | | | | | | | | | | | | | | | | | | | | |
| | Conventional Generation | | Renewables | | Thermal | | Total |
| December 31, 2022 | | (In millions) |
| Energy revenue | | $ | 6 | | | $ | 809 | | | $ | 1 | | | $ | 816 | |
| Capacity revenue | | 435 | | | — | | | — | | | 435 | |
| Operating revenues | | $ | 441 | | | $ | 809 | | | $ | 1 | | | $ | 1,251 | |
| | | | | | | | | | | | | | | | | | | | | | | | | | |
| | Conventional Generation | | Renewables | | Thermal | | Total |
| December 31, 2021 | | (In millions) |
| Energy revenue | | $ | 9 | | | $ | 716 | | | $ | 2 | | | $ | 727 | |
| Capacity revenue | | 455 | | | — | | | — | | | 455 | |
| Operating revenue | | $ | 464 | | | $ | 716 | | | $ | 2 | | | $ | 1,182 | |
| | Conventional Generation | | Renewables | | Thermal | | Total |
| December 31, 2020 | | (In millions) |
| | Conventional Generation | | | | Conventional Generation | | Renewables | | Thermal | | Total |
| December 31, 2021 | | December 31, 2021 | | (In millions) |
| Energy revenue | Energy revenue | | $ | 10 | | | $ | 554 | | | $ | 2 | | | $ | 566 | |
| Capacity revenue | Capacity revenue | | 451 | | | — | | | — | | | 451 | |
| Operating revenue | | $ | 461 | | | $ | 554 | | | $ | 2 | | | $ | 1,017 | |
| Operating revenues | |
Minimum future rent payments for the remaining periods related to the Conventional segmentCompany’s operating leases as of December 31, 20222023 were as follows:
| | (In millions) |
| 2023 | $ | 261 | |
| (In millions) | | | (In millions) |
| 2024 | 2024 | 106 | |
| 2025 | 2025 | 107 | |
| 2026 | 2026 | 108 | |
| 2027 | 2027 | 109 | |
| 2028 | |
| Thereafter | Thereafter | 1,281 | |
| Total lease payments | Total lease payments | $ | 1,972 | |
Property, plant and equipment, net related to the Company’s operating leases were as follows:
| | | | | | | | | | | |
| (In millions) | December 31, 2022 | | December 31, 2021 |
| Property, plant and equipment | $ | 8,630 | | | $ | 8,981 | |
| Accumulated depreciation | (2,855) | | | (2,827) | |
| Net property, plant and equipment | $ | 5,775 | | | $ | 6,154 | |
| | | | | | | | | | | |
| (In millions) | December 31, 2023 | | December 31, 2022 |
| Property, plant and equipment | $ | 5,720 | | | $ | 8,630 | |
| Accumulated depreciation | (1,991) | | | (2,855) | |
| Net property, plant and equipment | $ | 3,729 | | | $ | 5,775 | |
Schedule I
Clearway Energy LLC (Parent)
Condensed Financial Information of Registrant
Condensed Statements of Income
| | | | | | | | | | | | | | | | | |
| Year ended December 31, |
| (In millions) | 2022 | | 2021 | | 2020 |
| Total operating costs and expenses | $ | 1 | | | $ | — | | | $ | — | |
| Equity in earnings of consolidated affiliates | 1,379 | | | 110 | | | 61 | |
| | | | | |
| | | | | |
| | | | | |
| | | | | |
| Interest income | 10 | | | — | | | — | |
| Total other income | 1,389 | | | 110 | | | 61 | |
| | | | | |
| | | | | |
| | | | | |
| | | | | |
| | | | | |
| Net Income Attributable to Clearway Energy LLC | $ | 1,388 | | | $ | 110 | | | $ | 61 | |
| | | | | | | | | | | | | | | | | |
| Year ended December 31, |
| (In millions) | 2023 | | 2022 | | 2021 |
| Total operating costs and expenses | $ | — | | | $ | 1 | | | $ | — | |
| Equity in earnings of consolidated subsidiaries | 126 | | | 1,379 | | | 110 | |
| | | | | |
| | | | | |
| | | | | |
| | | | | |
| Interest income | 23 | | | 10 | | | — | |
| Total other income | 149 | | | 1,389 | | | 110 | |
| | | | | |
| | | | | |
| | | | | |
| | | | | |
| | | | | |
| Net Income Attributable to Clearway Energy LLC | $ | 149 | | | $ | 1,388 | | | $ | 110 | |
See accompanying notes to condensed financial statements.
Schedule I
Clearway Energy LLC (Parent)
Condensed Balance Sheets
| | December 31, | | December 31, |
| 2022 | | 2021 |
| December 31, | | | December 31, |
| 2023 | | | 2023 | | 2022 |
| ASSETS | ASSETS | (In millions) | ASSETS | (In millions) |
| Current Assets | Current Assets | |
| Cash and cash equivalents | |
| Cash and cash equivalents | |
| Cash and cash equivalents | Cash and cash equivalents | $ | 536 | | | $ | 33 | |
| | Other current assets | Other current assets | 1 | | | — | |
| | | Other current assets | |
| | Other current assets | |
| | Other Assets | Other Assets | |
| Other Assets | |
| Other Assets | |
| Investment in consolidated subsidiaries | |
| Investment in consolidated subsidiaries | |
| Investment in consolidated subsidiaries | Investment in consolidated subsidiaries | 2,034 | | | 1,497 | |
| | Total Assets | Total Assets | $ | 2,571 | | | $ | 1,530 | |
| | Total Assets | |
| | Total Assets | |
| LIABILITIES AND MEMBERS’ EQUITY | LIABILITIES AND MEMBERS’ EQUITY | | | |
| Current Liabilities | Current Liabilities | |
| Current Liabilities | |
| Current Liabilities | |
| | Accounts payable — affiliates | |
| | Accounts payable — affiliates | |
| | Accounts payable — affiliates | Accounts payable — affiliates | $ | 1 | | | $ | 5 | |
| | Other Liabilities | Other Liabilities | |
| | Other Liabilities | |
| | Other Liabilities | |
| | Other non-current liabilities | |
| | Other non-current liabilities | |
| | | Other non-current liabilities | Other non-current liabilities | 1 | | | — | |
| Total Liabilities | Total Liabilities | 2 | | | 5 | |
| Commitments and Contingencies | Commitments and Contingencies | | | | Commitments and Contingencies | | | |
| Members’ Equity | Members’ Equity | |
| Contributed capital | Contributed capital | 1,308 | | | 1,495 | |
| Contributed capital | |
| Contributed capital | |
| Retained earnings | Retained earnings | 1,240 | | | 43 | |
| Accumulated other comprehensive income (loss) | 21 | | | (13) | |
| Accumulated other comprehensive income | |
| | Total Members’ Equity | Total Members’ Equity | 2,569 | | | 1,525 | |
| Total Members’ Equity | |
| Total Members’ Equity | |
| Total Liabilities and Members’ Equity | Total Liabilities and Members’ Equity | $ | 2,571 | | | $ | 1,530 | |
See accompanying notes to condensed financial statements.
Schedule I
Clearway Energy LLC (Parent)
Condensed Statements of Cash Flows
| | Years ended December 31, | | | Years ended December 31, |
| 2023 | | | 2023 | | 2022 | | 2021 |
| (In millions) | | | (In millions) |
| Cash Flows from Operating Activities | |
| Net Cash Provided by Operating Activities | |
| Net Cash Provided by Operating Activities | |
| Net Cash Provided by Operating Activities | |
| Cash Flows from Investing Activities | |
| Investments in consolidated affiliates | |
| Investments in consolidated affiliates | |
| Investments in consolidated affiliates | |
| | Net Cash Provided by Investing Activities | |
| Net Cash Provided by Investing Activities | |
| Net Cash Provided by Investing Activities | |
| Cash Flows from Financing Activities | |
| Receipt (transfer) of funds under intercompany cash management arrangement | |
| Receipt (transfer) of funds under intercompany cash management arrangement | |
| Receipt (transfer) of funds under intercompany cash management arrangement | |
| | | Years ended December 31, |
| | 2022 | | 2021 | | 2020 |
| | (In millions) |
| Cash Flows from Operating Activities | |
| Net Cash Provided by Operating Activities | $ | 8 | | | $ | — | | | $ | — | |
| Cash Flows from Investing Activities | |
| Investments in consolidated affiliates | 845 | | | 202 | | | 306 | |
| Tax-related distributions | |
| | Net Cash Provided by Investing Activities | 845 | | | 202 | | | 306 | |
| Cash Flows from Financing Activities | |
| Transfer of funds under intercompany cash management arrangement | (42) | | | (20) | | | (65) | |
| | Proceeds from issuance of Class C units | — | | | — | | | 62 | |
| | Tax-related distributions | |
| | | Tax-related distributions | Tax-related distributions | (19) | | | — | | | — | |
| Payments of distributions | Payments of distributions | (289) | | | (268) | | | (211) | |
| Net Cash Used in Financing Activities | Net Cash Used in Financing Activities | (350) | | | (288) | | | (214) | |
| Net Increase (Decrease) in Cash and Cash Equivalents | 503 | | | (86) | | | 92 | |
| Net (Decrease) Increase in Cash and Cash Equivalents | |
| Cash and Cash Equivalents at Beginning of Period | Cash and Cash Equivalents at Beginning of Period | 33 | | | 119 | | | 27 | |
| Cash and Cash Equivalents at End of Period | Cash and Cash Equivalents at End of Period | $ | 536 | | | $ | 33 | | | $ | 119 | |
|
See accompanying notes to condensed financial statements.
Schedule I
Clearway Energy LLC (Parent)
Notes to Condensed Financial Statements
Note 1 — Background and Basis of Presentation
Background
Clearway Energy LLC, together with its consolidated subsidiaries, or the Company, is an energy infrastructure investor with a focus on investments in clean energy and owner of modern, sustainable and long-term contracted assets across North America. The Company is sponsored by GIP and TotalEnergies through the portfolio company, Clearway Energy Group LLC, or CEG, which becameis equally owned by GIP and TotalEnergies as of September 12, 2022, when TotalEnergies acquired, through its investment in an intermediate holding company, 50% of GIP’s interest in CEG.TotalEnergies. GIP is an independent infrastructure fund manager that makes equity and debt investments in infrastructure assets and businesses. TotalEnergies is a global multi-energy company. CEG is a leading developer of renewable energy infrastructure in the U.S.
The Company is one of the largest renewable energy owners in the U.S. with over 5,500approximately 6,000 net MW of installed wind, solar and solar generationenergy storage projects. The Company’s over 8,000approximately 8,500 net MW of assets includes approximately 2,500 net MW of environmentally-sound, highly efficient natural gas-fired generation facilities. Through this environmentally-sound, diversified and primarily contracted portfolio, the Company endeavors to increase distributions to its unit holders. The majority of the Company’s revenues are derived from long-term contractual arrangements for the output or capacity from these assets.
On May 1, 2022, the Company completed the sale of 100% of its interests in the Thermal Business to KKR. For further details of the Thermal Disposition, refer to Note 3, Acquisitions and Dispositions.
Clearway Energy, Inc., or Clearway, Inc., consolidates the results of Clearway Energy LLC through its controlling interest, with CEG’s interest shown as noncontrolling interest in the financial statements. The holders of Clearway, Inc.’s outstanding shares of Class A and Class C common stock are entitled to dividends as declared. CEG receives its distributions from Clearway Energy LLC through its ownership of Clearway Energy LLC Class B and Class D units. From time to time, CEG may also hold shares of Clearway Inc’s Class A and/or Class C common stock.
As of December 31, 2022,2023, Clearway, Inc. owned 57.88%57.90% of the economic interests of the Company, with CEG owning 42.12%42.10% of the economic interests of the Company. For further discussion, see Note 11, Members’ Equity.
Basis of Presentation
The condensed parent-only company financial statements have been prepared in accordance with Rule 12-04 of Regulation S-X, as the restricted net assets of Clearway Energy LLC’s subsidiaries exceed 25% of the consolidated net assets of Clearway Energy LLC. The parent’s 100% investment in its subsidiaries has been recorded using the equity basis of accounting in the accompanying condensed parent-only financial statements. These statements should be read in conjunction with the consolidated financial statements and notes thereto of Clearway Energy LLC.
Note 2 — Long-Term Debt
For a discussion of Clearway Energy LLC’s financing arrangements, see Note 10, Long-term Debt, to the Company’s consolidated financial statements.
Note 3 — Commitments, Contingencies and Guarantees
See Note 14, Commitments and Contingencies, to the Company’s consolidated financial statements for a detailed discussion of Clearway Energy LLC’s commitments and contingencies.
Note 4 — Distributions
Cash distributions paid on the Company’s Class A, Class B, Class C and Class D units, were $311 million, $289 million, $268 million, and $211$268 million for the years ended December 31, 2023, 2022, 2021, and 2020,2021, respectively.
EXHIBIT INDEX | | | | | | | | | | | | | | |
| Number | | Description | | Method of Filing |
| | | | |
| | | | |
| 2.3 | | | | Incorporated herein by reference to Exhibit 2.1 to the Company’s Current Report on Form 8-K filed on November 20, 2020. |
| 3.1 | | | | Incorporated herein by reference to Exhibit 3.01(a) to the Company’s Registration Statement on Form S-4 filed on April 13, 2015. |
| 3.2 | | | | Incorporated herein by reference to Exhibit 3.01(b) to the Company’s Registration Statement on Form S-4 filed on April 13, 2015. |
| 3.3 | | | | Incorporated herein by reference to Exhibit 3.3. to the Company’s Annual Report on Form 10-K filed on February 28, 2019. |
| 3.4 | | | | Incorporated herein by reference to Exhibit 3.03(a) to the Company’s Registration Statement on Form S-4 filed on April 13, 2015. |
| 3.5 | | | | Incorporated herein by reference to Exhibit 3.03(b) to the Company’s Registration Statement on Form S-4 filed on April 13, 2015. |
| 3.6 | | | | Incorporated herein by reference to Exhibit 10.6 to Clearway Energy, Inc.’s Current Report on Form 8-K filed on September 5, 2018. |
| 4.1 | | | | Incorporated herein by reference to Exhibit 4.1 to the Company’s Current Report on Form 8-K filed on December 12, 2019. |
| 4.2 | | | | Incorporated herein by reference to Exhibit 4.14.2 to the Company’s Current Report on Form 8-K filed on December 12, 2019. |
| 4.3 | | | | Incorporated herein by reference to Exhibit 4.3 to the Company’s Current Report on Form 8-K filed on January 8, 2020. |
| 4.4 | | | | Incorporated herein by reference to Exhibit 4.3 to the Company’s Current Report on Form 8-K filed on March 3, 2020. |
| 4.5 | | | | Incorporated herein by reference to Exhibit 4.3 to the Company’s Current Report on Form 8-K filed on July 21, 2020. |
| 4.6 | | | | Incorporated herein by reference to Exhibit 4.3 to the Company’s Current Report on Form 8-K filed on August 20, 2020. |
| 4.7 | | | | Incorporated herein by reference to Exhibit 4.3 to the Company’s Current Report on Form 8-K filed on November 19, 2020. |
| 4.8 | | | | Incorporated herein by reference to Exhibit 4.3 to the Company’s Current Report on Form 8-K filed on December 4, 2020. |
| 4.9 | | | | Incorporated herein by reference to Exhibit 4.3 to the Company’s Current Report on Form 8-K filed on December 29, 2020. |
| 4.10 | | | | Incorporated herein by reference to Exhibit 4.3 to the Company’s Current Report on Form 8-K filed on February 5, 2021. |
| 4.11 | | | | Incorporated herein by reference to Exhibit 4.1 to the Company’s Current Report on Form 8-K filed on March 9, 2021. |
| 4.12 | | | | Incorporated herein by reference to Exhibit 4.2 to the Company’s Current Report on Form 8-K filed on March 9, 2021. |
| 4.13 | | | | Incorporated herein by reference to Exhibit 4.2 to the Company’s Current Report on Form 8-K filed on May 19, 2021. |
| 4.14 | | | | Incorporated herein by reference to Exhibit 4.3 to the Company’s Current Report on Form 8-K filed on May 19, 2021. |
| | | | | | | | | | | | | | |
| 4.15 | | | | Incorporated herein by reference to Exhibit 4.1 to the Company’s Current Report on Form 8-K filed on October 1, 2021. |
| 4.16 | | | | Incorporated herein by reference to Exhibit 4.2 to the Company’s Current Report on Form 8-K filed on October 1, 2021. |
| 4.17 | | | | Incorporated herein by reference to Exhibit 4.2 to the Company’s Current Report on Form 8-K filed on October 8, 2021. |
| 4.18 | | | | Incorporated herein by reference to Exhibit 4.3 to the Company’s Current Report on Form 8-K filed on October 8, 2021. |
| 4.19 | | | | Incorporated herein by reference to Exhibit 4.4 to the Company’s Current Report on Form 8-K filed on October 8, 2021. |
| 4.20 | | | | Incorporated herein by reference to Exhibit 4.1 to the Company’s Current Report on Form 8-K filed on June 1, 2022. |
| 4.21 | | | | Incorporated herein by reference to Exhibit 4.2 to the Company’s Current Report on Form 8-K filed on June 1, 2022. |
| 4.22 | | | | Incorporated herein by reference to Exhibit 4.3 to the Company’s Current Report on Form 8-K filed on June 1, 2022. |
| 4.23 | | | | Incorporated herein by reference to Exhibit 4.1 to the Company’s Current Report on Form 8-K filed on February 21, 2023. |
| 4.24 | | | | Incorporated herein by reference to Exhibit 4.2 to the Company’s Current Report on Form 8-K filed on February 21, 2023. |
| 4.25 | | | | Incorporated herein by reference to Exhibit 4.3 to the Company’s Current Report on Form 8-K filed on February 21, 2023. |
| 10.1 | | | | Incorporated herein by reference to Exhibit 10.5 to Clearway Energy, Inc.’s Current Report on Form 8-K filed on September 5, 2018. |
10.2.1 | | | | Incorporated herein by reference to Exhibit 10.3 to Clearway Energy, Inc.’s Current Report on Form 8-K filed on September 5, 2018. |
10.2.2 | | | | Incorporated herein by reference to Exhibit 10.1 to Clearway Energy, Inc.’s Current Report on Form 8-K filed on February 14, 2019. |
10.2.3 | | | | Incorporated herein by reference to Exhibit 10.1 to the Company’s Quarterly Report on Form 10-Q filed on August 6, 2019. |
10.2.4 | | | | Incorporated herein by reference to Exhibit 10.1 to the Company’s Current Report on Form 8-K filed on December 9, 2019. |
10.3 | | | | Incorporated herein by reference to Exhibit 10.1 to Clearway Energy, Inc.’s Current Report on Form 8-K filed on September 5, 2018. |
10.4 | | | | Incorporated herein by reference to Exhibit 10.2 to Clearway Energy, Inc.’s Current Report on Form 8-K filed on September 5, 2018. |
10.5 | | | | Incorporated herein by reference to Exhibit 10.9 to Clearway Energy, Inc.’s Current Report on Form 8-K filed on September 5, 2018. |
10.6.110.2.1 | | Amended and Restated Credit Agreement, dated April 25, 2014, by and among NRG Yield Operating LLC, NRG Yield LLC, Royal Bank of Canada, as Administrative Agent, the lenders party thereto, Royal Bank of Canada, Goldman Sachs Bank USA and Bank of America, N.A., as L/C Issuers and RBC Capital Markets as Sole Left Lead Arranger and Sole Left Lead Book Runner. | | Incorporated by reference to Exhibit 10.1 to Clearway Energy, Inc.’s Current Report on Form 8-K filed on April 28, 2014. |
10.6.210.2.2 | | | | Incorporated herein by reference to Exhibit 10.9 to Clearway Energy, Inc.’s Quarterly Report on Form 10-Q filed on August 4, 2015. |
| | | | | | | | | | | | | | |
10.6.310.2.3 | | | | Incorporated herein by reference to Exhibit 10.1 to the Company’s Current Report on Form 8-K filed on February 12, 2018.
|
10.6.410.2.4 | | Third Amendment to Amended and Restated Credit Agreement and Administrative Agent Resignation and Appointment Agreement, dated as of April 30, 2018, by and among NRG Yield Operating LLC, NRG Yield LLC, the guarantors party thereto, Royal Bank of Canada, as Resigning Administrative Agent, JPMorgan Chase Bank, N.A., as Successor Administrative Agent, and the lenders party thereto. | | Incorporated herein by reference to Exhibit 10.1 to the Company’s Quarterly Report on Form 10-Q filed on May 3, 2018.
|
10.6.510.2.5 | | | | Incorporated herein by reference to Exhibit 10.1 to the Company’s Current Report on Form 8-K filed on December 6, 2018.
|
10.6.610.2.6 | | | | Incorporated herein by reference to Exhibit 10.1 to the Company’s Current Report on Form 8-K filed on December 23, 2019.
|
| | | | | | | | | | | | | | |
10.6.710.2.7 | | | | Incorporated herein by reference to Exhibit 10.1 to the Company’s Current Report on Form 8-K filed on December 1, 2021. |
10.6.810.2.8 | | | | Incorporated herein by reference to Exhibit 10.1 to the Company’s Current Report on Form 8-K filed on August 19, 2022. |
10.7^10.2.9 | | | | Incorporated herein by reference to Exhibit 10.1 to the Company’s Current Report on Form 8-K filed on March 20, 2023. |
| 10.3^ | | | | Incorporated herein by reference to Exhibit 10.1 to Clearway Energy, Inc.’s Quarterly Report on Form 10-Q filed on August 4, 2015. |
10.8^10.4^ | | | | Incorporated herein by reference to Exhibit 10.2 to Clearway Energy, Inc.’s Quarterly Report on Form 10-Q filed on August 4, 2015. |
10.9^10.5^ | | | | Incorporated herein by reference to Exhibit 10.1 to Clearway Energy, Inc.’s Quarterly Report on Form 10-Q filed on May 5, 2016.
|
10.10^10.6^ | | | | Incorporated herein by reference to Exhibit 10.2 to Clearway Energy, Inc.’s Quarterly Report on Form 10-Q filed on May 5, 2016.
|
10.11^10.7^ | | | | Incorporated herein by reference to Exhibit 10.3 to Clearway Energy, Inc.’s Quarterly Report on Form 10-Q filed on May 5, 2016. |
10.1210.8 | | | | Incorporated herein by reference to Exhibit 10.1 to Clearway Energy, Inc.’s Quarterly Report on Form 10-Q, filed on August 9, 2016.
|
10.1310.9 | | | | Incorporated herein by reference to Exhibit 10.30 to the Company’s Annual Report on Form 10-K filed on February 28, 2019. |
10.1410.10 | | Amended and Restated Exchange Agreement, dated as of May 14, 2015, by and among NRG Energy, Inc., NRG Yield, Inc., and NRG Yield LLC and, pursuant to a joinder thereto, dated as of August 31, 2018, Zephyr Renewables LLC. | | Incorporated herein by reference to Exhibit 10.1 to Clearway Energy, Inc.’s Current Report on Form 8-K filed on May 15, 2015. |
10.15† | | | | Incorporated herein by reference to Exhibit 10.26 to the Clearway Energy, Inc. Annual Report on Form 10-K filed on March 2, 2020. |
10.16† | | | | Incorporated by reference to Exhibit 10.19 to the Company’s Annual Report on Form 10-K, filed on March 1, 2021. |
10.17† | | | | Incorporated by reference to Exhibit 10.20 to the Company’s Annual Report on Form 10-K, filed on March 1, 2021. |
| | | | | | | | | | | | | | |
10.18*10.11*^ | | | | Incorporated herein by reference to Exhibit 10.1 to the Company’s Current Report on Form 8-K filed on April 20, 2020. |
10.19*10.12*^ | | | | Incorporated herein by reference to Exhibit 10.2 to the Company’s Current Report on Form 8-K filed on April 20, 2020. |
10.20*10.13*^ | | | | Incorporated herein by reference to Exhibit 10.3 to the Company’s Current Report on Form 8-K filed on April 20, 2020. |
10.21 | | | | Incorporated herein by reference to Exhibit 10.1 to the Company’s Quarterly Report on Form 10-Q filed on November 5, 2020. |
10.22†10.14†* | | | | Incorporated herein by reference to Exhibit 10.1 to the Company’s Current Report on Form 8-K filed on December 22, 2020. |
10.23†10.15†* | | | | Incorporated herein by reference to Exhibit 10.2 to the Company’s Current Report on Form 8-K filed on December 22, 2020. |
10.24†10.16†* | | | | Incorporated herein by reference to Exhibit 10.3 to the Company’s Current Report on Form 8-K filed on December 22, 2020. |
10.25*10.17*^ | | | | Incorporated by reference to Exhibit 10.31 to the Company’s Annual Report on Form 10-K, filed on March 1, 2021. |
| 10.26 | | | | Incorporated by reference to Exhibit 10.2 to the Company’s Quarterly Report on Form 10-Q, filed on August 3, 2021. | | | | | | | | | |
10.2710.18 | | | | Incorporated by reference to Exhibit 10.1 to the Company’s Current Report on Form 8-K, filed on August 23, 2021. |
10.2810.19 | | | | Incorporated by reference to Exhibit 10.1 to the Company’s Current Report on Form 8-K, filed on September 23, 2021. |
10.2910.20 | | | | Incorporated by reference to Exhibit 10.1 to the Company’s Current Report on Form 8-K, filed on October 26, 2021. |
10.3010.21 | | | | Incorporated by reference to Exhibit 10.2 to the Company’s Current Report on Form 8-K, filed on December 1, 2021. |
10.31*10.22*^ | | | | Incorporated herein by reference to Exhibit 10.1 to the Company’s Current Report on Form 8-K filed on January 18, 2022. |
10.32*10.23*^ | | | | Incorporated herein by reference to Exhibit 10.2 to the Company’s Current Report on Form 8-K filed on January 18, 2022. |
10.33†10.24† | | | | Incorporated herein by reference to Exhibit 10.3 to the Company’s Quarterly Report on Form 10-Q filed on May 5, 2022. |
10.34† | | | | Incorporated herein by reference to Exhibit 10.4 to the Company’s Quarterly Report on Form 10-Q filed on May 5, 2022. |
10.35† | | | | Incorporated herein by reference to Exhibit 10.5 to the Company’s Quarterly Report on Form 10-Q filed on May 5, 2022. |
10.36†10.25† | | | | Incorporated herein by reference to Exhibit 10.6 to the Company’s Quarterly Report on Form 10-Q filed on May 5, 2022. |
10.37†10.26† | | | | Incorporated herein by reference to Exhibit 10.7 to the Company’s Quarterly Report on Form 10-Q filed on May 5, 2022. |
10.38*10.27*^ | | | | Incorporated herein by reference to Exhibit 10.1 to the Company’s Current Report on Form 8-K filed on December 29, 2022. |
| | | | | | | | | | | | | | |
10.3910.28 | | | | Filed herewith.Incorporated herein by reference to Exhibit 10.39 to the Company’s Annual Report on Form 10-K, filed on February 23, 2023. |
10.4010.29 | | | | Filed herewith.Incorporated by reference to Exhibit 10.40 to the Company’s Annual Report on Form 10-K, filed on February 23, 2023. |
16.110.30*^ | | | | Incorporated herein by reference to Exhibit 16.110.1 to the Company’s Current Report on Form 8-K filed on March 15, 2021.May 24, 2023. |
| 10.31† | | | | Filed herewith. |
| 10.32† | | | | Filed herewith. |
| 21.1 | | | | Filed herewith. |
| 24.1 | | | | Included on the signature page of this Annual Report on Form 10-K. |
| 31.1 | | | | Filed herewith. |
| 31.2 | | | | Filed herewith. |
| 32 | | | | Furnished herewith. |
| 97 | | | | Filed herewith. |
| 101 INS | | Inline XBRL Instance Document. | | Filed herewith. |
| 101 SCH | | Inline XBRL Taxonomy Extension Schema. | | Filed herewith. |
| 101 CAL | | Inline XBRL Taxonomy Extension Calculation Linkbase. | | Filed herewith. |
| 101 DEF | | Inline XBRL Taxonomy Extension Definition Linkbase. | | Filed herewith. |
| 101 LAB | | Inline XBRL Taxonomy Extension Label Linkbase. | | Filed herewith. |
| 101 PRE | | Inline XBRL Taxonomy Extension Presentation Linkbase. | | Filed herewith. |
| | | | | | | | | | | | | | |
| 104 | | Cover Page Interactive Data File (the cover page interactive data file does not appear in Exhibit 104 because its Inline XBRL tags are embedded within the Inline XBRL document) | | |
| | | | | | | | |
| † | | Indicates exhibits that constitute compensatory plans or arrangements. |
| * | | This filing excludes schedules pursuant to Item 601(a)(5) of Regulation S-K, which the registrant agrees to furnish supplementary to the Securities and Exchange Commission upon request by the Commission. |
| ^ | | Information in this exhibit identified by the mark “[***]” is confidential and has been excluded pursuant to Item 601(b)(10)(iv) of Regulation S-K because it (i) is not material and (ii) would likely cause competitive harm to the Registrant if disclosed.
|
Item 16 — Form 10-K Summary
None.
SIGNATURES
Pursuant to the requirements of Section 13 or 15 (d) of the Securities Exchange Act of 1934, the registrant has duly caused this report to be signed on its behalf by the undersigned thereunto duly authorized.
| | | | | | | | | | | | | | |
| | CLEARWAY ENERGY LLC
(Registrant) | |
| | |
| | /s/ CHRISTOPHER S. SOTOS | |
| | Christopher S. Sotos | |
| | Chief Executive Officer (Principal Executive Officer) | |
| |
Date: February 23, 202322, 2024 | | |
| |
POWER OF ATTORNEY
Each person whose signature appears below constitutes and appoints Christopher S. Sotos, Kevin P. Malcarney and Amelia McKeithen, each or any of them, such person’s true and lawful attorney-in-fact and agent with full power of substitution and resubstitution for such person and in such person’s name, place and stead, in any and all capacities, to sign any and all amendments to this report on Form 10-K, and to file the same with all exhibits thereto, and other documents in connection therewith, with the Securities and Exchange Commission, granting unto said attorneys-in-fact and agents, and each of them, full power and authority to do and perform each and every act and thing necessary or desirable to be done in and about the premises, as fully to all intents and purposes as such person, hereby ratifying and confirming all that said attorneys-in-fact and agents, or any of them or his or their substitute or substitutes, may lawfully do or cause to be done by virtue hereof.
In accordance withPursuant to the requirements of the Securities Exchange Act of 1934, this report has been signed below by the following persons on behalf of the registrant and in the capacities and on the dates indicated.
| | | | | | | | | | | | | | |
| Signatures | | Title | |
| /s/ CHRISTOPHER S. SOTOS | | President and Chief Executive Officer | |
| Christopher S. Sotos | | of Clearway Energy LLC (Principal Executive Officer) | |
| Date: | February 23, 202322, 2024 | | | |
| | | | |
| | | | |
| | | | |
| | | | |
| | | | |
| /s/ SARAH RUBENSTEIN | | SeniorExecutive Vice President and Chief AccountingFinancial Officer | |
| Sarah Rubenstein | | of Clearway Energy LLC (Principal Financial and | |
| Date: | February 23, 202322, 2024 | | Principal Accounting Officer) | |
| | | | |
| CLEARWAY ENERGY, INC. | | Sole Managing Member | |
| | | | |
| /s/ CHRISTOPHER S. SOTOS | | President and Chief Executive Officer | |
| Christopher S. Sotos | | of Clearway Energy, Inc. | |
| Date: | February 23, 202322, 2024 | | | |
| | | | | | | | | | | | | | |
| Signature | | Title | | Date |
| | | | |
| /s/ NATHANIEL ANSCHUETZ | | Director of Clearway Energy, Inc. | | February 23, 202322, 2024 |
| Nathaniel Anschuetz | | Sole Managing Member of Clearway Energy LLC | |
| | | | |
| /s/ JONATHAN BRAM | | Director of Clearway Energy, Inc. | | February 23, 202322, 2024 |
| Jonathan Bram | | Sole Managing Member of Clearway Energy LLC | |
| | | | |
| /s/ BRIAN FORD | | Director of Clearway Energy, Inc. | | February 23, 202322, 2024 |
| Brian Ford | | Sole Managing Member of Clearway Energy LLC | |
| | | | |
| /s/ BRUCE MACLENNAN | | Director of Clearway Energy, Inc. | | February 23, 202322, 2024 |
| Bruce MacLennan | | Sole Managing Member of Clearway Energy LLC | |
| | | | |
| /s/ DANIEL B. MORE | | Director of Clearway Energy, Inc. | | February 23, 202322, 2024 |
| Daniel B. More | | Sole Managing Member of Clearway Energy LLC | |
| | | | |
| /s/ E. STANLEY O’NEAL | | Director of Clearway Energy, Inc. | | February 23, 202322, 2024 |
| E. Stanley O’Neal | | Sole Managing Member of Clearway Energy LLC | |
| | | | |
| /s/ GUILLAUME HÉDIARD | | Director of Clearway Energy, Inc. | | February 23, 202322, 2024 |
| Guillaume Hédiard | | Sole Managing Member of Clearway Energy LLC | |
| | | | |
| /s/ VINCENT STOQUART | | Director of Clearway Energy, Inc. | | February 23, 202322, 2024 |
| Vincent Stoquart | | Sole Managing Member of Clearway Energy LLC | |
| | | | |
| /s/ EMMANUEL BARROIS | | Director of Clearway Energy, Inc. | | February 23, 202322, 2024 |
| Emmanuel Barrois | | Sole Managing Member of Clearway Energy LLC | |
| | | | |
| /s/ CHRISTOPHER S. SOTOS | | Director of Clearway Energy, Inc. | | February 23, 202322, 2024 |
| Christopher S. Sotos | | Sole Managing Member of Clearway Energy LLC | |
| | | | |
| /s/ JENNIFER LOWRY | | Director of Clearway Energy, Inc. | | February 23, 202322, 2024 |
| Jennifer Lowry | | Sole Managing Member of Clearway Energy LLC | |
| | | | |
| | | | |
| | | |
Supplemental Information to be Furnished with Reports Filed Pursuant to Section 15(d) of the Act by Registrants Which Have Not Registered Securities Pursuant to Section 12 of the Act
No annual report or proxy materials has been sent to securities holders and no such report or proxy material is to be furnished to securities holders subsequent to the filing of the annual report on this Form 10-K.