Page | ||||||
| 3 |
| ||||
| 10 |
| ||||
|
|
| ||||
|
|
| ||||
|
|
| ||||
| 14 |
| ||||
| ||||||
| ||||||
|
|
| ||||
|
|
| ||||
Management’s Discussion and Analysis of Financial Condition and Results of Operations |
| 16 |
| |||
|
|
| ||||
|
|
| ||||
Changes in and Disagreements |
|
|
| |||
|
|
| ||||
| 39 |
| ||||
| ||||||
| ||||||
|
|
| ||||
|
|
| ||||
Security Ownership of Certain Beneficial Owners and Management and Related Stockholder Matters |
|
|
| |||
Certain Relationships and Related Transactions, and Director Independence |
|
|
| |||
| 44 |
| ||||
| ||||||
| ||||||
| 45 | |||||
|
| |||||
46 |
| |||||
| 2 |
FORWARD-LOOKING STATEMENTS
This annual report on Form 10-K (the “Report”) and other reports (collectively the “Filings”) filed by the registrant from time to time with the Securities and Exchange Commission (the “SEC”) contain or may contain forward looking statements and information that are based upon beliefs of, and information currently available to, the registrant’s management as well as estimates and assumptions made by the registrant’s management. When used in the filings the words “anticipate,” “believe,” “estimate,” “expect,” “future,” “intend,” “plan” or the negative of these terms and similar expressions as they relate to the registrant or the registrant’s management identify forward looking statements. Such statements reflect the current view of the registrant with respect to future events and are subject to risks, uncertainties, assumptions and other factors (including the risks contained in the section of this Report entitled “Risk Factors”) relating to the registrant’s industry, the registrant’s operations and results of operations and any businesses that may be acquired by the registrant. Should one or more of these risks or uncertainties materialize, or should the underlying assumptions prove incorrect, actual results may differ significantly from those anticipated, believed, estimated, expected, intended or planned.
Although the registrant believes that the expectations reflected in the forward looking statements are reasonable, the registrant cannot guarantee future results, levels of activity, performance or achievements. Except as required by applicable law, including the securities laws of the United States, the registrant does not intend to update any of the forward-looking statements to conform these statements to actual results. The following discussion should be read in conjunction with the registrant’s financial statements and the related notes thereto included in this Report.
In this Report, “we,” “our,” “us,” “TGS International Ltd.” or the “Company” sometimes refers collectively to TGS International Ltd. and its subsidiaries and affiliated companies.
General Overview
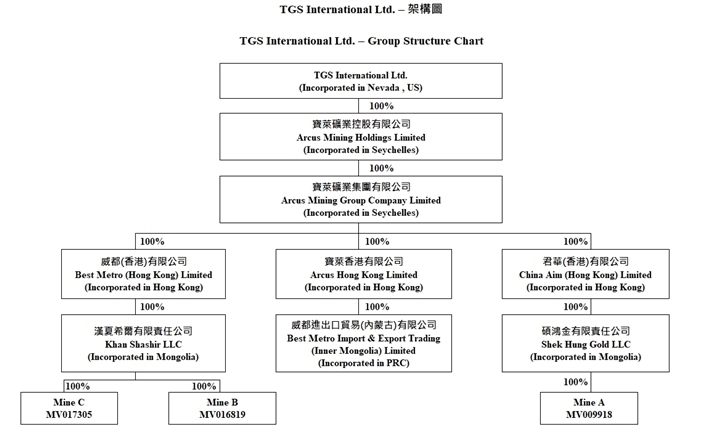
The Company was established on December 1, 2016 in Nevada, USA. On September 14, 2018, the Company and Arcus Mining Holdings Limited (“Arcus”) entered into a Share Exchange Agreement, dated September 14, 2018 (the “Share Exchange Agreement”), with Chi Kin Loo, Billion Plus Limited, First Fortune Investment Limited, Great Win Limited and Master Value Holdings Limited (the “Selling Stockholders”), pursuant to which the Selling Stockholders agreed to sell all of their ordinary shares of Arcus to the Company in exchange for an aggregate of 7,000,000 shares of common stock of the Company. Arcus, through its wholly owned subsidiaries, is engaged in the exploration, mining, processing and sale of fluorite in Mongolia.
Arcus currently owns three fluorite projects through its subsidiaries. Its official mining licenses in Mongolia are shown below:
Details of Three Fluorite Projects transferred to the Company by Arcus
Mining Project | Fluorite Reserves | Covered Area | License No. | Expiration Date | Current Status |
Altan Ovoo (Mine A) | To be explored | 39.35 hectares (97.24 acres) | MV-009918 | December 29, 2034 | In exploration stage. Trial production has been in place since 2019. |
Oosmonskogo 1 (Mine B) | To be explored | 98.37 hectares (243.08 acres) | MV-016819 | April 28, 2041 | In exploration stage since 2015. Trial production has been in place since 2018. |
Oosmonskogo 2 (Mine C) | To be explored | 300.96 hectares (743.69 acres) | MV-017305 | April 23, 2043 | Ready for exploration. |
According to the staged exploration results, there are abundant resources as well as a large potential to expand the resource base of the mines, laying a solid foundation for the sustainable development of the Company.
| 3 |
| Table of Contents |
Arcus strives to create more value through efficiency in mining. The initial expected annual production capacity of fluorite (“CaF2”) for 2020 and 2021 is described below:
Type |
| Metallurgical Grade |
| Acid Grade | ||
CaF2 Content |
| 50% |
| 80% to 90% |
| 97% |
Estimated Capacity in 2020 |
| 30,000 tons |
| 6,000 tons |
| 22,000 tons |
Estimated Capacity in 2021 |
| 35,000 tons |
| 6,000 tons |
| 12,000 tons |
Final Product |
| Granule |
| Granule/Powder |
| Powder |
Arcus intends to start producing 97% Acid Grade powder products and further increase the production of the metallurgical grade products in 2020.
PART INevertheless, there are several areas where Arcus expects to outperform the market:
· | Abundant fluorite resources for a long-term sustainable business; and | |
· | Experience in mine construction, mining and marketing of fluorite. |
In summary, the Company intends to make full use of Mongolia’s fluorite resource advantages and market under the guidance of our experienced management team.
Item 1. BusinessArcus Company Background
The founders and the management of Arcus have extensive experience in the mining industry in Africa, China, Russia and Mongolia. Their industrial experience includes exploration, mining and mineral investment. With extensive experience in the manufacture and sale of fluorite and related products, Arcus believes the Company will be able to produce the raw material needed for various high standard industrial products, including the manufacture of acid grade fluorite, metallurgical grade fluorite and more.
To meet ever-changing demands from customers, Arcus established a management team comprised of several experienced persons in the industry, as well as financial and marketing experts from international and local markets. The mines use advanced production equipment to produce high-quality products for the market.
In 2014, the Mongolian Parliament waived several restrictions on issuing new minerals exploration licenses and introduced a series of new regulations to encourage foreign investments in the Mongolian mining sector. Arcus is well positioned to take advantage of new opportunities in this promising business environment.
| 4 |
| Table of Contents |
Arcus Company Structure
Arcus indirectly holds three fluorite projects in Mongolia through its wholly owned subsidiaries incorporated in Hong Kong, namely Best Metro (Hong Kong) Limited, China Aim (Hong Kong) Limited, which in turn wholly own Mongolian based fluorite mining companies Khan Shashir LLC (“Khan Shashir”), Shek Hung Gold LLC (“Shek Hung”) respectively. Arcus Hong Kong Limited wholly own the PRC based Best Metro Import & Export Trading (Inner Mongolia) Limited as a trading arm.
The demand for metallurgical grade fluorite in China and other Asian countries currently exceeds supply, and current market conditions are expected to continue for the foreseeable future, creating excellent opportunities for the Company. Inherent uncertainties in the mining industry as well as the changing legal and political environment in Mongolia potentially bring additional business risks, as detailed under “Risk Factors” below.
Shek Hung currently owns a project called Altan Ovoo, while Khan Shashir owns the mines Oosmonskogo 1 and Oosmonskogo 2.
Mining Licenses
The three fluorite projects in Mongolia are Altan Ovoo (“Mine A”), Oosmonskogo 1 (“Mine B”) and Oosmonskogo 2 (“Mine C”).
The three projects have all been issued official mining licenses. The mining licenses allow the right to conduct mining activities throughout the license areas and to construct structures within the license areas that are related to its mining activities.
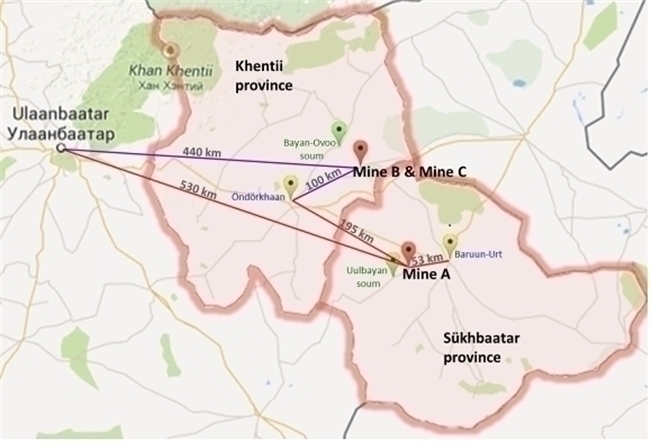
Mine A is located in Uulbayan soum, Sukhbaatar province, 530 kilometers (“km”) from Ulaanbaatar, the capital of Mongolia. Mine A’s mining license, reference number MV-009918, is valid until December 29, 2034. Mine A covers an area of 39.35 hectares (97.24 acres).
Mine B is located in the Bayan-Ovoo soum, Khentii province, 440 km from Ulaanbaatar. Mine B’s license, reference number MV-016819, is valid until April 28, 2041. Mine B covers an area of 98.37 hectares (243.08 acres).
Mine C is adjacent to Mine B. Mine C’s license, reference number MV-017305, is valid until April 23, 2043. Mine C covers an area of 300.96 hectares (743.69 acres).
| 5 |
| Table of Contents |
The location map of Mines A, B and C are shown below:
Resources and Reserves
After years of exploration, a significant potential for high grade fluorite resources for Mine A and Mine B has been positively demonstrated.
The historic exploration of Mine A and Mine B can be divided into three phrases:
· | An investigation conducted by the former Soviet Union governmental agencies in the last century; | |
· | An investigation conducted by an independent consultant from the United States in 2012; and | |
· | An investigation conducted by SRK Consulting in 2014, a leading mining consulting services provider. |
Arcus’ own geological team will continue to search for other resources through continued exploration in the areas surrounding existing deposits.
Mine A
Phase 1: Investigation conducted by former Soviet Union government agencies in 1980’s
The former Soviet Union politically governed Mongolia between 1925 and 1991. Its governmental agencies performed the first systematic exploration on Mine A between 1985 and 1987. Only one vein was located, east-trending with a strike length of 600 to 700 meters. The major work performed included drilling and digging six trenches three to four meters deep along the vein.
Phase 2: Investigation conducted by an independent surveyor in 2012
Since the date of the report by the Soviet Union governmental agencies, 27 new holes were drilled (2,916 m) underneath the trenches excavated in the 1980s to investigate the resource in Mine A. Most holes were drilled vertically or at an angle of 60° to the north, as the vein dips approximately 45° to the south.
Phase 3: Investigation conducted by SRK Consulting
Considering the advice from the independent explorer on the possibility of re-drilling some core holes to increase output of Mine A and Mine B, Arcus formally engaged SRK Consulting to perform a formal survey on both mines.
In late 2014, a specialist from SRK Consulting visited both Mine A and Mine B. SRK Consulting collected 43 extra drill core samples in Mine A during its visit. The finding by SRK Consulting is at a better grade with an average CaF2 of 34%.
| 6 |
| Table of Contents |
Mine B
Phase 1: Investigation conducted by former Soviet Union government agencies in 1930s to 1950s
Former Soviet Union governmental agencies performed the first systemic exploration on Mine B in 1937 and continued until approximately 1950. The main vein located was north-striking. It was traced by trenching and defined to be at least 400 meters in length in the 1940’s.
Major work performed in Phase 1 included:
1. | Over 160 trenches dug along the vein surface, which are now mostly deteriorated; | |
2. | Over 35 vertical drill holes; and | |
3. | A 35-meter underground tunnel along the main vein zone. |
Phase 2: Investigation conducted by an independent surveyor in 2012
The Company has drilled 9 vertical core holes with an aggregate length of 877 meters in 2011 to update information on Mine B. Based on the samples obtained from the 9 vertical core holes drilled and assays of 4 drill hole cores in the Soviet Union period.
Phase 3: Investigation conducted by SRK Consulting
During the site visit to Mine B, the specialist consultant from SRK Consulting observed that most of the fluorite ores in Mine B have a grade of more than 90% CaF2 and could be used for ornamental and lapidary purposes.
Based on the samples taken by SRK Consulting, the average grade of CaF2 is 67%.
Mine C
No exploration or resource estimate has been done on Mine C, but initial surface investigations suggest that the resource of Mine B may extend onto the license of Mine C.
Future development
The Company is planning to continue with a second round of exploration in Mine A and Mine B and start a first round of exploration in Mine C. The primary objective would be to gain a better understanding of the geological structure to assist in mine planning and to upgrade the identified inferred resource to the indicated resource category.
According to SRK Consulting, the drill holes in Mine A do not provide consistent coverage of all areas. Therefore, another round of exploration would allow a more detailed understanding of the resource allocation and help upgrade much of the inferred resource into the indicated resource category. Full feasibility studies for Mine A and Mine B will be prepared once it’s the right time. These feasibility studies will be conducted by external specialist consultants together with Arcus’ experienced team.
Mine C is adjacent to Mine B, and given the large cover area of Mine C, we are optimistic regarding the resources of Mine C. Based on preliminary estimates by the geologists, it is possible that the resource of Mine C could be greater than that of Mine B. Conducting a thorough exploration of the resource will allow better planning on mining Mine C and ensure sustainability of the Company’s growth.
Operations
Both Mine A and Mine B were in the exploration stage in 2019. Revenue generated during the year were $101,222 by Mine A and $181,635 by Mine B. We expected to further extend the operation of Mine A and Mine B in the second quarter of 2020.
There are two types of products available from Mine B, metallurgical and acid grade fluorite. Metallurgical grade fluorite is sold mainly to steel manufacturers for use as flux in steel production. Acid grade fluorite which is used to manufacture hydrofluoric acid, a feedstock for many different chemical processes. At the moment, there is only metallurgical grade fluorite available from Mine A.
The Company ran trial productions at Mine A and Mine B in 2019. Below is the summary of revenue for 2019 from the trial productions.
Type of Finished Products |
| Grade Mined |
| Quantities (In tons) |
|
| Mining Recovery |
|
| Average Price (USD) |
| |||
Metallurgical Fluorite |
| Concentration 50% |
|
| 4,418 |
|
|
| 95 | % |
|
| 22.91 |
|
Metallurgical Fluorite |
| Concentration 65% |
|
| 2,221 |
|
|
| 95 | % |
|
| 81.78 |
|
| 7 |
| Table of Contents |
Workflow of Operations
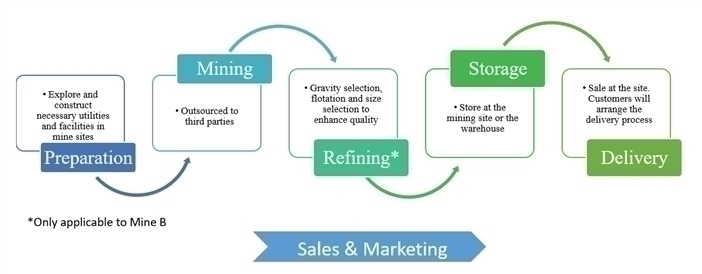
The operation at Mine A and Mine B of the Company involves several steps as shown below:
Mine Preparation
Preparing a mine involves investigation, exploration, evaluation and the construction of necessary infrastructures and utilities facilities, among other tasks.
Both Mine A and Mine B are now equipped with the necessary facilities, but the infrastructure in Mine B is more comprehensive. The basic facilities information of Mine A and Mine B is shown below:
Mine A | Mine B | |
Water Resources | Drilled water wells | Drilled water wells |
Electricity Resources | Local wind turbine generators | Bayan-Ovoo soum electrical power grid |
Mining Method | Open pit mining | Underground mining |
Shafts | Not applicable | 4 in production |
Water Resources
It is probable that there is sufficient water from drilled wells for mining and processing operations in Mine A and Mine B. Several such wells have been completed at both Mine A and Mine B. All the water will be recycled, but in the dry climate, evaporation is high.
Electricity Resources
Mine B is currently connected to the Bayan-Ovoo soum electrical power grid. Power generation in Mine A is currently supported by a set of wind turbines. Both Mine A and Mine B have sufficient power to meet daily usage, and each has two sets of contingent diesel generators.
Infrastructures
At Mine B, the construction of offices, living quarters and explosive stores has been completed. Of the four shafts built in Mine B, one shaft and the other shaft has been excavated with a 150 meter long and 180 meter long development drive in the fluorite ore respectively. There was no vertical development in 2019. Construction on excavating an underground tunnel to connect the four shafts is completed in 2019.
Mining activities are halted for the winter break, which takes place between January and March every year. Since mining activities are conducted underground, which is more dependent on the weather condition, the winter break for the mining activities is one month longer than the winter break for the production line. We have adopted open-pit mining at Mine A which is different from Mine B. Although mining activities are subject to weather, open-pit mining is more flexible so we decided to suspend the mining activities at Mine A in mid-February instead of late November 2019 as we did with Mine B. Production of both Mine A and Mine B is to be continued after the winter break and is expected to commence in the second quarter of 2020.
Mine A is planned as an open pit mine because the mineralization outcrops on the surface are relatively easy to begin mining. Four temporary offices and storage containers have been set up at Mine A. Since the resource in Mine A is large, management plans to develop Mine A in stages. Mining of the open pit has been commenced in 2019, while the deeper ores will be subjected to further exploration.
Mine A is originally planned to produce fluorite powder. However, in order to cope with our business development, the management decided to put the construction of refinery at Mine A on hold for now. Once it is the suitable time for further expanding our business, the management may resume the plan of the construction of refinery at Mine A.
| 8 |
| Table of Contents |
Mining
A strategic open pit exploration at Mine A has been started in 2019. The refinery operations described below apply only to Mine B but can serve as a general reference regarding the future production of Mine A. Starting from year 2019, we have outsourced the mining activities to subcontractors.
Refining
The Company will not outsource its core fluorite processing to third parties but rather work together with the strategic partners. Major fluorite processing of metallurgical grade fluorite includes gravity separation, which refines the fluorite granules, followed by sorting the granules by sizes in accordance with a customer’s needs.
The major machines employed in Mine B are the shakers and the jiggers. A jigger is a vertical container where a pulsing action divides ores into different layers according to their densities. When sorted by a shaker, ore is placed on a horizontal water surface, and the shaker applies longitudinal forces. As ores of different densities respond to longitudinal forces, they are sorted accordingly. Both shakers and jiggers are common tools in conducting gravity selection, but jiggers mainly divide coarse ores into different size groups (30 mm - 80 mm) and shakers mainly refine smaller ores (3 mm – 10 mm or 1 mm – 3 mm).
Sales and Marketing
From 2015 throughout 2019, the mines have still been in exploration stage so the Company decided to sell metallurgical grade fluorite within the territory of Mongolia to avoid incurring cross-border freight and transportation. The Company would like to further expand its production in the second quarter of 2020. Some of the ultimate target customers include foreign steel manufacturers.
Customers
The Company intends to develop a pool of customers to reduce its distribution risk. The Company’s targeted customer base is set forth below:
· | Korean steel manufacturers; | |
· | Chinese steel manufacturers; | |
· | Other foreign steel manufacturers (e.g., Japanese, Indian, American, etc.); | |
· | Online sales platforms; | |
· | Fluorochemical companies, mainly in China due to large demand; | |
· | Chinese and other foreign aluminum manufacturers. |
The Market for Fluorite in Mongolia
Fluorite and its Applications
Fluorite, commercially termed as fluorspar, is a transparent halide mineral of various colors, composed primarily of calcium fluoride (CaF2). Fluorite is the dominant source for the chemical element fluorine. Due to its unique chemical properties, fluorine is largely irreplaceable in its use. The major applications of fluorite and the corresponding requirement of content percentage are summarized below:
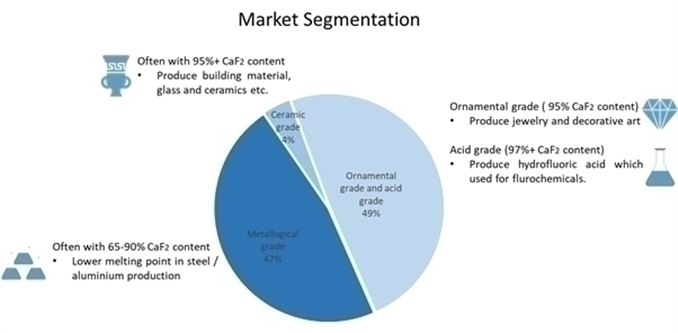
Most of the world demand for fluorite is for acid-grade fluorite, which is used to manufacture hydrofluoric acid, a feedstock for many different chemical processes. The second greatest demand is for metallurgical grade fluorite, used as flux in steel and aluminum production. A small portion is produced as ceramic grade fluorite for the manufacture of ceramics and enamels due to the high content percentage requirement.
| 9 |
| Table of Contents |
Competition
There are a number of listed companies that are primarily focused on mining fluorite. We have presented them in the table set forth below.
Comparable company | Mexichem | China King Resources | Do-Fluoride |
Country | Mexico | China | China |
Exchange Listed | Mexico | Shanghai | Shenzhen |
Location of fluorite deposit | Mexico | China | China |
Patents, Trademarks, Licenses, Franchises, Concessions and Royalty Agreements
Licenses
The three projects owned by the Company all hold official mining licenses from the Mineral Resources and Petroleum Authority of Mongolia. The mining licenses allow the holder the right to conduct mining activities throughout the license areas and to construct structures within the license areas that are related to its mining activities.
Mine A is located in Uulbayan soum, Sukhbaatar province, 530 kilometers from Ulaanbaatar, the capital of Mongolia. Mine A’s mining license, reference number MV-009918, is valid until December 29, 2034. Mine A covers an area of 39.35 hectares (97.24 acres).
Mine B is located in the Bayan-Ovoo soum, Khentii province, 440 kilometers from Ulaanbaatar. Mine B’s license, reference number MV-016819, is valid until April 28, 2041. Mine B covers an area of 98.37 hectares (243.08 acres).
Mine C is adjacent to Mine B. Mine C’s license, reference number MV-017305, is valid until April 23, 2043. Mine C covers an area of 300.96 hectares (743.69 acres).
Government Approval and Regulation of the Company’s Principal Products or Services
The Mineral Law of Mongolia governs our operations. The Company endeavors to ensure the safe and lawful operation of its facilities in its operations and the distribution of its products and believes it is in compliance in all material respects with applicable laws and regulations.
Employees
The Company currently has approximately 100 employees.
Principal Executive Offices
Our principal executive office is located at Suite 1023, 10/F., Ocean Centre, 5 Canton Rd., Tsim Sha Tsui, Kowloon, Hong Kong.
Risks Related to our Business
Our limited operating history makes it difficult to evaluate our future prospects and results of operations.
The Company is in the process of developing its mines and bringing its fluorite products to the market. Accordingly, we have a limited operating history. You should consider our future prospects in light of the risks and uncertainties experienced by early stage companies in evolving geographical areas such as Mongolia. Some of these risks and uncertainties relate to our ability to:
· | offer products of sufficient quality to attract and retain a larger customer base; | |
· | attract additional customers and increase spending per customer; | |
· | increase awareness of our products and continue to develop customer loyalty; | |
· | respond to competitive market conditions; | |
· | respond to changes in our regulatory environment; | |
· | maintain effective control of our costs and expenses; | |
· | raise sufficient capital to sustain and expand our business; and | |
· | attract, retain and motivate qualified personnel. |
If we are unsuccessful in addressing any of these risks and uncertainties, our business may be materially and adversely affected.
| 10 |
| Table of Contents |
Our operating results may fluctuate, which makes our results difficult to predict and could cause our results to fall short of expectations.
Our operating results may fluctuate as a result of a number of factors, many outside of our control. As a result, comparing our operating results on a period-to-period basis may not be meaningful, and you should not rely on our past results as an indication of our future performance. Our quarterly, year-to-date and annual expenses as a percentage of our revenues may differ significantly from our historical or projected rates. Our operating results in future quarters may fall below expectations. Any of these events could cause our stock price to fall. Each of the risk factors listed in this section and the following factors may affect our operating results:
· | Our ability to continue to attract customers; | |
· | Our ability to generate revenue from the products we offer; | |
· | The amount and timing of operating costs and capital expenditures related to the maintenance and expansion of our businesses; and | |
· | Our focus on long-term goals over short-term results. |
Because our business is changing and evolving, our historical operating results may not be useful to you in predicting our future operating results.
Our business operations may be adversely affected by present or future governmental regulations or political changes.
Mongolia, the country where the Company’s mines are situated, is currently undergoing rapid development. Our operations may be affected by changes to Mongolian regulation of the mining sector or changing levels of political involvement in mining.
The Mongolian Parliament passed an amendment to the Minerals Law on July 1, 2014 to ease certain restrictions on the mining industry and also to give some incentives to foreign mining companies and investors. These changes have clarified many areas of the law and settled issues around government interests in mines of national or strategic importance. These changes have brought potential benefits to the Company. Visits paid by Chinese president Xi Jinping to Mongolia have indicated Chinese support for strengthening cooperation between Mongolian and Chinese entities in the future. Corresponding lobbying by the Chinese government may help ensure that the Mongolian government respects the rights of foreign mining companies investing in Mongolia.
Our business operations may be adversely affected by the recent COVID-19
Due to the current outbreak of novel coronavirus that was first reported from Wuhan, China, on December 31, 2019 and since then, the government of Mongolia officially announced on January 31, 2020 that it will close all ports of entry from and into China with immediate effect until March 2, 2020. However, The Embassy of the PRC in Mongolia further announced on February 19, 2020 that all ports of entry from and into China will be closed until March 30, 2020. We expect that such temporary closures might result in a delay in the resumption of our exploratory work and production in the newly set up refinery at Mine A and Mine B respectively. However, we have started the preparation work for arranging working visas for the Chinese workers in advance and will hire more Mongolian workers in case all ports of entry from and into China are not open before we resume our work at both Mine A and Mine B so as to minimize the effect of the delay.
Taking the recent worldwide outbreak and development of the COVID-19 into account, the management worried the development of 2020 but we have been strictly prudent towards the epidemic. We will keep tracking the measures of different governments, especially the Chinese and Mongolian Government, are going to implement so to determine what the Company will do in order to minimize the negative effect of the COVID-19 on our business. The management will strengthen all necessary measures and make special arrangement so to protect our workers from the COVID-19 after the winter break as well as sticking to our expected performance in 2020.
Deviations between inferred resources and actual mineable resources may have an adverse effect on the Company’s results.
Actual mine output usually deviates to a certain extent when compared to the inferred resource, as every estimation model is based on certain assumptions made in the calculation. In order to enhance estimation accuracy and maximize output quantity and quality, the Company engaged SRK Consulting, a leading mining consultant company, to conduct a detailed resource and reserve assessment. However, there can be no assurance as to the accuracy of SRK Consulting’s estimate.
Adverse weather conditions may limit the periods during which the Company may conduct its operations or may cause a disruption in its utilities or the delivery of its products to its customers.
Due to the severe weather in Mongolia during the winter, we have scheduled a regular winter break between January and March for mining activities and processing every year. However, it is possible that severe weather conditions may occur outside their normal range in some years, which would hinder the Company’s mining and production operations and require the extension of the scheduled winter break. Severe weather may also cause a disruption in the Company’s essential utilities. Although the production lines will be roofed to minimize the impact of severe weather and the Company will maintain a backstock of ore to reduce the chances of production suspension from interruptions in mining, there can be no assurance that these measures will be adequate to compensate for the effects of especially severe weather. As a further precaution, we will also maintain a sufficient inventory level in our Baganuur warehouse to secure a continuous supply to customers during the winter, but there can be no assurance that our rail and trucking transportation methods will not be disrupted by weather events.
We may suffer losses resulting from industry-related accidents.
Despite the safety precautions taken by the Company in its mining operations, there can be no assurance that we will not suffer losses resulting from industry-related accidents. To minimize the occurrence of industrial incidents, we regularly monitor mine site construction in order to identify and implement practical protective measures.
| 11 |
| Table of Contents |
We may not be successful in implementing important strategic initiatives, which may have a material adverse impact on our business and financial results.
There is no assurance that we will be able to implement important strategic initiatives in accordance with our expectations, which may result in a material adverse impact on our business and financial results. These strategic initiatives are designed to drive long-term stockholder value and improve our results of operations.
We face significant competition, and if we do not compete successfully against new and existing competitors, we may lose our market share, and our profitability may be adversely affected.
Increased competition could reduce our profitability and result in a loss of market share. Some of our existing and potential competitors may have competitive advantages, such as significantly greater financial, marketing or other resources, and may successfully mimic and adopt our business models. We cannot assure you that we will be able to successfully compete against new or existing competitors.
Failure to manage our growth could strain our management, operational and other resources, which could materially and adversely affect our business and prospects.
We intend to expand our operations and plan to expand as rapidly as possible. The continued growth of our business will result in, substantial demand on our management, operational and other resources. In particular, the management of our growth will require, among other things:
· | increased sales and sales support activities; | |
· | improved administrative and operational systems; | |
· | enhancements to our information technology system; | |
· | stringent cost controls and sufficient working capital; | |
· | strengthening of financial and management controls; and | |
· | hiring and training of new personnel. |
As we continue this effort, we may incur substantial costs and expend substantial resources. We may not be able to manage our current or future operations effectively and efficiently or compete effectively in new markets we enter. If we are not able to manage our growth successfully, our business and prospects would be materially and adversely affected.
Attracting skilled personnel are essential to growing our business.
We face competition for attracting skilled personnel. If we fail to attract and retain qualified personnel to meet current and future needs, this could slow our ability to grow our business, which could result in a decrease in market share.
We may need additional capital and we may not be able to obtain it at acceptable terms, or at all, which could adversely affect our liquidity and financial position.
We may need additional cash resources due to changed business conditions or other future developments. If these sources are insufficient to satisfy our cash requirements, we may seek to sell additional equity or debt securities or obtain a credit facility. The incurrence of indebtedness would result in increased debt service obligations and could result in operating and financing covenants that would restrict our operations and liquidity.
Our ability to obtain additional capital on acceptable terms is subject to a variety of uncertainties, including:
· | investors’ perception of, and demand for, our securities; | |
· | conditions of the U.S. and other capital markets in which we may seek to raise funds; | |
· | our future results of operations, financial condition and cash flow; | |
· | Mongolian governmental regulation; and | |
· | economic, political and other conditions in Mongolia. |
We do not have a majority of independent directors serving on our board of directors, which could present the potential for conflicts of interest.
We do not have a majority of independent directors serving on our board of directors. In the absence of a majority of independent directors, our executive officers could establish policies and enter into transactions without independent review and approval thereof. This could present the potential for a conflict of interest between us and our stockholders, generally, and the controlling officers, stockholders or directors. However, we are going to invite different professionals as our independent directors gradually. An independent director was added in April 2019.
| 12 |
| Table of Contents |
We have limited insurance coverage.
The insurance industry in China is still at an early stage of development. Insurance companies in China offer limited insurance products. We have determined that the risks of disruption or liability from our business, the loss or damage to our property, including our facilities, equipment and office furniture, the cost of insuring for these risks, and the difficulties associated with acquiring such insurance on commercially reasonable terms make it impractical for us to have such insurance. As a result, we do not have any business liability, disruption, litigation or property insurance coverage for our operations in China except for insurance on some company owned vehicles. Any uninsured occurrence of loss or damage to property, or litigation or business disruption may result in the incurrence of substantial costs and the diversion of resources, which could have an adverse effect on our operating results.
Similarly, although it has been 80 years since the introduction of insurance in Mongolia, the penetration of insurance is still low and its development is still immature which the insurance industry is still yet to be up to international standard. As a result, we do not have any business liability, disruption, litigation or property insurance coverage for our operations in Mongolia except for insurance on some company owned vehicles. Any uninsured occurrence of loss or damage to property, or litigation or business disruption may result in the incurrence of substantial costs and the diversion of resources, which could have an adverse effect on our operating results.
If we are unable to establish appropriate internal financial reporting controls and procedures, it could cause us to fail to meet our reporting obligations, result in the restatement of our financial statements, harm our operating results, subject us to regulatory scrutiny and sanction, cause investors to lose confidence in our reported financial information and have a negative effect on the market price for shares of our common stock.
Effective internal controls are necessary for us to provide reliable financial reports and effectively prevent fraud. We maintain a system of internal control over financial reporting, which is defined as a process designed by, or under the supervision of, our principal executive officer and principal financial officer, or persons performing similar functions, and effected by our board of directors, management and other personnel, to provide reasonable assurance regarding the reliability of financial reporting and the preparation of financial statements for external purposes in accordance with generally accepted accounting principles.
As a public company, we have significant additional requirements for enhanced financial reporting and internal controls. We are required to document and test our internal control procedures in order to satisfy the requirements of SOX 404, which requires annual management assessments of the effectiveness of our internal controls over financial reporting and a report by our independent registered public accounting firm addressing these assessments. The process of designing and implementing effective internal controls is a continuous effort that requires us to anticipate and react to changes in our business and the economic and regulatory environments and to expend significant resources to maintain a system of internal controls that is adequate to satisfy our reporting obligations as a public company.
We cannot assure you that we will not, in the future, identify areas requiring improvement in our internal control over financial reporting. We cannot assure you that the measures we will take to remediate any areas in need of improvement will be successful or that we will implement and maintain adequate controls over our financial processes and reporting in the future as we continue our growth. If we are unable to establish appropriate internal financial reporting controls and procedures, it could cause us to fail to meet our reporting obligations, result in the restatement of our financial statements, harm our operating results, subject us to regulatory scrutiny and sanction, cause investors to lose confidence in our reported financial information and have a negative effect on the market price for shares of our common stock.
Lack of experienced officers of publicly-traded companies may hinder our ability to comply with Sarbanes-Oxley Act.
It may be time consuming, difficult and costly for us to develop and implement the internal controls and reporting procedures required by the Sarbanes-Oxley Act. We may need to hire additional financial reporting, internal controls and other finance staff or consultants in order to develop and implement appropriate internal controls and reporting procedures. If we are unable to comply with the Sarbanes-Oxley Act’s internal controls requirements, we may not be able to obtain the independent auditor certifications that Sarbanes-Oxley Act requires publicly-traded companies to obtain.
We incur increased costs as a result of being a public company.
As a public company, we incur significant legal, accounting and other expenses that we did not incur as a private company. In addition, the Sarbanes-Oxley Act, as well as new rules subsequently implemented by the SEC, has required changes in corporate governance practices of public companies. We expect these new rules and regulations to increase our legal, accounting and financial compliance costs and to make certain corporate activities more time-consuming and costly. In addition, we incur additional costs associated with our public company reporting requirements. We are currently evaluating and monitoring developments with respect to these new rules, and we cannot predict or estimate that there is a high probability of additional costs we may incur or the timing of such costs.
| 13 |
| Table of Contents |
Risks Relating to Our Securities
There may not be sufficient liquidity in the market for our securities in order for investors to sell their securities.
There is currently only a limited public market for our common stock, which is listed on the Over-the-Counter (“OTC”) Pink Sheets, and there can be no assurance that a trading market will develop further or be maintained in the future.
The market price of our common stock may be volatile.
The market price of our common stock has been and will likely continue to be highly volatile, as is the stock market in general, and the market for OTC Pink Sheet quoted stocks in particular. Some of the factors that may materially affect the market price of our common stock are beyond our control, such as changes in financial estimates by industry and securities analysts, conditions or trends in the industry in which we operate or sales of our common stock. These factors may materially adversely affect the market price of our common stock, regardless of our performance. In addition, the public stock markets have experienced extreme price and trading volume volatility. This volatility has significantly affected the market prices of securities of many companies for reasons frequently unrelated to the operating performance of the specific companies. These broad market fluctuations may adversely affect the market price of our common stock.
Our common stock may be considered a “penny stock” and may be difficult to sell.
The SEC has adopted regulations which generally define a “penny stock” to be an equity security that has a market price of less than $5.00 per share or an exercise price of less than $5.00 per share, subject to specific exemptions. The market price of our common stock is less than $5.00 per share and, therefore, it may be designated as a “penny stock” according to SEC rules. This designation requires any broker or dealer selling these securities to disclose certain information concerning the transaction, obtain a written agreement from the purchaser and determine that the purchaser is reasonably suitable to purchase the securities. These rules may restrict the ability of brokers or dealers to sell our common stock and may affect the ability of investors to sell their shares.
The market for penny stocks has experienced numerous frauds and abuses, which could adversely impact investors in our stock.
OTC Pink Sheet securities are frequent targets of fraud or market manipulation, both because of their generally low prices and because OTC Pink Sheet reporting requirements are less stringent than those of the stock exchanges or NASDAQ.
Patterns of fraud and abuse include:
· | Control of the market for the security by one or a few broker-dealers that are often related to the promoter or issuer; | |
· | Manipulation of prices through prearranged matching of purchases and sales and false and misleading press releases; | |
· | “Boiler room” practices involving high pressure sales tactics and unrealistic price projections by inexperienced sales persons; | |
· | Excessive and undisclosed bid-ask differentials and markups by selling broker-dealers; and | |
· | Wholesale dumping of the same securities by promoters and broker-dealers after prices have been manipulated to a desired level, along with the inevitable collapse of those prices with consequent investor losses. |
Our management is aware of the abuses that have occurred historically in the penny stock market.
We have not paid dividends in the past and do not expect to pay dividends in the foreseeable future and any return on investment may be limited to the value of our stock.
We have never paid any cash dividends on our common stock and do not anticipate paying any cash dividends on our common stock in the foreseeable future and any return on investment may be limited to the value of our stock. We plan to retain any future earnings to finance growth.
Item 1B. Unresolved Staff Comments
None.
The Company’s corporate headquarters is located at Suite 1023, 10/F., Ocean Centre, 5 Canton Rd., Tsim Sha Tsui, Kowloon, Hong Kong. We believe that our existing mining and processing facilities in Mongolia, which are described above, are well maintained and in good operating condition, and will be sufficient for our production goals for the next year.
There are no pending legal proceedings to which the Company is a party or in which any director, officer or affiliate of the Company, any owner of record or beneficially of more than 5% of any class of voting securities of the Company, or security holder is a party adverse to the Company or has a material interest adverse to the Company. The Company’s property is not the subject of any pending legal proceedings.
Item 4. Mine and Safety Disclosure
Not applicable.
| 14 |
| Table of Contents |
Market Information
Our common stock is currently traded on the OTC Pink Sheets under the trading symbol “TGSI”. There is a limited trading market in our securities.
Our transfer agent is VStock Transfer, LLC, 18 Lafayette Place, Woodmere, NY, 11598, telephone: (212) 828-8436, fax: (646) 536-3179.
Holders
As of March 20, 2020, there were 35 holders of record of our common stock and 14,858,328 shares of our common stock were issued and outstanding.
Dividends
We have not declared or paid any cash dividends since inception. We intend to retain future earnings, if any, for use in the operation and expansion of our business and do not intend to pay any cash dividends in the foreseeable future. There are no restrictions in our articles of incorporation or bylaws that prevent us from declaring dividends.
Recent Sales of Unregistered Securities; Use of Proceeds from Registered Securities
In 2019, the Company issued a subscription package (the “Second Subscription Package”) of up to $825,000, consisting of 330,000 common shares and 66,000 warrants exercisable at $3.00 to purchase common shares within three years from the respective issuance dates, to accredited investors. The Company also issued the placement agent 33,000 common shares at a price of $3.70 per common share for services rendered.
In 2019, there were four convertible bond agreements entered into between the Company, Arcus and third party investors. Three of the bonds matured in 2019 and were settled by issuing 141,782 common shares at a price stated in the respective agreements, representing loans of HK$4 million and interest expenses of HK$8,333, for a total of HK$4,008,333 (equivalent to US$513,888). In November 2019, one convertible bond agreement was signed including a HK$1.5 million (equivalent to US$192,308) loan bearing interest of 5% per annum for six months. The convertible bond will mature on May 25, 2020 with a conversion price of $3.60 per share.
The shares issued in connection with the transactions were issued pursuant to an exemption from the registration requirements of the Securities Act of 1933, as amended (the “Securities Act”), pursuant Section 4(a)(2) of the Securities Act and Regulation S promulgated thereunder.
Equity Compensation Plans
We do not have in effect any compensation plans under which our equity securities are authorized for issuance and we do not have any outstanding stock options.
Purchases of Equity Securities by the Company
We did not purchase any of our shares of common stock or other securities during the fiscal year ended December 31, 2019.
Item 6. Selected Financial Data
As a “smaller reporting company”, we are not required to provide the information required by this Item.
| 15 |
| Table of Contents |
Item 7. Management's Discussion and Analysis of Financial Condition and Results of Operations
FORWARD LOOKING STATEMENTS
This annual report contains forward-looking statements. These statements relate to future events or our future financial performance. In some cases, you can identify forward-looking statements by terminology such as “may”, “should”, “expects”, “plans”, “anticipates”, “believes”, “estimates”, “predicts”, “potential” or “continue” or the negative of these terms or other comparable terminology. These statements are only predictions and involve known and unknown risks, uncertainties and other factors including the risks in the section entitled “Risk Factors”, whichthat may cause our or our industry’s actual results, levels of activity, performance or achievements to be materially different from any future results, levels of activity, performance or achievements expressed or implied by these forward-looking statements.
Although we believe that the expectations reflected in the forward-looking statements are reasonable, we cannot guarantee future results, levels of activity, performance or achievements. Except as required by applicable law, including the securities laws of the United States, we do not intend to update any of the forward-looking statements to conform these statements to actual results.
Our audited financial statements are stated in United States Dollars (US$($) and are prepared in accordance with United States Generally Accepted Accounting Principles.
In this annual report, unless otherwise specified, all dollar amounts are expressed in United States dollars. All references to “common shares” refer to the common shares in our capital stock.
As used in this annual report, the terms “we”, “us”, “our” and “our company”, mean TGS International Ltd. and our wholly owned subsidiaries, MJP Lightings Solutions Ltd., a British Virgin Islands corporation and MJP Holdings Ltd., an Alberta, Canada corporation.
General Overview
TGS International Ltd. (“TGS International”) was established on December 1, 2016 in Nevada, USA. On December 21, 2016, TGS International acquired TGS Building Products Ltd. of Alberta (“TGS Alberta”) as its wholly subsidiary. TGS Alberta was established in March, 2016 in Alberta, Canada with focus in the sale and installation of PVC wall and ceiling panels in addition to renovation business in North America. TGS Alberta has worked closely with a PVC products manufacturer in China to bring the Company’s newly-formulated PVC products into Canada. We are a development stage company; having entered into the development stage on December 21, 2016.
Our executive offices are located at Unit 3, 6420 – 4 Street NE, Calgary, Alberta, Canada T2K 5M8. Our telephone number is (403) 616 - 9226.
Our Company specializes in the design, procurement, marketing, sale, distribution, and installation of indoor PVC (polyvinyl chloride) wall and ceiling panels for residential, commercial, and industrial applications. Initially, the Company is focusing in the production and sale of white PVC wall and ceiling panels in standard width of 16 inches to better streamline its operations and to ensure a quality and timely delivery of its products to customers. Colored and textured panels will be offered as special custom orders on a per project basis.
Products
The Company specializes in indoor PVC (polyvinyl chloride) wall and ceiling panels for residential, commercial, and industrial applications. Initially, the Company is focusing in the production and sale of white PVC wall and ceiling panels in standard width of 16 inches to better streamline its operations and to ensure a quality and timely delivery of its products to customers. Colored and textured panels will be offered as special custom orders on a per project basis. In addition to PVC wall and ceiling panels, the company also offers a selection of PVC floorings as a part of the company’s product line.
Product Sourcing
TGS purchases its products from a Chinese manufacturer. On June 4, 2017, we entered into a marketing and sale agency agreement with this Chinese manufacturer. With this agreement, we will be responsible for the marketing and sale of products in Canada. The agreement is for a term of 2 years with automatic renewal for one year term for subsequent years. There are no royalties payable pursuant to the agreement and no pre-determined wholesale or retail prices. Wholesale product pricing will be determined by the parties on a continual basis, and retail pricing will be at the discretion of TGS. The Chinese manufacturer will manufacture PVC panels to order based on the mold designed by the company, or to such other specifications as may be requested by the company from time to time. The company will strive to maintain a solid rapport with its manufacturer to ensure the company will have a good quality product and enhanced reliability in manufacturing and delivery. TGS also plans to work closely with its manufacturer to diversify its products to present a more complete and varied product line.
Benefit of PVC Panels
PVC panels boast many advantageous qualities for building applications both traditional and creative. Their usage has gained increasing popularity as they are ideal alternatives for conventional building materials such as drywalls and plywood, particularly in areas exposed to water and moisture.
Easy Installation. PVC panels are quick and easy to install, without the need for complex specialty tools. Their interlocking design is based on a simple tongue-and-groove mechanism, pieced together like a jigsaw puzzle. Fasteners are hidden inside the grooves and finished off with specially designed trimmings to provide a smooth and clean finish. Panels are available in standard width and customizable lengths to accommodate to different project requirements.
Low Maintenance. PVC panels require minimal effort to maintain and cleaning only involves water and a mild soap solution using a sponge or soft bristle brush. On most occasions, wiping will be sufficient.
Waterproof and Mold Proof. One of the most appealing selling points of PVC panels is their water-resistant capability; ideal for use in areas with frequent exposure to water that would otherwise damage alternative wall applications. Because of their ability to repel water, they are also highly resistant to mold and bacteria, making them highly hygienic and suitable for environments with stringent health and safety requirements.
Fire and Chemical Resistant. The chemical makeup of PVC panels provides an inherit resistance to fire and most corrosive chemicals. Not only do they offer a safe environment for application but also longevity not obtainable with conventional building materials.
Lightweight yet Durable. With their hollow design and standard widths, PVC panels are easy to transport and lightweight compared to other materials of similar application. Nonetheless, they are also very durable and robust; materials that can withstand even the toughest and most demanding environments.
Bright and Clean. The smooth, glossy finish of the panels helps reflect light, offering interiors a bright and clean appearance. As long as the panels are installed indoor as directed, they are fade resistant and the surface will remain fresh and clean for a long period of time.
Versatile Application. PVC panels are suitable for virtually all indoor settings and environments whereby walls and ceilings exist. They can be installed as a new walls system or retrofitted to existing surfaces with little complications. The panels can be installed horizontally, vertically, or even diagonally to accommodate to the needs and tastes of individual customers.
Cost and Time Effective. The simplicity of PVC panels calls for straightforward labour. No additional plastering or painting is required. Not only can projects be completed in a fraction amount of time in comparison to drywall, but money is also saved as labour cost is significantly reduced.
Recyclable. PVC panels can be recycled and reshaped into new products.
PVC panel Applications
Due to the versatility of the products, PVC panels can be utilized in a wide array of different applications within residential, commercial, and industrial settings. They are ideal alternatives to traditional wall systems not only for their functionality but also for their decorative aptitude.
|
|
| ||
|
|
| ||
|
|
| ||
|
|
| ||
|
|
| ||
|
|
| ||
|
|
| ||
|
|
|
Installation Overview
Cutting. The panels can be cut vertically or horizontally using simple woodworking tools. They can be cut using a normal fine-toothed wood saw or with a jigsaw.
Fitting to Walls. The panels can be fitted directly to the wall and can be fixed straight over tiles. Only on exceptionally uneven/bad conditioned walls do they need to be fitted to battens. The panels can be glued, screwed, nailed or stapled as desired. Due to the tongue and groove nature of the paneling, they can be fixed through the tongue, such that the fixings are always hidden.
Fitting to Ceilings. Panels can be fitted using adhesive, staples or screws. If suspending from the ceiling, panels can be fitted using a metal hanger bracket or attached to a wooden framework. To cut holes for spotlights, a hole cutting attachment for an electric drill is ideal.
Industry Analysis
Construction Industry
Canada’s construction industry activity dropped from US$294.1 billion in 2014 to US$289.0 billion in 2015, marking a 1.7 percent decline, following an average annual growth of 3.6 percent for four consecutive years. Weak economic conditions, low commodity prices, poor fixed-capital investments, public spending cuts, and a high rate of unemployment all contributed to this weak performance. Despite this downturn, industry activity is expected to pick up in 2016 with marked improvement over the next five years to reach US$321 billion by 2020, driven by investment in public infrastructure, renewable energy infrastructure and commercial projects, and improvements in consumer and investor confidence. Growing population and urbanization, and improvements in domestic manufacturing activities are predicted to be the main drivers behind the industry growth up until 2020 in Canada. Several government programs, such as the Affordable Housing Initiative (AHI), New Building Canada Plan (NBCP) and Made in Canada, will also continue to support the industry’s growth over the forecast period.
Non-residential and engineering construction projects will remain the keystones of provincial and federal governments ten-year plans. As a start, the second quarter of 2016 saw investment in non-residential construction rising 0.2 percent to $12.6 billion from the previous quarter. However, construction activity will vary greatly across provinces, with some regions impacted by lower commodity prices, delayed or cancelled projects and declining employment.
Alberta. Low oil and natural gas prices in Alberta will continue to hinder engineering, institutional, and industrial construction until 2019. Commercial building, on the other hand, will continue into 2016 with existing projects, before slowing in 2017 and growing in steady increments over the long term.
Manitoba. The province’s diverse economic sectors offer potential for growth as major new hydro, transmission and pipeline projects go underway. It is also anticipated that there will also be a gradual rise in commercial and industrial building construction and growing demand for maintenance work.
Saskatchewan. It is anticipated that non-residential building construction will be maintained at high levels until 2021 by major mining and infrastructure projects, as well as steady gains in maintenance work in the near term. As projects wind down after 2021, the decline in engineering-related work declines will be offset by moderate growth in industrial, commercial and institutional (ICI) building construction.
British Columbia. Construction in 2016 will begin in a growth phase with new infrastructure projects and energy development leading investment.
Residential
Residential construction is expected to take on more importance in the industry over the next five years, to account for 38.4 percent of the industry’s total value in 2020. The market will be supported by a rising population, urbanization, improving economic conditions, as well as the government’s initiative to provide affordable houses to the lower- and middle-class population through the Affordable Housing Initiative. The Canadian government is planning to spend US$6.0 billion in social infrastructure by 2020, which includes expenditure on renovation and new housing buildings construction.
Housing Starts
After years of record growth, nationwide housing starts are expected to slow in 2018 and 2019. While there is an overall decline in new housing starts at the national level, activity will vary greatly amongst different provinces. Oil-producing provinces such as Alberta, Saskatchewan, and Newfoundland and Labrador are expected to experience continual decline before rebounding.
Renovations
While new housing slows, renovation work continues to rise in Canada across all provinces. Renovation spending is an important part of Canada’s economy, contributing roughly $15 billion to the local market in 201512 and accounting for 3.4 percent of the gross domestic product in 2014. From the millennium up to the recession, the renovation industry has grown by 8.7 percent annually and 2.6 percent per year post-recession. With Canadians struggling to afford new housing options, many have turned to renovations as a way to achieve better living spaces.
Market Size and Growth
In 2013, roughly 39.3 million tons of PVC were consumed worldwide, making it one of the most widely produced plastics in addition to polypropylene (PP) and polyethylene (PE). According to German market research firm Ceresana, demand for PVC is expected to rise by 3.2 percent per annum until 2021. Asia-Pacific currently makes up the largest market in sales, accounting for 56 percent of global consumption. It will remain as the highest growth market in the upcoming years, followed by North America and Western European, who are experiencing growth again after losses in previous years.
The construction industry has been recognized as the leading market for the sale of PVC products. Despite a slowdown, China’s construction industry remains the highest growing market in the world, followed by India, who is expected to grow at a rate of 4.9 percent per year. With positive developments in the construction industry, demand for PVC products in the United States and Canada is projected to be on a steady rise, rebounding from weak domestic demand in previous years.
Market Strategy
Agricultural
Agricultural facilities will represent one of the major target markets of the Company. Among agricultural facilities, TGS will largely be focusing its initial marketing efforts towards the Hutterites colonies within Canada through various forms of direct marketing. The Hutterites, with their concentrated geographic locations and dominant agricultural background, are ideal customers for the Company. This largely untapped market presents a tremendous potential as they allow for the purchase of large volume and opportunity for recurring business. Word-of-mouth is a very effective form of advertisement within such tightly knit community. TGS hopes to take advantage of such once it gains entry into this market. The Company will be working closely with agents with experience conducting business with the Hutterites colonies to maximize its marketing reach.
Each Hutterite colony is inhabited by 50 to 120 people with an average of 80 people and 14 families. Almost all Hutterites are sustained through farming, an occupation of utmost importance pertaining to their religious beliefs. Most colonies grow crops and manage farms between 3,000 and 12,000 acres. They also raise a large amount of livestock, at times producing 10 to 30 percent of a province’s hogs, eggs, or turkeys18.
Residential
TGS will also be pursuing the home renovation market where PVC panel could be a practical replacement to drywall installations, particularly where moisture and mold growth are issues. The Company will work with experienced contractors that can seek out potential market in the residential sector and, at the same time, generate enough buzz within the market to enhance consumer interest and knowledge for how PVC panels can be incorporated into their homes.
According to Canada Mortgage and Housing Corporation’s last issue of Renovation and Home Purchase Report published in 2012, contractors continue to play a big part in homeowner’s renovation projects. Among households that renovated in 2011, 35 percent contracted out all the work, 30 percent contracted out partial of the work, 29 percent engaged in the work themselves, and 5 percent purchased materials and contracted out the labor. Respondents between ages 45 to 54 performed 28 percent of all renovations, the highest among all the age groups, followed by age 55 to 64, age 35 to 44, age 65+, and lastly, age 25 to 34. The average cost of renovations was highest among the highest income brackets, led by those earning over $100,000 (at an average cost of $18,604), followed by those earning $80,000 to $99,999 (average cost of $11,827).
Commercial and Industrial
For the commercial and industrial market, the Company will target facilities where frequent exposure to water may pose as a concern, such as car wash facilities. As well, it will also target warehousing facilities for which the use of PVC wall panels could substantially reduce cost and installation time. PVC panels can also be considered for use in temporary facilities in which the panels can be removed at the end of the job and relocated to another facility.
Marketing and Sale Strategy
Pricing
A competitively lower price point will be set at the initial stage of the Company’s operations to avoid direct competition with the existing suppliers in Canada. This pricing strategy aims to overcome the challenge of being a new entry into the market and to attract larger volumes sales from contractors and the Hutterite colonies in hopes of retaining them as repeat customers. Generally, the Company aims to sell its products at 10% below the selling price of other suppliers while achieving a gross profit margin of at least 15% to 20%. Based on the company’s recent review, the market selling price of PVC panels ranges from $1.30 to $1.80 per square foot. Despite the company’s appealing price structure, it is important for the consumers to be aware that quality will not be comprised. TGS’ lowered pricing approach should be achievable through a combined competitive advantage of having its products sourced overseas, an effective coordination of logistic functions and a simple corporate structure. Once the Company establishes a stable foothold in the market, price adjustments can be made as needed to achieve a more favorable profit margin.
Inventory, Sales and Distribution
We do not currently maintain an inventory of products, although we intend to do so when we have sufficient capital to procure an inventory of our custom designed panels. We will require a minimum investment of $50,000 to manufacture the first container of our custom designed PVC panels. A container represents the minimum shipping quantity available to us.
TGS does not intend to carry any large amount of in-house inventory and will aim to complete orders only upon the fulfillment of a minimum shipping quantity. It is, therefore, imperative that a significant sales volume be achieved, not only to offset the reduced profit margin due in part of the lower pricing, but also to attain maximum economy in shipping and to eliminate the cost for inventory storage. Generally, shipments of products will be shipped to Calgary and from Calgary the products will be distributed to customers. Although we do not currently require a warehouse facility, we anticipate that we will require a modest warehousing or storage space once we invest in an inventory of our custom designed panels. Such spaces are commonly available in Calgary on a month to month basis.
When we do obtain inventory, wholesale prices will be negotiated on a case by case basis. Similarly, we will negotiate retail prices on a case by case basis, typically incorporating a markup of 15% to 30% from the factory wholesale price. Generally, all payments will be due upon delivery. For large orders, we will require a deposit of 30%. We will either receive payments directly from customers or from our agents.
The sale of TGS’ products will primarily be conducted through direct sale or the company’s sales agents. Initially, TGS plans to have two groups of sales agents, with one group located in northern Alberta and one group located in southern Alberta. Generally, the Company would require a deposit of 30% upon receiving an order and a final payment on delivery. Importantly, our ability to engage sales agents is subject to our raising sufficient capital to finance inventory, marketing expense, and general and administrative expenses.
Promotion
Direct marketing, public relations, simple advertisements and word-of-mouth will be TGS’ primary promotional strategy. We will also focus our marketing efforts towards farming communities in the form of direct fax advertising to create awareness and stimulate consumer interest. Facsimile remains a common form of communication channel within the farming communities, such as Hutterite colonies. The advertisement will provide general information about our products and direct the viewer to the Company’s sales agent to obtain further details. As the sales agent will be the representative for the Company, strong interpersonal skills and public relations will be imperative for the closing of the transactions. In any sale, the ultimate goal for the Company is to foster long-term relationships with potential and existing clients in hopes of generating positive word-of-mouth referrals.
Target Customers
Initially, TGS will target its marketing efforts toward few group of customers, such as farming communities, contractors, home builders and developers. These customer groups should tend to purchase in large volume and bring recurring business. By focusing on these few initial customer groups, this will allow the Company to operate more on a person-to-person basis and to develop a good relationship which should lead to recurring business.
Competitive Analysis
The market for PVC wall and ceiling panels in Canada is still in its infancy state with a limited number of competitors in the industry. Currently, there several Canadian companies selling their own brand of PVC wall and ceiling panels in western Canada. Accompanying their direct sales approach are distributors in various regions that help market and promote their products.
Despite being a new player in the market, TGS believes that it is well positioned to enter into the market due to its low overhead structure and strong relationship with its PVC products manufacturer in China.
Competitive Products
Drywall is the main competitive product to PVC panels. It is the most commonly used product for wall and ceiling installations. However, there are locations where drywall installation is not suitable, particularly in moist and wet locations such as car wash facilities. Using PVC panels would be a more suitable installation for moist and wet locations. PVC panels could also be better suited for temporary facilities for which the PVC panels can be removed at the end of the job and relocated to another location.
In addition to various advantages of using PVC panels, PVC panel installation is also cost effective in comparison to drywall installation. With finish surface, PVC panel installation doesn’t require tapping, mudding, sanding and painting as for drywall installation. This saves a lot of installation time and thus labor cost. Based on the current pricing, it is estimated that a drywall installation would cost significantly higher than the cost of PVC panel installation. For example for an area of 1,000 square feet, it is estimated that the installation cost using PVC panels would be in the range of about $2,000 comparing to $4,000 for drywall installation.
Employees
Currently we do not have any employees. Our President, Chief Executive Officer and director, Chung Szeto, provides his services as a consultant to our Company on a full-time basis. Our Secretary, Treasurer, and Director, Sau Chun Yu provides her services as a consultant to our Company on a part-time basis. Our officers and directors provide services to our business on a consulting basis in order to eliminate overhead costs that we would be required to incur upon the engagement of employees, including employment insurance and workers compensation premiums. We do not expect any material changes in the number of employees over the next 12-month period and will continue to outsource contract employment as needed.
Description of Property
Our executive and administrative offices are located at Unit 3, 6420 – 4 Street NE Calgary, Alberta, Canada T2K 5M8. The space, which is approximately 300 square feet, is currently provided to us at no cost by our officers and directors. We believe that our office space is sufficient to meet our present needs and do not anticipate any difficulty securing alternative or additional space, as needed, on terms acceptable to us.
Subsidiaries
We have one wholly owned subsidiary, TGS Building Products Ltd, an Alberta (Canada) company, incorporated on March 8, 2016.
Intellectual Property
We assert common law trademark rights in the province of Alberta for the names “TGS”, “TGS International”, and “TGS Building Products” in the field of construction materials. Common law trademark rights are enforceable in provincial courts in Canada, and may be asserted against those who appropriate, dilute or damage the goodwill of our business by using the same or similar trade-names or trademarks. Unlike statutory trademark rights, which are acquired by registration and provide nation-wide protection, common law trademark rights are acquired automatically and provide protection only in the jurisdiction where a business uses a name or logo in commerce. We intend to rely on common law trademark protection until such time as we deem it economical for our business to register our trade-names or trademarks.
We have not registered for the protection of any rights under trademark, patent, or copyright laws in any jurisdiction.
Risks Associated with Our Business
Our independent auditors have expressed substantial doubt about our ability to continue as a going concern.
We incurred cumulative net losses of $83,297 during the period from December 1, 2016 (inception) to February 28, 2018 and had cash (and cash equivalents) of $8,186 as at February 28, 2018. We are in the development stage and have yet to attain profitable operations and in their report on our financial statements for the fiscal year ended February 28, 2018. Our independent auditors included an explanatory paragraph regarding the substantial doubt about our ability to continue as a going concern. Our financial statements contain additional note disclosures describing the circumstances that led to this disclosure by our independent auditors.
Because our officers and directors have no experience in managing a public company our business may be at a competitive disadvantage.
Our President, Chief Executive Officer and director, Chung Szeto, and our Secretary, Treasurer, Chief Financial Officer and Director, Sau Chun Yu, lack public company experience and do not possess a sophisticated knowledge of the requirements of United States securities laws, which could impair our ability to comply with legal and regulatory requirements such as those imposed by Sarbanes-Oxley Act of 2002. Neither Mr. Szeto nor Ms. Yu have ever had responsibility for managing a publicly traded company. Such responsibilities include complying with federal securities laws and making required disclosures on a timely basis. Our management may not be able to implement programs and policies in an effective and timely manner which adequately responds to our legal, regulatory compliance and reporting requirements. Our failure to comply with all applicable requirements could lead to the imposition of fines and penalties and distract our management from attending to the growth of our business.
If we are unable to obtain financing in the amounts and on terms and dates acceptable to us, we may not be able to expand or continue our operations and developments and so may be forced to scale back or cease operations or discontinue our business and you could lose your entire investment.
We require approximately $125,000 to carry out our planned business activities over the next 12 months and had approximately $8,168 in cash and cash equivalents on hand as of February 28, 2018. We do not currently have any arrangements for additional financing. We will have to raise additional funds for the development of our business and the marketing of our products. Such additional funds may be raised through the sale of additional stock, stockholder and director advances and/or commercial borrowing. There can be no assurance that a financing will continue to be available if necessary to meet these continuing development costs or, if the financing is available, that it will be on terms acceptable to us. The issuance of additional equity securities by us will result in a significant dilution in the equity interests of our stockholders. Obtaining commercial loans, assuming those loans would be available, will increase our liabilities and future cash commitments. If we are unable to obtain financing in the amounts and on terms deemed acceptable to us, we may not be able to expand or continue our operations and developments and so may be forced to scale back or cease operations.
We may not be able to compete effectively against other companies that have existed for a longer period and have greater financial resources.
We compete in a market that is highly competitive and expect competition to intensify in the future. We will seek to compete with a variety of developing and established companies, including those specialized exclusively in the sale of PVC panels, as well as those engaged in the sale of broader portfolios of hardware and building materials. Many of our prospective competitors have significantly greater financial, technical, and marketing resources than our Company, and many have established consumer brands, preferential supplier relationship, and developed retail distribution networks, both traditional and online. We may not be able to compete successfully against these competitors. If we are unable to effectively compete in our chosen markets, our results would be negatively affected, we may be unable to implement our business plan, and our business may ultimately fail.
Our products or our Company may be subject to product liability claims which may be detrimental to our reputation and financial condition.
Although we are a distributor and not a manufacturer of products, and therefore not directly responsible for potential flaws or defects in any of the goods which we intend to sell, we may become implicated in product liability claims as a result of alleged or actual harm related to the use of our products by end users. Whether we are directly implicated as a named defendant in such a civil claim, or indirectly implicated by association as a product distributor, we may suffer reputational and economic harm to the extent that the safety or quality of our products is called into question. Additionally, if we are directly named as a defendant in such a civil claim, we expect to incur significant legal expense and, if we our held responsible for injury arising from any of our products, significant additional financial liability. Although we intend to carry product liability insurance to safeguard against potential claims, any such claims could irreparably harm our reputation, our financial condition, and ultimately cause our business to fail.
We depend on third parties for our product supply and therefore, if they fail to perform, we may not be able to effectively operate our business.
To generate significant customer traffic, volume of purchases and repeat purchases that we believe are crucial to obtaining sufficient revenues, we must develop and maintain customer trust in the quality of goods which we deliver, in the timeliness of our delivery and installation services, among other factors. If for any reason any of our suppliers fails to perform, we may not be able to service our customers (buyers) effectively and thereby may lose customers or damage our reputation. Furthermore, if we do not secure sufficient number of suppliers to supply our products, then we may not have a successful product offering and may not attract customers. In addition, the success of our business requires that we establish relationships with professionals in strategic regions around the world who can, through their expertise, source and nurture relationships to develop our business. If we are unable to establish such relationships, we may be unable to procure goods or we may be unable to procure goods on terms that are acceptable to us. In this case, our business may fail.
Compliance with rules and requirements applicable to public companies will cause us to incur increased costs, which may negatively affect our results of operations.
We are subject to a number of laws, regulations and standards relating to corporate governance and public disclosure, including the Sarbanes-Oxley Act and related regulations implemented by the SEC. Unlike private companies, we must invest significant resources to comply with current and future securities laws, regulations and standards. This investment will result in increased general and administrative expenses and a diversion of management’s time and attention from revenue-generating activities in favor of compliance related activities. In that regard, we estimate that, based on our anticipated public reporting obligations, we must dedicate approximately $40,000 per year in respect of legal, auditing, accounting and filing costs. Furthermore, the laws, regulations and standards that are applicable to our Company are subject to change, which could result in continuing uncertainty regarding compliance matters, and higher compliance and disclosure costs.
If we are unable to benefit from our status as a reporting company by establishing a public market for our securities in order to attract investment, the ongoing costs of our public reporting obligations will have a material adverse effect on our financial condition and results of operations.
Because our principal assets and our directors and officers are located outside of the United States, it may be difficult for you to enforce your rights based on U.S. Federal Securities Laws against us or our officers and directors, or to enforce U.S. Court Judgments against us or our sole officer and director in Canada.
Our officers and directors reside in Canada. In addition, although we are a Nevada corporation, our primary assets, which include cash, trade receivables, and any inventory we may acquire, will be located outside of the United States. It may therefore be difficult for investors in the United States to enforce their legal rights based on the civil liability provisions of the U.S. Federal securities laws against us in the courts of either the U.S. or in Canada and, even if civil judgments are obtained in U.S. courts, to enforce such judgments against our officers and directors in courts of Canada. Further, it is unclear whether extradition treaties now in effect between the United States and Canada would permit effective enforcement of criminal penalties against us or our officers and/or directors.
Our officers are engaged as consultants instead of employees of our Company.
Having our officers engaged as consultants instead of employees poses the risk to our Company that, perhaps, our consultant may not always be available. If one of our consultants has other clients, we may be at a lower priority until they are able to fit us into their schedule.
Further, when we engage consultants rather than employees to minimize overhead cost, we do not have the advantages of an employee, such as consistency, dependability, and availability. If we need our employee to work on a project, all we have to do is assign it and wait for it to be completed. As the business owner, we won’t be lowly prioritized as we would with a consultant. Contrary to a consultant, an employee will maintain focus on our objective, rather than furthering his/her career by taking on additional clients. Many consultants will leave clients behind once they secure higher-paying clients.
Unlike employees, whom we can closely supervise and monitor, independent contractors enjoy certain autonomy to decide how best to do the task for which we hired them. We may be liable for injuries a consultant suffers on the job. Employees who are injured on the job are usually covered by workers’ compensation insurance. In exchange for the benefits they receive for their injuries, these employees give up the right to sue their employer for damages. Consultants are not covered by workers’ compensation, which means that if they are injured on the job, they might be able to sue us and recover damages.
We expect to be directly affected by fluctuations in the general economy.
Demand for goods is affected by the general global economic conditions. When economic conditions are favorable, commercial and residential construction increase. Under such circumstances, purchases of building and renovation materials, such as PVC panels, generally increase. When economic conditions are less favorable, sales of building and renovation materials are generally lower. In addition, we may experience more competitive pricing pressure during economic downturns. Therefore, any significant economic downturn or any future changes in consumer spending habits could have a material adverse effect on our financial condition and results of operations.
We expect our products to be subject to changes in customer taste.
The markets for our products are subject to changing customer tastes and the need to create and market new products. Demand for construction finishing materials, such as wall and ceiling paneling, is influenced by the popularity of certain aesthetics, cultural and demographic trends, marketing and advertising expenditures and general economic conditions. Because these factors can change rapidly, customer demand also can shift quickly. Some goods appeal to customers for only a limited time. The success of new product introductions depends on various factors, including product selection and quality, sales and marketing efforts, timely production and delivery and customer acceptance. We may not always be able to respond quickly and effectively to changes in customer taste and demand due to the amount of time and financial resources that may be required to bring new products to market. The inability to respond quickly to market changes could have a material adverse effect on our financial condition and results of operations.
If we are unable to successfully manage growth, our operations could be adversely affected, and our business may fail.
Our progress is expected to require the full utilization of our management, financial and other resources. Our ability to manage growth effectively will depend on our ability to improve and expand operations, including our financial and management information systems, and to recruit, train and manage sales personnel. There can be no assurance that management will be able to manage growth effectively.
Because we do not have sufficient insurance to cover our business losses, we might have uninsured losses, increasing the possibility that you may lose your investment.
We may incur uninsured liabilities and losses as a result of the conduct of our business. We do not currently maintain any comprehensive liability or property insurance. Even if we obtain such insurance in the future, we may not carry sufficient insurance coverage to satisfy potential claims. We do not carry any business interruption insurance.
We may have liabilities to affiliated or unaffiliated third parties incurred in the regular course of our business.
We regularly do business with third party vendors, customers, suppliers and other third parties and thus we are always subject to the risk of litigation from customers, employees, suppliers or other third parties because of the nature of our business. Litigation could cause us to incur substantial expenses and, negative outcomes of any such litigation could add to our operating costs which would reduce the available cash from which we could fund our ongoing business operations.
The loss of the services of our executive officers would disrupt our operations and interfere with our ability to compete.
We depend upon the continued contributions of our executive officers. Our executive officers handle all of the responsibilities in the area of corporate administration and business development. We do not carry key person life insurance on any of their lives and the loss of services of any of these individuals could disrupt our operations and interfere with our ability to compete with others.
Risks Associated with Our Common Stock
There is no active trading market for our common stock and if a market for our common stock does not develop, our investors will be unable to easily sell their shares.
There has been no public market for our securities and there can be no assurance that an active trading market will develop or be sustained. Since we have completed a registration of our common shares on Form S-1, effective October 4, 2017, we have engaged a market maker to file an application with the Financial Industry Regulatory Authority (“FINRA”) to have our common stock quoted on the OTCQB tier of the OTC Markets electronic quotation system. We must satisfy certain criteria in order for our application to be accepted. There can be no assurance as to whether we will meet the requisite criteria or that our application will be accepted. Our common stock may never be quoted on the OTCQB or a public market for our common stock may not materialize if it becomes quoted.
If our securities are not eligible for initial or continued quotation on the OTCQB or if a public trading market does not develop, purchasers of the common stock in this Offering may have difficulty selling or they may be unable to sell their securities should they desire to do so.
As a result of the registration of our common shares on Form S-1 effective October 4, 2017, as required under Section 15(d) of the Securities Exchange Act of 1934, we will file periodic reports with the Securities and Exchange Commission through October, 2018. At or prior to February 28, 2017, we may voluntarily file a registration statement under the Security Exchange Act of 1934 (“Exchange Act”) on Form 8-A, which would subject us to all of the reporting requirements of the 1934 Act, and require us to file quarterly and annual reports with the SEC and will also subject us to the proxy rules of the SEC. In addition, our officers, directors and 10% stockholders would be required to submit reports to the SEC on their stock ownership and stock trading activity. We are not required under Section 12(g) or otherwise to become a mandatory 1934 Act filer unless we have more than 2,000 shareholders (of which 500 may be unaccredited) and total assets of more than $10 million on February 28, 2018. If we do not file a registration statement under the Exchange Act at or prior to February 28, 2018, we will continue as a reporting company and will not be subject to the proxy statement requirements of the 1934 Act, and our officers, directors and 10% stockholders will not be required to submit reports to the SEC on their stock ownership and stock trading activity.
We will be subject to penny stock regulations and restrictions and you may have difficulty selling shares of our common stock.
The SEC has adopted regulations which generally define so-called “penny stocks” to be an equity security that has a market price of less than $5.00 per share or an exercise price of less than $5.00 per share, subject to certain exemptions. We anticipate that our common stock will be a “penny stock”, and we will become subject to Rule 15g-9 under the Exchange Act, or the “Penny Stock Rule”. These rules impose additional sales practice requirements on broker-dealers that sell such securities to persons other than established customers. For transactions covered by Rule 15g-9, a broker-dealer must make a special suitability determination for the purchaser and have received the purchaser’s written consent to the transaction prior to sale. As a result, this rule may affect the ability of broker-dealers to sell our common shares and may affect the ability of purchasers to sell any of our common shares in the secondary market.
For any transaction (other than an exempt transaction) involving a penny stock, the rules require delivery, prior to such transaction, of a disclosure schedule prepared by the SEC relating to the penny stock market. Disclosure is also required to be made regarding sales commissions payable to both the broker-dealer and the registered representative, and current quotations for the securities. Finally, monthly statements are required to be sent disclosing recent price information for the penny stock held in the account and information on the limited market in penny stock.
We do not anticipate that our common stock will qualify for exemption from the Penny Stock Rules. In any event, even if our common stock is exempt from the Penny Stock Rule, we would remain subject to Section 15(b)(6) of the Exchange Act, which gives the SEC the authority to restrict any person from participating in a distribution of penny stock, if the SEC finds that such a restriction would be in the public interest.
Financial Industry Regulatory Authority (FINRA) sales practice requirements may also limit your ability to buy and sell our stock, which could depress our share price.
FINRA rules require that in recommending an investment to a customer, a broker-dealer must have reasonable grounds for believing that the investment is suitable for that customer. Prior to recommending speculative low priced securities to their non-institutional customers, broker-dealers must make reasonable efforts to obtain information about the customer’s financial status, tax status, investment objectives and other information. Under interpretations of these rules, FINRA believes that there is a high probability that speculative low priced securities will not be suitable for at least some customers. FINRA requirements make it more difficult for broker-dealers to recommend that their customers buy our common stock, which may limit your ability to buy and sell our stock and have an adverse effect on the market for our shares, depressing our share price.
State securities laws may limit secondary trading, which may restrict the states in which you can sell the shares offered by this prospectus.
If you purchase shares of our common stock sold pursuant to our Offering, you may not be able to resell the shares in a certain state unless and until the shares of our common stock are qualified for secondary trading under the applicable securities laws of such state or there is confirmation that an exemption, such as listing in certain recognized securities manuals, is available for secondary trading in such state. There can be no assurance that we will be successful in registering or qualifying our common stock for secondary trading, or identifying an available exemption for secondary trading in our common stock in every state. If we fail to register or qualify, or to obtain or verify an exemption for the secondary trading of, our common stock in any particular state, the shares of common stock could not be offered or sold to, or purchased by, a resident of that state. In the event that a significant number of states refuse to permit secondary trading in our common stock, the market for the common stock will be limited which could drive down the market price of our common stock and reduce the liquidity of the shares of our common stock and a stockholder’s ability to resell shares of our common stock at all or at current market prices, which could increase a stockholder’s risk of losing some or all of their investment.
If quoted, the price of our common stock may be volatile, which may substantially increase the risk that you may not be able to sell your shares at or above the price that you may pay for the shares.
Even if our shares are quoted for trading on the and a public market develops for our common stock, the market price of our common stock may be volatile. It may fluctuate significantly in response to the following factors:
|
| |
|
| |
|
| |
|
| |
|
| |
|
| |
|
|
Your inability to sell your shares during a decline in the price of our stock may increase losses that you may suffer as a result of your investment.
Because we do not intend to pay any dividends on our common stock; holders of our common stock must rely on stock appreciation for any return on their investment.
We have not declared or paid any dividends on our common stock since our inception, and we do not anticipate paying any such dividends for the foreseeable future. Accordingly, holders of our common stock will have to rely on capital appreciation, if any, to earn a return on their investment in our common stock.
We are an “emerging growth company” under the JOBS Act of 2012, and we cannot be certain if the reduced disclosure requirements applicable to emerging growth companies will make our common stock less attractive to investors.
We are an “emerging growth company,” as defined in the Jumpstart Our Business Startups Act of 2012 (“JOBS Act”), and we may take advantage of certain exemptions from various reporting requirements that are applicable to other public companies that are not “emerging growth companies” including, but not limited to, not being required to comply with the auditor attestation requirements of section 404 of the Sarbanes-Oxley Act, reduced disclosure obligations regarding executive compensation in our periodic reports and proxy statements, and exemptions from the requirements of holding a nonbinding advisory vote on executive compensation and shareholder approval of any golden parachute payments not previously approved. We cannot predict if investors will find our common stock less attractive because we may rely on these exemptions. If some investors find our common stock less attractive as a result, there may be a less active trading market for our common stock and our stock price may be more volatile. We will remain an “emerging growth company” for up to five years, although we will lose that status sooner if our revenues exceed $1 billion, if we issue more than $1 billion in non-convertible debt in a three-year period, or if the market value of our common stock that is held by non-affiliates exceeds $700 million as of any December 31.
Our status as an “emerging growth company” under the JOBS Act of 2012 may make it more difficult to raise capital as and when we need it.
Because of the exemptions from various reporting requirements provided to us as an “emerging growth company”, we may be less attractive to investors and it may be difficult for us to raise additional capital as and when we need it. If we are unable to raise additional capital as and when we need it, our financial condition and results of operations may be materially and adversely affected.
Item 1B. Unresolved Staff Comments
As a “smaller reporting company”, we are not required to provide the information required by this Item.
Our executive and administrative offices are located at Unit 3, 6420 – 4 Street NE Calgary, Alberta, Canada T2K 5M8. The space, which is approximately 300 square feet, is currently provided to us at no cost by our officers and directors. We believe that our office space is sufficient to meet our present needs and do not anticipate any difficulty securing alternative or additional space, as needed, on terms acceptable to us.
We know of no material, existing or pending legal proceedings against our Company, nor are we involved as a plaintiff in any material proceeding or pending litigation. There are no proceedings in which our director, officer or any affiliates, or any registered or beneficial shareholder, is an adverse party or has a material interest adverse to our interest.
Item 4. Mine Safety Disclosures
Not Applicable.
PART II
Our common stock is currently not quoted on the OTC Markets. OTC Markets securities are not listed and traded on the floor of an organized national or regional stock exchange. Instead, OTC Market securities transactions are conducted through a telephone and computer network connecting dealers. OTC Market issuers are traditionally smaller companies that do not meet the financial and other listing requirements of a national or regional stock exchange.
Our transfer agent is VStock Transfer, LLC, 18 Lafayette Place, Woodmere, NY, 11598, telephone: (212) 828-8436, fax: (646) 536-3179.
Holders
As of February 28, 2018, there were 27 holders of record of our common stock and, 13,530,000 shares of our common stock were issued and outstanding.
Dividends
We have not declared or paid any cash dividends since inception. We intend to retain future earnings, if any, for use in the operation and expansion of our business and do not intend to pay any cash dividends in the foreseeable future. There are no restrictions in our articles of incorporation or bylaws that prevent us from declaring dividends.
Recent Sales of Unregistered Securities; Use of Proceeds from Registered Securities
We did not sell any equity securities which were not registered under the Securities Act during the year ended February 28, 2018 that were not otherwise disclosed on our quarterly reports on Form 10-Q or our current reports on Form 8-K filed during the year ended February 28, 2018.
Equity Compensation Plans
We do not have in effect any compensation plans under which our equity securities are authorized for issuance and we do not have any outstanding stock options.
Purchases of Equity Securities by the Company
We did not purchase any of our shares of common stock or other securities during the fiscal year ended February 28, 2018.
Item 6. Selected Financial Data
As a “smaller reporting company”, we are not required to provide the information required by this Item.
Item 7. Management’s Discussion and Analysis of Financial Condition and Results of Operations
The following discussion should be read in conjunction with our audited financial statements and the related notes forto the years ended February 28, 2018 and February 28, 2017 that appearconsolidated financial statements included elsewhere in this annual report.Form 10-K. The following discussion contains forward-looking statements that reflect our plans, estimates and beliefs. Our actual results could differ materially from those discussed in the forward-looking statements. Factors that could cause or contribute to such differences include, but are not limited to, those discussed below and elsewhere in this annual report, particularly in the section entitled "Risk Factors" beginning on page 10 of this annual report.
In this annual report, unless otherwise specified, all dollar amounts are expressed in United States dollars and all references to “common stock” refer to the common stock in our capital stock.
As used in this annual report, the terms “we”, “us”, “our” or the “Company” mean TGS International Ltd., a Nevada corporation, and our subsidiaries, unless otherwise indicated.
General Overview
TGS International Ltd. was established on December 1, 2016 in Nevada, USA. On September 14, 2018, TGS International Ltd. and Arcus entered into a Share Exchange Agreement, dated September 14, 2018, with Chi Kin Loo, Billion Plus Limited, First Fortune Investment Limited, Great Win Limited and Master Value Holdings Limited, pursuant to which the Selling Stockholders agreed to sell all of their ordinary shares of Arcus to the Company in exchange for an aggregate of 7,000,000 shares of common stock of TGS International Ltd.
We are a mining company focused on both fluorite mining operations in Mongolia (3 mines in total, Mining license numbers: MV-016819, MV-017305 and MV-009918) and sales of fluorite across Mongolia and China. During 2015 to 2017, we were setting up infrastructure at Mine B and appointed SRK Consulting China Limited for resource exploration for Mine A and Mine B. The only production at Mine B started in 2018 and has been ongoing since that time.
In 2019, there were a few unpredictable events, including delay in exploratory work at Mine B due to the tightened working visa application procedure by the Mongolian Government, delay in explosives delivery due to the temporary suspension of the only two explosive factories in Mongolia, which have brought about significant postponement of our exploratory work. Therefore, the production forecast for 2019 was not reached. Nonetheless, the management has devoted all their effort to minimize any impact on the Company. For instance, workers were instructed to work on the foundation of the refinery and other on-site infrastructures until the explosives arrived at our mine.
We have suspended the work at Mine B since November 25, 2019 due to the annual winter break and expect to resume our work in early April 2020, depending on the weather and overall situation. All workers working at Mine B were sent home the same day. Right before the winter break, there were 2,221 tons of output from Mine B in the last quarter of 2019.
Although open pit mining is adopted at Mine A, as the weather has become more frigid, we have put the exploratory work at Mine A on hold since mid-February 2020 to make sure the workers are safe and sound. The output in the last quarter of 2019 is 4,418 tons. We would like to take advantage of adopting open pit mining at Mine A so as to resume the exploratory work earlier once the winter break comes to an end and boost the production, presumably in early April 2020.
The construction of the refinery at Mine B was completed in late November 2019. However, the power supply upgrade at Mine B is still in progress and we hope to get it done in early April 2020 to put the refinery into use as early as possible. This is a strategic cooperation with Yantai Fulin Mining Machinery Co., Ltd (“Fulin”) which provided construction funds in advance to the construction and installation of the refinery. We expect that the production and the sales would have a certain increase in 2020 as well as the profits. During 2019, we have upgraded the infrastructures at Mine B as well as building the refinery at Mine B. The cost, therefore, was unavoidably much larger than the last year’s. With the experienced engineers and construction teams provided by Fulin, our strategic partner, we could get the construction of the refinery completed in merely six months. The refinery is basically ready. Once we get the power supply upgrade done in April 2020, the entire refinery could be put into trial in late April or early May 2020.
As what we have known that the operation of the refinery and the production line is straightforward and simple with approximately 3 steps – breaking apart and grinding, flotation separation, and drying out the acid grade fluorite, the end product. We expect to increase manpower to accelerate the exploration at Mine B by the end of the second quarter of 2020 to escalate production. The fluorite with higher grading could be sold to the market directly while the fluorite with lower grading could be used as the raw materials for producing acid grade fluorite. The management are confident in the overall development and sales of the Company.
Mine C is still intact and we have not had any development there because we would like to prioritize and focus the use of our resources for the development of Mine A and Mine B. Once we have sufficient resources, we would start exploring and developing Mine C, for example, getting SRK Consulting China Limited for resource exploration as the first step, to maximize the value of the Company.
| 16 |
| Table of Contents |
There were a total of four convertible bond agreements entered into between the Company, a subsidiary of the Company, Arcus Mining Holdings Limited (“Arcus”), and third party investors during 2019. On August 30 2019, a convertible bond agreement was entered into between the Company, Arcus and a third party investor including a HK$1 million (equivalent to US$128,205) loan bearing interest of 2.5% per annum for one month. The convertible bond matured and was converted into 34,722 shares of the Company’s common stock on September 29, 2019 with a conversion price of $3.70 per share.
ResultsOn October 25, 2019, a convertible bond agreement was entered into between the Company, Arcus and a third party investor including a HK$2 million (equivalent to US$256,410) loan bearing interest of Operations2.5% per annum for one month. The convertible bond matured and was converted into 71,373 shares of the Company’s common stock on November 27, 2019 with a conversion price of $3.60 per share.
On November 4, 2019, a convertible bond agreement was entered into between the Company, Arcus and a third party investor including a HK$1 million (equivalent to US$128,205) loan bearing interest of 2.5% per annum for one month. The following summaryconvertible bond matured and was converted into 35,687 shares of our resultsthe Company’s common stock on December 3, 2019 with a conversion price of operations should be read in conjunction with our audited financial statements for the years ended February 28, 2018 and 2017 which are included herein.$3.60 per share.
Operating ExpensesOn November 26, 2019, a convertible bond agreement was entered into between the Company, Arcus and a third party investor including a HK$1.5 million (equivalent to US$192,308) loan, bearing interest of 5% per annum for six months. The convertible bond will mature on May 25, 2020 with a conversion price of $3.60 per share.
Our operating expenses forAs of December 31, 2019, a loan of $132,423 was borrowed from an unrelated party. The loan is unsecured, has no collateral or guarantee and carries interest at 11.61% per annum and repayable on December 31, 2029.
Subsequent to the year ended December 31, 2019, there were four convertible bond agreements entered into between the Company, Arcus and third party investors. On January 2, 2020 a convertible bond agreement was signed including a HK$1.5 million (equivalent to US$192,308) loan bearing interest of 2.5% per annum for one month. The convertible bond matured and was converted into 53,236 shares of the Company’s common stock on February 28,1, 2020 with a conversion price of $3.62 per share.
On January 14, 2020, a convertible bond agreement was signed including a HK$400,000 (equivalent to US$51,282) loan bearing interest of 2.5% per annum for one month. The convertible bond matured and was converted into 14,196 shares of the Company’s common stock on February 13, 2020 with a conversion price of $3.62 per share.
On February 24, 2020, a convertible bond agreement was signed including a HK$200,000 (equivalent to US$25,641) loan bearing interest of 2.5% per annum for one month. The convertible bond will mature on March 25, 2020 with a conversion price of $3.62 per share.
On February 29, 2020, a convertible bond agreement was signed including a HK$500,000 (equivalent to US$64,103) loan bearing interest of 2.5% per annum for one month. The convertible bond will mature on March 30, 2020 with a conversion price of $3.62 per share.
Apart from the exploration and infrastructure work at Mine A and Mine B, the Company might consider further fund raising activities through the capital markets and from stockholders with the aim of speeding up the development of the Company.
Results of Operations
Comparison of Years Ended December 31, 2019 and December 31, 2018
Revenue
Revenue consisted mainly of fluorspar products generated from production at our mines. In 2019, we had total revenue of $282,857, as compared to revenue of $274,238 during 2018. The percentage of such increase was approximately 3% as a result of the increase in average price of metallurgical fluorite.
Commission income
Commission income was recognized when the Company purchased minerals from suppliers and received payments from the customers on selling minerals. The Company has been determined as an agent for the ultimate customers in these transactions and the revenue is recorded net of the related fulfillment costs as commission income. The Company had commission income of $393,566 in 2018 and 2017,nil commission income in 2019.
Cost of goods sold
Cost of goods sold included raw material costs. The total cost of goods sold decreased from $10,544 in 2018 to nil in 2019. The significant decrease was mainly due to no raw material costs in 2019.
Exploration cost
Exploration costs are expensed as incurred and forincluded labor and benefits, construction service fee, mining overhead, including food, supplies, utilities and lubricants related to mine exploration. Exploration costs increased significantly from $421,508 in 2018 to $737,248 in 2019. The percentage of such increment was approximately 75% and was mainly due to our focus on the period from December 1, 2016 (inception) to February 28, 2018, are outlinedmining infrastructure project resulted in the table below:increase of construction service fee, mining supplies and utilities during the year.
Year Ended February 28, 2018 Year Ended February 28, 2017 Cumulative from December 1, 2016 (Inception) to February 28, 2018 Revenues Cost of Goods Sold Operating Expenses Income Tax Expense NIL Nil NIL Net Loss $ 33,663 $ 6,214 $ 39,877 $ (22,148 ) $ (5,214 ) $ (27,362 ) $ (92,507 ) $ (15,327 ) $ (107,834 ) $ $ $ $ (80,992 ) $ (14,327 ) $ (95,319 )
RevenuesSelling and distribution costs included transportation and handling costs related to the movement of finished goods from mines to customer designated locations, security fee, royalty and custom tax. Selling and distribution costs increased significantly from $56,697 in 2018 to $105,279 in 2019. The percentage of such increment was approximately 86% and was mainly due to the increase in royalty and custom tax.
We earned revenues of $33,663 for the year ended February 28, 2018 compared to $6,214 for the year ended February 28, 2017 for an increase of $27,449 or approximately 400.42%. The increase in sales for the year ended February 28, 2018 is primarily due to having a full year of operation instead of three months for the previous year. Our gross profit for the year ended February 28, 2018 was $11,515 compared to a gross profit of $1,000 for the year ended February 28, 2017 for an increase of $10,515 or 1051.5% due to higher sales revenue.
Operating Expenses
Our consolidated expenses for the year ended February 28, 2018 and 2017:
Year Ended June 30, 2016 Year Ended June 30, 2015 Cumulative from July 19, 2010 (Inception) to June 30, 2016 Depreciation $ 2,038 nil 2,038 Filing Fees $ 20,293 nil 20,293 General and administrative expenses $ 8,989 $ 3,594 12,583 Management fees $ 8,588 $ nil 8,588 Professional fees $ 52,599 $ 11,733 64,332 Total Expenses $ 92,507 $ 15,327 107,834
| 17 |
| Table of Contents |
Administrative expenses
OurAdministrative expenses included salaries and benefits, consulting, audit, tax, legal, insurance, rent and utilities, and other general operating expenses.
Administrative expenses increased significantly from $1,342,830 in 2018 to $1,645,900 in 2019. The percentage of such increment was approximately 23% and administrativeis mainly due to the commission expenses include telephonerelated to subscription package, increase in staff salaries and internet services, banking changesincrease of rental expense by additional staff accommodation in 2019.
Other income
Other income increased significantly from $34,083 in 2018 to $195,576 in 2019. The percentage of such increment was approximately 474% as a result of a waiver of consultancy fee in 2019 and miscellaneous office supply costs. Our management fees are fees chargeda write back of receipt in advance due to the dissolution of our customer.
Interest expenses
Interest expenses mainly included other loan interest, related party loan interest and bond interest arising from convertible bonds.
Interest expenses decreased from $83,548 in 2018 to $76,824 in 2019. The percentage of such reduction was approximately 8% as a result of the repayment of related party loans of HK$3 million (equivalent to US$382,945), in which HK$2 million (equivalent to US$255,297) was settled by our officers. Our professional fees include legalissuance of shares and auditing fees. The decrease in expensesHK$1 million (equivalent to US$127,648) was settled by cash.
Net loss
As a result of the factors described above, we had a net loss of $2,115,716 for the year ended February 28, 2018 is primarily due to a full year of operation instead of three months of operations for the previous year.
Earnings after Taxes
The net loss for the year ended February 28, 2018 was $80,992December 31, 2019 as compared to a net loss of $14,327$1,241,452 for the year ended February 28, 2017.December 31, 2018. The net loss resulted mainly from the decrease in the commission income and increase in loss forcost on mining infrastructure project. This was within our management expectation since our mine is still under trial production and we expect to further increase the year ended February 28, 2018 is primarily due to higher operating expenses.productions in 2020.
Liquidity and Capital Resources
|
| At February 28, 2018 |
|
| At February 28 2017 |
| ||
|
|
|
|
| ||||
Current Assets |
| $ | 10,659 |
|
| $ | 29,905 |
|
Current Liabilities |
| $ | 79,666 |
|
| $ | 19,955 |
|
Working Capital (Deficit) |
| $ | (69,007 | ) |
| $ | 9,950 |
|
As at February 28, 2018, we were obligated to related parties, Chung Szeto, our president, chief executive officer and director and a number of shareholders, for $54,690 in funds advanced to us for working capital. The advances are unsecured and no interest rate or payback schedule has been established.
At February 28,Cash and cash equivalents are short-term, highly liquid investments with original maturities of three months or less. As of December 31, 2019 and 2018, our company had athe Company’s cash balancewas $106,850 and total assets of $8,186 and $18,539 compared with$98,121, respectively. There were no cash balance and total assets of $20,867 and $39,823 as at February 28, 2017. The decrease in cash and total assets were attributed primarily to higher operating expenses.equivalents.
As at February 28, 2018,Factors affecting our company had total liabilities of $79,666 compared with $19,955 as at February 28, 2017. The increase was primarily attributed to losses incurred during the year and lack of injection of new capital.
As at February 28, 2018, our company had a working capital deficit of $69,007 compared with a working capital of $9,950 as at February 28, 2017.
|
| Year Ended February 28, 2018 |
|
| Year Ended February 28, 2017 |
|
| Cumulative from December 1, 2016 (Inception) to February 28, 2018 |
| |||
Net Cash Provided by (Used in) Operating Activities |
| $ | (13,342 | ) |
| $ | (10,292 | ) |
|
| (23,634 | ) |
Net Cash Provided by Financing Activities |
| $ | Nil |
|
| $ | 31,456 |
|
|
| 31,456 |
|
Net Cash Provided by (Used In) Investing Activities |
| $ | Nil |
|
| $ | (154 | ) |
|
| (154 | ) |
Effect of Exchange Rate Changes on Cash |
| $ | 661 |
|
| $ | (143 | ) |
|
| 518 |
|
Net Increase (Decrease) in Cash During the Period |
| $ | (12,681 | ) |
| $ | 20,867 |
|
|
| 8,186 |
|
Cash Flow from Operating Activities
During the year ended February 28, 2018, our company had $13,342 ofliquidity include (i) net cash used in operating activities that consists of (a) cash required to fund the mining sites operating activities and continued expansion of our mining sites and (b) our working capital needs, which include advanced payments for several mining supplies and repair and maintenance, payment of our operating expenses; and (ii) net cash used in investing activities that consists of the investments in purchasing new and additional property, plant and equipment for mining sites. To date, we have financed our liquidity needs primarily through advances from stockholders, proceeds from related parties and unrelated party loans, proceeds from issuance of common stock and the proceeds from issuance of convertible bonds.
We expect to continue to make capital expenditures to keep pace with the expansion of the production and scale of operations of our mining sites, which we expect to fund in part with the proceeds from issuance of convertible bonds and other loans in the future. We expect that the proceeds from the above and our existing cash and cash equivalents will be used to fund working capital and for capital expenditures and other general corporate purposes, such as partnering arrangements, or reduction of debt obligations. However, there can be no assurance that we will be able obtain financing, if at all or upon terms that will be acceptable to us.
Cash Flows
As of December 31, 2019, we had $106,850 in cash and cash equivalents, compared with $10,292to $98,121 on December 31, 2018.
Net cash used duringin operating activities
Our net cash used in operating activities increased to $1,228,886 in 2019 from $888,079 in 2018. Net cash used in operating activities for the year ended February 28, 2017. TheDecember 31, 2019 primarily reflected our net loss of $2,115,716 and the add-back of non-cash items, mainly consisting of depreciation of property, plant and equipment of $51,898, stock compensation expenses of $122,100, amortization of non-cash interest expenses and bond discount related to convertible bonds of $13,732, exchange difference of $246,346, and deduct of non-cash items, mainly consisting of write back of receipt in advance of $160,542 and waiver of consultancy fee of $34,556, and changes in operating assets and liabilities primarily consisting of an increase in accounts receivable of $60,314, an increase of other receivables of $394,560, an increase of deposits and prepayments of $56,795, decrease in the useaccrued charges of $40,022 and offset by an increase of trade and other payables of $1,196,364 and increase in provision for asset retirement obligations of $3,179.
Net cash for operatingused in investing activities
Our net cash used in investing activities increased to $976,818 in 2019 from $38,379 in 2018. This was primarilymainly due to the increase in business activities. From our inception on December 1, 2016 through February 28, 2018, we used cashacquisition of $23,634 in our operating activities.property, plant and equipment at mine sites.
Net cash provided by financing activities
Our net cash provided by financing activities increased to $2,216,864 in 2019 from $989,312 in 2018. This was mainly the result of advances from stockholders and directors, proceed from unrelated party loan, issuance of common stock and convertible bonds in 2019.
| 18 |
| Table of Contents |
Cash Flow from Financing Activities
During the year ended February 28, 2018, our Company received no cash from financing activities compared with $31,456 received during the year ended February 28, 2017. As at February 28, 2018 we had received $31,456 from financing activities since our inception on December 1, 2016.
Cash Flow from Investing ActivitiesFuture Financings
We used $154anticipate continuing to rely on related party and unrelated party loans, convertible bonds or equity sales of our common stock in investing activities sinceorder to continue to fund our inception.business operations. We believe this will enable us to meet our cash needs for the next 12 months. Issuances of additional shares will result in dilution to our existing stockholders. Importantly, there is no assurance that we will achieve any additional sales of our equity securities or arrange for debt or other financing (whether from related parties or otherwise) to fund our planned business activities.
PurchaseExcept for the convertible bonds and loans from others, we presently do not have any other arrangements or commitments for additional financing for the expansion of Significant Equipmentour operations, and no potential lines of credit or sources of financing are currently available for the purpose of proceeding with our plan of operations.
Off-Balance Sheet Arrangements
We do not intend to purchase any significant equipment during the twelve months beginning March 1, 2018.
Personnel Plan
We do not expect any material changes in the number of employees during the twelve months beginning March 1, 2018. We do and will continue to engage contractors or consultants as needed.
Off-Balance Sheet Arrangements
There arehave no off-balance sheet arrangements that have or are reasonably likely to have a current or future affecteffect on our financial condition, changes in financial condition, revenues or expenses, results of operations, liquidity, and capital expenditures or capital resources that isare material to investors. Our principal capital resourcesstockholders.
Critical Accounting Policies
The preparation of financial statements in conformity with accounting principles generally accepted in the United States (“GAAP”) requires us to make estimates and assumptions that affect the reported amounts of assets and liabilities and disclosure of contingent assets and liabilities at the date of the financial statements and the reported amounts of revenues and expenses during the reported period. The critical accounting policies we employ in the preparation of our consolidated financial statements are those which involve impairment of long-lived assets, intangible assets and income taxes.
Going Concern
The Company incurred an operating loss of $2,115,716 for the year ended December 31, 2019, and as of that date, the Company’s current liabilities exceeded its current assets by $1,555,450. Notwithstanding the operating loss incurred for the year ended December 31, 2019 and the net current liabilities as of December 31, 2019, the accompanying consolidated financial statements have been throughprepared on a going concern basis. Since the subscription and issuanceCompany is currently in the exploration stage, it is still in the capital investing period. The Company’s business forecast indicates that the Company will have positive cash inflow after the commencement of common stock, although weformal production in 2021. Management believes the Company will have also used stockholder loans and advances from related parties.
Contractual Obligations and Commitments
As of February 28, 2018, we do not have any contractual obligations and commitments.
Anticipated Cash Requirements
Our expenses for the twelve-month period beginning from March 1, 2018 are estimated to be approximately $125,000. With oursufficient working capital deficit of $69,007 as at February 28, 2018, we will need to raise additional capital to cover our expenses for this twelve-month period beginning from March 1, 2018. We plan to raise additional funding either from new share issuance or from loans from shareholders.
Estimated Expenses For the Twelve Month Period Beginning March 1, 2018 |
| |||
|
|
|
|
|
Professional Fees |
| $ | 40,000 |
|
Inventory |
| $ | 50,000 |
|
Marketing and Business Development |
|
| 10,000 |
|
General & Administrative |
|
| 25,000 |
|
Total |
| $ | 125,000 |
|
At present, our cashmeet its financing requirements for the next 12 months (beginning March 1, 2018) outweighbased on the funds available to maintain or develop our business. Offinancial support of certain stockholders, issuance of new convertible bonds, proceeds from unrelated party loans and upon their experience and their assessment of the estimated $125,000 that we require for the 12 months, we had approximately $8,186 in cashCompany’s projected performance, production ability and cash equivalents as at February 28, 2018. In order to improve our liquidity, we plan to pursue additional equity financing from private investors or possibly a registered public offering. We do not currently have any definitive arrangements in place for the completion of any further private placement financings and there is no assurance that we will be successful in completing any further private placement financings. If we are unable to raise sufficient additional financial, we will be required to scale back our business plan to accommodate the funds available to us. This would involve the elimination of all non-essential expenditures, such as inventory purchases, marketing & web design, and administrative expenses not related to our public reporting requirements.product market.
If we are able to raise the required funds to fully implement our business plan, we plan to implement the business actions in the order provided below. If we are not able to raise all required funds, we will prioritize our corporate activities as chronologically as follows:
March 1, 2018 to February 28, 2019:
|
| |
|
| |
|
| |
|
| |
|
| |
|
|
Future Financings
We will continue to rely on equity sales of our common shares and funding from directors and shareholders in order to continue to fund our business operations. Issuances of additional shares will result in dilution to existing stockholders. There is no assurance that we will achieve any additional sales of the equity securities or arrange for debt or other financing to fund our operations and other activities.
Going Concern
We incurred a cumulative net loss of $83,297 during the period from inception, December 1, 2016, to February 28, 2018. We have commenced limited operations, raising substantial doubt about our ability to continue as a going concern. We will seek additional sources of capital through the issuance of debt or equity financing, but there can be no assurance that we will be successful in accomplishing our objectives.
Our ability to continue as a going concern is dependent on additional sources of capital and the success of our plan. The financial statements do not include any adjustments relating to the recoverability and classification of recorded asset amounts, or amounts and classification of liabilities that might result from the outcome of this uncertainty.
Critical Accounting Policies
Our significant accounting policies are described in the notes to our financial statements for the year ended February 28, 2018, and are included elsewhere in this annual report on Form 10-K.
Item 7A. Quantitative and Qualitative Disclosures About Market Risk
N/A.Not applicable.
Item 8. Financial Statements and Supplementary Data
The auditOur Consolidated Financial Statements, together with the report of MNP LLP, Chartered Accountantsour independent registered public accounting firm, begin on page 20 of this Annual Report and our audited financial statements for the year ended February 28, 2018 follow on pages F-1 through F-12.are incorporated herein by reference.
| Table of Contents |
Report of Independent Registered Public Accounting Firm
REPORT OF INDEPENDENT REGISTERED PUBLIC ACCOUNTING FIRM
To the Stockholders and the Board of Directors and
Stockholders of TGS International Ltd.
Opinion on the Consolidated Financial Statements
We have audited the accompanying consolidated balance sheets of TGS International Ltd. (the “Corporation”and subsidiaries (collectively, the “Company”) as of February 28,December 31, 2019 and 2018, and 2017, and the related consolidated statements of lossoperations and comprehensive loss, changes in stockholders’ equity, (deficit) and cash flows for each of the year ended February 28, 2018 and fortwo years in the period fromended December 1, 2016 (inception) to February 28, 2017,31, 2019, and the related notes (collectively referred to as the consolidated“consolidated financial statements)statements”). In our opinion, the consolidated financial statements present fairly, in all material respects, the consolidated financial position of the CorporationCompany as of February 28,December 31, 2019 and 2018, and 2017, and the consolidated results of its operations and its cash flows for each of the year ended February 28, 2018 and fortwo years in the period fromended December 1, 2016 (inception) to February 28, 2017,31, 2019, in conformity with accounting principles generally accepted in the United States of America.
The Corporation’s AbilityMaterial Uncertainty related to Continue as a Going Concern
The accompanying consolidated financial statements have been prepared assuming that the CorporationCompany will continue as a going concern. As discussed in Note 1 to the consolidated financial statements, the Corporation’s recurring lossesCompany has suffered an operating loss of $2,115,716 for the year ended December 31, 2019, and negative cash flows from operations as well as working capital deficiency and accumulated deficitof that date, the Company’s current liabilities exceeded its current assets by $1,555,450, which raise substantial doubt about its ability to continue as a going concern. Management’sManagement's plans concerningin regard to these matters are also discusseddescribed in Note 1 to the consolidated financial statements.1. The consolidated financial statements do not include any adjustments that might result from the outcome of this uncertainty.
Basis for Opinion
These consolidated financial statements are the responsibility of the Corporation'sCompany’s management. Our responsibility is to express an opinion on the Corporation'sCompany’s consolidated financial statements based on our audits. We are a public accounting firm registered with the Public CorporationCompany Accounting Oversight Board (United States) (PCAOB)(“PCAOB”) and are required to be independent with respect to the CorporationCompany in accordance with the U.S. federal securities laws and the applicable rules and regulations of the Securities and Exchange Commission and the PCAOB.
We conducted our audits in accordance with the standards of the PCAOB. Those standards require that we plan and perform the auditaudits to obtain reasonable assurance about whether the consolidated financial statements are free of material misstatement, whether due to error or fraud. The CorporationCompany is not required to have, nor were we engaged to perform, an audit of its internal control over financial reporting. As part of our audits, we are required to obtain an understanding of internal control over financial reporting but not for the purpose of expressing an opinion on the effectiveness of the Corporation'sCompany’s internal control over financial reporting. Accordingly, we express no such opinion.
Our audits included performing procedures to assess the risks of material misstatement of the consolidated financial statements, whether due to error or fraud, and performing procedures that respond to those risks. Such procedures included examining, on a test basis, evidence regarding the amounts and disclosures in the consolidated financial statements. Our audits also included evaluating the accounting principles used and significant estimates made by management, as well as evaluating the overall presentation of the consolidated financial statements. We believe that our audits provide a reasonable basis for our opinion.
/s/ Moore Stephens CPA Limited
Certified Public Accountants
We have served as the Company’s auditor since 2015.
Hong Kong
March 20, 2020
|
| 20 |
|
|
|
|
| Table of Contents |
TGS International Ltd. Consolidated Balance Sheets as of December 31, 2019 and December 31, 2018 |
|
| Note |
|
| December 31, 2019 |
|
| December 31, 2018 |
| |||
|
|
|
|
|
|
|
|
|
| |||
Assets |
|
|
|
|
|
|
|
|
| |||
|
|
|
|
|
|
|
|
|
| |||
Current assets |
|
|
|
|
|
|
|
|
| |||
Cash and cash equivalents |
|
|
|
| $ | 106,850 |
|
| $ | 98,121 |
| |
Other receivables |
|
|
|
|
| 459,846 |
|
|
| 68,963 |
| |
Prepayments and deposits |
|
|
|
|
| 197,995 |
|
|
| 141,522 |
| |
Accounts receivable |
|
|
|
|
| 58,825 |
|
|
| - |
| |
|
|
|
|
|
|
|
|
|
|
|
| |
Total current assets |
|
|
|
|
| 823,516 |
|
|
| 308,606 |
| |
|
|
|
|
|
|
|
|
|
|
|
| |
Non-current assets |
|
|
|
|
|
|
|
|
|
|
| |
Property, plant and equipment |
|
| 3 |
|
|
| 2,406,368 |
|
|
| 1,557,622 |
|
Intangible assets |
|
| 4 |
|
|
| 1,097,362 |
|
|
| 1,097,362 |
|
Right-of-use assets |
|
| 5 |
|
|
| 189,456 |
|
|
| - |
|
|
|
|
|
|
|
|
|
|
|
|
|
|
Total assets |
|
|
|
|
| $ | 4,516,702 |
|
| $ | 2,963,590 |
|
|
|
|
|
|
|
|
|
|
|
|
|
|
Liabilities and Stockholders’ Equity |
|
|
|
|
|
|
|
|
|
|
|
|
|
|
|
|
|
|
|
|
|
|
|
|
|
Current liabilities |
|
|
|
|
|
|
|
|
|
|
|
|
Accounts payable |
|
|
|
|
| $ | 9,769 |
|
| $ | - |
|
Accrued charges |
|
|
|
|
|
| 228,283 |
|
|
| 301,413 |
|
Other payables |
|
| 7 |
|
|
| 1,304,355 |
|
|
| 237,167 |
|
Lease liabilities |
|
| 5 |
|
|
| 189,456 |
|
|
| - |
|
Amount due to a director |
|
| 14(d) |
|
| 73,950 |
|
|
| 73,560 |
| |
Loans from related persons |
|
| 14(a) |
|
| 385,158 |
|
|
| 766,246 |
| |
Convertible bond payable, net |
|
| 8 |
|
|
| 187,995 |
|
|
| - |
|
|
|
|
|
|
|
|
|
|
|
|
|
|
Total current liabilities |
|
|
|
|
|
| 2,378,966 |
|
|
| 1,378,386 |
|
|
|
|
|
|
|
|
|
|
|
|
|
|
Non-current liabilities |
|
|
|
|
|
|
|
|
|
|
|
|
Amounts due to stockholders |
|
| 14(c) |
|
| 872,968 |
|
|
| 398,208 |
| |
Amount due to a director |
|
| 14(d) |
|
| 45,045 |
|
|
| - |
| |
Other loan |
|
| 9 |
|
|
| 132,423 |
|
|
| - |
|
Provision for asset retirement obligations |
|
| 10 |
|
|
| 33,443 |
|
|
| 31,383 |
|
Provision for exploration asset compensation |
|
| 11 |
|
|
| 98,742 |
|
|
| 102,127 |
|
|
|
|
|
|
|
|
|
|
|
|
|
|
Total liabilities |
|
|
|
|
|
| 3,561,587 |
|
|
| 1,910,104 |
|
|
|
|
|
|
|
|
|
|
|
|
|
|
Commitments |
|
|
|
|
|
| - |
|
|
| - |
|
|
|
|
|
|
|
|
|
|
|
|
|
|
Stockholders’ equity |
|
|
|
|
|
|
|
|
|
|
|
|
Capital Stock |
|
|
|
|
|
|
|
|
|
|
|
|
-Preferred stock, $0.0001 par value; 100,000,000 shares authorized, nil issued and outstanding |
|
|
|
|
|
| - |
|
|
| - |
|
-Common stock, $0.0001 par value; 200,000,000 shares authorized, 14,790,896 shares issued and outstanding as of December31, 2019 and 14,165,000 shares issued and outstanding as of December31, 2018 |
|
| 12 |
|
|
| 1,479 |
|
|
| 1,417 |
|
|
|
|
|
|
|
|
|
|
|
|
|
|
Additional paid in capital |
|
|
|
|
|
| 10,824,927 |
|
|
| 8,937,243 |
|
Accumulated deficit |
|
|
|
|
|
| (9,733,167 | ) |
|
| (7,617,451 | ) |
Accumulated other comprehensive loss |
|
|
|
|
|
| (138,124 | ) |
|
| (267,723 | ) |
|
|
|
|
|
|
|
|
|
|
|
|
|
Total stockholders’ equity |
|
|
|
|
|
| 955,115 |
|
|
| 1,053,486 |
|
|
|
|
|
|
|
|
|
|
|
|
|
|
Total liabilities and stockholders’ equity |
|
|
|
|
| $ | 4,516,702 |
|
| $ | 2,963,590 |
|
TGS International Ltd. Consolidated Statements of Financial Position Stated in US dollars As at February 28, 2018 February 28, 2017 ASSETS Current Cash Prepaid expenses Trade receivables Long-term Equipment & fixtures 7,880 Total Assets 18,539 LIABILITIES Current Trade and other payables Due to related parties (Note 4) Total Liabilities STOCKHOLDERS' (DEFICIENCY) EQUITY Capital Stock Authorized 200,000,000 common stock, voting, par value $0.0001 each 100,000,000 preferred stock, non-voting, par value $0.0001 each Issued 13,530,000 common stock (Note 5) Additional paid in capital (Note 5) Deficit (95,319 Accumulated other comprehensive income (loss) (255 ) Total Stockholders' (Deficiency) Equity (61,127 Total Liabilities and Stockholders' Equity (Deficiency) 18,539 $ 8,186 $ 20,867 2,473 7,548 - 1,490 10,659 29,905 9,918 $ $ 39,823 $ 24,976 $ 19,955 54,690 - 79,666 19,955 1,353 1,353 33,094 33,094 ) (14,327 ) (252 ) ) 19,868 $ $ 39,823
Going Concern (Note 1)
The accompanying notes are an integral part of these consolidated financial statementsstatements.
| Table of Contents |
TGS International Ltd. Consolidated Statements of Operations and Comprehensive Loss for the years ended December 31, 2019 and 2018 |
|
|
|
|
| Years ended December 31, |
| ||||||
|
| Note |
|
| 2019 |
|
| 2018 |
| |||
|
|
|
|
|
|
|
|
|
| |||
Revenue |
|
| 13 |
|
| $ | 282,857 |
|
| $ | 274,238 |
|
Commission income |
|
| 13 |
|
|
| - |
|
|
| 393,566 |
|
Cost, expenses and other: |
|
|
|
|
|
|
|
|
|
|
|
|
Cost of goods sold |
|
|
|
|
|
| - |
|
|
| (10,554 | ) |
Exploration |
|
|
|
|
|
| (737,248 | ) |
|
| (421,508 | ) |
Selling and distribution |
|
|
|
|
|
| (105,279 | ) |
|
| (56,697 | ) |
Depreciation of factory equipment |
|
|
|
|
|
| (28,898 | ) |
|
| (28,202 | ) |
Administrative |
|
|
|
|
|
| (1,645,900 | ) |
|
| (1,342,830 | ) |
|
|
|
|
|
|
|
|
|
|
|
|
|
Loss from operations |
|
|
|
|
|
| (2,234,468 | ) |
|
| (1,191,987 | ) |
Other income |
|
|
|
|
|
| 195,576 |
|
|
| 34,083 |
|
Interest expense |
|
|
|
|
|
| (76,824 | ) |
|
| (83,548 | ) |
Loss before provision for income taxes |
|
|
|
|
|
| (2,115,716 | ) |
|
| (1,241,452 | ) |
|
|
|
|
|
|
|
|
|
|
|
|
|
Income taxes |
|
| 6 |
|
|
| - |
|
|
| - |
|
Net loss |
|
|
|
|
|
| (2,115,716 | ) |
|
| (1,241,452 | ) |
Other comprehensive income/(loss), net of tax: |
|
|
|
|
|
|
|
|
|
|
|
|
Foreign currency translation adjustments |
|
|
|
|
|
| 129,599 |
|
|
| (39,328 | ) |
Comprehensive loss |
|
|
|
|
| $ | (1,986,117 | ) |
| $ | (1,280,780 | ) |
Net loss per share: |
|
| 15 |
|
|
|
|
|
|
|
|
|
Basic and Diluted net loss per share |
|
|
|
|
| $ | (0.15 | ) |
| $ | (0.26 | ) |
|
|
|
|
|
|
|
|
|
|
|
|
|
Weighted average number of common shares outstanding: |
|
|
|
|
|
|
|
|
|
|
|
|
Basic and diluted |
|
|
|
|
|
| 14,532,189 |
|
|
| 4,736,382 |
|
TGS International Ltd. Consolidated Statements of Loss and Comprehensive Loss Stated in US dollars Year ended February 28, Period from December 1, 2016 (inception) to February 28, 2018 2017 Revenue Cost of goods sold Gross profit Expenses Depreciation 2,038 Filing fees General & administration Management fee Professional fees 92,507 Net loss (80,992 Other comprehensive income (loss) Foreign currency adjustment (3 ) Comprehensive loss (80,995 Basic and diluted loss per common stock Weighted average number of common stock outstanding $ 33,663 $ 6,214 (22,148 ) (5,214 ) 11,515 1,000 - 20,293 - 8,989 3,594 8,588 - 52,599 11,733 15,327 ) (14,327 ) (252 ) $ ) $ (14,579 ) $ (0.006 ) $ (0.001 ) 13,530,000 13,065,000
The accompanying notes are an integral part of these consolidated financial statementsstatements.
| Table of Contents |
TGS International Ltd. Consolidated Statements of Changes in Stockholders’ Equity for the years ended December 31, 2019 and 2018 |
TGS International Ltd. Consolidated Statements of Changes in Equity (Deficit) Stated in US dollars Common stock Additional paid in Accumulated other comprehensive Stocks Amount capital income (Loss) Deficit Total Balance, December 1, 2016 (inception) Common stock issued Shareholder contribution on acquisition Net loss for the period Other comprehensive loss for the period Balance, February 28, 2017 Net loss for the year (80,992 (80,992 Other comprehensive income for the year ) ) Balance, February 28, 2018 ) - $ - $ - $ - $ - $ - 13,530,000 1,353 30,103 - - 31,456 - - 2,991 - - 2,991 - - - - (14,327 ) (14,327 ) - - - (252 ) - (252 ) 13,530,000 1,353 33,094 (252 ) (14,327 ) 19,868 - - - - ) ) - - - (3 - (3 13,530,000 $ 1,353 $ 33,094 $ (255 $ (95,319 ) $ (61,127 )
|
|
|
|
|
|
|
| Additional |
|
|
|
|
| Accumulated other |
|
|
|
| ||||||||||
|
|
|
|
| Common Stock |
|
| Paid-in |
|
| Accumulated |
|
| comprehensive |
|
|
|
| ||||||||||
|
| Note |
|
| Shares |
|
| Amount |
|
| Capital |
|
| deficit |
|
| loss |
|
| Total |
| |||||||
Balance as of December 31, 2017 |
|
|
|
|
| 791 |
|
| $ | 791 |
|
| $ | (691 | ) |
| $ | (6,375,999 | ) |
| $ | (228,395 | ) |
| $ | (6,604,294 | ) | |
|
|
|
|
|
|
|
|
|
|
|
|
|
|
|
|
|
|
|
|
|
|
|
|
|
|
|
| |
Issuance of common stock |
|
| 14(c) |
|
| 6,999,209 |
|
|
| 6,999,209 |
|
|
| 1,849,501 |
|
|
| - |
|
|
| - |
|
|
| 8,848,710 |
| |
|
|
|
|
|
|
|
|
|
|
|
|
|
|
|
|
|
|
|
|
|
|
|
|
|
|
|
|
|
Adjustment due to the reverse merger |
|
| 1 |
|
|
| 7,030,000 |
|
|
| (6,998,597 | ) |
|
| 6,998,597 |
|
|
| - |
|
|
| - |
|
|
| - |
|
|
|
|
|
|
|
|
|
|
|
|
|
|
|
|
|
|
|
|
|
|
|
|
|
|
|
|
|
|
Cancellation of shares |
|
| 1 |
|
|
| (30,000 | ) |
|
| (3 | ) |
|
| 3 |
|
|
| - |
|
|
| - |
|
|
| - |
|
|
|
|
|
|
|
|
|
|
|
|
|
|
|
|
|
|
|
|
|
|
|
|
|
|
|
|
|
|
Proceeds from issuance of shares and warrants |
|
| 12 |
|
|
| 165,000 |
|
|
| 17 |
|
|
| 89,833 |
|
|
| - |
|
|
| - |
|
|
| 89,850 |
|
|
|
|
|
|
|
|
|
|
|
|
|
|
|
|
|
|
|
|
|
|
|
|
|
|
|
|
|
|
Net loss |
|
|
|
|
|
| - |
|
|
| - |
|
|
| - |
|
|
| (1,241,452 | ) |
|
| - |
|
|
| (1,241,452 | ) |
|
|
|
|
|
|
|
|
|
|
|
|
|
|
|
|
|
|
|
|
|
|
|
|
|
|
|
|
|
Foreign currency translation adjustments |
|
|
|
|
|
| - |
|
|
| - |
|
|
| - |
|
|
| - |
|
|
| (39,328 | ) |
|
| (39,328 | ) |
|
|
|
|
|
|
|
|
|
|
|
|
|
|
|
|
|
|
|
|
|
|
|
|
|
|
|
|
|
Balance as of December 31, 2018 |
|
|
|
|
|
| 14,165,000 |
|
| $ | 1,417 |
|
| $ | 8,937,243 |
|
| $ | (7,617,451 | ) |
| $ | (267,723 | ) |
| $ | 1,053,486 |
|
|
|
|
|
|
|
|
|
|
|
|
|
|
|
|
|
|
|
|
|
|
|
|
|
|
|
|
|
|
Proceeds from issuance of common stock |
|
| 12 |
|
|
| 625,896 |
|
|
| 62 |
|
|
| 1,887,684 |
|
|
| - |
|
|
| - |
|
|
| 1,887,746 |
|
|
|
|
|
|
|
|
|
|
|
|
|
|
|
|
|
|
|
|
|
|
|
|
|
|
|
|
|
|
Net loss |
|
|
|
|
|
| - |
|
|
| - |
|
|
|
|
|
|
| (2,115,716 | ) |
|
| - |
|
|
| (2,115,716 | ) |
Foreign currency translation adjustments |
|
|
|
|
|
| - |
|
|
| - |
|
|
|
|
|
|
| - |
|
|
| 129,599 |
|
|
| 129,599 |
|
|
|
|
|
|
|
|
|
|
|
|
|
|
|
|
|
|
|
|
|
|
|
|
|
|
|
|
|
|
Balance as of December 31, 2019 |
|
|
|
|
|
| 14,790,896 |
|
| $ | 1,479 |
|
| $ | 10,824,927 |
|
| $ | (9,733,167 | ) |
| $ | (138,124 | ) |
| $ | 955,115 |
|
The accompanying notes are an integral part of these consolidated financial statementsstatements.
| Table of Contents |
TGS International Ltd. Consolidated Statements of Cash Flows for the years ended December 31, 2019 and 2018 |
|
|
|
|
| Year ended December 31, |
| ||||||
|
| Note |
|
| 2019 |
|
| 2018 |
| |||
|
|
|
|
|
|
|
|
|
| |||
Cash flows from operating activities |
|
|
|
|
|
|
|
|
| |||
Net loss |
|
|
|
| $ | (2,115,716 | ) |
| $ | (1,241,452 | ) | |
|
|
|
|
|
|
|
|
|
|
|
| |
Adjustments to reconcile net loss to net cash used in operating activities:- |
|
|
|
|
|
|
|
|
|
|
| |
Depreciation of property, plant and equipment |
|
| 3 |
|
|
| 51,898 |
|
|
| 52,149 |
|
Loss on disposal of property, plant and equipment |
|
|
|
|
|
| - |
|
|
| 1,018 |
|
Net foreign exchange losses |
|
|
|
|
|
| 246,346 |
|
|
| 30,369 |
|
Stock compensation expenses |
|
| 12 |
|
|
| 122,100 |
|
|
| 37,350 |
|
Waiver of consultancy fee |
|
|
|
|
|
| (34,556 | ) |
|
| (5,311 | ) |
Write back of receipt in advance |
|
|
|
|
|
| (160,542 | ) |
|
| - |
|
Amortization of right-of-use asset |
|
| 5 |
|
|
| 206,643 |
|
|
| - |
|
Amortization of non-cash interest expenses and bond discount related to convertible bonds |
|
|
|
|
|
| 13,732 |
|
|
| - |
|
Written off of deposit paid |
|
|
|
|
|
| - |
|
|
| 10,856 |
|
Over-provision of prior year service fee |
|
|
|
|
|
| - |
|
|
| (28,661 | ) |
|
|
|
|
|
|
|
|
|
|
|
|
|
Changes in assets and liabilities:- |
|
|
|
|
|
|
|
|
|
|
|
|
Accounts receivable |
|
|
|
|
|
| (60,314 | ) |
|
| - |
|
Other receivables |
|
|
|
|
|
| (394,560 | ) |
|
| 5,551 |
|
Prepayments and deposits |
|
|
|
|
|
| (56,795 | ) |
|
| 6,874 |
|
Accrued charges |
|
|
|
|
|
| (40,022 | ) |
|
| 96,881 |
|
Accounts and other payables |
|
|
|
|
|
| 1,196,364 |
|
|
| 142,889 |
|
Lease liabilities |
|
|
|
|
|
| (206,643 | ) |
|
| - |
|
Provision for asset retirement obligations |
|
|
|
|
|
| 3,179 |
|
|
| 3,408 |
|
Net cash used in operating activities |
|
|
|
|
|
| (1,228,886 | ) |
|
| (888,079 | ) |
|
|
|
|
|
|
|
|
|
|
|
|
|
Cash flows from investing activities |
|
|
|
|
|
|
|
|
|
|
|
|
Proceeds from the sale of property plant and equipment |
|
|
|
|
|
| - |
|
|
| 4,026 |
|
Acquisition of property, plant and equipment |
|
|
|
|
|
| (976,818 | ) |
|
| (42,405 | ) |
Net cash used in investing activities |
|
|
|
|
|
| (976,818 | ) |
|
| (38,379 | ) |
|
|
|
|
|
|
|
|
|
|
|
|
|
Cash flows from financing activities |
|
|
|
|
|
|
|
|
|
|
|
|
Advances from stockholders |
|
|
|
|
|
| 517,329 |
|
|
| 478,958 |
|
Net advances from directors |
|
|
|
|
|
| 165,392 |
|
|
| - |
|
Repayment of loans from related persons |
|
|
|
|
|
| (127,648 | ) |
|
| - |
|
Proceed from issuance of common stock |
|
|
|
|
|
| 825,000 |
|
|
| - |
|
Proceed from new loan – related person |
|
|
|
|
|
| - |
|
|
| 510,354 |
|
Proceed from new loan – other |
|
|
|
|
|
| 131,663 |
|
|
| - |
|
Proceed from issuance of convertible bonds |
|
|
|
|
|
| 705,128 |
|
|
| - |
|
Net cash provided by financing activities |
|
|
|
|
|
| 2,216,864 |
|
|
| 989,312 |
|
Net increase in cash and cash equivalents |
|
|
|
|
|
| 11,160 |
|
|
| 62,854 |
|
Effect of exchange rate changes on cash and cash equivalents |
|
|
|
|
|
| (2,431 | ) |
|
| (3,676 | ) |
Cash and cash equivalents, beginning of year |
|
|
|
|
|
| 98,121 |
|
|
| 38,943 |
|
Cash and cash equivalents, end of year |
|
|
|
|
| $ | 106,850 |
|
| $ | 98,121 |
|
|
|
|
|
|
|
|
|
|
|
|
|
|
Supplemental disclosures:- |
|
|
|
|
|
|
|
|
|
|
|
|
Interest paid |
|
|
|
|
| $ | 66,377 |
|
| $ | 37,851 |
|
Income tax paid |
|
|
|
|
| $ | - |
|
| $ | - |
|
Cash paid for amounts included in measurement of lease liabilities |
|
|
|
|
| $ | 206,643 |
|
| $ | - |
|
|
|
|
|
|
|
|
|
|
|
|
|
|
Non-cash investing and financing transactions:- |
|
|
|
|
|
|
|
|
|
|
|
|
Cancellation of shares |
|
|
|
|
| $ | - |
|
| $ | 3 |
|
Capitalization of advances from stockholder |
|
| 14(c) |
| $ | - |
|
| $ | 8,848,710 |
| |
Capitalization of advances from a director |
|
| 14(d) |
| $ | 121,133 |
|
| $ | - |
| |
Capitalization of loans from related persons |
|
| 12 |
|
| $ | 289,578 |
|
| $ | - |
|
Recognition of Beneficial Conversion Feature (“BCF”) discount at inception of convertible bond |
|
| 8 |
|
| $ | 16,047 |
|
| $ | - |
|
Conversion of convertible bond and accrued interest into common stock |
|
| 8 |
|
| $ | 513,888 |
|
| $ | - |
|
Stock compensation expenses |
|
| 12 |
|
| $ | 122,100 |
|
| $ | 37,350 |
|
Right-of-use assets obtained in exchange for lease obligations |
|
|
|
|
| $ | 369,874 |
|
| $ | - |
|
TGS International Ltd. Consolidated Statements of Cash Flows Stated in US dollars Year ended February 28, Period from December 1, 2016 (inception) to February 28, 2018 2017 Operating activities Net loss for the period (80,992 Item not affecting cash: Depreciation 2,038 Changes in non-cash working capital: Trade receivables Prepaid expenses Trade and other payables Due to related parties Net cash used in operating activities Financing activities Common stock issued Net cash provided by financing activities Investing activities Acquisition Net cash used in investing activities Effect of exchange rate changes on cash Net cash increase (decrease) for period Cash, beginning of the period Cash, end of the period $ ) $ (14,327 ) - 1,534 (1,496 ) 5,311 (7,579 ) 4,315 10,119 54,452 2,991 (13,342 ) (10,292 ) - 31,456 - 31,456 - (154 ) - (154 ) 661 (143 ) (12,681 ) 20,867 20,867 - $ 8,186 $ 20,867
The accompanying notes are an integral part of these consolidated financial statementsstatements.
| Table of Contents |
TGS International Ltd. Notes to
|
NOTE 1 – - NATURE AND CONTINUANCE OF OPERATIONS AND GOING CONCERN
TGS International Ltd. (“TGS” or the “Corporation”, “the Company”) was incorporated in the state of Nevada, United States on December 1, 2016. On December 21, 2016,September 14, 2018, the CorporationCompany entered into a business combination by acquiring TGS Building Products Ltd.Share Exchange Agreement with Arcus Mining Holdings Limited (“Arcus”) and Chi Kin Loo, Billion Plus Limited, First Fortune Investment Limited, Great Win Limited and Master Value Holdings Limited (the “Selling Stockholders”), (“TGS Alberta”) (Note 3). TGS Alberta,pursuant to which the Selling Stockholders agreed to sell all of their ordinary shares of Arcus to the Company in exchange for an aggregate of 7,000,000 shares of common stock of the Company. Arcus, which was incorporated on March 8, 2016 specializes in the saleRepublic of Seychelles on June 17, 2014, and distributionits subsidiaries are engaged in fluorite mining operations in Mongolia, including the processing and installationsales of building materialsfluorite products. Up to December 31, 2019 and is focusedthe date of this report, the Company owns three mining rights in Mongolia (Mining license numbers: MV-016819, MV-017305 and MV-009918). During the year ended December 31, 2019, the Company did not commence regular mining operations except for a trial production which was conducted in Mine A and Mine B, which are located in Uulbayan soum, Sukhbaatar province (Mining license number: MV-009918) and Bayan-Ovoo soum, Khentii province (Mining license number: MV-016819), respectively.
Reverse merger
On September 14, 2018, the Company and Arcus entered into a Share Exchange Agreement, dated September 14, 2018 with the Selling Stockholders, pursuant to which the Selling Stockholders agreed to sell all of their ordinary shares of Arcus to the Company in exchange for an aggregate of 7,000,000 shares of common stock of the Company. The merger closed on September 14, 2018 and resulted in the North Americanfollowing:
Immediately prior to the Share Exchange, 6,500,000 shares of our outstanding common stock were cancelled and retired. A further 30,000 shares were cancelled after the Share Exchange.
As a result of the transactions described above, the Company became the record and beneficial owner of 100% of the share capital of Arcus and therefore owns 100% of the share capital of its subsidiaries.
As a result of the Share Exchange, the cancellation of 6,530,000 shares and the issuance of 7,000,000 shares, the Company had 14,000,000 shares of common stock issued and outstanding on September 14, 2018.
The transaction is accounted for as a “reverse acquisition”, with Arcus being treated as the accounting acquirer for financial reporting purposes. The historical consolidated financial statements include the operations of the accounting acquirer and its subsidiaries for all periods presented.
Going Concern
The Company incurred an operating loss of $2,115,716 for the year ended December 31, 2019, and as of that date, the Company’s current liabilities exceeded its current assets by $1,555,450. Notwithstanding the operating loss incurred for the year ended December 31, 2019 and the net current liabilities as of December 31, 2019, the accompanying consolidated financial statements have been prepared on a going concern basis. Since the Company is currently in the exploration stage, it is still in the capital investing period. Management has prepared a business cash flow forecast and it indicates that the Company will have positive cash inflow after the commencement of formal production in 2021. Management believes the Company will have sufficient working capital to meet its financing requirements for the next 12 months based on the financial support of certain stockholders, issuance of new convertible bonds, proceeds from unrelated party loans and upon their experience and their assessment of the Company’s projected performance, production ability and product market.
NOTE 2 – SUMMARY OF SIGNIFICANT ACCOUNTING POLICIES
Principles of consolidation
These consolidated financial statements include the accounts of the Company, TGS, and all of the wholly owned subsidiaries of TGS. All intercompany balances have been preparedeliminated in accordance with generally accepted accounting principles applicable to a going concern, which assumes thatconsolidation.
Use of estimates in the Corporation and its subsidiary will be able to meet its obligations and continue its operations for next fiscal year. Realization values may be substantially different from carrying values as shown and thesepreparation of consolidated financial statements and do not give effect to adjustments that would be necessary to the carrying values and classification of assets and liabilities should the Corporation be unable to continue as a going concern.
At February 28, 2018, the Corporation had not yet achieved profitable operations and has accumulated losses of $95,319 since its inception. The Corporation expects to incur further losses in the development of its business, all of which casts substantial doubt about the Corporation’s ability to continue as a going concern. The Corporation’s ability to continue as a going concern is dependent upon its ability to generate future profitable operations and/or to obtain the necessary financing to meet its obligations and repay its liabilities arising from normal business operations when they come due. Management anticipates that additional funding will be in the form of equity financing from the sale of common stock. Management may also seek to obtain short-term loans from the directors of the Corporation. There are no current arrangements in place for equity funding or short-term loans.
NOTE 2 – SUMMARY OF SIGNIFICANT ACCOUNTING POLICIES
Basis of Presentation
The Corporation’s consolidated financial statements included herein are prepared under the accrual basis of accounting in accordance with accounting principles generally accepted in the United States of America. These consolidated financial statements include the financial statements of its wholly owned subsidiary, TGS Alberta. All inter-company balances and transactions have been eliminated.
Cash
For purposes of the consolidated statement of cash flows, management considers liquid investments with an original maturity of three months or less to be cash equivalents. As at February 28, 2018, all cash amounts deposited in accounts were federally insured.
|
NOTE 2 – SUMMARY OF SIGNIFICANT ACCOUNTING POLICIES (CONT.)
Equipment & Fixtures
Items of equipment and fixtures are measured at cost less accumulated depreciation and accumulated impairment loss. Depreciation is calculated using the straight-line method and at the following annual rates which is intended to amortize the cost over its useful life:
Equipment and fixtures – 5 years
Improvements and betterments are capitalized if they extend the useful life of the asset. Repair and maintenance costs are charged to expense as incurred. Gain (loss) related to retirement or disposition of fixed assets is recognized in the period which the gain (loss) occurs.
Use of Estimates
The preparation of consolidated financial statements in conformityaccordance with accounting principles generally accepted in the United States of AmericaU.S. GAAP requires management to make estimates and assumptions that affect the reported amounts of assets and liabilities and disclosuresdisclosure of contingent assets and liabilities at the date of the consolidated financial statements and the reported amounts of revenues and expenses during the reportingreported period. SuchAlthough these estimates includes the useful life, residual value and depreciation rate of equipment and fixtures. Management makes itsare based on management’s best estimateassessment of the ultimate outcome for these items based on historical trendscurrent business environment, actual results may be different from those estimates. The significant estimates and other information available whenassumptions that affect the consolidated financial statements include, but are prepared. Changes in estimates are recognized in accordance withnot limited to, deferred tax valuation allowances, income-tax uncertainties, assumptions used to determine the accounting rules for the estimate, which is typically in the period when new information becomes availableincremental borrowing rate to management. Actual results could differ from those estimates.calculate lease liabilities and right-of-use (“ROU”) assets, depreciation and amortization periods, recoverability of long-lived assets including intangible assets, valuation of warrant equity, and valuation and impairment losses on mining rights and valuation of asset retirement obligations and exploration asset compensation.
Comprehensive Income (loss)
The Corporation adopted FASB ASC 220, “Reporting Comprehensive Income”, which establishes standards for the reporting and display of comprehensive income and its components in the consolidated financial statements. Comprehensive income consists of net income and other gains and losses affecting stockholders’ equity that are excluded from net income, such as unrealized gains and losses on investments available for sale, foreign currency translation gains and losses and minimum pension liability. Since inception, the Corporation’s other comprehensive income (loss) represents foreign currency translation adjustments.
Basic and Diluted Loss per Common Stock
FASB ASC 260 requires dual presentation of basic and diluted earnings per share (EPS) with a reconciliation of the numerator and denominator of the EPS computations. Basic earnings per share amounts are based on the weighted average shares of common stock outstanding. If applicable, diluted earnings per stock would assume the conversion, exercise or issuance of all potential common stock instruments such as options, warrants and convertible securities, unless the effect is to reduce a loss or increase earnings per share. Diluted net income (loss) per common stock on the potential exercise of the equity-based financial instruments is not presented where anti-dilutive.
|
NOTE 2 – SUMMARY OF SIGNIFICANT ACCOUNTING POLICIES (CONT.)
Financial Instruments
Fair Value
The guidance for fair value measurements establishes the authoritative definition of fair value, sets out a framework for measuring fair value and outlines the required disclosures regarding fair value measurements. Fair value is the price that would be received to sell an asset or paid to transfer a liability (an exit price) in the principal or most advantageous market for the asset or liability in an orderly transaction between market participants at the measurement date.
The Corporation uses a three-tier fair value hierarchy based upon observable and non-observable inputs as follows:
| |
| Table of Contents |
TGS International Ltd. | Notes to Consolidated Financial Statements December 31, 2019 and 2018 |
Cash is measured using level 1 inputs.
AssetsConcentration and Liabilities that are measured at Fair Value on a Recurring Basis
The fair value hierarchy requires the use of observable market data when available. In instances in which the inputs used to measure fair value fall into different levels of the fair value hierarchy, the fair value measurement has been determined based on the lowest level input that is significant to the fair value measurement in its entirety.
The Corporation’s assessment of the significance of a particular item to the fair value measurement in its entirety requires judgment, including the consideration of inputs specific to the asset or liability.
The fair value of financial instruments consisting of cash, trade receivables, trade and other payables, and due to related parties were estimated to approximate their carrying values based on the short-term maturity of these instruments.
Riskscredit risks
Financial instruments that potentially subject the CorporationCompany to significant concentrations of credit risk consist principallyprimarily of cash and trade receivables.cash equivalents.
ManagementAll of the Company’s cash and cash equivalents are held at financial institutions that management believes to be of high credit quality. The Company has not experienced any losses on cash and cash equivalents to date. The Company does not believe the Corporation is exposedrequire collateral or other securities to significant credit risk. Management, as well, does not believe the Corporation is exposed to significant interest rate risks during the periods presented in these consolidated financial statements as the Corporation does not hold any interest-bearing financial instruments.
|
NOTE 2 – SUMMARY OF SIGNIFICANT ACCOUNTING POLICIES (CONT.)
Fair Value Measurements
The Corporation follows FASB ASC 820, Fair Value Measurements and Disclosures, for allsupport financial instruments and non-financial instruments accounted for at fair value on a recurring basis. This accounting standard establishes a single definition of fair value and a framework for measuring fair value, sets out a fair value hierarchythat are subject to be used to classify the source of information used in fair value measurement and expands disclosures about fair value measurements required under other accounting pronouncements. It does not change existing guidance as to whether or not an instrument is carried at fair value. The Corporation defines fair value as the price that would be received from selling an asset or paid to transfer a liability in an orderly transaction between market participants at the measurement date.
When determining the fair value measurements for assets and liabilities, which are required to be recorded at fair value, the Corporation considers the principal or most advantageous market in which the Corporation would transact and the market-based risk measurements or assumptions that market participants would use in pricing the asset or liability, such as inherent risk, transfer restrictions and credit risk.
The Corporation has adopted FASB ASC 825, Financial Instruments, which allows companiesCompany operates principally in the People’s Republic of China (“PRC”) (including Hong Kong) and Mongolia and grants credit to chooseits customers in these geographic regions. Although the PRC is economically stable, it is always possible that unanticipated events in foreign countries could disrupt the Company’s operations.
As of December 31, 2019 and 2018, the Company had credit risk exposure of uninsured cash and deposits with maturities of less than one year in banks of $96,495 and $116,744, respectively.
The net sales to measure eligiblecustomers representing at least 10% of net total sales are as follows:
|
| Year ended December 31, 2019 |
| |||||
|
| Amount |
|
| % |
| ||
|
|
|
|
|
|
| ||
Customer A |
| $ | 40,907 |
|
|
| 15 |
|
Customer B |
|
| 60,314 |
|
|
| 21 |
|
Customer C |
|
| 181,636 |
|
|
| 64 |
|
|
| $ | 282,857 |
|
|
| 100 |
|
|
| Year ended December 31, 2018 |
| |||||
|
| Amount |
|
| % |
| ||
|
|
|
|
|
|
| ||
Customer D |
| $ | 261,159 |
|
|
| 39 |
|
Customer E |
|
| 393,566 |
|
|
| 59 |
|
|
| $ | 654,725 |
|
|
| 98 |
|
Accounts receivable
Accounts receivable are recorded at the invoiced amount, net of allowances for doubtful accounts. The allowance for doubtful accounts is the Company’s best estimate of the amount of probable credit losses in the Company’s existing accounts receivable. Bad debt expense is included in administrative expenses.
The Company recognizes an allowance for doubtful receivables to ensure accounts and other receivables are not overstated due to uncollectibility. Allowance for doubtful receivables is maintained for all customers based on a variety of factors, including the length of time the receivables are past due, significant one-time events and historical experience. An additional allowance for individual accounts is recorded when the Company becomes aware of customers’ or other debtors’ inability to meet their financial instrumentsobligations, such as bankruptcy filings or deterioration in the customer’s or other debtor’s operating results or financial position. If circumstances related to customers or debtors change, estimates of the recoverability of receivables will be further adjusted. Accounts receivable are written off when deemed uncollectible. As of December 31, 2019 and certain other items2018, there were no allowance of accounts receivable.
Cash and cash equivalents
Cash and cash equivalents are short-term, highly liquid investments with original maturities of three months or less. As of December 31, 2019 and 2018, the Company’s cash amounted to $106,850 and $98,121, respectively, and there were no cash equivalents.
Intangible assets
Intangible assets consist of acquired mining rights and are initially measured at fair value thatas at the date of acquisition. Following the initial recognition, intangible assets are not required to be measuredstated at fair value. The Corporation has not elected the fair value option for any eligible financial instruments.cost less accumulated amortization and impairment losses.
Currency RisksIntangible assets are amortized on the units-of-production method utilizing only proven and probable fluorite reserves in the depletion base.
| 26 |
| Table of Contents |
TGS International Ltd. Notes to Consolidated Financial Statements December 31, 2019 and 2018 |
Property, plant and equipment
(i) | Property, plant and equipment are stated at cost less accumulated depreciation. Buildings are depreciated on a straight-line basis over 15 to 40 years, representing the shorter of the remaining term of the mining right or the expected useful life to the Company. | |
(ii) | Other categories of property, plant and equipment are recorded at cost and depreciated to their estimated residual values using the straight-line method over their estimated useful lives, as follows: |
· | Leasehold improvements: 5 years or the shorter of the remaining term of the lease | |
· | Furniture and equipment: 3 to 10 years | |
· | Motor vehicles: 3 to 10 years | |
· | Factory equipment: 3 to 10 years | |
· | Mineral properties: Unit-of-production |
(iii) | Normal repairs and maintenance are charged to operating expenses as incurred, while costs incurred that extend the useful life of an asset, improve the safety of our operations, or improve operating efficiency are capitalized. |
Impairment of long-lived assets
The Corporation’s presentation currency is in US dollarsCompany reviews and evaluates its functional currency is in Canadian dollars. Consequently, assets and liabilities carried in any currency other than Canadian dollars are subject to foreign currency fluctuations.
As at February 28, 2018, cash of $785 (2017 - $nil) and due to related parties of $15,614 (2017 - $nil) were denominated in US dollars.
Impairment of Long-Lived Assets
Impairment losses on long-lived assets are recognizedfor impairment when events or changes in circumstances indicate that the undiscounted cash flows estimated to be generated by such assets are less than theirrelated carrying value and, accordingly, all or a portion of such carrying valueamounts may not be recoverable. Impairment lossesis considered to exist if the total estimated future cash flows on an undiscounted basis are thenless than the carrying amount of the assets. An impairment loss is measured by comparingand recorded based on discounted estimated future cash flows or upon an estimate of fair value that may be received in an exchange transaction. Future cash flows are estimated based on quantities of recoverable minerals, expected fluorspar prices, production levels and operating costs of production and capital, based upon the projected remaining future fluorspar production from each mining site. Existing proven and probable reserves and value beyond proven and probable reserves, including mineralization that is not part of the measured, indicated or inferred resource base, are included when determining the fair value of mine site reporting units at acquisition and, subsequently, in determining whether the assets are impaired. The term “recoverable minerals” refers to their carrying amounts. No impairmentsthe estimated amount of these typesfluorspar that will be obtained after taking into account losses during processing and treatment. In estimating future cash flows, assets are grouped at the lowest level for which there are identifiable cash flows that are largely independent of assets were recognized duringfuture cash flows from other asset groups. The Company’s estimates of future cash flows are based on numerous assumptions and it is possible that actual future cash flows will be significantly different than the year ended February 28, 2018.estimates, as actual future quantities of recoverable minerals, fluorspar prices, production levels and operating costs of production and capital are each subject to significant risks and uncertainties. As of December 31, 2019 and 2018, there was no impairment of long-lived assets.
Revenue RecognitionIncome taxes
The Corporation recognizes revenue when persuasive evidence of an arrangement exists, shipment has occurred or services rendered, the price is fixed or determinable and payment is reasonably assured. Customers take ownership at point of sale and bear the costs and risks of delivery.
|
Income Taxes
The Corporation follows FASB ASC Topic 740, “Income Taxes” which requires the use ofDeferred income taxes are provided using the asset and liability method of accounting for income taxes.in accordance with Financial Accounting Standards Board Accounting Standards Codification (“FASB ASC”) 740, “Income Taxes”. Under this method, deferred tax assets and liabilitiesincome taxes are recognized for future tax consequences attributable toall significant temporary differences between the consolidated financial statements carrying amounts of existing assetsat enacted rates and liabilities and loss carry forwards and their respective tax bases. Deferred tax assets and liabilities are measured using enacted tax rates expectedclassified as a non-current asset or liability. A valuation allowance is provided to apply to taxable income in the year in which those temporary differences are expected to be recovered or settled. The tax consequences of most events recognized in the current year’s consolidated financial statements are included in determining income taxes currently payable. However, because tax laws and financial accounting standards differ in their recognition and measurement of assets, liabilities, equity, revenues, expenses, gains and losses, differences arise betweenreduce the amount of taxable income and pre-tax financial income for a year and between the tax bases of assets or liabilities and their reported amounts in the consolidated financial statements.
Because the Corporation assumes that the reported amounts of assets and liabilities will be recovered and settled, respectively, a difference between the tax basis of an asset or a liability and its reported amount in the balance sheet will result in a taxable or a deductible amount in some future years when the related liabilities are settled or the reported amounts of the assets are recovered, which gives rise to a deferred tax asset. The Corporation must then assess the likelihoodassets if it is considered more likely than not that some portion of, or all, the deferred tax assets will not be recovered from future taxable income and to the extent the Corporation believes that recovery is not likely, the Corporation must establish a valuation allowance.realized.
The Corporation has adopted FASB guidance onASC 740 clarifies the accounting for uncertainty in income taxes which providesrecognized in an enterprise’s financial statements, and prescribes a consolidated financial statement recognition threshold and measurement attribute for the financial statement recognition and measurement of a tax position taken or expected to be taken in a tax return. Under thisIt also provides accounting guidance on de-recognition, classification, interest and penalties, accounting in years, disclosure and transition. Interest and penalties from tax assessments, if any, are included in income taxes in the Corporation may recognize the tax benefit from an uncertainstatements of operations and comprehensive income.
A tax position only if it ismust be more likely than not that the tax position willof being sustained in order to be sustained on examination by the taxing authorities, based on the technical merits of the position. The tax benefits recognized in the consolidated financial statements from such a position should be measured based onstatements. As of December 31, 2019 and 2018, the largest benefit that has a greater than 50% likelihood of being realized upon ultimate settlement. The guidance also extends to de-recognition of incomeCompany did not have any uncertain tax assets and liabilities, classification of current and deferred income tax assets and liabilities, accounting forpositions or accrued interest and penalties associated withrelated to uncertain tax positions, andpositions. The Company does not expect to have a material change to its income tax disclosures. As of February 28, 2018,provisions in the Corporation had no uncertain tax positions.next year.
Foreign Currency TranslationRestoration and remediation costs (Asset retirement obligations)
The functional currencyIn Mongolia, the mining laws and regulations require the Company to reclaim the surface areas and restore underground water quality for its mine projects to the pre-existing mine area average quality after completion of the Corporation and its subsidiary is Canadian dollars (“C$”). The Corporation’s reporting currency is the United States currency (“US dollars”).mining activities.
(i) Foreign currency transactionsFuture reclamation and remediation costs, which include extraction equipment removal and environmental remediation, are accrued at the end of each period based on management’s best estimate of the costs expected to be incurred for each project. Such estimates consider the costs of future surface and groundwater activities, current regulations, actual expenses incurred, and technology and industry standards.
TransactionsIn accordance with FASB ASC 410, “Asset Retirement and Environmental Obligations”, the Company capitalizes the measured fair value of asset retirement obligations to mineral properties. The asset retirement obligations are accreted to an undiscounted value until the time at which they are expected to be settled. The accretion expense is charged to earnings and the actual retirement costs are recorded against the asset retirement obligations when incurred. Any difference between the recorded asset retirement obligations and the actual retirement costs incurred will be recorded as a gain or loss in foreign currencies are initially recorded by the Corporationperiod of settlement.
On a regular basis, the Company reviews the assumptions used to estimate the expected cash flows required to settle the asset retirement obligations, including changes in estimated probabilities, amounts and its subsidiary at their respective functional currency rates prevailing at the datetiming of the transaction.settlement of the asset retirement obligations, as well as changes in any regulatory or legal obligations for each of its mineral projects. Changes in any one or more of these assumptions may cause revision of asset retirement obligations for the corresponding assets.
Monetary assets and liabilities denominated in foreign currencies are translated at the functional currency spot rate of exchange at the reporting date. All differences are taken to the consolidated statement of operations.
| Table of Contents |
TGS International Ltd. Notes to Consolidated Financial Statements December 31, 2019 and 2018 |
Revenue recognition
|
NOTE 2 – SUMMARY OF SIGNIFICANT ACCOUNTING POLICIES (CONT.)
Non-monetary items that are measured in terms of historical cost in a foreign currency are translated using the exchange rates as at the dates of the initial transactions. Non-monetary items measured at fair value in a foreign currency are translated using the exchange rates at the date when the fair value is determined.
(ii) Foreign operations
The assets and liabilities of foreign operations are translated to US dollars at exchange rates at the reporting date. The income and expenses of foreign operations are translated into US dollars at exchange rates at the dates of the transactions.
Foreign currency adjustments are recognized in other comprehensive income (loss) in the accumulated other comprehensive income (loss).
Foreign exchange gains or losses arising from a monetary item receivable from or payable to a foreign operation, the settlement of which is neither planned nor likely to occur in the foreseeable future and which in substance is considered to form part of the net investment in the foreign operation, are recognized in other comprehensive income in the cumulative amount of foreign currency translation differences.
Recent Accounting Pronouncements
The Corporation adopts new pronouncements relating to accounting principles generally accepted in the United States of America applicable to the Corporation as they are issued, which may be in advance of their effective date. Management does not believe that any recently issued, but not yet effective accounting standards, if currentlyCompany adopted would have a material effect on the accompanying consolidated financial statements.
In May 2014, the FASB issued Accounting Standards Update 2014-09,ASC 606, “Revenue from Contracts with Customers” (“ASU 2014-09”) and issued subsequent amendments, applying the modified retrospective method. The adoption did not result in a material adjustment to the initial guidance during 2015 and 2016, collectively referred toaccumulated deficit as “Topic 606”. These updates supersedeof January 1, 2018.
The Company recognizes revenue in accordance with ASC 606 when control of the revenue recognition requirements in ASC Topic 605, "Revenue Recognition" and nearly all other existing revenue recognition guidance under US GAAP. The core principle of Topic 606 is to recognize revenues when promised goods or services areis transferred to customersthe customer in an amount that reflects the consideration that is expectedthe Company expects to be receivedentitled to in exchange for those goods or services. Topic 606
The Company has two kinds of revenue, sales of fluorite and commission income.
The Company recognizes revenue when it satisfies a performance obligation in accordance with the provisions of a customer order or contract. This is achieved when control of the product has been transferred to the customer, which is generally determined when title, ownership, and risk of loss pass to the customer, all of which occurs upon shipment or delivery of the product. In determining when and how much revenue is recognized from contracts with customers, the Company performs the following five-step analysis: (1) identify the contract with a customer; (2) identify the performance obligations in the contract; (3) determine the transaction price; (4) allocate the transaction price to the performance obligations in the contract; and (5) recognize revenue when (or as) the Company satisfies a performance obligation. The sales of the Company’s products to its customers represent a single performance obligation for which revenue is recognized at a point in time. Based on the foregoing, no significant judgment is required to determine when control of a product has been transferred to a customer.
When another party is involved in providing goods or services to a customer, the Company must determine whether the obligation is to provide the specified good or service itself (i.e., the Company is the principal in the transaction) or to arrange for that good or service to be provided by the other party (i.e., the Company is an agent in the transaction). When the Company is responsible for satisfying a performance obligation, based on the ability to control the product or service provided, the Company is considered as a principal and revenue is recognized for the gross amount of consideration. When the other party is primarily responsible for satisfying a performance obligation, the Company is considered as an agent and revenue is recognized in the amount of any fee or commission to which the Company is entitled. The Company purchase minerals from suppliers and receive payments from the customers on selling certain goods. The Company has been determined as an agent for the ultimate customers in these transactions and the revenue is recorded net of the related fulfillment costs as commission income.
The Company measures revenue based on the consideration it expects to be entitled to receive in exchange for its products. The standard terms and conditions of customer orders and contracts does not provide its customers with the right of return (except for quality), price protection, rebates or discounts. All sales are based on firm customer orders with fixed terms and conditions, which generally cannot be modified.
See note 13 regarding the Company’s revenue disaggregated by reporting segment.
Provision for exploration asset compensation
The Government of Mongolia issued a policy that requires all mining companies to pay compensation to the Government if the exploration work on their mining license area was funded by the Government. The compensation amount for the exploration work done has been estimated by the Mineral Resources and Petroleum Authority of Mongolia.
The provision for exploration expenditure is calculated as the discounted net present value of estimated future net cash outflows of the reclamation and closure costs.
Cost of goods sold
Cost of goods sold included raw material costs.
Exploration costs
Exploration costs are expensed as incurred. Costs to identify new mineral resources and to evaluate potential resources are considered exploration costs.
Selling and distribution costs
Selling and distribution costs included transportation and handling costs related to the movement of finished goods from mines to customer designated locations, security fee, royalty and custom tax.
| 28 |
| Table of Contents |
TGS International Ltd. Notes to Consolidated Financial Statements December 31, 2019 and 2018 |
Administrative expenses
Administrative expenses include salaries and benefits, consulting, audit, tax, legal, insurance, rent and utilities, and other general operating expenses.
Shipping and Handling Costs
Shipping and handling costs are expensed as incurred.
Foreign currency transactions and translations
These consolidated financial statements are presented in United States dollars (“USD”), which is different from TGS subsidiaries’ functional currencies. The functional currency of the subsidiaries in Mongolia, Khan Shashir LLC and Shek Hung Gold LLC, is the Mongolian Tugrik (“MNT”). The functional currency of the subsidiary in the People’s Republic of China (“PRC”), Best Metro Import & Export Trading (Inner Mongolia) Limited is the Chinese Renminbi (“RMB”), while the functional currency of all other subsidiaries is the Hong Kong dollar (“HKD”).
The functional currency of TGS is the USD. The financial statements of foreign subsidiaries where HKD, MNT and RMB are the functional currencies and which have transactions denominated in non-HKD/MNT/RMB currencies are translated into HKD/MNT/RMB at the exchange rates existing on that date. The translation of local currencies into HKD/MNT/RMB creates transaction adjustments which are included in the statements of operations and comprehensive income.
The financial statements of TGS’s foreign subsidiaries, where non-USD currencies are the functional currencies, are translated into USD using exchange rates in effect at period end for assets and liabilities and average exchange rates during each reporting period for the statement of operations. Adjustments resulting from translation of these financial statements are reflected as a separate component of stockholders’ deficit.
Comprehensive loss
Comprehensive loss is defined as all changes in equity/(deficit), exclusive of transactions with stockholders, such as capital investments. Comprehensive loss includes net loss and changes in certain assets and liabilities that are reported directly in equity.
Basic and Diluted Loss per Share
The Company computes loss per share in accordance with FASB ASC 260, “Earnings per Share” which requires presentation of both basic and diluted earnings per share on the face of the statement of operations. Basic loss per share is computed by dividing net loss available to common stockholders by the weighted average number of outstanding common shares during the period. Diluted loss per share gives effect to all dilutive potential common stock equivalents outstanding during the period. Dilutive loss per share excludes all common stock equivalents if their effect is anti-dilutive.
As of December 31, 2019, the Company had warrants and convertible bonds outstanding which could potentially dilute basic loss per share in the future, but were excluded from the computation of diluted net loss per share, as their effect would have been anti-dilutive due to the net losses.
Fair value measurement
The Company complies with FASB ASC 820, “Fair Value Measurements”, which clarifies the definition of fair value, prescribes methods for measuring fair value and establishes a fair value hierarchy to classify the inputs used in measuring fair value.
Fair value is estimated by applying the following hierarchy, which prioritizes the inputs used to measure fair value into three levels and bases the categorization within the hierarchy upon the lowest level of input that is available and significant to the fair value measurement:-
Level 1 — Quoted prices in active markets for identical assets or liabilities.
Level 2 — Observable inputs other than quoted prices in active markets for identical assets and liabilities, quoted prices for identical or similar assets or liabilities in inactive markets, or other inputs that are observable or can be applied either (i) retrospectivelycorroborated by observable market data for substantially the full term of the assets or liabilities.
Level 3 — Inputs that are generally unobservable and typically reflect management’s estimate of assumptions that market participants would use in pricing the asset or liability.
Financial instruments are measured as follows:-
The carrying amounts of cash and cash equivalents, accounts receivable, other receivables, deposits, accounts payable, accrued charges, other payables, loans from related persons, convertible bonds, other loan, amount due to each prior reporting period presenteddirectors and amounts due to stockholders, approximate their fair values due to the short term nature of these instruments.
| 29 |
| Table of Contents |
TGS International Ltd. Notes to Consolidated Financial Statements December 31, 2019 and 2018 |
Conversion Option – Convertible bonds
The Company accounts for convertible bond in accordance with the guidelines established by ASC 470-20, Debt with Conversion and Other Options. The Company separates the convertible bond into liability and equity components. The Beneficial Conversion Feature ("BCF") of a convertible bond, which is the equity component and recorded as additional paid-in capital, is normally characterized as the convertible portion or feature of certain bonds payable that provide a rate of conversion that is below market value or in-the-money when issued. The Company records a BCF related to the issuance of a convertible bond when issued.
To determine the effective conversion price, the Company first allocates the proceeds received to the convertible instrument, and then uses those allocated proceeds to determine the effective conversion price. The intrinsic value of the conversion option should be measured using the effective conversion price for the convertible instrument on the proceeds allocated to that instrument.
The accounting for a BCF requires that the BCF be recognized by allocating the intrinsic value of the conversion option to electadditional paid in capital, resulting in a discount to the convertible instrument. This discount should be accreted from the date on which the BCF is first recognized through the earliest conversion date for instruments that do not have a stated redemption date.
The discount is amortized to interest expense over the expected term of the convertible bonds using the effective interest method.
Warrants
ASC 815-40, “Contracts in Entity’s Own Equity”, requires freestanding contracts that are settled in a company’s own stock, including common stock warrants, to be designated as an equity instrument, asset or a liability. Under the provisions of ASC 815-40, a contract designated as an asset or a liability must be carried at fair value on a company’s balance sheet, with any changes in fair value recorded in the Company’s results of operations. A contract designated as an equity instrument must be included within equity, and no fair value adjustments are required from period to period.
Lease
The Company determines if an arrangement is a lease at inception of the contract. Leases are recorded in "Right-of-use ("ROU") assets" and "lease liabilities" in the Company's consolidated balance sheets.
ROU assets represent the Company’s right to use an underlying asset during the lease term and lease liabilities represent the Company’s obligation to make lease payments arising from the lease. ROU assets and lease liabilities are recognized at commencement date based on the present value of lease payments over the lease term. For leases in which the rate implicit in the lease is not readily determinable, the Company uses its incremental borrowing rate based on the information available at commencement date for determining the present value of lease payments. Lease term includes the effects of options to extend or terminate the lease when it is reasonably certain practical expedients; or (ii) retrospectively withthat the cumulative effectCompany will exercise that option. Lease expense for operating lease arrangements is recognized aton a straight-line basis over the lease term.
On January 1, 2019, the date of initial application, and providing certain additional disclosures (the “cumulative effect approach”). Topic 606 is effective for annual periods, and interim periods withinthe Company adopted, “Leases” (Topic 842), using the modified retrospective method. The modified retrospective method provides a method of recognizing those annual periods, beginning after December 15, 2017,leases which will behad not expired as of the Corporation’s fiscal year beginning March 1, 2018 (fiscal 2019). The Corporation does not expect thedate of adoption of thisJanuary 1, 2019. The prior period consolidated financial statements have not been retrospectively adjusted and continues to be reported under Topic 840.
The Company elected the practical expedient permitted under the transition guidance will haveunder Topic 842, which amongst other matters, allowed the Company (i) not to apply the recognition requirements to short-term leases (leases with a materiallease term of 12 months or less), (ii) not to reassess whether any expired or existing contracts are or contain leases, (iii) not to reassess the lease classification for any expired or existing leases, and (iv) not to reassess initial direct costs for any existing leases.
The adoption resulted in the recognition of ROU assets of $369,874 and lease liabilities of $369,874 for operating leases as of January 1, 2019. The adoption had no impact on itsopening balance of accumulated deficit. Refer to note 5 to the consolidated financial statements.statements for details.
The Company reviews ROU assets for impairment whenever events or changes in circumstances indicate that the related carrying amount may not be recoverable.
Recent changes in accounting standards
Pending Adoption as at year end
In June 2016, the FASB issued ASU No. 2016-13, Financial“Financial Instruments –- Credit Losses (Topic 326): Measurement of Credit Losses on Financial Instruments. ThisInstruments”. In November 2018, FASB issued ASU No. 2018-19, “Codification Improvements to Topic 326, Financial Instruments-Credit Losses”, which amends guidance on reporting credit losses for assets heldthe scope and transition requirements of ASU 2016-13. Topic 326 requires a financial asset (or a group of financial assets) measured at amortized cost basis to be presented at the net amount expected to be collected. The measurement of expected credit losses is based on relevant information about past events, including historical experience, current conditions and availablereasonable and supportable forecasts that affect the collectability of the reported amount. Topic 326 will originally become effective for sale debt securities.the Company beginning January 1, 2020, with early adoption permitted, on a modified retrospective approach. As a smaller reporting company, the effective date for the Company has been delayed until fiscal years beginning after December 15, 2022, in accordance with ASU 2019-10, although early adoption is still permitted. This standard is not expected to have a material impact to the Company’s consolidated financial statements after evaluation.
| 30 |
| Table of Contents |
TGS International Ltd. Notes to Consolidated Financial Statements December 31, 2019 and 2018 |
Recent changes in accounting standards (continued)
Pending Adoption as at year end (continued)
In August 2018, the FASB issued ASU No. 2018-13, Fair Value Measurement (Topic 820): Disclosure Framework-Changes to the Disclosure Requirements for Fair Value Measurement. The objective of ASU 2018-13 is to improve the effectiveness of disclosures in the notes to the financial statements by removing, modifying, and adding certain fair value disclosure requirements to facilitate clear communication of the information required by generally accepted accounting principles. The amendments are effective for all entities for fiscal years, and interim periods within those fiscal years, beginning after December 15, 2019 with early adoption permitted upon issuance of this ASU. This standard is not expected to have a material impact to the Company’s consolidated financial statements after evaluation.
In October 2018, the FASB issued ASU 2018-17, Consolidation (Topic 810): Targeted Improvements to Related Party Guidance for Variable Interest Entities. This Update states a private company (reporting entity) may elect not to apply VIE guidance to legal entities under common control (including common control leasing arrangements) if both the parent and the legal entity being evaluated for consolidation are not public business entities. This Update also states indirect interests held through related parties in common control arrangements should be considered on a proportional basis for determining whether fees paid to decision makers and service providers are variable interests. This is consistent with how indirect interests held through related parties under common control are considered for determining whether a reporting entity must consolidate a VIE. For the Company, this Update is effective for fiscal years beginning after December 15, 2019, (fiscal 2021), includingand interim periods within those fiscal years,years. All entities are required to apply the amendments in this Update retrospectively with earlya cumulative-effect adjustment to retained earnings at the beginning of the earliest period presented. Early adoption is permitted. The Corporation does not expect the adoption of this guidance willASU 2018-17 is not expected to have a material impact on itsthe consolidated financial statements.statements of the Company.
In August 2016,December 2019, the FinancialFASB issued ASU 2019-12, Income Taxes (Topic 740): Simplifying the Accounting Standards Board (“FASB) issued Accounting Standards Update (“ASU”) 2016-15, Statementfor Income Taxes. The amendments in this ASU simplify the accounting for income taxes, eliminates certain exceptions to the general principles in Topic 740 and clarifies certain aspects of Cash Flows (Topic 230): Classification of Certain Cash Receipts and Cash Payments. Thisthe current guidance to improve consistent application among reporting entities. ASU addresses the classification of certain specific cash flow issues including debt prepayment or extinguishment costs, settlement of certain debt instruments, contingent consideration payments made after a business combination, proceeds from the settlement of certain insurance claims and distributions received from equity method investees. This ASU2019-12 is effective for fiscal years beginning after December 15, 2017 (fiscal 2019),2021 and interim periods within those fiscal years, withannual periods beginning after December 15, 2022, though early adoption permitted. An entity that elects earlyis permitted, including adoption must adopt all of the amendments in the same period. The Corporation doesany interim period for which financial statements have not expect the adoption of this guidance willyet been issued. This standard is not expected to have a material impact onto the Company’s consolidated financial statements after evaluation.
The Company has implemented all new accounting pronouncements that are in effect and that could impact its consolidated financial statements.
|
NOTE 2 – SUMMARY OF SIGNIFICANT ACCOUNTING POLICIES (CONT.)
Other recentstatements and does not believe that there are any other new accounting pronouncements that have been issued, by the FASB (including its Emerging Issues Task Force) and the SEC did not orbut are not believed toyet effective, that might have a material impact on the Corporation’s present or future consolidated financial statements.statements of the Company.
NOTE 3 – BUSINESS ACQUISITIONPROPERTY, PLANT AND EQUIPMENT
On December 21, 2016,Property, plant and equipment include the Corporation acquired allfollowing:-
|
| December 31, 2019 |
|
| December 31, 2018 |
| ||
|
|
|
|
|
|
| ||
Buildings |
| $ | 159,364 |
|
| $ | 164,223 |
|
Leasehold improvements |
|
| 120,524 |
|
|
| 119,887 |
|
Furniture, fixture and equipment |
|
| 66,582 |
|
|
| 176,883 |
|
Motor vehicles |
|
| 338,320 |
|
|
| 245,217 |
|
Factory equipment |
|
| 230,290 |
|
|
| 23,936 |
|
Mineral properties |
|
| 1,375,608 |
|
|
| 1,276,766 |
|
|
|
|
|
|
|
|
|
|
Less: accumulated depreciation |
|
| (522,609 | ) |
|
| (481,672 | ) |
|
|
| 1,768,079 |
|
|
| 1,525,240 |
|
Construction in progress |
|
| 638,289 |
|
|
| 32,382 |
|
Total property, plant and equipment |
| $ | 2,406,368 |
|
| $ | 1,557,622 |
|
Construction in progress is mainly related to a power station under construction and stall cables to be used during the construction of the issuedshaft at the mine sites. During the years ended December 31, 2019 and outstanding shares2018, depreciation expenses charged to the consolidated statements of TGS Alberta from related parties for cashoperations amounted to $51,898 ($23,000 to administrative expenses and $28,898 to depreciation of $154. This acquisition enables the Corporationfactory equipment) and $52,149 ($23,947 to operate in the Canadian market.administrative expenses and $28,202 to depreciation of factory equipment), respectively.
| ||
| 31 |
| |
| ||
|
TGS International Ltd. Notes to Consolidated Financial Statements December 31, 2019 and 2018 |
NOTE 4 – INTANGIBLE ASSETS
Intangible assets consist of acquired mining rights.
As of December 31, 2019 and 2018, the Company owned three mining rights in Mongolia.
Cost |
|
|
| |
At December 31, 2019 and 2018 |
| $ | 1,097,362 |
|
|
|
|
|
|
Accumulated amortization and impairment loss |
|
|
|
|
At December 31, 2019 and 2018 |
|
| - |
|
|
|
|
|
|
Net book value |
|
|
|
|
At December 31, 2019 |
| $ | 1,097,362 |
|
|
|
|
|
|
At December 31, 2018 |
| $ | 1,097,362 |
|
As of December 31, 2019, future minimum amortization expenses in respect of intangible assets are as follows:
Year ending December 31,
2020 |
| $ | - |
|
2021 |
|
| 85,330 |
|
2022 |
|
| 85,632 |
|
2023 |
|
| 91,474 |
|
2024 |
|
| 97,377 |
|
Thereafter |
|
| 737,549 |
|
|
| $ | 1,097,362 |
|
NOTE 5 – LEASING ARRANGEMENT
The Company leases certain office and warehouse spaces under operating leases in Hong Kong and Mongolia. Operating lease assets and obligations are reflected within right-of-use asset, and current lease liability respectively, on the Consolidated Balance Sheet.
The discount rate implicit within the leases is generally not determinable and therefore the Company determines the discount rate based on its incremental borrowing rate. The incremental borrowing rate for the leases is determined based on lease term and currency in which lease payments are made, adjusted for impacts of collateral. The weighted average discount rate used to measure the operating lease liabilities as of December 31, 2019 was 11%.
Balance Sheet as of December 31, 2019
Assets |
|
|
| |
Right-of-use assets |
| $ | 189,456 |
|
|
|
|
|
|
Liabilities |
|
|
|
|
Current portion of operating lease liabilities |
| $ | 189,456 |
|
|
|
|
|
|
Total lease liabilities |
| $ | 189,456 |
|
| |
|
TGS International Ltd. Notes to Consolidated Financial Statements December 31, 2019 and 2018 |
NOTE 5 – LEASING ARRANGEMENT (CONTINUED)
Maturity Analysis of Lease Liabilities:
December 31, 2020 |
| $ | 217,033 |
|
December 31, 2021 |
|
| 4,106 |
|
Total lease payments, undiscounted |
|
| 221,139 |
|
Less short-term lease payments |
|
| (20,564 | ) |
Less amount of lease payment representing interest |
|
| (11,119 | ) |
Total present value of lease payments |
|
| 189,456 |
|
Less: Current portion of operating leases liabilities |
|
| (189,456 | ) |
Non-current operating leases liabilities |
| $ | - |
|
Lease costs for all operating leases classified under Topic 842 for the year ended December 31, 2019 was $206,643.
Lease cost for all operating leases classified under Topic 840 for the year ended December 31, 2018 was $225,126.
Supplemental cash flow and other information related to leases is as follows:
|
| December 31, 2019 |
| |
Total lease liabilities |
| $ | 189,456 |
|
Cash payment for amounts included in the measurement of lease liabilities within operating cash flows |
| $ | 206,643 |
|
Weighted average remaining lease term (years) |
|
| 0.97 |
|
Weighted average discount rate |
|
| 11 | % |
NOTE 6 – INCOME TAXES
The Company is subject to tax on an entity basis on income arising in or derived from the United States of America, Republic of Seychelles, Mongolia, PRC and Hong Kong.
United States Tax
The federal income tax rate in the United States is 21%. The Company is subject to income taxes in the United States of America for each of the years ended December 31, 2019 and 2018.
Seychelles Tax
The statutory tax rate in the Republic of Seychelles is 25% on the first 1 million Seychelles Rupee of taxable income and 33% on the remainder. The Company is subject to income taxes in the Republic of Seychelles for each of the years ended December 31, 2019 and 2018.
Hong Kong Tax
BMHK, AHK and CAHK are subject to Hong Kong profits tax at the rate of 16.5% on the assessable profits. No provision for Hong Kong profits tax has been made as these companies incurred a loss for each of the years ended December 31, 2019 and 2018.
Mongolia Corporate Income Tax
KSS and SHG are registered and operate in Mongolia and are subject to Mongolia Corporate Income Tax at the rate of 10% on taxable income below MNT3 billion, or MNT300 million plus 25% on taxable income exceeding MNT3 billion. No provision for Mongolia corporate income tax has been made as these companies incurred a loss for each of the years ended December 31, 2019 and 2018.
PRC Enterprise Income Tax
BMIM is subject to PRC Enterprise Income Tax at the statutory rate of 25%. No provision for PRC Enterprise Income Tax has been made as this company incurred a loss for each of the years ended December 31, 2019 and 2018.
The Company’s deferred tax assets and liabilities as of December 31, 2019 and 2018 are attributable to the following:
|
| As of |
| |||||
|
| December 31, 2019 |
|
| December 31, 2018 |
| ||
|
|
|
|
|
|
| ||
Tax loss carry forwards |
| $ | 301,091 |
|
| $ | 287,735 |
|
Less: Valuation allowance |
|
| (301,091 | ) |
|
| (287,735 | ) |
|
| $ | - |
|
| $ | - |
|
|
| Table of Contents |
TGS International Ltd. Notes to Consolidated Financial Statements December 31, 2019 and 2018 |
NOTE 6 – INCOME TAXES (CONTINUED)
Changes in valuation allowance are as follows:
|
| As of |
| |||||
|
| December 31, 2019 |
|
| December 31, 2018 |
| ||
|
|
|
|
|
|
| ||
Beginning balance |
| $ | 287,735 |
|
| $ | 212,789 |
|
Increase in valuation allowance |
|
| 13,011 |
|
|
| 66,756 |
|
Exchange difference |
|
| 345 |
|
|
| 8,190 |
|
Ending balance |
| $ | 301,091 |
|
| $ | 287,735 |
|
As of December 31, 2019 and 2018, the Hong Kong subsidiaries have tax losses arising in Hong Kong of approximately $1,602,522 (2018: $1,592,556) that are available indefinitely for offsetting against its future taxable profits. The PRC subsidiary has tax losses arising in PRC of approximately $146,700 (2018: $99,851) that are available for offsetting against its future taxable profits, which expire between 2022-2024 and between 2022-2023, respectively. The Company had total accumulated tax losses amounting to approximately $1,749,222 and $1,692,407 (the tax effect thereon being approximately $301,091 and $287,735), respectively, subject to the final agreement by the relevant tax authorities, which may be carried forward and applied to reduce future taxable income which is earned in or derived from the jurisdictions in which the tax losses were incurred. Realization of deferred tax assets associated with tax losses carry forwards is dependent upon generating sufficient taxable income prior to their expiration. A full valuation allowance is established against such tax losses at each balance sheet date since management believes it is more likely than not that such tax losses will not be utilized.
A reconciliation of the income tax expense to the amount computed by applying the statutory tax rate of 21% to the loss before income taxes in the consolidated statements of comprehensive income is as follows:-
|
| December 31, 2019 |
|
| December 31, 2018 |
| ||
|
|
|
|
|
|
| ||
Loss before income taxes |
| $ | (2,115,716 | ) |
| $ | (1,241,452 | ) |
|
|
|
|
|
|
|
|
|
Tax loss at the statutory tax rate of 21% |
|
| (444,300 | ) |
|
| (260,705 | ) |
Effect of different tax rates in other jurisdictions |
|
| (12,910 | ) |
|
| (9,921 | ) |
Non-deductible items |
|
| 488,717 |
|
|
| 203,873 |
|
Non-taxable items |
|
| (44,518 | ) |
|
| (3 | ) |
Change in valuation allowance |
|
| 13,011 |
|
|
| 66,756 |
|
|
|
|
|
|
|
|
|
|
Income tax expense |
| $ | - |
|
| $ | - |
|
NOTE 7 – OTHER PAYABLES
|
| As of |
| |||||
|
| December 31, 2019 |
|
| December 31, 2018 |
| ||
|
|
|
|
|
|
| ||
Tax and social insurance payable |
| $ | 53,087 |
|
| $ | 9,384 |
|
Contract liabilities |
|
| 289,786 |
|
|
| 215,359 |
|
Temporary receipts |
|
| 720,278 |
|
|
| - |
|
Other payables |
|
| 241,204 |
|
|
| 12,424 |
|
|
| $ | 1,304,355 |
|
| $ | 237,167 |
|
Contract liabilities are consideration received from the customers or billed in advance of providing goods or services promised in the future. The Company defers recognizing this consideration as revenue until it has satisfied the related performance obligation to the customer.
Temporary receipts represented the fund received from Yantai Fulin Mining Machinery Co., Ltd, a strategic partner of the Company, to build a refinery factory in Mongolia.
| 34 | |
| |
|
TGS International Ltd. Notes to Consolidated Financial Statements December 31, 2019 and 2018 |
NOTE 8 – CONVERTIBLE BONDS
As of December 31, 2019 and 2018, the Company had the following convertible bond outstanding:
|
| As of |
| |||||||||||||
|
| December 31, 2019 |
|
| December 31, 2018 |
| ||||||||||
|
|
|
|
|
|
| ||||||||||
|
| Principal |
|
| Accrued Interest |
|
| Principal |
|
| Accrued Interest |
| ||||
November 2019 HK$1.5 million (equivalent to $192,308) convertible into common shares at $3.60 per share, 5% interest, due May 25, 2020 |
| $ | 192,308 |
|
| $ | 930 |
|
| $ | - |
|
| $ | - |
|
Less: Bond discount |
|
| (4,313 | ) |
|
| - |
|
|
| - |
|
|
| - |
|
|
| $ | 187,995 |
|
| $ | 930 |
|
| $ | - |
|
| $ | - |
|
In the year of 2019, four convertible bond agreements were entered into between the Company, Arcus and third party investors. Three of the bonds matured in 2019 and were settled by issuing 141,782 common shares at a price stated in the respective agreements, representing loans of HK$4 million and interest expenses of HK$8,333, for a total of HK$4,008,333 (equivalent to $513,888) (see note 12). In addition, the Company recognized a beneficial conversion feature discount to the bond of $10,705 that is being amortized over the life of the convertible bond using the effective interest method. For the year ended December 31, 2019, the Company amortized $10,705 of the discount and recognized non-cash interest of $1,068 to interest expenses.
On November 26, 2019, a convertible bond agreement was signed including a HK$1.5 million (equivalent to $192,308) loan bearing interest of 5% per annum for six months. The convertible bond will mature on May 25, 2020 with a conversion price of $3.60 per share. In addition, the Company recognized a beneficial conversion feature discount to the bond of $5,342 that is being amortized over a six-month period using the effective interest method. For the year ended December 31, 2019, the Company amortized $1,029 of the discount and recognized non-cash interest of $930 to interest expenses. The unamortized debt discount on the convertible bond as of December 31, 2019 was $4,313.
NOTE 9 – OTHER LOAN
As of December 31, 2019, a loan of $132,423 was borrowed from an unrelated party. The loan is unsecured, has no collateral or guarantee and carries interest at 11.61% per annum and repayable on December 31, 2029.
NOTE 10 – PROVISION FOR ASSET RETIREMENT OBLIGATIONS
The Company’s asset retirement obligations relate to future remediation and decommissioning activities at the three fluorite mines.
At December 31, 2017 |
| $ | 30,696 |
|
Additions |
|
| 3,408 |
|
Exchange adjustments |
|
| (2,721 | ) |
|
|
|
|
|
At December 31, 2018 |
|
| 31,383 |
|
Additions |
|
| 6,081 |
|
Exchange adjustments |
|
| (4,021 | ) |
|
|
|
|
|
At December 31, 2019 |
| $ | 33,443 |
|
NOTE 11 – PROVISION FOR EXPLORATION ASSET COMPENSATION
At December 31, 2017 |
| $ | 111,239 |
|
Exchange adjustments |
|
| (9,112 | ) |
|
|
|
|
|
At December 31, 2018 |
|
| 102,127 |
|
Exchange adjustments |
|
| (3,385 | ) |
|
|
|
|
|
At December 31, 2019 |
| $ | 98,742 |
|
| 35 | |
| |
|
TGS International Ltd. Notes to Consolidated Financial Statements December 31, 2019 and 2018 |
NOTE 12 – CAPITAL STOCK
On September 14, 2018, the Company and Arcus entered into a Share Exchange Agreement, dated September 14, 2018 with the Selling Stockholders, pursuant to which the Selling Stockholders agreed to sell all of their ordinary shares of Arcus to the Company in exchange for an aggregate of 7,000,000 shares of common stock of the Company. The merger closed on September 14, 2018 and resulted in the following:
Immediately prior to the Share Exchange, 6,500,000 shares of the outstanding common stock were cancelled and retired. A further 30,000 shares were cancelled after the Share Exchange.
On November 21, 2018, the Company completed the first subscription package (the “First Subscription Package”) of 150,000 common shares at a price of $0.35 per share with a warrants option to purchase an aggregate of 50,000 common shares. The warrants will be exercisable within three years from the date of the Company receiving fund from investors at an exercise price of $1.00 per common share. The Company also issued to the placement agent 15,000 common shares at a price of $2.49 per common share for the services rendered (equivalent to $37,350).
As a result of the Share Exchange and the First Subscription Package, the cancellation of 6,530,000 shares and the issuance of 7,165,000 shares, the Company had 14,165,000 shares of common stock issued and outstanding as of December 31, 2018.
For the year ended December 31, 2019, the Company issued a second subscription package (the “Second Subscription Package”) of up to $825,000, consisting of 330,000 common shares and 66,000 warrants exercisable at $3.00 to purchase common stock within three years from the respective issuance dates, to accredited investors. The Company also issued to the placement agent 33,000 common shares at a price of $3.70 per common share for the services rendered (equivalent to $122,100).
On May 15, 2019, the Company issued 88,018 common shares at a price of $3.29 per share to settle the loans from related persons of HK$2 million and accrued interest expenses of HK$258,709, for a total of HK$2,258,709 (equivalent to $289,578).
On August 30, 2019, a convertible bond agreement was entered into between the Company, Arcus and a third party investor. On September 29, 2019, the convertible bond matured and was settled by issuing 34,722 common shares at a price of $3.70 per share representing loans of HK$1 million and interest expenses of HK$2,083, for a total of HK$1,002,083 (equivalent to $128,472).
On September 29, 2019, the Company issued 33,096 common shares at a price of $3.66 per share to settle the amount due to a director of HK$944,832 (equivalent to $121,133).
On October 25, 2019, a convertible bond agreement was entered into between the Company, Arcus and a third party investor. On November 27, 2019, the convertible bond matured and was settled by issuing 71,373 common shares at a price of $3.60 per share representing loans of HK$2 million and interest expenses of HK$4,167, for a total of HK$2,004,167 (equivalent to $256,944).
On November 4, 2019, a convertible bond agreement was entered into between the Company, Arcus and a third party investor. On December 3, 2019, the convertible bond matured and was settled by issuing 35,687 common shares at a price of $3.60 per share representing loans of HK$1 million and interest expenses of HK$2,083, for a total of HK$1,002,083 (equivalent to $128,472).
NOTE 13 – REVENUE
|
| December 31, 2019 |
|
| December 31, 2018 |
| ||
Disaggregation of revenue:- |
|
|
|
|
|
| ||
Revenue from contract with customers within the scope of ASC 606, types of goods and services |
|
|
|
|
|
| ||
Sales of minerals – point in time |
| $ | 282,857 |
|
| $ | 274,238 |
|
Commission income – point in time |
|
| - |
|
|
| 393,566 |
|
|
|
|
|
|
|
|
|
|
|
| $ | 282,857 |
|
| $ | 667,804 |
|
| |||
| |||
| Table of Contents |
Notes to Consolidated Financial Statements December 31, 2019 and |
NOTE 14 – SIGNIFICANT TRANSACTIONS WITH RELATED PARTIES
Trade and other payables
Foreign exchange
| (a) | Loans from related persons |
The acquisition constitutes a business combinationAs of December 31, 2019 and is accounted for in accordance with Accounting Standards Codification 805 – Business Combinations.
The acquisition date fair valueDecember 31, 2018, loans from related persons included HK$3 million (equivalent to $385,158) and HK$4 million (equivalent to $510,830) respectively borrowed from the wife of consideration transferred in the transaction was $3,145 which approximates the fair valueone of the net assets received. All costs associated withCompany’s stockholders on May 21, 2018. The loan is unsecured, has no collateral or guarantee and carries interest at a monthly rate of 3.08% for the transaction were expensed as incurred.
NOTE 4 – DUE TO RELATED PARTIESfirst month and a monthly rate of 1.08% for the rest of the term. The loan originally was due to be repaid on May 20, 2019, however, on April 24, 2019, the repayment date was extended to May 20, 2020. The Company repaid HK$1 million (equivalent to $127,648) loan on April 24, 2019.
As of December 31, 2018, loans from related persons included a HK$1 million (equivalent to $127,708) loan borrowed from the son of the CFO of TGS on October 6, 2016. The loan is unsecured, has no collateral or guarantee and carries interest at February 28, 2018, the Corporation8% per annum. The loan was obligated to shareholders for funds advanced to the Corporation for working capital, in the amountfully repaid by issuing common stock of $54,690 (February 28, 2017 - $Nil)TGS on May 15, 2019 (see note 12). The advances are unsecured and no interest rate or payback schedule has been established.
|
NOTE 5 – COMMON STOCK
(i) Stock issued
On December 1, 2016, the date of inception, the Corporation received $723 to issue 9,500,000 common stocks.
On January 28, 2017, the Corporation closed a private placement to issue 4,030,000 common stocks for a gross proceed of $30,733.
(ii) Weighted average stock outstanding
As of December 31, 2018, loans from related persons included HK$1 million (equivalent to$127,708) loans borrowed from the sisters of one of the stockholders of TGS on October 31, 2016. The loans are unsecured, have no collateral or guarantee and carry interest at February 28,8% per annum. The loans were fully repaid by issuing common stock of TGS on May 15, 2019 (see note 12).
(b) | Interest expense paid to related persons |
During the years ended December 31, 2019 and 2018, weighted average numberinterest expense of HK$462,326 (equivalent to $59,015) and HK$581,264 (equivalent to $74,162), respectively, was paid to related persons.
(c) | Amounts due to stockholders |
On August 15, 2018, Arcus allotted and issued 884,871 ordinary shares of Arcus (equivalent to 6,999,209 shares of the Company; each share of Arcus was exchanged for 7.91 shares of the Company’s common stocksstock) at $10 each to repay the debts to Mr. Loo Chi Kin with total amount, HK$69,410,892 (equivalent to $8,848,710), within the group.
As of December 31, 2019 and 2018, amounts due to stockholders, Chi Kin Loo, Kwong Bun Mak, Xianqin Pan and Tak Leung Ho, included $872,968 and $398,208 at December 31, 2019 and December 31, 2018 respectively. The Company is currently in the exploration stage, and the stockholders advanced $517,329 working capital to meet the financing requirement for the loss per common stock calculation is 13,530,000 (2017 – 13,065,000).year of 2019. Amounts due to stockholders are unsecured, interest-free and there are no fixed terms for repayment. The stockholders have agreed not to demand for repayment within the next 12 months from the balance sheet date.
NOTE 6 – INCOME TAXES
(d) | Amount due to directors |
Potential benefitsAs of income tax losses have not been recognized in these consolidated financial statements because the Corporation cannot be assured itDecember 31, 2019 and 2018, amount due to a director, Tak Shing Eddie Wong, of HK$576,000 (equivalent to $73,950) and HK$576,000 (equivalent to $73,560) respectively. The amount is more likely-than-not it will utilize the net operating losses carried forward in future years.
Income tax recovery differs from that which would be expected by applying the effective rates to net loss as follows:
For the year ended February 28, 2018 For the period ended February 28, 2017 $ $ Net loss for the year / period (80,992 ) (14,327 ) Statutory and effective rates 34 % 34 % Income tax recovery at effective rate (27,537 ) (1,871 ) Income tax expense on Canadian income - (14 ) Difference in foreign tax rate 12,244 (5 ) Change in valuation allowance (15,293 ) 4,980 Corporate income tax recovery recognized in the accounts - -
During the year, the Corporationdirector, Sai Kit Leung advanced HK$1,295,687 (equivalent to $165,392) to the Company. On September 29, 2019, the Company issued 33,096 common shares at a price of $3.66 to settle the amount due to the director of HK$944,832 (equivalent to $121,133) (see note 12). As of December 31, 2019, there is an amount due to a director of HK$350,855 (equivalent to $45,045). This amount is unsecured, interest-free and there are no fixed terms for repayment. The director has $541 of loss carry forwards in Canada that beginagreed not to expire in 2038. The Corporation has $92,795 of loss carry forwards in the United States that begin to expire in 2037. The componentsdemand for repayment within 12 months of the net deferred tax asset are below:balance sheet date.
February 28, 2018 February 28, 2017 $ $ Non-capital losses carried forward Deferred tax asset value Valuation allowance Deferred tax assets recognized 95,374 14,382 15,293 4,980 (15,293 ) (4,980 ) - -
Loss per common share is presented under two formats: basic loss per common share and diluted loss per common share. Basic loss per common share is computed by dividing net loss attributable to common stockholders by the weighted average number of common shares outstanding during the period. Diluted loss per common share is computed by dividing net loss by the weighted average number of common shares outstanding during the period, plus the potentially dilutive impact of common stock equivalents (e.g. stock options, warrants and convertible bonds). Dilutive common stock equivalents consist of the incremental common stock issuable upon exercise of stock options and warrants. The following table sets forth the computation of basic and diluted net loss per share:
|
| Years Ended |
| |||||
|
| December 31, 2019 |
|
| December 31, 2018 |
| ||
Numerator: |
|
|
|
|
|
| ||
Net loss |
| $ | (2,115,716 | ) |
| $ | (1,241,452 | ) |
|
|
|
|
|
|
|
|
|
Denominator: |
|
|
|
|
|
|
|
|
Weighted-average common stock, basic |
|
| 14,532,189 |
|
|
| 4,736,382 |
|
Dilutive effect of warrants |
|
| – |
|
|
| – |
|
Dilutive effect of convertible bonds |
|
| – |
|
|
| – |
|
Incremental dilutive shares |
|
| – |
|
|
| – |
|
Weighted-average common stock, diluted |
|
| 14,532,189 |
|
|
| 4,736,382 |
|
Net loss per share, basic and diluted |
| $ | (0.15 | ) |
| $ | (0.26 | ) |
| Table of Contents |
TGS International Ltd. Notes to Consolidated Financial Statements December 31, 2019 and 2018 |
NOTE 16 — WARRANT EQUITY
On November 21, 2018 (“Issuance Date”), the Company issued First Subscription Package of up to $52,500, consisting of 150,000 common shares and 50,000 warrants exercisable at $1.00 (the “Warrants”) to purchase common stock within three years from the Issuance Date, to accredited subscribers.
For the year ended December 31, 2019, the Company issued Second Subscription Package of up to $825,000, consisting of 330,000 common shares and 66,000 warrants exercisable at $3.00 to purchase common stock within three years from the respective issuance dates, to accredited subscribers.
The two investors in the First Subscription Package, which was completed on November 21, 2018, forfeited their rights to exercise the 25,000 warrant at $1.00 of their own accord.
The Company determined that these warrants are free standing financial instruments that are legally detachable and separately exercisable from the common stock included in the subscriptions. All of the Company’s outstanding warrants are considered to be indexed to the Company’s own stock and are therefore classified as equity under ASC 480. The warrants, in specified situations, provide for certain compensation remedies to a holder if the Company fails to timely deliver the shares underlying the warrants in accordance with the warrant terms.
As of December 31, 2019, the Company reviewed the valuation technique and inputs used to determine the fair value of the outstanding warrants. The Company engaged an outside valuation company to calculate the fair value of warrants based on the Binominal Option Pricing Model (“Binomial”).
Set out below are the major parameters adopted in the valuation:
Grant date |
| January 2019 |
|
| February 2019 |
|
| March 2019 |
|
| April 2019 |
| ||||
Stock price of the issuer at respective grant dates |
| $ | 3.50 |
|
| $ | 3.50 |
|
| $ | 3.50 |
|
| $ | 3.50 |
|
Risk-free rate |
|
| 14.01 | % |
|
| 14.01 | % |
|
| 13.99 | % |
|
| 14.27 | % |
Volatility |
|
| 56.74 | % |
|
| 56.74 | % |
|
| 55.80 | % |
|
| 54.63 | % |
Dividend yield |
|
| 0.00 | % |
|
| 0.00 | % |
|
| 0.00 | % |
|
| 0.00 | % |
The warrants outstanding and fair values at each of the respective valuation dates are summarized below:
Grant date |
| Warrants Outstanding |
|
| Fair Value per Share |
|
| Fair Value $ |
| |||
2018 |
|
| 50,000 |
|
| $ | 0.07 |
|
| $ | 3,490 |
|
2019 |
|
| 66,000 |
|
|
| 2.11 |
|
|
| 139,115 |
|
Less: warrants forfeited |
|
| (50,000 | ) |
|
| (0.07 | ) |
|
| (3,490 | ) |
As at December 31, 2019 |
|
| 66,000 |
|
|
|
|
|
| $ | 139,115 |
|
NOTE 17 – SUBSEQUENT EVENTS
Subsequent to the year ended December 31, 2019, there were four convertible bond agreements entered into between the Company, Arcus and third party investors.
On January 2, 2020, a convertible bond agreement was signed including a HK$1.5 million (equivalent to $192,308) loan bearing interest of 2.5% per annum for one month. The convertible bond matured and converted into 53,236 shares of the Company’s common stock on February 1, 2020 with a conversion price of $3.62 per share.
On January 14, 2020, a convertible bond agreement was signed including a HK$400,000 (equivalent to $51,282) loan bearing interest of 2.5% per annum for one month. The convertible bond matured and converted into 14,196 shares of the Company’s common stock on February 13, 2020 with a conversion price of $3.62 per share.
On February 24, 2020, a convertible bond agreement was signed including a HK$200,000 (equivalent to $25,641) loan bearing interest of 2.5% per annum for one month. The convertible bond will mature on March 25, 2020 with a conversion price of $3.62 per share.
On February 29, 2020, a convertible bond agreement was signed including a HK$500,000 (equivalent to $64,103) loan bearing interest of 2.5% per annum for one month. The convertible bond will mature on March 30, 2020 with a conversion price of $3.62 per share.
NOTE 18 – COMPARATIVE AMOUNTS
Certain comparative figures have been reclassified to conform with the current year's presentation and disclosures.
| 38 |
| Table of Contents |
Item 9. Changes in and Disagreements with Accountants on Accounting and Financial Disclosure
There were no disagreements related to accounting principles or practices, financial statement disclosure, internal controls or auditing scope or procedure during the two fiscal years and interim periods.None.
Item 9A. Controls and Procedures
(a) Evaluation of Disclosure Controls and Procedures
As required by Rule 13a-15 underUnder the Exchange Act, our management evaluated the effectiveness of the designsupervision and operation of our disclosure controls and procedures as of February 28, 2018.
Our management, with the participation of our president (our principal executive officer, principal accounting officermanagement, including our Chief Executive Officer and principal financial officer), evaluatedour Chief Financial Officer, we carried out an evaluation of the effectiveness of our disclosure controls and procedures (as such term is defined in SEC Rules 13a-15(e) and 15d-15(e) promulgated under the Securities Exchange Act of 1934, as amended (the “Exchange Act”)) as of the end of the period covered by this report. Based on thissuch evaluation, our president (our principal executive officer, principal accounting officermanagement, including our Chief Executive Officer and principal financial officer)Chief Financial Officer, has concluded that as of the end of such period, our disclosure controls and procedures were not effective to ensure that information that is required to be disclosed by us in the reports we file or submit under the Exchange Act is (i) recorded, processed, summarized and reported, within the time periods specified in the SEC’s rules and forms and (ii) accumulated and communicated to our management, including our president (our principal executive officer and our principal accounting officer and principal financial officer), as appropriate, to allow timely decisions regarding required disclosure.of December 31, 2019.
(b) Management’s Report on Internal Control over Financial Reporting
Management is responsible for establishing and maintaining adequate internal control over financial reporting (as defined in Rules 13a-15(f) and 15d-15(f) under the Exchange Act). Internal control over financial reporting is a process designed by, or under the supervision of, our president (our principal executive officer and our principal accounting officer and principal financial officer), to provide reasonable assurance regarding the reliability of financial reporting and the preparation of financial statements in accordance with GAAP. Internal control over financial reporting includes those policies and procedures that (1) pertain to the maintenance of records that, in reasonable detail, accurately and fairly reflect the transactions and dispositions of the assets of our company; (2) provide reasonable assurance that transactions are recorded as necessary to permit preparation of financial statements in accordance with GAAP, and that receipts and expenditures of our company are being made only in accordance with authorizations of management and directors of our company; and (3) provide reasonable assurance regarding prevention or timely detection of unauthorized acquisition, use, or disposition of our company’s assets that could have a material effect on the financial statements. Because of its inherent limitations, internal control over financial reporting may not provide absolute assurance that a misstatement of our financial statements would be prevented or detected.
Further, the evaluation of the effectiveness of internal control over financial reporting was made as of a specific date, and continued effectiveness in future periods is subject to the risks that controls may become inadequate because of changes in conditions, or that the degree of compliance with the policies or procedures may deteriorate.
Management has conducted, with the participation of our president (our principal executive officerChief Executive Officer and our principal accounting officer and principal financial officer),Chief Financial Officer, an evaluation of the effectiveness of our internal control over financial reporting as of February 28, 2018December 31, 2019 in accordance with the criteria set forth by the Committee of Sponsoring Organizations of the Treadway Commission ("COSO"(“COSO”) in Internal Control — Integrated Framework. Based on this assessment, management concluded that as of February 28, 2018,December 31, 2019, our company’s internal control over financial reporting was not effective based on present company activity. Our company is in the process of adopting specific internal control mechanisms with our board and officers’ collaboration to ensure effectiveness as we grow. We are presently engaging an outside consultant to assist in adopting new measures to improve upon our internal controls. Future controls, among other things, will include more checks and balances and communication strategies between the management and the board to ensure efficient and effective oversight over company activities as well as more stringent accounting policies to track and update our financial reporting.effective.
This annual report does not include an attestation report from our registered public accounting firm regarding internal control over financial reporting. Management’s report was not subject to attestation by our registered public accounting firm pursuant to rules of the Securities and Exchange Commission that permit us to provide only the management’s report in this annual report.
(c) Changes in Internal ControlControls over Financial Reporting
There have been no changes in our internal controls over financial reporting that occurred during the year ended February 28, 2018December 31, 2019 that have materially or are reasonably likely to materially affect, our internal controls over financial reporting.
None.
PART III
Item 10. Directors, Executive Officers and Corporate Governance
Name | Age | Positions | ||
Tak Shing Eddie Wong | 56 | Chairman of the Board of Directors, Chief Executive Officer and President | ||
Sai Kit Leung | 63 | Chief Financial Officer and Secretary | ||
Shaowei Deng | 31 | Director | ||
Ka Yi Poon | 28 | Director |
Mr. Wong, 56, has held numerous senior management positions with various Asian companies in different industries. He is currently the chief executive officer of Peak Strategy Management Co., Ltd., a Hong Kong company providing business general consultancy services. Since March 2014, Mr. Wong has been the chief consultant of Conpak Management Group, a Hong Kong company providing corporate consultancy services, and is responsible for advising on its various projects and overall development. Mr. Wong is also the chief strategy officer of Sinostar Securities Limited, a Hong Kong company offering securities trading services, and is responsible for overseeing its overall business development. Mr. Wong previously served as the chief executive officer of He Zheng Yuan Agriculture Group Limited, a PRC company focusing on agricultural trades and provision of food and beverage, from June 2016 to February 2018 and Mondo Vantaggio Pte. Ltd., a Singaporean company operating luxury multi-brand stores, from October 2014 to June 2016. Between April 2016 and December 2016, he was the chief financial officer of Happy Animation (Shenzhen) Co., Ltd., a PRC company focusing on amination and education related development. Mr. Wong holds a certificate in Hotel Business Program offered by Cartas Bianchi College of Careers. He is also a member of China Academy of Management Science and a qualified Senior Financial Planner certified by the PRC.
| 39 |
| Table of Contents |
Item 10. Directors, Executive Officers and Corporate Governance (continued)
Mr. Leung, 63, has been the chief financial officer of Arcus Mining Holdings Limited since November 2015. Prior to joining Arcus Mining Holdings Limited, Mr. Leung had over 35 years of experience in the banking industry. In August 1975, Mr. Leung joined Nanyang Commercial Bank as a clerk. From March 1991 to August 2015, he served as the head of treasury of Nanyang Commercial Bank, and was responsible for treasury duties including cash and liquidity management, banking facilities arrangement, advising management on the treasury position of the business, short-term and long-term liquidity, preparing cash flow forecasts and performing financial modelling. Mr. Leung holds a Master Degree of Science in Financial Engineering from the City University of Hong Kong.
Mr. Shaowei Deng, age 31, serves as an independent director. He has been working in the financial industry since 2013 and has ample experience in both Hong Kong and PRC. Mr. Deng deals in and advises on securities (Type 1 and Type 4 HKSFC license holder respectively), deals in futures contracts (Type 2 HKSFC license holder) and participates in asset management activity (Type 9 HKSFC license holder). Mr. Deng was an investment manager of Hongta Security Company, a PRC company providing financial consultancy services, from July 2013 to August 2014 and was responsible for assisting in IPO projects. From August 2014 to May 2015, he served as the director of Dongguan Yuefang Trading Company, a PRC company specializing in tea trading, and was responsible for business development, financial management and product development. Mr. Deng has been the chairman of Dongguan Four Eyes Asset Management Limited, a PRC company providing professional wealth management consultancy services, since June 2015. He was responsible for advising high-net-worth clients on asset allocation and investment, as well as designing private equity products. Between December 2017 and June 2018, Mr. Deng was the representative of Orient Securities (Hong Kong) Limited, a Hong Kong company offering securities trading services, and was responsible for handling securities and futures contracts. Mr. Deng has been serving as an executive director of Deyu Family Office, a Hong Kong company providing family office services, since April 2017. He is responsible for building and maintaining relationship with the high-net-worth individual and corporate clients and overseeing its overall business development. He has been a senior manager of Aspenwood Capital Limited, a Hong Kong company offering securities trading services and asset management services, and is responsible for advising on securities trading and asset management. Mr. Deng holds a Master Degree of Science in Real Estate Investment and a Bachelor Degree of Art in Accounting and Finance from Cass Business School in London and Lancaster University in the UK respectively.
Miss Ka Yi Poon, age 28, joined Arcus Mining Holdings Limited in January 2018 and serves as a non-independent director. Prior to joining Arcus Mining Holdings Limited, she was a business development officer of Conpak CPA Limited, a Hong Kong company specializing in providing audit and assurance services, and was responsible for business development from September 2014 to September 2017. Miss Poon holds a Bachelor Degree of Art in Business Administration (Hons) from Hong Kong Shue Yan University.
Family Relationships
No family relationships exist among our directors, executive officers, or persons nominated or chosen by us to become directors or executive officers.
All directors of our Company hold office until the next annual stockholders’ meeting of the security holdersor until their death, resignation, retirement, removal, disqualification, or until their successors have been elected and are qualified. TheOur officers serve at the will of our Company are appointed by our boardthe Board of directors and hold office until their death, resignation or removal from office. Our directors and executive officers, their ages, positions held, and duration as such, are as follows:
|
|
|
| |||
|
|
|
| |||
|
|
|
|
Business ExperienceDirectors.
The following is a brief account of the education and business experience during at least the past five years of our directors and executive officers, indicating their principal occupation during that period, and the name and principal business of the organization in which such occupation and employment were carried out.
Chung Szeto – Director, President and CEO
Mr. Szeto is the President of TGS International. He began his career in the field of power engineering after receiving his diploma in Power Engineering Technology in 1998 at The Southern Alberta Institute of Technology in Alberta, Canada. In 1999, he moved to Hong Kong and worked for Gammon Construction Ltd. until 2003, initially as an engineer assistant and later as a site coordinator in one of Hong Kong’s large railway projects. In 2003, he returned to Canada and formed Szeto Renovations. After forming Szeto Renovations, he started to work in the construction industry in Canada. Since then, he has worked in a number of construction projects and has gained a diverse experience in the various sectors in the construction industry. In addition to his renovations business with Szeto Renovations, in 2014 he began a trading business which imports various products from China. In March, 2016, he formed TGS Building Products Ltd. of Alberta, which was in the business of the installation of PVC wall and ceiling panels imported from China.
Sau Chun Yu – Director, CFO and Secretary
Ms. Yu is the Treasurer and Secretary of TGS International. She has a diversified working experience. While in Hong Kong, she obtained a diploma in Executive Secretarial Studies in 2001 and another diploma in Business Administration in 2003. In 2003, she immigrated to Canada. In 2008, she obtained a certificate in Health Care Aide in Alberta, Canada. Since then, she worked as a health care aid for Wing Kei Care Centre of Calgary from 2008 to 2010 and for Bayshore Home Health Care of Calgary from 2010 to present. In addition to her work in the health care industry, she has also performed various administrative and accounting functions for a number of companies.
Our company believes that the educational background, accounting and business experience of Mr. Szeto and Ms. Yu provide the qualifications and skills necessary for them to serve as directors and officers of our Company.
Significant Employees
There are no individuals other than our executive officers who make a significant contribution to our business.
Family Relationships
Our President and CEO, Chung Szeto, and our Secretary and CFO are husband and wife.
Involvement in Certain Legal Proceedings
To the best of our knowledge, none of our directors or executive officers have been convicted in a criminal proceeding, excluding traffic violations or similar misdemeanors, or has been a party to any judicial or administrative proceeding during the past ten years:five years that resulted in a judgment, decree or final order enjoining the person from future violations of, or prohibiting activities subject to, federal or state securities laws, or a finding of any violation of federal or state securities laws, except for matters that were dismissed without sanction or settlement. Except as set forth in our discussion below in “Certain Relationships and Related Transactions,” none of our directors, director nominees or executive officers has been involved in any transactions with us or any of our directors, executive officers, affiliates or associates which are required to be disclosed pursuant to the rules and regulations of the SEC.
Other Directorships
Our directors do not hold any other directorships in any company with a class of securities registered pursuant to Section 12 of the Exchange Act or subject to the requirements of section 15(d) of such Act or any company registered as an investment company under the Investment Company Act of 1940.
Board of Directors and Director Nominees
The Board will consider candidates for directors proposed by security holders, although no formal procedures for submitting candidates have been adopted. Unless otherwise determined, at any time not less than 90ninety (90) days prior to the next annual Board meeting at which a slate of director nominees is adopted, the Board will accept written submissions from proposed nominees that include the name, address and telephone number of the proposed nominee; a brief statement of the nominee’s qualifications to serve as a director; and a statement as to why the security holder submitting the proposed nominee believes that the nomination would be in the best interests of our security holders. If the proposed nominee is not the same person as the security holder submitting the name of the nominee, a letter from the nominee agreeing to the submission of his or her name for consideration should be provided at the time of submission. The letter should be accompanied by a résumé supporting the nominee’s qualifications to serve on the Board, as well as a list of references.
The Board identifies director nominees through a combination of referrals from different people, including management, existing Board members and security holders. Once a candidate has been identified, the Board reviews the individual’s experience and background and may discuss the proposed nominee with the source of the recommendation. If the Board believes it to be appropriate, Board members may meet with the proposed nominee before making a final determination whether to include the proposed nominee as a member of the slate of director nominees submitted to security holders for election to the Board.
Some of the factors which the Board considers when evaluating proposed nominees include their knowledge of and experience in business matters, finance, capital markets and mergers and acquisitions. The Board may request additional information from each candidate prior to reaching a determination, and it is under no obligation to formally respond to all recommendations, although as a matter of practice, it will endeavor to do so.
| 40 |
| Table of Contents |
Board and Committee Meetings
Our boardBoard of directorsDirectors held no in person meetings during the year ended February 28, 2018.December 31, 2019. All proceedings of the boardBoard of directorsDirectors were conducted by resolutions consented to in writing by all the directors and filed with the minutes of the proceedings of the directors. Such resolutions consented to in writing by the directors entitled to vote on that resolution at a meeting of the directors are, according to the Nevada General Corporate Law and our Bylaws, as valid and effective as if they had been passed at a meeting of the directors duly called and held.
For the year ended February 28, 2018,December 31, 2019, there was no standing nominating committee or committee performing similar functions for our company. Mr. Szeto and Ms. Yu participateWong participates in the consideration of director nominees.
Conflicts of Interest
Our directors are not obligated to commit their full time and attention to our business and, accordingly, they may encounter a conflict of interest in allocating their time between our operations and those of other businesses. In the course of their other business activities, they may become aware of investment and business opportunities which may be appropriate for presentation to us as well as other entities to which they owe a fiduciary duty. As a result, they may have conflicts of interest in determining to which entity a particular business opportunity should be presented. They may also in the future become affiliated with entities, engaged in business activities similar to those we intend to conduct.
In general, officers and directors of a corporation are required to present business opportunities to a corporation if:
| · | the corporation could financially undertake the opportunity; |
|
|
|
| · | the opportunity is within the corporation’s line of business; and |
|
|
|
| · | it would be unfair to the corporation and its stockholders not to bring the opportunity to the attention of the corporation. |
We plan to adopt a code of ethics that obligates our directors, officers and employees to disclose potential conflicts of interest and prohibits those persons from engaging in such transactions without our consent.
Code of Ethics
We have not adopted a code of ethics that applies to our officers, directors and employees. When we do adopt a code of ethics, we will disclose it in a Current Report on Form 8-K.
Audit Committee
We do not currently have an audit committee or a committee performing similar functions. The boardBoard of directorsDirectors as a whole participates in the review of financial statements and disclosure.
Section 16(a) of the Securities Exchange Act of 1934
Our common stock is not registered pursuant to Section 12Based solely on review of the Securities Exchange Actcopies of 1934, as amended (the “Exchange Act”). Accordingly,such forms furnished to the Company, or written representations that no reports were required, the Company believes that for the year ended December 31, 2019, our officers, directors and principal stockholders are not subject to the beneficial ownership reporting requirements ofexecutive officers complied with Section 16(a) of the Exchange Act.filing requirements applicable to them.
Item 11. Executive Compensation
The following table summarizesExecutive Officer Compensation
Set forth below is information regarding the compensation paid during the years ended December 31, 2018 and 2019 to the following persons:our principal executive officer and principal financial officer, who are collectively referred to as “named executive officers” elsewhere in this Annual Report.
Name and Principal Compensation |
| Year |
|
| Salary ($) |
| ||
|
|
|
|
|
|
| ||
Tak Shing Eddie Wong |
|
| 2019 |
|
|
| 121,777 |
|
Chairman of the Board of Directors, Chief Executive Officer and President |
|
| 2018 |
|
|
| 45,265 |
|
|
|
|
|
|
|
|
|
|
Sai Kit Leung |
|
| 2019 |
|
| Nil |
| |
Chief Financial Officer and Secretary |
|
| 2018 |
|
| Nil |
| |
| ||
| Table of Contents |
whom we will collectively refer to as the named executive officers of our company, are set out in the following summary compensation table, except that no disclosure is provided for any named executive officer, other than our principal executive officers, whose total compensation did not exceed $100,000 for the respective fiscal year:
SUMMARY COMPENSATION TABLE | |||||||||||||||||||||
Name and Principal Position |
| Year |
|
| Salary ($) |
| Bonus ($) |
| Stock Awards ($) |
| Option Awards ($) |
| Non-Equity Incentive Plan Compensa- tion ($) |
| Change in Pension Value and Nonqualified Deferred Compensation Earnings ($) |
| All Other Compensa- tion ($) |
| Total ($) | ||
|
|
|
|
|
|
|
|
|
|
|
|
|
|
|
|
|
|
|
|
| |
Chung Szeto(1) |
|
| 2018 |
|
| 8,588 |
| Nil |
| Nil |
| Nil |
| Nil |
| Nil |
| Nil |
| 8,588 | |
President, Chief Executive Officer, and Director |
|
| 2017 |
|
| Nil |
| Nil |
| Nil |
| Nil |
| Nil |
| Nil |
| Nil |
| Nil |
|
|
|
|
|
|
|
|
|
|
|
|
|
|
|
|
|
|
|
|
|
|
|
Sau Chun Yu (2) |
|
| 2018 |
|
| Nil |
| Nil |
| Nil |
| Nil |
| Nil |
| Nil |
| Nil |
| Nil | |
Secretary, Chief Financial Officer, and Director |
|
| 2017 |
|
| Nil |
| Nil |
| Nil |
| Nil |
| Nil |
| Nil |
| Nil |
| Nil |
|
____________
|
|
|
|
Narrative Disclosure to Summary Compensation TableEmployment Agreements
There are no employment contracts, compensatory plans or arrangements, including payments to be received from our companyCompany with respect to any executive officer, that would result in payments to such person because of his or her resignation, retirement or other termination of employment with our company,Company, or its subsidiaries, any change in control, or a change in the person’s responsibilities following a change in control of our company.Company.
Options Grants During the Last Fiscal Year / Stock Option Plans
We do not currently have a stock option plan in favor of any director, officer, consultant or employee of our company. No individual grants of stock options, whether or not in tandem with stock appreciation rights known as SARs or freestanding SARs have been made to any executive officer or director during the last fiscal year; accordingly, no stock options have been granted or exercised by any of the officers or directors during our last fiscal year.
Aggregated Options Exercises in Last Fiscal Year
No individual grants of stock options, whether or not in tandem with stock appreciation rights known as SARs or freestanding SARs have been made to any executive officer or any director during our last fiscal year; accordingly, no stock options have been granted or exercised by any of the officers or directors since during our last fiscal year.
Long-Term Incentive Plans and Awards
We do not have any long-term incentive plans that provide compensation intended to serve as incentive for performance. No individual grants or agreements regarding future payouts under non-stock price-based plans have been made to any executive officer or any director or any employee or consultant since our inception; accordingly, no future payouts under non-stock price-based plans or agreements have been granted or entered into or exercised by any of the officers or directors or employees or consultants since we were founded.
Outstanding Equity Awards at Fiscal Year End
No equity awards were outstanding as of the year ended June 30, 2016.December 31, 2019.
Director Compensation of Directors
The members of our board ofOur directors are not compensated by our Company for acting as such. Directors are reimbursed for reasonable out-of-pocket expenses incurred. There are no arrangements pursuantincurred by them in connection with attending Board of Directors’ meetings. During the years ended December 31, 2018 and 2019, salary amounting $45,265 and $121,777 was paid to which directors are or will be compensated indirector, Tak Shing Eddie Wong, respectively. During the future for any services provided as ayear ended December 31, 2019, salary amounting $22,517 was paid to director, Ka Yi Poon. No compensation was paid to the other director.
We do not have any agreements for compensating our directors for their services in their capacity as directors, although such directors are expected in the future to receive stock options to purchase shares of our common stock as awarded by our board of directors.
Name and Principal Compensation |
| Year |
| Salary ($) |
| |
|
|
|
|
|
| |
Ka Yi Poon |
| 2019 |
|
| 22,517 |
|
|
| 2018 |
| Nil |
| |
|
|
|
|
|
| |
Shaowei Deng |
| 2019 |
| Nil |
| |
|
| 2018 |
| Nil |
| |
We have determined that none of our directors are independent directors, as that term is used in Item 7(d)(3)(iv)(B) of Schedule 14A under the Securities Exchange Act of 1934, as amended, and as defined by Rule 4200(a)(15) of the NASDAQ Marketplace Rules.
Pension, Retirement or Similar Benefit Plans
There are no arrangements or plans in which we provide pension, retirement or similar benefits for directors or executive officers. We have no material bonus or profit sharing plans pursuant to which cash or non-cash compensation is or may be paid to our directors or executive officers, except that stock options may be granted at the discretion of the board of directors or a committee thereof.
Long-Term Incentive Plan Awards
We do not have any long-term incentive plans that provide compensation intended to serve as incentive for performance.
Indebtedness of Directors, Senior Officers, Executive Officers and Other Management
None of our directors or executive officers or any associate or affiliate of our company during the last two fiscal years, is or has been indebted to our company by way of guarantee, support agreement, letter of credit or other similar agreement or understanding currently outstanding.
| 42 |
| Table of Contents |
Item 12. Security Ownership of Certain Beneficial Owners and Management and Related Stockholder Matters
On March 20, 2020, we had 14,858,328 shares of common stock and 66,000 warrants issued and outstanding. The following table sets forth as of February 28, 2018, certain information with respect to the beneficial ownership of our common shares bysecurities as of March 20, 2020, for (i) each shareholder known by us to be the beneficial owner of our directors and executive officers; (ii) all of our directors and executive officers as a group; and (iii) each person who we know beneficially owns more than 5% of our common stock.
Beneficial ownership data in the table has been calculated based on Commission rules that require us to identify all securities that are exercisable or convertible into shares as well as by each of our current directorscommon stock within 60 days of March 20, 2020 and executive officerstreat the underlying stock as a group. Each person hasoutstanding for the purpose of computing the percentage of ownership of the holder.
Except as indicated below, the stockholders listed possess sole voting and investment power with respect to their shares. Unless otherwise noted, the sharesprincipal address of common stock, except as otherwise indicated. Beneficial ownership consistseach of a direct interest in the shares of common stock, except as otherwise indicated.stockholders, directors and officers listed below is at Suite 1023, 10/F., Ocean Centre, 5 Canton Rd., Tsim Sha Tsui, Kowloon, Hong Kong.
Name of Beneficial Owner |
| Number of Shares of Common Stock Beneficially Owned |
|
| Percent of Class |
| ||
|
|
|
|
|
|
| ||
5% Holders |
|
|
|
|
|
| ||
Chi Kin Loo |
|
| 7,252,194 |
|
|
| 48.81 | % |
Talent World Group Limited (1) |
|
| 7,252,194 |
|
|
| 48.81 | % |
New Precision Global Limited (1) |
|
| 7,252,194 |
|
|
| 48.81 | % |
Kwong Bun Mak |
|
| 1,570,830 |
|
|
| 10.57 | % |
Brilliant New Ventures Limited (2) |
|
| 1,570,830 |
|
|
| 10.57 | % |
Xianqin Pan |
|
| 1,676,208 |
|
|
| 11.28 | % |
Empire Glory International Limited (3) |
|
| 1,676,208 |
|
|
| 11.28 | % |
Tak Leung Ho |
|
| 1,570,830 |
|
|
| 10.57 | % |
Virtue Success Global Limited (4) |
|
| 1,570,830 |
|
|
| 10.57 | % |
Linfa Sun |
|
| 1,156,344 |
|
|
| 7.78 | % |
Go Achiever International Limited (5) |
|
| 1,156,344 |
|
|
| 7.78 | % |
|
|
|
|
|
|
|
|
|
Directors and Officers: |
|
|
|
|
|
|
|
|
Tak Shing Eddie Wong |
|
| 281,007 |
|
|
| 1.89 | % |
Sai Kit Leung |
|
| 190,010 |
|
|
| 1.28 | % |
Ka Yi Poon |
|
| 5,848 |
|
|
| 0.04 | % |
|
|
|
|
|
|
|
|
|
Directors and officers as a group (3 Individuals) (6) |
|
| 476,865 |
|
|
| 3.21 | % |
Name and Address of Beneficial Owner |
| Amount and Nature of Beneficial Ownership(1) |
|
| Percentage of Class |
| ||
Chung Szeto(2) Unit 3, 6420 4 Street NE, Calgary, AB, Canada T2K 5M8 |
| 4,000,000 |
|
|
| 29.56 | % | |
| Sau Chun Yu(3) Unit 3, 6420 4 Street NE, Calgary, AB, Canada T2K 5M8 |
| 2,500,000 common |
|
|
| 18.48 | % | |
Directors and Executive Officers as a Group(1) |
| 6,500,000 common |
|
|
| 48.04 | % | |
Djong Djung Tjhin Flat F, 9/F, Winning Heights, 8 Wun Tung Street, Tsuen Wan, Hong Kong |
| 1,500,000 common |
|
|
| 11.09 | % | |
Ng Kam Shing Raymond Room 85, 15/F, Block 3, Lotus Tower, Kwun Tong Garden Estate, Ngau Tau Kok, Kowloon, Hong Kong |
| 1,500,000 common |
|
|
| 11.09 | % | |
|
|
|
|
|
|
|
| |
All 5%+ Shareholders as a Group |
| 9,500,000 common |
|
|
| 70.21 | % | |
_________________
(1) |
Chi Kin Loo. |
(2) |
Brilliant New Ventures Limited is controlled by Kwong Bun Mak. |
(3) |
|
(4) | Virtue Success Global Limited is controlled by Tak Leung Ho. |
(5) | Go Achiever International Limited is controlled by Linfa Sun. |
(6) | Represents common stock held by Tak Shing Eddie Wong, Sai Kit Leung and |
Changes in Control
WeThere are unaware ofno arrangements known to us, including any contract or other arrangement or provisionspledge by any person of our Articles or Bylawssecurities, the operation of which may at a subsequent date result in a change of control of our company. There are not any provisions in our Articles or Bylaws, the operation of which would delay, defer, or prevent a change in control of our company.the Company.
| 43 |
| Table of Contents |
Item 13. Certain Relationships and Related Transactions, and Director Independence
Except as disclosed below, there have been no transactions or proposed transactions in whichAs of December 31, 2019 and December 31, 2018, loans from related persons included a HK$3 million (equivalent to US$385,158) and HK$4 million (equivalent to US$510,830) respectively loan borrowed from the amount involved exceeds the lesserwife of $120,000 or 1%one of the averageCompany’s stockholders on May 21, 2018. The loan is unsecured, has no collateral or guarantee and carries interest at a monthly rate of our total assets at year-end3.08% for the last two completed fiscal years in which anyfirst month and a monthly rate of our directors, executive officers or beneficial holders of more than 5%1.08% for the rest of the outstanding sharesterm. The loan originally was due to be repaid on May 20, 2019, however, on April 24, 2019, the repayment date was extended to May 20, 2020. The Company repaid HK$1 million (equivalent to US$127,648) loan on April 24, 2019.
As of ourDecember 31, 2018, loans from related persons included a HK$1 million (equivalent to US$127,708) loan borrowed from the son of the CFO of TGS on October 6, 2016. The loan is unsecured, has no collateral or guarantee and carries interest at 8% per annum. The loan was fully repaid by issuing common stock or any of their respective relatives, spouses, associates or affiliates, has had or will have any direct or material indirect interest.TGS on May 15, 2019.
As of December 31, 2019 and 2018, amounts due to stockholders, Chi Kin Loo, Kwong Bun Mak, Xianqin Pan and Tak Leung Ho, included $872,968 and $398,208 at December 31, 2019 and December 31, 2018 respectively. The Company is currently in the exploration stage, and the stockholders advanced $517,329 working capital to meet the financing requirement for the year of 2019. Amounts due to stockholders are unsecured, interest-free and there are no fixed terms for repayment. The stockholders have agreed not to demand for repayment within the next 12 months for the balance sheet date.
As of December 31, 2019 and 2018, amount due to a director, Tak Shing Eddie Wong, of HK$576,000 (equivalent to US$73,950) and HK$576,000 (equivalent to US$73,560) respectively. The amount is unsecured, has no collateral or guarantee and is interest-free. The amount was fully repaid on March 13, 2020 and February 14, 2019, respectively.
During the year, ended February 28, 2018, we paidthe director, Sai Kit Leung advanced HK$1,295,687 (equivalent to US$165,392) to the Company. On September 29, 2019, the Company issued 33,096 common shares at a management feeprice of $8,588$3.66 to Chung Szeto, our president, chief executive officer, director and shareholder.
As at February 28, 2018, we are obligated to Chung Szeto, our president, chief executive officer, director and shareholder and other shareholders, for funds advanced to us for working capital, insettle the amount due to the director of $55,097 (2017 - Nil)HK$944,832 (equivalent to US$121,133). The advances areAs of December 31, 2019, there is an amount due to a director of HK$350,855 (equivalent to US$45,045). This amount is unsecured, interest-free and no interest rate or payback schedule has been established.
As at the date of this Annual Report there are no written agreements between our company and Chung Szeto or Sau Chun Yu regarding their respective consulting, officer, orfixed terms for repayment. The director serviceshas agreed not to demand for repayment within 12 months of the company.balance sheet date.
Director Independence
We currently act with two directors. We do not have a director that would qualify as an “independent director” as defined by Nasdaq Marketplace Rule 4200(a)(15).
four directors, one of which is independent. We do not have a standing audit, compensation or nominating committee, but our entire board of directors’ acts in such capacities. We believe that our board of directors is capable of analyzing and evaluating our financial statements and understanding internal controls and procedures for financial reporting. The board of directors of our company does not believe that it is necessary to have a standing audit, compensation or nominating committee because we believe that the functions of such committees can be adequately performed by the board of directors. Additionally, we believe that retaining an independent director who would qualify as an “audit committee financial expert” would be overly costly and burdensome and is not warranted in our circumstances given the early stages of our development.
Indemnification
Our Bylaws provide that we will indemnify our directors and officers to the fullest extent not prohibited by Nevada law.
The general effect of the foregoing is to indemnify a control person, officer or director from liability, thereby making us responsible for any expenses or damages incurred by such control person, officer or director in any action brought against them based on their conduct in such capacity, provided they did not engage in fraud or criminal activity.
Insofar as indemnification for liabilities arising under the Securities Act may be permitted to our directors, officers or control persons pursuant to the foregoing provisions, we have been informed that in the opinion of the SEC such indemnification is against public policy as expressed in the Securities Act and is therefore unenforceable.
Item 14. Principal Accountant Fees and Services
The aggregate fees billed forDuring the most recently completed fiscal year ended February 28,December 31, 2018, the total fees billed by Moore Stephens CPA Limited for audit-related services was $148,063, for tax services was $0 and for all other services was $0.
During the fiscal year ended February 28, 2017 for professional services rendered byDecember 31, 2019, the principal accountant for the audit of our annual financial statements and review of the financial statements included in our quarterly reports on Form 10-Q and services that are normally provided by the accountant in connection with statutory and regulatory filings or engagements for these fiscal periods were as follows:
Year Ended February 28, 2018 CAD$ February 28, 2017 CAD$ Audit Fees Audit Related Fees Nil Nil Tax Fees All Other Fees Nil Total 10,000 (1) 10,000 3,000 (1) 3,000 4,000 17,000 13,000
________
Our board of directors pre-approves all services provided by our independent auditors. All of the above services and fees were reviewed and approved by the board of directors either before or after the respective services were rendered.
Our board of directors has considered the nature and amount oftotal fees billed by our independent auditorsMoore Stephens CPA Limited for audit-related services was $124,457, for tax services was $0 and believes that the provision offor all other services for activities unrelated to the audit is compatible with maintaining our independent auditors’ independence.was $0.
| Table of Contents |
PART IV
Item 15. Exhibits and Financial Statement Schedules
Exhibit No. |
| |
|
| |
|
|
|
|
|
|
| ||
| ||
|
| |
| ||
|
| |
|
| |
|
| |
| ||
|
|
|
| ||
|
| |
|
| XBRL Instance Document |
___________
|
| |
|
| |
|
| |
|
| |
|
|
__________(1) Incorporated herein by reference to the current report on Form 8-K filed on September 14, 2018.
|
|
(2) Incorporated by reference to our registration statement on Form S-1 filed on April 25, 2017. None.
|
|
| Table of Contents |
SIGNATURES
In accordance withPursuant to the requirements of Section 13 or 15(d) of the Securities Exchange Act of 1934, the registrant has duly caused this report to be signed on its behalf by the undersigned, thereunto duly authorized.
TGS | |||
Date: March 20, 2020 | By: | /s/ Tak Shing Eddie Wong | |
Tak Shing Eddie Wong | |||
President, Chief Executive Officer and Chairman of the Board of Directors |
| ||
|
|
| |
| |||
Date: March 20, 2020 | By: | /s/ |
|
|
| ||
| |||
|
| ||
Pursuant to the requirements of the Securities Exchange Act of 1934, this report has been signed below by the following persons on behalf of the registrant and in the capacities and on the dates indicated.
|
|
|
| |
|
| |||
| Date | |||
| ||||
| ||||
|
|
| March 20, 2020 | |
Tak Shing Eddie Wong | (Principal Executive Officer) | |||
| ||||
/s/ Sai Kit Leung |
|
| ||
|
| March 20, 2020 | ||
Sai Kit Leung |
| (Principal Financial | ||
/s/ Shaowei Deng | Director | March 20, 2020 | ||
Shaowei Deng | ||||
/s/ Ka Yi Poon | Director | March 20, 2020 | ||
Ka Yi Poon |
|
| 46 |
|