Item 2. Properties.Properties
Item 3. Legal Proceedings
We are involved in lawsuits, claims and proceedings arising in the ordinary course of business. These matters may involve personnel and employment issues, personal injury, contract and other proceedings arising in the ordinary course of business, which have not resulted in any material losses to date.business. Although we do not expect the outcome of these proceedings to have a material adverse effect on our financial condition or results of operations, litigation is inherently unpredictable. Therefore, we could incur judgments or enter into settlements or claims that could materially impact our results.
Item 4. Mine Safety Disclosures.Disclosures
Not applicable.
Item 5. Market for Registrant’s Common Equity, Related Stockholder Matters and Issuer Purchases of Equity Securities
We currently do not pay dividends and have not paid any cash dividends on our common stock to date.
The following graph and related information shall not be deemed “soliciting material” or be deemed to be “filed” with the Commission, nor shall such information be incorporated by reference into any future filing, except to the extent that we specifically incorporate it by reference into such filing.
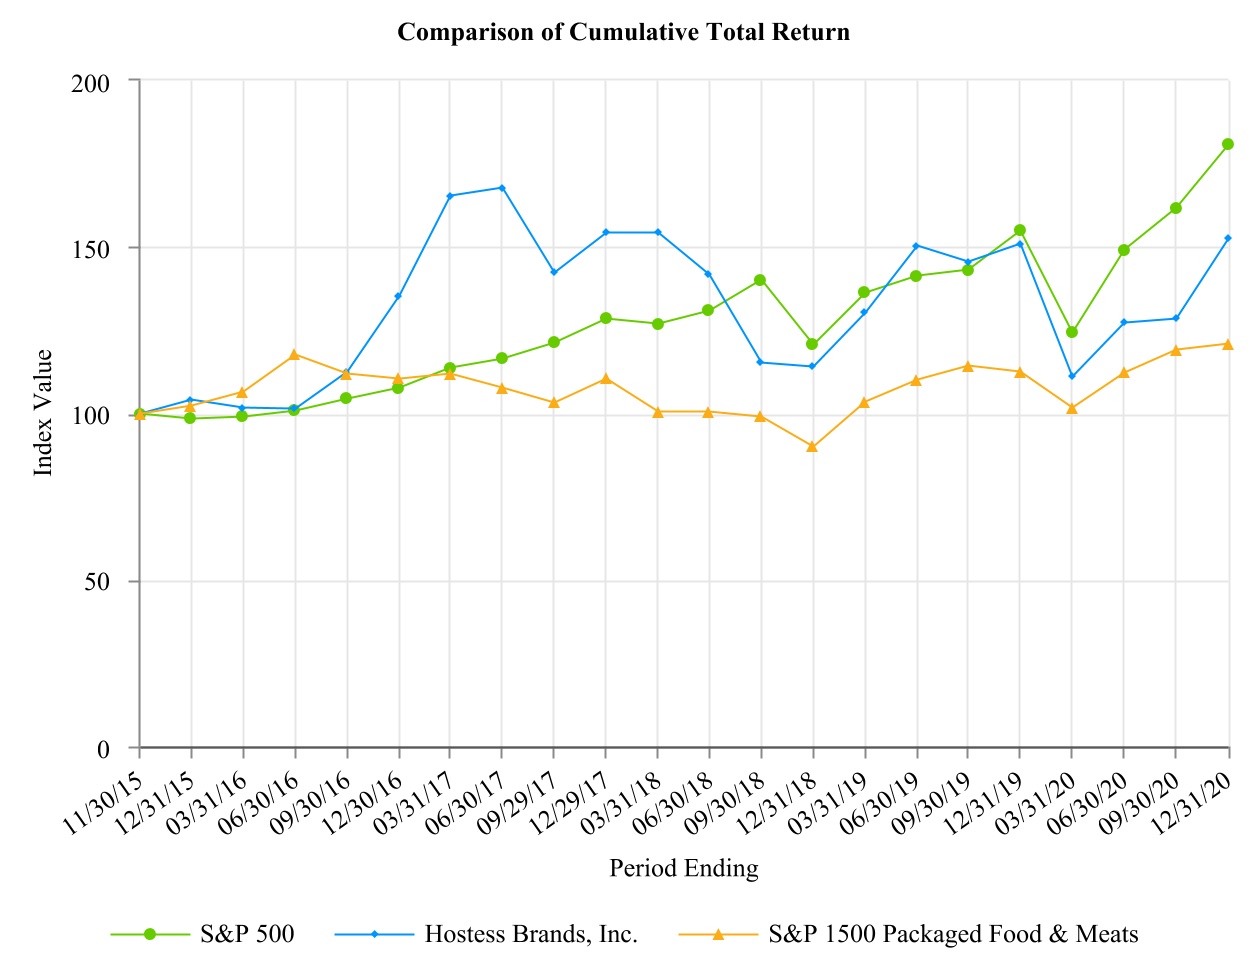
The following stock performance graph compares, for the period November 30, 2015 (the first day our common stock was traded following our initial public offering) through December 29, 201731, 2020 (the last trading day of our fiscal year), the cumulative total stockholder return for (1) the Company’s common stock, (2) the Standard & Poor’s 500 and (3) the Standard & Poor’s 500composite 1500 Packaged Foods and Meats Index.Sub-Index. The graph assumes the value of the investment in our common stock and each index was $100.00 on November 30, 2015 and assumes reinvestment of any dividends.
The stock price performance below is not necessarily indicative of future stock price performance.
Item 6. Selected Financial Data
The following table sets forth our net revenues, operating costs and expenses attributable to our operations.Not applicable.
As a result of the Business Combination, we are the acquirer for accounting purposes and Hostess Holdings is the acquiree and accounting predecessor. Our financial statement presentation includes the financial statements of Hostess Holdings as “Predecessor” for periods prior to the Closing Date and of us for periods after the Closing Date, including the consolidation of Hostess Holdings. Also see “Item 7-Management’s Discussion and Analysis of Financial Condition and Results of Operations-Supplemental Unaudited Pro Forma Combined Financial Information” for supplemental pro forma combined information for 2016 that gives effect to the Business Combination as if such transaction had been consummated on January 1, 2016.
|
| | | | | | | | | | | | | | | | | | | | | | | | | |
| Statement of Operations Data |
| (In thousands except for share and per share data) | Year Ended December 31, 2017 | | From November 4, 2016
through December 31, 2016 | | | From January 1, 2016
through November 3, 2016 | | | Year Ended December 31, 2015 | | Year Ended
December 31, 2014 | | February 6, 2013 (Inception) through December 31, 2013 |
| | (Successor) | | (Successor) | | | (Predecessor) | | | (Predecessor) | | (Predecessor) | | (Predecessor) |
| Net revenue | $ | 776,188 |
| | $ | 111,998 |
| | | $ | 615,588 |
| | | $ | 620,815 |
| | $ | 554,695 |
| | $ | 237,418 |
|
| Gross profit | 326,898 |
| | 38,714 |
| | | 266,529 |
| | | 262,203 |
| | 233,932 |
| | 91,920 |
|
| Operating income (loss) | 233,992 |
| | (9,607 | ) | | | 122,872 |
| | | 155,908 |
| | 119,467 |
| | 23,330 |
|
| Income (loss) before income taxes | 190,904 |
| | (16,247 | ) | | | 60,864 |
| | | 88,760 |
| | 81,464 |
| | (5,594 | ) |
| Net income (loss) | 258,108 |
| | (8,485 | ) | | | 60,425 |
| | | 88,760 |
| | 81,464 |
| | (5,594 | ) |
| Net income (loss) attributable to the non-controlling interest | 34,211 |
| | (4,081 | ) | | | 3,214 |
| | | 4,507 |
| | 4,267 |
| | — |
|
| Net income (loss) attributable to Class A shareholders | $ | 223,897 |
| | $ | (4,404 | ) | | | $ | 57,211 |
| | | $ | 84,253 |
| | $ | 77,197 |
| | $ | (5,594 | ) |
| Earnings (loss) per Class A share: |
|
| | | | | | | | | | | | |
| Basic | $ | 2.26 |
| | $ | (0.05 | ) | | | | | | | | | | |
| Diluted | $ | 2.13 |
| | $ | (0.05 | ) | | | | | | | | | | |
| Weighted-average shares outstanding: | | | | | | | | | | | | | |
| Basic | 99,109,629 |
| | 97,791,658 |
| | | | | | | | | | |
| Diluted | 105,307,293 |
| | 97,791,658 |
| | | | | | | | | | |
|
| | | | | | | | | | | | | | | | | | | | | | | | | |
| Cash Flow Data |
| (In thousands) | | Year Ended December 31, 2017 | | From November 4, 2016 through December 31, 2016 | | | From January 1, 2016 through November 3, 2016 | | Year Ended December 31, 2015 | | Year Ended December 31, 2014 | | February 6, 2013 (Inception) through December 31, 2013 |
| | | (Successor) | | (Successor) | | | (Predecessor) | | (Predecessor) | | (Predecessor) | | (Predecessor) |
Net cash provided by (used in) operating activities | | $ | 163,685 |
| | $ | 13,611 |
| | | $ | 102,221 |
| | $ | 132,972 |
| | $ | 108,329 |
| | $ | (29,672 | ) |
| Net cash provided by (used in) investing activities | | (35,209 | ) | | (428,196 | ) | | | (76,579 | ) | | 17,880 |
| | (91,393 | ) | | (422,498 | ) |
| Net cash provided by (used in) financing activities | | (19,630 | ) | | (232,345 | ) | | | (31,596 | ) | | (296,002 | ) | | (9,769 | ) | | 654,626 |
|
|
| | | | | | | | | | | | | | | | | | | | | | |
| Balance Sheet Data |
| (In thousands) | | December 31, 2017 | | December 31, 2016 | | | December 31, 2015 | | December 31, 2014 | | February 6, 2013 (Inception) through December 31, 2013 | |
| | | (Successor) | | (Successor) | | | (Predecessor) | | (Predecessor) | | (Predecessor) | |
| Cash and cash equivalents | | $ | 135,701 |
| | $ | 26,855 |
| | | $ | 64,473 |
| | $ | 209,623 |
| | $ | 202,456 |
| |
| Property and equipment, net | | 174,121 |
| | 153,224 |
| | | 128,078 |
| | 112,732 |
| | 88,269 |
| |
| Total assets | | 2,966,275 |
| | 2,847,892 |
| | | 643,529 |
| | 765,494 |
| | 683,678 |
| |
| Long-term debt and capital lease obligation | | 987,920 |
| | 993,374 |
| | | 1,193,667 |
| | 473,175 |
| | 479,602 |
| |
| Non-controlling interest | | 342,240 |
| | 334,192 |
| | | (37,991 | ) | | 4,267 |
| | — |
| |
|
| | | | | | | | | | | | | | | | | | | | | | | | | |
Other Financial Data (1) |
| (In thousands) | | Year Ended December 31, 2017 | | From
November 4, 2016 through
December 31, 2016 | | | From
January 1, 2016 through November 3, 2016 | | Year Ended
December 31, 2015 | | Year Ended
December 31, 2014 | | February 6, 2013 (Inception) through December 31, 2013 |
| | | (Successor) | | (Successor) | | | (Predecessor) | | (Predecessor) | | (Predecessor) | | (Predecessor) |
| Adjusted EBITDA | | $ | 230,212 |
| | $ | 31,894 |
| | | $ | 183,409 |
| | $ | 177,930 |
| | $ | 145,343 |
| | $ | 40,285 |
|
|
| | | | | | | | | | | | | | | | | | | | | | | | |
| Adjusted Gross Profit and Adjusted Gross Margin |
| (In thousands) | Year Ended December 31, 2017 | | From November 4, 2016
through December 31, 2016 | | | From
January 1, 2016
through November 3, 2016 | | Year Ended December 31, 2015 | | Year Ended
December 31, 2014 | | February 6, 2013 (Inception) through December 31, 2013 |
| | (Successor) | | (Successor) | | | (Predecessor) | | (Predecessor) | | (Predecessor) | | (Predecessor) |
| Net revenue | $ | 776,188 |
| | $ | 111,998 |
| | | $ | 615,588 |
| | $ | 620,815 |
| | $ | 554,695 |
| | $ | 237,418 |
|
| Cost of goods sold | 449,290 |
| | 73,284 |
| | | 346,864 |
| | 355,963 |
| | 320,763 |
| | 145,498 |
|
| Special employee incentive compensation | — |
| | — |
| | | 2,195 |
| | 2,649 |
| | — |
| | — |
|
| Gross Profit | $ | 326,898 |
| | $ | 38,714 |
| | | $ | 266,529 |
| | $ | 262,203 |
| | $ | 233,932 |
| | $ | 91,920 |
|
| | | | | | | | | | | | | |
| Add back: | | | | | | | | | | | | |
| Special employee incentive compensation (i) | — |
| | — |
| | | 2,195 |
| | 2,649 |
| | — |
| | — |
|
| Inventory fair value adjustment (ii) | — |
| | 8,914 |
| | | — |
| | — |
| | — |
| | — |
|
| Adjusted Gross Profit | $ | 326,898 |
| | $ | 47,628 |
| | | $ | 268,724 |
| | $ | 264,852 |
| | $ | 233,932 |
| | $ | 91,920 |
|
| | | | | | | | | | | | | |
| Gross Margin - GAAP | 42.1 | % | | 34.6 | % | | | 43.3 | % | | 42.2 | % | | 42.2 | % | | 38.7 | % |
| | | | | | | | | | | | | |
| Adjusted Gross Margin | 42.1 | % | | 42.5 | % | | | 43.7 | % | | 42.7 | % | | 42.2 | % | | 38.7 | % |
(i) For the Predecessor period January 1, 2016 through November 3, 2016, a special bonus payment of $2.2 million was paid to employees at the bakery facilities as compensation for their efforts in the Business Combination. For the year ended December 31, 2015, a special bonus payment of $2.6 million was paid to employees at the bakery facilities as compensation for their efforts in the recapitalization of Hostess.
(ii) For the Successor period November 4, 2016 through December 31, 2016, the Company remeasured inventory at fair value at the Business Combination date, resulting in additional non-cash cost of goods sold of $8.9 million.
(1) Adjusted EBITDA is defined and explained in more detail in Item 7. Management’s Discussion and Analysis of Financial Condition and Results of Operations, which contains a reconciliation to the most comparable GAAP measure. Adjusted EBITDA is a non-GAAP financial measures commonly used by securities analysts, investors and other interested parties in their evaluation of the operating performance of companies in industries similar to ours. However, Adjusted EBITDA should not be construed as an alternative to net income as an indicator of operating performance or as an alternative to cash flow provided by operating activities as a measure of liquidity (each as determined in accordance with GAAP). Adjusted EBITDA may not be comparable to similarly titled measures reported by other companies. We have included Adjusted EBITDA because we believe it provides management and investors with additional information to measure our performance.
Adjusted Gross Profit and Adjusted Gross Margin are non-GAAP financial measures commonly used in our industry, however they should not be construed as an alternative to gross profit and gross margin as an indicator of operating performance. Adjusted Gross Profit and Adjusted Gross Margin may not be comparable to similarly titled measures reported by other companies. We have included Adjusted Gross Profit and Adjusted Gross Margin because we believe they provide management and investors with additional information to measure our performance. We believe the presentation of Adjusted Gross Profit and Adjusted Gross Margin is useful to investors because it is consistent with our definition of Adjusted EBITDA.
See Item 7-Management’s Discussion and Analysis of financial Condition and Results of Operations-Adjusted EBITDA Reconciliation.
Item 7. Management’s Discussion and Analysis of Financial Condition and Results of Operations
The following discussion and analysis of our financial condition and results of operations should be read in conjunction with our Consolidated Financial Statementsconsolidated financial statements and related notes included in Item 8 of this Annual Report on Form 10-K.10-K/A. This discussion contains forward-looking statements that involve risks and uncertainties. Our actual results could differ materially from those discussed below. Factors that could cause or contribute to such differences include, but are not limited to, those identified below and those discussed in Item 1A “Risk Factors” of this Annual Report on Form 10-K.10-K/A.
Overview
We are a leading United States packaged food company focused on developing, manufacturing, marketing, selling and distributing fresh sweet baked goods coast-to-coast,snack products in North America, providing a wide range of snack cakes, donuts, sweet rolls, breakfast pastries, cookies, snack pies and related products. We acquired the Hostess® brand and certain strategic assets out of the bankruptcy liquidation proceedings of Old HB Inc., its prior owner, free and clear of all past liabilities, in April 2013, and relaunched the brand later that year.
As of December 31, 2017,2020, we operate five bakeriesbaking facilities and three centralizedutilize distribution centers.centers and third-party warehouses to distribute our products. Our direct-to-warehouse (“DTW”)DTW product distribution system allows us to deliver to our customers’ warehouses. Our customers in turn distribute to their retail stores and/or distributors.
We haveThe Company has one reportable segment: Snacking (formerly referred to as Sweet Baked Goods, or “SBG”). The Snacking segment consists of sweet baked goods, cookies, bread and buns and frozen retail products that are sold under the Hostess®, Dolly Madison®, Cloverhill®, Big Texas®, and Voortman® brands. Through August 30, 2019, we operated in two reportable segments: “Sweet Baked Goods”SBG and “In-Store Bakery”In-Store Bakery (“ISB”). A change in the Company’s internal reporting structure during the last quarterThe In-Store Bakery segment consisted of 2017 caused the Company to reassess its reportable segments. Sweet Baked Goods consists of freshSuperior on Main® and frozen sweet baked goods and breadprivate label products sold underthrough the Hostess® and Dolly Madison® brands. In-Store Bakery consists of certain Superior and Hostess® branded eclairs, madeleines, brownies, and iced cookies sold in thein-store bakery section of grocery and club stores. The Company divested its In-Store Bakery segment's operations on August 30, 2019.
Hostess® is the second leading brand by market share within the Sweet Baked Goods (“SBG”("SBG") category, according to Nielsen U.S. total universe. For the 52-week period ended December 30, 201726, 2020 our branded SBG products (which include Hostess®, Dolly Madison®, Cloverhill®, and Big Texas®) market share was 17.2%19.5% per Nielsen’s U.S. SBG category data. We have aOur Voortman® branded products include the #1 leading market positioncreme wafer and sugar-free cookie products within the two largest SBG Segments; Donut Segment and Snack Cake Segment, The Donut and Snack Cake Segments together account for 49% of the Sweet Baked Goods category’s total dollar sales.
larger cookie category.
Principal Components of Operating Results
Net Revenue
We generate revenue primarily through selling sweet baked goods and other productspackaged snacks under the Hostess® group of brands, which includes iconic products such as CupCakes, Twinkies®, CupCakes,Donettes®, Ding Dongs®, Zingers®, HoHos®Danishes, Honey Buns and Donettes®,Coffee Cakes, as well as cookies, wafers and sugar-free products under the Voortman® brand. We also sell products under the Dolly Madison® brand , Cloverhill® and the Superior on Main® brand (e.g., eclairs, madeleines, brownies and iced cookies).Big Texas® brands along with private label products. Our product assortment is sold to customers’ warehouses and distribution centers by the case or in display readydisplay-ready corrugate units. Retailers display and sell our products to the end consumer in single-serve, multi-pack or club-pack formats. We sell our products primarily to supermarket chains, national mass merchandisers and convenience and dollar stores, along with a smaller portion of our product sales going to dollarclub stores, vending, club,drug, and other retail outlets.
Our revenues are driven by average net price and total volume of products sold. Factors that impact unit pricing and sales volume include product mix, the cost of ingredients, the promotional activities, implemented by the Company and its competitors, industry capacity, new product initiatives and quality and consumer preferences. We do not keep a significant backlog of finished goods inventory, as our fresh baked products are promptly shipped to our distribution centers after being produced and then distributed to customers.
Cost of Goods Sold
Cost of goods sold consists of ingredients, packaging, labor, energy, other production costs, warehousing and transportation costs for theincluding in-bound freight, inter-plant transportation and distribution of our products to our customers. The cost of ingredients and packaging represent the majority of our total costs of goods sold. All costs that are incurred at the bakeries, including the depreciation of bakery facilities and equipment, are included in cost of goods sold. We do not allocate any corporate functions into cost of goods sold.
Our cost of ingredients consists principally of flour, sweeteners, edible oils and cocoa,compound coating, which are subject to substantial price fluctuations, as is the cost of paper, corrugate, films and plastics used to package our products. The prices for raw materials are influenced by a number of factors, including the weather, crop production, transportation and processing costs, government regulation and policies and worldwide market supply and demand. We also rely on fuel products, such as natural gas, diesel, propane and electricity, to operate our bakeries and produce our products. Fluctuations in the prices of the
raw materials or fuel products used in the production, packaging or transportation of our products affect the cost of products sold and our product pricing strategy. We utilize forward buying strategies through short-term and long-term advance purchase contracts to lock in prices for certain high-volume raw materials, packaged components and certain fuel inputs. Through these initiatives, we believe we are able to obtain competitive pricing.
Advertising and Marketing
Our advertising and marketing expenses relate to our advertising campaigns, which include social media, print, online advertising, local promotional events and monthly agency fees. We also invest in wire racks and corrugate displays delivered to customers to display our products off shelf, field marketing and merchandising services to reset and check theour store inventory on a regular basisbasis. We also invest in advertising campaigns, which include social media, print, online advertising, local promotional events, monthly agency fees and marketing employmentpayroll costs.
Selling Expense
Selling expenses primarily include sales management, employment, travel, and related expenses, as well as broker fees. We utilize brokers for sales support, including managing promotional activities and order processing.
General and Administrative
General and administrative expenses primarily include employee and related expenses for the accounting, planning, customer service, legal, human resources, corporate operations, research and development, purchasing, logistics and executive functions. Also included are professional service fees related to audit and tax, legal, outsourced information technology functions, transportation planning, headquarters and corporate siteother office sites and insurance costs.costs, as well as the depreciation and amortization of corporate assets.
Related PartyOther Expenses
Related partyOther expenses consistedprimarily include interest paid on our Term loan as well as the change in fair value of the normal annual cash payments associated with our employment arrangements with Mr. Metropoulos as Chief Executive Officer and/or Executive Chairman.
liability-classified public and private placement warrants.
Non-Controlling Interest
During the years ended December 31, 2020 and 2019, Mr. Metropoulos and the Metropoulos Entities hold theirheld equity investment in us primarily through Class B limited partnership units in the Company’s subsidiary, Hostess Holdings (“Class B Units”), and an equal number of shares of the Company’s Class B common stock (“Class B Stock”). Our Class B Stock hashad voting, but no economic rights, while Hostess Holdings’ Class B Units havehad economic, but no voting rights. Each Class B Unit, together with a share of Class B Stock held by the Metropoulos Entities, iswas exchangeable for a share of the Company’s Class A common stock (or at the option of the Company, the cash equivalent thereof). The Company holds 100% of the general partnership interest in Hostess Holdings and, a majoritysince the final exchange described below, all of the limited partnership interests and consolidates Hostess Holdings in the Company’s consolidated financial statements. The interest of the Metropoulos Entities in Hostess Holdings’ Class B Units prior to the final exchange is reflected in our consolidated financial statements as a non-controlling interest.
For periods prior to The Metropoulos Entities have eliminated their ownership through a series of exchanges of shares of Class B Stock and Class B Units for an equal number of Class A shares. As part of the Business Combination, Hostess Holdings consolidatedfinal exchange, we repurchased 0.4 million shares of Class A common stock from the financial position and resultsMetropoulos Entities. The remaining shares were purchased by third parties. At December 31, 2020, there were no outstanding shares of operations of New Hostess Holdco, LLC. The portion of New Hostess Holdco, LLC not owned by Hostess Holdings (which constituted a profits interest plan for management) was recognized as a non-controlling interest in its consolidated financial statements.
Class B common stock.
Factors Impacting Recent Results
COVID-19
Long-term Debt RefinancingThe acute and Interest Rate Risk Management
To managefar-reaching impact of the risk relatedCOVID-19 pandemic and actions taken by governments to contain the spread of the virus have impacted our variable rate debt,operations during the year ended December 31, 2017,2020. As consumers prepared for extended stays at home, we enteredexperienced an increase in consumption during the first and second quarters, particularly in our multi-pack products sold through grocery and mass retailer channels. Conversely, we experienced lower consumption of single-serve products, often consumed away from home. This trend has moderated during the remainder of the year; however, we cannot predict if these trends will sustain or reverse in future periods.
We have established a COVID-19 task force to monitor the rapidly evolving situation and recommend risk mitigation actions as deemed necessary. To date, we have experienced minimal disruption to our supply chain or distribution network, including the supply of our ingredients, and packaging or other sourced materials, though it is possible that more significant disruptions could occur if the COVID-19 pandemic continues to impact markets around the world. We are also working closely with all of our contract manufacturers, distributors and other external business partners. As a food producer, we are an essential service and our production and distribution facilities continue to operate. To protect our employees and ensure continuity of operations, we have implemented additional safety and sanitation measures in all of our facilities. We are monitoring our employees’ health and providing additional resources and protocols to enable effective social distancing and adherence to our stringent internal
food safety guidelines, industry best practices and evolving CDC and other governmental guidelines. Although our corporate headquarters and other offices have remained open with additional safety and sanitation protocols, many non-production and warehouse team members, including sales, marketing and corporate employees, are adhering to social distancing guidelines by working from home and reducing person-to-person contact while supporting our ability to bring products to consumers.
We have adequate liquidity to pay for the costs associated with these additional measures while servicing our on-going operating and capital needs. However, we continue to actively monitor and will take action, as necessary, to preserve adequate liquidity and ensure that our business can continue to operate in this dynamic environment.
On March 27, 2020, the Coronavirus Aid, Relief, and Economic Security (“CARES”) Act was signed into an interest rate swap contract withlaw. The CARES Act provided a counter partysubstantial stimulus and assistance package intended to make a seriesaddress the impact of payments based on a fixed interest ratethe COVID-19 pandemic, including tax relief and government loans, grants and investments. Under the provisions of 1.78%this act, we were able to defer the payment of $5.6 million of 2020 employer payroll taxes until 2021. Apart from this deferral and receive a series of payments basedtheir impact on the greater of LIBOR or 0.75%. Bothgeneral economy, including the fixedlabor market and floating payment streams are basedconsumer demand, neither the CARES Act nor any other government program intended to address COVID-19 had any material impact on a notional amount of $500 million at the inception of the contract and will be reduced by $100 million each year of the five year contract.
On November 20, 2017 and May 19, 2017, our first lien term loan was amended resulting in a decrease of 0.25% and 0.50%, respectively, to the margin applied to our variable rate. The maturity date of August 3, 2022 remained unchanged.
Seasonality
Sweet baked goods revenues tend to be moderately seasonal, with declines during the early winter period, which we believe are attributable to altered consumption patterns during the holiday season. We expect this trend to continue and continue to be applicable to our business. We strive to mitigate the seasonality by running certain targeted promotional campaigns.
Note on Financial Presentation
As a result of the completion of the Business Combination on November 4, 2016, our Consolidated Financial Statements included elsewhere in the Annual Report are presented: (i) as of December 31, 2017 andconsolidated financial statements for the year ended December 31, 2017 (Successor); (ii)2020. We continue to monitor any effects that may result from the CARES Act and other stimulus programs.
Acquisition
On January 3, 2020, we completed the acquisition of all of the shares of the parent company of Voortman Cookies Limited (“Voortman”), a manufacturer of premium, branded wafers and cookies as well as sugar-free products. By adding the Voortman® brand, we believe we have greater growth opportunities provided by a more diverse portfolio of brands and products. Our consolidated statement of operations includes the operation of these assets from January 3, 2020 through December 31, 2020. In December 2020, we asserted claims for indemnification against the sellers under the terms of the Share Purchase Agreement pursuant to which we acquired Voortman for an aggregate of approximately $90 million Canadian Dollar (“CAD”) in damages arising out of alleged breaches by the sellers of certain representations, warranties and covenants contained in such agreement relating to periods prior to the closing of the acquisition. We have also submitted claims relating to these alleged breaches under the representation and warranty insurance policy we purchased in connection with the acquisition. Such insurance policy has a coverage limit of $42.5 million CAD. Although we strongly believe that our claims are meritorious, no assurance can be given as to whether we will recover all, or any part, of the amounts for which we have made such claims. No gains or receivables have been recognized related to these claims as of December 31, 20162020.
Disposition
On August 30, 2019, we sold the In-Store Bakery operations, including relevant trademarks and forlicensing agreements, to an unrelated party. The In-Store Bakery operations provided products that were primarily sold in the period November 4, 2016in-store bakery section of the U.S. retail channels under the Superior on Main® brand or store-branded. We divested the operations to December 31, 2016 (Successor); (iii) forfocus more on future investment in areas of our business that better leverage our core competencies.
Change in Fair Value of Warrant Liabilities
During the period January 1, 2016 to November 3, 2016 (Predecessor); and (iv) for the yearyears ended December 31, 2015 (Predecessor). For comparative purposes, we also present supplemental unaudited pro forma combined Statements of Operations for the year ended December 31, 20162020, 2019 and 2018, there were fluctuations in the table belowmarket price of our publicly traded warrants. These fluctuations created significant gains and losses on the discussion that follows. See “-Supplemental Unaudited Pro Forma Combined Financial Information.”remeasurement of certain warrants which are recognized as liabilities measured at fair value on our consolidated balance sheet. These remeasurements are recognized as “change in fair value of warrant liabilities” within other expenses on our consolidated statement of operations.
Results of Operations
Comparison of Results of Operations for the Year Ended December 31, 2017 (Successor), From November 4, 2016 through December 31, 2016 (Successor), From January 1, 2016 through November 3, 2016 (Predecessor) and the Year Ended December 31, 2015 (Predecessor)
|
| | | | | | | | | | | | | | | | | | | | | | | | | | | | |
| | | | | | | | | | | |
| | 2017 | | 2016 | | | | 2015 |
(In thousands, except share and per share data) | Year Ended December 31 | | %
of Net Revenues | | From November 4 through December 31 | | %
of Net Revenues | | | From January 1 through November 3 | | %
of Net Revenues | | Year Ended December 31 | | %
of Net Revenues |
| | (Successor) | | | | (Successor) | | | | | (Predecessor) | | | | (Predecessor) | | |
| Net revenue | $ | 776,188 |
| | 100.0 | % | | $ | 111,998 |
| | 100.0 | % | | | $ | 615,588 |
| | 100.0 | % | | $ | 620,815 |
| | 100.0 | % |
| Cost of goods sold | 449,290 |
| | 57.9 |
| | 73,284 |
| | 65.4 |
| | | 346,864 |
| | 56.3 |
| | 355,963 |
| | 57.3 |
|
| Special employee incentive compensation | — |
| | — |
| | — |
| | — |
| | | 2,195 |
| | 0.4 |
| | 2,649 |
| | 0.4 |
|
| Gross profit | 326,898 |
| | 42.1 |
| | 38,714 |
| | 34.6 |
| | | 266,529 |
| | 43.3 |
| | 262,203 |
| | 42.2 |
|
| Operating costs and expenses: | | | | | | | — |
| | | | | — |
| | | | — |
|
| Advertising and marketing | 33,004 |
| | 4.3 |
| | 5,245 |
| | 4.7 |
| | | 30,626 |
| | 5.0 |
| | 31,967 |
| | 5.1 |
|
| Selling expense | 32,086 |
| | 4.1 |
| | 5,033 |
| | 4.5 |
| | | 25,730 |
| | 4.2 |
| | 29,484 |
| | 4.7 |
|
| General and administrative | 52,943 |
| | 6.8 |
| | 7,322 |
| | 6.5 |
| | | 38,391 |
| | 6.2 |
| | 31,531 |
| | 5.1 |
|
| Special employee incentive compensation | — |
| | — |
| | — |
| | — |
| | | 2,503 |
| | 0.4 |
| | 1,274 |
| | 0.2 |
|
| Amortization of customer relationships | 23,855 |
| | 3.1 |
| | 3,922 |
| | 3.5 |
| | | 1,185 |
| | 0.2 |
| | 851 |
| | 0.1 |
|
| Impairment on property and equipment | 1,003 |
| | 0.1 |
| | — |
| | — |
| | | 7,300 |
| | 1.2 |
| | 2,700 |
| | 0.4 |
|
| Loss on sale/abandonment of property and equipment, and bakery shutdown costs (recoveries) | (144 | ) | | — |
| | — |
| | — |
| | | 2,551 |
| | 0.4 |
| | 4,182 |
| | 0.7 |
|
| Business combination transaction costs | — |
| | — |
| | — |
| | — |
| | | 31,832 |
| | 5.2 |
| | — |
| | — |
|
| Related party expenses | 381 |
| | — |
| | 26,799 |
| | 23.9 |
| | | 3,539 |
| | 0.6 |
| | 4,306 |
| | 0.7 |
|
| Tax receivable agreement liability remeasurement | (50,222 | ) | | (6.5 | ) | | — |
| | — |
| | | — |
| | — |
| | — |
| | — |
|
| Total operating costs and expenses | 92,906 |
| | 12.0 |
| | 48,321 |
| | 43.1 |
| | | 143,657 |
| | 23.3 |
| | 106,295 |
| | 17.1 |
|
| Operating income | 233,992 |
| | 30.1 |
| | (9,607 | ) | | (8.6 | ) | | | 122,872 |
| | 20.0 |
| | 155,908 |
| | 25.1 |
|
| Other expense: | | | | | | | — |
| | | | |
|
| | | |
|
|
| Interest expense, net | 39,174 |
| | 5.0 |
| | 6,649 |
| | 5.9 |
| | | 60,384 |
| | 9.8 |
| | 50,011 |
| | 8.1 |
|
| Loss (gain) on modification of debt | 2,554 |
| | 0.3 |
| | (763 | ) | | (0.7 | ) | | | — |
| | — |
| | 25,880 |
| | 4.2 |
|
| Other expense (income) | 1,360 |
| | 0.2 |
| | 754 |
| | 0.7 |
| | | 1,624 |
| | 0.3 |
| | (8,743 | ) | | (1.4 | ) |
| Total other expense | 43,088 |
| | 5.6 |
| | 6,640 |
| | 5.9 |
| | | 62,008 |
| | 10.1 |
| | 67,148 |
| | 10.8 |
|
| Income before income taxes | 190,904 |
| | 24.6 |
| | (16,247 | ) | | (14.5 | ) | | | 60,864 |
| | 9.9 |
| | 88,760 |
| | 14.3 |
|
| Income tax expense (benefit) | (67,204 | ) | | (8.7 | ) | | (7,762 | ) | | (6.9 | ) | | | 439 |
| | 0.1 |
| | — |
| | — |
|
| Net income (loss) | 258,108 |
| | 33.3 |
| | (8,485 | ) | | (7.6 | ) | | | 60,425 |
| | 9.8 |
| | 88,760 |
| | 14.3 |
|
| Less: Net income attributable to the non-controlling interest | 34,211 |
| | 4.4 |
| | (4,081 | ) | | (3.6 | ) | | | 3,214 |
| | 0.5 |
| | — |
| | — |
|
| Net income attributable to Class A shareholders | $ | 223,897 |
| | 28.8 | % | | $ | (4,404 | ) | | (3.9 | )% | | | $ | 57,211 |
| | 9.3 | % | | $ | 88,760 |
| | 14.3 | % |
| | | | | | | | | | | | | | | | | |
| Earnings per Class A share: | | | | | | | | | | | | | | | | |
| Basic | $ | 2.26 |
| | | | $ | (0.05 | ) | | | | | | | | | | | |
| Diluted | $ | 2.13 |
| | | | $ | (0.05 | ) | | | | | | | | | | | |
| | | | | | | | | | | | | | | | | |
| Weighted-average shares outstanding: | | | | | | | | | | | | | | | | |
| Basic | 99,109,629 |
| | | | 97,791,658 |
| | | | | | | | | | | |
| Diluted | 105,307,293 |
| | | | 97,791,658 |
| | | | | | | | | | | |
As discussed above, the financial information presented herein for periods prior to the completion of the Business Combination is of our accounting Predecessor, Hostess Holdings, and, for periods from and after the Business Combination, is of Hostess Brands, Inc.
The financial information for the year ended December 31, 2016 is divided into Predecessor and Successor periods and is not comparable to the full year ended December 31, 2017 (Successor) and the full year ended December 31, 2015 (Predecessor). Accordingly, such periods are presented on a historical stand-alone basis without comparison. In addition, we have presented comparative results of operations for the year ended December 31, 2017 (Successor) compared to the pro forma combined year ended December 31, 2016 and of such pro forma combined year ended December 31, 2016 compared to the year ended December 31, 2015 (Predecessor).
| | | | | | | | | | | | | | | | | |
| (As Restated) |
(In thousands, except per share data) | Year Ended
December 31,
2020 | | Year Ended
December 31,
2019 | | Year Ended
December 31,
2018 |
| Net revenue | $ | 1,016,609 | | | $ | 907,675 | | | $ | 850,389 | |
| | | | | |
| | | | | |
| Gross profit | 355,639 | | | 299,834 | | | 267,277 | |
| As a % of net revenue | 35.0 | % | | 33.0 | % | | 31.4 | % |
| | | | | |
| | | | | |
| | | | | |
| | | | | |
| | | | | |
| | | | | |
| | | | | |
| | | | | |
| | | | | |
| | | | | |
| | | | | |
| | | | | |
| Operating costs and expenses | $ | 220,329 | | | $ | 163,738 | | | $ | 145,719 | |
| Operating income | 135,310 | | | 136,096 | | | 121,558 | |
| | | | | |
| | | | | |
| | | | | |
| | | | | |
| | | | | |
| Other (income) expense | 6,608 | | | 100,455 | | | (51,978) | |
| | | | | |
| Income tax expense | 20,405 | | | 16,892 | | | 12,954 | |
| Net income | 108,297 | | | 18,749 | | | 160,582 | |
| | | | | |
| Net income attributable to Class A shareholders | 104,676 | | | 4,299 | | | 142,051 | |
| | | | | |
| Earnings per Class A share: | | | | | |
| Basic | 0.84 | | | 0.04 | | | 1.42 | |
| Diluted | 0.51 | | | 0.04 | | | 0.61 | |
| | | | | |
Results for the Year Ended December 31, 2017 (Successor)2020 Compared to Results for the Year Ended December 31, 2019
Net Revenue Cost of Goods Sold and Gross Profit
Net revenue was $776.2 million for the year ended December 31, 2017 (Successor), with cost of goods sold of $449.3 million and gross profit of $326.92020 increased $108.9 million, or 42.1% as a percentage12.0%, compared to the year ended December 31, 2019. Excluding In-Store Bakery, net revenue increased $137.6 million or 15.7%. The acquisition of Voortman contributed $96.2 million of net revenue. The remaining increase was attributed to higher volume of Hostess® branded multi-pack and bagged-donut products due to strong demand partially offset by lower sales of private label and non-Hostess® branded products. From a sales channel perspective, strong growth in the grocery, convenience and dollar channels was offset by lower sales in the mass channel.
NetGross Profit
Gross profit was 35.0% of net revenue for the Sweet Baked Goods segment was $733.8 million for the year ended December 31, 2017 (Successor), with2020, an increase of 195 basis points from a gross profitmargin of $316.9 million, or 43.2% of net revenue, while net revenue for the In-Store Bakery segment was $42.4 million33.0% for the year ended December 31, 2017, with gross profit of $10.0 million, or 23.6% of net revenue.2019. The increase resulted primarily from the accretion from Voortman and efficiencies from higher sales volume as well as lower promotional activity. These benefits were partially offset by higher operating costs due to COVID-19.
Operating Costs and Expenses
AdvertisingOperating costs and Marketing, Selling Expense, and General and Administrative
For the year ended December 31, 2017, advertising and marketing expenses were $33.0 million, selling expenses were $32.1 million, while general and administrative expenses were $52.9 million.
Amortization of Customer Relationships
Amortization of customer relationships was $23.9 million for the year ended December 31, 2017.
Impairment, Loss on Sale/Abandonment of Property and Equipment, and Bakery Shutdown Costs
During2020 increased by 34.6% from the year ended December 31, 2017, we idled2019. These costs increased primarily due to transition costs incurred to shift Voortman from a production line in our Columbus, Georgia facility and transitioned the productiondirect-to-store delivery operating model to a third party. We recognizeddirect-to-warehouse model including contract termination costs for the independent distributors and severance costs, as well as normal costs of Voortman's continuing operations. 2020 operating costs also increased due to higher employee incentive compensation and an impairment losscharge related to the planned disposition of $1.0 million.
Related Party Expenses
Related party expenses were $0.4production equipment. 2019 operating costs reflect a $7.1 million forgain on the year ended December 31, 2017. These expenses represent payments madevaluation of a foreign currency contract originated to Mr. Metropoulos underhedge the termsJanuary 2020 purchase of his employment arrangements.
Tax Receivable Agreement Liability Remeasurement
For the year ended December 31, 2017, we adjusted the value of the Tax Receivable Agreement due to a lower projected future cash tax savings rate as a result of the Tax Cuts and Jobs Act. This adjustment resultedVoortman in a gain of $51.8 million. A similar adjustment was made due to a change in a state tax law and resulted in a loss of $1.6 million.Canadian dollars.
Operating Income
Operating income for the year ended December 31, 20172020 was $234.0 million.
Interest Expense, net
Our interest expense was $39.2$135.3 million compared to $136.1 million for the year ended December 31, 2017.2019. The additional profits from Voortman's operations and higher Hostess® branded sales volume were offset by transition costs to shift Voortman to a warehouse model and lapping the prior year gain on remeasurement of the foreign currency contract.
LossOther Expense
For the years ended December 31, 2020 and 2019, interest expense related to our term loan was $41.8 million and $43.3 million, respectively. Also during the years ended December 31, 2020 and 2019 we recognized a $39.9 million gain and a $58.8 million loss, respectively, on Modificationthe fair value remeasurement of debt
our liability-classified public and private placement warrants. During the year ended December 31, 2017,2020 we expensed $1.6 million of previously capitalized debt financing charges for a total loss of $2.6 million. The remaining loss of $1.0 million wasalso recognized unrealized losses related to the May and November 2017 repricing transactions. See Note 1- “Summaryremeasurement of Significant Accounting Policies” to the consolidated financial statements included in Part II, Item 8 of this Annual Report on Form 10-K.certain CAD denominated liabilities.
Income Taxes
The incomeOur effective tax benefit of $67.2 millionrate was 15.9% for the year ended December 31, 2017 includes a benefit of approximately $111.3 million due2020 compared to a revaluation of our deferred tax liability to reflect lower future U.S. corporate income tax rates caused by the Tax Cuts and Jobs Act. The tax provision also includes a $1.7 million expense caused by a change in state tax rates. The remaining tax expense of $42.4 million represents an effective tax rate of 30.1%, giving effect to the non-controlling interest, a partnership47.4% for income tax purposes and excluding the impact of the remeasurement of the tax receivable agreement.
Net Income
For the year ended December 31, 2017,2019. The decrease in the Company hadeffective tax rate was due to the remeasurement of fair value of warrants, which significantly impacts our pre-tax net income, of $258.1 million.
Earnings Per Share
Forbut is not taxed as the year ended December 31, 2017, earnings per class A share was $2.26 (basic) and $2.13 (dilutive).
Resultswarrants are considered equity for the Successor period November 4, 2016 through December 31, 2016 and Predecessor period January 1, 2016 through November 3, 2016
Net Revenue
Net revenues in the Successor period from November 4, 2016 through December 31, 2016 were $112.0 million, compared to $615.6 million for the Predecessor period from January 1, 2016 through November 3, 2016. During the Predecessor period, we acquired Superior on May 10, 2016 and reported net revenues of $19.9 million from Superior from the date of acquisition through November 3, 2016. During the Successor period, the net revenues for Superior were $6.8 million.
Cost of Goods Sold
In the Successor period, as a result of the Business Combination, we recorded a one-time inventory fair value step-up of $8.9 million that was charged to cost of goods sold.tax purposes. Excluding the impact of the inventory fair value step-up, cost of goods soldwarrant remeasurement for both the years ended December 31, 2020 and 2019, our effective tax rates were 23.0% and 17.9%, respectively. The increase in the Successor period would have been 57.5% of net revenues.
Special Employee Incentive Compensation
Foreffective tax rate (excluding the Predecessor period January 1, 2016 through November 3, 2016, we made a special bonus payment to certain employees at our bakery facilities as compensation for their efforts in connection with the Business Combination. Payment of $2.2 million of this special bonuswarrant remeasurements) was recorded as a separate line item reducing gross profit.
Gross Profit
For the Predecessor period January 1, 2016 through November 3, 2016, gross profit, including the effect of the special employee incentive compensation discussed above, was $266.5 million, or 43.3% of net revenue. Excluding this item, gross profit would have been $268.7 million, or 43.7% of net revenue.
For the Successor period November 4, 2016 through December 31, 2016, gross profit was $38.7 million, or 34.6% of net revenue. Excluding the impact of the inventory fair value step up discussed above, adjusted gross margin for the Successor period was 42.5% of net revenue. Adjusted gross margin for the Successor period compared to the gross margin for the Predecessor period declined slightly due to overall changes in mix of products sold.
Operating Costs and Expenses
Advertising and Marketing
For the Predecessor period January 1, 2016 through November 4, 2016, advertising and marketing expenses were $30.6 million, or 5.0% of net revenue.
For the Successor period November 4, 2016 through December 31, 2016, advertising and marketing expenses were $5.2 million, or 4.7% in net
revenue.
Advertising and marketing expenses as a percentage of net revenue were lower in the Successor period primarily due to higher field marketing costs in the Predecessor Period.
Selling Expense
For the Predecessor period January 1, 2016 through November 4, 2016, selling expenses were $25.7 million, or 4.2% of net revenue.
For the Successor period November 4, 2016 through December 31, 2016, selling expenses were $5.0 million, or 4.5% in net revenue.
General and Administrative
For the Predecessor period January 1, 2016 through November 4, 2016, general and administrative expenses were $38.4 million, or 6.2%, of net revenue.
For the Successor period November 4, 2016 through December 31, 2016, general and administrative expenses were $7.3 million, or 6.5% of net revenue.
Special Employee Incentive Compensation
For the Predecessor period January 1, 2016 through November 3, 2016, we paid a special bonus payment of $2.5 million to certain corporate
employees as compensation for their efforts in connection with the Business Combination. This payment to corporate employees was recorded under operating costs and expenses.
Amortization of Customer Relationships
For the Predecessor period January 1, 2016 through November 3, 2016, amortization of customer relationships was $1.2 million, or 0.2% of net revenue.
For the Successor period November 4, 2016 through December 31, 2016, amortization of customer relationships was $3.9 million, or 3.5% of net revenue.
Amortization of customer relationships in the Successor period was significantly higher than in the Predecessor period primarily due to the higher fair value measurement at November 4, 2016Class B for Class A share exchanges during 2019 and 2020. Subsequent to these exchanges, more income from Hostess Holdings, L.P was allocated to Hostess Brands, Inc. This increase was partially offset by state tax credits generated in 2020.
Net Income
For the year ended December 31, 2020, net income was $108.3 million compared to $18.7 million for the year ended December 31, 2019. Excluding the $39.9 million gain and $58.8 million loss on remeasurement of warrant liabilities for the years ended December 31, 2020 and 2019, respectively, net income increased as a result of the Business Combination comparedhigher gross margin due to the overall fair valueaccretion of Voortman and the customer relationships in the Predecessor period. There were no significant changes in the naturebenefit of the customer relationships, including overall useful lives in the comparative periods.
Impairment of Property and Equipment
For the Predecessor period January 1, 2016 through November 3, 2016, impairment of property and equipment was $7.3 million, or 1.2% of net revenue. During the Predecessor period, we closed multiple production lines at our Indianapolis, Indiana bakery, and transitioned production to other facilities.
There were no such impairments in the Successor period November 4, 2016 through December 31, 2016.
Loss on Sale/Abandonment of Property and Equipment and Bakery Shutdown Costs
For the Predecessor period January 1, 2016 through November 3, 2016, we recorded a charge for loss on sale/abandonment of property and bakery shutdown costs of $2.6 million, or 0.4% of net revenue, primarily due to utilities, insurance, taxes and maintenance expenses related to the Schiller Park, Illinois bakery.
For the Successor period November 4, 2016 through December 31, 2016, there were no such charges.
Business Combination Transaction Costs
For the Predecessor period January 1, 2016 through November 3, 2016, business combination transaction costs were $31.8 million, or 5.2% of net revenue. This consisted of professional and legal costs associated with the Business Combination, and transactional costs attributable to the acquisition of Superior in May 2016.
For the Successor period November 4, 2016 through December 31, 2016, there were no such charges.
Related Party Expenses
For the Predecessor period January 1, 2016 through November 3, 2016, related party expenses were $3.5 million, or 0.6% of net revenue. These amounts represent the normal annual cash payments associated with our employment arrangements with Mr. Metropoulos as Chief Executive Officer and/or Executive Chairman.
For the Successor period November 4, 2016 through December 31, 2016, the Company expensed $26.8 million, or 23.9% of net revenue, as a result of a grant of stock awarded to Mr. Metropoulos as required under his new employment arrangements.
Operating Income (Loss)
For the Predecessor period January 1, 2016 through November 3, 2016, total operating costs and expenses were $143.7 million, or 23.3% of net revenue, and operating income was $122.9 million, or 20.0% of net revenue.
For the Successor period November 4, 2016 through December 31, 2016, total operating costs and expenses were $48.3 million, or 43.1% of net revenue, and operating loss was $9.6 million or 8.6% of net revenue.
Operating loss for the Successor period was significantly impacted by the related party expense discussed above.
Interest Expense, net
For the Predecessor period January 1, 2016 through November 3, 2016, interest expense, net was $60.4 million, or 9.8% of net revenue. For the Successor period November 4, 2016 through December 31, 2016, interest expense, net was $6.6 million, or 5.9% of net revenue.
The lower interest expense in the Successor period is a result of the reduced applicable interest rates following the debt refinancing discussed below.
Gain on Debt Extinguishment
For the Successor period November 4, 2016 through December 31, 2016, in connection with the refinancing of existing debt with the new first lien term loan we recorded a net gain on a partial extinguishment of debt in the amount of $0.8 million. The gain consisted of the write-off of approximately $4.0 million of debt premium and deferred financing costs,higher Hostess® branded sales volume partially offset by prepayment penalties of $3.0costs incurred to transition Voortman DSD to warehouse distribution. In 2020, we also lapped the $7.1 million foreign currency contract remeasurement gain in 2019.
Earnings Per Share
Our earnings per Class A share was $0.84 (basic) and $0.51 (dilutive) for the write-off of deferred financing costs of $0.2 million.
Other Expense
For the Predecessor period January 1, 2016 through November 3, 2016, other expense was $1.6 million, or 0.3% of net revenue. This consisted of professional and transactional costs for acquisition activity which has since been abandoned, partially offset by a gain from the settlement in connection with product recall matter with one of our suppliers of approximately $0.8 million.
For the Successor period November 4, 2016 through year ended December 31, 2016, other expense was $0.8 million, or 0.7% of net revenue.
Income (Loss) Before Income Taxes
For2020, compared to $0.04 (basic) and $0.04 (dilutive) for the Predecessor period January 1, 2016 through November 3, 2016, income before income taxes was $60.9 million, or 9.9% of net revenue.
For the Successor period November 4, 2016 through year ended December 31, 2016, loss before income taxes2019. The increase in basic and diluted earnings per share was $16.2 million or 14.5% of net revenue.
Income Tax Expense
For the Predecessor period January 1, 2016 through November 3, 2016, the Company was a series of limited liability companies and, therefore, had no tax expense or benefit, except insignificant amounts for Superior, a C corporation.
For the Successor period November 4, 2016 through December 31, 2016, income tax benefit was $7.8 million or 6.9% of net revenue. This represented an effective tax rate of 47.8% which exceeds the statutory rates primarily due to the reversal of a previously recorded valuation allowance.net income impacts noted above.
Results for the Year Ended December 31, 2015 (Predecessor)
Net Revenue, Gross Profit and Cost of Goods Sold
Net revenue was $620.8 million for the year ended December 31, 2015, with cost of goods sold of $356.0 million, and gross profit of $264.9 million, excluding the impact of a $2.6 million special employee incentive compensation payment. Cost of goods sold was impacted by higher ingredient costs due2019 Compared to an outbreak of avian influenza which led to reduced availability of eggs, which increased egg ingredient prices to record high levels.
Special Employee Incentive Compensation
For the year ended December 31, 2015, a special bonus payment was paid to employees at our bakery facilities as compensation for their efforts in the recapitalization of our Company of which $2.6 million was recorded on a separate line in our Consolidated Statements of Operations as a deduction from gross profit.
Operating Costs and Expenses
Advertising and Marketing
Advertising and marketing expenses were $32.0 million, selling expenses were $29.5 million, and general and administrative expenses were $31.5 million for the year ended December 31, 2015.
Special Employee Incentive Compensation
For the year ended December 31, 2015, a special bonus payment of $1.3 million was paid to corporate employees as compensation for their efforts in the recapitalization of the Company.
Amortization of Customer Relationships
Amortization of customer relationships was $0.9 million for the year ended December 31, 2015.
Loss on Sale/Abandonment of Property and Equipment and Bakery Shutdown Costs
For the year ended December 31, 2015, we incurred a loss on sale/abandonment of property and equipment and bakery shutdown costs of $4.2 million.
Related Party Expenses
Related party expenses were $4.3 million for the year ended December 31, 2015. Mr. Metropoulos serves as our Executive Chairman and expenses associated with his employment agreements are recorded in related party expenses.
Operating Income (Loss)
For the year ended December 31, 2015, total operating costs and expenses were $106.3 million. Operating income was $155.9 million for the year ended December 31, 2015.
Interest Expense, net
Interest expense for the year ended December 31, 2015 was 50.0 million.
Loss on Debt Extinguishment
We extinguished the Term Loan dated April 9, 2013 (the “2013 Term Loan”) through early principal payments of $343.8 million and $150.0 million on August 3, 2015 and June 4, 2015, respectively. As part of this debt extinguishment and in accordance with its contractual terms, we expensed 2% prepayment penalties of $9.9 million, as well as $16.0 million of amortization to write-off the remaining deferred financing costs. For the year ended December 31, 2015, the total loss on debt extinguishment was $25.9 million.
Other Income
For the year ended December 31, 2015, other income consisted of $12.0 million of proceeds from the sale of foreign trademark rights and certain “know how” in certain countries in the Middle East, partially offset by $3.3 million for professional service fees related to the pursuit of potential sale transactions.
Income Taxes
For the year ended December 31, 2015, the Company was a series of limited partnerships and, therefore, had no income tax expense or benefit.
Supplemental Unaudited Pro Forma Combined Financial Information
For comparative purposes, we are presenting a supplemental unaudited pro forma combined statement of operations for the year ended December 31, 2016, and we discuss such pro forma combined results compared to the Successor’s full year 2017, and the Predecessor’s full year 2015 results below.
The unaudited pro forma combined statements of operations for the year ended December 31, 2016 presents our consolidated results of operations giving pro forma effect to the Business Combination as if it had occurred as of January 1, 2016. The pro forma combined adjustments are based on available information and upon assumptions that our management believes are reasonable in order to reflect, on a pro forma combined basis, the impact of these transactions on the historical financial information of our Predecessor and Successor entities, as applicable.
The Business Combination was accounted for using the acquisition method of accounting. The final fair values of the acquired assets and assumed liabilities as of the Closing Date, which are based on the consideration paid and our estimates and assumptions, are reflected herein. As explained in more detail in Note 2 in the accompanying Notes to the Consolidated Financial Statements, the total purchase price to acquire Hostess Holdings has been allocated to the assets acquired and assumed liabilities of Hostess Holdings, based upon the fair values at the Closing Date. We utilized third-party valuation specialists to assist our management in determining the fair values of the acquired assets and liabilities assumed. As of November 3, 2017, management determined that the allocation of the purchase price for the Business Combination is final.
The unaudited pro forma combined financial information contains a variety of adjustments, assumptions and estimates, is subject to numerous other uncertainties and the assumptions and adjustments as described in the accompanying notes hereto and should not be relied upon as being indicative of our results of operations had the Business Combination occurred on January 1, 2016. The unaudited pro forma combined financial information also does not project our results of operations for any future period or date. The unaudited pro forma combined financial information for the year ended December 31, 2016 includes results of the Superior acquisition and its related operations from May 10, 2016, the date of acquisition, through December 31, 2016. We evaluated the impact of the Superior acquisition on the Company’s financial statements and concluded that the impact was not significant and did not require nor separately warrant the inclusion of pro forma combined financial results assuming the acquisition of Superior at January 1, 2016 under applicable SEC rules and regulations or under GAAP. In addition, we evaluated the impact of the refinancing of existing debt pursuant to the New First Lien Term Loan, completed on November 18, 2016, and concluded that the impact was not significant and did not require nor separately warrant the inclusion of pro forma combined financial results assuming the completion of the refinancing on January 1, 2016. The pro forma combined adjustments give effect to the items identified in the pro forma combined table below in connection with the Business Combination.
Results of Operations
Comparison of Results of Operations for the Year Ended December 31, 2017 (Successor), Unaudited Pro Forma Combined Year Ended December 31, 2016, and the Year Ended December 31, 2015 (Predecessor)
|
| | | | | | | | | | | | | | | | | | | | | | | | | | | |
| | | | Historical(i) | | | | | | | | |
| | 2017 | | 2016 | | | | 2016 | | | | 2015 |
(In thousands, except share and per share data) | Year Ended December 31 | | From November 4 through December 31 | | | From January 1 through November 3 | | Pro Forma Adjustments | | (Unaudited) Year Ended December 31 | | % of Net Revenues | | Year Ended December 31 |
| | (Successor) | | (Successor) | | | (Predecessor) | | | | Pro Forma
Combined | | | | (Predecessor) |
| Net revenue | $ | 776,188 |
| | $ | 111,998 |
| | | $ | 615,588 |
| | $ | — |
| | $ | 727,586 |
| | 100.0 | % | | 620,815 |
|
| Cost of goods sold | 449,290 |
| | 73,284 |
| | | 346,864 |
| | (8,541 | ) | ii | 411,607 |
| | 56.6 |
| | 355,963 |
|
| Special employee incentive compensation | — |
| | — |
| | | 2,195 |
| | (2,195 | ) | iii | — |
| | — |
| | 2,649 |
|
| Gross profit | 326,898 |
| | 38,714 |
| | | 266,529 |
| | 10,736 |
| | 315,979 |
| | 43.4 |
| | 262,203 |
|
| Operating costs and expenses: | | | | | | | | | | | | — |
| | |
| Advertising and marketing | 33,004 |
| | 5,245 |
| | | 30,626 |
| | — |
| | 35,871 |
| | 4.9 |
| | 31,967 |
|
| Selling expense | 32,086 |
| | 5,033 |
| | | 25,730 |
| | — |
| | 30,763 |
| | 4.2 |
| | 29,484 |
|
| General and administrative | 52,943 |
| | 7,322 |
| | | 38,391 |
| | (3,902 | ) | iv | 41,811 |
| | 5.7 |
| | 31,531 |
|
| Special employee incentive compensation | — |
| | — |
| | | 2,503 |
| | (2,503 | ) | iii | — |
| | — |
| | 1,274 |
|
| Amortization of customer relationships | 23,855 |
| | 3,922 |
| | | 1,185 |
| | 20,050 |
| v | 25,157 |
| | 3.5 |
| | 851 |
|
| Impairment on property and equipment | 1,003 |
| | — |
| | | 7,300 |
| | — |
| | 7,300 |
| | 1.0 |
| | 2,700 |
|
| Loss on sale/abandonment of property and equipment, and bakery shutdown costs (recoveries) | (144 | ) | | — |
| | | 2,551 |
| | — |
| | 2,551 |
| | 0.4 |
| | 4,182 |
|
| Business combination transaction costs | — |
| | — |
| | | 31,832 |
| | (31,257 | ) | vi | 575 |
| | 0.1 |
| | — |
|
| Related party expenses | 381 |
| | 26,799 |
| | | 3,539 |
| | (26,747 | ) | vii | 3,591 |
| | 0.5 |
| | 4,306 |
|
| Tax receivable agreement liability remeasurement | (50,222 | ) | | — |
| | | — |
| | — |
| | — |
| | — |
| | — |
|
| Total operating costs and expenses | 92,906 |
| | 48,321 |
| | | 143,657 |
| | (44,359 | ) | | 147,619 |
| | 20.3 |
| | 106,295 |
|
| Operating income | 233,992 |
| | (9,607 | ) | | | 122,872 |
| | 55,095 |
| | 168,360 |
| | 23.1 |
| | 155,908 |
|
| Other expense: | | | | | | | | | | | | — |
| | |
| Interest expense, net | 39,174 |
| | 6,649 |
| | | 60,384 |
| | (15,592 | ) | viii | 51,441 |
| | 7.1 |
| | 50,011 |
|
| Loss (gain) on modification of debt | 2,554 |
| | (763 | ) | | | — |
| | — |
| | (763 | ) | | (0.1 | ) | | 25,880 |
|
| Other expense | 1,360 |
| | 754 |
| | | 1,624 |
| | — |
| | 2,378 |
| | 0.3 |
| | (8,743 | ) |
| Total other expense | 43,088 |
| | 6,640 |
| | | 62,008 |
| | (15,592 | ) | | 53,056 |
| | 7.3 |
| | 67,148 |
|
| Income before income taxes | 190,904 |
| | (16,247 | ) | | | 60,864 |
| | 70,687 |
| | 115,304 |
| | 15.8 |
| | 88,760 |
|
| Income tax expense (benefit) | (67,204 | ) | | (7,762 | ) | | | 439 |
| | 40,185 |
| ix | 32,862 |
| | 4.5 |
| | — |
|
| Net income (loss) | 258,108 |
| | (8,485 | ) | | | 60,425 |
| | 30,502 |
| | 82,442 |
| | 11.3 |
| | 88,760 |
|
| Less: Net income attributable to the non-controlling interest | 34,211 |
| | (4,081 | ) | | | 3,214 |
| | 29,565 |
| x | 28,698 |
| | 3.9 |
| | 4,507 |
|
| Net income attributable to Class A shareholders | $ | 223,897 |
| | $ | (4,404 | ) | | | $ | 57,211 |
| | $ | 937 |
| | $ | 53,744 |
| | 7.4 | % | | $ | 84,253 |
|
| | | | | | | | | | | | | | | |
| Earnings per Class A share: | | | | | | | | | | | | | | |
| Basic | $ | 2.26 |
| | $ | (0.05 | ) | | | | | | | $ | 0.55 |
| | | | |
| Diluted | $ | 2.13 |
| | $ | (0.05 | ) | | | | | | | $ | 0.54 |
| | | | |
| | | | | | | | | | | | | | | |
| Weighted-average shares outstanding: | | | | | | | | | | | | | | |
| Basic | 99,109,629 |
| | 97,791,658 |
| | | | | (180,000 | ) | xi | 97,611,658 |
| | | | |
| Diluted | 105,307,293 |
| | 97,791,658 |
| | | | | 2,393,000 |
| xii | 100,184,658 |
| | | | |
| |
i. | The amounts in these columns represent the Successor’s and Predecessor’s historical results of operations for the periods reflected. |
| |
ii. | Approximately $8.9 million of this adjustment reflects the non-cash impact of the remeasurement of inventory at fair value as a result of the Business Combination. In addition, the adjustment reflects the incremental depreciation expense associated with the allocation of purchase price to property and equipment and is recorded in cost of goods sold. |
| |
iii. | For cost of goods sold, this adjustment represents special payments we made to certain employees at our bakery facilities of $2.2 million and for the operating costs this adjustment represents special payments to corporate employees of $2.5 million as compensation for their efforts in connection with the Business Combination. |
| |
iv. | Represents compensation for management profits interest plan of approximately $3.9 million that was recognized as part of the Business Combination. See Note 3 to the Consolidated Financial Statements for additional information. |
| |
v. | Represents additional amortization expense associated with the fair value recognized for customer relationships in connection with the Business Combination. |
| |
vi. | This adjustment consists primarily of legal and professional fees, and other costs associated with the Business Combination. |
| |
vii. | Represents non-cash expenses incurred by Successor for stock awarded to Mr. Metropoulos as required under his new employment arrangements. |
| |
viii. | Represents the reduction in interest expense due to the repayment of a portion of Hostess Holdings debt as part of the Business Combination. |
| |
ix. | Represents the effective income tax rate of 28.5% for the Successor, giving effect to the non-controlling interest, and not giving effect to the adjustment made to the valuation allowance on the Company’s historical deferred tax assets. |
| |
x. | Represents the elimination of historical income attributable to the non-controlling interest and attributes a portion of the pro forma income to the non-controlling interest created in the Business Combination. Income is allocated to the non-controlling interest based on its pro rata share of the total equity of Hostess Holdings. |
| |
xi. | This adjustment annualized the basic weighted average number of Class A shares outstanding. |
| |
xii. | This adjustment includes the dilutive impact of the outstanding warrants that are considered anti-dilutive on a historical basis. |
Results for the Year Ended December 31, 2017 compared to the Pro Forma Combined Year Ended December 31, 20162018
Net Revenue
Net revenue was $776.2 million for the year ended December 31, 2017, compared to $727.6 million for the pro forma combined year ended December 31, 2016, an increase of 6.7%, or $48.6 million. Growth in net revenue for the year ended December 31, 2017 from current year new product initiatives was $62.52019 increased $57.3 million, led by Chocolate Cake Twinkies®or 6.7%, Golden Cupcakes, White Fudge Ding Dongs®, and Peanut Butter HoHo’s®. Additionally, there was an $11.9 million increase in net sales attributedcompared to the acquisition of Superior in May 2016. These increases were offset primarily by a decrease in net revenue from 2016 product innovations and discontinued items.
Cost of Goods Sold and Gross Profit
Cost of goods sold for the year ended December 31, 20172018. Excluding the impact of $449.3 million represents an increase of $37.7the In-Store Bakery disposition in 2019, net revenue increased $72.0 million, or 9.2%, from the pro forma combined cost of goods sold of $411.6 million for the year ended December 31, 20168.6%. The increase for the year ended December 31, 2017 from the pro forma combined year ended December 31, 2016 is primarilyin net revenue was attributed to higher shipping costsvolume growth in our core products across multiple customer channels, the introduction of our breakfast innovation products, including Danishes and increased sales volume.Cinnamon Rolls, and the impact of pricing actions implemented in the fourth quarter of 2018.
Gross Profit
Gross profit was $326.9 million for the year ended December 31, 2017, an increase of $10.9 million, or 3.5%, compared to pro forma gross profit of $316.0 million for the year ended December 31, 2016. The increase for the year ended December 31, 2017 from pro forma combined year ended December 31, 2016 was primarily attributed to an increase in sales.
Gross margin was 42.1% for the year ended December 31, 2017, compared to gross margin of 43.4% for the pro forma combined year ended December 31, 2016 . The decrease in margin for the year ended December 31, 2017 from pro forma combined gross margin for the year ended December 31, 2016 was primarily due to higher shipping costs which caused a 70 basis point decrease in gross margin. The decrease in margin was also attributed to a shift in our product mix due to higher growth in multi-pack, club-pack than other pack types, and additional In-Store Bakery sales.
Gross profit for the Sweet Baked Goods segment for the year ended December 31, 2017 was $316.9 million or 43.2% of net revenue, compared to gross profit of $309.8 million, or 44.2% of net revenue, for the pro forma combined year ended December 31, 2016. Gross margin decreased 120 basis points due to higher shipping costs. Gross margin was also affected by a shift in product mix due to higher growth in multi-pack sales than other pack types.
Gross profit for the In-Store Bakery segment for the year ended December 31, 2017 was $10.0 million, or 23.6% of net revenue, compared to pro forma combined gross profit of $6.1 million, or 23.0%33.0% of net revenue for the year ended December 31, 2016.2019, an increase of 160 basis points from a gross margin of 31.4% for the year ended December 31, 2018. Gross profit increased primarily due to increased revenue.in 2019 benefited from pricing actions, higher sales volume and bakery savings initiatives executed across all bakeries, particularly in our Chicago bakery. These benefits were partially offset by higher input costs.
Operating Costs and Expenses
AdvertisingOperating costs and Marketing
Advertising and marketing expenses for the year ended December 31, 20172019 increased by 12.4% from the year ended December 31, 2018. During 2019, we recognized a $7.1 million gain on the valuation of $33.0a foreign currency contract originated to hedge the January 2020 purchase of Voortman in Canadian dollars. During 2018, we recognized a $3.3 million represent a decreaseimpairment charge related to our In-Store Bakery assets, which were sold in August 2019. Excluding these costs, operating costs and expenses increased due to additional expense related to incentive and stock compensation, additional payroll to execute strategic corporate initiatives, transaction costs related the sale of In-Store Bakery and the acquisition of Voortman, and facility transition costs to relocate our primary distribution center as well an increase from pro forma combined advertising and marketing expenses the remeasurement of $35.9 million, or 8.0%the Tax Receivable Agreement.
Operating Income
Operating income for the year ended December 31, 2016 as a result of reduced permanent wire display deployment.
Selling Expense
Selling expense2019 was $32.1$136.1 million or 4.1% of revenue for the year ended December 31, 2017, compared to $30.8 million, or 4.2% of revenue on a pro forma combined basis for the year ended December 31, 2016. The increase in selling expense is reflective of the increase in sales volume during the year.
General and Administrative
General and administrative expenses for the year ended December 31, 2017 of $52.9 million represent an increase of $11.1 million, or 26.6%, over the pro forma combined general and administrative expenses of $41.8$121.6 million for the year ended December 31, 2016.2018. The increase isin operating income was attributed to increased non-cash share-basedhigher sales volume, the impact of pricing actions and bakery operating efficiencies as well as the gain on the foreign currency contract. These increases to operating income were partially offset by higher incentive and stock compensation, transaction and facility transition costs as well an increase from the remeasurement of $7.4the Tax Receivable Agreement.
Other Expense
For the years ended December 31, 2019 and 2018, interest expense related to our term loan was $43.3 million, additional professional and administrative costs$41.3 million, respectively. During the year ended December 31, 2019, we recognized a loss of $3.5$0.5 million duerelated to public company compliance,the refinancing of our term loan. Also during the year ended December 31, 2018, we recognized a $12.4 million gain related to the buyout of the Tax Receivable Agreement. Additionally, during the years ended December 31, 2019 and 2018 we recognized a $58.8 million loss and a $2.0$79.2 million litigation settlement.gain, respectively, on the remeasurement of our liability-classified public and private placement warrants.
Income Taxes
Amortization of Customer Relationships
Amortization of customer relationshipsOur effective tax rate was $23.9 million47.4% for the year ended December 31, 2017,2019 compared to pro forma combined customer relationships amortization of $25.2 million7.5% for the year ended December 31, 2016. For2018. The increase in the yeareffective tax rate was primarily due to the change in fair value of warrants, which significantly impacts our pre-tax net income, but is not taxed. Excluding the impact of the warrant remeasurement for both the years ended December 31, 2016 on a historical basis, amortization expense2019 and 2018, our effective tax rates were 17.9% and 13.7%, respectively. The increase in the effective tax rate (excluding the warrant remeasurement) was based onprimarily due to the valuation of customer relationships acquiredClass B for Class A share exchanges during 2019. Subsequent to these exchanges, more income from Old HBHostess Holdings, L.P. was allocated to Hostess Brands, Inc. in 2013. The amortization expenseeffective tax rate for the year ended December 31, 20172018 reflects the tax impact of the gain on the buyout of the Tax Receivable Agreement and the tax benefit related to revaluing our deferred tax liabilities due to a change in our estimated state tax rate.
Net Income
For the year ended December 31, 2016 on a pro forma combined basis reflects the new valuation of the customer relationships acquired through the Business Combination.
Impairment, Loss on Sale/Abandonment of Property and Equipment, and Bakery Shutdown Costs
During the year ended December 31, 2017, an impairment loss of $1.02019, net income was $18.7 million was recognized when we idled a production line in our Columbus, Georgia facility and transitioned the productioncompared to a third party. During the pro forma combined year ended December 31, 2016, we recorded an impairment of $7.3 million when we closed multiple production lines at the Indianapolis, Indiana bakery and transitioned production to other facilities in preparation to convert the bakery to a nut facility. In addition, we incurred a loss on sale/abandonment of property and equipment, and bakery shutdown costs of $2.6 million primarily due to utilities, insurance, taxes and maintenance expenses related to the Schiller Park, Illinois bakery.
Related Party Expenses
Related party expenses were $0.4$160.6 million for the year ended December 31, 2017 compared to pro forma combined expenses2018.Excluding the $58.8 million loss and $79.2 million gain on remeasurement of $3.6 million warrant liabilities for the yearyears ended December 31, 2016. These expenses represent payments made to Mr. Metropoulos under2019 and 2018, respectively, the terms of his employment arrangements, which changed as part of the Business Combination.
Tax Receivable Agreement Liability Remeasurement
For the year ended December 31, 2017, we adjusted the value of the Tax Receivable Agreement due to a lower projected future cash tax savings rate as a result of the Tax Cuts and Jobs Act. This adjustment resulteddecrease in a gain of $51.8 million. A similar adjustmentnet income was made due to a change in a state tax law and resulted in a loss of $1.6 million.
Operating Income
The $65.6 million increase in operating income from pro forma combined operating income of $168.4 million for the year ended December 31, 2016 to $234.0 million for the year ended December 31, 2017 is primarily attributed to the gain on the remeasurementbuyout of the tax receivable agreement in 2018, partially offset by higher sales volume,operating income in 2019.
Earnings Per Share
Our earnings per class A share was $0.04 (basic) and lower impairment/abandonment costs.
Interest Expense, net
Our interest expense decreased $12.3 million from $51.4 million for the pro forma combined year ended December 31, 2016 to $39.2 million$0.04 (dilutive) for the year ended December 31, 2017 primarily due2019, compared to the pay down of our Second Lien Term Loan in November 2016,$1.42 (basic) and three repricing transactions between November of 2016 and November of 2017 which collectively reduced the effective interest rate on our first lien term loan by 1.25%.
Loss on Modification of debt
During the year ended December 31, 2017, we recognized $2.6 million of losses related to the repricing transactions on our first lien term loan, of which $1.6 million was attributed to previously capitalized charges. See Note 1- “Summary of Significant Accounting Policies” to the consolidated financial statements included in Part II, Item 8 of this Annual Report on Form 10-K.
Income Taxes
The income tax benefit of $67.2 million$0.61 (dilutive) for the year ended December 31, 2017 includes a benefit of approximately $126.4 million due to a revaluation of our deferred tax liability to reflect lower future U.S. corporate income tax rates caused by the Tax Cuts2018. The decrease in basic and Jobs Act (“Tax Reform”). This benefitdiluted earnings per share was partially offset by a tax expense of $15.1 million due to the remeasurement of the tax receivable agreement also due to Tax Reform. The tax provision also includes a $1.7 million expense caused by a change in state tax rates. The remaining tax expense of $42.4 million represents an effective tax rate of 30.1%, giving effect to the non-controlling interest, a partnership for income tax purposes and excluding the impact of the remeasurement of the tax receivable agreement. Income tax expense for the pro forma combined year ended December 31, 2016 was $32.9 million, representing an effective tax rate of 28.5%. After accounting for tax law changes, our effective tax rate for 2017 was higher than the pro forma combined 2016 due to a higher statutory rate for one of the states in which we operate.
Results of Operations for the Pro Forma Combined Year Ended December 31, 2016 compared to the Year Ended December 31, 2015 (Predecessor)
Net Revenue
Net revenue increased $106.8 million, or 17.2%, to $727.6 million, for the pro forma combined year ended December 31, 2016, compared to $620.8 million for the year ended December 31, 2015, primarily due to new product launches in 2016 of $44.0 million and contribution of Superior net revenue of $26.7 million from the date of its acquisition. New products in 2016 included Deep Fried Twinkies®, Hostess Sweet Shop™ brownies, plus the relaunch of Suzy Qs®
Cost of Goods Sold and Gross Profit
Cost of goods sold increased $55.6 million, to $411.6 million, for the pro forma combined year ended December 31, 2016, compared to $356.0 million, for the year ended December 31, 2015, primarily due to the increase in volume.
As a percentage of net revenue, pro forma combined cost of goods sold was 56.6%, compared to 57.3% of net revenue for the year ended December 31, 2015. The decrease in cost of goods sold from the year ended December 31, 2015 to the pro forma combined for the year ended December 31, 2016, is primarily due to higher ingredient costs in 2015. An outbreak of avian influenza in 2015 led to reduced availability of eggs, which increased egg ingredient prices to record high levels.
Pro Forma combined gross profit was $316.0 million for the year ended December 31, 2016, compared to $262.2 million for the year ended December 31, 2015.
Gross margin was 43.4% for the pro forma combined year ended December 31, 2016, compared to historical gross margin of 42.2% for the year ended December 31, 2015. The increase in gross profit was driven primarily by commodity cost decreases and improved bakery costs.
Operating Costs and Expenses
Advertising and Marketing
Advertising and marketing expenses for the year increased 12.2% on a pro forma combined basis for the year ended December 31, 2016, to $35.9 million, compared to $32.0 million for the year ended December 31, 2015. The increase was primarily attributable to planned expansion of field marketing activities.
Selling Expense
Selling expense increased $1.3 million, or 4.3%, to $30.8 million, during the pro forma combined year ended December 31, 2016, compared to $29.5 million for the year ended December 31, 2015, primarily due to increases in sales management expense and broker fees.
General and Administrative
General and administrative expenses increased 32.6%, to $41.8 million, on a pro forma combined basis for the year ended December 31, 2016, compared to $31.5 million for the year ended December 31, 2015. The increase is primarily due to increased incentive compensation related to improved operating performance and the addition of Superior’s operations.
Special Employee Incentive Compensation
A special bonus payment of $1.3 million was paid during the year ended December 31, 2015 to corporate employees as compensation for their efforts in the recapitalization of the Company. There was no special employee incentive compensation for the pro forma combined year ended December 31, 2016.
Amortization of Customer Relationships
Amortization of customer relationships was $25.2 million for the pro forma combined year ended December 31, 2016, compared to $0.9 million, for the year ended December 31, 2015. The increase is primarily due to an increase in intangible assets with definite lives as a result of the Business Combination, as well as the acquisition of Superior during 2016.
Impairment, Loss on Sale/Abandonment of Property and Equipment, and Bakery Shutdown Costs
For the pro forma combined year ended December 31, 2016, we recorded an impairment of $7.3 million. We closed multiple production lines at Indianapolis, Indiana bakery and transitioned production to other facilities resulting in a loss of $7.3 million, compared to a similar loss of $2.7 million for the year ended December 31, 2015.
For the pro forma combined year ended December 31, 2016, we incurred a loss of $2.6 million for the year ended December 31, 2016, compared to $4.2 million for the year ended December 31, 2015, for the sale/abandonment of property and equipment and bakery shutdown costs.
Related Party Expenses
Related party expenses for the pro forma combined year ended December 31, 2016 were $3.6 million, a decrease of $0.7 million, compared to $4.3 million for the year ended December 31, 2015. Mr. Metropoulos serves as our Executive Chairman and expenses associated with his employment agreements are recorded in related party expenses. After the Business Combination, payments to Mr. Metropoulos were reduced to approximately $0.3 million annually.
Operating Income
Operating income increased from $155.9 million, for the year ended December 31, 2015 by $12.5 million, to $168.4 million on a pro forma combined basis for the year ended December 31, 2016.
Interest Expense, net
Our interest expense increased $1.4 million to $51.4 million for the pro forma combined year ended December 31, 2016, compared to $50.0 million for the year ended December 31, 2015 (Predecessor). The Company completed the refinancing of existing debt with the new first lien term loan on November 18, 2016.
(Gain) Loss on Modification of debt
For the pro forma combined year ended December 31, 2016, in connection with the refinancing of the first and second lien term loan, we recorded a net gain on a partial extinguishment of debt in the amount of $0.8 million. The gain consisted of the write-off of approximately $4.0 million of debt premium and deferred financing costs, partially offset by prepayment penalties of $3.0 million and the write-off of deferred financing costs of $0.2 million.
We extinguished the Term Loan dated April 9, 2013 (the “2013 Term Loan”) through early principal payments of $343.8 million and $150.0 million on August 3, 2015 and June 4, 2015, respectively. As part of this debt extinguishment and in accordance with its contractual terms, we expensed 2% prepayment penalties of $9.9 million, as well as $16.0 million of amortization to write-off the remaining deferred financing costs. For the year ended December 31, 2015, (Predecessor), the total loss of debt extinguishment was $25.9 million.
Other (Income) Expense
For the pro forma combined year ended December 31, 2016, the Company recorded expenses of $2.4 million which primarily consisted of legal and professional fees related to post-Business Combination activities. For the year ended December 31, 2015, other income consisted of $12.0 million of proceeds from the sale of foreign trademark rights and certain “know how” in certain countries in the Middle East, partially offset by $3.3 million for professional service fees related to the pursuit of potential sale transactions.
Income Taxes
For the pro forma combined year ended December 31, 2016, income tax expense was $32.9 million, which represents the effective rate of 28.5%, giving effect to the noncontrolling interest, a partnership for income tax purposes. This is compared to a zero tax liability for the year ended December 31, 2015, due to the Company’s status of a series of limited partnerships.
Adjusted EBITDA Reconciliation
Adjusted EBITDA was $230.2 million for the year ended December 31, 2017, an increase of $14.9 million, or 6.9%, compared to pro forma combined adjusted EBITDA of $215.3 million for the year ended December 31, 2016, and an increase of $52.3 million, or 29.4% compared to adjusted EBITDA of $177.9 million for the year ended December 31, 2015. As a percentage of net revenue, adjusted EBITDA was 29.7% for the year ended December 31, 2017, which was comparable to pro forma combined adjusted EBITDA of 29.6% of net revenues for the year ended December 31, 2016, and 28.7% for the year ended December 31, 2015.
Adjusted EBITDA is a non-GAAP financial measure commonly used in our industry and should not be construed as an alternative to net income as an indicator of operating performance or as an alternative to cash flow provided by operating activities as a measure of liquidity (each as determined in accordance with GAAP). This measure may not be comparable to similarly titled measures reported by other companies. We have included these measures because we believe they provide management and investors with additional information to measure our performance and liquidity, estimate our value and evaluate our ability to service debt.
We define adjusted EBITDA as net income adjusted to exclude (i)income taxes, (ii) interest expense, net (iii) depreciation and amortization and (iv) as further adjusted to eliminate the impact of certain items that we do not consider indicative of our ongoing operating performance. These further adjustments are itemized below. You are encouraged to evaluate these adjustments and the reasons we consider them appropriate for supplemental analysis. In evaluating adjusted EBITDA, you should be aware that in the future we may incur expenses that are the same as or similar to some of the adjustments set forth below. Our presentation of adjusted EBITDA should not be construed as an inference that our future results will be unaffected by unusual or non-recurring items.
Adjusted EBITDA has important limitations as an analytical tool, and you should not consider it in isolation, or as a substitute for analysis of our results as reported under GAAP. For example, adjusted EBITDA:
does not reflect our capital expenditures, future requirements for capital expenditures or contractual commitments;
does not reflect changes in, or cash requirements for, our working capital needs;
does not reflect the significant interest expenses, or the cash requirements necessary to service interest or principal payments, on our debt;
does not reflect any cash requirements for the assets being depreciated and amortized that may have to be replaced in the future; and
does not reflect payments related to income taxes, the tax receivable agreement or distributions to the non-controlling interest to reimburse its tax liability.
|
| | | | | | | | | | | | | | | | | | | | | |
Reconciliation of Adjusted EBITDA
|
| (In thousands) | | Year Ended December 31, 2017 | | From November 4, 2016 through December 31, 2016 | | | From January 1, 2016 through November 3, 2016 | | Pro Forma Combined December 31, 2016 (1) | | Year Ended December 31, 2015 |
| | | (Successor) | | (Successor) | | | (Predecessor) | | | | (Predecessor) |
| Net income | | $ | 258,108 |
| | $ | (8,485 | ) | | | $ | 60,425 |
| | $ | 82,442 |
| | $ | 88,760 |
|
| Plus non-GAAP adjustments: | | | | | | | | | | | |
| Income tax provision | | (67,204 | ) | | (7,762 | ) | | | 439 |
| | 32,862 |
| | — |
|
| Interest expense, net | | 39,174 |
| | 6,649 |
| | | 60,384 |
| | 51,441 |
| | 50,011 |
|
| Depreciation and amortization | | 38,170 |
| | 5,843 |
| | | 10,265 |
| | 36,520 |
| | 9,836 |
|
| Executive chairman agreement termination and execution | i. | — |
| | 26,747 |
| | | — |
| | — |
| | — |
|
| Share-based compensation | | 7,413 |
| | | | | 3,891 |
| | — |
| | 1,381 |
|
| Tax receivable agreement liability remeasurement | ii. | (50,222 | ) | | — |
| | | — |
| | — |
| | — |
|
| Other (income) expense | iii. | 1,360 |
| | 751 |
| | | 1,624 |
| | 2,375 |
| | (8,743 | ) |
| Loss (gain) on debt modification | iv. | 2,554 |
| | (763 | ) | | | — |
| | (763 | ) | | 25,880 |
|
| Impairment of property and equipment | v | 1,003 |
| | — |
| | | 7,300 |
| | 7,300 |
| | 2,700 |
|
| Loss on sale/abandonment of property and equipment and bakery shutdown costs (recovery) | vi. | (144 | ) | | — |
| | | 2,551 |
| | 2,551 |
| | 4,182 |
|
| Inventory fair value adjustment | vii. | — |
| | 8,914 |
| | | — |
| | — |
| | — |
|
| Special employee incentive compensation | viii. | — |
| | — |
| | | 4,698 |
| | — |
| | 3,923 |
|
| Business combination transaction costs | ix. | — |
| | — |
| | | 31,832 |
| | 575 |
| | — |
|
| Adjusted EBITDA | | $ | 230,212 |
| | $ | 31,894 |
| | | $ | 183,409 |
| | $ | 215,303 |
| | $ | 177,930 |
|
| |
i. | For the Successor period November 4, 2016 through December 31, 2016, we expensed $26.7 million related to stock awarded to Mr. Metropoulos as required under his new employment arrangements. |
| |
ii. | During the year ended December 31, 2017, we recognized a gain of $50.2 million related to the adjustment to the tax receivable agreement related to Tax Reform, slightly offset by a loss due a change in a state tax rate. |
| |
iii. | For the year ended December 31, 2017, other expense primarily included professional fees incurred related to the secondary public offering of common stock and the registration of certain privately held warrants. For the Successor period November 4, 2016 through December 31, 2016, and the pro forma combined year ended December 31, 2016, we recorded expenses of $0.8 million which primarily consisted of legal and professional fees and other post-Business Combination costs such as fees related to securities filings. For the Predecessor period from January 1, 2016 through November 3, 2016, and the pro forma combined year ended December 31, 2016, other expense consisted of transaction costs attributable to the pursuit of a potential acquisition that has since been abandoned, offset partially by a gain from the settlement of a recall matter with one of our suppliers of approximately $0.8 million. For the year ended December 31, 2015, other income consisted of $12.0 million of proceeds from the sale of foreign trademark rights and certain “know how” in certain countries in the Middle East, partially offset by $3.3 million for professional service fees related to the pursuit of a potential sale transactions. |
| |
iv. | For the year ended December 31, 2017 and the period from November 4, 2016, through December 31, 2016, and the pro forma combined year ended December 31, 2016, the Company incurred losses on debt modification of $2.6 million resulting from refinancing transactions on its first lien term loan, and a $0.8 million gain on the extinguishment of the former first lien, respectively. For the year ended December 31, 2015, the Company recorded a loss on extinguishment related to its 2013 Term Loan of $25.9 million. |
| |
v. | For the year ended December 31, 2017, we transitioned the production of one of our products to a third party and recognized an impairment loss resulting from the idling of the related production equipment. For the period January 1, 2016 through November 3, 2016, and for the pro forma combined year ended December 31, 2016, we closed multiple production lines at the Indianapolis, Indiana bakery and transitioned production to other facilities resulting in a loss of $7.3 million. |
| |
vi. | For the Predecessor period January 1, 2016 through November 3, 2016 and the pro forma combined year ended December 31, 2016, we incurred a loss on a sale/abandonment of property and bakery shutdown costs, primarily due to utilities, insurance, taxes and maintenance expenses related to the Schiller Park, Illinois bakery. During the year ended December 31, 2017, we recovered $0.1 million of this cost. |
| |
vii. | For the Successor period November 4, 2016 through December 31, 2016, we remeasured inventory at fair value at the Closing Date, resulting in additional non-cash cost of goods sold of $8.9 million. |
| |
viii. | For the Predecessor period January 1, 2016 through November 3, 2016, a special bonus payment of $2.5 million and $2.2 million was paid to employees at the bakery facilities and corporate employees, respectively, as compensation for their efforts in the Business Combination. For the year ended December 31, 2015, a special bonus payment of $2.6 million and $1.3 million was paid to employees at the bakery facilities and corporate employees, respectively, as compensation for their efforts in the recapitalization of the Company. |
| |
ix. | For the Predecessor period from January 1, 2016 through November 3, 2016, business combination transaction costs consisted primarily of professional and legal costs. For the pro forma combined year ended December 31, 2016, business combination transaction costs consisted primarily of transactional costs attributable to the acquisition of Superior in May 2016. |
impacts noted above.
Segments
The Company has twoWe have one reportable segments:segment: Snacking (formerly referred to as Sweet Baked Goods, and In-Store Bakery.or “SBG”). The Company’s Sweet Baked GoodsSnacking segment consists of fresh and frozensweet baked goods, cookies, bread and breadbuns retail products that are sold under the Hostess®, Dolly Madison®, Cloverhill®, Big Texas®, and Dolly Madison®Voortman® brands. Through August 30, 2019, we operated in two reportable segments: SBG and In-Store Bakery. The In-Store Bakery segment consistsconsisted of Superior on Main® and Hostess brandedprivate label products sold through the in-store bakery section of grocery and club stores. During the fourth quarter of 2017, theThe Company reassesseddivested its segment presentation. Previously, the “Other” category included In-Store Bakery as well as bread and buns, and frozen retail products. The periods presented below reflect bread and buns and frozen retail products within the Sweet Baked Goods segment, while discretely presenting In-Store Bakery.segment's operations on August 30, 2019.
We evaluate performance and allocate resources based on net revenue and gross profit. Information regarding the operations of these reportable segments is as follows:
| | | | | | | | | | | | | | | | | |
| (In thousands) | Year Ended
December 31,
2020 | | Year Ended
December 31,
2019 | | Year Ended
December 31,
2018 |
| | | | | |
| Net revenue: | | | | | |
| Snacking | $ | 1,016,609 | | | $ | 878,973 | | | $ | 808,355 | |
| In-Store Bakery | — | | | 28,702 | | | 42,034 | |
| Net revenue | $ | 1,016,609 | | | $ | 907,675 | | | $ | 850,389 | |
| | | | | |
| Gross profit: | | | | | |
| Snacking | $ | 355,639 | | | $ | 293,648 | | | $ | 258,995 | |
| In-Store Bakery | — | | | 6,186 | | | 8,282 | |
| Gross profit | $ | 355,639 | | | $ | 299,834 | | | $ | 267,277 | |
| | | | | |
| Capital expenditures (1): | | | | | |
| Snacking | $ | 58,953 | | | $ | 35,354 | | | $ | 53,394 | |
| In-Store Bakery | — | | | 182 | | | 354 | |
| Capital expenditures | $ | 58,953 | | | $ | 35,536 | | | $ | 53,748 | |
(1)For all periods presented, capital expenditures consists of purchases of property and equipment and acquisition and development of software assets paid in cash or acquired through accounts payable.
Snacking net revenue for the year ended December 31, 2019 increased $70.6 million, or 8.7%, from the year ended December 31, 2018. The increase in net revenue was attributed to sales growth in our core products across multiple customer channels, the introduction of our breakfast innovation products, including Danishes and Cinnamon Rolls, and the impact of pricing actions implemented in the fourth quarter of 2018.
Snacking gross profit for the year ended December 31, 2019 was 33.4% of net revenue, compared to 32.0% of net revenue, for the year ended December 31, 2018. Gross profit in 2019 benefited from pricing actions, higher sales volume and bakery savings initiatives executed across all bakeries, particularly in our Chicago bakery. These benefits were partially offset by a shift in product mix.
In-Store Bakery net revenue for the year ended December 31, 2019 decreased 31.7% from the year ended ended December 31, 2018 as a result of the sale of the In-Store Bakery operations in August of 2019. In-Store Bakery gross profit for the year ended December 31, 2019 was 21.6% of net revenue compared to 19.7% for the year ended December 31, 2018.
|
| | | | | | | | | | | | | | | | | |
| Audited Segment Financial Data |
| (In thousands) | Year Ended
December 31,
2017 | | | From November 4
through December 31,
2016 | | | From January 1 through November 3, 2016 | | Year Ended December 31, 2015 |
| (Successor) | | | (Successor) | | | (Predecessor) | | (Predecessor) |
Net revenue: | | | | | | | | | |
| Sweet Baked Goods | $ | 733,827 |
| | | $ | 105,211 |
| | | $ | 595,645 |
| | $ | 620,815 |
|
| In-Store Bakery | 42,361 |
| | | 6,787 |
| | | 19,943 |
| | — |
|
| Net revenue | $ | 776,188 |
| | | $ | 111,998 |
| | | $ | 615,588 |
| | $ | 620,815 |
|
|
|
| | |
|
| | | | | |
| Gross profit: | | | | | | | | | |
| Sweet Baked Goods | $ | 316,916 |
| | | $ | 37,387 |
| | | $ | 262,930 |
| | $ | 262,203 |
|
| In-Store Bakery | 9,982 |
| | | 1,327 |
| | | 3,599 |
| | — |
|
| Gross profit | $ | 326,898 |
| | | $ | 38,714 |
| | | $ | 266,529 |
| | $ | 262,203 |
|
|
|
| | |
|
| | | | | |
Capital expenditures (1): | | | | | | | | | |
| Sweet Baked Goods | $ | 35,609 |
| | | $ | 7,544 |
| | | $ | 31,254 |
| | $ | 27,252 |
|
| In-Store Bakery | 774 |
| | | 83 |
| | | 223 |
| | — |
|
| Capital expenditures | $ | 36,383 |
| | | $ | 7,627 |
| | | $ | 31,477 |
| | $ | 27,252 |
|
| |
(1) | Capital expenditures consists of purchases of property and equipment and acquisition and development of software assets paid in cash or acquired through accounts payable during the year ended December 31, 2017 (Successor), from November 4, 2016 through December 31, 2016 (Successor), from January 1, 2016 through November 3, 2016 (Predecessor) and the year ended December 31, 2015 (Predecessor). |
Adjusted net revenue, adjusted gross profit, adjusted operating income, adjusted net income, adjusted Class A net income, adjusted EBITDA, adjusted diluted shares outstanding and adjusted EPS collectively referred to as “Non-GAAP Financial Measures,” are commonly used in our industry and should not be construed as an alternative to net revenue, gross profit, operating income, net income, net income attributed to Class A stockholders, diluted shares outstanding or earnings per share as indicators of operating performance (as determined in accordance with GAAP). These Non-GAAP Financial Measures may not be comparable to similarly titled measures reported by other companies. We included these Non-GAAP Financial Measures because we believe the measures provide management and investors with additional information to measure the Company's performance, estimate the Company's value and evaluate the Company's ability to service debt.
Customer Concentrations
Non-GAAP Financial Measures are adjusted to exclude certain items that affect comparability. The adjustments are itemized in the tables below. You are encouraged to evaluate these adjustments and the reason we consider them appropriate for supplemental analysis. In evaluating adjustments, you should be aware that in the future the Company may incur expenses that are the same as or similar to some of the adjustments set forth below. The presentation of Non-GAAP Financial Measures should not be construed as an inference that future results will be unaffected by unusual or recurring items.
See Note 1- “SummaryFor example, we define adjusted EBITDA as net income adjusted to exclude (i) interest expense, net, (ii) depreciation and amortization (iii) income taxes and (iv) share-based compensation, as further adjusted to eliminate the impact of Significant Accounting Policies”certain items that the Company does not consider indicative of its ongoing operating performance. Adjusted EBITDA has limitations as an analytical tool, and you should not consider it in isolation, or as a substitute for analysis of the Company's results as reported under GAAP. For example, adjusted EBITDA:
•does not reflect the Company's capital expenditures, future requirements for capital expenditures or contractual commitments;
•does not reflect changes in, or cash requirements for, the Company's working capital needs;
•does not reflect the significant interest expense, or the cash requirements necessary to service interest or principal payments, on the Company's debt; and
•does not reflect payments related to income taxes, the Tax Receivable Agreement or distributions to the non-controlling interest to reimburse its tax liability.
| | | | | | | | | | | | | | | | | | | | | | | | | | | | | | | | | | | | | | | | | |
| Year Ended December 31, 2020 |
| ($ and shares in thousands) | Net Revenue | | Gross
Profit | | Operating Income | | Net
Income | | Class A Net Income | | Diluted Shares | | Diluted
EPS |
| GAAP Results | $ | 1,016,609 | | | $ | 355,639 | | | $ | 135,310 | | | $ | 108,297 | | | $ | 104,676 | | | 127,723 | | | $ | 0.51 | |
| Non-GAAP adjustments: | | | | | | | | | | | | | |
| Foreign currency impacts | — | | | — | | | — | | | 2,065 | | | 1,966 | | | — | | | 0.02 | |
| Acquisition, disposal and integration related costs (1) | 6,821 | | | 7,963 | | | 29,166 | | | 29,166 | | | 27,569 | | | — | | | 0.22 | |
| Facility transition costs (2) | — | | | 3,681 | | | 5,710 | | | 5,710 | | | 5,396 | | | — | | | 0.04 | |
| Impairment of property and equipment | — | | | — | | | 3,009 | | | 3,009 | | | 2,909 | | | — | | | 0.02 | |
| Tax Receivable Agreement remeasurement | — | | | — | | | 760 | | | 760 | | | 760 | | | — | | | — | |
| COVID-19 costs (3) | — | | | 2,082 | | | 2,388 | | | 2,388 | | | 2,257 | | | — | | | 0.02 | |
| Change in fair value of warrant liabilities | — | | | — | | | — | | | (39,941) | | | (39,941) | | | — | | | — | |
| Other | — | | | — | | | 100 | | | 1,766 | | | 1,681 | | | — | | | 0.01 | |
| Remeasurement of tax liabilities | — | | | — | | | — | | | (455) | | | (455) | | | — | | | — | |
| Tax impact of adjustments | — | | | — | | | — | | | (10,961) | | | (10,961) | | | — | | | (0.09) | |
| | | | | | | | | | | | | |
| Adjusted Non-GAAP results | $ | 1,023,430 | | | $ | 369,365 | | | $ | 176,443 | | | $ | 101,804 | | | $ | 95,857 | | | 127,723 | | | $ | 0.75 | |
| | | | | | | | | | | | | |
| Income tax | | | | | | | 31,821 | | | | | | | |
| Interest expense | | | | | | | 42,826 | | | | | | | |
| Depreciation and amortization | | | | | | | 54,940 | | | | | | | |
| Share-based compensation | | | | | | | 8,671 | | | | | | | |
| Adjusted EBITDA | | | | | | | $ | 240,062 | | | | | | | |
(1) Adjustments to net revenue represent initial slotting fees paid to to customers to obtain space in customer warehouses for the Voortman transition. Adjustments to operating costs included $8.0 million of selling expense, $8.9 million of general and administrative expenses and $4.3 million of business combination transaction costs on the consolidated financial statementsstatement of operations.
(2) Facility transition operating costs are included in Part II, Item 8general and administrative expenses on the consolidated statement of this Annual Reportoperations.
(3) COVID-19 operating costs are included in general and administrative expenses on Form 10-K.the consolidated statement of operations. Total COVID-19 non-GAAP adjustments primarily consist of costs of incremental cleaning and sanitation, personal protective equipment and employee bonuses in the first half of 2020.
| | | | | | | | | | | | | | | | | | | | | | | | | | | | | | | | | | | | | | | | | |
| Year Ended December 31, 2019 |
| ($ and shares in thousands) | Net Revenue | | Gross
Profit | | Operating Income | | Net
Income | | Class A Net Income | | Diluted Shares | | Diluted
EPS |
| GAAP Results | $ | 907,675 | | | $ | 299,834 | | | $ | 136,096 | | | $ | 18,749 | | | $ | 4,299 | | | 111,006 | | | $ | 0.04 | |
| Non-GAAP adjustments: | | | | | | | | | | | | | |
| Foreign currency impacts | — | | | — | | | (7,127) | | | (7,127) | | | (6,721) | | | — | | | (0.07) | |
| Acquisition, disposal and integration related costs | — | | | 1,563 | | | 5,484 | | | 5,484 | | | 5,172 | | | — | | | 0.05 | |
| Special employee incentive compensation (1) | — | | | 33 | | | 1,910 | | | 1,910 | | | 1,801 | | | — | | | 0.02 | |
| Facility transition costs (2) | — | | | 9,381 | | | 12,080 | | | 12,080 | | | 11,392 | | | — | | | 0.10 | |
| Tax Receivable Agreement remeasurement | — | | | — | | | 186 | | | 186 | | | 186 | | | — | | | — | |
| Impairment of property and equipment, intangible assets and goodwill | — | | | — | | | 1,976 | | | 1,976 | | | 1,863 | | | — | | | 0.02 | |
| Loss on debt refinancing | — | | | — | | | 1,487 | | | 2,023 | | | 1,908 | | | — | | | 0.02 | |
| Remeasurement of tax liabilities | — | | | — | | | — | | | (4,564) | | | (4,564) | | | — | | | (0.05) | |
| Change in fair value of warrant liabilities | — | | | — | | | — | | | 58,816 | | | 58,816 | | | 3,694 | | | 0.51 | |
| Other | — | | | — | | | — | | | 1,233 | | | 1,163 | | | — | | | 0.01 | |
| Tax impact of adjustments | — | | | — | | | — | | | (3,918) | | | (3,918) | | | — | | | (0.04) | |
| | | | | | | | | | | | | |
| Adjusted Non-GAAP results | $ | 907,675 | | | $ | 310,811 | | | $ | 152,092 | | | $ | 86,848 | | | $ | 71,397 | | | 114,700 | | | $ | 0.61 | |
| | | | | | | | | | | | | |
| Income tax | | | | | | | 25,374 | | | | | | | |
| Interest expense | | | | | | | 39,870 | | | | | | | |
| Depreciation and amortization | | | | | | | 43,334 | | | | | | | |
| Share-based compensation | | | | | | | 9,231 | | | | | | | |
| Adjusted EBITDA | | | | | | | $ | 204,657 | | | | | | | |
(1) Special employee incentive compensation is included in general and administrative expenses on the consolidated statement of operations.
(2) Facility transition costs are included in general and administrative expenses on the consolidated statement of operations.
| | | | | | | | | | | | | | | | | | | | | | | | | | | | | | | | | | | | | | | | | |
| Year Ended December 31, 2018 |
| ($ and shares in thousands) | Net Revenue | | Gross
Profit | | Operating Income | | Net
Income | | Class A Net Income | | Diluted Shares | | Diluted
EPS |
| GAAP Results | $ | 850,389 | | | $ | 267,277 | | | $ | 121,558 | | | 160,582 | | | $ | 142,051 | | | 103,098 | | | $ | 0.61 | |
| Non-GAAP adjustments: | | | | | | | | | | | | | |
| Acquisition, disposal and integration related costs | — | | | 10,137 | | | 10,434 | | | 10,434 | | | 8,869 | | | — | | | 0.08 | |
| Special employee incentive compensation | — | | | 1,965 | | | 3,444 | | | 3,444 | | | 2,927 | | | — | | | 0.02 | |
| Tax Receivable Agreement remeasurement | — | | | — | | | (1,865) | | | (14,237) | | | (14,237) | | | — | | | (0.14) | |
| Impairment of property and equipment, intangible assets and goodwill | — | | | — | | | 4,970 | | | 4,970 | | | 4,225 | | | — | | | 0.04 | |
| Remeasurement of tax liabilities | — | | | — | | | — | | | (5,375) | | | (5,375) | | | — | | | (0.05) | |
| Change in fair value of warrant liabilities | — | | | — | | | — | | | (79,156) | | | (79,156) | | | — | | | — | |
| Other | — | | | — | | | 624 | | | 770 | | | 655 | | | — | | | — | |
| Tax impact of adjustments | — | | | — | | | — | | | (2,027) | | | (2,027) | | | — | | | (0.02) | |
| Adjusted Non-GAAP results | 850,389 | | | 279,379 | | | 139,165 | | | 79,405 | | | 57,932 | | | 103,098 | | | 0.54 | |
| | | | | | | | | | | | | |
| Income tax | | | | | | | 20,356 | | | | | | | |
| Interest expense | | | | | | | 39,404 | | | | | | | |
| Depreciation and amortization | | | | | | | 41,411 | | | | | | | |
| Share-based compensation | | | | | | | 5,600 | | | | | | | |
| Adjusted EBITDA | | | | | | | 186,176 | | | | | | | |
Adjusted EBITDA
Adjusted EBITDA was $240.1 million for the year ended December 31, 2020, compared to $204.7 million for the year ended December 31, 2019. The improvement in adjusted EBITDA was driven by the contribution of Voortman and higher volume of Hostess® branded products.
Adjusted EPS
Adjusted EPS was $0.75 for the year ended December 31, 2020, compared to $0.61 for the year ended December 31, 2019. The improvement in adjusted EPS was driven by Voortman profitability and strong demand for Hostess® branded products.
Liquidity and Capital Resources
Our primary sources of liquidity are from the cash and cash equivalents on the balance sheet, future cash flow generated from operations, and availability under our revolving credit agreement (“Revolver”). We believe that cash flows from operations and the current cash and cash equivalents on the balance sheet will be sufficient to satisfy the anticipated cash requirements associated with our existing operations for at least the next 12 months. Our future cash requirements include the purchase commitments for certain raw materials and packaging used in our production process, scheduled rent on leased facilities, scheduled debt service payments on our term loan and settlements on related interest rate swap contracts, payments on our Tax Receivable Agreement, settlements on our outstanding foreign currency contracts and outstanding purchase orders on capital projects.
Our ability to generate sufficient cash from our operating activities depends on our future performance, which is subject to general economic, political, financial, competitive and other factors beyond our control. In addition, our future capital expenditures and other cash requirements could be higher than we currently expect as a result of various factors, including any expansion of our business that we undertake, including acquisitions. We consider all highly liquid investments purchased with an original maturity of three months or less to be cash equivalents.
We had working capital, excluding cash and warrant liabilities, as of December 31, 20172020 and December 31, 20162019 of $15.5$7.0 million and $20.6$8.1 million, respectively. We have the ability to borrow under our Revolver to meet obligations as they come due. As of December 31, 2017,2020, we had approximately $96.1$94.5 million available for borrowing, net of letters of credit, under our Revolver.
Cash Flows from Operating Activities
Cash flows provided by operating activities for the yearyears ended December 31, 20172020 and 2019 were $163.7$159.2 million compared toand $144.0 million, respectively. The increase in operating cash flows was driven by an increase in net income after adjusting for non-cash items such as the Successor period November 4, 2016 through December 31, 2016current year increase in depreciation and amortization, prior year gain on the remeasurement of $13.6foreign currency contracts and change in fair value of warrant liabilities in both periods. Our operating cash flow also benefited from the deferral of certain employer payroll taxes allowed under the CARES Act.
Cash Flows provided by and used in Investing Activities
Investing activities used $374.3 million and for the Predecessor period January 1, 2016 through November 3, 2016 of $102.2 million, and $133.0 millioncash for the year ended December 31, 2015. Cash flows provided by operating activities during 2017 was driven by an increase in income before taxes and benefits from accounts payable and customer trade allowances, offset by higher inventory, accounts receivable, and prepaid expense balances. Cash flow provided by operating activities for the 2016 periods was driven by the payment2020 compared to providing $22.9 million of transaction costs related to the Business Combination.
Cash Flows from Investing Activities
Cash flows used in investing activitiescash for the year ended December 31, 2017 were $35.2 million.2019. During 2020, we funded $316.0 million of the net cash required to purchase Voortman from cash on hand and the proceeds from an incremental term loan on our existing credit facility. During 2019, we received proceeds of $63.3 million from the sale of our In-Store Bakery business. Cash flowsused for the purchase of property and equipment reflects planned investments in our bakeries, including Voortman, and our centralized distribution center.
Cash Flows provided by and used in investingFinancing Activities
Financing activities for the period November 4, 2016 through December 31, 2016 were $428.2provided $103.2 million (Successor) and $76.6 million for the period January 1, 2016 through November 3, 2016 (Predecessor) andof cash flows of $17.9 million were provided by investing activities for the year ended December 31, 2015. The acquisition2020 compared to using $28.1 million of Superior and Hostess during the Predecessor and Successor 2016 periods, respectively, represented a significant investing use of cash. Our property and equipment capital expenditures primarily consisted of strategic growth initiatives, maintenance and productivity improvements.
Cash Flows from Financing Activities
Cash flows used in financing activities were $19.6 millioncash for the year ended December 31, 2017, $232.32019. During 2020, cash proceeds of $140.0 million forfrom the Successor period November 4, 2016 through December 31, 2016, $31.6incremental term loan used to finance the purchase of Voortman were partially offset by related charges of $3.1 million. This incremental term loan increased the amount of principal repayments during 2020. Also during 2020, we paid $8.0 million forto repurchase 2.0 million warrants and 0.4 million shares from the Predecessor period January 1, 2016 through November 3, 2016, and $296.0 millionMetropoulos Entities as part of the exchange of their last remaining Class B units in Hostess Holdings, LP. In 2019, we incurred costs to refinance our First Lien Term Loan. Payments on the Tax Receivable Agreement increased in 2020 due to additional taxable basis created by Metropoulos Entity exchanges in 2019, which were monetized in 2020. These same exchanges decreased the amount of distributions to the non-controlling interest to cover tax liabilities related to net income allocated to Class B units.
For a discussion of our cash flows for the year ended December 31, 2015. For2019 compared to our results for the year ended December 31, 2017 (Successor), financing activities were primarily attributed to scheduled principal payments2018, please see Item 7 of our Annual Report on long term debt and distributions to partners/non-controlling interest in respect of their tax liability. For the Successor period of 2016, we had $13.1 million of deferred underwriting costs related to the Business Combination.
In November 2016, we extinguished the former second lien term loan through early principal payments and refinanced our first lien term loan which accountedForm 10-K for the primary use of cash used in financing activities for the Successor period. In June 2015 and August 2015 the Predecessor extinguished the 2013 Term Loan through early principal payments. In the period January 1, 2016 through November 3, 2016, and in the year ended December 31, 2015,2019, filed with the Predecessor paid distributions of $23.6 million, and $952.9 million, respectively, to partners, and $1.0 million, $46.8 million to non-controlling interest, respectively.SEC on February 26, 2020.
Long-Term Debt
As of December 31, 2017, $993.82020, $1,102.8 million aggregate principal amount of the Third Amended First Lien Term Loanour term loan and $3.9 $5.5 million aggregate principal amount of letters of credit, reducing the amount available under the Revolver, were outstanding. See Note 14 - “Commitments16. Commitments and Contingencies”Contingencies to the consolidated financial statements in Part II, Item 8 of this Annual Report on Form 10-K10-K/A for information regarding the letters of credits.credit. We had no outstanding borrowings under our Revolver as of December 31, 2017.
2020. As of December 31, 2017,2020, we were in compliance with theall covenants under the Third Amended First Lien Term Loanour term loan and the Revolver.
Commitments The Revolver contains certain restrictive financial covenants. Based on our current and Contingencies
As of December 31, 2017, the Company has commitments and contingencies for tax receivable arrangements, debt, operating leases, and advance purchase commitments. Refer to Note 14--“Commitments and Contingencies” to the Consolidated Financial Statements included in Part II, Item 8 on this Annual Report on Form 10-K.
|
| | | | | | | | | | | | | | | | | | | |
| Contractual Commitments as of December 31, 2017 | Total Committed | | Less than 1 year | | 1 to 3 years | | 3 to 5 years | | More than 5 years |
| (In thousands) | | | | | | | | | |
| Tax receivable agreement | $ | 124,360 |
| | $ | 14,200 |
| | $ | 15,000 |
| | $ | 14,400 |
| | $ | 80,760 |
|
| First lien term loan | 993,762 |
| | 9,938 |
| | 19,876 |
| | 963,948 |
| | — |
|
| Interest payments on term loan | 173,174 |
| | 35,344 |
| | 69,624 |
| | 68,206 |
| | — |
|
| Operating leases | 2,610 |
| | 2,043 |
| | 567 |
| | — |
| | |
| Capital lease | 633 |
| | 200 |
| | 400 |
| | 33 |
| | — |
|
| Ingredient procurement | 64,235 |
| | 61,166 |
| | 3,069 |
| | — |
| | — |
|
| Packaging procurement | 35,401 |
| | 35,401 |
| | — |
| | — |
| | — |
|
| | $ | 1,394,175 |
| | $ | 158,292 |
| | $ | 108,536 |
| | $ | 1,046,587 |
| | $ | 80,760 |
|
Tax receivable agreement
The tax receivable agreement entered into in connectionprojected financial performance, we believe that we will comply with the Business Combination (the “Tax Receivable Agreement”) generally providesthese covenants for the payment by the Company to the Legacy Hostess Equityholders of 85% of the net cash savings, if any, in U.S. federal, state and local income tax that the Company actually realizes (or is deemed to realize in certain circumstances) in periods after the closing of the Business Combination (which periods may extend, unless the Tax Receivable Agreement is terminated early in accordance with its terms, for more than 15 years following any exchange of Class B units of Hostess Holdings for shares of the Company’s Class A common stock or the cash equivalent thereof) as a result of (i) certain increases in tax basis resulting from the Business Combination; (ii) certain tax attributes of Hostess Holdings and its subsidiaries existing prior to the Business Combination and prior to subsequent exchanges of Class B units; (iii) certain increases in tax basis resulting from exchanges of Class B units; (iv) imputed interest deemed to be paid by the Company as a result of payments it makes under the Tax Receivable Agreement; and (v) certain increases in tax basis resulting from payments the Company makes under the Tax Receivable Agreement. The Company will retain the benefit of the remaining 15% of these cash savings. Certain payments under the Tax Receivable Agreement will be made to Legacy Hostess Equityholders in accordance with specified percentages, regardless of the source of the applicable tax attribute. The most significant estimate utilized by management to calculate the corresponding liability is the Company’s future cash tax savings rates, which are projected based on current tax laws and the Company’s historical and projected future tax profile.
In addition, in January 2018, we entered into an agreement with the Apollo Funds terminating all future payment obligations to the Apollo Funds in exchange for a payment of $34.0 million. However, if we enter into a definitive agreement on or before January 26, 2019 and that agreement results in a change in control (as defined in the Tax Receivable Agreement), we would be required to make an additional payment of $10.0 million to the Apollo Funds.
During the year ended December 31, 2017, we recognized a gain of $50.2 million related to the adjustment to the tax receivable agreement, partially offset by approximately $1.6 million of expense to reflect an increase to the estimated future cash tax savings rate attributed to a state tax law change. We recognized a corresponding gain on the consolidated statement of operations.foreseeable future.
Critical Accounting Policies
The preparation of financial statements in accordance with generally accepted accounting principles in the United States requires the use of judgment, estimates and assumptions. We make such subjective determinations after careful consideration of our historical performance, management’s experience, current economic trends and events and information from outside sources. Inherent in this process is the possibility that actual results could differ from these estimates and assumptions for any particular period.
Our significant accounting policies are detailed in Note 1 to our Consolidated Financial Statements.consolidated financial statements within Item 8. The following areas are the most important and require the most difficult, subjective judgments.
Trade and consumer promotion programs
We offer various sales incentive programs to customers, and consumers, such as feature price discounts, in-store display incentives, cooperative advertising programs and new product introduction fees, and coupons.fees. The mix between promotional programs, which are classified as reductions in revenue in the Statementstatements of Operations,operations, and advertising or other marketing activities, which are classified as marketing and selling expenses in the Statementconsolidated statements of Operations,operations, fluctuates between periods based on our overall marketing plans, and such fluctuations have an impact on revenues. These trade programs also require management to make estimates about the expected total cost of the programs and related allocations amongst participants (who might have different levels of incentives based on various program requirements). These estimates are inherently uncertain and are generally based on historical experience, adjusted for any new facts or circumstances that might impact the ultimate cost estimate for a particular program or programs.
Goodwill and Indefinite-lived trade names
When evaluating goodwill and indefinite-lived intangible assets for impairment under U.S. GAAP, we may first perform an assessment of qualitative factors to determine if the fair value of the reporting unit or the intangible asset is more-likely-than-not greater than the carrying amount. Such qualitative factors include, but are not limited to, macro-economic conditions, market and industry conditions, cost considerations, competitive environment, share price fluctuations, overall financial performance and results of past impairment tests. If, basedBased on a review of the qualitative factors, if we determine it is not more-likely-than-not that the fair value is less than the carrying value, we may bypass the two-step quantitative impairment test. The first step (“Step 1”) ofWe also may elect not to perform the qualitative assessment for some or all reporting units and perform a quantitative impairment test. For our 2020 and 2019 annual impairment testing, we elected to perform qualitative assessments for our reporting units. No indicators of impairment were noted.
If a quantitative test calculateswere to be utilized for any reporting unit, it would estimate the estimated fair value of each of the reporting units and comparescompared it to theits carrying value. IfTo the extent the fair value iswas in excess of the carrying value, no impairment exists. If Step 1 does indicatewould be recognized. Otherwise, an impairment a second step (“Step 2”) must take place. Under Step 2,loss would be recognized for the fair value of the assets and liabilities of the reporting unit are estimated as if the reporting unit were acquired in a business combination. The excess of the fair value of the reporting unit over the amounts assigned to its assets and liabilities is the implied fair value of the goodwill, to whichamount that the carrying value of thea reporting unit, including goodwill, must be adjusted.
exceeded its fair value. In performing the quantitative test of goodwill, we primarily use thefair value would be determined based on a calculation which would give consideration to an income approach method of valuation that includedutilizing the discounted cash flow method and the market approach using the market comparable and market transaction methods.
During the year ended December 31, 2019, we recognized an impairment charge to the In-Store Bakery reporting segment goodwill of $1.0 million reflecting a change in certain market assumptions (level 1 inputs).
Our indefinite-lived intangible assets consist of trademarks and trade names. The $1,538.6 million and $1,408.6 million balances at December 31, 2020 and 2019, respectively, were recognized as well as other generally accepted valuation methodologies to determine the fair value of goodwill and intangible assets. Significant assumptions used to determine fair value under the discounted cash flow model included future trends in sales, operating expenses, overhead expenses, capital expenditures and changes in working capital, along with an appropriate discount rate based on our estimated cost of equity capital and after-tax cost of debt.
In the process of our annual impairment reviewpart of the Hostess Business Combination and the Voortman and Cloverhill acquisitions. The trademarks and trade names we primarily useare integral to the reliefCompany’s identity and are expected to contribute indefinitely to our corporate cash flows. Fair value for trademarks and trade names was determined using the income approach. The application of royalty method under the income approach was premised on a royalty savings method, whereby the trademark and trade names are valued by reference to the amount of valuation. Significantroyalty income they could generate if they were licensed, in an arm’s-length transaction, to a third party. These assets have been assigned an indefinite life and therefore are not amortized but rather evaluated for impairment annually using the qualitative or quantitative methods similar to goodwill. For 2020 and 2019, we performed a qualitative test. No indicators of impairment were noted.
Changes in certain significant assumptions used to determinecould have a significant impact on the estimated fair value, under the reliefand therefore, a future impairment or additional impairments could result for a portion of royalty method included future trends in sales, a royalty rate and a discount rate to be applied to the forecast revenue stream.
goodwill, long-lived assets or intangible assets.
Business Combinations
We account for business acquisitions using the purchase method of accounting. Assets acquired, liabilities assumed, and non-controlling interests are recorded at their estimated fair values at the acquisition date. The excess of purchase price over fair value of the net assets acquired, including the amount assigned to identifiable intangible assets, is recorded as goodwill. Given the time it takes to obtain pertinent information to finalize the acquired company’s balance sheet, it may be multiple quarters before we are able to finalize those initial fair value estimates. Accordingly, it is not uncommon for the initial estimates to be subsequently revised.
Tax receivable agreementReceivable Agreement
We recognize a liability on the consolidated balance sheet based on the undiscounted estimated future payments under the Tax Receivable Agreement. See Note 10. Tax Receivable Agreement to the consolidated financial statements in Part II, Item 8 of this Annual Report on Form 10-K/A for information on the Tax Receivable Agreement. The most significant estimates utilized by management to calculate the corresponding liability is the Company’s increase in tax basis related to exchanges, future cash tax savings rates, which are projected based on current tax laws and the Company’s historical and future tax profile, and the allocation of the liability between short-term and long-term based on when the Company realizes certain tax attributes.
See “-Commitments and Contingencies- Tax receivable agreement” above.
New Accounting Pronouncements
Refer to Note 1. Summary of Significant Accounting Policies of the Notesnotes to our Consolidated Financial Statements elsewherethe consolidated financial statements included in Part II, Item 8 of this filingAnnual Report on Form 10-K/A for further information regarding recently issued accounting standards.
Item 7A. Quantitative and Qualitative Disclosures about Market Risk
We are exposed to market risks related to interest rate market risk.rates and foreign currency exchange rates.
Market risk on variable-rate financial instruments
Our Third Amended First Lien Term Loanterm loan and Revolver each bear interest on outstanding borrowings thereunder at variable interest rates. The rate in effect at December 31, 20172020 for the outstanding Third Amended First Lien Term Loanterm loan was a LIBOR-based rate of 3.60%3% per annum. At December 31, 2017, the subsidiary borrower2020, we had an aggregate principal balance of $993.8$1,102.8 million outstanding under the Third Amended First Lien Term Loan. At December 31, 2017, the subsidiary borrower had $96.1term loan and $94.5 million available for borrowing, net of letters of credit of $3.9$5.5 million, under itsthe Revolver. Increases in market interest rates would cause interest expense to increase and earnings before income taxes to decrease.
To manage the risk related to our variable rate debt, we have entered into an interest rate swap contractcontracts with a counter partyparties to make a series of payments based on a fixed interest rate ofrates ranging from 1.11% to 1.78% and receive a series of payments based on the greater of LIBOR or 0.75%. Both the fixed and floating payment streams are based onAt December 31, 2020, a notional amount of $500$700.0 million atremained outstanding on the inception of the contract andswap contracts. This notional amount will be reduced by $100decrease $100.0 million each year until a notional amount of $500.0 million remains outstanding through the five year contract.maturity of our term loan in August 2025.
The change in interest expense and earnings before income taxes resulting from a change in market interest rates would be dependent upon the weighted average outstanding borrowings and the portion of those borrowings that are hedged by our swap contract during the reporting period following an increase in market interest rates. An increase or decrease in applicable interest rates of 1% would result in an increase or decrease in interest payable of approximately $4.9 million for the year ended December 31, 2017,2020 would result in an increase in interest expense of approximately $11 million, or approximately $4 million after accounting for the impact of our swap contract.contracts.
We are exposed to fluctuations of the Canadian Dollar (“CAD”) relative to the US Dollar (“USD”) due to the operations of our Burlington, Ontario facility and sales to customers denominated in CAD. Revenue generated from Canadian customers, offset by the related selling expense and the operations of this facility, including certain raw materials, production labor and overhead, creates a net exposure to CAD denominated expenses. In December of 2020, we entered into a series of contracts to purchase a total of $14.6 million Canadian dollars at fixed exchange rates and varying dates from January 2021 through December 2021. At December 31, 2020, a 10% change in the USD to CAD exchange rate would change the aggregate fair value of these contracts by approximately $1 million.
Item 8. Financial Statements and Supplementary Data
|
| | | | |
| INDEX TO CONSOLIDATED FINANCIAL STATEMENTS |
| Audited Consolidated Financial Statements | |
| Report of Independent Registered Public Accounting Firm | |
Consolidated Balance Sheets as of December 31, 20172020 and December 31, 20162019 | |
Consolidated Statements of Operations for the yearyears ended December 31, 2017 (Successor), from November 4, 2016 through December 31, 2016 (Successor),2020, 2019 and from January 1, 2016 through November 3, 2016 (Predecessor), and the year ended December 31, 2015 (Predecessor)2018 | |
Consolidated Statements of Comprehensive Income (Loss) for the yearyears ended December 31, 2017 (Successor), from November 4, 2016 through December 31, 2016 (Successor),2020, 2019 and from January 1, 2016 through November 3, 2016 (Predecessor), and the year ended December 31, 2015 (Predecessor)2018 | |
Consolidated Statements of Stockholders’ Equity for the yearyears ended December 31, 2017 (Successor), from November 4, 2016 through December 31, 2016 (Successor),2020, 2019 and Partners’ Equity (Deficit) from January 1, 2016 through November 3, 2016 (Predecessor) and the year ended December 31, 2015 (Predecessor)2018 | |
Consolidated Statements of Cash Flows for the yearyears ended December 31, 2017, November 4, 2016 through December 31, 2016 (Successor),2020, 2019 and from January 1, 2016 through November 3, 2016 (Predecessor), and the year ended December 31, 2015 (Predecessor)2018 | |
| Notes to Consolidated Financial Statements | |
Report of Independent Registered Public Accounting Firm
To the ShareholdersStockholders and Board of Directors
Hostess Brands, Inc.:
OpinionsOpinion on the Consolidated Financial Statements and Internal Control Over Financial Reporting
We have audited the accompanying consolidated balance sheets of Hostess Brands, Inc. and subsidiaries (the “Company”)Company) as of December 31, 20172020 and 2016, and2019, the related consolidated statements of operations, comprehensive income, (loss),stockholders’ equity, and cash flows for each of the yearyears in the three-year period ended December 31, 2017 and for the period November 4, 2016 through December 31, 2016, and the related notes. We have also audited the accompanying consolidated statements of operations, equity, and cash flows for the period January 1, 2016 through November 3, 2016 and the year ended December 31, 2015 of Hostess Holdings, L.P. and subsidiaries,2020, and the related notes (collectively, withthe consolidated financial statements). In our opinion, the consolidated financial statements present fairly, in all material respects, the financial position of Hostess Brands, Inc., the “consolidated financial statements”). Company as of December 31, 2020 and 2019, and the results of its operations and its cash flows for each of the years in the three-year period ended December 31, 2020, in conformity with U.S. generally accepted accounting principles.
We also have audited, in accordance with the standards of the Public Company Accounting Oversight Board (United States) (PCAOB), the Company’s internal control over financial reporting as of December 31, 2017,2020, based on criteria established in Internal Control -– Integrated Framework(2013) issued by the Committee of Sponsoring Organizations of the Treadway Commission.
InCommission, and our opinion, the consolidated financial statements referred to above present fairly, in all material respects, the financial position of Hostess Brands, Inc. and subsidiaries as of December 31, 2017 and 2016, and the results of their operations and their cash flowsreport dated February 24, 2021, except for the year ended December 31, 2017 and for the period November 4, 2016 through December 31, 2016, in conformity with U.S. generally accepted accounting principles. It is also our opinion that the financial statements referredrestatement as to above present fairly, in all material respects, the results of Hostess Holdings, L.P. and subsidiaries’ operations and cash flows for the period January 1, 2016 through November 3, 2016 and the year ended December 31, 2015, in conformity with U.S. generally accepted accounting principles. Also in our opinion, the Company maintained, in all material respects, effective internal control over financial reporting as of December 31, 2017, based on criteria established in Internal Control - Integrated Framework (2013) issued by the Committee of Sponsoring Organizations of the Treadway Commission.
Basis for Opinions
The Company’s management is responsible for these consolidated financial statements, for maintaining effective internal control over financial reporting, and for its assessment of the effectiveness of internal control over financial reporting includedfor the material weakness related to the classification and measurement of warrant liabilities, as to which the date is May 17, 2021, expressed an adverse opinion on the effectiveness of the Company’s internal control over financial reporting.
Correction of a Misstatement
As discussed in Note 2 to the accompanying Management’s Report on Internal Control Over Financial Reporting.consolidated financial statements, the 2020, 2019, and 2018 financial statements have been restated to correct a misstatement.
Basis for Opinion
These consolidated financial statements are the responsibility of the Company’s management. Our responsibility is to express an opinion on the Company’sthese consolidated financial statements and an opinion on the Company’s internal control over financial reporting based on our audits. We are a public accounting firm registered with the Public Company Accounting Oversight Board (United States) (“PCAOB”)PCAOB and are required to be independent with respect to the Company in accordance with the U.S. federal securities laws and the applicable rules and regulations of the Securities and Exchange Commission and the PCAOB.
We conducted our audits in accordance with the standards of the PCAOB. Those standards require that we plan and perform the auditsaudit to obtain reasonable assurance about whether the consolidated financial statements are free of material misstatement, whether due to error or fraud, and whether effective internal control over financial reporting was maintained in all material respects.
fraud. Our audits of the consolidated financial statements included performing procedures to assess the risks of material misstatement of the consolidated financial statements, whether due to error or fraud, and performing procedures that respond to those risks. Such procedures included examining, on a test basis, evidence regarding the amounts and disclosures in the consolidated financial statements. Our audits also included evaluating the accounting principles used and significant estimates made by management, as well as evaluating the overall presentation of the consolidated financial statements. Our audit of internal control over financial reporting included obtaining an understanding of internal control over financial reporting, assessing the risk that a material weakness exists, and testing and evaluating the design and operating effectiveness of internal control based on the assessed risk. Our audits also included performing such other procedures as we considered necessary in the circumstances. We believe that our audits provide a reasonable basis for our opinions.opinion.
Definition
Critical Audit Matters
The critical audit matters communicated below are matters arising from the current period audit of the consolidated financial statements that were communicated or required to be communicated to the audit committee and Limitationsthat: (1) relate to accounts or disclosures that are material to the consolidated financial statements and (2) involved our especially challenging, subjective, or complex judgments. The communication of Internal Control Over Financial Reportingcritical audit matters does not alter in any way our opinion on the consolidated financial statements, taken as a whole, and we are not, by communicating the critical audit matters below, providing separate opinions on the critical audit matters or on the accounts or disclosures to which they relate.
A company’s internal control over
Evaluation of customer trade allowances
As discussed in Note 1 to the consolidated financial reportingstatements, the Company has recorded a provision for customer trade allowances, consisting primarily of pricing allowances and merchandising programs associated with sales to
customers. The liability recorded for the estimated cost of these programs is a process designed to provide reasonable assurance regardingdependent on factors such as the reliabilityultimate purchase volume activity, participation levels of financial reportingcustomers, and the preparationrelated settlement rates for these programs. The Company’s liability for customer trade allowances as of December 31, 2020 was $46.8 million.
We have identified the evaluation of the customer trade allowance as a critical audit matter because of the higher degree of auditor judgment required to evaluate the Company’s estimates. This is due to uncertainty around the amount of settlements, which typically occur in a period subsequent to the related sales transactions, and in particular, the estimate of purchase volumes made by retailers from distributors.
The following are the primary procedures we performed to address this critical audit matter. We evaluated the design and tested the operating effectiveness of certain internal controls related to the Company’s trade process at disaggregated levels. This included controls related to the Company’s trade spend trending and lookback analyses based on final settlement. We analyzed the liability by trade allowance type to identify unusual trends. We assessed the Company’s historical ability to accurately estimate its customer trade allowances by comparing historical estimates to final settlements. We compared a sample of settlements subsequent to period end to the amount previously recognized by the Company.
Acquisition-date fair value of acquired trade name
As discussed in Note 3 to the consolidated financial statements, for external purposes in accordance with generally accepted accounting principles. A company’s internal control over financial reporting includes those policies and procedures that (1) pertain toon January 3, 2020, the maintenance of records that, in reasonable detail, accurately and fairly reflectCompany acquired Voortman Cookies, Limited (Voortman), including the transactions and dispositionsassociated trade name. The acquisition-date fair value of the assetsVoortman trade name was $130.0 million.
We have identified the evaluation of the company; (2) provide reasonable assurance that transactions are recorded as necessary to permit preparation of financial statements in accordance with generally accepted accounting principles, and that receipts and expendituresacquisition-date fair value of the company are being made onlytrade name acquired in accordance with authorizationsthe Voortman acquisition as a critical audit matter. A high degree of managementsubjective auditor judgment was involved in evaluating discrete period revenue growth rates and directorsroyalty rate assumptions used in the relief from royalty method to estimate the acquisition-date fair value of the company;trade name.
The following are the primary procedures we performed to address this critical audit matter. We evaluated the design and (3) provide reasonable assurance regarding prevention or timely detectiontested the operating effectiveness of unauthorized acquisition, use, or dispositioncertain internal controls over the Company’s acquisition-date valuation process. This included controls over the assumptions listed above used to estimate the acquisition-date fair value of the company’s assets that could have a material effect ontrade name. We evaluated the financial statements.reasonableness of the discrete period revenue growth rates by comparing the Company’s estimates of forecasted revenue growth to historical actual results and current period performance. We involved valuation professionals with specialized skills and knowledge, who assisted in evaluating the reasonableness of:
Because of its inherent limitations, internal control over financial reporting may not prevent or detect misstatements. Also, projections of any evaluation of effectiveness
• the discrete period revenue growth rates by comparing the forecasted amounts to future periods are subject topublicly available market data for comparable companies
• the risk that controls may become inadequate because of changes in conditions, or thatroyalty rate by comparing the degree of compliance with the policies or procedures may deteriorate.rate determined by management against publicly available market data for comparable transactions.
(signed)/s/ KPMG LLP
We have served as the Company’s auditor since 2013.
Kansas City, Missouri
February 28, 201824, 2021, except for Notes 1, 2, 12, 13, 14, and 15, and for the restatement as to the effectiveness of internal control over financial reporting for a material weakness related to the classification and measurement of warrant liabilities, as to which the date is May 17, 2021
HOSTESS BRANDS, INC.
CONSOLIDATED BALANCE SHEETS
(Amounts in thousands, except shares and per share data)shares)
| | | | | | | | (As Restated) |
| December 31, | | December 31, | | December 31, | | December 31, |
| ASSETS | 2017 | | 2016 | ASSETS | 2020 | | 2019 |
| (Successor) | | (Successor) | |
| Current assets: |
| |
| Current assets: | | | |
| Cash and cash equivalents | $ | 135,701 |
| | $ | 26,855 |
| Cash and cash equivalents | $ | 173,034 | | | $ | 285,087 | |
| Accounts receivable, net | 101,012 |
| | 89,237 |
| Accounts receivable, net | 125,550 | | | 104,892 | |
| Inventories | 34,345 |
| | 30,444 |
| Inventories | 49,348 | | | 47,608 | |
| Prepaids and other current assets | 7,970 |
| | 4,827 |
| Prepaids and other current assets | 21,614 | | | 15,569 | |
| Total current assets | 279,028 |
| | 151,363 |
| Total current assets | 369,546 | | | 453,156 | |
| Property and equipment, net | 174,121 |
| | 153,224 |
| Property and equipment, net | 303,959 | | | 242,384 | |
| Intangible assets, net | 1,923,088 |
| | 1,946,943 |
| Intangible assets, net | 1,967,903 | | | 1,853,315 | |
| Goodwill | 579,446 |
| | 588,460 |
| Goodwill | 706,615 | | | 535,853 | |
| Other assets, net | 10,592 |
| | 7,902 |
| Other assets, net | 17,446 | | | 12,993 | |
| Total assets | $ | 2,966,275 |
| | $ | 2,847,892 |
| Total assets | $ | 3,365,469 | | | $ | 3,097,701 | |
| | | | | | | | |
| LIABILITIES AND STOCKHOLDERS’ EQUITY | | | | LIABILITIES AND STOCKHOLDERS’ EQUITY | |
| | | | | |
| Current liabilities: | | | | Current liabilities: | |
| Long-term debt and capital lease obligation payable within one year | $ | 11,268 |
| | $ | 11,496 |
| |
| Tax receivable agreement payments payable within one year | 14,200 |
| | — |
| |
| Long-term debt and lease obligations payable within one year | | Long-term debt and lease obligations payable within one year | $ | 13,811 | | | $ | 11,883 | |
| Tax receivable agreement obligations payable within one year | | Tax receivable agreement obligations payable within one year | 11,800 | | | 12,100 | |
| Accounts payable | 49,992 |
| | 34,083 |
| Accounts payable | 61,428 | | | 68,566 | |
| Customer trade allowances | 40,511 |
| | 36,691 |
| Customer trade allowances | 46,779 | | | 45,715 | |
| Warrant liabilities | | Warrant liabilities | 861 | | | 111,305 | |
| Accrued expenses and other current liabilities | 11,880 |
| | 21,656 |
| Accrued expenses and other current liabilities | 55,715 | | | 21,661 | |
| Total current liabilities | 127,851 |
| | 103,926 |
| Total current liabilities | 190,394 | | | 271,230 | |
| Long-term debt and capital lease obligation | 987,920 |
| | 993,374 |
| |
| Tax receivable agreement | 110,160 |
| | 165,384 |
| |
| Long-term debt and lease obligations | | Long-term debt and lease obligations | 1,113,037 | | | 975,405 | |
| Tax receivable agreement obligations | | Tax receivable agreement obligations | 144,744 | | | 126,096 | |
| Deferred tax liability | 267,771 |
| | 353,797 |
| Deferred tax liability | 295,009 | | | 256,051 | |
| Other long-term liabilities | | Other long-term liabilities | 1,560 | | | 0 | |
| Total liabilities | 1,493,702 |
| | 1,616,481 |
| Total liabilities | 1,744,744 | | | 1,628,782 | |
| Commitments and Contingencies (Note 14) |
| |
| |
| Class A common stock, $0.0001 par value, 200,000,000 shares authorized, 99,791,245 and 98,250,917 shares issued and outstanding at December 31, 2017 and 2016, respectively | 10 |
| | 10 |
| |
| Class B common stock, $0.0001 par value, 50,000,000 shares authorized, 30,319,564 and 31,704,988 shares issued and outstanding at December 31, 2017 and 2016, respectively | 3 |
| | 3 |
| |
| Commitments and Contingencies (Note 15) | | Commitments and Contingencies (Note 15) | 0 | | 0 |
| Class A common stock, $0.0001 par value, 200,000,000 shares authorized, 130,347,464 and 122,108,086 issued and outstanding at December 31, 2020 and 2019, respectively | | Class A common stock, $0.0001 par value, 200,000,000 shares authorized, 130,347,464 and 122,108,086 issued and outstanding at December 31, 2020 and 2019, respectively | 13 | | | 12 | |
| Class B common stock, $0.0001 par value, 50,000,000 shares authorized, NaN issued or outstanding at December 31, 2020, 8,409,834 issued and outstanding at December 31, 2019 | | Class B common stock, $0.0001 par value, 50,000,000 shares authorized, NaN issued or outstanding at December 31, 2020, 8,409,834 issued and outstanding at December 31, 2019 | 0 | | | 1 | |
| Additional paid in capital | 920,723 |
| | 912,824 |
| Additional paid in capital | 1,281,018 | | | 1,123,805 | |
| Accumulated other comprehensive income | 1,318 |
| | — |
| |
| Retained earnings (accumulated deficit) | 208,279 |
| | (15,618 | ) | |
| Accumulated other comprehensive loss | | Accumulated other comprehensive loss | (10,407) | | | (756) | |
| Retained earnings | | Retained earnings | 356,101 | | | 251,425 | |
| Treasury stock | | Treasury stock | (6,000) | | | 0 | |
| Stockholders’ equity | 1,130,333 |
| | 897,219 |
| Stockholders’ equity | 1,620,725 | | | 1,374,487 | |
| Non-controlling interest | 342,240 |
| | 334,192 |
| Non-controlling interest | 0 | | | 94,432 | |
| Total liabilities, stockholders’ equity and non-controlling interest | $ | 2,966,275 |
| | $ | 2,847,892 |
| Total liabilities, stockholders’ equity and non-controlling interest | $ | 3,365,469 | | | $ | 3,097,701 | |
See accompanying notes to the consolidated financial statements.
HOSTESS BRANDS, INC.
CONSOLIDATED STATEMENTS OF OPERATIONS
(Amounts in thousands, except shares and per share data) | | | | | | | | | | | | | | | | | | | | |
| (As Restated) | | | |
| Year Ended
December 31,
2020 | | Year Ended
December 31,
2019 | | Year Ended
December 31,
2018 | | | |
| | | | | | | | |
| Net revenue | $ | 1,016,609 | | | $ | 907,675 | | | $ | 850,389 | | | | |
| Cost of goods sold | 660,970 | | | 607,841 | | | 583,112 | | | | |
| | | | | | | | |
| Gross profit | 355,639 | | | 299,834 | | | 267,277 | | | | |
| | | | | | | | |
| Operating costs and expenses: | | | | | | | | |
| Advertising and marketing | 45,724 | | | 39,775 | | | 35,069 | | | | |
| Selling expense | 46,729 | | | 30,719 | | | 30,071 | | | | |
| General and administrative | 92,860 | | | 69,423 | | | 52,760 | | | | |
| | | | | | | | |
| Amortization of customer relationships | 26,510 | | | 23,377 | | | 24,057 | | | | |
| | | | | | | | |
| Business combination transaction costs | 4,282 | | | 1,914 | | | 297 | | | | |
| Tax receivable agreement liability remeasurement | 760 | | | 186 | | | (1,866) | | | | |
| Gain on foreign currency contract | 0 | | | (7,128) | | | 0 | | | | |
| Other operating expense | 3,464 | | | 5,472 | | | 5,331 | | | | |
| Total operating costs and expenses | 220,329 | | | 163,738 | | | 145,719 | | | | |
| Operating income | 135,310 | | | 136,096 | | | 121,558 | | | | |
| Other (income) expense: | | | | | | | | |
| Interest expense, net | 42,826 | | | 39,870 | | | 39,404 | | | | |
| Gain on buyout of tax receivable agreement | 0 | | | 0 | | | (12,372) | | | | |
| Change in fair value of warrant liabilities | (39,941) | | | 58,816 | | | (79,156) | | | | |
| Other expense | 3,723 | | | 1,769 | | | 146 | | | | |
| Total other (income) expense | 6,608 | | | 100,455 | | | (51,978) | | | | |
| Income before income taxes | 128,702 | | | 35,641 | | | 173,536 | | | | |
| Income tax expense | 20,405 | | | 16,892 | | | 12,954 | | | | |
| Net income | 108,297 | | | 18,749 | | | 160,582 | | | | |
| Less: Net income attributable to the non-controlling interest | 3,621 | | | 14,450 | | | 18,531 | | | | |
| Net income attributable to Class A stockholders | $ | 104,676 | | | $ | 4,299 | | | $ | 142,051 | | | | |
| | | | | | | | |
| Earnings per Class A share: | | | | | | | | |
| Basic | 0.84 | | | 0.04 | | | 1.42 | | | | |
| Diluted | 0.51 | | | 0.04 | | | 0.61 | | | | |
| Weighted-average shares outstanding: | | | | | | | | |
| Basic | 124,927,535 | | | 110,540,264 | | | 99,957,049 | | | | |
| Diluted | 127,723,488 | | | 111,005,689 | | | 103,098,394 | | | | |
|
| | | | | | | | | | | | | | | | |
| Year Ended
December 31, 2017 | | From
November 4, 2016
through
December 31, 2016 | | | From
January 1, 2016
through
November 3, 2016 | | Year Ended
December 31, 2015 |
| (Successor) | | (Successor) | | | (Predecessor) | | (Predecessor) |
| Net revenue | $ | 776,188 |
| | $ | 111,998 |
| | | $ | 615,588 |
| | $ | 620,815 |
|
| Cost of goods sold | 449,290 |
| | 73,284 |
| | | 346,864 |
| | 355,963 |
|
| Special employee incentive compensation | — |
| | — |
| | | 2,195 |
| | 2,649 |
|
| Gross profit | 326,898 |
| | 38,714 |
| | | 266,529 |
| | 262,203 |
|
| | | | | | | | | |
| Operating costs and expenses: | | | | | | | | |
| Advertising and marketing | 33,004 |
| | 5,245 |
| | | 30,626 |
| | 31,967 |
|
| Selling expense | 32,086 |
| | 5,033 |
| | | 25,730 |
| | 29,484 |
|
| General and administrative | 52,943 |
| | 7,322 |
| | | 38,391 |
| | 31,531 |
|
| Special employee incentive compensation | — |
| | — |
| | | 2,503 |
| | 1,274 |
|
| Amortization of customer relationships | 23,855 |
| | 3,922 |
| | | 1,185 |
| | 851 |
|
| Impairment of property and equipment | 1,003 |
| | — |
| | | 7,300 |
| | 2,700 |
|
| Loss on sale/abandonment of property and equipment, and bakery shutdown costs (recoveries) | (144 | ) | | — |
| | | 2,551 |
| | 4,182 |
|
| Business combination transaction costs | — |
| | — |
| | | 31,832 |
| | — |
|
| Related party expenses | 381 |
| | 26,799 |
| | | 3,539 |
| | 4,306 |
|
| Tax receivable agreement liability remeasurement | (50,222 | ) | | — |
| | | — |
| | — |
|
| Total operating costs and expenses | 92,906 |
| | 48,321 |
| | | 143,657 |
| | 106,295 |
|
| Operating income (loss) | 233,992 |
| | (9,607 | ) | | | 122,872 |
| | 155,908 |
|
| Other (income) expense: |
| |
| | |
| |
|
| Interest expense, net | 39,174 |
| | 6,649 |
| | | 60,384 |
| | 50,011 |
|
| Loss (gain) on modification of debt | 2,554 |
| | (763 | ) | | | — |
| | 25,880 |
|
| Other expense (income) | 1,360 |
| | 754 |
| | | 1,624 |
| | (8,743 | ) |
| Total other expense | 43,088 |
| | 6,640 |
| | | 62,008 |
| | 67,148 |
|
| Income (loss) before income taxes | 190,904 |
| | (16,247 | ) | | | 60,864 |
| | 88,760 |
|
| Income tax expense (benefit) | (67,204 | ) | | (7,762 | ) | | | 439 |
| | — |
|
| Net income (loss) | 258,108 |
| | (8,485 | ) | | | 60,425 |
| | 88,760 |
|
| Less: Net income (loss) attributable to the non-controlling interest | 34,211 |
| | (4,081 | ) | | | 3,214 |
| | 4,507 |
|
| Net income (loss) attributable to Class A shareholders/partners | $ | 223,897 |
| | $ | (4,404 | ) | | | $ | 57,211 |
| | $ | 84,253 |
|
| Earnings (loss) per Class A share: |
| |
| | |
| |
|
| Basic | $2.26 | | (0.05 | ) | | |
| |
|
| Diluted | $2.13 | | (0.05 | ) | | |
| |
|
| Weighted-average shares outstanding: |
| |
| | |
| |
|
| Basic | 99,109,629 |
| | 97,791,658 |
| | |
| |
|
| Diluted | 105,307,293 |
| | 97,791,658 |
| | |
| |
|
See accompanying notes to the consolidated financial statements.
HOSTESS BRANDS, INC.
CONSOLIDATED STATEMENTS OF COMPREHENSIVE INCOME
(Amounts in thousands)
| | | | | | | | | | | | | | | | | | | | |
| (As Restated) | | | |
| Year Ended
December 31,
2020 | | Year Ended
December 31,
2019 | | Year Ended
December 31,
2018 | | | |
| Net income | $ | 108,297 | | | $ | 18,749 | | | $ | 160,582 | | | | |
| Other comprehensive income: | | | | | | | | |
| Unrealized gain (loss) on interest rate swap designated as a cash flow hedge | (16,870) | | | (4,063) | | | 2,962 | | | | |
| Reclassification into net income | 3,886 | | | (1,705) | | | (775) | | | | |
| Income tax benefit (expense) | 3,421 | | | 1,222 | | | (470) | | | | |
| Comprehensive income | 98,734 | | | 14,203 | | | 162,299 | | | | |
| Less: Comprehensive income attributed to non-controlling interest | 2,749 | | | 13,292 | | | 19,050 | | | | |
| Comprehensive income attributed to Class A stockholders | $ | 95,985 | | | $ | 911 | | | $ | 143,249 | | | | |
|
| | | | | | | | | | | | | | | | | |
| Year Ended
December 31,
2017 | | | From
November 4, 2016
through
December 31, 2016 | | | From
January 1, 2016
through
November 3, 2016 | | Year Ended
December 31,
2015 |
| | (Successor) | | | (Successor) | | | (Predecessor) | | (Predecessor) |
| Net income (loss) | $ | 258,108 |
| | | $ | (8,485 | ) | | | $ | 60,425 |
| | $ | 88,760 |
|
| Other comprehensive income: |
| | |
| | |
| |
|
| Unrealized income on interest rate swap designated as a cash flow hedge | 2,878 |
| | | — |
| | | — |
| | — |
|
| Income tax expense | (890 | ) | | | — |
| | | — |
| | — |
|
| Comprehensive income (loss) | 260,096 |
| | | (8,485 | ) | | | 60,425 |
| | 88,760 |
|
| Less: Comprehensive income (loss) attributed to non-controlling interest | 34,881 |
| | | (4,081 | ) | | | 3,214 |
| | 4,507 |
|
| Comprehensive income (loss) attributed to class A shareholders/partners | $ | 225,215 |
| | | $ | (4,404 | ) | | | $ | 57,211 |
| | $ | 84,253 |
|
See accompanying notes to the consolidated financial statements.
HOSTESS BRANDS, INC.
CONSOLIDATED STATEMENTS OF STOCKHOLDERS' EQUITY (DEFICIT)
(Amounts in thousands, except shares data)
thousands) | | | | | | | | | | | | | | | | | | | | | | | | | | | | | | | | | | | | | | | | | | | | | | | | | | | | | | | | | | | | | | | | | |
| Class A Voting
Common Stock | | Class B Voting
Common Stock | | Additional
Paid-in Capital | | Accumulated Other Comprehensive Income (Losses) | | Retained Earnings | | Treasury Stock | | Total
Stockholders’
Equity | | Non-controlling
Interest |
| Shares | | Amount | | Shares | | Amount | | | | | | | | Shares | | Amount | | | | |
| Balance - December 31, 2017 (as previously reported) | 99,791 | | | $ | 10 | | | 30,320 | | | $ | 3 | | | $ | 920,723 | | | $ | 1,318 | | | $ | 208,279 | | | 0 | | | $ | 0 | | | $ | 1,130,333 | | | $ | 342,240 | |
| Restatement adjustment (Note 2) | — | | | — | | | — | | | — | | | (28,250) | | | — | | | (103,395) | | | — | | | — | | | (131,645) | | | — | |
| Balance–December 31, 2017 (as restated) | 99,791 | | | 10 | | | 30,320 | | | 3 | | | 892,473 | | | 1,318 | | | 104,884 | | | 0 | | | 0 | | | 998,688 | | | 342,240 | |
| Adoption of new accounting standards net of income taxes of $83 | — | | | — | | | — | | | — | | | — | | | 7 | | | 191 | | | — | | | — | | | 198 | | | 85 | |
| Comprehensive income | — | | | — | | | — | | | — | | | — | | | 1,198 | | | 142,051 | | | — | | | — | | | 143,249 | | | 19,050 | |
| Share-based compensation, net of income taxes of $505 | 191 | | | — | | | — | | | — | | | 5,095 | | | — | | | — | | | — | | | — | | | 5,095 | | | — | |
| Exchanges | 64 | | | — | | | (64) | | | — | | | 1,370 | | | — | | | — | | | — | | | — | | | 1,370 | | | (1,370) | |
| Distributions | — | | | — | | | — | | | — | | | — | | | — | | | — | | | — | | | — | | | — | | | (9,551) | |
| Payment of taxes for employee stock awards | — | | | — | | | — | | | — | | | (1,025) | | | — | | | — | | | — | | | — | | | (1,025) | | | — | |
| Tax receivable agreement arising from exchanges, net of income taxes of $33 | — | | | — | | | — | | | — | | | (261) | | | — | | | — | | | — | | | — | | | (261) | | | — | |
| Balance–December 31, 2018 (as restated) | 100,046 | | | 10 | | | 30,256 | | | 3 | | | 897,652 | | | 2,523 | | | 247,126 | | | 0 | | | 0 | | | 1,147,314 | | | 350,454 | |
| Comprehensive income | — | | | — | | | — | | | — | | | — | | | (3,388) | | | 4,299 | | | — | | | — | | | 911 | | | 13,292 | |
| Share-based compensation, net of income taxes of $1,354 | 209 | | | — | | | — | | | — | | | 7,877 | | | — | | | — | | | — | | | — | | | 7,877 | | | — | |
| Exchanges | 21,845 | | | 2 | | | (21,845) | | | (2) | | | 262,547 | | | 109 | | | — | | | — | | | — | | | 262,656 | | | (262,656) | |
| Distributions | — | | | — | | | — | | | — | | | — | | | — | | | — | | | — | | | — | | | — | | | (6,658) | |
| Exercise of employee stock options | 7 | | | — | | | — | | | — | | | 23 | | | — | | | — | | | — | | | — | | | 23 | | | — | |
| Payment of taxes for employee stock awards | — | | | — | | | — | | | — | | | (1,431) | | | — | | | — | | | — | | | — | | | (1,431) | | | — | |
| | | | | | | | | | | | | | | | | | | | | |
| Tax receivable agreement arising from exchanges, net of income taxes of $28,817 | — | | | — | | | — | | | — | | | (42,863) | | | — | | | — | | | — | | | — | | | (42,863) | | | — | |
| Balance–December 31, 2019 (as restated) | 122,107 | | | 12 | | | 8,411 | | | 1 | | | 1,123,805 | | | (756) | | | 251,425 | | | 0 | | | 0 | | | 1,374,487 | | | 94,432 | |
| Comprehensive income | — | | | — | | | — | | | — | | | — | | | (8,691) | | | 104,676 | | | — | | | — | | | 95,985 | | | 2,749 | |
| Share-based compensation, including income taxes of $2,167 | 223 | | | — | | | — | | | — | | | 10,838 | | | — | | | — | | | — | | | — | | | 10,838 | | | — | |
| Exchanges | 8,411 | | | 1 | | | (8,411) | | | (1) | | | 94,719 | | | (960) | | | — | | | — | | | — | | | 93,759 | | | (93,759) | |
| Distributions | — | | | — | | | — | | | — | | | — | | | — | | | — | | | — | | | — | | | — | | | (3,422) | |
| Exercise of employee stock options and warrants | 50 | | | — | | | — | | | — | | | 690 | | | — | | | — | | | — | | | — | | | 690 | | | — | |
| Payment of taxes for employee stock awards | — | | | — | | | — | | | — | | | (1,440) | | | — | | | — | | | — | | | — | | | (1,440) | | | — | |
| | | | | | | | | | | | | | | | | | | | | |
| Reclassification of public warrants | — | | | — | | | — | | | — | | | 68,503 | | | — | | | — | | | — | | | — | | | 68,503 | | | — | |
| | | | | | | | | | | | | | | | | | | | | |
| Repurchase of common stock | (444) | | | — | | | — | | | — | | | — | | | — | | | — | | | 444 | | | (6,000) | | | (6,000) | | | — | |
| Tax receivable agreement arising from exchanges, net of income taxes of $11,818 | — | | | — | | | — | | | — | | | (16,097) | | | — | | | — | | | — | | | — | | | (16,097) | | | — | |
| Balance-December 31, 2020 (as restated) | 130,347 | | | $ | 13 | | | 0 | | | $ | 0 | | | $ | 1,281,018 | | | $ | (10,407) | | | $ | 356,101 | | | 444 | | | $ | (6,000) | | | $ | 1,620,725 | | | $ | 0 | |
|
| | | | | | | | | | | | | | | | | | | | |
Partners’ Equity (Deficit)
Hostess Holdings, LP (Predecessor) |
|
| Class A |
| Class C |
| Total Partners’
Equity (Deficit) |
| Non-controlling
Interest |
| Balance – January 1, 2015 | | $ | 191,989 | | | $ | 53,100 | | | $ | 245,089 |
| | $ | 4,267 |
|
| Distributions to partners | | (533,030 | ) | | (419,823 | ) | | (952,853 | ) | | (46,765 | ) |
| Unit based compensation | | 948 | | | 433 | | | 1,381 |
| | — |
|
| Net income | | 64,009 | | | 20,244 | | | 84,253 |
| | 4,507 |
|
| Balance – December 31, 2015 |
| (276,084 | ) |
| (346,046 | ) |
| (622,130 | ) |
| (37,991 | ) |
| Distributions to partners |
| (9,817 | ) |
| (13,765 | ) |
| (23,582 | ) |
| (1,027 | ) |
| Unit based compensation |
| 1,945 | |
| 1,945 | |
| 3,890 |
|
| — |
|
| Net income |
| 28,605 | |
| 28,606 | |
| 57,211 |
|
| 3,214 |
|
| Balance – November 3, 2016 |
| $ | (255,351 | ) |
| $ | (329,260 | ) |
| $ | (584,611 | ) |
| $ | (35,804 | ) |
|
| | | | | | | | | | | | | | | | | | | | | | | | | | | | | | | | | | |
| | Stockholders’ Equity Hostess Brands, Inc. (Successor) |
| |
| | | Class A Voting
Common Stock | | Class B Voting
Common Stock | | Additional
Paid-in Capital | | Accumulated Other Comprehensive Loss | | Accumulated
Losses / Retained Earnings | | Total
Stockholders’
Equity | | Non-controlling
Interest |
| | | Shares | | Amount | | Shares | | Amount | | | | | | | | | | |
| | Balance–November 4, 2016 | 97,589,217 |
| | $ | 10 |
| | 29,870,688 |
| | $ | 3 |
| | $ | 901,157 |
| | $ | — |
| | $ | (11,214 | ) | | $ | 889,956 |
| | $ | 326,601 |
|
| | Comprehensive income | — |
| | — |
| | — |
| | — |
| | — |
| | — |
| | (4,404 | ) | | (4,404 | ) | | (4,081 | ) |
| | Share-based compensation | — |
| | — |
| | 2,496,000 |
| | — |
| | 5,718 |
| | — |
| | — |
| | 5,718 |
| | 17,889 |
|
| | Exchanges | 661,700 |
| | — |
| | (661,700 | ) | | — |
| | 6,217 |
| | — |
| | — |
| | 6,217 |
| | (6,217 | ) |
| | Tax receivable agreement arising from exchanges, net of income taxes of $420 | — |
| | — |
| | — |
| | — |
| | (268 | ) | | — |
| | — |
| | (268 | ) | | — |
|
| | Balance–December 31, 2016 | 98,250,917 |
| | 10 |
| | 31,704,988 |
| | 3 |
| | 912,824 |
| | — |
| | (15,618 | ) | | 897,219 |
| | 334,192 |
|
| | Comprehensive income | — |
| | — |
| | — |
| | — |
| | — |
| | 1,318 |
| | 223,897 |
| | 225,215 |
| | 34,881 |
|
| | Share-based compensation, net of income taxes of $2,610 | 154,849 |
| | — |
| | — |
| | — |
| | 4,803 |
| | — |
| | — |
| | 4,803 |
| | — |
|
| | Exchanges | 1,385,424 |
| | — |
| | (1,385,424 | ) | | — |
| | 13,848 |
| | — |
| | — |
| | 13,848 |
| | (13,848 | ) |
| | Distributions | — |
| | — |
| | — |
| | — |
| | — |
| | — |
| | — |
| | — |
| | (12,985 | ) |
| | Payment of taxes for employee stock awards | — |
| | — |
| | — |
| | — |
| | (436 | ) | | — |
| | — |
| | (436 | ) | | — |
|
| | Exercise of public warrants | 55 |
| | — |
| | — |
| | — |
| | 1 |
| | — |
| | — |
| | 1 |
| | — |
|
| | Tax receivable agreement arising from exchanges, net of income taxes of $1,898 | — |
| | — |
| | — |
| | — |
| | (10,317 | ) | | — |
| | — |
| | (10,317 | ) | | — |
|
| | Balance–December 31, 2017 | 99,791,245 |
| | $ | 10 |
| | 30,319,564 |
| | $ | 3 |
| | $ | 920,723 |
| | $ | 1,318 |
| | $ | 208,279 |
| | $ | 1,130,333 |
| | $ | 342,240 |
|
See accompanying notes to the consolidated financial statements.
HOSTESS BRANDS, INC.
CONSOLIDATED STATEMENTS OF CASH FLOWS
(Amounts in thousands)
|
| | | | | | | | | | | | | | | | |
| Year Ended
December 31, 2017 |
| November 4, 2016
through
December 31, 2016 |
|
| January 1, 2016
through
November 3, 2016 |
| Year Ended
December 31, 2015 |
| (Successor) |
| (Successor) |
|
| (Predecessor) |
| (Predecessor) |
| Operating activities | | | | | | | | |
| Net income (loss) | $ | 258,108 |
|
| $ | (8,485 | ) |
|
| $ | 60,425 |
|
| $ | 88,760 |
|
| Depreciation and amortization | 38,170 |
|
| 5,843 |
|
|
| 10,265 |
|
| 9,836 |
|
| Impairment of property | 1,003 |
|
| — |
|
|
| 7,300 |
|
| 2,700 |
|
| Non-cash loss (gain) on debt modification | 1,453 |
|
| (3,974 | ) |
|
| — |
|
| 16,005 |
|
| Debt discount (premium) amortization | (925 | ) |
| (197 | ) |
|
| 2,790 |
|
| 3,423 |
|
| Tax receivable agreement remeasurement | (50,222 | ) |
| — |
|
|
| — |
|
| — |
|
| Stock-based compensation | 7,413 |
|
| 26,748 |
|
|
| 3,890 |
|
| 1,381 |
|
| Loss on sale/abandonment of property and equipment | 11 |
|
| — |
|
|
| 2,551 |
|
| 3,001 |
|
| Deferred taxes | (81,270 | ) |
| (7,815 | ) |
|
| — |
|
| — |
|
| Change in operating assets and liabilities | | | | | | | | |
| Accounts receivable | (11,775 | ) |
| 3,705 |
|
|
| (19,869 | ) |
| (1,077 | ) |
| Inventories | (3,901 | ) |
| 8,895 |
|
|
| (2,994 | ) |
| (5,611 | ) |
| Prepaids and other current assets | (3,039 | ) |
| (1,694 | ) |
|
| (1,049 | ) |
| (441 | ) |
| Accounts payable and accrued expenses | 4,839 |
|
| (11,296 | ) |
|
| 33,886 |
|
| 10,480 |
|
| Customer trade allowances | 3,820 |
|
| 2,225 |
|
|
| 4,828 |
|
| 4,364 |
|
| Other | — |
|
| (344 | ) |
|
| 198 |
|
| 151 |
|
| Net cash provided by operating activities | 163,685 |
|
| 13,611 |
|
|
| 102,221 |
|
| 132,972 |
|
|
|
|
|
|
|
|
|
|
|
|
|
|
| Investing activities |
|
|
|
|
|
|
|
|
|
|
|
|
| Purchases of property and equipment | (32,913 | ) |
| (6,494 | ) |
|
| (28,633 | ) |
| (25,082 | ) |
| Acquisition of business, net of cash | — |
|
| (421,242 | ) |
|
| (49,735 | ) |
| — |
|
| Proceeds from sale of assets | 85 |
|
| — |
|
|
| 4,000 |
|
| 425 |
|
| Proceeds from sale of marketable securities | — |
|
| — |
|
|
| — |
|
| 42,960 |
|
| Restricted cash release | — |
|
| — |
|
|
| — |
|
| 1,762 |
|
| Acquisition and development of software assets | (2,381 | ) |
| (460 | ) |
|
| (2,211 | ) |
| (2,185 | ) |
| Net cash used in investing activities | (35,209 | ) |
| (428,196 | ) |
|
| (76,579 | ) |
| 17,880 |
|
|
|
|
|
|
|
|
|
|
|
|
|
|
| Financing activities |
|
|
|
|
|
|
|
|
|
|
|
|
| Repayments of long-term debt and capital lease obligation | (5,144 | ) |
| (217,400 | ) |
|
| (6,987 | ) |
| (498,565 | ) |
| Proceeds from issuance of long-term debt | — |
|
| — |
|
|
| — |
|
| 1,225,000 |
|
| Payment of deferred underwriting costs | — |
|
| (13,125 | ) |
|
| — |
|
| — |
|
| Debt fees | (1,066 | ) |
| (1,820 | ) |
|
| — |
|
| (22,819 | ) |
| Distributions to partners | — |
|
| — |
|
|
| (23,582 | ) |
| (952,853 | ) |
| Distributions to non-controlling interest | (12,985 | ) |
| — |
|
|
| (1,027 | ) |
| (46,765 | ) |
| Payment of taxes related to the net issuance of employee stock awards | (436 | ) | | — |
| | | — |
| | — |
|
| Proceeds from the exercise of warrants | 1 |
|
| — |
|
|
| — |
|
| — |
|
| Net cash used in financing activities | (19,630 | ) |
| (232,345 | ) |
|
| (31,596 | ) |
| (296,002 | ) |
| Net increase (decrease) in cash and cash equivalents | 108,846 |
|
| (646,930 | ) |
|
| (5,954 | ) |
| (145,150 | ) |
| Cash and cash equivalents at beginning of period | 26,855 |
|
| 673,785 |
|
|
| 64,473 |
|
| 209,623 |
|
| Cash and cash equivalents at end of period | $ | 135,701 |
|
| $ | 26,855 |
|
|
| $ | 58,519 |
|
| $ | 64,473 |
|
|
|
|
|
|
|
|
|
|
|
|
|
|
| Supplemental Disclosures of Cash Flow Information |
|
|
|
|
|
|
|
|
|
|
|
|
| Interest | $ | 45,431 |
|
| $ | — |
|
|
| $ | 68,606 |
|
| $ | 34,710 |
|
| Taxes paid | $ | 16,617 |
|
| $ | 43 |
|
|
| $ | — |
|
| $ | — |
|
| Supplemental disclosure of non-cash investing |
|
|
|
|
|
|
|
|
|
|
|
|
| Purchases of property and equipment funded by accounts payable | $ | 1,089 |
|
| $ | 673 |
|
|
| $ | 633 |
|
| $ | (15 | ) |
| | | | | | | | | | | | | | | | | | | | |
| (As Restated) | | | |
| Year Ended
December 31,
2020 | | Year Ended
December 31,
2019 | | Year Ended
December 31,
2018 | | | |
| Operating activities | | | | | | | | |
| Net income | $ | 108,297 | | | $ | 18,749 | | | $ | 160,582 | | | | |
| Depreciation and amortization | 54,940 | | | 43,334 | | | 41,411 | | | | |
| Impairment and loss on sale of assets | 3,329 | | | 1,976 | | | 4,970 | | | | |
| Non-cash loss on debt modification | 0 | | | 531 | | | 0 | | | | |
| Debt discount (premium) amortization | 1,289 | | | (747) | | | (1,079) | | | | |
| Tax receivable agreement remeasurement and gain on buyout | 760 | | | 185 | | | (14,237) | | | | |
| Change in fair value of warrant liabilities | (39,941) | | | 58,816 | | | (79,156) | | | | |
| Non-cash fees on sale of business | 0 | | | 1,414 | | | 0 | | | | |
| Unrealized loss (gain) on foreign currency | 2,061 | | | (7,128) | | | 0 | | | | |
| Non-cash lease expense | 571 | | | 0 | | | 0 | | | | |
| Share-based compensation | 8,671 | | | 9,231 | | | 5,600 | | | | |
| | | | | | | | |
| Deferred taxes | 16,806 | | | 14,121 | | | 10,255 | | | | |
| Change in operating assets and liabilities, net of acquisitions and dispositions: | | | | | | | | |
| Accounts receivable | 4,434 | | | (2,570) | | | (3,667) | | | | |
| Inventories | 5,824 | | | (12,477) | | | 3,569 | | | | |
| Prepaids and other current assets | (5,301) | | | 265 | | | (510) | | | | |
| Accounts payable and accrued expenses | 1,900 | | | 14,072 | | | 14,418 | | | | |
| Customer trade allowances | (4,397) | | | 4,202 | | | 1,499 | | | | |
| | | | | | | | |
| Net cash provided by operating activities | 159,243 | | | 143,974 | | | 143,655 | | | | |
| | | | | | | | |
| Investing activities | | | | | | | | |
| Purchases of property and equipment | (51,983) | | | (34,875) | | | (44,585) | | | | |
| Acquisition of business, net of cash | (316,013) | | | 0 | | | (23,160) | | | | |
| Proceeds from sale of business, net of cash | 0 | | | 63,345 | | | 0 | | | | |
| Proceeds from sale of assets | 0 | | | 0 | | | 639 | | | | |
| Acquisition and development of software assets | (6,269) | | | (5,609) | | | (3,839) | | | | |
| Net cash provided by (used in) investing activities | (374,265) | | | 22,861 | | | (70,945) | | | | |
| Financing activities | | | | | | | | |
| Repayments of long-term debt and financing lease obligations | (11,168) | | | (9,894) | | | (10,105) | | | | |
| Proceeds from long-term debt origination, net of fees paid | 136,888 | | | 0 | | | 0 | | | | |
| Debt refinancing costs | 0 | | | (7,433) | | | 0 | | | | |
| Distributions to non-controlling interest | (3,422) | | | (6,658) | | | (9,551) | | | | |
| Repurchase of warrants | (2,000) | | | 0 | | | 0 | | | | |
| Repurchase of common stock | (6,000) | | | 0 | | | 0 | | | | |
| Payment of taxes related to the net issuance of employee stock awards | (1,440) | | | (1,431) | | | (1,025) | | | | |
| Payments on tax receivable agreement | (10,327) | | | (2,732) | | | (41,353) | | | | |
| Proceeds from the exercise of warrants | 690 | | | 23 | | | 0 | | | | |
| Net cash provided by (used in) financing activities | 103,221 | | | (28,125) | | | (62,034) | | | | |
| Effect of exchange rate changes on cash and cash equivalents | (252) | | | 0 | | | 0 | | | | |
| Net increase (decrease) in cash and cash equivalents | (112,053) | | | 138,710 | | | 10,676 | | | | |
| Cash and cash equivalents at beginning of period | 285,087 | | | 146,377 | | | 135,701 | | | | |
| Cash and cash equivalents at end of period | $ | 173,034 | | | $ | 285,087 | | | $ | 146,377 | | | | |
| | | | | | | | |
| Supplemental Disclosures of Cash Flow Information | | | | | | | | |
| Interest paid | $ | 41,776 | | | $ | 43,986 | | | $ | 37,617 | | | | |
| Taxes paid | $ | 5,825 | | | $ | 1,840 | | | $ | 3,422 | | | | |
| Supplemental disclosure of non-cash investing | | | | | | | | |
| Accrued capital expenditures | $ | 4,718 | | | $ | 2,910 | | | $ | 7,858 | | | | |
See accompanying notes to the consolidated financial statements.
HOSTESS BRANDS, INC.
NOTES TO CONSOLIDATED FINANCIAL STATEMENTS
1. Summary of Significant Accounting Policies
Description of Business
Hostess Brands, Inc. is a Delaware corporation headquartered in Kansas City, Missouri.Lenexa, Kansas. The consolidated financial statements include the accounts of Hostess Brands, Inc. and its wholly owned subsidiaries (collectively, the “Company”). The Company is a leading packaged food company focused on developing, manufacturing, marketing, selling and distributing freshsnack products, including sweet baked goods, cookies and wafers in the United States.North America. The HostessHostess® brand dates back to 1919 when the HostessHostess® CupCake was introduced to the public, followed by Twinkies®Twinkies® in 1930. In 2013, the Legacy Hostess Equityholders (as defined below) acquired the Hostess brand out of the bankruptcy liquidation proceedings of its prior owners, free and clear of all past liabilities. After a brief hiatus in production, the Company began providing Hostess products to consumers and retailers across the nation in July 2013. Today, the Company produces a variety of new and classic treats primarily under the Hostess® and Dolly Madison® group of brands, including Twinkies®, CupCakes, Ding Dongs®, HoHos®, Donettes® and Fruit Pies.
On November 4, 2016 (the “Closing Date”), in a transaction referred to as the “Business Combination,” the Company, then known as Gores Holdings, Inc. (“Gores Holdings”), acquired a controlling interest in Hostess Holdings, L.P. (“Hostess Holdings”), an entity owned indirectly by C. Dean Metropoulos and certain equity funds managed by affiliates of Apollo Global Management, LLC (the “Apollo Funds”, and together with entities controlled by Mr. Metropoulos, the “Legacy Hostess Equityholders”). Our “Sponsor” refers to Gores Sponsor, LLC, a Delaware limited liability company and the principal stockholder of Gores Holdings, Inc. prior to the Business Combination, and the “The Gores Group” refers to The Gores Group LLC, an affiliate of our Sponsor. In connection with the closing of the Business Combination, Gores Holdings, Inc. changed its name to “Hostess Brands, Inc.” and its trading symbols on NASDAQ from “GRSH” and “GRSHW,” to “TWNK” and “TWNKW”.
As a result of the Business Combination, for accounting purposes, Hostess Brands, Inc. is the acquirer and Hostess Holdings is the acquired party and accounting predecessor. The Company’s financial statement presentation includes the financial statements of Hostess Holdings and its subsidiaries as “Predecessor” for periods prior to the completion of the Business Combination and of Hostess Brands, Inc., including the consolidation of Hostess Holdings and its subsidiaries, for periods from and after the Closing Date (referred to as the “Successor”). Unless the context requires otherwise, the “Company” refers to the Predecessor for periods prior to the Business Combination and to the Successor for periods after the Business Combination.
On May 10, 2016, the Company purchased the stock of Superior Cake Products, Inc. (“Superior”) located in Southbridge, Massachusetts. Superior manufactures and distributes eclairs, madeleines, brownies, and iced cookies sold in the “In-Store Bakery” section of retailers.
Basis of Presentation
The Company’s operations are conducted through operating subsidiaries that are wholly-owned by the Company. The consolidated financial statements included herein have been prepared in accordance with generally accepted accounting principles in the United States of America (“U.S. GAAP”) and the rules and regulations of the Securities and Exchange Commission (“SEC”). The accompanying consolidated financial statements include the accounts of the Company and its wholly-owned, majority-owned or controlled subsidiaries, collectively referred to as either Hostess or the Company. All intercompany balances and transactions have been eliminated in consolidation. Certain prior period amounts have been reclassified to conform with current period presentation. As discussed in Note 2. Restatement of Previously Issued Financial Statements, the consolidated financial statements have been restated to reflect certain warrants as liabilities rather than equity.
Prior to the final exchange of Class B stock (as described below), the Company's operating subsidiaries were wholly-owned by Hostess Holdings, a direct subsidiary of Hostess Brands, Inc. Hostess Brands, Inc. held 100% of the general partnership interest in Hostess Holdings and a majority of the limited partnership interests therein and consolidated Hostess Holdings in the Company’s consolidated financial statements. The remaining limited partnership interests in Hostess Holdings were held by the holders of Class B stock.
C. Dean Metropoulos and entities under his control (the “Metropoulos Entities”) held their equity investment in the Company primarily through Class B limited partnership units (“Class B Units”) in Hostess Holdings LP (“Hostess Holdings”) and an equal number of shares of the Company’s Class B common stock (“Class B Stock”). Each Class B Unit, together with a share of Class B Stock held by the Metropoulos Entities, was exchangeable for a share of the Company’s Class A common stock. The interest of the Class B Units was reflected in the consolidated financial statements as a non-controlling interest. During the year ended December 31, 2020, the Metropoulos Entities exchanged all of their remaining Class B Units and Class B Stock for Class A common stock. At December 31, 2020, there are no outstanding Class B Units or Class B stock and there is no non-controlling interest reported on the December 31, 2020 consolidated balance sheet.
Subsequent to the Metropoulos Entities' final exchange of Class B Units, all subsidiaries including, Hostess Holdings, are wholly owned by the Company.
ThePrior to the final exchange of Class B Units, the Company has determined that Hostess Holdings, a limited partnership, iswas a variable interest entity (“VIE”) and that the Company iswas the primary beneficiary of the VIE. The Company determined that, throughdue to its ownership of Hostess GP, it hasHoldings’ general partnership units, the Company had the power to direct all of the activities of Hostess Holdings, with no substantive kick-out rights or participating rights by the limited partners individually or as a group. Hostess Holdings constitutesconstituted the majority of the assets of the Company.
Mr. Metropoulos and the Metropoulos Entities hold their equity investment in the company primarily through Class B limited partnership units in the Company’s subsidiary, Hostess Holdings (“Class B Units”) and an equal number of shares of the Company’s Class B common stock (“Class B Stock”)The Company has 1 reportable segment: Snacking (formerly known as Sweet Baked Goods). The Company’s Class B Stock has voting, but no economic, rights, while Hostess Holdings’ Class B Units have economic, but no voting, rights. Each Class B Unit, together with a share of Class B Stock held by the Metropoulos Entities, is exchangeable for a share of the Company’s Class A common stock (or at the option of the Company, the cash equivalent thereof). The interest of the Metropoulos Entities in Hostess Holdings’ Class B Units is reflected in our Consolidated Financial Statements as a non-controlling interest. The non-controlling interest was recorded at fair value at November 4, 2016 as a result of the Business Combination.
For the Predecessor periods, Hostess Holdings consolidated the financial position and results of operations of New Hostess Holdco LLC. The portion of the New Hostess Holdco, LLC not owned by Hostess Holdings was recognized as a non-controlling interest in the Consolidated Financial Statements. The non-controlling interest presented in the accompanying consolidated balance sheet represents the amount of cash that would be payable to the non-controlling interest holders if the Company were liquidated at book value as of the balance sheet date. The difference between the calculated liquidation distribution amounts at the beginning and the end of the reporting period, is the share of the earnings or losses allocated to non-controlling interest for the period.
For the year ended December 31, 2017,2019, the Company recorded adjustments to previously reported gains on debt modifications, resulting in a pre-tax charge of $1.6 million. The Company has determined that this correction of an error is immaterial to the current and prior reported periods.
The Company has twohad 2 reportable segments: Sweet Baked Goods and In-Store Bakery. Previously,The Company sold its In-Store Bakery operations on August 30, 2019.
Principles of Consolidation
The accompanying consolidated financial statements include the Company’s reportable segments were Sweet Baked Goods and Other. A change in the Company’s internal reporting structure during the last quarteraccounts of 2017 caused the Company and its majority-owned or controlled subsidiaries (including those for which the Company was the primary beneficiary of a VIE), collectively referred to reassess its reportable segments.as the Company. All intercompany balances and transactions have been eliminated in consolidation.
HOSTESS BRANDS, INC.
NOTES TO CONSOLIDATED FINANCIAL STATEMENTS
Adoption of New Accounting Standards
On January 1, 2020, the Company adopted Accounting Standards Update (“ASU”), 2016-13 Financial Instruments-Credit Losses: Measurement of Credit Losses on Financial Instruments (“Topic 326”). This ASU requires entities to measure the impairment of certain financial instruments, including trade receivables, based on expected losses rather than incurred losses. This ASU is effective for fiscal years beginning after December 15, 2019, with early adoption permitted for financial statement periods beginning after December 15, 2018. The adoption of this standard did not have a material impact on the consolidated financial statements.
On January 1, 2019, the Company adopted ASU No. 2016-02, Leases, along with the related ASUs 2018-01, 2018-10 and 2018-11 (collectively, “Topic 842”). Topic 842 requires a lessee to record on the balance sheet the assets and liabilities for the rights and obligations created by lease terms of more than 12 months. To adopt this standard, the Company utilized a modified retrospective transition method. Under this approach, the results for reporting periods beginning January 1, 2019 are presented under Topic 842. Prior period segment disclosures have been reclassifiedamounts are not adjusted and continue to conformbe reported in accordance with current period presentation.the historic accounting standards. There was no cumulative effect of applying Topic 842 to the opening balance of retained earnings. The Company has elected to apply the practical expedients under Topic 842 which allow entities to not reassess the lease classification for expired or existing leases and to not reassess if expired or existing contracts contain leases under the Topic 842 definition. The Company has also elected to use hindsight when determining the lease term of existing leases. As a result of the adoption, on January 1, 2019, the Company recognized right of use assets of $8.2 million, offset by associated accumulated amortization of $5.2 million and corresponding lease liabilities of $3.0 million. The recognition of leases subsequent to the adoption of Topic 842 is further described in Note 16. Commitments and Contingencies.
Use of Estimates
The preparation of consolidated financial statements in conformity with U.S. GAAP requires management to make estimates and judgments that affect the reported amounts of assets and liabilities at the date of the financial statements and for the reported amounts of revenues and expenses during the reporting period. Management utilizes estimates, including, but not limited to, valuation and useful lives of tangible and intangible assets, valuationinputs used to calculate the Tax Receivable Agreement liability including increases in tax basis related to exchanges, future cash tax savings rate, and the allocation of expected future payments under the liability between short-term and long-term based on when the Company realizes certain tax receivable agreement,attributes and reserves for trade and promotional allowances. Actual results could differ from these estimates.
Cash and Cash Equivalents
The Company considers all highly liquid investments purchased with original maturities of three months or less when purchased as cash equivalents and are recorded at cost. Under the Company’s cash management system, checks that have been issued and are out of the control of the Company, but which have not cleared the bank by the balance sheet date, are reported as a reduction of cash.
Accounts Receivable
Accounts receivable represents amounts invoiced to customers for goods that havewhich the Company’s obligation to the customer has been received by the customer.satisfied. As of December 31, 20172020 and December 31, 2016,2019, the Company’s accounts receivable were $101.0$125.6 million and $89.2$104.9 million, respectively, which have been reduced by allowances for damages occurring during shipment, quality claims and doubtful accounts in the amount of $2.1$3.5 million and $1.9$2.7 million, respectively.
HOSTESS BRANDS, INC.
NOTES TO CONSOLIDATED FINANCIAL STATEMENTS
Inventories
Inventories are stated at the lower of cost or market on a first-in first-out basis.
Abnormal amounts of idle facility expense, freight, handling costs, and wasted material (spoilage) are expensed in the period they are incurred.
The components of inventories are as follows:
| | | (In thousands) | December 31,
2017 | | December 31, 2016 | (In thousands) | December 31,
2020 | | December 31,
2019 |
| | (Successor) | | (Successor) | |
| Ingredients and packaging | $ | 14,826 |
| | $ | 12,712 |
| Ingredients and packaging | $ | 22,965 | | | $ | 21,439 | |
| Finished goods | 15,471 |
| | 14,229 |
| Finished goods | 23,583 | | | 22,513 | |
| Inventory in transit to customers | 4,048 |
| | 3,503 |
| Inventory in transit to customers | 2,800 | | | 3,656 | |
| | $ | 34,345 |
| | $ | 30,444 |
| | $ | 49,348 | | | $ | 47,608 | |
Property and Equipment
Property and equipment acquired in the Business Combinationbusiness combinations were assigned useful lives for purposes of depreciation that the Company believes to be the remaining useful life of such assets. Additions to property and equipment are recorded at cost and depreciated straight line over estimated useful lives of 1015 to 50 years for buildings and land improvements and 3 to 20 years for machinery and equipment. In order to maximize the efficiency of the Company’s operations and to operate the acquired equipment, occasionally the Company will remove and relocate equipment between bakeries. Such removal and relocation costs are expensed as incurred. Reinstallation costs are capitalized if the useful life is extended or the equipment is significantly improved. Otherwise, reinstallation costs are expensed as incurred. Expenditures for repairs and maintenance are charged to expense when incurred. Expenditures for major renewals and betterments, which extend the useful lives of existing property and equipment, are capitalized and depreciated. Upon retirement or disposition of property and equipment, the capitalized cost and related accumulated depreciation are removed from the balance sheet and any resulting gain or loss is recognized in the Consolidated Statementsconsolidated statements of Operations.operations.
The Company assesses property, plant and equipment for impairment when circumstances arise which could change its use or expected life. For the yearyears ended December 31, 2017 (Successor),2020, 2019 and 2018 the Company recorded an impairment losslosses of $1.0$2.9 million, $0.5 million and $1.4 million, respectively, in the Snacking segment (formerly referred to as Sweet Baked Goods, segment related to a production line that was idled when the related production was transitioned to a third party. From January 1, 2016 through November 3, 2016 (Predecessor), the Company recorded an impairment loss of $7.3 million in the Sweet Baked Goods segment when it closed multiple production lines at the Indianapolis, Indiana bakery and transitioned production to other facilities. The measurement of this loss was based on Level 3 inputs within the fair value measurement hierarchy.
or “SBG”).
Software Costs
Costs associated with computer software projects during the preliminary project stage are expensed as incurred. Once management authorizes and commits to funding a project, appropriate application development stage costs are capitalized. Capitalization ceases when the project is substantially complete and the software is ready for its intended use. Upgrades and enhancements to capitalized software are capitalized when such enhancements are determined to provide additional functionality. Training and maintenance costs associated with software applications are expensed as incurred.
Included in the caption “Other assets” in the Consolidated Balance Sheetsconsolidated balance sheets is capitalized software in the amount of approximately $7.3$14.7 million and $7.4$11.9 million at December 31, 20172020 and December 31, 2016,2019, respectively. Capitalized software costs are amortized over their estimated useful life of up to five years commencing when such assets are ready for their intended use. Software amortization expense included in general and administrative expense in the consolidated statements of operations was $2.5$5.3 million for the year ended December 31, 2017, $1.52020, and $2.7 million from January 1, 2016 through November 3, 2016 (Predecessor), $0.3 million from November 4, 2016 through December 31, 2016 (Successor), and $1.4 million (Predecessor), for the yearboth years ended December 31, 2015.
2019 and 2018.
Goodwill and Intangible Assets
At December 31, 20172020 and 2016,2019, the goodwill balances of $579.4$706.6 million and $588.5$535.9 million, respectively, represent the excess of the amount the SuccessorCompany paid for the Business Combinationacquisition of Hostess Holdings from the Metropoulos Entities and other former equity holders in a 2016 transaction over the fair value of the assets acquired and liabilities assumed. Goodwill that resulted fromThe December 31, 2020 goodwill balance also reflects the Business Combinationexcess of the amount the Company paid for the acquisition of Voortman over the fair value of the assets acquired and liabilities assumed. The resulting goodwill was allocated to the Sweet Baked GoodsSnacking reporting segment.
HOSTESS BRANDS, INC.
NOTES TO CONSOLIDATED FINANCIAL STATEMENTS
Goodwill by reporting segment is tested for impairment annually by either performing a qualitative evaluation or a quantitative test. The qualitative evaluation is an assessment of factors to determine whether it is more likely than not that the fair value of a reporting segment is less than its carrying amount, including goodwill. The Company may elect not to perform the qualitative assessment for some or all reporting units and perform a quantitative impairment test. For the In-Store Bakery segment.2020 and 2019 annual impairment tests, the Company elected to perform the qualitative test. No indicators of impairment were noted.
The Company’s indefinite-lived intangible assets consist of trademarks and trade names. The $1,408.8$1,538.6 million balanceand $1,408.6 million balances at December 31, 20172020 and 2016, was2019, respectively, were recognized as part of the Business Combination.2016 acquisition of Hostess Holdings and the 2018 acquisition of the Cloverhill Business. The December 31, 2020 balance also includes trademarks and trade names from the acquisition of Voortman. The trademarks and trade names are integral to the Company’s identity and are expected to contribute indefinitely to its corporate cash flows. Fair value for trademarks and tradenamestrade names was determined using the income approach, which is considered to be Level 3 within the fair value hierarchy. The application of the income approach was premised on a royalty savings method, whereby the trademark and tradenamestrade names are valued by reference to the amount of royalty income itthey could generate if it wasthey were licensed, in an arm’s‑lengtharm’s-length transaction, to a third party. These assets have been assigned an indefinite life and therefore are not amortized but rather evaluated for impairment annually.annually using the qualitative or quantitative methods similar to goodwill. For the quantitative assessment, the valuation of trademarks and trade names are determined using the relief of royalty method. Significant assumptions used in this method include future trends in sales, a royalty rate and a discount rate to be applied to the forecasted revenue stream.
During the year ended December 31, 2019, the Company recognized an impairment charge of $1.0 million to the In-Store Bakery goodwill and intangibles. See Note 8. Goodwill and Intangible Assets for more information on impairment charges.
Also, the Company has finite-lived intangible assets, net of accumulated amortization of $429.3 million and $444.7 million on December 31, 2020 and 2019 respectively, that consist of customer relationships. The $514.2 million and $538.1 million balances on December 31, 2017 and 2016 respectively,relationships that were recognized as part of the Business Combination.Hostess Holdings, Voortman and Cloverhill acquisitions. For customer relationships, the application of the income approach (Level 3) was premised on an excess earnings method, whereby the customer relationships are valued by the earnings expected to be generated from those customers after other capital charges. Definite-lived intangible assets are being amortized on a straight‑linestraight-line basis over the estimated remaining useful lives of the assets.
During the year ended December 31, 2017, the Company changed its policy and will perform an impairment assessment each year as of October 1 (previously September 30).
Reserves for Self-Insurance Benefits
The Company’s employee health plan is self-insured by the Company up to a stop-loss amount of $0.3 million for each participant per plan year. In addition, the Company maintains insurance programs covering its exposure to workers’ compensation. Such programs include the retention of certain levels of risks and costs through high deductibles and other risk retention strategies. Included in the accrued expenses in the Consolidated Balance Sheetsconsolidated balance sheets is a reserve for healthcare claims in the amount of approximately $1.1$2.2 million and $1.7$2.0 million at December 31, 20172020 and December 31, 2016,2019, respectively, and a reserve for workers’ compensation claims of $1.7$2.9 million and $1.3$2.7 million at December 31, 20172020 and 2019, respectively.
Leases
Subsequent to its adoption of Topic 842 on January 1, 2019, the Company recognizes a right of use asset and corresponding lease liability on the consolidated balance sheet for all lease transactions with terms of more than 12 months. Agreements are determined to contain a lease if they convey the use and control of an underlying physical asset. Based on the nature of the lease transaction, leases are either classified as financing or operating. Under both classifications, the right of use asset and liability are initially valued based on the present value of the future minimum lease payments using an effective borrowing rate at the inception of the lease. The Company determined the effective borrowing rate based on its expected incremental borrowing rate on collateralized debt. At December 31, 2016, respectively.2020, 3.6% was the weighted average effective borrowing rates for outstanding operating leases.
HOSTESS BRANDS, INC.
NOTES TO CONSOLIDATED FINANCIAL STATEMENTS
Under a financing lease, interest expense related to the lease liability is recognized over the lease term using an effective interest rate method and right of use assets are amortized straight-line over the term of the lease. Under an operating lease, minimum lease payments are expensed straight-line over the lease term. Lease liabilities are amortized using an effective interest rate method and right of use assets are reduced based on the excess of the sum of the straight-line lease expense and the reduction of the lease liability over the actual lease payments. At December 31, 2020, the weighted average remaining terms on operating leases were approximately eight years.
Variable lease payments, such as taxes and insurance, are expensed as incurred. Expenses related to leases with original terms less than 12 months (short-term leases) are expensed as incurred. For all leases related to distribution, bakery and corporate facilities, the Company has elected not to separate non-lease components from lease components.
At December 31, 2020, right of use assets related to operating leases are included in property and equipment, net on the consolidated balance sheet (see Note 6. Property and Equipment). Lease liabilities for operating leases are included in the current and non-current portions of long-term debt and lease obligations on the consolidated balance sheet (see Note 11. Debt).
Revenue Recognition
Net revenue consists primarily of sales of packaged food products. The Company invoicesrecognizes revenue when the obligations under the terms of its agreements with customers have been satisfied. The Company’s obligation is satisfied when control of the product is transferred to its customers along with the title, risk of loss and rewards of ownership. Depending on the arrangement with the customer, these criteria are met either at the time the product is shipped or when the product is received by such customer.
Customers are invoiced at the time of shipment of its product, but only recognizes revenue upon delivery to retail customers and distributors as the Company arranges freight and is generally responsible, along with the Company’s common carriers, for any damage that occurs during transportation. The Company allows retail customers and distributors to return product that is damaged or defective at the time of delivery. A provision for payment discounts and product return allowances, which is estimatedcustomer pickup based upon the Company’s historical performance, management’s experience and current economic trends, is recorded as a reduction of sales in the same period that the revenue is recognized.
The Company’s products are sold on credit terms established in accordance with industry practice, which typically requirespractice. Invoices generally require payment within 30 days of invoice date. days. Net revenue is recognized in an amount that reflects the consideration the Company expects to be entitled to in exchange for that product. Amounts billed to customers related to shipping and handling are classified as net revenue. A provision for payment discounts and other allowances is estimated based on the Company’s historical performance or specific terms with the customer. The Company generally does not accept product returns and provides these allowances for anticipated expired or damaged products.
Trade promotions, consisting primarily of customer pricing allowances and merchandising funds and consumer coupons are offered through various programs to customers and consumers. Sales are recorded net ofcustomers. A provision for estimated trade promotion spending, whichpromotions is recognizedrecorded as incurred ata reduction of revenue in the time of sale.same period when the sale is recognized.
The Company participates in a number of promotional activities including, but not limited to, offeringalso offers rebates for achieving various performancebased on purchase levels, offering incentives for product placement locations in retail stores offering pricing discounts for those customers electing to provide their own transportation for shipment of product and offering subsidies for advertising placed by customers. In lieu of accepting returns, the Company offers an allowance for anticipated expired and damaged products to certain customers. The ultimate cost of these programs dependsis dependent on retailer performancecertain factors such as actual purchase volumes or customer activities and is the subject of significant management estimates. The Company recordsaccounts for these programs as expensevariable consideration and recognizes a reduction in revenue in the estimated ultimate costsame period as the underlying program.
For product produced by third parties, management evaluates whether the Company is the principal (i.e., report revenue on a gross basis) or agent (i.e., report revenue on a net basis). Management has determined that it is the principal in all cases, since it establishes its own pricing for such product, generally assumes the credit risk for amounts billed to its customers, and often takes physical control of the program at the later of the recognition of theproduct before it is shipped to customers.
HOSTESS BRANDS, INC.
NOTES TO CONSOLIDATED FINANCIAL STATEMENTS
The following tables disaggregate revenue for the underlying sale, or when the trade allowance is offered. In accordance with the authoritative guidance for revenue recognition, the cost of these programs is classified in the Consolidated Statements of Operations as a reduction of net sales. Also, in accordance with the guidance, coupon redemption costs are also recognized as reductions of net revenues when issued.by geographical market and category:
| | | | | | | | | | | | | | | | | | | | | | | |
| Year Ended December 31, 2020 |
| (In thousands) | Sweet Baked Goods | | In-Store Bakery | | Cookies | | Total |
| United States | $ | 920,388 | | | $ | 0 | | | $ | 77,692 | | | $ | 998,080 | |
| Canada | 0 | | | 0 | | | 18,529 | | | 18,529 | |
| $ | 920,388 | | | $ | 0 | | | $ | 96,221 | | | $ | 1,016,609 | |
| | | | | | | | | | | | | | | | | | | | | | | |
| Year Ended December 31, 2019 |
| (In thousands) | Sweet Baked Goods | | In-Store Bakery | | Cookies | | Total |
| United States | $ | 878,973 | | | $ | 28,702 | | | $ | 0 | | | $ | 907,675 | |
| Canada | 0 | | | 0 | | | 0 | | | 0 | |
| $ | 878,973 | | | $ | 28,702 | | | $ | 0 | | | $ | 907,675 | |
The Company has one customer that accounted for 10% or more of the Company’s total net revenue. The percentage of total net revenues for this customer is presented below by segment:
| | | | | | | | | | | | | | | | | | | | |
| Year Ended
December 31,
2020 | | Year Ended
December 31,
2019 | | Year Ended
December 31,
2018 | | | |
| Snacking | 20.2 | % | | 23.3 | % | | 20.4 | % | | | |
| In-Store Bakery | 0.0 | % | | 0.3 | % | | 0.6 | % | | | |
| Total | 20.2 | % | | 23.6 | % | | 21.0 | % | | | |
|
| | | | | | | | | | | | | |
(% of Consolidated Net Revenues) | December 31,
2017 | | | From
November 4, 2016
through
December 31, 2016 | | | From January 1, 2016
through
November 3, 2016 | | Year Ended December 31, 2015 |
| | (Successor) | | | (Successor) | | | (Predecessor) | | (Predecessor) |
| Sweet Baked Goods | 19.7 | % | | | 19.3 | % | | | 21.2 | % | | 21.0 | % |
| In-Store Bakery | 0.7 | % | | | 0.7 | % | | | 0.4 | % | | 0.0 | % |
| Total | 20.4 | % | | | 20.0 | % | | | 21.6 | % | | 21.0 | % |
Foreign Currency Remeasurement
Certain Voortman sales and production related costs are denominated in the Canadian dollar (“CAD”). CAD transactions have been remeasured into U.S. dollars (“USD”) on the consolidated statement of operations using the average exchange rate for the reporting period. Balances expected to be settled in CAD have been remeasured into USD on the consolidated balance sheet using the exchange rate at the end of the period. During the year ended December 31, 2020, the Company recognized losses on remeasurement of $1.8 million, reported within other expense on the consolidated statement of operations.
Equity Compensation
The grant date fair values of stock options are valued using the Black-Scholes option-pricing model, including a simplified method to estimate the number of periods to exercise date (i.e., the expected option term). Management has determined that the equity plan has not been in place for a sufficient amount of time to estimate the post vesting exercise behavior. Therefore, it will continue to use this simplified method until such time as it has sufficient history to provide a reasonable basis to estimate the expected term. Forfeitures are recognized as a reduction of expense as incurred.
For awards which have performancemarket conditions, compensation expense is calculated based on the number of shares expected to vest after assessing the probability that the performance or market criteria will be met. The equity-basedFor market-based awards, probability is not reassessed and compensation expense net of forfeitures, is recognized using a straight-line basis over the requisite service period of the awards, which correspondsnot remeasured subsequent to the vesting periods ofinitial assessment on the awards.grant date.
HOSTESS BRANDS, INC.
NOTES TO CONSOLIDATED FINANCIAL STATEMENTS
Collective Bargaining Agreements
As of December 31, 2017,2020, approximately 26.9%41%, of thethe Company’s employees are covered by these collective bargaining agreements. None of these agreements including 18.4% subject to collective bargaining agreements which will expire before December 31, 2018.2021.
Employee Benefit Plans
The Company provides several benefit plans for employees depending upon employee eligibility. The Company has a health care plan, a defined contribution retirement plan (401(k)), company-sponsored life insurance, and other benefit plans. The Company’s contributions to the defined contribution retirement plan were $1.1$2.0 million, $1.8 million and $1.9 million for the yearyears ended December 31, 2017, compared to no contributions for the period from November 4, 2016 through December 31, 2016 (Successor), $1.1 million for the period from January 1, 2016 through November 3, 2016 (Predecessor),2020, 2019 and $1.0 million of contributions for the year ended December 31, 2015.
2018, respectively.
The Company offers an annual incentive plan based upon annual operating targets. Final payout is approved by the board of directors. The Company has accrued $4.3 million and $6.0 million at December 31, 2017 (Successor) and December 31, 2016 (Successor), respectively.
The Company has also hasdirectors or a long-term incentive plan for certain director-level employees, payment under which is contingent on changes in certain ownership levels. Amounts paid in the Predecessor period from January 1, 2016 through November 3, 2016 and the year ended December 31, 2015 are reported as special employee incentive compensation in the consolidated statement of operations. The total that could be payable due to any future qualifying changes in ownership levels under the plan is $0.6 million ascommittee thereof. As of December 31, 2017. In accordance with U.S. GAAP, the Company does not carry an accrual2020 and 2019 there was $14.2 million and $6.8 million accrued for the long-term incentive plan.
this plan, respectively.
Income Taxes
As a resultThe Company is subject to U.S. federal, state and local income taxes as well as Canadian income tax on certain subsidiaries.
Prior to the final exchange of the Business Combination,Class B units, Hostess Brands, Inc. acquiredowned a controlling interest in Hostess Holdings, which is treated as a partnership for U.S. federal and most applicable state and local income tax purposes. As a partnership, Hostess Holdings iswas not directly subject to U.S. federal and certain state and local income taxes. Any taxable income or loss generated by Hostess Holdings iswas passed through to and included in the taxable income or loss of its partners, including the Company following the Business Combination. Company.
The Company is subject to U.S. federalaccounts for income taxes under the asset and liability method. Under this method, deferred tax liabilities and assets are determined based on the difference between the financial statement and tax basis of assets and liabilities using enacted tax rates in additioneffect for the year in which the difference is expected to statereverse. Additionally, the impact of changes in the enacted tax rates and locallaws on deferred taxes, if any, is reflected in the financial statements in the period of enactment.
The Company recognizes the effect of income taxes with respecttax positions only if those positions are more likely than not to its allocable sharebe sustained. Recognized income tax positions are measured at the largest amount that is greater than 50% likely of any taxable income of Hostess Holdings followingbeing realized. Changes in recognition or measurement are reflected in the Business Combination.period in which the change in judgment occurs (see Note 15. Income Taxes).
On December 22, 2017, the President of the United States signed into law the Tax Cuts and Jobs Act (“Tax Reform”). The SEC staff issued Staff Accounting Bulletin No. 119 (“SAB 118”) to address the application of U.S. GAAP in situations when a registrant does not have the necessary information available to complete the accounting for Tax Reform. Derivatives
The Company has outstanding public and private placement warrants which were originated in the 2015 initial public offering of a special purpose acquisition company (“SPAC”), which subsequently acquired Hostess Holdings in 2016 in a transaction that resulted in the Company becoming the parent company of Hostess Holdings. Due to certain provisions in the warrant agreement, the Company concluded that certain warrants do not meet the criteria to be classified in stockholders’ equity. In periods in which the public and private warrants meet the definition of a liability-classified derivative under Accounting Standards Codification (“ASC”) 815, the Company recognized the provisional tax impacts related to the revaluation of deferred tax assets and liabilities. Further informationthese warrants within current liabilities on the tax impactsconsolidated balance sheet at fair value, with subsequent changes in fair value recognized in the consolidated statement of Tax Reform is included in Note 13 of the Company’s consolidated financial statements. operations at each reporting date.
Derivatives
In April 2017, theThe Company has entered into an interest rate swap contractcontracts to mitigate its exposure to changes in the variable interest rate on its long-term debt. This contract wasThe Company has also entered into Canadian Dollar (CAD) purchase contracts to mitigate its exposure to foreign currency exchanges rates on its CAD denominated production costs. Both interest rate swap contracts and CAD purchase contracts are designated as a cash flow hedge.hedges. Changes in the fair value of this instrumentthese instruments are recognized in accumulated other comprehensive income in the consolidated balance sheets and reclassified into earnings in the period in which the hedged transaction affects earnings. Hedging ineffectiveness, if any, is recognized as a component of interest expense for interest rate swap contracts and costs of goods sold for CAD purchase contracts in the consolidated statements of operations. Payments made under this contractthe interest rate swap contracts are included in the supplemental disclosure of interest paid in the consolidated statementstatements of cash flows.
HOSTESS BRANDS, INC.
NOTES TO CONSOLIDATED FINANCIAL STATEMENTS
The Company also used a CAD purchase contract to mitigate the impact of foreign currency exchange rates on its January 2020 purchase of Voortman. This contract was settled during the year ended December 31, 2020 and did not qualify as a cash flow hedge.
Fair Value Measurements
The Company utilizes valuation techniques that maximize the use of observable inputs and minimize the use of unobservable inputs to the best extent possible. The Company determines fair value based on assumptions that market participants would use in pricing an asset or liability in the principal or most advantageous market. When considering market participant assumptions in fair value measurements, the following fair value hierarchy distinguishes between observable and unobservable inputs, which are categorized in one of the following levels:
•Level 1 inputs: Unadjusted quoted prices in active markets for identical assets or liabilities accessible to the reporting entity at the measurement datedate.
•Level 2 inputs: Other than quoted prices included in Level 1 inputs that are observable for the asset or liability, either directly or indirectly, for substantially the full term of the asset or liabilityliability.
•Level 3 inputs: Unobservable inputs for the asset or liability used to measure fair value to the extent that observable inputs are not available, thereby allowing for situations in which there is little, if any, market activity for the asset or liability at measurement date
Fair Value of Financial Instruments
The Company estimates that the carrying amount of its long-term debt reasonably approximates fair value. At December 31, 2017 and December 31, 2016, the approximate fair value of the Company’s debt was $998.7 million and $1,005.5 million, respectively. The fair value is calculated using current interest rates and pricing from financial institutions (Level 2 inputs).
date.
New Accounting Pronouncements
In August 2017,March 2020, the FASB issued Accounting Standards UpdateASU No. 2017-12 (“ASU 2017-12”), Derivatives2020-04, “Reference Rate Reform (Topic 848): Facilitation of the Effects of Reference Rate Reform on Financial Reporting,” which provides practical expedients and Hedging: Targeted Improvementsexceptions for applying GAAP to Accounting for Hedging Activities, which improves the financial reporting ofcontracts, hedging relationships, to better portrayand other transactions affected by reference rate reform if certain criteria are met. The expedients and exceptions provided by the economic results of an entity's risk management activities in its financial statements and make certain targeted improvements to simplify the application of the hedge accounting guidance in current U.S. GAAP. The amendments in this update better align an entity's risk management activities and financial reporting for hedging relationships through changesapply only to both the designation and measurement guidance for qualifyingcontracts, hedging relationships, and presentationother transactions that reference the London interbank offered rate (“LIBOR”) or another reference rate expected to be discontinued as a result of hedge results. The effective date for the standard is for fiscal years beginningreference rate reform. These amendments are not applicable to contract modifications made and hedging relationships entered into or evaluated after December 15, 2018.31, 2022. ASU No. 2020-04 is effective as of March 12, 2020 through December 31, 2022 and may be applied to contract modifications and hedging relationships from the beginning of an interim period that includes or is subsequent to March 12, 2020. The Company plans to early adopt thisis evaluating the impact the new standard inwill have on the first quarter of 2018consolidated financial statements and doesrelated disclosures but do not expect the adoption of this standard to haveanticipate a material impact on its consolidated financial position, results of operations or cash flows.impact.
In May 2017, the FASB issued Accounting Standards Update No. 2017-9 (“December 2019, ASU 2017-9”), Compensation - Stock Compensation (Topic 718): Scope of Modification Accounting, which provides guidance about what changes to the terms or conditions of a share-based payment award require an entity to apply modification accounting in Topic 718. Per ASU 2017-9, an entity should account for the effects of a modification unless all the following are met: (1) the fair value (or calculated value or intrinsic value, if such an alternative measurement method is used) of the modified award is the same as the fair value (or calculated value or intrinsic value, if such an alternative measurement method is used) of the original award immediately before the original award is modified. If the modification does not affect any of the inputs to the valuation technique that the entity uses to value the award, the entity is not required to estimate the value immediately before and after the modification, (2) the vesting conditions of the modified award are the same as the vesting conditions of the original award immediately before the original award is modified, and (3) the classification of the modified award as an equity instrument or a liability instrument is the same as the classification of the original award immediately before the original award is modified. The current disclosure requirements in Topic 718 apply regardless of whether an entity is required to apply modification accounting under the amendments in ASU 2017-9. The Company early adopted ASU 2017-9 during the year ended December 31, 2017. The adoption of this standard did not have a material impact on the Company’s consolidated financial position, results of operations, or cash flows.
In January 2017, the FASB issued Accounting Standards Update No. 2017-4 (“ASU 2017-4”), Intangibles—Goodwill and Other (Topic 350):2019-12 “Income Taxes: Simplifying the TestAccounting for Goodwill Impairment.Income Taxes (Topic 740)” was issued. This ASU 2017-4 eliminates Step 2 fromsimplifies the goodwill impairment test. Step 2 required an entityaccounting for certain income tax related items, including intraperiod tax allocations, deferred taxes related to determine the fair value at the impairment testing dateforeign subsidiaries and step-up in tax basis of its assets and liabilities following the procedure that would be required in a business combination. Instead, an entity should perform its goodwill impairment test and recognize an impairment charge by comparing the fair value of a reporting unit with its carrying amount.goodwill. The ASU 2017-4 will becomeis effective for fiscal years beginning after December 15, 2019, including interim periods within those fiscal years. Early adoption is permitted. The Company early adopted ASU 2017-4 during the year ended December 31, 2017, the adoption did not have a material impact on the company’s consolidated financial position, results of operations or cash flows. The company’s goodwill impairment tests have not proceeded to Step 2 at any testing date.
In February 2016, the FASB issued ASU No. 2016-02, Leases (“ASU 2016-02”), which is intended to improve financial reporting about leasing transactions. This standard requires a lessee to record on the balance sheet the assets and liabilities for the rights and obligations created by lease terms of more than 12 months. This standard will be effective for fiscal years beginning after December 15, 2018, including interim periods within those fiscal years,2020 and early adoption is permitted. The Company is currently evaluatingstill assessing the impact of this update.
2. Restatement of Previously Issued Financial Statements
On April 12, 2021, the adoptionSEC issued a statement (the “SEC Statement”) on the accounting and reporting considerations for warrants issued by SPACs. The SEC Statement discussed certain features of ASU 2016-02 willwarrants issued in SPAC transactions that may be common across many entities. The SEC Statement indicated that when one or more of such features is included in a warrant, the warrant should be classified as a liability at fair value, with changes in fair value each period reported in earnings.
Following consideration of the guidance in the SEC Statement, the Company concluded that certain of its warrants should have been classified as liabilities, rather than equity, and should be measured at fair value in the affected financial statements, with changes in fair value each period reported in earnings. As such, the Company is restating its financial statements for the affected periods included in this Annual Report.
The impact of the restatement on its consolidated financial position, resultsthe balance sheets as of December 31, 2020 and 2019 and statements of operations or cash flows.
In May 2014, the FASB issued ASU No. 2014-09, Revenue from Contracts with Customers (Topic 606), (“ASU 2014-09”), which requires an entity to recognize the amount of revenue to which it expects to be entitled for the transferyears ended December 31, 2020, 2019 and 2018 are presented below. The impact of promised goods or services to customers. The ASU will replace most existing revenue recognition guidance in U.S. GAAP when it becomes effective. The new standardthe restatement on the December 31, 2017 stockholders' equity balances is effectivepresented on the consolidated statement of stockholders' equity.
HOSTESS BRANDS, INC.
NOTES TO CONSOLIDATED FINANCIAL STATEMENTS
Additionally, see Note 17. Unaudited Quarterly Financial Data (As Restated) for the Company on January 1, 2018.
restatement impacts to the quarterly periods during the year ended December 31, 2020. Regarding the statement of cash flows, the adjustments below to net income were offset by adjustments to non-cash operating activities within cash flow provided by operations. The Company plans to adopt the standard in the first quarter of 2018 retrospectively with the cumulative effect of initial application reported as of January 1, 2018. The Company is utilizing a comprehensive approach when reviewing its current accounting policies to identify potential differences that would result from applying the new requirements to its customer contracts. The approach includes the evaluation of sales terms, performance obligations, variable consideration, and costs to obtain and fulfill contracts. The Company has made significant progress on its process review. Based on the Company’s review, management does not currently expect the initial application of this guidance to have a materialrestatement had no impact on its consolidated financial statements.total net cash flows from operating, investing or financing activities.
2. | | | | | | | | | | | | | | | | | |
| (In thousands) | As of December 31, 2020 |
| As Previously Reported | | Restatement Adjustment | | As Restated |
| Balance Sheet | | | | | |
| Total assets | $ | 3,365,469 | | | $ | 0 | | | $ | 3,365,469 | |
| Warrant liabilities | 0 | | | 861 | | | 861 | |
| Total current liabilities | 189,533 | | | 861 | | | 190,394 | |
| Total liabilities | 1,743,883 | | | 861 | | | 1,744,744 | |
| Additional paid in capital | 1,238,765 | | | 42,253 | | | 1,281,018 | |
| Retained earnings | 399,215 | | | (43,114) | | | 356,101 | |
| Stockholder's equity | 1,621,586 | | | (861) | | | 1,620,725 | |
| Total liabilities, stockholder's equity and non-controlling interest | $ | 3,365,469 | | | $ | 0 | | | $ | 3,365,469 | |
| | | | | | | | | | | | | | | | | |
| (In thousands, except shares and per share data) | For the Year Ended December 31, 2020 |
| Statement of Operations | As Previously Reported | | Restatement Adjustment | | As Restated |
| Operating income | $ | 135,310 | | | $ | 0 | | | $ | 135,310 | |
| Change in fair value of warrant liabilities | 0 | | | (39,941) | | | (39,941) | |
| Total other (income) expense | 46,549 | | | (39,941) | | | 6,608 | |
| Income before income taxes | 88,761 | | | 39,941 | | | 128,702 | |
| Net income | 68,356 | | | 39,941 | | | 108,297 | |
| Net income attributable to Class A stockholders | $ | 64,735 | | | $ | 39,941 | | | $ | 104,676 | |
| Earnings per Class A share: | | | | | |
| Basic | $ | 0.52 | | | 0.32 | | | $ | 0.84 | |
| Diluted | $ | 0.51 | | | 0 | | | $ | 0.51 | |
| Weighted-average shares outstanding: | | | | | |
| Basic | 124,927,535 | | | 0 | | | 124,927,535 | |
| Diluted | 127,723,488 | | | 0 | | | 127,723,488 | |
HOSTESS BRANDS, INC.
NOTES TO CONSOLIDATED FINANCIAL STATEMENTS
| | | | | | | | | | | | | | | | | |
| As of December 31, 2019 |
| (In thousands) | As Previously Reported | | Restatement Adjustment | | As Restated |
| Balance Sheet | | | | | |
| Total assets | $ | 3,097,701 | | | $ | 0 | | | $ | 3,097,701 | |
| Liabilities and stockholder's equity | | | | | |
| Warrant liabilities | 0 | | | 111,305 | | | 111,305 | |
| Total current liabilities | 159,925 | | | 111,305 | | | 271,230 | |
| Total liabilities | 1,517,477 | | | 111,305 | | | 1,628,782 | |
| Additional paid in capital | 1,152,055 | | | (28,250) | | | 1,123,805 | |
| Retained earnings | 334,480 | | | (83,055) | | | 251,425 | |
| Stockholder's equity | 1,485,792 | | | (111,305) | | | 1,374,487 | |
| Total liabilities, stockholder's equity and non-controlling interest | $ | 3,097,701 | | | $ | 0 | | | $ | 3,097,701 | |
| | | | | | | | | | | | | | | | | |
| (In thousands, except shares and per share data) | For the Year Ended December 31, 2019 |
| Statement of Operations | As Previously Reported | | Restatement Adjustment | | As Restated |
| Operating income | $ | 136,096 | | | $ | 0 | | | $ | 136,096 | |
| Change in fair value of warrant liabilities | 0 | | | 58,816 | | | 58,816 | |
| Total other expense | 41,639 | | | 58,816 | | | 100,455 | |
| Income before income taxes | 94,457 | | | (58,816) | | | 35,641 | |
| Net income | 77,565 | | | (58,816) | | | 18,749 | |
| Net income attributable to Class A stockholders | $ | 63,115 | | | $ | (58,816) | | | $ | 4,299 | |
| Earnings per Class A share: | | | | | |
| Basic | $ | 0.57 | | | $ | (0.53) | | | $ | 0.04 | |
| Diluted | $ | 0.55 | | | $ | (0.51) | | | $ | 0.04 | |
| Weighted-average shares outstanding: | | | | | |
| Basic | 110,540,264 | | | 0 | | | 110,540,264 | |
| Diluted | 114,699,447 | | | (3,693,758) | | | 111,005,689 | |
| | | | | | | | | | | | | | | | | |
| (In thousands, except shares and per share data) | For the Year Ended December 31, 2018 |
| Statement of Operations | As Previously Reported | | Restatement Adjustment | | As Restated |
| Operating income | $ | 121,558 | | | $ | 0 | | | $ | 121,558 | |
| Change in fair value of warrant liabilities | 0 | | | (79,156) | | | (79,156) | |
| Total other (income) expense | 27,178 | | | (79,156) | | | (51,978) | |
| Income before income taxes | 94,380 | | | 79,156 | | | 173,536 | |
| Net income | 81,426 | | | 79,156 | | | 160,582 | |
| Net income attributable to Class A stockholders | $ | 62,895 | | | $ | 79,156 | | | $ | 142,051 | |
| Earnings per Class A share: | | | | | |
| Basic | $ | 0.63 | | | $ | 0.79 | | | $ | 1.42 | |
| Diluted | $ | 0.61 | | | $ | 0 | | | $ | 0.61 | |
| Weighted-average shares outstanding: | | | | | |
| Basic | 99,957,049 | | | 0 | | | 99,957,049 | |
| Diluted | 103,098,394 | | | 0 | | | 103,098,394 | |
HOSTESS BRANDS, INC.
NOTES TO CONSOLIDATED FINANCIAL STATEMENTS
3. Business CombinationCombinations and Divestitures
Voortman Acquisition
The following summarizesOn January 3, 2020, the fair valueCompany completed the acquisition of all of the Business Combination:shares of the parent company of Voortman, a manufacturer of premium, branded wafers as well as sugar-free and specialty cookies for approximately $328.7 million ($427.0 million CAD), reflecting final working capital and other closing statement adjustments.
|
| | | |
| (In thousands) | |
| Cash paid | $ | 479,761 |
|
| Equity consideration paid (1) | 239,323 |
|
| Tax receivable arrangement payable | 161,681 |
|
| Total consideration | 880,765 |
|
| Hostess Holdings debt assumed by Gores Holdings, Inc | 1,228,254 |
|
| Noncontrolling interest (2) | 326,601 |
|
| Fair value of the Business Combination | $ | 2,435,620 |
|
(1) Equity consideration paidNet cash outflow related to the Legacy Hostess Equityholders is summarized below:
|
| | | | |
| (In thousands, except share data) | | |
| Class A common shares of the Company subject to six month sales restriction | | 22,098,139 |
|
| Fair value per share | | $ | 10.83 |
|
| | | $ | 239,323 |
|
(2) The class B units in Hostess Holdings, LP, which are not owned by the Company, represent the noncontrolling interest as provided below:
|
| | | | |
| (In thousands except share data) | | |
| Class B units of Hostess Holdings, LP subject to six month sales restriction | | 24,424,259 |
|
| Fair value per unit | | $ | 10.83 |
|
| | $ | 264,515 |
|
|
| | | | |
| (In thousands except share data) | | |
| Class B units of Hostess Holdings, LP not subject to sales restrictions | | 5,446,429 |
|
| Fair value per unit | | $ | 11.40 |
|
| | $ | 62,086 |
|
The fair value of these units was determined as follows:
|
| | | | |
| Per share price based on average market price on the day of the Business Combination | | $ | 11.40 |
|
| Discount for lack of marketability | | 5.0 | % |
| | | $ | 10.83 |
|
The 5% discount for lack of marketability was determined by using an option pricing method (Finnerty Protective Put Model) to reflect a six month sales restriction.
The Company recorded an allocation of the purchase price to Predecessor’s tangibleduring the year ended December 31, 2020 was $316.0 million. This net cash outflow reflects a non-cash gain on a related foreign currency contract of $6.9 million, cash acquired of $1.6 million and identified intangible assets acquired and liabilities assumed, excluding long-term debt, based on their fair valuesa liability outstanding as of the closing date. TheDecember 31, 2020 for certain purchase price allocationadjustments of $4.2 million.
The acquisition of Voortman diversifies and expands the Company’s product offerings and manufacturing capabilities in the adjacent cookie category. The acquisition also leverages the Company’s customer reach and lean and agile business model. The combined Company expects to realize additional benefits of scale via sharing established, efficient infrastructure and strengthening collaborative retail partnerships in the United States and Canada.
During the year ended December 31, 2020, working capital and other adjustments of $4.7 million were made to goodwill. Included in other non-current liabilities in the table below is as follows:a $1.3 million liability for pre-acquisition uncertain tax positions. It is offset by a non-current receivable balance of $1.3 million representing expected recovery through indemnifications.
As of December 31, 2020, the Company has finalized the following purchase price allocation: |
| | | | |
| (In thousands) | | |
| Cash | $ | $1,639 | 58,519 |
|
| Accounts receivable | 24,848 | 58,474 |
|
InventoriesInventory | 7,564 | 39,338 |
|
Prepaids and other assetsIncome tax receivable | 7,522 | 2,998 |
|
| Other current assets | 420 | |
| Property and equipment | 32,028 | 155,076 |
|
| Customer relationships (1) | 11,100 | |
| Trade names (2) | 130,000 | |
| Goodwill (3) | 170,762 | |
| Other non-current assets | 1,320 | |
| Accounts payable and accrued expenses | (6,172) | (56,559 | ) |
Deferred tax liabilitiesCustomer trade allowances | (5,428) | (352,531 | ) |
Trade name and trademarksLease liabilities | (6,420) | 1,408,848 |
|
Customer relationshipsDeferred taxes | (39,149) | 542,011 |
|
GoodwillOther non-current liabilities | (1,320) | 579,446 |
|
Total assetsAssets acquired and liabilities assumed |
$ | $328,714 | 2,435,620 |
|
(1) Customer relationships were valued through application of the income approach (Level 3). Under this approach, revenue, operating expenses and other costs associated with existing customers were estimated in order to derive cash flows attributable to the existing customer relationships. The resulting cash flows were then discounted to present value to arrive at the fair value of existing customer relationships as of the valuation date. The estimated useful lives by operating segment ranging from one to eight years represent the approximate point in the projection period in which a majority of the assets’ cash flows are expected to be realized based on assumed attrition rates.
(2) The trade names were valued through application of the income approach (level 3), involving the estimation of likely future sales and an appropriate royalty rate. The trade name and trademarks are estimated to have indefinite useful lives as the Company expects a market participant would use the trade name and trademarks in perpetuity based on their historical strength and consumer recognition.
HOSTESS BRANDS, INC.
NOTES TO CONSOLIDATED FINANCIAL STATEMENTS
(3) Goodwill represents the excess of the consideration transferred over the fair values of the assets acquired and liabilities assumed. It is attributedprimarily attributable to synergies and intangible assets such as assembled workforce which doare not qualify for separate recognition,separately recognizable.
During the year ended December 31, 2020 and is partially deductible for income tax purposes.
From January 1, 2016 through November 3, 2016 (the Predecessor) approximately $31.32019, the Company incurred $4.3 million of expenses were incurred directly related to the Business Combination. From January 1, 2016 through the date of its last filing for the nine month period ending September 30, 2016, Gores Holdings incurred $4.0and $1.9 million, of transaction related expenses. From October 1, 2016 through the Closing Date, Gores Holdingsincurred $6.7 millionrespectively, of expenses related to the Business Combination. On the Closing Date, the Company paid $13.1 million of deferred underwritingthis acquisition. These expenses are classified as business combination transaction costs related to Gores Holdings’initial public offering and repaid a working capital loan of $0.2 million.
During the measurement period which started on the Closing Date and ended on November 3, 2017, the Company revised its preliminary estimateconsolidated statement of the future cash tax savings under the tax receivable agreement. This resulted in an $8.1 million decrease in goodwill, a decrease to the tax receivable agreement liability of $3.0 million, a $5.5 million decrease to deferred tax liabilities, and an increase to accrued expenses and other liabilities of $0.4 million. The Company also revised its estimate of deferred tax liabilities which decreased both deferred tax liabilities and goodwill by $0.9 million. As of November 3, 2017, the allocation of the purchase price for the Business Combination is final.operations.
The following unaudited pro forma combined financial information presents the Company’s results as though the Business Combinationacquisition of Voortman had occurred at January 1, 2016.2019. The unaudited pro forma consolidated financial information has been prepared using the acquisition method of accounting in accordance with U.S. GAAP: | | | | | | | | | | | |
| Twelve Months Ended |
| (In thousands) | December 31,
2020 | | December 31,
2019 |
| (unaudited, pro forma) |
| Net revenue | $ | 1,016,609 | | | $ | 1,007,140 | |
| Net income | 108,297 | | | 11,612 | |
|
| | | | |
| | | Year Ended December 31, 2016 |
| (In thousands) | | (Pro Forma) |
| | | (Unaudited) |
| Net Revenue | | $ | 727,586 |
|
| Net Income | | 82,442 |
|
In-Store Bakery Divestiture
On May 10, 2016,August 30, 2019, the Predecessor purchased the stock of Superior for $51.1 million, $49.7 million net of cash acquired. Superior is located in Southbridge, MassachusettsCompany sold its In-Store Bakery operations, including relevant trademarks and manufactures eclairs, madeleines, brownies, and iced cookies.licensing agreements, to an unrelated party. The Predecessor acquired Superior to expand its market and product offeringsoperations included products that were primarily sold in the In-Store Bakeryin-store bakery section of grocery and club retailers.U.S. retail channels. The Company expectsdivested the operations to realize synergiesprovide more focus on future investment in areas of its business that better leverage its core competencies.
The Company received proceeds from the divestiture of $65.0 million prior to transaction expenses and cost savingssubject to certain post-closing adjustments. In connection with the sale, during the year ended December 31, 2019, the Company recognized transaction expenses of $2.1 million and a loss on disposal of $0.3 million within other operating expenses on the consolidated statements of operations.
4.Exit Costs
Subsequent to the Company’s acquisition of Voortman, activities were initiated to transition Voortman’s distribution model to the Company’s direct-to-warehouse distribution model. The Company has incurred costs to exit Voortman’s direct-store-delivery model, including severance and contract termination costs related to this acquisition as a resultthird-party distributor and leasing relationships. Total costs were $12.9 million through completion of purchasing and procurement economiesthe transition in 2020. During the year ended December 31, 2020, contract termination costs of scale and$8.3 million were recognized in selling expense on the consolidated statement of operations. During the year ended December 31, 2020, severance costs of $4.6 million, were recognized within general and administrative expense savings, particularly with respect toexpenses on the consolidationconsolidated statement of corporate related functionsoperations.
Reserves for these activities are reported within accrued expenses on the consolidated balance sheet and elimination of redundancies.
The acquisition of Superior was treated as a purchase in accordance with ASC 805, Business Combinations, which requires allocation ofhad the purchase price tofollowing activity during the estimated fair values of assets and liabilities acquired in the transaction. The allocation of purchase price is considered final. The following is a summary of the allocation of the purchase price:
|
| | | | |
| (In thousands) | | |
| Cash | | $ | 1,009 |
|
| Accounts receivable | | 2,122 |
|
| Inventories | | 2,300 |
|
| Prepaids and other current assets | | 112 |
|
| Property and equipment (1) | | 7,075 |
|
| Intangible assets (2) | | 29,370 |
|
| Goodwill (3) | | 24,227 |
|
| Accounts payable | | (2,920 | ) |
| Accrued expenses | | (552 | ) |
| Capital lease obligation | | (799 | ) |
| Deferred tax liability | | (10,844 | ) |
| Total assets acquired and liabilities assumed | | $ | 51,100 |
|
| |
(1) | Amounts recorded for property and equipment includes land, building, plant machinery and equipment. |
| |
(2) | Amounts recorded for intangible assets includes customer relationships, trade names and trademarks. |
| |
(3) | Amounts recorded for goodwill are generally not expected to be deductible for tax purposes. |
The fair value measurement of tangible and intangible assets and liabilities was based on significant inputs not observable in the market and thus represent Level 3 measurements within the fair value measurement hierarchy. Level 3 fair market values were determined using a variety of information, including estimated future cash flows, appraisals, and market comparables.
From January 1, 2016 through November 3, 2016, the Predecessor incurred acquisition‑related costs for Superior of approximately $0.6 million. For the period from January 1, 2016 through November 3, 2016 (Predecessor) net revenue and net income for Superior was $19.9 million and $0.7 million, respectively. For the period from November 4, 2016 throughyear ended December 31, 2016 (Successor), net revenue and net loss for Superior was $6.8 million, and $0.1 million, respectively.2020:
The acquisition of Superior was deemed not material to the Company under Item 3-05 of Regulation S-X, and, therefore, separate financial statements are not required because Superior does not meet the definition of a “significant subsidiary”. | | | | | | | | | | | | | | | | | | | | |
| (In thousands) | | Severance | | Contract Termination | | Total |
| Charges recorded | | $ | 4,632 | | | $ | 8,278 | | | $ | 12,910 | |
| Payments made | | (4,063) | | | (7,913) | | | (11,976) | |
| Impact of change in exchange rates on CAD denominated liability | | (33) | | | (365) | | | (398) | |
| Reserve balance as of December 31, 2020 | | $ | 536 | | | $ | 0 | | | $ | 536 | |
3HOSTESS BRANDS, INC.
NOTES TO CONSOLIDATED FINANCIAL STATEMENTS
5. Stock-Based Compensation
Hostess Brands, Inc. 2016 Equity Incentive Plan (Successor)
The Hostess Brands, Inc. 2016 Equity Incentive Plan (the “2016 Plan”) provides for the granting of various equity-based incentive awards to directorsmembers of the Board of Directors of the Company, certain members of Company management,employees and service providers to the Company. The types of equity-based awards that may be granted under the 2016 Plan include: stock options, stock appreciation rights (SARs), restricted stock, restricted stock units (RSUs), and other stock-based awards. There are 7,150,000 registered shares of Class A common stock reserved for issuance under the 2016 Plan. All awards issued under the 2016 Plan may only be settled in shares of Class A common stock. As of December 31, 2017, 5,188,6822020, 2,770,885 shares wereremained available for issuance under the 2016 Plan.
Equity-basedShare-based compensation expense totaled approximately $7.4$8.7 million, $9.2 million and $5.6 million for the Successor yearyears ended December 31, 2017. There was no equity-based compensation expense for either the Successor or Predecessor periods in 2016 related to the 2016 Plan.
2020, 2019 and 2018, respectively.
Restricted Stock Units (“RSUs”)
The fair value of RSU awards is calculated based on the closing market price of the Company’s Class A Common Stock on the date of grant. Compensation expense is recognized straight-line over the requisite service period of the awards, ranging from one to three years.
The vesting of certain RSU awards is contingent upon the Company attaining positive earnings per share for the fiscalCompany’s Class A Common Stock achieving a certain total stockholder return (“TSR”) in relation to a group of its peers, measured over a three year ending immediately prior to the vesting date. Management has determined it is probable that these performance conditions will be met.
For certain RSU awards, a portion of the granted units are banked at each annual performance period if the Company achieves certain EBITDA targets. Banked shares continue to be subject to the requisite service period under the terms of the awards.period. Depending on the actual performance during each ofover the three annual performance periods,measurement period, an award recipients haverecipient has the opportunity to receive up to 225%200% of the granted units.awards. At December 31, 2020 and 2019 there were 0.4 million and 0.3 million RSU awards with TSR performance conditions outstanding, respectively.
Upon an employee’s termination, allcertain RSU awards provide that unvested awards will be forfeited and the shares of common stock underlying such award will become available for issuance under the 2016 Plan. Other RSU awards provide for accelerated vesting upon an employee's termination under certain circumstances.
The following table summarizes the activity of the Company’s unvested RSUs for the successor year ended December 31, 2017:RSUs: | | | | | | | | | | | |
| Restricted Stock
Units | | Weighted Average
Grant Date
Fair Value |
| Unvested as of December 31, 2018 | 895,784 | | | $ | 14.46 | |
| Total Granted | 721,985 | | | 12.76 | |
| Forfeited | (298,601) | | | 14.96 | |
| Vested(1) | (415,033) | | | 14.26 | |
| Unvested as of December 31, 2019 | 904,135 | | | 12.99 | |
| Total Granted | 628,801 | | | 12.99 | |
| Forfeited | (285,991) | | | 14.54 | |
| Vested(2) | (198,677) | | | 12.17 | |
| Unvested as of December 31, 2020 | 1,048,268 | | | $ | 13.95 | |
|
| | | | | | |
| | Restricted Stock
Units | | Weighted Average
Grant Date
Fair Value |
| Unvested units as of December 31, 2016 (Successor) | — |
| | $ | — |
|
| Total Granted | 1,448,736 |
| | 15.73 |
|
| Forfeited | (390,038 | ) | | 15.78 |
|
Vested(1) | (142,804 | ) | | 15.55 |
|
| Unvested as of December 31, 2017 (Successor) | 915,894 |
| | $ | 15.73 |
|
(1)Includes 40,223108,012 shares withheld to satisfy $0.4$1.4 million of employee tax obligations upon vesting.
(2) Includes 78,728 shares withheld to satisfy $1.1 million of employee tax obligations upon vesting.
As of December 31, 2017,2020 there was $6.5$8.1 million of total unrecognized compensation cost, related to non-vested RSUs granted under the 2016 Plan that are considered probable to vest;Plan; that cost is expected to be recognized over a weighted average remaining period of approximately 2.001.7 years. As of December 31, 2017, the grant date fair value of2020 there were no awards outstanding for which no compensation is recognized because it iswas not probable that the performance conditions willwould be met is $4.8 million.met.
For the yearyears ended December 31, 2017 (Successor), $5.42020 and 2019, $6.3 million and $7.2 million, respectively, of compensation expense related to the RSUs was recognized within general and administrative expenses on the consolidated statementstatements of operations.
Restricted HOSTESS BRANDS, INC.
NOTES TO CONSOLIDATED FINANCIAL STATEMENTS
Stock Awards (“RSAs”)Options
On March 23, 2017,The following table includes the Company granted 435,000 sharessignificant inputs used to determine the fair value of restricted stock to the Company’s Chief Executive Officeroptions issued under the 2016 Plan. plan.
| | | | | | | | |
| | Year Ended
December 31,
2020 | Year Ended
December 31,
2019 |
| Expected volatility (1) | 26.34% | 26.66% |
| Expected dividend yield (2) | 0% | 0% |
| Expected option term (3) | 6.00 years | 6.00 years |
| Risk-free rate (4) | 1.6% | 1.8% |
(1)The fair value of the RSAs isexpected volatility assumption was calculated based on a peer group analysis of stock price volatility with a look back period based on the closing market price of the Company’s Class A common stockexpected term and ending on the grant date. On October 12, 2017, with
(2)From its inception through December 31, 2020, the announcementCompany has not paid any dividends on its common stock. As of the Company’s Chief Executive Officer’s retirement,stock option grant date, the grant was modified so that the 435,000 unvested shares were forfeited and 75,000 replacement shares would vestCompany does not anticipate paying any dividends on January 1, 2018, provided there was positive earnings per share for the year ended December 31, 2017.
If the vesting requirements of a restricted stock award are not satisfied, or the performance conditions are not attained, the award will be forfeited and the shares of Class A common stock subjectover the term of the stock options. Option holders have no right to dividends prior to the award shall be returnedexercise of the options.
(3)The Company utilized the simplified method to determine the expected term of the stock options since the Company does not have sufficient historical exercise data to provide a reasonable basis upon which to estimate expected term.
(4)The risk-free interest rate was based on the U.S. Treasury yield curve in effect at the time of grant which corresponds to the Company.
As of December 31, 2017, there was no unrecognized compensation cost related to the non-vested restricted stock. For the year ended December 31, 2017 (Successor), the Company recognized expense of $1.0 million related to the restricted stock awards within general and administrative expenses on the consolidated statement of operations.
The following table summarizes the activityexpected term of the Company’s restricted stock awards for the year ended December 31, 2017:options.
|
| | | | | | | |
|
| Shares of
Restricted Stock | | Weighted Average
Grant Date Fair Value |
| Unvested units as of December 31, 2016 (Successor) |
| — |
| | — |
|
| Granted |
| 510,000 |
| | $ | 15.73 |
|
| Forfeited |
| (435,000 | ) | | 15.78 |
|
| Vested |
| — |
| | — |
|
| Unvested as of December 31, 2017 (Successor) |
| 75,000 |
| | $ | 13.43 |
|
Stock Options
During the year ended December 31, 2017, the Company granted 1,202,613 stock options to certain members of management under the Plan. The weighted average grant date fair value was estimated using the Black-Scholes option-pricing model (level 3) with the following assumptions:
|
| |
| Year
Ended
December 31, 2017
|
Expected volatility (1)
| 0.2746% |
Expected dividend yield (2)
| —% |
Expected option term (3)
| 6.24 years |
Risk-free rate (4)
| 2.09% |
| |
(1) | The expected volatility assumption was calculated based on a peer group analysis of stock price volatility with a look back period based on the expected term and ending on the grant date. |
| |
(2) | As of December 31, 2017, the Company has not paid any dividends on our common stock. As of the stock option grant date, the Company does not anticipate paying any dividends on common stock over the term of the stock options. Option holders have no right to dividends prior to the exercise of the options. |
| |
(3) | The Company utilized the simplified method to determine the expected term of the stock options since the Company does not have sufficient historical exercise data to provide a reasonable basis upon which to estimate expected term. |
| |
(4) | The risk-free interest rate was based on the U.S. Treasury yield curve in effect at the time of grant which corresponds to the expected term of the stock options. |
The stock options vest in four equal annual installments on varying dates through December 2021.2022. The maximum term under the grant agreement is ten years. As of December 31, 2017,2020, there was $3.1$3.2 million of total unrecognized compensation cost related to non-vested stock options outstanding under the 2016 Plan; that cost is expected to be recognized over the vesting periods. For the yearyears ended December 31, 2017 (Successor),2020 and 2019, there was $1.0$2.4 million and $2.0 million, respectively, of expense related to the stock options recognized within general and administrative costs on the consolidated statementstatements of operations. The weighted average grant-date fair value of options granted in years ended December 31, 2020, 2019 and 2018 was $4.04, $3.76, and $5.04, respectively.
The following table summarizes the activity of the Company’s unvested stock options for the year ended December 31, 2017 (Successor):options:
| | | | | | | | | | | | | | | | | |
| Number
of
Options | | Weighted Average
Remaining
Contractual Life
(years) | | Weighted
Average
Exercise Price |
| Outstanding as of December 31, 2018 | 943,939 | | | 5.54 | | $ | 13.54 | |
| Granted | 905,421 | | | — | | | 11.59 | |
| Exercised | (7,463) | | | — | | | 13.11 | |
| Forfeited | (124,226) | | | — | | | 12.42 | |
| Outstanding as of December 31, 2019 | 1,717,671 | | | 8.35 | | $ | 13.35 | |
| Exercisable as of December 31, 2019 | 486,663 | | | 7.35 | | $ | 15.43 | |
| Granted | 703,329 | | | — | | | 13.69 | |
| Exercised | (44,257) | | | — | | | 11.35 | |
| Forfeited | (305,628) | | | — | | | 13.93 | |
| Outstanding as of December 31, 2020 | 2,071,115 | | | 7.95 | | $ | 13.43 | |
| Exercisable as of December 31, 2020 | 787,671 | | | 7.01 | | $ | 14.20 | |
|
| | | | | | | | | | | | | |
| Number
of
Options | | Weighted Average
Remaining
Contractual Life
(years) | | Weighted
Average
Exercise Price | | Weighted
Average Grant
Date Fair Value |
| Outstanding as of December 31, 2016 (Successor) | — |
| | — |
| | $ | — |
| | $ | — |
|
| Granted | 1,202,613 |
| | 5.52 |
| | 15.75 |
| | 4.99 |
|
| Exercised | — |
| | — |
| | — |
| | — |
|
| Forfeited | (374,993 | ) | | 5.47 |
| | 15.78 |
| | 5.04 |
|
| Outstanding as of December 31, 2017 (Successor) | 827,620 |
| | 5.54 |
| | $ | 15.74 |
| | $ | 4.97 |
|
| Exercisable as of December 31, 2017 (Successor) | 241.931 |
| | 5.47 |
| | 15.78 |
| | 5.04 |
|
HOSTESS BRANDS, INC.
Related Party Stock AwardsNOTES TO CONSOLIDATED FINANCIAL STATEMENTS
See note 15 for information regarding additional equity awards not issued under the 2016 or 2013 Plans.
Hostess Management, LLC Equity Interest Plan (Predecessor)
The Company established a profits interest plan under the 2013 Hostess Management, LLC (“Hostess Management”) Equity Incentive Plan (“2013 Plan”) to allow members of the management team to participate in the success of the Company. The 2013 Plan consisted of an approximate 9% ownership interest in the Company’s subsidiary, New Hostess Holdco, LLC. Hostess Management had three classes of units and required certain returns to ranking classes before other classes participated in subsequent returns of Hostess Management.
The Company recognized unit-based compensation expense of $3.9 million from January 1, 2016 through November 3, 2016, including $3.2 million of expense due to a grant agreement provision which caused the accelerated vesting of units granted prior to January 1, 2016 upon consummation of the Business Combination and the accelerated vesting of units granted in 2016 based on the approval of the board of directors, and $1.4 million for the year ended December 31, 2015, (Predecessor), within general and administrative expense on the consolidated statement of operations. All outstanding units under the 2013 Plan were redeemed and the 2013 Plan was terminated on November 4, 2016.
4.6. Property and Equipment
Property and equipment consists of the following:
| | | | | | | | | | | |
| (In thousands) | December 31,
2020 | | December 31,
2019 |
| | | |
| Land and buildings | $ | 59,774 | | | $ | 53,683 | |
| Right of use assets - operating | 31,354 | | | 23,771 | |
| Machinery and equipment | 255,821 | | | 209,382 | |
| Construction in progress | 25,041 | | | 5,878 | |
| 371,990 | | | 292,714 | |
| Less accumulated depreciation | (68,031) | | | (50,330) | |
| $ | 303,959 | | | $ | 242,384 | |
|
| | | | | | | | |
| (In thousands) | December 31, 2017 | | | December 31, 2016 |
| | (Successor) | | | (Successor) |
| Land and buildings | $ | 32,088 |
| | | $ | 30,275 |
|
| Machinery and equipment | 141,995 |
| | | 112,221 |
|
| Construction in progress | 13,489 |
| | | 12,334 |
|
| | 187,572 |
| | | 154,830 |
|
| Less accumulated depreciation | (13,451 | ) | | | (1,606 | ) |
| | $ | 174,121 |
| | | $ | 153,224 |
|
Depreciation expense was $11.8$23.1 million, $17.2 million and $14.6 million for the yearyears ended December 31, 2017 (Successor), and was $1.6 million (Successor) and $7.6 million (Predecessor) for the year ended December 31, 2016 (Predecessor),2020, 2019, 2018, respectively.
HOSTESS BRANDS, INC.
NOTES TO CONSOLIDATED FINANCIAL STATEMENTS
5.7. Segment Reporting
The Company has two1 reportable segment: Snacking (formally known as Sweet Baked Goods). For the years ended December 31, 2019 and 2018, the Company had 2 reportable segments: Sweet Baked Goods and In-Store Bakery. Previously,As of January 3, 2020, the Company’sCompany added the newly acquired Voortman operations into the reportable segments weresegment previously known as Sweet Baked Goods and Other, which included In-Store Bakery, Hostess® branded bread and buns and frozen retail. A change inrenamed the Company’s internal reporting structure during the fourth quarter of 2017 caused the Company to reassess its reportable segments.segment as “Snacking”. The Company’s Sweet Baked GoodsSnacking segment consists of fresh and frozensweet baked goods, cookies, wafers and bread products that are sold under the Hostess®, Dolly Madison®, Cloverhill®, Big Texas® and Dolly Madison®Voortman® brands. The In-Store Bakery segment consistsconsisted primarily of Superior on Main® branded and Hostess brandedprivate label products sold through the in-store bakery section of grocery and club stores. The Company divested its In-Store Bakery operations on August 30, 2019. Subsequent to the sale, Snacking is the Company's single reportable segment.
The Company evaluates performance and allocates resources based on net revenue and gross profit. Information regarding the operations of these reportable segments is as follows:
| | | | | | | | | | | | | | | | | |
| (In thousands) | Year Ended
December 31,
2020 | | Year Ended
December 31,
2019 | | Year Ended
December 31,
2018 |
| | | | | |
| Net revenue: | | | | | |
| Snacking | $ | 1,016,609 | | | $ | 878,973 | | | $ | 808,355 | |
| In-Store Bakery | 0 | | | 28,702 | | | 42,034 | |
| Net revenue | $ | 1,016,609 | | | $ | 907,675 | | | $ | 850,389 | |
| | | | | |
| Depreciation and amortization (1): | | | | | |
| Snacking | $ | 54,940 | | | $ | 41,732 | | | $ | 38,607 | |
| In-Store Bakery | 0 | | | 1,602 | | | 2,804 | |
| Depreciation and amortization | $ | 54,940 | | | $ | 43,334 | | | $ | 41,411 | |
| | | | | |
| Gross profit: | | | | | |
| Snacking | $ | 355,639 | | | $ | 293,648 | | | $ | 258,995 | |
| In-Store Bakery | 0 | | | 6,186 | | | 8,282 | |
| Gross profit | $ | 355,639 | | | $ | 299,834 | | | $ | 267,277 | |
| | | | | |
| Capital expenditures (2): | | | | | |
| Snacking | $ | 58,953 | | | $ | 35,354 | | | $ | 53,394 | |
| In-Store Bakery | 0 | | | 182 | | | 354 | |
| Capital expenditures | $ | 58,953 | | | $ | 35,536 | | | $ | 53,748 | |
(1)Depreciation and amortization include charges to net income classified as costs of goods sold and general and administrative expenses on the consolidated statements of operations.
(2)Capital expenditures consists of purchases of property and equipment and acquisition and development of software assets paid in cash or acquired through accounts payable.
For the years ended December 31, 2020 and 2019, total assets on the consolidated balance sheet are entirely attributed to the Snacking segment.
|
| | | | | | | | | | | | | | | | |
| (In thousands) | Year Ended
December 31,
2017 | | From November 4 through December 31, 2016 | | | From January 1 through November 3, 2016 | | Year Ended
December 31,
2015 |
| | (Successor) | | (Successor) | | | (Predecessor) | | (Predecessor) |
| Net revenue: |
|
| |
|
| | | | |
|
|
| Sweet Baked Goods | $ | 733,827 |
| | $ | 105,211 |
| | | $ | 595,645 |
| | $ | 620,815 |
|
| In-Store Bakery | 42,361 |
| | 6,787 |
| | | 19,943 |
| | — |
|
| Net revenue | $ | 776,188 |
| | $ | 111,998 |
| | | $ | 615,588 |
| | $ | 620,815 |
|
| | | | | | | | | |
| Depreciation and amortization (2): | | | | | | | | |
| Sweet Baked Goods | $ | 35,441 |
| | $ | 5,245 |
| | | $ | 9,221 |
| | $ | 9,836 |
|
| In-Store Bakery | 2,729 |
| | 598 |
| | | 1,044 |
| | — |
|
| Depreciation and amortization | $ | 38,170 |
| | $ | 5,843 |
| | | $ | 10,265 |
| | $ | 9,836 |
|
| | | | | | | | | |
| Gross profit: | | | | | | | | |
| Sweet Baked Goods | $ | 316,916 |
| | $ | 37,387 |
| | | $ | 262,930 |
| | $ | 262,203 |
|
| In-Store Bakery | 9,982 |
| | 1,327 |
| | | 3,599 |
| | — |
|
| Gross profit | $ | 326,898 |
| | $ | 38,714 |
| | | $ | 266,529 |
| | $ | 262,203 |
|
| | | | | | | | | |
| Capital expenditures (1): | | | | | | | | |
| Sweet Baked Goods | $ | 35,609 |
| | $ | 7,544 |
| | | $ | 31,254 |
| | $ | 27,252 |
|
| In-Store Bakery | 774 |
| | 83 |
| | | 223 |
| | — |
|
| Capital expenditures | $ | 36,383 |
| | $ | 7,627 |
| | | $ | 31,477 |
| | $ | 27,252 |
|
| |
(1) | Capital expenditures consists of purchases of property and equipment and acquisition and development of software assets paid in cash or acquired through accounts payable during the year ended December 31, 2017 (Successor), from November 4, 2016 through December 31, 2016 (Successor), from January 1 through November 3, 2016 (Predecessor) and the year ended December 31, 2016 (Predecessor). |
| |
(2) | Depreciation and amortization include charges to net income classified as costs of goods sold and general and administrative expenses on the consolidated statement of operations. |
HOSTESS BRANDS, INC.
Total assets by reportable segment are as follows:
NOTES TO CONSOLIDATED FINANCIAL STATEMENTS
|
| | | | | | | | |
| (In thousands) | December 31,
2017 | | | December 31,
2016 |
| (Successor) | | | (Successor) |
| Total segment assets: |
|
| | |
|
|
| Sweet Baked Goods | $ | 2,884,642 |
| | | $ | 2,754,514 |
|
| In-Store Bakery | 81,633 |
| | | 93,378 |
|
| Total segment assets | $ | 2,966,275 |
| | | $ | 2,847,892 |
|
6.8. Goodwill and Intangible Assets
The Company recognized goodwill in January of 2020 related to its acquisition of Voortman based on a valuation performed to determine the fair value of the acquired assets. During the year ended December 31, 2020, the preliminary valuation was adjusted, resulting in an increase to goodwill of $4.7 million. The valuation was finalized in the fourth quarter of 2020. The Voortman goodwill was incorporated into the Company's Snacking reporting segment. Goodwill and intangible assets as of December 31, 20172020 and December 31, 20162019 were recognized as part of the purchase price allocation of theHostess Business Combination as ofand the Closing Date. Voortman and Cloverhill Business acquisitions.
During the year ended December 31, 2017,2019, the purchase price allocation forCompany recognized an impairment charge of $1.0 million related to its In-Store Bakery reporting unit, within other operating expense on the Business Combination was adjusted, resulting in a $9.0 million decrease to goodwill asconsolidated statements of operations. During the year ended December 31, 2017,2019, the purchase price allocation for the business combination is considered final.
Activity of goodwillCompany divested its In-Store Bakery segment (see Note 3. Business Combinations and Divestitures). Goodwill activity is presented below by reportable segment:
|
| | | | | | | | | | | |
| (In thousands) | Sweet Baked Goods | | In-Store Bakery | | Total |
| Balance as of December 31, 2015 | $ | 56,992 |
| | $ | — |
| | $ | 56,992 |
|
| Acquisition of Superior | — |
| | 24,227 |
| | 24,227 |
|
| Elimination of Predecessor goodwill | (56,992 | ) | | (24,227 | ) | | (81,219 | ) |
| Business combination | 542,410 |
| | 46,050 |
| | 588,460 |
|
| Balance as of December 31, 2016 (Successor) | 542,410 |
| | 46,050 |
| | 588,460 |
|
| Measurement period adjustments | (12,987 | ) | | 3,973 |
| | (9,014 | ) |
| Balance as of December 31, 2017 (Successor) | $ | 529,423 |
| | $ | 50,023 |
| | $ | 579,446 |
|
| | | | | | | | | | | | | | | | | |
| (In thousands) | Snacking | | In-Store Bakery | | Total |
| Balance as of December 31, 2018 | $ | 535,853 | | | $ | 39,792 | | | $ | 575,645 | |
| Impairment | 0 | | | (1,000) | | | (1,000) | |
| Divestiture | 0 | | | (38,792) | | | (38,792) | |
| Balance as of December 31, 2019 | 535,853 | | | 0 | | | 535,853 | |
| Acquisition of Voortman | 170,762 | | | 0 | | | 170,762 | |
| | | | | |
| | | | | |
| Balance as of December 31, 2020 | $ | 706,615 | | | $ | 0 | | | $ | 706,615 | |
Intangible assets consist of the following:
| | | | | | | | | | | |
| (In thousands) | December 31,
2020 | | December 31,
2019 |
| Intangible assets with indefinite lives (Trademarks and Trade Names) | $ | 1,538,631 | | | $ | 1,408,630 | |
| Intangible assets with definite lives (Customer Relationships) | 526,813 | | | 515,713 | |
| Less accumulated amortization (Customer Relationships) | (97,541) | | | (71,028) | |
| | | |
| Intangible assets, net | $ | 1,967,903 | | | $ | 1,853,315 | |
HOSTESS BRANDS, INC.
NOTES TO CONSOLIDATED FINANCIAL STATEMENTS
|
| | | | | | | |
| (In thousands) | December 31, 2017 | | December 31, 2016 |
| | (Successor) | | (Successor) |
| Intangible assets with indefinite lives (trademarks and tradenames) | $ | 1,408,848 |
| | $ | 1,408,848 |
|
| Intangible assets with definite lives (customer relationships) | 542,011 |
| | 542,011 |
|
| Less accumulated amortization (customer relationships) | (27,771 | ) | | (3,916 | ) |
| Intangible assets, net | $ | 1,923,088 |
| | $ | 1,946,943 |
|
Amortization expense was $23.9 million forThe Company recognized additional trade names and customer relationships intangible assets during the year ended December 31, 2017,2020 related to the acquisition of Voortman. See Note 3. Business Combinations and $3.9 million (Successor) and $1.2 million (Predecessor)Divestitures for the periods from November 4, 2016 through December 31, 2016 and from January 1, 2016 through November 3, 2016, respectively, and $0.9 million (Predecessor) foradditional details.
During the year ended December 31, 2015.2019, the Company divested of its In-Store Bakery segment, resulting in a reduction of intangible assets, net of $24.5 million. Amortization expense was $26.5 million, $23.4 million and $24.1 million for the years ended December 31, 2020, 2019 and 2018 respectively. The unamortized portion of customer relationships will be expensed over their remaining useful life, from18 4 to 2319 years. The weighted-average amortization period as of December 31, 20172020 for customer relationships was 21.5was 18.7 years.
Future expected amortization expense is as follows:
| | | | | |
| (In thousands) | |
| 2021 | $ | 23,512 | |
| 2022 | 23,512 | |
| 2023 | 23,512 | |
| 2024 | 23,512 | |
| 2025 | 22,752 | |
| 2026 and thereafter | 312,472 | |
|
| | | |
| (In thousands) | |
| 2018 | $ | 23,977 |
|
| 2019 | 23,977 |
|
| 2020 | 23,977 |
|
| 2021 | 23,977 |
|
| 2022 | 23,977 |
|
| 2023 and thereafter | 394,355 |
|
7.9. Accrued Expenses
Included in accrued expenses are the following:
| | | | | | | | | | | | | | |
| (In thousands) | December 31,
2020 | | | December 31,
2019 |
| | | | |
| Incentive compensation | $ | 16,199 | | | | $ | 6,840 | |
| Interest rate and foreign currency contracts | 13,694 | | | | 704 | |
| Payroll, vacation and other compensation | 9,886 | | | | 3,389 | |
| Accrued interest | 4,815 | | | | 4,870 | |
| Other | 11,121 | | | | 5,858 | |
| | | | |
| | | | |
| $ | 55,715 | | | | $ | 21,661 | |
|
| | | | | | | | |
| (In thousands) | December 31, 2017 |
|
| December 31, 2016 |
| | (Successor) | | | (Successor) |
| Annual incentive compensation | $ | 4,259 |
| | | $ | 5,997 |
|
| Payroll, vacation and other compensation | 4,342 |
| | | 5,121 |
|
| Self-insurance reserves | 1,192 |
| | | 2,091 |
|
| Accrued interest | 338 |
| | | 4,885 |
|
| Current income taxes payable | 99 |
| | | 2 |
|
| Workers compensation reserve | 1,650 |
| | | 1,321 |
|
| Litigation | — |
| | | 1,100 |
|
| Other | — |
| | | 1,139 |
|
| | $ | 11,880 |
| | | $ | 21,656 |
|
HOSTESS BRANDS, INC.
8.NOTES TO CONSOLIDATED FINANCIAL STATEMENTS
10.Tax Receivable Agreement
The tax receivable agreement was entered into by the Company in connection with the Business Combination (the “TaxTax Receivable Agreement”) andAgreement generally provides for the payment by the Company to the Legacylegacy Hostess EquityholdersEquity Holders of 85% of the net cash savings, if any, in U.S. federal, state and local income taxes that the Company realizes (or is deemed to realize in certain circumstances) in periods after the closing of the Business Combination2016 acquisition (which periods may extend, unless the Tax Receivable Agreement is terminated early in accordance with its terms, for more than 15 years following any exchange of Class B Units of Hostess Holdings for shares of the Company’s Class A common stock or the cash equivalent thereof) as a result of (i) certain increases in tax basis resulting from the Business Combination;2016 acquisition; (ii) certain tax attributes of Hostess Holdings and its subsidiaries existing prior to the Business Combination2016 acquisition and prior to subsequent exchanges of Class B Units; (iii) certain increases in tax basis resulting from exchanges of Class B Units; (iv) imputed interest deemed to be paid by the Company as a result of payments it makes under the Tax Receivable Agreement; and (v) certain increases in tax basis resulting from payments the Company makes under the Tax Receivable Agreement. The Company will retain the benefit of the remaining 15% of these cash savings. Certain payments under the Tax Receivable Agreement will be made to Legacy Hostess Equityholdersthe Metropoulos Entities in accordance with specified percentages, regardless of the source of the applicable tax attribute. The Company recognizes a liability on the consolidated balance sheet based on the undiscounted estimated future payments under the Tax Receivable Agreement. Significant inputs used to estimate the future expected payments include a 26.5% cash tax savings expressed as a rate of approximately 27.5%.rate.
The following table summarizes activity related to the tax receivable agreement for the year ended December 31, 2017:Tax Receivable Agreement obligations:
| | | | | | | | |
| (In thousands) | | |
| Balance December 31, 2018 | | $ | 69,063 | |
| Exchange of Class B units for Class A shares | | 71,679 | |
| Remeasurement due to disposal of In-Store Bakery operations | | 1,779 | |
| Remeasurement due to change in estimated state tax rate | | (1,593) | |
| Payments | | (2,732) | |
| Balance December 31, 2019 | | 138,196 | |
| Exchange of Class B units for Class A shares | | 27,915 | |
| Remeasurement due to tax law change | | 610 | |
| Remeasurement due to change in estimated state tax rate | | 150 | |
| Payments | | (10,327) | |
| Balance December 31, 2020 | | $ | 156,544 | |
|
| | | | |
| (In thousands) | | |
| Balance December 31, 2016 (Successor) | | $ | 165,384 |
|
| Measurement period adjustments | | (3,017 | ) |
| Exchanges of Class B units for Class A shares | | 12,215 |
|
| Remeasurement due to change in state tax rate | | 1,589 |
|
| Remeasurement due to Tax Cuts and Jobs Act | | (51,811 | ) |
| Balance December 31, 2017 (Successor) | | $ | 124,360 |
|
During the year ended December 31, 2017,2020, the Tax Receivable Agreement obligations increased $27.9 million due to additional tax basis realized from the exchange of Class B Units and $0.8 million for tax law and rate remeasurements.
During the year ended December 31, 2019, the Company remeasured the Tax Receivable Agreement obligations due to changes in federal and state law. The Company remeasured the Tax Receivable Agreement due to a change in state tax rates resulting in a $1.6 million benefit as the Company decreased its estimated cash tax savings rate thatfrom 26.9% to 26.4%. Additionally, the disposition of the In-Store Bakery operations resulted in approximately $1.6a $1.8 million of expense recognized on the consolidated statement of operations. The Company remeasured the Tax Receivable Agreement due to the Tax Reform. Tax Reform decreased the Company’s estimated cash tax savings rate from approximately 37.4% to 27.5%, primarily due to a permanent Federal tax rate reduction. This resulted in $51.8 million of benefit on the consolidated statement of operations which was reported as a component of operating income.
HOSTESS BRANDS, INC.
NOTES TO CONSOLIDATED FINANCIAL STATEMENTS
As of December 31, 20172020 the future expected payments under the Tax Receivable Agreement are as follows:
| | | | | |
| (In thousands) | |
| 2021 | $ | 11,800 | |
| 2022 | 9,000 | |
| 2023 | 9,700 | |
| 2024 | 9,900 | |
| 2025 | 9,800 | |
| Thereafter | 106,344 | |
11.Debt
|
| | | |
| (In thousands) | |
| 2018 | $ | 14,200 |
|
| 2019 | 7,600 |
|
| 2020 | 7,400 |
|
| 2021 | 7,200 |
|
| 2022 | 7,200 |
|
| Thereafter | 80,760 |
|
9.DebtOn January 3, 2020, the Company originated a $140.0 million incremental term loan through an amendment to its existing credit agreement. The Company received proceeds of $136.9 million, net of fees incurred of $3.1 million. The proceeds, together with cash on hand, financed the purchase of Voortman (see Note 3. Business Combinations and Divestitures). The terms, conditions and covenants applicable to the incremental term loan are the same as the terms, conditions and covenants applicable to the Fourth Term Loan. The term loan requires quarterly payments of interest at a rate of the greater of the applicable LIBOR or 0.75% per annum plus a margin of 2.25% per annum and principal payments at a rate of 0.25% of the aggregate principal balance per quarter with the remaining principal amount due upon maturity on August 3, 2025.
A term loan was originated on November 20, 2017October 1, 2019 through an amendment to an existing credit agreement held by the Company’s subsidiary, Hostess Brands, LLC (referred to below as the Third New First Lien“Fourth Term Loan)Loan”). It requires quarterly payments of interest at a rate of the greater of the applicable LIBOR or 0.75% per annum (“New LIBOR Floor”) plus a margin of 2.25% per annum and principal at a rate of 0.25% of the aggregate principal balance with the remaining principal amount due upon maturity on August 3, 2022.2025. The Third New First LienFourth Term Loan is secured by substantially all of Hostess Brands, LLC’s present and future assets.
The interest rate charged toFourth Term Loan refinanced the Companyremaining balance of $976.4 million on the Third New First Lien Term Loan from its origination through December 31, 2017 was 3.57%.
The (“Third New First Lien Term Loan refinanced the remaining balance of $993.8 million on the Second New First Lien Term LoanLoan”) through a non-cash refinancing transaction. The Second New First LienThird Term Loan was originated through an amendment to an existing credit agreement held by Hostess Brands, LLC on May 19,November 20, 2017 and required quarterly payments of interest at a rate equal to the the New LiborLIBOR Floor plus a margin of 2.50% per annum and principal at a rate of 0.25% of the aggregate principal balance with the remaining principal amount due upon maturity on August 3, 2022. The Second New First Lien Term Loan was secured by substantially all of Hostess Brands’ present and future assets. The interest rate charged to the company on the Second New First Lien Term loan from its origination to refinancing was 3.67%.
The Second New First Lien Term Loan refinanced the remaining balance of $996.3 million on the New First Lien Term Loan through a non-cash refinancing transaction. The New First Lien Term Loan was originated by Hostess Brands, LLC on November 18, 2016 and required quarterly payments of interest at a rate of the greater of the applicable LIBOR or 1% per annum (“LIBOR Floor”) plus a margin of 3.0% per annum and principal at a rate of 0.25% of the aggregate principal balance with the remaining principal amount due upon maturity on August 3, 2022. The New First Lien Term Loan was secured by substantially all of Hostess Brands’ present and future assets. The interest rate charged to the company on the New First Lien Term loan from January 1, 2017 through refinancing was 4.00%.
The New First Lien Term Loan refinanced the remaining balance on the First and Second Lien Term Loans (referred to below as the Former First Lien Term Loan and Former Second Lien Term Loan, respectively) previously incurred by Hostess Brands, LLC of $915.7 million and $83.0 million, respectively, through a non-cash refinancing transaction in November of 2016. The Company expensed prepayment penalties of $3.0 million as part of the deleverage and refinancing, in accordance with the contractual terms of Former First and Second Lien Term loans.
Prior to its refinancing, required quarterly payments on the Former First Lien Term Loan included interest at a rate of the greater of the LIBOR Floor plus an applicable margin of 3.50% per annum or the base rate plus an applicable margin of 2.25% or 2.50% per annum, based on the net first lien leverage ratio, and principal at a rate of 0.25% of the aggregate principal amount through August 3, 2022, at which time all remaining principal was due.
In connection with the Business Combination, the Company recognized $8.9 million of premiums for the Former First and Former Second Lien Term Loans. Lender debt discount costs, premium, and deferred financing costs are presented net of the long-term debt balance on the Consolidated Balance Sheets and will be amortized to interest expense utilizing the effective interest method over the term of the debt. Portions of the lender debt discount costs, premium, and deferred financing costs have been adjusted through the recognition of gains or losses on the statement of operations along with a portion of other fees incurred with each of the aforementioned refinancing transactions.
A summary of the carrying value of the debt and the capital lease obligationobligations is as follows:
| | | | | | | | | | | | | | |
| (In thousands) | December 31,
2020 | | | December 31,
2019 |
| Term Loan (3.0% as of December 31, 2020) | | | | |
| Principal | $ | 1,102,763 | | | | $ | 973,930 | |
| Unamortized debt premiums, discounts and issuance costs | (4,917) | | | | (3,094) | |
| 1,097,846 | | | | 970,836 | |
| Lease obligations | 29,002 | | | | 16,452 | |
| Total debt and lease obligations | 1,126,848 | | | | 987,288 | |
| Less: Amounts due within one year | (13,811) | | | | (11,883) | |
| Long-term portion | $ | 1,113,037 | | | | $ | 975,405 | |
|
| | | | | | | | |
| (In thousands) | December 31, 2017 | | | December 31,
2016 |
| | (Successor) | | | (Successor) |
| Third First Lien Term Loan (3.6% as of December 31, 2017) | | | | |
| Principal | $ | 993,762 |
| | | $ | 998,750 |
|
| Unamortized debt premium and issuance costs | 4,857 |
| | | 5,396 |
|
| 998,619 |
| | | 1,004,146 |
|
| Capital lease obligation (6.8% as of December 31, 2017) | 569 |
| | | 724 |
|
| Total debt and capital lease obligation | 999,188 |
| | | 1,004,870 |
|
| Less: Amounts due within one year | (11,268 | ) | | | (11,496 | ) |
| Long-term portion | $ | 987,920 |
| | | $ | 993,374 |
|
At December 31, 2017,2020 and 2019, the approximate fair value of the Company's aggregate term loan balance was $1,109.3 million and $977.6 million, respectively. The fair value is calculated using current interest rates and pricing from financial institutions (Level 2 inputs).
HOSTESS BRANDS, INC.
NOTES TO CONSOLIDATED FINANCIAL STATEMENTS
At December 31, 2020, minimum debt repayments under the Third First LienFourth Term Loan are due as follows:
| | | (In thousands) | | (In thousands) | |
| 2018 | $ | 9,938 |
| |
| 2019 | 9,938 |
| |
| 2020 | 9,938 |
| |
| 2021 | 9,938 |
| 2021 | $ | 11,167 | |
| 2022 | 954,010 |
| 2022 | 11,167 | |
| 2023 | | 2023 | 11,167 | |
| 2024 | | 2024 | 11,167 | |
| 2025 | | 2025 | 1,058,095 | |
Revolving Credit Facility
On October 1, 2019, Hostess Brands, LLC entered into aamended its Revolving Credit Agreement (the “Revolver”) on August 3, 2015 that provides, providing for borrowings up to $100.0 million. The Revolver hasmillion, a stated maturity date of August 3, 20202024 and is secured by liens on substantially all of Hostess Brands, LLC’s present and future assets, including accounts receivable and inventories, as defined in the Revolver. The Revolver is pari passu, or ranked equally with the Third New First LienFourth Term Loan in regards to secured liens. The Revolver has an annual commitment fee on the unused portion of between 0.375% and 0.50% annually based upon the unused percentage. Interest on borrowings under the Revolver is, at Hostess Brands, LLC’s option, either the applicable LIBOR plus a margin of 2.25% per annum or the base rate plus a margin of 1.25% per annum.
Prior to the amendment the Revolver originated on August 3, 2015 had a stated maturity date of August 3, 2020 and an annual commitment fee on the unused portion of between 0.375% and 0.50% annually based upon the unused percentage. Interest on borrowings under the Revolver was, at Hostess Brands, LLC’s option, either the applicable LIBOR plus a margin of between 3.00% and 3.50% per annum or the base rate plus a margin of 2.00% to 2.50% per annum. All other significant terms and provisions were unchanged by the amendment.
The Company had no0 outstanding borrowings under its Revolving Credit Agreement (the “Revolver”)the Revolver as of December 31, 2017.2020 or 2019. See Note 14 -- “Commitments16. Commitments and Contingencies”Contingencies for information regarding the letters of credits,credit, which reduce the amount available for borrowing under the Revolver. Interest expense from theThe Revolver debt fee amortization was $0.3 million (Predecessor) for the year endedcontains certain restrictive financial covenants. As of December 31, 2016, and $0.1 million for2020, the year endedCompany was in compliance with these covenants.
HOSTESS BRANDS, INC.
NOTES TO CONSOLIDATED FINANCIAL STATEMENTS
12.Derivative Instruments
Warrants
As of December 31, 2015,2020 and 2019, there were 53,936,776 and 48,453,154 public warrants, and 541,658 and 8,046,636 private placement warrants outstanding, respectively. Each warrant entitles its holder to purchase one-half of one share of Class A common stock at an exercise price of $5.75 per half share, to be exercised only for a whole number of shares of Class A common stock. The warrants expire on November 4, 2021, or earlier upon redemption or liquidation. The Company may call the outstanding public warrants for redemption at a price of $0.01 per warrant, if the last sale price of the Company’s common stock equals or exceeds $24.00 per share for any 20 trading days within a 30-trading day period ending on the third business day before the Company sends the notice of redemption to the warrant holders. The private placement warrants, however, are nonredeemable so long as they are held by Gores Sponsor, LLC or its permitted transferees. The potential resale of the private placement warrants to the public has been registered with the SEC. When sold to the public, the private placement warrants will become public warrants.
The warrant agreement contains a tender offer provision that when paired with a two-class equity structure causes all warrants to be precluded from equity classification. Subsequent to the collapse of the two-class structure in November 2020 when all remaining Class B shares were exchanged for Class A shares, the tender offer provision no longer precludes the public warrants from being equity-classified. As a result, the $68.5 million liability related to the public warrants was reclassified to equity in November 2020. There are provisions specific to the private warrants which cause them to continue to be liability classified subsequent to the exchange. As of December 31, 2020, the outstanding private warrants remain liability classified and subject to fair value measurement. The fair value of the warrants is measured on a recurring basis by comparison to available market information. The value of the each public warrant up until they were no longer classified as liabilities was based on the public trading price of the warrant (Level 1 fair value measurement). The fair value of each private warrant was evaluated and determined to be substantially the same as that of a public warrant and therefore considered to be a Level 2 fair value measurement.Gains and losses related to the warrants are reflected in the change in fair value of warrant liabilities in the consolidated statement of operations. 10.Interest Rate SwapSwaps
DuringTo reduce the year ended December 31, 2017, Hostess Brands, LLCeffect of interest rate fluctuations, the Company entered into an interest rate swap contract with a counter party to make a series of payments based on a fixed interest rate of 1.78% and receive a series of payments based on the greater of LIBOR or 0.75%. Both the fixed and floating payment streams are based on a notional amount of $500 million at the inception of the contract and will beare reduced by $100 million each year of the five-year contract. As of December 31, 2020, the notional amount was $200 million. The Company entered into this transaction to reduce its exposure to changes in cash flows associated with its variable rate debt and has designated this derivative as a cash flow hedge. At December 31, 2017,2020, the effective fixed interest rate on the long-term debt hedged by this contract was 4.03%.
In February 2020, the Company entered into additional five-year interest rate swap contracts to further reduce the effect of interest rate fluctuations on its variable-rate debt. The notional value of these contracts was $500 million. Under the terms of the contracts, the Company makes quarterly payments based on fixed interest rates ranging from 1.11% to 1.64% and receives quarterly payments based on the greater of LIBOR or 0.75%. The Company has designated these contracts as cash flow hedges. At December 31, 2020, the effective interest rate on the long-term debt hedged by these contracts was 3.76%.
HOSTESS BRANDS, INC.
NOTES TO CONSOLIDATED FINANCIAL STATEMENTS
Foreign Currency Contracts
To reduce the effect of fluctuations in CAD denominated expenses relative to their US dollar equivalents originating from its Canadian operations, the Company entered into CAD purchase contracts during the year ended December 31, 2017, less than $0.12020. The contracts provide for the Company to sell a total of $11.5 million USD for $14.6 million of CAD at varying defined settlement dates through the end of 2021. The Company has designated these contracts as cash flow hedges.
In connection with the agreement to purchase Voortman as described in Note 3. Business Combinations and Divestitures, the Company entered into a deal-contingent foreign currency contract to hedge the $440 million CAD forecasted purchase price and a portion of the subsequent expected conversion costs. The contract was recorded within interest expensesettled in cash following the consolidated statementscompletion of operations for ineffectiveness and there were no reclassifications from accumulated other comprehensive loss into earnings. Asthe purchase on January 3, 2020.
A summary of December 31, 2017, the fair value of theforeign currency and interest rate swap contract of $2.9 million was reported within other assets, net on the consolidated balance sheet. The$0.1 million of unrealized losses recognized in accumulated other comprehensive incomecontracts is as of December 31, 2017 are expected to be reclassified into interest expense through December 31, 2018.follows: | | | | | | | | | | | | | | |
| (In thousands) | | December 31,
2020 | | December 31,
2019 |
| Asset derivatives | Location | | | |
| Foreign currency contracts (1) | Other current assets | $ | 0 | | | $ | 7,128 | |
| | | | |
| Liability derivatives | Location | | | |
| | | | |
| Interest rate swap contracts (2) | Accrued expenses | $ | 13,688 | | | $ | 704 | |
| Foreign currency contracts (1) | Accrued expenses | 6 | | | 0 | |
| | $ | 13,694 | | | $ | 704 | |
(1) The fair valuevalues of the interest rate swap contract isforeign currency contracts are measured on a recurring basis by comparison to available market information on similar contracts (Level 2)
(2) The fair values of these contracts are measured on a recurring basis by netting the discounted future fixed cash payments and the discounted expected variable cash receipts. The variable cash receipts are based on the expectation of future interest rates (forward curves) derived from observed market interest rate curves (Level 2).
11.HOSTESS BRANDS, INC.
NOTES TO CONSOLIDATED FINANCIAL STATEMENTS
A summary of the gains and losses related to foreign currency and interest rate contracts in the consolidated statement of operations is as follows:
| | | | | | | | | | | | | | | | | | | | |
| (In thousands) | | Year Ended
December 31,
2020 | | Year Ended
December 31,
2019 | | Year Ended
December 31,
2018 |
| | | | | | |
| Gain (loss) on derivative contracts designated as cash flow hedges | Location | | | | | |
| Interest rate swap contracts | Interest expense, net | $ | (3,886) | | | $ | 1,705 | | | $ | 775 | |
| | | | | | |
| Gain (loss) on other derivative contracts | Location | | | | | |
| Foreign currency contracts | Gain on foreign currency contract | 0 | | | 7,128 | | | 0 | |
| Foreign currency contracts | Other expense | (274) | | | 0 | | | 0 | |
| | $ | (274) | | | $ | 7,128 | | | $ | 0 | |
For interest rate swap contracts, unrealized expense recognized in accumulated other comprehensive income as of December 31, 2020 of $4.7 million is expected to be reclassified into interest expense through December 31, 2021.
For foreign currency contracts, unrealized expense recognized in accumulated other comprehensive income as of December 31, 2020 of less than $0.1 million is expected to be reclassified into cost of goods sold through December 31, 2021.
13. Equity
The Company’s authorized common shares consiststock consists of three3 classes: 200,000,000 shares of Class A common stock, 50,000,000 shares of Class B common stock,Stock, and 10,000,000 shares of Class F common stock (none(NaN of which were issued and outstanding at December 31, 20172020 or December 31, 2016)2019). As of December 31, 20172020 and December 31, 2016,2019, there were 99,791,245130,347,464 and 98,250,917122,108,086 shares of Class A common stock issued and outstanding, respectively. AtAs of December 31, 2017 and 20162020 there were 30,319,564 and 31,704,9880 shares of Class B common stock issued and outstanding, respectively.outstanding. At December 31, 2019, there were 8,409,834 shares of Class B common stock issued and outstanding.
Shares of Class A common stock and Class B common stockStock have identical voting rights. However, shares of Class B common stockStock do not participate in earnings or dividends of the Company. Ownership of shares of Class B common stockStock is restricted to owners of Class B unitsUnits in Hostess Holdings. Class B units in Hostess Holdings may be exchanged (together with the cancellation of an equivalent number of shares of Class B common stock)Stock) by the holders thereof for, at the election of the Company, shares of Class A common stock or the cash equivalent of such shares.
As of December 31, 2017 and December 31, 2016, there were 44,182,889 and 37,500,000 public warrants, and 12,317,001 and 19,000,000 private placement warrants outstanding, respectively. Each warrant entitles its holder to purchase one-half of one share of our Class A common stock at an exercise price of $5.75 per half share, to be exercised only for a whole number of shares of our Class A common stock. The warrants expire on December 4, 2021, or earlier upon redemption or liquidation. The Company may call the outstanding warrants for redemption at a price of $0.01 per warrant, if the last sale price of the Company’s common stock equals or exceeds $24.00 per share for any 20 trading days within a 30 trading day period ending on the third business day before the Company sends the notice of redemption to the warrant holders. The private placement warrants, however, are nonredeemable so long as they are held by the Company’s Sponsor or its permitted transferees. During the year ended December 31, 2017,2020, all remaining outstanding Class B units were exchanged for Class A Common Stock.
During the year ended December 31, 2020, the Company's Board of Directors approved a securities repurchase program of up to $100 million of the Company's outstanding securities. As of December 31, 2020, $8.0 million has been used under this authorization to repurchase 444,444 Class A shares at $13.50 per share and 2,000,000 private placement warrants were registered withat $1 each. The repurchased Class A shares are included in treasury stock on the SEC for future potential sales to the public. When sold to the public, the private placement warrants will become public warrants.consolidated balance sheet.
12.
HOSTESS BRANDS, INC.
NOTES TO CONSOLIDATED FINANCIAL STATEMENTS
14.Earnings Per Share
Basic earnings per share is calculated by dividing net income attributable to the Company’s Class A shareholdersstockholders for the period by the weighted average number of Class A common shares outstanding for the period excluding non-vested restricted stock awards. In computing dilutive earnings per share, basic earnings per share is adjusted for the assumed issuance of all applicable potentially dilutive share-based awards, including: public and private placement warrants, RSUs, restricted stock awards, and stock options.
Below are basic and diluted earnings (loss) per share: | | | | | | | | | | | | | | | | | |
| (As Restated) |
| Year Ended
December 31,
2020 | | Year Ended
December 31,
2019 | | Year Ended
December 31,
2018 |
| Numerator: (in thousands) | | | | | |
| Net income attributable to Class A stockholders - basic | $ | 104,676 | | | $ | 4,299 | | | $ | 142,051 | |
| Impact of change in fair value of warrant liabilities | (39,941) | | | — | | | (79,156) | |
| Numerator for diluted earnings per share | 64,735 | | | 4,299 | | | 62,895 | |
| Denominator: | | | | | |
| Weighted-average Class A shares outstanding - basic (excluding non-vested restricted stock awards) | 124,927,535 | | | 110,540,264 | | | 99,957,049 | |
| Dilutive effect of warrants | 2,525,863 | | | 0 | | | 3,021,239 | |
| Dilutive effect of RSUs | 270,090 | | | 465,425 | | | 120,106 | |
| Weighted-average shares outstanding - diluted | 127,723,488 | | | 111,005,689 | | | 103,098,394 | |
| Earnings per Class A share - basic | $ | 0.84 | | | $ | 0.04 | | | $ | 1.42 | |
| Earnings per Class A share - dilutive | $ | 0.51 | | | $ | 0.04 | | | $ | 0.61 | |
| | | | | |
|
| | | | | | | | |
| | Year Ended
December 31,
2017 | | From November 4, 2016
through
December 31, 2016 |
| | (Successor) | | (Successor) |
| Numerator: | |
| |
|
| Net income (loss) attributable to Class A shareholders (in thousands) | | $ | 223,897 |
| | $ | (4,404 | ) |
| Denominator: | |
| |
|
| Weighted-average Class A shares outstanding - basic (excluding non-vested restricted stock awards) | | 99,109,629 |
| | 97,791,658 |
|
| Dilutive effect of warrants | | 6,113,053 |
| | — |
|
| Dilutive effect of RSAs and RSUs | | 84,611 |
| | — |
|
| Weighted-average shares outstanding - diluted | | 105,307,293 |
| | 97,791,658 |
|
| Earnings (loss) per Class A share - basic | | $ | 2.26 |
| | $ | (0.05 | ) |
| Earnings (loss) per Class A share - dilutive | | $ | 2.13 |
| | $ | (0.05 | ) |
For warrants that are liability-classified, during periods when the year ended December 31, 2017,impact is dilutive, the Company assumes share settlement of the instruments as of the beginning of the reporting period and adjusts the numerator to remove the change in fair value of the warrant liability and adjusts the denominator to include the dilutive shares calculated using the treasury stock method.
For all years presented, the dilutive effect of stock options were excluded from the computation of diluted net incomeearnings per share because the assumed proceeds from the awards’ exercise were greater than the average market price of the common shares.
13.HOSTESS BRANDS, INC.
NOTES TO CONSOLIDATED FINANCIAL STATEMENTS
15. Income Taxes
The Company accounts for income taxes under the asset and liability method. Under this method, deferred tax liabilities and assets are determined based on the difference between the financial statement and tax basis of assets and liabilities using enacted tax rates in effect for the year in which the difference is expected to reverse. Additionally, the impact of changes in the enacted tax rates and laws on deferred taxes, if any, is reflected in the financial statements in the period of enactment.
The income tax expense (benefit) consisted of the following:
| | | | | | | | | | | | | | |
| (In thousands) | | Year Ended
December 31,
2020 | Year Ended
December 31,
2019 | Year Ended
December 31,
2018 |
| Current tax expense | | | | |
| Federal | | $ | 2,120 | | $ | 1,724 | | $ | 622 | |
| State and local | | 1,479 | | 1,047 | | 2,077 | |
| Foreign | | 0 | | 0 | | 0 | |
| Total Current | | 3,599 | | 2,771 | | 2,699 | |
| | | | |
| Deferred tax expense (benefit) | | | | |
| Federal | | 17,204 | | 14,859 | | 14,476 | |
| State and local | | 3,750 | | (738) | | (4,221) | |
| Foreign | | (4,148) | | 0 | | 0 | |
| Total Deferred | | 16,806 | | 14,121 | | 10,255 | |
| Income tax expense, net | | $ | 20,405 | | $ | 16,892 | | $ | 12,954 | |
|
| | | | | | | | | | | | |
| (In thousands) | Year Ended December 31, 2017 | | November 4, 2016
through December 31, 2016 | | | January 1, 2016
through November 3, 2016 |
| | (Successor) | | (Successor) | | | (Predecessor) |
| Current tax expense (benefit) | | | | | | |
| Federal | $ | 11,163 |
| | $ | 9 |
| | | $ | 35 |
|
| State and local | 2,903 |
| | 43 |
| | | 12 |
|
| Total Current | 14,066 |
| | 52 |
| | | 47 |
|
| | | | | | | |
| Deferred tax expense (benefit) | | | | | | |
| Federal | (93,457 | ) | | $ | (6,751 | ) | | | 343 |
|
| State and local | 12,187 |
| | (1,063 | ) | | | 49 |
|
| Total Deferred | (81,270 | ) | | (7,814 | ) | | | 392 |
|
| Income tax expense (benefit), net | $ | (67,204 | ) | | $ | (7,762 | ) | | | $ | 439 |
|
| | | | | | | | | | | | | | |
| | (As Restated) |
| (In thousands) | | Year Ended
December 31,
2020 | Year Ended
December 31,
2019 | Year Ended
December 31,
2018 |
| Earnings before income taxes | | | | |
| United States | | $ | 144,075 | | $ | 35,641 | | $ | 173,536 | |
| Foreign | | (15,373) | | 0 | | 0 | |
| Income before income taxes | | $ | 128,702 | | $ | 35,641 | | $ | 173,536 | |
The Company was a nontaxable partnership inFor the Predecessor yearyears ended December 31, 2015. In the Predecessor period January 1, 2016 through November 3, 2016, Superior, a C corporation, was subject to income taxes.
As a result of the Business Combination, the Company acquired a controlling interest in Hostess Holdings, which is treated as a partnership for U.S. federal2020, 2019, and most applicable state and local income tax purposes. As a partnership, Hostess Holdings is not itself subject to U.S. federal and certain state and local income taxes. Any taxable income or loss generated by Hostess Holdings is passed through and included in the taxable income or loss of its partners, including the Company in Successor periods. The Company is subject to U.S. federal income taxes, in addition to state and local income taxes with respect to its allocable share of any taxable income of Hostess Holdings following the Business Combination.
The operations of Hostess Holdings include those of its C corporation subsidiaries. These C corporation subsidiaries are subject to U.S. federal, state and local income taxes. The Company’s tax provision includes income taxes for the share of Hostess Holdings income or loss passed through to the Company, the income or loss of the Company’s C corporation subsidiaries and the deferred tax tax impact of outside basis differences in its investments in subsidiaries.
For the year ended December 31, 2017 (Successor) and the periods from November 4 through December 31, 2016 (Successor) and January 1 through November 3, 2016 (Predecessor),2018, the effective income tax rate differs from the federal statutory income tax rate as explained below:
HOSTESS BRANDS, INC.
NOTES TO CONSOLIDATED FINANCIAL STATEMENTS
| | | | | | | | | (As Restated) |
| | Year Ended December 31, 2017 | | November 4, 2016
through December 31, 2016 | | | January 1, 2016
through November 3, 2016 | | Year Ended
December 31,
2020 | | Year Ended
December 31,
2019 | | Year Ended
December 31,
2018 |
| U.S. federal statutory income tax rate | | U.S. federal statutory income tax rate | | 21.0 | % | | 21.0 | % | | 21.0 | % |
| | (Successor) | | (Successor) | | | (Predecessor) | |
| U. S. federal statutory income tax rate | 35.0 | % | | 35.0 | % | | | 35.0 | % | |
| | | | | | | | |
| Change in fair value of warrant liabilities | | Change in fair value of warrant liabilities | | (6.5) | | | 34.7 | | | (9.6) | |
| State and local income taxes, net of federal benefit | 3.8 |
| | 4.1 |
| | | 0.1 |
| State and local income taxes, net of federal benefit | | 2.8 | | | 12.3 | | | 2.4 | |
| Income attributable to non-controlling interest | (6.3 | ) | | (8.8 | ) | | | — |
| Income attributable to non-controlling interest | | (0.6) | | | (8.5) | | | (2.2) | |
| Nontaxable partnerships | — |
| | — |
| | | (34.4 | ) | |
| Valuation allowance | — |
| | 17.2 |
| | | — |
| |
| Tax Cuts and Jobs Act | (66.2 | ) | | — |
| | | — |
| |
| Foreign rate differential | | Foreign rate differential | | (0.6) | | | 0 | | | 0 | |
| Change in state tax rate | 1.2 |
| | — |
| | | — |
| Change in state tax rate | | 0.6 | | | (12.8) | | | (3.3) | |
| Tax law change | | Tax law change | | (0.8) | | | 0 | | | 0 | |
| Gain on TRA buyout | | Gain on TRA buyout | | 0 | | | 0 | | | (0.8) | |
| Other | (2.7 | ) | | 0.3 |
| | | — |
| Other | | 0 | | | 0.7 | | | 0 | |
| Effective income tax rate | (35.2 | )% | | 47.8 | % | | | 0.7 | % | Effective income tax rate | | 15.9 | % | | 47.4 | % | | 7.5 | % |
The recognition of deferred tax assets is based on management’s belief that it is more likely than not that the tax benefits associated with temporary differences, net operating loss carryforwards and tax credits will be utilized. The
Company assesses the recoverability of the deferred tax assets on an ongoing basis. In making this assessment, the Company considers all positive and negative evidence, and all potential sources of taxable income including scheduled reversals of deferred tax liabilities, tax-planning strategies, projected future taxable income and recent financial performance.
Interest and penalties related to income tax liabilities, if incurred, are included in income tax expense in the consolidated statementstatements
Liabilities related to legal proceedings are recorded when it is probable that a liability has been incurred and the associated amount can be reasonably estimated. Where the estimated amount of loss is within a range of amounts and no amount within the range is a better estimate than any other amount, the low end of the range is accrued.
As additional information becomes available, the potential liabilities related to these matters are reassessed and the estimates revised, if necessary. These accrued liabilities are subject to change in the future based on new developments in each matter, or changes in circumstances, which could have a material effect on the Company’s financial condition and results of operations.
The Company entered into a bond-lease agreement with the Development Authority of Columbus, Georgia on December 1, 2013, which was amended in December, 2016. The bond-lease transaction required the companyCompany to exchange its property to the taxing jurisdiction for tax-exempt bonds issued in the name of the Company and not to exceed $18 million. As the issuer and holder of the bonds, the Company is not required to make lease payments. On December 16, 2013, the Company received an ad valorem tax agreement from the Columbus, Georgia Board of Tax Assessors granting tax abatement for the real and personal property located at the Company’s Columbus, Georgia bakery through 2023.
The Company is a party to various long-term arrangements through advance purchase contracts to lock in prices for certain high-volume raw materials and packaging components for normal product production requirements. These advance purchase arrangements are contractual agreements and can only be canceled with a termination penalty that is based upon the current market price of the commodity at the time of cancellation. These agreements qualify for the “normal purchase” exception under accounting standards; and the purchases under these contracts are included as a component of cost of goods sold.
The Company is a party to Letter of Credit arrangements to provide for the issuance of standby letters of credit in the amount of $2.2$5.5 million and $1.7 million.$4.2 million for the years ended 2020 and 2019, respectively. The arrangements support the collateral requirements for insurance. The Letters of Credit are 100% secured through our Revolver.
Item 9. Changes in and Disagreements with Accountants on Accounting and Financial Disclosure
None.
We have established disclosure controls and procedures (as defined in Rules 13a-15(e) and 15d-15(e)) of the Securities Exchange Act of 1934, as amended (the “Exchange Act”), that are designed to provide reasonable assurance that information required to be disclosed in our reports filed or submitted under the Exchange Act is recorded, processed, summarized and reported within the time periods specified in the rules and forms of the Securities and Exchange Commission, and that information relating to the Company is accumulated and communicated to management, including our Chief Executive Officer and Chief Financial Officer, as appropriate, to allow timely decisions regarding required disclosure.
Item 9B. Other Information
None.
Item 10. Directors, Executive Officers and Corporate Governance
Item 11. Executive Compensation
Item 12. Security Ownership of Certain Beneficial Owners and Management and Related Stockholder Matters
Item 13. Certain Relationships and Related Transactions, and Director Independence
Item 14. Principal AccountingAccountant Fees and Services
Part IV.
Item 15. Exhibits, Financial Statement Schedules
*Schedules and exhibits to this Exhibit omitted pursuant to Regulation S-K Item 601(b)(2). The Company agrees to furnish supplementally a copy of any omitted schedules or exhibits to the SEC upon request.
Pursuant to the requirements of Section 13 or 15(d) of the Securities Exchange Act of 1934, the registrant has duly caused this report to be signed on its behalf by the undersigned, thereunto duly authorized, in Lenexa, Kansas City, Missouri on February 28, 2018.
Pursuant to the requirements of the Securities Exchange Act of 1934, this report has been signed by the following persons in the capacities and on the date indicated.