Item 2. Properties.Properties
Item 3. Legal Proceedings
We are involved in lawsuits, claims and proceedings arising in the ordinary course of business. These matters may involve personnel and employment issues, personal injury, contractcontracts and other proceedings arising in the ordinary course of business, which have not resulted in any material losses to date.business. Although we do not expect the outcome of these proceedings to have a material adverse effect on our financial condition or results of operations, litigation is inherently unpredictable. Therefore, we could incur judgments or enter into settlements or claims that could materially impact our results.
Item 4. Mine Safety Disclosures.Disclosures
Not applicable.
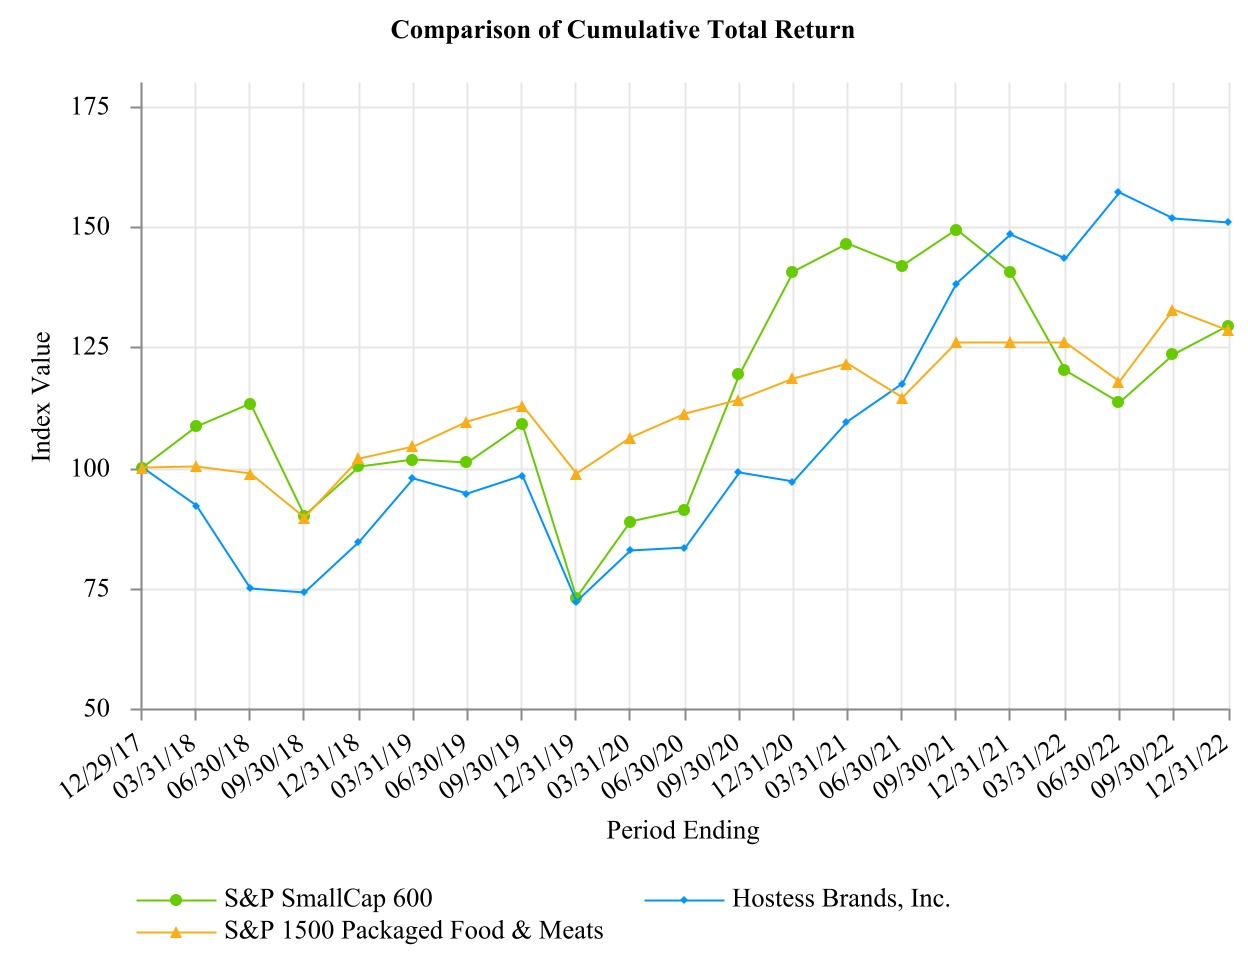
Item 5. Market for Registrant’s Common Equity, Related Stockholder Matters and Issuer Purchases of Equity Securities
We currently do not pay dividends and have not paid any cash dividends on our common stock to date.
The following graph and related information shall not be deemed “soliciting material” or be deemed to be “filed” with the Commission, nor shall such information be incorporated by reference into any future filing, except to the extent that we specifically incorporate it by reference into such filing.
The stock price performance below is not necessarily indicative of future stock price performance.
Item 6. Selected Financial Data[RESERVED]
The following table sets forth our net revenues, operating costs and expenses attributable to our operations.
As a result of the Business Combination, we are the acquirer for accounting purposes and Hostess Holdings is the acquiree and accounting predecessor. Our financial statement presentation includes the financial statements of Hostess Holdings as “Predecessor” for periods prior to the Closing Date and of us for periods after the Closing Date, including the consolidation of Hostess Holdings. Also see “Item 7-Management’s Discussion and Analysis of Financial Condition and Results of Operations-Supplemental Unaudited Pro Forma Combined Financial Information” for supplemental pro forma combined information for 2016 that gives effect to the Business Combination as if such transaction had been consummated on January 1, 2016.
|
| | | | | | | | | | | | | | | | | | | | | | | | | |
| Statement of Operations Data |
| (In thousands except for share and per share data) | Year Ended December 31, 2017 | | From November 4, 2016
through December 31, 2016 | | | From January 1, 2016
through November 3, 2016 | | | Year Ended December 31, 2015 | | Year Ended
December 31, 2014 | | February 6, 2013 (Inception) through December 31, 2013 |
| | (Successor) | | (Successor) | | | (Predecessor) | | | (Predecessor) | | (Predecessor) | | (Predecessor) |
| Net revenue | $ | 776,188 |
| | $ | 111,998 |
| | | $ | 615,588 |
| | | $ | 620,815 |
| | $ | 554,695 |
| | $ | 237,418 |
|
| Gross profit | 326,898 |
| | 38,714 |
| | | 266,529 |
| | | 262,203 |
| | 233,932 |
| | 91,920 |
|
| Operating income (loss) | 233,992 |
| | (9,607 | ) | | | 122,872 |
| | | 155,908 |
| | 119,467 |
| | 23,330 |
|
| Income (loss) before income taxes | 190,904 |
| | (16,247 | ) | | | 60,864 |
| | | 88,760 |
| | 81,464 |
| | (5,594 | ) |
| Net income (loss) | 258,108 |
| | (8,485 | ) | | | 60,425 |
| | | 88,760 |
| | 81,464 |
| | (5,594 | ) |
| Net income (loss) attributable to the non-controlling interest | 34,211 |
| | (4,081 | ) | | | 3,214 |
| | | 4,507 |
| | 4,267 |
| | — |
|
| Net income (loss) attributable to Class A shareholders | $ | 223,897 |
| | $ | (4,404 | ) | | | $ | 57,211 |
| | | $ | 84,253 |
| | $ | 77,197 |
| | $ | (5,594 | ) |
| Earnings (loss) per Class A share: |
|
| | | | | | | | | | | | |
| Basic | $ | 2.26 |
| | $ | (0.05 | ) | | | | | | | | | | |
| Diluted | $ | 2.13 |
| | $ | (0.05 | ) | | | | | | | | | | |
| Weighted-average shares outstanding: | | | | | | | | | | | | | |
| Basic | 99,109,629 |
| | 97,791,658 |
| | | | | | | | | | |
| Diluted | 105,307,293 |
| | 97,791,658 |
| | | | | | | | | | |
|
| | | | | | | | | | | | | | | | | | | | | | | | | |
| Cash Flow Data |
| (In thousands) | | Year Ended December 31, 2017 | | From November 4, 2016 through December 31, 2016 | | | From January 1, 2016 through November 3, 2016 | | Year Ended December 31, 2015 | | Year Ended December 31, 2014 | | February 6, 2013 (Inception) through December 31, 2013 |
| | | (Successor) | | (Successor) | | | (Predecessor) | | (Predecessor) | | (Predecessor) | | (Predecessor) |
Net cash provided by (used in) operating activities | | $ | 163,685 |
| | $ | 13,611 |
| | | $ | 102,221 |
| | $ | 132,972 |
| | $ | 108,329 |
| | $ | (29,672 | ) |
| Net cash provided by (used in) investing activities | | (35,209 | ) | | (428,196 | ) | | | (76,579 | ) | | 17,880 |
| | (91,393 | ) | | (422,498 | ) |
| Net cash provided by (used in) financing activities | | (19,630 | ) | | (232,345 | ) | | | (31,596 | ) | | (296,002 | ) | | (9,769 | ) | | 654,626 |
|
|
| | | | | | | | | | | | | | | | | | | | | | |
| Balance Sheet Data |
| (In thousands) | | December 31, 2017 | | December 31, 2016 | | | December 31, 2015 | | December 31, 2014 | | February 6, 2013 (Inception) through December 31, 2013 | |
| | | (Successor) | | (Successor) | | | (Predecessor) | | (Predecessor) | | (Predecessor) | |
| Cash and cash equivalents | | $ | 135,701 |
| | $ | 26,855 |
| | | $ | 64,473 |
| | $ | 209,623 |
| | $ | 202,456 |
| |
| Property and equipment, net | | 174,121 |
| | 153,224 |
| | | 128,078 |
| | 112,732 |
| | 88,269 |
| |
| Total assets | | 2,966,275 |
| | 2,847,892 |
| | | 643,529 |
| | 765,494 |
| | 683,678 |
| |
| Long-term debt and capital lease obligation | | 987,920 |
| | 993,374 |
| | | 1,193,667 |
| | 473,175 |
| | 479,602 |
| |
| Non-controlling interest | | 342,240 |
| | 334,192 |
| | | (37,991 | ) | | 4,267 |
| | — |
| |
|
| | | | | | | | | | | | | | | | | | | | | | | | | |
Other Financial Data (1) |
| (In thousands) | | Year Ended December 31, 2017 | | From
November 4, 2016 through
December 31, 2016 | | | From
January 1, 2016 through November 3, 2016 | | Year Ended
December 31, 2015 | | Year Ended
December 31, 2014 | | February 6, 2013 (Inception) through December 31, 2013 |
| | | (Successor) | | (Successor) | | | (Predecessor) | | (Predecessor) | | (Predecessor) | | (Predecessor) |
| Adjusted EBITDA | | $ | 230,212 |
| | $ | 31,894 |
| | | $ | 183,409 |
| | $ | 177,930 |
| | $ | 145,343 |
| | $ | 40,285 |
|
|
| | | | | | | | | | | | | | | | | | | | | | | | |
| Adjusted Gross Profit and Adjusted Gross Margin |
| (In thousands) | Year Ended December 31, 2017 | | From November 4, 2016
through December 31, 2016 | | | From
January 1, 2016
through November 3, 2016 | | Year Ended December 31, 2015 | | Year Ended
December 31, 2014 | | February 6, 2013 (Inception) through December 31, 2013 |
| | (Successor) | | (Successor) | | | (Predecessor) | | (Predecessor) | | (Predecessor) | | (Predecessor) |
| Net revenue | $ | 776,188 |
| | $ | 111,998 |
| | | $ | 615,588 |
| | $ | 620,815 |
| | $ | 554,695 |
| | $ | 237,418 |
|
| Cost of goods sold | 449,290 |
| | 73,284 |
| | | 346,864 |
| | 355,963 |
| | 320,763 |
| | 145,498 |
|
| Special employee incentive compensation | — |
| | — |
| | | 2,195 |
| | 2,649 |
| | — |
| | — |
|
| Gross Profit | $ | 326,898 |
| | $ | 38,714 |
| | | $ | 266,529 |
| | $ | 262,203 |
| | $ | 233,932 |
| | $ | 91,920 |
|
| | | | | | | | | | | | | |
| Add back: | | | | | | | | | | | | |
| Special employee incentive compensation (i) | — |
| | — |
| | | 2,195 |
| | 2,649 |
| | — |
| | — |
|
| Inventory fair value adjustment (ii) | — |
| | 8,914 |
| | | — |
| | — |
| | — |
| | — |
|
| Adjusted Gross Profit | $ | 326,898 |
| | $ | 47,628 |
| | | $ | 268,724 |
| | $ | 264,852 |
| | $ | 233,932 |
| | $ | 91,920 |
|
| | | | | | | | | | | | | |
| Gross Margin - GAAP | 42.1 | % | | 34.6 | % | | | 43.3 | % | | 42.2 | % | | 42.2 | % | | 38.7 | % |
| | | | | | | | | | | | | |
| Adjusted Gross Margin | 42.1 | % | | 42.5 | % | | | 43.7 | % | | 42.7 | % | | 42.2 | % | | 38.7 | % |
(i) For the Predecessor period January 1, 2016 through November 3, 2016, a special bonus payment of $2.2 million was paid to employees at the bakery facilities as compensation for their efforts in the Business Combination. For the year ended December 31, 2015, a special bonus payment of $2.6 million was paid to employees at the bakery facilities as compensation for their efforts in the recapitalization of Hostess.
(ii) For the Successor period November 4, 2016 through December 31, 2016, the Company remeasured inventory at fair value at the Business Combination date, resulting in additional non-cash cost of goods sold of $8.9 million.
(1) Adjusted EBITDA is defined and explained in more detail in Item 7. Management’s Discussion and Analysis of Financial Condition and Results of Operations, which contains a reconciliation to the most comparable GAAP measure. Adjusted EBITDA is a non-GAAP financial measures commonly used by securities analysts, investors and other interested parties in their evaluation of the operating performance of companies in industries similar to ours. However, Adjusted EBITDA should not be construed as an alternative to net income as an indicator of operating performance or as an alternative to cash flow provided by operating activities as a measure of liquidity (each as determined in accordance with GAAP). Adjusted EBITDA may not be comparable to similarly titled measures reported by other companies. We have included Adjusted EBITDA because we believe it provides management and investors with additional information to measure our performance.
Adjusted Gross Profit and Adjusted Gross Margin are non-GAAP financial measures commonly used in our industry, however they should not be construed as an alternative to gross profit and gross margin as an indicator of operating performance. Adjusted Gross Profit and Adjusted Gross Margin may not be comparable to similarly titled measures reported by other companies. We have included Adjusted Gross Profit and Adjusted Gross Margin because we believe they provide management and investors with additional information to measure our performance. We believe the presentation of Adjusted Gross Profit and Adjusted Gross Margin is useful to investors because it is consistent with our definition of Adjusted EBITDA.
See Item 7-Management’s Discussion and Analysis of financial Condition and Results of Operations-Adjusted EBITDA Reconciliation.
Item 7. Management’s Discussion and Analysis of Financial Condition and Results of Operations
The following discussion and analysis of our financial condition and results of operations should be read in conjunction with our Consolidated Financial Statementsconsolidated financial statements and related notes included in Item 8 of this Annual Report on Form 10-K. This discussion contains forward-looking statements that involve risks and uncertainties. Our actual results could differ materially from those discussed below. Factors that could cause or contribute to such differences include, but are not limited to, those identified below and those discussed in Item 1A “Risk Factors” of this Annual Report on Form 10-K.
For a comparison of our results of operations for the fiscal years ended December 31, 2021 and December 31, 2020, see “Part II, Item 7. Management’s Discussion and Analysis of Financial Condition and Results of Operations” of our annual report on Form 10-K for the fiscal year ended December 31, 2021, filed with the SEC on March 1, 2022.
Overview
We are a leading United States packaged foodsweet snacks company focused on developing, manufacturing, marketing, selling and distributing fresh sweet baked goods coast-to-coast,snacks in North America, providing a wide range of snack cakes, donuts, sweet rolls, breakfast pastries, cookies, snack pies and related products. We acquired the Hostess® brand and certain strategic assets out of the bankruptcy liquidation proceedings of Old HB Inc., its prior owner, free and clear of all past liabilities, in April 2013, and relaunched the brand later that year.
As of December 31, 2017,2022, we operate five bakeriesbaking facilities and three centralizedutilize distribution centers.centers and third-party warehouses to distribute our products. Our direct-to-warehouse (“DTW”)Direct-to-Warehouse product distribution system allows us to deliver to our customers’ warehouses. Our customers in turn distribute to their retail stores and/or distributors.
We have two reportable segments: “Sweet Baked Goods” In 2022, we purchased a facility in Arkadelphia, Arkansas. The facility will become our sixth bakery upon completion of capital investments to install production lines and “In-Store Bakery”. A changeother necessary improvements needed to make the facility operational. The facility is expected to open in the Company’s internal reporting structure during the lastfourth quarter of 2017 caused the2023.
The Company to reassess itshas one reportable segments. Sweet Baked Goodssegment: Snacking. The Snacking segment consists of fresh and frozen sweet baked goods, cookies, bread and bread productsbuns that are sold under the Hostess®, Voortman®, Dolly Madison®, Cloverhill® and Dolly Madison®Big Texas® brands. In-Store Bakery consists of certain Superior and Hostess® branded eclairs, madeleines, brownies, and iced cookies sold in the bakery section of grocery and club stores.
Hostess® is the second leading brand by market share within the Sweet Baked Goods (“SBG”(“SBG”) category, according to Nielsen U.S. total universe. For the 52-week period ended December 30, 201731, 2022 our branded SBG products’ (which include Hostess®, Dolly Madison®, Cloverhill®, and Big Texas®) market share was 17.2%21.2% per Nielsen’s U.S. SBG category data. We have aOur Hostess® branded products include the #1 leading market positioncupcake and mini donut products within the two largest SBG Segments; Donut Segmentcategory and Snack Cake Segment, The Donutour Voortman® branded products include the #1 creme wafer and Snack Cake Segments together account for 49% ofsugar free cookie products within the Sweet Baked Goods category’s total dollar sales.
Cookie category.
Principal Components of Operating Results
Net Revenue
We generate revenue primarily through selling sweet baked goods and other products under the Hostess® group of brands,packaged snacks, which includesinclude iconic products such as Donettes®, Twinkies®, CupCakes, Ding Dongs®, Zingers®, HoHos®Danishes, Honey Buns and Donettes®,Coffee Cakes under the Hostess® brand, as well as cookies, wafers and sugar free products under the Voortman® brand. We also sell products under the Dolly Madison® brand , Cloverhill® and the Superior on Main® brand (e.g., eclairs, madeleines, brownies and iced cookies).Big Texas® brands along with private label products. Our product assortment is solddelivered to customers’ warehouses and distribution centers by the case or in display readydisplay-ready corrugate units. Retailers display and sell our products to the end consumer in single-serve, multi-pack or club-pack formats. We sell our products primarily to supermarket chains, national mass merchandisersretailers and convenience stores, along with a smaller portion of our product sales going to club, dollar and drug stores, the vending club,channel, and other retail outlets.
Our revenues are driven by average net price and total volume of products sold. Factors that impact unit pricing and sales volume include product mix, the cost of ingredients, theinputs, promotional activities, implemented by the Company and its competitors, industry capacity, new product initiatives and quality and consumer preferences. We do not keep a significant backlog of finished goods inventory, as our fresh baked products are promptly shipped to our distribution centers after being produced and then distributed to customers.
Cost of Goods Sold
Cost of goods sold consists of ingredients, packaging, labor, energy, and other production costs, as well as warehousing and transportation costs for theincluding in-bound freight, inter-plant transportation and distribution of our products to our customers. The cost of ingredients and packaging represent the majority of our total costs of goods sold. All costs that are incurred at the bakeries, including the depreciation of bakery facilities and equipment, are included in cost of goods sold. We do not allocate any corporate functions into cost of goods sold.
Our cost of ingredients consists principally of cooking oil, sugar, coatings, flour sweeteners, edible oils and cocoa,eggs, which are subject to substantial price fluctuations, as is the cost of paper, corrugate, films and plastics used to package our products. The prices for raw materials are influenced by a number of factors, including the weather, crop production, transportation and processing costs, inflation,
government regulation and policies and worldwide market supply and demand. We also rely on fuel products, such as natural gas, diesel, propane and electricity, to operate our bakeries and produce our products. Fluctuations in the prices of the raw materials or fuel products used in the production, packaging or transportation of our products affect the cost of products sold and our product pricing strategy. We utilize forward buying strategies through short-term and long-term advance purchase contracts to lock in prices for certain high-volume raw materials, packagedpackaging components and certain fuel inputs. Through these initiatives, we believe we are able to obtain competitive pricing.
Advertising and Marketing
Our advertising and marketing expenses relate to our advertising campaigns, which include social media, print, online advertising, local promotional events and monthly agency fees. We also invest in wire racks and corrugate displays delivered to customers to display our products off shelf, field marketing and merchandising services to reset and check theour store inventory on a regular basisbasis. We also invest in advertising campaigns, which include social media, print, online advertising, local promotional events, monthly agency fees and marketing employmentpayroll costs.
Selling Expense
Selling expenses primarily include sales management, employment,sales employee-related expenses, travel, and related expenses, as well as broker fees. We utilize brokers for sales support, including managing promotional activities and order processing.
General and Administrative
General and administrative expenses primarily include employee and related expenses for the accounting, planning,finance, customer service, legal, human resources, corporate operations, research and development, purchasing, logistics and executive functions. Also included are professional service fees related to audit and tax, legal, outsourced information technology functions, transportation planning, headquarters and corporate siteother office sites and insurance costs.costs, as well as the depreciation and amortization of corporate assets.
Other Expense
Related Party Expenses
Related party expenses consistedOther expense primarily includes interest paid on our term loan offset by interest income earned on investments as well as a gain in 2022 from receipt of insurance proceeds under the normal annual cash payments associatedrepresentation and warranty insurance policy purchased in connection with our employment arrangements with Mr. Metropoulos as Chief Executive Officer and/or Executive Chairman.
Non-Controlling Interest
Mr. Metropoulosthe Voortman acquisition and the Metropoulos Entities hold their equity investmentchange in us primarily through Class B limited partnership units in the Company’s subsidiary, Hostess Holdings (“Class B Units”),fair value of our liability-classified public and an equal number of shares of the Company’s Class B common stock (“Class B Stock”). Our Class B Stock has voting, but no economic rights, while Hostess Holdings’ Class B Units have economic, but no voting rights. Each Class B Unit, together with a share of Class B Stock held by the Metropoulos Entities, is exchangeable for a share of the Company’s Class A common stock (or at the option of the Company, the cash equivalent thereof). The Company holds 100% of the general partnership interest in Hostess Holdings and a majority of the limited partnership interests and consolidates Hostess Holdings in the Company’s consolidated financial statements. The interest of the Metropoulos Entities in Hostess Holdings’ Class B Units is reflected in our consolidated financial statements as a non-controlling interest.
For periods prior to the Business Combination, Hostess Holdings consolidated the financial position and results of operations of New Hostess Holdco, LLC. The portion of New Hostess Holdco, LLC not owned by Hostess Holdings (which constituted a profits interest plan for management) was recognized as a non-controlling interest in its consolidated financial statements.
Factors Impacting Recent Results
Long-term Debt Refinancing and Interest Rate Risk Management
To manage the risk related to our variable rate debt, during the year ended December 31, 2017, we entered into an interest rate swap contract with a counter party to make a series of payments based on a fixed interest rate of 1.78% and receive a series of payments based on the greater of LIBOR or 0.75%. Both the fixed and floating payment streams are based on a notional amount of $500 million at the inception of the contract and will be reduced by $100 million each year of the five year contract.
On November 20, 2017 and May 19, 2017, our first lien term loan was amended resulting in a decrease of 0.25% and 0.50%, respectively, to the margin applied to our variable rate. The maturity date of August 3, 2022 remained unchanged.
Seasonality
Sweet baked goods revenues tend to be moderately seasonal, with declines during the early winter period, which we believe are attributable to altered consumption patterns during the holiday season. We expect this trend to continue and continue to be applicable to our business. We strive to mitigate the seasonality by running certain targeted promotional campaigns.
Note on Financial Presentation
As a result of the completion of the Business Combination on November 4, 2016, our Consolidated Financial Statements included elsewhere in the Annual Report are presented: (i) as of December 31, 2017 andprivate placement warrants for the year ended December 31, 2017 (Successor); (ii) as2021.
Factors Impacting Recent Results
Supply Chain
We believe volatility in certain aspects of the global supply chain have had a continued impact on our operations, including the cost and availability of labor, transportation and raw materials. Various macro factors, including, but not limited to, the COVID-19 pandemic, labor market trends, rising fuel and transportation costs, currency exchange rate, the conflict in Ukraine, the Avian Influenza and overall elevated demand for goods, have led to fragility in the supply chain.
We continue to experience increased labor costs, raw materials costs and transportation costs in the current economic climate. Given the fragility of the global supply-chain environment, our ability to source raw materials for our production facilities or produce and ship products to meet the needs of our customers may be materially impacted. We continue to work closely with all of our vendors, distributors, contract manufacturers, and other external business partners to ensure availability of our products for our customers and consumers.
In response to the inflationary costs described above, we have implemented price increases and may implement additional price increases in the future. Customers may not accept price increases or we may face competitive pressure that leads to price reductions for certain products.
Acquisition
On January 3, 2020, we completed the acquisition of all of the shares of the parent company of Voortman Cookies Limited (“Voortman”), a manufacturer of premium, branded wafers and cookies, including sugar free products. By adding the Voortman® brand, we believe we have greater growth opportunities provided by a more diverse portfolio of brands and products.
In December 31, 20162020, the Company asserted claims for indemnification against the sellers under the terms of the Share Purchase Agreement pursuant to which the Company acquired Voortman (the “Agreement”). The claims arose out of alleged breaches by the sellers of certain representations, warranties and forcovenants contained in the period November 4, 2016Agreement relating to December 31, 2016 (Successor); (iii) forperiods prior to the period January 1, 2016closing of the acquisition. The Company also submitted claims relating to November 3, 2016 (Predecessor);these alleged breaches under the representation and (iv) forwarranty insurance policy (“RWI”) it purchased in connection with the acquisition. In June 2022, the RWI insurers agreed to pay the Company $42.5 million CAD (the RWI coverage limit) (the “Proceeds”) related to these breaches. During the year ended December 31, 2015 (Predecessor). For comparative purposes, we also present supplemental unaudited pro forma combined Statements2022, the Company received the Proceeds and recognized a gain of Operations$42.5 million CAD ($33.0 million) in other expense (income) on our consolidated statement of operations. Per agreement with the RWI insurers, under no circumstances will the Company be required to return the Proceeds.
On November 3, 2022, pursuant to the agreement with the RWI insurer, Voortman brought claims in the Ontario (Canada) Superior Court of Justice (the “Claim”), related to the breaches against certain of the sellers from whom Voortman was acquired. The Claim alleges the seller defendants made certain non-disclosures and misrepresentations to induce the Company to overpay for Voortman. The Company is seeking damages of $109 million CAD representing the yearamount of the aggregate liability of the sellers for indemnification under the Agreement, $5.0 million CAD in punitive or aggravated damages, interest, proceedings fees and any other relief the presiding court deems appropriate. A portion of any recovery will be shared with the RWI insurers. Although the Company strongly believes that its Claim against the sellers is meritorious, no assurance can be given as to whether the Company will recover all, or any part, of the amounts it is pursuing.
Change in Fair Value of Warrant Liabilities
During the years ended December 31, 20162021 and 2020, there were fluctuations in the table belowmarket price of our publicly traded warrants. These fluctuations created significant gains and losses on the discussion that follows. See “-Supplemental Unaudited Pro Forma Combined Financial Information.”remeasurement of certain warrants which are recognized as “change in fair value of warrant liabilities” within other expense on our consolidated statement of operations. The warrants expired on November 4, 2021 and are no longer outstanding.
Results of Operations
Comparison of Results of Operations for the Year Ended December 31, 2017 (Successor), From November 4, 2016 through December 31, 2016 (Successor), From January 1, 2016 through November 3, 2016 (Predecessor) and the Year Ended December 31, 2015 (Predecessor)
|
| | | | | | | | | | | | | | | | | | | | | | | | | | | | |
| | | | | | | | | | | |
| | 2017 | | 2016 | | | | 2015 |
(In thousands, except share and per share data) | Year Ended December 31 | | %
of Net Revenues | | From November 4 through December 31 | | %
of Net Revenues | | | From January 1 through November 3 | | %
of Net Revenues | | Year Ended December 31 | | %
of Net Revenues |
| | (Successor) | | | | (Successor) | | | | | (Predecessor) | | | | (Predecessor) | | |
| Net revenue | $ | 776,188 |
| | 100.0 | % | | $ | 111,998 |
| | 100.0 | % | | | $ | 615,588 |
| | 100.0 | % | | $ | 620,815 |
| | 100.0 | % |
| Cost of goods sold | 449,290 |
| | 57.9 |
| | 73,284 |
| | 65.4 |
| | | 346,864 |
| | 56.3 |
| | 355,963 |
| | 57.3 |
|
| Special employee incentive compensation | — |
| | — |
| | — |
| | — |
| | | 2,195 |
| | 0.4 |
| | 2,649 |
| | 0.4 |
|
| Gross profit | 326,898 |
| | 42.1 |
| | 38,714 |
| | 34.6 |
| | | 266,529 |
| | 43.3 |
| | 262,203 |
| | 42.2 |
|
| Operating costs and expenses: | | | | | | | — |
| | | | | — |
| | | | — |
|
| Advertising and marketing | 33,004 |
| | 4.3 |
| | 5,245 |
| | 4.7 |
| | | 30,626 |
| | 5.0 |
| | 31,967 |
| | 5.1 |
|
| Selling expense | 32,086 |
| | 4.1 |
| | 5,033 |
| | 4.5 |
| | | 25,730 |
| | 4.2 |
| | 29,484 |
| | 4.7 |
|
| General and administrative | 52,943 |
| | 6.8 |
| | 7,322 |
| | 6.5 |
| | | 38,391 |
| | 6.2 |
| | 31,531 |
| | 5.1 |
|
| Special employee incentive compensation | — |
| | — |
| | — |
| | — |
| | | 2,503 |
| | 0.4 |
| | 1,274 |
| | 0.2 |
|
| Amortization of customer relationships | 23,855 |
| | 3.1 |
| | 3,922 |
| | 3.5 |
| | | 1,185 |
| | 0.2 |
| | 851 |
| | 0.1 |
|
| Impairment on property and equipment | 1,003 |
| | 0.1 |
| | — |
| | — |
| | | 7,300 |
| | 1.2 |
| | 2,700 |
| | 0.4 |
|
| Loss on sale/abandonment of property and equipment, and bakery shutdown costs (recoveries) | (144 | ) | | — |
| | — |
| | — |
| | | 2,551 |
| | 0.4 |
| | 4,182 |
| | 0.7 |
|
| Business combination transaction costs | — |
| | — |
| | — |
| | — |
| | | 31,832 |
| | 5.2 |
| | — |
| | — |
|
| Related party expenses | 381 |
| | — |
| | 26,799 |
| | 23.9 |
| | | 3,539 |
| | 0.6 |
| | 4,306 |
| | 0.7 |
|
| Tax receivable agreement liability remeasurement | (50,222 | ) | | (6.5 | ) | | — |
| | — |
| | | — |
| | — |
| | — |
| | — |
|
| Total operating costs and expenses | 92,906 |
| | 12.0 |
| | 48,321 |
| | 43.1 |
| | | 143,657 |
| | 23.3 |
| | 106,295 |
| | 17.1 |
|
| Operating income | 233,992 |
| | 30.1 |
| | (9,607 | ) | | (8.6 | ) | | | 122,872 |
| | 20.0 |
| | 155,908 |
| | 25.1 |
|
| Other expense: | | | | | | | — |
| | | | |
|
| | | |
|
|
| Interest expense, net | 39,174 |
| | 5.0 |
| | 6,649 |
| | 5.9 |
| | | 60,384 |
| | 9.8 |
| | 50,011 |
| | 8.1 |
|
| Loss (gain) on modification of debt | 2,554 |
| | 0.3 |
| | (763 | ) | | (0.7 | ) | | | — |
| | — |
| | 25,880 |
| | 4.2 |
|
| Other expense (income) | 1,360 |
| | 0.2 |
| | 754 |
| | 0.7 |
| | | 1,624 |
| | 0.3 |
| | (8,743 | ) | | (1.4 | ) |
| Total other expense | 43,088 |
| | 5.6 |
| | 6,640 |
| | 5.9 |
| | | 62,008 |
| | 10.1 |
| | 67,148 |
| | 10.8 |
|
| Income before income taxes | 190,904 |
| | 24.6 |
| | (16,247 | ) | | (14.5 | ) | | | 60,864 |
| | 9.9 |
| | 88,760 |
| | 14.3 |
|
| Income tax expense (benefit) | (67,204 | ) | | (8.7 | ) | | (7,762 | ) | | (6.9 | ) | | | 439 |
| | 0.1 |
| | — |
| | — |
|
| Net income (loss) | 258,108 |
| | 33.3 |
| | (8,485 | ) | | (7.6 | ) | | | 60,425 |
| | 9.8 |
| | 88,760 |
| | 14.3 |
|
| Less: Net income attributable to the non-controlling interest | 34,211 |
| | 4.4 |
| | (4,081 | ) | | (3.6 | ) | | | 3,214 |
| | 0.5 |
| | — |
| | — |
|
| Net income attributable to Class A shareholders | $ | 223,897 |
| | 28.8 | % | | $ | (4,404 | ) | | (3.9 | )% | | | $ | 57,211 |
| | 9.3 | % | | $ | 88,760 |
| | 14.3 | % |
| | | | | | | | | | | | | | | | | |
| Earnings per Class A share: | | | | | | | | | | | | | | | | |
| Basic | $ | 2.26 |
| | | | $ | (0.05 | ) | | | | | | | | | | | |
| Diluted | $ | 2.13 |
| | | | $ | (0.05 | ) | | | | | | | | | | | |
| | | | | | | | | | | | | | | | | |
| Weighted-average shares outstanding: | | | | | | | | | | | | | | | | |
| Basic | 99,109,629 |
| | | | 97,791,658 |
| | | | | | | | | | | |
| Diluted | 105,307,293 |
| | | | 97,791,658 |
| | | | | | | | | | | |
As discussed above, the financial information presented herein for periods prior to the completion of the Business Combination is of our accounting Predecessor, Hostess Holdings, and, for periods from and after the Business Combination, is of Hostess Brands, Inc.
The financial information for the year ended December 31, 2016 is divided into Predecessor and Successor periods and is not comparable to the full year ended December 31, 2017 (Successor) and the full year ended December 31, 2015 (Predecessor). Accordingly, such periods are presented on a historical stand-alone basis without comparison. In addition, we have presented comparative results of operations for the year ended December 31, 2017 (Successor) compared to the pro forma combined year ended December 31, 2016 and of such pro forma combined year ended December 31, 2016 compared to the year ended December 31, 2015 (Predecessor).
| | | | | | | | | | | | | | | |
| | | |
(In thousands, except per share data) | Year Ended December 31, 2022 | | Year Ended
December 31,
2021 | | | | |
| Net revenue | $ | 1,358,207 | | | $ | 1,142,036 | | | | | |
| | | | | | | |
| | | | | | | |
| Gross profit | 465,679 | | | 409,983 | | | | | |
| As a % of net revenue | 34.3 | % | | 35.9 | % | | | | |
| | | | | | | |
| | | | | | | |
| | | | | | | |
| | | | | | | |
| | | | | | | |
| | | | | | | |
| | | | | | | |
| | | | | | | |
| | | | | | | |
| | | | | | | |
| | | | | | | |
| | | | | | | |
| Total operating costs and expenses | $ | 245,401 | | | $ | 209,245 | | | | | |
| Operating income | 220,278 | | | 200,738 | | | | | |
| | | | | | | |
| | | | | | | |
| | | | | | | |
| | | | | | | |
| | | | | | | |
| Total other expense | 8,994 | | | 40,926 | | | | | |
| | | | | | | |
| Income tax expense | 47,089 | | | 40,513 | | | | | |
| Net income | $ | 164,195 | | | $ | 119,299 | | | | | |
| | | | | | | |
| | | | | | | |
| | | | | | | |
| Earnings per Class A share: | | | | | | | |
| Basic | $ | 1.20 | | | $ | 0.91 | | | | | |
| Diluted | 1.19 | | | 0.86 | | | | | |
| | | | | | | |
Results for the Year Ended December 31, 2017 (Successor)2022 Compared to Results for the Year Ended December 31, 2021
Net Revenue Cost of Goods Sold and Gross Profit
Net revenue was $776.2 million for the year ended December 31, 2017 (Successor), with cost of goods sold of $449.3 million and gross profit of $326.92022 increased $216.2 million, or 42.1% as a percentage18.9%, compared to the year ended December 31, 2021. Contribution from pricing actions and favorable product mix provided 16.3% of the growth, while higher volumes accounted for 2.6% of the growth. Sweet baked goods revenue increased $185.0 million or 18.0%, while cookies net revenue increased $31.2 million or 26.8%.
Gross Profit
Gross profit increased 13.6% and was 34.3% of net revenue.
Net revenue for the Sweet Baked Goods segment was $733.8 million for the year ended December 31, 2017 (Successor), with2022, a decrease of 161 basis points from a gross profitmargin of $316.9 million, or 43.2% of net revenue, while net revenue for the In-Store Bakery segment was $42.4 million35.9% for the year ended December 31, 2017, with2021. The decrease in gross profit of $10.0 million, or 23.6% of net revenue.margin was due to inflation and supply-chain inefficiencies, partially offset by favorable price/mix, including revenue growth management initiatives, and productivity initiatives.
Operating Costs and Expenses
AdvertisingOperating costs and Marketing, Selling Expense, and General and Administrative
For the year ended December 31, 2017, advertising and marketing expenses were $33.0 million, selling expenses were $32.1 million, while general and administrative expenses were $52.9 million.
Amortization of Customer Relationships
Amortization of customer relationships was $23.9 million for the year ended December 31, 2017.
Impairment, Loss on Sale/Abandonment of Property and Equipment, and Bakery Shutdown Costs
During2022 increased by 17.3% from the year ended December 31, 2017, we idled a production line2021. The increase was primarily attributed to higher investments in our Columbus, Georgia facilityworkforce, as well as higher advertising and transitioned the production to a third party. We recognized an impairment loss of $1.0 million.
Related Party Expenses
Related party expenses were $0.4 million for the year ended December 31, 2017. These expenses represent payments made to Mr. Metropoulos under the terms of his employment arrangements.
Tax Receivable Agreement Liability Remeasurement
For the year ended December 31, 2017, we adjusted the value of the Tax Receivable Agreement due to a lower projected future cash tax savings rate as a result of the Tax Cuts and Jobs Act. This adjustment resulted in a gain of $51.8 million. A similar adjustment was made due to a change in a state tax law and resulted in a loss of $1.6 million.depreciation expense.
Operating Income
Operating income for the year ended December 31, 20172022 was $234.0 million.
Interest Expense, net
Our interest expense was $39.2$220.3 million compared to $200.7 million for the year ended December 31, 2017.2021. The increase in gross profit contributed to the higher operating income in the current year partially offset by higher operating costs.
Loss on Modification of debtOther Expense
DuringOther expense for the year ended December 31, 2017, we expensed $1.62022 was $9.0 million of previously capitalized debt financing charges for a total loss of $2.6 million. The remaining loss of $1.0 million was relatedcompared to the May and November 2017 repricing transactions. See Note 1- “Summary of Significant Accounting Policies” to the consolidated financial statements included in Part II, Item 8 of this Annual Report on Form 10-K.
Income Taxes
The income tax benefit of $67.2$40.9 million for the year ended December 31, 2017 includes a benefit of approximately $111.3 million2021. The decrease in other expense was primarily due to a revaluationgain from receipt of insurance proceeds of $33.0 million under the representation and warranty insurance policy (purchased in connection with the Voortman acquisition). Interest expense related to our term loan was $42.4 million and $38.6 million for the years ended December 31, 2022 and December 31, 2021, respectively.
Income Taxes
Our effective tax rate was 22.3% for the year ended December 31, 2022 compared to 25.4% for the year ended December 31, 2021. The effective tax rate for the year ended December 31, 2022 was impacted favorably by the $33.0 million non-taxable gain related to receipt of proceeds under the representation and warranty insurance policy. Additionally, the effective tax rate for both periods reflect a tax benefit related to revaluing our deferred tax liabilityliabilities due to reflect lower future U.S. corporate income tax rates caused by the Tax Cuts and Jobs Act. The tax provision also includes a $1.7 million expense caused by a change in the estimated state tax rates. The remaining tax expense of $42.4 million represents an effective tax rate of 30.1%, giving effect to the non-controlling interest, a partnership for income tax purposes and excluding the impact of the remeasurement of the tax receivable agreement.rate.
Net Income
For the year ended December 31, 2017, the Company had2022, net income of $258.1 million.
Earnings Per Share
For the year ended December 31, 2017, earnings per class A share was $2.26 (basic) and $2.13 (dilutive).
Results for the Successor period November 4, 2016 through December 31, 2016 and Predecessor period January 1, 2016 through November 3, 2016
Net Revenue
Net revenues in the Successor period from November 4, 2016 through December 31, 2016 were $112.0$164.2 million compared to $615.6 million for the Predecessor period from January 1, 2016 through November 3, 2016. During the Predecessor period, we acquired Superior on May 10, 2016 and reported net revenues of $19.9 million from Superior from the date of acquisition through November 3, 2016. During the Successor period, the net revenues for Superior were $6.8 million.
Cost of Goods Sold
In the Successor period, as a result of the Business Combination, we recorded a one-time inventory fair value step-up of $8.9 million that was charged to cost of goods sold. Excluding the impact of the inventory fair value step-up, cost of goods sold in the Successor period would have been 57.5% of net revenues.
Special Employee Incentive Compensation
For the Predecessor period January 1, 2016 through November 3, 2016, we made a special bonus payment to certain employees at our bakery facilities as compensation for their efforts in connection with the Business Combination. Payment of $2.2 million of this special bonus was recorded as a separate line item reducing gross profit.
Gross Profit
For the Predecessor period January 1, 2016 through November 3, 2016, gross profit, including the effect of the special employee incentive compensation discussed above, was $266.5 million, or 43.3% of net revenue. Excluding this item, gross profit would have been $268.7 million, or 43.7% of net revenue.
For the Successor period November 4, 2016 through December 31, 2016, gross profit was $38.7 million, or 34.6% of net revenue. Excluding the impact of the inventory fair value step up discussed above, adjusted gross margin for the Successor period was 42.5% of net revenue. Adjusted gross margin for the Successor period compared to the gross margin for the Predecessor period declined slightly due to overall changes in mix of products sold.
Operating Costs and Expenses
Advertising and Marketing
For the Predecessor period January 1, 2016 through November 4, 2016, advertising and marketing expenses were $30.6 million, or 5.0% of net revenue.
For the Successor period November 4, 2016 through December 31, 2016, advertising and marketing expenses were $5.2 million, or 4.7% in net
revenue.
Advertising and marketing expenses as a percentage of net revenue were lower in the Successor period primarily due to higher field marketing costs in the Predecessor Period.
Selling Expense
For the Predecessor period January 1, 2016 through November 4, 2016, selling expenses were $25.7 million, or 4.2% of net revenue.
For the Successor period November 4, 2016 through December 31, 2016, selling expenses were $5.0 million, or 4.5% in net revenue.
General and Administrative
For the Predecessor period January 1, 2016 through November 4, 2016, general and administrative expenses were $38.4 million, or 6.2%, of net revenue.
For the Successor period November 4, 2016 through December 31, 2016, general and administrative expenses were $7.3 million, or 6.5% of net revenue.
Special Employee Incentive Compensation
For the Predecessor period January 1, 2016 through November 3, 2016, we paid a special bonus payment of $2.5 million to certain corporate
employees as compensation for their efforts in connection with the Business Combination. This payment to corporate employees was recorded under operating costs and expenses.
Amortization of Customer Relationships
For the Predecessor period January 1, 2016 through November 3, 2016, amortization of customer relationships was $1.2 million, or 0.2% of net revenue.
For the Successor period November 4, 2016 through December 31, 2016, amortization of customer relationships was $3.9 million, or 3.5% of net revenue.
Amortization of customer relationships in the Successor period was significantly higher than in the Predecessor period primarily due to the higher fair value measurement at November 4, 2016 as a result of the Business Combination compared to the overall fair value of the customer relationships in the Predecessor period. There were no significant changes in the nature of the customer relationships, including overall useful lives in the comparative periods.
Impairment of Property and Equipment
For the Predecessor period January 1, 2016 through November 3, 2016, impairment of property and equipment was $7.3 million, or 1.2% of net revenue. During the Predecessor period, we closed multiple production lines at our Indianapolis, Indiana bakery, and transitioned production to other facilities.
There were no such impairments in the Successor period November 4, 2016 through December 31, 2016.
Loss on Sale/Abandonment of Property and Equipment and Bakery Shutdown Costs
For the Predecessor period January 1, 2016 through November 3, 2016, we recorded a charge for loss on sale/abandonment of property and bakery shutdown costs of $2.6 million, or 0.4% of net revenue, primarily due to utilities, insurance, taxes and maintenance expenses related to the Schiller Park, Illinois bakery.
For the Successor period November 4, 2016 through December 31, 2016, there were no such charges.
Business Combination Transaction Costs
For the Predecessor period January 1, 2016 through November 3, 2016, business combination transaction costs were $31.8 million, or 5.2% of net revenue. This consisted of professional and legal costs associated with the Business Combination, and transactional costs attributable to the acquisition of Superior in May 2016.
For the Successor period November 4, 2016 through December 31, 2016, there were no such charges.
Related Party Expenses
For the Predecessor period January 1, 2016 through November 3, 2016, related party expenses were $3.5 million, or 0.6% of net revenue. These amounts represent the normal annual cash payments associated with our employment arrangements with Mr. Metropoulos as Chief Executive Officer and/or Executive Chairman.
For the Successor period November 4, 2016 through December 31, 2016, the Company expensed $26.8 million, or 23.9% of net revenue, as a result of a grant of stock awarded to Mr. Metropoulos as required under his new employment arrangements.
Operating Income (Loss)
For the Predecessor period January 1, 2016 through November 3, 2016, total operating costs and expenses were $143.7 million, or 23.3% of net revenue, and operating income was $122.9 million, or 20.0% of net revenue.
For the Successor period November 4, 2016 through December 31, 2016, total operating costs and expenses were $48.3 million, or 43.1% of net revenue, and operating loss was $9.6 million or 8.6% of net revenue.
Operating loss for the Successor period was significantly impacted by the related party expense discussed above.
Interest Expense, net
For the Predecessor period January 1, 2016 through November 3, 2016, interest expense, net was $60.4 million, or 9.8% of net revenue. For the Successor period November 4, 2016 through December 31, 2016, interest expense, net was $6.6 million, or 5.9% of net revenue.
The lower interest expense in the Successor period is a result of the reduced applicable interest rates following the debt refinancing discussed below.
Gain on Debt Extinguishment
For the Successor period November 4, 2016 through December 31, 2016, in connection with the refinancing of existing debt with the new first lien term loan we recorded a net gain on a partial extinguishment of debt in the amount of $0.8 million. The gain consisted of the write-off of approximately $4.0 million of debt premium and deferred financing costs, partially offset by prepayment penalties of $3.0 million and the write-off of deferred financing costs of $0.2 million.
Other Expense
For the Predecessor period January 1, 2016 through November 3, 2016, other expense was $1.6 million, or 0.3% of net revenue. This consisted of professional and transactional costs for acquisition activity which has since been abandoned, partially offset by a gain from the settlement in connection with product recall matter with one of our suppliers of approximately $0.8 million.
For the Successor period November 4, 2016 through December 31, 2016, other expense was $0.8 million, or 0.7% of net revenue.
Income (Loss) Before Income Taxes
For the Predecessor period January 1, 2016 through November 3, 2016, income before income taxes was $60.9 million, or 9.9% of net revenue.
For the Successor period November 4, 2016 through December 31, 2016, loss before income taxes was $16.2 million or 14.5% of net revenue.
Income Tax Expense
For the Predecessor period January 1, 2016 through November 3, 2016, the Company was a series of limited liability companies and, therefore, had no tax expense or benefit, except insignificant amounts for Superior, a C corporation.
For the Successor period November 4, 2016 through December 31, 2016, income tax benefit was $7.8 million or 6.9% of net revenue. This represented an effective tax rate of 47.8% which exceeds the statutory rates primarily due to the reversal of a previously recorded valuation allowance.
Results for the Year Ended December 31, 2015 (Predecessor)
Net Revenue, Gross Profit and Cost of Goods Sold
Net revenue was $620.8$119.3 million for the year ended December 31, 2015, with cost of goods sold of $356.0 million, and gross profit of $264.9 million, excluding the impact of a $2.6 million special employee incentive compensation payment. Cost of goods sold was impacted by higher ingredient costs2021. Net income increased due to an outbreakhigher gross profits and the $33.0 million gain from receipt of avian influenza which led to reduced availability of eggs, which increased egg ingredient prices to record high levels.
Special Employee Incentive Compensation
Forinsurance proceeds under the year ended December 31, 2015, a special bonus payment was paid to employees at our bakery facilities as compensation for their effortsrepresentation and warranty insurance policy purchased in connection with the recapitalization of our Company of which $2.6 million was recorded on a separate line in our Consolidated Statements of Operations as a deduction from gross profit.
Operating Costs and Expenses
Advertising and Marketing
Advertising and marketing expenses were $32.0 million, selling expenses were $29.5 million, and general and administrative expenses were $31.5 millionVoortman acquisition for the year ended December 31, 2015.2022, partially offset by higher operating costs and higher interest expense.
Special Employee Incentive CompensationEarnings Per Share
For the year ended December 31, 2015, a special bonus payment of $1.3 millionOur earnings per Class A share was paid to corporate employees as compensation for their efforts in the recapitalization of the Company.
Amortization of Customer Relationships
Amortization of customer relationships was $0.9 million$1.20 (basic) and $1.19 (dilutive) for the year ended December 31, 2015.
Loss on Sale/Abandonment of Property2022, compared to $0.91 (basic) and Equipment and Bakery Shutdown Costs
For the year ended December 31, 2015, we incurred a loss on sale/abandonment of property and equipment and bakery shutdown costs of $4.2 million.
Related Party Expenses
Related party expenses were $4.3 million$0.86 (dilutive) for the year ended December 31, 2015. Mr. Metropoulos serves as our Executive Chairman and expenses associated with his employment agreements are recorded in related party expenses.
Operating Income (Loss)
For the year ended December 31, 2015, total operating costs and expenses were $106.3 million. Operating income was $155.9 million for the year ended December 31, 2015.
Interest Expense, net
Interest expense for the year ended December 31, 2015 was 50.0 million.
Loss on Debt Extinguishment
We extinguished the Term Loan dated April 9, 2013 (the “2013 Term Loan”) through early principal payments of $343.8 million and $150.0 million on August 3, 2015 and June 4, 2015, respectively. As part of this debt extinguishment and in accordance with its contractual terms, we expensed 2% prepayment penalties of $9.9 million, as well as $16.0 million of amortization to write-off the remaining deferred financing costs. For the year ended December 31, 2015, the total loss on debt extinguishment was $25.9 million.
Other Income
For the year ended December 31, 2015, other income consisted of $12.0 million of proceeds from the sale of foreign trademark rights and certain “know how” in certain countries in the Middle East, partially offset by $3.3 million for professional service fees related to the pursuit of potential sale transactions.
Income Taxes
For the year ended December 31, 2015, the Company was a series of limited partnerships and, therefore, had no income tax expense or benefit.
Supplemental Unaudited Pro Forma Combined Financial Information
For comparative purposes, we are presenting a supplemental unaudited pro forma combined statement of operations for the year ended December 31, 2016, and we discuss such pro forma combined results compared to the Successor’s full year 2017, and the Predecessor’s full year 2015 results below.
The unaudited pro forma combined statements of operations for the year ended December 31, 2016 presents our consolidated results of operations giving pro forma effect to the Business Combination as if it had occurred as of January 1, 2016. The pro forma combined adjustments are based on available information and upon assumptions that our management believes are reasonable in order to reflect, on a pro forma combined basis, the impact of these transactions on the historical financial information of our Predecessor and Successor entities, as applicable.
The Business Combination was accounted for using the acquisition method of accounting. The final fair values of the acquired assets and assumed liabilities as of the Closing Date, which are based on the consideration paid and our estimates and assumptions, are reflected herein. As explained in more detail in Note 2 in the accompanying Notes to the Consolidated Financial Statements, the total purchase price to acquire Hostess Holdings has been allocated to the assets acquired and assumed liabilities of Hostess Holdings, based upon the fair values at the Closing Date. We utilized third-party valuation specialists to assist our management in determining the fair values of the acquired assets and liabilities assumed. As of November 3, 2017, management determined that the allocation of the purchase price for the Business Combination is final.
The unaudited pro forma combined financial information contains a variety of adjustments, assumptions and estimates, is subject to numerous other uncertainties and the assumptions and adjustments as described in the accompanying notes hereto and should not be relied upon as being indicative of our results of operations had the Business Combination occurred on January 1, 2016. The unaudited pro forma combined financial information also does not project our results of operations for any future period or date. The unaudited pro forma combined financial information for the year ended December 31, 2016 includes results of the Superior acquisition and its related operations from May 10, 2016, the date of acquisition, through December 31, 2016. We evaluated the impact of the Superior acquisition on the Company’s financial statements and concluded that the impact was not significant and did not require nor separately warrant the inclusion of pro forma combined financial results assuming the acquisition of Superior at January 1, 2016 under applicable SEC rules and regulations or under GAAP. In addition, we evaluated the impact of the refinancing of existing debt pursuant to the New First Lien Term Loan, completed on November 18, 2016, and concluded that the impact was not significant and did not require nor separately warrant the inclusion of pro forma combined financial results assuming the completion of the refinancing on January 1, 2016. The pro forma combined adjustments give effect to the items identified in the pro forma combined table below in connection with the Business Combination.
Results of Operations
Comparison of Results of Operations for the Year Ended December 31, 2017 (Successor), Unaudited Pro Forma Combined Year Ended December 31, 2016, and the Year Ended December 31, 2015 (Predecessor)
|
| | | | | | | | | | | | | | | | | | | | | | | | | | | |
| | | | Historical(i) | | | | | | | | |
| | 2017 | | 2016 | | | | 2016 | | | | 2015 |
(In thousands, except share and per share data) | Year Ended December 31 | | From November 4 through December 31 | | | From January 1 through November 3 | | Pro Forma Adjustments | | (Unaudited) Year Ended December 31 | | % of Net Revenues | | Year Ended December 31 |
| | (Successor) | | (Successor) | | | (Predecessor) | | | | Pro Forma
Combined | | | | (Predecessor) |
| Net revenue | $ | 776,188 |
| | $ | 111,998 |
| | | $ | 615,588 |
| | $ | — |
| | $ | 727,586 |
| | 100.0 | % | | 620,815 |
|
| Cost of goods sold | 449,290 |
| | 73,284 |
| | | 346,864 |
| | (8,541 | ) | ii | 411,607 |
| | 56.6 |
| | 355,963 |
|
| Special employee incentive compensation | — |
| | — |
| | | 2,195 |
| | (2,195 | ) | iii | — |
| | — |
| | 2,649 |
|
| Gross profit | 326,898 |
| | 38,714 |
| | | 266,529 |
| | 10,736 |
| | 315,979 |
| | 43.4 |
| | 262,203 |
|
| Operating costs and expenses: | | | | | | | | | | | | — |
| | |
| Advertising and marketing | 33,004 |
| | 5,245 |
| | | 30,626 |
| | — |
| | 35,871 |
| | 4.9 |
| | 31,967 |
|
| Selling expense | 32,086 |
| | 5,033 |
| | | 25,730 |
| | — |
| | 30,763 |
| | 4.2 |
| | 29,484 |
|
| General and administrative | 52,943 |
| | 7,322 |
| | | 38,391 |
| | (3,902 | ) | iv | 41,811 |
| | 5.7 |
| | 31,531 |
|
| Special employee incentive compensation | — |
| | — |
| | | 2,503 |
| | (2,503 | ) | iii | — |
| | — |
| | 1,274 |
|
| Amortization of customer relationships | 23,855 |
| | 3,922 |
| | | 1,185 |
| | 20,050 |
| v | 25,157 |
| | 3.5 |
| | 851 |
|
| Impairment on property and equipment | 1,003 |
| | — |
| | | 7,300 |
| | — |
| | 7,300 |
| | 1.0 |
| | 2,700 |
|
| Loss on sale/abandonment of property and equipment, and bakery shutdown costs (recoveries) | (144 | ) | | — |
| | | 2,551 |
| | — |
| | 2,551 |
| | 0.4 |
| | 4,182 |
|
| Business combination transaction costs | — |
| | — |
| | | 31,832 |
| | (31,257 | ) | vi | 575 |
| | 0.1 |
| | — |
|
| Related party expenses | 381 |
| | 26,799 |
| | | 3,539 |
| | (26,747 | ) | vii | 3,591 |
| | 0.5 |
| | 4,306 |
|
| Tax receivable agreement liability remeasurement | (50,222 | ) | | — |
| | | — |
| | — |
| | — |
| | — |
| | — |
|
| Total operating costs and expenses | 92,906 |
| | 48,321 |
| | | 143,657 |
| | (44,359 | ) | | 147,619 |
| | 20.3 |
| | 106,295 |
|
| Operating income | 233,992 |
| | (9,607 | ) | | | 122,872 |
| | 55,095 |
| | 168,360 |
| | 23.1 |
| | 155,908 |
|
| Other expense: | | | | | | | | | | | | — |
| | |
| Interest expense, net | 39,174 |
| | 6,649 |
| | | 60,384 |
| | (15,592 | ) | viii | 51,441 |
| | 7.1 |
| | 50,011 |
|
| Loss (gain) on modification of debt | 2,554 |
| | (763 | ) | | | — |
| | — |
| | (763 | ) | | (0.1 | ) | | 25,880 |
|
| Other expense | 1,360 |
| | 754 |
| | | 1,624 |
| | — |
| | 2,378 |
| | 0.3 |
| | (8,743 | ) |
| Total other expense | 43,088 |
| | 6,640 |
| | | 62,008 |
| | (15,592 | ) | | 53,056 |
| | 7.3 |
| | 67,148 |
|
| Income before income taxes | 190,904 |
| | (16,247 | ) | | | 60,864 |
| | 70,687 |
| | 115,304 |
| | 15.8 |
| | 88,760 |
|
| Income tax expense (benefit) | (67,204 | ) | | (7,762 | ) | | | 439 |
| | 40,185 |
| ix | 32,862 |
| | 4.5 |
| | — |
|
| Net income (loss) | 258,108 |
| | (8,485 | ) | | | 60,425 |
| | 30,502 |
| | 82,442 |
| | 11.3 |
| | 88,760 |
|
| Less: Net income attributable to the non-controlling interest | 34,211 |
| | (4,081 | ) | | | 3,214 |
| | 29,565 |
| x | 28,698 |
| | 3.9 |
| | 4,507 |
|
| Net income attributable to Class A shareholders | $ | 223,897 |
| | $ | (4,404 | ) | | | $ | 57,211 |
| | $ | 937 |
| | $ | 53,744 |
| | 7.4 | % | | $ | 84,253 |
|
| | | | | | | | | | | | | | | |
| Earnings per Class A share: | | | | | | | | | | | | | | |
| Basic | $ | 2.26 |
| | $ | (0.05 | ) | | | | | | | $ | 0.55 |
| | | | |
| Diluted | $ | 2.13 |
| | $ | (0.05 | ) | | | | | | | $ | 0.54 |
| | | | |
| | | | | | | | | | | | | | | |
| Weighted-average shares outstanding: | | | | | | | | | | | | | | |
| Basic | 99,109,629 |
| | 97,791,658 |
| | | | | (180,000 | ) | xi | 97,611,658 |
| | | | |
| Diluted | 105,307,293 |
| | 97,791,658 |
| | | | | 2,393,000 |
| xii | 100,184,658 |
| | | | |
| |
i. | The amounts in these columns represent the Successor’s and Predecessor’s historical results of operations for the periods reflected. |
| |
ii. | Approximately $8.9 million of this adjustment reflects the non-cash impact of the remeasurement of inventory at fair value as a result of the Business Combination. In addition, the adjustment reflects the incremental depreciation expense associated with the allocation of purchase price to property and equipment and is recorded in cost of goods sold. |
| |
iii. | For cost of goods sold, this adjustment represents special payments we made to certain employees at our bakery facilities of $2.2 million and for the operating costs this adjustment represents special payments to corporate employees of $2.5 million as compensation for their efforts in connection with the Business Combination. |
| |
iv. | Represents compensation for management profits interest plan of approximately $3.9 million that was recognized as part of the Business Combination. See Note 3 to the Consolidated Financial Statements for additional information. |
| |
v. | Represents additional amortization expense associated with the fair value recognized for customer relationships in connection with the Business Combination. |
| |
vi. | This adjustment consists primarily of legal and professional fees, and other costs associated with the Business Combination. |
| |
vii. | Represents non-cash expenses incurred by Successor for stock awarded to Mr. Metropoulos as required under his new employment arrangements. |
| |
viii. | Represents the reduction in interest expense due to the repayment of a portion of Hostess Holdings debt as part of the Business Combination. |
| |
ix. | Represents the effective income tax rate of 28.5% for the Successor, giving effect to the non-controlling interest, and not giving effect to the adjustment made to the valuation allowance on the Company’s historical deferred tax assets. |
| |
x. | Represents the elimination of historical income attributable to the non-controlling interest and attributes a portion of the pro forma income to the non-controlling interest created in the Business Combination. Income is allocated to the non-controlling interest based on its pro rata share of the total equity of Hostess Holdings. |
| |
xi. | This adjustment annualized the basic weighted average number of Class A shares outstanding. |
| |
xii. | This adjustment includes the dilutive impact of the outstanding warrants that are considered anti-dilutive on a historical basis. |
Results for the Year Ended December 31, 2017 compared to the Pro Forma Combined Year Ended December 31, 2016
Net Revenue
Net revenue was $776.2 million for the year ended December 31, 2017, compared to $727.6 million for the pro forma combined year ended December 31, 2016, an increase of 6.7%, or $48.6 million. Growth in net revenue for the year ended December 31, 2017 from current year new product initiatives was $62.5 million, led by Chocolate Cake Twinkies®, Golden Cupcakes, White Fudge Ding Dongs®, and Peanut Butter HoHo’s®. Additionally, there was an $11.9 million increase in net sales attributed to the acquisition of Superior in May 2016. These increases were offset primarily by a decrease in net revenue from 2016 product innovations and discontinued items.
Cost of Goods Sold and Gross Profit
Cost of goods sold for the year ended December 31, 2017 of $449.3 million represents an increase of $37.7 million, or 9.2%, from the pro forma combined cost of goods sold of $411.6 million for the year ended December 31, 2016. The increase for the year ended December 31, 2017 from the pro forma combined year ended December 31, 2016 is primarily attributed to higher shipping costs and increased sales volume.
Gross profit was $326.9 million for the year ended December 31, 2017, an increase of $10.9 million, or 3.5%, compared to pro forma gross profit of $316.0 million for the year ended December 31, 2016. The increase for the year ended December 31, 2017 from pro forma combined year ended December 31, 2016 was primarily attributed to an increase in sales.
Gross margin was 42.1% for the year ended December 31, 2017, compared to gross margin of 43.4% for the pro forma combined year ended December 31, 2016 . The decrease in margin for the year ended December 31, 2017 from pro forma combined gross margin for the year ended December 31, 2016 was primarily due to higher shipping costs which caused a 70 basis point decrease in gross margin. The decrease in margin was also attributed to a shift in our product mix due to higher growth in multi-pack, club-pack than other pack types, and additional In-Store Bakery sales.
Gross profit for the Sweet Baked Goods segment for the year ended December 31, 2017 was $316.9 million or 43.2% of net revenue, compared to gross profit of $309.8 million, or 44.2% of net revenue, for the pro forma combined year ended December 31, 2016. Gross margin decreased 120 basis points due to higher shipping costs. Gross margin was also affected by a shift in product mix due to higher growth in multi-pack sales than other pack types.
Gross profit for the In-Store Bakery segment for the year ended December 31, 2017 was $10.0 million, or 23.6% of net revenue, compared to pro forma combined gross profit of $6.1 million, or 23.0% of net revenue, for the year ended December 31, 2016. Gross profit increased primarily due to increased revenue.
Operating Costs and Expenses
Advertising and Marketing
Advertising and marketing expenses for the year ended December 31, 2017 of $33.0 million represent a decrease from pro forma combined advertising and marketing expenses of $35.9 million, or 8.0% for the year ended December 31, 2016 as a result of reduced permanent wire display deployment.
Selling Expense
Selling expense was $32.1 million, or 4.1% of revenue for the year ended December 31, 2017, compared to $30.8 million, or 4.2% of revenue on a pro forma combined basis for the year ended December 31, 2016.2021. The increase in selling expense is reflective of the increase in sales volume during the year.
Generalbasic and Administrative
General and administrative expenses for the year ended December 31, 2017 of $52.9 million represent an increase of $11.1 million, or 26.6%, over the pro forma combined general and administrative expenses of $41.8 million for the year ended December 31, 2016. The increase is attributed to increased non-cash share-based compensation of $7.4 million, additional professional and administrative costs of $3.5 million due to public company compliance, and a $2.0 million litigation settlement.
Amortization of Customer Relationships
Amortization of customer relationshipsdiluted earnings per share was $23.9 million for the year ended December 31, 2017, compared to pro forma combined customer relationships amortization of $25.2 million for the year ended December 31, 2016. For the year ended December 31, 2016 on a historical basis, amortization expense was based on the valuation of customer relationships acquired from Old HB Inc. in 2013. The amortization expense for the year ended December 31, 2017 and the year ended December 31, 2016 on a pro forma combined basis reflects the new valuation of the customer relationships acquired through the Business Combination.
Impairment, Loss on Sale/Abandonment of Property and Equipment, and Bakery Shutdown Costs
During the year ended December 31, 2017, an impairment loss of $1.0 million was recognized when we idled a production line in our Columbus, Georgia facility and transitioned the production to a third party. During the pro forma combined year ended December 31, 2016, we recorded an impairment of $7.3 million when we closed multiple production lines at the Indianapolis, Indiana bakery and transitioned production to other facilities in preparation to convert the bakery to a nut facility. In addition, we incurred a loss on sale/abandonment of property and equipment, and bakery shutdown costs of $2.6 million primarily due to utilities, insurance, taxes and maintenance expenses related to the Schiller Park, Illinois bakery.
Related Party Expenses
Related party expenses were $0.4 million for the year ended December 31, 2017 compared to pro forma combined expenses of $3.6 million for the year ended December 31, 2016. These expenses represent payments made to Mr. Metropoulos under the terms of his employment arrangements, which changed as part of the Business Combination.
Tax Receivable Agreement Liability Remeasurement
For the year ended December 31, 2017, we adjusted the value of the Tax Receivable Agreement due to a lower projected future cash tax savings rate as a result of the Tax Cuts and Jobs Act. This adjustment resulted in a gain of $51.8 million. A similar adjustment was made due to a change in a state tax law and resulted in a loss of $1.6 million.
Operating Income
The $65.6 million increase in operating income from pro forma combined operating income of $168.4 million for the year ended December 31, 2016 to $234.0 million for the year ended December 31, 2017 is primarily attributed to the gain on the remeasurement of the tax receivable agreement, higher sales volume, and lower impairment/abandonment costs.
Interest Expense, net
Our interest expense decreased $12.3 million from $51.4 million for the pro forma combined year ended December 31, 2016 to $39.2 million for the year ended December 31, 2017 primarily due to the pay down of our Second Lien Term Loan in November 2016, and three repricing transactions between November of 2016 and November of 2017 which collectively reduced the effective interest rate on our first lien term loan by 1.25%.net income impacts noted above.
Loss on Modification of debt
During the year ended December 31, 2017, we recognized $2.6 million of losses related to the repricing transactions on our first lien term loan, of which $1.6 million was attributed to previously capitalized charges. See Note 1- “Summary of Significant Accounting Policies” to the consolidated financial statements included in Part II, Item 8 of this Annual Report on Form 10-K.RECONCILIATION OF NON-GAAP FINANCIAL MEASURES
Income Taxes
The income tax benefit of $67.2 million for the year ended December 31, 2017 includes a benefit of approximately $126.4 million due to a revaluation of our deferred tax liability to reflect lower future U.S. corporate income tax rates caused by the Tax Cuts and Jobs Act (“Tax Reform”). This benefit was partially offset by a tax expense of $15.1 million due to the remeasurement of the tax receivable agreement also due to Tax Reform. The tax provision also includes a $1.7 million expense caused by a change in state tax rates. The remaining tax expense of $42.4 million represents an effective tax rate of 30.1%, giving effect to the non-controlling interest, a partnership for income tax purposes and excluding the impact of the remeasurement of the tax receivable agreement. Income tax expense for the pro forma combined year ended December 31, 2016 was $32.9 million, representing an effective tax rate of 28.5%. After accounting for tax law changes, our effective tax rate for 2017 was higher than the pro forma combined 2016 due to a higher statutory rate for one of the states in which we operate.
Results of Operations for the Pro Forma Combined Year Ended December 31, 2016 compared to the Year Ended December 31, 2015 (Predecessor)
Net Revenue
Net revenue increased $106.8 million, or 17.2%, to $727.6 million, for the pro forma combined year ended December 31, 2016, compared to $620.8 million for the year ended December 31, 2015, primarily due to new product launches in 2016 of $44.0 million and contribution of Superior net revenue of $26.7 million from the date of its acquisition. New products in 2016 included Deep Fried Twinkies®, Hostess Sweet Shop™ brownies, plus the relaunch of Suzy Qs®
Cost of Goods Sold and Gross Profit
Cost of goods sold increased $55.6 million, to $411.6 million, for the pro forma combined year ended December 31, 2016, compared to $356.0 million, for the year ended December 31, 2015, primarily due to the increase in volume.
As a percentage of net revenue, pro forma combined cost of goods sold was 56.6%, compared to 57.3% of net revenue for the year ended December 31, 2015. The decrease in cost of goods sold from the year ended December 31, 2015 to the pro forma combined for the year ended December 31, 2016, is primarily due to higher ingredient costs in 2015. An outbreak of avian influenza in 2015 led to reduced availability of eggs, which increased egg ingredient prices to record high levels.
Pro Forma combinedAdjusted gross profit, was $316.0 million for the year ended December 31, 2016, compared to $262.2 million for the year ended December 31, 2015.
Gross margin was 43.4% for the pro forma combined year ended December 31, 2016, compared to historicaladjusted gross margin, of 42.2% for the year ended December 31, 2015. The increase in gross profit was driven primarily by commodity cost decreases and improved bakery costs.
Operating Costs and Expenses
Advertising and Marketing
Advertising and marketing expenses for the year increased 12.2% on a pro forma combined basis for the year ended December 31, 2016, to $35.9 million, compared to $32.0 million for the year ended December 31, 2015. The increase was primarily attributable to planned expansion of field marketing activities.
Selling Expense
Selling expense increased $1.3 million, or 4.3%, to $30.8 million, during the pro forma combined year ended December 31, 2016, compared to $29.5 million for the year ended December 31, 2015, primarily due to increases in sales management expense and broker fees.
General and Administrative
General and administrative expenses increased 32.6%, to $41.8 million, on a pro forma combined basis for the year ended December 31, 2016, compared to $31.5 million for the year ended December 31, 2015. The increase is primarily due to increased incentive compensation related to improvedadjusted operating performance and the addition of Superior’s operations.
Special Employee Incentive Compensation
A special bonus payment of $1.3 million was paid during the year ended December 31, 2015 to corporate employees as compensation for their efforts in the recapitalization of the Company. There was no special employee incentive compensation for the pro forma combined year ended December 31, 2016.
Amortization of Customer Relationships
Amortization of customer relationships was $25.2 million for the pro forma combined year ended December 31, 2016, compared to $0.9 million, for the year ended December 31, 2015. The increase is primarily due to an increase in intangible assets with definite lives as a result of the Business Combination, as well as the acquisition of Superior during 2016.
Impairment, Loss on Sale/Abandonment of Property and Equipment, and Bakery Shutdown Costs
For the pro forma combined year ended December 31, 2016, we recorded an impairment of $7.3 million. We closed multiple production lines at Indianapolis, Indiana bakery and transitioned production to other facilities resulting in a loss of $7.3 million, compared to a similar loss of $2.7 million for the year ended December 31, 2015.
For the pro forma combined year ended December 31, 2016, we incurred a loss of $2.6 million for the year ended December 31, 2016, compared to $4.2 million for the year ended December 31, 2015, for the sale/abandonment of property and equipment and bakery shutdown costs.
Related Party Expenses
Related party expenses for the pro forma combined year ended December 31, 2016 were $3.6 million, a decrease of $0.7 million, compared to $4.3 million for the year ended December 31, 2015. Mr. Metropoulos serves as our Executive Chairman and expenses associated with his employment agreements are recorded in related party expenses. After the Business Combination, payments to Mr. Metropoulos were reduced to approximately $0.3 million annually.
Operating Income
Operating income, increased from $155.9 million, for the year ended December 31, 2015 by $12.5 million, to $168.4 million on a pro forma combined basis for the year ended December 31, 2016.
Interest Expense,adjusted net
Our interest expense increased $1.4 million to $51.4 million for the pro forma combined year ended December 31, 2016, compared to $50.0 million for the year ended December 31, 2015 (Predecessor). The Company completed the refinancing of existing debt with the new first lien term loan on November 18, 2016.
(Gain) Loss on Modification of debt
For the pro forma combined year ended December 31, 2016, in connection with the refinancing of the first and second lien term loan, we recorded a income, adjusted net gain on a partial extinguishment of debt in the amount of $0.8 million. The gain consisted of the write-off of approximately $4.0 million of debt premium and deferred financing costs, partially offset by prepayment penalties of $3.0 million and the write-off of deferred financing costs of $0.2 million.
We extinguished the Term Loan dated April 9, 2013 (the “2013 Term Loan”) through early principal payments of $343.8 million and $150.0 million on August 3, 2015 and June 4, 2015, respectively. As part of this debt extinguishment and in accordance with its contractual terms, we expensed 2% prepayment penalties of $9.9 million, as well as $16.0 million of amortization to write-off the remaining deferred financing costs. For the year ended December 31, 2015, (Predecessor), the total loss of debt extinguishment was $25.9 million.
Other (Income) Expense
For the pro forma combined year ended December 31, 2016, the Company recorded expenses of $2.4 million which primarily consisted of legal and professional fees related to post-Business Combination activities. For the year ended December 31, 2015, other income consisted of $12.0 million of proceeds from the sale of foreign trademark rights and certain “know how” in certain countries in the Middle East, partially offset by $3.3 million for professional service fees related to the pursuit of potential sale transactions.
Income Taxes
For the pro forma combined year ended December 31, 2016, income tax expense was $32.9 million, which represents the effective rate of 28.5%, giving effect to the noncontrolling interest, a partnership for income tax purposes. This is compared to a zero tax liability for the year ended December 31, 2015, due to the Company’s status of a series of limited partnerships.
Adjusted EBITDA Reconciliation
Adjusted EBITDA was $230.2 million for the year ended December 31, 2017, an increase of $14.9 million, or 6.9%, compared to pro forma combinedmargin, adjusted EBITDA, of $215.3 million for the year ended December 31, 2016, and an increase of $52.3 million, or 29.4% compared to adjusted EBITDA of $177.9 million for the year ended December 31, 2015. As a percentage of net revenue,margin, and adjusted EBITDA was 29.7% for the year ended December 31, 2017, which was comparableEPS collectively referred to pro forma combined adjusted EBITDA of 29.6% of net revenues for the year ended December 31, 2016, and 28.7% for the year ended December 31, 2015.
Adjusted EBITDA is a non-GAAP financial measureas “Non-GAAP Financial Measures,” are commonly used in our industry and should not be construed as an alternative to gross profit, gross margin, operating income, net income, net income margin, or earnings per share as an indicatorindicators of operating performance or as an alternative to cash flow provided by operating activities as a measure of liquidity (each as(as determined in accordance with GAAP). This measureThese Non-GAAP Financial Measures may not be comparable to similarly titled measures reported by other companies. We have included these measuresNon-GAAP Financial Measures because we believe theythe measures provide management and investors with additional information to measure ourthe Company’s performance, and liquidity, estimate ourthe Company’s value and evaluate ourthe Company’s ability to service debt.
We define adjusted EBITDA as net incomeNon-GAAP Financial Measures are adjusted to exclude (i)income taxes, (ii) interest expense, net (iii) depreciation and amortization and (iv) as further adjusted to eliminate the impact of certain items that we do not consider indicative of our ongoing operating performance. These furtheraffect comparability. The adjustments are itemized in the tables below. You are encouraged to evaluate these adjustments and the reasonsreason we consider them appropriate for supplemental analysis. In evaluating adjusted EBITDA,adjustments, you should be aware that in the future wethe Company may incur expenses that are the same as or similar to some of the adjustments set forth below. OurThe presentation of adjusted EBITDANon-GAAP Financial Measures should not be construed as an inference that our future results will be unaffected by unusual or non-recurringrecurring items.
For example, we define adjusted EBITDA as net income adjusted to exclude (i) interest expense, net, (ii) depreciation and amortization (iii) income taxes and (iv) share-based compensation, as further adjusted to eliminate the impact of certain items that the Company does not consider indicative of its ongoing operating performance. Adjusted EBITDA has important limitations as an analytical tool, and you should not consider it in isolation, or as a substitute for analysis of ourthe Company’s results as reported under GAAP. For example, adjusted EBITDA:
•does not reflect ourthe Company’s capital expenditures, future requirements for capital expenditures or contractual commitments;
•does not reflect changes in, or cash requirements for, ourthe Company’s working capital needs;
•does not reflect the significant interest expenses,expense, or the cash requirements necessary to service interest or principal payments, on ourthe Company’s debt; and
does not reflect any cash requirements for the assets being depreciated and amortized that may have to be replaced in the future; and
•does not reflect payments related to income taxes or the tax receivable agreement or distributions toagreement.
| | | | | | | | | | | | | | | | | | | | | | | | | | | | | | | | | | | | | | | | |
| | | Year Ended December 31, 2022 |
| ($ and shares in thousands) | | | Gross
Profit | | Gross Margin | | Operating Income | | Net
Income | | Net Income Margin | | | | | Diluted
EPS |
| GAAP results | | | $ | 465,679 | | | 34.3 | % | | $ | 220,278 | | | $ | 164,195 | | | 12.1 | % | | | | | $ | 1.19 | |
| Non-GAAP adjustments: | | | | | | | | | | | | | | | | |
| Foreign currency remeasurement | | | — | | | — | | | — | | | 630 | | | — | | | | | | 0.01 | |
| Project consulting costs (1) | | | — | | | — | | | 3,887 | | | 3,887 | | | 0.3 | | | | | | 0.03 | |
| Tax receivable agreement remeasurement | | | — | | | — | | | (860) | | | (860) | | | (0.1) | | | | | | (0.01) | |
| Gain on Voortman insurance proceeds (2) | | | — | | | — | | | — | | | (32,970) | | | (2.3) | | | | | | (0.24) | |
| Accelerated depreciation related to network optimization | | | 1,908 | | | 0.1 | | | 1,908 | | | 1,908 | | | 0.1 | | | | | | 0.02 | |
| Other (3) | | | 161 | | | — | | | 265 | | | 650 | | | — | | | | | | — | |
| Remeasurement of tax liabilities | | | — | | | — | | | — | | | (2,161) | | | (0.2) | | | | | | (0.02) | |
| Discrete income tax expense | | | — | | | — | | | — | | | 1,188 | | | 0.1 | | | | | | 0.01 | |
| Tax impact of adjustments | | | — | | | — | | | — | | | (1,910) | | | (0.1) | | | | | | (0.01) | |
| Adjusted Non-GAAP results | | | $ | 467,748 | | | 34.4 | % | | $ | 225,478 | | | 134,557 | | | 9.9 | | | | | | $ | 0.98 | |
| | | | | | | | | | | | | | | | |
| Income tax | | | | | | | | | 49,972 | | | 3.7 | | | | | | |
| Interest expense | | | | | | | | | 40,950 | | | 3.0 | | | | | | |
| Depreciation and amortization | | | | | | | | | 58,178 | | | 4.3 | | | | | | |
| Share-based compensation | | | | | | | | | 10,450 | | | 0.8 | | | | | | |
| Adjusted EBITDA | | | | | | | | | $ | 294,107 | | | 21.7 | % | | | | | |
(1) Project consulting costs are included in general and administrative on the non-controlling interest to reimburse its tax liability.consolidated statement of operations.
|
| | | | | | | | | | | | | | | | | | | | | |
Reconciliation of Adjusted EBITDA
|
| (In thousands) | | Year Ended December 31, 2017 | | From November 4, 2016 through December 31, 2016 | | | From January 1, 2016 through November 3, 2016 | | Pro Forma Combined December 31, 2016 (1) | | Year Ended December 31, 2015 |
| | | (Successor) | | (Successor) | | | (Predecessor) | | | | (Predecessor) |
| Net income | | $ | 258,108 |
| | $ | (8,485 | ) | | | $ | 60,425 |
| | $ | 82,442 |
| | $ | 88,760 |
|
| Plus non-GAAP adjustments: | | | | | | | | | | | |
| Income tax provision | | (67,204 | ) | | (7,762 | ) | | | 439 |
| | 32,862 |
| | — |
|
| Interest expense, net | | 39,174 |
| | 6,649 |
| | | 60,384 |
| | 51,441 |
| | 50,011 |
|
| Depreciation and amortization | | 38,170 |
| | 5,843 |
| | | 10,265 |
| | 36,520 |
| | 9,836 |
|
| Executive chairman agreement termination and execution | i. | — |
| | 26,747 |
| | | — |
| | — |
| | — |
|
| Share-based compensation | | 7,413 |
| | | | | 3,891 |
| | — |
| | 1,381 |
|
| Tax receivable agreement liability remeasurement | ii. | (50,222 | ) | | — |
| | | — |
| | — |
| | — |
|
| Other (income) expense | iii. | 1,360 |
| | 751 |
| | | 1,624 |
| | 2,375 |
| | (8,743 | ) |
| Loss (gain) on debt modification | iv. | 2,554 |
| | (763 | ) | | | — |
| | (763 | ) | | 25,880 |
|
| Impairment of property and equipment | v | 1,003 |
| | — |
| | | 7,300 |
| | 7,300 |
| | 2,700 |
|
| Loss on sale/abandonment of property and equipment and bakery shutdown costs (recovery) | vi. | (144 | ) | | — |
| | | 2,551 |
| | 2,551 |
| | 4,182 |
|
| Inventory fair value adjustment | vii. | — |
| | 8,914 |
| | | — |
| | — |
| | — |
|
| Special employee incentive compensation | viii. | — |
| | — |
| | | 4,698 |
| | — |
| | 3,923 |
|
| Business combination transaction costs | ix. | — |
| | — |
| | | 31,832 |
| | 575 |
| | — |
|
| Adjusted EBITDA | | $ | 230,212 |
| | $ | 31,894 |
| | | $ | 183,409 |
| | $ | 215,303 |
| | $ | 177,930 |
|
| |
i. | For the Successor period November 4, 2016 through December 31, 2016, we expensed $26.7 million related to stock awarded to Mr. Metropoulos as required under his new employment arrangements. |
| |
ii. | During the year ended December 31, 2017, we recognized a gain of $50.2 million related to the adjustment to the tax receivable agreement related to Tax Reform, slightly offset by a loss due a change in a state tax rate. |
| |
iii. | For the year ended December 31, 2017, other expense primarily included professional fees incurred related to the secondary public offering of common stock and the registration of certain privately held warrants. For the Successor period November 4, 2016 through December 31, 2016, and the pro forma combined year ended December 31, 2016, we recorded expenses of $0.8 million which primarily consisted of legal and professional fees and other post-Business Combination costs such as fees related to securities filings. For the Predecessor period from January 1, 2016 through November 3, 2016, and the pro forma combined year ended December 31, 2016, other expense consisted of transaction costs attributable to the pursuit of a potential acquisition that has since been abandoned, offset partially by a gain from the settlement of a recall matter with one of our suppliers of approximately $0.8 million. For the year ended December 31, 2015, other income consisted of $12.0 million(2) Gain from receipt of insurance proceeds from the sale of foreign trademark rights and certain “know how” in certain countries in the Middle East, partially offset by $3.3 million for professional service fees related to the pursuit of a potential sale transactions. |
| |
iv. | For the year ended December 31, 2017 and the period from November 4, 2016, through December 31, 2016, and the pro forma combined year ended December 31, 2016, the Company incurred losses on debt modification of $2.6 million resulting from refinancing transactions on its first lien term loan, and a $0.8 million gain on the extinguishment of the former first lien, respectively. For the year ended December 31, 2015, the Company recorded a loss on extinguishment related to its 2013 Term Loan of $25.9 million. |
| |
v. | For the year ended December 31, 2017, we transitioned the production of one of our products to a third party and recognized an impairment loss resulting from the idling of the related production equipment. For the period January 1, 2016 through November 3, 2016, and for the pro forma combined year ended December 31, 2016, we closed multiple production lines at the Indianapolis, Indiana bakery and transitioned production to other facilities resulting in a loss of $7.3 million. |
| |
vi. | For the Predecessor period January 1, 2016 through November 3, 2016 and the pro forma combined year ended December 31, 2016, we incurred a loss on a sale/abandonment of property and bakery shutdown costs, primarily due to utilities, insurance, taxes and maintenance expenses related to the Schiller Park, Illinois bakery. During the year ended December 31, 2017, we recovered $0.1 million of this cost. |
| |
vii. | For the Successor period November 4, 2016 through December 31, 2016, we remeasured inventory at fair value at the Closing Date, resulting in additional non-cash cost of goods sold of $8.9 million. |
| |
viii. | For the Predecessor period January 1, 2016 through November 3, 2016, a special bonus payment of $2.5 million and $2.2 million was paid to employees at the bakery facilities and corporate employees, respectively, as compensation for their efforts in the Business Combination. For the year ended December 31, 2015, a special bonus payment of $2.6 million and $1.3 million was paid to employees at the bakery facilities and corporate employees, respectively, as compensation for their efforts in the recapitalization of the Company. |
| |
ix. | For the Predecessor period from January 1, 2016 through November 3, 2016, business combination transaction costs consisted primarily of professional and legal costs. For the pro forma combined year ended December 31, 2016, business combination transaction costs consisted primarily of transactional costs attributable to the acquisition of Superior in May 2016. |
Segments
The Company has two reportable segments: Sweet Baked Goods and In-Store Bakery. The Company’s Sweet Baked Goods segment consists of fresh and frozen baked goods and bread products that are sold under the Hostess®representation and Dolly Madison® brands. The In-Store Bakery segment consists of Superior and Hostess branded products sold throughwarranty insurance policy purchased in connection with the in-store bakery section of grocery and club stores. During the fourth quarter of 2017, the Company reassessed its segment presentation. Previously, the “Other” categoryVoortman acquisition in 2020 included In-Store Bakery as well as bread and buns, and frozen retail products. The periods presented below reflect bread and buns and frozen retail products within the Sweet Baked Goods segment, while discretely presenting In-Store Bakery.
We evaluate performance and allocate resources basedin other expense (income) on net revenue and gross profit. Information regarding the operations of these reportable segments is as follows:
|
| | | | | | | | | | | | | | | | | |
| Audited Segment Financial Data |
| (In thousands) | Year Ended
December 31,
2017 | | | From November 4
through December 31,
2016 | | | From January 1 through November 3, 2016 | | Year Ended December 31, 2015 |
| (Successor) | | | (Successor) | | | (Predecessor) | | (Predecessor) |
Net revenue: | | | | | | | | | |
| Sweet Baked Goods | $ | 733,827 |
| | | $ | 105,211 |
| | | $ | 595,645 |
| | $ | 620,815 |
|
| In-Store Bakery | 42,361 |
| | | 6,787 |
| | | 19,943 |
| | — |
|
| Net revenue | $ | 776,188 |
| | | $ | 111,998 |
| | | $ | 615,588 |
| | $ | 620,815 |
|
|
|
| | |
|
| | | | | |
| Gross profit: | | | | | | | | | |
| Sweet Baked Goods | $ | 316,916 |
| | | $ | 37,387 |
| | | $ | 262,930 |
| | $ | 262,203 |
|
| In-Store Bakery | 9,982 |
| | | 1,327 |
| | | 3,599 |
| | — |
|
| Gross profit | $ | 326,898 |
| | | $ | 38,714 |
| | | $ | 266,529 |
| | $ | 262,203 |
|
|
|
| | |
|
| | | | | |
Capital expenditures (1): | | | | | | | | | |
| Sweet Baked Goods | $ | 35,609 |
| | | $ | 7,544 |
| | | $ | 31,254 |
| | $ | 27,252 |
|
| In-Store Bakery | 774 |
| | | 83 |
| | | 223 |
| | — |
|
| Capital expenditures | $ | 36,383 |
| | | $ | 7,627 |
| | | $ | 31,477 |
| | $ | 27,252 |
|
| |
(1) | Capital expenditures consists of purchases of property and equipment and acquisition and development of software assets paid in cash or acquired through accounts payable during the year ended December 31, 2017 (Successor), from November 4, 2016 through December 31, 2016 (Successor), from January 1, 2016 through November 3, 2016 (Predecessor) and the year ended December 31, 2015 (Predecessor). |
Customer Concentrations
See Note 1- “Summary of Significant Accounting Policies” to the consolidated financial statementsstatement of operations.
(3) Costs related to certain corporate initiatives, of which $0.2 million is included in Part II, Item 8cost of this Annual Reportgoods sold, $0.1 million is included in general and administrative and $0.4 million is included in other expense (income) on Form 10-K.the consolidated statement of operations.
| | | | | | | | | | | | | | | | | | | | | | | | | | | | | | | | | | | | | | | | | |
| | | Year Ended December 31, 2021 |
| ($ and shares in thousands) | | | Gross
Profit | | Gross Margin | | Operating Income | | Net
Income | | Net Income Margin | | | | | | Diluted
EPS |
| GAAP results | | | $ | 409,983 | | | 35.9 | % | | $200,738 | | $119,299 | | 10.4% | | | | | | $0.86 |
| Non-GAAP adjustments: | | | | | | | | | | | | | | | | | |
| Foreign currency remeasurement | | | — | | | — | | — | | | (505) | | | — | | | | | | — | |
| | | | | | | | | | | | | | | | | |
| Project consulting costs (1) | | | — | | | — | | 6,081 | | | 6,081 | | | 0.5 | | | | | | 0.04 | |
| Change in fair value of warrant liabilities | | | — | | | — | | — | | | (566) | | | — | | | | | | — | |
| Tax receivable agreement remeasurement | | | — | | | — | | (1,409) | | | (1,409) | | | (0.1) | | | | | | (0.01) | |
| | | | | | | | | | | | | | | | | |
| | | | | | | | | | | | | | | | | |
| Other (2) | | | 704 | | | 0.1 | | 2,107 | | | 4,338 | | | 0.4 | | | | | | 0.03 | |
| Remeasurement of tax liabilities | | | — | | | — | | — | | | (3,357) | | | (0.3) | | | | | | (0.03) | |
| Tax impact of adjustments | | | — | | | — | | — | | | (1,871) | | | (0.2) | | | | | | (0.01) | |
| | | | | | | | | | | | | | | | | |
| Adjusted Non-GAAP results | | | $ | 410,687 | | | 36.0 | % | | $ | 207,517 | | | 122,010 | | | 10.7 | | | | | | | $ | 0.88 | |
| | | | | | | | | | | | | | | | | |
| Income tax | | | | | | | | | 45,741 | | | 4.0 | | | | | | |
| Interest expense | | | | | | | | | 39,762 | | | 3.5 | | | | | | |
| Depreciation and amortization | | | | | | | | | 51,681 | | | 4.5 | | | | | | |
| Share-based compensation | | | | | | | | | 9,585 | | | 0.8 | | | | | | |
| Adjusted EBITDA | | | | | | | | | $ | 268,779 | | | 23.5 | % | | | | | | |
(1) Project consulting costs are included within general and administrative on the consolidated statement of operations.
(2) Costs related to certain corporate initiatives, including $2.8 million of Voortman acquisition related costs. Of the total $4.3 million, $0.7 million is included in costs of goods sold, $1.4 million is included in general and administrative and $2.2 million is included in other non-operating expenses on the consolidated statement of operations.
Adjusted Gross Margin
Adjusted gross margin was 34.4% for the year ended December 31, 2022, a decrease of 152 basis points from an adjusted gross margin of 36.0% for the year ended December 31, 2021. The decrease in adjusted gross margin was due to inflation and supply-chain inefficiencies, partially offset by favorable price/mix, including revenue growth management initiatives. Adjusted gross profit increased 13.9% on pricing actions and productivity partially offset by inflation.
Adjusted EBITDA
Adjusted EBITDA was $294.1 million for the year ended December 31, 2022, compared to $268.8 million for the year ended December 31, 2021. The improvement in adjusted EBITDA was driven by higher gross profit, partially offset by higher operating costs including higher investments in our workforce and higher advertising expense.
Adjusted EPS
Adjusted EPS was $0.98 for the year ended December 31, 2022, compared to $0.88 for the year ended December 31, 2021. The improvement in adjusted EPS was driven by strong adjusted EBITDA performance partially offset by increased interest expense, depreciation expense and share-based compensation expense.
Liquidity and Capital Resources
Our primary sources of liquidity are from the cash and cash equivalents and short-term investments on the balance sheet, future cash flow generated from operations, and availability under our revolving credit agreement (“Revolver”). We believe that cash flows from operations and the current cash and cash equivalents and short-term investments on the balance sheet will be sufficient to satisfy the anticipated cash requirements associated with our existing operations for at least the next 12 months. Our future cash requirements include the purchase commitments for certain raw materials and packaging used in our production process, scheduled rent on leased facilities, scheduled debt service payments on our term loan and settlements on related interest rate swap contracts, payments on our tax receivable agreement, settlements on our outstanding foreign currency contracts and outstanding purchase orders on capital projects.
Our ability to generate sufficient cash from our operating activities depends on our future performance, which is subject to general economic, political, financial, competitive and other factors beyond our control. In addition, our future capital expenditures and other cash requirements could be higher than we currently expect as a result of various factors, including any expansion of our business that we undertake, including acquisitions. We consider all highly liquid investments purchased with an original maturity of three months or less to be cash equivalents.
We had working capital, excluding cash and cash equivalents and short-term investments, as of December 31, 20172022 and December 31, 20162021 of $15.5$26.3 million and $20.6$17.9 million, respectively. We have the ability to borrow under our Revolver to meet obligations as they come due. As of December 31, 2017,2022, we had approximately $96.1 $94.1 million available for borrowing, net of letters of credit, under our Revolver.
Cash Flows from Operating Activities
Cash flows provided by operating activities for the yearyears ended December 31, 20172022 and 2021 were $163.7$248.8 million compared toand $203.0 million, respectively. Operating cash flowsflow benefited from current year improvement in profitability, including the insurance proceeds of $33.0��million, partially offset by an increase in tax payments and an increase in working capital.
Cash Flows provided by and used in Investing Activities
Investing activities used $147.9 million and $65.4 million of cash for the Successor period November 4, 2016 throughyears ended December 31, 20162022 and 2021, respectively. On February 22, 2022, we purchased a facility in Arkadelphia, Arkansas for a total purchase price of $13.6 million and for the Predecessor period January 1, 2016 through November 3, 2016 of $102.2 million, and $133.0 million for$11.5 million. Additional capital expenditures were incurred on this project during the year ended December 31, 2015. Cash flows provided by operating activities2022, and we expect elevated capital expenditures due to this project in 2023. Additionally, during 2017 was driven by an increase in income before taxes and benefits from accounts payable and customer trade allowances, offset by higher inventory, accounts receivable, and prepaid expense balances. Cash flow provided by operating activities for the 2016 periods was driven by the payment of transaction costs related to the Business Combination.
Cash Flows from Investing Activities
Cash flows used in investing activities for the year ended December 31, 2017 were $35.22022, we invested in short-term marketable securities of $80.4 million and received proceeds from maturity of short-term marketable securities of $63.0 million.
Cash flowsFlows used in investingFinancing Activities
Financing activities used $249.8 million and $61.3 million of cash for the period November 4, 2016 through December 31, 2016 were $428.2 million (Successor) and $76.6 million for the period January 1, 2016 through November 3, 2016 (Predecessor) and cash flows of $17.9 million were provided by investing activities for the yearyears ended December 31, 2015.2022 and 2021, respectively. The acquisition of Superior and Hostess during the Predecessor and Successor 2016 periods, respectively, represented a significant investing use of cash. Our property and equipment capital expenditures primarilynet outflow for 2022 consisted of strategic growth initiatives, maintenance and productivity improvements.
Cash Flows from Financing Activities
Cash flows used in financing activities were $19.6 million for the year ended December 31, 2017, $232.3 million for the Successor period November 4, 2016 through December 31, 2016, $31.6 million for the Predecessor period January 1, 2016 through November 3, 2016, and $296.0 million for the year ended December 31, 2015. For the year ended December 31, 2017 (Successor), financing activities were primarily attributed to scheduled principal payments on long term debt and distributions to partners/non-controlling interest in respect of their tax liability. For the Successor period of 2016, we had $13.1 million of deferred underwriting costs related to the Business Combination.
In November 2016, we extinguished the former second lien term loan through early principal payments and refinanced our first lien term loan which accounted for the primary use of cash used in financing activitiesto prepay $100.0 million of our term loan principal, repurchase 5.8 million shares of our Class A common stock under our existing share repurchase authorization for the Successor period. In June 2015 and August 2015 the Predecessor extinguished the 2013 Term Loan through early principal payments. In the period January 1, 2016 through November 3, 2016, and in the year ended December 31, 2015, the Predecessor paid distributionsan amount of $23.6$130.1 million and $952.9an average price per share of $22.50, offset by cash inflows from the proceeds on exercise of employee stock options. The net outflow for 2021 consisted of cash used to repurchase 3.3 million respectively,shares of our common stock under our existing securities repurchase authorization for an amount of $53.2 million and an average price per share of $16.17, offset by cash inflows from the proceeds on exercise of employee stock options and proceeds from the exercise of public warrants prior to partners,the amendment of the warrant agreement in July 2021. Both periods reflected similar activity on cash outflows related to scheduled payments under the tax receivable agreement and $1.0 million, $46.8 million to non-controlling interest, respectively.term loan.
Long-Term Debt
As of December 31, 2017, $993.82022, $983.2 million aggregate principal amount of the Third Amended First Lien Term Loanour term loan and $3.9 $5.9 million aggregate principal amount of letters of credit, reducing the amount available under the Revolver, were outstanding. See Note 14 - “Commitments14. Commitments and Contingencies”Contingencies to the consolidated financial statements in Part II, Item 8 of this Annual Report on Form 10-K for information regarding the letters of credits.credit. We had no outstanding borrowings under our Revolver as of December 31, 2017.
2022. As of December 31, 2017,2022, we were in compliance with theall covenants under the Third Amended First Lien Term Loanour term loan and the Revolver.
Commitments The Revolver contains certain restrictive financial covenants. Based on our current and Contingencies
As of December 31, 2017, the Company has commitments and contingencies for tax receivable arrangements, debt, operating leases, and advance purchase commitments. Refer to Note 14--“Commitments and Contingencies” to the Consolidated Financial Statements included in Part II, Item 8 on this Annual Report on Form 10-K.
|
| | | | | | | | | | | | | | | | | | | |
| Contractual Commitments as of December 31, 2017 | Total Committed | | Less than 1 year | | 1 to 3 years | | 3 to 5 years | | More than 5 years |
| (In thousands) | | | | | | | | | |
| Tax receivable agreement | $ | 124,360 |
| | $ | 14,200 |
| | $ | 15,000 |
| | $ | 14,400 |
| | $ | 80,760 |
|
| First lien term loan | 993,762 |
| | 9,938 |
| | 19,876 |
| | 963,948 |
| | — |
|
| Interest payments on term loan | 173,174 |
| | 35,344 |
| | 69,624 |
| | 68,206 |
| | — |
|
| Operating leases | 2,610 |
| | 2,043 |
| | 567 |
| | — |
| | |
| Capital lease | 633 |
| | 200 |
| | 400 |
| | 33 |
| | — |
|
| Ingredient procurement | 64,235 |
| | 61,166 |
| | 3,069 |
| | — |
| | — |
|
| Packaging procurement | 35,401 |
| | 35,401 |
| | — |
| | — |
| | — |
|
| | $ | 1,394,175 |
| | $ | 158,292 |
| | $ | 108,536 |
| | $ | 1,046,587 |
| | $ | 80,760 |
|
Tax receivable agreement
The tax receivable agreement entered into in connectionprojected financial performance, we believe that we will comply with the Business Combination (the “Tax Receivable Agreement”) generally providesthese covenants for the payment by the Company to the Legacy Hostess Equityholders of 85% of the net cash savings, if any, in U.S. federal, state and local income tax that the Company actually realizes (or is deemed to realize in certain circumstances) in periods after the closing of the Business Combination (which periods may extend, unless the Tax Receivable Agreement is terminated early in accordance with its terms, for more than 15 years following any exchange of Class B units of Hostess Holdings for shares of the Company’s Class A common stock or the cash equivalent thereof) as a result of (i) certain increases in tax basis resulting from the Business Combination; (ii) certain tax attributes of Hostess Holdings and its subsidiaries existing prior to the Business Combination and prior to subsequent exchanges of Class B units; (iii) certain increases in tax basis resulting from exchanges of Class B units; (iv) imputed interest deemed to be paid by the Company as a result of payments it makes under the Tax Receivable Agreement; and (v) certain increases in tax basis resulting from payments the Company makes under the Tax Receivable Agreement. The Company will retain the benefit of the remaining 15% of these cash savings. Certain payments under the Tax Receivable Agreement will be made to Legacy Hostess Equityholders in accordance with specified percentages, regardless of the source of the applicable tax attribute. The most significant estimate utilized by management to calculate the corresponding liability is the Company’s future cash tax savings rates, which are projected based on current tax laws and the Company’s historical and projected future tax profile.
In addition, in January 2018, we entered into an agreement with the Apollo Funds terminating all future payment obligations to the Apollo Funds in exchange for a payment of $34.0 million. However, if we enter into a definitive agreement on or before January 26, 2019 and that agreement results in a change in control (as defined in the Tax Receivable Agreement), we would be required to make an additional payment of $10.0 million to the Apollo Funds.
During the year ended December 31, 2017, we recognized a gain of $50.2 million related to the adjustment to the tax receivable agreement, partially offset by approximately $1.6 million of expense to reflect an increase to the estimated future cash tax savings rate attributed to a state tax law change. We recognized a corresponding gain on the consolidated statement of operations.foreseeable future.
Critical Accounting PoliciesEstimates
The preparation of financial statements in accordance with generally accepted accounting principles in the United States requires the use of judgment, estimates and assumptions. We make such subjective determinations after careful consideration of our historical performance, management’s experience, current economic trends and events and information from outside sources. Inherent in this process is the possibility that actual results could differ from these estimates and assumptions for any particular period.
Our significant accounting policies are detailed in Note 11. Summary of Significant Accounting Policies of the notes to our Consolidated Financial Statements.consolidated financial statements within Item 8. Critical accounting policies are defined as those policies that are reflective of significant judgments, estimates and uncertainties, which could potentially result in materially different results under different assumptions and conditions. The following areas are the most important and require the most difficult, subjective judgments.
is a summary of certain accounting estimates considered critical by management.
Trade and consumer promotion programsConsumer Promotion Programs
We offer various sales incentive programs to customers, and consumers, such as feature price discounts, in-store display incentives, cooperative advertising programs and new product introduction fees, and coupons.allowances. The mix between promotional programs, which are classified as reductions in revenue in the Statementstatements of Operations,operations, and advertising or other marketing activities, which are classified as marketing and selling expenses in the Statementconsolidated statements of Operations,operations, fluctuates between periods based on our overall marketing plans, and such fluctuations have an impact on revenues.revenue. These trade programs also require management to make estimates about the expected total cost of the programs and related allocations amongst participants (who might have different levels of incentives based on various program requirements). These estimates are inherently uncertain and are generally based on historical experience, adjusted for any new facts or circumstances that might impact the ultimate cost estimate for a particular program or programs.
Goodwill and Indefinite-lived trade names
Trade Names
When evaluating goodwill and indefinite-lived intangible assets for impairment under U.S. GAAP, we may first perform an assessment of qualitative factors to determine if the fair value of the reporting unit or the intangible asset is more-likely-than-notmore likely than not greater than the carrying amount. Such qualitative factors include, but are not limited to, macro-economic conditions, market and industry conditions, cost considerations, competitive environment, share price fluctuations, overall financial performance and results of past impairment tests. If, basedBased on a review of the qualitative factors, if we determine it is not more-likely-than-notmore likely than not that the fair value is less than the carrying value, we may bypass the two-step quantitative impairment test. The first step (“Step 1”) ofWe also may elect not to perform the qualitative assessment for the reporting unit or intangible assets and perform a quantitative impairment test.
For our 2022 and 2021 annual goodwill impairment testing, we elected to perform qualitative assessments for our reporting unit. No indicators of impairment were noted. If a quantitative test calculateswere to be utilized for our reporting unit, it would estimate the estimated fair value of each of the reporting unitsunit and comparescompare it to theits carrying value. IfTo the extent the fair value iswas in excess of the carrying value, no impairment exists. If Step 1 does indicatewould be recognized. Otherwise, an impairment a second step (“Step 2”) must take place. Under Step 2,loss would be recognized for the fair value of the assets and liabilities of the reporting unit are estimated as if the reporting unit were acquired in a business combination. The excess of the fair value of the reporting unit over the amounts assigned to its assets and liabilities is the implied fair value of the goodwill, to whichamount that the carrying value of theour reporting unit, including goodwill, must be adjusted.
exceeded its fair value. In performing the quantitative test of goodwill, we primarily use thefair value would be determined based on a calculation which would give consideration to an income approach method of valuation that includedutilizing the discounted cash flow method and the market approach using the market comparable and market transaction methods.
Our indefinite-lived intangible assets consist of trademarks and trade names. The $1,538.6 million balances at both December 31, 2022 and 2021, were recognized as well as other generally accepted valuation methodologiespart of the Hostess Business Combination and the Voortman and Cloverhill acquisitions. The trademarks and trade names are integral to determine the Company’s identity and are expected to contribute indefinitely to our corporate cash flows. Fair value for trademarks and trade names was determined using the income approach. The application of the income approach was premised on a royalty savings method, whereby the trademark and trade names are valued by reference to the amount of royalty income they could generate if they were licensed, in an arm’s-length transaction, to a third party. These assets have been assigned an indefinite life and therefore are not amortized but rather evaluated for impairment annually using the qualitative or quantitative methods similar to goodwill. For 2022 and 2021, we performed a qualitative test. No indicators of impairment were noted.
Changes in certain significant assumptions could have a significant impact on the estimated fair value, and therefore, a future impairment could result for a portion of goodwill andor long-lived intangible assets. Significant assumptions used
Long-lived Assets
We review long-lived assets, including property and equipment and amortizable identifiable intangible assets (e.g. customer relationships), to determine fair value under the discountedassess recoverability from projected undiscounted cash flow model included future trends in sales, operating expenses, overhead expenses, capital expenditures andflows whenever events or changes in working capital, along with an appropriate discount ratefacts and circumstances indicate that the carrying value of the assets may not be recoverable. When such events occur, we compare the sum of the undiscounted cash flows expected to result from the use and eventual disposition of the asset or asset group to the carrying amount of the long-lived asset or asset group. The cash flows are based on our estimated costbest estimate of equity capital and after-tax cost of debt.
Infuture cash flows derived from the process of our annualmost recent business projections. If this comparison indicates there is an impairment, reviewthe carrying value of the trade names, we primarily useasset is reduced to its estimated fair value. We also evaluate the relief of royalty method under the income approach method of valuation. Significant assumptions usedamortization periods assigned to our intangible assets to determine fair value underwhether events or changes in circumstances require a revised estimate of useful lives. There were no impairment losses for the relief of royalty method included future trends in sales, a royalty rateyears ended December 31, 2022 and a discount rate to be applied to the forecast revenue stream.
2021.
Business Combinations
We account for business acquisitions using the purchase method of accounting. Assets acquired, liabilities assumed, and non-controlling interests are recorded at their estimated fair values at the acquisition date. The excess of purchase price over fair value of the net assets acquired, including the amount assigned to identifiable intangible assets, is recorded as goodwill. Given the time it takes to obtain pertinent information to finalize the acquired company’s balance sheet, it may be multiple quarters before we are able to finalize those initial fair value estimates. Accordingly, it is not uncommon for the initial estimates to be subsequently revised.
Tax receivable agreement
See “-Commitments and Contingencies- Tax receivable agreement” above.
New Accounting Pronouncements
Refer to Note 1. Summary of Significant Accounting Policies of the Notesnotes to our Consolidated Financial Statements elsewherethe consolidated financial statements included in Part II, Item 8 of this filingAnnual Report on Form 10-K for further information regarding recently issued accounting standards.
Item 7A. Quantitative and Qualitative Disclosures about Market Risk
We are exposed to market risks related to interest rate market risk.rates and foreign currency exchange rates.
Market risk on variable-rate financial instruments
Our Third Amended First Lien Term Loanterm loan and Revolver each bear interest on outstanding borrowings thereunder at variable interest rates. The rate in effect at December 31, 20172022 for the outstanding Third Amended First Lien Term Loanterm loan was a LIBOR-based rate of 3.60%6.7% per annum. At December 31, 2017, the subsidiary borrower2022, we had an aggregate principal balance of $993.8$983.2 million outstanding under the Third Amended First Lien Term Loan. At December 31, 2017, the subsidiary borrower had $96.1term loan and $94.1 million available for borrowing, net of letters of credit of $3.9$5.9 million, under itsthe Revolver. Increases in market interest rates would cause interest expense to increase and earnings before income taxes to decrease.
To manage the risk related to our variable rate debt, we have entered into an interest rate swap contractcontracts with a counter partyparties to make a series of payments based on a fixed interest rate of 1.78%rates ranging from 1.11% to 2.06% and receive a series of payments based on the greater of LIBOR or 0.75%. Both the fixed and floating payment streams are based onAt December 31, 2022, a notional amount of $500$700.0 million atremained outstanding on the inception of the contractswap contracts and will be reduced by $100 million each yearremain outstanding through the maturity of the five year contract.our term loan in August 2025.
The change in interest expense and earnings before income taxes resulting from a change in market interest rates would be dependent upon the weighted average outstanding borrowings and the portion of those borrowings that are hedged by our swap contractcontracts during the reporting period following an increase in market interest rates.period. An increase or decrease in applicable interest rates of 1% would result in an increase or decrease in interest payableexpense of approximately $4.9$10.7 million and $11.0 million for the yearyears ended December 31, 2017,2022 and 2021, respectively, or approximately $3.8 million and $4.6 million after accounting for the impact of our swap contract.contracts for the years ended December 31, 2022 and 2021, respectively.
We are exposed to fluctuations of the Canadian Dollar (“CAD”) relative to the U.S. Dollar (“USD”) due to the operations of our Burlington, Ontario bakery and distribution center and sales to customers denominated in CAD. Revenue generated from Canadian customers, offset by the related selling expense and the operations of this facility, including certain raw materials, production labor and overhead, creates a net exposure to CAD denominated expenses. We enter into contracts to purchase Canadian dollars at fixed exchange rates throughout the year. At December 31, 2022 and 2021, we had contracts to purchase a total of $9.2 million and $15.5 million Canadian dollars at fixed exchange rates and varying dates from January 2023 through June 2023 and January 2022 through December 2022, respectively. At December 31, 2022 and 2021, a 10% change in the USD to CAD exchange rate would change the aggregate fair value of these contracts by approximately $0.6 million and $0.9 million for the years ended December 31, 2022 and 2021.
Item 8. Financial Statements and Supplementary Data
|
| | | | |
| INDEX TO CONSOLIDATED FINANCIAL STATEMENTS |
| Audited Consolidated Financial Statements | |
| Report of Independent Registered Public Accounting Firm | |
Consolidated Balance Sheets as of December 31, 20172022 and December 31, 20162021 | |
Consolidated Statements of Operations for the yearyears ended December 31, 2017 (Successor), from November 4, 2016 through December 31, 2016 (Successor),2022, 2021 and from January 1, 2016 through November 3, 2016 (Predecessor), and the year ended December 31, 2015 (Predecessor)2020 | |
Consolidated Statements of Comprehensive Income (Loss) for the yearyears ended December 31, 2017 (Successor), from November 4, 2016 through December 31, 2016 (Successor),2022, 2021 and from January 1, 2016 through November 3, 2016 (Predecessor), and the year ended December 31, 2015 (Predecessor)2020 | |
Consolidated Statements of Stockholders’ Equity for the yearyears ended December 31, 2017 (Successor), from November 4, 2016 through December 31, 2016 (Successor),2022, 2021 and Partners’ Equity (Deficit) from January 1, 2016 through November 3, 2016 (Predecessor) and the year ended December 31, 2015 (Predecessor)2020 | |
Consolidated Statements of Cash Flows for the yearyears ended December 31, 2017, November 4, 2016 through December 31, 2016 (Successor),2022, 2021 and from January 1, 2016 through November 3, 2016 (Predecessor), and the year ended December 31, 2015 (Predecessor)2020 | |
| Notes to Consolidated Financial Statements | |
Report of Independent Registered Public Accounting Firm
To the ShareholdersStockholders and Board of Directors
Hostess Brands, Inc.:
Opinions on the Consolidated Financial Statements and Internal Control Over Financial Reporting
We have audited the accompanying consolidated balance sheets of Hostess Brands, Inc. and subsidiaries (the “Company”)Company) as of December 31, 20172022 and 2016, and2021, the related consolidated statements of operations, comprehensive income, (loss),stockholders’ equity, and cash flows for each of the yearyears in the three-year period ended December 31, 2017 and for the period November 4, 2016 through December 31, 2016, and the related notes. We have also audited the accompanying consolidated statements of operations, equity, and cash flows for the period January 1, 2016 through November 3, 2016 and the year ended December 31, 2015 of Hostess Holdings, L.P. and subsidiaries,2022, and the related notes (collectively, with the consolidated financial statements of Hostess Brands, Inc., the “consolidated financial statements”)statements). We also have audited the Company’s internal control over financial reporting as of December 31, 2017,2022, based on criteria established in Internal Control -– Integrated Framework(2013) issued by the Committee of Sponsoring Organizations of the Treadway Commission.
In our opinion, the consolidated financial statements referred to above present fairly, in all material respects, the financial position of Hostess Brands, Inc. and subsidiariesthe Company as of December 31, 20172022 and 2016,2021, and the results of theirits operations and theirits cash flows for each of the yearyears in the three-year period ended December 31, 2017 and for the period November 4, 2016 through December 31, 2016, in conformity with U.S. generally accepted accounting principles. It is also our opinion that the financial statements referred to above present fairly, in all material respects, the results of Hostess Holdings, L.P. and subsidiaries’ operations and cash flows for the period January 1, 2016 through November 3, 2016 and the year ended December 31, 2015,2022, in conformity with U.S. generally accepted accounting principles. Also in our opinion, the Company maintained, in all material respects, effective internal control over financial reporting as of December 31, 2017,2022 based on criteria established in Internal Control -– Integrated Framework (2013) issued by the Committee of Sponsoring Organizations of the Treadway Commission.
Basis for Opinions
The Company’s management is responsible for these consolidated financial statements, for maintaining effective internal control over financial reporting, and for its assessment of the effectiveness of internal control over financial reporting, included in the accompanying Management’s Report onOn Internal Control Over Financial Reporting. Our responsibility is to express an opinion on the Company’s consolidated financial statements and an opinion on the Company’s internal control over financial reporting based on our audits. We are a public accounting firm registered with the Public Company Accounting Oversight Board (United States) (“PCAOB”)(PCAOB) and are required to be independent with respect to the Company in accordance with the U.S. federal securities laws and the applicable rules and regulations of the Securities and Exchange Commission and the PCAOB.
We conducted our audits in accordance with the standards of the PCAOB. Those standards require that we plan and perform the audits to obtain reasonable assurance about whether the consolidated financial statements are free of material misstatement, whether due to error or fraud, and whether effective internal control over financial reporting was maintained in all material respects.
Our audits of the consolidated financial statements included performing procedures to assess the risks of material misstatement of the consolidated financial statements, whether due to error or fraud, and performing procedures that respond to those risks. Such procedures included examining, on a test basis, evidence regarding the amounts and disclosures in the consolidated financial statements. Our audits also included evaluating the accounting principles used and significant estimates made by management, as well as evaluating the overall presentation of the consolidated financial statements. Our audit of internal control over financial reporting included obtaining an understanding of internal control over financial reporting, assessing the risk that a material weakness exists, and testing and evaluating the design and operating effectiveness of internal control based on the assessed risk. Our audits also included performing such other procedures as we considered necessary in the circumstances. We believe that our audits provide a reasonable basis for our opinions.
Definition and Limitations of Internal Control Over Financial Reporting
A company’s internal control over financial reporting is a process designed to provide reasonable assurance regarding the reliability of financial reporting and the preparation of financial statements for external purposes in accordance with generally accepted accounting principles. A company’s internal control over financial reporting includes those policies and procedures that (1) pertain to the maintenance of records that, in reasonable detail, accurately and fairly reflect the transactions and dispositions of the assets of the company; (2) provide reasonable assurance that transactions are recorded as necessary to permit preparation of financial statements in accordance with generally accepted accounting principles, and that receipts and expenditures of the company are being made only in accordance with authorizations of management and directors of the company; and (3) provide reasonable assurance regarding prevention or timely detection of unauthorized acquisition, use, or disposition of the company’s assets that could have a material effect on the financial statements.
Because of its inherent limitations, internal control over financial reporting may not prevent or detect misstatements. Also, projections of any evaluation of effectiveness to future periods are subject to the risk that controls may become inadequate because of changes in conditions, or that the degree of compliance with the policies or procedures may deteriorate.
(signed)Critical Audit Matter
The critical audit matter communicated below is a matter arising from the current period audit of the consolidated financial statements that was communicated or required to be communicated to the audit committee and that: (1) relates to accounts or disclosures that are material to the consolidated financial statements and (2) involved our especially challenging, subjective, or complex judgments. The communication of a critical audit matter does not alter in any way our opinion on the consolidated financial statements, taken as a whole, and we are not, by communicating the critical audit matter below, providing a separate opinion on the critical audit matter or on the accounts or disclosures to which it relates.
Evaluation of customer trade allowances
As discussed in Note 1 to the consolidated financial statements, the Company has recorded a provision for customer trade allowances, consisting primarily of pricing allowances and merchandising programs associated with sales to customers. The liability recorded for the estimated cost of these programs is dependent on factors such as the ultimate purchase volume activity, participation levels of customers, and the related settlement rates for these programs. The Company’s liability for customer trade allowances as of December 31, 2022 was $62.2 million.
We identified the evaluation of certain customer trade allowances as a critical audit matter because of the higher degree of auditor judgment required to evaluate the Company’s estimates. This is due to uncertainty around the amount of settlements, which typically occur in a period subsequent to the related sales transactions, and in particular, the estimate of purchase volumes made by retailers from distributors.
The following are the primary procedures we performed to address this critical audit matter. We evaluated the design and tested the operating effectiveness of certain internal controls related to the Company’s trade process at disaggregated levels. This included controls related to the Company’s trade spend trending and lookback analyses based on final settlement. We analyzed the liability by trade allowance type to identify unusual trends. We assessed the Company’s historical ability to accurately estimate its customer trade allowances by comparing historical estimates to final settlements. We compared a sample of settlements subsequent to period end to the amount previously recognized by the Company.
/s/ KPMG LLP
We have served as the Company’s auditor since 2013.
Kansas City, Missouri
February 28, 201821, 2023
HOSTESS BRANDS, INC.
CONSOLIDATED BALANCE SHEETS
(Amounts in thousands, except shares and per share data)shares)
| |
| December 31, | | December 31, | | December 31, | | December 31, |
| ASSETS | 2017 | | 2016 | ASSETS | 2022 | | 2021 |
| (Successor) | | (Successor) | |
| Current assets: |
| |
| Current assets: | | | |
| Cash and cash equivalents | $ | 135,701 |
| | $ | 26,855 |
| Cash and cash equivalents | $ | 98,584 | | | $ | 249,159 | |
| Short-term investments | | Short-term investments | 17,914 | | | — | |
| Accounts receivable, net | 101,012 |
| | 89,237 |
| Accounts receivable, net | 168,783 | | | 148,180 | |
| Inventories | 34,345 |
| | 30,444 |
| Inventories | 65,406 | | | 52,813 | |
| Prepaids and other current assets | 7,970 |
| | 4,827 |
| Prepaids and other current assets | 16,375 | | | 10,564 | |
| Total current assets | 279,028 |
| | 151,363 |
| Total current assets | 367,062 | | | 460,716 | |
| Property and equipment, net | 174,121 |
| | 153,224 |
| Property and equipment, net | 425,313 | | | 335,305 | |
| Intangible assets, net | 1,923,088 |
| | 1,946,943 |
| Intangible assets, net | 1,920,880 | | | 1,944,392 | |
| Goodwill | 579,446 |
| | 588,460 |
| Goodwill | 706,615 | | | 706,615 | |
| Other assets, net | 10,592 |
| | 7,902 |
| Other assets, net | 72,329 | | | 19,283 | |
| Total assets | $ | 2,966,275 |
| | $ | 2,847,892 |
| Total assets | $ | 3,492,199 | | | $ | 3,466,311 | |
| | | | | | | | |
| LIABILITIES AND STOCKHOLDERS’ EQUITY | | | | LIABILITIES AND STOCKHOLDERS’ EQUITY | |
| | | | | |
| Current liabilities: | | | | Current liabilities: | |
| Long-term debt and capital lease obligation payable within one year | $ | 11,268 |
| | $ | 11,496 |
| |
| Tax receivable agreement payments payable within one year | 14,200 |
| | — |
| |
| Long-term debt and lease obligations payable within one year | | Long-term debt and lease obligations payable within one year | $ | 3,917 | | | $ | 14,170 | |
| Tax receivable agreement obligations payable within one year | | Tax receivable agreement obligations payable within one year | 12,600 | | | 11,600 | |
| Accounts payable | 49,992 |
| | 34,083 |
| Accounts payable | 85,667 | | | 68,104 | |
| Customer trade allowances | 40,511 |
| | 36,691 |
| Customer trade allowances | 62,194 | | | 52,746 | |
| Accrued expenses and other current liabilities | 11,880 |
| | 21,656 |
| Accrued expenses and other current liabilities | 59,933 | | | 47,009 | |
| Total current liabilities | 127,851 |
| | 103,926 |
| Total current liabilities | 224,311 | | | 193,629 | |
| Long-term debt and capital lease obligation | 987,920 |
| | 993,374 |
| |
| Tax receivable agreement | 110,160 |
| | 165,384 |
| |
| Long-term debt and lease obligations | | Long-term debt and lease obligations | 999,089 | | | 1,099,975 | |
| Tax receivable agreement obligations | | Tax receivable agreement obligations | 123,092 | | | 134,265 | |
| Deferred tax liability | 267,771 |
| | 353,797 |
| Deferred tax liability | 347,030 | | | 317,847 | |
| Other long-term liabilities | | Other long-term liabilities | 1,593 | | | 1,605 | |
| Total liabilities | 1,493,702 |
| | 1,616,481 |
| Total liabilities | 1,695,115 | | | 1,747,321 | |
| Commitments and Contingencies (Note 14) |
| |
| Commitments and Contingencies (Note 14) | | | |
| Class A common stock, $0.0001 par value, 200,000,000 shares authorized, 99,791,245 and 98,250,917 shares issued and outstanding at December 31, 2017 and 2016, respectively | 10 |
| | 10 |
| |
| Class B common stock, $0.0001 par value, 50,000,000 shares authorized, 30,319,564 and 31,704,988 shares issued and outstanding at December 31, 2017 and 2016, respectively | 3 |
| | 3 |
| |
| Class A common stock, $0.0001 par value, 200,000,000 shares authorized, 142,650,344 shares issued and 133,117,224 shares outstanding as of December 31, 2022 and 142,031,329 shares issued and 138,278,573 shares outstanding as of December 31, 2021 | | Class A common stock, $0.0001 par value, 200,000,000 shares authorized, 142,650,344 shares issued and 133,117,224 shares outstanding as of December 31, 2022 and 142,031,329 shares issued and 138,278,573 shares outstanding as of December 31, 2021 | 14 | | | 14 | |
| | Additional paid in capital | 920,723 |
| | 912,824 |
| Additional paid in capital | 1,311,629 | | | 1,303,254 | |
| Accumulated other comprehensive income | 1,318 |
| | — |
| |
| Retained earnings (accumulated deficit) | 208,279 |
| | (15,618 | ) | |
| Accumulated other comprehensive income (loss) | | Accumulated other comprehensive income (loss) | 35,078 | | | (506) | |
| Retained earnings | | Retained earnings | 639,595 | | | 475,400 | |
| Treasury stock | | Treasury stock | (189,232) | | | (59,172) | |
| Stockholders’ equity | 1,130,333 |
| | 897,219 |
| Stockholders’ equity | 1,797,084 | | | 1,718,990 | |
| Non-controlling interest | 342,240 |
| | 334,192 |
| |
| Total liabilities, stockholders’ equity and non-controlling interest | $ | 2,966,275 |
| | $ | 2,847,892 |
| |
| | Total liabilities and stockholders’ equity | | Total liabilities and stockholders’ equity | $ | 3,492,199 | | | $ | 3,466,311 | |
See accompanying notes to the consolidated financial statements.
HOSTESS BRANDS, INC.
CONSOLIDATED STATEMENTS OF OPERATIONS
(Amounts in thousands, except shares and per share data) | | | | | | | | | | | | | | | | | | | | | | |
| Year Ended December 31, 2022 | | Year Ended
December 31,
2021 | | Year Ended
December 31,
2020 | | | | | |
| Net revenue | $ | 1,358,207 | | | $ | 1,142,036 | | | $ | 1,016,609 | | | | | | |
| Cost of goods sold | 892,528 | | | 732,053 | | | 660,970 | | | | | | |
| Gross profit | 465,679 | | | 409,983 | | | 355,639 | | | | | | |
| | | | | | | | | | |
| Operating costs and expenses: | | | | | | | | | | |
| Advertising and marketing | 62,754 | | | 51,683 | | | 45,724 | | | | | | |
| Selling | 40,542 | | | 36,288 | | | 46,729 | | | | | | |
| General and administrative | 119,453 | | | 99,173 | | | 92,860 | | | | | | |
| Amortization of customer relationships | 23,512 | | | 23,510 | | | 26,510 | | | | | | |
| Business combination transaction costs | — | | | — | | | 4,282 | | | | | | |
| Tax receivable agreement remeasurement | (860) | | | (1,409) | | | 760 | | | | | | |
| | | | | | | | | | |
| Other operating expense | — | | | — | | | 3,464 | | | | | | |
| Total operating costs and expenses | 245,401 | | | 209,245 | | | 220,329 | | | | | | |
| Operating income | 220,278 | | | 200,738 | | | 135,310 | | | | | | |
| Other (income) expense: | | | | | | | | | | |
| Interest expense, net | 40,950 | | | 39,762 | | | 42,826 | | | | | | |
| | | | | | | | | | |
| Change in fair value of warrant liabilities | — | | | (566) | | | (39,941) | | | | | | |
| Other expense (income) | (31,956) | | | 1,730 | | | 3,723 | | | | | | |
| Total other expense | 8,994 | | | 40,926 | | | 6,608 | | | | | | |
| Income before income taxes | 211,284 | | | 159,812 | | | 128,702 | | | | | | |
| Income tax expense | 47,089 | | | 40,513 | | | 20,405 | | | | | | |
| Net income | 164,195 | | | 119,299 | | | 108,297 | | | | | | |
| Less: Net income attributable to the non-controlling interest | — | | | — | | | 3,621 | | | | | | |
| Net income attributable to Class A stockholders | $ | 164,195 | | | $ | 119,299 | | | $ | 104,676 | | | | | | |
| | | | | | | | | | |
| Earnings per Class A share: | | | | | | | | | | |
| Basic | $ | 1.20 | | | $ | 0.91 | | | $ | 0.84 | | | | | | |
| Diluted | $ | 1.19 | | | $ | 0.86 | | | $ | 0.51 | | | | | | |
| Weighted-average shares outstanding: | | | | | | | | | | |
| Basic | 136,768,310 | | | 131,571,733 | | | 124,927,535 | | | | | | |
| Diluted | 137,924,471 | | | 138,198,176 | | | 127,723,488 | | | | | | |
|
| | | | | | | | | | | | | | | | |
| Year Ended
December 31, 2017 | | From
November 4, 2016
through
December 31, 2016 | | | From
January 1, 2016
through
November 3, 2016 | | Year Ended
December 31, 2015 |
| (Successor) | | (Successor) | | | (Predecessor) | | (Predecessor) |
| Net revenue | $ | 776,188 |
| | $ | 111,998 |
| | | $ | 615,588 |
| | $ | 620,815 |
|
| Cost of goods sold | 449,290 |
| | 73,284 |
| | | 346,864 |
| | 355,963 |
|
| Special employee incentive compensation | — |
| | — |
| | | 2,195 |
| | 2,649 |
|
| Gross profit | 326,898 |
| | 38,714 |
| | | 266,529 |
| | 262,203 |
|
| | | | | | | | | |
| Operating costs and expenses: | | | | | | | | |
| Advertising and marketing | 33,004 |
| | 5,245 |
| | | 30,626 |
| | 31,967 |
|
| Selling expense | 32,086 |
| | 5,033 |
| | | 25,730 |
| | 29,484 |
|
| General and administrative | 52,943 |
| | 7,322 |
| | | 38,391 |
| | 31,531 |
|
| Special employee incentive compensation | — |
| | — |
| | | 2,503 |
| | 1,274 |
|
| Amortization of customer relationships | 23,855 |
| | 3,922 |
| | | 1,185 |
| | 851 |
|
| Impairment of property and equipment | 1,003 |
| | — |
| | | 7,300 |
| | 2,700 |
|
| Loss on sale/abandonment of property and equipment, and bakery shutdown costs (recoveries) | (144 | ) | | — |
| | | 2,551 |
| | 4,182 |
|
| Business combination transaction costs | — |
| | — |
| | | 31,832 |
| | — |
|
| Related party expenses | 381 |
| | 26,799 |
| | | 3,539 |
| | 4,306 |
|
| Tax receivable agreement liability remeasurement | (50,222 | ) | | — |
| | | — |
| | — |
|
| Total operating costs and expenses | 92,906 |
| | 48,321 |
| | | 143,657 |
| | 106,295 |
|
| Operating income (loss) | 233,992 |
| | (9,607 | ) | | | 122,872 |
| | 155,908 |
|
| Other (income) expense: |
| |
| | |
| |
|
| Interest expense, net | 39,174 |
| | 6,649 |
| | | 60,384 |
| | 50,011 |
|
| Loss (gain) on modification of debt | 2,554 |
| | (763 | ) | | | — |
| | 25,880 |
|
| Other expense (income) | 1,360 |
| | 754 |
| | | 1,624 |
| | (8,743 | ) |
| Total other expense | 43,088 |
| | 6,640 |
| | | 62,008 |
| | 67,148 |
|
| Income (loss) before income taxes | 190,904 |
| | (16,247 | ) | | | 60,864 |
| | 88,760 |
|
| Income tax expense (benefit) | (67,204 | ) | | (7,762 | ) | | | 439 |
| | — |
|
| Net income (loss) | 258,108 |
| | (8,485 | ) | | | 60,425 |
| | 88,760 |
|
| Less: Net income (loss) attributable to the non-controlling interest | 34,211 |
| | (4,081 | ) | | | 3,214 |
| | 4,507 |
|
| Net income (loss) attributable to Class A shareholders/partners | $ | 223,897 |
| | $ | (4,404 | ) | | | $ | 57,211 |
| | $ | 84,253 |
|
| Earnings (loss) per Class A share: |
| |
| | |
| |
|
| Basic | $2.26 | | (0.05 | ) | | |
| |
|
| Diluted | $2.13 | | (0.05 | ) | | |
| |
|
| Weighted-average shares outstanding: |
| |
| | |
| |
|
| Basic | 99,109,629 |
| | 97,791,658 |
| | |
| |
|
| Diluted | 105,307,293 |
| | 97,791,658 |
| | |
| |
|
See accompanying notes to the consolidated financial statements.
HOSTESS BRANDS, INC.
CONSOLIDATED STATEMENTS OF COMPREHENSIVE INCOME
(Amounts in thousands)
| | | | | | | | | | | | | | | | | | | | | | |
| | | | | | |
| Year Ended
December 31,
2022 | | Year Ended
December 31,
2021 | | Year Ended
December 31,
2020 | | | | | |
| Net income | $ | 164,195 | | | $ | 119,299 | | | $ | 108,297 | | | | | | |
| Other comprehensive income: | | | | | | | | | | |
| Unrealized gain (loss) on interest rate swaps and foreign currency contracts designated as cash flow hedges | 51,566 | | | 8,973 | | | (16,870) | | | | | | |
| Reclassification into net income | (3,309) | | | 4,503 | | | 3,886 | | | | | | |
| Income tax benefit (expense) | (12,673) | | | (3,575) | | | 3,421 | | | | | | |
| Comprehensive income | 199,779 | | | 129,200 | | | 98,734 | | | | | | |
| Less: Comprehensive income attributed to non-controlling interest | — | | | — | | | 2,749 | | | | | | |
| Comprehensive income attributed to Class A stockholders | $ | 199,779 | | | $ | 129,200 | | | $ | 95,985 | | | | | | |
|
| | | | | | | | | | | | | | | | | |
| Year Ended
December 31,
2017 | | | From
November 4, 2016
through
December 31, 2016 | | | From
January 1, 2016
through
November 3, 2016 | | Year Ended
December 31,
2015 |
| | (Successor) | | | (Successor) | | | (Predecessor) | | (Predecessor) |
| Net income (loss) | $ | 258,108 |
| | | $ | (8,485 | ) | | | $ | 60,425 |
| | $ | 88,760 |
|
| Other comprehensive income: |
| | |
| | |
| |
|
| Unrealized income on interest rate swap designated as a cash flow hedge | 2,878 |
| | | — |
| | | — |
| | — |
|
| Income tax expense | (890 | ) | | | — |
| | | — |
| | — |
|
| Comprehensive income (loss) | 260,096 |
| | | (8,485 | ) | | | 60,425 |
| | 88,760 |
|
| Less: Comprehensive income (loss) attributed to non-controlling interest | 34,881 |
| | | (4,081 | ) | | | 3,214 |
| | 4,507 |
|
| Comprehensive income (loss) attributed to class A shareholders/partners | $ | 225,215 |
| | | $ | (4,404 | ) | | | $ | 57,211 |
| | $ | 84,253 |
|
See accompanying notes to the consolidated financial statements.
HOSTESS BRANDS, INC.
CONSOLIDATED STATEMENTS OF STOCKHOLDERS’ EQUITY (DEFICIT)
(Amounts in thousands, except shares data)
thousands) | | | | | | | | | | | | | | | | | | | | | | | | | | | | | | | | | | | | | | | | | | | | | | | | | | | | | | | | | | | | | | | | | |
| Class A Voting
Common Stock | | Class B Voting
Common Stock | | Additional
Paid-in Capital | | Accumulated Other Comprehensive Income (Losses) | | Retained Earnings | | Treasury Stock | | Total
Stockholders’
Equity | | Non-controlling
Interest |
| Shares | | Amount | | Shares | | Amount | | | | | | | | Shares | | Amount | | | | |
| | | | | | | | | | | | | | | | | | | | | |
| | | | | | | | | | | | | | | | | | | | | |
| | | | | | | | | | | | | | | | | | | | | |
| | | | | | | | | | | | | | | | | | | | | |
| | | | | | | | | | | | | | | | | | | | | |
| | | | | | | | | | | | | | | | | | | | | |
| | | | | | | | | | | | | | | | | | | | | |
| | | | | | | | | | | | | | | | | | | | | |
| | | | | | | | | | | | | | | | | | | | | |
| | | | | | | | | | | | | | | | | | | | | |
| | | | | | | | | | | | | | | | | | | | | |
| | | | | | | | | | | | | | | | | | | | | |
| | | | | | | | | | | | | | | | | | | | | |
| | | | | | | | | | | | | | | | | | | | | |
| | | | | | | | | | | | | | | | | | | | | |
| | | | | | | | | | | | | | | | | | | | | |
| | | | | | | | | | | | | | | | | | | | | |
| | | | | | | | | | | | | | | | | | | | | |
| | | | | | | | | | | | | | | | | | | | | |
| Balance–December 31, 2019 | 122,107 | | | $ | 12 | | | 8,411 | | | $ | 1 | | | $ | 1,123,805 | | | $ | (756) | | | $ | 251,425 | | | — | | | $ | — | | | $ | 1,374,487 | | | $ | 94,432 | |
| Comprehensive income (loss) | — | | | — | | | — | | | — | | | — | | | (8,691) | | | 104,676 | | | — | | | — | | | 95,985 | | | 2,749 | |
| Share-based compensation, including income taxes of $2,167 | 223 | | | — | | | — | | | — | | | 10,838 | | | — | | | — | | | — | | | — | | | 10,838 | | | — | |
| Exchanges | 8,411 | | | 1 | | | (8,411) | | | (1) | | | 94,719 | | | (960) | | | — | | | — | | | — | | | 93,759 | | | (93,759) | |
| Distributions | — | | | — | | | — | | | — | | | — | | | — | | | — | | | — | | | — | | | — | | | (3,422) | |
| Exercise of employee stock options and warrants | 50 | | | — | | | — | | | — | | | 690 | | | — | | | — | | | — | | | — | | | 690 | | | — | |
| Payment of taxes for employee stock awards | — | | | — | | | — | | | — | | | (1,440) | | | — | | | — | | | — | | | — | | | (1,440) | | | — | |
| | | | | | | | | | | | | | | | | | | | | |
| Reclassification of public warrants | — | | | — | | | — | | | — | | | 68,503 | | | — | | | — | | | — | | | — | | | 68,503 | | | — | |
| | | | | | | | | | | | | | | | | | | | | |
| Repurchase of common stock | (444) | | | — | | | — | | | — | | | — | | | — | | | — | | | 444 | | | (6,000) | | | (6,000) | | | — | |
| Tax receivable agreement arising from exchanges, net of income taxes of $11,818 | — | | | — | | | — | | | — | | | (16,097) | | | — | | | — | | | — | | | — | | | (16,097) | | | — | |
| Balance-December 31, 2020 | 130,347 | | | 13 | | | — | | | — | | | 1,281,018 | | | (10,407) | | | 356,101 | | | 444 | | | (6,000) | | | 1,620,725 | | | — | |
| Comprehensive income | — | | | — | | | — | | | — | | | — | | | 9,901 | | | 119,299 | | | — | | | — | | | 129,200 | | | — | |
| Share-based compensation | 224 | | | — | | | — | | | — | | | 9,585 | | | — | | | — | | | — | | | — | | | 9,585 | | | — | |
| Exercise of employee stock options | 313 | | | — | | | — | | | — | | | 4,488 | | | — | | | — | | | — | | | — | | | 4,488 | | | — | |
| Exercise of public warrants | 881 | | | — | | | — | | | — | | | 9,632 | | | — | | | — | | | — | | | — | | | 9,632 | | | — | |
| Cashless exercise of public warrants, net of fees of $500 | 9,823 | | | 1 | | | — | | | — | | | — | | | — | | | — | | | — | | | — | | | 1 | | | — | |
| Payment of taxes for employee stock awards | — | | | — | | | — | | | — | | | (1,767) | | | — | | | — | | | — | | | — | | | (1,767) | | | — | |
| Reclassification of warrants | — | | | — | | | — | | | — | | | 298 | | | — | | | — | | | — | | | — | | | 298 | | | — | |
| Repurchase of common stock | (3,309) | | | — | | | — | | | — | | | — | | | — | | | — | | | 3,309 | | | (53,172) | | | (53,172) | | | — | |
| Balance-December 31, 2021 | 138,279 | | | 14 | | | — | | | — | | | 1,303,254 | | | (506) | | | 475,400 | | | 3,753 | | | (59,172) | | | 1,718,990 | | | — | |
| Comprehensive income | — | | | — | | | — | | | — | | | — | | | 35,584 | | | 164,195 | | | — | | | — | | | 199,779 | | | — | |
| Share-based compensation | 382 | | | — | | | — | | | — | | | 10,450 | | | — | | | — | | | — | | | — | | | 10,450 | | | — | |
| Exercise of employee stock options | 236 | | | — | | | — | | | — | | | 3,970 | | | — | | | — | | | — | | | — | | | 3,970 | | | — | |
| Payment of taxes for employee stock awards | — | | | — | | | — | | | — | | | (6,045) | | | — | | | — | | | — | | | — | | | (6,045) | | | — | |
| Repurchase of common stock | (5,780) | | | — | | | — | | | — | | | — | | | — | | | — | | | 5,780 | | | (130,060) | | | (130,060) | | | — | |
| Balance-December 31, 2022 | 133,117 | | | $ | 14 | | | — | | | $ | — | | | $ | 1,311,629 | | | $ | 35,078 | | | $ | 639,595 | | | 9,533 | | | $ | (189,232) | | | $ | 1,797,084 | | | $ | — | |
|
| | | | | | | | | | | | | | | | | | | | |
Partners’ Equity (Deficit)
Hostess Holdings, LP (Predecessor) |
|
| Class A |
| Class C |
| Total Partners’
Equity (Deficit) |
| Non-controlling
Interest |
| Balance – January 1, 2015 | | $ | 191,989 | | | $ | 53,100 | | | $ | 245,089 |
| | $ | 4,267 |
|
| Distributions to partners | | (533,030 | ) | | (419,823 | ) | | (952,853 | ) | | (46,765 | ) |
| Unit based compensation | | 948 | | | 433 | | | 1,381 |
| | — |
|
| Net income | | 64,009 | | | 20,244 | | | 84,253 |
| | 4,507 |
|
| Balance – December 31, 2015 |
| (276,084 | ) |
| (346,046 | ) |
| (622,130 | ) |
| (37,991 | ) |
| Distributions to partners |
| (9,817 | ) |
| (13,765 | ) |
| (23,582 | ) |
| (1,027 | ) |
| Unit based compensation |
| 1,945 | |
| 1,945 | |
| 3,890 |
|
| — |
|
| Net income |
| 28,605 | |
| 28,606 | |
| 57,211 |
|
| 3,214 |
|
| Balance – November 3, 2016 |
| $ | (255,351 | ) |
| $ | (329,260 | ) |
| $ | (584,611 | ) |
| $ | (35,804 | ) |
|
| | | | | | | | | | | | | | | | | | | | | | | | | | | | | | | | | | |
| | Stockholders’ Equity Hostess Brands, Inc. (Successor) |
| |
| | | Class A Voting
Common Stock | | Class B Voting
Common Stock | | Additional
Paid-in Capital | | Accumulated Other Comprehensive Loss | | Accumulated
Losses / Retained Earnings | | Total
Stockholders’
Equity | | Non-controlling
Interest |
| | | Shares | | Amount | | Shares | | Amount | | | | | | | | | | |
| | Balance–November 4, 2016 | 97,589,217 |
| | $ | 10 |
| | 29,870,688 |
| | $ | 3 |
| | $ | 901,157 |
| | $ | — |
| | $ | (11,214 | ) | | $ | 889,956 |
| | $ | 326,601 |
|
| | Comprehensive income | — |
| | — |
| | — |
| | — |
| | — |
| | — |
| | (4,404 | ) | | (4,404 | ) | | (4,081 | ) |
| | Share-based compensation | — |
| | — |
| | 2,496,000 |
| | — |
| | 5,718 |
| | — |
| | — |
| | 5,718 |
| | 17,889 |
|
| | Exchanges | 661,700 |
| | — |
| | (661,700 | ) | | — |
| | 6,217 |
| | — |
| | — |
| | 6,217 |
| | (6,217 | ) |
| | Tax receivable agreement arising from exchanges, net of income taxes of $420 | — |
| | — |
| | — |
| | — |
| | (268 | ) | | — |
| | — |
| | (268 | ) | | — |
|
| | Balance–December 31, 2016 | 98,250,917 |
| | 10 |
| | 31,704,988 |
| | 3 |
| | 912,824 |
| | — |
| | (15,618 | ) | | 897,219 |
| | 334,192 |
|
| | Comprehensive income | — |
| | — |
| | — |
| | — |
| | — |
| | 1,318 |
| | 223,897 |
| | 225,215 |
| | 34,881 |
|
| | Share-based compensation, net of income taxes of $2,610 | 154,849 |
| | — |
| | — |
| | — |
| | 4,803 |
| | — |
| | — |
| | 4,803 |
| | — |
|
| | Exchanges | 1,385,424 |
| | — |
| | (1,385,424 | ) | | — |
| | 13,848 |
| | — |
| | — |
| | 13,848 |
| | (13,848 | ) |
| | Distributions | — |
| | — |
| | — |
| | — |
| | — |
| | — |
| | — |
| | — |
| | (12,985 | ) |
| | Payment of taxes for employee stock awards | — |
| | — |
| | — |
| | — |
| | (436 | ) | | — |
| | — |
| | (436 | ) | | — |
|
| | Exercise of public warrants | 55 |
| | — |
| | — |
| | — |
| | 1 |
| | — |
| | — |
| | 1 |
| | — |
|
| | Tax receivable agreement arising from exchanges, net of income taxes of $1,898 | — |
| | — |
| | — |
| | — |
| | (10,317 | ) | | — |
| | — |
| | (10,317 | ) | | — |
|
| | Balance–December 31, 2017 | 99,791,245 |
| | $ | 10 |
| | 30,319,564 |
| | $ | 3 |
| | $ | 920,723 |
| | $ | 1,318 |
| | $ | 208,279 |
| | $ | 1,130,333 |
| | $ | 342,240 |
|
See accompanying notes to the consolidated financial statements.
HOSTESS BRANDS, INC.
CONSOLIDATED STATEMENTS OF CASH FLOWS
(Amounts in thousands)
|
| | | | | | | | | | | | | | | | |
| Year Ended
December 31, 2017 |
| November 4, 2016
through
December 31, 2016 |
|
| January 1, 2016
through
November 3, 2016 |
| Year Ended
December 31, 2015 |
| (Successor) |
| (Successor) |
|
| (Predecessor) |
| (Predecessor) |
| Operating activities | | | | | | | | |
| Net income (loss) | $ | 258,108 |
|
| $ | (8,485 | ) |
|
| $ | 60,425 |
|
| $ | 88,760 |
|
| Depreciation and amortization | 38,170 |
|
| 5,843 |
|
|
| 10,265 |
|
| 9,836 |
|
| Impairment of property | 1,003 |
|
| — |
|
|
| 7,300 |
|
| 2,700 |
|
| Non-cash loss (gain) on debt modification | 1,453 |
|
| (3,974 | ) |
|
| — |
|
| 16,005 |
|
| Debt discount (premium) amortization | (925 | ) |
| (197 | ) |
|
| 2,790 |
|
| 3,423 |
|
| Tax receivable agreement remeasurement | (50,222 | ) |
| — |
|
|
| — |
|
| — |
|
| Stock-based compensation | 7,413 |
|
| 26,748 |
|
|
| 3,890 |
|
| 1,381 |
|
| Loss on sale/abandonment of property and equipment | 11 |
|
| — |
|
|
| 2,551 |
|
| 3,001 |
|
| Deferred taxes | (81,270 | ) |
| (7,815 | ) |
|
| — |
|
| — |
|
| Change in operating assets and liabilities | | | | | | | | |
| Accounts receivable | (11,775 | ) |
| 3,705 |
|
|
| (19,869 | ) |
| (1,077 | ) |
| Inventories | (3,901 | ) |
| 8,895 |
|
|
| (2,994 | ) |
| (5,611 | ) |
| Prepaids and other current assets | (3,039 | ) |
| (1,694 | ) |
|
| (1,049 | ) |
| (441 | ) |
| Accounts payable and accrued expenses | 4,839 |
|
| (11,296 | ) |
|
| 33,886 |
|
| 10,480 |
|
| Customer trade allowances | 3,820 |
|
| 2,225 |
|
|
| 4,828 |
|
| 4,364 |
|
| Other | — |
|
| (344 | ) |
|
| 198 |
|
| 151 |
|
| Net cash provided by operating activities | 163,685 |
|
| 13,611 |
|
|
| 102,221 |
|
| 132,972 |
|
|
|
|
|
|
|
|
|
|
|
|
|
|
| Investing activities |
|
|
|
|
|
|
|
|
|
|
|
|
| Purchases of property and equipment | (32,913 | ) |
| (6,494 | ) |
|
| (28,633 | ) |
| (25,082 | ) |
| Acquisition of business, net of cash | — |
|
| (421,242 | ) |
|
| (49,735 | ) |
| — |
|
| Proceeds from sale of assets | 85 |
|
| — |
|
|
| 4,000 |
|
| 425 |
|
| Proceeds from sale of marketable securities | — |
|
| — |
|
|
| — |
|
| 42,960 |
|
| Restricted cash release | — |
|
| — |
|
|
| — |
|
| 1,762 |
|
| Acquisition and development of software assets | (2,381 | ) |
| (460 | ) |
|
| (2,211 | ) |
| (2,185 | ) |
| Net cash used in investing activities | (35,209 | ) |
| (428,196 | ) |
|
| (76,579 | ) |
| 17,880 |
|
|
|
|
|
|
|
|
|
|
|
|
|
|
| Financing activities |
|
|
|
|
|
|
|
|
|
|
|
|
| Repayments of long-term debt and capital lease obligation | (5,144 | ) |
| (217,400 | ) |
|
| (6,987 | ) |
| (498,565 | ) |
| Proceeds from issuance of long-term debt | — |
|
| — |
|
|
| — |
|
| 1,225,000 |
|
| Payment of deferred underwriting costs | — |
|
| (13,125 | ) |
|
| — |
|
| — |
|
| Debt fees | (1,066 | ) |
| (1,820 | ) |
|
| — |
|
| (22,819 | ) |
| Distributions to partners | — |
|
| — |
|
|
| (23,582 | ) |
| (952,853 | ) |
| Distributions to non-controlling interest | (12,985 | ) |
| — |
|
|
| (1,027 | ) |
| (46,765 | ) |
| Payment of taxes related to the net issuance of employee stock awards | (436 | ) | | — |
| | | — |
| | — |
|
| Proceeds from the exercise of warrants | 1 |
|
| — |
|
|
| — |
|
| — |
|
| Net cash used in financing activities | (19,630 | ) |
| (232,345 | ) |
|
| (31,596 | ) |
| (296,002 | ) |
| Net increase (decrease) in cash and cash equivalents | 108,846 |
|
| (646,930 | ) |
|
| (5,954 | ) |
| (145,150 | ) |
| Cash and cash equivalents at beginning of period | 26,855 |
|
| 673,785 |
|
|
| 64,473 |
|
| 209,623 |
|
| Cash and cash equivalents at end of period | $ | 135,701 |
|
| $ | 26,855 |
|
|
| $ | 58,519 |
|
| $ | 64,473 |
|
|
|
|
|
|
|
|
|
|
|
|
|
|
| Supplemental Disclosures of Cash Flow Information |
|
|
|
|
|
|
|
|
|
|
|
|
| Interest | $ | 45,431 |
|
| $ | — |
|
|
| $ | 68,606 |
|
| $ | 34,710 |
|
| Taxes paid | $ | 16,617 |
|
| $ | 43 |
|
|
| $ | — |
|
| $ | — |
|
| Supplemental disclosure of non-cash investing |
|
|
|
|
|
|
|
|
|
|
|
|
| Purchases of property and equipment funded by accounts payable | $ | 1,089 |
|
| $ | 673 |
|
|
| $ | 633 |
|
| $ | (15 | ) |
| | | | | | | | | | | | | | | | | | | | | | |
| Year Ended
December 31,
2022 | | Year Ended
December 31,
2021 | | Year Ended
December 31,
2020 | | | | | |
| Operating activities | | | | | | | | | | |
| Net income | $ | 164,195 | | | $ | 119,299 | | | $ | 108,297 | | | | | | |
| Depreciation and amortization | 60,086 | | | 51,681 | | | 54,940 | | | | | | |
| Impairment and loss on sale of assets | — | | | — | | | 3,329 | | | | | | |
| | | | | | | | | | |
| Debt discount amortization | 1,514 | | | 1,238 | | | 1,289 | | | | | | |
| Tax receivable agreement remeasurement | (860) | | | (1,409) | | | 760 | | | | | | |
| Change in fair value of warrant liabilities | — | | | (566) | | | (39,941) | | | | | | |
| | | | | | | | | | |
| Unrealized loss (gain) on foreign currency | 631 | | | (503) | | | 2,061 | | | | | | |
| Non-cash lease expense | 462 | | | 1,247 | | | 571 | | | | | | |
| Share-based compensation | 10,450 | | | 9,585 | | | 8,671 | | | | | | |
| Realized and unrealized gains on short-term investments | (490) | | | — | | | — | | | | | | |
| | | | | | | | | | |
| Deferred taxes | 16,511 | | | 18,995 | | | 16,806 | | | | | | |
| Change in operating assets and liabilities, net of acquisitions and dispositions: | | | | | | | | | | |
| Accounts receivable | (20,763) | | | (22,728) | | | 4,434 | | | | | | |
| Inventories | (12,593) | | | (3,465) | | | 5,824 | | | | | | |
| Prepaids and other current assets | (5,959) | | | 9,876 | | | (5,301) | | | | | | |
| Accounts payable and accrued expenses | 26,072 | | | 13,723 | | | 1,900 | | | | | | |
| Customer trade allowances | 9,546 | | | 6,056 | | | (4,397) | | | | | | |
| | | | | | | | | | |
| Net cash provided by operating activities | 248,802 | | | 203,029 | | | 159,243 | | | | | | |
| | | | | | | | | | |
| Investing activities | | | | | | | | | | |
| Purchases of property and equipment | (119,374) | | | (60,803) | | | (51,983) | | | | | | |
| Acquisition of short-term investments | (80,424) | | | — | | | — | | | | | | |
| Proceeds from maturity of short-term investments | 63,000 | | | — | | | — | | | | | | |
| Acquisition of business, net of cash | — | | | — | | | (316,013) | | | | | | |
| | | | | | | | | | |
| | | | | | | | | | |
| Acquisition and development of software assets | (11,123) | | | (4,622) | | | (6,269) | | | | | | |
| Net cash used in investing activities | (147,921) | | | (65,425) | | | (374,265) | | | | | | |
| Financing activities | | | | | | | | | | |
| Repayments of long-term debt and financing lease obligations | (108,375) | | | (11,167) | | | (11,168) | | | | | | |
| Proceeds from long-term debt origination, net of fees paid | — | | | — | | | 136,888 | | | | | | |
| | | | | | | | | | |
| Distributions to non-controlling interest | — | | | — | | | (3,422) | | | | | | |
| Repurchase of warrants | — | | | — | | | (2,000) | | | | | | |
| Repurchase of common stock | (130,060) | | | (53,172) | | | (6,000) | | | | | | |
| Payment of taxes related to the net issuance of employee stock awards | (6,045) | | | (1,767) | | | (1,440) | | | | | | |
| Payments on tax receivable agreement | (9,313) | | | (9,270) | | | (10,327) | | | | | | |
| Cash received from exercise of options and warrants, net of fees | 3,970 | | | 14,121 | | | 690 | | | | | | |
| Net cash provided by (used in) financing activities | (249,823) | | | (61,255) | | | 103,221 | | | | | | |
| Effect of exchange rate changes on cash and cash equivalents | (1,633) | | | (224) | | | (252) | | | | | | |
| Net increase (decrease) in cash and cash equivalents | (150,575) | | | 76,125 | | | (112,053) | | | | | | |
| Cash and cash equivalents at beginning of period | 249,159 | | | 173,034 | | | 285,087 | | | | | | |
| Cash and cash equivalents at end of period | $ | 98,584 | | | $ | 249,159 | | | $ | 173,034 | | | | | | |
| | | | | | | | | | |
| Supplemental Disclosures of Cash Flow Information | | | | | | | | | | |
| Interest paid, net of amounts capitalized | $ | 39,419 | | | $ | 38,567 | | | $ | 41,776 | | | | | | |
| Net taxes paid | $ | 28,003 | | | $ | 12,081 | | | $ | 5,825 | | | | | | |
| Supplemental disclosure of non-cash investing | | | | | | | | | | |
| Accrued capital expenditures | $ | 8,638 | | | $ | 2,244 | | | $ | 4,718 | | | | | | |
See accompanying notes to the consolidated financial statements.
HOSTESS BRANDS, INC.
NOTES TO CONSOLIDATED FINANCIAL STATEMENTS
1. Summary of Significant Accounting Policies
Description of Business
Hostess Brands, Inc. is a Delaware corporation headquartered in Kansas City, Missouri.Lenexa, Kansas. The consolidated financial statements include the accounts of Hostess Brands, Inc. and its wholly owned subsidiaries (collectively, the “Company”). The Company is a leading packaged foodsweet snacks company focused on developing, manufacturing, marketing, selling and distributing fresh sweet baked goodssnacks in North America under the United States.Hostess® and Voortman® brands. The Hostess brand dates to 1919 when the Hostess CupCake was introduced to the public, followed by Twinkies® in 1930. In 2013, the Legacy Hostess Equityholders (as defined below) acquired the Hostess brand out of the bankruptcy liquidation proceedings of its prior owners, free and clear of all past liabilities. After a brief hiatus in production, the Company began providing Hostess products to consumers and retailers across the nation in July 2013. Today, the Company produces a variety of new and classic treats primarily under theincluding iconic Hostess® and Dolly Madison® group of brands, includingDonettes®, Twinkies®, CupCakes, Ding Dongs® and Zingers®, HoHos®, Donettes®as well as a variety of Voortman® cookies and Fruit Pies.
On November 4, 2016 (the “Closing Date”), in a transaction referredwafers. The Hostess® brand dates back to as1919 when the “Business Combination,” the Company, then known as Gores Holdings, Inc. (“Gores Holdings”), acquired a controlling interest in Hostess Holdings, L.P. (“Hostess Holdings”), an entity owned indirectly by C. Dean Metropoulos and certain equity funds managed by affiliates of Apollo Global Management, LLC (the “Apollo Funds”, and together with entities controlled by Mr. Metropoulos, the “Legacy Hostess Equityholders”). Our “Sponsor” refers to Gores Sponsor, LLC, a Delaware limited liability company and the principal stockholder of Gores Holdings, Inc. priorHostess® CupCake was introduced to the Business Combination, and the “The Gores Group” refers to public, followed by Twinkies® in 1930.
Basis of Presentation
The Gores GroupCompany’s operations are primarily conducted through its wholly-owned operating subsidiary, Hostess Brands, LLC an affiliate of our Sponsor. In connection with the closing of the Business Combination, Gores Holdings, Inc. changed its name to “Hostess Brands, Inc.”(“HBLLC”) and its trading symbols on NASDAQ from “GRSH” and “GRSHW,” to “TWNK” and “TWNKW”.
As a result of the Business Combination, for accounting purposes,subsidiary, Voortman Cookies Limited. Hostess Brands, Inc. is the acquirera holding company with no significant assets or operations other than cash and Hostess Holdings is the acquired partycash equivalents of $16.7 million and accounting predecessor. The Company’s financial statement presentation includes the financial statements of Hostess Holdings$56.2 million at December 31, 2022 and 2021, respectively, tax receivable agreement liability, investment in its subsidiaries as “Predecessor” for periods priorand current and deferred income tax assets and liabilities related to the completion of the Business Combination and of Hostess Brands, Inc., including the consolidation of Hostess Holdings and its subsidiaries, for periodsearnings from and after the Closing Date (referred to as the “Successor”). Unless the context requires otherwise, the “Company” refers to the Predecessor for periods prior to the Business Combination and to the Successor for periods after the Business Combination.
On May 10, 2016, the Company purchased the stock of Superior Cake Products, Inc. (“Superior”) located in Southbridge, Massachusetts. Superior manufactures and distributes eclairs, madeleines, brownies, and iced cookies sold in the “In-Store Bakery” section of retailers.
Basis of Presentation
HBLLC. The consolidated financial statements included herein have been prepared in accordance with generally accepted accounting principles in the United States of America (“U.S. GAAP”) and the rules and regulations of the Securities and Exchange Commission (“SEC”). The accompanying consolidated financial statements include the accounts of the CompanyHostess Brands, Inc. and its wholly-owned, majority-owned or controlled subsidiaries, collectively referred to as either Hostess or the Company.subsidiaries. All intercompany balances and transactions have been eliminated in consolidation.
The operating subsidiaries are wholly-owned by Hostess Holdings, a direct subsidiary of Hostess Brands, Inc. Prior to the final exchange of Class B stock (as described below), Hostess Brands, Inc. held 100% of the general partnership interest in Hostess Holdings and a majority of the limited partnership interests therein and consolidated Hostess Holdings in the Company’s consolidated financial statements. The remaining limited partnership interests in Hostess Holdings were held by the holders of Class B stock.
C. Dean Metropoulos and entities under his control (the “Metropoulos Entities”) held their equity investment in the Company primarily through Class B limited partnership units (“Class B Units”) in Hostess Holdings LP (“Hostess Holdings”) and an equal number of shares of the Company’s Class B common stock (“Class B Stock”). Each Class B Unit, together with a share of Class B Stock held by the Metropoulos Entities, was exchangeable for a share of the Company’s Class A common stock. The interest of the Class B Units was reflected in the consolidated financial statements as a non-controlling interest. During the year ended December 31, 2020, the Metropoulos Entities exchanged all of their remaining Class B Units and Class B Stock for Class A common stock. At December 31, 2022 and 2021, there were no outstanding Class B Units or Class B Stock and there is no non-controlling interest reported on the December 31, 2022 or 2021 consolidated balance sheets.
Subsequent to the Metropoulos Entities’ final exchange of Class B Units, all subsidiaries, including Hostess Holdings, are wholly owned by the Company.
ThePrior to the final exchange of Class B Units, the Company has determined that Hostess Holdings, a limited partnership, iswas a variable interest entity (“VIE”) and that the Company iswas the primary beneficiary of the VIE. The Company determined that, throughdue to its ownership of Hostess GP, it hasHoldings’ general partnership units, the Company had the power to direct all of the activities of Hostess Holdings, with no substantive kick-out rights or participating rights by the limited partners individually or as a group. Hostess Holdings constitutesconstituted the majority of the assets of the Company.
The Company has one reportable segment: Snacking.
Mr. Metropoulos and
HOSTESS BRANDS, INC.
NOTES TO CONSOLIDATED FINANCIAL STATEMENTS
Principles of Consolidation
The accompanying consolidated financial statements include the Metropoulos Entities hold their equity investment in the company primarily through Class B limited partnership units in the Company’s subsidiary, Hostess Holdings (“Class B Units”) and an equal number of shares of the Company’s Class B common stock (“Class B Stock”). The Company’s Class B Stock has voting, but no economic, rights, while Hostess Holdings’ Class B Units have economic, but no voting, rights. Each Class B Unit, together with a share of Class B Stock held by the Metropoulos Entities, is exchangeable for a share of the Company’s Class A common stock (or at the optionaccounts of the Company and its majority-owned or controlled subsidiaries (including those for which the cash equivalent thereof). The interestCompany was the primary beneficiary of a VIE), collectively referred to as the Metropoulos EntitiesCompany. All intercompany balances and transactions have been eliminated in Hostess Holdings’ Class B Units is reflected in our Consolidated Financial Statements as a non-controlling interest. The non-controlling interest was recorded at fair value at November 4, 2016 as a result of the Business Combination.consolidation.
For the Predecessor periods, Hostess Holdings consolidated the financial position and results of operationsAdoption of New Hostess Holdco LLC. The portion of the New Hostess Holdco, LLC not owned by Hostess Holdings was recognized as a non-controlling interest in the Consolidated Financial Statements. The non-controlling interest presented in the accompanying consolidated balance sheet represents the amount of cash that would be payable to the non-controlling interest holders ifAccounting Standards
On January 1, 2021, the Company were liquidated at book value asadopted Accounting Standards Update (“ASU”), 2019-12 Income Taxes (Topic 740): Simplifying the Accounting for Income Taxes. This ASU simplifies the accounting for certain income tax related items, including intraperiod tax allocations, deferred taxes related to foreign subsidiaries and step-up in tax basis of goodwill. The adoption of this standard did not have a material impact on the balance sheet date. The difference between the calculated liquidation distribution amounts at the beginning and the end of the reporting period, is the share of the earnings or losses allocated to non-controlling interest for the period.consolidated financial statements.
For the year ended December 31, 2017,On January 1, 2020, the Company recorded adjustmentsadopted ASU No. 2016-13 Financial Instruments-Credit Losses (Topic 326): Measurement of Credit Losses on Financial Instruments. This ASU requires entities to previously reported gainsmeasure the impairment of certain financial instruments, including trade receivables, based on debt modifications, resulting inexpected losses rather than incurred losses. The adoption of this standard did not have a pre-tax charge of $1.6 million. The Company has determined that this correction of an error is immaterial tomaterial impact on the current and prior reported periods.
The Company has two reportable segments: Sweet Baked Goods and In-Store Bakery. Previously, the Company’s reportable segments were Sweet Baked Goods and Other. A change in the Company’s internal reporting structure during the last quarter of 2017 caused the Company to reassess its reportable segments. Prior period segment disclosures have been reclassified to conform with current period presentation.consolidated financial statements.
Use of Estimates
The preparation of consolidated financial statements in conformity with U.S. GAAP requires management to make estimates and judgments that affect the reported amounts of assets and liabilities at the date of the financial statements and for the reported amounts of revenues and expenses during the reporting period. Management utilizes estimates, including, but not limited to, valuation and useful lives of tangible and intangible assets, valuationfuture cash tax savings rate, incremental borrowing rate and the allocation of expected future payments under the liability between short-term and long-term based on when the Company realizes certain tax receivable agreement,attributes and reserves for trade and promotional allowances. Actual results could differ from these estimates.
Cash and Cash Equivalents
The Company considers all highly liquid investments purchased with original maturities of three months or less when purchased as cash equivalents and are recordedrecords these at cost. Under the Company’s cash management system, checks that have been issued and are out of the control of the Company, but which have not cleared the bank by the balance sheet date, are reported as a reduction of cash.
Investments
The Company considers all investments purchased with original maturities of greater than three months, but less than one year as short-term investments and all investments purchased with original maturities of greater than one year as long-term investments.
The Company classifies its investments in debt securities where it has positive intent and ability to hold until maturity as held-to-maturity investments. As of December 31, 2022, the Company’s held-to-maturity investments classified as cash equivalents on the consolidated balance sheet totaled $12.0 million, which consisted of $6.0 million of U.S. treasury securities, $6.0 million of U.S. agency bonds and held-to-maturity investments classified as short-term investments on the consolidated balance sheet of $17.9 million. The short-term investments consisted of $10.0 million of commercial paper and $7.9 million of U.S. agency bonds. As of December 31, 2021, the Company had no held-to-maturity investments. Held-to-maturity investments are recorded at amortized cost, which approximates fair value, and realized gains or losses are reported in interest expense, net on the consolidated statement of operations. For the year ended December 31, 2022, the Company recognized $1.1 million in realized gains and $0.2 million in unrealized gains. The Company's held-to-maturity investments are classified as Level 2 in the fair value hierarchy because they are valued using inputs other than quoted prices, which are directly or indirectly observable in the market, including prices for similar assets in active markets as well as quoted prices for identical or similar assets in markets that are not active.
HOSTESS BRANDS, INC.
NOTES TO CONSOLIDATED FINANCIAL STATEMENTS
Accounts Receivable
Accounts receivable represents amounts invoiced to customers for goods that havewhich the Company’s obligation to the customer has been received by the customer.satisfied. As of December 31, 20172022 and December 31, 2016,2021, the Company’s accounts receivable were $101.0$168.8 million and $89.2$148.2 million, respectively, which have been reduced by allowances for damages occurring during shipment, quality claims and doubtful accounts in the amount of $2.1$5.8 million and $1.9$3.0 million, respectively.
The allowance for doubtful accounts represents the Company’s estimate of expected credit losses related to trade receivables. To estimate the allowance for doubtful accounts, the Company leverages information on historical losses, current conditions, and reasonable and supportable forecasts of future conditions. Account balances are written off against the allowance when the Company deems the amount is uncollectible.
Inventories
Inventories are stated at the lower of cost or marketnet realizable value on a first-in first-out basis.
Abnormal amounts of idle facility expense, freight, handling costs, and wasted material (spoilage) are expensed in the period they are incurred.
The components of inventories are as follows:
| | | | | | | | | | | |
| (In thousands) | December 31,
2022 | | December 31,
2021 |
| Ingredients and packaging | $ | 35,410 | | | $ | 22,607 | |
| Finished goods | 26,133 | | | 26,988 | |
| Inventory in transit to customers | 3,863 | | | 3,218 | |
| $ | 65,406 | | | $ | 52,813 | |
|
| | | | | | | |
| (In thousands) | December 31,
2017 | | December 31, 2016 |
| | (Successor) | | (Successor) |
| Ingredients and packaging | $ | 14,826 |
| | $ | 12,712 |
|
| Finished goods | 15,471 |
| | 14,229 |
|
| Inventory in transit to customers | 4,048 |
| | 3,503 |
|
| | $ | 34,345 |
| | $ | 30,444 |
|
The Company capitalizes a portion of the interest on its term loan (see Note 9. Debt ) related to certain property and equipment during its construction period. The capitalized interest is recorded as part of the asset to which it relates and depreciated over the asset’s estimated useful life. The Company capitalized interest of $1.2 million during the year ended December 31, 2022. No interest was capitalized during the year ended December 31, 2021. Capitalized interest is included in property and equipment, net on the consolidated balance sheet.
Property and Equipment
Property and equipment acquired in the Business Combination were assigned useful lives for purposes of depreciation that the Company believes to be the useful life of such assets. Additions to property and equipment are recorded at cost and depreciated straight linestraight-line over estimated useful lives of 1015 to 50 years for buildings and land improvements and 3 to 20 years for machinery and equipment. In order to maximize the efficiency of the Company’s operations and to operate the acquired equipment, occasionally the Company will remove and relocate equipment between bakeries. Such removal and relocation costs are expensed as incurred. Reinstallation costs are capitalized if the useful life is extended or the equipment is significantly improved. Otherwise, reinstallation costs are expensed as incurred. Expenditures for repairs and maintenance are charged to expense when incurred. Expenditures for major renewals and betterments, which extend the useful lives of existing property and equipment, are capitalized and depreciated. Upon retirement or disposition of property and equipment, the capitalized cost and related accumulated depreciation are removed from the balance sheet and any resulting gain or loss is recognized in the Consolidated Statementsconsolidated statements of Operations.operations.
The Company assesses property, plant and equipment for impairment whenever events or changes in facts and circumstances indicate that the carrying amount of the asset may not be recoverable based on projected undiscounted cash flows. For the year ended December 31, 2017 (Successor),2020, the Company recorded an impairment losslosses of $1.0$2.9 million, inlocated within other operating expenses on the Sweet Baked Goods segment related to a production line that was idled whenconsolidated statements of operations. There were no impairment losses for the related production was transitioned to a third party. From January 1, 2016 through November 3, 2016 (Predecessor), the Company recorded an impairment loss of $7.3 million in the Sweet Baked Goods segment when it closed multiple production lines at the Indianapolis, Indiana bakeryyears ended December 31, 2022 and transitioned production to other facilities. The measurement of this loss was based on Level 3 inputs within the fair value measurement hierarchy.
2021.
Software Costs
Costs associated with computer software projects during the preliminary project stage are expensed as incurred. Once management authorizes and commits to funding a project, appropriate application development stage costs are capitalized. Capitalization ceases when the project is substantially complete and the software is ready for its intended use. Upgrades and enhancements to capitalized software are capitalized when such enhancements are determined to provide
HOSTESS BRANDS, INC.
NOTES TO CONSOLIDATED FINANCIAL STATEMENTS
additional functionality. Training and maintenance costs associated with software applications are expensed as incurred.
IncludedCapitalized software is included in other assets in the caption “Other assets” in the Consolidated Balance Sheets is capitalized softwareconsolidated balance sheets in the amount of approximately $7.3$21.4 million and $7.4$14.7 million, net of accumulated amortization of $22.6 million and $17.5 million at December 31, 20172022 and December 31, 2016,2021, respectively. Capitalized software costs are amortized over their estimated useful life of up to five years commencing when such assets are ready for their intended use. Software amortization expense included in general and administrative expense in the consolidated statements of operations was $2.5$4.4 million, $4.7 million and $5.3 million for the yearyears ended December 31, 2017, $1.5 million from January 1, 2016 through November 3, 2016 (Predecessor), $0.3 million from November 4, 2016 through December 31, 2016 (Successor),2022, 2021 and $1.4 million (Predecessor), for the year ended December 31, 2015.
2020, respectively.
Goodwill and Intangible Assets
AtFor the years ended December 31, 20172022 and 2016,2021, the goodwill balancesbalance of $579.4$706.6 million and $588.5 million, respectively, representrepresents the excess of the amount the SuccessorCompany paid for the Business Combinationacquisition of Hostess Holdings from the Metropoulos Entities and other former equity holders in a 2016 transaction and the acquisition of Voortman in 2020 over the fair valuevalues of the assets acquired and liabilities assumed. Goodwill that resulted from the Business CombinationThe resulting goodwill was allocated to the Sweet Baked Goods segmentSnacking reportable segment.
Goodwill by reporting unit is tested for impairment annually by either performing a qualitative evaluation or a quantitative test. The qualitative evaluation is an assessment of factors to determine whether it is more likely than not that the fair value of a reporting unit is less than its carrying amount, including goodwill. The Company may elect not to perform the qualitative assessment for some or all reporting units and the In-Store Bakery segment.perform a quantitative impairment test.
The Company’s indefinite-lived intangible assets consist of trademarks and trade names. The $1,408.8$1,538.6 million balance at both December 31, 20172022 and 2016,2021, was recognized as part of the 2016 acquisition of Hostess Holdings, the 2018 acquisition of the Cloverhill Business Combination.and the 2020 acquisition of Voortman. The trademarks and trade names are integral to the Company’s identity and are expected to contribute indefinitely to its corporate cash flows. Fair value for trademarks and tradenamestrade names was determined using the income approach, which is considered to be Level 3 within the fair value hierarchy. The application of the income approach was premised on a royalty savings method, whereby the trademark and tradenamestrade names are valued by reference to the amount of royalty income itthey could generate if it wasthey were licensed, in an arm’s‑lengtharm’s-length transaction, to a third party. These assets have been assigned an indefinite life and therefore are not amortized but rather evaluated for impairment annually.annually using the qualitative or quantitative methods, similar to goodwill. For the quantitative assessment, the valuation of trademarks and trade names are determined using the relief from royalty method. Significant assumptions used in this method include future trends in sales, a royalty rate and a discount rate to be applied to the forecasted revenue stream.
For the 2022, 2021 and 2020 annual impairment tests of goodwill and indefinite-lived intangible assets, the Company elected to perform the qualitative test. No indicators of impairment were noted.
Also, the Company has finite-lived intangible assets, that consistnet of customer relationships. The $514.2accumulated amortization, of $382.2 million and $538.1$405.8 million balances on December 31, 20172022 and 20162021 respectively, consisting of customer relationships that were recognized as part of the Business Combination.Hostess Holdings, Voortman and Cloverhill acquisitions. For customer relationships, the application of the income approach (Level 3) was premised on an excess earnings method, whereby the customer relationships are valued by the earnings expected to be generated from those customers after other capital charges. Definite-livedFinite-lived intangible assets are being amortized on a straight‑linestraight-line basis over the estimated remaining useful lives of the assets.assets, from 2 to 17 years. The weighted-average amortization period as of December 31, 2022 for customer relationships was 16.8 years.
DuringThe Company assesses finite-lived intangible assets for impairment whenever events or changes in facts and circumstances indicate that the yearcarrying amount of the asset may not be recoverable based on projected undiscounted cash flows, similar to property, plant and equipment. There were no impairment losses for the years ended December 31, 2017, the Company changed its policy2022, 2021 and will perform an impairment assessment each year as of October 1 (previously September 30).2020.
HOSTESS BRANDS, INC.
NOTES TO CONSOLIDATED FINANCIAL STATEMENTS
Reserves for Self-Insurance Benefits
The Company’s employee health plan is self-insured by the Company up to a stop-loss amount of $0.3 million for each participant per plan year. In addition, the Company maintains insurance programs covering its exposure to workers’ compensation. Such programs include the retention of certain levels of risks and costs through high deductibles and other risk retention strategies. Included in the accrued expenses in the Consolidated Balance Sheetsconsolidated balance sheets is a reserve for healthcare claims in the amount of approximately $1.1$2.6 million and $1.7$1.9 million at December 31, 20172022 and December 31, 2016,2021, respectively, and a reserve for workers’ compensation claims of $1.7$2.9 million and $1.3$3.1 million at December 31, 20172022 and 2021, respectively.
Leases
The Company recognizes a right of use asset and corresponding lease liability on the consolidated balance sheets for all lease transactions with terms of more than 12 months. Agreements are determined to contain a lease if they convey the use and control of an underlying physical asset. Based on the nature of the lease transaction, leases are either classified as financing or operating. Under both classifications, the right of use asset and liability are initially valued based on the present value of the future minimum lease payments using an effective borrowing rate at the inception of the lease. The Company determined the effective borrowing rate based on its expected incremental borrowing rate on collateralized debt. At December 31, 2016,2022, 2021 and 2020, the weighted average effective borrowing rate for outstanding operating leases was 3.7%, 3.6% and 3.6%, respectively.
Under a financing lease, interest expense related to the lease liability is recognized over the lease term using an effective interest rate method and right of use assets are amortized straight-line over the term of the lease. Under an operating lease, minimum lease payments are expensed straight-line over the lease term. Lease liabilities are amortized using an effective interest rate method and right of use assets are reduced based on the excess of the sum of the straight-line lease expense and the reduction of the lease liability over the actual lease payments. At December 31, 2022, 2021 and 2020, the weighted average remaining terms on operating leases were approximately six, seven and eight years, respectively.
Variable lease payments, such as taxes and insurance, are expensed as incurred. Expenses related to leases with original terms less than 12 months (short-term leases) are expensed as incurred. For all leases related to distribution, bakery and corporate facilities, the Company has elected not to separate non-lease components from lease components.
At December 31, 2022 and 2021, right of use assets related to operating leases are included in property and equipment, net on the consolidated balance sheets (see Note 5. Property and Equipment). Lease liabilities for operating leases are included in the current and non-current portions of long-term debt and lease obligations on the consolidated balance sheets (see Note 9. Debt).
Revenue Recognition
Net revenue consists primarily of sales of packaged food products. The Company invoicesrecognizes revenue when the performance obligations under the terms of its agreements with customers have been satisfied. The Company’s obligation is satisfied when control of the product is transferred to its customers along with the title, risk of loss and rewards of ownership. Depending on the arrangement with the customer, these criteria are met either at the time the product is shipped or when the product is received by such customer.
Customers are invoiced at the time of shipment of its product, but only recognizes revenue upon delivery to retail customers and distributors as the Company arranges freight and is generally responsible, along with the Company’s common carriers, for any damage that occurs during transportation. The Company allows retail customers and distributors to return product that is damaged or defective at the time of delivery. A provision for payment discounts and product return allowances, which is estimatedcustomer pickup based upon the Company’s historical performance, management’s experience and current economic trends, is recorded as a reduction of sales in the same period that the revenue is recognized.
The Company’s products are sold on credit terms established in accordance with industry practice, which typically requirespractice. Invoices generally require payment within 30 daysdays. As a result, revenue is not adjusted for the effects of invoice date. a significant financing component. Net revenue is recognized in an amount that reflects the consideration the Company expects to be entitled to in exchange for that product. Amounts billed to customers related to shipping and handling are classified as net revenue and accounted for as fulfillment activities, rather than separate performance obligations. The Company generally does not accept product returns and provides these allowances for anticipated expired or damaged products.
Trade promotions, consisting primarily of customer pricing allowances and merchandising funds and consumer coupons are offered through various programs to customers and consumers. Sales are recorded net ofcustomers. A provision for estimated trade promotion spending, whichpromotions is recorded as a reduction of revenue in the same period when the sale is recognized, with the liability for these allowances included within customer trade
HOSTESS BRANDS, INC.
NOTES TO CONSOLIDATED FINANCIAL STATEMENTS
allowances on the consolidated balance sheets. Differences between estimated and actual reductions to the transaction price are recognized as incurred at the time of sale.a change in estimate in a subsequent period.
The Company participates in a number of promotional activities including, but not limited to, offeringalso offers rebates for achieving various performancebased on purchase levels, offering incentives for product placement locationsproducts carried in retail stores offering pricing discounts for those customers electing to provide their own transportation for shipment of product and offering subsidies for advertising placed by customers. In lieu of accepting returns, the Company offers an allowance for anticipated expired and damaged products to certain customers.customers’ promotional activity. The ultimate cost of these programs dependsis dependent on retailervarious factors such as actual purchase volumes or promotional performance and is the subject of significant management estimates. Assumptions included in the development of these estimates are primarily based on historical performance adjusted for current trends. The Company recordsregularly reviews these assumptions and related estimates. The Company accounts for these programs as expensevariable consideration and recognizes a reduction in revenue in the estimated ultimate costsame period as the underlying program. Our recorded liability for allowances is included within customer trade allowances on the consolidated balance sheets.
For product produced by third parties, management evaluates whether the Company is the principal (i.e., report revenue on a gross basis) or agent (i.e., report revenue on a net basis). Management has determined that it is the principal in all cases, since it establishes its own pricing for such product, assumes the credit risk for amounts billed to its customers, and often takes physical control of the program at the later of the recognition of theproduct before it is shipped to customers.
HOSTESS BRANDS, INC.
NOTES TO CONSOLIDATED FINANCIAL STATEMENTS
The following tables disaggregate revenue for the underlying sale, or when the trade allowance is offered. In accordance with the authoritative guidance for revenue recognition, the cost of these programs is classified in the Consolidated Statements of Operations as a reduction of net sales. Also, in accordance with the guidance, coupon redemption costs are also recognized as reductions of net revenues when issued.by geographical market and category:
| | | | | | | | | | | | | | | | | | | |
| Year Ended December 31, 2022 |
| (In thousands) | Sweet Baked Goods | | | | Cookies | | Total |
| United States | $ | 1,210,507 | | | | | $ | 127,420 | | | $ | 1,337,927 | |
| Canada | — | | | | | 20,280 | | | 20,280 | |
| $ | 1,210,507 | | | | | $ | 147,700 | | | $ | 1,358,207 | |
| | | | | | | | | | | | | | | | | | | |
| Year Ended December 31, 2021 |
| (In thousands) | Sweet Baked Goods | | | | Cookies | | Total |
| United States | $ | 1,025,541 | | | | | $ | 98,797 | | | $ | 1,124,338 | |
| Canada | — | | | | | 17,698 | | | 17,698 | |
| $ | 1,025,541 | | | | | $ | 116,495 | | | $ | 1,142,036 | |
| | | | | | | | | | | | | | | | | | | |
| Year Ended December 31, 2020 |
| (In thousands) | Sweet Baked Goods | | | | Cookies | | Total |
| United States | $ | 920,388 | | | | | $ | 77,692 | | | $ | 998,080 | |
| Canada | — | | | | | 18,529 | | | 18,529 | |
| $ | 920,388 | | | | | $ | 96,221 | | | $ | 1,016,609 | |
The Company has one customer that accounted for 10% or more of the Company’s total net revenue. The percentage of total net revenues for this customer is presented below by segment:was 19.6%, 18.9% and 20.2% for the years ended December 31, 2022, 2021 and 2020, respectively.
|
| | | | | | | | | | | | | |
(% of Consolidated Net Revenues) | December 31,
2017 | | | From
November 4, 2016
through
December 31, 2016 | | | From January 1, 2016
through
November 3, 2016 | | Year Ended December 31, 2015 |
| | (Successor) | | | (Successor) | | | (Predecessor) | | (Predecessor) |
| Sweet Baked Goods | 19.7 | % | | | 19.3 | % | | | 21.2 | % | | 21.0 | % |
| In-Store Bakery | 0.7 | % | | | 0.7 | % | | | 0.4 | % | | 0.0 | % |
| Total | 20.4 | % | | | 20.0 | % | | | 21.6 | % | | 21.0 | % |
Advertising costs are expensed as incurred. Advertising expense included in advertising and marketing in the consolidated statements of operations was $21.3 million, $9.5 million and $6.2 million for the years ended December 31, 2022, 2021 and 2020, respectively.
Equity Compensation
The grant date fair values of stock options are valued using the Black-Scholes option-pricing model, including a simplified method to estimate the number of periods to exercise date (i.e., the expected option term). Management has determined that the equity plan has not been in place for a sufficient amount of time to estimate the post vesting exercise behavior. Therefore, it will continue to use this simplified method until such time as it has sufficient history to provide a reasonable basis to estimate the expected term. Forfeitures are recognized as a reduction of expense as incurred.
For awards whichthat have performancemarket conditions, compensationthe grant date fair value is determined using a Monte Carlo simulation model with assumptions underlying the Black-Scholes option-pricing methodology. Compensation expense is calculated based on the number of shares expected to vest after assessing the probability that the performance or market criteria will be met. The equity-basedFor market-based awards, probability is not reassessed and compensation expense net of forfeitures, is recognized using a straight-line basis over the requisite service period of the awards, which correspondsnot remeasured subsequent to the vesting periodsinitial assessment on the grant date.
HOSTESS BRANDS, INC.
NOTES TO CONSOLIDATED FINANCIAL STATEMENTS
Shares issued for option exercises, restricted stock units and other share-based awards may be either authorized but unissued shares or shares of the awards.
treasury stock.
Collective Bargaining Agreements
As of December 31, 2017,2022, approximately 26.9%44%, of thethe Company’s employees are covered by these collective bargaining agreements. None of these agreements including 18.4% subject to collective bargaining agreements which will expire before December 31, 2018.2023.
Employee Benefit Plans
The Company provides several benefit plans for employees depending upon employee eligibility. The Company has a health care plan, a defined contribution retirement plan (401(k)), company-sponsored life insurance, employee stock purchase plan and other benefit plans. The Company’sFor the defined contribution retirement plan, the Company matches a percentage of employee contributions up to a specified amount. For the years ended December 31, 2022, 2021 and 2020, contributions to the defined contribution retirement plan were $1.1$3.0 million, for the year ended December 31, 2017, compared to no contributions for the period from November 4, 2016 through December 31, 2016 (Successor), $1.1$2.4 million for the period from January 1, 2016 through November 3, 2016 (Predecessor), and $1.0$2.0 million, of contributions for the year ended December 31, 2015.
respectively.
The Company offers an annual incentive plan based upon annual operating targets. Final payout is approved by the boardBoard of directors. The Company has accrued $4.3 million and $6.0 million at December 31, 2017 (Successor) and December 31, 2016 (Successor), respectively.
The Company has also hasDirectors or a long-term incentive plan for certain director-level employees, payment under which is contingent on changes in certain ownership levels. Amounts paid in the Predecessor period from January 1, 2016 through November 3, 2016 and the year ended December 31, 2015 are reported as special employee incentive compensation in the consolidated statement of operations. The total that could be payable due to any future qualifying changes in ownership levels under the plan is $0.6 million ascommittee thereof. As of December 31, 2017. In accordance with U.S. GAAP, the Company does not carry an accrual2022 and 2021 there was $29.0 million and $21.2 million accrued for the long-term incentive plan.
this plan, respectively.
Income Taxes
As a resultThe Company is subject to U.S. federal, state and local income taxes as well as Canadian income tax on certain subsidiaries.
Prior to the final exchange of Class B Units, the Business Combination, Hostess Brands, Inc. acquiredCompany owned a controlling interest in Hostess Holdings, which iswas treated as a partnership for U.S. federal and most applicable state and local income tax purposes. As a partnership, Hostess Holdings iswas not directly subject to U.S. federal and certain state and local income taxes. Any taxable income or loss generated by Hostess Holdings iswas passed through to and included in the taxable income or loss of its partners, including the Company following the Business Combination. The Company is subject to U.S. federal income taxes, in addition to state and local income taxes with respect to its allocable share of any taxable income of Hostess Holdings following the Business Combination.
On December 22, 2017, the President of the United States signed into law the Tax Cuts and Jobs Act (“Tax Reform”). The SEC staff issued Staff Accounting Bulletin No. 119 (“SAB 118”) to address the application of U.S. GAAP in situations when a registrant does not have the necessary information available to complete the accounting for Tax Reform. The Company has recognized the provisional tax impacts related to the revaluation of deferred tax assets and liabilities. Further information on the tax impacts of Tax Reform is included in Note 13 of the Company’s consolidated financial statements.
Derivatives
In April 2017, the Company entered into an interest rate swap contract to mitigate its exposure to changes in the variable interest rate on its long-term debt. This contract was designated as a cash flow hedge. Changes in the fair value of this instrument are recognized in accumulated other comprehensive income in the consolidated balance sheets and reclassified into earnings in the period in which the hedged transaction affects earnings. Hedging ineffectiveness, if any, is recognized as a component of interest expense in the consolidated statements of operations. Payments made under this contract are included in the supplemental disclosure of interest in the consolidated statement of cash flows.
Fair Value Measurements
The Company utilizes valuation techniques that maximize the use of observable inputs and minimize the use of unobservable inputs to the best extent possible. The Company determines fair value based on assumptions that market participants would use in pricing an asset or liability in the principal or most advantageous market. When considering market participant assumptions in fair value measurements, the following fair value hierarchy distinguishes between observable and unobservable inputs, which are categorized in one of the following levels:
•Level 1 inputs: Unadjusted quoted prices in active markets for identical assets or liabilities accessible to the reporting entity at the measurement date
•Level 2 inputs: Other than quoted prices included in Level 1 inputs that are observable for the asset or liability, either directly or indirectly, for substantially the full term of the asset or liability
•Level 3 inputs: Unobservable inputs for the asset or liability used to measure fair value to the extent that observable inputs are not available, thereby allowing for situations in which there is little, if any, market activity for the asset or liability at measurement date
Fair Value of Financial Instruments
The Company estimates that the carrying amount of its long-term debt reasonably approximates fair value. At December 31, 2017 and December 31, 2016, the approximate fair value of the Company’s debt was $998.7 million and $1,005.5 million, respectively. The fair value is calculated using current interest rates and pricing from financial institutions (Level 2 inputs).
New Accounting Pronouncements
In August 2017, the FASB issued Accounting Standards Update No. 2017-12 (“ASU 2017-12”), Derivatives and Hedging: Targeted Improvements to Accounting for Hedging Activities, which improves the financial reporting of hedging relationships to better portray the economic results of an entity's risk management activities in its financial statements and make certain targeted improvements to simplify the application of the hedge accounting guidance in current U.S. GAAP. The amendments in this update better align an entity's risk management activities and financial reporting for hedging relationships through changes to both the designation and measurement guidance for qualifying hedging relationships and presentation of hedge results. The effective date for the standard is for fiscal years beginning after December 15, 2018. The Company plans to early adopt this standard in the first quarter of 2018 and does not expect the adoption of this standard to have a material impact on its consolidated financial position, results of operations or cash flows.
In May 2017, the FASB issued Accounting Standards Update No. 2017-9 (“ASU 2017-9”), Compensation - Stock Compensation (Topic 718): Scope of Modification Accounting, which provides guidance about what changes to the terms or conditions of a share-based payment award require an entity to apply modification accounting in Topic 718. Per ASU 2017-9, an entity should account for the effects of a modification unless all the following are met: (1) the fair value (or calculated value or intrinsic value, if such an alternative measurement method is used) of the modified award is the same as the fair value (or calculated value or intrinsic value, if such an alternative measurement method is used) of the original award immediately before the original award is modified. If the modification does not affect any of the inputs to the valuation technique that the entity uses to value the award, the entity is not required to estimate the value immediately before and after the modification, (2) the vesting conditions of the modified award are the same as the vesting conditions of the original award immediately before the original award is modified, and (3) the classification of the modified award as an equity instrument or a liability instrument is the same as the classification of the original award immediately before the original award is modified. The current disclosure requirements in Topic 718 apply regardless of whether an entity is required to apply modification accounting under the amendments in ASU 2017-9. The Company early adopted ASU 2017-9 during the year ended December 31, 2017. The adoption of this standard did not have a material impact on the Company’s consolidated financial position, results of operations, or cash flows.
In January 2017, the FASB issued Accounting Standards Update No. 2017-4 (“ASU 2017-4”), Intangibles—Goodwill and Other (Topic 350): Simplifying the Test for Goodwill Impairment. ASU 2017-4 eliminates Step 2 from the goodwill impairment test. Step 2 required an entity to determine the fair value at the impairment testing date of its assets and liabilities following the procedure that would be required in a business combination. Instead, an entity should perform its goodwill impairment test and recognize an impairment charge by comparing the fair value of a reporting unit with its carrying amount. ASU 2017-4 will become effective for fiscal years beginning after December 15, 2019, including interim periods within those fiscal years. Early adoption is permitted. The Company early adopted ASU 2017-4 during the year ended December 31, 2017, the adoption did not have a material impact on the company’s consolidated financial position, results of operations or cash flows. The company’s goodwill impairment tests have not proceeded to Step 2 at any testing date.
In February 2016, the FASB issued ASU No. 2016-02, Leases (“ASU 2016-02”), which is intended to improve financial reporting about leasing transactions. This standard requires a lessee to record on the balance sheet the assets and liabilities for the rights and obligations created by lease terms of more than 12 months. This standard will be effective for fiscal years beginning after December 15, 2018, including interim periods within those fiscal years, and early adoption is permitted. The Company is currently evaluating the impact the adoption of ASU 2016-02 will have on its consolidated financial position, results of operations or cash flows.
In May 2014, the FASB issued ASU No. 2014-09, Revenue from Contracts with Customers (Topic 606), (“ASU 2014-09”), which requires an entity to recognize the amount of revenue to which it expects to be entitled for the transfer of promised goods or services to customers. The ASU will replace most existing revenue recognition guidance in U.S. GAAP when it becomes effective. The new standard is effective for the Company on January 1, 2018.
The Company plans to adopt the standard in the first quarter of 2018 retrospectively with the cumulative effect of initial application reported as of January 1, 2018. The Company is utilizing a comprehensive approach when reviewing its current accounting policies to identify potential differences that would result from applying the new requirements to its customer contracts. The approach includes the evaluation of sales terms, performance obligations, variable consideration, and costs to obtain and fulfill contracts. The Company has made significant progress on its process review. Based on the Company’s review, management does not currently expect the initial application of this guidance to have a material impact on its consolidated financial statements.
2. Business Combination
The following summarizes the fair value of the Business Combination:
|
| | | |
| (In thousands) | |
| Cash paid | $ | 479,761 |
|
| Equity consideration paid (1) | 239,323 |
|
| Tax receivable arrangement payable | 161,681 |
|
| Total consideration | 880,765 |
|
| Hostess Holdings debt assumed by Gores Holdings, Inc | 1,228,254 |
|
| Noncontrolling interest (2) | 326,601 |
|
| Fair value of the Business Combination | $ | 2,435,620 |
|
(1) Equity consideration paid to the Legacy Hostess Equityholders is summarized below:
|
| | | | |
| (In thousands, except share data) | | |
| Class A common shares of the Company subject to six month sales restriction | | 22,098,139 |
|
| Fair value per share | | $ | 10.83 |
|
| | | $ | 239,323 |
|
(2) The class B units in Hostess Holdings, LP, which are not owned by the Company, represent the noncontrolling interest as provided below:
|
| | | | |
| (In thousands except share data) | | |
| Class B units of Hostess Holdings, LP subject to six month sales restriction | | 24,424,259 |
|
| Fair value per unit | | $ | 10.83 |
|
| | $ | 264,515 |
|
|
| | | | |
| (In thousands except share data) | | |
| Class B units of Hostess Holdings, LP not subject to sales restrictions | | 5,446,429 |
|
| Fair value per unit | | $ | 11.40 |
|
| | $ | 62,086 |
|
The fair value of these units was determined as follows:
|
| | | | |
| Per share price based on average market price on the day of the Business Combination | | $ | 11.40 |
|
| Discount for lack of marketability | | 5.0 | % |
| | | $ | 10.83 |
|
The 5% discount for lack of marketability was determined by using an option pricing method (Finnerty Protective Put Model) to reflect a six month sales restriction.
The Company recorded an allocation of the purchase price to Predecessor’s tangible and identified intangible assets acquired and liabilities assumed, excluding long-term debt, based on their fair values as of the closing date. The purchase price allocation is as follows:
|
| | | | |
(In thousands) | | |
Cash | | $ | 58,519 |
|
Accounts receivable | | 58,474 |
|
Inventories | | 39,338 |
|
Prepaids and other assets | | 2,998 |
|
Property and equipment | | 155,076 |
|
Accounts payable and accrued expenses | | (56,559 | ) |
Deferred tax liabilities | | (352,531 | ) |
Trade name and trademarks | | 1,408,848 |
|
Customer relationships | | 542,011 |
|
Goodwill | | 579,446 |
|
Total assets acquired and liabilities assumed |
| $ | 2,435,620 |
|
Goodwill is attributed to intangible assets which do not qualify for separate recognition, and is partially deductible for income tax purposes.
From January 1, 2016 through November 3, 2016 (the Predecessor) approximately $31.3 million of expenses were incurred directly related to the Business Combination. From January 1, 2016 through the date of its last filing for the nine month period ending September 30, 2016, Gores Holdings incurred $4.0 million of transaction related expenses. From October 1, 2016 through the Closing Date, Gores Holdingsincurred $6.7 million of expenses related to the Business Combination. On the Closing Date, the Company paid $13.1 million of deferred underwriting costs related to Gores Holdings’initial public offering and repaid a working capital loan of $0.2 million.
During the measurement period which started on the Closing Date and ended on November 3, 2017, the Company revised its preliminary estimate of the future cash tax savings under the tax receivable agreement. This resulted in an $8.1 million decrease in goodwill, a decrease to the tax receivable agreement liability of $3.0 million, a $5.5 million decrease to deferred tax liabilities, and an increase to accrued expenses and other liabilities of $0.4 million. The Company also revised its estimate of deferred tax liabilities which decreased both deferred tax liabilities and goodwill by $0.9 million. As of November 3, 2017, the allocation of the purchase price for the Business Combination is final.
The following unaudited pro forma combined financial information presents the Company’s results as though the Business Combination had occurred at January 1, 2016. The unaudited pro forma consolidated financial information has been prepared using the acquisition method of accounting in accordance with U.S. GAAP:
|
| | | | |
| | | Year Ended December 31, 2016 |
| (In thousands) | | (Pro Forma) |
| | | (Unaudited) |
| Net Revenue | | $ | 727,586 |
|
| Net Income | | 82,442 |
|
On May 10, 2016, the Predecessor purchased the stock of Superior for $51.1 million, $49.7 million net of cash acquired. Superior is located in Southbridge, Massachusetts and manufactures eclairs, madeleines, brownies, and iced cookies. The Predecessor acquired Superior to expand its market and product offerings in the In-Store Bakery section of grocery and club retailers. The Company expects to realize synergies and cost savings related to this acquisition as a result of purchasing and procurement economies of scale and general and administrative expense savings, particularly with respect to the consolidation of corporate related functions and elimination of redundancies.
The acquisition of Superior was treated as a purchase in accordance with ASC 805, Business Combinations, which requires allocation of the purchase price to the estimated fair values of assets and liabilities acquired in the transaction. The allocation of purchase price is considered final. The following is a summary of the allocation of the purchase price:
|
| | | | |
| (In thousands) | | |
| Cash | | $ | 1,009 |
|
| Accounts receivable | | 2,122 |
|
| Inventories | | 2,300 |
|
| Prepaids and other current assets | | 112 |
|
| Property and equipment (1) | | 7,075 |
|
| Intangible assets (2) | | 29,370 |
|
| Goodwill (3) | | 24,227 |
|
| Accounts payable | | (2,920 | ) |
| Accrued expenses | | (552 | ) |
| Capital lease obligation | | (799 | ) |
| Deferred tax liability | | (10,844 | ) |
| Total assets acquired and liabilities assumed | | $ | 51,100 |
|
| |
(1) | Amounts recorded for property and equipment includes land, building, plant machinery and equipment. |
| |
(2) | Amounts recorded for intangible assets includes customer relationships, trade names and trademarks. |
| |
(3) | Amounts recorded for goodwill are generally not expected to be deductible for tax purposes. |
The fair value measurement of tangible and intangible assets and liabilities was based on significant inputs not observable in the market and thus represent Level 3 measurements within the fair value measurement hierarchy. Level 3 fair market values were determined using a variety of information, including estimated future cash flows, appraisals, and market comparables.
From January 1, 2016 through November 3, 2016, the Predecessor incurred acquisition‑related costs for Superior of approximately $0.6 million. For the period from January 1, 2016 through November 3, 2016 (Predecessor) net revenue and net income for Superior was $19.9 million and $0.7 million, respectively. For the period from November 4, 2016 through December 31, 2016 (Successor), net revenue and net loss for Superior was $6.8 million, and $0.1 million, respectively.
The acquisition of Superior was deemed not material to the Company under Item 3-05 of Regulation S-X, and, therefore, separate financial statements are not required because Superior does not meet the definition of a “significant subsidiary”.
3. Stock-Based Compensation
Hostess Brands, Inc. 2016 Equity Incentive Plan (Successor)
The Hostess Brands, Inc. 2016 Equity Incentive Plan (the “2016 Plan”) provides for the granting of various equity-based incentive awards to directors of the Company, certain members of Company management, and service providers to the Company. The types of equity-based awards that may be granted under the 2016 Plan include: stock options, stock appreciation rights (SARs), restricted stock, restricted stock units (RSUs), and other stock-based awards. There are 7,150,000 registered shares of Class A common stock reserved for issuance under the 2016 Plan. All awards issued under the 2016 Plan may only be settled in shares of Class A common stock. As of December 31, 2017, 5,188,682 shares were available for issuance under the 2016 Plan.
Equity-based compensation expense totaled approximately $7.4 million for the Successor year ended December 31, 2017. There was no equity-based compensation expense for either the Successor or Predecessor periods in 2016 related to the 2016 Plan.
Restricted Stock Units (“RSUs”)
The fair value of RSU awards is calculated based on the closing market price of the Company’s Class A Common Stock on the date of grant. Compensation expense is recognized straight-line over the requisite service period of the awards, ranging from one to three years.
The vesting of certain RSU awards is contingent upon the Company attaining positive earnings per share for the fiscal year ending immediately prior to the vesting date. Management has determined it is probable that these performance conditions will be met.
For certain RSU awards, a portion of the granted units are banked at each annual performance period if the Company achieves certain EBITDA targets. Banked shares continue to be subject to the requisite service period under the terms of the awards. Depending on actual performance during each of the three annual performance periods, award recipients have the opportunity to receive up to 225% of the granted units.
Upon an employee’s termination, all unvested awards will be forfeited and the shares of common stock underlying such award will become available for issuance under the 2016 Plan.
The following table summarizes the activity of the Company’s unvested RSUs for the successor year ended December 31, 2017:
|
| | | | | | |
| | Restricted Stock
Units | | Weighted Average
Grant Date
Fair Value |
| Unvested units as of December 31, 2016 (Successor) | — |
| | $ | — |
|
| Total Granted | 1,448,736 |
| | 15.73 |
|
| Forfeited | (390,038 | ) | | 15.78 |
|
Vested(1) | (142,804 | ) | | 15.55 |
|
| Unvested as of December 31, 2017 (Successor) | 915,894 |
| | $ | 15.73 |
|
(1)Includes 40,223 shares withheld to satisfy $0.4 million employee tax obligations upon vesting.
As of December 31, 2017, there was $6.5 million of total unrecognized compensation cost related to non-vested RSUs granted under the 2016 Plan that are considered probable to vest; that cost is expected to be recognized over a weighted average remaining period of approximately 2.00 years. As of December 31, 2017, the grant date fair value of awards for which no compensation is recognized because it is not probable that the performance conditions will be met is $4.8 million.
For the year ended December 31, 2017 (Successor), $5.4 million of compensation expense related to the RSUs was recognized within general and administrative expenses on the consolidated statement of operations.
Restricted Stock Awards (“RSAs”)
On March 23, 2017, the Company granted 435,000 shares of restricted stock to the Company’s Chief Executive Officer under the 2016 Plan. The fair value of the RSAs is calculated based on the closing market price of the Company’s Class A common stock on the grant date. On October 12, 2017, with the announcement of the Company’s Chief Executive Officer’s retirement, the grant was modified so that the 435,000 unvested shares were forfeited and 75,000 replacement shares would vest on January 1, 2018, provided there was positive earnings per share for the year ended December 31, 2017.
If the vesting requirements of a restricted stock award are not satisfied, or the performance conditions are not attained, the award will be forfeited and the shares of Class A common stock subject to the award shall be returned to the Company.
As of December 31, 2017, there was no unrecognized compensation cost related to the non-vested restricted stock. For the year ended December 31, 2017 (Successor), the Company recognized expense of $1.0 million related to the restricted stock awards within general and administrative expenses on the consolidated statement of operations.
The following table summarizes the activity of the Company’s restricted stock awards for the year ended December 31, 2017:
|
| | | | | | | |
|
| Shares of
Restricted Stock | | Weighted Average
Grant Date Fair Value |
| Unvested units as of December 31, 2016 (Successor) |
| — |
| | — |
|
| Granted |
| 510,000 |
| | $ | 15.73 |
|
| Forfeited |
| (435,000 | ) | | 15.78 |
|
| Vested |
| — |
| | — |
|
| Unvested as of December 31, 2017 (Successor) |
| 75,000 |
| | $ | 13.43 |
|
Stock Options
During the year ended December 31, 2017, the Company granted 1,202,613 stock options to certain members of management under the Plan. The weighted average grant date fair value was estimated using the Black-Scholes option-pricing model (level 3) with the following assumptions:
|
| |
| Year
Ended
December 31, 2017
|
Expected volatility (1)
| 0.2746% |
Expected dividend yield (2)
| —% |
Expected option term (3)
| 6.24 years |
Risk-free rate (4)
| 2.09% |
| |
(1) | The expected volatility assumption was calculated based on a peer group analysis of stock price volatility with a look back period based on the expected term and ending on the grant date. |
| |
(2) | As of December 31, 2017, the Company has not paid any dividends on our common stock. As of the stock option grant date, the Company does not anticipate paying any dividends on common stock over the term of the stock options. Option holders have no right to dividends prior to the exercise of the options. |
| |
(3) | The Company utilized the simplified method to determine the expected term of the stock options since the Company does not have sufficient historical exercise data to provide a reasonable basis upon which to estimate expected term. |
| |
(4) | The risk-free interest rate was based on the U.S. Treasury yield curve in effect at the time of grant which corresponds to the expected term of the stock options. |
The stock options vest in four equal annual installments on varying dates through December 2021. The maximum term under the grant agreement is ten years. As of December 31, 2017, there was $3.1 million of total unrecognized compensation cost related to non-vested stock options outstanding under the 2016 Plan; that cost is expected to be recognized over the vesting periods. For the year ended December 31, 2017 (Successor), there was $1.0 million of expense related to the stock options recognized within general and administrative costs on the consolidated statement of operations.
The following table summarizes the activity of the Company’s unvested stock options for the year ended December 31, 2017 (Successor):
|
| | | | | | | | | | | | | |
| Number
of
Options | | Weighted Average
Remaining
Contractual Life
(years) | | Weighted
Average
Exercise Price | | Weighted
Average Grant
Date Fair Value |
| Outstanding as of December 31, 2016 (Successor) | — |
| | — |
| | $ | — |
| | $ | — |
|
| Granted | 1,202,613 |
| | 5.52 |
| | 15.75 |
| | 4.99 |
|
| Exercised | — |
| | — |
| | — |
| | — |
|
| Forfeited | (374,993 | ) | | 5.47 |
| | 15.78 |
| | 5.04 |
|
| Outstanding as of December 31, 2017 (Successor) | 827,620 |
| | 5.54 |
| | $ | 15.74 |
| | $ | 4.97 |
|
| Exercisable as of December 31, 2017 (Successor) | 241.931 |
| | 5.47 |
| | 15.78 |
| | 5.04 |
|
Related Party Stock Awards
See note 15 for information regarding additional equity awards not issued under the 2016 or 2013 Plans.
Hostess Management, LLC Equity Interest Plan (Predecessor)
The Company established a profits interest plan under the 2013 Hostess Management, LLC (“Hostess Management”) Equity Incentive Plan (“2013 Plan”) to allow members of the management team to participate in the success of the Company. The 2013 Plan consisted of an approximate 9% ownership interest in the Company’s subsidiary, New Hostess Holdco, LLC. Hostess Management had three classes of units and required certain returns to ranking classes before other classes participated in subsequent returns of Hostess Management.
The Company recognized unit-based compensation expense of $3.9 million from January 1, 2016 through November 3, 2016, including $3.2 million of expense due to a grant agreement provision which caused the accelerated vesting of units granted prior to January 1, 2016 upon consummation of the Business Combination and the accelerated vesting of units granted in 2016 based on the approval of the board of directors, and $1.4 million for the year ended December 31, 2015, (Predecessor), within general and administrative expense on the consolidated statement of operations. All outstanding units under the 2013 Plan were redeemed and the 2013 Plan was terminated on November 4, 2016.
4. Property and Equipment
Property and equipment consists of the following:
|
| | | | | | | | |
| (In thousands) | December 31, 2017 | | | December 31, 2016 |
| | (Successor) | | | (Successor) |
| Land and buildings | $ | 32,088 |
| | | $ | 30,275 |
|
| Machinery and equipment | 141,995 |
| | | 112,221 |
|
| Construction in progress | 13,489 |
| | | 12,334 |
|
| | 187,572 |
| | | 154,830 |
|
| Less accumulated depreciation | (13,451 | ) | | | (1,606 | ) |
| | $ | 174,121 |
| | | $ | 153,224 |
|
Depreciation expense was $11.8 million for the year ended December 31, 2017 (Successor), and was $1.6 million (Successor) and $7.6 million (Predecessor) for the year ended December 31, 2016 (Predecessor), respectively.
5. Segment Reporting
The Company has two reportable segments: Sweet Baked Goods and In-Store Bakery. Previously, the Company’s reportable segments were Sweet Baked Goods and Other, which included In-Store Bakery, Hostess® branded bread and buns and frozen retail. A change in the Company’s internal reporting structure during the fourth quarter of 2017 caused the Company to reassess its reportable segments. The Company’s Sweet Baked Goods segment consists of fresh and frozen baked goods and bread products that are sold under the Hostess® and Dolly Madison® brands. The In-Store Bakery segment consists of Superior and Hostess branded products sold through the in-store bakery section of grocery and club stores.
The Company evaluates performance and allocates resources based on net revenue and gross profit. Information regarding the operations of these reportable segments is as follows:
|
| | | | | | | | | | | | | | | | |
| (In thousands) | Year Ended
December 31,
2017 | | From November 4 through December 31, 2016 | | | From January 1 through November 3, 2016 | | Year Ended
December 31,
2015 |
| | (Successor) | | (Successor) | | | (Predecessor) | | (Predecessor) |
| Net revenue: |
|
| |
|
| | | | |
|
|
| Sweet Baked Goods | $ | 733,827 |
| | $ | 105,211 |
| | | $ | 595,645 |
| | $ | 620,815 |
|
| In-Store Bakery | 42,361 |
| | 6,787 |
| | | 19,943 |
| | — |
|
| Net revenue | $ | 776,188 |
| | $ | 111,998 |
| | | $ | 615,588 |
| | $ | 620,815 |
|
| | | | | | | | | |
| Depreciation and amortization (2): | | | | | | | | |
| Sweet Baked Goods | $ | 35,441 |
| | $ | 5,245 |
| | | $ | 9,221 |
| | $ | 9,836 |
|
| In-Store Bakery | 2,729 |
| | 598 |
| | | 1,044 |
| | — |
|
| Depreciation and amortization | $ | 38,170 |
| | $ | 5,843 |
| | | $ | 10,265 |
| | $ | 9,836 |
|
| | | | | | | | | |
| Gross profit: | | | | | | | | |
| Sweet Baked Goods | $ | 316,916 |
| | $ | 37,387 |
| | | $ | 262,930 |
| | $ | 262,203 |
|
| In-Store Bakery | 9,982 |
| | 1,327 |
| | | 3,599 |
| | — |
|
| Gross profit | $ | 326,898 |
| | $ | 38,714 |
| | | $ | 266,529 |
| | $ | 262,203 |
|
| | | | | | | | | |
| Capital expenditures (1): | | | | | | | | |
| Sweet Baked Goods | $ | 35,609 |
| | $ | 7,544 |
| | | $ | 31,254 |
| | $ | 27,252 |
|
| In-Store Bakery | 774 |
| | 83 |
| | | 223 |
| | — |
|
| Capital expenditures | $ | 36,383 |
| | $ | 7,627 |
| | | $ | 31,477 |
| | $ | 27,252 |
|
| |
(1) | Capital expenditures consists of purchases of property and equipment and acquisition and development of software assets paid in cash or acquired through accounts payable during the year ended December 31, 2017 (Successor), from November 4, 2016 through December 31, 2016 (Successor), from January 1 through November 3, 2016 (Predecessor) and the year ended December 31, 2016 (Predecessor). |
| |
(2) | Depreciation and amortization include charges to net income classified as costs of goods sold and general and administrative expenses on the consolidated statement of operations. |
Total assets by reportable segment are as follows:
|
| | | | | | | | |
| (In thousands) | December 31,
2017 | | | December 31,
2016 |
| (Successor) | | | (Successor) |
| Total segment assets: |
|
| | |
|
|
| Sweet Baked Goods | $ | 2,884,642 |
| | | $ | 2,754,514 |
|
| In-Store Bakery | 81,633 |
| | | 93,378 |
|
| Total segment assets | $ | 2,966,275 |
| | | $ | 2,847,892 |
|
6. Goodwill and Intangible Assets
Goodwill and intangible assets as of December 31, 2017 and December 31, 2016 were recognized as part of the purchase price allocation of the Business Combination as of the Closing Date. During the year ended December 31, 2017, the purchase price allocation for the Business Combination was adjusted, resulting in a $9.0 million decrease to goodwill as of December 31, 2017, the purchase price allocation for the business combination is considered final.
Activity of goodwill is presented below by reportable segment:
|
| | | | | | | | | | | |
| (In thousands) | Sweet Baked Goods | | In-Store Bakery | | Total |
| Balance as of December 31, 2015 | $ | 56,992 |
| | $ | — |
| | $ | 56,992 |
|
| Acquisition of Superior | — |
| | 24,227 |
| | 24,227 |
|
| Elimination of Predecessor goodwill | (56,992 | ) | | (24,227 | ) | | (81,219 | ) |
| Business combination | 542,410 |
| | 46,050 |
| | 588,460 |
|
| Balance as of December 31, 2016 (Successor) | 542,410 |
| | 46,050 |
| | 588,460 |
|
| Measurement period adjustments | (12,987 | ) | | 3,973 |
| | (9,014 | ) |
| Balance as of December 31, 2017 (Successor) | $ | 529,423 |
| | $ | 50,023 |
| | $ | 579,446 |
|
Intangible assets consist of the following:
|
| | | | | | | |
| (In thousands) | December 31, 2017 | | December 31, 2016 |
| | (Successor) | | (Successor) |
| Intangible assets with indefinite lives (trademarks and tradenames) | $ | 1,408,848 |
| | $ | 1,408,848 |
|
| Intangible assets with definite lives (customer relationships) | 542,011 |
| | 542,011 |
|
| Less accumulated amortization (customer relationships) | (27,771 | ) | | (3,916 | ) |
| Intangible assets, net | $ | 1,923,088 |
| | $ | 1,946,943 |
|
Amortization expense was $23.9 million for the year ended December 31, 2017, and $3.9 million (Successor) and $1.2 million (Predecessor) for the periods from November 4, 2016 through December 31, 2016 and from January 1, 2016 through November 3, 2016, respectively, and $0.9 million (Predecessor) for the year ended December 31, 2015. The unamortized portion of customer relationships will be expensed over their remaining useful life, from18 to 23 years. The weighted-average amortization period as of December 31, 2017 for customer relationships was 21.5 years. Future expected amortization expense is as follows:
|
| | | |
| (In thousands) | |
| 2018 | $ | 23,977 |
|
| 2019 | 23,977 |
|
| 2020 | 23,977 |
|
| 2021 | 23,977 |
|
| 2022 | 23,977 |
|
| 2023 and thereafter | 394,355 |
|
7. Accrued Expenses
Included in accrued expenses are the following:
|
| | | | | | | | |
| (In thousands) | December 31, 2017 |
|
| December 31, 2016 |
| | (Successor) | | | (Successor) |
| Annual incentive compensation | $ | 4,259 |
| | | $ | 5,997 |
|
| Payroll, vacation and other compensation | 4,342 |
| | | 5,121 |
|
| Self-insurance reserves | 1,192 |
| | | 2,091 |
|
| Accrued interest | 338 |
| | | 4,885 |
|
| Current income taxes payable | 99 |
| | | 2 |
|
| Workers compensation reserve | 1,650 |
| | | 1,321 |
|
| Litigation | — |
| | | 1,100 |
|
| Other | — |
| | | 1,139 |
|
| | $ | 11,880 |
| | | $ | 21,656 |
|
8.Tax Receivable Agreement
The tax receivable agreement was entered into by the Company in connection with the Business Combination (the “Tax Receivable Agreement”) and generally provides for the payment by the Company to the Legacy Hostess Equityholders of 85% of the net cash savings, if any, in U.S. federal, state and local income taxes that the Company realizes (or is deemed to realize in certain circumstances) in periods after the closing of the Business Combination (which periods may extend, unless the Tax Receivable Agreement is terminated early in accordance with its terms, for more than 15 years following any exchange of Class B Units of Hostess Holdings for shares of the Company’s Class A common stock or the cash equivalent thereof) as a result of (i) certain increases in tax basis resulting from the Business Combination; (ii) certain tax attributes of Hostess Holdings and its subsidiaries existing prior to the Business Combination and prior to subsequent exchanges of Class B Units; (iii) certain increases in tax basis resulting from exchanges of Class B Units; (iv) imputed interest deemed to be paid by the Company as a result of payments it makes under the Tax Receivable Agreement; and (v) certain increases in tax basis resulting from payments the Company makes under the Tax Receivable Agreement. The Company will retain the benefit of the remaining 15% of these cash savings. Certain payments under the Tax Receivable Agreement will be made to Legacy Hostess Equityholders in accordance with specified percentages, regardless of the source of the applicable tax attribute. Significant inputs used to estimate the future expected payments include a cash tax savings expressed as a rate of approximately 27.5%.
The following table summarizes activity related to the tax receivable agreement for the year ended December 31, 2017:
|
| | | | |
| (In thousands) | | |
| Balance December 31, 2016 (Successor) | | $ | 165,384 |
|
| Measurement period adjustments | | (3,017 | ) |
| Exchanges of Class B units for Class A shares | | 12,215 |
|
| Remeasurement due to change in state tax rate | | 1,589 |
|
| Remeasurement due to Tax Cuts and Jobs Act | | (51,811 | ) |
| Balance December 31, 2017 (Successor) | | $ | 124,360 |
|
During the year ended December 31, 2017, the Company remeasured the Tax Receivable Agreement due to changes in federal and state law. The Company remeasured the Tax Receivable Agreement due to a change in state tax rate that resulted in approximately $1.6 million of expense on the consolidated statement of operations. The Company remeasured the Tax Receivable Agreement due to the Tax Reform. Tax Reform decreased the Company’s estimated cash tax savings rate from approximately 37.4% to 27.5%, primarily due to a permanent Federal tax rate reduction. This resulted in $51.8 million of benefit on the consolidated statement of operations which was reported as a component of operating income.
As of December 31, 2017 the future expected payments under the Tax Receivable Agreement are as follows:
|
| | | |
| (In thousands) | |
| 2018 | $ | 14,200 |
|
| 2019 | 7,600 |
|
| 2020 | 7,400 |
|
| 2021 | 7,200 |
|
| 2022 | 7,200 |
|
| Thereafter | 80,760 |
|
9.Debt
A term loan was originated on November 20, 2017 through the Company’s subsidiary, Hostess Brands, LLC (referred to below as the Third New First Lien Term Loan). It requires quarterly payments of interest at a rate of the greater of the applicable LIBOR or 0.75% per annum (“New LIBOR Floor”) plus a margin of 2.25% per annum and principal at a rate of 0.25% of the aggregate principal balance with the remaining principal amount due upon maturity on August 3, 2022. The Third New First Lien Term Loan is secured by substantially all of Hostess Brands, LLC’s present and future assets. The interest rate charged to the Company on the Third New First Lien Term Loan from its origination through December 31, 2017 was 3.57%.
The Third New First Lien Term Loan refinanced the remaining balance of $993.8 million on the Second New First Lien Term Loan through a non-cash refinancing transaction. The Second New First Lien Term Loan was originated by Hostess Brands, LLC on May 19, 2017 and required quarterly payments of interest at a rate equal to the the New Libor Floor plus a margin of 2.50% per annum and principal at a rate of 0.25% of the aggregate principal balance with the remaining principal amount due upon maturity on August 3, 2022. The Second New First Lien Term Loan was secured by substantially all of Hostess Brands’ present and future assets. The interest rate charged to the company on the Second New First Lien Term loan from its origination to refinancing was 3.67%.
The Second New First Lien Term Loan refinanced the remaining balance of $996.3 million on the New First Lien Term Loan through a non-cash refinancing transaction. The New First Lien Term Loan was originated by Hostess Brands, LLC on November 18, 2016 and required quarterly payments of interest at a rate of the greater of the applicable LIBOR or 1% per annum (“LIBOR Floor”) plus a margin of 3.0% per annum and principal at a rate of 0.25% of the aggregate principal balance with the remaining principal amount due upon maturity on August 3, 2022. The New First Lien Term Loan was secured by substantially all of Hostess Brands’ present and future assets. The interest rate charged to the company on the New First Lien Term loan from January 1, 2017 through refinancing was 4.00%.
The New First Lien Term Loan refinanced the remaining balance on the First and Second Lien Term Loans (referred to below as the Former First Lien Term Loan and Former Second Lien Term Loan, respectively) previously incurred by Hostess Brands, LLC of $915.7 million and $83.0 million, respectively, through a non-cash refinancing transaction in November of 2016. The Company expensed prepayment penalties of $3.0 million as part of the deleverage and refinancing, in accordance with the contractual terms of Former First and Second Lien Term loans.
Prior to its refinancing, required quarterly payments on the Former First Lien Term Loan included interest at a rate of the greater of the LIBOR Floor plus an applicable margin of 3.50% per annum or the base rate plus an applicable margin of 2.25% or 2.50% per annum, based on the net first lien leverage ratio, and principal at a rate of 0.25% of the aggregate principal amount through August 3, 2022, at which time all remaining principal was due.
In connection with the Business Combination, the Company recognized $8.9 million of premiums for the Former First and Former Second Lien Term Loans. Lender debt discount costs, premium, and deferred financing costs are presented net of the long-term debt balance on the Consolidated Balance Sheets and will be amortized to interest expense utilizing the effective interest method over the term of the debt. Portions of the lender debt discount costs, premium, and deferred financing costs have been adjusted through the recognition of gains or losses on the statement of operations along with a portion of other fees incurred with each of the aforementioned refinancing transactions.
A summary of the carrying value of the debt and the capital lease obligation is as follows:
|
| | | | | | | | |
| (In thousands) | December 31, 2017 | | | December 31,
2016 |
| | (Successor) | | | (Successor) |
| Third First Lien Term Loan (3.6% as of December 31, 2017) | | | | |
| Principal | $ | 993,762 |
| | | $ | 998,750 |
|
| Unamortized debt premium and issuance costs | 4,857 |
| | | 5,396 |
|
| 998,619 |
| | | 1,004,146 |
|
| Capital lease obligation (6.8% as of December 31, 2017) | 569 |
| | | 724 |
|
| Total debt and capital lease obligation | 999,188 |
| | | 1,004,870 |
|
| Less: Amounts due within one year | (11,268 | ) | | | (11,496 | ) |
| Long-term portion | $ | 987,920 |
| | | $ | 993,374 |
|
At December 31, 2017, minimum debt repayments under the Third First Lien Term Loan are due as follows:
|
| | | |
| (In thousands) | |
| 2018 | $ | 9,938 |
|
| 2019 | 9,938 |
|
| 2020 | 9,938 |
|
| 2021 | 9,938 |
|
| 2022 | 954,010 |
|
Revolving Credit Facility
Hostess Brands, LLC entered into a Revolving Credit Agreement (the “Revolver”) on August 3, 2015 that provides for borrowings up to $100.0 million. The Revolver has a stated maturity date of August 3, 2020 and is secured by liens on substantially all of Hostess Brands LLC’s present and future assets, including accounts receivable and inventories, as defined in the Revolver. The Revolver is pari passu, or ranked equally, with the Third New First Lien Term Loan in regards to secured liens. The Revolver has an annual commitment fee on the unused portion of between 0.375% and 0.50% annually based upon the unused percentage. Interest on borrowings under the Revolver is, at Hostess Brands LLC’s option, either the applicable LIBOR plus a margin of between 3.00% and 3.50% per annum or the base rate plus a margin of 2.00% to 2.50% per annum.
The Company had no outstanding borrowings under its Revolving Credit Agreement (the “Revolver”) as of December 31, 2017. See Note 14 -- “Commitments and Contingencies” for information regarding the letters of credits, which reduce the amount available for borrowing under the Revolver. Interest expense from the Revolver debt fee amortization was $0.3 million (Predecessor) for the year ended December 31, 2016, and $0.1 million for the year ended December 31, 2015, respectively.
10.Interest Rate Swap
During the year ended December 31, 2017, Hostess Brands, LLC entered into an interest rate swap contract with a counter party to make a series of payments based on a fixed interest rate of 1.78% and receive a series of payments based on the greater of LIBOR or 0.75%. Both the fixed and floating payment streams are based on a notional amount of $500 million at the inception of the contract and will be reduced by $100 million each year of the five-year contract. The Company entered into this transaction to reduce its exposure to changes in cash flows associated with its variable rate debt and has designated this derivative as a cash flow hedge. At December 31, 2017, the effective fixed interest rate on the long-term debt hedged by this contract was 4.03%.
For the year ended December 31, 2017, less than $0.1 million was recorded within interest expense in the consolidated statements of operations for ineffectiveness and there were no reclassifications from accumulated other comprehensive loss into earnings. As of December 31, 2017, the fair value of the interest rate swap contract of $2.9 million was reported within other assets, net on the consolidated balance sheet. The$0.1 million of unrealized losses recognized in accumulated other comprehensive income as of December 31, 2017 are expected to be reclassified into interest expense through December 31, 2018. The fair value of the interest rate swap contract is measured on a recurring basis by netting the discounted future fixed cash payments and the discounted expected variable cash receipts. The variable cash receipts are based on the expectation of future interest rates (forward curves) derived from observed market interest rate curves (Level 2).
11.Equity
The Company’s authorized common shares consist of three classes: 200,000,000 shares of Class A common stock, 50,000,000 shares of Class B common stock, and 10,000,000 shares of Class F common stock (none of which were issued and outstanding at December 31, 2017 or December 31, 2016). As of December 31, 2017 and December 31, 2016, there were 99,791,245 and 98,250,917 shares of Class A common stock issued and outstanding, respectively. At December 31, 2017 and 2016 there were 30,319,564 and 31,704,988 shares of Class B common stock issued and outstanding, respectively.
Shares of Class A common stock and Class B common stock have identical voting rights. However, shares of Class B common stock do not participate in earnings or dividends of the Company. Ownership of shares of Class B common stock is restricted to owners of Class B units in Hostess Holdings. Class B units in Hostess Holdings may be exchanged (together with the cancellation of an equivalent number of shares of Class B common stock) by the holders thereof for, at the election of the Company, shares of Class A common stock or the cash equivalent of such shares.
As of December 31, 2017 and December 31, 2016, there were 44,182,889 and 37,500,000 public warrants, and 12,317,001 and 19,000,000 private placement warrants outstanding, respectively. Each warrant entitles its holder to purchase one-half of one share of our Class A common stock at an exercise price of $5.75 per half share, to be exercised only for a whole number of shares of our Class A common stock. The warrants expire on December 4, 2021, or earlier upon redemption or liquidation. The Company may call the outstanding warrants for redemption at a price of $0.01 per warrant, if the last sale price of the Company’s common stock equals or exceeds $24.00 per share for any 20 trading days within a 30 trading day period ending on the third business day before the Company sends the notice of redemption to the warrant holders. The private placement warrants, however, are nonredeemable so long as they are held by the Company’s Sponsor or its permitted transferees. During the year ended December 31, 2017, the private placement warrants were registered with the SEC for future potential sales to the public. When sold to the public, the private placement warrants will become public warrants.
12.Earnings Per Share
Basic earnings per share is calculated by dividing net income attributable to the Company’s Class A shareholders for the period by the weighted average number of Class A common shares outstanding for the period excluding non-vested restricted stock awards. In computing dilutive earnings per share, basic earnings per share is adjusted for the assumed issuance of all applicable potentially dilutive share-based awards, including: public and private placement warrants, RSUs, restricted stock awards, and stock options.
Below are basic and diluted earnings (loss) per share:
|
| | | | | | | | |
| | Year Ended
December 31,
2017 | | From November 4, 2016
through
December 31, 2016 |
| | (Successor) | | (Successor) |
| Numerator: | |
| |
|
| Net income (loss) attributable to Class A shareholders (in thousands) | | $ | 223,897 |
| | $ | (4,404 | ) |
| Denominator: | |
| |
|
| Weighted-average Class A shares outstanding - basic (excluding non-vested restricted stock awards) | | 99,109,629 |
| | 97,791,658 |
|
| Dilutive effect of warrants | | 6,113,053 |
| | — |
|
| Dilutive effect of RSAs and RSUs | | 84,611 |
| | — |
|
| Weighted-average shares outstanding - diluted | | 105,307,293 |
| | 97,791,658 |
|
| Earnings (loss) per Class A share - basic | | $ | 2.26 |
| | $ | (0.05 | ) |
| Earnings (loss) per Class A share - dilutive | | $ | 2.13 |
| | $ | (0.05 | ) |
For the year ended December 31, 2017, all stock options were excluded from the computation of diluted net income per share because the assumed proceeds from the awards’ exercise were greater than the average market price of the common shares.
13. Income Taxes
The Company accounts for income taxes under the asset and liability method. Under this method, deferred tax liabilities and assets are determined based on the difference between the financial statement and tax basis of assets and liabilities using enacted tax rates in effect for the year in which the difference is expected to reverse. Additionally, the impact of changes in the enacted tax rates and laws on deferred taxes, if any, is reflected in the financial statements in the period of enactment.
The Company recognizes the effect of income tax positions only if those positions are more likely than not to be sustained. Recognized income tax positions are measured at the largest amount that is greater than 50% likely of being realized. Changes in recognition or measurement are reflected in the period in which the change in judgment occurs (see Note 13. Income Taxes).
Derivatives
Prior to November 4, 2021, the Company had outstanding public and private placement warrants which were originated in the 2015 initial public offering of a special purpose acquisition company (“SPAC”), which subsequently acquired Hostess Holdings in 2016 in a transaction that resulted in the Company becoming the parent company of Hostess Holdings. Due to certain provisions in the warrant agreement, the Company concluded that certain warrants do not meet the criteria to be classified in stockholders’ equity. In periods in which the public and private warrants meet the definition of a liability-classified derivative under Accounting Standards Codification (“ASC”) 815, the Company recognized these warrants within current liabilities on the consolidated balance sheets at fair value, with subsequent changes in fair value recognized in the consolidated statements of operations at each reporting date. The warrants expired on November 4, 2021 and are no longer outstanding.
HOSTESS BRANDS, INC.
NOTES TO CONSOLIDATED FINANCIAL STATEMENTS
The Company has entered into interest rate swap contracts to mitigate its exposure to changes in the variable interest rate on its long-term debt. The Company has also entered into Canadian Dollar (CAD) purchase contracts to mitigate its exposure to foreign currency exchange rates on its CAD denominated production costs. Both interest rate swap contracts and CAD purchase contracts are designated as cash flow hedges. Changes in the fair value of these instruments are recognized in accumulated other comprehensive income in the consolidated balance sheets and reclassified into earnings in the period in which the hedged transaction affects earnings. Hedging ineffectiveness, if any, is recognized as a component of interest expense for interest rate swap contracts and costs of goods sold for CAD purchase contracts in the consolidated statements of operations. Payments made under the interest rate swap contracts are included in the supplemental disclosure of interest paid in the consolidated statements of cash flows.
See Note 10. Derivative Instruments for more information on our derivative instruments.
Fair Value Measurements
The Company utilizes valuation techniques that maximize the use of observable inputs and minimize the use of unobservable inputs to the best extent possible. The Company determines fair value based on assumptions that market participants would use in pricing an asset or liability in the principal or most advantageous market. When considering market participant assumptions in fair value measurements, the following fair value hierarchy distinguishes between observable and unobservable inputs, which are categorized in one of the following levels:
•Level 1 inputs: Unadjusted quoted prices in active markets for identical assets or liabilities accessible to the reporting entity at the measurement date.
•Level 2 inputs: Other than quoted prices included in Level 1 inputs that are observable for the asset or liability, either directly or indirectly, for substantially the full term of the asset or liability.
•Level 3 inputs: Unobservable inputs for the asset or liability used to measure fair value to the extent that observable inputs are not available, thereby allowing for situations in which there is little, if any, market activity for the asset or liability at measurement date.
New Accounting Pronouncements
In March 2020, the FASB issued ASU No. 2020-04, Reference Rate Reform (Topic 848): Facilitation of the Effects of Reference Rate Reform on Financial Reporting, which provides practical expedients and exceptions for applying GAAP to contracts, hedging relationships, and other transactions affected by reference rate reform if certain criteria are met. The expedients and exceptions provided by the amendments in this update apply only to contracts, hedging relationships, and other transactions that reference the London Inter-Bank Offered Rate (“LIBOR”) or another reference rate expected to be discontinued as a result of reference rate reform. In December 2022, the FASB issued ASU No 2022-06, “Reference Rate Reform (Topic 848) - Deferral of the Sunset Date of Topic 848”, which extends the optional transition relief to ease the potential burden in accounting for reference rate reform on financial reporting. The transition relief is provided through December 31, 2024 based on the expectation that the London Interbank Offered Rate (LIBOR) will cease to be published as of June 30, 2023. The Company is evaluating the impact the new standard will have on the consolidated financial statements and related disclosures but does not anticipate a material impact.
2. Business Combinations
Voortman Acquisition
On January 3, 2020, the Company completed the acquisition of all of the shares of the parent company of Voortman, a manufacturer of premium, branded wafers as well as sugar free and specialty cookies for approximately $328.7 million ($427.0 million CAD), reflecting final working capital and other closing statement adjustments.
Net cash outflow related to the purchase price during the year ended December 31, 2020 was $316.0 million. This net cash outflow reflects a non-cash gain on a related foreign currency contract of $6.9 million, cash acquired of $1.6 million. As of December 31, 2022 and 2021, the outstanding liability for certain purchase price adjustments was $4.1 million and $4.3 million, respectively.
HOSTESS BRANDS, INC.
NOTES TO CONSOLIDATED FINANCIAL STATEMENTS
During the year ended December 31, 2020, the Company incurred $4.3 million of expenses related to this acquisition. These expenses are classified as business combination transaction costs on the consolidated statements of operations.
3.Exit Costs
Subsequent to the Company’s acquisition of Voortman, activities were initiated to transition Voortman’s distribution model to the Company’s direct-to-warehouse distribution model. The Company incurred costs to exit Voortman’s direct-store-delivery model, including severance and contract termination costs related to third-party distributor and leasing relationships. Total costs were $12.9 million through completion of the transition in 2020. During the year ended December 31, 2020, contract termination costs of $8.3 million were recognized in selling expense on the consolidated statement of operations and $4.6 million of severance costs were recognized within general and administrative expenses on the consolidated statement of operations.
4. Share-Based Compensation
The Company provides compensation benefits to employees under the Amended and Restated Hostess Brands, Inc. 2016 Equity Incentive Plan (the “2016 Plan”) and the Hostess Brands, Inc. 2022 Employee Stock Purchase Plan (“ESPP”).
Hostess Brands, Inc. 2016 Equity Incentive Plan
The 2016 Plan provides for the granting of various equity-based incentive awards to members of the Board of Directors of the Company, employees and service providers to the Company. The types of equity-based awards that may be granted under the 2016 Plan include: stock options, stock appreciation rights (SARs), restricted stock, restricted stock units (RSUs), and other share-based awards. There are 11,150,000 registered shares of Class A common stock reserved for issuance under the 2016 Plan. All awards issued under the 2016 Plan may only be settled in shares of Class A common stock. As of December 31, 2022, 5,180,342 shares remained available for issuance under the 2016 Plan.
Restricted Stock Units (“RSUs”)
The fair value of RSU awards is calculated based on the closing market price of the Company’s Class A common stock on the date of grant. Compensation expense is recognized straight-line over the requisite service period of the awards, ranging from one to three years. The weighted average grant date fair value of RSU awards granted in 2022, 2021, and 2020 was $20.55, $14.78 and $12.99, respectively.
The vesting of certain RSU awards is contingent upon the Company’s Class A common stock achieving a certain total stockholder return (“TSR”) in relation to a group of its peers, measured over a three year period. Depending on the actual performance over the measurement period, an award recipient has the opportunity to receive up to 200% of the granted awards. At December 31, 2022, 2021 and 2020, there were 437,041, 359,388, and 411,549 RSU awards with TSR performance conditions outstanding, respectively.
The fair value of RSUs with a TSR component granted during the years ended December 31, 2022, 2021 and 2020, were estimated on the date of grant using the Monte Carlo simulation model using the following assumptions:
| | | | | | | | | | | |
| | Year Ended
December 31,
2022 | Year Ended
December 31,
2021 | Year Ended
December 31,
2020 |
| Expected volatility (1) | 24.0% | 29.0% | 30.0% |
| Expected dividend yield (2) | —% | —% | —% |
| Performance period (years) | 3.0 years | 3.0 years | 3.0 years |
| Risk-free rate (3) | 1.3% | 0.2% | 1.5% |
HOSTESS BRANDS, INC.
NOTES TO CONSOLIDATED FINANCIAL STATEMENTS
(1)The expected volatility assumption was calculated based on the actual volatility of Hostess Brands’ daily closing share price over the three year period to the valuation date.
(2)From its inception through December 31, 2022, the Company has not paid any dividends on its common stock. As of the RSU grant date, it was assumed that no dividends would be paid on common stock over the performance period.
(3)The risk-free interest rate was based on the U.S. Treasury yield curve in effect at the time of grant which corresponds to the performance period.
Upon an employee’s termination, certain RSU awards provide that unvested awards will be forfeited and the shares of common stock underlying such awards will become available for issuance under the 2016 Plan. Other RSU awards provide for accelerated vesting upon an employee’s termination under certain circumstances.
The following table summarizes the activity of the Company’s unvested RSUs: | | | | | | | | | | | |
| Restricted Stock
Units | | Weighted Average
Grant Date
Fair Value |
| | | |
| | | |
| | | |
| | | |
| Unvested as of December 31, 2021 | 1,139,527 | | | $ | 14.62 | |
| Total Granted | 714,118 | | | 20.55 | |
| Forfeited | (91,573) | | | 16.73 | |
| Vested (1) | (508,906) | | | 14.47 | |
| Unvested as of December 31, 2022 | 1,253,166 | | | $ | 17.90 | |
(1) Includes 256,528 shares withheld to satisfy $5.2 million of employee tax obligations upon vesting.
As of December 31, 2022, there was $13.1 million of total unrecognized compensation cost, related to non-vested RSUs granted under the 2016 Plan; that cost is expected to be recognized over a weighted average remaining period of approximately 1.8 years. The total fair value of shares vested during the years ended December 31, 2022, 2021 and 2020 was $10.6 million, $8.3 million and $3.7 million. As of December 31, 2022 there were no awards outstanding for which it was not probable that the performance conditions would be met.
For the years ended December 31, 2022, 2021 and 2020, $9.6 million, $7.9 million and $6.3 million, respectively, of compensation expense related to the RSUs was recognized within general and administrative expenses on the consolidated statements of operations.
Stock Options
The following table includes the significant inputs used to determine the fair value of options issued under the 2016 plan.
| | | | | | |
| | Year Ended
December 31,
2020 |
| Expected volatility (1) | | 26.3% |
| Expected dividend yield (2) | | —% |
| Expected option term (3) | | 6.0 years |
| Risk-free rate (4) | | 1.6% |
(1)The expected volatility assumption was calculated based on a peer group analysis of stock price volatility with a look back period based on the expected term and ending on the grant date.
(2)From its inception through December 31, 2022, the Company has not paid any dividends on its common stock. As of the stock option grant date, it was assumed that no dividends would be paid on common stock over the term of the stock options. Option holders have no right to dividends prior to the exercise of the options.
(3)The Company utilized the simplified method to determine the expected term of the stock options since the Company does not have sufficient historical exercise data to provide a reasonable basis upon which to estimate expected term.
(4)The risk-free interest rate was based on the U.S. Treasury yield curve in effect at the time of grant which corresponds to the expected term of the stock options.
HOSTESS BRANDS, INC.
NOTES TO CONSOLIDATED FINANCIAL STATEMENTS
The stock options vest in equal annual installments on varying dates through 2023. The maximum term under the grant agreement is ten years. For the years ended December 31, 2022, 2021 and 2020, there was $0.7 million, $1.7 million and $2.4 million, respectively, of expense related to the stock options recognized within general and administrative costs on the consolidated statements of operations. No options were granted in the years ended December 31, 2022 and 2021. The weighted average grant-date fair value of options granted in the year ended December 31, 2020 was $4.04.
The following table summarizes the activity of the Company’s unvested stock options:
| | | | | | | | | | | | | | | | | | | | | | | |
| Number
of
Options | | Weighted Average
Remaining
Contractual Life
(years) | | Weighted
Average
Exercise Price | | Aggregate Intrinsic Value |
| | | | | | | |
| | | | | | | |
| | | | | | | |
| | | | | | | |
| Outstanding as of December 31, 2021 | 1,461,885 | | | 6.98 | | $ | 13.26 | | | $ | 10,467,312 | |
| | | | | | | |
| | | | | | | |
| Exercised | (236,422) | | | — | | | 13.34 | | | 2,487,634 | |
| Forfeited | (22,596) | | | — | | | 12.72 | | | |
| Outstanding as of December 31, 2022 | 1,202,867 | | | 6.02 | | $ | 13.25 | | | 11,048,766 | |
| Exercisable as of December 31, 2022 | 1,050,089 | | | 5.86 | | $ | 13.18 | | | 9,718,721 | |
2022 Employee Stock Purchase Plan
The ESPP is intended to provide employees with an opportunity to purchase the Company’s common stock through accumulated payroll deductions at the end of a specified purchase period. Each of the Company’s employees (including officers) is eligible to participate in the ESPP, subject to certain limitations set forth in the ESPP. The ESPP operates with six-month offering periods commencing on the first trading day on or after April 1 and October 1 of each year (“Offering Period”), with the first Offering Period commencing on October 1, 2022. Class A common stock may be purchased under the ESPP at the end of each six-month Offering Period unless the participant withdraws or terminates employment earlier. Shares of the Company’s common stock may be purchased under the ESPP at a price not less than 85% of the lesser of the fair market value of our Class A common stock on the first or last trading day of each Offering Period.
There are 3,000,000 registered shares of Class A common stock reserved for issuance under the ESPP. All awards issued under the ESPP may only be settled in shares of Class A common stock. As of December 31, 2022, 3,000,000 shares remained available for issuance under the ESPP.
For the year ended December 31, 2022, $0.1 million of compensation expense related to the ESPP was recognized within general and administrative expenses on the consolidated statements of operations.
All Share-Based Payment Arrangements
Share-based compensation expense totaled approximately $10.5 million, $9.6 million and $8.7 million for the years ended December 31, 2022, 2021 and 2020, respectively.
HOSTESS BRANDS, INC.
NOTES TO CONSOLIDATED FINANCIAL STATEMENTS
5. Property and Equipment
Property and equipment consists of the following:
| | | | | | | | | | | |
| (In thousands) | December 31,
2022 | | December 31,
2021 |
| | | |
| Land and buildings | $ | 81,405 | | | $ | 70,692 | |
| Right of use assets - operating | 32,170 | | | 32,192 | |
| Machinery and equipment | 315,149 | | | 299,071 | |
| Construction in progress | 118,679 | | | 26,027 | |
| 547,403 | | | 427,982 | |
| Less accumulated depreciation | (122,090) | | | (92,677) | |
| $ | 425,313 | | | $ | 335,305 | |
Depreciation expense was $32.2 million, $23.5 million and $23.1 million for the years ended December 31, 2022, 2021, 2020, respectively.
6. Goodwill and Intangible Assets
Goodwill and intangible assets as of December 31, 2022 and 2021 were recognized as part of the Hostess Business Combination and the Voortman and Cloverhill Business acquisitions.
Goodwill was $706.6 million for the years ended December 31, 2022 and 2021, respectively, and is recognized at the Snacking reportable segment. There were no changes to goodwill during the years ended December 31, 2022 and 2021.
Intangible assets consist of the following:
| | | | | | | | | | | |
| (In thousands) | December 31,
2022 | | December 31,
2021 |
| Intangible assets with indefinite lives (Trademarks and Trade Names) | $ | 1,538,631 | | | $ | 1,538,631 | |
| Intangible assets with definite lives (Customer Relationships) | 526,813 | | | 526,813 | |
| Less accumulated amortization (Customer Relationships) | (144,564) | | | (121,052) | |
| | | |
| Intangible assets, net | $ | 1,920,880 | | | $ | 1,944,392 | |
The Company recognized additional trade names and customer relationships intangible assets during the year ended December 31, 2020 related to the acquisition of Voortman. See Note 2. Business Combinations for additional details.
Amortization expense was $23.5 million, $23.5 million and $26.5 million for the years ended December 31, 2022, 2021 and 2020 respectively.
Future expected amortization expense is as follows:
| | | | | |
| (In thousands) | |
| 2023 | $ | 23,512 | |
| 2024 | 23,512 | |
| 2025 | 22,752 | |
| 2026 | 22,752 | |
| 2027 | 22,752 | |
| 2028 and thereafter | 266,969 | |
HOSTESS BRANDS, INC.
NOTES TO CONSOLIDATED FINANCIAL STATEMENTS
7. Accrued Expenses
Included in accrued expenses are the following:
| | | | | | | | | | | | | | |
| (In thousands) | December 31,
2022 | | | December 31,
2021 |
| | | | |
| Incentive compensation | $ | 29,045 | | | | $ | 21,172 | |
| Accrued interest | 7,850 | | | | 4,828 | |
| Payroll, vacation and other compensation | 6,195 | | | | 7,791 | |
| Interest rate and foreign currency contracts | 423 | | | | 2,042 | |
| Other | 16,420 | | | | 11,176 | |
| | | | |
| | | | |
| $ | 59,933 | | | | $ | 47,009 | |
8.Tax Receivable Agreement
Concurrent with the Hostess Business Combination, the Company entered into a tax receivable agreement that generally provides for the payment by the Company to the legacy equity holders of Hostess Holdings of 85% of the net cash savings, if any, in U.S. federal, state and local income taxes that the Company realizes (or is deemed to realize in certain circumstances) in periods after the closing of the business combination (which periods may extend, unless the tax receivable agreement is terminated early in accordance with its terms, for more than 15 years following any exchange of Class B Units of Hostess Holdings for shares of the Company’s Class A common stock or the cash equivalent thereof) as a result of (i) certain increases in tax basis resulting from the 2016 acquisition; (ii) certain tax attributes of Hostess Holdings and its subsidiaries existing prior to the 2016 acquisition and prior to subsequent exchanges of Class B Units; (iii) certain increases in tax basis resulting from exchanges of Class B Units; (iv) imputed interest deemed to be paid by the Company as a result of payments it makes under the tax receivable agreement; and (v) certain increases in tax basis resulting from payments the Company makes under the tax receivable agreement. The Company will retain the benefit of the remaining 15% of these cash savings. Certain payments under the tax receivable agreement will be made to the Metropoulos Entities in accordance with specified percentages, regardless of the source of the applicable tax attribute. The Company recognizes a liability on the consolidated balance sheet based on the undiscounted estimated future payments under the tax receivable agreement. Significant inputs used to estimate the future expected payments include a 26.0% cash tax savings rate.
HOSTESS BRANDS, INC.
NOTES TO CONSOLIDATED FINANCIAL STATEMENTS
The following table summarizes activity related to the tax receivable agreement obligations:
| | | | | | | | |
| (In thousands) | | |
| | |
| | |
| | |
| | |
| | |
| Balance December 31, 2020 | | $ | 156,544 | |
| Remeasurement due to change in estimated state tax rate | | (1,409) | |
| Payments | | (9,270) | |
| | |
| | |
| Balance December 31, 2021 | | $ | 145,865 | |
| Remeasurement due to change in estimated state tax rate | | (860) | |
| Payments | | (9,313) | |
| Balance December 31, 2022 | | $ | 135,692 | |
As of December 31, 2022 the future expected payments under the tax receivable agreement are as follows:
| | | | | |
| (In thousands) | |
| 2023 | $ | 12,600 | |
| 2024 | 6,700 | |
| 2025 | 8,500 | |
| 2026 | 11,200 | |
| 2027 | 11,500 | |
| Thereafter | 85,192 | |
9.Debt
On January 3, 2020, the Company originated a $140.0 million incremental term loan through an amendment to its existing credit agreement. The Company received proceeds of $136.9 million, net of fees incurred of $3.1 million. The proceeds, together with cash on hand, financed the purchase of Voortman (see Note 2. Business Combinations). The terms, conditions and covenants applicable to the incremental term loan are the same as the terms, conditions and covenants applicable to the Fourth Term Loan, defined below. The term loan requires quarterly payments of interest at a rate of the greater of the applicable LIBOR or 0.75% per annum plus a margin of 2.25% per annum and principal payments at a rate of 0.25% of the aggregate principal balance per quarter with the remaining principal amount due upon maturity on August 3, 2025.
A term loan was originated on October 1, 2019 through an amendment to an existing credit agreement held by the Company’s subsidiary, Hostess Brands, LLC (referred to as the “Fourth Term Loan”). It requires quarterly payments of interest at a rate of the greater of the applicable LIBOR or 0.75% per annum (“New LIBOR Floor”) plus a margin of 2.25% per annum and principal at a rate of 0.25% of the aggregate principal balance with the remaining principal amount due upon maturity on August 3, 2025. The Fourth Term Loan is secured by substantially all of Hostess Brands, LLC’s present and future assets.
The Fourth Term Loan refinanced the remaining balance of $976.4 million on the Third New First Lien Term Loan (“Third Term Loan”) through a non-cash refinancing transaction. The Third Term Loan was originated through an amendment to an existing credit agreement held by Hostess Brands, LLC on November 20, 2017 and required quarterly payments of interest at a rate equal to the New LIBOR Floor plus a margin of 2.50% per annum and principal at a rate of 0.25% of the aggregate principal balance. Including the impact of the interest rate swap contracts, at December 31, 2022, the Company's aggregate term loans had an effective interest rate of 4.65%.
HOSTESS BRANDS, INC.
NOTES TO CONSOLIDATED FINANCIAL STATEMENTS
On December 23, 2022, the Company prepaid, without penalty, $100.0 million of the remaining balance on its term loan.
A summary of the carrying value of the debt and the lease obligations is as follows:
| | | | | | | | | | | | | | |
| (In thousands) | December 31,
2022 | | | December 31,
2021 |
| Term loan (6.7% as of December 31, 2022) | | | | |
| Principal | $ | 983,221 | | | | $ | 1,091,596 | |
| Unamortized debt premiums, discounts and issuance costs | (2,563) | | | | (3,679) | |
| 980,658 | | | | 1,087,917 | |
| Lease obligations | 22,348 | | | | 26,228 | |
| Total debt and lease obligations | 1,003,006 | | | | 1,114,145 | |
| Less: Amounts due within one year | (3,917) | | | | (14,170) | |
| Long-term portion | $ | 999,089 | | | | $ | 1,099,975 | |
At December 31, 2022 and 2021, the approximate fair value of the Company’s aggregate term loan balance was $979.1 million and $1,090.2 million, respectively. The fair value is calculated using current interest rates and pricing from financial institutions (Level 2 inputs).
At December 31, 2022, there are no principal payments due under the Fourth Term loan until maturity on August 3, 2025.
Revolving Credit Facility
On October 1, 2019, Hostess Brands, LLC amended its Revolving Credit Agreement (the “Revolver”), providing for borrowings up to $100.0 million, a stated maturity date of August 3, 2024 and secured by liens on substantially all of Hostess Brands, LLC’s present and future assets, as defined in the Revolver. The Revolver is ranked equally with the Fourth Term Loan in regards to secured liens. The Revolver has an annual commitment fee on the unused portion of between 0.375% and 0.50% annually based upon the unused percentage. Interest on borrowings under the Revolver is, at Hostess Brands, LLC’s option, either the applicable LIBOR plus a margin of 2.25% per annum or the base rate plus a margin of 1.25% per annum.
Prior to the amendment, the Revolver originated on August 3, 2015 had interest on borrowings at Hostess Brands, LLC’s option, of either the applicable LIBOR plus a margin of between 3.00% and 3.50% per annum or the base rate plus a margin of 2.00% to 2.50% per annum.
The Company had no outstanding borrowings under the Revolver as of December 31, 2022 or 2021. See Note 14. Commitments and Contingencies for information regarding the letters of credit, which reduce the amount available for borrowing under the Revolver. The Revolver contains certain restrictive financial covenants. As of December 31, 2022, the Company was in compliance with these covenants.
HOSTESS BRANDS, INC.
NOTES TO CONSOLIDATED FINANCIAL STATEMENTS
10.Derivative Instruments
Warrants
As part of its initial public offering in 2015, the Company issued public and private placement warrants. Each warrant entitled its holder to purchase one-half of one share of Class A common stock at an exercise price of $5.75 per half share, to be exercised only for a whole number of shares of Class A common stock. No warrants were outstanding as of December 31, 2022 or 2021.
In July 2021, the agreement governing the Company’s public and private placement warrants was amended. Subsequent to the amendment, the exercise price for all outstanding warrants was payable through a “cashless exercise” with a premium of $0.25 added to the valuation price of each share for purposes of calculating the number of shares issuable upon exercise of the warrants. Subsequent to this amendment, 51,595,844 warrants were exercised on a cashless basis, resulting in the issuance of 9,822,909 shares of the Company’s Class A common stock. All remaining warrants expired on November 4, 2021.
The warrant agreement contained a tender offer provision that when paired with a two-class equity structure caused all warrants to be precluded from equity classification. Subsequent to the collapse of the two-class structure in November 2020 when all remaining Class B shares were exchanged for Class A shares, the tender offer provision no longer precluded the public warrants from being equity-classified. As a result, the $68.5 million liability related to the public warrants was reclassified to equity in November 2020. There were provisions specific to the private warrants which caused them to continue to be liability classified subsequent to the exchange, through their final expiration in November 2021. The fair value of the warrants is measured on a recurring basis by comparison to available market information. The value of each public warrant up until they were no longer classified as liabilities was based on the public trading price of the warrant (Level 1 fair value measurement). The fair value of each private warrant was evaluated and determined to be substantially the same as that of a public warrant and therefore considered to be a Level 2 fair value measurement. Gains and losses related to the warrants are reflected in the change in fair value of warrant liabilities in the consolidated statements of operations.
Interest Rate Swaps
In 2020, the Company entered into five-year interest rate swap contracts to reduce the effect of interest rate fluctuations on its variable-rate debt. The notional value of these contracts was $500 million. In February 2022, the Company entered into a three-year interest rate swap contract with a notional value of $200 million to further reduce the effect of interest rate fluctuations on its variable-rate term loan. At December 31, 2022, a total notional amount of $700.0 million remained outstanding on the swap contracts which have a maturity date aligned with the maturity of the term loan in August 2025. Under the terms of the contracts, the Company makes quarterly payments based on fixed interest rates ranging from 1.11% to 2.06% and receives quarterly payments based on the greater of LIBOR or 0.75%. The Company has designated these contracts as cash flow hedges. At December 31, 2022, the interest on the Company’s variable rate debt hedged by these contracts is effectively fixed at rates ranging from 3.36% to 4.31%, which includes the term loan margin of 2.25%.
HOSTESS BRANDS, INC.
NOTES TO CONSOLIDATED FINANCIAL STATEMENTS
Foreign Currency Contracts
To reduce the effect of fluctuations in CAD denominated expenses relative to their U.S. dollar equivalents originating from its Canadian operations, the Company entered into CAD purchase contracts during the years ended December 31, 2022 and 2021. The contracts that remain outstanding at December 31, 2022 provide for the Company to sell a total of $7.2 million USD for $9.2 million of CAD at varying defined settlement dates throughout 2023. The Company has designated these contracts as cash flow hedges.
A summary of the fair value of foreign currency and interest rate contracts is as follows:
| | | | | | | | | | | | | | |
| (In thousands) | | December 31,
2022 | | December 31,
2021 |
| Asset derivatives | Location | | | |
| Interest rate swap contracts (1) | Other non-current assets | $ | 48,539 | | | $ | 1,803 | |
| | | | |
| Liability derivatives | Location | | | |
| | | | |
| Interest rate swap contracts (1) | Accrued expenses | $ | — | | | $ | 1,798 | |
| Foreign currency contracts (2) | Accrued expenses | 423 | | | 244 | |
| | $ | 423 | | | $ | 2,042 | |
(1) The fair values of interest rate swap contracts are measured on a recurring basis by netting the discounted future fixed cash payments and the discounted expected variable cash receipts. The variable cash receipts are based on the expectation of future interest rates (forward curves) derived from observed market interest rate curves (Level 2).
(2) The fair values of foreign currency contracts are measured on a recurring basis by comparison to available market information on similar contracts (Level 2).
A summary of the gains and losses related to foreign currency and interest rate contracts in the consolidated statements of operations is as follows:
| | | | | | | | | | | | | | | | | | | | |
| (In thousands) | | Year Ended
December 31,
2022 | | Year Ended
December 31,
2021 | | Year Ended
December 31,
2020 |
| | | | | | |
| (Gain) Loss on derivative contracts designated as cash flow hedges | Location | | | | | |
| Interest rate swap contracts | Interest expense, net | $ | (3,557) | | | $ | 4,563 | | | $ | 3,886 | |
| Foreign currency contracts | Cost of goods sold | 248 | | | (60) | | | — | |
| | $ | (3,309) | | | $ | 4,503 | | | $ | 3,886 | |
| | | | | | |
| Gain (loss) on other derivative contracts | Location | | | | | |
| | | | | | |
| Foreign currency contracts | Other expense | $ | — | | | $ | — | | | $ | (274) | |
| | | | | | |
For interest rate swap contracts, unrealized income recognized in accumulated other comprehensive income as of December 31, 2022 of $23.4 million is expected to be reclassified into interest expense on the consolidated statement of operations through December 31, 2023.
For foreign currency contracts, unrealized expense recognized in accumulated other comprehensive income as of December 31, 2022 of $0.5 million is expected to be reclassified into cost of goods sold on the consolidated statement of operations through December 31, 2023.
HOSTESS BRANDS, INC.
NOTES TO CONSOLIDATED FINANCIAL STATEMENTS
11. Equity
The Company’s authorized common stock consists of three classes: 200,000,000 shares of Class A common stock, 50,000,000 shares of Class B Stock, and 1,000,000 shares of preferred stock. As of December 31, 2022, there were 142,650,344 shares of Class A common stock issued, 133,117,224 shares of Class A common stock outstanding and 9,533,120 shares of treasury stock. As of December 31, 2021 there were 142,031,329 shares of Class A common stock issued, 138,278,573 shares of Class A common stock outstanding and 3,752,756 shares of treasury stock. As of December 31, 2022, and 2021 there were no shares of Class B Stock or preferred stock issued or outstanding.
Shares of Class A common stock and Class B Stock have identical voting rights. However, shares of Class B Stock do not participate in earnings or dividends of the Company. During the year ended December 31, 2020, all remaining outstanding Class B Units were exchanged for Class A common stock. Ownership of shares of Class B Stock was restricted to owners of Class B Units in Hostess Holdings. Class B Units in Hostess Holdings could be exchanged (together with the cancellation of an equivalent number of shares of Class B Stock) by the holders thereof for, at the election of the Company, shares of Class A common stock or the cash equivalent of such shares.
During the year ended December 31, 2022, the Company’s Board of Directors approved a share repurchase program of up to $150 million of the Company’s outstanding Class A common stock. As of December 31, 2022, $21.7 million remained available for use under this program.
12.Earnings Per Share
Basic earnings per share is calculated by dividing net income attributable to the Company’s Class A stockholders for the period by the weighted average number of Class A common shares outstanding for the period. In computing dilutive earnings per share, basic earnings per share is adjusted for the assumed issuance of all applicable potentially dilutive share-based awards, including: public and private placement warrants, RSUs, stock options and ESPP awards.
Below are basic and diluted earnings per share: | | | | | | | | | | | | | | | | | | | |
| Year Ended December 31, 2022 | | Year Ended
December 31,
2021 | | Year Ended
December 31,
2020 | | |
| Numerator: (in thousands) | | | | | | | |
| Net income attributable to Class A stockholders - basic | $ | 164,195 | | | $ | 119,299 | | | $ | 104,676 | | | |
| Impact of change in fair value of warrant liabilities | — | | | (566) | | | (39,941) | | | |
| Numerator for diluted earnings per share | $ | 164,195 | | | $ | 118,733 | | | $ | 64,735 | | | |
| Denominator: | | | | | | | |
| Weighted-average Class A shares outstanding - basic | 136,768,310 | | | 131,571,733 | | | 124,927,535 | | | |
| Dilutive effect of warrants | — | | | 5,841,062 | | | 2,525,863 | | | |
| Dilutive effect of RSUs | 631,800 | | | 588,250 | | | 270,090 | | | |
| Dilutive effect of stock options and ESPP awards | 524,361 | | | 197,131 | | | — | | | |
| Weighted-average shares outstanding - diluted | 137,924,471 | | | 138,198,176 | | | 127,723,488 | | | |
| Earnings per Class A share - basic | $ | 1.20 | | | $ | 0.91 | | | $ | 0.84 | | | |
| Earnings per Class A share - dilutive | $ | 1.19 | | | $ | 0.86 | | | $ | 0.51 | | | |
| | | | | | | |
For warrants that are liability-classified, during periods when the impact is dilutive, the Company assumes share settlement of the instruments as of the beginning of the reporting period and adjusts the numerator to remove the change in fair value of the warrant liability and adjusts the denominator to include the dilutive shares calculated using the treasury stock method.
HOSTESS BRANDS, INC.
NOTES TO CONSOLIDATED FINANCIAL STATEMENTS
Stock options and ESPP shares that were excluded from the computation of diluted weighted average shares, because their effect was anti-dilutive, were 130, 2,010 and 477,923 for the years ended December 31, 2022, 2021 and 2020, respectively.
13. Income Taxes
The income tax expense (benefit) consisted of the following:
| | | | | | | | | | | | | | | |
| (In thousands) | | Year Ended December 31, 2022 | Year Ended
December 31,
2021 | Year Ended
December 31,
2020 | |
| Current tax expense | | | | | |
| Federal | | $ | 20,213 | | $ | 17,430 | | $ | 2,120 | | |
| State and local | | 5,334 | | 4,088 | | 1,479 | | |
| Foreign | | 5,031 | | — | | — | | |
| Total Current | | 30,578 | | 21,518 | | 3,599 | | |
| | | | | |
| Deferred tax expense (benefit) | | | | | |
| Federal | | 12,666 | | 13,509 | | 17,204 | | |
| State and local | | 3,285 | | 3,077 | | 3,750 | | |
| Foreign | | 560 | | 2,409 | | (4,148) | | |
| Total Deferred | | 16,511 | | 18,995 | | 16,806 | | |
| Income tax expense, net | | $ | 47,089 | | $ | 40,513 | | $ | 20,405 | | |
Income (loss) before income taxes consists of the following:
| | | | | | | | | | | | | | | |
| (In thousands) | | Year Ended December 31, 2022 | Year Ended
December 31,
2021 | Year Ended
December 31,
2020 | |
| Earnings (losses) before income taxes | | | | | |
| United States | | $ | 156,357 | | $ | 149,360 | | $ | 144,075 | | |
| Foreign | | 54,927 | | 10,452 | | (15,373) | | |
| Income before income taxes | | $ | 211,284 | | $ | 159,812 | | $ | 128,702 | | |
HOSTESS BRANDS, INC.
NOTES TO CONSOLIDATED FINANCIAL STATEMENTS
|
| | | | | | | | | | | | |
| (In thousands) | Year Ended December 31, 2017 | | November 4, 2016
through December 31, 2016 | | | January 1, 2016
through November 3, 2016 |
| | (Successor) | | (Successor) | | | (Predecessor) |
| Current tax expense (benefit) | | | | | | |
| Federal | $ | 11,163 |
| | $ | 9 |
| | | $ | 35 |
|
| State and local | 2,903 |
| | 43 |
| | | 12 |
|
| Total Current | 14,066 |
| | 52 |
| | | 47 |
|
| | | | | | | |
| Deferred tax expense (benefit) | | | | | | |
| Federal | (93,457 | ) | | $ | (6,751 | ) | | | 343 |
|
| State and local | 12,187 |
| | (1,063 | ) | | | 49 |
|
| Total Deferred | (81,270 | ) | | (7,814 | ) | | | 392 |
|
| Income tax expense (benefit), net | $ | (67,204 | ) | | $ | (7,762 | ) | | | $ | 439 |
|
The Company was a nontaxable partnership inFor the Predecessor yearyears ended December 31, 2015. In the Predecessor period January 1, 2016 through November 3, 2016, Superior, a C corporation, was subject to income taxes.
As a result of the Business Combination, the Company acquired a controlling interest in Hostess Holdings, which is treated as a partnership for U.S. federal2022, 2021, and most applicable state and local income tax purposes. As a partnership, Hostess Holdings is not itself subject to U.S. federal and certain state and local income taxes. Any taxable income or loss generated by Hostess Holdings is passed through and included in the taxable income or loss of its partners, including the Company in Successor periods. The Company is subject to U.S. federal income taxes, in addition to state and local income taxes with respect to its allocable share of any taxable income of Hostess Holdings following the Business Combination.
The operations of Hostess Holdings include those of its C corporation subsidiaries. These C corporation subsidiaries are subject to U.S. federal, state and local income taxes. The Company’s tax provision includes income taxes for the share of Hostess Holdings income or loss passed through to the Company, the income or loss of the Company’s C corporation subsidiaries and the deferred tax tax impact of outside basis differences in its investments in subsidiaries.
For the year ended December 31, 2017 (Successor) and the periods from November 4 through December 31, 2016 (Successor) and January 1 through November 3, 2016 (Predecessor),2020, the effective income tax rate differs from the federal statutory income tax rate as explained below:
| | | | | | | | | | | | | | | | | | | | | | |
| | Year Ended December 31, 2022 | | Year Ended
December 31,
2021 | | Year Ended
December 31,
2020 | | |
| U.S. federal statutory income tax rate | | 21.0 | % | | 21.0 | % | | 21.0 | % | | |
| | | | | | | | |
| Change in fair value of warrant liabilities | | — | | | (0.1) | | | (6.5) | | | |
| State and local income taxes, net of federal benefit | | 4.2 | | | 5.6 | | | 2.8 | | | |
| Insurance proceeds | | (2.9) | | | — | | | — | | | |
| Income attributable to non-controlling interest | | — | | | — | | | (0.6) | | | |
| Foreign rate differential | | 0.5 | | | 0.3 | | | (0.6) | | | |
| Change in state tax rate | | (1.1) | | | (1.9) | | | 0.6 | | | |
| Tax law change | | — | | | — | | | (0.8) | | | |
| | | | | | | | |
| Other | | 0.6 | | | 0.5 | | | — | | | |
| Effective income tax rate | | 22.3 | % | | 25.4 | % | | 15.9 | % | | |
|
| | | | | | | | | |
| | Year Ended December 31, 2017 | | November 4, 2016
through December 31, 2016 | | | January 1, 2016
through November 3, 2016 |
| | (Successor) | | (Successor) | | | (Predecessor) |
| U. S. federal statutory income tax rate | 35.0 | % | | 35.0 | % | | | 35.0 | % |
| | | | | | | |
| State and local income taxes, net of federal benefit | 3.8 |
| | 4.1 |
| | | 0.1 |
|
| Income attributable to non-controlling interest | (6.3 | ) | | (8.8 | ) | | | — |
|
| Nontaxable partnerships | — |
| | — |
| | | (34.4 | ) |
| Valuation allowance | — |
| | 17.2 |
| | | — |
|
| Tax Cuts and Jobs Act | (66.2 | ) | | — |
| | | — |
|
| Change in state tax rate | 1.2 |
| | — |
| | | — |
|
| Other | (2.7 | ) | | 0.3 |
| | | — |
|
| Effective income tax rate | (35.2 | )% | | 47.8 | % | | | 0.7 | % |
Deferred income taxes are provided for the effects of temporary differences between the tax basis of an asset or liability and its reported amount in the accompanying Consolidated Balance Sheets.consolidated balance sheets. These temporary differences result in taxable or deductible amounts in future years.
Details of the Company’s deferred tax assets and liabilities are summarized as follows:
| | | (In thousands) | Year Ended December 31, 2017 | | Year Ended December 31, 2016 | | (In thousands) | | As of December 31, 2022 | | As of
December 31, 2021 | |
| | (Successor) | | (Successor) | | |
| Deferred tax assets | | | | | Deferred tax assets | | | | | |
| Imputed interest | $ | 4,967 |
| | $ | 10,113 |
| | Imputed interest | | $ | 6,248 | | | $ | 6,478 | | |
| Tax credits | | Tax credits | | 1,140 | | | 3,011 | | |
| | Net operating loss carryforwards | 578 |
| | 9,574 |
| | Net operating loss carryforwards | | 122 | | | — | | |
| Tax credits | 2,337 |
| | 2,019 |
| | |
| Accrued liabilities | | Accrued liabilities | | 8,992 | | | 7,080 | | |
| Share-based compensation | | Share-based compensation | | 2,804 | | | 3,588 | | |
| Other | 1,002 |
| | 1,472 |
| | Other | | 5,236 | | | 5,367 | | |
| Subtotal | 8,884 |
| | 23,178 |
| | |
| Valuation allowance | (242 | ) | | (205 | ) | | |
| Total deferred tax assets | 8,642 |
| | 22,973 |
| | Total deferred tax assets | | 24,542 | | | 25,524 | | |
| | | | | | | | | | |
| Deferred tax liabilities | | | | | Deferred tax liabilities | | |
| Investment in partnership | (266,900 | ) | | (363,439 | ) | | |
| | Goodwill and intangible assets | | Goodwill and intangible assets | | (304,121) | | | (291,024) | | |
| Property and equipment | (1,394 | ) | | (1,857 | ) | | Property and equipment | | (53,456) | | | (51,272) | | |
| Goodwill and intangible assets | (7,512 | ) | | (11,474 | ) | | |
| Other | (607 | ) | | — |
| | Other | | (13,995) | | | (1,075) | | |
| Total deferred tax liabilities | (276,413 | ) | | (376,770 | ) | | Total deferred tax liabilities | | (371,572) | | | (343,371) | | |
| | | | | | |
| Total deferred tax assets and liabilities | $ | (267,771 | ) | | $ | (353,797 | ) | | Total deferred tax assets and liabilities | | $ | (347,030) | | | $ | (317,847) | | |
The recognition of deferred tax assets is based on management’s belief that it is more likely than not that the tax benefits associated with temporary differences, net operating loss carryforwards and tax credits will be utilized. The Company assesses the recoverability of the deferred tax assets on an ongoing basis. In making this assessment, the Company considers all positive and negative evidence, and all potential sources of taxable income including scheduled reversals of deferred tax liabilities, tax-planning strategies, projected future taxable income and recent financial performance.
HOSTESS BRANDS, INC.
NOTES TO CONSOLIDATED FINANCIAL STATEMENTS
At December 31, 2022 and 2021, Hostess had gross state credit carryforwards of $1.4 million and $3.8 million respectively. The carryforwards in 2022 relate entirely to Kansas High Performance Incentive Program credits and will begin to expire in 2032 if not utilized.
At December 31, 2022, Hostess had gross state net operating losses of $1.6 million. Unless utilized, the acquisition of Hostess Holdings,state net operating losses expire in 2034.
The global intangible low-taxed income (“GILTI”) provisions require the Company did not have a significant sourceto include in its U.S. income tax return foreign subsidiary earnings in excess of taxable income to supportan allowable return on the realization of its deferred tax assets and therefore had a full valuation allowance booked on its deferred taxforeign subsidiary’s tangible assets. The Company re-evaluated its conclusion on November 4, 2016 dueis electing to account for GILTI tax in the acquisition of Hostess Holdings and concluded that the valuation allowance was no longer appropriate.period in which it is incurred.
The Company reversed $2.8recognizes in the consolidated financial statements the benefit of a tax position only if the impact is more likely than not of being sustained on audit based on the technical merits of the position. As of both December 31, 2022 and 2021, the Company had $1.6 million of valuation allowance in the fourth quarter of 2016. This reversal is reflected as a non-cash income tax benefit recorded in the accompanying consolidated statement of operations. The Company still maintains a valuation allowance of $0.2 million against deferred tax assets for state net operating loss carryforwards attributable to its C corporation subsidiaries.
The Company and its C corporation subsidiaries file income tax returns in the U.S. federal jurisdiction, and various state and local jurisdictions. For federal tax purposes, the Company’s and its C corporation subsidiaries’ 2014 through 2017 tax years remain open for examination by the tax authorities under the normal three year statute of limitations. Generally, for state tax purposes, the Company’s and its C corporation subsidiaries’ 2014 through 2017 tax years remain open for examination by the tax authorities under a three year statute of limitations. Should the Company or its C corporation subsidiaries utilize any of their U.S. or state loss carryforwards, their carryforward losses, which date back to 2003, would be subject to examination.
At December 31, 2017, the Company’s C corporation subsidiaries had an available federal net operating loss carryforward of approximately $1.1 million. This carryforward expires in 2035. Of this NOL carryforward, $1.1 million is subject to annual limitations due to a change in ownership of the Company and its C corporation subsidiaries as defined in the Internal Revenue Code. The Company and its C corporation subsidiaries also had various state net operating loss carryforwards totaling approximately $2.5 million and $4.1 million, respectively. Of these NOL carryforwards, $2.5 million and $4.1 million, respectively, are subject to an annual limitation due to an ownership change of the Company and its C corporation subsidiaries. Unless utilized, the state carryforwards expire from 2022 to 2036. The Company does not believe that these limitations will prevent it from utilizing its pre-ownership change net operating loss carryforwards. The Company also has state income tax credit carryforwards of approximately $2.9 million which expire from 2028 to 2032.
The Company does not believe it has any significant uncertain tax positions and therefore has nogross unrecognized tax benefits, at December 31, 2017 or 2016, that if recognized,which would affecthave a net $1.6 million impact on the annual effective tax rate.
Tax Reform significantly changes U.S. tax law by lowering the corporate income tax rate, permanently fromif recognized. The following is a maximum of 35% to a flat 21% rate, effective January 1, 2018. As a resultreconciliation of the reduction in the U.S. corporate incomebeginning and ending amount of unrecognized tax rate from 35% to 21% under Tax Reform, the Company revalued its ending net deferred tax liabilities at December 31, 2017 and recognized a provisional $111.3 million non-cash tax benefit in the Company’s consolidated statement of income for the year ended December 31, 2017.benefits:
Tax Reform provides for considerable changes in the taxation of international operations by implementing a territorial tax system and imposing a repatriation tax on deemed earnings of foreign subsidiaries. The Company has determined that these changes will not have a material impact on its consolidated financial statements given the Company’s current tax profile and has recorded no provisional tax impact.
On December 22, 2017, the SEC staff issued Staff Accounting Bulletin No. 118 (“SAB 118”) to address the application of U.S. GAAP in situations when a registrant does not have the necessary information available, prepared, or analyzed (including computations) in reasonable detail to complete the accounting for certain income tax effects of Tax Reform. The Company has recognized the provisional tax impacts related to the revaluation of deferred tax assets and liabilities and the impact of changes in the tax receivable agreement due to the tax rate reduction and included these amounts in its consolidated financial statements for the year ended December 31, 2017. The ultimate impact may differ from these provisional amounts, possibly materially, due to, among other things, additional analysis, changes in interpretations and assumptions the Company has made, additional regulatory guidance that may be issued, and actions the Company may take as a result of Tax Reform. The accounting is expected to be complete when the Company has had further time to analyze the tax law changes during the first half of 2018.
| | | | | | | | | | |
| (In thousands) | | | | |
| Balance at December 31, 2020 | | $ | 1,560 | | | |
| | | | |
| Additions for tax positions established in prior years | | 45 | | | |
| Balance at December 31, 2021 | | 1,605 | | | |
| Additions for tax positions acquired | | 80 | | | |
| Reductions for tax positions established in prior years | | (92) | | | |
| Balance at December 31, 2022 | | $ | 1,593 | | | |
Interest and penalties related to income tax liabilities, if incurred, are included in income tax expense in the consolidated statementstatements.
The Company and its subsidiaries file income tax returns in the U.S. federal jurisdiction, various state and local jurisdictions, and certain subsidiaries in Canada. For federal and state tax purposes, the Company and its subsidiaries are generally subject to examination for three years after the income tax returns are filed. As such, U.S. federal and state income tax returns filed for periods since 2017 remain open for examination by tax authorities. In Canada, tax returns are subject to examination for four years after the notice of operations. For the year endedassessment is issued. Canadian tax returns filed for periods since 2016 remain open for examination.
As of December 31, 2017 (Successor), the periods from January 1, 2016 through November 3, 2016 (Predecessor) and November 4, 2016 through December 31, 2016 (Successor), and the year ended December 31, 2015 (Predecessor),2022, the Company has approximately $45.9 million of undistributed foreign subsidiary earnings that are intended to be permanently reinvested outside of the United States. The Company does not recorded any penalties and interestprovide deferred taxes on the undistributed earnings and does not have any accrued balance of penalties and interest.expect withholding taxes or other foreign income taxes to apply should these earnings be distributed.
14. Commitments and Contingencies
Accruals and the Potential Effect of Litigation
From time to time, the Company is subject to lawsuits, claims and proceedings arising in the ordinary course of business. These matters may involve personnel and employment issues, personal injury, contracts and other proceedings. Based upon information presently known, the Company does not believe that the ultimate resolution of such matters will have a material effect on the Company’s financial position, although the final resolution of such matters could have a material effect on its results of operations or cash flows in the period of resolution.
HOSTESS BRANDS, INC.
NOTES TO CONSOLIDATED FINANCIAL STATEMENTS
Liabilities related to legal proceedings are recorded when it is probable that a liability has been incurred and the associated amount can be reasonably estimated. Where the estimated amount of loss is within a range of amounts and no amount within the range is a better estimate than any other amount, the low end of the range is accrued.
As additional information becomes available, the potential liabilities related to these matters are reassessed and the estimates revised, if necessary. These accrued liabilities are subject to change in the future based on new developments in each matter, or changes in circumstances, which could have a material effect on the Company’s financial condition and results of operations.
From time to time,In December 2020, the Company is subjectasserted claims for indemnification against the sellers under the terms of the Share Purchase Agreement pursuant to various other legal actions, lawsuits,which the Company acquired Voortman (the “Agreement”). The claims arose out of alleged breaches by the sellers of certain representations, warranties and proceedingscovenants contained in the Agreement relating to periods prior to the closing of the acquisition. The Company also submitted claims relating to these alleged breaches under the representation and warranty insurance policy (“RWI”) it purchased in connection with the acquisition. In June 2022, the RWI insurers agreed to pay the Company $42.5 million CAD (the RWI coverage limit) (the “Proceeds”) related to products, employment, environmental regulations, and other matters incidental to its businesses.
Based upon information presently known,these breaches. During the year ended December 31, 2022, the Company does not believe thatreceived the ultimate resolutionProceeds and recognized a gain of such matters will have a material effect on the Company’s financial position, although the final resolution of such matters could have a material effect$42.5 million CAD ($33.0 million) in other expense (income) on its resultsconsolidated statement of operations or cash flowsoperations. Per agreement with the RWI insurers, under no circumstances will the Company be required to return the Proceeds.
On November 3, 2022, pursuant to the agreement with the RWI insurer, Voortman brought claims in the periodOntario (Canada) Superior Court of resolution.Justice (the “Claim”), related to the breaches against certain of the sellers from whom Voortman was acquired. The Claim alleges the seller defendants made certain non-disclosures and misrepresentations to induce the Company to overpay for Voortman. The Company is seeking damages of $109 million CAD representing the amount of the aggregate liability of the sellers for indemnification under the Agreement, $5.0 million CAD in punitive or aggravated damages, interest, proceedings fees and any other relief the presiding court deems appropriate. A portion of any recovery will be shared with the RWI insurers. Although the Company strongly believes that its Claim against the sellers is meritorious, no assurance can be given as to whether the Company will recover all, or any part, of the amounts it is pursuing.
Lease Commitments
Operating Leases
The Company leases facilities for its headquarters, manufacturing, and distribution, under noncancelable operating lease arrangements. As of December 31, 2017,2022 the Company’s totalCompany has leases outstanding for certain office spaces, its Burlington, Ontario bakery and its primary distribution center under noncancellable operating lease arrangements. The future minimum lease payments under these operating leases were $2.6 million.
Rent expense under all operating leases was $2.0 million for the year endedagreements as of December 31, 2017, $0.32022 are shown below.
| | | | | |
| (In thousands) | |
| 2023 | $ | 4,966 | |
| 2024 | 5,101 | |
| 2025 | 5,234 | |
| 2026 | 2,655 | |
| 2027 | 1,639 | |
| Thereafter | 4,848 | |
| Total lease payments | 24,443 | |
| Reconciling impact from discounting | (2,095) | |
| Total lease liabilities | $ | 22,348 | |
HOSTESS BRANDS, INC.
NOTES TO CONSOLIDATED FINANCIAL STATEMENTS
Financing Leases
The Company entered into bond and lease agreements with Clark County, Arkansas on October 4, 2022. The bond-lease transaction required the Company to exchange its property to the taxing jurisdiction for tax-exempt bonds issued in the name of the Company and not to exceed $160 million. The Company has used $11.5 million (Successor) for November 4, 2016 through December 31, 2016 and $1.3 million (Predecessor) for2022. As the period January 1, 2016 through November 3, 2016, comparedholder of the bonds, the Company is not required to $0.4 million for the year ended December 31, 2015 (Predecessor).
Future minimummake lease payments as the Company’s obligation to pay rent is equal to the county’s obligation to pay debt service on the bonds. Also on October 4, 2022, the Company entered into agreements for payments in lieu of taxes (PILOT) with Clark County, Arkansas, whereby the county granted ad valorem tax savings with respect to certain real and personal property in Arkadelphia, Arkansas through 2052. In accordance with the PILOT agreements, the Company will owe 35% of the ad valorem taxes on the Arkadelphia, Arkansas property that would have otherwise been due. The Company has elected to use the right of offset under operating leases were as follows:
|
| | | |
| (In thousands) | |
| 2018 | $ | 2,042 |
|
| 2019 | 568 |
|
| 2020 | — |
|
| 2021 | — |
|
| 2022 | — |
|
| Thereafter | — |
|
Capital LeasesASC 210-20 to net the asset and the liability.
The Company entered into a bond-lease agreement with the Development Authority of Columbus, Georgia on December 1, 2013, which was amended in December 2016. The bond-lease transaction required the companyCompany to exchange its property to the taxing jurisdiction for tax-exempt bonds issued in the name of the Company and not to exceed $18 million. As the issuer and holder of the bonds, the Company is not required to make lease payments.payments as the Company’s obligation to pay rent is equal to the county’s obligation to pay debt service on the bonds. On December 16, 2013, the Company received an ad valorem tax agreement from the Columbus, Georgia Board of Tax Assessors granting tax abatement for the real and personal property located at the Company’s Columbus, Georgia bakery through 2023.
The Company has elected to use the right of setoffoffset under Accounting Standards CodificationASC 210-20 to net the asset and the liability.
The Company has a capitaltable below shows the composition of lease obligation of $0.6 millionexpense for the lease locatedperiod:
| | | | | | | | | | | |
| (In thousands) | Year Ended
December 31,
2022 | Year Ended
December 31,
2021 | Year Ended
December 31,
2020 |
| | | |
| | | |
| Operating lease expense | 6,372 | | 6,420 | | 5,722 | |
| Short-term lease expense | 3,032 | | 1,945 | | 2,633 | |
| Variable lease expense | 1,564 | | 1,450 | | 1,763 | |
| $ | 10,968 | | $ | 9,815 | | $ | 10,118 | |
For short-term leases, the Company records rent expense in its consolidated statements of operations on its Southbridge, Massachusetts bakery facility. The base term ofa straight-line basis over the lease is through February 2021.
Future minimumterm. Variable lease payments, under capital leases werewhich primarily include taxes, insurance and common area maintenance, are expensed as follows:incurred. Lease expenses are classified as operating activities within the consolidated statements of cash flows. During the year ended December 31, 2020, the Company amended the existing lease for its Burlington, Ontario bakery. The amendment extended the lease term through October 2030 and provided for two five-year extensions, at the Company’s option.
|
| | | |
| (In thousands) | |
| 2018 | $ | 200 |
|
| 2019 | 200 |
|
| 2020 | 200 |
|
| 2021 | 33 |
|
| 2022 | — |
|
| Thereafter | — |
|
Contractual Commitments
The Company is a party to various long-term arrangements through advance purchase contracts to lock in prices for certain high-volume raw materials and packaging components for normal product production requirements. These advance purchase arrangements are contractual agreements and can only be canceled with a termination penalty that is based upon the current market price of the commodity at the time of cancellation. These agreements qualify for the “normal purchase” exception under accounting standards; and the purchases under these contracts are included as a component of cost of goods sold.
Contractual
As of December 31, 2022, we had purchase commitments were as follows:for various ingredients with a remaining term in excess of one year of $5.2 million.
|
| | | | | | | | | |
| (In millions) | Total Committed | Commitments within 1 year | Commitments beyond 1 year |
| Ingredients | $ | 64.2 |
| $ | 61.2 |
| $ | 3.0 |
|
| Packaging | 35.4 |
| 35.4 |
| — |
|
HOSTESS BRANDS, INC.
NOTES TO CONSOLIDATED FINANCIAL STATEMENTS
Letters of Credit
The Company is a party to Letter of Credit arrangements to provide for the issuance of standby letters of credit in the amount of $2.2$5.9 million and $1.7 million.$6.0 million for the years ended 2022 and 2021, respectively. The arrangements support the collateral requirements for insurance. The Letters of Credit are 100% secured through our Revolver.
15. Related Party Transactions
Prior to the Business Combination, the Company was party to an agreement to employ Mr. Metropoulos as the Executive Chairman. The agreement, dated April 2013, included payment of an annual salary, a performance bonus at the discretion of the board of directors, and expenses related to the use of his personal aircraft. From January 1, 2016 through November 3, 2016, $3.5 million was expensed by the Company for this compensation agreement. For the year ended December 31, 2015, the Company expensed $4.3 million. The agreement with Mr. Metropoulos was terminated in connection with the Business Combination.
In connection with the Business Combination, the Company entered into an Executive Chairman Employment Agreement with Mr. Metropoulos. Under the terms of this agreement, on November 4, 2016, Mr. Metropoulos was granted 2,496,000 fully vested units of Hostess Holdings and an equivalent number of shares of Class B common stock in the Company as compensation for his continuing service as Executive Chairman.
The Company determined the fair value of this compensation as follows:
|
| | | | |
| (In thousands, except share data) | | |
| Number of Class B units granted | | 2,496 |
|
| Closing price of equivalent shares of Class A common stock on date of grant | | $ | 11.40 |
|
| | | 28,454 |
|
| Discount for lack of marketability | | 6 | % |
| | | $ | 26,747 |
|
As these units are subject to certain sales restrictions, a discount for lack of marketability was determined by using an option pricing method (Finnerty Protective Put Model). The $26.7 million of compensation expense related to these awards is recognized as related party expenses on the consolidated statements of operations for the year ended December 31, 2016 along with less than $0.1 million of other payments under this employment agreement.
Also in connection to the Business Combination, the Company agreed to grant shares of Class A common stock or Class B units of Hostess Holdings and equivalent shares of Class B common stock of the Company to an entity owned by Mr. Metropoulos if certain EBITDA thresholds are met for the year ended December 31, 2017. The potential grants under this arrangement are between zero and 5.5 million shares. Based on the nature of the arrangement, for U.S. GAAP purposes the potential grants are considered to be compensation for future services to be provided by Mr. Metropoulos. In order to receive 2.75 million shares under this agreement, adjusted EBITDA, as calculated pursuant to the terms of the Master Transaction Agreement entered into in connection with the Business Combination, (“MTA EBITDA”), for the year ended December 31, 2017 must be greater than $240.5 million. The minimum EBITDA threshold for the year ended December 31, 2017 was not met and no Class A common shares or Class B units were issued.
Under the terms of Mr. Metropoulos’ employment agreement, the Company is obligated to grant additional equity (in the form of either shares of Class A common stock of the Company, or Class B units of Hostess Holdings and equivalent shares of Class B common stock of the Company) to Mr. Metropoulos if MTA EBITDA thresholds are met for the year ended December 31, 2018. The potential grants range from zero to 2.75 million shares. In order to receive 1.375 million shares under this agreement, MTA EBITDA for the year ended December 31, 2018 must be greater than $257.8 million. If MTA EBITDA is greater than $262.8 million, an additional 1.375 million shares will be awarded. As of December 31, 2017, management determined it was not probable that the Company would meet the 2018 MTA EBITDA thresholds.
16.Unaudited Quarterly Financial Data
Summarized quarterly financial data:
|
| | | | | | | | | | | | | | | | |
| | | Three Months Ended |
| (In thousands) | | December 31, 2017 | | September 30, 2017 | | June 30, 2017 | | March 31, 2017 |
| | | (Successor) | | (Successor) | | (Successor) | | (Successor) |
| Net revenue | | $ | 196,221 |
| | $ | 192,250 |
| | $ | 203,178 |
| | $ | 184,538 |
|
| Operating income | | 100,762 |
| | 38,716 |
| | 49,792 |
| | 44,723 |
|
| Net income | | 189,574 |
| | 16,130 |
| | 28,207 |
| | 24,199 |
|
| Net income (loss) attributable to Class A shareholders/partners | | 179,686 |
| | 9,549 |
| | 18,830 |
| | 15,832 |
|
| Earnings (loss) per Class A share: | | | | | | | | |
| Basic | | $ | 1.80 |
| | .10 | | .19 | | .16 |
| Diluted | | $ | 1.74 |
| | .09 | | .18 | | .15 |
As a result of Tax Reform, the Company remeasured its net deferred tax liabilities and recognized a $111.3 million non-cash tax benefit and also recognized a gain on the remeasurement of the tax receivable arrangement of $51.8 million during the three months ended December 31, 2017.
|
| | | | | | | | | | | | | | | | | | | | | |
| (In thousands) | | From November 4, 2016 through December 31, 2016 | | | From October 1, 2016 through November 3, 2016 | | Three Months Ended September 30, 2016 | | Three Months Ended June 30, 2016 | | Three Months Ended March 31, 2016 |
| | | (Successor) | | | (Predecessor) | | (Predecessor) | | (Predecessor) | | (Predecessor) |
| Net revenue | | $ | 111,998 |
| | | $ | 66,831 |
| | $ | 196,197 |
| | $ | 192,343 |
| | $ | 160,217 |
|
| Operating income | | (9,607 | ) | | | (15,022 | ) | | 51,667 |
| | 48,600 |
| | 37,640 |
|
| Net income (loss) | | (8,485 | ) | | | (21,084 | ) | | 33,513 |
| | 29,472 |
| | 18,537 |
|
| Income (Loss) per Class A share: | |
| | |
| |
| |
| |
|
| Basic | | $ | (0.05 | ) | | |
| |
| |
| |
|
| Diluted | | $ | (0.05 | ) | | |
| |
| |
| |
|
The following table sets forth the high and low sales prices for shares of our Class A common stock and warrants for the quarterly periods indicated, as reported on NASDAQ:
|
| | | | | | | | | | | | | | | |
| | Class A Common Stock | | Warrants |
| Year Ended December 31, 2017 | High | | Low | | High | | Low |
| First Quarter | $ | 16.48 |
| | $ | 12.75 |
| | $ | 3.00 |
| | $ | 1.73 |
|
| Second Quarter | 17.18 |
| | 14.93 |
| | 3.57 |
| | 2.43 |
|
| Third Quarter | 16.55 |
| | 13.00 |
| | 3.04 |
| | 1.69 |
|
| Fourth Quarter | 15.40 |
| | 11.00 |
| | 2.49 |
| | 1.23 |
|
| Year Ended December 31, 2016 | | | | | | | |
| First Quarter | $ | 10.00 |
| | $ | 9.50 |
| | $ | 0.40 |
| | $ | 0.21 |
|
| Second Quarter | 9.80 |
| | 9.50 |
| | 0.36 |
| | 0.16 |
|
| Third Quarter | 11.16 |
| | 9.72 |
| | 1.38 |
| | 0.25 |
|
| Fourth Quarter | 13.50 |
| | 10.67 |
| | 1.98 |
| | 1.13 |
|
17. Subsequent Events
Tax Receivable Agreement
On January 26, 2018, the Company entered into an agreement to terminate all future payments payable under the Tax Receivable Agreement to the Apollo Funds in exchange for a payment of $34.0 million. The agreement did not affect the portion of the rights under the Tax Receivable Agreement for the remaining Legacy Hostess Equity Holders. However, if the Company enters into a definitive agreement on or before January 26, 2019 and that agreement results in a change of control (as defined in the Tax Receivable Agreement), the Company would be required to make an additional payment of $10.0 million to the Apollo Funds. Prior to the buyout, the Company anticipated making its first payment under the Tax Receivable Agreement between $14.0 and $15.0 million in 2018. As a result of the buyout, the first estimated payment to be made in 2018 will be reduced to between $8 million and $9 million.
The summary of expected cash payments under the Tax Receivable Agreement after the buyout and reflecting the impact of Tax Reform is as follows:
|
| |
(In millions) | Estimated Cash
Payments
|
2018 | $8.0 - $9.0 |
2019 | 4.0 - 5.0 |
2020 | 4.0 - 5.0 |
2021 | 4.0 - 5.0 |
Thereafter | 57.0 - 58.0 |
Total estimated payments | $77.0 - $82.0 |
Acquisition
On February 1, 2018, the Company acquired certain U.S. breakfast assets of Aryzta, LLC, primarily including a bakery facility, inventory and the Big Texas ® and Cloverhill ® tradenames for a purchase price of approximately $25 million. A preliminary allocation of the purchase price to the net assets acquired for this business combination is expected to be made during the first quarter of 2018.
Item 9. Changes in and Disagreements with Accountants on Accounting and Financial Disclosure
None.
| |
Item 9A. | Controls and Procedures |
Item 9A. Controls and Procedures
(a) Evaluation Of Disclosure Controls And Procedures
We have established disclosure controls and procedures (as defined in Rules 13a-15(e) and 15d-15(e)) of the Securities Exchange Act of 1934, as amended (the “Exchange Act”), that are designed to provide reasonable assurance that information required to be disclosed in our reports filed or submitted under the Exchange Act is recorded, processed, summarized and reported within the time periods specified in the rules and forms of the Securities and Exchange Commission, and that information relating to the Company is accumulated and communicated to management, including our Chief Executive Officer and Chief Financial Officer, as appropriate, to allow timely decisions regarding required disclosure. Under the supervision and with the participation of our management, including our Chief Executive Officer and our Chief Financial Officer, we evaluated the effectiveness of the design and operation of our disclosure controls and procedures as of December 31, 2022, the end of the period covered by this report. Based on that evaluation, the Chief Executive Officer and Chief Financial Officer have concluded that our current disclosure controls and procedures arewere effective as of December 31, 2022 at a level of reasonable assurance.
(b) Management’s Report On Internal Control Over Financial Reporting
Our management is responsible for establishing and maintaining adequate internal control over financial reporting, as defined in Exchange Act Rule 13a-15(f). Under the supervision and with the participation of our management, including our Chief Executive Officer and Chief Financial Officer, we conducted an evaluation of the effectiveness of our internal control over financial reporting based on criteria established in Internal Control - Integrated Framework(2013) by the Committee of Sponsoring Organization of the Treadway Commission. Based on that evaluation, our management concluded that our internal control over financial reporting was effective as of December 31, 2017.
Attestation Report Of The Registered Public Accounting Firm
2022. The effectiveness of the Company’s internal control ofover financial reporting as of December 31, 20172022 has been audited by KPMG LLP, an independent registered public accounting firm, as stated in their report which appears herein.
(c) Changes in Internal Control over Financial Reporting
Changes In Internal Controls
During 2017, the Company completed its implementation of internal control over financial reporting in a manner commensurate with the scale of our operations subsequent to the November 4, 2016 Business Combination.
Except as disclosed above, there hasThere have been no changechanges in the Company’sour internal control over financial reporting during 2017the most recent calendar quarter that has materially affected, or is reasonably likely to materially affect, the Company’sour internal control over financial reporting.
Item 9B. Other Information
None.
Item 9C. Disclosure Regarding Foreign Jurisdictions that Prevent Inspections
Not applicable.
Item 10. Directors, Executive Officers and Corporate Governance
The information required by this item will be contained in our definitive proxy statement to be filed with the SEC in connection with our 20182023 Annual Meeting of Stockholders, which is expected to be filed not later than 120 days after the end of our fiscal year, and is incorporated herein by reference.
Item 11. Executive Compensation
The information required by this item will be contained in our definitive proxy statement to be filed with the SEC in connection with our 20182023 Annual Meeting of Stockholders, which is expected to be filed not later than 120 days after the end of our fiscal year, and is incorporated herein by reference.
Item 12. Security Ownership of Certain Beneficial Owners and Management and Related Stockholder Matters
The information required by this item will be contained in our definitive proxy statement to be filedfiled with the SEC in connection with our 20182023 Annual Meeting of Stockholders, which is expected to be filed not later than 120 days after the end of our fiscal year, and is incorporated herein by reference.
Item 13. Certain Relationships and Related Transactions, and Director Independence
The information required by this item will be contained in our definitive proxy statement to be filed with the SEC in connection with our 20182023 Annual Meeting of Stockholders, which is expected to be filed not laterlater than 120 days after the end of our fiscal year, and is incorporated herein by reference.
Item 14. Principal AccountingAccountant Fees and Services
Our independent registered public accounting firm is KPMG LLP, Kansas City, MO, Auditor Firm ID: 185.
The information required by this item will be contained in our definitive proxy statement to be filed with the SEC in connection with our 20182023 Annual Meeting of Stockholders, which is expected to be filed not later than 120 days after the end of our fiscal year, and is incorporated herein by reference.
Part IV.
Item 15. Exhibits, Financial Statement Schedules
Financial Statements and Financial Statement Schedules
See “Index to Consolidated Financial Statements”consolidated financial statements” in Part II, Item 8 of this Annual Report on Form 10-K. Financial statement schedules have been omitted because they are not required or are not applicable or because the information required in those schedules either is not material or is included in the consolidated financial statements or the accompanying notes.
Item 6. Exhibits
|
| | | | | | | | | | | | | |
| Exhibit No. | | Description | | |
2.1*2.2* | | Master TransactionShare Purchase Agreement, dated as of July 5, 2016,November 29, 2019, by and among Gores Holdings,Hostess Brands, LLC, SPE Partners V, LP, Pacific Street Fund III, LP, PPM American Private Equity Fund V, LP, the Manufacturers Life Insurance Company, Roynat Capital Inc., Homer Merger Sub,Voortman Enterprises Trust, 2727939 Ontario Inc., AP Hostess Holdings, L.P., Hostess CDM Co-Invest, LLC, CDM Hostess Class C, LLC, and AP Hostess Holdings, L.P., in its capacity as the Sellers’ Representativepersons listed on Exhibit A thereto (1) | | |
| 3.1 | | | | |
| 3.2 | | | | |
| 4.1 | | | | |
| 4.2 | | | | |
4.310.1 | | | | |
10.1 | | | | |
10.2 | | | | |
10.3 | | | | |
10.4 | | | | |
10.5 | | | | |
10.6 | | | | |
10.7 | | Exchange Agreement, dated as of November 4, 2016 by and among Gores Holdings, Inc., Hostess Holdings, L.P., Hostess CDM Co-Invest, LLC, CDM Hostess Class C, LLC , C. Dean Metropoulos, and such other holders of Class B Units from time to time party thereto (2) | | |
10.8 | | Tax Receivable Agreement, dated November 4, 2016, by and among Gores Holdings, Inc., Hostess CDM Co-Invest, LLC, CDM Hostess Class C, LLC, AP Hostess Holdings, L.P., and C. Dean Metropoulos (2)(3) | | |
10.8.110.2 | | Buyout and Amendment Agreement, dated as of January 26, 2018, by and among Hostess Brands, Inc., Hostess CDM Co-Invest, LLC, CDM Hostess Class C, LLC, CDM HB Holdings, LLC, AP Hostess Holdings, L.P., and C. Dean Metropoulos (6) | | |
10.9 | | | | |
10.10 | | Amended and Restated Registration Rights and Lock-Up Agreement, dated as of November 4, 2016, by and among Hostess Brands, Inc., AP Hostess Holdings, L.P., Hostess CDM Co-Invest, LLC, CDM Hostess Class C, LLC, C. Dean Metropoulos, Gores Sponsor LLC, Randy Bort, William Patton and Jeffrey Rea (2) | | |
10.11 | | | | |
10.12 | | | | |
10.13 | | | | |
|
| | | | |
10.1410.3 | | | | |
10.15 | | | | |
10.16 | | | | |
10.1710.4 | | | | |
| 10.5 | | | | |
| 10.6 | | | | |
| 10.7 | | | | |
| 10.8 | | | | |
| 10.9 | | | | |
| 10.10 | | | | |
| 10.11 | | | | |
| 10.12 | | | | |
| 10.13 | | | | |
| 10.14 | | | | |
| 10.15 | | Incremental Assumption and Amendment Agreement No. 5, dated as of January 3, 2020, by and among HB Holdings, LLC, Hostess Brands LLC, certain of Hostess Brands, LLC's subsidiaries, the lenders party thereto, Credit Suisse AG, Cayman Island Branch, as administrative agent and the other parties party thereto.(8) | | |
| 10.16 | | | | |
10.1810.17 | | | | |
10.1921.1 | | | | |
21.1 | | | | |
| 23.1 | | | | |
| 31.1 | | | | |
| 31.2 | | | | |
| | | | | | | | | | | | | | |
| 32.1 | | | | |
| 32.2 | | | | |
| 101.INS | | XBRL Instance Document | | |
| 101.SCH | | XBRL Taxonomy Extension Schema Document | | |
| 101.CAL | | XBRL Taxonomy Extension Calculation Linkbase Document | | |
| 101.DEF | | XBRL Taxonomy Extension Definition Linkbase Document | | |
| 101.LAB | | XBRL Taxonomy Extension Label Linkbase Document | | |
| 101.PRE | | XBRL Taxonomy Extension Presentation Linkbase Document | | |
| 104.1 | | The cover page from this Current Report on Form 8-K, formatted in Inline XBRL | | |
*Schedules and exhibits to this Exhibit omitted pursuant to Regulation S-K Item 601(b)(2). The Company agrees to furnish supplementally a copy of any omitted schedules or exhibits to the SEC upon request.
| |
(1) | Filed as an exhibit to the Company’s Current Report on Form 8-K filed with the SEC on July 5, 2016 and incorporated herein by reference. |
| |
(2) | Filed as an exhibit to the Company’s Current Report on Form 8-K filed with the SEC on November 9, 2016 and incorporated herein by reference. |
| |
(3) | Filed as an exhibit of the Company’s Current Report on Form 8-K filed with the SEC on August 19, 2015 and incorporated herein by reference. |
| |
(4) | Filed as an exhibit to the Company’s Current Report on Form 8-K filed with the SEC on July 27, 2016 and incorporated herein by reference. |
| |
(5) | Filed as an exhibit to the Company’s Current Report on Form 8-K filed with the SEC on August 15, 2016 and incorporated herein by reference. |
| |
(6) | Filed as an exhibit to the Company’s Current Report on Form 8-K filed with the SEC on January 29, 2018 and incorporated herein by reference. |
| |
(7) | Filed as an exhibit to the Company’s Current Report on Form 8-K filed with the SEC on November 20, 2017 and incorporated herein by reference. |
(1)Filed as an exhibit to the Company’s Annual Report on Form 10-K for the fiscal year ended December 31, 2019 filed with the SEC on February 26, 2020 and incorporated herein by reference.
(2)Filed as an exhibit to the Company’s Quarterly Report on Form 10-Q for the quarter ended June 30, 2020 filed with the SEC on August 5, 2020.
(3)Filed as an exhibit to the Company’s Current Report on Form 8-K filed with the SEC on November 9, 2016 and incorporated herein by reference.
(4)Filed as an exhibit to the Company’s Current Report on Form 8-K filed with the SEC on April 13, 2018 and incorporated herein by reference.
(5)Filed as an exhibit to the Company’s Current Report on Form 8-K filed with the SEC on August 6, 2018 and incorporated herein by reference.
(6)Filed as an exhibit to the Company’s Quarterly Report on Form 10-Q for the quarter ended March 31, 2019 filed with the SEC on May 8, 2019 and incorporated herein by reference.
(7)Filed as an exhibit to the Company’s Annual Report on Form 10-K for the fiscal year ended December 31, 2020 filed with the SEC on February 24, 2021 and incorporated herein by reference.
(8)Filed as an exhibit to the Company’s Current Report on Form 8-K filed with the SEC on January 6, 2020 and incorporated herein by reference.
(9)Filed as an exhibit to the Company’s Quarterly Report on Form 10-Q for the quarter ended March 31, 2021 filed with the SEC on May 17, 2021 and incorporated herein by reference.
(10)Filed as an exhibit to the Company's Annual Report on Form 10-K for the fiscal year ended December 31, 2021 filed with the SEC on March 1, 2022 and incorporated herein by reference.
(11)Filed as an exhibit to the Company's Current Report on Form 8-K filed with the SEC on June 10, 2022 and incorporated herein by reference.
(12)Filed as an exhibit to the Company's Current Report on Form 8-K filed with the SEC on December 16, 2022 and incorporated herein by reference.
(13)Filed as an exhibit to the Company's Current Report on Form 8-K filed with the SEC on February 21, 2023 and incorporated herein by reference.
Pursuant to the requirements of Section 13 or 15(d) of the Securities Exchange Act of 1934, the registrant has duly caused this report to be signed on its behalf by the undersigned, thereunto duly authorized, in Lenexa, Kansas City, Missouri on February 28, 2018.
21, 2023.
| | | | | |
| HOSTESS BRANDS, INC. |
| |
HOSTESS BRANDS, INC.By | /s/ Travis E. Leonard |
| |
By | /s/ Thomas Peterson |
| Thomas Peterson
Travis E. Leonard
Executive Vice President, Chief Financial Officer |
Pursuant to the requirements of the Securities Exchange Act of 1934, this report has been signed by the following persons in the capacities and on the date indicated.
| | | | | | | | | | | | | | |
| Signature | | Title | | Date |
| | | |
| /s/ Andrew P. Callahan | | President, Chief Executive Officer (principal executive officer) and Director | February 21, 2023 | | Andrew P. Callahan | | | | | /s/ Travis E. Leonard | | Executive Vice President, Chief Financial Officer (principal financial officer and principal accounting officer) | | February 21, 2023 | | Travis E. Leonard | | | | | /s/ Jerry D. Kaminski | | Chairman and Director | | February 21, 2023 | | Jerry D. Kaminski | | | | | /s/ Olu Beck | | Director | | February 21, 2023 | | Olu Beck | | | | | | /s/ Laurence Bodner | | Director | | February 21, 2023 | | Laurence Bodner | | | | | | /s/ Gretchen R. Crist | | Director | | February 21, 2023 | | Gretchen R. Crist | | | | | | /s/ Rachel P. Cullen | | Director | | February 21, 2023 | | Rachel P. Cullen | | | | | | /s/ Hugh G. Dineen | | Director | | February 21, 2023 | | Hugh G. Dineen | | | | | | /s/ Ioannis Skoufalos | | Director | | February 21, 2023 | | Ioannis Skoufalos | | | | | /s/ Craig D. Steeneck | | Director | | February 21, 2023 | | Craig D. Steeneck | | | | | | | | | Signature | | Title | | Date | | | | | /s/ William Toler | | President and Chief Executive Officer
(principal executive officer)
| | February 28, 2018 | William Toler | | | | /s/ Thomas Peterson | | Executive Vice President, Chief Financial Officer
(principal financial officer and principal accounting officer)
| | February 28, 2018 | Thomas Peterson | | | | /s/ C. Dean Metropoulos | | Executive Chairman | | February 28, 2018 | C. Dean Metropoulos | | | | /s/ Mark Stone | | Director | | February 28, 2018 | Mark Stone | | | | /s/ Laurence Bodner | | Director | | February 28, 2018 | Laurence Bodner | | | | /s/ Neil P. DeFeo | | Director | | February 28, 2018 | Neil P. DeFeo | | | | /s/ Jerry D. Kaminski | | Director | | February 28, 2018 | Jerry D. Kaminski | | | | /s/ Craig D. Steeneck | | Director | | February 28, 2018 | Craig D. Steeneck | | | | | |

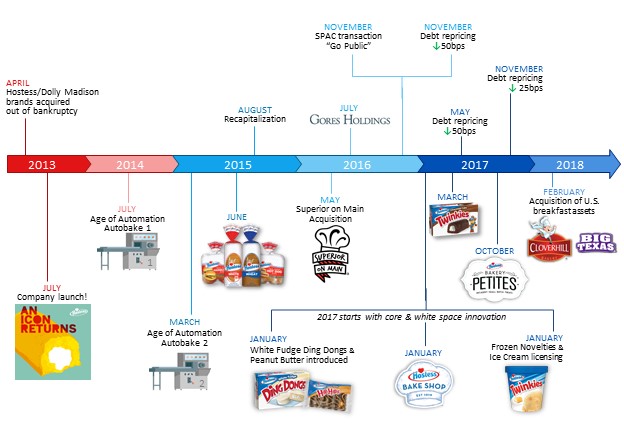
 into everything we do. We seek to leverage our iconic brands, pricing power, impactful innovation, efficient manufacturing and distribution model, collaborative customer and strategic sourcing partnerships, and strong cash flows to drive profitable and sustained growth.