UNITED STATES
SECURITIES AND EXCHANGE COMMISSION
WASHINGTON, D.C. 20549
FORM 10-K
| | | | | |
| (Mark One) | |
| ☑ | ANNUAL REPORT PURSUANT TO SECTION 13 OR 15(d) OF THE SECURITIES EXCHANGE ACT OF 1934 |
For the fiscal year ended December 31, 20202023
OR
| | | | | |
| ☐ | TRANSITION REPORT PURSUANT TO SECTION 13 OR 15(d) OF THE SECURITIES EXCHANGE ACT OF 1934 |
For the transition period from to .
Commission file number 001-37754
RED ROCK RESORTS, INC.
(Exact name of registrant as specified in its charter)
| | | | | |
| Delaware | 47-5081182 |
(State or other jurisdiction of
incorporation or organization) | (I.R.S. Employer
Identification No.) |
1505 South Pavilion Center Drive, Las Vegas, Nevada 89135
(Address of principal executive offices, Zip Code)
(702) 495-3000
(Registrant’s telephone number, including area code)
Securities registered pursuant to Section 12(b) of the Act
| | | | | | | | |
| Title of each class | Trading symbol | Name of each exchange on which registered |
| Class A Common Stock, $.01 par value | RRR | NASDAQ Stock Market |
Securities registered pursuant to Section 12(g) of the Act
None
Indicate by check mark if the registrant is a well-known seasoned issuer, as defined in Rule 405 of the Securities Act. Yes ☑ No ☐
Indicate by check mark if the registrant is not required to file reports pursuant to Section 13 or Section 15(d) of the Act. Yes ☐ No ☑
Indicate by check mark whether the registrant (1) has filed all reports required to be filed by Section 13 or 15(d) of the Securities Exchange Act of 1934 during the preceding 12 months (or for such shorter period that the registrant was required to file such reports), and (2) has been subject to such filing requirements for the past 90 days. Yes ☑ No ☐
Indicate by check mark whether the registrant has submitted electronically every Interactive Data File required to be submitted pursuant to Rule 405 of Regulation S-T (§232.405 of this chapter) during the preceding 12 months (or for such shorter period that the registrant was required to submit such files). Yes ☑ No ☐
Indicate by check mark whether the registrant is a large accelerated filer, an accelerated filer, a non-accelerated filer, a smaller reporting company, or an emerging growth company. See definitions of “large accelerated filer,” “accelerated filer,” “smaller reporting company” and “emerging growth company” in Rule 12b-2 of the Exchange Act.
| | | | | | | | | | | |
| Large accelerated filer | ☑ | Accelerated filer | ☐ |
| Non-accelerated filer | ☐ | Smaller reporting company | ☐ |
|
| Emerging growth company | ☐ |
If an emerging growth company, indicate by check mark if the registrant has elected not to use the extended transition period for complying with any new or revised financial accounting standards provided pursuant to Section 13(a) of the Exchange Act. ☐
Indicate by check mark whether the registrant has filed a report on and attestation to its management’s assessment of the effectiveness of its internal control over financial reporting under Section 404(b) of the Sarbanes-Oxley Act (15 U.S.C.7262(b)) by the registered public accounting firm that prepared or issued its audit report. ☑
If securities are registered pursuant to Section 12(b) of the Act, indicate by check mark whether the financial statements of the registrant included in the filing reflect the correction of an error to previously issued financial statements. ☐
Indicate by check mark whether any of those error corrections are restatements that required a recovery analysis of incentive-based compensation received by any of the registrant’s executive officers during the relevant recovery period pursuant to §240.10D-1(b). ☐
Indicate by check mark whether the registrant is a shell company (as defined in Rule 12b-2 of the Act). Yes ☐ No ☑
As of June 30, 2020,2023, the last business day of the registrant’s most recently completed second fiscal quarter, the aggregate market value of the registrant’s Class A common stock held by non-affiliates (all persons other than executive officers or directors) was $730.9 million,$2.3 billion, based on the closing price on that date as reported by the NASDAQ Stock Market LLC.
Indicate the number of shares outstanding of each of the registrant’s classes of common stock, as of the latest practicable date.
| | | | | | | | |
| Class | | Outstanding at February 15, 20212024 |
| Class A Common Stock, $0.01 par value | | 71,228,16859,202,330 |
| Class B Common Stock, $0.00001 par value | | 46,085,80445,985,804 |
Documents Incorporated by Reference
Portions of the registrant’s definitive Proxy Statement for the 20212024 Annual Meeting of Stockholders are incorporated by reference into Part III of this Annual Report on Form 10-K. Such proxy statement will be filed with the Securities and Exchange Commission within 120 days of the registrant’s fiscal year end of December 31, 2020.2023.
TABLE OF CONTENTS
PART I
ITEM 1.BUSINESS
Introduction
Red Rock Resorts, Inc. (“we,” “our,” “us,” “Red Rock” or the “Company”) is a holding company that owns an indirect equity interest in and manages Station Casinos LLC (“Station LLC”), through which we conduct all of our operations. Station LLC is a gaming, development and management company established in 1976 that develops and operates strategically-located casino and entertainment properties. Station LLC owns and operates tenseven major gaming and entertainment facilities, including Durango Casino & Resort (“Durango”), and ten smaller casinos (three of which are 50% owned). A subsidiaryDurango opened in December of Station LLC also managed Graton Resort & Casino (“Graton Resort”)2023 on approximately 50 acres of land at the intersection of Durango Drive and Interstate 215 in northern California on behalfthe southwest Las Vegas valley. The resort features approximately 533,000 square feet and includes 83,000 square feet of casino space, four full-service food and beverage outlets, a Native American tribe through February 5, 2021.food hall, a state-of-the-art sports book and a resort-style pool.
We own all of the outstanding voting interests in Station LLC and have an indirect equity interest in Station LLC through our ownership of limited liability interests in Station Holdco LLC (“Station Holdco,” and such interests, “LLC Units”), which owns all of the economic interests in Station LLC. At December 31, 2020,2023, we held 60.7%58% of the economic interests and 100% of the voting power in Station Holdco, subject to certain limited exceptions, and we are designated as the sole managing member of both Station Holdco and Station LLC. We control and operate all of the business and affairs of Station Holdco and Station LLC. OurOther than tax-related assets and liabilities, our only assets are our ownership interestsequity interest in Station Holdco, our voting interest in Station LLC and a note receivable from Station Holdco, other than cash and tax-related assets and liabilities.LLC. We have no operations outside of our management of Station Holdco and Station LLC.
Our Consolidated Financial Statements in Part II, Item 8 of this Annual Report on Form 10-K (the “Consolidated Financial Statements”) reflect the consolidation of Station LLC and its consolidated subsidiaries and Station Holdco. The financial position and results of operations attributable to LLC Units we do not own are reported separately as noncontrolling interest.
Our casino properties are conveniently located throughout the Las Vegas Valleyvalley and provide our customers a wide variety of entertainment and dining options. Over 90% of the Las Vegas population is located within five miles of one of our gaming facilities. We provide friendly service and exceptional value in a comfortable environment. We believe we surpass our competitors in offering casino patrons the newest and most popular slot and video games featuring the latest technology. We also believe the high-quality entertainment experience we provide our customers differentiates us from our competitors.
Most of our major properties are master-planned for expansion, enabling us to incrementally expand our facilities as demand dictates. We also control six highly desirable gaming-entitled development sites in Las Vegas.
Our principal source of revenue and operating income is gaming, and our non-gaming offerings include restaurants, hotels and other entertainment amenities. Approximately 80% to 85% of our casino revenue is generated from slot play. The majority of our revenue is cash-based and as a result, fluctuations in our revenues have a direct impact on our cash flows from operations. Because our business is capital intensive, we rely heavily on the ability of our properties to generate operating cash flow to repay debt financing and fund capital expenditures.
Impact of COVID-19
During 2020, our business was significantly negatively impacted by the global pandemic caused by a new strain of coronavirus (“COVID-19”). All of our Las Vegas properties were temporarily closed on March 17, 2020 in compliance with a statewide emergency order mandating the closure of all nonessential businesses in Nevada, including casinos. On June 4, 2020, we reopened our Red Rock, Green Valley Ranch, Santa Fe Station, Boulder Station, Palace Station and Sunset Station properties, as well as our Wildfire properties, subject to state-mandated occupancy and other operational restrictions. At December 31, 2020, our Texas Station, Fiesta Henderson, Fiesta Rancho and Palms properties had not reopened. We will continue to assess the performance of the reopened properties, as well as the recovery of the Las Vegas market and the economy as a whole, before considering whether to reopen some or all of the remaining properties, and we have no plans to reopen any of these properties in 2021.
Subsequent to the reopening of most of our properties in June 2020, we saw favorable customer trends which continued throughout the third and fourth quarters, including strong visitation from a younger demographic, increased spend per visit, more time spent on device, and increased return of our core customers. While these trends helped drive strong post-reopening operating results at our first-to-reopen properties, we cannot predict whether these trends will continue, nor can we predict the extent to which the impacts of COVID-19 on the United States and Las Vegas economies may affect our business in the future.
The COVID-19 pandemic has had and may continue to have a detrimental impact on the United States and Las Vegas economies, including widespread unemployment as well as reduced consumer confidence, discretionary spending and travel. We have taken steps to mitigate these and potential future effects of COVID-19 on our results of operations through a combination of streamlining our business, optimizing our marketing initiatives, and reducing expenses, including staffing reductions in May 2020 that affected approximately 39% of our full-time workforce. However, we continue to have significant fixed and variable expenses that will impact our cash position and profitability. We have implemented comprehensive health and cleanliness standards designed to provide the safest and most secure environment possible for our guests and employees, which include COVID-19 testing of our employees and vendors, personal protective equipment and temperature checks for employees and guests, enhanced cleaning procedures and other measures.
The United States economy and the economy in the Las Vegas metropolitan area have been negatively affected by the unprecedented impacts of COVID-19. A significant portion of our business is dependent upon customers who live and/or work in the Las Vegas metropolitan area. As of December 2020, the unemployment rate in the Las Vegas metropolitan area was 10.4%, down from a high of 34% in April 2020. Statewide, the unemployment rate for December 2020 declined to 9.0%, as compared to 30% in April 2020. Despite the economic impacts of the COVID-19 pandemic, the median price of an existing single-family home in Las Vegas was up 10.2% at December 31, 2020 as compared to the prior year. This continues a trend of significant improvement in home values in Las Vegas since 2012, with the median home price remaining at an all-time high of $314,000 in December 2020 according to the Las Vegas Realtors®. In addition, Las Vegas remains one of the fastest growing metropolitan areas in the United States, posting a 1.5% growth rate in 2020. Due to uncertainties surrounding the ongoing pandemic, we cannot predict whether the recovery in unemployment and the positive trends in housing prices and population growth in the Las Vegas area will continue.
Our principal executive offices are located at 1505 South Pavilion Center Drive, Las Vegas, Nevada 89135. The telephone number for our executive offices is (702) 495-3000. We maintain a website at www.redrockresorts.com, the contents of which are expressly not incorporated by reference into this filing.
Impact of Economic Conditions
A significant portion of our business is dependent upon customers who live and/or work in the Las Vegas metropolitan area. As of December 2023, the unemployment rate in the Las Vegas metropolitan area was 5.3%, down from 5.4% in December 2022 and 6.0% in December 2021. Statewide, the unemployment rate for December 2023 was 5.4%, as compared to 5.2% in December 2022 and December 2021. The median price of an existing single-family home in Las Vegas was $449,900 at December 31, 2023 up 5.9% as compared to December 31, 2022, according to the Las Vegas Realtors®. In addition, Las Vegas remains one of the fastest growing metropolitan areas in the United States, posting a 2.1% growth rate in 2023. In light of uncertainty in the economic outlook stemming from inflationary pressures, higher interest rates and increased energy costs, we cannot predict whether the trends in unemployment, population growth and housing prices in the Las Vegas area will continue.
In 2022, we permanently closed our Texas Station, Fiesta Henderson, Fiesta Rancho and Wild Wild West properties. We sold our Fiesta Henderson parcel in December 2022 and our Texas Station and Fiesta Rancho parcels in November 2023.
Our properties have continued to experience favorable customer trends in 2023, including consistent visitation from our guests, including a younger demographic, and strong spend per visit. These positive trends, in combination with business optimization and cost reduction measures implemented since 2020, have continued to drive strong operating results for our company. However, we cannot predict whether these trends will continue, nor can we predict the extent to which the impacts of inflation, increased energy costs and higher interest rates on the United States and Las Vegas economies may affect our business in the future.
Business Strategy
Our primary operating strategy emphasizes attracting and retaining customers, primarily Las Vegas residents and, to a lesser extent, out-of-town visitors. Our properties attract customers through:
•convenient locations with best-in-class assets;
•offering our customers the latest in slot and video poker technology;
•a variety of non-gaming amenities such as hotel resorts, restaurants, bars and entertainment options;
•focused marketing efforts targeting our extensive customer database;
•innovative, frequent and high-profile promotional programs; and
•convention business.
The Las Vegas regional market is very competitive, and we compete with both large hotel casinos in Las Vegas and smaller gaming-only establishments throughout the Las Vegas Valley.valley.
Provide a high quality, value-oriented gaming and entertainment experience. We are committed to providing a high-value entertainment experience for our guests, as our significant level of repeat visitors demand exceptional service, variety and quality in their overall experience. We offer a broad array of gaming options, including the most popular slot and video poker products, and the latest technological innovations in slots, table games and sports wagering. We believe that providing a wide variety of entertainment options is also a significant factor in attracting guests. In particular, we feature multiple dining options at all of our major properties, which is a primarysignificant motivation for casino visits. We are dedicated to ensuring a high level of guest satisfaction and loyalty by providing attentive guest service in a convenient, friendly and casual atmosphere. As part of our commitment to providing a high-value entertainment experience and to stimulate visitation, we regularly refresh and enhance our gaming and non-gaming amenities.
Generate revenue growth through targeted marketing and promotional programs. Our significant advertising programs generate consistent brand awareness and promotional visibility. Our ability to advertise under a single brand across our portfolio also allows us to achieve material economies of scale. While we advertise through traditional media such as television, radio and newspaper to reach our core guests, we continue to expand our focus and spend on social, digital and mobile platforms to respond to the evolving trends in methods through which guests receive information.
We employ an innovative marketing strategy that utilizes our frequent high-profile promotional programs to attract and retain guests, while also establishing and maintaining a high level of brand recognition. Through our analytical approach to promotional development, we are also able to optimize reinvestment in those guests who deliver stronger results. Our proprietary customer relationship management systems are highly attuned to how guests interact with our properties and products. This information allows us to focus on targeting guests based on their preferences.
We have installed new technology on all of our slot machines which permits us to provide “on device” marketing, bonusing and guest communication, including real-time customized promotions and incentives. We believe that this investment in technology has resulted in an increase in guest loyalty and enhanced the value of our loyalty program. As we continue to introduce new features and brand titles for customized promotional incentives, the technology should continue to help drive participation in our my|Rewards Boarding Pass loyalty program.
Maximize business profitability. During our over 40-year47-year history, we have developed a culture that focuses on operational excellence and cost management. We believe that this focus has contributed to adjusted earnings before interest, taxes, depreciation and amortization (“Adjusted EBITDA”) margins that compare favorably to our public peers over the past several years. Our internally developed proprietary systems and analytical tools provide us with the ability to closely monitor
revenues and operational expenses and provide real-time information to management. Benchmarking across our properties also allows us to create and take advantage of best practices in all functional areas of our business. We believe our existing cost structure, which has low variable costs, can support significant incremental revenue growth while maximizing the flow throughflow-through of revenue to Adjusted EBITDA.
Utilize flexible capital structure to drive growth and equity holderequityholder returns. We maintain a flexible capital structure that we believe allows us to pursue a balance of new growth opportunities and a disciplined return of capital to our equity holders.equityholders. We believe our scalable platform and extensive development and management expertise provide us the ability to build master-planned expansions, pursue acquisitions and/or seek new development opportunities in an effort to maximize equity holderequityholder returns.
Maintain strong employee relations. Station LLC began as a family-run business in 1976 and has maintained close-knit relationships among our management, and we endeavor to instill this same sense of loyalty among our employees. Toward this end, we take a hands-on approach through active and direct involvement with employees at all levels. We believe we have excellent employee relations. See “Human Capital” for more information on our employee relations. In addition, see “Item 1A. Risk Factors—Business, economic, marketEconomic, Market and operating risks—Operating Risks—Union organization activities could disrupt our business by discouraging patrons from visiting our properties, causing labor disputes or work stoppages, and, if successful, could significantly increase our labor costs.”
Develop and operate Native American projects. We currently provide development and management services to a Native American tribetribes using our expertise in developing and operating regional entertainment destinations. We have successfully developed and managed Native American casinos for over 20 years.
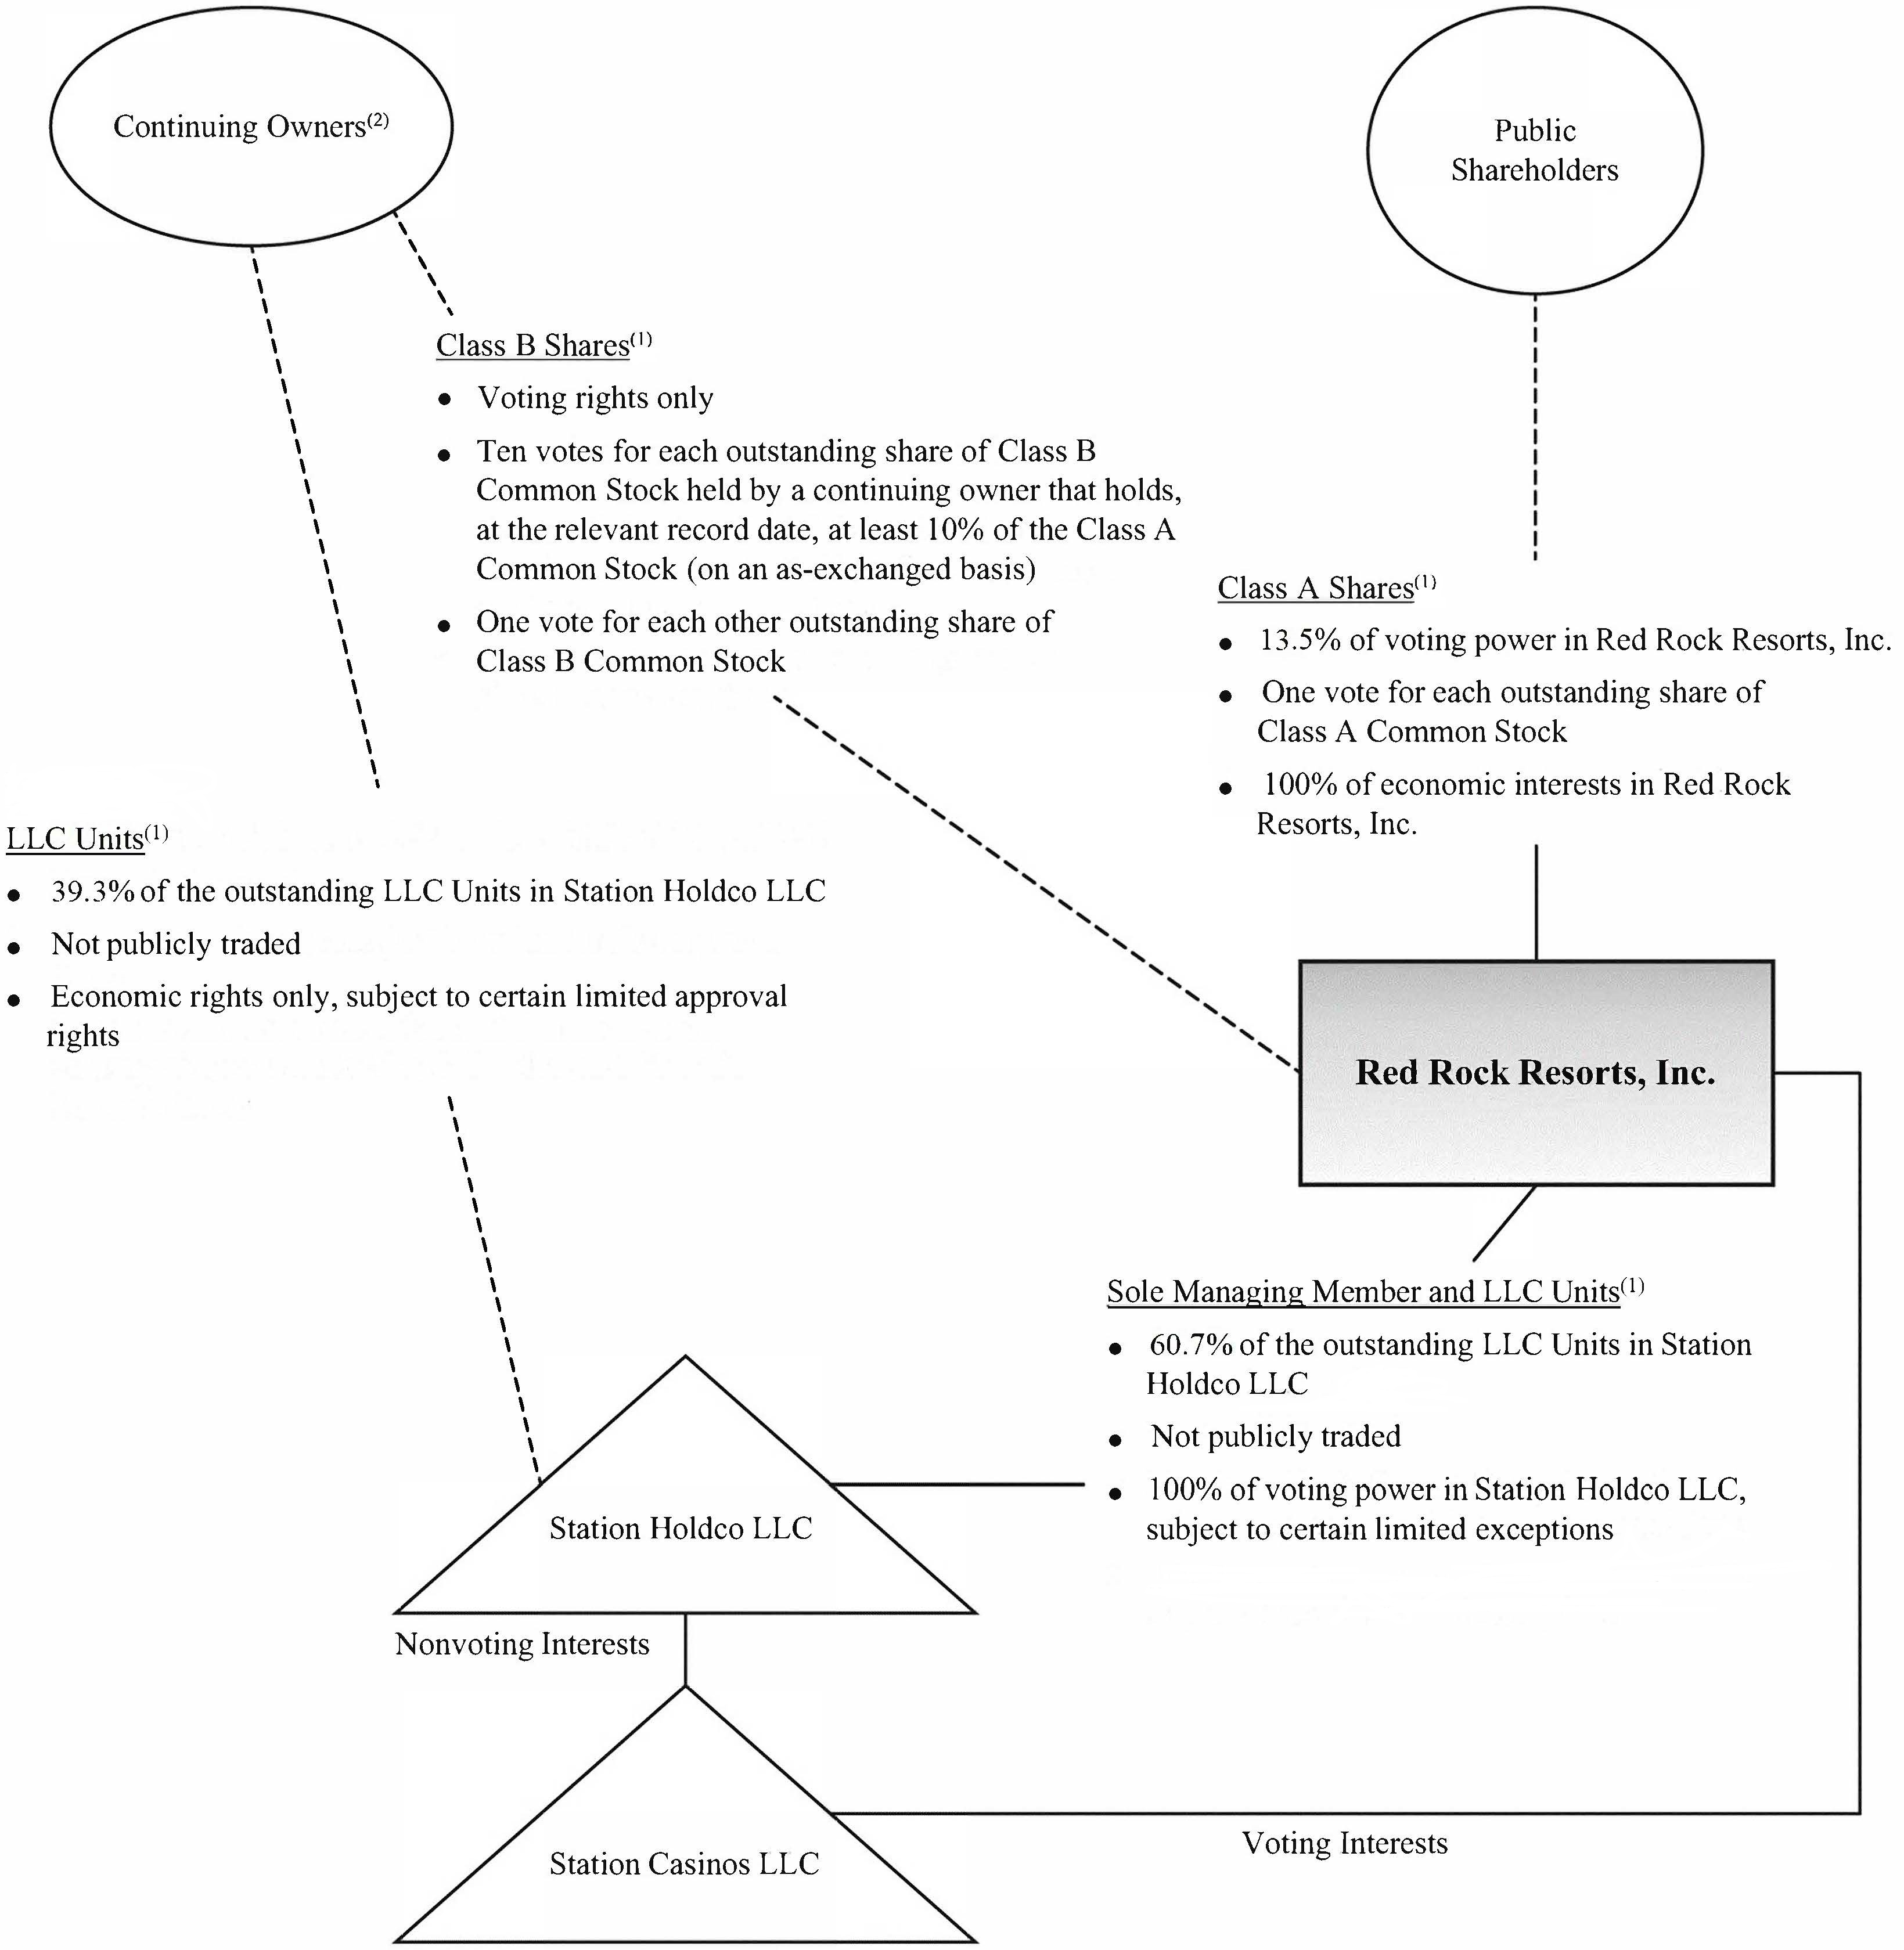
Organizational Structure
The following chart summarizes our organizational structure as of December 31, 2020.2023. This chart is provided for illustrative purposes only and does not purport to represent all legal entities owned or controlled by us:
(1) Shares of Class A common stock and Class B common stock vote as a single class. Each outstanding share of Class A common stock is entitled to one vote; each outstanding share of Class B common stock that is held by a holder that, together with its affiliates, owned at least 30% of the outstanding LLC Units immediately following the consummation of the Company’s public offering in 2016 (the “IPO”) and, at the applicable record date, maintains direct or indirect beneficial ownership of at least 10% of the outstanding shares of Class A common stock (determined on an as-exchanged basis assuming that all of the LLC Units were exchanged for Class A common stock) is entitled to ten votes; and each other outstanding share of Class B common stock is entitled
to one vote. The only holders of Class B common stock that satisfy the foregoing criteria are entities controlled by Frank J. Fertitta III, our Chairman of the Board and Chief Executive Officer, and Lorenzo J. Fertitta, our Vice Chairman of the Board.Board and a Vice President. These entities are referred to herein as the “Fertitta Family Entities” or “Principal Equity Holders.” The exchange ratio for LLC Units and shares of Class B common stock for shares of Class A common stock is a fraction, the numerator of which shall be the number of shares of Class A common stock outstanding immediately prior to the applicable exchange and the denominator of which shall be the number of LLC Units owned by Red Rock and its subsidiaries immediately prior to applicable exchange. The initial exchange ratio andat the exchange ratio as of December 31, 2020IPO date was one share of Class A common stock for each LLC Unit and share of Class B common stock andstock. The exchange ratio is subject to adjustment in the event that the number of outstanding shares of Class A common stock does not equal the number of LLC Units held by Red Rock, including as a result of purchases of shares of Class A common stock by Red Rock with excess cash on hand that does not result in a reduction in the outstanding number of LLC Units held by Red Rock. At December 31, 2023, the exchange ratio was 0.934 shares of Class A common stock for each LLC Unit and share of Class B common stock.
(2) “Continuing Owners” refers to the owners of LLC Units at December 31, 20202023 who held such units prior to the Company’s IPO in May 2016.
Properties
Set forth below is selected information about our properties at December 31, 2020. Due to the impacts of the ongoing COVID-19 pandemic and related operational restrictions, certain amenities listed within the property descriptions below are temporarily closed.2023.
| | Hotel
Rooms | | Slots (1) | | Gaming Tables (2) | | Acreage |
| Hotel
Rooms | | | Hotel
Rooms | | Slots (1) | | Gaming Tables (2) | | Acreage |
| Las Vegas Properties | Las Vegas Properties | | | | | | | |
| Red Rock | Red Rock | 795 | | | 2,505 | | | 70 | | | 64 | |
| Red Rock | |
| Red Rock | |
| Green Valley Ranch | Green Valley Ranch | 495 | | | 2,136 | | | 37 | | | 40 | |
| Durango | |
| Palace Station | Palace Station | 575 | | | 1,516 | | | 51 | | | 30 | |
| Boulder Station | Boulder Station | 299 | | | 2,224 | | | 35 | | | 46 | |
| Sunset Station | Sunset Station | 457 | | | 1,993 | | | 31 | | | 80 | |
| Santa Fe Station | Santa Fe Station | 200 | | | 2,259 | | | 49 | | | 39 | |
| Wild Wild West | 260 | | | 164 | | | — | | | 20 | |
| Wildfire Rancho | Wildfire Rancho | — | | | 161 | | | — | | | 5 | |
| Wildfire Fremont | |
| Wildfire Boulder | Wildfire Boulder | — | | | 159 | | | — | | | 2 | |
| Wildfire Sunset | Wildfire Sunset | — | | | 127 | | | — | | | 1 | |
| Wildfire Lake Mead | Wildfire Lake Mead | — | | | 70 | | | — | | | 3 | |
| Wildfire Valley View | Wildfire Valley View | — | | | 35 | | | — | | | — | |
| Wildfire Anthem | Wildfire Anthem | — | | | 15 | | | — | | | — | |
| 50% Owned Properties | 50% Owned Properties | |
| Barley’s | Barley’s | — | | | 184 | | | — | | | — |
| Barley’s | |
| Barley’s | | — | | | 186 | | | — | | | — |
| The Greens | The Greens | — | | | 38 | | | — | | | — | The Greens | — | | | 40 | | 40 | | | — | | — | | | — | | — |
| Wildfire Lanes | Wildfire Lanes | — | | | 183 | | | — | | | 9 | |
| 3,081 | | | 13,769 | | | 273 | | | 339 | |
| Closed Las Vegas Properties (3) | |
Palms (4) | 1,363 | | | 1,420 | | | 53 | | | 37 | |
| Texas Station | 199 | | | 1,668 | | | 23 | | | 47 | |
| Fiesta Rancho | 100 | | | 1,010 | | | 12 | | | 25 | |
| Fiesta Henderson | 224 | | | 1,398 | | | 18 | | | 35 | |
| 4,967 | | | 19,265 | | | 379 | | | 483 | |
| | Managed Property | |
Graton Resort & Casino (5) | 200 | | | 3,185 | | | 115 | | | 254 | |
| 3,030 | |
(1)Includes slot and video poker machines.
(2)Generally includes blackjack (“21”), craps, roulette, pai gow and baccarat.
(3)Prior to closing on March 17, 2020.
(4)Hotel rooms include 599 condominium units.
(5)Our management agreement for Graton Resort was terminated on February 5, 2021.
Red Rock
Red Rock opened in 2006 and is strategically located at the intersection of Interstate 215 and Charleston Boulevard in the Summerlin master-planned community in Las Vegas, Nevada. Red Rock is adjacent to Downtown Summerlin, a 1.6 million square-foot outdoor shopping, dining and entertainment center; City National Arena, which features two National Hockey League-sized ice sheets for use by both the Vegas Golden Knights team and the public; and Las Vegas Ballpark, the home of the Las Vegas Aviators professional Triple-A baseball team. Red Rock’s gaming amenities include slots, table games, and a race and sports book. Red Rock is a AAA Four Diamond resort featuring an elegant desert oasis theme with a contemporary design featuring luxury amenities. This resort offers six styles of suites, including one-of-a-kind custom villas and penthouse
suites, in addition to standard guest rooms. Additional non-gaming amenities include nineten full-service restaurants, a 16-screen movie theater complex, approximately 94,000 square feet of meeting and convention space, a full-service spa and salon, a 72-lane bowling center, a Kid’s Quest child care facility and a gift shop. Red Rock also features numerous bars and lounges, new high limit slot and offerstable games rooms and a variety of quick-serve restaurants.
Green Valley Ranch
Green Valley Ranch opened in 2001 and is strategically located at the intersection of Interstate 215 and Green Valley Parkway in Henderson, Nevada. Green Valley Ranch is approximately five minutes from McCarranHarry Reid International Airport and seven minutes from the Las Vegas Strip. Green Valley Ranch was designed to complement the Green Valley master-planned community. This Mediterranean styleGreen Valley Ranch gaming amenities include slots, table games, including a new high limit table games room that opened in November 2023, and a race and sports book. Green Valley Ranch is a Mediterranean-style AAA Four Diamond resort featuresfeaturing standard guest rooms and suites, eight full-service restaurants, a 4,200-square-foot non-gaming arcade, a European Spa with outdoor pools, a 10-screen movie theater complex, a Kid’s Quest child care facility, a gift shop and approximately 65,000 square feet of meeting and convention space which includes the Grand Events Center and El Cielo Ballroom. Green Valley Ranch also offers an eight-acre outdoor complex featuring private poolside cabanas and a contemporary poolside bar and grill. Green Valley Ranch also features several bars and offers a variety of quick-serve restaurants.
Durango Casino & Resort
Durango Casino & Resort opened in December of 2023 and is strategically located at the intersection of Durango Drive and Interstate 215 in the southwest Las Vegas valley. Durango is located within the fastest growing area in the Las Vegas Valley and has excellent visibility and access from Interstate 215. As a result of gaming and land use restrictions, there are no major casino sites, other than those owned by us, within approximately five miles of this site. The approximately 533,000 square foot resort features standard guest rooms and suites, approximately 83,000 square feet of casino space offering slots, table games, individual high limit slot and table games rooms and a state-of-the-art sports book. Non-gaming amenities include four full-service food and beverage outlets, a food hall, four bars, a resort-style pool and over 25,000 square feet of meeting and event space.
Palace Station
Palace Station opened in 1976 and is strategically located at the intersection of Sahara Avenue and Interstate 15, one of Las Vegas’ most heavily traveled areas. Palace Station is a short distance from McCarranHarry Reid International Airport and very close to major attractions on the Las Vegas Strip and in downtown Las Vegas. In December 2018, Palace Station completedStation’s gaming amenities include slots, table games and a $192.6 million redevelopment project, which added 178,000 square feet of gamingrace and entertainment space to the property, along with a refreshed exterior look. Highlights of the propertysports book. Palace Station’s non-gaming amenities include a fully renovated and expanded gaming floor, 575 updated hotel rooms and suites, a new resort-style pool area, a state-of-the-art bingo room, a fully renovated poker room, a fully renovated race and sports book, a nine-screen Regal CinnebarreCinebarre luxury movieplex, and two LED marquee signs. In addition to the new venues and upgrades, Palace Station offers other non-gaming amenities including sixfour full-service restaurants, three bars, an approximately 20,000-square-foot meeting and convention center and a gift shop. In addition to its many full-service restaurants, Palace Station also offers a variety of quick-serve restaurants.
Boulder Station
Boulder Station opened in 1994 and is strategically located at the intersection of Boulder Highway and Interstate 515. Boulder Station is located approximately four miles east of the Las Vegas Strip and approximately four miles southeast of downtown Las Vegas. Boulder Station features a turn-of-the-20th-century railroad station theme with non-gamingtheme. Gaming amenities including threeinclude slots, table games and a race and sports book. Non-gaming amenities include four full-service restaurants, a 750-seat entertainment lounge, fourfive bars, an 11-screen movie theater complex, a Kid’s Quest child care facility, a swimming pool, a non-gaming video arcade and a gift shop. Boulder Station also offers a variety of quick-serve restaurants.
Sunset Station
Sunset Station opened in 1997 and is strategically located at the intersection of Interstate 515 and Sunset Road. Situated in a highly concentrated commercial corridor along Interstate 515, Sunset Station has prominent visibility from the freeway and the Sunset commercial corridor. Sunset Station is located approximately 4.5 miles east of McCarranHarry Reid International Airport and approximately 5.5 miles southeast of Boulder Station. Sunset Station features a Spanish/Mediterranean style theme. Additional non-gamingGaming amenities include fiveslots, table games and a race and sports book. Non-gaming amenities include four full-service restaurants, approximately 13,000 square feet of meeting space, a 500-seat entertainment lounge, a 5,000-seat outdoor amphitheater, six bars, a gift shop, a non-gaming video arcade, a 13-screen
luxury seating movie theater complex, a 72-lane bowling center, a Kid’s Quest child care facility and a swimming pool. In addition, the center of the casino features a bar highlighted by over 8,000 square feet of stained glass. Sunset Station also offers a variety of quick-serve restaurants.
Santa Fe Station
We purchased Santa Fe Station in 2000 and subsequently refurbished and expanded the facility. Santa Fe Station is strategically located at the intersection of U.S. Highway 95 and Rancho Drive, approximately five miles northwest of Texas Station.Drive. Santa Fe Station features non-gamingStation’s gaming amenities including fiveinclude slots, table games and a race and sports book. Non-gaming amenities include four full-service restaurants, a gift shop, a non-gaming video arcade, a swimming pool, a 500-seat entertainment lounge, four bars and grills, a 60-lane bowling center, a 16-screen luxury seating movie theater complex, a Kid’s Quest child care facility and over 14,000 square feet of meeting and banquet facilities. Santa Fe Station also features a bar which is a centerpiece of the casino. In addition, Santa Fe Station offers a variety of quick-serve restaurants.
Wild Wild WestWildfire Fremont
We purchased Wild Wild Westopened Wildfire Fremont in 1998. Wild Wild WestFebruary 2023. Wildfire Fremont is strategically located on Tropicana Avenue immediately adjacent to Interstate 15. Wild Wild West’s non-gaming amenities includeFremont Street approximately three miles northwest of Boulder Station. Wildfire Fremont has approximately 200 slot machines, a hotel,sports book, a full-service restaurant a bar, a gift shop and a truck plaza.bar.
Wildfire Rancho
We purchased Wildfire Rancho in 2003. Wildfire Rancho is located on Rancho Drive, across from Texasapproximately five miles southeast of Santa Fe Station. Wildfire Rancho’s gaming amenities include slots and a sports book. Wildfire Rancho’s non-gaming amenities include a lounge, outdoor patio and quick-serve food offerings.
Wildfire Boulder and Wildfire Sunset
We purchased Wildfire Boulder and Wildfire Sunset in 2004. Both properties are located in Henderson, Nevada, and offer gaming amenities which include slots and sports wagering. In addition, both properties offer non-gaming amenities which include a quick-serve restaurant and a bar. Wildfire Boulder is located approximately seveneight miles southeast of Fiesta Henderson.Sunset Station. Wildfire Sunset is located next to Sunset Station.
Wildfire Lake Mead
We purchased Wildfire Lake Mead in 2006. Wildfire Lake Mead, which is located in Henderson, Nevada, and features slots, a sports book, a bar and quick-serve food offerings.
Wildfire Valley View and Wildfire Anthem
We purchased Wildfire Valley View and Wildfire Anthem in 2013. Wildfire Valley View is located in Las Vegas and Wildfire Anthem is located in Henderson, Nevada. Gaming amenities offered by Wildfire Valley View and Wildfire Anthem include slots. Non-gaming amenities offered by Wildfire Valley View and Wildfire Anthem include a bar and quick-serve food offerings.
Barley’s, The Greens and Wildfire Lanes
We own a 50% interest in three smaller properties in Henderson, Nevada including Barley’s, which features slots, a casinosports book and brew pub,a restaurant, The Greens, which features slots, a restaurant and lounge, and Wildfire Lanes, which features slots, a sports book, a quick-serve restaurant, two bars and an 18-lane bowling center.
Palms
We purchased Palms in 2016. Palms is strategically located just west of the center of the Las Vegas Strip off Interstate 15 on Flamingo Road. In September 2019, Palms completed a $690 million redevelopment project, which repositioned and reimagined the property. The redevelopment included a completely renovated casino floor featuring the addition of approximately 300 slot machines and 16 table games; new slot and table games high limit rooms; 33,000 square feet of completely renovated meeting and convention space; a new hotel front desk registration and VIP registration and reception areas; 282 fully redesigned and renovated premium hotel rooms and one-of-a-kind luxury suites, as well as construction of 60 new hotel rooms in the Fantasy Tower; a casino connector integrating the adjacent 599-room Palms Place tower directly into the newly expanded casino floor; an indoor connector to the pre-existing self-park garage with ingress directly into the newly expanded casino floor; and an all-new exterior look, including a new marquee, state-of-the-art digital signage on the hotel tower exterior, a modernized porte cochere, and new exterior facades and lush landscaping.
The redevelopment also added several new full-service restaurants and dining options and an iconic center bar, Unknown, featuring signature art pieces from world-renowned artist Damien Hirst. In addition to its many full-service
restaurants, Palms also offers a variety of quick-serve restaurants. Apart from these new venues and upgrades, Palms offers other non-gaming amenities that were upgraded in the redevelopment, including: a fully upgraded 14-screen Brendan Theatres luxury movieplex; a resort pool; a complete renovation of the 2,500-seat Pearl Concert Theater; a full-service and state-of-the art 8,000 square foot recording studio, and a new wellness spa and salon.
Texas Station
Texas Station opened in 1995 and is strategically located at the intersection of Lake Mead Boulevard and Rancho Drive in North Las Vegas. Texas Station features a friendly Texas atmosphere, highlighted by distinctive early Texas architecture with non-gaming amenities including four full-service restaurants, a Kid’s Quest child care facility, a 300-seat entertainment lounge, a 2,000-seat event center, six bars, an 18-screen movie theater complex, a swimming pool, two non-gaming video arcades, a gift shop, a 60-lane bowling center and approximately 40,000 square feet of meeting and banquet space. Texas Station also offers several unique bars and lounges as well as a variety of quick-serve restaurants.
Fiesta Rancho
We purchased Fiesta Rancho in 2001. Fiesta Rancho is strategically located at the intersection of Lake Mead Boulevard and Rancho Drive in North Las Vegas across from Texas Station. Fiesta Rancho features non-gaming amenities including full-service restaurants, a gift shop, a non-gaming video arcade, a swimming pool, a 700-seat entertainment lounge, a regulation-size ice skating rink and several bars. Fiesta Rancho’s restaurants also include a variety of quick-serve restaurants.
Fiesta Henderson
We purchased Fiesta Henderson in 2001 and subsequently refurbished and expanded the facility. Fiesta Henderson is strategically located at the intersection of Interstate 215 and Interstate 515 in Henderson, Nevada, approximately three miles southeast of Sunset Station. Fiesta Henderson features non-gaming amenities including four full-service restaurants, a 12-screen movie theater complex, a gift shop, a swimming pool, four bars and lounges and meeting space. Fiesta Henderson also offers a variety of quick-serve restaurants.
Graton Resort & Casino
Until February 5, 2021 we managed Graton Resort in northern California, which opened in November 2013, on behalf of the Federated Indians of Graton Rancheria, a federally recognized Native American tribe (the “FIGR”). The management agreement had a term of seven years from the opening date and was originally expected to expire in November 2020, but was extended as a result of the COVID-19 pandemic through February 5, 2021, when the FIGR terminated our management role at Graton Resort. We believe the FIGR terminated the management agreement prematurely and we are currently attempting to resolve that issue with the FIGR.
Developable Land
We own approximately 315441 acres of developable land comprised of six strategically-located parcels in Las Vegas, Nevada, each of which is zoned for casino gaming and other commercial uses. We also own three additional development sites that are currently for sale. Following is a description of suchour parcels of land held for development or sale:development:
Land Held for Development
•Durango/I-215: We own approximately 71 acres located at the intersection of Durango Road and Interstate 215 in the southwestern area of the Las Vegas Valley. The site has excellent visibility and access from Interstate 215. As a result of gaming and land use restrictions, there are no major casino sites, other than those owned by us, within approximately five miles of this site.
•Wild Wild West:Viva: We own approximately 96 acres of land located at the intersection of Tropicana Boulevard and Interstate 15, less than one-half mile from the Las Vegas Strip. This site has excellent visibility and access from Interstate 15, on which approximately 290,000 cars per day pass by the site. Included in this site are the 20 acres on which Wild Wild West is located. On the remainder of the site, weWe own a number of commercial and industrial buildings on this site that we lease to third-party tenants.
•Flamingo/I-215: We own approximately 58 acres located between Flamingo Road and Interstate 215 in the master-planned community of Summerlin in Las Vegas. The site has excellent visibility and access from Interstate 215.
•Cactus Avenue: We own approximately 128 acres near the intersection of Cactus Avenue and Las Vegas Boulevard, approximately six miles south of the Las Vegas Strip.
•Via Inspirada/Bicentennial Parkway: We own approximately 4544 acres located on Via Inspirada near Bicentennial Parkway in the Las Vegas Valley,valley, approximately six miles southwest of Green Valley Ranch. This site is the only casino gaming-entitled property in the master-planned community of Inspirada.
•Skye Canyon: We own approximately 4048 acres in northwestern Las Vegas off of U.S. Highway 95 approximately seven miles northwest of Santa Fe Station.
•Boulder Highway: Losee Road/I-215:We own approximately five67 acres at the intersection of Boulder Highway and Oakey Boulevard approximately 1.5 miles southeast of downtown Las Vegas. This site has grandfathered gaming entitlements that predate room and other amenity requirements, which creates greater flexibility with respect to the potential development of this site.
Land Held for Sale
•Mt. Rose Property (Reno): We own approximately 89 acres at the intersection of Mt. Rose Highway and South Virginia Street in Reno, Nevada.
•Cactus Avenue: We own approximately 57 acresland near the intersection of Cactus AvenueInterstate 215 and Losee Road in North Las Vegas Boulevard, approximately six miles south of the Las Vegas Strip.Vegas.
•South Virginia Street/I-580 (Reno): We own approximately eight acres on South Virginia Street near Interstate 580, directly across from the Reno-Sparks Convention Center.
From time to time we may acquire additional parcels or sell portions of our existing sites that are not necessary to the development of additional gaming facilities.
Native American Development
We have entered into developmenta Third Amended and management agreementsRestated Management Agreement (the “Management Agreement”) and a Third Amended and Restated Development Agreement (the “Development Agreement”), each dated November 7, 2023, with the North Fork Rancheria of Mono Indians (the “Mono”), a federally recognized Native American tribe located near Fresno, California, under which we will assist the Mono in developing and operating a gaming and entertainment facility (the “North Fork Project”) to be located on a 305-acre site (the “North Fork Site”) located adjacent to U.S. Highway 99 north of the city of Madera in Madera County, California. The North Fork Site was taken into trust for the benefit of the Mono by the United States Department of the Interior in February 2013.
We willexpect to receive a development fee of 4% of the costs of construction (as defined in the development agreement)Development Agreement) for our development services, which will be paid upon the commencement of gaming operations at the facility. The management agreementManagement Agreement provides for a management fee of 30% of the facility’s net income. As currently contemplated, the North Fork Project is expected to include approximately 2,000 slot machines, approximately 40 table games and several restaurants. The management agreementManagement Agreement and the development agreementDevelopment Agreement have a term of seven years from the opening of the facility.
Development of See Note 6 to the Consolidated Financial Statements for additional information about the North Fork Project is subject to certain governmental and regulatory approvals, including, but not limited to, approval of the management agreement by the National Indian Gaming Commission (“NIGC”).Project.
The development of the North Fork Project is subject to several ongoing legal challenges the receipt of required regulatory approvals and financing. There can be no assurance that the North Fork Project will be successfully completed nor that future events and circumstances will not change our estimates of the timing, scope, and potential for successful completion or that any such changes will not be material. There can be no assurance that we will recover all of our investment in the North Fork Project even if it is successfully completed and opened for business. See Note 5 to the Consolidated Financial StatementsItem 1A. Risk Factors— Business, Economic, Market and Operating Risks - We may not be successful in entering into additional management or development agreements for additional information about the North Fork Project.Native American gaming opportunities.
Intellectual Property
We use a variety of trade names, service marks, trademarks, patents and copyrights in our operations and believe that we have all the licenses necessary to conduct our continuing operations. We have registered several service marks, trademarks, patents and copyrights with the United States Patent and Trademark Office or otherwise acquired the licenses to use those which are material to conduct our business. We file copyright applications to protect our creative artworks, which are often featured in property branding, as well as our distinctive website content.
Seasonality
Our cash flows from operating activities are somewhat seasonal in nature. Our operating results are traditionally strongest in the fourth quarter and weakest duringin the third quarter.
Competition
Our casino properties face competition from all other casinos and hotels in the Las Vegas area, including to some degree, from each other. We compete with other nonrestricted casino/hotels, as well as restricted gaming locations, by focusing on repeat customers and attracting these customers through great service and innovative marketing programs. Our value-oriented, high-quality approach is designed to generate repeat business. Additionally, our casino properties are strategically located and designed to permit convenient access and ample free parking, which are critical factors in attracting local visitors and repeat patrons.
At December 31, 2020,2023, there were approximately 3940 major gaming properties located on or near the Las Vegas Strip, 1416 located in the downtown area and several located in other areas of Las Vegas. We also face competition from 141144 nonrestricted gaming locations in the Clark County area primarily targeted to the local and repeat visitor markets. In addition,
our casino properties face competition from restricted gaming locations (sites with 15 or fewer slot machines) in the greater Las Vegas area. At December 31, 2020,2023, there were approximately 1,4351,504 restricted gaming locations in Clark County with approximately 13,15014,570 slot machines. Major additions, expansions or enhancements of existing properties or the construction of new properties by competitors could have a material adverse effect on our business.
The Nevada legislature enacted SB 208 in 1997. This legislation identified certain gaming enterprise districts wherein casino gaming development would be permitted throughout the Las Vegas Valleyvalley and established more restrictive criteria for the establishment of new gaming enterprise districts. We believe the growth in gaming supply in the Las Vegas regional market has been, and will continue to be, limited by the provisions of SB 208.
To a lesser extent, we compete with gaming operations in other parts of the state of Nevada, such as Reno, Laughlin and Lake Tahoe, and other gaming markets throughout the United States and in other parts of the world, and with state sponsored lotteries, on- and off-track wagering on horse and other races, sports betting, card rooms, online gaming and other forms of legalized gambling. The gaming industry also includes land-based casinos, dockside casinos, riverboat casinos, racetracks with slots and casinos located on Native American land. There is intense competition among companies in the gaming industry, some of which have significantly greater resources than we do. In May 2018, the United States Supreme Court overturned a law prohibiting states from legalizing sports wagering which together with the expansion of sports gaming as a result of the pandemic, has resulted in a substantial expansion of sports gamingbetting outside the state of Nevada. Several states have legalized or are also considering legalizing casino gaming in designated areas. Legalized casino and sports gamingbetting in various states and on Native American land could result in additional competition and could adversely affect our operations, particularly to the extent that such gaming is conducted in areas close to our operations.
We also face competition from internet poker and sports betting operators in Nevada. In addition, internet gaming has commenced in Nevada, New Jersey, Delaware, Pennsylvania, Michigan and Pennsylvania,West Virginia, internet sports betting has commenced in a majority of states, and legislation permitting internet gaming and/or sports betting has been approved or proposed by a number of other states. Expansion of internet gaming in new or existing jurisdictions and on Native American land could result in additional competition for our Las Vegas operations and for the gaming facilities that we may manage for Native American tribes.
Native American gaming in California, as it currently exists, has had little, if any,limited impact on our Las Vegas operations to date, although there are no assurances as to the future impact it may have. In total, 7876 Native American tribes have Tribal-State Compacts with the State of California or procedures with the Secretary of the Interior to operate Class III gaming in California. At December 31, 2020,2023, there were 66 Native American gaming facilities in operation in the State of California. These Native American tribes are allowed to operate slot machines, lottery games, and banked and percentage games (including “21”) on Native American lands. A banked game is one in which players compete against the licensed gaming establishment rather than against one another. A percentage game is one in which the house does not directly participate in the game, but collects a percentage of the amount of bets made, winnings collected, or the amount of money changing hands. It is not certain whether any additional expansion of Native American gaming in California will affect our Las Vegas operations given that visitors from California make up Nevada’s largest visitor market. Increased competition from Native American gaming in California may result in a decline in our revenues and may have a material adverse effect on our business.
Regulation and Licensing
In addition to gaming regulations, our business is subject to various federal, state and local laws and regulations of the United States and Nevada. These laws and regulations include, but are not limited to, restrictions concerning employment and immigration status, currency transactions, zoning and building codes, protection of human health and safety and the environment, marketing and advertising, privacy and telemarketing. SinceBecause we deal with significant amounts of cash in our operations we are subject to various reporting and anti-money laundering regulations. Any violations of anti-money laundering laws or any of the other laws or regulations to which we are subject could result in regulatory actions, fines, or other penalties.
Any material changes, new laws or regulations or material differences in interpretations by courts or governmental authorities or material regulatory actions, fines, penalties or other actions could adversely affect our business and operating results.
Nevada Gaming Laws and Regulations
The ownership and operation of casino gaming facilities and the manufacture and distribution of gaming devices in Nevada are subject to the Nevada Gaming Control Act and the rules and regulations promulgated thereunder (collectively, the “Nevada Act”) and various local ordinances and regulations. Our gaming operations in Nevada are subject to the licensing and regulatory control of the Nevada Gaming Commission (the “Nevada Commission”), the Nevada State Gaming Control Board (the “Nevada Board”), the Las Vegas City Council, the Clark County Liquor and Gaming Licensing Board (the “CCLGLB”), the North Las Vegas City Council,
the Henderson City Council and certain other local regulatory agencies. The Nevada Commission, Nevada Board, Las Vegas City Council, CCLGLB, North Las Vegas City Council, Henderson City Council, and certain other local regulatory agencies are collectively referred to as the “Nevada Gaming Authorities.”
The laws, regulations and supervisory procedures of the Nevada Gaming Authorities are based upon declarations of public policy which are concerned with, among other things: (i) the prevention of unsavory or unsuitable persons from having a direct or indirect involvement with gaming at any time or in any capacity; (ii) the establishment and maintenance of responsible accounting practices and procedures; (iii) the maintenance of effective controls over the financial practices of gaming licensees, including the establishment of minimum procedures for internal controls and the safeguarding of assets and revenues, providing reliable record keeping and requiring the filing of periodic reports with the Nevada Gaming Authorities; (iv) the prevention of cheating and fraudulent practices; and (v) providing a source of state and local revenues through taxation and licensing fees. Changes in such laws, regulations and procedures could have an adverse effect on our gaming operations.
Our indirect subsidiaries that conduct gaming operations in Nevada are required to be licensed by the Nevada Gaming Authorities. The gaming licenses require the periodic payment of fees and taxes and are not transferable. NP Red RockBoulder LLC, NP BoulderDurango LLC, NP Palace LLC, NP Red Rock LLC, NP Santa Fe LLC, NP Sunset LLC, NP Tropicana LLC, NP FiestaStation GVR Acquisition, LLC, NP Gold Rush LLC, NP Lake Mead, LLC, NP Magic Star LLC, NP Rancho LLC, NP Santa Fe LLC, NP Texas LLC, Station GVR Acquisition, LLC, SC SP 2 LLC, NP LML LLC, FPNP Centerline Holdings L.P.LLC and NP River Central LLC hold licenses to conduct nonrestricted gaming operations. SC SP 4 LLC holds a restricted gaming license. NP Opco Holdings LLC is registered as an intermediary company and is licensed as the sole member and manager of NP Opco LLC. NP Opco LLC is registered as an intermediary company and is licensed as the sole member and manager of NP Fiesta LLC, NP Lake Mead LLC, NP Santa Fe LLC, NP Gold Rush LLC, NP Magic Star LLC, NP Rancho LLC, NP Texas LLC, NP River Central LLC, andNP Centerline Holdings LLC, Station GVR Acquisition, LLC and NP Durango LLC. NP Opco LLC is also found suitable as the sole member and manager of NP Green Valley LLC, SC SP Holdco LLC and NP LML LLC. Our ownership in NP TropicanaSC SP Holdco LLC is held through NP Landco Holdco LLC, which has a registrationregistered as an intermediary company and a licenseis licensed as the sole member of NP Tropicana LLC. Our ownership in SC SP 2 LLC is held through SC SP Holdco LLC which has a registration as an intermediary company and a license as a member and manager of SC SP 2 LLC and SC SP 4 LLC. NP Green Valley LLC is registered as an intermediary company and is licensed as a 50% member and the sole manager of Greens Café, LLC, Town Center Amusements, Inc., a Limited Liability Company isand Sunset GV, LLC, which are licensed to conduct nonrestricted gaming operations at Barley’s. Greens Café, LLC is licensed to conduct nonrestricted gaming operations at The Greens, and Sunset GV, LLC is licensed to conduct nonrestricted gaming operations at Wildfire Lanes.operations. A license to conduct “nonrestricted” gaming operations is a state gaming license to conduct an operation of (i) at least 16 slot machines, (ii) any number of slot machines together with any other game, gaming device, race book or sports pool at one establishment, (iii) a slot machine route, (iv) an inter-casino linked system, or (v) a mobile gaming system. SC SP 4 LLC holds a restricted, A license to conduct “restricted” gaming license, whichoperations is a state gaming license to operate not more than 15 slot machines and no other gaming device, race book or sports pool. We are required to periodically submit detailed financial and operating reports to the Nevada Commission and provide any other information that the Nevada Commission may require. Substantially all material loans, leases, sales of securities and similar financing transactions by us and our licensed or registered subsidiaries must be reported to or approved by the Nevada Commission and/or the Nevada Board.
We have been found suitable to indirectly own the equity interests in our licensed and registered subsidiaries (the “Gaming Subsidiaries”) and we are registered by the Nevada Commission as a publicly traded corporation for purposes of the Nevada Act (a “Registered Corporation”). On August 27, 2020,November 16, 2023, the Nevada Commission issued its Sixthapproved the Tenth Revised Order of Registration for the Company that, among other things, reaffirmed our registration as a publicly traded corporation for the purposes of the Nevada Act (“SixthTenth Revised Order”). As a Registered Corporation, we are required to periodically submit detailed financial and operating reports to the Nevada Board and provide any other information the Nevada Board may require. No person may become a more than 5% stockholder or holder of more than a 5% interest in, or receive any percentage of gaming revenue from the Gaming Subsidiaries without first obtaining licenses, approvals and/or applicable waivers from the Nevada Gaming Authorities.
The Nevada Gaming Authorities may investigate any individual who has a material relationship to, or material involvement with, a Registered Corporation or its licensed subsidiaries, in order to determine whether such individual is suitable or should be licensed as a business associate of a Registered Corporation or a gaming licensee. Officers, directors and certain key employees of our licensed subsidiaries must file applications and may be required to be licensed or found suitable by the Nevada Gaming Authorities. Our officers, directors and key employees who are actively and directly involved in gaming activities of our licensed subsidiaries may be required to be licensed or found suitable by the Nevada Gaming Authorities. The Nevada Gaming Authorities may deny an application for licensing for any cause that they deem reasonable. A finding of suitability is comparable to licensing, and both require submission of detailed personal and financial information followed by a thorough investigation. The applicant for licensing or a finding of suitability must pay all the costs of the investigation. Changes in licensed positions must be reported to the Nevada Gaming Authorities and, in addition to their authority to deny an application for a finding of suitability or licensure, the Nevada Gaming Authorities have jurisdiction to disapprove a change in corporate position.
If the Nevada Gaming Authorities were to find an officer, director or key employee unsuitable for licensing or unsuitable to continue to have a relationship with us or our licensed subsidiaries, the companies involved would have to sever all relationships with such person. In addition, the Nevada Commission may require our licensed subsidiaries to terminate the employment of any person who refuses to file the appropriate applications. Determinations of suitability or questions pertaining to licensing are not subject to judicial review in Nevada.
If it were determined that the Nevada Act was violated by a licensed subsidiary, the gaming licenses it holds could be limited, conditioned, suspended or revoked, subject to compliance with certain statutory and regulatory procedures. In addition, the Company, our licensed subsidiaries and the persons involved could be subject to substantial fines for each separate violation of the Nevada Act at the discretion of the Nevada Commission. Further, a supervisor could be appointed by the Nevada Commission to operate our properties, and under certain circumstances, earnings generated during the supervisor’s appointment (except for the reasonable rental value of the premises) could be forfeited to the State of Nevada. Limitation, conditioning or suspension of the gaming licenses of the licensed subsidiaries or the appointment of a supervisor could (and revocation of any such gaming license would) have a material adverse effect on our gaming operations.
Any beneficial owner of our equity securities, regardless of the number of shares owned, may be required to file an application, may be investigated, and may be required to obtain a finding of suitability if the Nevada Commission has reason to believe that such ownership would otherwise be inconsistent with the declared policies of the State of Nevada. If the beneficial owner of our equity securities who must be found suitable is a corporation, partnership, limited partnership, limited liability company or trust, it must submit detailed business and financial information, including a list of its beneficial owners, to the Nevada Board. The applicant must pay all costs of investigation incurred by the Nevada Gaming Authorities in conducting any such investigation.
The Nevada Act provides that persons who acquire beneficial ownership of more than 5% of the voting or non-voting securities of a Registered Corporation must report the acquisition to the Nevada Commission. The Nevada Act also requires that beneficial owners of more than 10% of the voting securities of a Registered Corporation must apply to the Nevada Commission for a finding of suitability within thirty days after the Chair of the Nevada Board mails the written notice requiring such filing. An “institutional investor,” as defined in the Nevada Commission’s regulations, which acquires beneficial ownership of more than 10%, but not more than 25%, of our voting securities may apply to the Nevada Commission for a waiver of such finding of suitability if such institutional investor holds the voting securities for investment purposes only. An institutional investor that has obtained a waiver may, in certain circumstances, hold up to 29% of our voting securities and maintain its waiver for a limited period of time. An institutional investor shall not be deemed to hold voting securities for investment purposes unless the voting securities were acquired and are held in the ordinary course of business as an institutional investor and not for the purpose of causing, directly or indirectly, the election of a majority of the members of our board of directors, any change in our corporate charter, bylaws, management policies or our operations, or any of our gaming affiliates, or any other action which the Nevada Commission finds to be inconsistent with holding our voting securities for investment purposes only. Activities which are not deemed to be inconsistent with holding voting securities for investment purposes only include: (i) voting on all matters voted on by stockholders; (ii) making financial and other inquiries of management of the type normally made by securities analysts for informational purposes and not to cause a change in our management, policies or operations; and (iii) such other activities as the Nevada Commission may determine to be consistent with such investment intent.
Any person who fails or refuses to apply for a finding of suitability or a license within thirty days after being ordered to do so by the Nevada Commission, or the Chair of the Nevada Board, may be found unsuitable. The same restrictions apply to a record owner if the record owner, after request, fails to identify the beneficial owner. Any equity holderequityholder who is found
unsuitable and who holds, directly or indirectly, any beneficial ownership of the common equity of a Registered Corporation beyond such period of time as may be prescribed by the Nevada Commission may be guilty of a criminal offense. We will be subject to disciplinary action if, after we receive notice that a person is unsuitable to be an equity holderequityholder or to have any other relationship with us or our licensed or registered subsidiaries, we (i) pay that person any dividend or interest upon our securities, (ii) allow that person to exercise, directly or indirectly, any voting right conferred through securities held by that person, (iii) pay remuneration in any form to that person for services rendered or otherwise, or (iv) fail to pursue all lawful efforts to require such unsuitable person to relinquish his securities including, if necessary, the immediate purchase of said securities for the price specified by the relevant gaming authority or, if no such price is specified, the fair market value as determined by our board of directors. The purchase may be made in cash, notes that bear interest at the applicable federal rate or a combination of notes and cash. Additionally, the CCLGLB has the authority to approve all persons owning or controlling the stock of any corporation controlling a gaming licensee.
The Nevada Commission may, in its discretion, require the holder of any debt security of a Registered Corporation to file applications, be investigated and be found suitable to own the debt security of a Registered Corporation if the Nevada Commission has reason to believe that such ownership would otherwise be inconsistent with the declared policies of the State of Nevada. If the Nevada Commission determines that a person is unsuitable to own such security, then pursuant to the Nevada Act, the Registered Corporation can be sanctioned, including the loss of its approvals, if without the prior approval of the Nevada Commission, it: (i) pays to the unsuitable person any dividend, interest, or any distribution whatsoever; (ii) recognizes any voting right by such unsuitable person in connection with such securities; (iii) pays the unsuitable person remuneration in any form; or (iv) makes any payment to the unsuitable person by way of principal, redemption, conversion, exchange, liquidation or similar transaction.
We are required to maintain a current membership interest ledger in Nevada, which may be examined by the Nevada Gaming Authorities at any time. If any securities are held in trust by an agent or by a nominee, the record holder may be required to disclose the identity of the beneficial owner to the Nevada Gaming Authorities. Failure to make such disclosure may be grounds for finding the record holder unsuitable. We are also required to render maximum assistance in determining the identity of the beneficial owner.
We may not make a public offering of our securities without the prior approval of the Nevada Commission if the securities or proceeds therefrom are intended to be used to construct, acquire or finance gaming facilities in Nevada, or to retire or extend obligations incurred for such purposes. On September 26, 2019,22, 2022, the Nevada Commission granted us prior approval, subject to certain conditions, to make public offerings for a period of three years (the “Shelf Approval”). The Shelf Approval also applies to any affiliated company wholly owned by us which is a publicly traded corporation or would thereby become a publicly traded corporation pursuant to a public offering. The Shelf Approval may be rescinded for good cause without prior notice upon the issuance of an interlocutory stop order by the Chair of the Nevada Board. If the Shelf Approval is rescinded for any reason, it could adversely impact our capital structure and liquidity and limit our flexibility in planning for, or reacting to, changes in our business and industry. The Shelf Approval does not constitute a finding, recommendation or approval by any of the Nevada Gaming Authorities as to the accuracy or adequacy of any offering memorandum or the investment merits of the securities offered thereby. Any representation to the contrary is unlawful.
Changes in control of the Company through merger, consolidation, stock or asset acquisitions (including stock issuances in connection with restructuring transactions), management or consulting agreements, or any act or conduct by a person whereby such person obtains control, may not occur without the prior approval of the Nevada Commission. Entities seeking to acquire control of a Registered Corporation must satisfy the Nevada Board and the Nevada Commission that they meet a variety of stringent standards prior to assuming control of such Registered Corporation. The Nevada Commission may also require controlling equity holders,equityholders, officers, directors and other persons having a material relationship or involvement with the entity proposing to acquire control, to be investigated and licensed as part of the approval process relating to the transaction.
The Nevada legislature has declared that some corporate acquisitions opposed by management, repurchases of voting securities and corporate defense tactics affecting Nevada corporate gaming licensees, and Registered Corporations that are affiliated with those operations, may be injurious to stable and productive corporate gaming. The Nevada Commission has established a regulatory scheme to ameliorate the potentially adverse effects of these business practices upon Nevada’s gaming industry and to further Nevada’s policy to: (i) assure the financial stability of corporate gaming licensees and their affiliates; (ii) preserve the beneficial aspects of conducting business in the corporate form; and (iii) promote a neutral environment for the orderly governance of corporate affairs. Approvals are, in certain circumstances, required from the Nevada Commission before a Registered Corporation can make exceptional repurchases of voting securities above the current market price thereof and before a corporate acquisition opposed by management can be consummated. The Nevada Act also requires prior approval of a
plan of re-capitalization proposed by the Registered Corporation’s board of directors or similar governing entity in response to a tender offer made directly to the Registered Corporation’s equity holdersequityholders for the purpose of acquiring control of the Registered Corporation.
License fees and taxes, computed in various ways depending on the type of gaming or activity involved, are payable to the State of Nevada and to the counties and cities in which the Nevada licensee’s respective operations are conducted. Depending upon the particular fee or tax involved, these fees and taxes are payable either monthly, quarterly or annually and are based upon either: (i) a percentage of the gross revenues received; (ii) the number of gaming devices operated; or (iii) the number of table games operated. A live entertainment tax is also paid by casino operations where admission charges are imposed for entry into certain entertainment venues. Nevada licensees that hold a license as an operator of a slot route or manufacturer’s or distributor’s license also pay certain fees and taxes to the State of Nevada.
Any person who is licensed, required to be licensed, registered, required to be registered, or is under common control with such persons, and who proposes to become involved in a gaming venture outside of Nevada, is required to deposit with the Nevada Board, and thereafter maintain, a revolving fund in the amount of $10,000 to pay the expenses of investigation by the Nevada Board of their participation in such foreign gaming. The revolving fund is subject to increase or decrease at the discretion of the Nevada Commission. The SixthTenth Revised Order requires us to deposit with the Nevada Board and maintain a revolving fund of $50,000 for all purposes, including foreign gaming and compliance with the SixthTenth Revised Order. Thereafter, licensees are required to comply with certain reporting requirements imposed by the Nevada Act. Licensees are also subject to disciplinary action by the Nevada Commission if they knowingly violate any laws of the foreign jurisdiction pertaining to the foreign gaming operation, fail to conduct the foreign gaming operation in accordance with the standards of honesty and integrity required of Nevada gaming operations, engage in activities or enter into associations that are harmful to the State of Nevada or its ability to collect gaming taxes and fees, or employ, contract with or associate with a person in the foreign operation who has been denied a license or finding of suitability in Nevada on the grounds of unsuitability or whom a court in the state of Nevada has found guilty of cheating. The loss or restriction of our gaming licenses in Nevada would have a material adverse effect on our business and could require us to cease gaming operations in Nevada.
Nevada Liquor Regulations
There are various local ordinances and regulations as well as state laws applicable to the sale of alcoholic beverages in Nevada. Palace Station, Wildfire Rancho, Wildfire Valley View, and Santa Fe Station and Wildfire Fremont are subject to liquor licensing control and regulation by the Las Vegas City Council. Red Rock, Boulder Station Palms, and Wild Wild WestDurango are subject to liquor licensing control and regulation by the CCLGLB. Texas Station and Fiesta Rancho are subject to liquor licensing control and regulation by the North Las Vegas City Council. Sunset Station, Green Valley Ranch, Fiesta Henderson, Barley’s, Wildfire Sunset, Wildfire Boulder, The Greens, Wildfire Anthem, Wildfire Lanes and Wildfire Lake Mead are subject to liquor licensing control and regulation by the Henderson City Council. All liquor licenses are revocable and are, in some jurisdictions, not transferable. The agencies involved have full power to limit, condition, suspend or revoke any such license, and any such disciplinary action could (and revocation would) have a material adverse effect on the operations of our licensed subsidiaries.
Native American Gaming Regulations
The terms and conditions of management contracts and the operation of casinos and all gaming on land held in trust for Native American tribes in the United States are subject to the Indian Gaming Regulatory Act of 1988 (the “IGRA”), which is administered by the NIGC and the gaming regulatory agencies of state and tribal governments. The IGRA is subject to interpretation by the NIGC and may be subject to judicial and legislative clarification or amendment.
The IGRA established three separate classes of tribal gaming: Class I, Class II and Class III. Class I gaming includes all traditional or social games solely for prizes of minimal value played by a Native American tribe in connection with celebrations or ceremonies. Class II gaming includes games such as bingo, pull-tabs, punchboards, instant bingo (and electronic or computer-aided versions of such games) and non-banked card games (those that are not played against the house), such as poker. Class III gaming is casino-style gaming and includes banked table games such as blackjack, craps and roulette, and gaming machines such as slots, video poker, lotteries and pari-mutuel wagering, a system of betting under which wagers are placed in a pool, management receives a fee from the pool, and the remainder of the pool is split among the winning wagers.
The IGRA requires NIGC approval of management contracts for Class II and Class III gaming, as well as the review of all agreements collateral to the management contracts. The NIGC will not approve a management contract if a director or a 10% shareholder of the management company: (i) is an elected member of the governing body of the Native American tribe which is the party to the management contract; (ii) has been or subsequently is convicted of a felony or gaming offense; (iii) has knowingly and willfully provided materially important false information to the NIGC or the tribe; (iv) has refused to respond to
questions from the NIGC; or (v) is a person whose prior history, reputation and associations pose a threat to the public interest or to effective gaming regulation and control, or create or enhance the chance of unsuitable activities in gaming or the business and financial arrangements incidental thereto. In addition, the NIGC will not approve a management contract if the management company or any of its agents have attempted to unduly influence any decision or process of tribal government relating to gaming, or if the management company has materially breached the terms of the management contract or the tribe’s gaming ordinance or resolution, or a trustee, exercising the skill and due diligence that a trustee is commonly held to, would not approve the management contract. A management contract can be approved only after the NIGC determines that the contract provides for, among other things: (i) adequate accounting procedures and verifiable financial reports, which must be furnished to the tribe; (ii) tribal access to the daily operations of the gaming enterprise, including the right to verify daily gross revenues and income; (iii) minimum guaranteed payments to the tribe, which must have priority over the retirement of development and construction costs; (iv) a ceiling on the repayment of such development and construction costs; and (v) a contract term not exceeding five years and a management fee not exceeding 30% of net revenues (as determined by the NIGC); provided that the
NIGC may approve up to a seven-year term and a management fee not to exceed 40% of net revenues if the NIGC is satisfied that the capital investment required, and the income projections for the particular gaming activity require the larger fee and longer term. There is no periodic or ongoing review of approved contracts by the NIGC. Other than an action by the parties, the only post-approval action that could result in possible modification or cancellation of a contract would be as the result of an enforcement action taken by the NIGC based on a violation of the law or an issue affecting suitability.
The IGRA prohibits all forms of Class III gaming unless the tribe has entered into a written agreement with the state that specifically authorizes the types of Class III gaming the tribe may offer (a “tribal-state compact”) or the Secretary of the Interior has issued procedures pursuant to which the tribe may conduct Class III gaming. These tribal-state compacts provide, among other things, the manner and extent to which each state will conduct background investigations and certify the suitability of the manager, its officers, directors, and key employees to conduct gaming on Native American lands.
Title 25, Section 81 of the United States Code states that “no agreement or contract with an Indian tribe that encumbers Indian lands for a period of 7 or more years shall be valid unless that agreement or contact bears the approval of the Secretary of the Interior or a designee of the Secretary.” An agreement or contract for services relative to Native American lands which fails to conform with the requirements of Section 81 is void and unenforceable. All money or other things of value paid to any person by any Native American or tribe for or on his or their behalf, on account of such services, in excess of any amount approved by the Secretary or his or her authorized representative will be subject to forfeiture. We intend to comply with Section 81 with respect to any other contract with an Indian tribe in the United States.
Native American tribes are sovereign nations with their own governmental systems, which have primary regulatory authority over gaming on land within the tribes’ jurisdiction. Therefore, persons engaged in gaming activities on tribal lands, including the Company, are subject to the provisions of tribal ordinances and regulations. Tribal gaming ordinances are subject to review by the NIGC under certain standards established by the IGRA. The NIGC may determine that some or all of the ordinances require amendment, and those additional requirements, including additional licensing requirements, may be imposed on us.
Several bills have been introduced in Congress that would amend the IGRA. Any amendment of the IGRA could change the governmental structure and requirements within which tribes could conduct gaming and may have an adverse effect on our results of operations or impose additional regulatory or operational burdens. In addition, any amendment to or expiration of a tribal-state compact may have an adverse effect on our results of operations or impose additional regulatory or operational burdens.
General Gaming Regulations in Other Jurisdictions
If we become involved in gaming operations in any other jurisdictions, such gaming operations will subject us and certain of our officers, directors, key employees, equity holdersequityholders and other affiliates (“Regulated Persons”) to strict legal and regulatory requirements, including mandatory licensing and approval requirements, suitability requirements, and ongoing regulatory oversight with respect to such gaming operations. Such legal and regulatory requirements and oversight will be administered and exercised by the relevant regulatory agency or agencies in each jurisdiction (the “Regulatory Authorities”). We and the Regulated Persons will need to satisfy the licensing, approval and suitability requirements of each jurisdiction in which we seek to become involved in gaming operations. These requirements vary from jurisdiction to jurisdiction, but generally concern the responsibility, financial stability and character of the owners and managers of gaming operations as well as persons financially interested or involved in gaming operations. In general, the procedures for gaming licensing, approvals and findings of suitability require the Company and each Regulated Person to submit detailed personal history information and financial information to demonstrate that the proposed gaming operation has adequate financial resources generated from
suitable sources and adequate procedures to comply with the operating controls and requirements imposed by law and regulation in each jurisdiction, followed by a thorough investigation by such Regulatory Authorities. In general, the Company and each Regulated Person must pay the costs of such investigation. An application for any gaming license, approval or finding of suitability may be denied for any cause that the Regulatory Authorities deem reasonable. Once obtained, licenses and approvals may be subject to periodic renewal and generally are not transferable. The Regulatory Authorities may at any time revoke, suspend, condition, limit or restrict a license, approval or finding of suitability for any cause that they deem reasonable. Fines for violations may be levied against the holder of a license or approval and in certain jurisdictions, gaming operation revenues can be forfeited to the state under certain circumstances. There can be no assurance that we will obtain all of the necessary licenses, approvals and findings of suitability or that our officers, directors, key employees, other affiliates and certain other stockholders will satisfy the suitability requirements in one or more jurisdictions, or that such licenses, approvals and findings of suitability, if obtained, will not be revoked, limited, suspended or not renewed in the future. We may be required to submit detailed financial and operating reports to Regulatory Authorities.
Failure by us to obtain, or the loss or suspension of, any necessary licenses, approval or findings of suitability would prevent us from conducting gaming operations in such jurisdiction and possibly in other jurisdictions, which may have an adverse effect on our results of operations.
Anti-Money Laundering Laws
Our services are subject to federal anti-money laundering laws, including the Currency and Foreign Transactions Reporting Act of 1970 (the “Bank Secrecy Act”). On an ongoing basis, these laws require us, among other things, to: (i) maintain an anti-money laundering program; (ii) designate and maintain individuals to assure compliance; (iii) train relevant personnel; (iv) identify and report large cash transactions and suspicious activity; (v) screen individuals and entities against sanctions and watch lists and;lists; and (vi) independently test for compliance.
Anti-money laundering regulations and regulator expectations thereof are constantly evolving. We implement policies and procedures to reasonably assure compliance with anti-money laundering regulations and continuously monitor our compliance with these regulations. We cannot predict how these future regulations and expectations thereof might affect us. Complying with future regulationregulations could be expensive or require us to change the way we operate our business.
Environmental Matters
Although we are currently involved in monitoring activities at a few of our sites due to historical or nearby operations, complianceCompliance with federal, state and local laws and regulations relating to the protection of the environment to date has not had a material effect upon our capital expenditures, earnings or competitive position and we do not anticipate any material adverse effects in the future based on the nature of our current or future operations.
Social Responsibility and Environmental Stewardship
The Company and Station LLC have a longstanding commitment to social responsibility, and we pride ourselves on our established track record of outstanding corporate citizenship. We believe that our programs and our team members’ participation in our programs and the community causes they support have had a significant positive impact on the communities in which we operate. Our decades-long commitment to acting as a responsible corporate citizen has been reflected in recent years through: Station Casinos’ donation of $1 million to the COVID-19 Emergency Response Fund to purchase personal protective equipment and critical medical supplies, including test kits, for use by first responders and healthcare professionals throughout Nevada; our pandemic-related food donations through Three Square Food Bank; our donations to the Public Education Fund to support distance learning initiatives; our longstanding support of the “Smart Start” school program supporting in-need schools in Clark County; and our support of Three Square Food Bank’s “Backpack for Kids” program supporting children experiencing food insecurity; and by our support and encouragement of our team members as they collectively completed thousands of volunteer hours, including paid volunteer hours, through these and other initiatives. Throughout the pandemic and continuing to the present, we have maintained partnerships with emergency services, local municipalities and charitable organizations through which we have made available our properties for emergency training and preparedness, as well as for COVID-19 testing sites and food distribution centers.
At the Company, we consider environmental stewardship to be part of our social responsibility. In the last several years, we have sought and obtained Green Globes certification through the Green Building Initiative for all of our seven operating resort properties and our corporate building, all of which have obtained at least three globes and several of which have obtained four. In addition, we are considering the addition of rooftop solar arrays at our seven operating resort properties. We have also taken an early and leading role in seeking to add charging stations for electric vehicles at our properties and we have charging stations available at each of our resort properties. Notably, we designed our Durango project with sustainability goals in mind, including incorporation of Green Globes certification into the construction process. In addition, the Durango project features bike access with dedicated bike lanes and utilizes water conservation design features. In addition, we have installed water saving fixtures at each of our resort properties and we have removed natural grass features at all of our resort properties to reduce water consumption, well in advance of any mandate to do so.
Since its inception over 47 years ago, Station LLC has been steadfast in its commitment to promoting responsible gaming practices. As a provider of entertainment that can become problematic for some individuals, we do our best to provide information on the available support, treatment, and assistance programs. We are a charter member of the National Center for Responsible Gaming and we have contributed over $150,000 to the organization. We have been a member of the Nevada Council on Problem Gambling since 1996 and have contributed more than $55,000 to the organization. Our benefits programs include insurance coverage for the treatment of problem gambling for our team members who may recognize a gambling problem due to their proximity to the product. In our properties, in compliance with regulation, we post written materials concerning the nature and symptoms of problem gambling and the toll-free 1-800 problem gambling helpline on or near all
gaming and cage areas and ATMs. Finally, our team members actively participate in events annually during Responsible Gaming Education Week. These activities are designed to promote awareness among our team members and guests of the need to gamble responsibly and of the treatment options available for problem gamblers.
Human Capital
At January 31, 2021,2024, we had approximately 7,6009,385 employees, all of whom were employed in the United States. We have a talented and diverse workforce and believe we have excellent employee relations. We have always understood that our most important asset is our team members, and the events of 2020 exemplified their importance to our organization and our customers. Despite the challenging year, we continuedmembers. We continue to roll out our “Focus on Family” program to all of our team members to recognize the contribution that every team member has made to the Company. Some highlights of our accomplishments to date include:
•We provided salary and benefits continuation forOur team members throughouthave also benefited from the mandatory closure of our properties due to COVID-19, including full medical, dental and vision;
•We provided on-site COVID-19 testing for all team members prior to the reopening of certain of our properties in June 2020 and periodic testing thereafter;
•We installed thermal temperature screening equipment at all team member entrances;
•We implemented strong health and safety protocols to protect team member health and well-being, including protocols relating to sanitization, masking and social distancing;following:
•We offer free medical dental and health benefits to all of our team members making less than $100,000 per year;
•We opened twohave three on-site medical centers offering free office visits, free generic prescriptions and free lab services for insured team members and their families;
•We have one full service dental center for team members and their families;
•We implementedhave instituted a paid volunteer day for team members;
•We initiated a Surviving Family Support program that pays surviving family members six months of medical and dental insurance;
•We pay for performancefull tuition of team members who want to become full-time dealers in our industry;
•We offer competitive pay, which has and competitive rate adjustments, which will continue to positively impact the vast majority of our team members;
•We have an innovative 401(k) retirement program, which we believe is far superior to a traditional pension, pursuant to which we contributed over $8.6$26.3 million in the past three years, including $8.8 million in 2023;
•We have hired a specialist in citizenship and immigration services to assist our team members’ 401(k) retirement program;members;
•We have hired a health and wellness coordinator; and
•We beganhave begun implementing extensive training and development initiativesprograms focusing on leadership and development.
These initiatives, together with a number of other positive changes we have made, were designed to enhance the long-term health, well-being and financial security of our team members and their families as well as give us the ability to recruit and retain the best team members and make Red Rock Resortsus the employer of choice in the Las Vegas Valley.valley. Our efforts were recognized for the third year in a row by our team members, who voted us the top casino employer in the Las Vegas valley.
Available Information
We are required to file annual, quarterly and other current reports and information with the Securities and Exchange Commission (“SEC”). Because we submit filings to the SEC electronically, access to this information is available at the SEC’s website (www.sec.gov). This site contains reports and other information regarding issuers that file electronically with the SEC.
We also make available, free of charge, at our principal internet address (www.redrockresorts.com) our Annual Report on Form 10-K, Quarterly Reports on Form 10-Q, Current Reports on Form 8-K, and, if applicable, amendments to those reports filed or furnished pursuant to the Exchange Act as soon as reasonably practicable after we electronically file such material with, or furnish it to, the SEC. Other information on our website is expressly not incorporated by reference into this filing.
We have adopted a Code of Business Conduct and Ethics (the “Code of Ethics”) that applies to all of our directors, officers (including our principal executive officer and our principal financial officer) and employees. The Code of Ethics and any waivers or amendments to the Code of Ethics are available on the Investor Relations section of our website at www.redrockresorts.com. Printed copies are also available to any person without charge, upon request directed to our Corporate Secretary, 1505 South Pavilion Center Drive, Las Vegas, Nevada 89135.
Cautionary Statement Regarding Forward-Looking Statements
This Annual Report on Form 10-K contains forward-looking statements. Such statements contain words such as “believe,” “estimate,” “expect,” “intend,” “plan,” “project,” “may,” “will,” “might,” “should,” “could,” “would,” “seek,” “pursue,” and “anticipate” or the negative or other variation of these or similar words, or may include discussions of strategy or risks and uncertainties. Forward-looking statements in this Annual Report on Form 10-K include, among other things, statements concerning:
•projections of future results of operations or financial condition;
•expectations regarding our business and results of operations of our existing casino properties and prospects for future development;
•expenses and our ability to operate efficiently;
•expectations regarding trends that will affect our market and the gaming industry generally and the impact of those trends on our business and results of operations;
•our ability to comply with the covenants in the agreements governing our outstanding indebtedness;
•our ability to meet our projected debt service obligations, operating expenses, and maintenance capital expenditures;
•expectations regarding the availability of capital resources, including our ability to refinance our outstanding indebtedness;
•our intention to pursue development opportunities and acquisitions and obtain financing for such development and acquisitions; and
•the impact of regulation on our business and our ability to receive and maintain necessary approvals for our existing properties and future projects.
Any forward-looking statement is based upon a number of estimates and assumptions that, while considered reasonable by us, is inherently subject to significant business, economic and competitive uncertainties and contingencies, many of which are beyond our control, and are subject to change. Actual results of operations may vary materially from any forward-looking statement made herein. Forward-looking statements should not be regarded as a representation by us or any other
person that the forward-looking statements will be achieved. Undue reliance should not be placed on any forward-looking statements. Some of the contingencies and uncertainties to which any forward-looking statement contained herein is subject include, but are not limited to, the following:
•our reliance on the Las Vegas regional market;
•the impact of business conditions, including competitive practices, changes in customer demand and the cyclical nature of the gaming and hospitality business generally, on our business and results of operations;
•the impact of general economic conditions outside our control, including changes in interest rates, consumer confidence and unemployment levels, on our business and results of operations;
•the effects of intense competition that exists in the gaming industry;
•additional competition arising as a result of the approval of new gaming licenses or gaming activities such as internet gaming, and the continued expansion of sports betting outside the state of Nevada;
•our substantial outstanding indebtedness and the effect of our significant debt service requirements on our operations and ability to compete;
•the risk that we will not be able to finance our development and investment projects or refinance our outstanding indebtedness;
•the impact of extensive regulation from gaming and other government authorities on our ability to operate our business and the risk that regulatory authorities may revoke, suspend, condition or limit our gaming or other licenses, impose substantial fines or take other actions that adversely affect us;
•risks associated with changes to applicable gaming and tax laws that could have a material adverse effect on our financial condition;
•adverse outcomes of legal proceedings and the development of, and changes in, claims or litigation reserves;
•risks associated with development, construction and management of new projects or the expansion of existing facilities, including cost overruns, construction delays, environmental risks and legal or political challenges; and
•risks associated with integrating operations of any acquired companies and developed properties.
For additional contingencies and uncertainties, see Item 1A. Risk Factors.
Given these risks and uncertainties, we can give no assurances that results contemplated by any forward-looking statements will in fact occur and therefore caution investors not to place undue reliance on them. We undertake no obligation to publicly update or revise any forward-looking statements, whether as a result of new information, future events or otherwise. In light of these risks, uncertainties and assumptions, the forward-looking events discussed in this Annual Report on Form 10-K might not occur.
Market and Industry Data
Some of the market and industry data contained in this Annual Report on Form 10-K are based on independent industry publications or other publicly available information. Although we believe that these independent sources are reliable, we have not independently verified and cannot assure you as to the accuracy or completeness of this information. As a result, you should be aware that the market and industry data contained herein, and our beliefs and estimates based on such data, may not be reliable.
ITEM 1A.RISK FACTORS
The following risk factors should be considered carefully in addition to the other information contained in this Annual Report on Form 10-K. This Annual Report on Form 10-K contains forward-looking statements that involve risks and uncertainties. Any of these risks and uncertainties could cause our actual results to differ materially from the results contemplated by the forward-looking statements. The following risk factors set forth the risks that we believe are material to our business, financial condition, assets, operations and equity interests. If any of the following risks actually occur, our business, financial condition and results of operations could be materially and adversely affected. The risks described below are not the only ones we face. Additional risks currently not known to us or that we believe to be immaterial could also adversely impact our business.
Any one of the factors discussed below or elsewhere in this report or the cumulative effect of some of the factors referred to herein may result in significant fluctuations in our financial and other operating results. This variability and unpredictability could result in our failure to meet investor expectations for our revenues or other operating results for a particular period. If we fail to meet or exceed such expectations for these or any other reasons, the market price of our common stock could decrease.
Business, economic, marketEconomic, Market and operating risks
The COVID-19 outbreak has negatively impacted our business and results of operations. Such negative impacts could continue for an extended period of time and may worsen.
The impact and effects of COVID-19 have adversely impacted and are expected to continue to adversely have an impact on our ability to attract customers to our properties and our results of operations. As a result of state-wide orders, all of our properties were closed from March 17, 2020 through June 3, 2020. We reopened the majority of our properties on June 4, 2020, but Texas Station, Fiesta Rancho, Fiesta Henderson and Palms have not reopened and will remain closed until we determine whether to reopen them based on our analysis of a number of factors, including the health of the economy as a whole, the health of the Las Vegas economy, customer demand, expense of operating the properties and restrictions on operations to implement social distancing and other health and safety protocols.
While we are currently operating the majority of our properties, shelter-in-place or other governmental orders or directives could require us to close the properties that are currently operating in the future or may prevent or discourage customers from visiting our properties. In addition, we cannot predict whether our properties that have not reopened will reopen or will remain operating if reopened. Social distancing measures have resulted in restrictions on our operations, including limiting the number of customers present in our facilities or within certain areas and reduced gaming operations, implementation of additional health and safety measures, such as enhanced cleaning protocols, restrictions on hotel, food and beverage outlets and limits on concerts, conventions or special events.
Our future financial results and cash flows will continue to be negatively impacted by a number of factors that are beyond our control, including the duration and extent of social distancing measures, the possibility that governmental regulations and directives enacted in the future may further limit the operations of our properties or prohibit or discourages customers from visiting our properties, the impact of such measures on our ability to operate our casinos profitably or at all and our ability to adjust our cost structure to mitigate the impact of COVID-19 on our business and results of operations. We may also face unforeseen liability or be subject to additional obligations as a result of COVID-19, including as a result of claims alleging exposure to COVID-19 in connection with our operations or facilities or to the extent we are subject to a governmental enforcement action as a result of failing to comply with applicable health and safety regulations.
The impact of COVID-19 may also have the effect of exacerbating many of the other risks described herein. As a result of the foregoing, we cannot predict the ultimate scope, duration and impact that COVID-19 will have on our results of operations, but we expect that it will continue to have a material impact on our business, financial condition, liquidity, results of operations (including revenues and profitability) and stock price.
As a result of COVID-19, we have implemented aggressive cost reduction and efficiency improvement measures, which could adversely affect the loyalty of our guests and our ability to attract and retain employees.
We have taken steps to reduce our operating costs and improve efficiencies as a result of our property closures and the ongoing uncertainty surrounding COVID-19, and we may undertake additional steps in the future. Such steps may harm our reputation by adversely impacting guest loyalty and our ability to attract and retain employees. While we have retained a majority of our full-time team members, our reduced operations and continued closures have resulted in long-term reductions in our full-time workforce. When COVID-19 subsides, we may experience difficulties in resuming normal operations.
We depend on the residents of the Las Vegas regional market and repeat visitors, which subjects us to greater risks than a gaming company with more diverse operations.
All of our casino properties are dependent upon attracting Las Vegas residents as well as out of town visitors. As a result of our concentration in the Las Vegas regional market, we have a greater degree of exposure to a number of risks than we would have if we had operations outside of the Las Vegas Valley.valley. These risks include the following:
•local economic and competitive conditions;
•changes in local and state governmental laws and regulations, including gaming laws and regulations and COVID-19public health related orders and directives;
•natural and other disasters;
•increased gasoline prices, which may discourage travelers from visiting our properties; and
•a decline in the local population; and
•the impact of COVID-19 travel restrictions or warnings on visitation to our casinos, including from nearby areas such as Southern California.population.
Our strategy of growth through master-planning of certain of our major casinos for future expansion was developed, in part, based on projected population growth in Las Vegas. ThereLas Vegas and its surrounding areas have been growing over the past few decades, including certain periods of significant growth, but no assurance can be given that the regional population will continue to grow at its historic pace or at all. Even if this trend continues, there can be no assurance that such population growth will justify future development, additional casinos or expansion of any of our existing casinos, which can affect our results of operations and financial condition and limits our ability to expand our business.
Our business is sensitive to changes in consumer sentiment and discretionary spending.
Consumer demand for the offerings of casino hotel properties such as ours is sensitive to factors impacting consumer confidence, including downturns in the economy and other factors that impact discretionary spending on leisure activities. Changes in discretionary consumer spending, consumer preferences or consumer preferencespurchase power brought about by factors such as perceived or actual general economic conditions and customer confidence in the economy, unemployment, inflation, uncertainty and distress in the housing and credit markets, the impact of high energy, fuel, food and healthcare costs, perceived or actual changes in disposable consumer income and wealth, taxes, and effects or fears of war, civil unrest, terrorism, violence, widespread illnesses or epidemics could further reduce customer demand for our offerings and materially and adversely affect our business and results of operations. In particular, visitationNotably, after years of a low interest rate environment, central banks across the globe significantly (and swiftly) increased interest rates to our propertiesstem inflation. Though the global inflation rate began to stabilize, and in some cases decline, in 2023, core inflation has been, andproved persistent. Thus, there is expected tono telling if interest rates will stabilize, continue to increase or decrease. Widespread increases in costs of goods and services due to inflation and supply chain challenges and rising interest rates have negatively impacted, and may negatively impact, the discretionary spending of our customers in the future and, in turn, our results of operations. We cannot be effected by widespread unemployment, consumer concerns about safety and economic uncertainty arising as a resultcertain of COVID-19.the extent or duration of any resulting negative impacts on our business.
Our casinos draw a substantial number of customers from the Las Vegas metropolitan area, as well as nearby geographic areas, including Southern California, Arizona and Utah. While our business is affected by the general economic conditions in the United States, our business and results of operations would be particularly negatively impacted if our target markets experience an economic downturn or other adverse conditions, including restrictions on travel as a resultdeclines in housing prices and/or an increase in unemployment rates.
We face substantial competition in the gaming industry and we expect that such competition will intensify.
Our casino properties face competition for customers and employees from all other casinos and hotels in the Las Vegas metropolitan area including, to some degree, each other. In addition, our casino properties face competition from all smaller nonrestricted gaming locations and restricted gaming locations (locations with 15 or fewer slot machines) in the Las Vegas metropolitan area, including those that primarily target the local and repeat visitor markets. Major additions, expansions or enhancements of existing properties or the construction of new properties by competitors could also have a material adverse effect on the business of our casino properties. If our competitors operate more successfully than we do, or if they attract customers away from us as a result of aggressive pricing and promotion or enhanced or expanded properties, we may lose market share and our business could be adversely affected. If they are successful in soliciting our employees it could be costly to replace such employees.
To a lesser extent, our casino properties compete with gaming operations in other parts of the state of Nevada and other gaming markets in the United States and in other parts of the world, with online betting and gaming, state sponsored lotteries, on- and off-track pari-mutuel wagering (a system of betting under which wagers are placed in a pool, management receives a fee from the pool, and the remainder of the pool is split among the winning wagers), card rooms and other forms of legalized gaming and online gaming. The gaming industry also includes dockside casinos, riverboat casinos, racetracks with slot machines and casinos located on Native American land. There is intense competition among companies in the gaming industry, some of which have significantly greater resources than we do. Our properties have encountered additional competition as large-scale Native American gaming on Indian lands, particularly in California, has increased, and competition may intensify if more Native American gaming facilities are developed. Several states have approved or are currently considering the approval of legalized casino gaming in designated areas and
the expansion of existing gaming operations or additional gaming sites. In May 2018, the United States Supreme Court overturned a law prohibiting states from legalizing sports wagering which together with the expansion of sports gaming as a result of the pandemic, has resulted in a substantial expansion of sports betting outside the state of Nevada, including online sports betting. In addition, internetmultiple operators offer online gaming has commenced in Nevada and a number of other states and internetonline betting and gaming has been approved or proposedis expected to continue to expand in a number of other states.states that currently authorize such activities and in new jurisdictions that legalize such activities. Internet gaming and the expansion of legalized casino gaming or legalized sports betting in new or existing jurisdictions and on Native American land could result in additional competition that could adversely affect our operations, particularly to the extent thatespecially if such gaming is conducted in areas close to our operations. Two ballot initiatives that would have permitted sports betting in California, including online and mobile betting, were recently defeated. However, there can be no assurance that similar measures will not be approved in the future. For further details on competition in the gaming industry, see Item 1. Business—Competition.
Our success depends on key executive officers and personnel.personnel and our ability to attract and retain employees.
Our success depends on the efforts and abilities of our executive officers and other key employees, many of whom have significant experience in the gaming industry, including, but not limited to, Frank J. Fertitta III, our Chairman of the Board and Chief Executive Officer. Competition for qualified personnel in our industry is intense, and it would be difficult for us to find experienced personnel to replace our current executive officers and employees. Such competition may also make it difficult for us to recruit and retain a sufficient number of qualified employees, particularly in light of recent labor shortages. Since our reopening in June 2020, we have faced increased challenges in attracting and retaining qualified employees. If we fail to retain our current employees, it would be difficult and costly to identify, recruit and train replacements needed to continue to conduct and expand our business. There can be no assurance that we will be able to retain and motivate our employees. In addition, if we do not effectively execute succession planning and leadership development, our growth and long-term success could be hindered. We believe that a loss of the services of theseour executive officers and/or other personnel could have a material adverse effect on our results of operations.
We may incur delays and budget overruns with respect to current or future construction projects. Any such delays or cost overruns may have a material adverse effect on our operating results.
We recently opened a new casino, Durango, on Durango Drive in the southwest Las Vegas valley, and we expect to begin development of other projects in the Las Vegas valley and the North Fork project. We expect to continue to evaluate expansion opportunities as they become available and construct other new facilities or enhance our existing properties by constructing additional facilities in the future. Such construction projects entail significant risks, including the following, any of which can give rise to delays or cost overruns:
•shortages of material or skilled labor, including due to supply chain issues that are beyond our control;
•unforeseen engineering, environmental or geological problems;
•work stoppages;
•weather interference;
•floods;
•unanticipated cost increases; and
•legal or political challenges.
The anticipated costs and construction periods are based upon budgets, conceptual design documents and construction schedule estimates prepared by us in consultation with our architects and contractors. We may spend a significant sum of money in the planning stages of a project and then determine not to proceed. In addition, construction, equipment, staffing requirements, problems or difficulties in obtaining and maintaining any of the requisite licenses, permits, allocations or authorizations from regulatory authorities can increase the cost or delay the construction or opening of each of the proposed facilities or otherwise affect the project’s planned design and features. We cannot be sure that we will not exceed the budgeted costs of these projects or that the projects will commence operations within the contemplated time frame, if at all. Budget overruns and delays with respect to North Fork or other expansion and development projects could have a material adverse impact on our results of operations.
We may pursue new gaming acquisition and development opportunities and may not be able to recover our investment or successfully expand to additional locations.
We have invested in real property in connection with development and expansion opportunities and we evaluate and may pursue acquisition opportunities in existing and emerging jurisdictions. To the extent that we decide to pursue any new gaming acquisition or development opportunities, our ability to benefit from such investments will depend upon a number of factors including:
•our ability to identify and acquire attractive acquisition opportunities and development sites at attractive prices;
•our ability to secure required federal, state and local licenses, permits and approvals, which in some jurisdictions are limited in number;
•certain political factors, such as local support or opposition to development of new gaming facilities or legalizing casino gaming in designated areas;
•restrictions in our existing credit arrangements and the availability of adequate financing on acceptable terms;
•restrictions on and obligations with respect to our business that may exist in connection with any such pending transaction or investment;
•our ability to retain key employees;
•our ability to identify and develop satisfactory relationships with joint venture partners;
•to the extent we acquire existing operations, our ability to integrate the systems and employees from such operations; and
•our ability to effectively manage any combined business following an acquisition.
Most of these factors are beyond our control. Therefore, we cannot be sure that we will be able to recover our investment in any of our existing or new gaming development opportunities or acquired facilities, or successfully expand to additional locations.
We require significant capital to fund capital expenditures, pursue proposed development, expansion or acquisition opportunities or refinance our indebtedness.
Our businesses are capital intensive. We may be unable to generate sufficient revenues and cash flows to service our debt obligations as they come due, finance capital expenditures and meet our operational needs. For our casino properties to remain attractive and competitive we must periodically invest significant capital to keep the properties well-maintained, modernized and refurbished. Similarly, future construction and development projects, including but not limited to, the proposed North Fork project, and acquisitions of other gaming properties and/or operations could require significant additional capital. We rely on earnings and cash flow from operations to finance our business, capital expenditures, development, expansion and acquisitions and, to the extent that we cannot fund such expenditures from cash generated by operations, funds must be borrowed or otherwise obtained. We will also be required in the future to refinance our outstanding debt. Our ability to effectively operate and grow our business may be constrained if we are unable to borrow additional capital or refinance existing borrowings on reasonable terms.
If we are unable to access sufficient capital from operations, borrowings or otherwise, we may be precluded from:
•maintaining or enhancing our properties;
•taking advantage of future opportunities;
•growing our business; or
•responding to competitive pressures.
Further, our failure to generate sufficient revenues and cash flows could lead to cash flow and working capital constraints, which may require us to seek additional working capital. We may not be able to obtain such working capital when it is required. Further, even if we were able to obtain additional working capital, it may only be available on unfavorable terms. For example, we may be required to incur additional debt at unattractive prices, and servicing the payments on such debt could adversely affect our results of operations and financial condition. Under such circumstances, we may be adversely impacted by the expirationrequired to sell common or terminationpreferred equity or some of our Native American management agreementsassets in order to bolster our working capital and liquidity. Limited liquidity and working capital may also restrict our ability to maintain and update our casino properties, which could put us at a competitive disadvantage to casinos offering more modern and better maintained facilities.
If we do not have access to credit or capital markets at desirable times or at rates that we would consider acceptable, the lack of such funding could have a material adverse effect on our business, results of operations and financial condition and our ability to service our indebtedness.
We may not be successful in entering into additional management or development agreements for Native American gaming opportunities.
Our management agreement for Graton Resort was terminated by the FIGR on February 5, 2021. For the years ended December 31, 2020, 2019 and 2018, our management fees from Graton Resort were $77.4 million, $85.6 million and $77.5 million respectively, which, based on the margins applicable to our management activities, contributed significantly to our net income for such periods. Our results of operations may be adversely impacted by the expiration or termination of such agreement. We have a development agreement and management agreement with the North Fork Rancheria of Mono Indians relating to development and operation of a casino to be located in Madera County, California and we intend to seek additional development and management contracts with Native American tribes. However, we cannot be sure that we will be able to develop the North Fork project or that we will be successful in entering into agreements for new development opportunities. While we believe that the ongoing legal challenges to the North Fork project will be resolved and that development of the North Fork project will proceed, the development of Native American gaming facilities is subject to numerous conditions and is frequently subject to protracted legal challenges. As a result, even if we are able to enter into development and management agreements for Native American gaming projects, we cannot be sure that the projects, including the North Fork project, will be completed or, if completed, that they will generate significant management fees or return on our investment. For more information see Item 3. Legal Proceedings.
Union organization activities could disrupt our business by discouraging patrons from visiting our properties, causing labor disputes or work stoppages, and, if successful, could significantly increase our labor costs.
Our properties have been subject to ongoing efforts of union activists to enter into collective bargaining agreements and to organize our employees into collective bargaining units. The Local Joint Executive Board of Las Vegas (the “LJEBLV”) has been certified as the collective bargaining representative of non-gaming employees at Sunset Station and Green Valley Ranch, Fiesta Rancho, Fiesta Henderson and Palms.Ranch. We have not yet entered into collective bargaining agreements with the bargaining units represented by the LJEBLV at anyeither of these properties. The LJEBLV had been recognized as the collective bargaining representative for a unit of non-gaming employees at Palace Station and Boulder Station, but we no longer recognize the LJEBLV as the bargaining representative of those employees at either of those properties, as each of those properties received a petition indicating that a majority of its bargaining unit employees no longer desired to be represented by the LJEBLV. In an election held in December 2019, a proposed bargaining unit consisting of non-gaming employees of Red Rock rejected the LJEBLV as their bargaining representative. The LJEBLV isand the National Labor Relations Board (the “NLRB”) has contested the election results at Red Rock and as a result of actions related to that contest we are currently bargaining with the LJEBLV at Red Rock, although we have not yet entered into a collective bargaining agreement with the bargaining units represented by the LJEBLV at Red Rock. The LJEBLV and the NLRB are also contesting both the withdrawal of recognition of the LJEBLV at Boulder Station and Palace Station and in addition have commenced an action which seeks, among other things, an order forcing us to collectively bargain with the election resultsLJEBLV at Red Rock.each of our resort properties. Accordingly, it is uncertain whether we will be subject to, anyor continue to be subject to, a bargaining obligation or whether we will eventually agree to enter into a collective bargaining agreement at any of those threeour properties. In addition, slot technicians are represented by the International Union of Operating Engineers, Local 501 (“Local 501”) at Palms, Palace Station and Green Valley Ranch, Sunset Station, Fiesta Henderson and Red Rock and Teamsters Local Union 986 was certified as the bargaining representative for a bargaining unit of Palms warehouse receivers, valet parking attendants and bell desk employees.Ranch. We are bargaining with, but have not yet entered into collective bargaining agreements with, the bargaining units represented by Local 501 or Teamstersat these properties. Local Union 986501 had been recognized as the collective bargaining representative for a unit of slot technicians at anySunset Station and Red Rock, but we no longer recognize Local 501 as the bargaining representative of these properties.those employees at either of those properties, as each of those properties received a petition indicating that a majority of its bargaining unit employees no longer desired to be represented by Local 501.Local 501 and the NLRB are contesting the withdrawal of recognition of Local 501 at Sunset Station and Red Rock. None of our other casino properties isare currently subject to any bargaining obligation, collective bargaining agreement or
similar arrangement with any union; however, we believe that organizing efforts are ongoing at this time. Accordingly, there can be no assurance that our casino properties will not ultimately be unionized.
Union organization efforts could cause disruptions to our casino properties and discourage patrons from visiting our properties and may cause us to incur significant costs, any of which could have a material adverse effect on our results of operations and financial condition. In addition, union activities may result in labor disputes, including work stoppages, which could have a material adverse effect on our business, financial condition and results of operations. Furthermore, collective bargaining involving any of our existing or future properties in the event that they become organized introduces an element of uncertainty into planning our future labor costs, which could have a material adverse effect on the business of our casino properties and our financial condition and results of operations.
Work stoppages, labor problems and unexpected shutdowns may limit our operational flexibility and negatively impact our future profits.
Any work stoppage at one or more of our casino properties or construction projects which may be undertaken, in each case whether or not union driven, could require us to expend significant funds to hire replacement workers, and qualified replacement labor may not be available at reasonable costs, if at all. Strikes and work stoppages could also result in adverse media attention or otherwise discourage customers from visiting our casino properties. Strikes and work stoppages involving laborers at a construction project could result in construction delays and increases in construction costs. As a result, a strike or other work stoppage at one of our casino properties or any construction project could have an adverse effect on the business of our casino properties and our financial condition and results of operations. There can be no assurance that we will not experience a strike or work stoppage at one or more of our casino properties or any construction project in the future. As noted above, our properties have been subject to ongoing efforts of union activists to enter into collective bargaining agreements and to organize our employees into collective bargaining units.
Any unexpected shutdown of one of our casino properties or any construction project could have an adverse effect on the business of our casino properties and our results of operations. There can be no assurance that we will be adequately prepared for unexpected events, including political or regulatory actions, which may lead to a temporary or permanent shutdown of any of our casino properties.
The concentration and evolution of the slot machine manufacturing industry or other technological conditions could impose additional costs on us.
We rely on a variety of hardware and software products to maximize revenue and efficiency in our operations. Technology in the gaming industry is developing rapidly, and we may need to invest substantial amounts to acquire the most current gaming and hotel technology and equipment in order to remain competitive in the markets in which we operate. In addition, we may not be able to successfully implement and/or maintain any acquired technology.
We are subject to extensive federal, state and local regulation and governmental authorities have significant control over our operations; this control and the cost of compliance or failure to comply with such regulations that govern our operations in any jurisdiction where we operate could have an adverse effect on our business.
Our ownership and operation of gaming facilities is subject to extensive regulation, including licensing requirements, by the states, counties and cities in which we operate. These laws, regulations and ordinances vary from jurisdiction to jurisdiction, but generally concern the responsibility, financial stability and character of the owners and managers of gaming operations as well as persons financially interested or involved in gaming operations, and we are subject to extensive background investigations and suitability standards in our gaming business. We also will become subject to regulation in any other jurisdiction where we choose to operate in the future. As such, our gaming regulators can require us to disassociate ourselves from suppliers or business partners found unsuitable by the regulators or, alternatively, cease operations in that jurisdiction. In addition, unsuitable activity on our part, on the part of individuals investing in or otherwise involved with us or on the part of our owners, managers or unconsolidated affiliates in any jurisdiction could have a negative effect on our ability to continue operating in other jurisdictions.
In addition, we are subject to various gaming taxes, which are subject to possible increase at any time, and federal income tax. Tax laws are dynamic and subject to change as new laws are passed and new interpretations of the law are issued or applied. In addition, governmental tax authorities are increasingly scrutinizing the tax positions of companies. If United States or state tax authorities change applicable tax laws, including laws relating to taxation of gaming operations, our overall taxes could increase, and our business, financial condition or results of operations may be adversely impacted.
We also deal with significant amounts of cash in our operations and are subject to various reporting and anti-money laundering regulations. As a result of such regulations, we may beare subject to periodic examinations by the Financial Crimes Enforcement Network (“FinCEN”) and we may be required to pay substantial penalties if we fail to comply with applicable regulations. Any violations of anti-money laundering laws or regulations by any of our properties could have an adverse effect on our financial condition, results of operations or cash flows. Such laws and regulations could change or could be interpreted differently in the future, or new laws and regulations could be enacted.
For a more complete description of the regulatory requirements, see Item 1. Business—Regulation and Licensing.
We are subject to a variety of federal, state and local laws and regulations relating to the protection of the environment and human health and safety, which could materially affect our business, financial condition, results of operations and cash flows.
We are subject to federal, state and local laws and regulations relating to the protection of the environment and human health and safety, including those relating to air emissions, water discharges and remediation of contamination. Such laws and regulations require us to obtain, maintain and renew environmental operating or construction permits or approvals, particularly in connection with our development activities. Certain environmental laws can impose joint and several liability without regard to fault on responsible parties, including past and present owners and operators of sites, related to the investigation or remediation of sites at which hazardous wastes or materials were disposed or released. Private parties may also bring claims arising from the presence of hazardous materials on a site or exposure to such materials. We are currently involved in monitoring activities at or adjacent to a few of our sites due to historical or nearby operations. Increasingly stringent environmentalEnvironmental laws, regulations orand standards have become increasingly stringent overtime and this trend is expected to continue, which may make compliance with suchnew requirements more difficult or costly or otherwise adversely affect our
operations. Failure to comply with environmental laws or regulations, or any liabilities or claims arising under such laws or regulations, could require us to incur potentially significant costs or sanctions, including fines, penalties, or cessation of operations or site clean ups, or otherwise adversely affect our business, financial condition and results of operations.
The effects of climate change and/or increased regulation by international, national, state, regional, and local regulatory bodies of greenhouse gas emissions could materially affect our business, financial condition, results of operation and cash flows.
There has been an increasing focus of international, national, state, regional and local regulatory bodies on greenhouse gas (“GHG”), including carbon dioxide and methane, emissions, and climate change issues. The United States is a member of the Paris Agreement, a climate accord reached at the Conference of the Parties (“COP 21”) in Paris, that set many new goals, and many related policies are still emerging. The Paris Agreement requires set GHG emission reduction goals every five years beginning in 2020. Stronger GHG emission targets were set at COP 26 in Glasgow in November 2021 and reaffirmed at COP 28 in Dubai in November and December 2023.
Future regulation could impose stringent standards to substantially reduce GHG emissions. Legislation to regulate GHG emissions has periodically been introduced in the U.S. Congress. If such legislation is enacted, we could incur increased energy, environmental, and other costs and capital expenditures to comply with the limitations.In addition, the current presidential administration has taken steps to further regulate GHG emissions. Due to uncertainty in the regulatory and legislative processes, as well as the scope of such requirements and initiatives, we cannot currently determine the effect such legislation and regulation may have on our operations, but it could be costly and difficult to implement.
Beyond financial and regulatory effects, the projected severe effects of climate change – such as protracted drought and property damage or supply chain issues stemming from extreme weather events – have the potential to directly affect our facilities and operations. We recognize the impacts of climate change and are engaged in several initiatives to identify, assess, and manage the risks and opportunities associated with climate change (see “Social Responsibility and Environmental Stewardship,” above).
Increased scrutiny and changing expectations from investors, consumers, employees, regulators, and others regarding our environmental, social and governance practices and reporting could cause us to incur additional costs, devote additional resources and expose us to additional risks, which could adversely impact our reputation, customer attraction and retention, access to capital and employee recruitment and retention.
Companies across all industries are facing increasing scrutiny related to their environmental, social and governance (“ESG”) practices and reporting. Investors, consumers, employees and other stakeholders have focused increasingly on ESG practices and placed increasing importance on the implications and social cost of their investments, purchases and other
interactions with companies. With this increased focus, public reporting regarding ESG practices is becoming more broadly expected. If our ESG practices and reporting do not meet investor, consumer or employee expectations, which continue to evolve, our brand, reputation and customer retention may be negatively impacted.
Our ability to achieve any ESG objective is subject to numerous risks, many of which are outside of our control. Examples of such risks include:
•the availability and cost of low- or non-carbon-based energy sources;
•the evolving regulatory requirements affecting ESG standards or disclosures;
•the availability of suppliers that can meet sustainability, diversity and other ESG standards that we may set;
•our ability to recruit, develop and retain diverse talent in our labor markets; and
•the success of our organic growth and acquisitions or dispositions of businesses or operations.
If we fail, or are perceived to be failing, to meet the standards included in any sustainability disclosure or the expectations of our various stakeholders, it could negatively impact our reputation, customer attraction and retention, access to capital and employee retention. Investors are increasingly focused on ESG matters and failure to address their needs could lead to stock price volatility. In addition, new sustainability rules and regulations have been adopted and may continue to be introduced. For instance, the SEC is in the process of considering new disclosure rules that would require companies to disclose the impact of climate change and their risk mitigation environment and practices. Our failure to comply with any applicable rules or regulations as they are adopted, as well as our failure to predict trends and stakeholder requirements related to ESG, could lead to penalties and adversely impact our reputation, customer attraction and retention, access to capital and employee retention.
We may incur losses that are not adequately covered by insurance, which may harm our results of operations. In addition, our insurance costs may increase and we may not be able to obtain similar insurance coverage in the future.
Although we maintain insurance that we believe is customary and appropriate for our business, each of our insurance policies is subject to certain exclusions and our coverage is in an amount that may be significantly less than the expected replacement cost of rebuilding our facilities in the event of a total loss. To the extent that we are inadequately insured for certain types or levels of risk, we may be exposed to significant losses in the event of a catastrophe. In addition to the damage caused to our properties by a casualty loss, we may suffer business disruption or be subject to claims by third parties that may be injured or harmed. While we carry general liability insurance and business interruption insurance, there can be no assurance that insurance will be available or adequate to cover all loss and damage to which our business or our assets might be subjected. Certain casualty events, such as labor strikes, nuclear events, loss of income due to terrorism or epidemics, deterioration or corrosion, insect or animal damage and pollution, may not be covered under our policies. Any losses we incur that are not adequately covered by insurance may decrease our future operating income, require us to fund replacements or repairs for destroyed property and reduce the funds available for payments of our obligations.
We renew our insurance policies on an annual basis. To the extent that the cost of insurance coverage increases, we may be required to reduce our policy limits or agree to exclusions from our coverage.
We may incur delays and budget overruns with respect to current or future construction projects. Any such delays or cost overruns may have a material adverse effect on our operating results.
We evaluate expansion opportunities as they become available, and in the future we may construct new facilities or enhance our existing properties by constructing additional facilities. Such construction projects entail significant risks, including the following, any of which can give rise to delays or cost overruns:
•shortages of material or skilled labor;
•unforeseen engineering, environmental or geological problems;
•work stoppages;
•weather interference;
•floods;
•unanticipated cost increases; and
•legal or political challenges.
The anticipated costs and construction periods are based upon budgets, conceptual design documents and construction schedule estimates prepared by us in consultation with our architects and contractors. Construction, equipment, staffing requirements, problems or difficulties in obtaining and maintaining any of the requisite licenses, permits, allocations or authorizations from regulatory authorities can increase the cost or delay the construction or opening of each of the proposed facilities or otherwise affect the project’s planned design and features. We cannot be sure that we will not exceed the budgeted costs of these projects, that the projects will commence operations within the contemplated time frame, if at all, or that we will receive the return on investment that we expect from such projects. Budget overruns and delays with respect to expansion and development projects could have a material adverse impact on our results of operations.
We may pursue new gaming acquisition and development opportunities and may not be able to recover our investment or successfully expand to additional locations.
We have invested in real property in connection with development and expansion opportunities and we evaluate and may pursue acquisition opportunities in existing and emerging jurisdictions. To the extent that we decide to pursue any new gaming acquisition or development opportunities, our ability to benefit from such investments will depend upon a number of factors including:
•our ability to identify and acquire attractive acquisition opportunities and development sites;
•our ability to secure required federal, state and local licenses, permits and approvals, which in some jurisdictions are limited in number;
•certain political factors, such as local support or opposition to development of new gaming facilities or legalizing casino gaming in designated areas;
•restrictions in our existing credit arrangements and the availability of adequate financing on acceptable terms; and
•our ability to identify and develop satisfactory relationships with joint venture partners.
Most of these factors are beyond our control. Therefore, we cannot be sure that we will be able to recover our investment in any of our existing or new gaming development opportunities or acquired facilities, or successfully expand to additional locations.
We require significant capital to fund capital expenditures, pursue proposed development, expansion or acquisition opportunities or refinance our indebtedness.
Our businesses are capital intensive. For our casino properties to remain attractive and competitive we must periodically invest significant capital to keep the properties well-maintained, modernized and refurbished. Similarly, future construction and development projects, including but not limited to, the proposed North Fork Project, and acquisitions of other gaming operations could require significant additional capital. We rely on earnings and cash flow from operations to finance our business, capital expenditures, development, expansion and acquisitions and, to the extent that we cannot fund such expenditures from cash generated by operations, funds must be borrowed or otherwise obtained. We will also be required in the future to refinance our outstanding debt. Our ability to effectively operate and grow our business may be constrained if we are unable to borrow additional capital or refinance existing borrowings on reasonable terms.
We may be unable to generate sufficient revenues and cash flows to service our debt obligations as they come due, finance capital expenditures and meet our operational needs.
If we are unable to access sufficient capital from operations or borrowings, we may be precluded from:
•maintaining or enhancing our properties;
•taking advantage of future opportunities;
•growing our business; or
•responding to competitive pressures.
Further, our failure to generate sufficient revenues and cash flows could lead to cash flow and working capital constraints, which may require us to seek additional working capital. We may not be able to obtain such working capital when it is required. Further, even if we were able to obtain additional working capital, it may only be available on unfavorable terms. For example, we may be required to incur additional debt, and servicing the payments on such debt could adversely affect our results of operations and financial condition. Limited liquidity and working capital may also restrict our ability to maintain and update our casino properties, which could put us at a competitive disadvantage to casinos offering more modern and better maintained facilities.
If we do not have access to credit or capital markets at desirable times or at rates that we would consider acceptable, the lack of such funding could have a material adverse effect on our business, results of operations and financial condition and our ability to service our indebtedness.
We may incur impairments to goodwill, indefinite-lived intangible assets, or long-lived assets which could negatively affect our results of operations.
We test our goodwill and indefinite-lived intangible assets for impairment during the fourth quarter of each year and when a triggering event occurs, and we test other long-lived assets for impairment whenever changes in circumstances indicate that the carrying amount of an asset may not be recoverable. If we do not achieve our projected cash flow estimates related to such assets, we may be required to record an impairment charge, which could have a material adverse impact on our financial statements. We have recognized significant impairment charges in the past as a result of a number of factors including negative industry and economic trends, reduced estimates of future cash flows, and slower than expected growth. We could be required to recognize additional impairment charges, which could have a material adverse effect on our results of operations if events that negatively impact our business should occur in the future.
Any failure to protect our trademarks could have a negative impact on the value of our brand names and adversely affect our business.
The development of intellectual property is part of our overall business strategy, and we regard our intellectual property to be an important element of our success. While our business as a whole is not substantially dependent on any one
trademark or combination of several of our trademarks or other intellectual property, we seek to establish and maintain our
proprietary rights in our business operations through the use of trademarks. Despite our efforts to protect our proprietary rights, parties may infringe our trademarks and our rights may be invalidated or unenforceable. Monitoring the unauthorized use of our intellectual property is difficult. Litigation may be necessary to enforce our intellectual property rights or to determine the validity and scope of the proprietary rights of others. Litigation of this type could result in substantial costs and diversion of resources. We cannot assure you that all of the steps we have taken to protect our trademarks will be adequate to prevent imitation of our trademarks by others. The unauthorized use or reproduction of our trademarks could diminish the value of our brand and its market acceptance, competitive advantages or goodwill, which could adversely affect our business.
Shortages or increases in prices of energy or water may adversely affect our business and our results of operations.
Our casinos and hotels use significant amounts of electricity, natural gas, other forms of energy and water. The southwest United States is currently experiencing a series of long-lasting drought phases, which may result in governmentally-imposed restrictions on water use or increases in the cost of water. Any such restrictions on use of water or increases in cost could adversely impact our business and our results of operations. While no shortages of energy have been experienced recently, energywe have experienced and are currently experiencing increases in the cost of energy. Energy shortages or substantial or continuing increases in the cost of electricity have negatively affected our operating results in the past.past, and could adversely impact our business and our results of operations.
Win rates for our gaming operations depend on a variety of factors, some beyond our control, and the winnings of our gaming customers could exceed our casino winnings.
The gaming industry is characterized by an element of chance. In addition to the element of chance, win rates are also affected by other factors, including players’ skill and experience, the mix of games played, the financial resources of players, the spread of table limits, the volume of bets placed and the amount of time played. Our gaming profits are mainly derived from the difference between our casino winnings and the casino winnings of our gaming customers. Since there is an inherent element of chance in the gaming industry, we do not have full control over our winnings or the winnings of our gaming customers. If the winnings of our gaming customers exceed our winnings, we may record a loss from our gaming operations, which could have a material adverse effect on our business, financial condition, results of operations and cash flows.
We face the risk of fraud and cheating.
Our gaming customers may attempt or commit fraud or cheat in order to increase winnings. Acts of fraud or cheating could involve the use of counterfeit chips or other tactics, possibly in collusion with our employees. Internal acts of cheating could also be conducted by employees through collusion with dealers, surveillance staff, floor managers or other casino or gaming area staff. Failure to discover such acts or schemes in a timely manner could result in losses in our gaming operations. In addition, negative publicity related to such schemes could have an adverse effect on our reputation, potentially causing a material adverse effect on our business, financial condition, results of operations and cash flows.
Failure to maintain the integrity of our internal or customer data, including defending our information systems against hacking, security breaches, computer malware, cyber-attacks and similar technology exploitation risks, could have an adverse effect on our results of operations and cash flows, and/or subject us to costs, fines or lawsuits.
Our business requires the collection and retention of large volumes of data about our customers, employees, suppliers and business partners, including customer credit card numbers and other personally identifiable information of our customers and employees, in various information systems that we maintain and in those maintained by third-party service providers. The integrity and protection of that data is important to our business and is subject to privacy laws enacted by various jurisdictions. The regulatory environment and the requirements imposed on us by the payment card industry surrounding information, security and privacy are evolving and may be inconsistent. Our systems may be unable to meet changing regulatory and payment card industry requirements and employee and customer expectations, or may require significant additional investments or time in order to do so. Our information systems and records, including those maintained by service providers, may be subject to cyber-attacks, security breaches, system failures, viruses, operator error or inadvertent releases of data. Any perceived or actual electronic or physical security breach involving the misappropriation, loss, or other unauthorized disclosure of confidential or personally identifiable information, including penetration of our network security, whether by us or by a third party, could disrupt our business, damage our reputation and our relationships with our customers or employees, expose us to risks of litigation, significant fines and penalties and liability, result in the deterioration of our customers’ and employees’ confidence in us, and adversely affect our business, results of operations and financial condition.
Cyber-attacks and security breaches may include, but are not limited to, attempts to access information, including customer and company information, computer malware such as viruses, denial of service, ransomware attacks that encrypt,
exfiltrate, or otherwise render data unusable or unavailable in an effort to extort money or other consideration as a condition to purportedly returning the data to a usable form, operator errors or misuse, or inadvertent releases of data, and other forms of electronic security breaches. The techniques and sophistication used to conduct cyberattacks and compromise information technology infrastructure, as well as the sources and targets of these attacks, change and are often not recognized until such attacks are launched or have been in place for some time. In addition, there has been an increase in state sponsored cyberattacks which are often conducted by capable, well-funded groups. The rapid evolution and increased adoption of artificial intelligence technologies amplifies these concerns. The steps we have taken to mitigate these risks may not be sufficient and a significant theft, loss or fraudulent use of customer, employee or company data maintained by us or by a service provider could have an adverse effect on our reputation and employee relationships and could result in remedial and other expenses, fines or litigation. A breach in the security of our information systems or those of our service providers could lead to an interruption in the operation of our systems or loss,
disclosure or misappropriation of our business information or other unintended consequences. If any of these risks materialize, they could have an adverse effect on our business, results of operations and cash flows.
Risks Related to our Indebtedness
We have a substantial amount of indebtedness, which could have a material adverse effect on our financial condition and our ability to obtain financing in the future and to react to changes in our business.
We have a substantial amount of debt, which requires significant principal and interest payments. As of December 31, 2020,2023, the principal amount of our outstanding indebtedness totaled approximately $2.92$3.35 billion and we had $1.0 billion$479.3 million of undrawn availability under our Revolving Credit Facility, which is net of the issuance of approximately $29.4$39.8 million of letters of credit and similar obligations. Our ability to make interest payments on our debt will be significantly impacted by general economic, financial, competitive and other factors beyond our control.
Our substantial indebtedness could:
•make it more difficult for us to satisfy our obligations under our senior notes and senior secured credit facilities and other indebtedness;
•increase our vulnerability to adverse economic and general industry conditions, including interest rate fluctuations, because a portion of our borrowings, including those under our senior secured credit facilities, are and will continue to be at variable rates of interest;
•require us to dedicate a substantial portion of our cash flow from operations to payments on our debt, which would reduce the availability of our cash flow from operations to fund working capital, capital expenditures or other general corporate purposes;
•limit our flexibility in planning for, or reacting to, changes in our business and industry;
•place us at a disadvantage compared to competitors that may have proportionately less debt;
•limit our ability to obtain additional debt or equity financing due to applicable financial and restrictive covenants in our debt agreements; and
•cause us to incur higher interest expense in the event of increases in interest rates on our borrowings that have variable interest rates or if we refinance existing debt at higher interest rates.
Our indebtedness imposes restrictive financial and operating covenants that limit our flexibility in operating our business and may adversely affect our ability to compete or engage in favorable business or financing activities.
Our credit agreements and the indentureindentures governing our senior notes contain a number of covenants that impose significant operating and financial restrictions on us, including certain limitations on our and our subsidiaries’ ability to, among other things:
•incur additional debt or issue certain preferred units;
•pay dividends on or make certain redemptions, repurchases or distributions or make other restricted payments;
•make certain investments;
•sell certain assets;
•create liens on certain assets;
•consolidate, merge, sell or otherwise dispose of all or substantially all of our assets; and
•enter into certain transactions with our affiliates.
In addition, our credit agreements contain certain financial covenants, including maintenance of a minimum interest coverage ratio and adherence to a maximum total leverage ratio.
As a result of these covenants and restrictions, we are limited in how we conduct our business and we may be unable to raise additional debt or equity financing to compete effectively or to take advantage of new business opportunities. Our ability to comply with covenants and restrictions contained in the agreements governing our indebtedness also may be affected by general economic conditions, industry conditions and other events beyond our control. As a result, we cannot assure you that we will be able to comply with these covenants and restrictions.
A failure to comply with the covenants contained in the credit agreements, the indentures governing our senior notes, or other indebtedness that we may incur in the future could result in an event of default, which, if not cured or waived, could result in the acceleration of the indebtedness and have a material adverse effect on our business, financial condition and results of operations.
Despite our current indebtedness levels, we and our subsidiaries may still incur significant additional indebtedness, which could increase the risks associated with our substantial indebtedness.
We and our subsidiaries may be able to incur substantial additional indebtedness, including additional secured indebtedness, in the future. The terms of the documents governing our indebtedness restrict, but do not completely prohibit, us from doing so. As of December 31, 2020,2023, we had $1.0 billion$479.3 million of undrawn availability under our Revolving Credit Facility, which is net of $512.0 million in outstanding borrowings and the issuance of approximately $29.4$39.8 million of letters of credit and similar obligations. In addition, the indentures governing our senior notes allow us to issue additional notes under certain circumstances. The indentures also allow us to incur certain other additional secured and unsecured debt. Further, the indentures do not prevent us from incurring other liabilities that do not constitute indebtedness. If new debt or other liabilities are added to our current debt levels, the related risks that we and our subsidiaries now face could intensify.
We may not be able to generate sufficient cash to service all of our indebtedness, and may be forced to take other actions to satisfy our obligations under our indebtedness, which may not be successful.
Our ability to make scheduled payments on or to refinance our debt obligations depends on our financial condition and operating performance, which is subject to prevailing economic and competitive conditions and to certain financial, business, legislative, regulatory and other factors beyond our control. We cannot assure you that we will maintain a level of cash flows from operating activities sufficient to permit us to pay the principal, premium, if any, and interest on our indebtedness.
If our cash flows and capital resources are insufficient to fund our debt service obligations, we may be forced to reduce or delay investments and capital expenditures, or to sell assets, seek additional capital or restructure or refinance our indebtedness. These alternative measures may not be successful and may not permit us to meet our scheduled debt service obligations. If our operating results and available cash are insufficient to meet our debt service obligations, we could face substantial liquidity problems and might be required to dispose of significant assets or operations or sell equity to meet our debt service and other obligations. We may not be able to consummate those dispositions or to obtain the proceeds that we could realize from them, and these proceeds may not be adequate to meet any debt service obligations then due. Additionally, the documents governing our indebtedness limit the use of the proceeds from any disposition; as a result, we may not be allowed, under these documents, to use proceeds from such dispositions to satisfy all current debt service obligations.
Our ability to remain in compliance with our covenants contained in the agreements governing our indebtedness and our liquidity may be negatively impacted byCOVID-19, measures implemented to curtail its spread, and changes in the economy, discretionary spending and consumer confidence.
We rely on our casino operations as a primary source of income and operating cash flows to remain in compliance with covenants contained in the documents governing our outstanding indebtedness. At December 31, 2020 we believe we were in compliance with such covenants; however, our ability to remain in compliance with the covenants contained in such agreements may be negatively impacted if COVID-19, measures implemented to curtail its spread, and changes in the economy, discretionary spending and consumer confidence have a protracted negative effect on our business. Failure to satisfy such debt covenants would require us to seek waivers or amendments of such covenants. If we are unable to obtain such waivers or amendments, our creditors would be entitled to exercise remedies under the documents governing such obligations, including acceleration of the outstanding principal amount of such indebtedness. In addition, while we believe that our cash on hand and our borrowing availability under our revolving credit facility will be sufficient to provide liquidity to meet our obligations during the current period that our operations are impacted by COVID-19, our ability to make required payments under our outstanding indebtedness or other obligations may be negatively impacted by additional measures that we are required to take in response to COVID-19 and widespread unemployment and disruption to the economy caused by COVID-19.
In addition, we may be unable to raise additional debt or equity financing to provide liquidity if COVID-19, measures implemented to curtail its spread, and changes in the economy, discretionary spending and consumer confidence have a protracted negative effect on our business.
Risks Related to Our Structure and Organization
Red Rock’s only material asset is its interest in Station Holdco and Station LLC. Accordingly, it is dependent upon distributions from Station Holdco to make payments under the tax receivable agreement, pay dividends, if any, and pay taxes and other expenses.
Red Rock is a holding company. ItsOther than assets and liabilities related to income taxes and the tax receivable agreement, its only material assets are its ownership of LLC Unitsequity interest in Station Holdco and its voting interest in Station LLC, other than cash and tax-related assets and liabilities.LLC. In connection with the IPO, Red Rock entered into a tax receivable agreement (“TRA”) with certain pre-IPO owners of Station Holdco. Red Rock intends to cause Station Holdco to make distributions to its members, including us, in an amount sufficient to cover all applicable taxes at assumed tax rates, payments under the TRA and dividends, if any, declared by it. To the extent Station LLC or Station Holdco is restricted from making such distributions pursuant to the terms of the agreements governing its debt or under applicable law or regulation, or is otherwise unable to provide such funds, it could materially and adversely affect Red
Rock’s liquidity and financial condition and impair Red Rock’s ability to pay taxes and other expenses, make payments under the TRA or pay dividends on the Class A common stock.
Payments of dividends, if any, will be at the discretion of our board of directors after taking into account various factors, including our business, operating results and financial condition, current and anticipated cash needs, plans for expansion and any legal or contractual limitations on our ability to pay dividends. Our credit facility and the indentures governing our senior notes include, and any financing arrangement that we enter into in the future may include, restrictive covenants that limit our ability to pay dividends and make distributions. In addition, Station Holdco is generally prohibited under Delaware law from making a distribution to a member to the extent that, at the time of the distribution, after giving effect to the distribution, liabilities of Station Holdco (with certain exceptions) exceed the fair value of its assets. Subsidiaries of Station Holdco are generally subject to similar legal limitations on their ability to make distributions to Station Holdco.
Our Principal Equity Holders have control over our management and affairs, and their interests may differ from our interests or those of our other stockholders.
Each outstanding share of Class B common stock that is held by a holder that, together with its affiliates, owned LLC Units representing at least 30% of the outstanding LLC Units immediately following the IPO and, at the applicable record date, maintains direct or indirect beneficial ownership of at least 10% of the outstanding shares of Class A common stock (determined on an as-exchanged basis assuming that all of the LLC Units were exchanged for Class A common stock) is entitled to ten votes, and each other outstanding share of Class B common stock and each share of Class A common stock is entitled to one vote. As a result, Fertitta Family Entities held 87.9%90.1% of the combined voting power of Red Rock as of December 31, 2020.2023. Due to their ownership, the Fertitta Family Entities have the power to control our management and affairs, including the power to:
•elect all of our directors;
•agree to sell or otherwise transfer a controlling stake in our Company, which may result in the acquisition of effective control of our Company by a third party; and
•determine the outcome of substantially all actions requiring stockholder approval, including transactions with related parties, corporate reorganizations, acquisitions and dispositions of assets and dividends.
The interests of the Fertitta Family Entities may differ from our interests or those of our other stakeholders, including our stockholders and the concentration of control in the Fertitta Family Entities will limit other stockholders’ ability to influence corporate matters. The concentration of ownership and voting power of the Fertitta Family Entities may also prevent or cause a change of control of our Company or a change in the composition of our board of directors and will make many transactions impossible without the support of the Fertitta Family Entities, even if such events are in the best interests of our other stockholders.stakeholders. As a result of the concentration of voting power among the Fertitta Family Entities, we may take actions that our other stockholders do not view as beneficial, which may adversely affect our results of operations and financial condition and cause the value of your investment in our Class A common stock to decline.
In addition, because the Principal Equity Holders hold most of their ownership interest in part of our business directly and/or indirectly through Station Holdco, rather than through Red Rock, the public company, they may have conflicting interests with holders of shares of our Class A common stock. For example, if Station Holdco makes distributions to Red Rock, the Principal Equity Holders will also be entitled to receive distributions pro rata in accordance with the percentages of their respective LLC Units and their preferences as to the timing and amount of any such distributions may differ from those of our public stockholders. The Principal Equity Holders may also have different tax positions from us which could influence their
decisions regarding whether and when to dispose of assets, especially in light of the existence of the TRA, whether and when to incur new, or refinance existing, indebtedness, and whether and when Red Rock should terminate the TRA and accelerate its obligations thereunder. The structuring of future transactions may take into consideration these Principal Equity Holders’ tax or other considerations even where no similar benefit would accrue to us. For example, a disposition of real estate or other assets in a taxable transaction could accelerate then-existing obligations under the TRA, which may result in differing incentives between the Principal Equity Holders and Red Rock with respect to such a transaction. For more information, see “Tax Receivable Agreement” within Note 2 to the Consolidated Financial Statements.
We are a “controlled company” within the meaning of the rules of NASDAQ and, as a result, qualify for, and intend to rely on, exemptions from certain corporate governance requirements. You will not have the same protections afforded to stockholders of companies that are subject to such requirements.
The Fertitta Family Entities hold more than 50% of the voting power of our shares eligible to vote. As a result, we are a “controlled company” under the rules of NASDAQ. Under these rules, a company of which more than 50% of the voting power in the election of directors is held by an individual, group or another company is a “controlled company” and may elect not to comply with certain corporate governance requirements, including the requirements that (i) a majority of the board of directors consist of independent directors and (ii) that the board of directors have compensation and nominating and corporate governance committees composed entirely of independent directors. Although a majority of the members of our board of directors are independent and our compensation and nominating and corporate governance committees are comprised entirely of independent directors, in the future we may elect not to comply with certain corporate governance requirements that are not applicable to controlled companies.
We will be required to pay certain of our pre-IPO Ownersowners for certain tax benefits we may claim arising in connection with the reorganization transactions, and the amounts we may pay could be substantial.
The TRA provides for the payment by Red Rock to certain of our pre-IPO owners of 85% of the amount of benefits, if any, that Red Rock realizes (or is deemed to realize in the case of an early termination payment by us, a change in control or a material breach by us of our obligations under the TRA, as discussed below) as a result of (i) increases in tax basis resulting from our purchases or exchanges of LLC Units and (ii) certain other tax benefits related to our entering into the TRA, including tax benefits attributable to payments that we are required to make under the TRA. See “Tax Receivable Agreement” within Note 2 to the Consolidated Financial Statements.
Any increases in tax basis, as well as the amount and timing of any payments under the TRA, cannot reliably be predicted at this time. The amount of any such increases and payments will vary depending upon a number of factors, including, but not limited to, the timing of exchanges, the price of our Class A common stock at the time of the exchanges, the amount, character and timing of our income and the tax rates then applicable.
The payments that we may make under the TRA could be substantial. At December 31, 20202023 and 2019,2022, our liability under the TRA with respect to previously consummated transactions was $27.4$22.1 million and $25.1$28.6 million, respectively. Assuming no material changes in the relevant tax law and based on our current operating plan and other assumptions, including our estimate of the tax basis of our assets as of December 31, 20202023 and that Red Rock earns sufficient taxable income to realize all the tax benefits that are subject to the TRA, we expect to make payments under the TRA over a period of approximately 40 years. The foregoing numbers are merely estimates based on current assumptions. The amount of actual payments could differ materially.
Future payments to our pre-IPO owners in respect of any subsequent exchanges of LLC Units for Class A common stock would be in addition to these amounts and are expected to be substantial. It is possible that future transactions or events could increase or decrease the actual tax benefits realized and the corresponding TRA payments. There may be a material negative effect on our liquidity if, as a result of timing discrepancies or otherwise (as described below), the payments under the TRA exceed the actual benefits we realize in respect of the tax attributes subject to the TRA and/or distributions to Red Rock by Station Holdco are not sufficient to permit Red Rock to make payments under the TRA after it has paid taxes.
In certain cases, payments under the TRA may be accelerated and/or significantly exceed the actual benefits, if any, we realize in respect of the tax attributes subject to the TRA.
The TRA provides that in the event that we exercise our right to early termination of the TRA, there is a change in control or a material breach by us of our obligations under the TRA, the TRA will terminate, and we will be required to make a payment equal to the present value of future payments under the TRA, which payment would be based on certain assumptions, including those relating to our future taxable income, and may substantially exceed the actual benefits, if any, we realize in
respect of the tax attributes subject to the TRA. In these situations, our obligations under the TRA could have a substantial negative impact on our liquidity, and there can be no assurance that we will be able to finance our obligations under the TRA. In addition, these obligations could have the effect of delaying, deferring or preventing certain mergers, asset sales, other forms of business combinations or other changes of control, in particular in circumstances where our Principal Equity Holders have interests that differ from those of other stockholders. Because our Principal Equity Holders have a controlling ownership interest in the Company, they are able to control the outcome of votes on all matters requiring approval by our stockholders. Accordingly, actions that affect such obligations under the TRA may be taken even if other stockholders oppose them.
Payments under the TRA will be based on the tax reporting positions that we determine. Although we are not aware of any material issue that would cause the Internal Revenue Service (the “IRS”) to challenge a tax basis increase, we will not be reimbursed for any payments previously made under the TRA (although we would reduce future amounts otherwise payable under such TRA). No assurance can be given that the IRS will agree with the allocation of value among our assets. As a result, in certain circumstances, payments could be made under the TRA in excess of the benefit that we actually realize in respect of the increases in tax basis resulting from our purchases or exchanges of LLC Units and certain other tax benefits related to our entering into the TRA.
We may not be able to realize all or a portion of the tax benefits that are expected to result from the exchanges of LLC Units and payments made under the TRA itself.
Our ability to benefit from any depreciation or amortization deductions or to realize other tax benefits that we currently expect to be available as a result of the increases in tax basis created by the exchanges of LLC Units, including exchanges associated with the sale of the shares of Class A common stock offered hereby, and our ability to realize certain other tax benefits attributable to payments under the TRA itself, depend on a number of assumptions, including that we
earn sufficient taxable income each year during the period over which such deductions are available and that there are no adverse changes in applicable law or regulations. If our actual taxable income is insufficient and/or there are adverse changes in applicable law or regulations, we may be unable to realize all or a portion of these expected benefits and our cash flows and stockholders’ equity could be negatively affected. However, absent a change in control or other termination event with respect to the TRA, we will generally not be required to make payments under that agreement with respect to projected tax benefits that we do not actually realize, as reported on our tax return. See “Tax Receivable Agreement” within Note 2 to the Consolidated Financial Statements.
General Risks Related to Ownership of Our Class A Common Stock
The market price of our Class A common stock could decline upon the exchange of LLC Units by our Continuing Owners.
At December 31, 2020,2023, approximately 46 million LLC Units of Station Holdco were owned by our Continuing Owners, or 39.3%42.2% of Red Rock Class A common stock on a fully exchanged basis, and may be sold in the future. In addition, under the Exchange Agreement, each holder of shares our Class B common stock is entitled to exchange its LLC Units for shares of our Class A common stock, as described under “Tax Receivable Agreement”“Class B Common Stock” within Note 29 to the Consolidated Financial Statements.
The market price of our Class A common stock could decline as a result of sales of a large number of shares of our Class A common stock eligible for future sale, or the perception that such sales could occur. These sales, or the possibility that these sales may occur, may make it more difficult for holders of our Class A common stock to sell such stock in the future at a time and at a price that they deem appropriate. They also may make it more difficult for us to raise additional capital by selling equity securities in the future.
We may not have sufficient funds to pay dividends on our Class A common stock.
Although we have in the past and may in the futureintend to pay dividends on our Class A common stock to the extent that we have sufficient funds available for such purpose, the declaration, amount and payment of any future dividends on shares of Class A common stock will be at the sole discretion of our board of directors and if we reinstate the payment of dividends we may reduce or discontinue entirely the payment of such dividends at any time thereafter.directors. Our board of directors may take into account general and economic conditions, our financial condition and operating results, our available cash and current and anticipated cash needs, capital requirements, contractual, legal, tax and regulatory restrictions and implications on the payment of dividends by us to our stockholders or by our subsidiaries to us, and such other factors as our board of directors may deem relevant. The existing debt agreements of Station LLC limit the ability of Station LLC to make distributions to Station Holdco, which effectively restricts the ability of Station Holdco to distribute sufficient funds to permit Red Rock to pay dividends to its stockholders. Red Rock will be required to apply funds distributed by Station Holdco to pay taxes and make payments under
the TRA. Therefore, we cannot assure you that you will receive any dividends on your Class A common stock. Accordingly, you may need to sell your shares of Class A common stock to realize a return on your investment, and you may not be able to sell your shares above the price you paid for them. See Note 109 to the Consolidated Financial Statements.
Anti-takeover provisions and shareholder requirements in our charter documents, provisions of Delaware law and Nevada gaming laws may delay or prevent our acquisition by a third party, which might diminish the value of our Class A common stock. Provisions in our debt agreements may also require an acquirer to refinance our outstanding indebtedness if a change of control occurs, which could discourage or increase the costs of a takeover.
In addition to the Fertitta Family Entities owning 87.9%90.1% of the combined voting power of our common stock, which permits them to control decisions made by our stockholders, including election of directors and change of control transactions, our amended and restated certificate of incorporation and bylaws contain provisions that make it harder for a third party to acquire us. These provisions include certain super-majority approval requirements and limitations on actions by written consent of our stockholders at any time that the Fertitta Family Entities hold less than 10% of the LLC Units. In addition, our board of directors has the right to issue preferred stock without stockholder approval that could be used to dilute a potential hostile acquirer. Our amended and restated certificate of incorporation also imposes some restrictions on mergers and other business combinations between us and any holder of 15% or more of our outstanding common stock other than the Fertitta Family Entities.
The Nevada Act provides that persons who acquire beneficial ownership of more than 5% of the voting or non-voting securities of a Registered Corporation under Nevada gaming laws must report the acquisition to the Nevada Commission. The Nevada Act also requires that beneficial owners of more than 10% of the voting securities of a Registered Corporation must apply, subject to certain exceptions, to the Nevada Commission for a finding of suitability within thirty days after the Chair of
the Nevada Board mails the written notice requiring such filing. Further, changes in control of the Company through merger, consolidation, stock or asset acquisitions (including stock issuances in connection with restructuring transactions), management or consulting agreements, or any act or conduct by a person whereby such person obtains control, may not occur without the prior approval of the Nevada Commission.
These anti-takeover provisions, shareholder requirements and other provisions under Delaware law and Nevada gaming laws could discourage, delay or prevent a transaction involving a change in control of our Company, including transactions that our stockholders may deem advantageous, and negatively affect the trading price of our Class A common stock. These provisions could also discourage proxy contests and make it more difficult for you and other stockholders to elect directors of your choosing and to cause us to take other corporate actions you desire.
Under the agreements governing our indebtedness, a takeover of our Company would likely constitute a “change of control” and be deemed to be an event of default under such facility, which would therefore require a third-party acquirer to refinance any outstanding indebtedness under the credit facility in connection with such takeover. In addition, the TRA provides that, in the event of a change of control, we are required to make a payment equal to the present value of estimated future payments under the TRA, which would result in a significant payment becoming due in the event of a change of control. These change of control provisions, and similar provisions in future agreements, are likely to increase the costs of any takeover and may discourage, delay or prevent an acquisition of our Company by a third party.
Future offerings of debt securities or additional or increased loans, which would rank senior to our common stock upon our bankruptcy or liquidation, and future offerings of equity securities that may be senior to our common stock for the purposes of dividend and liquidating distributions, may adversely affect the market price of our Class A common stock.
In the future, we may attempt to increase our capital resources through offerings of debt securities, entering into or increasing amounts under our loan agreements or additional offerings of equity securities. Upon bankruptcy or liquidation, holders of our debt securities, including holders of our senior notes, and shares of preferred stock, if any is issued, and lenders with respect to our indebtedness, including our credit facility, will receive a distribution of our available assets prior to the holders of our common stock. Additional equity offerings may dilute the holdings of our existing stockholders or reduce the market price of our common stock, or both. Our preferred stock, if issued, will likely have a preference on liquidating distributions or a preference on dividend payments or both that could limit our ability to make a dividend distribution to the holders of our common stock. Our decision to issue securities in any future offering or enter into or increase loan amounts will depend on our management’s views on our capital structure and financial results, as well as market conditions and other factors beyond our control. As a result, we cannot predict or estimate the amount, timing or nature of any such future transaction, and purchasers of our Class A common stock bear the risk of our future transactions reducing the market price of our Class A common stock and diluting their ownership interest in our Company.
General Risks
The share price for our Class A common stock may fluctuate significantly.
The market price of our Class A common stock may be significantly affected by factors such as quarterly variations in our results of operations, changes in government regulations, general market conditions specific to the gaming industry, changes in interest rates, changes in general and/or local economic and political conditions, volatility in the financial markets, threatened or actual litigation or government investigations, the addition or departure of key personnel, actions taken by our stockholders, including the sale or other disposition of their shares of our Class A common stock, differences between our actual financial and operating results and those expected by investors and analysts and changes in analysts’ recommendations or projections. These and other factors may lower the market price of our Class A common stock, even though they may or may not affect our actual operating performance.
Furthermore, in recent years the stock market has experienced significant price and volume fluctuations. This volatility has had a significant impact on the market price of securities issued by many companies, including companies in our industry. The changes frequently appear to occur without regard to the operating performance of the affected companies. Hence, the price of our Class A common stock could fluctuate based upon factors that have little or nothing to do with us, and these fluctuations could materially reduce the price of our Class A common stock and materially affect the value of your investment.
Additionally, significant sales of our Class A common stock, whether by the principal equity holders or the Company, could have a significant effect on the price of our Class A common stock and, in the case of sales by the Company, a dilutive effect on existing stockholders.
We are subject to litigation in the ordinary course of our business. An adverse determination with respect to any such disputed matter could result in substantial losses.
We are, from time to time, during the ordinary course of operating our businesses, subject to various litigation claims and legal disputes, including contract, lease, employment and regulatory claims as well as claims made by visitors to our properties. There are also litigation risks inherent in any construction or development of any of our properties. Certain litigation claims may not be covered entirely or at all by our insurance policies or our insurance carriers may seek to deny coverage. In addition, litigation claims can be expensive to defend and may divert our attention from the operations of our businesses. Further, litigation involving visitors to our properties, even if without merit, can attract adverse media attention. As a result, litigation can have a material adverse effect on our businesses and, because we cannot predict the outcome of any action, it is possible that adverse judgments or settlements could significantly reduce our earnings or result in losses.
Work stoppages, labor problems and unexpected shutdowns may limit our operational flexibility and negatively impact our future profits.
Any work stoppage at one or more of our casino properties, including any construction projects which may be undertaken, could require us to expend significant funds to hire replacement workers, and qualified replacement labor may not be available at reasonable costs, if at all. Strikes and work stoppages could also result in adverse media attention or otherwise discourage customers from visiting our casino properties. Strikes and work stoppages involving laborers at any construction project which may be undertaken could result in construction delays and increases in construction costs. As a result, a strike or other work stoppage at one of our casino properties or any construction project could have an adverse effect on the business of our casino properties and our financial condition and results of operations. There can be no assurance that we will not experience a strike or work stoppage at one or more of our casino properties or any construction project in the future.
Any unexpected shutdown of one of our casino properties or any construction project could have an adverse effect on the business of our casino properties and our results of operations. There can be no assurance that we will be adequately prepared for unexpected events, including political or regulatory actions, which may lead to a temporary or permanent shutdown of any of our casino properties.
ITEM 1B.UNRESOLVED STAFF COMMENTS
None.
ITEM 1C.CYBERSECURITY
We rely on our technology infrastructure and information systems to operate our gaming and non-gaming facilities, interact with customers, employees, utilize our data, support and grow our customer base, and bill, collect, and make payments. Our technology infrastructure and information systems also support and form the foundation for our accounting and finance systems and form an integral part of our disclosure and accounting control environment. Our internally developed systems and processes, as well as those systems and processes provided by third-party vendors, may be susceptible to damage or interruption from cybersecurity threats, which include any unauthorized access to our information systems that may result in adverse effects on the confidentiality, integrity, or availability of such systems or the related information. Potential cybersecurity threats include terrorist or hacker attacks, the introduction of malicious computer viruses, ransomware, falsification of banking and other information, insider risk, or other security breaches. Such attacks have become more and more sophisticated over time, especially as threat actors have become increasingly well-funded by, or themselves include, governmental actors with significant means.
We have implemented robust processes to assess, identify, and manage cybersecurity risks, including potentially material risks, related to our internal information systems and our products. Our Board of Directors has direct oversight of our management of cybersecurity risks.
The Board of Directors receives an evaluation of cybersecurity risks, which includes detailed descriptions of the actions we have taken to accept, transfer, or mitigate these risks and an analysis of cybersecurity threats and incidents across the industry. The Board of Directors reviews the evaluation on an annual basis. Management will provide a comprehensive update to the Board of Directors on cybersecurity threats and risk mitigation at least annually, and more frequently as relevant.
Our Chief Information Security Officer reporting to our Chief Information Officer as well as the Chief Financial Officer is a twenty four year industry veteran, with 10 years of business operations experience and 14 years of technology experience including six years directly in cybersecurity. The Chief Information Security Officer has principal responsibility for assessing and managing cybersecurity risks and threats, implementing the systems necessary to address such risks and threats and preparing updates for the Board of Directors on a regular basis. These updates contain information such as key performance indicators, National Institute of Standards and Technology (“NIST”) Cybersecurity Framework status, cybersecurity road map status, and current events and issues.
Our Director of Cyber Security reports to our Chief Information Security Officer as well as our Chief Information Officer and is responsible for the operation of our cybersecurity program. Our Director of Cyber Security has 30 years of combined information technology experience with ten of those years working in the cybersecurity field as both an engineer and a director.
We have adopted the NIST Cybersecurity Framework to continually evaluate and enhance our cybersecurity procedures. Activities include mandatory monthly online training for all employees, technical security controls, enhanced data protection, the maintenance of backup and protective systems, policy review and implementation, the evaluation and retention of cybersecurity insurance, periodic assessments of third-party service providers to assess cyber preparedness of key vendors, and running simulated cybersecurity drills, including vulnerability scanning, penetration testing and disaster recovery exercises, throughout the organization. These cybersecurity drills are performed both in-house and by third-party service providers. We use automated tools that monitor, detect, and prevent cybersecurity risks and have a security operations center that operates 24 hours a day to alert us to any potential cybersecurity threats.
When we experience a cybersecurity incident, our Chief Information Security Officer or Chief Information Officer will inform our Senior Leadership and/or the Board of Directors, Computer Security Incident Response Team, which will then evaluate and assess the nature and materiality of the incident to the Company, in general, its information technology infrastructure and data integrity, and whether the cybersecurity incident should be reported to the Board of Directors in advance of or external to the next regular cybersecurity update. Once a cybersecurity incident is reported to the Board of Directors, the Board of Directors, with the input of the Chief Information Security Officer and Chief Information Officer, will determine how to address it.
We engage subject matter experts such as consultants and auditors to assist us in establishing processes to assess, identify and manage potential and actual cybersecurity threats, to actively monitor our systems internally using widely accepted digital applications, processes, and controls, and to provide forensic assistance to facilitate system recovery in the case of an incident. The Chief Information Security Officer oversees and establishes the parameters of our engagement with these experts to ensure we obtain the supplement assistance needed in this area, if any.
If there is a cybersecurity incident, we may suffer interruptions in service, loss of assets or data, or reduced functionality. Security breaches of our systems may allow inappropriate access to or inadvertent transfer of information and misappropriation or unauthorized disclosure of confidential information. Though we take steps to ensure our products and/or software are secure, it is possible that a cybersecurity incident could result in the loss or compromise of critical data. If a guest alleges that a cybersecurity incident causes or contributes to a loss or compromise of critical data, whether or not caused by us, we could face harm to our reputation and financial condition and regulatory repercussions. A cybersecurity incident could materially harm our reputation and financial condition and cause us to incur legal liability and increased costs to respond to such events. See Item 1A. Risk Factors— Business, Economic, Market and Operating Risks—Failure to maintain the integrity of our internal or customer data, including defending our information systems against hacking, security breaches, computer malware, cyber-attacks and similar technology exploitation risks, could have an adverse effect on our results of operations and cash flows, and/or subject us to costs, fines or lawsuits.
ITEM 2.PROPERTIES
Substantially all of the property that we own and lease is subject to liens to secure borrowings under our credit agreements and include the following:
•Red Rock, which opened in 2006, is situated on approximately 64 acres that we own on the west side of Las Vegas, Nevada.
•Green Valley Ranch, which opened in 2001, is situated on approximately 40 acres that we own in Henderson, Nevada.
•Palms,Durango, which we purchasedopened in 2016,December 2023, is situated on approximately 3750 acres that we own in Las Vegas, Nevada.
•Palace Station, which opened in 1976, is situated on approximately 30 acres that we own in Las Vegas, Nevada.
•Boulder Station, which opened in 1994, is situated on approximately 46 acres that we own on the east side of Las Vegas, Nevada.
•Texas Station, which opened in 1995, is situated on approximately 47 acres that we own in North Las Vegas, Nevada.
•Sunset Station, which opened in 1997, is situated on approximately 8075 acres that we own in Henderson, Nevada.
•Santa Fe Station, which we purchased in 2000, is situated on approximately 39 acres that we own on the northwest side of Las Vegas, Nevada.
•Fiesta Rancho, which we purchased in 2001, is situated on approximately 25 acres that we own in North Las Vegas, Nevada.
•Fiesta Henderson, which we purchased in 2001, is situated on approximately 35 acres that we own in Henderson, Nevada.
•Wild Wild West, which we purchased in 1998, is situated on approximately 20 acres of land in Las Vegas, Nevada. The land on which Wild Wild West is situated is part of a 96-acre site that we own, which is being held for future development.
•Wildfire Rancho, which we purchased in 2003, is situated on approximately five acres that we own in Las Vegas, Nevada.
•Wildfire Boulder, which we purchased in 2004, is situated on approximately two acres that we own in Henderson, Nevada.
•Wildfire Sunset, which we purchased in 2004, is situated on approximately one acre that we own in Henderson, Nevada.
•Wildfire Lake Mead, which we purchased in 2006, is situated on approximately three acres that we own in Henderson, Nevada.
•Wildfire Fremont, which we opened in February 2023, is situated on approximately five acres that we own in Las Vegas, Nevada.
•Wildfire Valley View and Wildfire Anthem, which we purchased in 2013, lease land and buildings used in their operations in Las Vegas, Nevada and Henderson, Nevada, respectively, from third-party lessors.
•Barley’s and The Greens, which are 50% owned, lease land and buildings in Henderson, Nevada used in their operations from third-party lessors. Wildfire Lanes, which is 50% owned, owns the land and building in Henderson, Nevada used in its operations. We opened Barley’s in 1996 and purchased The Greens in 2005 and Wildfire Lanes in 2007.
We own 315441 acres of developable land comprised of six strategically-located parcels in Las Vegas, each of which is zoned for casino gaming and other commercial uses. We also own threeone additional development sitessite that are currentlyis being positioned for sale, comprising a 57-acre site in Las Vegas, an 89-acre site in Reno and an eight-acre site in Reno.sale. From time to time we may acquire additional parcels or sell portions of our existing sites that are not necessary to the development of additional gaming facilities.
Subsequent to the opening or purchase of certain of our properties, weWe have completed a variety of expansion and major renovation projects.projects at our properties. From time to time we also renovate portions of our properties, such as hotel rooms and restaurants.
ITEM 3.LEGAL PROCEEDINGS
We and our subsidiaries are defendants in various lawsuits relating to routine matters incidental to our business. No assurance can be provided as to the outcome of such matters and litigation inherently involves significant costs.risks.
ITEM 4.MINE SAFETY DISCLOSURES
Not applicable.
PART II
ITEM 5.MARKET FOR REGISTRANT’S COMMON EQUITY, RELATED STOCKHOLDER MATTERS AND ISSUER PURCHASES OF EQUITY SECURITIES
Market Information
Our Class A common stock has traded on the NASDAQ under the symbol “RRR” since April 27, 2016. Prior to that date, there was no public market for our Class A common stock. The declaration, amount and payment of dividends on shares of Class A common stock are at the discretion of the board of directors, subject to legally available funds.
Dividends
During the years ended December 31, 2023 and 2022, we declared and paid quarterly cash dividends totaling $1.00 per share to Class A common stockholders. In addition, in December 2022, we paid a special cash dividend of $1.00 per share to Class A common stockholders.
On February 7, 2024, we announced that our board of directors declared a quarterly cash dividend of $0.25 per share of Class A common stock, to be paid on March 29, 2024 to shareholders of record as of March 15, 2024. In addition, on February 7, 2024, we announced that we would pay a special cash dividend of $1.00 per share of Class A common stock, to be paid on March 4, 2024, to shareholders of record as of February 22, 2024.
The declaration, amount and payment of any future dividends on shares of Class A common stock will be at the sole discretion of our board of directors and if we reinstate the payment of dividends we may reduce or discontinue entirely the payment of such dividends at any time. Our board of directors may take into account general and economic conditions, our financial condition and operating results, our available cash and current and anticipated cash needs, capital requirements, contractual, legal, tax and regulatory restrictions and implications on the payment of dividends by us to our stockholders or by our subsidiaries to us, and such other factors as our board of directors may deem relevant. See Note 109 to the Consolidated Financial Statements for further details onadditional information about dividends.
During the years ended December 31, 2020 and 2019, we declared and paid cash dividends of $0.10 and $0.40, respectively, per share to Class A common stockholders. On May 19, 2020, we announced that our board of directors had elected to suspend the payment of dividends for the remainder of 2020.
Holders
At February 15, 2021,2024, there were 1311 holders of record of our Class A common stock, although we believe there are a significantly larger number of beneficial owners of our Class A common stock because many shares are held by brokers and other institutions on behalf of stockholders.
Issuer Purchases of Equity Securities
In November 2020,During the three months ended December 31, 2023 we repurchased 585860 shares of Class A common stock at an average price paid per share of $41.88, related to shares withheld in satisfaction of tax withholding obligations on vested restricted stock at a price of $21.73 per share, for a total purchase price of approximately $12,700. The shares were retired upon repurchase.stock.
In February 2019, ourOur board of directors approved an equity repurchase program authorizing the repurchasehas authorized $600 million for repurchases of up to an aggregate of $150 million of our Class A common stock. In February 2021,stock under our board of directors extended its approval of the equity repurchase program through June 30, 2024. The Company made no repurchases during the three months ended December 31, 2022. Through December 31, 2020, no equity repurchases were made2023 under the program. See Note 10 toAt December 31, 2023, the Consolidated Financial Statementsremaining amount authorized for additional information about our equity repurchase program.repurchases under the program was $312.9 million.
Recent Sales of Unregistered Securities—None.
Stock Performance Graph
The following graph for the period beginning on April 27, 2016 (the date our common stock commenced trading on the NASDAQ)December 31, 2018 and ending on December 31, 20202023 compares the cumulative total stockholder return on our Class A common stock with the cumulative total return on the Standard & Poor’s MidCap 400 Index (“S&P MidCap 400”), and the Standard & Poor’s Composite 1500 Casinos & Gaming Index (“S&P Composite 1500 Casinos & Gaming Index”Gaming”) and a peer group previously selected by the Company.
The S&P 1500 Casinos & Gaming Index is intended to replace the previous peer group. Management believes that the transition to a published industry index provides a better representation of industry performance. The presentation of the cumulative total return of the previous peer group is provided pursuant to SEC rules requiring presentation in the year of change. The peer group will not be presented in future periods..
| | | | | | | | | | | | | | | | | | | | | | | | | | | | | | | | | | | |
| Cumulative Total Return |
| April 27, 2016 | | December 31, |
| | 2016 | | 2017 | | 2018 | | 2019 | | 2020 |
| RRR | $ | 100.00 | | | $ | 125.13 | | | $ | 185.18 | | | $ | 113.04 | | | $ | 135.56 | | | $ | 143.46 | |
| S&P MidCap 400 | 100.00 | | | 116.34 | | | 135.23 | | | 120.24 | | | 151.75 | | | 172.48 | |
| S&P 1500 Casinos & Gaming Index | 100.00 | | | 118.79 | | | 174.63 | | | 128.13 | | | 182.77 | | | 189.33 | |
| Peer Group (a) | 100.00 | | | 123.82 | | | 164.47 | | | 121.18 | | | 173.78 | | | 229.57 | |
(a) Includes Boyd Gaming Corporation, Caesars Entertainment Corporation, MGM Resorts International and Penn National Gaming, Inc. Eldorado Resorts, Inc. has been excluded from the peer group for all periods presented due to merger with Caesars Entertainment Corporation in 2020. | | | | | | | | | | | | | | | | | | | | | | | | | | | | | | | | | | | |
| Cumulative Total Return |
| December 31, |
| 2018 | | 2019 | | 2020 | | 2021 | | 2022 | | 2023 |
| Red Rock Resorts, Inc. | $ | 100.00 | | | $ | 119.92 | | | $ | 126.92 | | | $ | 296.30 | | | $ | 225.92 | | | $ | 307.68 | |
| S&P MidCap 400 | 100.00 | | | 126.20 | | | 143.44 | | | 178.95 | | | 155.58 | | | 181.15 | |
| S&P Composite 1500 Casinos & Gaming | 100.00 | | | 150.30 | | | 173.56 | | | 171.00 | | | 135.35 | | | 156.34 | |
Past stock price performance is not necessarily indicative of future results. The performance graph should not be deemed filed or incorporated by reference into any other of our filings under the Securities Act of 1933 or the Exchange Act of 1934, unless we specifically incorporate the performance graph by reference therein.
ITEM 6.SELECTED FINANCIAL DATA
Not applicable. [RESERVED]
ITEM 7. MANAGEMENT’S DISCUSSION AND ANALYSIS OF FINANCIAL CONDITION AND RESULTS OF OPERATIONS
The following discussion and analysis should be read in conjunction with the Consolidated Financial Statements and notes thereto included in Item 8. Financial Statements and Supplementary Data within this Annual Report on Form 10-K.
Impact of COVID-19
During 2020, our business was significantly negatively impacted by the global pandemic caused by a new strain of coronavirus (“COVID-19”). All of our Las Vegas properties were temporarily closed on March 17, 2020 in compliance with a statewide emergency order mandating the closure of all nonessential businesses in Nevada, including casinos. On June 4, 2020, we reopened our Red Rock, Green Valley Ranch, Santa Fe Station, Boulder Station, Palace Station and Sunset Station properties, as well as our Wildfire properties, subject to state-mandated occupancy and other operational restrictions. At December 31, 2020, our Texas Station, Fiesta Henderson, Fiesta Rancho and Palms properties had not reopened. We will continue to assess the performance of the reopened properties, as well as the recovery of the Las Vegas market and the economy as a whole, before considering whether to reopen some or all of the remaining properties, and we have no plans to reopen any of these properties in 2021.
In addition, our managed property, Graton Resort, located in northern California, was temporarily closed from March 17, 2020 through June 17, 2020 as a result of the COVID-19 pandemic. The management agreement was originally expected to expire in November 2020 but was extended as a result of the pandemic through February 5, 2021, when the tribe terminated our management role at the facility.
Subsequent to the reopening of most of our properties in June 2020, we saw favorable customer trends which continued throughout the third and fourth quarters, including strong visitation from a younger demographic, increased spend per visit, more time spent on device, and increased return of our core customers. These positive trends, in combination with business optimization and cost reduction measures, drove strong operating results at our first-to-reopen properties for the second half of 2020. However, we cannot predict whether these trends will continue, nor can we predict the extent to which the impacts of COVID-19 on the United States and Las Vegas economies may affect our business in the future.
The COVID-19 pandemic has had and may continue to have a detrimental impact on the United States and Las Vegas economies, including widespread unemployment as well as reduced consumer confidence, discretionary spending and travel. We have taken steps to mitigate these and potential future effects of COVID-19 on our results of operations through a combination of streamlining our business, optimizing our marketing initiatives, and reducing expenses, including staffing reductions in May 2020 that affected approximately 39% of our full-time workforce. However, we continue to have significant fixed and variable expenses that will impact our cash position and profitability. We have implemented comprehensive health and cleanliness standards designed to provide the safest and most secure environment possible for our guests and employees, which include COVID-19 testing of our employees and vendors, personal protective equipment and temperature checks for employees and guests, enhanced cleaning procedures and other measures.
On March 27, 2020, the Coronavirus Aid, Relief, and Economic Security Act (the “CARES Act”) was signed into law. We have received certain benefits from the CARES Act, including payroll retention credits of up to $5,000 per employee for the wages and health insurance we continued to provide to team members who were not providing services during the temporary closures of our properties, a deferral of employer social security taxes through December 31, 2020, and certain additional federal income tax benefits. For the year ended December 31, 2020, we recognized $38.2 million in payroll retention credits. We will continue to review and consider other potential benefits, if any, that may become available to us under government programs.
Overview
Red Rock was formed as a Delaware corporation in 2015 to own an indirect equity interest in, and manage, Station Casinos LLC, a Nevada limited liability company (“Station LLC”). Station LLC is a gaming, development and management company established in 1976 that owns and operates tenseven major gaming and entertainment facilities and ten smaller casinos (three of which are 50% owned) in the Las Vegas regional market. FourIn December 2023, we opened Durango at the intersection of Durango Drive and Interstate 215 in the southwest Las Vegas valley, and in February 2023, we opened our major properties had not reopened astenth smaller casino, Wildfire Fremont. As of December 31, 2020 as discussed above. Excluding the four closed properties,2023, we currently offer approximately 13,769offered 16,333 slot machines, 273317 table games and 3,0813,030 hotel rooms in the Las Vegas market. In 2022, we permanently closed our Texas Station, Fiesta Henderson, Fiesta Rancho and Wild Wild West properties. A subsidiary of Station LLC also previously managed Graton Resort in northern California on behalf of a Native American tribe through February 5, 2021.
We own all of the outstanding voting interests in Station LLC and have an indirect equity interest in Station LLC through our ownership of limited liability company interests in Station Holdco (“LLC Units”), which owns all of the economic
interests in Station LLC. At December 31, 2020,2023, we held 60.7%58% of the economic interests and 100% of the voting power in Station Holdco, subject to certain limited exceptions, and we are designated as the sole managing member of both Station Holdco and Station LLC. We control and operate all of the business and affairs of Station Holdco and Station LLC, and conduct all of our operations through these entities. OurOther than assets and liabilities related to income taxes and the tax receivable agreement, our only material assets are our ownership interestsequity interest in Station Holdco, our voting interest in Station LLC and a note receivable from Station Holdco, other than cash and tax-related assets and liabilities.LLC. We have no operations outside of our management of Station Holdco and Station LLC.
Our Consolidated Financial Statements reflect the consolidation of Station LLC and its consolidated subsidiaries, and Station Holdco. The financial position and results of operations attributable to LLC Units we do not own are reported separately as noncontrolling interest.
Our principal source of revenue and operating income is gaming, and our non-gaming offerings include restaurants, hotels and other entertainment amenities. Approximately 80% to 85% of our casino revenue is generated from slot play. The majority of our revenue is cash-based and as a result, fluctuations in our revenues have a direct impact on our cash flows from operations. Because our business is capital intensive and we utilize debt to fund many of our capital initiatives, we rely heavily on the ability of our properties to generate operating cash flow to repay debt financing and fund capital expenditures.
The United States economy and the economy in the Las Vegas metropolitan area have been negatively affected by the unprecedented impacts of COVID-19. A significant portion of our business is dependent upon customers who live and/or work in the Las Vegas metropolitan area. As of December 2020,2023, the unemployment rate in the Las Vegas metropolitan area was 10.4%5.3%, down from a high of 34%5.4% in April 2020.December 2022. Statewide, the unemployment rate for December 2020 declined to 9.0% in December 2020,2023 was 5.4%, as compared to 30%5.2% in April 2020. Despite the economic impacts of the COVID-19 pandemic, theDecember 2022. The median price of an existing single-family home in Las Vegas was up 10.2%$449,900 at December 31, 20202023 up 5.9% as compared to the prior year. This continues a trend of significant improvement in home values in Las Vegas since 2012, with the median home price remaining at an all-time high of $314,000 in December 202031, 2022, according to the Las Vegas Realtors®. In addition, Las Vegas remains one of the fastest growing metropolitan areas in the United States, posting a 1.5%2.1% growth rate in 2020. Due to uncertainties surrounding2023. In light of uncertainty in the ongoing pandemic,economic outlook stemming from inflation, higher interest rates, increased energy costs and increased geo-political and regional conflicts, we cannot predict whether the recoverytrend in unemployment andor the positive trendstrend in housing prices and population growth in the Las Vegas area will continue.
As a result ofWe have continued to experience favorable customer trends, including consistent visitation from our guests and strong spend per visit across the COVID-19 pandemic, the temporary closure of allmajority of our properties,properties. These trends, in combination with our operational discipline and the ongoing closureour focus on our core local guests, as well as regional and out of four of our properties, our year-over-yeartown guests, continued to drive consistent operating results are not comparable. In addition,in 2023. However, we cannot predict whether these trends will continue, nor can we predict the extent to which the impacts of inflation, increased energy costs and interest rate fluctuations may affect our operating results for 2019 were impacted by construction disruption and costs associated with the $690 million redevelopment project at Palms, which was completedbusiness in the third quarter of 2019.
Information about our results of operations is included herein and in the notes to our Consolidated Financial Statements.future.
Our Key Performance Indicators
We use certain key indicators to measure our performance.
Gaming revenue measures:
•Slot handle, table game drop and race and sports write are measures of volume. Slot handle represents the dollar amount wagered in slot machines, and table game drop represents the total amount of cash and net markers issued that are deposited in table game drop boxes. Race and sports write represents the aggregate dollar amount wagered on race and sports events.
•Win represents the amount of wagers retained by us.
•Hold represents win as a percentage of slot handle, or table game drop.drop or race and sports write.
As our customers are primarily Las Vegas residents, our hold percentages are generally consistent from period to period. Fluctuations in our casino revenue are primarily due to the volume and spending levels of customers at our properties.
Food and beverage revenue measures:
•Average guest check is a measure of food sales volume and product offerings at our restaurants, and represents the average amount spent per customer visit.
•Number of guests served is an indicator of volume.
Room revenue measures:
•Occupancy is calculated by dividing occupied rooms, including complimentary rooms, by rooms available.
•Average daily rate (“ADR”) is calculated by dividing room revenue, which includes the retail value of complimentary rooms, by rooms occupied, including complimentary rooms.
•Revenue per available room is calculated by dividing room revenue by rooms available.
Information about our results of operations is included herein and in the notes to our Consolidated Financial Statements.
Results of Operations
The following table presents information about our results of operations for the year ended December 31, 20202023 compared to 20192022 (dollars in thousands). Information about our results of operations for the year ended December 31, 2019 as2022 compared to 20182021 can be found underin Part II, Item 7. Management’s Discussion and Analysis of Financial Condition and Results of Operations in our Annual Report on Form 10-K for the year ended December 31, 2019,2022, filed with the SEC on February 21, 2020.24, 2023.
| | | | Year Ended December 31, | | Year Ended December 31, |
| | | 2020 | | 2019 | | Percent
change | | 2023 | | 2022 | | Percent
change |
| Net revenues | Net revenues | $ | 1,182,445 | | | $ | 1,856,534 | | | (36.3)% | Net revenues | $ | 1,724,086 | | | $ | | $ | 1,663,786 | | | 3.6% | | 3.6% |
| Operating income | Operating income | 88,589 | | | 186,001 | | | (52.4)% | Operating income | 558,688 | | | 561,302 | | 561,302 | | | (0.5)% | | (0.5)% |
| | Casino revenues | Casino revenues | 764,255 | | | 984,253 | | | (22.4)% |
| Casino revenues | |
| Casino revenues | | 1,132,154 | | | 1,126,058 | | | 0.5% |
| Casino expenses | Casino expenses | 232,939 | | | 351,043 | | | (33.6)% | Casino expenses | 293,993 | | | 279,537 | | 279,537 | | | 5.2% | | 5.2% |
| Margin | Margin | 69.5 | % | | 64.3 | % | |
| | Food and beverage revenues | |
| | Food and beverage revenues | |
| | Food and beverage revenues | Food and beverage revenues | 192,899 | | | 481,558 | | | (59.9)% | 313,619 | | | 283,067 | | 283,067 | | | 10.8% | | 10.8% |
| Food and beverage expenses | Food and beverage expenses | 195,963 | | | 465,505 | | | (57.9)% | Food and beverage expenses | 244,786 | | | 224,903 | | 224,903 | | | 8.8% | | 8.8% |
| Margin | Margin | (1.6) | % | | 3.3 | % | |
| | Room revenues | Room revenues | 87,035 | | | 192,305 | | | (54.7)% |
| | Room revenues | |
| | Room revenues | | 183,103 | | | 164,502 | | | 11.3% |
| Room expenses | Room expenses | 49,363 | | | 81,064 | | | (39.1)% | Room expenses | 55,064 | | | 52,017 | | 52,017 | | | 5.9% | | 5.9% |
| Margin | Margin | 43.3 | % | | 57.8 | % | |
| | Other revenues | |
| | Other revenues | |
| | Other revenues | Other revenues | 56,279 | | | 106,773 | | | (47.3)% | 94,403 | | | 87,089 | | 87,089 | | | 8.4% | | 8.4% |
| Other expenses | Other expenses | 23,034 | | | 52,329 | | | (56.0)% | Other expenses | 32,549 | | | 32,258 | | 32,258 | | | 0.9% | | 0.9% |
| | Management fee revenue | Management fee revenue | 81,977 | | | 91,645 | | | (10.5)% |
| Management fee revenue | |
| Management fee revenue | | 807 | | | 3,070 | | | n/m |
| | Selling, general and administrative expenses | |
| Selling, general and administrative expenses | |
| Selling, general and administrative expenses | Selling, general and administrative expenses | 324,644 | | | 416,355 | | | (22.0)% | 374,494 | | | 353,043 | | 353,043 | | | 6.1% | | 6.1% |
| Percent of net revenues | Percent of net revenues | 27.5 | % | | 22.4 | % | |
| | Depreciation and amortization | Depreciation and amortization | 231,391 | | | 222,211 | | | 4.1% |
| Write-downs and other charges, net | 36,537 | | | 82,123 | | | n/m |
| | Depreciation and amortization | |
| | Depreciation and amortization | | 132,536 | | | 128,368 | | | 3.2% |
| Write-downs and other, net | | Write-downs and other, net | 31,976 | | | (47,660) | | | n/m |
| Asset impairment | | Asset impairment | — | | | 80,018 | | | n/m |
| Interest expense, net | Interest expense, net | 128,465 | | | 156,679 | | | (18.0)% | Interest expense, net | 181,023 | | | 129,889 | | 129,889 | | | 39.4% | | 39.4% |
| Gain (loss) on extinguishment/modification of debt, net | 240 | | | (19,939) | | | n/m |
| Change in fair value of derivative instruments | (21,590) | | | (19,467) | | | n/m |
| (Provision) benefit for income tax | (114,081) | | | 1,734 | | | n/m |
| Net loss attributable to noncontrolling interests | (24,146) | | | (3,386) | | | n/m |
| Net loss attributable to Red Rock Resorts, Inc. | (150,397) | | | (3,351) | | | n/m |
| Net income attributable to noncontrolling interests | | Net income attributable to noncontrolling interests | 161,772 | | | 184,895 | | | (12.5)% |
| Provision for income tax | | Provision for income tax | (42,984) | | | (44,530) | | | (3.5)% |
| Net income attributable to Red Rock | | Net income attributable to Red Rock | 176,004 | | | 205,457 | | | (14.3)% |
n/m = not meaningful
We view each of our Las Vegas casino properties as an individual operating segment. We aggregate all of our Las Vegas operating segments into one reportable segment because all of our Las Vegas properties offer similar products, cater to the same customer base, have the same regulatory and tax structure, share the same marketing programs, are directed by a centralized management structure and have similar economic characteristics. We also aggregate our Native American
management activities into one reportable segment. The results of operations for our Native American management segment are discussed under “in the section entitled Management Fee Revenue” below and the results of operations of our Las Vegas operations are discussed in the remaining sections below.
Net Revenues. Net revenues for the year ended December 31, 2020 decreased2023 increased by $674.1$60.3 million to $1.18$1.72 billion as compared to $1.86$1.66 billion for the year ended December 31, 2019. The 36.3%2022. Contributing to our year over year increase is our Durango property which opened on December 5, 2023. We achieved year over year growth of 0.5%, 10.8%, 11.3% and 8.4% in casino revenue, food and beverage, room and other revenues, respectively. There was no revenue from our Native American management activity for the year ended December 31, 2023, resulting in a decrease in net revenues was due to the mandated closure of all of our properties from March 17, 2020 through June 3, 2020 and the ongoing closures of Texas Station, Fiesta Rancho, Fiesta Henderson and Palms, as well as the state-mandated occupancy, social distancing and other restrictions in place at our reopened properties.management fee revenue.
Operating Income. OperatingFor the year ended December 31, 2023 our operating income decreased by $97.4was $558.7 million. For the year ended December 31, 2022 our operating income was $561.3 million to $88.6 million for 2020 as compared to $186.0 million for 2019. The 52.4% decrease was primarily due to the mandated closure of all of our properties from March 17, 2020 through June 3, 2020 and the ongoing closure of four of our properties, partially offset byincluded the impact of cost reduction measures we instituted in March 2020 in responseimpairment charges of $80.0 million related primarily to the COVID-19 pandemic.permanent closure of our Texas Station, Fiesta Rancho and Fiesta Henderson properties in June 2022. Additional information about factors impacting our operating income areis discussed below.
Casino. Casino revenues decreasedincreased by 22.4% and casino expenses decreased by 33.6%$6.1 million for the year ended December 31, 20202023 as compared to 2019. The decreases were attributable2022. For 2023, slot handle was consistent as compared to the mandated closure of all of our properties from March 17, 2020 through June 3, 2020 and the ongoing closure of four of our properties, as well as cost reduction measures at our reopened properties. Slot handle decreased by 32.8%,2022, table games drop decreasedincreased by 35.5%9.2% and race and sports write decreased by 22.5%3.8%. Our hold percentages for 20202023 were consistent compared to 2022. Casino expenses increased by 5.2% for the year ended December 31, 2023 as compared to 2019.the prior year, primarily due to higher employee-related costs.
Food and Beverage. Food and beverage includes revenue and expenses from restaurants, bars and catering at all of our Las Vegas properties, as well as the revenue and expenses associated with the nightclub and dayclub at Palms, which operated from April 2019 to November 2019.catering. For the year ended December 31, 2020,2023, food and beverage revenue increased by 10.8% as compared to 2022, primarily due to an increase in our catering and group business. For 2023, the average guest check increased by 6.1%, while the number of restaurant guests served decreased by 59.9% and food4.0% as compared to 2022. Food and beverage expenses decreased by 57.9%, eachfor the year ended December 31, 2023 as compared to 2019. The decreases werethe prior year increased by 8.8%, primarily due to the impacthigher employee-related costs, associated catering costs and costs of the four closed properties, primarily Palms, the closure of our buffets, the mandated closure of all of our properties from March 17, 2020 through June 3, 2020, and ongoing mandatory operational restrictions.sales.
Room. For the year ended December 31, 2023 as compared to 2022, room revenues increased by 11.3% and room expenses increased by 5.9%. Room expenses were higher for the year ended December 31, 2023 as compared to 2022 commensurate with the higher revenues and increased occupancy.
Information about our hotel operations is presented below:
| | Year Ended December 31, |
| 2020 | | 2019 |
| Year Ended December 31, | | | Year Ended December 31, |
| 2023 | | | 2023 | | 2022 |
| Occupancy | Occupancy | 65.4 | % | | 88.1 | % | Occupancy | 87.4 | % | | 83.0 | % |
| Average daily rate | Average daily rate | $ | 118.01 | | | $ | 128.51 | |
| Revenue per available room | Revenue per available room | $ | 77.17 | | | $ | 113.15 | |
For the year ended December 31, 2020, room revenues decreasedOur ADR improved by 54.7% as compared to 2019. The year over year decline in revenues was due to decreased travel amid the COVID-19 pandemic, the temporary closure of all of our properties from March 17, 2020 through June 3, 2020 and the ongoing closure of the four properties, all of which negatively impacted our occupancy and average daily rate. For the year ended December 31, 2020, room expenses decreased by 39.1% as compared to 2019 due to the same factors, as well as our cost reduction measures. For year ended December 31, 2020, our ADR decreased by 8.2%10.9%, our revenue per available room decreasedimproved by 31.8%,16.8% and our occupancy rate decreasedimproved by 22.74.4 percentage points eachfor 2023 as compared to 2019.2022 due to improved demand.
Other. Other primarily includesrepresents revenues from tenant leases, retail outlets, bowling, spas entertainment and other amenitiesentertainment and their corresponding expenses. Other revenues and other expenses decreased 47.3% and 56.0%, respectively, forFor the year ended December 31, 2020,2023, other revenues increased by 8.4% as compared to 2019, duethe prior year, primarily driven by leased outlets, bowling and spas. Other expenses were consistent as compared to the temporary closure of all of our properties from March 17, 2020 through June 3, 2020, the ongoing closure of the four properties, a reduction in non-gaming amenities offered at our reopened properties, such as movie theaters, and lower revenues from amenities that were operating.prior year.
Management Fee Revenue. Management fee revenue primarily representsFor the year ended December 31, 2023, management fees represented fees earned from the management of our joint ventures. For the year ended December 31, 2022, management fees represented fees earned from our previous agreement with a Native American tribe to manage Graton Resort. For 2020Resort, as well as fees earned from the management of our joint ventures. We ceased to manage Graton Resort on February 5, 2021.
Selling, General and Administrative (“SG&A”). SG&A expenses increased by 6.1% to $374.5 million for the year ended December 31, 2023 as compared to 2019, management fee revenue decreased by 10.5%$353.0 million for the prior year. The increase in SG&A expenses as compared to the prior year was primarily due to higher employee-related costs, repairs and maintenance and utilities, partially offset by a decrease in legal expenses. As a percentage of net revenue, SG&A expenses for the effects ofyear ended December 31, 2023 were effectively flat as compared to the COVID-19 pandemic,prior year as we continued to focus on operational efficiencies and cost control.
Depreciation and Amortization. Depreciation and amortization expense for the year ended December 31, 2023 increased to $132.5 million as compared to $128.4 million for 2022. The increase for 2023 was primarily due to higher depreciation expense for development projects placed into service, including the temporary closure of Graton Resort from March 17, 2020 throughDurango, partially offset by a decrease in
June 17, 2020 and the mandatory operational restrictions that have existed since Graton Resort reopened. The Graton Resort management agreement was originally expected to expire in November 2020 but was extended as a result of the pandemic through February 5, 2021, when the tribe terminated our management role at the facility. Whether the management agreement provides for an additional extension beyond that date is in dispute.
Selling, General and Administrative (“SG&A”). SG&A expenses decreased by 22.0% to $324.6 million for 2020 as compared to $416.4 million for 2019, primarily due to the property closures and various cost reduction initiatives, including employee costs.
Depreciation and Amortization. Depreciation and amortizationdepreciation expense for 2020 increased to $231.4 million as compared to $222.2 millionthe closed properties. We ceased recognizing depreciation expense for 2019. The increase was primarily due to additional portions of the Palms redevelopment project being placed into serviceTexas Station, Fiesta Rancho and Fiesta Henderson in April 2019June 2022 and Wild Wild West in September 2019.2022.
Write-downs and Other Charges,other, net. Write-downs and other, net, include gains and losses on asset disposals, demolition and others costs associated with our closed properties, preopening and development expenses, business innovation and technology enhancements, contract termination costs and non-routine items. For the year ended December 31, 2020,2023, write-downs and other, charges, net totaled $36.5was a loss of $32.0 million, which included net losses on asset disposals, including the write-offcomprising $53.4 million in preopening and development expenses, $10.1 million of assets due to the closure of our buffets, severance, including insurance benefits through September 2020 for employees who were terminated in connectiondemolition costs associated with the workforce reductionpermanently closed properties, $4.0 million in May 2020,business innovation development, and asset write-offs related to various technology projects.other, partially offset by net gains on land sales of $38.6 million. For the year ended December 31, 2019,2022, write-downs and other, charges, net totaled $82.1was a gain of $47.7 million, which included $39.8comprising net gains on capital asset transactions of $79.0 million (including gains on land sales of $76.3 million), partially offset by preopening expense of $3.7 million for Durango, $9.3 million of demolition costs associated with the closed properties, $9.2 million in business innovation development, $6.7 million in artist performance agreement termination costs associated with the closure of the nightclub and dayclub at Palms, and $25.9other.
Asset Impairment. There were no asset impairment charges for the year ended December 31, 2023. For the year ended December 31, 2022, we recognized asset impairment charges totaling $80.0 million, primarily to write off the facilities and certain related assets at Texas Station, Fiesta Rancho and Fiesta Henderson, which we permanently closed in Palms redevelopment and preopening expenses, comprising various costs associated with the brand repositioning campaign, as well as preopening related to new restaurants, nightclubs, bars and other amenities.June 2022.
Interest Expense, net. The following table presents summarized information about our interest expense (amounts in thousands):
| | Year Ended December 31, |
| 2020 | | 2019 |
| Year Ended December 31, | | | Year Ended December 31, |
| 2023 | | | 2023 | | 2022 |
| Interest cost, net of interest income | Interest cost, net of interest income | $ | 117,993 | | | $ | 143,035 | |
| Amortization of debt discount and debt issuance costs | Amortization of debt discount and debt issuance costs | 10,472 | | | 16,421 | |
| Capitalized interest | Capitalized interest | — | | | (2,777) | |
| Interest expense, net | Interest expense, net | $ | 128,465 | | | $ | 156,679 | |
Interest expense, net, for 2020the year ended December 31, 2023 was $128.5$181.0 million, an increase of 39.4% as compared to $156.7$129.9 million for 2019.2022. The decreaseincrease in interest expense, net was due to higher variable interest rates applicable to our credit facility as well increased borrowings under our revolving credit facility, primarily associated with the Durango development project. At December 31, 2023, $2.1 billion of borrowings under the credit agreements were based on variable interest rates, primarily the Secured Overnight Financing Rate (“SOFR”), plus applicable margins of 1.50% to lower variable2.25%, and the SOFR rate applicable to our outstanding SOFR-based borrowings was 5.46%. We expect that interest rates on our credit facility as a result of a decrease in the London Interbank Offered Rate (“LIBOR”). Interest rates decreased in 2020may continue to vary in response to economic and growth uncertainty surrounding the COVID-19 pandemic. Seemacroeconomic conditions. Based on our outstanding borrowings at December 31, 2023, an assumed 1% increase in variable interest rates would cause our annual interest rate cost to increase by approximately $21.2 million. Additional information about our long-term debt is included in Note 78 to the Consolidated Financial Statements for additional information about our long-term debt.Statements.
Gain (Loss) on Extinguishment/Modification of Debt, netNet Income Attributable to Noncontrolling Interests. ForNet income attributable to noncontrolling interests for the yearyears ended December 31, 2020, we recognized a2023 and 2022 represented the portion of net gain of $0.2 million on extinguishment/modification of debt comprising a gain of $12.7 million on repurchases of $96.6 million of our outstanding indebtedness, partially offsetincome attributable to the ownership interest in Station Holdco not held by a loss of $12.5 million on amendments to our credit facility in February 2020. For the year ended December 31, 2019, we recognized a $19.9 million loss on extinguishment/modification of debt primarily arising from the purchase of our corporate office building.us.
Change in Fair Value of Derivative Instruments. For the year ended December 31, 2020, we recognized a net loss of $21.6 million in the fair value of our interest rate swaps, as compared to a net loss of $19.5 million for 2019. The losses were primarily due to downward movements in the forward interest rate curve. Our interest rate swaps will expire in July 2021.
(Provision) BenefitProvision for Income Tax. For the yearyears ended December 31, 2020,2023 and 2022, we recognized income tax expense of $114.1$43.0 million as compared to income tax benefit of $1.7and $44.5 million, for the prior year, primarily relating to the establishment of a full valuation allowance on our deferred tax assets due to the uncertainty of realizing the tax benefits. Our effective tax rate of (188.7)% for 2020 was less than the statutory rate with differences primarily related to the establishment of a full valuation allowance, as well as net loss attributable to noncontrolling interest, tax credits and permanent items.respectively. Station Holdco is treated as a partnership for income tax reporting and Station Holdco’s members are liable for federal, state and local income taxes based on their share of Station Holdco’s taxable income.
Net Loss Attributable to Noncontrolling Interests.Net We are not liable for income tax on the noncontrolling interests’ share of Station Holdco’s taxable income or benefit from a taxable loss, attributable to noncontrolling interestsand therefore our effective tax rate of 11.3% for the yearsyear ended December 31, 2020 and 2019 represented2023 was less than the portion of net loss attributable to the ownership interest in Station Holdco not held by us.statutory rate.
Adjusted EBITDA
Adjusted EBITDA for the years ended December 31, 20202023 and 20192022 for our two reportable segments and a reconciliation of our consolidated net income to Adjusted EBITDA are presented below (amounts in thousands). The Las Vegas operations segment includes all of our Las Vegas area casino properties and the Native American management segment includes our Native American management arrangements.activities.
| | Year Ended December 31, |
| 2020 | | 2019 |
| Year Ended December 31, | | | Year Ended December 31, |
| 2023 | | | 2023 | | 2022 |
| Net revenues | Net revenues | | | |
| Las Vegas operations | |
| Las Vegas operations | |
| Las Vegas operations | Las Vegas operations | $ | 1,094,442 | | | $ | 1,758,760 | |
| Native American management | Native American management | 81,440 | | | 91,074 | |
| Reportable segment net revenues | Reportable segment net revenues | 1,175,882 | | | 1,849,834 | |
| Corporate and other | Corporate and other | 6,563 | | | 6,700 | |
| Net revenues | Net revenues | $ | 1,182,445 | | | $ | 1,856,534 | |
| | Net loss | $ | (174,543) | | | $ | (6,737) | |
| Net income | |
| Net income | |
| Net income | |
| Adjustments | Adjustments | |
| Depreciation and amortization | Depreciation and amortization | 231,391 | | | 222,211 | |
| Depreciation and amortization | |
| Depreciation and amortization | |
| Share-based compensation | Share-based compensation | 10,886 | | | 16,848 | |
| Write-downs and other charges, net | 36,537 | | | 82,123 | |
| Tax receivable agreement liability adjustment | (15) | | | (97) | |
| Write-downs and other, net | |
| Asset impairment | |
| Interest expense, net | Interest expense, net | 128,465 | | | 156,679 | |
| (Gain) loss on extinguishment/modification of debt, net | (240) | | | 19,939 | |
| Change in fair value of derivative instruments | 21,590 | | | 19,467 | |
| Provision (benefit) for income tax | 114,081 | | | (1,734) | |
| Provision for income tax | |
| Other | Other | 333 | | | 316 | |
| Adjusted EBITDA | Adjusted EBITDA | $ | 368,485 | | | $ | 509,015 | |
| | Adjusted EBITDA | Adjusted EBITDA | |
| Adjusted EBITDA | |
| Adjusted EBITDA | |
| Las Vegas operations | |
| Las Vegas operations | |
| Las Vegas operations | Las Vegas operations | $ | 335,134 | | | $ | 472,921 | |
| Native American management | Native American management | 77,440 | | | 85,562 | |
| Corporate and other | Corporate and other | (44,089) | | | (49,468) | |
| Adjusted EBITDA | Adjusted EBITDA | $ | 368,485 | | | $ | 509,015 | |
|
The year-over-year declinechanges in Adjusted EBITDA is primarilywere due to the impacts of the COVID-19 pandemic. Additional information about the factors impacting the year-over-year decline are described under Results of Operations above.
Adjusted EBITDA is a non-GAAP measure that is presented solely as a supplemental disclosure. We believe that Adjusted EBITDA is a widely used measure of operating performance in our industry and is a principal basis for valuation of gaming companies. We believe that in addition to net income, (loss), Adjusted EBITDA is a useful financial performance measurement for assessing our operating performance because it provides information about the performance of our ongoing core operations excluding non-cash expenses, financing costs, and other non-operational or non-recurring items.operations. Adjusted EBITDA includes net income (loss) plus depreciation and amortization, share-based compensation, write-downs and other, charges, net (including netgains and losses on asset disposals, severance, redevelopmentdemolition costs, preopening and preopening expenses,development, business innovation and technology enhancements)enhancements, contract termination costs and non-routine items), tax receivable agreement liability adjustment,asset impairment, interest expense, net, (gain) loss on extinguishment/modification of debt, net, change in fair value of derivative instruments, provision (benefit) for income tax and other.
To evaluate Adjusted EBITDA and the trends it depicts, the components should be considered. Each of these components can significantly affect our results of operations and should be considered in evaluating our operating performance, and the impact of these components cannot be determined from Adjusted EBITDA. Further, Adjusted EBITDA does not represent net income or cash flows from operating, investing or financing activities as defined by accounting principles generally accepted in the United States of America (“GAAP”) and should not be considered as an alternative to net income as an indicator of our operating performance. Additionally, Adjusted EBITDA does not consider capital expenditures and other
investing activities and should not be considered as a measure of our liquidity. It should be noted that not all gaming companies that report EBITDA or adjustments to this measure may calculate EBITDA or such adjustments in the same manner as we do, and therefore, our measure of Adjusted EBITDA may not be comparable to similarly titled measures used by other gaming companies.
Beginning in 2020, we changed our methodology for allocating certain corporate technology expenses to our reportable segments. Historically, all technology costs incurred at the corporate level were allocated to our operating properties on a pro rata basis. Under the new methodology, only technology costs that are directly related to operating properties are allocated to those properties, and expenses associated with corporate technology initiatives remain within corporate expense. Such corporate technology expenses were $14.5 million and $18.1 million for the years ended December 31, 2020 and 2019, respectively. The amount for the prior year period has been reclassified from the Las Vegas operations segment to Corporate and other within Adjusted EBITDA to conform with the current year presentation.
Holding Company Financial Information
The indentureindentures governing the 5.00%4.50% Senior Notes and the indenture governing the 4.50%4.625% Senior Notes contain certain covenants that require Station LLC to furnish to the holders of the notes certain annual and quarterly financial information relating to Station LLC and its subsidiaries. The obligation to furnish such information may be satisfied by providing consolidated financial information of the Company along with additional disclosure explaining the differences between such information and the financial information of Station LLC and its subsidiaries on a standalone basis. The following financial information about the Company and its consolidated subsidiaries exclusive of Station LLC and its subsidiaries (the “Holding Company”), is furnished to explain the differences between the financial information of the Holding Company and the financial information of Station LLC and its subsidiaries for the periods presented in this report. As discussed below, theThe primary differences between the financial information of the Holding Company and that of Station LLC relate to income taxes, and the liability relating toassociated with the tax receivable agreement (“TRA”). and a note receivable from Station LLC.
At December 31, 2020,2023, the difference between the balance sheet for Station LLC and its consolidated subsidiaries and the balance sheet for the Holding Company is that the Holding Company had a $27.4 million noncurrent liability under the TRA and $0.6 million of other net current liabilities that are solely liabilities of the Holding Company. At December 31, 2019, the Holding Company had cash of $0.2 million, $14.4 million of income tax receivable, $43.4 million of deferred tax assets, net, and a net deferred tax asset of $113.2$34.0 million thatnote receivable from Station LLC, which are solely assets of the Holding Company, offset byand liabilities that are solely the Holding Company’s, consisting of a $25.1$22.1 million noncurrent liability under the TRA, of which $1.7 million is expected to be paid in the next twelve months and $0.8$3.3 million of other liabilities. The Holding Company’s $34.0 million intercompany note receivable from Station LLC is eliminated in consolidation. At December 31, 2022, the Holding Company had cash of $15.3 million, $75.7 million of deferred tax assets, net, $0.3 million of prepaid expenses, a $28.6 million liability under the TRA, of which $6.6 million was current, $1.7 million of other current liabilities and $1.8 million of other long-term liabilities.
For the yearyears ended December 31, 2020,2023 and 2022, the difference between the statement of operationsincome for Station LLC and its consolidated subsidiaries and the statement of operationsincome for the Holding Company is that the Holding Company had a net loss of $114.2$42.0 million and $46.0 million, respectively, primarily representing provision for income tax to establish a full valuation allowance against its deferred tax assets. For 2019, the difference between the statement of operations for Station LLC and its consolidated subsidiaries and the statement of operations for the Holding Company is that the Holding Company had net income of $1.7 million which represented its income tax benefit.tax.
Financial Condition, Capital Resources and Liquidity
The following financial condition, capital resources and liquidity discussion contains certain forward-looking statements with respect to our business, financial condition, results of operations, dispositions, acquisitions, expansion projects and issuances of debt and equity, which involve risks and uncertainties that cannot be predicted or quantified, and consequently, actual results may differ materially from those expressed or implied herein. Such risks and uncertainties include, but are not limited to, the risks described in Item 1A. Risk Factors.
At December 31, 2020,2023, we had $121.2$137.6 million in cash and cash equivalents. We have taken steps to reduce our operating costs while our business continues to be negatively impacted by the COVID-19 pandemic, but we continue to have substantial payment obligations, including salaries, wagesequivalents, and employee benefits, payments with respect to ourStation LLC’s borrowing availability under its revolving credit facility was $479.3 million, which was net of $512.0 million in outstanding indebtedness, service contracts, property taxes, insuranceborrowings and other$39.8 million in outstanding letters of credit and similar obligations. On May 19, 2020, we announced that our board of directors had suspended the payment of dividends for the remainder of 2020, and the suspension of dividend payments will continue until further notice. In order to preserve financial flexibility in light of uncertainty in the global markets, Station LLC maintains its borrowing availability under its revolving credit facility, subject to continued compliance with the terms of the credit facility. On February 7, 2020, we amended Station LLC’s credit facility, increasing the outstanding borrowing availability under the revolving credit facility by $135.1 million to $1.03 billion, and at December 31, 2020, that borrowing availability was $1.0 billion, which was net of $29.4 million in outstanding letters of credit and similar obligations. See Note 78 to the Consolidated Financial Statements for more information about our long-term debt.
Our primary capital requirements for the near term are expected to be related to the operation and maintenance of our properties, and debt service payments.payments, dividends and distributions. Our anticipated uses of cash for 20212024 include (i) approximately $140.0 million to $180.0 million for capital expenditures, (ii) required principal and interest payments totaling $26.1 million and $217.9 million, respectively, on Station LLC’s indebtedness, totaling $22.8 million(iii) dividends to our Class A common stockholders, and $115.3 million, respectively, and approximately $65.0 million(iv) distributions to $75.0 million for maintenance and investment capital expenditures. In addition, we anticipate making cash distributions, which we refer to as “tax distributions” to thenoncontrolling interest holders of LLC Units. We anticipate that these tax distributions willStation Holdco, including “tax distributions”, which may be made quarterly when required and in amounts that may vary from quarter to quarter. Other payment obligations include salaries, wages and employee benefits, service contracts, property taxes, insurance, federal income taxes and other obligations.
At December 31, 2023, $2.1 billion of the borrowings under our credit agreements were based on variable rates, primarily SOFR. We cannot predict the SOFR or base rate interest rates that will be in effect in the future, and actual rates will vary, which will impact our interest cost. Based on our outstanding borrowings at December 31, 2023, an assumed 1% increase in variable interest rates would cause our annual interest cost to increase by approximately $21.2 million. See Item 7A. Quantitative and Qualitative Disclosures about Market Risk for additional information.
In February 2025, our Revolving Credit Facility and Term Loan A with outstanding balances of $512.0 million and $153.6 million, respectively, will become due. We are currently in discussions with our lenders and we believe it is probable that these obligations will be refinanced on a long-term basis in 2024.
On February 7, 2024, we announced that Red Rock will pay a quarterly cash dividend of $0.25 per share of Class A common stock, to be paid on March 29, 2024 to shareholders of record as of March 15, 2024. Prior to the payment of the dividend, Station Holdco will make a cash distribution to all LLC Unit holders, including Red Rock, of $0.25 per LLC Unit, a portion of which will be paid to the other unit holders of Station Holdco. In addition, on February 7, 2024, we announced that Red Rock would pay a special cash dividend of $1.00 per share of Class A common stock, to be paid on March 4, 2024 to shareholders of record as of February 22, 2021, we completed2024. Prior to the payment of the special dividend, Station Holdco will make a partial redemptioncash distribution to all LLC Unit holders, including Red Rock, of $250 million in principal amount$1.00 per unit, a portion of 5.00% Senior Notes, which was funded using borrowings underwill be paid to the revolving credit facility and cash on hand.other unit holders of Station Holdco.
We are obligated to make payments under the TRA, which is described in Note 2 to the Consolidated Financial Statements. At December 31, 2020,2023, such obligations with respect to previously consummated transactions totaled $27.4$22.1 million. Future payments in respect of any subsequent exchanges of LLC Units for Class A common stock would be in addition to these amounts and are expected to be substantial. The timing of payments under the TRA may vary. The payments that we are required to make will generally reduce the amount of overall cash that might have otherwise been available to us, but we expect the cash tax savings we will realize from the utilization of the related deferred tax assets to fund the required payments.
In February 2019, ourOur board of directors approved an equity repurchase program authorizing the repurchasehas authorized $600 million for repurchases of up to an aggregate of $150 million of our Class A common stock. In February 2021,stock under our board of directors approved an extension of the equity repurchase program through December 31, 2022.June 30, 2024. We are not obligated to repurchase any shares under thisthe program. Subject to applicable laws and the provisions of any agreements restricting our ability to do so, repurchases may be made at our discretion from time to time through open market purchases, negotiated transactions or tender offers, depending on market conditions and other factors. ThroughWe made no repurchases of Class A common stock during the year ended December 31, 2020, no equity2023 under the program. At December 31, 2023, we had $312.9 million of remaining repurchases were madeauthorized under the program. From time to time, we may also seek to repurchase our outstanding indebtedness. Any such purchases may be funded by existing cash balances or the incurrence of debt, including borrowings under our credit facility. The amount and timing of any repurchase will be based on business and market conditions, capital availability, compliance with debt covenants and other considerations. For the year ended December 31, 2020, we repurchased $96.6 million of our outstanding indebtedness.
We expect that cash on hand, cash generated from operations and, to the extent necessary, borrowings available under the existing credit facility and proceeds from the planned refinancing of our credit facility will be sufficient to fund our operations and capital requirements and service our outstanding indebtedness for the next twelve months.months and beyond. We regularly assess our projected capitalcash requirements for capital expenditures, repayment of debt obligations, and payment of other general corporate and operational needs. In the long term, we expect that we will fund our capital requirements with a combination of cash generated from operations, borrowings under the credit facility and the issuance of debt or equity as market conditions may permit. However, our cash flow and ability to obtain debt or equity financing on terms that are satisfactory to us, or at all, may be affected by a variety of factors, including competition, general economic and business conditions and financial markets, all of which may be adversely impacted by the ongoing COVID-19 pandemic.markets. As a result, we cannot provide any assurance that we will generate sufficient income and liquidity to meet all of our liquidity requirements or other obligations.
Following is a summary of our cash flow information (amounts in thousands):
| | Year Ended December 31, | | | Year Ended December 31, |
| | Year Ended December 31, | | 2023 | | 2022 |
| | 2020 | | 2019 |
| Cash flows provided by (used in): | | | |
| Net cash provided by (used in): | |
| Operating activities | |
| Operating activities | |
| Operating activities | Operating activities | $ | 212,790 | | | $ | 316,632 | |
| Investing activities | Investing activities | (69,557) | | | (405,137) | |
| Financing activities | Financing activities | (150,443) | | | 103,162 | |
Cash Flows from Operations
Our operating cash flows primarily consist of operating income generated by our properties (excluding depreciation and other non-cash charges), interest paid and changes in working capital accounts such as inventories, prepaid expenses, receivables and payables. The majority of our revenue is generated from our slot machine and table game play, which is conducted primarily on a cash basis. Our food and beverage, room and other revenues are also primarily cash-based. As a result, fluctuations in our revenues have a direct impact on our cash flow from operations.
Net cash provided by operating activities for the years ended December 31, 2023 and 2022 totaled $494.3 million and $542.2 million, respectively. Cash flow from operating activities for the year ended December 31, 2020 totaled $212.82023 included $170.5 million in interest payments and $21.1 million cash paid for income taxes, compared to $316.6$120.2 million for 2019. For 2020, operating cash flows were negatively impacted by the ongoing COVID-19 pandemic,and $31.4 million, respectively,
includingfor the temporary closureprior year period. The continuation of allfavorable customer trends and our focus on cost control drove strong operating results in 2023. Information about our operating activities is presented within Results of our properties and the continued closure of four of our properties, the effects of state-mandated occupancy and social distancing restrictions, and reduced consumer confidence, discretionary spending and travel. For 2019, operating cash flows were negatively impacted by write-downs and other charges, net, including Palms redevelopment, preopening and artist performance agreement termination costs as well as an $18.7 million increase in cash paid for interest.Operations above.
Cash Flows from Investing Activities
During 2020For the years ended December 31, 2023 and 2019, we2022, cash paid $58.5for capital expenditures totaled $699.5 million and $353.3$328.6 million, respectively, forincluding capital expenditures. For 2019, capital expenditures were primarily related to the redevelopment project at Palms that was completedDurango project. For the year ended December 31, 2023, cash inflows from investing activities included net cash proceeds of $52.2 million from the sale of our Texas Station and Fiesta Rancho land parcels. For the year ended December 31, 2022, cash inflows from investing activities included net cash proceeds of $118.1 million from the sale of land parcels in Las Vegas and Henderson. In addition, we paid $232.8 million during 2022 to purchase additional development land in the third quarter of 2019 and the purchase of slot machines and related gaming equipment. During 2019, we also paid $57.4 million for the purchase of land held for development in Las Vegas.Vegas valley.
Cash Flows from Financing Activities
For the year ended December 31, 2020,2023, we reduced our outstanding indebtedness by $129.9 million. In February 2020, we issued $750.0borrowed $476.5 million in principal amount of 4.50% Senior Notes, the proceeds of which were used to repay a portion of the amounts outstanding under the credit facility, to pay feesRevolving Credit Facility, and costs associated with the offering and for general corporate purposes. In March 2020, we drew $997.5 million under our revolving credit facility to secure our liquidity position and preserve financial flexibility amid the COVID-19 pandemic, all of which was repaid during 2020. In addition, for the year ended December 31, 2020, we paid $82.6 million to repurchase $96.6 million in principal amount of our outstanding indebtedness, primarily our senior notes. We also paid $7.3 million in dividends to Class A common stockholders and $4.6$76.7 million in cash distributions to the noncontrolling interest holders of Station Holdco, as well as $22.9$14.7 million in fees and costs related to the amendment of the credit facilitytax withholding on share-based compensation and the new senior notes.
During 2019, we incurred net borrowings under the revolving credit facility of $195.0 million, which were primarily used to fund capital expenditures. We also paid $27.9$58.6 million in dividends to holders of our Class A common stockholders and $18.7stock.
For the year ended December 31, 2022, we paid $141.5 million to repurchase approximately 3.7 million shares of our Class A common stock in open market transactions, $152.4 million in cash distributions to the noncontrolling interest holders of Station Holdco. In addition, we purchasedHoldco and $116.7 million in cash dividends to holders of our corporate building for $57.0 million,Class A common stock, which was previously leased underincluded the payment of a sale-leaseback transaction accounted for as a financing transaction, and settled the associated $37.4 million liability. The $19.6 million difference between the purchase price and the liability extinguished was recognized as a loss on early extinguishmentspecial cash dividend of debt.$1.00 per share in December 2022.
Restrictive Covenants
Certain customary covenants are included in both the credit agreement governing the credit facility and the indentures governing Station LLC’s senior notes that, among other things and subject to certain exceptions, restrict Station LLC’s ability and the ability of its restricted subsidiaries to incur or guarantee additional debt; create liens on collateral; engage in mergers, consolidations or asset dispositions; pay distributions; make investments, loans or advances; engage in certain transactions with affiliates or subsidiaries; engage in lines of business other than its core business and related businesses; or issue certain preferred units.
The credit facility also includes certain financial ratio covenants that Station LLC is required to maintain throughout the term of the credit facility, measured as of the end of each quarter. As most recently amended in February 2020, these financial ratio covenants include an interest coverage ratio of not less than 2.50 to 1.00 and a maximum consolidated total leverage ratio with step-downs over the term of the credit facility, ranging from 6.50 to 1.00 at December 31, 2021 to 5.25 to 1.00 at December 31, 2023 and thereafter. A breach of the financial ratio covenants shall only become an event of default under the term loanTerm Loan B facility if the lenders providing the term loanTerm Loan A facility and the revolving credit facility take certain affirmative actions after the occurrence of a default of such financial ratio covenants. We believe Station LLC was in compliance with all applicable covenants at December 31, 2020. However, the ongoing impacts of the COVID-19 pandemic on our business and results of operations may negatively impact our ability to remain in compliance with such covenants.
We may be unable to raise additional debt or equity financing to provide liquidity if the COVID-19 pandemic, measures implemented to curtail its spread, and changes in the economy, discretionary spending and consumer confidence have a protracted negative effect on our business. In addition, the aforementioned covenants and restrictions may limit our ability to compete effectively or to take advantage of new business opportunities. Further, our ability to comply with covenants and restrictions contained in the agreements governing our indebtedness may be adversely affected by general economic conditions and industry conditions resulting from COVID-19 and other factors.
Failure to satisfy the covenants contained in the credit agreements, indentures or other agreements governing our indebtedness would require us to seek waivers or amendments of such covenants. There can be no assurance that we will be
able to obtain required waivers or amendments, as such matters depend, in part, on factors outside of our control. If we fail to satisfy our covenants and are unable to obtain such waivers or amendments, our creditors could exercise remedies under the applicable documents governing such indebtedness, including acceleration of such indebtedness.2023.
Off-Balance Sheet Arrangements
At December 31, 2020,2023, we had no variable interests in unconsolidated entities that provide off-balance sheet financing, liquidity, market risk or credit risk support, or that engage in leasing, hedging or research and development arrangements with us, nor did we have retained or contingent interests in assets transferred to an unconsolidated entity. Our derivative instruments comprise interest rate swaps as described in Note 8 to the Consolidated Financial Statements. At December 31, 2020,2023, we had outstanding letters of credit and similar obligations totaling $29.4$39.8 million.
Inflation
Our business continues to experience the impact of inflation and higher interest rates and we expect the impact to continue in 2024. Commodity prices have increased and become more volatile, and we continue to experience price inflation in ordinary goods and services such as food costs, supplies, energy costs and construction costs. In addition, we have been impacted by a shortage of qualified workers which places additional upward pressure on wages and benefit costs as we seek to attract and retain qualified workers. We attempt to minimize the impact of inflation on our business by implementing cost controls, adjusting prices and optimizing our procurement strategy.
Native American Development
We have development and management agreements with the North Fork Rancheria of Mono Indians, a federally recognized Native American tribe located near Fresno, California, pursuant to which we will assist the Mono in developing, financing and operating a gaming and entertainment facility to be located on Highway 99 north of the city of Madera, California. See Note 56 to the Consolidated Financial Statements for additional information.
Regulation and Taxes
We are subject to extensive regulation by Nevada gaming authorities, as well as regulation by gaming authorities in the other jurisdictions in which we operate, including the NIGC and the California Gambling Control Commission and the Federated Indians of Graton Rancheria Gaming Commission. We will also be subject to regulation, which may or may not be similar to that in Nevada, by any other jurisdiction in which we may conduct gaming activities in the future. For a more complete description of our regulatory requirements, see Item 1. Business—Regulation and Licensing.
The gaming industry represents a significant source of tax revenue, particularly to the State of Nevada and its counties and municipalities. From time to time, various state and federal legislators and officials have proposed changes in tax law, or in the administration of such law, affecting the gaming industry. The Nevada legislature meets every two years for 120 days and when special sessions are called by the Governor.Governor, and is not currently in session. The currentmost recent special legislative session beganended on February 1, 2021.June 14, 2023. There are currently no specific legislative proposals to increase taxes on gaming revenue, but there are no assurances that an increase in taxes on gaming or other revenue will not be proposed and passed by the Nevada legislature in the future.
Description of Certain Indebtedness
Long-term Debt
A description of our indebtedness is included in Note 7 to the Consolidated Financial Statements.
Derivative Instruments
A description of our derivative and hedging activities and the related accounting is included in Note 8 to the Consolidated Financial Statements.
Critical Accounting Policies and Estimates
The preparation of consolidated financial statements in conformity with GAAP requires us to make estimates and judgments that are subject to an inherent degree of uncertainty. Certain accounting estimates and assumptions may have a material impact on our financial statements due to the significant levels of subjectivity and judgment involved and the susceptibility of such estimates and assumptions to change. We base our estimates on historical experience, information that is currently available to us and various other assumptions that we believe are reasonable under the circumstances, and we evaluate our estimates on an ongoing basis. Actual results may differ from our estimates, and such differences could have a material effect on our consolidated financial statements. Our significant accounting policies are described in Note 2 to the Consolidated Financial Statements. Following is a discussion of our accounting policies that involve critical estimates and assumptions.
Long-Lived Assets
Our business is capital intensive and a significant portion of our capital is invested in property and equipment, finite-lived intangible assets and other long-lived assets. We review long-lived assets for impairment whenever events or changes in circumstances indicate the carrying amount of an asset may not be recoverable. We evaluate the recoverability of our long-lived assets by estimating the future cash flows the asset is expected to generate, and comparing these estimated cash flows, on an undiscounted basis, to the carrying amount of the asset. If the carrying amount is greater, the asset is considered to be impaired, and we recognize an impairment charge equal to the amount by which the carrying amount of the asset exceeds its fair value. We test our long-lived assets for impairment at the reporting unit level, and each of our operating properties is considered a separate reporting unit.
Inherent in the calculation of fair values are various estimates and assumptions, including estimates of future cash flows expected to be generated by an asset or asset group. We base our cash flow estimates on the current regulatory, political and economic climates in the areas where we operate, recent operating information and projections for our properties. These estimates could be negatively impacted by changes in federal, state or local regulations, economic downturns, changes in consumer preferences, or events affecting various forms of travel and access to our properties. Future cash flow estimates are, by their nature, subjective and actual results may differ materially from our estimates. The most significant assumptions used in determining cash flow estimates include forecasts of future operating results, Adjusted EBITDA margins, tax rates, capital expenditures, working capital requirements, long-term growth rates and terminal year free cash flows. Cash flow estimates and their impact on fair value are highly sensitive to changes in many of these assumptions. If our estimates of future cash flows are not met, we may be required to record impairment charges in the future.
In the first quarter of 2020, the initial economiceffects of the COVID-19 pandemic had a significant adverse effect on our actual and projected operating results. We determined that thoseeffects represented indicators of potential asset impairment and performed impairment assessments for all of our long-lived assets. No impairment losses were recognized as a result of the interim impairment testing.
As of December 31, 2020,2022, we permanently closed our Texas Station, Fiesta Henderson, Fiesta Rancho and Palms properties had not reopened, and we have no plans to reopen any of these properties in 2021. We determined these ongoingWild Wild West properties. The closures to bewere an indicator of potential impairment at those reporting units. Accordingly, we tested the long-lived assets of thosethe reporting units for impairment by comparing theeach reporting unit’s estimated future undiscounted cash flows of those properties to theits carrying amounts of the reporting units.amount. Our cash flow projections represented the expected net proceeds from the sale of the land and were based on a numbermarket prices for similar assets.
Property and Equipment. At December 31, 2020,2023, the carrying amount of our property and equipment was approximately $2.9$2.8 billion, which represents 76.4%70.1% of our total assets. We make estimates and assumptions when accounting for property and equipment. We compute depreciation using the straight-line method over the estimated useful lives of the assets, and our depreciation expense is highly dependent on the assumptions we make about the estimated useful lives of our assets. We estimate the useful lives of our property and equipment based on our experience with similar assets and our estimate of the usage of the asset. Whenever events or circumstances occur that change the estimated useful life of an asset, we account for the change prospectively. We must also make judgments about the capitalization of costs. Costs of major improvements are capitalized, while costs of normal repairs and maintenance are charged to expense as incurred. If an asset or asset group is disposed or retired before the end of its previously estimated useful life, we may be required to accelerate our depreciation expense or recognize a loss on disposal.
Finite-Lived Intangible Assets.Goodwill. Our finite-lived intangibles assets primarily include assets related toAt December 31, 2023, our customer relationships, condominium rental contracts, certain trademarks and management contracts. We amortize our finite-lived intangible assets over their estimated useful lives using the straight-line method. We periodically evaluate the remaining useful livesgoodwill totaled $195.7 million, approximately 86.8% of which is associated with one of our finite-lived intangible assets to determine whether events and circumstances warrant a revision to the remaining period of amortization. Whenever events or circumstances occur that change the estimated remaining useful life of an asset, we account for the change prospectively.
Goodwill. properties. We test our goodwill for impairment annually as of October 1, and whenever events or circumstances indicate that it is more likely than not that impairment may have occurred. Impairment testing for goodwill is performed at the reporting unit level, and we consider each of our operating properties to be a separate reporting unit.
When performing the annual goodwill impairment testing, we either conduct a qualitative assessment to determine whether it is more likely than not that the asset is impaired, or elect to bypass this qualitative assessment and perform a quantitative test for impairment. Under the qualitative assessment, we consider both positive and negative factors, including macroeconomic conditions, industry events, financial performance and other changes in facts and circumstances, and make a determination of whether it is more likely than not that the fair value of goodwill is less than its carrying amount. If, after assessing the qualitative factors, we determine it is more likely than not the asset is impaired, we then perform a quantitative test in which the estimated fair value of the reporting unit is compared with its carrying amount, including goodwill. If the carrying amount of the reporting unit exceeds its estimated fair value, an impairment loss is recognized in an amount equal to the excess, limited to the amount of goodwill allocated to the reporting unit. As of our most recent quantitative test performed at October 1, 2020, the estimated fair value of each of our properties with goodwill exceeded its respective carrying value by a substantial amount. We performed qualitative tests at October 1, 2023 and 2022 given the continued improvement in our operating results since our last quantitative test.
When performing the quantitative test, we estimate the fair value of each reporting unit using the expected present value of future cash flows along with value indications based on our current valuation multiple and multiples of comparable publicly traded companies. The estimation of fair value requires management to make critical estimates, judgments and assumptions, including estimating expected future cash flows and selecting appropriate discount rates, valuation multiples and market comparables. Application of alternative estimates and assumptions could produce significantly different results.
At December 31, 2020, our goodwill totaled $195.7 million. Approximately 86.8% of our goodwill is associated with one of our properties. As of our most recent annual goodwill testing date, the estimated fair value of each of our properties with goodwill exceeded its respective carrying value by a significant amount. If the fair value of any of theseour properties with goodwill should decline in the future, we may be required to recognize a goodwill impairment charge, which could be material. A property’s fair value may decline as a result of a decrease in the property’s actual or projected operating results or changes in other significant assumptions and judgments used in the estimation process, including the discount rate and market multiple.
Indefinite-Lived Intangible Assets. Our indefinite-lived intangible assets primarily represent the value of our brands. At December 31, 2020,2023, the carrying amount of our indefinite-lived intangible assets totaled $77.5$76.5 million. Indefinite-lived intangible assets are not amortized unless management determines that their useful life is no longer indefinite. We test our indefinite-lived intangible assets for impairment annually as of October 1, and whenever events or changes in circumstances indicate that an asset may be impaired, by comparing the carrying amount of the asset to its estimated fair value. If the carrying amount of the asset exceeds its estimated fair value, we recognize an impairment charge equal to the excess. We estimate the fair value of our brands using a derivation of the income approach to valuation based on the present value of estimated royalties avoided through ownership of the assets. The fair values of our indefinite-lived intangible assets are highly sensitivesubject to change as a result of changes in projected operating results. Accordingly, any decrease in the projected operating results of a property could require us to recognize an impairment charge, which could be material.
Native American Development Costs. We incur certain costs associated with our development and management agreements with Native American tribes whichthat are reimbursable by the tribes, and we capitalize thesetribes. The reimbursable costs are recognized as long-term assets. The assets are typically transferred to the tribe at such time as the tribe secures financing, or the gaming facility is completed. We earn a return on the costs incurred, forand primarily include advances associated with the acquisition of land and development of Native American projects.the tribal gaming facility. We earn interest on the reimbursable advances. The repayment of the advances and the related interest may come from the proceeds of the gaming facility’s third-party financing, from cash flows generated from the gaming facility’s operations, or from a combination of both, and the repayment is typically subordinated to debt service obligations under the gaming facility’s third-party financing. Due to the uncertainty surrounding the timing and amount of the stated return,repayment, we do not recognize interest on the return on a cash basis. Development costsadvances until the carrying amount of the advances has been recovered and the related return are typically repaid by the tribe from a project’s financing or from operating cash flows of the casino after opening.interest is received. Accordingly, the recoverability of our development costs is highly dependent upon the tribe’s success in obtaining third-party financing and our ability to operate the project successfully upon its completion. Our evaluation of the recoverability of our Native American development costs requires us to apply a significant amount of judgment.
We evaluate the recoverability of our Native American development costs for impairment whenever events or changes in circumstances indicate that the carrying amount of the project might not be recoverable, taking into consideration all available information. Among other things, we consider the status of the project, anythe impact of contingencies, the achievement of milestones, any existing or potential litigation, and regulatory matters when evaluating the recoverability of our Native American projects for impairment. If an indicator of impairment exists, we compare the estimated future cash flows of the asset, on an undiscounted basis, to the carrying amount of the asset. If the undiscounted expected future cash flows for a project do not exceed its carrying amount, the asset is written down to its estimated fair value.development costs. We estimate a project’s fair value using a discounted cash flow model and market comparables, when available. Our estimate of the undiscounted future cash flows of a Native American development project is based on consideration of all positive and negative evidence about the futureits cash flow potential of the project including, but not limited to, the likelihood that the project will be successfully completed, the status of required approvals, and the status and
timing of the construction of the project, as well as current and projected economic, political, regulatory and competitive conditions that may adversely impact the project’s operating results. In certain circumstances, we may discontinue funding of a project due to a revision of its expected potential, or otherwise determine that our advances are not recoverable and as a result, we may be required to write off the entire carrying amount of a project.our advances.
Litigation, Claims and Assessments
We are defendants in various lawsuits relating to routine matters incidental to our business and we assess the potential for any lawsuits or claims brought against us on an ongoing basis. For ongoing litigation and potential claims, we use judgment in determining the probability of loss and whether a reasonable estimate of loss, if any, can be made. We accrue a liability when we believe a loss is probable and the amount of the loss can be reasonably estimated. As the outcome of litigation is inherently uncertain, it is possible that certain matters may be resolved for materially different amounts than previously accrued or disclosed.
Income Taxes
We are taxed as a corporation and pay corporate federal, state and local taxes on income allocated to us by Station Holdco. Station Holdco operates as a partnership for federal, state and local tax reporting and holds 100% of the economic interests in Station LLC. The members of Station Holdco are liable for any income taxes resulting from income allocated to them by Station Holdco as a pass-through entity.
We recognize deferred tax assets and liabilities based on the differences between the book value of assets and liabilities for financial reporting purposes and those amounts applicable for income tax purposes using enacted tax rates in effect for the year in which the differences are expected to reverse. Deferred tax assets represent future tax deductions or credits. Realization of the deferred tax assets ultimately depends on the existence of sufficient taxable income of the appropriate character in either the carryback or carryforward period.
Each reporting period, we analyze the likelihood that our deferred tax assets will be realized. A valuation allowance is recorded if, based on the weight of all available positive and negative evidence, it is more likely than not that some portion, or all, of a deferred tax asset will not be realized. If we subsequently determine that there is sufficient evidence to indicate a deferred tax asset will be realized, the associated valuation allowance is reversed. On an annual basis, we perform a comprehensive analysis of all forms of positive and negative evidence based on year end results. During each interim period, we update our annual analysis for significant changes in the positive and negative evidence. We have determined that our deferred tax assets do not meet the “more likely than not” threshold required under the accounting standard for income taxes and as a result, have provided a full valuation allowance on our net deferred tax assets.
We record uncertain tax positions on the basis of a two-step process in which (1) we determine whether it is more likely than not the tax positions will be sustained on the basis of the technical merits of the position, and (2) for those tax positions meeting the more likely than not recognition threshold, we recognize the largest amount of tax benefit that is more than 50% likely to be realized upon ultimate settlement with the related tax authority. We do not believe that we have any tax positions for which it is reasonably possible that we will be required to record a significant liability for unrecognized tax benefits within the next twelve months.
ITEM 7A.QUANTITATIVE AND QUALITATIVE DISCLOSURES ABOUT MARKET RISK
Market risk is the risk of loss arising from adverse changes in market rates and prices, such as interest rates, foreign currency exchange rates and commodity prices.
Our primary exposure to market risk is interest rate risk associated with our long-term debt. We evaluate our exposure to market risk by monitoring interest rates in the marketplace. We attempt to limit our exposure to interest rate risk by managing the mix of our long-term and short-term borrowings and we may use interest rate swaps to limit cash flow variability on a portion of our variable-rate debt. Borrowings under our credit agreements bear interest at a margin above LIBORSOFR or base rate (each as defined in the credit agreements) as selected by us. The total amount of outstanding borrowings is expected to fluctuate and may be reduced from time to time.
LIBOR is expected to be discontinued after 2021. TheBeginning in July 2023, the interest rate per annum applicable to loans under our credit facility is, at our option, either LIBORSOFR plus a margin or a base rate plus a margin. The credit facility permits the administrative agent to approve a comparable successor baseinterest rate in the event that LIBOR is discontinued, but there can be no assurances as to what the alternative base rate may be and whether such base rate will be more or less favorable than LIBOR or any other unforeseen impacts of the potential discontinuation of LIBOR. We intend to continue monitoring the developments with respect to the potential phasing out of LIBOR after 2021 and are working with our lenders to ensure the transition away from LIBOR
will have minimal impact on our financial condition, but can provide no assurance regarding the impact of the discontinuation of LIBOR.SOFR-based loans was previously based on LIBOR, which was discontinued on June 30, 2023.
At December 31, 2020, $1.72023, $2.1 billion of the borrowings under our credit agreements were based on variable rates, primarily LIBOR,SOFR, plus applicable margins of 1.75%1.50% to 2.25%. The LIBOR, and the SOFR rate underlyingapplicable to our LIBOR-basedoutstanding SOFR-based borrowings outstanding under our credit facility ranged from 0.75% to 2.25%was 5.46%. The weighted-average interest rates for variable-rate debt shown in the long-term debt table below were calculated using the rates in effect at December 31, 2020.2023. We cannot predict the LIBORSOFR or base rate interest rates that will be in effect in the future, and actual rates will vary. Based on our outstanding borrowings at December 31, 2020,2023, an assumed 1% increase in variable interest rates would cause our annual interest cost to increase by approximately $4.3 million, after giving effect to our interest rate swaps.
We are also exposed to interest rate risk related to our interest rate swap agreements which we use to hedge a$21.2 million. A portion of our variable-rate debt. At December 31, 2020, ourvariable interest rate swaps haddebt will become due in February 2025. We believe it is probable that these obligations will be refinanced on a combined notional amount of $1.3 billion and a weighted-average fixed pay rate of 1.94%. Our interest rate swaps will expirelong-term basis in July 2021.
Although we no longer apply hedge accounting to these interest rate swaps, they continue to meet our risk management objectives by achieving fixed cash flows attributable to interest payments on the debt principal being hedged. See Note 8 to the Consolidated Financial Statements for additional information about our interest rate swaps. We do not use derivative financial instruments for trading or speculative purposes.
Interest rate movements affect the fair value of our interest rate swaps. The fair values of our interest rate swaps are determined using widely accepted valuation techniques including discounted cash flow analysis on the expected cash flows of the instrument. This analysis reflects the contractual terms of the agreements, including the period to maturity, and uses observable market-based inputs, including forward interest rate curves. We incorporate credit valuation adjustments to appropriately reflect both our own nonperformance risk and the respective counterparty’s nonperformance risk in the fair value measurement. Fair value is subject to significant estimation and a high degree of variability between periods and changes in the fair values of our interest rate swaps are recognized in our Consolidated Statements of Operations in the period of change. In addition, we are exposed to credit risk should the counterparties fail to perform under the terms of the interest rate swap agreements; however, we seek to minimize our exposure to this risk by entering into interest rate swap agreements with highly rated counterparties, and we do not believe we were exposed to significant credit risk at December 31, 2020.2024.
Following is information about future principal maturities of our long-term debt and the related weighted-average contractual interest rates in effect at December 31, 20202023 (dollars in millions):
| | | |
| | | | Expected maturity date | |
| | | 2021 | | 2022 | | 2023 | | 2024 | | 2025 | | Thereafter | | Total | | Fair value | 2024 | | 2025 | | 2026 | | 2027 | | 2028 | | Thereafter | | Total | | Fair value |
| Long-term debt: | Long-term debt: | | | | | | | | | | | | | | | |
| Fixed rate | Fixed rate | $ | 1.5 | | | $ | 1.1 | | | $ | 1.2 | | | $ | 1.2 | | | $ | 567.4 | | | $ | 690.9 | | | $ | 1,263.3 | | | $ | 1,274.7 | |
| Fixed rate | |
| Fixed rate | |
| Weighted-average interest rate | Weighted-average interest rate | 4.47 | % | | 3.80 | % | | 3.80 | % | | 3.80 | % | | 4.92 | % | | 4.50 | % | |
| | Variable rate (a) | $ | 21.3 | | | $ | 24.8 | | | $ | 24.8 | | | $ | 24.8 | | | $ | 159.4 | | | $ | 1,427.2 | | | $ | 1,682.3 | | | $ | 1,661.7 | |
| Weighted-average interest rate | 2.23 | % | | 2.27 | % | | 2.27 | % | | 2.27 | % | | 1.96 | % | | 2.50 | % | |
| Variable rate | |
| | Variable rate | |
| | Variable rate | |
| Weighted-average interest rate (a) | |
(a) Based on variable interest rates and margins in effect at December 31, 2020.
Following is information about the combined notional amount and weighted-average interest rate by contractual maturity date for our interest rate swap agreements, as well as the fair value of our interest rate swap liabilities at December 31, 2020 (dollars in millions):
| | | | | | | | | | | | | | | | | | | | | | | | | | | | | | | | | | | | | | | | | | | | | | | |
| | Expected maturity date | | Fair value (c) |
| | 2021 | | 2022 | | 2023 | | 2024 | | 2025 | | Thereafter | | Total | |
| Interest rate swaps: | | | | | | | | | | | | | | |
| Notional amount | $ | 1,250.0 | | | $ | — | | | $ | — | | | $ | — | | | $ | — | | | $ | — | | | $ | 1,250.0 | | | $ | 11.8 | |
| Fixed interest rate payable (a) | 1.94 | % | | — | % | | — | % | | — | % | | — | % | | — | % | | | | |
| Variable interest rate receivable (b) | 0.15 | % | | — | % | | — | % | | — | % | | — | % | | — | % | | | | |
(a)Represents the weighted-average fixed interest rate payable on our interest rate swaps.
(b)Represents the variable receive rate in effect at December 31, 2020.
(c)Liability excludes accrued interest.2023.
Additional information about our long-term debt and interest rate swaps is included in Notes 7 andNote 8 to the Consolidated Financial Statements.
ITEM 8.FINANCIAL STATEMENTS AND SUPPLEMENTARY DATA
INDEX TO CONSOLIDATED FINANCIAL STATEMENTS
Report of Independent Registered Public Accounting Firm
To the Stockholders and the Board of Directors of Red Rock Resorts, Inc.
Opinion on the Financial Statements
We have audited the accompanying consolidated balance sheets of Red Rock Resorts, Inc. (the Company) as of December 31, 20202023 and 2019,2022, the related consolidated statements of operations,income, comprehensive (loss) income, stockholders' equity and cash flows for each of the three years in the period ended December 31, 2020,2023, and the related notes and the financial statement schedule listed in the Index at Item 15(a)2 (collectively referred to as the “consolidated financial statements”). In our opinion, the consolidated financial statements present fairly, in all material respects, the financial position of the Company at December 31, 20202023 and 2019,2022, and the results of its operations and its cash flows for each of the three years in the period ended December 31, 2020,2023, in conformity with U.S. generally accepted accounting principles.
We also have audited, in accordance with the standards of the Public Company Accounting Oversight Board (United States) (PCAOB), the Company's internal control over financial reporting as of December 31, 2020,2023, based on criteria established in Internal Control-Integrated Framework issued by the Committee of Sponsoring Organizations of the Treadway Commission (2013 framework), and our report dated February 23, 202121, 2024 expressed an unqualified opinion thereon.
Basis for Opinion
These financial statements are the responsibility of the Company's management. Our responsibility is to express an opinion on the Company’s financial statements based on our audits. We are a public accounting firm registered with the PCAOB and are required to be independent with respect to the Company in accordance with the U.S. federal securities laws and the applicable rules and regulations of the Securities and Exchange Commission and the PCAOB.
We conducted our audits in accordance with the standards of the PCAOB. Those standards require that we plan and perform the audit to obtain reasonable assurance about whether the financial statements are free of material misstatement, whether due to error or fraud. Our audits included performing procedures to assess the risks of material misstatement of the financial statements, whether due to error or fraud, and performing procedures that respond to those risks. Such procedures included examining, on a test basis, evidence regarding the amounts and disclosures in the financial statements. Our audits also included evaluating the accounting principles used and significant estimates made by management, as well as evaluating the overall presentation of the financial statements. We believe that our audits provide a reasonable basis for our opinion.
Critical Audit Matter
The critical audit matter communicated below is a matter arising from the current period audit of the financial statements that was communicated or required to be communicated to the audit committee and that: (1) relates to accounts or disclosures that are material to the financial statements and (2) involved our especially challenging, subjective or complex judgments. The communication of the critical audit matter does not alter in any way our opinion on the consolidated financial statements, taken as a whole, and we are not, by communicating the critical audit matter below, providing a separate opinion on the critical audit matter or on the accounts or disclosures to which it relates.
| | | | | | | | |
| | ValuationRecoverability of Long-lived Assets at Operating Properties ClosedNative American Development Costs as of December 31, 20202023 |
| Description of the Matter | | At December 31, 2020,2023, the Company’s long-lived assets totaled $3 billion.Native American development costs had a carrying value of $45.9 million. As discussed in Note 2 to the consolidated financial statements, the Company reviewsevaluates the carrying amountsrecoverability of its long-lived assets, other than goodwillNative American development costs by considering the status of the respective Native American development project, the achievement of milestones, the impact of contingencies, existing litigation, and indefinite-lived intangible assets, for impairment whenever events or changes in circumstances indicateregulatory matters. The Company estimates the carrying amount of an asset may not be recoverable. Recoverability is evaluated by comparing the estimated future cash flows offrom the asset,Native American development project based on an undiscounted basis, toevaluation of all positive and negative evidence about the asset’s carrying amount. Ifcash flow potential, which includes the undiscounted future cash flows do not exceed the carrying amount, impairment is measured based on the difference between the asset’s estimated fair value and the carrying amount. The Company’s long-lived asset impairment tests are performed at the reporting unit level. Management uses judgment to determine the severity of the events or changes in circumstances that may be indicatorslikelihood that the carrying amount of an asset is not recoverable. As a result of the effects of the COVID-19 pandemic, four of the Company’s operating properties have not reopened as of December 31, 2020 and are not expected to reopen during the year ending December 31, 2021. The CompanyNative American development project will continue to assess the performance of its reopened operating properties, as well as the recovery of the Las Vegas market and the economy as a whole, before considering whether to reopen some or all of the four properties that remain closed. Management determined the ongoing closures of these four properties represented indicators of impairment, which required management to perform impairment assessments of the long-lived assets as of December 31, 2020. No indicators of impairment for any other reporting units were identified.successfully be completed.
Auditing the Company’s impairment assessments was challenging, as the assumptions used by management are highly subjective and judgmental and incorporate inherent uncertainties that are difficult to predict in the current economic environment. These specific assumptions are comprisedevaluation of recoverability of the projected reopening timelinesNative American development costs is challenging due to the uncertainty surrounding the timing and operating results,likelihood of completion of both the Native American development project and the repayment of the reimbursable advances, both of which are dependentcontingent on market conditions, including industrythe achievement of critical milestones, the financing of the Native American development project, and economic trends, changes in regulations, consumer preferences, and events affecting various forms of travel. Changes to management’s assumptions could have a material effect on management’s determination of whether the assets need to be tested for recoverability as of a reporting date. Additionally, auditing the Company’s estimation around the undiscounted cash flows involved a high degree of judgment overfrom the Company’s EBITDA growth rate assumptions.Native American project.
|
| How We Addressed the Matter in Our Audit | | We obtained an understanding, evaluated the design and tested the operating effectiveness of the controls over the Company’s reviewevaluation of impairment indicators over long-lived assets and the undiscounted cash flow analyses.recoverability of its Native American development costs. For example, we tested controls over management’s assessment, includingevaluation of the identificationcritical milestones, the likelihood of indicators of impairmentobtaining and the dataamount of expected financing for the Native American development project, and assumptions used in management’s impairment assessments. the estimated future cash flows from the Native American development project.
To test the Company’s Native American development costs recoverability evaluation, of indicators of impairment for long-lived assets, our audit procedures included, among others, assessing the methodologies and testing the completeness and accuracyreasonableness of the Company’s analysisevaluation of events or changes in circumstances. To test the Company’s undiscountedcritical milestones, impact of existing litigation, and the estimated future cash flow analyses forflows of the four operating properties,Native American development project. For example, we compared projected amountsthe status of the critical milestones to historical results, includingsupporting documentation and we evaluated management’s assumptions used in the estimated cash flows by performing sensitivity analyses on EBITDA growth rates and the projected reopening timelines.
|
/s//s/ Ernst & Young LLP
We have served as the Company’s auditor since 2015.
Las Vegas, Nevada
February 23, 202121, 2024
RED ROCK RESORTS, INC.
CONSOLIDATED BALANCE SHEETS
(amounts in thousands, except share data)
| | December 31, |
| December 31, | | | December 31, |
| | | 2020 | | 2019 | | 2023 | | 2022 |
| ASSETS | ASSETS | | | | ASSETS | | | |
| Current assets: | Current assets: | | | | Current assets: | | | |
| Cash and cash equivalents | Cash and cash equivalents | $ | 121,176 | | | $ | 128,835 | |
| Restricted cash | 4,529 | | | 4,080 | |
| Receivables, net | Receivables, net | 35,130 | | | 56,683 | |
| | Income tax receivables | |
| Inventories | Inventories | 13,079 | | | 17,765 | |
| Prepaid gaming tax | Prepaid gaming tax | 24,316 | | | 24,424 | |
| Prepaid expenses and other current assets | Prepaid expenses and other current assets | 13,827 | | | 17,641 | |
| Assets held for sale | 36,902 | | | 32,202 | |
| Total current assets | Total current assets | 248,959 | | | 281,630 | |
| Property and equipment, net | Property and equipment, net | 2,857,973 | | | 3,061,762 | |
| Goodwill | Goodwill | 195,676 | | | 195,676 | |
| Intangible assets, net | Intangible assets, net | 100,817 | | | 108,506 | |
| Land held for development | Land held for development | 233,740 | | | 238,440 | |
| Investments in joint ventures | 8,162 | | | 8,867 | |
| Native American development costs | Native American development costs | 22,149 | | | 18,749 | |
| Deferred tax asset, net | Deferred tax asset, net | 0 | | | 113,185 | |
| Other assets, net | Other assets, net | 72,478 | | | 87,372 | |
| Total assets | Total assets | $ | 3,739,954 | | | $ | 4,114,187 | |
| LIABILITIES AND STOCKHOLDERS’ EQUITY | LIABILITIES AND STOCKHOLDERS’ EQUITY | | | | LIABILITIES AND STOCKHOLDERS’ EQUITY | | | |
| Current liabilities: | Current liabilities: | | | | Current liabilities: | | | |
| Accounts payable | Accounts payable | $ | 11,208 | | | $ | 33,970 | |
| Accrued interest payable | Accrued interest payable | 20,128 | | | 7,477 | |
| | Other accrued liabilities | Other accrued liabilities | 146,077 | | | 200,560 | |
| | Current portion of payable pursuant to tax receivable agreement | |
| Current portion of long-term debt | Current portion of long-term debt | 22,844 | | | 33,989 | |
| Total current liabilities | Total current liabilities | 200,257 | | | 275,996 | |
| Long-term debt, less current portion | Long-term debt, less current portion | 2,879,163 | | | 2,999,302 | |
| | Other long-term liabilities | Other long-term liabilities | 28,499 | | | 31,228 | |
| Payable pursuant to tax receivable agreement | 27,394 | | | 25,064 | |
| Payable to related parties pursuant to tax receivable agreement | |
| Total liabilities | Total liabilities | 3,135,313 | | | 3,331,590 | |
| Commitments and contingencies (Note 17) | 0 | | 0 |
| Commitments and contingencies (Note 16) | | Commitments and contingencies (Note 16) | | | |
| Stockholders’ equity: | Stockholders’ equity: | | | | Stockholders’ equity: | | | |
| Preferred stock, par value $0.01 per share, 100,000,000 shares authorized; NaN issued and outstanding | 0 | | | 0 | |
| Class A common stock, par value $0.01 per share, 500,000,000 shares authorized; 71,228,168 and 70,465,422 shares issued and outstanding at December 31, 2020 and 2019, respectively | 712 | | | 705 | |
| Class B common stock, par value $0.00001 per share, 100,000,000 shares authorized; 46,085,804 and 46,827,370 shares issued and outstanding at December 31, 2020 and 2019, respectively | 1 | | | 1 | |
| Preferred stock, par value $0.01 per share, 100,000,000 shares authorized; none issued and outstanding | |
| Class A common stock, par value $0.01 per share, 500,000,000 shares authorized; 58,866,439 and 58,012,937 shares issued and outstanding at December 31, 2023 and 2022, respectively | |
| Class B common stock, par value $0.00001 per share, 100,000,000 shares authorized; 45,985,804 shares issued and outstanding at December 31, 2023 and 2022, respectively | |
| Additional paid-in capital | Additional paid-in capital | 385,579 | | | 376,229 | |
| (Accumulated deficit) retained earnings | (33,071) | | | 124,423 | |
| Accumulated other comprehensive loss | (623) | | | (641) | |
| Retained earnings | |
| Total Red Rock Resorts, Inc. stockholders’ equity | Total Red Rock Resorts, Inc. stockholders’ equity | 352,598 | | | 500,717 | |
| Noncontrolling interest | Noncontrolling interest | 252,043 | | | 281,880 | |
| Total stockholders’ equity | Total stockholders’ equity | 604,641 | | | 782,597 | |
| Total liabilities and stockholders’ equity | Total liabilities and stockholders’ equity | $ | 3,739,954 | | | $ | 4,114,187 | |
The accompanying notes are an integral part of these consolidated financial statements.
RED ROCK RESORTS, INC.
CONSOLIDATED STATEMENTS OF OPERATIONSINCOME
(amounts in thousands, except per share data)
| | Year Ended December 31, |
| 2020 | | 2019 | | 2018 |
| Year Ended December 31, | | | Year Ended December 31, |
| 2023 | | | 2023 | | 2022 | | 2021 |
| Operating revenues: | Operating revenues: | | | | | |
| Casino | |
| Casino | |
| Casino | Casino | $ | 764,255 | | | $ | 984,253 | | | $ | 940,483 | |
| Food and beverage | Food and beverage | 192,899 | | | 481,558 | | | 381,197 | |
| Room | Room | 87,035 | | | 192,305 | | | 170,824 | |
| Other | Other | 56,279 | | | 106,773 | | | 100,912 | |
| Management fees | Management fees | 81,977 | | | 91,645 | | | 87,614 | |
| Net revenues | Net revenues | 1,182,445 | | | 1,856,534 | | | 1,681,030 | |
| Operating costs and expenses: | Operating costs and expenses: | | | | | |
| Casino | Casino | 232,939 | | | 351,043 | | | 326,980 | |
| Casino | |
| Casino | |
| Food and beverage | Food and beverage | 195,963 | | | 465,505 | | | 340,212 | |
| Room | Room | 49,363 | | | 81,064 | | | 78,440 | |
| Other | Other | 23,034 | | | 52,329 | | | 48,431 | |
| Selling, general and administrative | Selling, general and administrative | 324,644 | | | 416,355 | | | 390,492 | |
| Depreciation and amortization | Depreciation and amortization | 231,391 | | | 222,211 | | | 180,255 | |
| Write-downs and other charges, net | 36,537 | | | 82,123 | | | 34,650 | |
| Tax receivable agreement liability adjustment | (15) | | | (97) | | | (90,638) | |
| 1,093,856 | | | 1,670,533 | | | 1,308,822 | |
| Write-downs and other, net | |
| Asset impairment | |
| 1,165,398 | |
| Operating income | Operating income | 88,589 | | | 186,001 | | | 372,208 | |
| Earnings from joint ventures | Earnings from joint ventures | 1,097 | | | 1,928 | | | 2,185 | |
| Operating income and earnings from joint ventures | Operating income and earnings from joint ventures | 89,686 | | | 187,929 | | | 374,393 | |
| Other (expense) income: | | | | | |
| Other expense: | |
| Interest expense, net | Interest expense, net | (128,465) | | | (156,679) | | | (143,099) | |
| Gain (loss) on extinguishment/modification of debt, net | 240 | | | (19,939) | | | 0 | |
| Change in fair value of derivative instruments | (21,590) | | | (19,467) | | | 12,415 | |
| Interest expense, net | |
| Interest expense, net | |
| Loss on extinguishment of debt | |
| Other | Other | (333) | | | (315) | | | (354) | |
| (181,023) | |
| Income before income tax | |
| (Provision) benefit for income tax | |
| Net income | |
| Less: net income attributable to noncontrolling interests | |
| Net income attributable to Red Rock Resorts, Inc. | |
| | (150,148) | | | (196,400) | | | (131,038) | |
| (Loss) income before income tax | (60,462) | | | (8,471) | | | 243,355 | |
| (Provision) benefit for income tax | (114,081) | | | 1,734 | | | (23,875) | |
| | Net (loss) income | (174,543) | | | (6,737) | | | 219,480 | |
| Less: net (loss) income attributable to noncontrolling interests | (24,146) | | | (3,386) | | | 61,939 | |
| Net (loss) income attributable to Red Rock Resorts, Inc. | $ | (150,397) | | | $ | (3,351) | | | $ | 157,541 | |
| | (Loss) earnings per common share (Note 15): | |
| | (Loss) earnings per share of Class A common stock, basic | $ | (2.13) | | | $ | (0.05) | | | $ | 2.28 | |
| | (Loss) earnings per share of Class A common stock, diluted | $ | (2.13) | | | $ | (0.05) | | | $ | 1.77 | |
| Earnings per common share (Note 14): | |
| Earnings per common share (Note 14): | |
| Earnings per common share (Note 14): | |
| Earnings per share of Class A common stock, basic | |
| Earnings per share of Class A common stock, basic | |
| Earnings per share of Class A common stock, basic | |
| Earnings per share of Class A common stock, diluted | |
| | Weighted-average common shares outstanding: | Weighted-average common shares outstanding: | |
| Weighted-average common shares outstanding: | |
| Weighted-average common shares outstanding: | |
| Basic | |
| Basic | |
| Basic | Basic | 70,542 | | | 69,565 | | | 69,115 | |
| Diluted | Diluted | 70,542 | | | 69,565 | | | 116,859 | |
The accompanying notes are an integral part of these consolidated financial statements.
RED ROCK RESORTS, INC.
CONSOLIDATED STATEMENTS OF COMPREHENSIVE (LOSS) INCOME
(amounts in thousands)
| | | | | | | | | | | | | | | | | |
| Year Ended December 31, |
| 2020 | | 2019 | | 2018 |
| Net (loss) income | $ | (174,543) | | | $ | (6,737) | | | $ | 219,480 | |
| Other comprehensive loss, net of tax: | | | | | |
| | | | | |
| | | | | |
| | | | | |
| Loss on interest rate swaps from reclassifications into income | (360) | | | (2,600) | | | (2,442) | |
| Minimum pension liability adjustment, net | (196) | | | (486) | | | (310) | |
| Other comprehensive loss, net of tax | (556) | | | (3,086) | | | (2,752) | |
| Comprehensive (loss) income | (175,099) | | | (9,823) | | | 216,728 | |
| Less: comprehensive (loss) income attributable to noncontrolling interests | (24,723) | | | (4,743) | | | 60,610 | |
| Comprehensive (loss) income attributable to Red Rock Resorts, Inc. | $ | (150,376) | | | $ | (5,080) | | | $ | 156,118 | |
| | | | | | | | | | | | | | | | | |
| Year Ended December 31, |
| 2023 | | 2022 | | 2021 |
| Net income | $ | 337,776 | | | $ | 390,352 | | | $ | 354,830 | |
| Other comprehensive income, net of tax: | | | | | |
| Minimum pension liability adjustment, net | — | | | — | | | 1,137 | |
| Other comprehensive income, net of tax | — | | | — | | | 1,137 | |
| Comprehensive income | 337,776 | | | 390,352 | | | 355,967 | |
| Less: comprehensive income attributable to noncontrolling interests | 161,772 | | | 184,895 | | | 113,513 | |
| Comprehensive income attributable to Red Rock Resorts, Inc. | $ | 176,004 | | | $ | 205,457 | | | $ | 242,454 | |
The accompanying notes are an integral part of these consolidated financial statements.
RED ROCK RESORTS, INC.
CONSOLIDATED STATEMENTS OF STOCKHOLDERS’ EQUITY
(amounts in thousands)
| | | | | | | | | | | | | | | | | | | | | | | | | | | | | | | | | | | | | | | | | | | | | | | | | | | | | |
| Red Rock Resorts, Inc. Stockholders’ Equity | | | | |
| Common Stock | | Additional paid in capital | | Retained earnings (accumulated deficit) | | Accumulated other comprehensive income (loss) | Noncontrolling interest | Total stockholders’ equity |
| Class A | | Class B |
| Shares | | Amount | Shares | | Amount |
| Balances, December 31, 2017 | 68,898 | | | $ | 689 | | | 47,264 | | | $ | 1 | | | $ | 349,430 | | | $ | 26,138 | | | $ | 2,473 | | | $ | 252,981 | | | $ | 631,712 | |
| Net income | — | | | — | | | — | | | — | | | — | | | 157,541 | | | — | | | 61,939 | | | 219,480 | |
| Other comprehensive loss, net of tax | — | | | — | | | — | | | — | | | — | | | — | | | (1,423) | | | (1,329) | | | (2,752) | |
| Share-based compensation | — | | | — | | | — | | | — | | | 11,343 | | | — | | | — | | | 0 | | | 11,343 | |
| Distributions | — | | | — | | | — | | | — | | | — | | | — | | | — | | | (19,940) | | | (19,940) | |
| Dividends declared | — | | | — | | | — | | | — | | | — | | | (27,810) | | | — | | | — | | | (27,810) | |
| Issuance of restricted stock awards, net of forfeitures | 122 | | | 1 | | | — | | | — | | | (1) | | | — | | | — | | | — | | | 0 | |
| Repurchases of Class A common stock | (10) | | | — | | | — | | | — | | | (307) | | | — | | | — | | | — | | | (307) | |
| Stock option exercises | 273 | | | 3 | | | — | | | — | | | 5,378 | | | — | | | — | | | — | | | 5,381 | |
| Exchanges of noncontrolling interests for Class A common stock | 380 | | | 4 | | | (380) | | | — | | | 2,149 | | | — | | | 21 | | | (2,174) | | | 0 | |
| Recognition of tax receivable agreement liability resulting from exchanges of noncontrolling interests for Class A common stock | — | | | — | | | — | | | — | | | (2,528) | | | — | | | — | | | — | | | (2,528) | |
| Net deferred tax assets resulting from exchanges of noncontrolling interests for Class A common stock | — | | | — | | | — | | | — | | | 2,675 | | | — | | | — | | | — | | | 2,675 | |
| Tax effects resulting from stock option exercises | — | | | — | | | — | | | — | | | (259) | | | — | | | — | | | — | | | (259) | |
| Rebalancing of ownership percentage between the Company and noncontrolling interests in Station Holdco | — | | | — | | | — | | | — | | | (5,910) | | | — | | | 12 | | | 5,898 | | | 0 | |
| Balances, December 31, 2018 | 69,663 | | | $ | 697 | | | 46,884 | | | $ | 1 | | | $ | 361,970 | | | $ | 155,869 | | | $ | 1,083 | | | $ | 297,375 | | | $ | 816,995 | |
| Net loss | — | | | — | | | — | | | — | | | — | | | (3,351) | | | — | | | (3,386) | | | (6,737) | |
| Other comprehensive loss, net of tax | — | | | — | | | — | | | — | | | — | | | — | | | (1,729) | | | (1,357) | | | (3,086) | |
| | | | | | | | | | | | | | | | | | | | | | | | | | | | | | | | | | | | | | | | | | | | | | | | | | | | | |
| Red Rock Resorts, Inc. Stockholders’ Equity | | | | |
| Common Stock | | Additional paid in capital | | Retained earnings (accumulated deficit) | | Accumulated other comprehensive loss | Noncontrolling interest | Total stockholders’ equity |
| Class A | | Class B |
| Shares | | Amount | Shares | | Amount |
| Balances, December 31, 2020 | 71,228 | | | $ | 712 | | | 46,086 | | | $ | 1 | | | $ | 385,579 | | | $ | (33,071) | | | $ | (623) | | | $ | 252,043 | | | $ | 604,641 | |
| Net income | — | | | — | | | — | | | — | | | — | | | 241,850 | | | — | | | 112,980 | | | 354,830 | |
| Other comprehensive income, net of tax | — | | | — | | | — | | | — | | | — | | | — | | | 604 | | | 533 | | | 1,137 | |
| Share-based compensation | — | | | — | | | — | | | — | | | 12,761 | | | — | | | — | | | — | | | 12,761 | |
| Distributions | — | | | — | | | — | | | — | | | — | | | — | | | — | | | (237,160) | | | (237,160) | |
| Dividends declared | — | | | — | | | — | | | — | | | — | | | (204,928) | | | — | | | — | | | (204,928) | |
| Stock option exercises and issuance of restricted stock awards, net | 620 | | | 6 | | | — | | | — | | | 1,171 | | | — | | | — | | | — | | | 1,177 | |
| Repurchases of Class A common stock | (10,402) | | | (104) | | | — | | | — | | | (500,063) | | | — | | | — | | | — | | | (500,167) | |
| Withholding tax on share-based compensation | (19) | | | — | | | — | | | — | | | (3,425) | | | — | | | — | | | — | | | (3,425) | |
| Exchanges of noncontrolling interests for cash | — | | | — | | | (100) | | | — | | | (2,223) | | | — | | | (1) | | | (598) | | | (2,822) | |
| Recognition of tax receivable agreement liability resulting from exchanges of noncontrolling interests | — | | | — | | | — | | | — | | | (641) | | | — | | | — | | | — | | | (641) | |
| Net deferred tax assets resulting from LLC Unit repurchases | — | | | — | | | — | | | — | | | 24,630 | | | — | | | — | | | — | | | 24,630 | |
| Rebalancing of ownership percentage between the Company and noncontrolling interests in Station Holdco | — | | | — | | | — | | | — | | | 137,239 | | | — | | | 20 | | | (137,259) | | | — | |
| Balances, December 31, 2021 | 61,427 | | | $ | 614 | | | 45,986 | | | $ | 1 | | | $ | 55,028 | | | $ | 3,851 | | | $ | — | | | $ | (9,461) | | | $ | 50,033 | |
| Net income | — | | | — | | | — | | | — | | | — | | | 205,457 | | | — | | | 184,895 | | | 390,352 | |
| Share-based compensation | — | | | — | | | — | | | — | | | 17,766 | | | — | | | — | | | — | | | 17,766 | |
| Distributions | — | | | — | | | — | | | — | | | — | | | — | | | — | | | (152,449) | | | (152,449) | |
| Dividends declared | — | | | — | | | — | | | — | | | — | | | (116,980) | | | — | | | — | | | (116,980) | |
| Stock option exercises and issuance of restricted stock, net | 345 | | | 3 | | | — | | | — | | | (3) | | | — | | | — | | | — | | | — | |
| Withholding tax on share-based compensation | (41) | | | — | | | — | | | — | | | (4,527) | | | — | | | — | | | — | | | (4,527) | |
| Repurchases of Class A common stock | (3,718) | | | (37) | | | — | | | — | | | (92,345) | | | (49,125) | | | — | | | — | | | (141,507) | |
| Net deferred tax assets resulting from LLC Unit repurchases | — | | | — | | | — | | | — | | | (10,445) | | | — | | | — | | | — | | | (10,445) | |
RED ROCK RESORTS, INC.
CONSOLIDATED STATEMENTS OF STOCKHOLDERS’ EQUITY (Continued)
(amounts in thousands)
| | | | | | | | | | | | | | | | | | | | | | | | | | | | | | | | | | | | | | | | | | | | | | | | | | | | | |
| Red Rock Resorts, Inc. Stockholders’ Equity | | | | |
| Common Stock | | Additional paid in capital | | Retained earnings (accumulated deficit) | | Accumulated other comprehensive income (loss) | Noncontrolling interest | Total stockholders’ equity |
| Class A | | Class B |
| Shares | | Amount | Shares | | Amount |
| Share-based compensation | — | | | — | | | — | | | — | | | 16,816 | | | — | | | — | | | 0 | | | 16,816 | |
| Distributions | — | | | — | | | — | | | — | | | — | | | — | | | — | | | (18,743) | | | (18,743) | |
| Dividends declared | — | | | — | | | — | | | — | | | — | | | (28,095) | | | — | | | — | | | (28,095) | |
| Issuance of restricted stock awards, net of forfeitures | 426 | | | 4 | | | — | | | — | | | (4) | | | — | | | — | | | — | | | 0 | |
| Repurchases of Class A common stock | (15) | | | — | | | — | | | — | | | (376) | | | — | | | — | | | — | | | (376) | |
| Stock option exercises | 334 | | | 3 | | | — | | | — | | | 6,704 | | | — | | | — | | | — | | | 6,707 | |
| Exchanges of noncontrolling interests for Class A common stock | 57 | | | 1 | | | (57) | | | — | | | 368 | | | — | | | 1 | | | (370) | | | 0 | |
| Recognition of tax receivable agreement liability resulting from exchanges of noncontrolling interests for Class A common stock | — | | | — | | | — | | | — | | | (213) | | | — | | | — | | | — | | | (213) | |
| Net deferred tax assets resulting from exchanges of noncontrolling interests for Class A common stock | — | | | — | | | — | | | — | | | 104 | | | — | | | — | | | — | | | 104 | |
| Tax effects resulting from stock option exercises | — | | | — | | | — | | | — | | | (775) | | | — | | | — | | | — | | | (775) | |
| Rebalancing of ownership percentage between the Company and noncontrolling interests in Station Holdco | — | | | — | | | — | | | — | | | (8,365) | | | — | | | 4 | | | 8,361 | | | 0 | |
| Balances, December 31, 2019 | 70,465 | | | $ | 705 | | | 46,827 | | | $ | 1 | | | $ | 376,229 | | | $ | 124,423 | | | $ | (641) | | | $ | 281,880 | | | $ | 782,597 | |
| Net loss | — | | | — | | | — | | | — | | | — | | | (150,397) | | | — | | | (24,146) | | | (174,543) | |
| Other comprehensive income (loss), net of tax | — | | | — | | | — | | | — | | | — | | | — | | | 21 | | | (577) | | | (556) | |
| Share-based compensation | — | | | — | | | — | | | — | | | 10,889 | | | — | | | — | | | 0 | | | 10,889 | |
| Distributions | — | | | — | | | — | | | — | | | — | | | — | | | — | | | (4,620) | | | (4,620) | |
| Dividends declared | — | | | — | | | — | | | — | | | — | | | (7,097) | | | — | | | — | | | (7,097) | |
RED ROCK RESORTS, INC.
CONSOLIDATED STATEMENTS OF STOCKHOLDERS’ EQUITY (Continued)
(amounts in thousands)
| | | | | | | | | | | | | | | | | | | | | | | | | | | | | | | | | | | | | | | | | | | | | | | | | | | | | |
| Red Rock Resorts, Inc. Stockholders’ Equity | | | | |
| Common Stock | | Additional paid in capital | | Retained earnings (accumulated deficit) | | Accumulated other comprehensive income (loss) | Noncontrolling interest | Total stockholders’ equity |
| Class A | | Class B |
| Shares | | Amount | Shares | | Amount |
| Issuance of restricted stock awards, net of forfeitures | (7) | | | 0 | | | — | | | — | | | 0 | | | — | | | — | | | — | | | 0 | |
| Repurchases of Class A common stock | (7) | | | — | | | — | | | — | | | (81) | | | — | | | — | | | — | | | (81) | |
| Stock option exercises | 36 | | | 0 | | | — | | | — | | | 397 | | | — | | | — | | | — | | | 397 | |
| Exchanges of noncontrolling interests for Class A common stock | 741 | | | 7 | | | (741) | | | — | | | 4,404 | | | — | | | 1 | | | (4,412) | | | 0 | |
| Recognition of tax receivable agreement liability resulting from exchanges of noncontrolling interests for Class A common stock | — | | | — | | | — | | | — | | | (2,345) | | | — | | | — | | | — | | | (2,345) | |
| Rebalancing of ownership percentage between the Company and noncontrolling interests in Station Holdco | — | | | — | | | — | | | — | | | (3,914) | | | — | | | (4) | | | 3,918 | | | 0 | |
| Balances, December 31, 2020 | 71,228 | | | $ | 712 | | | 46,086 | | | $ | 1 | | | $ | 385,579 | | | $ | (33,071) | | | $ | (623) | | | $ | 252,043 | | | $ | 604,641 | |
| | | | | | | | | | | | | | | | | |
| | | | | | | | | | | | | | | | | | | | | | | | | | | | | | | | | | | | | | | | | | | | | | | | | | | | | |
| Red Rock Resorts, Inc. Stockholders’ Equity | | | | |
| Common Stock | | Additional paid in capital | | Retained earnings (accumulated deficit) | | Accumulated other comprehensive loss | Noncontrolling interest | Total stockholders’ equity |
| Class A | | Class B |
| Shares | | Amount | Shares | | Amount |
| Rebalancing of ownership percentage between the Company and noncontrolling interests in Station Holdco | — | | | — | | | — | | | — | | | 34,526 | | | — | | | — | | | (34,526) | | | — | |
| Balances, December 31, 2022 | 58,013 | | | $ | 580 | | | 45,986 | | | $ | 1 | | | $ | — | | | $ | 43,203 | | | $ | — | | | $ | (11,541) | | | $ | 32,243 | |
| Net income | — | | | — | | | — | | | — | | | — | | | 176,004 | | | — | | | 161,772 | | | 337,776 | |
| Share-based compensation | — | | | — | | | — | | | — | | | 20,077 | | | — | | | — | | | — | | | 20,077 | |
| Distributions | — | | | — | | | — | | | — | | | — | | | — | | | — | | | (76,687) | | | (76,687) | |
| Dividends declared | — | | | — | | | — | | | — | | | — | | | (58,303) | | | — | | | — | | | (58,303) | |
| Stock option exercises and issuance of restricted stock, net | 883 | | | 9 | | | — | | | — | | | (9) | | | — | | | — | | | — | | | — | |
| Withholding tax on share-based compensation | (30) | | | — | | | — | | | — | | | (14,721) | | | — | | | — | | | — | | | (14,721) | |
| Deferred tax assets resulting from LLC Unit repurchases and TRA liability, net | — | | | — | | | — | | | — | | | 3,502 | | | — | | | — | | | — | | | 3,502 | |
| Rebalancing of ownership percentage between the Company and noncontrolling interests in Station Holdco | — | | | — | | | — | | | — | | | (1,504) | | | — | | | — | | | 1,504 | | | — | |
| Balances, December 31, 2023 | 58,866 | | | $ | 589 | | | 45,986 | | | $ | 1 | | | $ | 7,345 | | | $ | 160,904 | | | $ | — | | | $ | 75,048 | | | $ | 243,887 | |
| | | | | | | | | | | | | | | | | |
The accompanying notes are an integral part of these consolidated financial statements.
RED ROCK RESORTS, INC.
CONSOLIDATED STATEMENTS OF CASH FLOWS
(amounts in thousands)
| | Year Ended December 31, |
| 2020 | | 2019 | | 2018 |
| Year Ended December 31, | | | Year Ended December 31, |
| 2023 | | | 2023 | | 2022 | | 2021 |
| Cash flows from operating activities: | Cash flows from operating activities: | | | | | |
| Net (loss) income | $ | (174,543) | | | $ | (6,737) | | | $ | 219,480 | |
| Adjustments to reconcile net (loss) income to net cash provided by operating activities: | |
| Net income | |
| Net income | |
| Net income | |
| Adjustments to reconcile net income to net cash provided by operating activities: | |
| Depreciation and amortization | Depreciation and amortization | 231,391 | | | 222,211 | | | 180,255 | |
| Change in fair value of derivative instruments | 21,590 | | | 19,467 | | | (12,415) | |
| Reclassification of unrealized gain on derivative instruments into income | (1,351) | | | (2,843) | | | (2,929) | |
| Write-downs and other charges, net | 17,439 | | | 7,291 | | | 3,519 | |
| Tax receivable agreement liability adjustment | (15) | | | (97) | | | (90,638) | |
| Depreciation and amortization | |
| Depreciation and amortization | |
| Write-downs and other, net | |
| Asset impairment | |
| Amortization of debt discount and debt issuance costs | Amortization of debt discount and debt issuance costs | 10,472 | | | 16,421 | | | 16,149 | |
| Share-based compensation | Share-based compensation | 10,886 | | | 16,848 | | | 11,289 | |
| Earnings from joint ventures | (1,097) | | | (1,928) | | | (2,185) | |
| Distributions from joint ventures | 919 | | | 1,498 | | | 2,033 | |
| (Gain) loss on extinguishment/modification of debt, net | (240) | | | 19,939 | | | 0 | |
| Loss on extinguishment of debt | |
| Deferred income tax | Deferred income tax | 114,081 | | | (1,735) | | | 23,860 | |
| Changes in assets and liabilities: | Changes in assets and liabilities: | |
| Receivables, net | Receivables, net | 16,425 | | | (1,072) | | | (1,863) | |
| Receivables, net | |
| Receivables, net | |
| Income tax receivables, net | |
| Inventories and prepaid expenses | Inventories and prepaid expenses | 10,344 | | | (397) | | | (17,749) | |
| Accounts payable | Accounts payable | (21,411) | | | 9,686 | | | 2,677 | |
| Accrued interest payable | Accrued interest payable | 12,651 | | | 59 | | | (3,193) | |
| Other accrued liabilities | Other accrued liabilities | (35,384) | | | 16,314 | | | 13,619 | |
| Other, net | Other, net | 633 | | | 1,707 | | | 4,098 | |
| Net cash provided by operating activities | Net cash provided by operating activities | 212,790 | | | 316,632 | | | 346,007 | |
| Cash flows from investing activities: | Cash flows from investing activities: | | | | | |
| Capital expenditures, net of related payables | Capital expenditures, net of related payables | (58,496) | | | (353,269) | | | (579,287) | |
| Capital expenditures, net of related payables | |
| Capital expenditures, net of related payables | |
| Net proceeds from asset sales | |
| Acquisition of land held for development | Acquisition of land held for development | 0 | | | (57,354) | | | (36,106) | |
| Proceeds from asset sales | 580 | | | 938 | | | 4,702 | |
| Distributions in excess of earnings from joint ventures | 886 | | | 450 | | | 1,359 | |
| Native American development costs | Native American development costs | (2,284) | | | (804) | | | (702) | |
| Net settlement of derivative instruments | Net settlement of derivative instruments | (14,013) | | | 11,023 | | | 9,842 | |
| Other, net | Other, net | 3,770 | | | (6,121) | | | (6,490) | |
| Net cash used in investing activities | (69,557) | | | (405,137) | | | (606,682) | |
| Net cash (used in) provided by investing activities | |
|
| | | | | | | | | | | | | | | | | |
RED ROCK RESORTS, INC. CONSOLIDATED STATEMENTS OF CASH FLOWS (Continued) (amounts in thousands) |
| Year Ended December 31, |
| 2020 | | 2019 | | 2018 |
| Cash flows from financing activities: | | | | | |
Borrowings under credit agreements with original maturity dates greater than
three months | 1,057,500 | | | 690,000 | | | 440,000 | |
Payments under credit agreements with original maturity dates greater than
three months | (1,922,375) | | | (527,449) | | | (222,743) | |
| Proceeds from issuance of 4.50% Senior Notes | 750,000 | | | 0 | | | 0 | |
| Cash paid for early extinguishment of debt | (8,791) | | | (19,636) | | | 0 | |
| Proceeds from exercise of stock options | 397 | | | 6,707 | | | 5,381 | |
| Distributions to members and noncontrolling interests | (4,620) | | | (18,743) | | | (19,940) | |
| Dividends paid | (7,307) | | | (27,899) | | | (27,698) | |
| Payment of debt issuance costs | (14,091) | | | (3,619) | | | 0 | |
| Borrowings on other debt | 0 | | | 42,643 | | | 0 | |
| Payments on other debt | (1,075) | | | (38,167) | | | (823) | |
| Payments on tax receivable agreement liability | 0 | | | 0 | | | (28,865) | |
| Other, net | (81) | | | (675) | | | (1,123) | |
| Net cash (used in) provided by financing activities | (150,443) | | | 103,162 | | | 144,189 | |
| (Decrease) increase in cash, cash equivalents and restricted cash | (7,210) | | | 14,657 | | | (116,486) | |
| Balance, beginning of year | 132,915 | | | 118,258 | | | 234,744 | |
| Balance, end of year | $ | 125,705 | | | $ | 132,915 | | | $ | 118,258 | |
| Cash, cash equivalents and restricted cash: | | | | | |
| Cash and cash equivalents | $ | 121,176 | | | $ | 128,835 | | | $ | 114,607 | |
| Restricted cash | 4,529 | | | 4,080 | | | 3,651 | |
| Balance, end of year | $ | 125,705 | | | $ | 132,915 | | | $ | 118,258 | |
| | | | | |
| Supplemental cash flow disclosures: | | | | | |
| Cash paid for interest, net of $0, $2,777 and $8,048 capitalized, respectively | $ | 109,043 | | | $ | 143,134 | | | $ | 124,419 | |
| Income tax refunds received | $ | 0 | | | $ | 64 | | | $ | 176 | |
| Non-cash investing and financing activities: | | | | | |
| Capital expenditures incurred but not yet paid | $ | 2,931 | | | $ | 30,626 | | | $ | 112,668 | |
| | | | | | | | | | | | | | | | | |
RED ROCK RESORTS, INC. CONSOLIDATED STATEMENTS OF CASH FLOWS (Continued) (amounts in thousands) |
| Year Ended December 31, |
| 2023 | | 2022 | | 2021 |
| Cash flows from financing activities: | | | | | |
Borrowings under credit agreements with original maturity dates greater than
three months | 476,500 | | | 297,500 | | | 675,000 | |
Payments under credit agreements with original maturity dates greater than
three months | (138,779) | | | (172,779) | | | (696,278) | |
| Proceeds from issuance of Senior Notes | — | | | — | | | 500,000 | |
| Redemption of Senior Notes | — | | | — | | | (530,333) | |
| Cash paid for early extinguishment of debt | — | | | — | | | (9,754) | |
| Proceeds from exercise of stock options | — | | | — | | | 1,177 | |
| Distributions to members and noncontrolling interests | (76,687) | | | (152,449) | | | (237,160) | |
| Repurchases of Class A common stock | — | | | (141,507) | | | (500,167) | |
| Withholding tax on share-based compensation | (14,721) | | | (4,527) | | | (3,425) | |
| Exchanges of noncontrolling interest for cash | — | | | — | | | (2,822) | |
| Dividends paid | (58,590) | | | (116,675) | | | (203,834) | |
| Payment of debt issuance costs | — | | | — | | | (5,961) | |
| Payments on tax receivable agreement liability | (6,632) | | | — | | | — | |
| Other, net | (1,280) | | | 391 | | | (1,115) | |
| Net cash provided by (used in) financing activities | 179,811 | | | (290,046) | | | (1,014,672) | |
| Increase (decrease) in cash and cash equivalents | 20,297 | | | (189,966) | | | 181,550 | |
| Balance, beginning of year | 117,289 | | | 307,255 | | | 125,705 | |
| Balance, end of year | $ | 137,586 | | | $ | 117,289 | | | $ | 307,255 | |
| Cash, cash equivalents and restricted cash: | | | | | |
| Cash and cash equivalents | $ | 137,586 | | | $ | 117,289 | | | $ | 275,281 | |
| Restricted cash included in Other assets, net | — | | | — | | | 31,974 | |
| Balance, end of year | $ | 137,586 | | | $ | 117,289 | | | $ | 307,255 | |
| | | | | |
| Supplemental cash flow disclosures: | | | | | |
| Cash paid for interest, net of $29,828, $5,887 and $305 capitalized, respectively | $ | 170,506 | | | $ | 120,193 | | | $ | 97,964 | |
| Cash paid for income taxes, net of refunds received | $ | 21,100 | | | $ | 31,355 | | | $ | 4,139 | |
| Non-cash investing and financing activities: | | | | | |
| Capital expenditures incurred but not yet paid | $ | 108,037 | | | $ | 94,291 | | | $ | 15,439 | |
The accompanying notes are an integral part of these consolidated financial statements.
RED ROCK RESORTS, INC.
NOTES TO CONSOLIDATED FINANCIAL STATEMENTS
1. Organization and Background
Red Rock Resorts, Inc. (“Red Rock,” or the “Company”) was formed as a Delaware corporation in 2015 to own an indirect equity interest in and manage Station Casinos LLC (“Station LLC”), a Nevada limited liability company. Station LLC is a gaming, development and management company established in 1976 that owns and operates 10seven major gaming and entertainment facilities, including Durango Casino & Resort (“Durango”) which opened in December 2023, and 10ten smaller casino properties (3(three of which are 50% owned), in the Las Vegas regional market. Station LLC also managed a casino in northern California on behalf of a Native American tribe through February 5, 2021.
The Company owns all of the outstanding voting interests in Station LLC and has an indirect equity interest in Station LLC through its ownership of limited liability interests in Station Holdco LLC (“Station Holdco,” and such interests, “LLC Units”), which owns all of the economic interests in Station LLC. At December 31, 2020,2023, the Company held 60.7%58% of the economic interests and 100% of the voting power in Station Holdco, subject to certain limited exceptions, and is designated as the sole managing member of both Station Holdco and Station LLC. The Company controls and operates all of the business and affairs of Station Holdco and Station LLC, and conducts all of its operations through these entities.
ImpactA subsidiary of the COVID-19 Pandemic
During 2020, the global pandemic caused by a new strain of coronavirus (“COVID-19”) had a detrimental impact on the United States and Las Vegas economies and significantly negatively impacted the Company’s business. All of the Company’s Las Vegas properties were temporarily closed on March 17, 2020 in compliance with a statewide emergency order mandating the closure of Nevada casinos. On June 4, 2020, the Company reopened its Red Rock, Green Valley Ranch, Santa Fe Station Boulder Station, Palace Station and Sunset Station properties, as well as its Wildfire properties, subject to state-mandated occupancy and other operational restrictions. At December 31, 2020, the Texas Station, Fiesta Henderson, Fiesta Rancho and Palms properties have not reopened. The Company will continue to assess the performance of the reopened properties, as well as the recovery of the Las Vegas market and the economy as a whole, before considering whether to reopen some or all of the remaining properties. The Company has no plans to reopen any of these properties in 2021.
The Company has taken steps to mitigate the effects of the COVID-19 pandemic, property closures, operating restrictions and the economic downturn on its business and financial condition. The Company has reduced capital expenditures and operating expenses where possible, including staffing reductions. Based on these actions and financial assumptions regarding the impact of the COVID-19 pandemic on the Company’s operations, management believes the Company has sufficient liquidity to satisfy its obligations for the next twelve months. As a result of the pandemic, the temporary closure of all of the Company’s properties and the ongoing closure of four of its properties, the Company’s operating results for the year ended December 31, 2020 are not comparable with those of the prior years presented.
The Company’sLLC managed property, Graton Resort, locateda casino in northern California, also was temporarily closed from March 17, 2020 through June 17, 2020 ason behalf of a result of the COVID-19 pandemic. The management agreement was originally expected to expire in November 2020 but was extended as a result of the COVID-19 pandemicNative American tribe through February 5, 2021, when the tribe terminated the Company’s management role at the facility. Whether the management agreement provides for an additional extension beyond that date is in dispute.2021.
2. Basis of Presentation and Summary of Significant Accounting Policies
Principles of Consolidation
Station Holdco and Station LLC are variable interest entities (“VIEs”), of which the Company is the primary beneficiary. The Company controls and operates all of the business and affairs of Station Holdco and Station LLC and conducts all of its operations through these entities. Accordingly, the Company consolidates the financial position and results of operations of Station LLC and its consolidated subsidiaries and Station Holdco, and presents the interests in Station Holdco not owned by Red Rock within noncontrolling interest in the consolidated financial statements. Substantially all of the Company’s assets and liabilities represent the assets and liabilities of Station Holdco and Station LLC, other than assets and liabilities related to income taxes and the tax receivable agreement. Investments in all 50% or less owned affiliated companies are accounted for using the equity method. All significant intercompany accounts and transactions have been eliminated.
RED ROCK RESORTS, INC.
NOTES TO CONSOLIDATED FINANCIAL STATEMENTS (Continued)
Certain amounts in the consolidated financial statements and notes for previous years have been reclassified to be consistent with the current year presentation.Noncontrolling Interest in Station Holdco
Noncontrolling interest in Station Holdco represents the LLC Units held by certain owners who held such units prior to the Company’s 2016 initial public offering (the “IPO” and such owners, the “Continuing Owners”). Noncontrolling interest is reduced when Continuing Owners exchange their LLC Units, along with an equal number of shares of Class B common stock, for shares of Class A common stock. See Note 10 for additional information.The noncontrolling interest holders’ ownership percentage of LLC Units is increased when LLC Units held by Red Rock are repurchased by Station Holdco, typically in connection with the Company’s repurchases of its issued and outstanding shares of its Class A common stock. Entities controlled by Frank J. Fertitta III, the Company’s Chairman of the Board and Chief Executive Officer, and Lorenzo J. Fertitta, the Company’s Vice Chairman of the Board and a vice president of the Company (the “Fertitta Family Entities”), hold 99% of the noncontrolling interest.
The ownership of the LLC Units is summarized as follows:
| | December 31, 2020 | | December 31, 2019 |
| Units | | Ownership % | | Units | | Ownership % |
| December 31, 2023 | | | December 31, 2023 | | December 31, 2022 |
| Units | | | Units | | Ownership % | | Units | | Ownership % |
| Red Rock | Red Rock | 71,228,168 | | | 60.7 | % | | 70,465,422 | | | 60.1 | % | Red Rock | 63,027,745 | | | 57.8 | | 57.8 | % | | 62,113,911 | | | 57.5 | | 57.5 | % |
| Noncontrolling interest holders | Noncontrolling interest holders | 46,085,804 | | | 39.3 | % | | 46,827,370 | | | 39.9 | % | Noncontrolling interest holders | 45,985,804 | | | 42.2 | | 42.2 | % | | 45,985,804 | | | 42.5 | | 42.5 | % |
| Total | Total | 117,313,972 | | | 100.0 | % | | 117,292,792 | | | 100.0 | % | Total | 109,013,549 | | | 100.0 | | 100.0 | % | | 108,099,715 | | | 100.0 | | 100.0 | % |
The Company uses monthly weighted-average LLC Unit ownership to calculate the pretax income or loss and other comprehensive income or loss of Station Holdco attributable to Red Rock and the noncontrolling interest holders. Station Holdco equity attributable to Red Rock and the noncontrolling interest holders is rebalanced, as needed, to reflect LLC Unit
RED ROCK RESORTS, INC.
NOTES TO CONSOLIDATED FINANCIAL STATEMENTS (Continued)
ownership at period end. For the years ended December 31, 2022 and 2021, rebalancing was due primarily to Station Holdco’s repurchase of LLC Units from Red Rock in connection with the Company’s repurchases of Class A shares.
Use of Estimates
The preparation of financial statements in conformity with accounting principles generally accepted in the United States of America (“GAAP”) requires management to make estimates and assumptions that affect the reported amounts of assets and liabilities and disclosure of contingent assets and liabilities at the date of the financial statements and the reported amounts of revenues and expenses during the reporting period. Actual results could differ from those estimates.
Fair Value Measurements
For assets and liabilities accounted for or disclosed at fair value, the Company utilizes the fair value hierarchy established by the accounting guidance for fair value measurements and disclosures to categorize the inputs to valuation techniques used to measure fair value into three levels. The three levels of inputs are as follows:
Level 1: Quoted market prices in active markets for identical assets or liabilities.
Level 2: Observable market-based inputs or unobservable inputs that are corroborated by market data.
Level 3: Unobservable inputs that are not corroborated by market data.
Fair Value of Financial Instruments
The carrying values of cash and cash equivalents, receivables and accounts payable approximate fair value primarily because of the short maturities of these instruments. At December 31, 2023 and 2022, the Company had no other financial assets or liabilities measured at fair value on a recurring basis.
The accounting guidance for fair value measurements and disclosures also provides the option to measure certain financial assets and liabilities at fair value with changes in fair value recognized in earnings each period. The Company has not elected to measure any financial assets or liabilities at fair value that are not required to be measured at fair value.
Fair Value of Financial Instruments
The carrying values of cash and cash equivalents, restricted cash, receivables and accounts payable approximate fair value primarily because of the short maturities of these instruments.
Cash and Cash Equivalents
Cash and cash equivalents consist of cash on hand and investments with an original maturity of 90 days or less.
Restricted Cash
Restricted cash consists of reserve funds for the Company’s condominium operations at Palms.
Receivables, Net and Credit Risk
The Company’s accounts receivable primarily represent receivables from contracts with customers and consist mainly of casino, hotel, ATM, cash advance, retail, management fees and other receivables, which are typically non-interest bearing.
Receivables are initially recorded at cost and an allowance for doubtful accountscredit losses is maintained to reduce receivables to their carrying amount, which approximates fair value. The allowance is based on an expected loss model and is estimated based on a specific review of customer accounts, historical collection experience, the age of the receivable and other relevant factors.
RED ROCK RESORTS, INC.
NOTES TO CONSOLIDATED FINANCIAL STATEMENTS (Continued)
Accounts are written off when management deems the account to be uncollectible, and recoveries of accounts previously written off are recorded when received. At December 31, 20202023 and 2019,2022, the allowance for doubtful accountscredit losses was $8.2$6.8 million and $4.9$5.1 million, respectively. Management believes there are no significant concentrations of credit risk.risk with respect to its receivables, net.
Inventories
Inventories primarily represent food and beverage items and retail merchandise which are stated at the lower of cost or net realizable value. Cost is determined on a weighted-average basis.
Assets Held for Sale
The Company classifies assets as held for sale when management believes that the sale is probable of completion within one year and the asset or asset group meets all of the held for sale criteria in the accounting guidance for impairment and disposal of long-lived assets. Assets held for sale are initially measured at the lower of their carrying amount or fair value less cost to sell. At December 31, 2020 and 2019, assets held for sale represented certain undeveloped land in Las Vegas and Reno.
Property and Equipment
Property and equipment is initially recorded at cost. Depreciation and amortization are computed using the straight-line method over the estimated useful lives of the assets, or for leasehold improvements, the shorter of the estimated useful life of the asset or the lease term, as follows:
| | | | | |
| Buildings and improvements | 10 to 45 years |
| Furniture, fixtures and equipment | 3 to 10 years |
RED ROCK RESORTS, INC.
NOTES TO CONSOLIDATED FINANCIAL STATEMENTS (Continued)
Costs of major improvements are capitalized, while costs of normal repairs and maintenance are charged to expense as incurred. Construction in progress is related to the construction or development of property and equipment that has not yet been placed in service for its intended use. Depreciation and amortization of property and equipment commences when the asset is placed in service. When an asset is retired or otherwise disposed, the related cost and accumulated depreciation are removed from the accounts and the gain or loss on disposal is recognized within Write-downs and other, charges, net.
The Company makes estimates and assumptions when accounting for capital expenditures. The Company’s depreciation expense is highly dependent on the assumptions made for the estimated useful lives of its assets. Useful lives are estimated by the Company based on its experience with similar assets and estimates of the usage of the asset. Whenever events or circumstances occur whichthat change the estimated useful life of an asset, the Company accounts for the change prospectively.
Native American Development Costs
The Company incurs certain costs associated with development and management agreements with Native American tribes whichthat are reimbursable by such tribes. TheseThe reimbursable costs are capitalizedrecognized as long-term assets as incurred, and primarily include costsadvances associated with the acquisition of land and development of the casino facilities. The assets are typically transferred to the tribe when the tribe secures financing or thetribal gaming facility is completed. Upon transfer of the assets to the tribe, any remaining carrying amount that has not yet been recovered from the tribe is reclassified to a long-term receivable.
facility. The Company earns a returninterest on the costs incurred for the acquisition and development of Native American development projects. Repaymentreimbursable advances. The repayment of the advances and the related return typically is fundedinterest may come from the tribe’s financing, from the cash flowsproceeds of the gaming facility,facility’s third-party financing, from cash flows from the gaming facility’s operations, or both.from a combination of both, and the repayment is typically subordinated to debt service obligations under the gaming facility’s third-party financing. Due to the uncertainty surrounding the timing and amount of the stated return,repayment, the Company recognizesdoes not recognize accrued interest on the return on a cash basis.advances until the carrying amount of the advances has been recovered and the interest is received.
The Company evaluates the recoverability of its Native American development costs for impairment whenever events or changes in circumstances indicate that the carrying amount of a project might not be recoverable, taking into consideration all available information. Among other things, the Company considers the status of the project, anythe impact of contingencies, the achievement of milestones, any existing or potential litigation, and regulatory matters when evaluating the recoverability of its Native American projects for impairment. If an indicator of impairment exists, the Company compares the estimated future cash flows of the project, on an undiscounted basis, to its carrying amount. If the undiscounted expected future cash flows do not exceed the carrying amount, the asset is written down to its estimated fair value, which typically is estimated based on a discounted future cash flow model or market comparables, when available.development costs. The Company estimates the undiscounted future cash flows of a Native American development project based on consideration of all positive and negative evidence about the futureits cash flow potential of the project including, but not limited to, the likelihood that the project will be successfully completed, the status of required
RED ROCK RESORTS, INC.
NOTES TO CONSOLIDATED FINANCIAL STATEMENTS (Continued)
approvals, and the status and timing of the construction of the project, as well as current and projected economic, political, regulatory and competitive conditions that may adversely impact the project’s operating results.
At December 31, 2023 and 2022, the Company’s Native American development costs were related to development and management agreements with the North Fork Rancheria of Mono Indians. See Note 6 for additional information.
Goodwill
At December 31, 2023, the Company’s goodwill totaled $195.7 million, approximately 86.8% of which is associated with one of its properties. The Company tests its goodwill for impairment annually as of October 1, and whenever events or circumstances indicate that it is more likely than not that impairment may have occurred. Impairment testing for goodwill is performed at the reporting unit level, and each of the Company’s operating properties is considered a separate reporting unit.
When performing its goodwill impairment testing, the Company either conducts a qualitative assessment to determine whether it is more likely than not that the asset is impaired, or elects to bypass this qualitative assessment and perform a quantitative test for impairment. Under the qualitative assessment, the Company considers both positive and negative factors, including macroeconomic conditions, industry events, financial performance and other changes in facts and circumstances, and makes a determination of whether it is more likely than not that the fair value of goodwill is less than its carrying amount. If, after assessing the qualitative factors, the Company determines it is more likely than not the asset is impaired, it then performs a quantitative test in which the estimated fair value of the reporting unit is compared with its carrying amount, including goodwill. If the carrying amount of the reporting unit exceeds its estimated fair value, an impairment loss is recognized in an amount equal to the excess, limited to the amount of goodwill allocated to the reporting unit.
When performing the quantitative test, the Company estimates the fair value of each reporting unit using the expected present value of future cash flows along with value indications based on current valuation multiples of the Company and comparable publicly traded companies. The estimation of fair value involves significant judgment by management. Future cash flow estimates are, by their nature, subjective and actual results may differ materially from such estimates. Cash flow estimates are based on the current regulatory, political and economic climates, recent operating information and projections. Such estimates could be negatively impacted by changes in federal, state or local regulations, economic downturns, competition, events affecting various forms of travel and access to the Company’s properties, and other factors. If the Company’s estimates of future cash flows are not met, it may have to record impairment charges in the future.
Table of 2020, the initial economicContentseffects of the COVID-19 pandemic had a significant adverse effect on the Company’s actual and projected operating results. Management determined that thoseeffects represented indicators of potential asset impairment and performed quantitative tests as of March 31, 2020 for all of the Company’s goodwill and indefinite-lived intangible assets. No impairment losses were recognized as a result of the impairment testing. The Company also performed quantitative testing for its annual impairment test for 2020, which resulted in no impairment losses because the fair value of each of the Company’s properties with goodwill exceeded its carrying amount. The cash flow estimates used by management incorporate inherent uncertainties that are difficult to predict in the ongoing economic environment. The timing and trajectory of the expected post-pandemic economic recovery is unknown, and accordingly, management’s estimates and assumptions are likely to change as more information becomes available. Management believes that it has made reasonable estimates and judgments in performing its analysis in light of the unprecedented risks and uncertainties surrounding the COVID-19 pandemic. However, if actual results in future periods differ materially from the Company’s projected results and the related assumptions utilized in management’s analysis, the Company could be required to recognize impairment losses in future periods. RED ROCK RESORTS, INC.
NOTES TO CONSOLIDATED FINANCIAL STATEMENTS (Continued)
Indefinite-lived Intangible Assets
The Company’s indefinite-lived intangible assets primarily represent brands. The Company tests its indefinite-lived intangible assets for impairment annually as of October 1, and whenever events or circumstances indicate that it is more likely than not that an asset is impaired. If the Company determines it is more likely than not that an asset is impaired, it then performs a quantitative test by comparing the carrying amount of the asset to its estimated fair value. If the carrying amount of the asset exceeds its estimated fair value, the Company recognizes an impairment charge equal to the excess. The fair value of the Company’s brands is estimated using a derivation of the income approach to valuation based on estimated royalties avoided through ownership of the assets, utilizing market indications of fair value. The Company testsCompany’s fair value estimates are subject to change as a result of changes in its indefinite-lived intangible assets for impairment annually as of October 1, and whenever events or circumstances indicate that it is more likely than not that an asset is impaired.projected operating results. Indefinite-lived intangible assets are not amortized unless it is determined that an asset’s useful life is no longer indefinite. The Company periodically reviews its indefinite-lived assets to determine whether events and circumstances continue to support an indefinite useful life. If an indefinite-lived intangible asset no longer has an indefinite life, the asset is tested for impairment and is subsequently accounted for as a finite-lived intangible asset.
Finite-lived Intangible Assets
The Company’s finite-lived intangibles primarily include assets related to its customer relationships condominium rental contracts, certain trademarks and management contracts. The Company amortizes its finite-lived intangible assets over their estimated useful lives using the straight-line method. The Company periodically evaluates the remaining useful lives of its
RED ROCK RESORTS, INC.
NOTES TO CONSOLIDATED FINANCIAL STATEMENTS (Continued)
finite-lived intangible assets to determine whether events and circumstances warrant a revision to the remaining period of amortization.
The Company’s customer relationship intangible assets represent the value associated with its rated casino guests. The condominium rental contract intangible asset represents the value associated with agreements under which the Company provides rental and related services to condominium owners at Palms. The management contract intangible assets represent the value associated with agreements under which the Company provides, or will provide, management services to various casino properties, primarily a Native American casino project that is currently under development. The Company amortizes its management contract intangible assets over their expected useful lives beginning when the property commences operations and management fees are being earned.
Impairment of Long-lived Assets
The Company reviews the carrying amounts of its long-lived assets, other than goodwill and indefinite-lived intangible assets, for impairment whenever events or changes in circumstances indicate the carrying amount of an asset may not be recoverable. Recoverability is evaluated by comparing the estimated future cash flows of the asset, on an undiscounted basis, to its carrying amount. If the undiscounted estimated future cash flows exceed the carrying amount, no impairment is indicated. If the undiscounted estimated future cash flows do not exceed the carrying amount, impairment is measured based on the difference between the asset’s estimated fair value and its carrying amount. To estimate fair values, the Company typically uses market comparables, when available, or a discounted cash flow model. Assets to be disposed of are carried at the lower of their carrying amountmodel or fair value less costs of disposal. The fair value of assets to be disposed of is generally estimated based on comparable asset sales, solicited offers or a discounted cash flow model.market comparables. The Company’s long-lived asset impairment tests are performed at the reporting unit level.
In the first quarterThe estimation of 2020, the initial economiceffects of the COVID-19 pandemic had a significant adverse effect on the Company’s actual and projected operating results. Management determined that thoseeffects represented indicators of potential asset impairment and performed impairment assessments for the Company’s long-lived assets at all of its operating properties. No impairment losses were recognized as a result of the impairment testing. As of December 31, 2020, the Company’s Texas Station, Fiesta Henderson, Fiesta Rancho and Palms properties had not reopened, and management determined the ongoing closures to be an indicator of potential impairment at those respective reporting unit levels. Based on the undiscounted expected future cash flows noinvolves judgment by management. The Company’s estimates of future cash flows expected to be generated by an asset or asset group are based on the current regulatory, political and economic climates, recent operating information and projections. Such estimates could be negatively impacted by changes in federal, state or local regulations, economic downturns, changes in consumer preferences, or events affecting various forms of travel and access to its properties. If the Company’s estimates of future cash flows are not met, it may have to record impairment was recorded. However,charges in the Company cannot predict the future impact or duration of the negative effects of the COVID-19 pandemic and as a result, cannot reasonably predict the probability or amount of impairment losses that may be incurred in future periods. The Company will continue to assess the performance of the reopened properties, as well as the recovery of the Las Vegas market and the economy as a whole, before considering whether to reopen some or all of the four properties that have not reopened, and it has no plans to reopen any of these properties in 2021.future.
Land Held for Development
At December 31, 2020,2023, the Company owned approximately 315 acres of land comprised of 6comprising strategically-located parcels in Las Vegas and Reno, each of which is zoned for casino gaming and other uses.
Debt Discounts and Debt Issuance Costs
Debt discounts and costs incurred in connection with the issuance of long-term debt are capitalized and amortized to interest expense using the effective interest method over the expected term of the related debt agreements. Costs incurred in connection with the issuance of revolving lines of credit are presented in Other assets, net on the Consolidated Balance Sheets. All other capitalized costs incurred in connection with the issuance of long-term debt are presented as a direct reduction of Long-term debt, less current portion on the Consolidated Balance Sheets.
Derivative Instruments
The Company uses interest rate swaps to hedge its exposure to variability in expected future cash flows related to interest payments. At December 31, 2020 and 2019, none of the Company’s interest rate swaps were designated in cash flow hedging relationships. In accordance with the accounting guidance for derivatives and hedging activities, the Company records all derivatives on the balance sheet at fair value. The fair values of the Company’s derivatives are determined using widely accepted valuation techniques including discounted cash flow analysis on the expected cash flows of each derivative. This analysis reflects the contractual terms of the derivatives, including the period to maturity, and uses observable market-based inputs, including forward interest rate curves. The Company incorporates credit valuation adjustments to appropriately reflect both its own nonperformance risk and the respective counterparty’s nonperformance risk in the fair value measurements. The
RED ROCK RESORTS, INC.
NOTES TO CONSOLIDATED FINANCIAL STATEMENTS (Continued)
Company does not offset derivative asset and liability positions when interest rate swap agreements are held with the same counterparty.
As the Company’s derivative instruments are not designated in hedging relationships, the changes in fair value and related pretax gains and losses are presented in Change in fair value of derivative instruments in the Consolidated Statements of Operations in the period in which the change occurs, and the cash flows for these instruments are classified within investing activities in the Consolidated Statements of Cash Flows. Certain of the Company’s interest rate swaps were previously designated in cash flow hedging relationships until their dedesignation in June 2017. Accordingly, cumulative deferred net gains previously recognized in accumulated other comprehensive loss associated with these interest rate swaps were amortized as a reduction of interest expense through July 2020 as the previously hedged interest payments occurred.
Leases
The Company leases certain equipment, buildings, land and other assets used in its operations. The Company determines whether an arrangement is or contains a lease at inception, and determines the classification of the lease based on facts and circumstances as of the lease commencement date. For leases with an initial term greater than twelve months, the Company recognizes a right-of-use (“ROU”) asset and a lease liability at the lease commencement date. For leases with an initial term of twelve months or less, the Company has elected not to recognize ROU assets or lease liabilities. The Company measures its ROU assets and lease liabilities at the lease commencement date based on the present value of lease payments over the lease term. To calculate the present value of lease payments for leases that do not contain an implicit interest rate, the Company uses its incremental borrowing rate based on information available at the lease commencement date. For leases under which the Company has options to extend or terminate the lease, such options are included in the lease term when it is reasonably certain that the Company will exercise the option. The Company includes operating lease ROU assets within Other assets, net on its Consolidated Balance Sheets. Operating lease liabilities are included in Other accrued liabilities and Other long-term liabilities. For arrangements that contain both lease and non-lease components under which the Company is the lessee, the components are not combined for accounting purposes. The Company’s leases do not include any significant residual value guarantees, restrictions or covenants.
For operating leases with fixed rental payments or variable rental payments based on an index or rate, the Company recognizes lease expense on a straight-line basis over the lease term. For operating leases with variable payments not based on an index or rate, the Company recognizes the variable lease expense in the period in which the obligation for the payment is incurred. The Company’s variable lease payments not based on an index or rate are primarily related to short-term leases for slot machines under which lease payments are based on a percentage of the revenue earned.
The Company leases space within its properties to third-party tenants, primarily food and beverage outlets and movie theaters. The Company also leases space to tenants within commercial and industrial buildings located on certain land held for development. All of the Company’s tenant leases are classified as operating leases and do not contain options for the lessee to purchase the underlying real property. Revenue from tenant leases is included in Other revenues in the Company’s Consolidated Statements of Operations.Income.
Lease payments from tenants at the Company’s properties typically include variable rent based on a percentage of the tenant’s net sales, and may also include a fixed base rent amount, which may increase by a rate or index over time. The Company recognizes variable rental income in the period in which the right to receive such rental income is established according to the lease agreements and base rental income on a straight-line basis over the lease term. Lease payments from the Company’s tenants at commercial and industrial buildings are typically based on a fixed rental amount, which may increase by a rate or index over time. Non-lease components within tenant lease agreements, which primarily comprise utilities, property taxes and common area maintenance charges, are included within operating lease income.
Derivative Instruments
From time to time, the Company has used interest rate swaps to hedge its exposure to variability in expected future cash flows related to interest payments. At December 31, 2023 and 2022, the Company had no outstanding interest rate swaps. Through July 2021, the Company held interest rate swaps that were not designated in cash flow hedging relationships. The Company recognized the change in fair value in the Consolidated Statements of Operations in the period in which the change occurred and classified the cash flows for these instruments within investing activities in the Consolidated Statements of Cash Flows. The Company recorded all derivatives at fair value, which was determined using widely accepted valuation techniques, including discounted cash flow analyses and credit valuation adjustments, as well as observable market-based inputs such as forward interest rate curves.
Comprehensive (Loss) Income
Comprehensive (loss) income includes net (loss) income and other comprehensive loss,income, which includes all other non-owner changes in equity. Components of the Company’s comprehensive (loss) income are reported in the Consolidated Statements of Comprehensive (Loss) Income and Consolidated Statements of Stockholders’ Equity, andEquity. The Company had no accumulated other comprehensive loss is included in stockholders’ equity on the Consolidated Balance Sheets.income (loss) at December 31, 2023 or 2022.
Revenues
The Company’s revenue contracts with customers consist of gaming wagers, sales of food, beverage, hotel rooms and other amenities, and agreements to provide management services. Revenues are recognized when control of the promised goods or services is transferred to the guest, in an amount that reflects the consideration that the Company expects to be entitled to
RED ROCK RESORTS, INC.
NOTES TO CONSOLIDATED FINANCIAL STATEMENTS (Continued)
receive in exchange for those goods or services, referred to as the transaction price. Other revenues also include rental income from tenants, which is recognized over the lease term, and contingent rental income, which is recognized when the right to receive such rental income is established according to the lease agreements. Revenue is recognized net of cash sales incentives and discounts and excludes sales and other taxes collected from guests on behalf of governmental authorities.
The Company accounts for its gaming and non-gaming contracts on a portfolio basis. This practical expedient is applied because individual customer contracts have similar characteristics, and the Company reasonably expects the effects on the financial statements of applying its revenue recognition policy to the portfolio would not differ materially from applying its policy to the individual contracts.
Casino Revenue
Casino revenue includes gaming activities such as slot, table game and sports wagering. The transaction price for a gaming wagering contract is the difference between gaming wins and losses, not the total amount wagered. The transaction price is reduced for consideration payable to a guest, such as cash sales incentives and the change in progressive jackpot liabilities. Gaming contracts are typically completed daily based on the outcome of the wagering transaction and include a distinct performance obligation to provide gaming activities.
Guests may receive discretionary incentives for complimentary food, beverage, rooms, entertainment and merchandise to encourage additional gaming, or may earn loyalty points based on their slot play. The Company allocates the transaction price to each performance obligation in the gaming wagering contract. The amount allocated to loyalty points earned is based on an estimate of the standalone selling price of the loyalty points, which is determined by the redemption value less an estimate for points not expected to be redeemed. The amount allocated to discretionary complimentaries is the standalone selling price of the underlying goods or services, which is determined using the retail price at which those goods or services would be sold separately in similar transactions. The remaining amount of the transaction price is allocated to wagering activity using the residual approach as the standalone selling price for gaming wagers is highly variable and no set established price exists for gaming wagers. Amounts allocated to wagering are recognized as casino revenue when the result of the wager is determined, and amounts allocated to loyalty points and discretionary complimentaries are recognized as revenue when the goods or services are provided.
Non-gaming Revenue
Non-gaming revenue include sales of food, beverage, hotel rooms and other amenities such as retail merchandise, bowling, spa services and entertainment. The transaction price is the net amount collected from the guest and includes a distinct performance obligation to provide such goods or services. Non-gaming revenue is recognized when the goods or services are provided to the guest. Guests may also receive discretionary complimentaries that require the transaction price to be allocated to each performance obligation on a relative standalone selling price basis.
Non-gaming revenue also includes the portion of the transaction price from gaming or non-gaming contracts allocated to discretionary complimentaries and the value of loyalty points redeemed for food, beverage, room and other amenities. Discretionary complimentaries are classified in the departmental revenue category fulfilling the complimentary with a corresponding reduction in the departmental revenues that provided the complimentary, which is primarily casino revenue. Included in non-gaming revenues are discretionary complimentaries and loyalty point redemptions of $107.1$171.4 million, $228.7$157.5 million and $206.5$144.3 million for the years ended December 31, 2020, 20192023, 2022 and 2018,2021, respectively.
Management Fee Revenue
Management fee revenue primarily represents fees earned from the Company’s three 50%-owned smaller properties, as well as management agreementsfees earned from the Company’s previous management agreement with Native American tribes. Graton Resort & Casino (“Graton Resort”) which it managed on behalf of the Federated Indians of Graton Rancheria through February 5, 2021. There were no management fees from Graton Resort for the year ended December 31, 2023. For the years ended December 31, 2022 and 2021, management fees from Graton Resort totaled $2.2 million and $7.8 million, respectively.
The transaction price for management contracts is the management fee to which the Company is entitled for its management services. The management fee represents variable consideration as it is based on a percentage of net income of the managed property, as defined in the management agreements. The management services are a single performance obligation to provide a series of distinct services over the term of the management agreement. The Company allocates and recognizes the management fee monthly as the management services are performed because there is a consistent measure throughout the contract period that reflects the value to the Native American tribemanaged property each month.
The Company managed Graton Resort & Casino (“Graton Resort”) on behalf of the Federated Indians of Graton Rancheria through February 5, 2021. For the years ended December 31, 2020, 2019 and 2018, management fees from Graton Resort totaled $77.4 million, $85.6 million and $77.5 million, respectively.
RED ROCK RESORTS, INC.
NOTES TO CONSOLIDATED FINANCIAL STATEMENTS (Continued)
Player Rewards Program
The Company has a player rewards program (the “Rewards Program”) that allows customers to earn points based on their slot play. Guests may accumulate loyalty points over time that may be redeemed at their discretion under the terms of the Rewards Program. Loyalty points may be redeemed for cash, slot play, food, beverage, rooms, entertainment and merchandise at all of the Company’s Las Vegas area properties.
When guests earn points under the Rewards Program, the Company recognizes a liability for future performance obligations. The Rewards Program point liability represents deferred gaming revenue, which is measured at the redemption value of loyalty points earned under the Rewards Program that management ultimately believes will be redeemed. The recognition of the Rewards Program point liability reduces casino revenue.
When points are redeemed for cash, the point liability is reduced for the amount of cash paid out. When points are redeemed for slot play, food, beverage, rooms, entertainment and merchandise, revenues are recognized when the goods or services are provided, and such revenues are classified based on the type of goods or services provided with a corresponding reduction to the point liability.
The Company’s performance obligation related to its loyalty point liability is generally completed within one year, as a guest’s loyalty point balance is forfeited after six months of inactivity for a local guest and after thirteen months for an out-of-town guest, as defined in the Rewards Program. Loyalty points are generally earned and redeemed continually over time. As a result, the loyalty point liability balance remains relatively constant. The loyalty point liability is presented within Other accrued liabilities on the Consolidated Balance Sheets.
Slot Machine Jackpots
The Company does not accrue base jackpots if it is not legally obligated to pay the jackpot. A jackpot liability is accrued with a related reduction in casino revenue when the Company is obligated to pay the jackpot, such as the incremental amount in excess of the base jackpot on a progressive game.
Gaming Taxes
The Company is assessed taxes based on gross gaming revenue, subject to applicable jurisdictional adjustments. Gaming taxes are included in Casino costs and expenses in the Consolidated Statements of Operations.Income. Gaming tax expense was as follows (amounts in thousands):
| | | | | | | | | | | | | | | | | |
| Year Ended December 31, |
| 2020 | | 2019 | | 2018 |
| Gaming tax expense | $ | 56,253 | | | $ | 78,427 | | | $ | 74,501 | |
| | | | | | | | | | | | | | | | | |
| Year Ended December 31, |
| 2023 | | 2022 | | 2021 |
| Gaming tax expense | $ | 86,034 | | | $ | 84,544 | | | $ | 84,277 | |
Share-based Compensation
The Company measures its share-based compensation cost at the grant date based on the fair value of the award, and recognizes the cost over the requisite service period. The fair value of stock options is estimated at the grant date using the Black-Scholes option pricing model. The fair value of restricted stock is based on the closing share price of the Company’s stock on the grant date. The Company uses the straight-line method to recognize compensation cost for share-based awards with graded service-based vesting, and cumulative compensation cost recognized to date at least equals the grant-date fair value of the vested portion of the awards. Forfeitures are accounted for as they occur.
Advertising
The Company expenses advertising costs the first time the advertising takes place. Advertising expense is primarily included in selling, general and administrative expense in the Consolidated Statements of Operations.Income. Advertising expense was as follows (amounts in thousands):
| | | | | | | | | | | | | | | | | |
| Year Ended December 31, |
| 2020 | | 2019 | | 2018 |
| Advertising expense | $ | 10,205 | | | $ | 31,678 | | | $ | 24,302 | |
| | | | | | | | | | | | | | | | | |
| Year Ended December 31, |
| 2023 | | 2022 | | 2021 |
| Advertising expense | $ | 10,319 | | | $ | 11,305 | | | $ | 14,278 | |
RED ROCK RESORTS, INC.
NOTES TO CONSOLIDATED FINANCIAL STATEMENTS (Continued)
Income Taxes
Red Rock is taxed as a corporation and pays corporate federal, state and local taxes on income allocated to it by Station Holdco. Station Holdco operates as a partnership for federal, state and local tax reporting and holds 100% of the economic interests in Station LLC. The members of Station Holdco are liable for any income taxes resulting from income allocated to them by Station Holdco as a pass-through entity.
The Company recognizes deferred tax assets and liabilities based on the differences between the book value of assets and liabilities for financial reporting purposes and those amounts applicable for income tax purposes using enacted tax rates in effect for the year in which the differences are expected to reverse. The Company classifies all deferred tax assets and liabilities as noncurrent. The effect of a change in tax rates on deferred tax assets and liabilities is recognized in the period in which the enactment date occurs. Deferred tax assets represent future tax deductions or credits. Realization of the deferred tax assets ultimately depends on the existence of sufficient taxable income of the appropriate character in either the carryback or carryforward period.
Each reporting period, the Company analyzes the likelihood that its deferred tax assets will be realized. A valuation allowance is recorded if, based on the weight of all available positive and negative evidence, it is more likely than not that some portion, or all, of a deferred tax asset will not be realized. If the Company subsequently determines that there is sufficient evidence to indicate a deferred tax asset will be realized, the associated valuation allowance is reversed. On an annual basis, the Company performs a comprehensive analysis of all forms of positive and negative evidence based on year end results. During each interim reporting period, the Company updates its annual analysis for significant changes in the positive and negative evidence.
The Company records uncertain tax positions on the basis of a two-step process in which (1) the Company determines whether it is more likely than not the tax positions will be sustained on the basis of the technical merits of the position and (2) for those tax positions meeting the more likely than not recognition threshold, the Company recognizes the largest amount of tax benefit that is more than 50% likely to be realized upon ultimate settlement with the related tax authority. The Company does not believe that it has any tax positions for which it is reasonably possible that it will be required to record a significant liability for unrecognized tax benefits within the next twelve months.
TheAs applicable, the Company will recognizerecords interest and penalties related to income taxes if any, withinthrough the provision for income taxes. The Company has incurred no interest or penalties related to income taxes in any of the periods presented.
Tax Receivable Agreement
In connection with the IPO, the Company entered into a tax receivable agreement (“TRA”) with certain pre-IPO owners of Station Holdco. In the event that such parties exchange any or all of their LLC Units for Class A common stock, the TRA requires the Company to make payments to such parties for 85% of the tax benefits realized by the Company by such exchange. The annual tax benefits are computed by calculating the income taxes due, including such tax benefits, and the income taxes due without such benefits. When an exchange transaction occurs, the Company initially recognizes the related TRA liability through a charge to equity, and any subsequent adjustments to the liability are recorded through the statementsConsolidated Statements of operations.Income.
As a result of exchanges of LLC Units for Class A common stock and purchases by the Company of LLC Units from holders of such units, the Company is entitled to a proportionate share of the existing tax basis of the assets of Station Holdco at the time of such exchanges or purchases. In addition, such exchanges or purchases of LLC Units are expected to result in increases in the tax basis of the assets of Station Holdco that otherwise would not have been available. These increases in tax basis may reduce the amount of tax that the Company would otherwise be required to pay in the future. These increases in tax basis may also decrease gains (or increase losses) on future dispositions of certain capital assets to the extent tax basis is allocated to those capital assets.
The timing and amount of aggregate payments due under the TRA may vary based on a number of factors, including the amount and timing of the taxable income the Company generates each year, the tax rate then applicable and amortizable basis. If the Company does not generate sufficient taxable income in the aggregate over the term of the TRA to utilize the tax benefits, it would not be required to make the related TRA payments. The Company will only recognize a liability for TRA payments if management determines it is probable that it will generate sufficient future taxable income over the term of the TRA to utilize the related tax benefits. If management determines in the future that the Company will not be able to fully utilize all or part of the related tax benefits, it would derecognize the portion of the liability related to the benefits not expected to be utilized. Estimating future taxable income is inherently uncertain and requires judgment. In projecting future taxable income, the Company considers its historical results and incorporates certain assumptions, including revenue growth and operating margins, among others.
RED ROCK RESORTS, INC.
NOTES TO CONSOLIDATED FINANCIAL STATEMENTS (Continued)
the Company considers its historical results and incorporates certain assumptions, including revenue growth and operating margins, among others.
The payment obligations under the TRA are Red Rock’s obligations and are not obligations of Station Holdco or Station LLC. Payments are generally due within a specified period of time following the filing of the Company’s annual tax return and interest on such payments will accrue from the original due date (without extensions) of the income tax return until the date paid. Payments not made within the required period after the filing of the income tax return generally accrue interest at a rate of LIBOR plus 5.00%.interest.
The TRA will remain in effect until all such tax benefits have been utilized or expired unless the Company exercises its right to terminate the TRA. The TRA will also terminate if the Company breaches its obligations under the TRA or upon certain mergers, asset sales or other forms of business combinations, or other changes of control. If the Company exercises its right to terminate the TRA, or if the TRA is terminated early in accordance with its terms, the Company’s payment obligations would be accelerated based upon certain assumptions, including the assumption that it would have sufficient future taxable income to utilize such tax benefits, and may substantially exceed the actual benefits, if any, the Company realizes in respect of the tax attributes subject to the TRA.
Additionally, the Company estimates the amount of TRA payments expected to be paid within the next twelve months and classifies this amount within current liabilities on its Consolidated Balance Sheets. This determination is based on management’s estimate of taxable income for the next fiscal year. To the extent the Company’s estimate differs from actual results, it may be required to reclassify portions of the liability under the TRA between current and non-current.
Earnings Per Share
Basic earnings per share (“EPS”) is computed by dividing net income attributable to Red Rock by the weighted-average number of Class A shares outstanding during the period. Diluted EPS is computed by dividing net income attributable to Red Rock, including the impact of potentially dilutive securities, by the weighted-average number of Class A shares outstanding during the period, including the number of Class A shares that would have been outstanding if the potentially dilutive securities had been issued. Potentially dilutive securities include the outstanding Class B common stock, outstanding stock options and unvested restricted stock. The Company uses the “if-converted” method to determine the potentially dilutive effect of its Class B common stock, and the treasury stock method to determine the potentially dilutive effect of outstanding stock options and unvested restricted stock.
RED ROCK RESORTS, INC.
NOTES TO CONSOLIDATED FINANCIAL STATEMENTS (Continued)
Recently Issued and Adopted Accounting Standards
In March 2020 and December 2022, the Financial Accounting Standards Board (“FASB”) issued temporary accounting guidanceAccounting Standards Update (“ASU”) 2020-04, Reference Rate Reform (Topic 848) and ASU 2022-06, Reference Rate Reform (Topic 848), Deferral of the Sunset Date of Topic 848, respectively. The ASUs were intended to ease the potential accounting effectsand financial reporting burden of reference rate reform, toincluding the expected market transition from London Interbank Offered Rate (“LIBOR”) and other reference rates. The guidance contains. ASU 2020-04 provides an optional expedientsexpedient and exceptions that applyfor applying GAAP to accounting for contract modifications,contracts, hedging relationships, and other transactions affected by reference rate reform. The guidance is effective for all entities asreform if certain criteria are met. ASU 2022-06 extended the sunset date of March 12, 2020 throughTopic 848 to December 31, 2022 and may be applied2024 from December 31, 2022. The interest rates associated with the beginning of an interim period or prospectively from a date within an interim period that includes or is subsequentCompany’s previous borrowings under its Credit Facility (as defined in Note 8) were tied to March 12, 2020.LIBOR. The Company adopted this guidance beginning inASU 2020-04 upon the first quarteramendment of 2020its Credit Facility on June 6, 2023, and effective July 1, 2023, the LIBOR rate was replaced with the Term Secured Overnight Financing Rate (“Term SOFR”) (see Note 8). The Company elected to continueapply the optional expedient for contract modifications to assert probability of its hedging relationships regardless of any potential modifications in terms due to referencethe Credit Facility amendment and accordingly, treated the interest rate reform.replacement as a non-substantial modification. The adoption did not have an impact on the Company’s financial position or results of operations.
In June 2016, the FASB issued amended accounting guidance for measurement of credit losses on financial instruments. The amended accounting guidance replaces the incurred loss impairment model with a forward-looking expected loss model, and is applicable to most financial assets, including trade receivables other than those arising from operating leases. The Company adopted this guidance on January 1, 2020 using a modified retrospective transition method. The adoptionASU 2020-04 did not have a material impact on the Company’s financial positioncondition or results of operations.
Recently Issued Accounting Standards Not Yet Adopted
In December 2019,November 2023, the FASB issued amended accounting guidanceASU 2023-07, Segment Reporting (Topic 280). The ASU is intended to simplify the accounting for income taxes. The amendment eliminates certain exceptions relatedimprove disclosures of significant segment expenses by requiring disclosure of significant segment expenses regularly provided to the approach for intraperiod tax allocation, the methodology for calculating income taxes in anchief operating decision maker (“CODM”), requiring disclosure of other segment items by reportable segment, extend certain annual disclosures to interim periodperiods, permit more than one measure of segment profit or loss to be reported under certain conditions and the recognition of deferred tax liabilities for outside basis differences. The amendment also simplifies other aspectsrequiring disclosure of the accountingCODM’s title and position and how the CODM uses reported measure(s) in assessing segment performance. The amendments are effective for income taxes. The amended guidance is effective forthe Company in fiscal years beginning after December 15, 20202023, and interim periods within thosefiscal years beginning after December 15, 2024 and earlyare required to be applied retrospectively to all periods presented. Early adoption is permitted. The Company will adopt this guidancepermitted, including adoption in the first quarter of 2021.any interim periods for which financial statements have not been issued. The Company is currently evaluating the guidance and its impact to the financial statements.
In December 2023, the FASB issued ASU 2023-09, Income Taxes (Topic 740). The ASU is intended to provide more transparency of income tax information through improvements to income tax disclosures, primarily rate reconciliation and income taxes paid. For public entities, the amendments in this guidanceUpdate are effective for annual periods beginning after December 15, 2024. Amendments should be applied on a prospective basis. The Company does not anticipate that this ASU will have a material impact on its financial positionstatements.
3. Property and resultsEquipment
Property and equipment consisted of operations.the following (amounts in thousands):
| | | | | | | | | | | |
| December 31, |
| 2023 | | 2022 |
| Land | $ | 203,317 | | | $ | 203,256 | |
| Buildings and improvements | 2,956,328 | | | 2,182,922 | |
| Furniture, fixtures and equipment | 827,307 | | | 598,667 | |
| Construction in progress | 73,336 | | | 379,156 | |
| 4,060,288 | | | 3,364,001 | |
| Accumulated depreciation | (1,288,470) | | | (1,168,984) | |
| Property and equipment, net | $ | 2,771,818 | | | $ | 2,195,017 | |
Depreciation expense was as follows (amounts in thousands):
| | | | | | | | | | | | | | | | | |
| Year Ended December 31, |
| 2023 | | 2022 | | 2021 |
| Depreciation expense | $ | 130,957 | | | $ | 126,766 | | | $ | 155,966 | |
At December 31, 2023 and 2022, substantially all of the Company’s property and equipment was pledged as collateral for its long-term debt.
RED ROCK RESORTS, INC.
NOTES TO CONSOLIDATED FINANCIAL STATEMENTS (Continued)
3. Property and Equipment
Property and equipment consisted of the following (amounts in thousands):
| | | | | | | | | | | |
| December 31, |
| 2020 | | 2019 |
| Land | $ | 271,603 | | | $ | 271,603 | |
| Buildings and improvements | 3,001,283 | | | 2,990,259 | |
| Furniture, fixtures and equipment | 800,257 | | | 801,868 | |
| Construction in progress | 8,911 | | | 28,120 | |
| 4,082,054 | | | 4,091,850 | |
| Accumulated depreciation | (1,224,081) | | | (1,030,088) | |
| Property and equipment, net | $ | 2,857,973 | | | $ | 3,061,762 | |
Depreciation expense was as follows (amounts in thousands):
| | | | | | | | | | | | | | | | | |
| Year Ended December 31, |
| 2020 | | 2019 | | 2018 |
| Depreciation expense | $ | 223,846 | | | $ | 213,642 | | | $ | 169,656 | |
At December 31, 2020 and 2019, substantially all of the Company’s property and equipment was pledged as collateral for its long-term debt.
4. Goodwill and Other Intangibles
Goodwill, net of accumulated impairment losses of $1.2 million, was $195.7 million at December 31, 20202023 and 2019.2022. The Company’s goodwill is primarily related to the Las Vegas operations segment.
The Company’s intangibles, other than goodwill, consisted of the following (amounts in thousands):
| | December 31, 2020 |
| Estimated useful life (years) | | Gross Carrying Amount | | Accumulated Amortization | | Net Carrying Amount |
| December 31, 2023 | | | December 31, 2023 |
| Estimated useful life (years) | | | Estimated useful life (years) | | Gross Carrying Amount | | Accumulated Amortization | | Net Carrying Amount |
| Assets | Assets | | | | | | | |
| Brands | |
| Brands | |
| Brands | Brands | Indefinite | | $ | 77,200 | | | $ | — | | | $ | 77,200 | |
| License rights | License rights | Indefinite | | 300 | | | — | | | 300 | |
| Customer relationships | Customer relationships | 15 | | 23,600 | | | (14,726) | | | 8,874 | |
| Management contracts | Management contracts | 7 - 20 | | 4,000 | | | (1,004) | | | 2,996 | |
| Condominium rental contracts | 20 | | 9,000 | | | (1,913) | | | 7,087 | |
| Trademarks | 15 | | 6,000 | | | (1,700) | | | 4,300 | |
| Beneficial leases | 6 | | 237 | | | (177) | | | 60 | |
| Intangible assets | Intangible assets | | 120,337 | | | (19,520) | | | 100,817 | |
| Liabilities | |
| Below market lease | 15 | | 2,195 | | | (615) | | | 1,580 | |
| Net intangibles | | $ | 118,142 | | | $ | (18,905) | | | $ | 99,237 | |
| | | | | | | | | | | | | | | | | | | | | | | |
| December 31, 2022 |
| Estimated useful life (years) | | Gross Carrying Amount | | Accumulated Amortization | | Net Carrying Amount |
| Assets | | | | | | | |
| Brands | Indefinite | | $ | 76,200 | | | $ | — | | | $ | 76,200 | |
| License rights | Indefinite | | 300 | | | — | | | 300 | |
| Customer relationships | 15 | | 22,100 | | | (17,000) | | | 5,100 | |
| Management contracts | 7 - 20 | | 4,000 | | | (1,215) | | | 2,785 | |
| Intangible assets | | | $ | 102,600 | | | $ | (18,215) | | | $ | 84,385 | |
Amortization expense for intangibles was as follows (amounts in thousands):
| | | | | | | | | | | | | | | | | |
| Year Ended December 31, |
| 2023 | | 2022 | | 2021 |
| Amortization expense | $ | 1,579 | | | $ | 1,602 | | | $ | 1,825 | |
Estimated annual amortization expense for intangibles for each of the next five years is as follows (amounts in thousands):
| | | | | | | | |
| Years Ending December 31, | | |
| 2024 | | $ | 1,579 | |
| 2025 | | 1,579 | |
| 2026 | | 785 | |
| 2027 | | 105 | |
| 2028 | | 105 | |
5. Asset Impairment
The Company reviews the carrying amounts of its long-lived assets, other than goodwill and indefinite-lived intangible assets, for impairment whenever events or changes in circumstances indicate the carrying amount of an asset may not be recoverable. The Company’s long-lived asset impairment tests are performed at the reporting unit level, and each of its operating properties is considered a separate reporting unit.
RED ROCK RESORTS, INC.
NOTES TO CONSOLIDATED FINANCIAL STATEMENTS (Continued)
| | | | | | | | | | | | | | | | | | | | | | | |
| December 31, 2019 |
| Estimated useful life (years) | | Gross Carrying Amount | | Accumulated Amortization | | Net Carrying Amount |
| Assets | | | | | | | |
| Brands | Indefinite | | $ | 77,200 | | | $ | — | | | $ | 77,200 | |
| License rights | Indefinite | | 300 | | | — | | | 300 | |
| Customer relationships | 15 | | 23,600 | | | (13,152) | | | 10,448 | |
| Management contracts | 7 - 20 | | 47,000 | | | (38,780) | | | 8,220 | |
| Condominium rental contracts | 20 | | 9,000 | | | (1,463) | | | 7,537 | |
| Trademarks | 15 | | 6,000 | | | (1,300) | | | 4,700 | |
| Beneficial leases | 6 | | 237 | | | (136) | | | 101 | |
| | | | | | | |
| Intangible assets | | | 163,337 | | | (54,831) | | | 108,506 | |
| Liabilities | | | | | | | |
| Below market leases | 15 | | 2,195 | | | (470) | | | 1,725 | |
| Net intangibles | | | $ | 161,142 | | | $ | (54,361) | | | $ | 106,781 | |
Amortization expense for intangiblesIn June 2022, the Company permanently closed its Texas Station, Fiesta Henderson and Fiesta Rancho properties, which had been closed since March 2020 as a result of the COVID-19 pandemic. The decision to permanently close these properties was as follows (amounts in thousands):
| | | | | | | | | | | | | | | | | |
| Year Ended December 31, |
| 2020 | | 2019 | | 2018 |
| Amortization expense | $ | 7,545 | | | $ | 8,569 | | | $ | 10,599 | |
Estimated annual amortization expense for intangibles foran indicator of impairment. The Company tested each of these reporting units for impairment as of June 30, 2022 and recorded asset impairment charges totaling $79.0 million, primarily representing the next five yearswrite-off of the facilities that were being demolished in whole or in part. The recoverability of the carrying amounts of the remaining assets, primarily land, was evaluated based on market prices for similar assets, which are considered Level 2 inputs under the fair value measurement hierarchy. The Company also recognized an asset impairment charge of $1.0 million as a result of the permanent closure of its Wild Wild West property in September 2022. In December 2022, the Company sold the Fiesta Henderson parcel to a third-party buyer for aggregate consideration of $32.0 million. The transaction resulted in a gain on sale of $17.7 million. In November 2023, the Company sold the Texas Station and Fiesta Rancho parcels to a third-party buyer for aggregate consideration of $58.4 million. The transaction resulted in a net gain on sale of $37.9 million, which is as follows (amountsincluded in thousands):write-downs and other, net. There were no asset impairment charges for the year ended December 31, 2023.
| | | | | | | | |
| Years Ending December 31, | | |
| 2021 | | $ | 2,426 | |
| 2022 | | 2,401 | |
| 2023 | | 2,384 | |
| 2024 | | 2,384 | |
| 2025 | | 2,384 | |
5.6. Native American Development
The Company, has development and management agreements with the North Fork Rancheria of Mono Indians (the “Mono”), a federally recognized Native American tribe located near Fresno, California which were originallyand the North Fork Rancheria Economic Development Authority (the “Authority”) have entered into in 2003. In August 2014, the Monoa Third Amended and the Company entered into the SecondRestated Management Agreement (the “Management Agreement”) and a Third Amended and Restated Development Agreement (the “Development Agreement”) and the Second Amended and Restated Management Agreement., each dated as of November 7, 2023. Pursuant to those agreements,the Development Agreement, the Company has assisted and will assist the Mono and the Authority in developing and operating a gaming and entertainment facility (the “North Fork Project”) to be located in Madera County, California. Pursuant to the Management Agreement, the Company will assist the Mono and the Authority in operating the North Fork Project. The Company purchased a 305-acre parcel of land adjacent to Highway 99 north of the city of Madera (the “North Fork Site”), which was taken into trust for the benefit of the Mono by the Department of the Interior (“DOI”) in February 2013.
As currently contemplated, the North Fork Project is expected to include approximately 2,000 Class III slot machines and additional Class II slot machines, approximately 40 table games and several restaurants, and futurerestaurants. Future development costs of the project are expected to be between $300$375 million and $350$425 million. DevelopmentThe following table summarizes the Company’s evaluation at December 31, 2023 of each of the critical milestones that it has identified as necessary to complete the North Fork Project is subject to certain governmental and regulatory approvals, including, without limitation,Project. As of January 5, 2024, the date the Mono received the approval of the Management Agreement byfrom the ChairmanChair of the National Indian Gaming Commission (“NIGC”)., each of these critical milestones has substantially been resolved.
RED ROCK RESORTS, INC.
NOTES TO CONSOLIDATED FINANCIAL STATEMENTS (Continued)
Under the terms of the Development Agreement, the Company has agreed to arrange the financing for the ongoing development costs and construction of the facility, and has contributed significant financial support to the North Fork Project. Through December 31, 2020, the Company has paid approximately $37.2 million of reimbursable advances to the Mono, primarily to complete the environmental impact study, purchase the North Fork Site and pay the costs of litigation. The advances are expected to be repaid from the proceeds of the project’s financing or from the Mono’s cash flows from the North Fork Project’s operations; however, there can be no assurance that the advances will be repaid. The carrying amount of the advances was reduced to fair value upon the Company’s adoption of fresh-start reporting in 2011. At December 31, 2020, the carrying amount of the advances was $22.1 million. In accordance with the Company’s accounting policy, accrued interest on the advances will not be recognized in income until the carrying amount of the advances has been recovered.
The Company will receive a development fee of 4% of the costs of construction (as defined in the Development Agreement) for its development services, which will be paid upon the commencement of gaming operations at the facility. In March 2018, the Mono submitted a proposed Third Amended and Restated Management Agreement (the “Management Agreement”) to the NIGC. The Management Agreement allows the Company to receive a management fee of 30% of the North Fork Project’s net income. The Management Agreement and the Development Agreement have a term of seven years from the opening of the North Fork Project. The Management Agreement includes termination provisions whereby either party may terminate the agreement for cause, and the Management Agreement may also be terminated at any time upon agreement of the parties. There is no provision in the Management Agreement allowing the tribe to buy-out the agreement prior to its expiration. The Management Agreement provides that the Company will train the Mono tribal members such that they may assume responsibility for managing the North Fork Project upon the expiration of the agreement.
Upon termination or expiration of the Management Agreement and Development Agreement, the Mono will continue to be obligated to repay any unpaid principal and interest on the advances from the Company, as well as certain other amounts that may be due, such as management fees. Amounts due to the Company under the Development Agreement and Management Agreement are secured by substantially all of the assets of the North Fork Project except the North Fork Site. In addition, the Development Agreement and Management Agreement contain waivers of the Mono’s sovereign immunity from suit for the purpose of enforcing the agreements or permitting or compelling arbitration and other remedies.
The timing of this type of project is difficult to predict and is dependent upon the receipt of the necessary governmental and regulatory approvals. There can be no assurance as to when, or if, these approvals will be obtained. The Company currently estimates that construction of the North Fork Project may begin in the next three to six months and estimates that the North Fork Project would be completed and opened for business approximately 18 months after construction begins. There can be no assurance, however, that the North Fork Project will be completed and opened within this time frame or at all. The Company expects to assist the Mono in obtaining financing for the North Fork Project once all necessary regulatory approvals have been received and prior to commencement of construction; however, there can be no assurance that the Company will be able to obtain such financing for the North Fork Project on acceptable terms or at all.
The Company has evaluated the likelihood that the North Fork Project will be successfully completed and opened, and has concluded that the likelihood of successful completion is in the range of 75% to 85% at December 31, 2020. The Company’s evaluation is based on its consideration of all available positive and negative evidence about the status of the North Fork Project, including, but not limited to, the status of required regulatory approvals, as well as the progress being made toward the achievement of all milestones and the successful resolution of all litigation and contingencies. There can be no assurance that the North Fork Project will be successfully completed or that future events and circumstances will not change the Company’s estimates of the timing, scope, and potential for successful completion or that any such changes will not be material. In addition, there can be no assurance that the Company will recover all of its investment in the North Fork Project even if it is successfully completed and opened for business.
RED ROCK RESORTS, INC.
NOTES TO CONSOLIDATED FINANCIAL STATEMENTS (Continued)
The following table summarizes the Company’s evaluation at December 31, 20202023 (or, in the case of approval of the Management Agreement, at January 5, 2024) of each of the critical milestones necessary to complete the North Fork Project.
| | | | | |
| Federally recognized as an Indian tribe by the Bureau of Indian Affairs (“BIA”) | Yes |
| Date of recognition | Federal recognition was terminated in 1966 and restored in 1983. |
| Tribe has possession of or access to usable land upon which the project is to be built | The DOI accepted approximately 305 acres of land for the project into trust for the benefit of the Mono in February 2013.
|
| Status of obtaining regulatory and governmental approvals: | |
| Tribal-state compact | A compact was negotiated and signed by the Governor of California and the Mono in August 2012. The California State Assembly and Senate passed Assembly Bill 277 (“AB 277”) which ratified the Compact in May 2013 and June 2013, respectively. Opponents of the North Fork Project qualified a referendum, “Proposition 48,” for a state-wide ballot challenging the legislature’s ratification of the Compact. In November 2014, Proposition 48 failed. The State took the position that the failure of Proposition 48 nullified the ratification of the Compact and, therefore, the Compact did not take effect under California law. In March 2015, the Mono filed suit against the State to obtain a compact with the State or procedures from the Secretary of the Interior under which Class III gaming may be conducted on the North Fork Site. In July 2016, the DOI issued Secretarial procedures (the “Secretarial Procedures”) pursuant to which the Mono may conduct Class III gaming on the North Fork Site. |
| Approval of gaming compact by DOI | The Compact was submitted to the DOI in July 2013. In October 2013, notice of the Compact taking effect was published in the Federal Register. The Secretarial Procedures supersede and replace the Compact. |
| Record of decision regarding environmental impact published by BIA | In November 2012, the record of decision for the Environmental Impact Statement for the North Fork Project was issued by the BIA. In December 2012, the Notice of Intent to take land into trust was published in the Federal Register. |
| BIA accepting usable land into trust on behalf of the tribe | The North Fork Site was accepted into trust in February 2013. |
| Approval of management agreement by NIGC | In December 2015, the Mono submitted a Second Amended and Restated Management Agreement, and certain related documents, to the NIGC. In July 2016, the Mono received a deficiency letter from the NIGC seeking additional information concerning the Second Amended and Restated Management Agreement. In March 2018, the Mono submitted the Management Agreement and certain related documents to the NIGC. In June 2018, the Mono received a deficiency letter from the NIGC seeking additional information concerning the Management Agreement. ApprovalIn April 2021, the Mono received an issues letter from the NIGC identifying issues to be addressed prior to approval of the Management Agreement byAgreement. In September 2022, the Mono received an additional issues letter from the NIGC is expectedidentifying remaining issues to occur followingbe addressed prior to approval of the Mono’s responseManagement Agreement. Following dialogue with the NIGC, the Mono submitted executed North Fork Project agreements to the deficiency letter. The Company believesNIGC in November, 2023. On January 5, 2024, the Chairman of the NIGC approved the Management Agreement will be approved because the terms and conditions thereof are consistent with the provisions of the Indian Gaming Regulatory Act (“IGRA”).Agreement. |
| Gaming licenses: | |
| Type | The North Fork Project will include the operation of Class II and Class III gaming, which are allowed pursuant to the terms of the Secretarial Procedures and IGRA,the provisions of the Indian Gaming Regulatory Act (“IGRA”), following approval of the Management Agreement by the NIGC. |
| Number of gaming devices allowed | The Secretarial Procedures allow for the operation of a maximum of 2,000 Class III slot machines at the facility during the first two years of operation and thereafter up to 2,500 Class III slot machines. There is no limit on the number of Class II gaming devices that the Mono can offer. |
| Agreements with local authorities | The Mono has entered into memoranda of understanding with the City of Madera, the County of Madera and the Madera Irrigation District under which the Mono agreed to pay one-time and recurring mitigation contributions, subject to certain contingencies. The memoranda of understanding have all been amended to restructure the timing of certain payments due to delays in the development of the North Fork Project. |
RED ROCK RESORTS, INC.
NOTES TO CONSOLIDATED FINANCIAL STATEMENTS (Continued)
FollowingIn addition to the critical milestones, there is a discussion of certainremaining unresolved legal mattersmatter related to the North Fork Project.
Stand Up For California! v. Brown. In March 2013, Stand Up for California! and Barbara Leach, a local resident (collectively, the “Stand Up” plaintiffs), filed a complaint for declaratory relief and petition for writ of mandate in California Superior Court for the County of Madera against California Governor Edmund G. Brown, Jr., alleging that Governor Brown violated the California constitutional separation-of-powers doctrine when he concurred in the Secretary of the Interior’s determination that gaming on the North Fork Site would be in the best interest of the Mono and not detrimental to the surrounding community (the “North Fork Determination”). The complaint sought to vacate and set aside the Governor’s concurrence. Plaintiffs’ complaint was subsequently amended to include a challenge to the constitutionality of AB 277. The Mono intervened as a defendant in the lawsuit. In March 2014, the court dismissed plaintiffs’ amended complaint, which dismissal was appealed by plaintiffs. In December 2016, the California Court of Appeal, Fifth Appellate District (the “Fifth District Court of Appeal”) ruled in favor of the Stand Up plaintiffs concluding that Governor Brown exceeded his authority in concurring in the North Fork Determination. The Mono and the State filed petitions in the Supreme Court of California seeking review of the Fifth District Court of Appeal’s decision, which petitions for review were granted in March 2017. The Supreme Court of California deferred additional briefing or other action in this matter pending consideration and disposition of a similar issue in United Auburn Indian Community of Auburn Rancheria v. Brown. On August 31, 2020, the Supreme Court of California announced its decision in the United Auburn case, concluding that Governor Brown’s concurrence in that case did not exceed his authority. On October 14, 2020, the Supreme Court of California transferred the Stand Up case back to the Fifth District Court of Appeal with directions to vacate its December 2016 decision against the Mono and the State and to reconsider the matter in light of the United Auburn decision. The Fifth District Court of Appeal permitted supplemental briefing in connection with its reconsideration of the matter, which briefing was completed on February 10, 2021.
Picayune Rancheria of Chukchansi Indians v. Brown. In March 2016, Picayune Rancheria of Chukchansi Indians (“Picayune”) filed a complaint for declaratory relief and petition for writ of mandate in California Superior Court for the County of Madera against Governor Edmund G. Brown, Jr., alleging that the referendum that invalidated the Compact also invalidated Governor Brown’s concurrence with the Secretary of the Interior’s determination that gaming on the North Fork Determination.Site would be in the best interest of the Mono and not detrimental to the surrounding community. The complaint seeks to vacate and set aside the Governor’s concurrence. In Julyconcurrence and was stayed from December 2016 to September 2021, when the court grantedSupreme Court of California denied the Mono’s application to intervene and the Mono filed a demurrer seeking to dismiss the case. In November 2016, the district court dismissed Picayune’s complaint, but the court subsequently vacated its ruling based on the December 2016 decision by the Fifth District CourtState of AppealCalifornia’s petition for review in Stand Up for California! v. Brown. The case has been stayed since 2017 pending a decision by the California Supreme Court in Stand Up for California! v. Brown.
Stand Up for California! et. al. v. United States Department As a result of the Interior. In November 2016, Stand Up for California!denial, litigation of this matter has resumed and other plaintiffsa first amended complaint was filed a complaintby Picayune in December 2022. Each of the United States District Court for the Eastern DistrictState of California (the “District Court”) alleging that the DOI’s issuance of Secretarial Procedures forand the Mono filed demurrers challenging the first amended complaint; in July 2023, the State of California’s demurrer was subject to the National Environmental Policies Act (“NEPA”)granted and the Clean Air Act (the “CAA”),Mono’s demurrer was denied. The Mono has answered the first amended complaint and violate the Johnson Act. The complaint further alleges violations of the Freedom of Information Act and the Administrative Procedures Act. The DOI filed its answer to the complaint in February 2017 denying plaintiffs’ claims and asserting certain affirmative defenses. A motion to intervene filed by the Mono was granted in March 2017. Plaintiffs subsequently filed a motion to stay the proceedings in May 2017. Briefing on the contested stay request concluded in July 2017 and briefing on cross-motions for summary judgment was concluded in September 2017. On July 18, 2018, the court denied plaintiffs’ motion to stay the proceedings and granted the summary judgment motionseach of the Mono and Picayune have filed motions for summary judgment, which motions are fully briefed.
Under the federal defendants. On September 11, 2018, plaintiffs filed a notice of appealterms of the District Court decisionDevelopment Agreement, the Company has agreed to arrange the financing for the ongoing development costs and construction of the facility, and has contributed significant financial support to the North Fork Project. Through December 31, 2023, the Company has paid approximately $61.0 million of reimbursable advances to the Mono, primarily to complete the environmental impact study, purchase the North Fork Site and pay the costs of litigation. The repayment of the advances is expected to come from the proceeds of the North Fork Project’s financing, from cash flows from the North Fork Project’s operations, or from a combination of both. In accordance with the United States CourtCompany’s accounting policy, accrued interest on the advances will not be recognized in income until the carrying amount of Appealsthe advances has been recovered. The carrying amount of the reimbursable advances was reduced by $15.1 million to fair value upon the Company’s adoption of fresh-start reporting in 2011. At December 31, 2023, the carrying amount of the advances was $45.9 million.
In addition to the reimbursable advances, the Company expects to receive a development fee of 4% of the costs of construction for its development services, which will be paid upon the commencement of gaming operations at the facility. The proposed management agreement provides for the Ninth Circuit. The briefingCompany to receive a management fee of 30% of the issues on appeal was completed on June 13, 2019.North Fork Project’s net income. The Ninth Circuit heard oral argument on February 11, 2020 and in May 2020 renderedrepayment of all or a decision affirming the grant of summary judgment on the Johnson Act issues and reversing and remanding for further proceedings the portion of the summary judgment decision relatingreimbursable advances is anticipated to NEPAbe subordinated to the Mono’s debt service obligations under the North Fork Project’s financing. The Management Agreement has a term of seven years from the opening of the North Fork Project. The Management Agreement includes termination provisions whereby either party may terminate the agreement for cause, and may also be terminated at any time upon agreement of the parties. There is no provision in the Management Agreement allowing the tribe to buy-out the agreement prior to its expiration. The Management Agreement provides that the Company will train the Mono tribal members such that they may assume responsibility for managing the North Fork Project upon the expiration of the agreement.
The Company expects that upon termination or expiration of the Development Agreement, the Mono will continue to be obligated to repay any unpaid principal and interest on the advances from the Company. Amounts due to the Company under the Development Agreement and Management Agreement are secured by substantially all of the assets of the North Fork Project except the North Fork Site. In addition, each of the Development Agreement and the CAA. Management Agreement contains waivers of the Mono’s sovereign immunity from suit for the purpose of enforcing the agreements or permitting or compelling arbitration and other remedies.
The briefingtiming of both the North Fork Project and of the repayment of the reimbursable advances is difficult to predict and is contingent on the portionachievement of the case that was reversed and remanded was completed in January 2021 and a decisioncritical milestones, the financing of the District CourtNorth Fork Project, and the cash flows from the North Fork Project. The Company currently estimates that construction of the North Fork Project may begin in the next six months and estimates that the North Fork Project would be completed and opened for business approximately 15 to 18 months after construction begins. The Company expects to assist the Mono in obtaining financing for the North Fork Project once all necessary critical milestones have been achieved and prior to commencement of construction.
The Company has evaluated the likelihood that the North Fork Project will be successfully completed and opened, and has concluded that the likelihood of successful completion is pending.in the range of 75% to 85% at December 31, 2023. The Company’s evaluation is based on its consideration of all available positive and negative evidence about the status of the North Fork Project, including, but not limited to, the status of required regulatory approvals, the achievement of critical milestones, the arrangement of financing for the North Fork Project and the status of any remaining litigation and contingencies. There can be no assurance that all the necessary governmental and regulatory approvals will be obtained, that financing will be obtained, that the financing and/or the cash flows from the North Fork Project will be sufficient to repay the advances, that the North Fork Project will be successfully completed or that future events and circumstances will not change the Company’s estimates of the timing, scope, and potential for successful completion or that any such changes will not be material. In addition, there can
RED ROCK RESORTS, INC.
NOTES TO CONSOLIDATED FINANCIAL STATEMENTS (Continued)
6.be no assurance that the Company will recover all of its investment in the North Fork Project even if it is successfully completed and opened for business.
7. Other Accrued Liabilities
Other accrued liabilities consisted of the following (amounts in thousands):
| | December 31, |
| December 31, | | | December 31, |
| | | 2020 | | 2019 | | 2023 | | 2022 |
| Contract and customer-related liabilities: | Contract and customer-related liabilities: | | | |
| Unpaid wagers, outstanding chips and other customer-related liabilities | |
| Unpaid wagers, outstanding chips and other customer-related liabilities | |
| Unpaid wagers, outstanding chips and other customer-related liabilities | |
| Advance deposits and future wagers | |
| Rewards Program liability | Rewards Program liability | $ | 17,465 | | | $ | 21,392 | |
| Advance deposits and future wagers | 11,854 | | | 22,185 | |
| Unpaid wagers, outstanding chips and other customer-related liabilities | 18,248 | | | 19,722 | |
| Other accrued liabilities: | Other accrued liabilities: | |
| Construction payables and equipment purchase accruals | |
| Construction payables and equipment purchase accruals | |
| Construction payables and equipment purchase accruals | |
| Accrued payroll and related | Accrued payroll and related | 41,026 | | | 57,438 | |
| Accrued gaming and related | Accrued gaming and related | 20,316 | | | 27,490 | |
| Construction payables and equipment purchase accruals | 3,710 | | | 27,462 | |
| Operating lease liabilities, current portion | Operating lease liabilities, current portion | 2,936 | | | 3,646 | |
| Interest rate swaps | 11,758 | | | 440 | |
| Other | Other | 18,764 | | | 20,785 | |
| $ | 146,077 | | | $ | 200,560 | |
| $ | |
Construction payables and equipment purchase accruals at December 31, 2023 and 2022 included $100.2 million and $67.3 million, respectively, related to the development of Durango.
Contract Balances
Customer contract liabilities related to future performance obligations consist of the Rewards Program liability, advance deposits on goods or services yet to be provided and wagers for future sporting events. Advance deposits and wagers for future sporting events represent cash payments received from guests that are typically recognized in revenues within one year from the date received. The Company also has other customer-related liabilities that primarily include unpaid wagers and outstanding chips. Unpaid wagers include unredeemed gaming tickets that are exchanged for cash, and outstanding chips represent amounts owed to guests in exchange for gaming chips in their possession that may be redeemed for cash or recognized as revenue. Fluctuations in contract liabilities and other customer-related liabilities are typically a result of normal operating activities. The Company had 0no material contract assets at December 31, 20202023 and 2019,2022, respectively.
RED ROCK RESORTS, INC.
NOTES TO CONSOLIDATED FINANCIAL STATEMENTS (Continued)
7.8. Long-term Debt
Long-term debt consisted of the following (amounts in thousands):
| | | | | | | | | | | |
| December 31, |
| 2020 | | 2019 |
| Term Loan B Facility due February 7, 2027, interest at a margin above LIBOR or base rate (2.50% at December 31, 2020), net of unamortized discount and deferred issuance costs of $29.5 million at December 31, 2020 | $ | 1,470,944 | | | $ | 0 | |
| Term Loan B Facility due June 8, 2023, interest at a margin above LIBOR or base rate (4.30% at December 31, 2019), net of unamortized discount and deferred issuance costs of $33.7 million at December 31, 2019 | 0 | | | 1,766,757 | |
| Term Loan A Facility due February 7, 2025, interest at a margin above LIBOR or base rate (1.90% at December 31, 2020), net of unamortized discount and deferred issuance costs of $2.2 million at December 31, 2020 | 179,712 | | | 0 | |
| Term Loan A Facility due March 8, 2023, interest at a margin above LIBOR or base rate (3.55% at December 31, 2019), net of unamortized discount and deferred issuance costs of $2.5 million at December 31, 2019 | 0 | | | 186,394 | |
| Term Loan A Facility, due June 8, 2022, interest at a margin above LIBOR or base rate (3.80% at December 31, 2019), net of unamortized discount and deferred issuance costs of $0.6 million at December 31, 2019 | 0 | | | 52,289 | |
| Revolving Credit Facility due February 7, 2025, interest at a margin above LIBOR or base rate | 0 | | | 0 | |
| Revolving Credit Facility, due March 8, 2023, interest at a margin above LIBOR or base rate (3.54% weighted average at December 31, 2019) | 0 | | | 440,000 | |
| 4.50% Senior Notes due February 15, 2028, net of unamortized discount and deferred issuance costs of $7.6 million at December 31, 2020 | 683,257 | | | 0 | |
| 5.00% Senior Notes due October 1, 2025, net of deferred issuance costs of $4.1 million and $5.0 million at December 31, 2020 and 2019, respectively | 526,260 | | | 545,011 | |
| Other long-term debt, weighted-average interest of 3.83% at December 31, 2020 and 2019, net of unamortized discount and deferred issuance costs of $0.4 million at December 31, 2020 and 2019 | 41,834 | | | 42,840 | |
| Total long-term debt | 2,902,007 | | | 3,033,291 | |
| Current portion of long-term debt | (22,844) | | | (33,989) | |
| Long-term debt, net | $ | 2,879,163 | | | $ | 2,999,302 | |
| | | | | | | | | | | |
| December 31, |
| 2023 | | 2022 |
| Term Loan B Facility due February 7, 2027, interest at a margin above SOFR or base rate (7.71%) at December 31, 2023, interest at a margin above LIBOR or base rate (6.64%) at December 31, 2022, net of unamortized discount and deferred issuance costs of $15.9 million and $20.4 million at December 31, 2023 and 2022, respectively | $ | 1,442,054 | | | $ | 1,452,926 | |
| Term Loan A Facility due February 7, 2025, interest at a margin above SOFR or base rate (6.96%) at December 31, 2023, interest at a margin above LIBOR or base rate (5.89%) at December 31, 2022, net of unamortized discount and deferred issuance costs of $0.6 million and $1.1 million at December 31, 2023 and 2022, respectively | 152,955 | | | 161,898 | |
| Revolving Credit Facility due February 7, 2025, interest at a margin above SOFR or base rate (6.96%) at December 31, 2023 and interest at a margin above LIBOR or base rate (5.89%) at December 31, 2022 | 512,000 | | | 149,500 | |
| 4.625% Senior Notes due December 1, 2031, net of unamortized deferred issuance costs of $4.9 million and $5.5 million at December 31, 2023 and 2022, respectively | 495,006 | | | 494,499 | |
| 4.50% Senior Notes due February 15, 2028, net of unamortized discount and deferred issuance costs of $4.7 million and $5.6 million at December 31, 2023 and 2022, respectively | 686,129 | | | 685,126 | |
| Other long-term debt, weighted-average interest of 3.88% at December 31, 2023 and 2022, respectively, net of unamortized discount and deferred issuance costs of $0.1 million and $0.2 million at December 31, 2023 and 2022, respectively | 39,618 | | | 40,827 | |
| Total long-term debt | 3,327,762 | | | 2,984,776 | |
| Current portion of long-term debt | (26,104) | | | (26,059) | |
| Long-term debt, net | $ | 3,301,658 | | | $ | 2,958,717 | |
Credit Facility
Station LLC’s credit facility consists of the Term Loan B Facility, the Term Loan A Facility and the Revolving Credit Facility (collectively, the “Credit Facility”). TheOn June 6, 2023, the Company entered into the Seventh Amendment to the Credit Agreement for its Credit Facility to replace customary LIBOR language, including, but not limited to, the use of rates based on Term SOFR (“SOFR”). Effective July 1, 2023, the Term Loan B Facility bears interest at a rate per annum, at Station LLC’s option, equal to either SOFR plus 2.25% or base rate plus 1.25% and the Term Loan A Facility and Revolving Credit Facility bear interest at a rate per annum, at Station LLC’s option, equal to either SOFR plus an amount ranging from 1.50% to 1.75% or base rate plus an amount ranging from 0.50% to 0.75%, depending on Station LLC’s consolidated total leverage ratio. No other material terms of the Credit Facility were amended.
Prior to the amendment of the Credit Facility described above, the Term Loan B Facility bore interest at a rate per annum, at Station LLC’s option, equal to either LIBOR plus 2.25% or base rate plus 1.25%. Amounts outstanding under, and the Term Loan A Facility and the Revolving Credit Facility bearbore interest at either LIBOR or basea rate per annum, at Station LLC’s option, equal to either LIBOR plus a spread that is dependentan amount ranging from 1.50% to 1.75% or base rate plus an amount ranging from 0.50% to 0.75%, depending on whether Station LLC’s consolidated total leverage ratio as shown below:
| | | | | | | | | | | | | | |
| Consolidated Total Leverage Ratio | | Revolving Credit Facility and Term Loan A Facility due
February 7, 2025 |
|
| LIBOR | | Base Rate |
| Greater than 4.00 to 1.00 | | 1.75 | % | | 0.75 | % |
| Less than or equal to 4.00 to 1.00 | | 1.50 | % | | 0.50 | % |
Station LLC is required to make quarterly principal payments of $3.8 million on the Term Loan B Facility and $2.4 million on the Term Loan A Facility on the last day of each quarter, unless otherwise reduced by prepayments. Station LLC also is required to make mandatory payments of amounts outstanding under the Credit Facility with the proceeds of certain casualty events, debt issuances, asset sales and equity issuances and, depending on its consolidated total leverage ratio, Station
RED ROCK RESORTS, INC.
NOTES TO CONSOLIDATED FINANCIAL STATEMENTS (Continued)
LLC is required to apply a portion of its excess cash flow to repay amounts outstanding under the Term Loan B Facility, which would reduce future quarterly principal payments. The Company is not required to make an excess cash flow payment in 2021.
During the year ended December 31, 2020, the Company repurchased $17.7 million in aggregate principal amount of its Term Loan B Facility indebtedness and recognized a gain on extinguishment of $0.5 million, which included purchase discounts as well as the write-off of unamortized discount and deferred issuance costs on the retired principal amounts.for 2023.
Borrowings under the Credit Facility are guaranteed by all of Station LLC’s existing and future material restricted subsidiaries and are secured by pledges of all of the equity interests in Station LLC and its material restricted subsidiaries, a security interest in substantially all of the personal property of Station LLC and the subsidiary guarantors, and mortgages on the real property and improvements owned or leased by certain of Station LLC’s subsidiaries.
RED ROCK RESORTS, INC.
NOTES TO CONSOLIDATED FINANCIAL STATEMENTS (Continued)
The Credit Facility contains a number of customary covenants that, among other things, restrict, subject to certain exceptions, the ability of Station LLC and the subsidiary guarantors to incur debt; create a lien on collateral; engage in mergers, consolidations or asset dispositions; pay distributions; make investments, loans or advances; engage in certain transactions with affiliates or subsidiaries; or modify their lines of business.
The Credit Facility also includes certain financial ratio covenants that Station LLC is required to maintain throughout the term of the Credit Facility and measure as of the end of each quarter. At December 31, 2020,2023, these financial ratio covenants included an interest coverage ratio of not less than 2.50 to 1.00 and a maximum consolidated total leverage ratio with step-downs over the term of the Credit Facility, ranging from 6.50 to 1.00 at December 31, 2020 to 5.25 to 1.00 at December 31, 2023 and thereafter.1.00. A breach of the financial ratio covenants shall only become an event of default under the Term Loan B Facility if the lenders within the Term Loan A Facility and the Revolving Credit Facility take certain affirmative actions after the occurrence of a default of such financial ratio covenants. Management believes the Company was in compliance with all applicable covenants at December 31, 2020. The Company expects to remain in compliance with its debt covenants; however, the Company’s results of operations and ability to comply with its debt covenants may be negatively impacted in the future by COVID-19 and economic conditions resulting from COVID-19 and other factors.2023.
At December 31, 2020,2023, Station LLC’s borrowing availability under its Revolving Credit Facility, subject to continued compliance with the terms of the Credit Facility, was $1.0 billion,$479.3 million, which was net of $29.4$512.0 million in outstanding borrowings and $39.8 million in outstanding letters of credit and similar obligations.
Credit Facility Amendment
OnIn February 7, 2020, the Company amended the Credit Facility to, among other things, (a) extend the maturity date under each of the Term Loan A Facility and2025, the Revolving Credit Facility to February 7, 2025 and extend the maturity date under the Term Loan B FacilityA with outstanding balances as of December 31, 2023 of $512.0 million and $153.6 million, respectively, will become due. The Company is currently in discussions with its lenders and believes it is probable that these obligations will be refinanced on a long-term basis in 2024.
4.625% Senior Notes
In November 2021, Station LLC issued $500.0 million in aggregate principal amount of 4.625% Senior Notes due 2031, pursuant to February 7, 2027; (b) increasean indenture dated as of November 26, 2021, among Station LLC, the outstanding borrowing availabilityguarantors party thereto and Computershare Trust Company, National Association, as Trustee. The net proceeds of the sale of the 4.625% Senior Notes were used, together with borrowings under the Revolving Credit Facility, to (i) make a distribution of approximately $1.03 billion; (c) (i) reduce$344 million to holders of LLC Units, including the applicable margin underCompany, (ii) pay the Term Loan B Facilitypurchase price for shares of Class A common stock tendered in the equity tender offer described in Note 9, (iii) pay fees and costs associated with such transactions and (iv) for general corporate purposes. Interest on the 4.625% Senior Notes is paid every six months in arrears on June 1 and December 1, which commenced on June 1, 2022.
The 4.625% Senior Notes and the guarantees of such notes by certain of Station LLC’s subsidiaries are general senior unsecured obligations.
On or after June 1, 2031 (the date that is six months prior to 2.25%, (ii) reduce the LIBOR “floor” under the Term Loan B Facility to 0.25% and (iii) provide for benchmark replacement mechanics in respectmaturity date of the discontinuationnotes), Station LLC may redeem all or a portion of LIBOR; (d) increase the consolidated total leverage ratios4.625% Senior Notes at whicha redemption price equal to 100.00% of the applicable margin underprincipal amount redeemed, plus accrued and unpaid interest, if any, to the Term Loan A Facility and the Revolving Credit Facility step-down to 4.00 to 1.00; (e) set the consolidated total leverage ratios for the Term Loan B Facility excess cash flow prepayment percentage step-down to 5.00 to 1.00 for the reduction to 25% and to 4.50 to 1.00 for the reduction to 0%; (f) adjust the application, availability, calculation and sizing of certain covenants; and (g) modify the maximum consolidated total leverage ratio covenant.redemption date.
The Company evaluatedindenture governing the Credit Facility amendment on4.625% Notes requires Station LLC to offer to purchase the 4.625% Notes at a lender-by-lender basis and accounted for the majoritypurchase price in cash equal to 101.00% of the amendmentaggregate principal amount outstanding plus accrued and unpaid interest thereon if Station LLC experiences certain change of control events (as defined in the indenture). The indenture also requires Station LLC to make an offer to repurchase the 4.625% Notes at a purchase price equal to 100.00% of the principal amount of the purchased notes if it has excess net proceeds (as defined in the indenture) from certain asset sales.
The indenture governing the 4.625% Notes contains a number of customary covenants that, among other things and subject to certain exceptions, restrict the ability of Station LLC and its restricted subsidiaries to incur or guarantee additional indebtedness; issue disqualified stock or create subordinated indebtedness that is not subordinated to the 4.625% Notes; create liens; engage in mergers, consolidations or asset dispositions; enter into certain transactions with affiliates; engage in lines of business other than its core business and related businesses; or make investments or pay distributions (other than customary tax distributions). These covenants are subject to a number of exceptions and qualifications as a debt modification.set forth in the indenture. The Company capitalized $5.1 million in new costsindenture governing the 4.625% Notes also provides for events of default which, if any of them occurs, would permit or require the principal of and recognized a lossaccrued interest on debt extinguishmentsuch 4.625% Notes to be declared due and modification of $12.5 million.payable.
4.50% Senior Notes
OnIn February 7, 2020, Station LLC issued $750.0 million in aggregate principal amount of 4.50% Senior Notes due 2028 pursuant to an indenture dated as of February 7, 2020, among Station LLC, the guarantors party thereto and Wells Fargo Bank, National Association, as Trustee. The net proceeds of the sale of the 4.50% Senior Notes were used (i) to repay a portion of the amounts outstanding under the Credit Facility, (ii) to pay fees and costs associated with the offering and (iii) for general
RED ROCK RESORTS, INC.
NOTES TO CONSOLIDATED FINANCIAL STATEMENTS (Continued)
corporate purposes. Interest on the 4.50% Senior Notes is paid every six months in arrears on February 15 and August 15, commencing on August 15, 2020.
The 4.50% Senior Notes and the guarantees of such notes by certain of Station LLC’s subsidiaries are general senior unsecured obligations.
RED ROCK RESORTS, INC.
NOTES TO CONSOLIDATED FINANCIAL STATEMENTS (Continued)
On or after February 15, 2023, Station LLC may redeem all or a portion of the 4.50% Senior Notes at the redemption prices (expressed as percentages of the principal amount) set forth below plus accrued and unpaid interest and additional interest to the applicable redemption date:
| | | | | |
| Years Beginning February 15, | Percentage |
| 2023 | 102.250 | % |
| 2024 | 101.125 | % |
| 2025 and thereafter | 100.000 | % |
The indenture governing the 4.50% Senior Notes requires Station LLC to offer to purchase the 4.50% Senior Notes at a purchase price in cash equal to 101.00% of the aggregate principal amount outstanding plus accrued and unpaid interest thereon if Station LLC experiences certain change of control events (as defined in the indenture). The indenture also requires Station LLC to make an offer to repurchase the 4.50% Senior Notes at a purchase price equal to 100.00% of the principal amount of the purchased notes if it has excess net proceeds (as defined in the indenture) from certain asset sales.
The indenture governing the 4.50% Senior Notes contains a number of customary covenants that, among other things and subject to certain exceptions, restrict the ability of Station LLC and its restricted subsidiaries to incur or guarantee additional indebtedness; issue disqualified stock or create subordinated indebtedness that is not subordinated to the 4.50% Senior Notes; create liens; engage in mergers, consolidations or asset dispositions; enter into certain transactions with affiliates; engage in lines of business other than its core business and related businesses; or make investments or pay distributions (other than customary tax distributions). These covenants are subject to a number of exceptions and qualifications as set forth in the indenture. The indenture governing the 4.50% Senior Notes also provides for events of default which, if any of them occurs, would permit or require the principal of and accrued interest on such 4.50% Senior Notes to be declared due and payable.
During the year ended December 31, 2020, the Company repurchased $59.2 million in aggregate principal amount of its 4.50% Senior Notes. The earlyOther Long-term Debt
Other long-term debt repurchases resulted inprimarily represents a gain on extinguishment of $10.3 million, which included purchase discounts as well as the write-off of unamortized discount and deferred issuance costs on the retired principal amounts.
5.00% Senior Notes
In September 2017, Station LLC issued $550.0 million in aggregate principal amount of 5.00% Senior Notes due October 1, 2025 at par. Interest on the 5.00% Senior Notes is paid every six months in arrears on April 1 and October 1.
The 5.00% Senior Notes and the guarantees of such notes by certain of Station LLC’s subsidiaries are general senior unsecured obligations.
On or after October 1, 2020, Station LLC may redeem all or a portion of the 5.00% Senior Notes at the redemption prices (expressed as percentages of the principal amount) set forth below plus accrued and unpaid interest and additional interest to the applicable redemption date:
| | | | | |
| Years Beginning October 1, | Percentage |
| 2020 | 102.50 | % |
| 2021 | 101.25 | % |
| 2022 and thereafter | 100.00 | % |
The indenture governing the 5.00% Senior Notes requires Station LLC to offer to purchase the 5.00% Senior Notes at a purchase price in cash equal to 101.00% of the aggregate principal amount outstanding plus accrued and unpaid interest thereon if Station LLC experiences certain change of control events (as defined in the indenture). The indenture also requires Station LLC to make an offer to repurchase the 5.00% Senior Notes at a purchase price equal to 100.00% of the principal amount of the purchased notes if it has excess net proceeds (as defined in the indenture) from certain asset sales.
The indenture governing the 5.00% Senior Notes contains a number of customary covenants that, among other things and subject to certain exceptions, restrict the ability of Station LLC and its restricted subsidiaries to incur or guarantee additional indebtedness; issue disqualified stock or create subordinated indebtedness that is not subordinated to the 5.00% Senior Notes; create liens; engage in mergers, consolidations or asset dispositions; enter into certain transactions with affiliates; engage in lines of business other than its core business and related businesses; or make investments or pay distributions (other than customary tax distributions). These covenants are subject to a number of exceptions and qualifications as set forth in the
RED ROCK RESORTS, INC.
NOTES TO CONSOLIDATED FINANCIAL STATEMENTS (Continued)
indenture. The indenture governing the 5.00% Senior Notes also provides for events of default which, if any of them occurs, would permit or require the principal of and accrued interest on such 5.00% Senior Notes to be declared due and payable.
During the year ended December 31, 2020, the Company repurchased $19.7 million in aggregate principal amount of its 5.00% Senior Notes. The early debt repurchases resulted in a gain on extinguishment of $1.9 million, which included purchase discounts as well as the write-off of unamortized discount and deferred issuance costs on the retired principal amounts.
On February 22, 2021, the Company completed a partial redemption of $250.0 million in principal amount of 5.00% Senior Notes, which was funded using borrowings under the Revolving Credit Facility and cash on hand.
Corporate Office Building Financing
In October 2019, the Company paid $57.0 million to purchase its corporate office building, which was previously leased under a sale-leaseback arrangement accounted for as a financing transaction. Accordingly, the related financing obligation, which had a carrying amount of $37.4 million, was extinguished and the Company recognized a $19.6 million loss on debt extinguishment representing the difference between the purchase price and the carrying amount of the financing obligation.
In December 2019, a 100%-owned unrestricted subsidiary of Station LLC entered into a $42.8 million term loan agreement, with a bank. The term loan bears interest at a fixed rate of 3.80% per annum andwhich matures in December 2025. Principal and interest payments of $0.2 million are payable on a monthly basis until the maturity date, at which time the remaining principal amount will become due. The term loan is secured by the Company’s corporate office building and is not guaranteed by Station LLC or its restricted subsidiaries under the Credit Facility.
Principal Maturities
As of December 31, 2020,2023, scheduled principal maturities of Station LLC’s long-term debt for each of the next five years and thereafter were as follows (amounts in thousands):
| | Years Ending December 31, | Years Ending December 31, | |
| 2021 | $ | 22,844 | |
| 2022 | 25,906 | |
| 2023 | 25,950 | |
| 2024 | |
| 2024 | |
| 2024 | 2024 | 25,995 | |
| 2025 | 2025 | 726,840 | |
| 2026 | |
| 2027 | |
| 2028 | |
| Thereafter | Thereafter | 2,118,087 | |
| 2,945,622 | |
| 3,354,028 | |
| Debt discounts and issuance costs | Debt discounts and issuance costs | (43,615) | |
| $ | 2,902,007 | |
| $ | |
8. Derivative Instruments
The Company’s objective in using derivative instruments is to manage its exposure to interest rate movements. To accomplish this objective, the Company uses interest rate swaps as a primary part of its cash flow hedging strategy. The Company does not use derivative financial instruments for trading or speculative purposes.
The Company’s hedging strategy includes the use of interest rate swaps that are not designated in cash flow hedging relationships. The interest rate swap agreements allow Station LLC to receive variable-rate payments in exchange for fixed-rate payments over the life of the agreements without exchange of the underlying notional amount. At December 31, 2020, Station LLC’s interest rate swaps had a weighted-average fixed pay rate of 1.94%, a combined notional amount of $1.3 billion and effectively converted $1.3 billion of Station LLC’s variable interest rate debt to a fixed rate of 4.16%. The interest rate swaps will expire July 8, 2021.
Station LLC has not posted any collateral related to its interest rate swap agreements; however, Station LLC’s obligations under the interest rate swap agreements are subject to the security and guarantee arrangements applicable to the Credit Facility. The interest rate swap agreements contain a cross-default provision under which Station LLC could be declared in default on its obligation under such agreements if certain conditions of default exist on the Credit Facility. At December 31,
RED ROCK RESORTS, INC.
NOTES TO CONSOLIDATED FINANCIAL STATEMENTS (Continued)
2020, the termination value of Station LLC’s interest rate swaps, including accrued interest, was a net liability of $13.3 million. Had Station LLC been in breach of the provisions of its swap agreements, it could have been required to pay the termination value to settle the obligations.
The fair values of Station LLC’s interest rate swaps, exclusive of accrued interest, as well as their classification on the Consolidated Balance Sheets, are presented below (amounts in thousands):
| | | | | | | | | | | |
| December 31, |
| 2020 | | 2019 |
| Interest rate swaps not designated in hedge accounting relationships: | | | |
| Other accrued liabilities | $ | 11,758 | | | $ | 440 | |
| Other long-term liabilities | 0 | | | 5,227 | |
Certain of Station LLC’s interest rate swaps were previously designated in cash flow hedging relationships until their dedesignation in June 2017. Accordingly, associated cumulative deferred net gains, which were previously recognized in accumulated other comprehensive loss, were amortized as a reduction of interest expense through July 2020 as the hedged interest payments occurred. During the years ended December 31, 2020, 2019 and 2018, $1.4 million, $2.8 million and $2.9 million, respectively, in deferred net gains were reclassified from accumulated other comprehensive loss to Interest expense, net in the Consolidated Statements of Operations.
9. Fair Value Measurements
At December 31, 2020 and 2019, the Company had 0 financial assets measured at fair value on a recurring basis. Information about the Company’s liabilities measured at fair value on a recurring basis, aggregated by the level in the fair value hierarchy within which those measurements fall, is presented below (amounts in thousands):
| | | | | | | | | | | | | | | | | |
| December 31, | | |
| 2020 | | 2019 | | Level of Fair Value Hierarchy |
| Liabilities | | | | | |
| Interest rate swaps | $ | 11,758 | | | $ | 5,667 | | | Level 2 - Significant unobservable inputs |
The estimated fair value of the Company’s long-term debt compared with its carrying amount is presented below (amounts in millions):
| | December 31, |
| 2020 | | 2019 |
| December 31, | | | December 31, |
| 2023 | | | 2023 | | 2022 |
| Aggregate fair value | Aggregate fair value | $ | 2,936 | | | $ | 3,109 | |
| Aggregate carrying amount | Aggregate carrying amount | 2,902 | | | 3,033 | |
The estimated fair value of the Company’s long-term debt is based on quoted market prices from various banks for similar instruments, which is considered a Level 2 input under the fair value hierarchy.
10.9. Stockholders’ Equity
The Company has 2two classes of common stock. The Company’s Certificate of Incorporation authorizes 500,000,000 shares of Class A common stock, par value $0.01 per share and 100,000,000 shares of Class B common stock, par value $0.00001 per share. The Certificate of Incorporation also authorizes up to 100,000,000 shares of preferred stock, par value of $0.01 per share, NaNnone of which have been issued. The holders of the Company’s Class A common stock hold 100% of the economic interests in the Company.
Class A Common Stock
Voting Rights
The holders of Class A common stock are entitled to 1one vote per share on all matters to be voted upon by the stockholders. Holders of shares of the Company’s Class A common stock and Class B common stock vote together as a single
RED ROCK RESORTS, INC.
NOTES TO CONSOLIDATED FINANCIAL STATEMENTS (Continued)
class on all matters presented to the Company’s stockholders for their vote or approval, except as otherwise required by applicable law or the Certificate of Incorporation.
Dividend Rights
Subject to preferences that may be applicable to any outstanding preferred stock, the holders of Class A common stock are entitled to receive ratably such dividends, if any, as may be declared from time to time by the board of directors out of funds legally available therefor. The declaration, amount and payment of any future dividends on shares of Class A common stock will be at the sole discretion of the board of directors and it may increase, reduce or discontinue entirely the payment of such dividends at any time. The board of directors may take into account general economic and business conditions, the Company’s financial condition and operating results, its available cash and current and anticipated cash needs, capital requirements, contractual, legal, tax and regulatory restrictions and implications on the payment of dividends to stockholders or the payment of distributions by subsidiaries (including Station Holdco) to the Company, and such other factors as the board of directors may deem relevant.
AsRed Rock is a holding company, Red Rock’scompany. Other than a note receivable from Station LLC and assets and liabilities related to income taxes and the tax receivable agreement, its only material assets are its equity interest in Station Holdco and its voting interest in Station LLC, other than cash and tax-related assets and liabilities.LLC. Red Rock has no operations outside of its management of Station LLC. The Company intends to cause Station Holdco to make distributions in an amount sufficient to cover cash dividends declared, if any. If Station Holdco makes such distributions to Red Rock, the other holders of LLC Units will be entitled to receive proportionate distributions based on their percentage ownership of Station Holdco.
During the years ended December 31, 2020 and 2019, the Company declared and paid cash dividends of $0.10 and $0.40, respectively, per share to Class A common stockholders. On May 19, 2020, the Company announced that the board of directors had elected to suspend the payment of dividends for the remainder of 2020.
The existing debt agreements of Station LLC, including those governing the Credit Facility, contain restrictive covenants that limit its ability to make cash distributions. Because the only asset of Station Holdco is its interest in Station LLC, the limitations on such distributions will effectively limit the ability of Station Holdco to make distributions to Red Rock, and any financing arrangements that the Company or any of its subsidiaries enter into in the future may contain similar restrictions. Station Holdco is generally prohibited under Delaware law from making a distribution to a member to the extent that, at the time of the distribution, after giving effect to the distribution, liabilities of Station Holdco (with certain exceptions) exceed the fair value of its assets. Subsidiaries of Station Holdco, including Station LLC and its subsidiaries, are generally subject to similar legal limitations on their ability to make distributions to their members or equity holders.
equityholders. Because the Company must pay taxes and make payments under the TRA, amounts ultimately distributed as dividends to holders of Class A common stock may be less than the amounts distributed by Station Holdco to its members on a per LLC Unit basis.
RED ROCK RESORTS, INC.
NOTES TO CONSOLIDATED FINANCIAL STATEMENTS (Continued)
During each of the years ended December 31, 2023 and 2022, the Company declared and paid quarterly cash dividends totaling $1.00 per share of Class A common stock, which included $8.5 million paid to Fertitta Family Entities during each year. On February 7, 2024, the Company announced that it would pay a dividend of $0.25 per share to Class A shareholders of record as of March 15, 2024 to be paid on March 29, 2024, of which $2.1 million is expected to be paid to Fertitta Family Entities. Prior to the payment of the dividend, Station Holdco will make a cash distribution to all LLC Unit Holders, including the Company, of $0.25 per LLC Unit, of which $11.3 million is expected to be paid to Fertitta Family Entities.
Special Dividends
On February 7, 2024, the Company announced that it would pay a special cash dividend of $1.00 per share of Class A common stock to shareholders of record as of February 22, 2024, to be paid on March 4, 2024. Prior to the payment of the special dividend, Station Holdco will make a cash distribution to all LLC Unit holders, including the Company, of $1.00 per unit. For the special dividend and the related distribution to LLC Unit holders, $53.9 million will be paid to Fertitta Family Entities.
In November 2022, the Company declared a special cash dividend of $1.00 per share of Class A common stock to holders of record as of November 30, 2022, which was paid on December 9, 2022, and included $8.5 million paid to Fertitta Family Entities. Prior to the payment of the special dividend, Station Holdco made a cash distribution to all LLC Unit holders, including the Company, of $1.00 per unit and included $45.4 million paid to Fertitta Family Entities.
In November 2021, the Company declared a special cash dividend of $3.00 per share of Class A common stock to holders of record as of November 23, 2021, which was paid on December 22, 2021, and included $25.4 million paid to Fertitta Family Entities. Prior to the payment of the special dividend, Station Holdco made a cash distribution to all LLC Unit holders, including the Company, of $3.00 per unit and included $136.2 million paid to Fertitta Family Entities.
Rights upon Liquidation
In the event of liquidation, dissolution or winding-up of Red Rock, whether voluntarily or involuntarily, the holders of Class A common stock are entitled to share ratably in all assets remaining after payment of liabilities, subject to prior distribution rights of preferred stock, if any, then outstanding.
Other Rights
The holders of Class A common stock have no preemptive or conversion rights or other subscription rights. There are no redemption or sinking fund provisions applicable to the Class A common stock. The rights, preferences and privileges of holders of Class A common stock will be subject to those of the holders of any shares of preferred stock the Company may issue in the future.
Equity Repurchase Program
In February 2019, theThe Company’s board of directors approved an equity repurchase program authorizing the repurchasehas authorized $600 million for repurchases of up to an aggregate of $150 million of its Class A common stock. In February 2021,stock under the Company’s board of directors extended its approval of the equity repurchase program through June 30, 2024. As of December 31, 2022.2023, the Company had repurchased an aggregate of 7.2 million shares of Class A common stock pursuant to the program, and the remaining amount authorized for repurchases was $312.9 million. The Company is not obligated to repurchase any shares under this program. Subject to applicable laws and the provisions of any agreements restricting the Company’s ability to do so, repurchases may be made at the Company’s discretion from time to time through open market purchases, negotiated transactions or tender offers, depending on market conditions and other factors.
The Company made no repurchases during the year ended December 31, 2023 under the program. During the year ended December 31, 2022, the Company repurchased 3.7 million shares of its Class A common stock pursuant tofor an aggregate purchase price of $141.5 million in open market transactions. During the repurchase program during the yearsyear ended December 31, 20202021, the Company repurchased 3.5 million shares of its Class A common stock for an aggregate purchase price of $142.8 million in open market transactions. The Class A shares were retired upon repurchase.
Equity Tender Offer
In December 2021, the Company purchased 6.9 million shares of its issued and 2019.outstanding Class A common stock for an aggregate purchase price of $354.6 million and a price per share of $51.50 pursuant to a “modified Dutch Auction” tender offer, and the shares were retired upon repurchase. The Class A share repurchases made under the tender offer were not a part of the Company’s publicly-announced equity repurchase program.
RED ROCK RESORTS, INC.
NOTES TO CONSOLIDATED FINANCIAL STATEMENTS (Continued)
Class B Common Stock
Voting Rights
The Continuing Owners of Station Holdco hold shares of Class B common stock in an amount equal to the number of LLC Units owned. Although Class B shares have no economic rights, they allow those owners of Station Holdco to exercise voting power at Red Rock, which is the sole managing member of Station Holdco.
Each outstanding share of Class B common stock that is held by a holder that, together with its affiliates, owned LLC Units representing at least 30% of the outstanding LLC Units following the IPO and, at the applicable record date, maintains direct or indirect beneficial ownership of at least 10% of the outstanding shares of Class A common stock (determined on an as-exchanged basis assuming that all of the LLC Units were exchanged for Class A common stock) is entitled to 10ten votes and each other outstanding share of Class B common stock is entitled to 1one vote.
Affiliates of Frank J.The Fertitta III and Lorenzo J. FertittaFamily Entities hold all of the Company’s issued and outstanding shares of Class B common stock that have ten votes per share. As a result, Frank J. Fertitta III and Lorenzo J. Fertitta, together with their affiliates, control any action requiring the general approval of the Company’s stockholders, including the election of the board of directors, the adoption of amendments to the Certificate of Incorporation and bylaws and the approval of any merger or sale of substantially all of the Company’s assets.
Each share of Class B common stock is entitled to only 1 vote automatically upon it being held by a holder that, together with its affiliates, did not own at least 30% of the outstanding LLC Units immediately following the IPO or owns less than 10% of the outstanding shares of Class A common stock (determined on an as-exchanged basis assuming that all of the LLC Units were exchanged for Class A common stock). Holders of LLC Units are entitled at any time to exchange LLC Units, together with an equal number of shares of Class B common stock, for shares of Class A common stock based on an exchange ratio that is equal to or less than one-for-one or for cash, at the Company’s election. The exchange ratio is a fraction, the numerator of which shall be the number of shares of Class A common stock outstanding immediately prior to the applicable exchange and the denominator of which shall be the number of LLC Units owned by Red Rock and its subsidiaries immediately prior to applicable exchange. The initial exchange ratio and the exchange ratioAccordingly, as of December 31, 2020 was one share of Class A common stock for each LLC Unit and share of Class B common stock and is subject to adjustment in the event that the number of outstanding shares of Class A common stock does not equal the number of LLC Units held by Red Rock, including as a result of purchases of shares of Class A common stock by Red Rock with excess cash on hand that does not result in a reduction in the outstanding number of LLC Units held by Red Rock. As members of Station Holdco entitled to ten votes per share exchange LLC Units, the voting power afforded to them by their shares of Class B common stock will be correspondingly reduced. HoldersExchanges of LLC Units and shares of Class B common stock exchanged 741,000, 57,000 and 380,000for shares of suchClass A common stock along withare based on an equal numberexchange ratio. The exchange ratio is a fraction, the numerator of LLC Units, for an equalwhich is the number of shares of Class A common stock duringoutstanding immediately prior to the applicable exchange and the denominator of which is the number of LLC Units owned by Red Rock and its subsidiaries immediately prior to the applicable exchange. The initial exchange ratio at the IPO date was one share of Class A common stock for each LLC Unit and share of Class B common stock. The exchange ratio is subject to adjustment in the event that the number of outstanding shares of Class A common stock does not equal the number of LLC Units held by Red Rock. At December 31, 2023, the exchange ratio was 0.934 shares of Class A common stock for each LLC Unit and share of Class B common stock. No shares of Class B common stock were exchanged for Class A shares for the years ended December 31, 2020, 20192023 and 2018, respectively.
Automatic Transfer
In the event that any outstanding share of Class B common stock shall cease to be held by a holder of an LLC Unit (including a transferee of an LLC Unit), such share shall automatically be transferred to the Company and thereupon shall be retired.
Dividend Rights
Class B stockholders will not participate in any dividends declared by the board of directors.
Rights upon Liquidation
In the event of any liquidation, dissolution, or winding-up of Red Rock, whether voluntary or involuntary, the Class B stockholders will not be entitled to receive any of the Company’s assets.
Other Rights
The holders of Class B common stock have no preemptive or conversion rights or other subscription rights. There are no redemption or sinking fund provisions applicable to the Class B common stock. The rights, preferences and privileges of holders of Class B common stock will be subject to those of the holders of any shares of preferred stock the Company may issue in the future.
RED ROCK RESORTS, INC.
NOTES TO CONSOLIDATED FINANCIAL STATEMENTS (Continued)
Preferred Stock
Subject to limitations prescribed by Delaware law and the Certificate of Incorporation, the board of directors is authorized to issue preferred stock and to determine the terms and conditions of the preferred stock, including whether the shares of preferred stock will be issued in one or more series, the number of shares to be included in each series and the powers, designations, preferences and rights of the shares. The board of directors is authorized to designate any qualifications, limitations or restrictions on the shares without any further vote or action by the stockholders. The issuance of preferred stock
RED ROCK RESORTS, INC.
NOTES TO CONSOLIDATED FINANCIAL STATEMENTS (Continued)
may have the effect of delaying, deferring or preventing a change in control of the Company. The Company has no current plan to issue any shares of preferred stock.
Accumulated Other Comprehensive (Loss) Income
The following table presents changes in accumulated other comprehensive (loss) income balances, net of tax and noncontrolling interest (amounts in thousands):
| | | | | | | | | | | | | | | | | |
| Unrealized gain (loss) on interest rate swaps | | Unrecognized pension liability | | Total |
| Balances, December 31, 2018 | $ | 1,279 | | | $ | (196) | | | $ | 1,083 | |
| Unrealized loss arising during the period | 0 | | | (271) | | | (271) | |
| Amounts reclassified into income | (1,458) | | | 0 | | | (1,458) | |
| Net current-period other comprehensive loss | (1,458) | | | (271) | | | (1,729) | |
| Exchanges of noncontrolling interests for Class A common stock and rebalancing | 5 | | | 0 | | | 5 | |
| Balances, December 31, 2019 | (174) | | | (467) | | | (641) | |
| Unrealized loss arising during the period | 0 | | | (406) | | | (406) | |
| Amounts reclassified into income | 178 | | | 249 | | | 427 | |
| Net current-period other comprehensive income (loss) | 178 | | | (157) | | | 21 | |
| Exchanges of noncontrolling interests for Class A common stock and rebalancing | (4) | | | 1 | | | (3) | |
| Balances, December 31, 2020 | $ | 0 | | | $ | (623) | | | $ | (623) | |
Net (Loss) Income Attributable to Red Rock Resorts, Inc. and Transfers (to) from (to) Noncontrolling Interests
The table below presents the effect on Red Rock Resorts, Inc. stockholders’ equity from net (loss) income and changes in its ownership of Station Holdco (amounts in thousands):
| | | | | | | | | | | | | | | | | |
| Year Ended December 31, |
| 2020 | | 2019 | | 2018 |
| Net (loss) income attributable to Red Rock Resorts, Inc. | $ | (150,397) | | | $ | (3,351) | | | $ | 157,541 | |
| Transfers from (to) noncontrolling interests: | | | | | |
| Exchanges of noncontrolling interests for Class A common stock | 4,412 | | | 370 | | | 2,174 | |
| Rebalancing of ownership percentage between the Company and noncontrolling interests of Station Holdco | (3,918) | | | (8,361) | | | (5,898) | |
| Net transfers from (to) noncontrolling interests | 494 | | | (7,991) | | | (3,724) | |
| Change from net (loss) income attributable to Red Rock Resorts, Inc. and net transfers from (to) noncontrolling interests | $ | (149,903) | | | $ | (11,342) | | | $ | 153,817 | |
| | | | | |
| | | | | | | | | | | | | | | | | |
| Year Ended December 31, |
| 2023 | | 2022 | | 2021 |
| Net income attributable to Red Rock Resorts, Inc. | $ | 176,004 | | | $ | 205,457 | | | $ | 241,850 | |
| Transfers (to) from noncontrolling interests: | | | | | |
| Exchanges of noncontrolling interests for Class A common stock | — | | | — | | | 598 | |
| Rebalancing of ownership percentage between the Company and noncontrolling interests of Station Holdco | (1,504) | | | 34,526 | | | 137,259 | |
| Net transfers (to) from noncontrolling interests | (1,504) | | | 34,526 | | | 137,857 | |
| Change from net income attributable to Red Rock Resorts, Inc. and net transfers (to) from noncontrolling interests | $ | 174,500 | | | $ | 239,983 | | | $ | 379,707 | |
| | | | | |
11.10. Share-based Compensation
The Red Rock Resorts, Inc. 2016 Amended and Restated Equity Incentive Plan (the “Equity Incentive Plan”) is designed to attract, retain and motivate employees and to align the interests of those individuals with the interests of the Company. The Equity Incentive Plan was approved by the Company’s stockholders and is administered by the compensation committee or other designated committee of the board of directors (the “Committee”). The Equity Incentive Plan authorizes the
RED ROCK RESORTS, INC.
NOTES TO CONSOLIDATED FINANCIAL STATEMENTS (Continued)
Committee to grant share-based compensation awards, including stock options, restricted stock, performance awards, stock appreciation rights and certain other stock-based awards, to eligible participants. The Committee may designate plan participants, determine the types of awards to be granted and the number of shares covered by awards, and set the terms and conditions of awards, subject to limitations set forth in the plan. AAt December 31, 2023, a total of 23.223.7 million shares of Class A common stock arewere reserved for issuance under the plan, of which approximately 13.412.3 million shares were available to be issued at December 31, 2020.issued.
Stock Options
Stock option awards issued under the plan generally vest over a requisite service period of four years and have a term of seven years from the grant date. The exercise price of stock options awarded under the plan is equal to the fair market value of the Company’s stock at the grant date. A summary of stock option activity is presented below:
| | Shares | | Weighted-average exercise price | | Weighted-average remaining contractual life (years) | | Aggregate intrinsic value (amounts in thousands) |
| Outstanding at January 1, 2020 | 7,396,507 | | | $ | 25.79 | | | | | |
| Shares | | | Shares | | Weighted-average exercise price | | Weighted-average remaining contractual life (years) | | Aggregate intrinsic value (amounts in thousands) |
| Outstanding at January 1, 2023 | |
| Granted | |
| Granted | |
| Granted | Granted | 0 | | | 0 | | |
| Exercised (a) | Exercised (a) | (167,091) | | | 20.49 | | |
| Exercised (a) | |
| Exercised (a) | |
| Forfeited or expired | Forfeited or expired | (918,759) | | | 26.62 | | |
| Outstanding at December 31, 2020 | 6,310,657 | | | $ | 25.80 | | | 4.4 | | $ | 10,051 | |
| Forfeited or expired | |
| Forfeited or expired | |
| Outstanding at December 31, 2023 | |
| Outstanding at December 31, 2023 | |
| Outstanding at December 31, 2023 | |
| Unvested instruments expected to vest | Unvested instruments expected to vest | 3,354,651 | | | $ | 26.32 | | | 4.9 | | $ | 4,020 | |
| Exercisable at December 31, 2020 | 2,956,006 | | | $ | 25.22 | | | 3.8 | | $ | 6,031 | |
| Exercisable at December 31, 2023 | |
n/m = not meaningful
(a)Includes 131,2181,355,685 options that were not converted into shares due to net share settlements to cover the aggregate exercise price and employee withholding taxes.
The following information is provided for stock options awarded under the plan:
| | | | | | | | | | | | | | | | | |
| Year Ended December 31, |
| 2020 | | 2019 | | 2018 |
| Weighted-average grant date fair value | $ | 0 | | | $ | 7.20 | | | $ | 9.25 | |
| Total intrinsic value of stock options exercised (amounts in thousands) | $ | 498 | | | $ | 1,517 | | | $ | 3,550 | |
The weighted-average assumptions used by the Company to estimate the grant date fair values of stock option awards were as follows:
| | | | | | | | | | | | | | | | | |
| Year Ended December 31, |
| 2020 | | 2019 | | 2018 |
| Expected stock price volatility | n/a | | 32.22% | | 33.25% |
| Expected term (in years) | n/a | | 4.98 | | 4.87 |
| Risk-free interest rate | n/a | | 2.26% | | 2.63% |
| Expected dividend yield | n/a | | 1.43% | | 1.52% |
n/a — No stock option awards were granted in 2020.
The Company has limited historical data on which to base certain assumptions used in estimating the grant date fair value of stock option awards. Accordingly, the Company incorporates the historical volatility of comparable public companies into its estimate of expected stock price volatility and utilizes the simplified method to estimate the expected term of stock option awards. The risk-free interest rate is based on the U.S. Treasury yield curve in effect at the date of grant for a period equal to the expected term. The expected dividend yield is based on the current annualized dividend as of the grant date and the average stock price for the year preceding the option grant.
At December 31, 2020, unrecognized share-based compensation cost related to stock options was $12.3 million which is expected to be recognized over a weighted-average period of 2.0 years.
RED ROCK RESORTS, INC.
NOTES TO CONSOLIDATED FINANCIAL STATEMENTS (Continued)
The following information is provided for stock options awarded under the plan:
| | | | | | | | | | | | | | | | | |
| Year Ended December 31, |
| 2023 | | 2022 | | 2021 |
| Weighted-average grant date fair value | $ | 22.31 | | | $ | 21.17 | | | $ | 14.60 | |
| Total intrinsic value of stock options exercised (amounts in thousands) | $ | 51,559 | | | $ | 8,682 | | | $ | 23,980 | |
The Company estimates the grant date fair value of stock option awards using the Black-Scholes model. The weighted- average assumptions used by the Company were as follows:
| | | | | | | | | | | | | | | | | |
| Year Ended December 31, |
| 2023 | | 2022 | | 2021 |
| Expected stock price volatility | 62.8% | | 60.8% | | 59.1% |
| Expected term (in years) | 5.0 | | 5.0 | | 5.0 |
| Risk-free interest rate | 3.9% | | 2.1% | | 0.6% |
| Expected dividend yield | 2.4% | | 2.2% | | —% |
The Company uses the simplified method to estimate the expected term of stock option awards as it does not have sufficient historical exercise data on which to base its estimate. The expected volatility assumption is estimated based on the Company’s historical stock price volatility for a period equal to the expected term of the award. The risk-free interest rate is based on the U.S. Treasury yield in effect at the date of grant for a period equal to the award’s expected term. The expected dividend yield is based on the Company’s current annualized dividend as of the grant date and its average daily stock price for the year preceding the option grant.
At December 31, 2023, unrecognized share-based compensation cost related to stock options was $36.9 million which is expected to be recognized over a weighted-average period of 2.6 years.
Restricted Stock Awards
Restricted stock awards issued under the plan generally vest over requisite service periods of two to four years for employee awards and one year for awards to independent directors. A summary of restricted stock activity is presented below:
| | Shares | | Weighted-average grant date fair value |
| Nonvested at January 1, 2020 | 712,447 | | | $ | 26.75 | |
| Shares | | | Shares | | Weighted-average grant date fair value |
| Nonvested at January 1, 2023 | |
| Granted | Granted | 19,290 | | | 27.22 | |
| Vested | Vested | (336,083) | | | 26.15 | |
| Forfeited | Forfeited | (26,843) | | | 28.41 | |
| Nonvested at December 31, 2020 | 368,811 | | | $ | 27.19 | |
| Nonvested at December 31, 2023 | |
The following information is provided for restricted stock awarded under the plan:
| | Year Ended December 31, |
| 2020 | | 2019 | | 2018 |
| Year Ended December 31, | | | Year Ended December 31, |
| 2023 | | | 2023 | | 2022 | | 2021 |
| Weighted-average grant date fair value per share | Weighted-average grant date fair value per share | $ | 27.22 | | | $ | 27.01 | | | $ | 31.95 | |
| Total fair value of shares vested (amounts in thousands) | Total fair value of shares vested (amounts in thousands) | $ | 8,789 | | | $ | 2,101 | | | $ | 1,194 | |
At December 31, 2020,2023, unrecognized share-based compensation cost for restricted stock awards was $4.4$10.0 million which is expected to be recognized over a weighted-average period of 2.02.5 years.
RED ROCK RESORTS, INC.
NOTES TO CONSOLIDATED FINANCIAL STATEMENTS (Continued)
Share-based compensation is classified in the same financial statement line items as cash compensation. The following table presents the location of share-based compensation expense in the Consolidated Statements of Operations (amounts in thousands):
| | Year Ended December 31, |
| 2020 | | 2019 | | 2018 |
| Year Ended December 31, | | | Year Ended December 31, |
| 2023 | | | 2023 | | 2022 | | 2021 |
| Operating costs and expenses: | Operating costs and expenses: | | | | | |
| Casino | |
| Casino | |
| Casino | Casino | $ | 321 | | | $ | 458 | | | $ | 250 | |
| Food and beverage | Food and beverage | (68) | | | 202 | | | 36 | |
| Room | Room | 12 | | | 11 | | | 0 | |
| Selling, general and administrative | Selling, general and administrative | 10,621 | | | 16,177 | | | 11,003 | |
| Total share-based compensation expense | Total share-based compensation expense | $ | 10,886 | | | $ | 16,848 | | | $ | 11,289 | |
|
12.11. Write-downs and Other, Charges, Net
Write-downs and other, charges, net include various charges and gains related to non-routine transactions, such as net gains or losses on asset disposals, severance, redevelopmentdemolition and other costs associated with our closed properties, development expenses, preopening expenses, business innovation and technology enhancements.enhancements, contract termination costs and other.
For the year ended December 31, 2020,2023, write-downs and other, charges, net totaled $36.5was a loss of $32.0 million, which included: net losses on asset disposals, including the write-offcomprising preopening and development expenses of assets due to the closure$53.4 million, $10.1 million of the Company’s buffets; severance, including insurance benefits through September 2020 for employees who were terminated in connectiondemolition costs associated with the Company’s workforce reductionpermanently closed properties, $4.0 million in May 2020;business innovation projects, and asset write-offs related to various technology projects.other, partially offset by net gains on land sales of $38.6 million. For the year ended December 31, 2019,2022, write-downs and other, charges, net totaled $82.1was a gain of $47.7 million, which included $39.8comprising net gains on capital asset transactions of $79.0 million (including land sales of $76.3 million), partially offset by preopening expense of $3.7 million for Durango, $9.3 million of demolition costs associated with the permanently closed properties, $9.2 million in business innovation development, $6.7 million in artist performance agreement termination costs associated with the closure of the nightclub and dayclub at Palms, and $25.9 million in Palms redevelopment and preopening expenses, comprising various costs associated with the brand repositioning campaign, as well as preopening related to new restaurants, nightclubs, bars and other amenities.other. For the year ended December 31, 2018,2021, write-downs and other, charges, net were $34.7was a gain of $18.7 million, which included $18.6 million in Palms redevelopment and preopening expenses.
primarily representing gains on land sales.
RED ROCK RESORTS, INC.
NOTES TO CONSOLIDATED FINANCIAL STATEMENTS (Continued)
13. Income Taxes
12. Income Taxes
Red Rock is taxed as a corporation and pays corporate federal, state and local taxes on income allocated to it by Station Holdco based upon Red Rock’s economic interest held in Station Holdco. Station Holdco is treated as a pass-through partnership for income tax reporting purposes. Station Holdco’s members, including the Company, are liable for federal, state and local income taxes based on their share of Station Holdco’s pass-through taxable income.
Income Tax Expense (Benefit)
The components of income tax expense (benefit) were as follows (amounts in thousands):
| | | | | | | | | | | | | | | | | |
| Year Ended December 31, |
| 2020 | | 2019 | | 2018 |
| Current income taxes: | | | | | |
| Federal | $ | 0 | | | $ | 0 | | | $ | 0 | |
| State and local | 0 | | | 1 | | | 15 | |
| Total current income taxes | 0 | | | 1 | | | 15 | |
| Deferred income taxes: | | | | | |
| Federal | 113,977 | | | (1,721) | | | 23,817 | |
| State and local | 104 | | | (14) | | | 43 | |
| Total deferred income taxes | 114,081 | | | (1,735) | | | 23,860 | |
| Total income tax expense (benefit) | $ | 114,081 | | | $ | (1,734) | | | $ | 23,875 | |
A reconciliation of statutory federal income tax, which is the amount computed by multiplying income before tax by the statutory federal income tax rate, to the Company’s provision for income tax is as follows (amounts in thousands):
| | | | | | | | | | | | | | | | | |
| Year Ended December 31, |
| 2020 | | 2019 | | 2018 |
| Expected U.S. federal income taxes at statutory rate | $ | (12,676) | | | $ | (1,779) | | | $ | 51,105 | |
| Income attributable to noncontrolling interests | 5,071 | | | 711 | | | (13,007) | |
| State and local income taxes, net of federal benefit | 104 | | | (14) | | | 43 | |
| Non-deductible expenses | 2,330 | | | 1,336 | | | 1,525 | |
| Tax credits | (627) | | | (1,555) | | | (1,985) | |
| Share-based compensation contribution | (909) | | | (762) | | | (1,152) | |
| Return to provision | 888 | | | (313) | | | 1,037 | |
| Other | 0 | | | 0 | | | 2,874 | |
| Valuation allowance | 119,900 | | | 642 | | | (16,565) | |
| Income tax expense (benefit) | $ | 114,081 | | | $ | (1,734) | | | $ | 23,875 | |
The Company’s effective tax rate was (188.68)%, 20.47% and 9.81% for the years ended December 31, 2020, 2019 and 2018, respectively. The Company’s effective tax rate as compared to the 21% statutory rate was primarily impacted by a full valuation allowance established against the deferred tax assets. The Company’s effective tax rate includes the net tax expense associated with remeasuring its deferred tax assets, deferred tax liabilities and related valuation allowances to reflect the enacted federal rate, and rate benefit. Other items impacting the effective tax rate include a rate detriment attributable to the fact that Station Holdco operates as a limited liability company which is not subject to federal income tax. Accordingly, the Company does not recognize income tax provision or benefit on the portion of Station Holdco's earnings or loss attributable to noncontrolling interest holders. In addition, state income taxes do not have a significant impact on the Company's effective rate. Station Holdco operates in Nevada and California. Nevada does not impose a state income tax and the Company's activities in California result in minimal state income tax. | | | | | | | | | | | | | | | | | |
| Year Ended December 31, |
| 2023 | | 2022 | | 2021 |
| Current income taxes: | | | | | |
| Federal | $ | 7,095 | | | $ | 32,581 | | | $ | 4,874 | |
| State and local | — | | | — | | | — | |
| Total current income taxes | 7,095 | | | 32,581 | | | 4,874 | |
| Deferred income taxes: | | | | | |
| Federal | 35,888 | | | 11,970 | | | (74,161) | |
| State and local | 1 | | | (21) | | | — | |
| Total deferred income taxes | 35,889 | | | 11,949 | | | (74,161) | |
| Total income tax expense (benefit) | $ | 42,984 | | | $ | 44,530 | | | $ | (69,287) | |
RED ROCK RESORTS, INC.
NOTES TO CONSOLIDATED FINANCIAL STATEMENTS (Continued)
A reconciliation of the U.S. federal statutory tax rate to the actual tax rate is as follows (amounts in thousands):
| | | | | | | | | | | | | | | | | |
| Year Ended December 31, |
| 2023 | | 2022 | | 2021 |
| Expected U.S. federal income taxes at statutory rate | $ | 79,960 | | | $ | 91,326 | | | $ | 59,964 | |
| Income attributable to noncontrolling interests | (33,972) | | | (38,828) | | | (23,726) | |
| Change in valuation allowance | (322) | | | (3,077) | | | (105,676) | |
| Other | (2,682) | | | (4,891) | | | 151 | |
| Income tax expense (benefit) | $ | 42,984 | | | $ | 44,530 | | | $ | (69,287) | |
The Company’s effective tax rate was 11.3%, 10.2% and (24.3)% for the years ended December 31, 2023, 2022 and 2021, respectively. The Company’s effective tax rate differs from the U.S. federal statutory rate primarily due to income attributable to noncontrolling interests, for which the Company generally does not record income taxes. Additionally, the effective tax rate is impacted by the change in valuation allowance at each reporting period.
The components of deferred tax assets and liabilities are as follows (amounts in thousands):
| | December 31, |
| 2020 | | 2019 |
| December 31, | | | December 31, |
| 2023 | | | 2023 | | 2022 |
| Deferred tax assets: | Deferred tax assets: | | | |
| Tax credit carryforwards | $ | 5,920 | | | $ | 5,293 | |
| Net operating loss carryforwards and other attributes | 81,233 | | | 66,476 | |
| Interest expense carryforwards and other attributes | |
| Interest expense carryforwards and other attributes | |
| Interest expense carryforwards and other attributes | |
| Investment in partnership | Investment in partnership | 67,559 | | | 76,004 | |
| Payable pursuant to tax receivable agreement | Payable pursuant to tax receivable agreement | 5,758 | | | 5,268 | |
| Total gross deferred tax assets | Total gross deferred tax assets | 160,470 | | | 153,041 | |
| Valuation allowance | Valuation allowance | (160,470) | | | (39,856) | |
| Total deferred tax assets, net of valuation allowance | Total deferred tax assets, net of valuation allowance | $ | 0 | | | $ | 113,185 | |
As a result of the Company’s IPO in 2016 IPO and certain reorganization transactions, the Company recorded a net deferred tax asset resulting from the outside basis difference of its interest in Station Holdco. The Company also recorded a deferred tax asset for its liability related to payments to be made pursuant to the TRA representing 85% of the tax savings the Company expects to realize from the amortization deductions associated with the step up in the basis of depreciable assets under Section 754743 of the Internal Revenue Code. In addition, the Company has recorded deferred tax assets related to tax attributes including net operating losses, interest limitations and tax credits.
Atcapital losses. As of December 31, 2020,2023, the Company had a federalno material net operating loss carryforwardcarryforwards. As of approximately $375.9 million. $101.6December 31, 2023, the Company had $72.3 million of federal U.S. interest limitation carryforwards, which can be carried forward indefinitely. As of December 31, 2023, the Company had $4.6 million of federal net operatingU.S. capital loss carryforward willcarryforwards, which begin to expire in 2037; the remaining $274.3 million have unlimited carryforward but may have usage limitations in a given year. The Company also had $5.9 million of tax credits, which may be carried forward for 20 taxable years, and $10.7 million of pre-tax attributes at December 31, 2020.2026.
The Company considers both positive and negative evidence when measuring the need for a valuation allowance. A valuation allowance is not required to the extent that, in management’s judgment, positive evidence exists with a magnitude and duration sufficient to result in a conclusion that it is more likely than not (a likelihood of more than 50%) that the Company’s deferred tax assets will be realized.
Historically, the Company has recorded a full valuation allowance on the deferred tax asset related only to the newly issued LLC Units in the IPO and reorganization transactions asportion of the deferred tax asset relating to those units isfor its investment in Station Holdco that would not expected to be realized unless the Company disposes of its investment in Station Holdco. However, as a resultAs of each reporting date, the Company considers new evidence that could impact the assessment of the economic downturn and uncertainty caused byfuture realizability of the COVID-19 pandemic on its current operating results and the considerable uncertainty that remains in the future, theCompany’s deferred tax assets. The Company determined it was more likely than not that thehad no valuation allowance recorded against deferred tax assets will not be realized. The Company recognizes changes to the valuation allowance through the provision for income tax or other comprehensive loss, as applicable, and at December 31, 2020 and 2019,2023. At December 31, 2022 the Company recorded a valuation allowance was $160.5of $1.7 million and $39.9 million, respectively.against the Company’s deferred tax assets related to the portion of the Company’s investment in Station Holdco that is not expected to be realized.
Uncertain Tax Positions
The Company recorded $1.2$1.8 million of unrecognized tax benefits as of December 31, 2020.2023 and December 31, 2022. Included in the balance of unrecognized tax benefits as of December 31, 2023 and December 31, 2022 are tax benefits of $1.8 million that, if recognized, would affect the effective tax rate. The Company doesrecorded interest of $0.1 million for the year ended December 31, 2023. The Company did not currently record interest andor penalties for unrecognized tax benefits for prior periods, as any
RED ROCK RESORTS, INC.
NOTES TO CONSOLIDATED FINANCIAL STATEMENTS (Continued)
recognition would resulthave resulted in a reduction of its net operating loss or other tax attributes and would not resulthave resulted in anthe underpayment of tax. Further,The Company recognizes interest and penalties related to income taxes within the provision for income taxes. The Company does not believe that it has any tax positions for which it is reasonably possible that it will be required to record a significant liability for unrecognized tax benefits within the next twelve months.
The Company files annual income tax returns for Red Rock and Station Holdco in the U.S. federal jurisdiction and California. Red Rock is currently under examination by theThe Internal Revenue Service (“IRS”) has concluded its examination of Red Rock for the 2016 tax year. Station Holdco has also concluded examination for the 2016 tax year and Station Holdco is under examinationcurrently in appeals with the IRS for the 2017 tax year. The Company regularly assesses the likelihood of adverse outcomes resulting from any examinations to determine the adequacy of the Company’s provision for income taxes. The results of the 2016 and 2017 agreed audit adjustments were reflected as a reduction in carryforward net operating losses during the year ended December 31, 2021. The IRS has also issued a Notice of Proposed Adjustment under the 2017 tax years. year examination. The Company is appealing this proposed adjustment relating to land lease expense in 2017.
There are no other ongoing income tax audits as of December 31, 2020.
RED ROCK RESORTS, INC.
NOTES TO CONSOLIDATED FINANCIAL STATEMENTS (Continued)
limitations would expire three years after the actual filing date of the returns.The Company had the following activity for unrecognized tax benefits (amounts in thousands):
| | | | | | | | | | | | | | | | | |
| Year Ended December 31, |
| 2020 | | 2019 | | 2018 |
| Balance at beginning of year | $ | 1,004 | | | $ | 0 | | | $ | 0 | |
| Tax positions related to current year additions | 142 | | | 519 | | | 0 | |
| Additions for tax positions of prior years | 91 | | | 485 | | | 0 | |
| Tax positions related to prior years reductions | 0 | | | 0 | | | 0 | |
| Reductions due to lapse of statute of limitations on tax positions | 0 | | | 0 | | | 0 | |
| Settlements | 0 | | | 0 | | | 0 | |
| Balance at end of year | $ | 1,237 | | | $ | 1,004 | | | $ | 0 | |
| | | | | | | | | | | | | | | | | |
| Year Ended December 31, |
| 2023 | | 2022 | | 2021 |
| Balance at beginning of year | $ | 1,798 | | | $ | 2,249 | | | $ | 1,237 | |
| Tax positions related to current year additions | — | | | — | | | 1,012 | |
| Adjustments for tax positions of prior years | — | | | (451) | | | — | |
| Balance at end of year | $ | 1,798 | | | $ | 1,798 | | | $ | 2,249 | |
Tax Receivable Agreement
Pursuant to the election under Section 754 of the Internal Revenue Code, the Company continues to expect to obtain an increase in its share of the tax basis in the net assets of Station Holdco when LLC Units are exchanged by Station Holdco’s noncontrolling interest holders and other qualifying transactions. These increases in tax basis may reduce the amounts that the Company would otherwise pay in the future to various tax authorities. They may also decrease gains (or increase losses) on future dispositions of certain capital assets to the extent tax basis is allocated to those capital assets. The Company expects to realize these tax benefits based on current projections of taxable income.
For the years ended December 31, 2020, 20192023 and 2018,2022, there were no exchanges of LLC Units and Class B common shares for Class A common stock. For the year ended December 31, 2021, exchanges of LLC Units and Class B common shares for Class A common stock resulted in increasesan increase of $2.3$0.6 million $0.2 million and $2.5 million, respectively, in amounts payable under the TRA liability and net increases of $0.1 million and $2.7 million in deferred tax assets for the years ended December 31, 2019 and 2018, respectively, all of which were recorded through equity.liability. At December 31, 20202023 and 2019,2022, the Company’s liability under the TRA with respect to previously consummated transactions was $27.4$22.1 million and $25.1$28.6 million, respectively, which is due primarily to current and former executives of the Company or members of their respective family group. Of these amounts, $9.0$6.0 million wasis payable to entities related to Frank J. Fertitta III, the Company’s Chairman of the Board and Chief Executive Officer, and Lorenzo J. Fertitta, the Company’s Vice Chairman of the Board and a vice president of the Company.Family Entities. Future payments to the pre-IPO owners in respect of any subsequent exchanges of LLC Units and Class B common shares for Class A common stock would be in addition to these amounts and are expected to be substantial. During the year ended December 31, 2018, the Company paid $28.9 million to pre-IPO owners of Station Holdco in exchange for which the owners assigned to the Company all of their rights under the TRA. The Company’s liability under the TRA was reduced by $119.2 million, and nontaxable income of $90.4 million was recognized as a result of the transactions with Continuing Owners.
14. Retirement Plans
13. 401(k) Plan
The Company has a defined contribution 401(k) plan that covers all employees who meet certain age and length of service requirements and allows an employer contribution of up to 50% of the first 4% of each participating employee’s compensation contributed to the plan. Participants may elect to defer pretax compensation through payroll deductions. These deferralsdeductions, which are regulated under Section 401(k) of the Internal Revenue Code.Code, and may also make after-tax contributions. Effective January 1, 2020, the plan was amended to include a discretionary employer contribution for all employees who meet certain eligibility requirements, including a maximum annual salary threshold. Employer matching and discretionary contribution expense was $8.6$8.8 million, $4.2$9.0 million and $4.1$8.5 million for the years ended December 31, 2020, 20192023, 2022 and 2018,2021, respectively, which included discretionary contributions of $5.2 million, $5.6 million and $5.3 million for the yearyears ended December 31, 2020.
Palms Pension Plan
In connection with the acquisition of Palms, the Company acquired a single-employer defined benefit pension plan (the “Pension Plan”). The Pension Plan provides a cash balance form of pension benefits for eligible Palms employees who met certain age2023, 2022 and length of service requirements. There has been a plan curtailment since 2009, and as of the curtailment date, new participants were no longer permitted, and existing participants’ accrual of benefits for future service ceased.2021 respectively.
RED ROCK RESORTS, INC.
NOTES TO CONSOLIDATED FINANCIAL STATEMENTS (Continued)
The following table provides information about the changes in benefit obligation and the fair value of plan assets (amounts in thousands):
| | | | | | | | | | | |
| Year Ended December 31, |
| 2020 | | 2019 |
| Change in benefit obligation: | | | |
| Benefit obligation (accumulated and projected) at beginning of year | $ | 14,185 | | | $ | 13,357 | |
| Interest cost | 428 | | | 517 | |
| Actuarial loss | 389 | | | 1,390 | |
| Benefits paid | (515) | | | (1,079) | |
| Settlements paid | (1,588) | | | 0 | |
| Benefit obligation (accumulated and projected) at end of year | 12,899 | | | 14,185 | |
| Change in fair value of plan assets: | | | |
| Fair value of plan assets at beginning of year | 9,526 | | | 8,725 | |
| Actual return on plan assets | 385 | | | 1,045 | |
| Employer contributions | 3,952 | | | 835 | |
| Benefits paid | (515) | | | (1,079) | |
| Settlements paid | (1,588) | | | 0 | |
| Fair value of plan assets at end of year | 11,760 | | | 9,526 | |
| Funded status at end of year | $ | (1,139) | | | $ | (4,659) | |
The Company’s qualified pension plan is funded in accordance with requirements of the Employee Retirement Income Security Act of 1974, as amended. The Company expects to make 0 contribution to the Pension Plan for the year ending December 31, 2021.
The table below presents the components of pension expense (amounts in thousands):
| | | | | | | | | | | | | | | | | |
| Year Ended December 31, |
| 2020 | | 2019 | | 2018 |
| Components of net periodic benefit cost: | | | | | |
| Interest cost | $ | 428 | | | $ | 517 | | | $ | 475 | |
| Expected return on plan assets | (256) | | | (187) | | | (209) | |
| Effect of settlement | 160 | | | 0 | | | 0 | |
| Net periodic benefit cost | 332 | | | 330 | | | 266 | |
| Other changes recognized in other comprehensive loss: | | | | | |
| Net loss | 260 | | | 532 | | | 371 | |
| Amount recognized due to settlement | (160) | | | 0 | | | 0 | |
| Total recognized in other comprehensive loss | 100 | | | 532 | | | 371 | |
| Total recognized in net periodic benefit cost and other comprehensive loss | $ | 432 | | | $ | 862 | | | $ | 637 | |
The Company did not incur any service costs or amortize any net gains or losses within the net periodic benefit costs of the Pension Plan during the periods presented. Expense associated with the Pension Plan is classified within Other expense in the Consolidated Statements of Operations. Amounts recognized on the Consolidated Balance Sheets related to the Pension Plan consisted of the following (amounts in thousands):
| | | | | | | | | | | |
| December 31, |
| 2020 | | 2019 |
| Other long-term liabilities | $ | 1,139 | | | $ | 4,659 | |
| Net actuarial loss recognized in Accumulated Other Comprehensive Income | 1,303 | | | 1,203 | |
RED ROCK RESORTS, INC.
NOTES TO CONSOLIDATED FINANCIAL STATEMENTS (Continued)
The following tables present the weighted-average actuarial assumptions used to calculate the net periodic benefit cost and obligation:
| | | | | | | | | | | | | | | | | |
| Year Ended December 31, |
| 2020 | | 2019 | | 2018 |
| Net periodic benefit cost: | | | | | |
| Discount rate | 3.20% | | 4.15% | | 3.60% |
| Expected long-term rate of return | 5.80% | | 5.80% | | 5.80% |
| Rate of compensation increase | n/a | | n/a | | n/a |
| | | | | |
| | | December 31, |
| | | 2020 | | 2019 |
| Benefit obligations: | | | | | |
| Discount rate | | | 2.45% | | 3.20% |
| Cash balance interest crediting rate | | | 2.04% | | 2.77% |
| Rate of compensation increase | | | n/a | | n/a |
The discount rate used reflects the expected future benefit payments based on plan provisions and participant data as of the beginning of the plan year. The expected future cash flows are discounted by a pension discount yield curve on measurement dates and modified as deemed necessary. The expected return on plan assets uses a weighted-average rate based on the target asset allocation of the plan and capital market assumptions developed with a primary focus on forward-looking valuation models and market indicators. The key inputs for these models are future inflation, economic growth, and interest rate environment.
The current investment strategy for the Pension Plan covers a diversified mix of fixed income investments, allocated to correlate to the liabilities of the plan and to mitigate funded status volatility. The return objectives are to satisfy funding obligations when and as prescribed by law and to minimize the risk of large losses primarily through diversification. At December 31, 2020, fixed income investments comprised 100% of the plan’s target and actual asset mix.
The Company measures the fair value of the Pension Plan assets using the fair value hierarchy described in Note 2. At December 31, 2020, the fair value of the Pension Plan assets was $11.8 million, which was determined using Level 1 inputs (quoted prices in active markets) under the fair value hierarchy. The fair values of the Pension Plan assets at December 31, 2019 by asset category were as follows (amounts in thousands):
| | | | | | | | | | | | | | | | | | | | | | | |
| | | Fair Value Measurement at Reporting Date Using |
| Balance at December 31, 2019 | | Quoted Prices
in Active
Markets for
Identical
Assets
(Level 1) | | Significant
Other
Observable
Inputs
(Level 2) | | Significant
Unobservable
Inputs
(Level 3) |
| Fixed income | $ | 4,846 | | | $ | 4,822 | | | $ | 24 | | | $ | 0 | |
| Domestic equity | 1,748 | | | 150 | | | 1,598 | | | 0 | |
| International equity | 1,273 | | | 1,273 | | | 0 | | | 0 | |
| Long/short equity | 900 | | | 900 | | | 0 | | | 0 | |
| Other | 759 | | | 310 | | | 449 | | | 0 | |
| $ | 9,526 | | | $ | 7,455 | | | $ | 2,071 | | | $ | 0 | |
RED ROCK RESORTS, INC.
NOTES TO CONSOLIDATED FINANCIAL STATEMENTS (Continued)
At December 31, 2020, expected benefit payments for the next ten years were as follows (amounts in thousands):
| | | | | |
| Years Ending December 31, | |
| 2021 | $ | 1,300 | |
| 2022 | 830 | |
| 2023 | 640 | |
| 2024 | 1,000 | |
| 2025 | 740 | |
| 2026 - 2030 | 3,760 | |
15. (Loss)14. Earnings Per Share
Basic (loss) earnings or loss per share is calculated by dividing net (loss) income or loss attributable to Red Rock by the weighted-average number of shares of Class A common stock outstanding during the period. The calculation of diluted earnings or loss per share gives effect to all potentially dilutive shares, including shares issuable pursuant to outstanding stock options and nonvested restricted shares of Class A common stock, based on the application of the treasury stock method, and outstanding Class B common stock that is exchangeable, along with an equal number of LLC Units, for Class A common stock, based on the application of the if-converted method. Dilutive shares included in the calculation of diluted earnings per share for the year ended December 31, 2018 represent outstanding shares of Class B common stock, nonvested restricted shares of Class A common stock and outstanding stock options. All other potentially dilutive shares have been excluded from the calculation of diluted earnings per share because their inclusion would have been antidilutive.
A reconciliation of the numerator and denominator used in the calculation of basic and diluted (loss) earnings per share is presented below (amounts in thousands):
| | | | | | | | | | | | | | | | | |
| Year Ended December 31, |
| 2020 | | 2019 | | 2018 |
| Net (loss) income, basic | $ | (174,543) | | | $ | (6,737) | | | $ | 219,480 | |
| Less: net (loss) income attributable to noncontrolling interests, basic | (24,146) | | | (3,386) | | | 61,939 | |
| Net (loss) income attributable to Red Rock, basic | $ | (150,397) | | | $ | (3,351) | | | $ | 157,541 | |
| Effect of dilutive securities | 0 | | | 0 | | | 48,864 | |
| Net (loss) income attributable to Red Rock, diluted | $ | (150,397) | | | $ | (3,351) | | | $ | 206,405 | |
| | | | | | | | | | | | | | | | | |
| Year Ended December 31, |
| 2023 | | 2022 | | 2021 |
| Net income, basic | $ | 337,776 | | | $ | 390,352 | | | $ | 354,830 | |
| Less: net income attributable to noncontrolling interests, basic | (161,772) | | | (184,895) | | | (112,980) | |
| Net income attributable to Red Rock, basic | 176,004 | | | 205,457 | | | $ | 241,850 | |
| Effect of dilutive securities | 127,800 | | | 146,067 | | | 89,252 | |
| Net income attributable to Red Rock, diluted | $ | 303,804 | | | $ | 351,524 | | | $ | 331,102 | |
| | Year Ended December 31, |
| 2020 | | 2019 | | 2018 |
| Year Ended December 31, | | | Year Ended December 31, |
| 2023 | | | 2023 | | 2022 | | 2021 |
| Weighted-average shares of Class A common stock outstanding, basic | Weighted-average shares of Class A common stock outstanding, basic | 70,542 | | | 69,565 | | | 69,115 | |
| Effect of dilutive securities | Effect of dilutive securities | 0 | | | 0 | | | 47,744 | |
| Weighted-average shares of Class A common stock outstanding, diluted | Weighted-average shares of Class A common stock outstanding, diluted | 70,542 | | | 69,565 | | | 116,859 | |
The calculation of diluted (loss) earnings per share of Class A common stock excluded the following shares that could potentially dilute basic earnings per share in the future because their inclusion would have been antidilutive (amounts in thousands):
| | | | | | | | | | | | | | | | | |
| As of December 31, |
| 2020 | | 2019 | | 2018 |
| Shares issuable in exchange for Class B common stock and LLC Units | 46,086 | | | 46,827 | | | 0 | |
| Shares issuable upon exercise of stock options | 6,311 | | | 7,397 | | | 1,966 | |
| Shares issuable upon vesting of restricted stock | 369 | | | 712 | | | 64 | |
RED ROCK RESORTS, INC.
NOTES TO CONSOLIDATED FINANCIAL STATEMENTS (Continued)
| | | | | | | | | | | | | | | | | |
| As of December 31, |
| 2023 | | 2022 | | 2021 |
| Shares issuable upon exercise of stock options | 2,257 | | | 1,208 | | | 43 | |
| Shares issuable upon vesting of restricted stock | 149 | | | 104 | | | 5 | |
Shares of Class B common stock are not entitled to share in the earnings of the Company and are not participating securities. Accordingly, separate presentation of earnings per share of Class B common stock under the two-class method has not been presented.
16.15. Leases
Lessee
The components of lease expense were as follows (amounts in thousands):
| | | | | | | | | | | |
| Year Ended December 31, |
| 2020 | | 2019 |
| Operating lease cost | $ | 4,995 | | | $ | 5,185 | |
| Short-term lease cost | 1,895 | | | 7,073 | |
| Variable lease cost | 17,400 | | | 28,749 | |
| | | |
| | | |
| | | |
| Total lease expense | $ | 24,290 | | | $ | 41,007 | |
For the year ended December 31, 2018, which was not retrospectively adjusted by the Company upon adoption of the new lease accounting standard, expenses incurred under operating lease agreements totaled $20.2 million.
Supplemental balance sheet information related to leases under which the Company is the lessee was as follows (amounts in thousands):
| | | | | | | | | | | |
| December 31, |
| 2020 | | 2019 |
| Operating lease right-of-use assets | $ | 11,483 | | | $ | 13,099 | |
| | | |
| Operating lease liabilities: | | | |
| Current portion | $ | 2,936 | | | $ | 3,646 | |
| Noncurrent portion | 10,950 | | | 10,675 | |
| Total operating lease liabilities | $ | 13,886 | | | $ | 14,321 | |
| | | | | | | | | | | |
| Weighted-average remaining lease term - operating leases (years) | 36.1 | | 33.5 |
| Weighted-average discount rate - operating leases | 5.32 | % | | 5.40 | % |
Supplemental cash flow information related to leases under which the Company is the lessee was as follows (amounts in thousands):
| | | | | | | | | | | |
| Year Ended December 31, |
| 2020 | | 2019 |
| Cash paid for amounts included in the measurement of lease liabilities: | | | |
| Operating cash flows from operating leases | $ | 4,387 | | | $ | 5,842 | |
| | | |
| | | |
| | | |
| Right-of use assets obtained in exchange for new lease liabilities: | | | |
| Operating leases | $ | 1,336 | | | $ | 0 | |
| | | |
Future minimum lease payments required under operating leases with initial or remaining non-cancelable lease terms in excess of one year as of December 31, 2020 are as follows (amounts in thousands): | | | | | | | | | | | | | | | | | |
| Year Ended December 31, |
| 2023 | | 2022 | | 2021 |
| Operating lease cost | $ | 7,375 | | | $ | 4,633 | | | $ | 5,159 | |
| Short-term lease cost | 669 | | | 1,018 | | | 917 | |
| Variable lease cost | 21,383 | | | 21,317 | | | 24,153 | |
| | | | | |
| | | | | |
| | | | | |
| Total lease expense | $ | 29,427 | | | $ | 26,968 | | | $ | 30,229 | |
RED ROCK RESORTS, INC.
NOTES TO CONSOLIDATED FINANCIAL STATEMENTS (Continued)
| | | | | |
| Year Ending December 31, | |
| 2021 | $ | 4,222 | |
| 2022 | 1,667 | |
| 2023 | 871 | |
| 2024 | 736 | |
| 2025 | 537 | |
| Thereafter | 42,670 | |
| Total future lease payments | 50,703 | |
| Less imputed interest | (36,817) | |
| Total operating lease liabilities | $ | 13,886 | |
| | | | | | | | | | | |
| December 31, |
| 2023 | | 2022 |
| Operating lease right-of-use assets | $ | 30,464 | | | $ | 30,800 | |
| | | |
| Operating lease liabilities: | | | |
| Current portion | $ | 6,137 | | | $ | 4,800 | |
| Noncurrent portion | 29,418 | | | 29,662 | |
| Total operating lease liabilities | $ | 35,555 | | | $ | 34,462 | |
| | | | | | | | | | | |
| Weighted-average remaining lease term - operating leases (years) | 17.6 | | 17.7 |
| Weighted-average discount rate - operating leases | 5.34 | % | | 5.20 | % |
Supplemental cash flow information related to leases under which the Company is the lessee was as follows (amounts in thousands):
| | | | | | | | | | | | | | | | | |
| Year Ended December 31, |
| 2023 | | 2022 | | 2021 |
| Cash paid for amounts included in the measurement of lease liabilities: | | | | | |
| Operating cash flows from operating leases | $ | 5,886 | | | $ | 3,922 | | | $ | 4,602 | |
| | | | | |
| | | | | |
| | | | | |
| Right-of use assets obtained in exchange for new lease liabilities: | | | | | |
| Operating leases | $ | 2,522 | | | $ | 13,002 | | | $ | 15,106 | |
| | | | | |
Future minimum lease payments required under operating leases with initial or remaining non-cancelable lease terms in excess of one year as of December 31, 2023 are as follows (amounts in thousands):
| | | | | |
| Year Ending December 31, | |
| 2024 | $ | 7,172 | |
| 2025 | 6,859 | |
| 2026 | 6,024 | |
| 2027 | 5,518 | |
| 2028 | 3,739 | |
| Thereafter | 45,918 | |
| Total future lease payments | 75,230 | |
| Less imputed interest | (39,675) | |
| Total operating lease liabilities | $ | 35,555 | |
Lessor
For the years ended December 31, 2020, 20192023, 2022 and 2018,2021, revenue from tenant leases was $13.1$25.3 million, $24.2$20.6 million and $24.3$16.0 million, respectively. Revenue from tenant leases is included in Other revenues in the Company’s Consolidated Statements of Operations.Income.
RED ROCK RESORTS, INC.
NOTES TO CONSOLIDATED FINANCIAL STATEMENTS (Continued)
At December 31, 2020,2023, the Company’s tenant leases had remaining lease terms ranging from less than one year to approximately 2017 years. The following table presents undiscounted future minimum rentals to be received under operating leases as of December 31, 20202023 (amounts in thousands):
| | Year Ending December 31, | Year Ending December 31, | |
| 2021 | $ | 7,360 | |
| 2022 | 5,416 | |
| 2023 | 4,072 | |
| 2024 | |
| 2024 | |
| 2024 | 2024 | 3,007 | |
| 2025 | 2025 | 662 | |
| 2026 | |
| 2027 | |
| 2028 | |
| Thereafter | Thereafter | 2,861 | |
| $ | 23,378 | |
| $ | |
17.16. Commitments and Contingencies
Legal Matters
The Company and its subsidiaries are defendants in various lawsuits relating to routine matters incidental to their business. No assurance can be provided as to the outcome of any legal matters and litigation inherently involves significant risks. The Company does not believe there are any legal matters outstanding that would have a material impact on its financial condition or results of operations.
18.17. Segments
The Company views each of its Las Vegas casino properties and each of its Native American management arrangements as an individual operating segment. The Company aggregates all of its Las Vegas operating segmentsproperties into 1one reportable segment because all of its Las Vegasthe properties offer similar products, cater to the same customer base, have the same regulatory and tax structure, share the same marketing techniques, are directed by a centralized management structure and have similar economic characteristics. The Company also aggregates its Native American management arrangements into 1one reportable segment.
RED ROCK RESORTS, INC.
NOTES TO CONSOLIDATED FINANCIAL STATEMENTS (Continued)
The Company utilizes adjusted earnings before interest, taxes, depreciation and amortization (“Adjusted EBITDA”) as its primary performance measure. The Company’s segment information and a reconciliation of consolidated net income to Adjusted EBITDA are presented below (amounts in thousands):
| | Year Ended December 31, |
| 2020 | | 2019 | | 2018 |
| Year Ended December 31, | | | Year Ended December 31, |
| 2023 | | | 2023 | | 2022 | | 2021 |
| Net revenues | Net revenues | | | | | |
| Las Vegas operations: | Las Vegas operations: | |
| Las Vegas operations: | |
| Las Vegas operations: | |
| Casino | |
| Casino | |
| Casino | Casino | $ | 764,255 | | | $ | 984,253 | | | $ | 940,483 | |
| Food and beverage | Food and beverage | 192,899 | | | 481,558 | | | 381,197 | |
| Room | Room | 87,035 | | | 192,305 | | | 170,824 | |
| Other (a) | Other (a) | 49,716 | | | 100,073 | | | 94,894 | |
| Management fees | Management fees | 537 | | | 571 | | | 605 | |
| Las Vegas operations net revenues | Las Vegas operations net revenues | 1,094,442 | | | 1,758,760 | | | 1,588,003 | |
| Native American management: | Native American management: | |
| Management fees | Management fees | 81,440 | | | 91,074 | | | 87,009 | |
| Management fees | |
| Management fees | |
| Reportable segment net revenues | Reportable segment net revenues | 1,175,882 | | | 1,849,834 | | | 1,675,012 | |
| Corporate and other (a) | Corporate and other (a) | 6,563 | | | 6,700 | | | 6,018 | |
| Net revenues | Net revenues | $ | 1,182,445 | | | $ | 1,856,534 | | | $ | 1,681,030 | |
| | Net (loss) income | $ | (174,543) | | | $ | (6,737) | | | $ | 219,480 | |
| Net income | |
| Net income | |
| Net income | |
| Adjustments | Adjustments | |
| Depreciation and amortization | Depreciation and amortization | 231,391 | | | 222,211 | | | 180,255 | |
| Depreciation and amortization | |
| Depreciation and amortization | |
| Share-based compensation | Share-based compensation | 10,886 | | | 16,848 | | | 11,289 | |
| Write-downs and other charges, net | 36,537 | | | 82,123 | | | 34,650 | |
| Tax receivable agreement liability adjustment | (15) | | | (97) | | | (90,638) | |
| Write-downs and other, net | |
| Asset impairment | |
| Interest expense, net | Interest expense, net | 128,465 | | | 156,679 | | | 143,099 | |
| (Gain) loss on extinguishment/modification of debt, net | (240) | | | 19,939 | | | 0 | |
| Change in fair value of derivative instruments | 21,590 | | | 19,467 | | | (12,415) | |
| Loss on extinguishment/modification of debt, net | |
| Provision (benefit) for income tax | Provision (benefit) for income tax | 114,081 | | | (1,734) | | | 23,875 | |
| Other | Other | 333 | | | 316 | | | (633) | |
| Adjusted EBITDA (b) | Adjusted EBITDA (b) | $ | 368,485 | | | $ | 509,015 | | | $ | 508,962 | |
| | Adjusted EBITDA | Adjusted EBITDA | |
| Adjusted EBITDA | |
| Adjusted EBITDA | |
| Las Vegas operations | |
| Las Vegas operations | |
| Las Vegas operations | Las Vegas operations | $ | 335,134 | | | $ | 472,921 | | | $ | 474,503 | |
| Native American management | Native American management | 77,440 | | | 85,562 | | | 80,795 | |
| Reportable segment Adjusted EBITDA | Reportable segment Adjusted EBITDA | 412,574 | | | 558,483 | | | 555,298 | |
| Corporate and other | Corporate and other | (44,089) | | | (49,468) | | | (46,336) | |
| Adjusted EBITDA | Adjusted EBITDA | $ | 368,485 | | | $ | 509,015 | | | $ | 508,962 | |
| | December 31, | |
| 2020 | | 2019 | |
| December 31, | |
| December 31, | |
| December 31, | |
| 2023 | |
| 2023 | |
| 2023 | |
| Total assets | |
| Total assets | |
| Total assets | Total assets | | | | |
| Las Vegas operations | Las Vegas operations | $ | 3,376,296 | | | $ | 3,637,893 | | |
| Las Vegas operations | |
| Las Vegas operations | |
| Native American management | |
| Native American management | |
| Native American management | Native American management | 31,146 | | | 31,573 | | |
| Corporate and other | Corporate and other | 332,512 | | | 444,721 | | |
| $ | 3,739,954 | | | $ | 4,114,187 | | |
| | Corporate and other | |
| Corporate and other | |
| $ | |
| $ | |
| $ | |
(a)Includes tenant lease revenue which is accounted for under the lease accounting guidance. See Note 16.
(b)Adjusted EBITDA includes net (loss) income plus depreciation and amortization, share-based compensation, write-downs and other charges, net (including net losses on asset disposals, severance, redevelopment and preopening expenses, business innovation and technology enhancements), tax receivable agreement liability adjustment, interest15.
RED ROCK RESORTS, INC.
NOTES TO CONSOLIDATED FINANCIAL STATEMENTS (Continued)
(b)Adjusted EBITDA includes net income plus depreciation and amortization, share-based compensation, write-downs and other, net (including gains and losses on asset disposals, demolition costs, preopening and development, business innovation and technology enhancements, contract termination costs and non-routine items), asset impairment, interest expense, net, (gain) loss on extinguishment/modification of debt, net, change in fair value of derivative instruments, provision (benefit) for income tax and other.
Beginning in the first quarter of 2020, the Company changed its methodologyother, which includes losses from assets held for allocating certain corporate technology expenses to its reportable segments. Historically, all technology costs incurred at the corporate level were allocated to the Company’s operating properties on a pro rata basis. Under the new methodology, only technology costs that are directly related to operating properties are allocated to those properties, and expenses associated with corporate technology initiatives remain within corporate expense. Such corporate technology expenses were $14.5 million, $18.1 million and $17.1 million for the years ended December 31, 2020, 2019 and 2018, respectively. The amounts for the prior year periods have been reclassified from the Las Vegas operations segment to Corporate and other within reportable segment Adjusted EBITDA to conform with the current year presentation.sale.
The Company’s capital expenditures, which were primarily related to Las Vegas operations, were $58.5$699.5 million, $353.3$328.6 million and $579.3$61.3 million for the years ended December 31, 2020, 20192023, 2022 and 2018,2021, respectively.
ITEM 9.CHANGES IN AND DISAGREEMENTS WITH ACCOUNTANTS ON ACCOUNTING AND FINANCIAL DISCLOSURE
None.
ITEM 9A.CONTROLS AND PROCEDURES
Disclosure Controls and Procedures
As of the end of the period covered by this Annual Report on Form 10-K, the Company’s management conducted an evaluation, under the supervision and with the participation of the principal executive officer and principal financial officer, of the Company’s disclosure controls and procedures (as defined in Rules 13a-15(e) and 15d-15(e) under the Securities Exchange Act of 1934 (the “Exchange Act”)). In designing and evaluating disclosure controls and procedures, management recognizes that any controls and procedures, no matter how well designed and operated, can only provide reasonable assurance of achieving the desired control objectives, and management is required to apply its judgment in evaluating the cost-benefit relationship of possible controls and procedures. Based on this evaluation, the principal executive officer and principal financial officer concluded that, as of the end of the period covered by this report, the Company’s disclosure controls and procedures are effective, at the reasonable assurance level, and are designed to ensure that information required to be disclosed by the Company in reports that it files or submits under the Exchange Act is recorded, processed, summarized and reported within the time periods specified in Securities and Exchange Commission rules and forms, and that such information is accumulated and communicated to management, including the principal executive officer and principal financial officer to allow timely decisions regarding required disclosure.
Management’s Report on Internal Control over Financial Reporting
The Company’s management is responsible for establishing and maintaining adequate internal control over financial reporting. The Company’s internal control system was designed to provide reasonable assurance to the Company’s management and board of directors regarding the preparation and fair presentation of published financial statements.
All internal control systems, no matter how well designed, have inherent limitations, including the possibility of human error and the circumvention or overriding of controls. Accordingly, even effective internal controls can provide only reasonable assurances with respect to financial statement preparation. Further because of changes in conditions, the effectiveness of internal controls may vary over time.
Management assessed the effectiveness of the Company’s internal control over financial reporting as of December 31, 2020.2023. This assessment was performed using the criteria set forth by the Committee of Sponsoring Organizations of the Treadway Commission (COSO) in the 2013 Internal Control — Integrated Framework. Based on such assessment, management believes that, as of December 31, 2020,2023, the Company’s internal control over financial reporting was effective based on those criteria.
The Company’s independent registered public accounting firm, Ernst & Young LLP, has issued an attestation report on the Company’s internal control over financial reporting as of December 31, 2020,2023, which is included below.
Changes in Internal Control over Financial Reporting
During the fourth quarter endedof 2023, management completed the remediation of a previously disclosed material weakness in internal control over financial reporting in relation to the accuracy and timeliness of the review and approval of changes to the Company’s vendor master payment file.
Management implemented actions to remediate the material weakness, including enhancements to the Company’s policies and procedures for changes to its vendor master payment file and additional training for employees who are responsible for initiation and approval of payments by the Company. As a result of these actions and subsequent review and testing, management concluded that the material weakness was remediated as of December 31, 2020,2023.
Except for the remediation activities undertaken to address the material weakness, there were no changes in the Company’s internal control over financial reporting (as defined in Rule 13a-15(f) under the Exchange Act) during the quarter ended December 31, 2023, that materially affected, or are reasonably likely to materially affect, the Company’s internal control over financial reporting.
Report of Independent Registered Public Accounting Firm
To the Stockholders and the Board of Directors of Red Rock Resorts, Inc.
Opinion on Internal Control Over Financial Reporting
We have audited Red Rock Resorts, Inc.’s internal control over financial reporting as of December 31, 2020,2023, based on criteria established in Internal Control-IntegratedControl—Integrated Framework issued by the Committee of Sponsoring Organizations of the Treadway Commission (2013 Framework)framework) (the COSO criteria). In our opinion, Red Rock Resorts, Inc. (the Company) maintained, in all material respects, effective internal control over financial reporting as of December 31, 2020,2023, based on the COSO criteria.
We also have audited, in accordance with the standards of the Public Company Accounting Oversight Board (United States) (PCAOB), the consolidated balance sheets of the Company as of December 31, 20202023 and 2019,2022, the related consolidated statements of operations,income, comprehensive (loss) income, stockholders’ equity and cash flows for each of the three years in the period ended December 31, 2020,2023, and the related notes and the financial statement schedule listed in the Index at Item 15(a)2 of the Company and our report dated February 23, 202121, 2024 expressed an unmodifiedunqualified opinion thereon.
Basis for Opinion
The Company’s management is responsible for maintaining effective internal control over financial reporting and for its assessment of the effectiveness of internal control over financial reporting included in the accompanying Management’s Report on Internal Control over Financial Reporting, included in Item 9A.Reporting. Our responsibility is to express an opinion on the Company’s internal control over financial reporting based on our audit. We are a public accounting firm registered with the PCAOB and are required to be independent with respect to the Company in accordance with the U.S. federal securities laws and the applicable rules and regulations of the Securities and Exchange Commission and the PCAOB.
We conducted our audit in accordance with the standards of the PCAOB. Those standards require that we plan and perform the audit to obtain reasonable assurance about whether effective internal control over financial reporting was maintained in all material respects.
Our audit included obtaining an understanding of internal control over financial reporting, assessing the risk that a material weakness exists, testing and evaluating the design and operating effectiveness of internal control based on the assessed risk, and performing such other procedures as we considered necessary in the circumstances. We believe that our audit provides a reasonable basis for our opinion.
Definition and Limitations of Internal Control Over Financial Reporting
A company’s internal control over financial reporting is a process designed to provide reasonable assurance regarding the reliability of financial reporting and the preparation of financial statements for external purposes in accordance with generally accepted accounting principles. A company’s internal control over financial reporting includes those policies and procedures that (1) pertain to the maintenance of records that, in reasonable detail, accurately and fairly reflect the transactions and dispositions of the assets of the company; (2) provide reasonable assurance that transactions are recorded as necessary to permit preparation of financial statements in accordance with generally accepted accounting principles, and that receipts and expenditures of the company are being made only in accordance with authorizations of management and directors of the company; and (3) provide reasonable assurance regarding prevention or timely detection of unauthorized acquisition, use, or disposition of the company’s assets that could have a material effect on the financial statements.
Because of its inherent limitations, internal control over financial reporting may not prevent or detect misstatements. Also, projections of any evaluation of effectiveness to future periods are subject to the risk that controls may become inadequate because of changes in conditions, or that the degree of compliance with the policies or procedures may deteriorate.
/s/ Ernst & Young LLP
Las Vegas, Nevada
February 23, 202121, 2024
ITEM 9B.OTHER INFORMATION
None.During the quarter ended December 31, 2023, there were no Rule 10b5-1 trading arrangements (as defined in Item 408(a) of Regulation S-K) or non-Rule 10b5-1 trading arrangements (as defined in Item 408(c) of Regulation S-K) adopted or terminated by any of our directors or officers (as defined in Rule 16a-1(f) under the Exchange Act).
ITEM 9C. DISCLOSURE REGARDING FOREIGN JURISDICTIONS THAT PREVENT INSPECTIONS
Not applicable.
PART III
ITEM 10.DIRECTORS, EXECUTIVE OFFICERS AND CORPORATE GOVERNANCE
The information required under this item will be included in our definitive Proxy Statement for our 20212024 Annual Meeting of Stockholders to be filed with the Securities and Exchange Commission not later than 120 days after December 31, 20202023 and is incorporated herein by reference.
ITEM 11.EXECUTIVE COMPENSATION
The information required under this item will be included in our definitive Proxy Statement for our 20212024 Annual Meeting of Stockholders to be filed with the Securities and Exchange Commission not later than 120 days after December 31, 20202023 and is incorporated herein by reference.
ITEM 12.SECURITY OWNERSHIP OF CERTAIN BENEFICIAL OWNERS AND MANAGEMENT AND RELATED UNITHOLDER MATTERS
The information required under this item will be included in our definitive Proxy Statement for our 20212024 Annual Meeting of Stockholders to be filed with the Securities and Exchange Commission no later than 120 days after December 31, 20202023 and is incorporated herein by reference.
ITEM 13.CERTAIN RELATIONSHIPS AND RELATED TRANSACTIONS, AND DIRECTOR INDEPENDENCE
The information required under this item will be included in our definitive Proxy Statement for our 20212024 Annual Meeting of Stockholders to be filed with the Securities and Exchange Commission no later than 120 days after December 31, 20202023 and is incorporated herein by reference.
ITEM 14.PRINCIPAL ACCOUNTANT FEES AND SERVICES
The information required under this item will be included in our definitive Proxy Statement for our 20212024 Annual Meeting of Stockholders to be filed with the Securities and Exchange Commission no later than 120 days after December 31, 20202023 and is incorporated herein by reference.
PART IV
ITEM 15.EXHIBITS, FINANCIAL STATEMENT SCHEDULES
(a) 1. Red Rock Resorts, Inc. Consolidated Financial Statements (including related notes to Consolidated Financial Statements) filed in Part II of this report are listed below:
Report of Independent Registered Public Accounting Firm — Ernst & Young LLP
Financial Statements:
Consolidated Balance Sheets as of December 31, 20202023 and 20192022
Consolidated Statements of Operations — Years ended December 31, 2020, 2019 and 2018
Consolidated Statements of Comprehensive (Loss) Income — Years ended December 31, 2020, 20192023, 2022 and 20182021
Consolidated Statements of Comprehensive Income — Years ended December 31, 2023, 2022 and 2021
Consolidated Statements of Stockholders’ Equity — Years ended December 31, 2020, 20192023, 2022 and 20182021
Consolidated Statements of Cash Flows — Years ended December 31, 2020, 20192023, 2022 and 20182021
Notes to Consolidated Financial Statements
2. Schedule II — Valuation and Qualifying Accounts
We have omitted all other financial statement schedules because they are not required or are not applicable, or the required information is shown in the consolidated financial statements or notes to the consolidated financial statements.
SCHEDULE II — VALUATION AND QUALIFYING ACCOUNTS
RED ROCK RESORTS, INC.
For the Years Ended December 31, 2020, 20192023, 2022 and 20182021
(in thousands)
| | | | | | | | | | | | | | | | | |
| Balance at Beginning of Year | | Additions (deductions) | | Balance at End of Year |
| Description | | | | | |
| Deferred income tax asset valuation allowance: | | | | | |
| 2020 | $ | 39,856 | | | $ | 120,614 | | | $ | 160,470 | |
| 2019 | 39,968 | | | (112) | | | 39,856 | |
| 2018 | 57,607 | | | (17,639) | | | 39,968 | |
| | | | | |
| | | | | | | | | | | | | | | | | |
| Balance at Beginning of Year | | Additions (deductions) | | Balance at End of Year |
| Description | | | | | |
| Deferred income tax asset valuation allowance: | | | | | |
| 2023 | $ | 1,746 | | | $ | (1,746) | | | $ | — | |
| 2022 | 4,823 | | | (3,077) | | | 1,746 | |
| 2021 | 160,470 | | | (155,647) | | | 4,823 | |
| | | | | |
3. Exhibits
| | | | | | | | |
| Exhibit Number | | Exhibit Description |
4.3Indenture, dated as of September 21, 2017,February 7, 2020, among Station Casinos LLC, the guarantors party thereto and Wells Fargo Bank, National Association, as trustee. (Incorporated herein by reference to Exhibit 4.1 to the Company’s Current Report on Form 8-K filed September 21, 2017.)February 7, 2020). 4.4Indenture dated as of February 7, 2020,November 26, 2021, among Station Casinos LLC, the guarantors party thereto and Wells Fargo Bank, National Association,Computershare Trust Company, as trustee. (Incorporatedtrustee. (Incorporated herein by reference to Exhibit 4.1 to the Company’sCompany’s Current Report on Form 8-K filed February 7, 2020.November 26, 2021.)
10.1110.13Incremental Joinder Agreement No. 6 and Sixth Amendment to Credit Agreement dated as of February 7, 2020,, among Station Casinos LLC, the guarantor subsidiaries party thereto, Red Rock Resorts, Inc., Station Holdco LLC, Deutsche Bank AG Cayman Islands Branch, as administrative agent, and the lenders party thereto.(Incorporated (Incorporated herein by reference to Exhibit 10.110.1 to the Company’s Current Report on Form 8-K filed February 7, 2020.)101.INSXBRL Instance Document — the instance document does not appear in the Interactive Data File because its XBRL tags are embedded within the Inline XBRL document.
101.SCHXBRL Taxonomy Extension Schema Document
101.CALXBRL Taxonomy Extension Calculation Linkbase Document
101.DEFXBRL Taxonomy Extension Definition Linkbase Document
101.LABXBRL Taxonomy Extension Label Linkbase Document
101.PREXBRL Taxonomy Extension Presentation Linkbase Document
104Cover Page Interactive Data File (formatted as Inline XBRL and contained in Exhibit 101)
____________________________________
† Management contract or compensatory plan or arrangement.
ITEM 16.FORM 10-K SUMMARY
None.
SIGNATURES
Pursuant to the requirements of Section 13 or 15(d) of the Securities Exchange Act of 1934, the Registrant has duly caused this report to be signed on its behalf by the undersigned, thereunto duly authorized.
| | | | | | | | | | | |
| | RED ROCK RESORTS, INC.
|
| Dated: | By: | /s/ FRANK J. FERTITTA III |
February 23, 202121, 2024 | | | Frank J. Fertitta III |
| | | Chairman of the Board and Chief Executive Officer |
Pursuant to the requirements of the Securities Exchange Act of 1934, this report has been signed below by the following persons on behalf of the Registrant and in the capacities and on the dates indicated.
| | | | | | | | | | | |
| Signature | | Title | Date |
| | | |
| /s/ FRANK J. FERTITTA III | | Chairman of the Board and Chief Executive Officer (Principal Executive Officer) | February 23, 202121, 2024 |
| Frank J. Fertitta III | | | |
| | | |
| /s/ LORENZO J. FERTITTA | | Vice Chairman of the Board | February 23, 202121, 2024 |
| Lorenzo J. Fertitta | | | |
| | | |
| /s/ STEPHEN L. COOTEY | | Executive Vice President, Chief Financial Officer and Treasurer (Principal Financial and Accounting Officer) | February 23, 202121, 2024 |
| Stephen L. Cootey | | | |
| | | |
| /s/ ROBERT A. CASHELL, JR. | | Director | February 23, 202121, 2024 |
| Robert A. Cashell, Jr. | | | |
| | | |
| /s/ JAMES E. NAVE, D.V.M. | | Director | February 23, 202121, 2024 |
| James E. Nave, D.V.M. | | | |
| | | |
| /s/ ROBERT E. LEWIS | | Director | February 23, 202121, 2024 |
| Robert E. Lewis | | | |