UNITED STATES SECURITIES AND EXCHANGE COMMISSION
Washington, D.C. 20549
FORM 10-K
☒ ANNUAL REPORT PURSUANT TO SECTION 13 OR 15(d) OF THE SECURITIES EXCHANGE ACT OF 1934
For the fiscal year ended December 31, 20182020
or
☐ TRANSITION REPORT PURSUANT TO SECTION 13 OR 15(d) OF THE SECURITIES EXCHANGE ACT OF 1934
For the transition period from to
Commission File Number 000-09908
TOMI ENVIRONMENTAL SOLUTIONS, INC.
(Exact name of registrant as specified in its charter)
FLORIDA | |
| FLORIDA | 59-1947988 |
(State or other jurisdiction of incorporation or organization) | | (I.R.S. Employer Identification No.) |
| |
9454 Wilshire Blvd., R-1,8430 Spires Way
Beverly Hills, CaliforniaFrederick, Maryland
| | 9021221701 |
| (Address of principal executive offices) | | (Zip Code) |
Registrant’s telephone number, including area code: (800) 525-1698
Securities registered under Section 12(b) of the Exchange Act: None
Securities registered under Section 12(g) of the Exchange Act:
Common Stock, $0.01 par value per share |
| (Title of class) |
Indicate by check mark if the registrant is a well-known seasoned issuer, as defined in Rule 405 of the Securities Act.Yes ☐ No ☒
Indicate by check mark if the registrant is not required to file reports pursuant to Section 13 or Section 15(d) of the Act. Yes ☐ No ☒
Indicate by check mark whether the registrant (1) has filed all reports required to be filed by Section 13 or 15(d) of the Securities Exchange Act of 1934 during the preceding 12 months (or for such shorter period that the registrant was required to file such reports), and (2) has been subject to such filing requirements for the past 90 days. Yes ☒ No ☐
Indicate by check mark whether the registrant has submitted electronically and posted on its corporate Web site, if any, every Interactive Data File required to be submitted and posted pursuant to Rule 405 of Regulation S-T (§ 232.405 of this chapter) during the preceding 12 months (or for such shorter period that the registrant was required to submit and post such files). Yes ☒ No ☐
Indicate by check mark if disclosure of delinquent filers pursuant to Item 405 of Regulation S-K (229.405 of this chapter) is not contained herein, and will not be contained, to the best of registrant’s knowledge, in definitive proxy or information statements incorporated by reference in Part III of this Form 10-K or any amendment to this Form 10-K. ☒
Indicate by check mark whether the registrant is a large accelerated filer, an accelerated filer, a non-accelerated filer, a smaller reporting company, or emerging growth company. See the definitions of “large accelerated filer,” “accelerated filer,” “smaller reporting company,” and “emerging growth company” in Rule 12b-2 of the Exchange Act:
| Large Accelerated Filer ☐ | | Accelerated Filer ☐ |
| Non-Accelerated Filer ☐ | | Smaller Reporting Company ☒ |
| | | Emerging Growth Company ☐ |
If an emerging growth company, indicate by check mark if the registrant has elected not to use the extended transition period for complying with any new or revised financial accounting standards provided pursuant to Section 13(a) of the Exchange Act. ☐
Indicate by check mark whether the registrant is a shell company (as defined in Rule 12b-2 of the Act). Yes ☐ No ☒
As of June 30, 2018,2020, the last business day of the registrant’s most recently completed second fiscal quarter, the aggregate market value of the common stock held by non-affiliates of the registrant was approximately $7,980,134,$104,219,332, based upon the closing price of the registrant’s common stock as reported on the OTCQXOTCQB Marketplace on such date.
As of March 15, 2019,29, 2021, the registrant had 124,690,41816,811,513 shares of common stock outstanding.
DOCUMENTS INCORPORATED BY REFERENCE
None.
TOMI ENVIRONMENTAL SOLUTIONS, INC.
ANNUAL REPORT ON FORM 10-K
FOR THE FISCAL YEAR ENDED DECEMBER 31, 2018
2020
TABLE OF CONTENTS
| | | | | |
| Item |
| Page |
| Page |
| PART I | PART I | PART I |
| 1. | Business | 1 | | 1 |
| 1A. | Risk Factors | 10 | | 9
|
| 1B. | Unresolved Staff Comments | 15 | | 19
|
| 2. | Properties | 15 | | 19
|
| 3. | Legal Proceedings | 16 | | 20 |
| 4. | Mine Safety Disclosures | 16 | | 20
|
PART II | | 5. | Market for Registrant’s Common Equity, Related Shareholder Matters and Issuer Purchases of Equity Securities | 17 | | 21 |
| 6. | Selected Financial Data | 17 | | 21 |
| 7. | Management’s Discussion and Analysis of Financial Condition and Results of Operations | 17 | | 21 |
| 7A. | Quantitative and Qualitative Disclosures About Market Risk | 31
| | 41 |
| 8. | Financial Statements and Supplementary Data | 31
| | 41 |
| 9. | Changes in and Disagreements with Accountants on Accounting and Financial Disclosure | 31
| | 41 |
| 9A. | Controls and Procedures | 31
| | 41 |
| 9B. | Other Information | 32
| | 42 |
PART III | | 10. | Directors, Executive Officers and Corporate Governance | 33
| | 43 |
| 11. | Executive Compensation | 36 | | 45 |
| 12. | Security Ownership of Certain Beneficial Owners and Management and Related Shareholder Matters | 40
| | 50 |
| 13. | Certain Relationships and Related Transactions, and Director Independence | 42
| | 52 |
| 14. | Principal Accounting Fees and Services | 42
| | 52 |
PART IV | | 15. | Exhibits, Financial Statement Schedules | 43 | | 53 |
| | | Signatures | 44 | | 54 |
| | | | | |
| | Exhibit Index | 45 | | 55 |
| | | | | |
| | Financial Statements | F-1 | | F-1 |
FORWARD-LOOKING STATEMENTS
This Annual Report on Form 10-K contains certain forward-looking statements within the meaning of Section 27A of the Securities Act of 1933, as amended (the “Securities Act”), and Section 21E of the Securities Exchange Act of 1934, as amended (the “Exchange Act”), and we intend that such forward-looking statements be subject to the safe harbors created thereby. For this purpose, any statements contained in this Annual Report on Form 10-K, except for historical information, may be deemed to be forward-looking statements. You can generally identify forward-looking statements as statements containing the words “will,” “would,” “believe,” “expect,” “estimate,” “anticipate,” “intend,” “estimate,” “assume,” “can,” “could,” “plan,” “predict,” “should” or the negative or other variations thereof or comparable terminology are intended to identify forward-looking statements. In addition, any statements that refer to projections of our future financial performance, trends in our businesses, or other characterizations of future events or circumstances are forward-looking statements.
The forward-looking statements included herein are based on current expectations of our management based on available information and involve a number of risks and uncertainties, all of which are difficult or impossible to predict accurately and many of which are beyond our control. As such, our actual results could differ materially and adversely from those expressed in any forward-looking statements as a result of various factors, some of which are listed under the section “Risk Factors,” Item 1A of this Annual Report on Form 10-K. Readers should carefully review these risks, as well as the additional risks described in other documents we file from time to time with the Securities and Exchange Commission. In light of the significant risks and uncertainties inherent in the forward-looking information included herein, the inclusion of such information should not be regarded as a representation by us or any other person that such results will be achieved, and readers are cautioned not to place undue reliance on such forward-looking information. Except as required by law, we undertake no obligation to revise the forward-looking statements contained herein to reflect events or circumstances after the date hereof or to reflect the occurrence of unanticipated events.
PART I
Overview
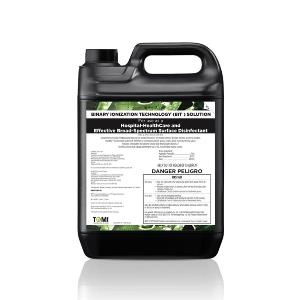
TOMI Environmental Solutions, Inc. (“TOMI”, the “Company”, “we”, “our” and “us”“our”) is a global bacteria decontamination and infectious disease control company, that specializes in disinfection and decontamination essentials using its premier Binary Ionization Technology®(“BIT™”)platform through the manufacturing, licensing, servicing, and selling of its SteraMist® brand of products. SteraMist is a hydrogen peroxide-based mist/fog registered with the U.S. Environmental Protection Agency (“EPA”) as a hospital-healthcare and effective broad-spectrum surface disinfectant. Our operating structure consists of four divisions: Hospital-HealthCare, Life Sciences, TOMI Service Network (“TSN®”) and Food Safety. We provideproviding environmental solutions for indoor and outdoor surface and air decontamination. Our mission is to help create a healthier worlddecontamination through the implementationmanufacturing, sales, service and integrationlicensing of our state-of-the-art product line and setSteraMist®brand of services, remaining committed to our motto, Innovating forproducts, including SteraMist®BIT™, a Safer Worldlow percentage (7.8%) hydrogen peroxide-based fog or mist that uses Binary Ionization Technology (BIT®™).
TOMI introduced SteraMist® to the commercial market in June 2013. In June 2015, we successfully registered SteraMist® BIT™as a hospital-healthcare disinfectant for use as a misting/fogging agent, at which time it became the first EPA-registered hospital-healthcare and general disinfectant registered solution and technology disinfection system on the market.
We have expanded our SteraMist® BIT™ Technology beyond the initial chemical and biological warfare applications to the killing of problem and resistant microorganisms, including spores, in a wide variety of commercial settings. SteraMist® BIT™ is designed to provide fast-acting biological six-log kill (a 99.9999% kill) in even the hardest-to-reach areas, while leaving no residue or noxious fumes.
We currently disinfect and decontaminate a variety of large and small indoor spaces threatened and thought to be threatened by biological pathogens and chemical agents for our domestic and international target markets. SteraMist® is used in the control of the spread of microorganisms and infectious diseases in a variety of use sites under our four (4) divisions, including hospitals, healthcare facilities (acute & chronic care), bio-safety labs of all levels including the most stringent BSL-3 and BSL-4, pharmaceutical (compounding and manufacturing), biodefense, isolation and transfer chambers, bio-safety cabinets (BSCs), food safety and other commercial and residential settings.
We believe we have the potential to become the industry standard in the prevention of transference and the overall solution for the concern regarding the level of healthcare acquired infections around the world, the impact of increased regulatory inspection of cleaning and validation processes for both pharmaceutical and food processing facilities, and the increased concern of bacterial, viral and mold infections that affects our industries, functionality, and communities’ everyday living.
Our Technology
BIT™ was developed in response to Amerithrax, the weaponized anthrax spore attacks that occurred in Washington, D.C. shortly after the September 11, 2001 U.S. terrorist attacks. BIT™is a patented processtechnology that aerosolizes and activatesproduces ionized Hydrogen Peroxide (iHP™) using cold plasma science created under a low concentration hydrogen peroxide solution, producing a fine aqueous mist (0.5-3 um in diameter) that contains a high concentration of Reactive Oxidative Species (“ROS”), mostly hydroxyl radicals (“grant by.OH”). ROS cause damage to pathogenic and resistant organisms, such as bacteria, bacteria spores, viruses, mold spores, other fungi and yeast, via oxidation of proteins carbohydrates, lipids and rendering the building blocks of nature- amino acids, DNA and RNA inactive - leading to cellular death, disruption and/or dysfunction.
Testing detailed by theUnited States Defense Advanced Research Projects Agency (DARPA) of the U.S. Department of Defense demonstrates these hydroxyl radicals, aggressively break the double bonds and other bonds in bacterial spores, biological and chemical warfare agents and neutralize their threat while producing nontoxic by-products. The unique alteration of the chemistry of our solution occurs after our EPA-registered solution passes through a high-energy-atmospheric cold plasma arc, which causes the breaking of the double bond. Our EPA registered BIT™Solution is composed of a low concentration of hydrogen peroxide molecule,converted to iHP™after passing the net result - our .OH hydroxyl radical. This hydroxyl radical is known as Ionized Hydrogen Peroxide (“iHP™”). This patented process allows these hydroxyl radicals to exist in high concentrations without rapidly recombining and losing their reactivity, while seeking to attach with any and all surfaces within the proximity of TOMI’s mist.
Thetrade secret blended solution, including its sole active ingredient of BIT7.8% hydrogen peroxide, through an atmospheric cold plasma arc. The newly formed iHP™ isfog and mist consists of submicron to 3-micron radical particles that are carried throughout the treatment area in a low percentage (7.8%) Hydrogen Peroxidefog or mist moving with the same velocity and is represented bycharacteristics of a gas. This allows the TOMIionized hydrogen peroxide fog or mist to affect all surfaces and air space throughout the targeted treatment area, over, above and beyond the ability of manual cleaning processes. iHP™ damages pathogenic organisms through the oxidation of proteins, carbohydrates, and lipids.SteraMist® brandno-touch disinfection and or decontamination treat areas mechanically, causing cellular disruptions and/or dysfunctions resulting in a 6-log (99.9999%) and greater kill or inactivation of products. Our technology produces a germ-killing aerosol that moves throughout a space like a gas. Our technology is able to efficiently and effectively kill pathogenic and resistant organismsall pathogens in the air and on the surfaces without damaging delicate equipment or computers, and the only by-product is oxygen and water in the form of humiditytreatment area.. SteraMist® is designed to be easily incorporated into any industry’s current cleaning procedures; is economical, non-corrosive and easy to apply; leaves behind no residues; and requires no manual wiping.
Under the Federal Insecticide, Fungicide, and Rodenticide Act (“FIFRA”), we arewere required to register with the EPA and certain state regulatory authorities as a seller of pesticides.disinfectants. In June 2015, SteraMist® BIT™ was registered with the EPA as a hospital-healthcare disinfectant and general broad-spectrum surface disinfectant for use as a misting/fogging agent. SteraMist® BIT™ now holds EPA registrations (# 90150-2) for mold control, and air and surface remediation (# 90150-1). In February 2016, we expanded our label with the EPA to include Clostridium C. diffdifficile spores and MRSA, as well as the influenza virus h1n1, which we believe has better positioned us to penetrate all industries including the bio-defensebiodefense and healthcare industry. In August 2017, our EPA label was further expanded to include efficacy against Salmonella and Norovirus. As of January 27, 2017, our technology is one of 53 of the EPA’s “Registered Antimicrobial Products Effective against Clostridium difficile Spores”, as published on the EPA’s K List.List. Further, in December 2017, SteraMist® was included in the EPA’s list G (Norovirus), L (Ebola) and M (Avian Flu). Currently,In March 2020, our EPA-registeredEPA label was further amended to include Emerging Viral Pathogens claims, thus meeting the criteria against Enveloped viruses and Large Non-enveloped viruses and included on List N (Emerging Viral Pathogens including SARS-CoV-2).
SteraMist®Binary Ionization Technology® allows a facility to have a mechanical method of cleaning using a Hospital-HealthCare disinfectant which is an EPA registered tool and solution to replace flawed manual cleaning technology, upgrade existing protocols, and limit liability in all fifty (50) U.S.a facility when it comes to resistant infectious pathogens. SteraMist®BIT™is the first EPA registered solution and system combination on the market.We maintain this registration in 50 states, as well as manyCanada, and approximately thirty-five (35) other countries.
Our Technology
BIT™was developed in response to Amerithrax, the weaponized anthrax spore attacks that occurred in Washington, D.C. shortly after the September 11, 2001 U.S. terrorist attacks. BIT™is a patented process that aerosolizes and activates a low concentration hydrogen peroxide solution, producing a fine aqueous mist (0.3-3 um in diameter) that contains a high concentration of Reactive Oxidative Species (“ROS”), mostly hydroxyl radicals (“OH”). ROS cause damage to pathogenic and resistant organisms, such as bacteria, bacteria spores, viruses, mold spores, other fungi and yeast, via oxidation of proteins carbohydrates, lipids and rendering the building blocks of nature’s amino acids, DNA and RNA inactive - leading to cellular death, disruption and/or dysfunction.
Testing detailed by the Defense Advanced Research Projects Agency (DARPA) of the U.S. Department of Defense demonstrated these hydroxyl radicals aggressively break the double bonds and other bonds in bacterial spores, biological and chemical warfare agents and neutralize their threat while producing nontoxic by-products. The unique alteration of the chemistry of our solution occurs after our EPA-registered solution passes through an atmospheric cold plasma arc, which causes the breaking of the double bond of a hydrogen peroxide molecule, the net result - our..OH hydroxyl radical. This hydroxyl radical is known as iHP™. This patented process allows these hydroxyl radicals to exist in high concentrations without rapidly recombining and losing their reactivity, while seeking to attach with any and all surfaces within the proximity of TOMI’s mist.
The sole active ingredient of BIT™is a low percentage (7.8%) Hydrogen Peroxide and is represented by the TOMI™SteraMist® brand of products. Our technology produces a germ-killing aerosol that moves throughout a space like a gas. Our technology is able to efficiently and effectively kill pathogenic and resistant organisms in the air and on the surfaces without damaging delicate equipment or computers, and the only by-product is oxygen and water in the form of humidity.
Each and every SteraMist®product utilizes the innovative and easy-to-use power of Binary Ionization Technology which is designed to be easily incorporated into any industry’s current cleaning procedures. No wipe, no rinse, no residue, non-corrosive, high level efficacy, quick turnaround time, superior material compatibility (spray direct on sensitive equipment), and a submicron particle allows the mist/fog to reach every area being treated regardless of what is in the space.
SteraMist®is being used throughout the world and has been demonstrated to reduce certain problem organisms, such as bacterial spores, Vancomycin-resistant Enterococcus (“VRE”), Clostridium difficile spores (“C. diff”), Middle East Respiratory Syndrome (“MERS”), Ebola (“Ebola”) and Ebola Virus Disease (“Ebola”).SARS CoV-2 the virus that causes COVID. In U.S. hospitals where SteraMist® is being used for terminal cleaning, evidence has demonstrated a reduction of C. diffClostridium difficilespore rates. SteraMist® has reduced outbreaks of nosocomial MDRO’s (Klebsiella pneumoniae, AB, pseudomonas aeruginosa) at large hospital to small clinics and has contributed to the control of MERS, Ebola and EbolaCOVID throughout the world.
Although a technology developed to combat the hardest to kill pathogens and neutralize the most difficult chemical agents, TOMI’s customer base fought at the front lines of combating the current pandemic of Coronavirus or SARS CoV-2 in 2020.
Our technology passed a sanctioned test showing six-log reduction against Geobacillus stearothermophilus. Geobacillus stearothermophilus is the laboratory testing gold standard and is commonly used as a challenge organism forsterilizationvalidation studies and periodic check of sterilization cycles. BIT In May 2015, the United States Agency for International Development (USAID) awarded us a grant in the amount of $559,000 for the development of SteraMist™ Mobile Decontamination Chambers to fight Ebola. In May 2016, upon the decontamination and decommissioning of an Ebola treatment center in West Africa, we fully achieved the milestones upon which the grant was conditioned. Additionally, BIT™has also been shown to effectively decontaminate weaponized biological agents, including weaponized anthrax, chemical agents such as VX (an extremely toxic organophosphate) and sulfur mustard (otherwise known as mustard gas) when applied using properly developed international protocols.
All our SteraMist® products are fully validated to comply with good manufacturing practice standards, have received Conformité Européene (“CE”) marks in the European Economic Area (“EEA”) and are approved by Underwriters Laboratory (“UL”). Our solution is manufactured at an EPA-registered solution blender and our product performance is supported by good laboratory practice efficacy data for Staphylococcus aureus, Pseudomonas aeruginosa, Salmonella, Norovirus, SARS CoV-2, mold spores, MRSA, h1n1, Geobacillus stearothermophilus and C. diff Clostridiumdifficilespores.
Our Products and Services
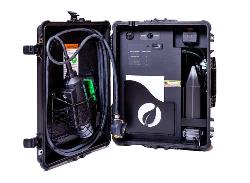
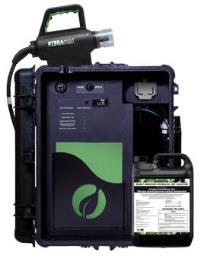
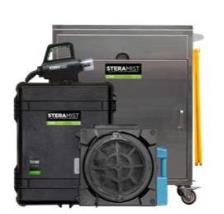
SteraMist Surface Unit
SteraMist®Surface Unit Our SteraMist®Surface Unit is a fully portable, handheld, point and spray disinfection/decontamination system intended to provide quick turnover of any affected space. The single applicator unit enables disinfection of all surfaces, including high touch, sensitive equipment and electronics. An application time of only five seconds per square foot and seven-minutewith no wet contact time allows for safe re-entering of the space within minutes after applying the iHPmist.application. Our SteraMist®Surface Unit is lightweight, easy to transport and capable of achieving reliable disinfection/decontamination results, as it is easily incorporated into existing cleaning procedures and protocols. It can be used as a standalone hospital terminal clean product or as an adjunct to ultraviolet disinfection and is a perfect solution to exit and entry barrier points of a facility. The SteraMist®Surface Unit does not require heating, ventilation or air conditioning systems to be shut down. Further, its touchless application (no wipe, no rinse) reduces risk of cross-contamination between treated surfaces. | |
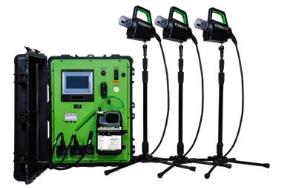
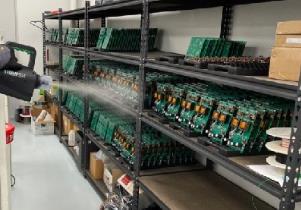
SteraMist®Environment System Our SteraMist®Environment System is a transportable, remotely-controlled (robotic)remotely controlled system that provides complete room disinfection/decontamination of a sealed space up to 103.8 m3 (3,663(3,663 ft3) in just over 75under 45 minutes (application contact, and aerationdwell time). Individually, each remote applicator can be used to treat a space of approximately 34.6 m3 (1,221(1,221 ft3). Injection times are based on individual room size and number of applicators. Multiple SteraMist Environment Systemssystems can be used simultaneously to accommodate larger or multiple spaces with fast application and minimal down time. Our hybrid technology applicators can be used in both manual and/or fogging modes. Our SteraMist®Environment System features additional programmable and printable features in PDF format. Other key features include lot # of BIT™Solution, location identifier, injection/dwell/aeration times, and error notifications. These features are required for many Life Science facilities. | |
|
|
The E-Z SteraMist®Total Disinfection Cart The E-ZTotal Disinfection Cart was designed by request of multiple public healthcare facilities EVS (Environmental Service) teams using our equipment for the SHIELD study that TOMI is participating in. The cart houses our Surface Unit, a portable H2O2 monitor, Carbon Air Scrubber, MaxAir Helmet Respiratory Protection System with positive pressure air flow, storage hooks, and a sign notifying the room is being treated. Included with the E-Z Cart is a custom ICU 45-minute55-minute terminal cleaning protocol.
| |
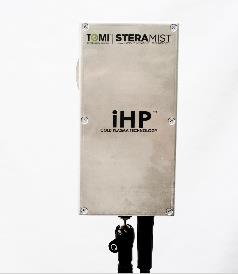
SteraMist®Select Surface Unit Our Select Unit was designed to meet the needs of our customers who have smaller enclosures in need of decontamination. This unit is lightweight and easy to transport with the added ability to function between a lower flow operation and standard operation, such as the SteraMist®Surface Unit. The user can adjust air flow, adjust pump fluid flow, set the programmable timer for automatic runs, modify spray/dwell times and number of cycles, and is equipped with start and stop buttons. It is ideal for the decontamination of Laminar flow cabinets, Biosafety cabinets, Isolators and other small and medium size laboratory and research equipment. | |
Stainless Steel 90 Degree Applicator TOMI’s standard applicator was converted to a 90 degree and manufactured using 316 stainless steel, the ideal applicator to accompany the Select Surface Unit, affording many 90-degree build-in opportunities. This applicator can beis purchased with a flange for ease of installation either permanently or semi-permanently. | |
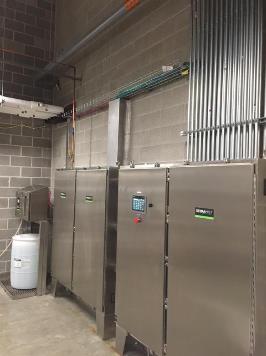
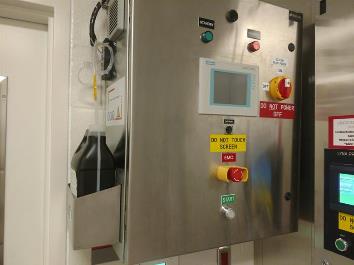
SteraMist Permanent iHP Complete Disinfection Room
The SteraMist Permanent iHP Disinfection Room is an automated system that is plumbed utilizing the facilities’ existing HVAC system. This involves permanently installing SteraMist applicators within the designated space to achieve maximum results. The generator and Programmable Logic Control (PLC) are housed in a National Electrical Manufacturers Association (NEMA) enclosure in a central remote location. The entire system can be developed for multiple rooms and various specifications, controlled remotely through the NEMA interface. The status of the decontamination cycle is monitored with indicators and can be integrated into a Supervisory Control And Data Acquisition (SCADA) monitoring board.
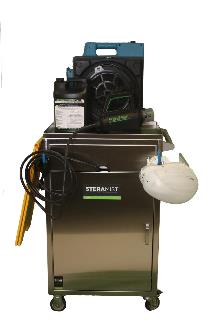
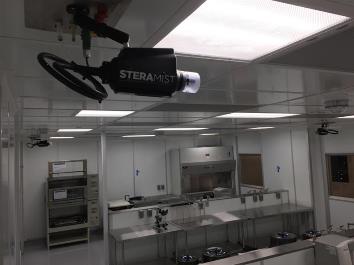
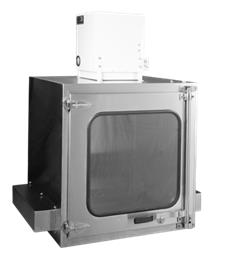
iHP™Plasma Decontamination Chamber With prior approval ourOur patented cold plasma technology can be integrated with a chamber or cage washer by competitiveleading manufacturers. Current examples are Lynx, BetterBuilt and BetterBuilt. The photo demonstrates our IHP Decontamination Chamber built into a lab at the University of Houston.Allentown. Our custom generator/chamber is built into a stainless-steel single door panel and is permanently mounted next to the chamber or washer, while a SteraMist applicator®Applicator or 90 Degree Applicator is permanently or semi-permanently mounted in the enclosure. This SteraMist®product line includes but is not limited to an internally mounted air compressor, regulator for air pressure adjustment, E-stop button, lever power switch, data logging functions, and multiple dry contract outputs determined by the needs of the customer.
| |
|
|
SteraMist®Custom Engineered System (CES) The SteraMist®permanent installation is perfect for any room that requires routine automated disinfection decontamination. The CES is an automated system that is plumbed utilizing the facilities’ existing HVAC system. This involves permanently installing SteraMist®applicators within the designated space to achieve maximum results. The generator and Programmable Logic Control (“PLC)” are housed in a National Electrical Manufacturers Association(“NEMA)” enclosure in a central remote location. The entire system can be developed for multiple rooms and various specifications, controlled remotely through the NEMA interface. The status of the decontamination cycle is monitored with indicators and can be integrated into a Supervisory Control and Data Acquisition (“SCADA)” monitoring board. The system is now available with a scale to measure the use of BIT Solution for a customer’s ease of reordering our consumable and comes in a variety of drum sizes. In addition, this product includes a new upgrade of 90-degree rotating applicators providing even faster equal dispersion of the iHP™ fog. | |
iHP™Corporate Service Decontamination TOMI offers full room, equipment, facility, and emergency disinfection/disinfection and decontamination services. Our goal is to reducegive our customers quality control by reducing bioburden and eliminate the potential for costly microbial contamination preventing laboratory outbreaks. If a lab is dealing with a current outbreak TOMI’s iHP service will containin the Life Sciences and prevent future outbreaks.Food Safety industries. Single and routine services are provided to TOMI customers to coincide with maintenance, mandatory facility shut downs,shutdowns, or to control a specific threat. ●The SteraMist systems are versatile and easy to maintain with relatively low upkeep. In fact, preventive maintenance is not required to be performed by a service engineer and remote guidance can be provided upon request.
| |
Industries & Market Segments
We believe that our technology, service, andAll the above product offerings providehelp our customers create a healthier world by providing them a significant opportunity to help reduce the spread of Community Associated Infections (“CAI’s”) and Healthcare-Acquired Infections (“HAI’s”). and the most lethal of pathogens including our recent SARS CoV-2 pandemic and future pandemics.
SteraMist® and TOMI’s related service platforms are currently being used in a broad spectrum of industries including but not limited to:
●Pharmaceutical companies
●Clean rooms
●Hospitals & medical facilities
●Bio-safety labs
●Tissue labs
●Vivariums
●Research Universities
●Military & Government Agencies;
●Office buildings
●Hospitality
●Schools
●Transportation;
●Athletic facilities;
●Single-family homes and multi-unit residences;
●Cannabis processing, manufacturing, and testing labs;
●Patient Medical Transport Airline;
●Cruise Ships;
●Entertainment establishments;
Life Sciences. Our SteraMist® line of products is a decontamination solutionhas the ability to use sites in this industry, specifically pharmaceutical (compounding and manufacturing), vivariums, research universities, BSLs offit into any level, BSC’s, chambers, isolators, cage washers, and cleanrooms. With proper implementation SteraMist® can reduce the risk of infectious as well as potentially infectious agents and/or materials, facilities such ascleaning protocol. We have categorized these handle on a routine basis.
There are many requirements and restrictions on the type of decontamination agents ourindustries into five (5) divisions: Hospital-HealthCare, Life Sciences, customers may use to prevent these risksTOMI Service Network (TSN), Food Safety, and remediate adverse incidents. In light of these regulations, our rapid deployment of our effective ionized hydrogen peroxide aerosolized mist is the solution to lower risks, reduce damage to expensive laboratory equipment and furniture, eliminate other labor intense procedures, and perform decontamination clean-up in these spaces quickly, less caustically, requiring no wipe and with no residue.
Our team of technicians and representatives train, maintain, and troubleshoot capital equipment globally for our Life Sciences customers. Further, our iHP™Commercial division. service decontamination team provides routine, emergency, and/or commissioning or decommissioning of facilities equipment or full complete space decontamination for its customer base.
Hospital-HealthCare. Our SteraMist® line of products, specifically the SteraMist®Surface Unit and EZ SteraMist®Total Disinfection Cart are solutions to aid our Hospital-HealthCare customers in providing the quality of care and safety they provide to their patients by disinfecting patient and operating rooms, pharmacies, ambulances, and emergency environments in a hospital or healthcare facility. Our team of technicians and representatives train, maintain, and troubleshoot capital equipment throughout the world for our Hospital-HealthCare customers.
We continue to penetrate the hospital-healthcare market segment, and under the United States Patient Protection and Affordable Care Act’s (also known as the Affordable Care Act or ACA) Hospital Readmissions Reduction Program, hospitals that have high rates of infections and HAIs are facing significant financial penalties. Our SteraMist® BIT™ technology has proven to reduce the transference spread of infections leading to an overall reduction in the number of patients being infected as a result of the priorhistoric poor manual cleaning of these patient rooms, infectious disease rooms and operatory suites, with a corresponding return on investment to the hospital of up to 20-to-1 in the first year. At
Life Sciences.Our SteraMist®line of products is a decontamination solution to use sites in this time, we cannot predictindustry, specifically pharmaceutical (compounding and manufacturing), vivariums, research universities, BSLs (biological safety labs) 1, 2, 3 and 4 level, BSC’s (biological safety chambers), isolators, cage washers, and cleanrooms. With proper implementation of SteraMist®, all facilities can reduce the effectrisk of any potential healthcare reform legislation, includinginfectious as well as potentially infectious agents and/or materials, which facilities such as these handle on a routine basis.
There are many requirements and restrictions on the potential repealtype of decontamination agents our Life Sciences customers may use to prevent these risks and remediate adverse incidents. In light of these regulations, our rapid deployment of our effective iHP™aerosolized mist is the Patient Protectionsolution to lower risks, reduce damage to expensive laboratory equipment and Affordable Care Act, on such penalties.furniture, eliminate other labor intense procedures, and perform decontamination clean-up in these spaces quickly, less caustically, requiring no wipe and with no residue. By using iHP technology these most important facilities are able to perform more experiments a year due to the effective quick treatment that iHP offers.
Our team of technicians and representatives train, maintain, and troubleshoot capital equipment globally for our Life Sciences customers. Further, our iHP™Corporate Service decontamination team provides routine and emergency treatment. TOMI’s iHP™service team also does commissioning and decommissioning of facilities equipment or full complete space decontamination for new and existing customers.
The TOMI Service Network. The TSN, has allowed us to enhance our corporate service division by creating a multi-nation-wide network composed of existing, full-service specialists. Since the launch of TSN, we have recruited and entered into eighty-eight (88) licensing agreementsadded two hundred (200) service partner companies across the United States and Canada. These are professional leaders and first responders that specialize within the mold remediation, hurricane and tornado response and other mitigation fields, bio-safety and biohazard specialists including forensic restoration specialists.
These professional servicing specialists (TSN partners) focus their businesses in the commercial and residential space. Our team of TSN Business Managerscustomer experience managers and SteraMist® technicians train, maintainour training department maintains and troubleshoottroubleshoots capital equipment for these individuals with the goal of implementing servicing procedures and protocols throughout the United States and Canada for our TSN network members.partners. Members are provided access to 24/7 support in marketing their iHP service divisions and landing webpage connected to tomimist.com.
In September 2018, we partnered with the Global BioRisk Advisory Council (“GBAC”) to use SteraMist® as one of the training technologies used in their certification classes. This also allows for the decontamination of everyday crises as well as forensic restoration and bio-hazard scenes as needed. TOMI also launched the Forensic Restoration Service Team (or “FRST”), a U.S. based TOMI-certified forensic restoration and crime clean network. This network is comprised of service providers who specialize in forensic restoration such as mass casualty, crime scene, suicide and unattended death cleanup. Also included within this field are hoarding and bio-recovery services. Participating FRST members will receive specialized training and certifications by GBAC. We have four (4) certified FRSTmembers to date.
Food Safety Industry. SteraMist™®aerosolizing cold plasma technology is an effective decontaminant in the food safety industry. According to the CDC, 80 million people per year in the United States contract, and 5,000 people die from, food poisoning or other food-related illnesses. Current food safety cleaning techniques involve time intensive processes, which can reduce food manufacturers’ profit. Our iHP™ degrades into only harmless water (humidity) and oxygen. After we obtainWe have applied for approval byfrom the United States Food and Drug Administration (the “FDA”) and the United States Department of Agriculture (the “USDA”), when approved we anticipate that our solution can be applied directly to all foods. Currently we use SteraMist®on all food packing, processing and storage equipment as SteraMist® is safe for use on electronics and kitchenware, along with high touch surfaces where most pathogens are found (such as phones, computers and kitchen appliances). We believe that SteraMist® could be useful for decontamination at all phases of food production, from the farm, slaughterhouse, packaging and canning facilities, food storage locations to the transportation of food and to the restaurants and grocery stores.
Medical Cannabis.Commercial. TOMI is lookingcommercial division addresses the viral pathogens threat to entereveryday operations. We bring powerful disinfection and decontamination to a wide array of industries with computability in endless use sites, from large-scale land, sea, and air transportation to county and state emergency facilities to retail and educational facilities. Our commercial customers have the global medicalgoal to keep employees and recreational cannabis market. Currently we are researching how the BIT Solution and the iHP process can be used to rid the cannabis plant of the following:
- Powdery Mildew (odium, white mold)
- Spider Mites, Thrips, Root Aphids & Fungus Gnats
- Bud Rot (Botrytis cinerea)
- Load counts on coliform, microbes, bacteria, e.coliand other molds.
- Direct plant application, soil application and whole room application
- Residuals left on the plant
All tests will also include whether or not the process affects the THC and Cannabinoid levels of the plant.
SteraMist®can be used in cannabis facilities globally upping the industry standard of disinfecting areas between grows. For example, the cannabis drying/curing/cloning/grow rooms, manufacturing/packaging areas, on-site laboratories, storage rooms, and employee restrooms and locker rooms. According to the Canadian Imperial Bank of Commerce analysts forecast the projected 2019 sale of both medical and recreational cannabis in North America is currently being estimated to reach $7 billion in Canada and $4.5 billion in the United States, with the expectation of the U.S. market doubling the Canadian market in sales if a full federal legalization is passed by 2020.first responders healthy while maintaining operations.
Homeland Defensedefense and Border Protection.border protection is a subspecialty of our commercial division. Countries around the world, including the United States, need to protect their borders and cities against a potential terrorist attack. Our SteraMist® line of products will give governmental bodies an added tool in their arsenal to mitigate the risk of a weaponized biological and chemical attack. In addition, SteraMist® could assist in mitigating the spread of emerging pandemic viruses, including strains of Ebola, MERS, MLAV (filovirus), and influenza virus subtypes like h1n1, h5n1, h7n9 and h10n8. Our SteraMist® line of products may assist border patrol agents in controlling the spread of infectious disease introduced by foreign individuals by decontaminating interview rooms, containment rooms, holding cells and quarantine areas after a potential infected carrier’s condition either improves or the carrier dies.
INFORMATION WITH RESPECT TO OUR BUSINESS IN GENERAL
Manufacturing
We outsource the manufacturing and blending of our SteraMist® line of equipment and BIT™ Solution. Our SteraMist® equipment manufacturer is anmanufactured by two (2) ISO9001 registered companycompanies with facilities in Pennsylvania, New York, New Jersey, and New Jersey.Australia.
Our solution is blended by an EPA approved blender; our blend includes as the onlyone (1) active ingredientsingredient, 7.8% Hydrogen Peroxide.
TOMI maintains sole source distribution of all the SteraMist® product lines, including our BIT™ Solution. Neither our manufacturer or chemical blender may make modifications to the manufacturing or blending of our products without our request or consent in written format. TOMI maintains all creative control throughout the design and manufacturing process, which includes research & development through final product fabrication.
Intellectual Property
Our success depends in part upon our ability to obtain and maintain proprietary protection for our products and technologies. We protect our technology and products by, among other means, obtaining United States and foreign patents. There can be no assurance, however, that any patent will provide adequate protection for the technology, system, product, service or process it covers. In addition, the process of obtaining and protecting patents can be long and expensive. We also rely upon trade secrets, technical know-how, and continuing technological innovation to develop and maintain our competitive position.
As part of our intellectual property protection strategy, we have registered our BIT™ solution with the Environmental Protection Agency (“EPA”), all fifty (50) states in the United States, and multiple countries worldwide. We have received Conformité Européene (“CE”) marks in the European Economic Area (“EEA”) and are approved by Underwriters Laboratory (“UL”).
We currently hold thirty-four (34)Our portfolio includes more than twenty (20) Utility patents across the globePatent applications worldwide for both method and have submitted for four (4) additional utility patents to the USPTO and a PCT with the International Authorities. Further,system claims on SteraMist® BIT™, either published or undergoing prosecution. Most recently, in November 2020, we were granted twenty-one (21)utility patents in Australia and Israel for our SteraMist® BIT™ technology. In the recent past, we have obtained two related United States utility patents giving us protection of our technology until the year 2038, and we are pursuing further claims to additional capabilities in on-going United States and worldwide patent applications. In May 2020, we filed a PCT application for further additional applications of SteraMist® BIT™ which were determined to be novel and inventive by the international search authority.
Further in 2020, we submitted utility patents in multiple countries which are all in the national stage for review under the patent prosecution highway for claims found novel and inventive by the international search authority. Once these are received, we will hold international acceptance for the inherited patents and our newly received patents. During 2020, we were awarded a design patent on our surface-mounted applicator device in the United States, China, Japan, Taiwan, and Korea. We have filed and have been granted or have pending acceptance on thirty-two (32) separate design patents with two (2) additional ones pending approval. Ourfor our: Decontamination Chamber(s), Decontamination Applicator, Decontamination Cart, Applicator, and Surface Mounted Applicator 90-Degree Device. These patents (utility and design) are in countries which includepublished around the world, including but are not limited to Canada,United States, China, Korea,Hong Kong, Europe, United Kingdom, Singapore, Taiwan, Belgium, Italy,Vietnam, Canada, South Korea, and Spain. Patents for individual products extend for varying periods according to the date of filing or grant and legal term of patents in various countries where a patent is obtained. The actual protection a patent provides, which can vary from country to country, depends upon the type of patent, the scope of its coverage, and the availability of legal remedies in each country.Japan.
Our products are sold around the world under various brand names and trademarks. We consider our brand names and trademarks to be valuable in the marketing of our products. As of December 31, 2018,March 1, 2021, we hadheld a total of one hundred seventy-eight (178) trademarks (word and logo) registered or pending across the globe. TOMI registers marks in seven (7) trademark registrations in the United States across as manyclasses of seven (7) separate classes, manyspecification of which are registered in multiple classes,goods and we have three (3) additional trademark submissions in review with the USPTO. In addition, we hold three (3) of these trademark registrations in various foreign countries in as many as five (5) separate classes, many of which are registered in multiple classes.services: Class 1 for Chemicals for Treating Hazardous Waste, Class 5 for Disinfectants, All-Purpose for Hard Surfaces and for Treating Mold, Class 7 for Handheld Power Operated Spraying Machines, Class 11 for Sterilizers for Medical Use and Air Purification, Class 35 for Business Consultation and Management Services, Class 37 for General Disinfecting Services, and Class 40 for Chemical Decontamination and Manufacturing Services.
Marketing and Distribution
Through our brand awareness, marketing, social media presence and sales, our business growth objective is to be athe global leader in disinfection and decontamination products sales, services, and manufacturing. We intend to continue to expand and support research and development on other decontamination and remediation solutions (including hydroxyl radicals and other ROS), and to form more business alliances with strategic partners.
We continue to perform decontamination services within cleanrooms, bio-safety labs, tissue and blood labs, pharmaceutical labs, vivariums and research universities and we continue to secure additional license agreements with major remediation, construction, forensic clean-up and bio-safety servicing companies. Both of these strategies assist in the brand awareness and use of our suite of products.
In the late first quarter of 2020, due to the COVID outbreak, the customer base of TOMI SteraMist®products expanded quickly. As a result of successfully training and implementing the SteraMist brand of products and protocols into our customer base, we benefited from referrals, testimonials, and an increase in media presence.
We sell our products domestically through our internal sales force, as well as independent sales and manufacturing representatives. Internationally, our products are sold through exclusive and non-exclusive sales representatives and distributors. We have shippedIn late 2020 and during the first quarter 2021, TOMI has onboarded three new vice presidents of sales for the promoting, demonstrating, and selling of its SteraMist®products in three of our equipmentsales verticals, commercial, life sciences and solution into twenty (20) countries worldwide.food safety. Each of these hires are expected to expand their divisions both with new customers and expanding the direct inside sales teams.
Competition
The decontamination and environmental infectious disease control industry is extremely competitive and highly regulated. Competition is intense in all four (4)five (5) of our divisions and includes many large and small competitors.
Our competitors include companies that market other hydrogen peroxide-based products, such as Steris Corporation (“Steris”), Bioquell, Inc. (“Bioquell”) currently owned by Ecolab, Inc. (“Ecolab”) and The Clorox Company (“Clorox”), various ultraviolet companies and quad ammonia-chemical companies. During 2020 due to the COVID outbreak, new competitors that manufacture and sell Electrostatic Sprayers and biostatic protectants, specifically to the Commercial industry, entered the market.
We believe our SteraMist®suite of products have a competitive advantage to our competitor’s products in that they have aare quicker and less caustic, kill time, provideprovides a six log kill to a wide variety of pathogens and leave no residue or unpleasant odor. However, some of these competitors may have longer operating histories, greater name recognition, larger installed customer bases and substantially greater financial and marketing resources than us.
We believe that the principal factors affecting competition in our markets include name recognition and the ability to receive referrals based on client confidence in the service. There are no significant barriers of entry that could keep potential competitors from opening similar facilities. Our ability to compete successfully in the industry will depend, in large part, upon our ability to market and sell our indoor decontamination and infectious disease control products and services. There can be no assurance that we will be able to compete successfully in this industry, or that future competition will not have a material adverse effect on our business, operating results and financial condition.
We believe that our growth in these industries as a leading global disinfection/decontamination company depends on our abilities to discover, develop, market, and innovate, disruptive cost-effective products and services.
Competitive Advantages
We believe the SteraMist® technology has many competitive advantages over its competition. Our technology can turn over a space to an end-user far faster than its competition. Our technology requires limited preparation to an area compared to our competitors and does not rely on fans or any outside force to move throughout a space. Our “.OH” is a small 0.5 to 3-micronthe smallest submicron 0.3-3-micron particle that receives a charge and can move around an area like a gas, going above, below, and beyond the hardest to reach areas.
Another key and critical advantage is the technology’s superior material compatibility. The hydroxyl radical allowing to kill on contact and leave no dangerous byproducts in the areas being treated. It is important the world is educated and aware of the harsh chemicals that exist on the market, and used with Electrostatic Sprayers, as they will not ensure proper efficacy on the surface being treated as even if the chemical is EPA registered, it may not be compatible with the sprayer. For example, the sprayer may not be spraying enough of the chemical to kill the virus or the bacteria, in addition to a lot of these harsh chemicals and sprayers are destroying materials and equipment over time, ending to be a much more costly product.
It is our position there is no other product on the market like SteraMist. A technology that can treat almost 4,000 cubic feet in 45 minutes with a contact time of only 15 minutes or spray surfaces 5 seconds per square foot with no wet time. A technology with all the competitive advantages required in disinfection, where other disinfectants will have a select few. No wipe, no rinse, no residue, non-corrosive, high level efficacy (developed by DARPA for Anthrax spores), quick turnaround time, superior material compatibility (spray direct on sensitive equipment), and our submicron particles which moves like a gas allows the mist/fog to reach every area being treated regardless of what is in the space.
In summary, SteraMist® offers the following competitive advantages:
●
Provides a 99.9999% or six-log kill and above kill (i.e., the statistical destruction of all microorganisms and their spores) on all challenged pathogens, on multiple surfaces including Bacillus atrophaeus spores, Bacillus subtilis spores and Geobacillus stearothermophilus, the spore that is considered a gold standard for validation of sterilization versus household/industrial cleaners that offer a 99.9% (sanitizing) or three-log kill to 99.99%,(disinfection) or four-log kill.
●
Does not require mixing of materialsmaterials.
●
No Wipe, No RinseRinse.
●
Does not include silver ions or peracetic acid.
●
Not affected by humidity or temperature.
●
Does not damage medical or electronic equipment.
●
By-products converts to humidity.water (humidity) and oxygen.
Research & Development
We are generating and supporting research on improving, extending and applying our patents in the field of mechanical cleaning and decontamination. Research and development expenses for the years ended December 31, 20182020 and 2017,2019, were approximately $916,000$455,000 and $454,000,$341,000, respectively.
Government Regulation
Our business is subject to various degrees of governmental regulation in the countries in which we operate. In the United States, the EPA, the FDA and other governmental authorities regulate the development, manufacture, sale, and distribution of our products and services. Our international operations also are subject to a significant amount of government regulation, including country-specific rules and regulations and U.S. regulations applicable to our international operations. Government regulations include detailed inspection of, and controls over, research and development, product approvals and manufacturing, marketing and promotion, sampling, distribution, record-keeping, storage, and disposal practices. We believe that we are currently compliant in all material respects with applicable regulatory requirements. To date, every registration for our technology we have applied for has been accepted.
Employees
As of March 15, 2019,1, 2021, we have nineteen (19)twenty-nine (29) full-time executive, operational and administrative employees working within the United States and one (1) consultant.States. Most of our sales are conducted by global exclusive distribution agreements or domestically by our internal sales team or independent manufacturing representatives.
Our business routinely encounters and attempts to address risks, some of which will cause our future results to differ, sometimes materially, from those originally anticipated. Below, we have described our present view of certain important risks. The risk factors set forth below are not the only risks that we may face or that could adversely affect us. If any of the risks discussed in this Annual Report on Form 10-K actually occur, our business, financial condition and results of operations could be materially adversely affected. If this were to occur, the trading price of our securities could decline significantly.In assessing these risks, investors should also refer to the other information contained or incorporated by reference in our other filings with the SEC.
Risk Related to Our Company and Business
Prior to 2020, we have historically experienced losses from our operations, may not be able to sustain profitability and may need to seek additional financing to sustain our operations.
We generated net income of approximately $4.4 million for the year ended December 31, 2020, incurred a net loss of $2.3 million for the year ended December 31, 2019 and had an accumulated deficit of $39.1 million as of December 31, 2020. We have experienced losses historically,been increasing our headcount and expenses to support our continued product development and planned growth, and if demand for our products declines and we are unable to sustain our recent increases in our net income, we may not be requiredable to obtain additional financing and may never achieve and sustain profitability.
We incurred net losses of approximately $3.2 million and $3.6 million for the years ended December 31, 2018 and 2017, respectively. We may continue to incur net losses for the foreseeable future as we continue to develop our products and seek customers and distribution for our products. Even if we achieve profitability, we may be unable todo sustain or increase profitability on a quarterly or annual basis. Further,basis, we may still need to seek additional financing to facilitate our continued growth. To finance our product development and grow our business, we may seek funds through borrowings or through additional rounds of financing, including private or public equity or debt offerings. We may be unable to raise funds on commercially reasonable terms or at all. In addition, the sale of additional equity or convertible debt securities could result in additional dilution to our shareholders. If we borrow additional funds or issue debt securities, these securities could have rights superior to holders of our common stock and could contain covenants that will restrict our operations. If we do not obtain additional resources or achieve and sustain profitability, our ability to capitalize on business opportunities will be limited, the growth of our business will be harmed, our business may fail, and investors may lose all of their investment.
A pandemic, epidemic or outbreak of an infectious disease in the United States or worldwide, including the outbreak of the novel strain of coronavirus disease, COVID-19, could adversely affect our business.
If a pandemic, epidemic or outbreak of an infectious disease occurs in the United States or worldwide, our business may be adversely affected. In December 2019, a novel strain of coronavirus, SARS-CoV-2, was identified in Wuhan, China. Since then, the SARS-CoV-2 virus, and the resulting disease, COVID-19, has spread to most countries, and has caused the worldwide COVID-19 Pandemic. While the demand for our products generated from the COVID-19 Pandemic has positively impacted our financial position, it has negatively impacted our operational condition in two divisions by forcing us to implement various policies for the safety of our employees, including “work from home” policies and office social distancing policies, which may lead to lower productivity of our employees and a decrease in the innovation and advancement of our products. Beyond our own policies, numerous state and local jurisdictions have previously imposed, and others in the future may impose, “shelter-in-place” orders, quarantines, executive orders and similar government orders and restrictions for their residents to control the spread of COVID-19, which negatively affects our operations and potentially the demand for our products and services. However, these “shelter-in-place” measures and challenges will likely continue for the duration of the pandemic, which is uncertain, and may continue to negatively impact our operations.
Significant outbreaks of contagious diseases such as COVID-19, and other adverse public health developments, could have a material impact on our inventory position or inventory costs due to its impact of our third-party suppliers. Further, our efforts to maintain an adequate stock of all our product components may not be sufficient to avoid a disruption to our production capacity due to the current COVID-19 Pandemic or similar events that may occur in the future.
Other disruptions or potential disruptions include restrictions on the ability of our sales representatives and other personnel to travel and access customers for training and case support; disruptions in our production schedule and ability to manufacture and assemble products; delays in actions of regulatory bodies; diversion of or limitations on employee resources that would otherwise be focused on the operations of our business, including because of sickness of employees or their families or the desire of employees to avoid contact with groups of people; business adjustments or disruptions of certain third parties, including suppliers; increase in bad debts due to an adverse impact of the pandemic on our clients’ cash flows and resulting decrease in collectability of our account receivables; and additional government requirements or other incremental mitigation efforts that may further impact our or our suppliers’ capacity to manufacture our products.
While the potential economic impact brought by, and the duration of any pandemic, epidemic or outbreak of an infectious disease, including COVID-19, may be difficult to assess or predict, the widespread COVID-19 Pandemic could cause disruption of global financial markets, reducing our ability to access capital, which could in the future negatively affect our liquidity. In addition, a recession or market correction resulting from the spread of an infectious disease, including COVID-19, could materially affect our business for the same reasons.
Our recent increase in our net income was largely caused by a spike in demand for sanitation products and services created by the COVID-19 Pandemic and may not be sustainable.
The COVID-19 Pandemic has increased the global demand for sanitizing products and services which help prevent the proliferation of COVID-19. Our products and services are among those that have seen an increase in demand due to the COVID-19 Pandemic, causing us to realize an increase in revenues and making us profitable for the first time. If these new customers as a result of COVID-19 do not continue to use our products after the COVID-19 Pandemic has subsided, our sales may be negatively impacted.
Continued rapid growth may strain our internal resources, which would hamper our ability to manage our growth effectively, create operating efficiencies or sustain profitability.
We are experiencing a rapid growth in the demand for our products and services in connection with the COVID-19 Pandemic which may strain our financial and operational resources that were established to meet a lower level of demand. Due to our rapid growth, we may not be able to effectively manage the expansion of our operations or recruit and train additional qualified personnel at the pace needed to meet the demand for our products and services. Further, the expansion of our operations may lead to significant costs and may divert our management and business development resources. Any inability to manage our growth could delay the execution of our development and strategic objectives or disrupt our operations. Any operational disruptions may take the form of a decrease in the quality of customer service, reporting problems and delays in meeting important deadlines, all of which could result in a loss of market share and other problems that could adversely affect our reputation and financial performance.
Our SteraMist®family of products currently accounts for the majority of our revenue, and our success is almost completely dependent on the success of our SteraMist®brand.
Our SteraMist®family of products is currently our primary product offering, and we are completely dependent on its success. Successfully commercializing products such as ours is a complex and uncertain process. Our commercialization efforts will depend on the efforts of our management and sales team, our third-party manufacturers and suppliers and general economic conditions, among other factors, including the following:
●
the effectiveness of our marketing and sales efforts in the United States and internationally;
●
our third-party manufacturers and suppliers’ ability to manufacture and supply the components of our SteraMist®products in a timely manner, in accordance with our specifications, and in compliance with applicable regulatory requirements, and to remain in good standing with regulatory agencies;
●
the availability, perceived advantages, relative cost, relative safety, and relative efficacy of alternative and competing disinfection products;
●
our ability to obtain, maintain, and enforce our intellectual property rights in and to our SteraMist®products;
●
the emergence of competing technologies and other adverse market developments, and our need to enhance our SteraMist®products and/or develop new products to maintain market share in response to such competing technologies or market developments;
●
our ability to raise additional capital on acceptable terms, or at all, if needed to support the commercialization of our SteraMist®products; and
●
our ability to achieve and maintain compliance with all regulatory requirements applicable to our SteraMist®products.
We have hired and trained additional sales professionals to account for the increased demand for our products. Despite this growth in sales personnel, we expect that our additional sales force will require lead time in the field to grow their network of accounts and achieve the productivity levels we expect them to reach in any individual territory. Furthermore, the use of our products will often require or benefit from direct support from us. If our sales representatives do not achieve the productivity levels, we expect them to reach, our revenue will not grow at the rate we expect, and our financial performance will suffer.
We have no long-term customer contracts, and our sales history or backlog cannot be relied upon as an indicator of our future sales.
We do not have long-term contracts with any of our customers, and our sales history or backlog cannot be relied upon as a future indicator of our revenues. Our contracts and purchase commitments with customers may be canceled under certain circumstances. As a result, we are exposed to competitive price pressures on every order, and our agreements with customers do not provide assurance of future sales. Our customers are not required to make minimum purchases and may cease purchasing our products at any time without penalty. As such, our unfilled orders and previously completed sales should not be relied on as a measure of anticipated demand or future revenue.
Our agreements with restoration industry specialists are not exclusive, which may allow for our competitors to sell their products and services to such specialists.
Our agreements with restoration industry specialists under our TOMI Service Network program, which allows certain restoration specialists to use and sell our products, are not exclusive. This lack of exclusivity allows our competitors to sell products to the same restoration specialists which could reduce our sales if our competitors’ products are used in lieu of our products. Additionally, the use of our and our competitors’ products by a restoration specialist may create market confusion between our products and the products of our competitors, which may adversely affect our brand reputation and business.
Our success depends upon broad market acceptance of our technology that has not yet been achieved.
Our BIT technology as a Hospital-Healthcare disinfectant is relatively new, having received full Hospital registration for Clostridiumdifficilespores from the EPA in mid-2017. Our sales are dependent upon broad market acceptance of our technology that replaces long-standing failing manual cleaning techniques such as quaternary ammonium compounds and bleach for disinfection, with our no-touch mechanical process. The failure to obtain broad market acceptance inevitably leads to substantially increased lead times for sales until our prospective customers, particularly in the Hospital-Healthcare market, are accustomed to the use of newer mechanical technology. The inability to timely meet our sales goals could adversely affect our financial condition and results of operations.
We are subject to a variety of risks associated with doing business internationally.
We maintain, and have grown over the last year, significant international operations, including operations in the U.S., Canada, Mexico, Europe, Asia Pacific and Latin America. As a result, we are subject to a number of risks and complications associated with international manufacturing, sales, services, and other operations. These include: risks associated with currency exchange rate fluctuations; requirements or preferences for domestic products or solutions, which could reduce demand for our products; difficulties in enforcing agreements and collecting receivables through some foreign legal systems; unexpected legal or regulatory changes; enhanced credit risks in certain countries and emerging market regions; significant variations in tax rates among the countries in which we do business, and tax withholding obligations in respect of our earnings; exchange controls or other trade restrictions including, the impact of the COVID-19 Pandemic on our supply chain and the industries in which we operate; customs clearance and shipping delays; general economic and political conditions in countries where we operate or where end users of our products are situated, including the potential implications of the COVID-19 Pandemic; natural disasters, political and economic instability, including wars, terrorism and political unrest, outbreak of disease, travel, social distancing and quarantine policies, boycotts, curtailment of trade, and other business restrictions affecting our ability to manufacture or sell our products; difficulties associated with managing a large organization spread throughout various countries; difficulties in enforcing intellectual property rights or weaker intellectual property right protections in some countries; and difficulties associated with compliance with a variety of laws and regulations governing international trade.
If our procedures to ensure compliance with export control laws are ineffective, our business could be harmed.
Our sales to foreign entities are subject to far reaching and complex export control laws and regulations in the United States and elsewhere. Violations of those laws and regulations could have material negative consequences for us including large fines, criminal sanctions, prohibitions on participating in certain transactions and government contracts, sanctions on other companies if they continue to do business with us and adverse publicity.
Failure to comply with the U.S. Foreign Corrupt Practices Act (“FCPA”), and similar laws associated with our activities outside of the United States could subject us to penalties and other adverse consequences.
Failure to comply with the FCPA, and similar laws associated with our activities outside of the United States could subject us to penalties and other adverse consequences. We face significant risks if we fail to comply with the FCPA and other anti-corruption laws that prohibit improper payments or offers of payment to foreign governments and political parties for the purpose of obtaining or retaining business. In many foreign countries, particularly in countries with developing economies, it may be a local custom that businesses operating in such countries engage in business practices that are prohibited by the FCPA or other applicable laws and regulations. Any violation of the FCPA or other applicable anti-corruption laws could result in severe criminal or civil sanctions and, in the case of the FCPA, suspension or debarment from U.S. government contracting, which could have a material and adverse effect on our reputation, businesses, financial conditions, operating results and cash flows.
Our operations are subject to environmental laws and regulations that may increase costs of operations and impact or limit our business plans.
We are subject to environmental laws and regulations affecting many aspects of our present and potential future operations, including a wide variety of EPA labeling and other state regulatory agency requirements. For example, under the Federal Insecticide, Fungicide, and Rodenticide Act, we are required to register with the EPA and certain state regulatory authorities as a seller of disinfectants, and we are subject to EPA labeling requirements for each use that SteraMist®is intended to address. Compliance with these laws and regulations may result in increased costs and delays as a result of administrative proceedings and certain reporting obligations. Public officials and entities may seek injunctive relief or other remedies to enforce applicable environmental laws and regulations. We cannot predict the outcome of any administrative proceedings that may arise.If we are found to not have complied with these laws and are unable to sell out products, our business and financial results will be negatively impacted.
We are subject to risks related to our international operations and failure to manage these risks may adversely affect our operating results and financial condition.
A portion of our sales are made to customers outside the United States. As such, we may be denied access to our customers as a result of a closing of the borders of the countries in which we sell our products due to economic, legislative, political and military conditions in such countries. International operations are subject to a number of other inherent risks, and our future results could be adversely affected by a number of factors, including:
●
unfavorable political or economic environments;
●
requirements or preferences for domestic products or solutions, which could reduce demand for our products;
●
differing existing or future regulatory and certification requirements;
●
unexpected legal or regulatory changes;
●
greater difficulty in collecting accounts receivable and longer collection periods;
●
difficulties in enforcing contracts;
●
an inability to effectively protect intellectual property;
●
tariffs and trade barriers, export regulations and other regulatory and contractual limitations on our ability to sell our products; and
●
potentially adverse tax consequences, including multiple and possibly overlapping tax structures.
If we are unable to manage the risks inherent in our international activities, our ability to obtain future revenues may suffer and, consequently, our business, financial condition and results of operations could be materially and adversely affected.
Our success dependsreliance upon third partythird-party contractors, suppliers and manufacturers for the disruptionmanufacture of which could negatively impact our business.products increases the risk that we will not have sufficient quantities of our products or such quantities at an acceptable cost and reduces our control over the manufacturing process.
We rely upon third parties to supply us with components for our products. We outsource the manufacturing of our SteraMist™® line of equipment to atwo manufacturing companycompanies and use contract manufacturers to build our BIT™-basedBIT-based systems, as we do not maintain our own manufacturing facilities. If we fail to maintain relationships with our current suppliers, we may not be able to effectively commercialize and market our products, which would havedue to risks including increased product costs, limited inventory that is not capable of meeting demand and the possible misappropriation of our proprietary information, such as our trade secrets and know-how. Further, as we maintain a materiallimited number of manufacturers for our SteraMist®line of equipment and adverse effect onblenders for our business. Further, any disruption in the manufacturing process could have a material adverse effect on our business, financial condition and results of operations. We cannot ensure thatSteraMist®solutions, alternative production capacity wouldfacilities may not be available in the event of a disruption, or if it would bealternative production facilities are available, the number of third-party suppliers with the necessary manufacturing and regulatory expertise to produce our products at their current quality level is limited, and it could be obtainedexpensive and take a significant amount of time to arrange for and qualify alternative suppliers, which could have a material adverse effect on favorable terms.our business.
The introductionBecause of newour reliance upon third parties to supply us with our products, is often accompanied by designwe do not have control over the manufacturing process of our third-party suppliers and production delays, as well as significant cost,are dependent on such third-party suppliers for compliance with the regulations applicable to our products. Third-party suppliers may not be able, or fail, to comply with applicable regulatory requirements which could preventresult in sanctions being imposed on us, from introducing new products to the market in a timelyincluding fines, injunctions, civil penalties, delays, suspension or withdrawal of approvals, seizures or recalls, operating restrictions and cost-effective manner.criminal prosecutions, any of which could significantly and adversely harm our business and results of operations.
The development and initial production and enhancementOur results of the decontamination systems we produce is often accompanied by design and production delays and related costs. Often, we cannot predict the time and expense required to overcome such problems. Ifoperations could be materially harmed if we are unable to introduce newaccurately forecast customer demand for our products and manage our inventory.
To ensure adequate inventory supply, we must forecast inventory needs and place orders with suppliers based on our anticipated timeframe,estimates of future demand for our business,products and services. Our limited historical experience in foreign markets and recent increase in demand in the United States may lead us to inadequately forecast such inventory needs. Further, our ability to accurately forecast demand for our products could be negatively affected by many factors, including our failure to adequately manage our expansion efforts, product introductions by competitors, an increase or decrease in customer demand for products of our competitors, our failure to accurately forecast customer acceptance of new product enhancements, unanticipated changes in general market conditions or regulatory matters, and weakening of economic conditions or consumer confidence in future economic conditions.
Inventory levels in excess of customer demand may result in inventory write-downs or write-offs, which would cause our gross margin to be adversely affected and could impair the strength of our brand. Similarly, a portion of our inventory could become obsolete or expire, which could have a material and adverse effect on our earnings and cash flows due to the resulting costs associated with inventory impairment charges and costs required to replace obsolete inventory. Any of these occurrences could negatively impact our financial conditionperformance.
Conversely, if we underestimate customer demand, we may not be able to deliver sufficient products to meet our customers’ requirements, which could result in damage to our reputation and customer relationships. In addition, if we experience a significant increase in demand, additional supplies of raw materials or additional manufacturing capacity may not be available when required on terms that are acceptable to us, or at all, and suppliers or our third-party manufacturers may not be able to allocate sufficient resources to meet our increased requirements, which could have an adverse effect on our ability to meet customer demand for our products and our results of operations may suffer.operations.
Our success depends on our ability to adequately protect our intellectual property.
In April 2013, we acquired certain assets from L-3 Applied Technologies, Inc. (“L-3”), including patents, trademarks and trade secrets related to BIT™. Our commercial success depends, in part, on our ability to obtain, maintain, defend, file new or enforce our existing patents, trademarks, trade secrets and other intellectual property rights covering our technologies and products including, in particular,throughout the intellectual property rights we acquired from L-3.world. We may, however, be unable to adequately preserve such rights due to a number of reasons, including the following:
●
our rights could be invalidated, circumvented, challenged, breached or infringed upon;
●
we may not have sufficient resources to adequately prosecute or protect our intellectual property rights;
●
upon expiration of our patents, certain of our key technology may become widely available; or
●
third parties may be able to develop or obtain patents for similar or competing technology.
Although we devote resources to the establishment and protection of our patents and trademarks, we cannot assure you that the actions we have taken or will take in the future willmay not be adequate to prevent violation of our patents, trademarks and proprietary rights by others or prevent others from seeking to block sales of our products as an alleged violation of their patents, trademarks and proprietary rights. In the future, litigation may be necessary to enforce our trademarks or proprietary rights and we may be forced to defend ourselves against claimed infringement or the rights of others. Any such litigation could result in adverse determinations that could have a material adverse effect on our business, financial condition or results of operations.
In addition, we rely in part upon unpatented trade secrets, unpatented know-how, and continuing technological innovation which may not yet, or may never be, patented, to develop and maintain our competitive position, which we seek to protect, in part, by confidentiality agreements with our employees and consultants. We also have agreements with our employees and consultants that obligate them to assign their inventions to us. It is possible that technology relevant to our business will be independently developed by a person that is not a party to such an agreement. In addition, if the employees and consultants who are parties to these agreements breach or violate the terms of these agreements, we may not have adequate remedies for any such breach or violation, and we could lose our trade secrets through such breaches or violations. To the extent that our commercial partners, collaborators, employees and consultants use intellectual property owned by others in their work for us, disputes may arise as to the rights in related or resulting know-how and inventions. Further, our trade secrets could otherwise become known or be independently discovered by our competitors, which would harm our business.
We may be unable to enforce our intellectual property rights throughout the world.
As part of our growth strategy, we are seeking to expand our operations internationally. The laws of some foreign countries do not protect intellectual property rights to the same extent as the laws of the United States. Companies have encountered significant problems in protecting and defending intellectual property rights in certain foreign jurisdictions. To the extent that we have obtained or are able to obtain patents, trademarks or other intellectual property rights in any foreign jurisdictions, it may be difficult to stop the infringement of our patents, trademarks or the misappropriation of other intellectual property rights. For example, some foreign countries have compulsory licensing laws under which a patent owner must grant licenses to third parties. In addition, some countries limit the availability of certain types of patent rights and enforceability of patents against third parties, including government agencies or government contractors. In these countries, patents may provide only limited benefit or no benefit.
Proceedings to enforce our patent rights in foreign jurisdictions could result in substantial costs and divert our efforts and attention from other aspects of our business. Accordingly, efforts to protect our intellectual property rights in such countries may be inadequate. In addition, future changes in the law and legal decisions by courts in the United States and foreign countries may affect our ability to obtain adequate protection for our technology and products and the enforcement of intellectual property.
We may not be able to manage our growth effectively, create operating efficiencies or achieve or sustain profitability.
The ability to manage and operate our business as we execute our growth strategy will require effective planning. Rapid growth could strain our internal resources, which could lead to a lower quality of customer service, reporting problems and delays in meeting important deadlines, resulting in loss of market share and other problems that could adversely affect our reputation and financial performance. Our ability to manage future growth effectively will also require us to continue to update and improve our operational, financial and management controls and procedures. If we do not manage our growth effectively, we could be faced with slower growth and a failure to achieve or sustain profitability.
We face significant competition in our industry, some of which could significantly limit our growthhave longer operating histories, more established products or greater resources than we do, which may prevent us from achieving increased market penetration and materially and adversely affect our financialimproved operating results.
The decontamination and environmental infectious disease control industry is extremely competitive. The competition includes remediators and disinfection/decontamination companies such as Steris, Bioquell (Eco-lab) and Clorox, various ultraviolet companies and quad ammonia-chemical companies. These competitors may have longer operating histories, greater name recognition, larger installed customer bases, a greater ability to provide similar products and services at a lower cost and substantially greater financial and marketing resources than us.us to develop new products and commercialize existing products. We believe that the principal factors affecting competition in our markets include name recognition, customer familiarity with products, effective marketing, competitive pricing strategies and the ability to receive referrals based on client confidence in the service. There are no significant barriers of entry that could keep potential competitors from opening similar facilities. Our ability to compete successfully in the industry will depend, in large part, upon our ability to market and sell our indoor decontamination and infectious disease control products and services. There can be no assurance that we willWe may not be able to compete successfully in the remediation industry,industry. Further, if one or more competitors successfully develops a decontamination product that future competition will notis more effective, better tolerated, results in a better customer experience, is easier to use or otherwise more attractive than our products, our ability to continue to commercialize our products could be significantly and adversely affected due to a lack of ability to compete, which would have a material adverse effect on our business, operating results and financial condition.
Our success depends upon broad market acceptance of our technology that has not yet been achieved.
Our BIT technology is relatively new, having received EPA registration in mid-2015. Our sales are dependent upon broad market acceptance of our technology that replaces long-standing failing manual cleaning techniques such as quaternary ammonium compounds and bleach for disinfection, with our mechanical process. The failure to obtain broad market acceptance inevitably leads to substantially increased lead times for sales, until our prospective customers-particularly in the hospital-healthcare market-are accustomed to the use of newer mechanical technology. The inability to timely meet our sales goals could adversely affect our financial condition and results of operations.
If the quality of our products do not meet the expectations of our customers, then our brand and reputation or our business could be adversely affected.
In the course of conducting our business, we must adequately address quality issues that may arise with our products, including defects in third-party components and inventory. We may not be able to eliminate or mitigate occurrences of these issues and associated liabilities. In addition, even in the absence of quality issues, we may be subject to claims and liability if the performance of products do not meet the expectations of our customers. If the quality of our products does not meet the expectations of customers, then our brand and reputation, and our ability to receive referral customer business, could be adversely affected.
Our long-term growth depends, in part, on our ability to enhance and develop new products, and if we fail to do so we may be unable to compete effectively.
It is important to our business and our long-term growth that we continue to enhance and develop new products. We intend to continue to invest in research and development activities focused on improvements and enhancements to our existing intellectual property and product offerings. Our development goals include the development and commercialization of a variety of sanitizing robotic devices and backpack units. Despite our reasonable efforts, it may not be possible for us to innovate in a way to keep us competitive with other companies due to financial and time constraints which will negatively impact our business.
The introduction of new products is often accompanied by design and production delays, as well as significant cost, which could prevent us from introducing new products to the market in a timely and cost-effective manner.
The development and initial production and enhancement of the decontamination systems we produce is often accompanied by design and production delays and related costs. If we are unable to introduce new products on our anticipated timeframe or financial cost, our business, financial condition and results of operations may suffer due to failing to remain competitive in our market.
We have a limited management team size which may reduce our ability to effectively manage our business operations as it grows.
We have a limited management team size, even though we keep hiring and redefining job descriptions. This limited management team may reduce our ability to effectively manage our business as it grows. As we expand, we expect to increase the size of our management team. However, our management team may not be able to adequately manage our business, and any failure to do so could lead to a general negative impact to our business.
We are dependent on our key personnel, the loss of whom could adversely affect our operations, and if we fail to attract and retain the talent required for our business, we could be materially harmed.
Our success is substantially dependent on the performance of our executive officers, including our Chairman and Chief Executive Officer, Dr. Halden S. Shane, the loss of whom would have a material adverse effect on our business. Given our relatively recent entry into the decontamination industry, we
We depend to a significant degree on our ability to attract, retain and motivate quality personnel.
Competition We further note that competition for highly-skilledhighly skilled personnel is often intense in the United States.intense. We may not be successful in attracting, integrating or retaining qualified personnel to fulfill our current or future needs.needs, the failure of which would have a material adverse effect on our business.
Our operations, and those of our suppliers, are subject to a variety of business continuity hazards and risks, any of which could interrupt production or operations or otherwise adversely affect our performance and results.
We are subject to business continuity hazards and other risks, including natural disasters, utility and other mechanical failures, labor difficulties, inability to obtain necessary licenses, permits or registrations, disruption of communications, data security and preservation, disruption of supply or distribution, safety regulation and labor difficulties. The occurrence of any of these or other events might disrupt or shut down operations, or otherwise adversely impact the production or profitability of a particular facility, or our operations as a whole. We may also be subject to certain liability claims in the event of an injury or loss of life, or damage to property and equipment, resulting from such events. Although we maintain property and casualty insurance, as well as other forms of insurance that we believe are customary for our industries, our insurance policies include limits and, as such, our coverage may be insufficient to protect against all potential hazards and risks incident to our business. Should any such hazards or risks occur, or should our insurance coverage be inadequate or unavailable, our business, prospects, financial condition and results of operations might be adversely affected.
Our products are subject to potential product liability claims which, if successful, could have a material adverse effect on our business, financial condition and results of operations.
Certain of our products may be hazardous if not deployed properly. We are exposed to significant risks for product liability claims if death, personal injury or property damage results from the use of our products. While we currently maintain insurance against product liability claims, we may experience material product liability losses in the future. Our insurance coverage may not continue to be available on terms that we accept, if at all, and our insurance coverage also may not adequately cover liabilities that we incur. A successful claim against us that exceeds our insurance coverage level or that is not covered by insurance, or any product recall, could have a material adverse effect on our business, financial condition and results of operations. In addition, product liability and other claims can divert the attention of management and other personnel for significant periods of time, regardless of the ultimate outcome. Further, claims of this nature may cause our customers to lose confidence in our products and us. As a result, an unsuccessful defense of a product liability or other claim could have a material adverse effect on our financial condition, results of operations and cash flows.
The misuse of our products may harm our reputation in the marketplace, result in injuries that lead to product liability suits or result in costly investigations, fines or sanctions by regulatory bodies if we are deemed to have engaged in the promotion of these uses, any of which could be costly to our business.
Customers, technicians, or service providers could use our products in a manner that is inconsistent with the products’ intended use. We train our marketing personnel and sales representatives to not promote our products for uses outside of the intended use, however, we cannot otherwise prevent all instances of misuse. Further, the marketing and sales representatives that we have hired to help meet the demand for our products may not have received proper training or have the working knowledge needed to adequately advise our customers how to safely use our products. Misuse of our products may cause an increased risk of injury to customers, which could harm our reputation in the marketplace, as well as lead to potential product liability lawsuits.
We may seek to grow our business through acquisitions of complementary products or technologies, and the failure to manage acquisitions, or the failure to integrate them with our existing business, could harm our business, financial condition and operating results.
From time to time, we may consider opportunities to acquire other companies, products or technologies that may enhance our product platform or technology, expand the breadth of our markets or customer base, or advance our business strategies. Potential acquisitions involve numerous risks, including: problems assimilating the acquired products or technologies; issues maintaining uniform standards, procedures, controls and policies; unanticipated costs associated with acquisitions; diversion of management’s attention from our existing business; risks associated with entering new markets in which we have limited or no experience; increased legal and accounting costs relating to the acquisitions or compliance with regulatory matters; and unanticipated or undisclosed liabilities of any target.
We have no current commitments with respect to any acquisition. We do not know if we will be able to identify acquisitions, we deem suitable, whether we will be able to successfully complete any such acquisitions on favorable terms or at all, or whether we will be able to successfully integrate any acquired products or technologies. Our potential inability to integrate any acquired products or technologies effectively may adversely affect our business, operating results and financial condition.
Our employees, consultants, and other commercial partners may engage in misconduct or other improper activities, including non-compliance with regulatory standards and requirements.
We are exposed to the risk that our employees, consultants, and other commercial partners and business associates may engage in fraudulent or illegal activity. Misconduct by these parties could include intentional, reckless or negligent conduct or other unauthorized activities that violate the regulations of the EPA and non-U.S. regulators, including those laws requiring the reporting of true, complete and accurate information to such regulators, manufacturing standards, healthcare fraud and abuse laws and regulations in the United States and internationally or laws that require the true, complete and accurate reporting of financial information or data. Whether or not we are successful in defending against any legal actions or investigations in connection with any misconduct attributed to us, we could incur substantial costs, including legal fees and reputational harm, and divert the attention of management in defending ourselves against any of these claims or investigations.
The requirements of being a public company may strain our resources, divert management’s attention and affect our ability to attract and retain executive management and qualified board members.
We have and likely will continue to incur significant legal, accounting and other expenses as a public company subject to the reporting requirements of the Securities Exchange Act of 1934, the Sarbanes-Oxley Act of 2002 (“SOX”), the Dodd–Frank Wall Street Reform and Consumer Protection Act and other applicable rules and regulations. Our management and other personnel devote a substantial amount of time to these compliance initiatives. Moreover, these rules and regulations have increased our legal and financial compliance costs and will make some activities more time-consuming and costly. For example, applicable rules and regulations could make it more difficult for us to attract and retain qualified persons to serve on our Boardboard of Directors (the “Board”)directors ( the “Board), or as executive officers.
In addition, SOX requires, among other things, that we maintain effective internal control over financial reporting and disclosure controls and procedures. Our testing, or the potential subsequent testing by our independent registered public accounting firm in future periods, may reveal deficiencies in our internal control over financial reporting that are deemed to be material weaknesses. Our compliance with Section 404 of SOX may require that we incur substantial expense and expend significant management time on compliance-related issues. Moreover, if our independent registered public accounting firm identifies deficiencies in our internal control over financial reporting that are deemed to be material weaknesses, the market price of our stock could decline, and we could be subject to sanctions or investigations by regulatory authorities, which would require additional financial and management resources.
When we are no longer a “smaller reporting company,” we will be subject to additional reporting requirements as a public company. We expect that we will incur increased legal, accounting and other costs as we continue to improve existing, and implement new, operational and financial systems, procedures and controls to prepare for and comply with these additional requirements.
As a result of disclosure of information, in this Annual Report on Form 10-K and in filings required of a public company, our business and financial condition are more visible, which we believe may result in threatened or actual litigation, including by competitors and other third parties. If such claims are successful, our business and operating results could be adversely affected. Even if the claims do not result in litigation or are resolved in our favor, these claims, and the time and resources necessary to resolve them, could divert the resources of our management and adversely affect our business and operating results.
Risk Related to Our Securities
Our stock price is volatile and there is a limited market for our shares.
The stock markets generally have experienced, and will probably continue to experience, extreme price and volume fluctuations that have affected the market price of the shares of many small-cap companies. These fluctuations have often been unrelated to the operating results of such companies.companies and in recent times have been exasperated by investors’ concerns stemming from the COVID-19 Pandemic. Factors that may affect the volatility of our stock price include the following:
●
anticipated or actual fluctuations in our quarterly or annual operating results;
●
our success, or lack of success, in developing and marketing our products and services;
●
changes in general economic, political and market conditions in or any of the regions in which we conduct our business, including as a result of the current COVID-19 outbreak and related governmental responses;
●
our ability to raise the required capital to fund our business;
●
changes in financial estimates by us or of securities or industry analysts;
●
the issuance of new or updated research reports by securities or industry analysts
●
the announcement of new products, services, or technological innovations by us or our competitors;
●
changes in our executive leadership;
●quarterly fluctuations of
regulatory developments in our operating results;industry affecting us, our customers or our competitors;
●changes in revenue
competition;
●
actual or earnings;purported “short squeeze” trading activity; and
●competition.
Moreover, the OTCQX Best Marketplace (“OTCQX”) is a trading platform, and trading of securities quoted on the OTCQX is often more sporadic than the trading of securities listed on a national securities exchange like The NASDAQ Stock Market or the New York Stock Exchange. Even if we were to seek to list our securities on a national securities exchange, there is no assurance we will be able to do so, and if we do so, many of these same forces and limitations may still impact our trading volumes and market price in the near term. Additionally, the sale or attempted sale of a large amount of common stock into the market may also have a significant impact on the trading price of our common stock.
We do not intend to pay dividends for the foreseeable future.
We have not paid dividends on our common stock since inception. The continued operation and expansion of our business will require substantial funding. Accordingly, we currently intend to retain earnings, if any, for use in the business and we do not anticipate that we will pay any cash dividends on shares of our common stock for the foreseeable future. Any determination to pay dividends in the future will be at the discretion of our Board and will depend upon results of operations, financial condition, contractual restrictions, restrictions imposed by applicable law and other factors our Board deems relevant. Investors seeking cash dividends should not purchase our common stock. Accordingly, realization of a gain on your investment will depend on the appreciation of the price of our common stock, which may never occur.
Our common stock is subject to the “penny stock” rules of the SEC, and trading in our securities is very limited, which makes transactions in our common stock cumbersome and may reduce the value of an investment in our securities.
The SEC has adopted regulations which generally define a “penny stock” to be any equity security that is not listed on a qualified national securities exchange and that has a market price of less than $5.00 per share, or with an exercise price of less than $5.00 per share, subject to certain exceptions. Historically, shares of our common stock have traded on the OTCQX at a price of less than $5.00 per share and, as a result, our common stock is considered a “penny stock” by the SEC and subject to rules adopted by the SEC regulating broker-dealer practices in connection with transactions in “penny stocks.” Our securities are covered by the penny stock rules, which impose additional sales practice requirements on broker-dealers who sell to persons other than established customers and accredited investors. For any transaction involving a penny stock, unless exempt, Rule 15g-9 under the Exchange Act requires that a broker-dealer must:
●
approve a person’s account for transactions in penny stocks; and
●
receive from the investor a written agreement to the transaction, setting forth the identity and quantity of the penny stock to be purchased.
In order to approve a person’s account for transactions in penny stocks, the broker or dealer must:
●
obtain financial information and investment experience objectives of the person; and
●
make a reasonable determination that the transactions in penny stocks are suitable for that person and the person has sufficient knowledge and experience in financial matters to be capable of evaluating the risks of transactions in penny stocks.
The broker or dealer must also deliver, prior to any transaction in a penny stock, a disclosure schedule prescribed by the SEC relating to the penny stock market that:
●
sets forth the basis on which the broker or dealer made the suitability determination; and
●
provides that the broker or dealer received a signed, written agreement from the investor prior to the transaction.
Additionally, the investor must receive disclosure about the risks of investing in penny stocks in both public offerings and in secondary trading and about the commissions payable to both the broker-dealer and the registered representative, current quotations for the securities and the rights and remedies available to an investor in cases of fraud in penny stock transactions. Finally, monthly statements must be sent disclosing recent price information for the penny stock held in the account and information on the limited market in penny stocks. Generally, brokers may be less willing to execute transactions in securities subject to the “penny stock” rules. This maydiscourage investor interest in and limit the marketability of our securities.
While we intend to apply to list our common stock on a national securities exchange, the exchange may not approve our listing and, if approved, our common stock may not continue to trade on such exchange.
We intend to apply to list our common stock on a national securities exchange. As such, we will need to satisfy certain qualitative and quantitative requirements in order to successfully list our common stock on such an exchange. We cannot assure you that we will be able to meet the applicable requirements for such initial listing or that our application will be approved.
If our listing application is approved, we will be required to comply with certain listing requirements of such exchange, which may include compliance with certain requirements with respect to our corporate governance, finances, stock trading volume and stock price. If we fail to meet any of these requirements, such exchange may take steps to delist our common stock. Such a delisting would likely have a negative effect on the price of our common stock and would adversely affect the ability to sell or purchase our common stock. Further, even if we successfully apply to list our common stock on a national exchange, we cannot assure you that an orderly and active trading market in our common stock will ever develop or be sustained.
We have a substantial number of options, warrants and convertible debtpreferred stock outstanding, which could give rise to additional issuances of our common stock and potential dilution of ownership to existing shareholders.
As of December 31, 2018,2020, we had outstanding options, warrants and warrantsconvertible preferred stock to purchase approximately an aggregate of 26.92.2 million shares of our common stock at exercise prices ranging from $0.05$0.80 to $2.10$8.40 per share. Of these, 320,000approximately 132,500 represent shares underlying options with exercise prices ranging from $0.05$0.80 to $2.10$7.06 per share, and 26.6approximately 2.0 million represent shares underlying warrants at exercise prices ranging from $0.08$0.64 to $1.00$8.40 per share.share and approximately 63,750 represent shares underlying our shares of convertible $0.01 preferred A stock. To the extent any holders of options, warrants or warrantsconvertible preferred stock exercise the same, the issuance of shares of our common stock upon such exercise will result in dilution of ownership to existing shareholders. Additionally, as a result
If securities or industry analysts do not publish research or publish inaccurate or unfavorable research about our business, our stock price and trading volume could decline.
The trading market for our common stock will rely in part on the research and reports that securities or industry analysts publish about us and our business. If one or more of the analysts who cover us downgrades our common stock or issues other unfavorable commentary or research the price of our 2017common stock may decline. If one or more analysts ceases coverage of our company or fails to publish reports on us regularly, demand for our stock could decrease, which in turn could cause the trading price or trading volume of our common stock to decline and could result in the loss of all or part of your investment in us.
Substantial future sales of our common stock, or the perception in the public markets that these sales may occur, may depress our stock price.
Our common stock is traded on the NASDAQ Capital Market (“Nasdaq”) and, despite certain increases of trading volume from time to time, there have been periods when our common stock could be considered thinly traded, meaning that the number of persons interested in purchasing our common stock at or near bid prices at any given time may be relatively small. Equity or equity-related financing withtransactions that result in a remaining principal balancelarge amount of $5,000,000 (See Note 6—Convertible Debt),newly issued shares that become readily tradable, or sales of significant numbers of shares by current shareholders, have placed, and in the promissory notes issued are convertible at $0.54 per share into an aggregatefuture could place, downward pressure on the trading price of 9,259,250our stock. In addition, during times of lower trading volume, a shareholder who desires to sell a large number of shares of common stock may need to sell the shares in increments over time to mitigate any adverse impact of the sales on the market price of our stock.
If our shareholders sell, or the market perceives that our shareholders intend to sell, substantial amounts of our common stock in the public market, the market price of our common stock could fall. Sales of a substantial number of shares of our common stock may make it more difficult for us to sell equity or equity-related securities in the future at a time and price that we deem reasonable or appropriate. In the event that the price of our stock falls, we may become involved in securities class action litigation that could divert management’s attention and harm our business.
In the future, we may also issue our securities if fully converted.we need to raise additional capital or in connection with acquisitions. The number of shares of our common stock issued in connection with a financing or acquisition could constitute a material portion of our then-outstanding shares of our common stock.
We have recently listed on the Nasdaq and may not be able to maintain compliance with NASDAQ’s standards to maintain listing on the exchange, which could limit shareholders’ ability to trade our common stock.
As a listed company on the Nasdaq, we are required to meet certain financial, public float, bid price and liquidity standards on an ongoing basis in order to continue the listing of our common stock. If we fail to pay the notes on or before the revised maturity dates of April 3, 2020, the notesmeet these continued listing requirements, our common stock may be convertiblesubject to delisting, which could materially impact the liquidity of our common stock making it more challenging to buy and sell shares of our common stock.
We are a “smaller reporting company” under the U.S. federal securities laws, and the reduced reporting requirements applicable to smaller reporting companies could make our common stock less attractive to investors.
We are a “smaller reporting company” under U.S. federal securities laws. For as long as we continue to be a smaller reporting company, we may take advantage of exemptions from various reporting requirements that are applicable to other public companies that are not smaller reporting companies. Investors may not find our common stock attractive because we may rely on these exemptions. If some investors find our common stock less attractive as a result, there may be a less active trading market for our common stock and our stock price may be more volatile.
Our anti-takeover provisions could prevent or delay a change in control of our company, even if such change in control would be beneficial to our shareholders.
Provisions of our articles of incorporation, as amended, and amended bylaws as well as provisions of Florida law could discourage, delay or prevent a merger, acquisition or other change in control of our company, even if such change in control would be beneficial to our shareholders. These include: maintaining authorized but unissued shares of our capital stock that could be issued by our Board to increase the number of outstanding shares and thwart a takeover attempt; no provision for the use of cumulative voting for the election of directors; maintaining a staggered board, limiting the speed at $0.11 per share into an aggregatewhich our shareholders may replace our entire Board, and limiting the ability of 45,454,545 common shares. As partour shareholders to call special meetings.
In addition, Florida Business Corporation Act, or FBCA, § 607.0902 generally provides that shares acquired in excess of certain specified thresholds, without first obtaining the approval of our Board, will not possess any voting rights unless such voting rights are approved by a majority of our disinterested shareholders. Additionally, FBCA § 607.0901 requires that, subject to certain exceptions, any affiliated transaction with a shareholder that owns more than 15% of the original transaction, we also issued warrantsvoting shares of the corporation, referred to purchase upas an “interested shareholder,” receive the approval of either the corporation’s disinterested directors or a supermajority vote of disinterested shareholders, or, absent either such approval, that a statutory “fair price” be paid to an additional 999,998the shareholders in the transaction. The shareholder vote requirement is in addition to any shareholder vote required under any other section of the FBCA or our articles of incorporation, as amended.
The concentration of our common stock ownership with our executive officers, directors and affiliates will limit your ability to influence corporate matters.
Our executive officers, directors and owners of 5% or more of our outstanding common stock and their respective affiliates beneficially owned, in the aggregate approximately 26.7% of our outstanding common stock as of March 5, 2021. This percentage includes outstanding shares of common stock, at an exercise priceconvertible preferred stock, warrant and stock options that are vested and exercisable as of $0.69 per share.that date. These shareholders will therefore have significant influence over management and affairs and over all matters requiring shareholder approval, including the election of directors and significant corporate transactions, such as a merger or other sale of our company or our assets, for the foreseeable future. This concentrated control will limit our shareholders’ ability to influence corporate matters and, as a result, we may take actions that our shareholders do not view as beneficial. This ownership could negatively affect the value of our common stock.
Item 1B. UNRESOLVED
UNRESOLVED STAFF COMMENTS
Not applicable.
Our U.S. headquarters, a 9,000 square foot office space, is located at 8430 Spires Way, Frederick, MD 21701.The innovative facility includes a warehouse, training room, quality control room, qualification laboratory, and upon further installation will housewith its own drive-in custom iHP™SteraMist®Complete Room System. The new warehouse is significantly larger than our previous headquarters, allowing TOMI to store its new product lines and stock a greater variety of inventory - quickly delivering a customer purchase. The training room is integrated with the newest technology to be able to present SteraMist®virtually around the world. As the company keeps up with the demand for SteraMist®, there is a dedicated quality control room to allow our service engineers to work on machines for quick and efficient service to our customers. The lease for our U.S. headquarters has a 10-year term and provides for annual rent of approximately $143,000.$147,000.
We lease a 300 square foot office and conference space located at 9454 Wilshire Blvd., Penthouse, Beverly Hills, CA 90212. We lease this space for $22,500$29,000 annually on a month-to-month tenancy in a professional office building. The property serves as our sales and executive office in the western region of the United States and is used for meetings, sales demonstrations and various administrativeother business functions.
We currently are not a party to any legal proceedings, the adverse outcome of which, in management’s opinion, individually or in the aggregate, would have a material adverse effect on our results of operations, financial position or cash flows.
Not applicable.
PART II
Item 5.
MARKETMARKET FOR REGISTRANT’S COMMON EQUITY, RELATED SHAREHOLDER MATTERS AND ISSUER PURCHASES OF EQUITY SECURITIES
Market Information
Our common stock is currently quoted on the OTCQX Best MarketplaceNasdaq under the symbol “TOMZ.” The market quotations were for OTCQX Best Marketplace reflect inter-dealer prices, without retail mark-up, mark-down or commissions and may not necessarily represent actual transactions.
Shareholders
As of March 15, 2019,29, 2021, there were 771227 record holders of our common stock.stock; however, we believe we have approximately 6,000 stockholders, including those held in street name. On March 15, 2019,29, 2021, the last reported sale price of our common stock on the OTCQXNasdaq was $0.12$4.15 per share.
Dividends
We have not paid and do not currently intend to pay cash dividends on our common stock in the foreseeable future. Our policy is to retain all earnings, if any, to provide funds for operation and expansion of our business. The declaration of dividends, if any, will be subject to the discretion of our Board, which may consider such factors as our results of operations, financial condition, capital needs and acquisition strategy, among others.
Recent Sales of Unregistered Securities
None.
Item 6.
SELECTEDSELECTED FINANCIAL DATA
Not Required.
Item 7.
MANAGEMENT’SMANAGEMENT’S DISCUSSION AND ANALYSIS OF FINANCIAL CONDITION AND RESULTS OF OPERATIONS
The following discussion and analysis of our financial condition and results of operations relates to the years ended December 31, 20182020 and 2017.2019. This discussion and analysis should be read in conjunction with our financial statements and the notes to those financial statements that are included elsewhere in this report.
Overview
TOMI Environmental Solutions, Inc. (“TOMI”, “we” and “our”) is a global providerbacteria decontamination and infectious disease control company, providing environmental solutions for indoor surface decontamination through the manufacturing, sales, service and licensing of disinfection and decontamination essentials through our premier Binary Ionization TechnologySteraMist® (BIT™) platform, under which we manufacture, license, service and sell our SteraMist™brand of products, including SteraMist® BIT™, a low percentage (7.8%) hydrogen peroxide-based mist/fog.fog or mist that uses Binary Ionization Technology (BIT
™).
In response to the 2001 Anthrax spore attacks, Our SteraMist®is a patented technology that produces ionized Hydrogen Peroxide (iHP™) using cold plasma science created under a grant bythe United States Defense Advanced Research Projects Agency (“DARPA”) and a leading defense company, Titan Corporation, developed BIT™to defend against chemical and biological agents under a DARPA grant. In June 2005, L-3Communications, Inc. (“L-3 Communications”) a leading defense company, acquired the technology through the acquisition of Titan Corporation.In 2011, TOMI recognized the importance of this disruptive and innovative technology and,after two years of negotiations, won the right to purchase the technology from L-3 Communications. Subsequently, we began the long process of registering BIT™with the Environmental Protection Agency (“EPA”), using good laboratory practice testing.TOMI introduced SteraMist™to the commercial market in June 2013, using our inherited and pre-existing EPA mold label. In June 2015, we successfully registered SteraMist™ BIT™as a hospital-healthcare disinfectant and broad-spectrum general use disinfectant for use as a misting/fogging agent, at which time our technology became the first EPA-registered hospital-healthcare disinfectant solution and equipment on the market. TOMI proudly maintains this registration and we continuously update our label with additional pathogens.
TOMI’s cold plasma technology produces ionized Hydrogen Peroxide (iHP™, a mist/fog consisting of Reactive Oxygen Species, mainly hydroxyl radicals (“(DARPA).OH”). This technology converts TOMI’s Our EPA registered BIT™ Solution is composed of a low concentration of hydrogen peroxide converted to iHP™after passing the trade secret blended solution which contains only oneincluding its sole active ingredient a low-percentageof 7.8% hydrogen peroxide solution to.OH by passing it through an atmospheric cold plasma arc. The newly formed iHP™fog and mist consists of submicron’s to 3-micron radical particles that are carried throughout the treatment area in a fog or mist moving with the same velocity and characteristics of a gas. This allows the ionized hydrogen peroxide fog or mist to affect all surfaces and air space throughout the targeted treatment area, over, above and beyond the ability of a manual cleaning processes. iHP™damages pathogenic organisms through the oxidation of proteins, carbohydrates, and lipids.SteraMist®no-touch disinfection and or decontamination treat areas mechanically, causing cellular disruptions and/or dysfunctions resulting in a 6-log (99.9999%) and greater kill or inactivation of all pathogens in the treatment area.
Markets
TOMI’s SteraMist™ products are designed to address multiple industries with various needs. Our operations are organized into four main divisions based on our current target industries: Life Sciences, Hospital-Healthcare, TOMI Service Network and Food Safety.
TOMI is committed to customer satisfactionUnder the Federal Insecticide, Fungicide, and client retention in all of our divisions both domestically and internationally. Our core values revolve around our commitment to the reduction of harmful pathogens and combating public health threats worldwide, whichRodenticide Act (“FIFRA”), we are evidence by our motto of Innovating for a Safer World®.
Regulation and Registrations
Under United States federal guidelines, TOMI is required to register with the EPA and certain state regulatory authorities as a seller of solution and technology.disinfectants. In June 2015, SteraMist®BIT™ was registered with the EPA as a hospital-healthcare disinfectant and general broad-spectrum surface disinfectant for use as a misting/fogging agent. SteraMist®BIT™now holds EPA registrations both as a hospital-healthcare and general disinfectant (EPA Registration(# 90150-2) and for mold control, and air and surface remediation (EPA Registration(# 90150-1). In February 2016, we expanded our label with the EPA to include C. diff spores. Methicillin-resistant Staphylococcus aureusClostridium (MRSA), difficileSporesand MRSA, as well as the influenza (Avian) virus h1n1.h1n1, which we believe has better positioned us to penetrate all industries including the biodefense and healthcare industry. In August 2017, our EPA label was further expanded to include efficacy against Salmonella and Norovirus. As of January 27, 2017, our product linetechnology is one of fifty-three (53) published products on53 of the EPA’s “Registered Antimicrobial Products Effective against ClostridiumClostridium difficile spores”Spores”, as published on the EPA’s K List. InFurther, in December 2017, SteraMist® earned publications on EPA Listswas included in the EPA’s list G (Norovirus), L (Ebola) and M which pertain(Avian Flu). In March 2020, our EPA label was further amended to norovirus, Ebola,include Emerging Viral Pathogens claims, thus meeting the criteria against Enveloped viruses and avian influenza (h1n1), respectively. Since 2016, the SteraMist™ BIT™ EPA-registered label has been accepted in all 50 U.S. states,Large Non-enveloped viruses and over 20 countries worldwideincluded on List N (Emerging Viral Pathogens including the EU, Canada and Taiwan which registrations we continue to maintain.SARS-CoV-2).
We have expanded our SteraMist® BIT™ Technology beyond the initial chemicalallows a facility to have a mechanical method of cleaning using a Hospital-HealthCare disinfectant which is an EPA registered tool and biological warfare applicationssolution to replace flawed manual cleaning technology, upgrade existing protocols, and limit liability in a facility when it comes to resistant microorganisms (including spores)infectious pathogens. SteraMist®BIT™is the first EPA registered solution and system combination on the market.We maintain this registration in 50 states, Canada, and approximately thirty-five (35) other countries.
Markets
Our SteraMist®products are designed to address a wide varietyspectrum of commercialindustries using iHP™. Our operations consist of five main divisions based on our current target industries: Hospital-Healthcare, Life Sciences, TOMI Service Network, Food Safety and residential settings. SteraMist®Commercial. BIT™ is designed to provide fast-acting biological six-log reduction, which is a 99.9999% kill, and works in hard-to-reach areas, leaving no residue, requiring no manual wiping, and leaves behind no noxious fumes.
All of the SteraMist® products are fully validated to comply with good manufacturing practice standards, have received CE marks in the European Economic Area and are approved by UL. Our solution is manufactured at an EPA-registered solution blender and our products are manufactured in an ISO 9001 certified facility.
Products
We continue to offer our customers a wide range of innovative mobile products designed to be easily incorporated into their existing disinfection and decontamination procedures. In addition,procedures and protocols. Additionally, we offer integrated facility equipment installations known as Custom Engineered Systems, routine & emergency iHP™Corporate Service, essential training packages, validations and qualifications, and onsite performance maintenance needs allrequests.
Each of whichthese are structured to address iHP® servicethe unique disinfection and decontamination needs globally.of our customers worldwide regardless of the type of facility requiring or requesting SteraMist
®disinfection decontamination.
Divisions
Hospital-Healthcare
Our Hospital-HealthCare customer list continues to grow with the closing of every quarter. Our SteraMist®Total Disinfection Cart, an all-in-one cart that houses our handheld point-and-spray SteraMist®Surface Unit and accompanying supplies, continues to assist medical staff with emergency response and turnaround for new and established protocols. The SteraMist®Total Disinfection Cart, recently modified for further ease and mobility, allows customers within the hospital-healthcare industry to address concerns of the cross-contamination of dangerous bacteria and viral pathogens in which some can lead to HAIs stemming from existing and emerging pathogens, as well as multiple drug resistant organisms (MDRO’s). SteraMist®technology allows a manual cleaning protocol lasting 90 minutes to be reduced to 55 minutes, including the changing of bed linens, as confirmed by the Shield Study at UCLA. This mobile consolidation solution has resulted in remarkable results for facilities utilizing our technology.
As our Training and Implementation department expands TOMI expects continued expansion in its Hospital-HealthCare division. The protocol development and onboarding for implementation in this division is critical. We have experienced in 2020, the expansion of SteraMist®use in such campuses by employing comprehensive training for their day and night shift maintenance and housekeeping departments. By late 2021, TOMI anticipates yearly comparison case studies from many of these facilities who were onboarded in 2020, which should show lower transference infection rates in COVID, ClostridiumdifficileSpores and overall, HAI cases.
We have recently hired a Vice President of Sales for this division who brings over 25 years of experience in the HealthCare space including working for Quest Diagnostics, Abbott, Siemens Bayer and ThermoFisher Scientific.
Life Sciences
TOMI’sOur SteraMist®. Environment System, iHP Decontamination Complete Room,Custom Engineered Systems, the SteraMist® Select Surface Unit, custom iHP™ implementation to decontamination chambers and cage washers, and our iHP®™Corporate Service Division, are designed to be tailored to provide a complete room solution to address the regulatory inspections of disinfecting/decontaminating and Installation Qualification (IQ)-Operational Qualification (OQ)–Performance Qualification (PQ) validation processes within the life sciences industry.
Hospital-Healthcare
In 2018, TOMI launchedaddition, we have worked alongside many research universities and government agencies in the E-Zeffort to test SteraMist® Disinfection Cart, an all-in-one cartefficacy on the disinfection and reprocessing of N95 masks and other equivalent PPE, with results that houses our handheld point-and-sprayindicate that the use of SteraMist® Surface Unit as well as accompanying supplies. This product is designed to makeiHP™ will not reduce mask efficacy, including on those containing 10% or less of cellulose while assuring a sterile reprocessed mask 100% of the terminal cleaning process of patient rooms more efficient than traditional manual cleaning methods. We believe that our E-Z SteraMist™time. Disinfection Cart will allow our customers within the Hospital-Healthcare industry to address the growing concern regarding the increasing high level of transference of pathogens including multiple drug resistant organisms (MDRO’s) leading to HAI’s from hospital and healthcare related environmental surfaces and equipment to patients and healthcare workers.
TOMI Service Network
The TOMI Service Network, or TSN, is ouran expansive network comprisedconsisting of outsidethird-party professionals specializing in a wide array of disciplines who are exclusively licensed and trained to use the SteraMist® products. TSN sells, trainsWe sell, train, and servicesservice a wide array of professional remediation companies in the use of SteraMist®. Thesethrough the TSN division. This allows for increased accessibility and brand awareness of iHP®services to facilities in need of local routine and emergency disinfection and decontamination.
Many of these companies specialize in mold abatement, water damageremediation, treatment of water-damaged areas (including damage from CAT 1 though 3grey and black water loss (CAT 1-3 water loss) and, fire damage, as well as professional specialists that are certified and practice in the area of forensic restoration. Currently, the TSN is comprisedfeatures a number of eighty-eight (88) such companiesprofessionals throughout both the United States and Canada. TSN members useCanada, with some utilizing SteraMist® as a standalone service as well asand others incorporating our products SteraMist®into their existing business models. TOMI derives a continuous revenue stream from our TSN customers through recurring purchases of our BIT™models and methods. solution.
Our TSN network continues to grow and currently the total numberSales of TSN provider contracts fully executed to date is eighty-eight (88), expandingBIT™Solution increases yearly as our network membership across thirty-five (35) U.S. Statesmembers utilize the technology more and two (2) Canadian provinces. Our service providers have a totalmore each year. BIT™Solution sales attributable to the TSN for the years ended December 31, 2020 and 2019, were approximately $2,059,000 and $268,000, respectively, representing an increase of one hundred and eleven (111) SteraMist® Surface Units and forty-two (42) SteraMist® Environment Systems in the field allowing for rapid deployment at a moment’s notice.668%.
In September 2018, we partnered withMany of our TSN members were and are at the Global BioRisk Advisory Council (“GBAC”) to use SteraMist® as one offorefront on the training technologies used in their certification classes. This also allows forfight against the decontamination of everyday crises as well as forensic restoration and bio-hazard scenes as needed. TOMI also launched the Forensic Restoration Service Team (or “FRST”), a U.S. based TOMI-certified forensic restoration and crime clean network. This network is comprised of service providers who specialize in forensic restoration such as mass casualty, crime scene, suicide and unattended death cleanup. Also included within this field are hoarding and bio-recovery services. Participating FRST members will receive specialized training and certifications by GBAC. We have four (4) certified FRSTmembers to date.Coronavirus pandemic.
Food Safety
In 2017, TOMI launched a Food Safety division. Food safety is quickly becoming one of our largest targeted markets,presents significant potential as we believe it presents a clear potentialan opportunity for substantial growth. This isgrowth with continued product research and compliance testing. With the food safety industry in light ofNorth America coming under closer scrutiny with the implementation and enforcement of new and existing rules in the United States under the FDA Food Safety Modernization Act and in Canada under the Safe Food for Canadians Act and the Safe Food for Canadians Regulations, the latter two of which became effective in January 2019. This is in part due to this increased focus on concerns within the food safety industry in North America and abroad. Weestablished guidelines, our consultants have consultants submitting to the EPA and FDAsubmitted a request to expand our current labels fromto include a 1% acceptable concentration of hydrogen peroxide. This concentration has previously been approved by the treatment ofUSDA and FDA for direct food and crop application and will allow SteraMist®to expand use sites beyond food processing machinery, restaurants, and food contact areas to assist in compliance with the newly established Food Safety Modernization Act guidelines set in place by the FDA, as well as the Safe Food for Canadians Act and Safe Food for Canadians Regulations in Canada.
Although COVID-19 has delayed a significant increase in our Food Safety division, the SteraMist®Select Surface Unit has been proven effective for the industry. In the second quarter of 2020, the United States Department of Agriculture (USDA), Food Safety and Inspection Service (FSIS) and Office of Public Health and Safety (OPHS) purchased three of these units. FSIS, a public health regulatory agency of the USDA, protects consumers by ensuring that meat, poultry, and egg products are safe, wholesome, and accurately labeled. FSIS has three laboratories located in Athens, GA, St. Louis, MO, and Albany, CA. These regulatory labs analyze meat, poultry and egg products, to ensure that they are free of adulteration. The labs are part of the critical infrastructure of the country and continue to operate during the coronavirus pandemic to provide a safe supply of food products. As the Select Surface unit is portable and flexible, the disinfection unit can be used in multiple areas and on different types of surfaces, which is ideal for these labs. The units were purchased initially to provide lab workers a safe environment to work in, however, since SteraMist®technology inactivates viruses and kills bacteria. The units will also be useful after the threat of the current pandemic ends as the Microbiology labs at all three (3) sites handle a variety of pathogenic bacteria routinely.
Recently, the USDA Research, Education, and Economics Mission area in the Northeast Area purchased a SteraMist®Select Surface unit. Additionally, we are seeing an increase in the interest of Universities assembling funding to purchase SteraMist®disinfection for their dining halls in order to bring students back to school and open their dining halls and cafes.
TOMI continues to work with premium companies in testing and validating SteraMist®technology in the Food Safety and seed industries.
In February 2021, we hired a Vice President of Sales for this division who brings years of experience with leading TIC (Testing, Inspection & Certification) companies and experience with food safety diagnostic companies including 3M, NSF International and Intertek.
Commercial
Due to a large interest and added customers in a variety of other use sites, we launched a Commercial division. These customers include direct foodbut are not limited to use sites such as aircraft, airports, police and crop applications.fire, manufacturing companies, automobile, military, cruise ships, shipping ports, preschool education, primary and secondary schools, colleges including dormitories, all modes of public and private transportation, regulatory consulting agencies, retail, housing and recreation, and of course emergency preparedness for counties and cities to use SteraMist®throughout their community.
We intend to target the following segments, with an initial emphasis on the profitable organic market:are actively pursuing federal grant monies and emergency preparedness monies in many of these verticals.
●
Food storage (produce, meats, fish)
●
Food transportation vehicle’s
In each area, our main objective is to prevent and/or minimize food decay without utilizing harsh chemicals that leave toxic residues. This could create an opportunity to supplement, or replace, current pesticidesOctober 2020, we hired a Vice President of Sales for this division who brings 35 years of global executive leadership experience in sales, marketing, strategy, business development, government affairs and fungicides currently being used by these industry leaders.
With regards totechnology development in the Food Safety industry, we believe that the routine treatment of tractor trailersaerospace, defense, energy, and shipping containers will reduce pathogen cross-contamination between cargo shipments. This is a high priority within this market based on volumehigh-tech industries with companies such as GE, Honeywell, Textron, and potential. In 2018, we treated specific rooms utilized by a global distributor with regards to their apple storage and lemon shelf life. In both decontamination situations SteraMist successfully demonstrated a clear pathogen reduction.Airbus.
Business Highlights and Recent Events
During 2018 management was focused on allocating significant resources into researchReverse Stock Split and product development, raising brand awareness through marketing and advertising initiatives, expanding our internal and external sales infrastructure, increasing product registrations, expanding our operational bandwidth with developmentNasdaq:
On September 10, 2020, we effected a 1-for-8 reverse stock split of the outstanding shares of our new facilitycommon stock and growingpreferred A stock. On September 30, 2020, we announced our revenuecommon stock was approved for listing on the Nasdaq and customer list.our shares commenced trading on the Nasdaq on October 1, 2020.
Research and product development:SARS CoV-2 coronavirus:
During 2018On March 11, 2020 the World Health Organization declared the SARS CoV-2 coronavirus a global pandemic, or the COVID-19 Pandemic, and recommended containment and mitigation measures worldwide. We have been identified as a disinfectant and decontamination vendor by various agencies and countries. We have been working with organizations to address the concerns and provide solutions for disinfecting and decontamination of the SARS CoV-2 coronavirus. The outbreak initially increased the demand for our products and services. We believe that the COVID-19 Pandemic has permanently created a public interest in disinfection. People all over the world are seeing germs differently since this pandemic started, mechanical disinfection is the wave of the future for this pandemic and for the ones ahead of us. There is a permanent shift as to the virus and in relationship to infectious control protocols which have been changed forever.
We anticipate that the outbreak will change requirements and protocols for disinfecting and decontamination worldwide, of which SteraMist®should be a solution. We are working with our existing and new customers to develop and/or upgrade their existing processes and requirements for disinfecting and decontamination.
We have been addressing the increased demand for our products as follows: (i) cooperation of our supply chain to expedite product, (ii) increase our staff to be able to receive and ship orders to meet customer timelines (iii) increase our customer service support to answer questions and solve issues and (iv) working with our TOMI service network to ensure that resources are deployed in a timely manner. In addition, we executed onincreased our R&D initiativesproduction capacity as we entered into an agreement with a second vendor to build our SteraMist®products.
Customers:
Globally, we have added approximately two-hundred and fifty (250) new customers across our five (5) divisions for the year ended December 31, 2020. This represents a three-hundred and sixty-three (363%) percent increase over the calendar year 2019. Post COVID-19 outlook we will continue to see demand for the SteraMist®products and services. While the initial outbreak saw a surge in Healthcare, Life Sciencedemand for the SteraMist®, we expect that the demand for our products and Food Safety areasservices will continue and further developedwe are building a team to address the linepost COVID-19 pandemic market opportunities. We are starting to see many of products we offer. Our R&D expenses increased in 2018 by approximately 102%our life science and biosafety customers come back to their workplace.
Revenues:
Total revenue for the year ended December 31, 2020 and 2019, was $25,028,000 and $6,347,000, respectively, representing an increase of $18,681,000, or 294% compared to the same prior year period.
The increase in revenue was attributable to increased global demand for disinfection and infectious disease control products in response to the COVID-19 pandemic. Although we saw a significant demand for our product within our Hospital-Healthcare, TSN, and Commercial divisions as a result of the 2018 initiativesCOVID-19 pandemic during the first half of 2020, we expect revenue to reflect steady growth as our customers update their operation requirements to include disinfecting and product development.
On the product development front, in 2018 we developed the following three new lines of product:
EZ SteraMist® Cart - offersdecontamination services into their regular routines for all potential pathogens and across all our Hospital-Healthcare customers a more efficient way to perform a terminal clean of their patient rooms. The EZ SteraMist® Cart was introduced in the third quarter of 2018 in connection with the Shield Study.divisions.
SteraMist® Selectproduct-based revenues for the years ended December 31, 2020 and 2019, were $22,971,000 and $4,999,000, representing an increase of $17,972,000 or 360% when compared to the same prior year period. The growth is attributable to increased mobile equipment orders and solution orders from our existing and new customers. We expect solution orders to continue to grow as our customers adopt new protocols for disinfecting and decontamination services.
Our service-based revenue for the years ended December 31, 2020 and 2019, was $2,057,000 and $1,348,000, respectively, representing a year over year increase of 53%. The increase in our service-based revenue was attributable to higher training sales recorded in connection with onboarding new customers and increased iHPTMservice jobs.
Our domestic revenue for the years ended December 31, 2020 and 2019, was $18,367,000 and $5,002,000, respectively, an increase of $13,365,000, or 267% when compared to the same prior year period. The increase was primarily due to the growth in our TSN network, Hospital-Healthcare and Commercial sales.
Internationally, our revenue for the years ended December 31, 2020 and 2019, was approximately $6,661,000 and $1,345,000, respectively, representing an increase of $5,316,000 or 395%. The increase in our international revenue was attributable to the increased use and expansion of our SteraMist®line of products in Canada, Europe, Asia and the Middle East. We expect our international revenue to continue to grow as more countries adopt our products and services as well as change their disinfecting and decontamination requirements as countries open their borders when the COVID-19 pandemic subsides.
Due to COVID-19, during most of 2020 and early 2021 many of our established vertical clients were closed or required to hunker down. The markets that were affected were our life sciences that were nonessential, University and privately owned vivarium labs, and many nonessential pharmaceutical research companies globally. The healthcare industry, which has been overwhelmed and lost most of its elective surgical and clinical revenue, had limited non-essential onsite personnel which made it virtually impossible to demo our equipment. Due to the decline in revenues, we are experiencing selective limited budgets for new technology at this time. We believe this will change mid-2021 as there will be significant federal funds available to improve the preparedness for subsequent pandemics. Our potential clients are already working on reevaluating the lack of effectiveness of historic manual cleaning process versus newer technologically driven mechanical cleaning process which includes SteraMist. The re-opening of the country and the rest of the world will allow us to meet with customers which will get our core technology back on track to becoming the leading disinfection and decontamination standard in the world.
In 2020 we budgeted revenues to be $18.0M, with actual revenues at approximately $25M, approximately 39% over budget. As we continue to evaluate the post COVID-19 landscape, we will have clearer understanding of 2021. Our goal is to meet our budgeted 2021 revenues of approximately $40 million. The goals will be driven by the anticipated return to work of our clients and potential clients within each of our verticals. As our customers return to work, they will need our technology and our solution to continue their everyday functions.
As many industrial companies are pulling back on R&D and capital expenditures spending due to the economic shock from the pandemic, we are moving ahead with many new products in development. Going forward we will spend more on capital expenditures (CapEx) and operating expenditures (OpEx) including development of new products, services and process technologies to sharpen our competitive advantage. In addition, we will expand our commercial service location to meet the expanding needs of our customers.
We believe that we possess one of the best technologies in the world in the decontamination space. This pandemic has given us the confidence to develop a clear strategy to manufacture what may be our best product portfolio to date. In addition, we continue to move our BIT technology closer to becoming the standard in disinfection and decontamination globally. This should lead to a greater market share, increased profitability and capability strength.
The second half of 2020 showed us that our customers wanted a lower cost disinfection device, even if it gave the end-user less efficacy and the potential of damage to its personal property and delicate equipment. Early in 2021, approximately 500,000 of the lower cost competitors electrostatic devices were recalled by Consumer Product Safety Commission. In addition to safety issues, they were damaging the materials that they were being used on but were also dangerous and causing explosions with many resulting in fires.
In order to respond to our customer demands of a lower cost and more versatile product, we developed a Backpack unit that will possess our award winning 6-log and above kill technology and speed without the damage to space and materials. We expect our backpack to be competitively priced and open SteraMist to the largest cleaning market in the world-members of ISSA (International Sanitary Supply Association) and its divisions IEHA (Integrated Environment and Health Assessment) and EMEA (Europe, Middle East & Africa). These organizations have historically been price conscious and were resistant early on to our SteraMist pricing of our professional decontamination equipment (SteraMist Surface and Environment Unit). We plan on introducing our new innovative backpack globally in early second quarter of 2021 with pre-orders being accepted on or about April 1. We have budgeted to sell two thousand units in 2021.
As of January 2021, the ELC (Epidemiology and Laboratory Capacity) Cooperative Agreement has awarded $30 billion for all 50 states and U.S. territories. The focus of the 2019-2024 ELC Cooperative Agreement (CoAg) is to strengthen core public health program growth while providing crucial flexibility needed to address emerging infectious disease issues. These awards are for the detection, response to, control and prevention of infectious disease. The ELC runs to 2024 and additional awards are expected to be distributed for 2021 – 2024.
Since 1995, the ELC program has been critical to U.S. health departments’ ability to combat infectious diseases.
Through ELC’s CoAg, all 50 states, several large metro areas, and U.S. territories and affiliates receive direct financial support to detect, respond to, control, and prevent infectious diseases.
We believe that disinfection will and should be a line item on all budgets going forward in both the public and private sectors and that SteraMist provides the best disinfection solution. Dangerous pathogens will still present themselves long after we recover from this pandemic. While the United States and other parts of the world are presently moving beyond this pandemic, there are many pathogens, some of which are respiratory in nature, that represent a looming threat. Preparedness is the most important measure to mitigate their effect. We learned this first with Ebola and again with SARS CoV-2. SteraMist can and will reduce the impact of the next pandemic.
During the pandemic, we have utilized our time to expand our salesforce in all verticals to develop relationships in the life science and healthcare industry. We believe Infectious Disease protocols have changed forever due to this pandemic and the need for a speedy comprehensive mechanical disinfectant/decontaminant will be included in the new norm of cleaning.
Due to the pandemic, there have been significant delays in our U.S. regulatory agencies in approving our new 1% label for food safety and for the FDA approving our product for reprocessing of personal protective gear. The delays are primarily due to the regulatory agencies not being able to have face-to-face committee meetings with our consultants and our staff.
We believe that disinfection will be a line item on all companies’ budgets going forward whether private, public or government. Dangerous pathogens still exist “Disease X” and will exist long after we recover from this pandemic. While the United States and most of the world is currently recovering from the SARS CoV-2 coronavirus outbreak there are many pathogens still a looming threat, with cases occurring globally to this day. There are 1.67 million unknown viruses in the world. Preparedness is the most important measure to ensure your family and business survives. We learned this with Ebola and recently with SARS CoV-2. SteraMist can reduce the impact of the next pandemic as it has already proven.
2020 Events:
In November 2020 we announced the retention of IMS Investor Relations to develop and execute a comprehensive investor relations and financial communications program.
As previously released, SteraMist iHP technology was deployed in the fight against EBOLA in West Africa, MERS in the Kingdom of Saudi Arabia and South Korea, and in 2020 was ready to be easily deployed throughout the world to aid in the fight against Coronavirus, an enveloped virus. TOMI’s Binary Ionization Technology (BIT) Solution, used exclusively in tandem with SteraMist equipment including the Surface Unit and Environment System, is listed on List G for Norovirus, List H for MRSA, List K for Clostridiumdifficilespores, List L for Ebola, List M for H1N1, and as of early 2020 List N: Disinfectants for Use Against SARS-CoV-2 with labeled efficacy for large and small enveloped viruses in addition to other pathogens.
After a three (3) year-long submission process, TOMI received two (2) separate registrations (SteraMist equipment and BIT solution) officially approved and registered with the China CDC. TOMI signed on a new distribution partner in Thailand, an exclusive partnership with Clean Environmental Solutions along with receiving a registration in the country. We shipped a number of units to Hong Kong to assist with new innovative ways of helping Hong Kong with their ongoing battle of controlling COVID-19. Routinely used to disinfect high traffic areas, SteraMist iHP technology treated public transportation, ambulances, hotel rooms, offices, and universities to stop the spread of this virus with more than 50 international customers and partners ranging from countries in Asia, Europe, and the Mideast using hundreds of SteraMist units, many of which were deployed to stop the spread of COVID-19 in 2020.
●
A hotel in York became the first in the United Kingdom to test positive for COVID-19, and after receiving approval from the Public Health of England, SteraMist was used to treat the hotel room. The treatment was a resounding success: the room was disinfected with a 9-log inactivation, exceeding the 6-log inactivation required.
●
ITH Pharma relocated their eight (8) Environment Systems to an area specifically designated for the manufacturing of COVID-19 testing supplies under the Centers for Disease Control (CDC) procedures in the United Kingdom.
●
Similarly, SteraMist in Singapore, was used in the disinfection of the National University of Singapore (NUS) upon realizing a professor contracted the contagious virus. The Ministry of Health proceeded to take action to stop the spread of the virus on campus, with the university president calling on SteraMist to thoroughly disinfect the facility - developedSteraMist was used in high traffic areas, such as hand railings, lifts, and lift lobbies, and routine facility cleaning was increased from two times a day to four times a day. In 2020, Singapore closed mosques to help stem the spread of SARS CoV-2 coronavirus after 82 citizens returned from a religious gathering in Malaysia with those thought to be confirmed with the virus. Professional cleaning services worked on the premises utilizing SteraMist disinfection, where all surfaces and high-contact areas within facilities, such as Masjid Angullia - one of Singapore’s oldest mosques, grateful for our superior material computability. And, early in 2021 our partner L3M has just sterilized a mosque in Malaysia.
●
South Korea’s national total of COVID-19 cases grew to over 4,000 according to the South Korean Centers for Disease Control and Prevention (KCDC). An established five-year TOMI authorized distributor in South Korea, GD Sciences, addressed this problem by utilizing SteraMist technology in transit systems, focusing primarily on the metropolitan transit system of South Korea’s capital city, Seoul which holds an annual ridership of over 1.2 billion. This same partner of TOMI’s also supplied SteraMist decontamination to the Korea Armed Force CBR Defense Command, a specialized team for the protection of life and death. It was used in special areas such as hospital negative pressure isolation rooms, operating rooms, and pharmaceutical sterile rooms.
●
TOMI 's exclusive partner in Israel, Clean-BIT purchased over $2.4 million in 2020 of TOMI technology and Solution and secured government contracts - including the Ministry of Defense - and private contracts for SteraMist disinfection to be used in hospitals, restaurants, grocery stores, food stores, ambulances and other transportation, including aircraft. They remain on alert to assist in an emergency situation by using SteraMist proprietary protocols and the cutting edge SteraMist technology to address all biological threats.
Along with being on the forefront of fighting the 2020 pandemic internationally, TOMI increased its TOMI Service Network provider memberships and BIT solution sales dramatically increased due to the amount of service jobs that our TSN providers conducted including the treatment of schools, residential and commercial buildings, rapid transit, airplanes and other transportation methods along with many other areas. Many businesses and facilities have taken proactive measures to help prevent the possibility of cross-contamination, including military and multiple healthcare facilities. Some businesses have also scheduled SteraMist service in direct response to confirmed cases, such as fast-food franchises. Certain members have begun to assist first responders, supermarket chains and aerospace defense companies and government facilities throughout the United States. TSN members throughout the U.S. and Canada serve as a critical wide spectrum of specializations within a variety of communities, and as a result of this operational diversity, many businesses experience periods of substantial growth over others depending on local conditions.
One such member, Enviro-Mist, not only utilized SteraMist during the PGA tour, but utilizes SteraMist technology to treat 234,582 square feet across five Merakey Behavioral Health campuses in Southeastern Pennsylvania on a quarterly basis. Additionally, Merakey operations personnel treat their own facilities using five (5) TOMI SteraMist Surface Unit disinfection devices, one for each facility. Coronavirus has elevated disinfection protocols adopted by the medical community and will continue to evolve well beyond the pandemic, with further scrutiny placed on other harmful pathogens prevalent in medical environments such as MRSA, Clostridium difficileSpore and Candida auris.
Late in 2020, TOMI launched its Commercial division, and has since experienced growth in this sector that includes, but is not limited to, aviation, police, fire and rescue departments, and emergency community/city preparedness. Since its launch TOMI accrued a new customer base within the Commercial division, with interest rapidly growing and providing great feedback. Two such customers that have integrated SteraMist into their disinfection/safety protocols are the fire and rescue operations of Chester Fire Bureau in Chester, PA and the fire rescue and police stations located on the airport grounds at Cincinnati-Northern Kentucky International Airport (CVG). Both of these enterprises share some commonality in their requirements for disinfection and SteraMist has been proven to perfectly fit their first responder needs. As Commissioner Rigby of the Chester Fire Bureau stated, “The most important consideration we have is the safety of our customerscitizens and employees, especially our police officers and firefighters who have smaller enclosuresbeen on the front line of this pandemic alongside the amazing paramedics and EMTs. We did not want just “good” decontamination equipment…we wanted the “best” equipment available to ensure that we are doing everything we can to keep our people as safe as possible.”
TOMI also announced that its local Operations Headquarters Frederick 911 Communications Center purchased a SteraMist Surface Unit to be used throughout its office to combat COVID-19, quickly promoting it within days through an article in needThe Frederick News-Post: Top-of-the-line disinfecting device delivered to county 911 call center. This initial purchase of decontamination. Thisone (1) unit is lightweight and easyhas led to transportfour (4) additional units for other Communication Centers in the area with budget approval in the added ability to function betweenfuture for ten (10) additional Surface Units.
On a lower flow operation and standard operation,manufacturing front, our long-term customer in the United Kingdom, ITH Pharma an industry leader in aseptic compounding services, mixing drugs into ready-to-use IV preparation that must comply with stringent decontamination levels as required by regulatory agencies such as the Medicines and Healthcare products Regulatory Agency (MHRA), implemented an additional SteraMist Surface Unit. The user can adjust air flow, adjust pump fluid flow, set the programmable timer for automatic runs, modify spray/dwell timeseight (8) applicator CES to service their new facility, following initial success with a CES in use with their other refurbished facility. Both systems have successfully been qualified and number of cycles, and is equipped with start and stop buttonsare in use.
Stainless Steel 90-Degree Applicator - rolled outMid 2020, TOMI entered into a new manufacturing agreement with Planet Innovation who offers greater production capability with a large production floor, providing the ability to house product and accommodate increased production activity. Planet Innovation specializes in healthcare technology and product commercialization, with an established portfolio spanning well over a decade. As a result of its significant growth in the first half of 2020, TOMI made strides in growing and evolving its research and quality control divisions, both of which have been involved in ongoing discussions to ensure regulatory compliance and quality consistency. The geography of this new manufacturer provides a benefit of increased product availability internationally, allowing for the significant growth of existing and future SteraMist product end users into the Asia Pacific region, EU and Africa. The contract has a three (3) year term, and the team is almost complete in the design of the SteraPack™.
Robotic applications using TOMI SteraMist iHP™ technology in healthcare and many other industries will help to vastly reduce direct human exposure to dangerous pathogens. TOMI signed agreements with several companies in the Asia and Southeast Asia region granting the right of its patented SteraMist iHP™ for use in the development of disinfection robots. Prototype disinfection robots have been developed and are undergoing early-stage trials at various locations. One of TOMI’s robotic development partners, RV Automation Technology Company Limited successfully deployed SteraBot™ in late 2020, in a pilot disinfection robot at the Lithuanian University Hospital of Health Sciences.
Finally, SteraMist technology once again successfully tested for direct produce application efficacy, with testing results published in Food Control for the third time. The United States Department of Agriculture paper “Cold plasma-activated hydrogen peroxide aerosol on populations of Salmonella Typhimurium and Listeria innocua and quality changes of apple, tomato and cantaloupe during storage – A pilot scale study” authored by Dr. Xuetong Fan. The objective of this study sought to test direct application of iHP™ directly onto the smooth surfaces of tomatoes and apples, the stem scars of tomatoes, and the rinds of cantaloupes. Resulting efficacy on the reduction of Salmonella Typhimurium and Listeria innocua bacteria as well as any changes in quality parameters for simulated storage were observed.
2021 Events to Date:
During the first quarter of 20182021, we hired two Vice President of Sales, each of which, along with a Vice President of Sales, hired in the fourth quarter of 2020, attended a week-long sales seminar hosted by TOMI at the end of February 2021. The sales seminar was intended to educate each sales professional about disinfection decontamination competition in their respective divisions and provides a solution for applications needs for small enclosuresthe advantages of SteraMist technology and very tight spaces. products.
Environment System softwareOn January 15, 2021, Dr. Halden Shane presented at the Needham Virtual Growth Conference while continuing to pursue and reporting upgrades – the upgrades include PDF printing capabilities and allows for reports to be generated providing our Life Sciences customersenhance SteraMist media presence across many platforms.
On January 27, 2021, we released preliminary scientific results on one of two studies conducted with the necessary informationUniversity of Virginia demonstrating kill on SARS CoV-2 Virus in 5 seconds and look forward to be cGMP compliant.results on the second study achieving kill on Adenovirus, which will help our Hospital-HealthCare, TOMI Service Network, and Commercial markets.
Research studiesStudies:
An article was published on April 30, 2020, with our long-term customer, Dana Farber in Boston on the research studies and protocol developments of the decontamination of N95 masks and face shields. This protocol is under review with the FDA and allows for the disinfection of 2,000 masks in two (2) hours. Similar protocols developed at the University of Iowa and Cedars Sinai of Los Angeles are also under review with the FDA allowing for tens of thousands of PPE reprocessing daily. We continue to wait for FDA EUA approval.
We have moved forward with testing on 1% BIT Solution in preparation of another EPA label as we passed the third milestone for EPA review on December 7, 2020 and our PRIA date has been extended until early summer.
We continue to work with our German aircraft partner and Boeing in a third-party test required for the aviation industry. We will incur no costs for this work as both testing partners are clients. We anticipate the testing will be completed in Q2-21.
We continue to work with the Virginia State University Agricultural Research Station and its partner, Arkema on a food safety pilot study based on novel, nonthermal, and environmentally friendly technology to control foodborne pathogens on industrial hemp seed and strawberry as representative model foods. The study will investigate the efficacy of aerosolized hydrogen peroxide in inactivating foodborne pathogens – determining the optimum treatment conditions on microbial and physical quality of the two model products. We anticipate the pilot to be completed Q2-21.
We are working with University of Virginia on two separate studies. First, SteraMist efficacy against SARS-CoV-2 and as reported successful results. We wait for the final published paper. The second, against Adenovirus using the handheld SteraMist Surface Unit and testing spray and contact time variables and we wait for final results. We anticipate the testing will be completed in Q3-21.
TOMI has partnered with the Department of Chemistry and Biochemistry of Texas Tech University to conduct a wide range of studies on spray pattern, deposition, and hydrogen peroxide content in order to compare our 1% label to other similar products on the market.
We continue to participate in a large multi-year federal funded study, aknown as the “SHIELD study”, that compares hospital manual cleans to a SteraMist®mechanical clean. ThisPreliminary results collected by the current hospitals in the study is being conducted at Los Angeles Public Health Hospitals; UCLA Olive View Medical Center, Harbor-UCLA Medical Center. Preliminary results have shown that there has beenshowing a significant decrease in the transference of pathogens resulting in HAIs and C.Clostridium difficile infections in the rooms that used SteraMist® for their terminal clean, as compared to the rooms that have been manually cleaned. Future results will be released as obtained from the study’s lead investigators.
The initial results received fromUniversity of California, Los Angeles expanded involvement in the SHIELD study directly ledallowing for additional collection of data to validate the partnership between TOMI and MaxAir formed in 2018. TOMI developed a terminal clean protocol that is less than one hour. MaxAir developed a purifying respiratory protection helmet, this high-tech helmet pushes 6-liters of cool clean air to the face of the hospital Environmental Service employees and outside service providers during TOMI’s hospital terminal clean protocol.
TOMI and one of our corporate partners have continued agricultural testing with the USDA to determine the efficacy of SteraMist® against viral threats to honey bees and hives. Initial results from such testing suggest that SteraMist® may be effective in inactivating such virus threating this particular vertical.
In the third quarter of 2018, a major global agricultural seed distributor began testing the efficacyvalue of SteraMist® against common viral, fungaltechnology in hospitals, this expansion has been postponed until the threat of COVID-19 decreases and bacterial threats to corn seeds and various other large and small seeds of size. While testing continues into 2019, to the extent the results indicate clear efficacy, we intend to pursue all available opportunities within the seed development industry.on-site EVS training can continue.
As for direct crop application, we are targeting those crops grown indoors, in particular, high value crops such as vegetables, mushrooms and cannabis. Additionally, with the help of strategic corporate partners, we have conducted tests and obtained positive preliminary results from the application of SteraMist® to a particular pathogen that is a current threat to the mushrooms industry.
During 2018, the World Health Organization (“WHO”) published and identified SteraMist® as the only “Disinfecting solution and technology” in its 2016–2017 “WHO compendium of innovative health technologies for low-resource settings”. As part of the selection process, 562 technologies were evaluated by 35 internal WHO staffers and 87 external independent reviewers, who presented no conflict of interest. Once these evaluations were received and the data compiled, a total of 39 prototypes and 29 commercially available products were selected and presented in the compendium in order to illustrate the innovative technologies that can empower healthcare workers with the goal of supporting people and patients to have a healthier life. SteraMist was the only disinfecting technology cited.
In September 2018, we partnered with the Global BioRisk Advisory Council (“GBAC”) to use SteraMist® as one of the training technologies used in their certification classes. This also allows for the decontamination of everyday crises as well as forensic restoration and bio-hazard scenes as needed. TOMI also launched the Forensic Restoration Service Team (or “FRST”), a U.S. based TOMI-certified forensic restoration and crime clean network. This network is comprised of service providers who specialize in forensic restoration such as mass casualty, crime scene, suicide and unattended death cleanup. Also included within this field are hoarding and bio-recovery services. Participating FRST members will receive specialized training and certifications by GBAC. We have four (4) certified FRSTmembers to date.
Registrations:
In 2018, we received our Taiwan Registration and added our Canadian label to the Organic Materials Review Institute (“OMRI”) certifying that our product follows Canadian organic standards adding to our already robust BIT Solution registrations.
Marketing and Advertising Campaigns:
In early 2018 we established a plan to increase our marketing and advertising initiatives in order to further build brand awareness. As a result of our digital campaigns that were carried out in 2018, our website statistics have improved significantly from 2017 to 2018. With our continual efforts in advertising within targeted publications, Google search engine optimized campaigns, and organic brand awareness built by our team we further increased our digital footprint. We have increased our 2017 to 2018 digital advertising in publications impressions. Our marketing director continues to focus on digital campaigns to drive users to TOMI’s website with the goal of creating higher lead conversations.
During 2018 we also attended fifty-two (52) national, state and local tradeshows and conferences to increase our growing base of sales leads and further build brand awareness. Our increased tradeshow presence has increased our leads, sales opportunities and has resulted in growth in our sales pipeline for 2019.
Personnel:
In January 2018, we appointed our new Chief Operating Officer, Elissa Shane, who had previously served us in other roles for several years, and in January 2018, we announced the appointment of Dr. Lim Boh Soon to our Board.
In 2018, we allocated resources into building our sales infrastructure, training on our products and equipment and expanding our internal and sales representative presence. We grew our overall sales force in 2018 compared to 2017 from (2) to (5) dedicated internal full-time dedicated sales personnel and from (26) in 2017 to (56) independent sales representatives in the U.S. We added consultants to assist with building brand awareness while also providing sales and technical support. Internationally, we continuously build our presence by the addition of distributors and representatives throughout Asia, Australia, Europe and South America.
In addition, we also continued to build internal base of employees by increasing our overall full-time employee headcount from 13 to 19 or by approximately 46% in 2018.
Facilities:Product Development:
ManagementWe have added four (4) new products to our growing line of products:
SteraBot™

SteraBot™ is an autonomous, machine-based solution that provides a more precise and efficient disinfection and decontamination, eliminating potential human error and reducing a facility’s operating expenses. It incorporates Automated Guided Vehicle (AGV) technology for intuitive maneuverability in unmapped environments, perfect for high touch surfaces maneuvering high and low, side by side, and multi-angle directions. The software allows for enhanced AI capability to optimize and execute mapping, autonomous navigation, and disinfection routines based on proprietary algorithms. The software also focusedensures the efficacy of SteraMist iHP™ disinfection under optimal operating parameters directed by TOMI, including the support of handheld disinfection. Currently, the SteraBot™ has been developed for testing internationally. The Picture above demonstrates the one applicator robot version, and allocated resourceswe are currently in 2018development of a three-applicator version. The consumer will have a choice between a one applicator or a three-applicator version depending on building our internal operating infrastructureneeds. We expect to launch the SteraBot in late Q2-2021.
SteraPack™
The soon to be launched domestically and bandwidth. In February 2018 we announcedinternationally, SteraPack™ will be a portable battery supplied product producing the relocation of our U.S. corporate headquarters, and in April 2018 we finalized our lease for our new facility. Our new state of the art facility5-second per square foot with no wet contact time, high efficacy iHP™ technology. The SteraPack™ is approximately 9,000 square feet25 pounds with a run time of 45 minutes and is outfitted withwill hold a 1.0-liter BIT™ Solution bottle. The SteraPack™ will have a 4-foot hybrid cable length, an iHP Decontamination Complete room system, a 40-seat training room, a qualification laboratory, a quality control roomergonomic padded harness which provides inputs for strap length and increased warehouse space to accommodate our anticipated growth. Full time business operations were moved here and began out of this facility in December 2018.adjustment ranges.
Financial:
TOMI’s SteraMist Drive-in CES Decontamination System at Frederick TOMI has a recently installed Customer Engineered System in its Frederick Operations Office. The system houses three (3) permanent 90-degree rotating applicators and one (1) additional applicator used for manual spraying. The full-service iHP disinfection room was launched for emergency, police, fire, medical transports, specialized transports, personal vehicles, auto dealerships for new and used cars. In addition, our decontamination room can treat personal and workplace equipment, furniture, sports equipment, contaminated shipments and a lot more. The SteraMist®systems are versatile and easy to maintain with relatively low upkeep. In fact, preventive maintenance is not required to be performed by a service engineer and remote guidance can be provided upon request. | | |
| | |
SteraMist®SteraBox Late in 2020, TOMI sold its first decontamination chamber. Currently we now sell our chamber in two separate sizes and it is sold with the Select Surface Unit or the Environment System and is dependent on the customers decontamination needs. This product is remotely initiated and includes a self-contained exhaust system without fear of hydrogen peroxide exposure to the surrounding area. The customer experiences speed, efficacy, and expansive material compatibility in a controlled, customizable cabinet decontaminating all needs with ease. The Chamber is expected to launch into the market in Q2-2021 | | |
Registrations & Intellectual Property (IP):
On the salesOur portfolio includes more than twenty (20) Utility Patent applications worldwide for both method and business development front, we continued to grow our customer base and build revenue in 2018. Since bringingsystem claims on SteraMist®toBIT™, either published or undergoing prosecution. Most recently, in November 2020, we were granted utility patents in Australia and Israel for our SteraMist® BIT™ technology. In the commercial market,recent past, we have added approximately 300 customers. During 2018,obtained two related US utility patents giving us protection of our technology until the year 2038, and we added 65 customersare pursuing further claims to additional capabilities in on-going US and sold 85 machinesworldwide patent applications. In May 2020, we filed a PCT application for further additional applications of SteraMist® BIT™ which includes 2 Permanent iHP Complete Disinfection Rooms that were installed duringdetermined to be novel and inventive by the year.international search authority.
Further in 2020, we submitted utility patents in multiple countries which are all in the national stage for review under the patent prosecution highway for claims found novel and inventive by the international search authority. Once these are received, we will hold international acceptance for the inherited patents and our newly received patents. During 2020, we were awarded a design patent on our surface-mounted applicator device in the United States, China, Japan, Taiwan, and Korea. We have filed and have been granted or have pending acceptance on thirty-two (32) separate design patents for our: Decontamination Chamber(s), Decontamination Applicator, Decontamination Cart, Applicator, and Surface Mounted Applicator 90-Degree Device. These patents are published around the world, including but not limited to United States, China, Hong Kong, Europe, United Kingdom, Singapore, Taiwan, Vietnam, Canada, South Korea, and Japan.
Our revenueproducts are sold around the world under various brand names and trademarks. We consider our brand names and trademarks to be valuable in the marketing of our products. As of March 1, 2021, we held a total of one hundred seventy-eight (178) trademarks (word and logo) registered or pending across the globe. TOMI registers marks in seven (7) classes of specification of goods and services: Class 1 for Chemicals for Treating Hazardous Waste, Class 5 for Disinfectants, All-Purpose for Hard Surfaces and for Treating Mold, Class 7 for Handheld Power Operated Spraying Machines, Class 11 for Sterilizers for Medical Use and Air Purification, Class 35 for Business Consultation and Management Services, Class 37 for General Disinfecting Services, and Class 40 for Chemical Decontamination and Manufacturing Services.
Financial Operations Overview
Our financial position as of December 31, 2020 and 2019, respectively, was as follows:
| | | |
| Total shareholders’ equity | $13,203,000 | $890,000 |
| Cash and cash equivalents | $5,199,000 | $897,000 |
| Accounts receivable, net | $3,717,000 | $1,495,000 |
| Inventories, net | $3,782,000 | $2,315,000 |
| Prepaid expenses | $421,000 | $188,000 |
| Vendor Deposits | $389,000 | $141,000 |
| Other Receivables | $199,000 | $- |
| Current liabilities (excluding convertible notes) | $2,203,000 | $1,302,000 |
| Convertible notes payable, net | $- | $5,000,000 |
| Long-term liabilities | $1,364,000 | $1,034,000 |
| Working Capital (excluding convertible notes) | $11,503,000 | $3,734,000 |
| Working Capital (including convertible notes) | $11,503,000 | $(1,266,000) |
During the year ended December 31, 2020, our debt and liquidity positions were affected by the following:
●
Net cash provided from operations of $4,578,000
●
Proceeds from loan payable of $411,000
●
Net cash used in investing activites of $401,000
●
Proceeds from exercise of outstanding warrants and options to purchase common stock of $214,000
●
Conversion of convertible notes payable with a principal balance of $4,500,000 into shares of common stock
●
Repayment of convertible note payable with a principal balance of $500,000
Results of Operations for the Year Ended December 31, 2020 Compared to the Year Ended December 31, 2019
| | For The Years Ended December 31, | |
| | | | | |
| Revenue, Net | $25,028,000 | $6,347,000 | $18,681,000 | 294% |
| Gross Profit | 15,043,000 | 3,914,000 | 11,129,000 | 284% |
Total Operating Expenses (1) | 10,534,000 | 5,997,000 | 4,537,000 | 76% |
| Income (Loss) from Operations | 4,509,000 | (2,083,000) | 6,592,000 | |
| Total Other Income (Expense) | (40,000) | (214,000) | 174,000 | |
| Provision for Income Taxes | (77,000) | - | (77,000) | |
| Net Income (Loss) | $4,391,000 | $(2,297,000) | $6,689,000 | |
| Basic Net Income (Loss) per share | $0.27 | $(0.15) | $0.42 | |
| Diluted Net Income (Loss) per share | $0.23 | $(0.15) | $0.38 | |
(1)
Includes $3,131,000 and $114,000 in non-cash equity compensation expense for the years ended December 31, 20182020 and 2017 was $5,584,6122019, respectively.
Sales
During the years ended December 31, 2020 and $4,993,668,2019, we had net revenue of approximately $25,028,000 and $6,347,000, respectively, representing an increase in revenue of approximately $18,681,000 or 294%. The increase in revenue was attributable to increased global demand for disinfection and infectious disease control products in response to the COVID-19 Pandemic. Although we saw a 12% year over year increase. Q3 2018 wassignificant demand for our product within our Hospital-Healthcare, TSN, and Commercial divisions as a record quarter with revenuesresult of $1,948,000. the COVID-19 Pandemic during the first half of 2020, we expect revenue to reflect steady growth as our customers update their operation requirements to include disinfecting and decontamination services into their regular routines for all potential pathogens and across all our divisions.
Internationally,
As customers mature through the product and adoption cycle and our sales pipeline converts to revenue, we expect to have more predictable sales quarter over quarter. Further, as the COVID-19 pandemic subsides, we expect that the demand for our products and services will continue and we are building a team to address the post COVID-19 pandemic market opportunities.
Net Revenue
Product and Service Revenue
| | For the Years Ended December 31, | |
| | | | | |
| SteraMist Product | $22,971,000 | $4,999,000 | $17,972,000 | 360% |
| Service and Training | 2,057,000 | 1,348,000 | 709,000 | 53% |
| Total | $25,028,000 | $6,347,000 | $18,681,000 | 294% |
Revenue by Geographic Region
| | For The Years Ended December 31, | |
| | | | | |
| United States | $18,367,000 | $5,002,000 | $13,365,000 | 267% |
| International | 6,661,000 | 1,345,000 | 5,316,000 | 395% |
| Total | $25,028,000 | $6,347,000 | $18,681,000 | 294% |
Cost of Sales
| | For The Years Ended December 31, | |
| | | | | |
| Cost of Sales | $9,985,000 | $2,433,000 | $7,552,000 | 310% |
Cost of sales was $9,985,000 and $2,433,000 for the year ended December 31, 2020 and 2019, respectively, an increase of $7,552,000, or 310%, compared to the prior year. The primary reason for the increase in cost of sales is attributable to the increase in revenue in the current year. Our gross profit as a percentage of sales for the years ended December 31, 2018 and 2017 were $1,388,000 and $1,499,000,2020 was 60.1% compared to 61.7% in the same prior period, respectively. While regulatory andThe lower gross profit is attributable to the product registrations have slowed our anticipated growthmix in Asia and Europe, wesales. As revenues continue to make stridesgrow and we are able to negotiate more favorable pricing from our vendors, we anticipate that our cost per unit could decrease.
Professional Fees
| | For The Years Ended December 31, | |
| | | | | |
| Professional Fees | $681,000 | $364,000 | $317,000 | 87% |
Professional fees are comprised mainly of legal, accounting, and financial consulting fees.
Professional fees were $681,000 and $364,000 for the years ended December 31, 2020 and 2019, respectively, an increase of approximately $317,000, or 87%, in the registration process, which we anticipate will position uscurrent year period. The increase is attributable to generate additional revenueprofessional fees in those regions.connection with our up list to the Nasdaq.
Depreciation and Amortization
During 2018, we experienced| | For The Years Ended December 31, | |
| | | | | |
| Depreciation and Amortization | $720,000 | $716,000 | $4,000 | 1% |
Depreciation and amortization were approximately $720,000 and $716,000 for the years ended December 31, 2020 and 2019, respectively, representing an increase of $4,000, or 1%.
Selling Expenses
| | For The Years Ended December 31, | |
| | | | | |
| Selling Expenses | $1,247,000 | $1,655,000 | $(408,000) | (25)% |
Selling expenses for the year ended December 31, 2020 were approximately $1,247,000, as compared to $1,655,000 for the year ended December 31, 2019, representing a decrease of approximately $408,000 or 25%.
We continue to invest and allocate resources into our sales, marketing and advertising initiatives and have increased efforts in the current year overin order to further develop our brand recognition and grow our base of customers. The decline in selling expenses is primarily due to a revision of our sales department as well as a complete reduction in tradeshow costs in the current year 14%period as a result of the COVID-19 pandemic. We expect tradeshow expenses to continue to decline this year in connection with the COVID-19 pandemic as physical distancing continues to remain in effect. We expect to increase our external sales team strategy during 2021 along with adding internal senior sales and sector Vice Presidents to address the increase in the demand for our reoccurring BIT Solution sales dueproducts and services.
Research and Development
| | For the Years Ended December 31, | |
| | | | | |
| Research and Development | $455,000 | $341,000 | $114,000 | 33% |
Research and development expenses for the year ended December 31, 2020 were approximately $455,000, as compared to higher repeat orders from our existing customer base. As our user base grows, we expect this metric$341,000 for the year ended December 31, 2019, representing an increase of approximately $114,000, or 33%. The increase in research and development expenses is attributable to improve over time.new product development and increased testing.
Recently, TOMI was audited by Pfizer Global Supply Manufacturing and Supplier Quality Assessments and were reported to be “Acceptable”, the highest given rank, allowing us to continue expanding SteraMistEquity Compensation Expen®implementation into Pfizer facilities.se
In 2018, we finalized our Installation & Performance Qualification documentation allowing for an additional avenue to generate company revenue. Along with this document we formalized User Requirement Specifications for our SteraMist equipment.| | For The Years Ended December 31, | |
| | | | | |
| Equity Compensation Expense | $3,131,000 | $114,000 | $3,017,000 | 2,646% |
In May 2018, we offered a noteholderEquity compensation expense was $3,131,000 and $114,000 for the option to convert its Note at a reduced conversion priceyears ended December 31, 2020 and 2019, respectively, representing an increase of $0.46.$3,017,000 or 2,646%. The noteholder accepted and converted at such price.Pursuantincrease in equity compensation expense relates to the termstiming of warrants issued to executives and consultants in 2020.
Consulting Fees
| | For the Years Ended December 31, | |
| | | | | |
| Consulting Fees | $327,000 | $127,000 | $200,000 | 157% |
Consulting fees were $327,000 and $127,000 for the year ended December 31, 2020 and 2019, respectively, representing an increase of $200,000, or 157%, in the current year period. The increase is due to the timing of certain projects that occurred in the current year that did not occur in the same prior year period.
General and Administrative Expense
| | For The Years Ended December 31, | |
| | | | | |
| General and Administrative | $3,972,000 | $2,681,000 | $1,291,000 | 48% |
General and administrative expense includes salaries and payroll taxes, rent, insurance expense, utilities, office expense and product registration costs.
General and administrative expense was $3,972,000 and $2,681,000 for the years ended December 31, 2020 and 2019, respectively, an increase of $1,291,000, or 48%, in the current year period. The increase in General and administrative expense is attributable to a higher employee headcount and higher wages as well as an increase in international product registration.
Other Income and Expense
| | For The Years Ended December 31, | |
| | | | | |
| Amortization of Debt Discounts | $- | $(18,000) | $18,000 | |
| Interest Income | 2,900 | 3,000 | (100) | (3)% |
| Interest Expense | (44,000) | (200,000) | 156,000 | (78)% |
| Other Income (Expense) | $(41,100) | $(215,000) | $173,900 | (81)% |
Amortization of debt discount was $0 and $18,000 for the years ended December 31, 2020 and 2019, respectively. Amortization of debt discount for the year ended December 31, 2019, consisted of the conversion offer, an aggregateamortization of $700,000debt discount on the $6,000,000 principal amount of principalNotes issued in March and $5,212May 2017. The debt discount was amortized over the life of accruedthe Notes utilizing the effective interest outstanding under the Note were converted into 1,877,960 shares of common stock. The Company recognized an induced conversion cost of $57,201 related to the conversion.method.
Interest income was $2,900 and $3,000 for the years ended December 31, 2020 and 2019, respectively.
Interest expense was $44,000 and $200,000 for the years ended December 31, 2020 and 2019, respectively. Interest expense for the years ended December 31, 2020 and 2019 primarily consisted of the interest incurred on the $6,000,000 principal amount of Notes issued in March and May 2017 of which $4,500,000 was converted to common stock in March, 2020 and the remaining $500,000 was paid in cash in March 2020.
Provision for Income Taxes
| | For The Years Ended December 31, | |
| | | | | |
| Provision for Income Taxes | $77,000 | $- | $77,000 | NM |
Provision for income taxes was $77,000 and $0 for the years ended December 31, 2020 and 2019, respectively.
Liquidity and Capital Resources
As of December 31, 2020, we had cash and cash equivalents of $5,199,000 and working capital of $11,503,000. Our principal capital requirements are to fund operations, invest in research and development and capital equipment, and the continued costs of public company filing requirements. We have historically funded our operations through debt and equity financings.
In December 2018, a noteholder redeemed a noteMarch 2020, convertible notes with a principal balance of $300,000$4,500,000 were converted into 1,041,667 shares of our common stock at a conversion price of $4.32 per share and the remaining outstanding balance of $500,000 was repaid in exchangethe form of cash.
For the year ended December 31, 2020 we generated income from operations of $4,509,000 and for $150,000the year ended December 31, 2019, we incurred losses from operations of ($2,083,000). Cash provided from operations for the year ended December 31, 2020, was $4,578,000. Cash used in cash.operations was ($814,000) for the year ended December 31, 2019.
A breakdown of our statement of cash flows for the year ended December 31, 2020 and 2019 is provided below:
| | For the Year Ended December 31, |
| | | |
| Net Cash Provided By (Used) in Operating Activities | $4,578,000 | $(814,000) |
| Net Cash Used in Investing Activities | $(401,000) | $(293,000) |
| Net Cash Provided By Financing Activities: | $124,000 | $- |
Operating Activities
Cash provided by operating activities We recognizedfor the year ended December 31, 2020 was $4,578,000, compared to cash used in operations for the year ended December 31, 2019 of ($814,000). Our cash provided by operations improved in the current year period as a gain on redemptionresult of convertible note incomeincreased revenue and net income.
Investing Activities
Cash used in investing activitiesfor the years ended December 31, 2020 and 2019 was $401,000 and $293,000, respectively.
Financing Activities
Cash provided by financing activities for the years ended December 31, 2020 and 2019 was $124,000 and $0, respectively. The cash provided by financing activities increased in the current period due to the proceeds from the exercise of warrants and options in the amount of $150,000 as a result$214,000 and proceeds from loans payable of $411,000 offset by repayment of the transactiprincipal balance of the convertible notes of $500,000.
Intellectual Property (IP):Liquidity
Since TOMI’s inceptionOur revenues can fluctuate due to the following factors, among others:
●
ramp up and expansion of our internal sales force and manufacturers’ representatives;
●
length of our sales cycle;
●
global response to the outbreak of COVID-19 Pandemic;
●
expansion into new territories and markets; and
●
timing of orders from distributors.
We could incur operating losses and an increase of costs related to the continuation of product and technology development, and sales expense as we have continuously advancedcontinue to grow our intellectual property portfolio. Currentlysales teams and geographic presence, tooling capital expenditures as we holdramp up and streamline our production and administrative activities including compliance with the Sarbanes-Oxley Act of 2002 Section 404.
Management has taken and will endeavor to continue to take a varietynumber of intellectual property both domesticallyactions in order to improve our results of operations and internationally - registered designthe related cash flows generated from operations in order to strengthen our financial position, including the following items:
●
expanding our label with the EPA to further our product registration internationally;
●
continued expansion of our internal sales force and utility patents as well as registered trademarksmanufacturer representatives in an effort to drive global revenue in all verticals;
●
Continue research and development and add new products to our “Stera” product line
●
source alternative lower-cost suppliers;
●
expansion of international distributors; and
●
continued growth in all of our verticals.
We expect that include both wordthe cash we generate from our core operations will generally be sufficient to cover our future capital expenditures and image marks registered across four separate classes. TOMI continues to maintainpay down our near-term debt obligations, although we may choose to seek alternative financing sources.
We believe that our existing balance of cash and renew a total of thirty-four (34) patentscash equivalents and seven (7) trademarks. Since 2017, TOMI added a total of sixteen (16) patentsamounts expected to be provided by operations will provide us with sufficient financial resources to meet our cash requirements for operations, working capital and fifteen (15) trademarks and is waiting for acceptance of eight (8) additional patents, including two (2) Utility Patents, and seven (7) additional registered trademarks. capital expenditures over the next twelve months.
Critical Accounting Policies and Estimates
Our discussion and analysis of our financial condition and results of operations is based upon our consolidated financial statements, which have been prepared in accordance with U.Saccounting principles generally accepted accounting principles.in the United States. The preparation of these financial statements requires us to make estimates and judgments that affect the reported amounts of assets, liabilities, revenues and expenses, and related disclosure of contingent assets and liabilities. The estimation process requires assumptions to be made about future events and conditions, and as such, is inherently subjective and uncertain. Actual results could differ materially from our estimates.
The SEC defines critical accounting policies as those that are, in management’s view, most important to the portrayal of our financial condition and results of operations and most demanding of our judgment. We consider the following policies to be critical to an understanding of our consolidated financial statements and the uncertainties associated with the complex judgments made by us that could impact our results of operations, financial position and cash flows.
Revenue Recognition
We recognize revenue in accordance with Financial Accounting Standards Board (“FASB”) (FASB) Accounting Standards Update (“ASU”)(ASU) No. 2014-09,Revenue from Contracts with Customers (Topic 606),. We recognize revenue when therewe transfer promised goods or services to customers in an amount that reflects the consideration to which we expect to be entitled in exchange for those goods or services. To determine revenue recognition for contracts with customers we perform the following five steps: (i) identify the contract(s) with a customer; (ii) identify the performance obligation(s) in the contract; (iii) determine the transaction price; (iv) allocate the transaction price to the performance obligation(s) in the contract; and (v) recognize revenue when (or as) we satisfy the performance obligation(s). At contract inception, we assess the goods or services promised within each contract, assess whether each promised good or service is persuasive evidencedistinct and identify those that an arrangement exists, titleare performance obligations.
We must use judgment to determine: a) the number of performance obligations based on the determination under step (ii) above and riskwhether those performance obligations are distinct from other performance obligations in the contract; b) the transaction price under step (iii) above; and c) the stand-alone selling price for each performance obligation identified in the contract for the allocation of loss have passed, delivery has occurred, or the services have been rendered, the salestransaction price is fixed or determinable and collection of the related receivable is reasonably assured. in step (iv) above.
Title and risk of loss generally pass to our customers upon shipment. Our Customers include end users as well as dealers and distributors who market and sell our products. Our revenue is not contingent upon resale by the dealer or distributor, and we have no further obligations related to bringing about resale. Shipping and handling costs charged to customers are included in Product Revenues. The associated expenses are treated as fulfillment costs and are included in Cost of Revenues. Revenues are reported net of sales taxes collected from Customers.
Disaggregation of Revenue
Product revenue includes sales from our standard and customized equipment, solution and accessories sold with our equipment. Revenue is recognized upon transfer of control of promised products to customers in an amount that reflects the consideration we expect to receive in exchange for those products or services.products.
Service and training revenue include sales from our high-level decontamination and service engagements, validation of our equipment and technology and customer training. Service revenue is recognized as the agreed upon services are rendered to our customers in an amount that reflects the consideration we expect to receive in exchange for those services.
Costs to Obtain a Contract with a Customer
We apply a practical expedient to expense costs as incurred for costs to obtain a contract with a customer when the amortization period would have been one year or less. We generally expense sales commissions when incurred because the amortization period would have been one year or less. These costs are recorded within sales and marketingselling expenses. These costs include our internal sales force compensation program and certain partner sales incentive programs as we have determined annual compensation is commensurate with annual sales activities.
Contract Balances
As of December 31, 2018,2020, and December 31, 2017,2019 we did not have any unsatisfied performance obligations for (i) contracts with an original expected length of one year or less and (ii) contracts for which we recognize revenue at the amount to which we have the right to invoice for services performed.
Arrangements with Multiple Performance Obligations
Our contracts with customers may include multiple performance obligations. We enter into contracts that can include various combinations of products and services, which are primarily distinct and accounted for as separate performance obligations.
SignificantSignificant Judgments
Our contracts with customers for products and services often dictate the terms and conditions of when hethe control of the promised products or services is transferred to the customer and the amount of consideration to be received in exchange for the products and services.
Use of Estimates
The preparation of consolidated financial statements in conformity with U.S. GAAP requires us to make estimates and assumptions that affect the amounts reported and disclosed in the accompanying consolidated financial statements and the accompanying notes. Actual results could differ materially from these estimates. On an ongoing basis, we evaluate our estimates, including those related to accounts receivable, inventory, fair values of financial instruments, intangible assets, useful lives of intangible assets and property and equipment, fair values of stock-based awards, income taxes, and contingent liabilities, among others. We base our estimates on historical experience and on various other assumptions that are believed to be reasonable, the results of which form the basis for making judgments about the carrying values of our assets and liabilities.
Fair Value MeasurementMeasurements
The authoritative guidance for fair value measurements defines fair value as the exchange price that would be received for an asset or paid to transfer a liability (an exit price) in the principal or the most advantageous market for the asset or liability in an orderly transaction between market participants on the measurement date. Market participants are buyers and sellers in the principal market that are (i) independent, (ii) knowledgeable, (iii) able to transact, and (iv) willing to transact. The guidance describes a fair value hierarchy based on the levels of inputs, of which the first two are considered observable and the last unobservable, that may be used to measure fair value, which are the following:
Level1:
| Level 1: | Quoted prices in active markets for identical assets or liabilities. Level2:
Inputs other than Level 1 that are observable, either directly or indirectly, such as quoted prices for similar assets or liabilities; quoted prices in markets that are not active; or other inputs that are observable or corroborated by observable market data or substantially the full term of the assets or liabilities.
Level3:
Unobservable inputs that are supported by little or no market activity and that are significant to the value of the assets or liabilities.
|
| Level 2: | Inputs other than Level 1 that are observable, either directly or indirectly, such as quoted prices for similar assets or liabilities; quoted prices in markets that are not active; or other inputs that are observable or corroborated by observable market data for substantially the full term of the assets or liabilities. |
| Level 3: | Unobservable inputs that are supported by little or no market activity and that are significant to the value of the assets or liabilities. |
Our financial instruments include cash and cash equivalents, accounts receivable, accounts payable and accrued expenses and convertible debt.expenses. All these items were determined to be Level 1 fair value measurements.
The carrying amounts of cash and cash equivalents, accounts receivable, accounts payable and accrued expenses approximated fair value because of the short maturity of these instruments. The recorded value of convertible debt approximates its fair value as the terms and rates approximate market rates.
Cash and Cash Equivalents
For purposes of the statement of cash flows, cash and cash equivalents includes cash on hand, held at financial institutions and other liquid investments with original maturities of three months or less. At times, these deposits may be in excess of insured limits.limits.
Accounts Receivable
Our accounts receivable are typically from credit worthy customers or, for certain international customers, are supported by pre-payments. For those customers to whom we extend credit, we perform periodic evaluations of them and maintain allowances for potential credit losses as deemed necessary. We have a policy of reserving for doubtful accounts based on our best estimate of the amount of potential credit losses in existing accounts receivable. We periodically review our accounts receivable to determine whether an allowance is necessary based on an analysis of past due accounts and other factors that may indicate that the realization of an account may be in doubt. Account balances deemed to be uncollectible are charged to the allowance after all means of collection have been exhausted and the potential for recovery is considered remote. At December 31, 2018 and December 31, 2017, the allowance for doubtful accounts was $300,000 and $500,000, respectively.
Inventories
Inventories are valued at the lower of cost or market using the first-in, first-out (FIFO) method. Inventories consist primarily of finished goods.goods.
We expense costs to maintain certification to cost of goods sold as incurred.
We review inventory on an ongoing basis, considering factors such as deterioration and obsolescence. We record an allowance for estimated losses when the facts and circumstances indicate that particular inventories willmay not be usable. Our reserve for obsolete inventory was $100,000 and $0 for the years ended December 31, 2018 and 2017, respectively.
Property and Equipment
We account for property and equipment at cost less accumulated depreciation. We compute depreciation using the straight-line method over the estimated useful lives of the assets, generally three to five years. Depreciation for equipment, furniture and fixtures and vehicles commences once placed in service for its intended use. Leasehold improvements are amortized using the straight-line method over the lives of the respective leases or service lives of the improvements, whichever is shorter.
Leases
In February 2016, the FASB issued ASU No. 2016-02 (ASC 842),Leases, to require lessees to recognize all leases, with certain exceptions, on the balance sheet, while recognition on the statement of operations will remain similar to current lease accounting. Subsequently, the FASB issued ASU No. 2018-10,Codification Improvements to Topic 842, Leases, ASU No. 2018-11,Targeted Improvements, ASU No. 2018-20,Narrow-Scope Improvements for Lessors, and ASU 2019-01,Codification Improvements, to clarify and amend the guidance in ASU No. 2016-02. ASC 842 eliminates real estate-specific provisions and modifies certain aspects of lessor accounting. This standard is effective for interim and annual periods beginning after December 15, 2018, with early adoption permitted. We adopted ASC 842 as of January 1, 2019 using the modified retrospective basis with a cumulative effect adjustment as of that date. In addition, we elected the package of practical expedients permitted under the transition guidance within the new standard, which allowed us to carry forward the historical determination of contracts as leases, lease classification and not reassess initial direct costs for historical lease arrangements. Accordingly, previously reported financial statements, including footnote disclosures, have not been recast to reflect the application of the new standard to all comparative periods presented.
Operating lease assets are included within operating lease right-of-use assets, and the corresponding operating lease liabilities are recorded as current portion of long-term operating lease, and within long-term liabilities as long-term operating lease, net of current portion on our consolidated balance sheet as of December 31, 2020 and December 31, 2019.
We have elected not to present short-term leases on the consolidated balance sheet as these leases have a lease term of 12 months or less at lease inception and do not contain purchase options or renewal terms that we are reasonably certain to exercise. All other lease assets and lease liabilities are recognized based on the present value of lease payments over the lease term at commencement date. Because most of our leases do not provide an implicit rate of return, we used our incremental borrowing rate based on the information available at adoption date in determining the present value of lease payments.
Capitalized Software Development Costs
In accordance with ASC 985-20 regarding the development of software to be sold, leased, or marketed we expense such costs as they are incurred until technological feasibility has been established, at and after which time those costs are capitalized until the product is available for general release to customers. The periodic expense for the amortization of capitalized software development costs will be included in cost of sales.
Accrued Warranties
Accrued warranties represent the estimated costs, if any, that will be incurred during the warranty period of our products. We make an estimate ofthe expected costs that willto be incurred by us during the warranty period and charge thatrecord the expense to the consolidated statement of operations at the date of sale. Our manufacturer assumesmanufacturers assume the warranty against product defects for one year from date of sales, which we extend to our customers upon salessale of the product. We assume responsibility for product reliability and results.
Income Taxes
Deferred income tax assets and liabilities are determined based on differences between the financial statement reporting and tax bases of assets and liabilities and are measured using the enacted tax rates and laws in effect when the differences are expected to reverse. The measurement of deferred income tax assets is reduced, if necessary, by a valuation allowance for any tax benefits whichthat are, on a more likely than not basis, not expected to be realized in accordance with Accounting Standards Codification (“ASC”)(ASC) guidance for income taxes. The effect on deferred income tax assets and liabilities of a change in tax rates is recognized in the period that such tax rate changes are enacted.
Leases and Tenant Improvement Allowance
For lease agreements that provide for escalating rent payments or free-rent occupancy periods, we recognize rent expense on a straight-line basis over the non-cancelable lease term and option renewal periods where failure to exercise such options would result in an economic penalty in such amount that renewal appears, at the inception of the lease, to be reasonably assured. The lease term commences on the date that the Company takes possession of or controls the physical use of the property. Deferred rent is included in liabilities on the consolidated balance sheet.
We record landlord allowances and incentives received as deferred rent based on their short-term or long-term nature. These landlord allowances are amortized using the straight-line method over the reasonably assured lease term as a reduction of rent expense. We consider improvements to be a lessor asset if all of the following criteria are met:
● the lease specifically requires the lessee to make the improvement;
● the improvement is fairly generic;
● the improvement increases the fair value of the property to the lessor; and
● the useful life of the improvement is longer than the lease term.
At December 31, 2018 and 2017 our short term deferred rent was $13,215 and $0, respectively. At December 31, 2018 and 2017, our long term deferred rent and tenant allowances was $401,734 and $0, respectively.
LossNet Income (Loss) Per Share
Basic lossnet income or (loss) per share is computed by dividing our net lossincome or (loss) by the weighted average number of shares of common stock outstanding during the period presented. Diluted lossincome or (loss) per share is based on the treasury stock method and includes the effect from potential issuance of shares of common stock, such as shares issuable pursuant to the exercise of options and warrants and conversions of preferred stock or debentures.
Equity Compensation Expense
We account for equity compensation expense in accordance with FASB ASC 718, “Compensation—Stock Compensation.” Under the provisions of FASB ASC 718, equity compensation expense is estimated at the grant date based on the award’s fair value and is recognized as expense over the requisite service period.
On July 7, 2017, our shareholders approved the 2016 Equity Incentive Plan, (the “2016 Plan”).or the 2016 Plan. The 2016 Plan authorizes the grant of stock options, stock appreciation rights, restricted stock, restricted stock units and performance units/shares. Up to 5,000,000625,000 shares of common stock are authorized for issuance under the 2016 Plan. Shares issued under the 2016 Plan may be either authorized but unissued shares, treasury shares, or any combination thereof. Provisions in the 2016 Plan permit the reuse or reissuance by the 2016 Plan of shares of common stock for numerous reasons, including, but not limited to, shares of common stock underlying canceled, expired, or forfeited awards of stock-based compensation and stock appreciation rights paid out in the form of cash. Equity compensation expense will typically be awarded in consideration for the future performance of services to us. All recipients of awards under the 2016 Plan are required to enter into award agreements with the Companyus at the time of the award; awards under the 2016 Plan are expressly conditioned upon such agreements. For
On December 30, 2020, we received shareholder approval to restate and amend the year ended December 31, 2017, we issued 200,0002016 Equity Incentive Plan to increase the maximum number of shares of common stock out of the 2016 Plan. In addition, for the year ended December 31, 2018, we issued 300,000authorized from issuance by 1,375,000, from 625,000 shares of common stock out of the 2016 Plan. The balance of common shares authorized for issuance at December 31, 2018, was 4,500,000.to 2,000,000.
Concentrations of Credit Risk
Financial instruments that potentially subject us to significant concentrations of credit risk consist principally of cash and cash equivalents. We maintain cash balances at financial institutions which exceed the current Federal Deposit Insurance Corporation limit of $250,000 at times during the year.
Long-Lived Assets Including Acquired Intangible Assets
We assess long-lived assets for potential impairments at the end of each year, or during the year if an event or other circumstance indicates that we may not be able to recover the carrying amount of the asset. In evaluating long-lived assets for impairment, we measure recoverability of these assets by comparing the carrying amounts to the future undiscounted cash flows the assets are expected to generate. If our long-lived assets are considered to be impaired, the impairment to be recognized equals the amount by which the carrying value of the asset exceeds its fair market value. We base the calculations of the estimated fair value of our long-lived assets on the income approach. For the income approach, we use an internally developed discounted cash flow model that includes, among others, the following assumptions: projections of revenues and expenses and related cash flows based on assumed long-term growth rates and demand trends; expected future investments to grow new units; and estimated discount rates. We base these assumptions on our historical data and experience, industry projections, micro and macro general economic condition projections, and our expectations. We had no long-lived asset impairment charges for the years ended December 31, 20182020 and 2017.2019.
Recent Accounting Pronouncements
In May 2014,August 2018, the FASB issued ASU No. 2014-09, Revenue from Contracts2018-15, “Intangibles-Goodwill and Other-Internal-Use Software (Topic 350): Customer’s Accounting for Implementation Costs Incurred in a Cloud Computing Arrangement That is a Service Contract.” This new guidance aligns the requirements for capitalizing implementation costs incurred in a hosting arrangement that is a service contract with Customers,the requirements for capitalizing implementation costs incurred to replace the existing revenue recognition criteria for contracts with customers. In August 2015, the FASB issued ASU No. 2015-14, Deferral of the Effective Date, to defer thedevelop or obtain internal-use software. This new guidance is effective date of ASU No. 2014-09 to interim and annual periodson a prospective or retrospective basis beginning after December 15, 2017. We adopted ASU Nos. 2014-09 and 2015-14 on January 1, 2018 on a modified retrospective basis, which did not impact our beginning accumulated deficit and additional paid-in capital.
In February 2016, the FASB issued ASU No. 2016-02, Leases, to require lessees to recognize all leases, with limited exceptions, on the balance sheet, while recognition on the statement of operations will remain similar to current lease accounting. The ASU also eliminates real estate-specific provisions and modifies certain aspects of lessor accounting. Subsequently, the FASB issued ASU No. 2018-10, Codification Improvements to Topic 842, ASU No. 2018-11, Targeted Improvements, and ASU No. 2018-20, Narrow-Scope Improvements for Lessors, to clarify and amend the guidance in ASU No. 2016-02. The ASUs are effective for interim and annual periods beginning after December 15, 2018,2020, with early adoption permitted. We willelected to adopt the ASUs on January 1, 2019this guidance early, in 2020 on a modified retrospective basis through a cumulative adjustment to our beginning accumulated deficit balance. Prior comparative periods willprospective basis. The new guidance did not be restated under this method, and we will adopt all available practical expedients, as applicable. Upon adoption, our consolidated balance sheet will include an overall increase in assets of approximately $800,000 and an increase in liabilities of approximately $800,000. The ASUs are not expected to have a material impact on our beginning accumulated deficit, consolidated statement of operations or the consolidated statement of cash flows.
In March 2016, the FASB issued ASU No. 2016-09, Improvements to Employee Share-Based Payment Accounting, to simplify the accounting for the income tax effects from share-based compensation, the accounting for forfeitures and the accounting for statutory income tax withholding, among others. In particular, ASU No. 2016-09 requires all income tax effects from share-based compensation to be recognized in the consolidated statement of operations when the awards vest or are settled, permits accounting for forfeitures as they occur, and permits a higher level of statutory income tax withholding without triggering liability accounting. Adoption of ASU No. 2016-09 is modified retrospective, retrospective and prospective, depending on the specific provision being adopted. We adopted ASU No. 2016-09 on January 1, 2017, which did not impact our beginning accumulated deficit and additional paid-in capital.
In January 2017, the FASB issued ASU No. 2017-04, Simplifying the Test for Goodwill Impairment, to simplify the test for goodwill impairment by removing Step 2. An entity will, therefore, perform the goodwill impairment test by comparing the fair value of a reporting unit with its carrying amount, recognizing an impairment charge for the amount by which the carrying amount exceeds the fair value, not to exceed the total amount of goodwill allocated to the reporting unit. An entity still has the option to perform a qualitative assessment to determine if the quantitative impairment test is necessary. ASU No. 2017-04 is effective for interim and annual periods beginning after December 15, 2019, with early adoption permitted for interim or annual goodwill impairment tests performed on testing dates after January 1, 2017. Adoption of ASU No. 2017-04 is prospective.
In May 2017, the FASB issued ASU No. 2017-09, Scope of Modification Accounting, to provide guidance on which changes to the terms or conditions of a share-based payment award require an entity to apply modification accounting. ASU No. 2017-09 is effective for interim and annual periods beginning after December 15, 2017, with early adoption permitted. Adoption of ASU No. 2017-09 is prospective. We adopted ASU No. 2017-09 on January 1, 2018, which did not impact our consolidated financial statements upon adoption.
Consolidated Financial Operations Overview
Our financial position as of December 31, 2018 and 2017, respectively, was as follows:
| | |
| | | |
| Total shareholders’ equity | $2,995,000 | $5,394,000 |
| Cash and cash equivalents | $2,005,000 | $4,550,000 |
| Accounts receivable, net | $2,146,000 | $1,836,000 |
| Inventories, net | $2,682,000 | $3,519,000 |
| Deposits | $109,000 | $- |
Current liabilities
| $1,700,000 | $1,103,000 |
Convertible notes payable, net
| $4,982,000 | $5,944,000 - |
| Long-term liabilities (excluding long-term convertible notes) | $402,000 | $- |
| | | |
| Working capital | $5,544,000 | $9,073,000 |
During the year ended December 31, 2018, our debt and liquidity positions were affected by the following:
●
Net cash used in operations of approximately $1,767,000; and
●
Purchases of property and equipment of approximately $628,000.
●
Redemption and conversion of convertible notes payable aggregating $1,000,000 in principal.
Results of Operations for the Year Ended December 31, 2018 Compared to the Year Ended December 31, 2017
| | | |
| | | |
| | | |
| Revenue, Net | $5,585,000 | $4,994,000 |
| Gross Profit | $3,117,000 | $3,066,000 |
Total Operating Expenses (1) | $6,188,000 | $6,510,000 |
| Loss from Operations | $(3,070,000) | $(3,444,000) |
| Total Other Income (Expense) | $(160,000) | $(196,000) |
| Net Loss | $(3,230,000) | $(3,640,000) |
| Basic (loss) per share | $(0.03) | $(0.03) |
| Diluted (loss) per share | $(0.03) | $(0.03) |
(1)
Includes approximately $77,000 and $649,000 in non-cash equity compensation expense for the years ended December 31, 2018 and 2017, respectively.
Sales
During the years ended December 31, 2018 and 2017, we had net revenue of approximately $5,585,000 and $4,994,000, respectively, representing an increase in revenue of approximately $591,000 or 12%. The increase in sales in the current year period was attributable to large equipment orders from new customers, and steady repeat solution orders from our existing customer base.
Net Revenue
Product and Service Revenue
| | For the year ended December 31, |
| | | |
| SteraMist Product | $4,652,000 | $4,097,000 |
| Service and Training | 933,000 | 897,000 |
| Total | $5,585,000 | $4,994,000 |
Revenue by Geographic Region
| | For the year ended December 31, |
| | | |
| United States | $4,197,000 | $3,495,000 |
| International | 1,388,000 | 1,499,000 |
| Total | $5,585,000 | $4,994,000 |
Cost of Sales
During the years ended December 31, 2018 and 2017, our cost of sales was approximately $2,467,000 and $1,928,000, respectively, representing an increase of approximately $539,000 or 28%. The primary reason for the increase in cost of sales is attributable to the increase in revenue and the related product mix in the current year period as compared to the prior year period and our inventory reserve that was recorded in the fourth quarter of 2018. Our gross profit margins as a percentage of sales for the year ended December 31, 2018 decreased as compared to the prior period as a result of the customer and product mix in sales and our inventory reserve established in 2018
Professional Fees
Professional fees for the year ended December 31, 2018 were approximately $330,000, as compared to $877,000 for the prior year, representing a decrease of approximately $547,000, or 62%. The decrease is attributable to high professional fees incurred in the prior year period in connection with a lawsuit we initiated and settled in July 2017. Professional fees are comprised mainly of legal, accounting and financial consulting fees.
Depreciation and Amortization
Depreciation and amortization were approximately $635,000 and $607,000 for the years ended December 31, 2018 and 2017, respectively, representing an increase of $28,000, or 5%. The increase in depreciation expense is attributable to additional property and equipment acquired in 2018 and 2017.
Selling Expenses
Selling expenses for the year ended December 31, 2018 were approximately $1,360,000, as compared to $1,256,000 for the year ended December 31, 2017, representing an increase of approximately $104,000 or 8%. The increase in selling expenses is attributable to higher salaries due to increases in headcount and marketing and advertising costs incurred for the year ended December 31, 2018 as compared to the prior year period. Selling expenses represent selling salaries and wages, trade show fees, commissions, advertising and marketing expenses.
Research and Development
Research and development expenses for the year ended December 31, 2018 were approximately $916,000, as compared to $454,000 for the year ended December 31, 2017, representing an increase of approximately $462,000, or 102%. The primary reason for the increase is attributable to current and ongoing studies and testing in connection with our product related to more effective and quicker hospital terminal cleans and product development costs we incurred in 2018. Research and development expenses mainly include costs incurred in generating and supporting research on improving, extending and applying our patents in the field of mechanical cleaning and decontamination.
Equity Compensation Expense
Equity compensation expense for the year ended December 31, 2018 was approximately $77,000, as compared to $649,000 for the year ended December 31, 2017, representing a decrease of approximately $572,000 or 88%. The decline in equity compensation expense relates to the timing of certain issuances that occurred in the prior period. Equity compensation expense is incurred upon the issuance of warrants and stock options. On the date of a grant, we determine the fair value of the award and recognize compensation expense over the requisite service period, which is generally the vesting period of the award. The fair value of the award is calculated using the Black-Scholes Method option-pricing model.
Consulting Fees
Consulting fees for the year ended December 31, 2018 were approximately $141,000, as compared to $211,000 for the year ended December 31, 2017, representing a decrease of approximately $70,000, or 33%. The decrease in consulting fees relates to a one-time fee that was incurred in the prior year period in connection with a short-term consulting agreement with no such charge in the current period.
General and Administrative Expense
General and administrative expense includes salaries and payroll taxes, rent, insurance expense, utilities, office expense and product registration costs. General and administrative expense was approximately $2,729,000 and $2,775,000 for the years ended December 31, 2018 and 2017, respectively, representing a decrease of approximately $46,000 or 2%.
Other Income and Expense
Gain on redemption of convertible note was $150,000 for the year ended December 31, 2018.
Amortization of debt discount was $38,000 and $6,000 during the years ended December 31, 2018 and 2017, respectively. Amortization of debt discount for the years ended December 31, 2018 and 2017, consists of the amortization of debt discount on the $6,000,000 principal amount of Notes issued in March and May 2017. The debt discount was amortized over the life of the Notes utilizing the effective interest method.
Induced conversion costs of approximately $57,000 for the year ended December 31,2018 were incurred in connection with the conversion of $700,000 convertible note payable.
Interest income for the years ended December 31, 2018 and 2017 was approximately $7,000 and $2,000, respectively.
Interest expense for the years ended December 31, 2018 and 2017 was approximately $222,000 and $191,000 respectively. Interest expense for the years ended December 31, 2018 and 2017 consisted of the interest incurred on the $6,000,000 principal amount of Notes issued in March and May 2017.
Net Loss
Net loss for the years ended December 31, 2018 and 2017 was approximately ($3,230,000) and ($3,640,000), respectively. Net loss per common share, basic and diluted, for the year ended December 31, 2018 was ($0.03). Net loss per common share, basic and diluted, for the year ended December 31, 2017 was ($0.03). The primary reasons for the decreased net loss can be attributed to:
●
Higher revenue and gross profit of approximately $591,000 and $51,000, respectively;
●
Lower operating expenses of approximately $322,000,
●
Gain on redemption of convertible note of $150,000, offset by
●
Higher interest expense of approximately $31,000; and
●
Induced conversion costs of approximately $57,000.
Liquidity and Capital Resources
As of December 31, 2018, we had cash and cash equivalents of approximately $2,005,000 and working capital of $5,544,000. Our principal capital requirements are to fund operations, invest in research and development and capital equipment, and the continued costs of public company filing requirements. We have historically funded our operations through debt and equity financings.
In March and May 2017, we raised gross proceeds of $6,000,000 through a private placement of the Notes. We issued the Notes in two tranches of $5,300,000 and $700,000, respectively, which originally were scheduled to mature on August 31, 2018 and November 8, 2018, respectively, unless earlier redeemed, repurchased or converted. The Notes are convertible at any time by the holder into common stock at a conversion price of $0.54 per share. We may redeem the Notes at any time prior to maturity at a price equal to 100% of the outstanding principal amount of the Notes to be redeemed, plus accrued and unpaid interest as of the redemption date. Interest on the Notes is payable semi-annually in cash on February 28 and August 31 of each year at a rate of 4 percent per annum. In addition, we issued three-year warrants to purchase up to an aggregate of 999,998 shares of common stock at an exercise price of $0.69 per share. Currently, we are using the proceeds from the private placement for research and development, international product registration, expansion of our internal sales force, marketing, public relations, expansions of our EPA label and for working capital and general corporate purposes. In February and March 2018, we and the holders of the Notes extended the maturity date of the $5,000,000 principal amount of Notes to April 1, 2019.
In May 2018, we offered a noteholder the option to convert its Note at a reduced conversion price of $0.46.The noteholder accepted and converted at such price.Pursuant to the terms of the conversion offer, an aggregate of $700,000 of principal and $5,212 of accrued interest outstanding under the Note were converted into 1,877,960 shares of common stock. The Company recognized an induced conversion cost of $57,201 related to the conversion.
In December 2018, a noteholder redeemed a note with a principal balance of $300,000 in exchange for $150,000 in cash.We recognized a gain on redemption of convertible note income in the amount of $150,000 as a result of the transaction.
On March 30, 2019, the remaining note holders agreed to extend the maturity dates of their aggregate of $5,000,000 in notes to April 3, 2020.
For the years ended December 31, 2018 and 2017, we incurred losses from operations of approximately $3,070,000 and $3,444,000, respectively. The cash used in operations was approximately $1,767,000 and $2,432,000 for the years ended December 31, 2018 and 2017, respectively.
Our revenues can fluctuate due to the following factors, among others:
●
Ramp up and expansion of our internal sales force and manufacturers’ representatives;
●
Length of our sales cycle;
●
Expansion into new territories and markets; and
●
Timing of orders from distributors.
We could incur additional operating losses and an increase of costs related to the continuation of product and technology development and administrative activities.
Management has taken and will endeavor to continue to take a number of actions in order to improve our results of operations and the related cash flows generated from operations in order to strengthen our financial position, including the following items:
●
Expanding our label with the EPA to further our product registration internationally;
●
Continued expansion of our internal sales force and manufacturer representatives in an effort to drive domestic revenue in all hospital-healthcare verticals;
●
Continued expansion of our internal sales force and manufacturer representatives in an effort to drive global revenue in the life science verticals;
●
Expansion of international distributors; and
●
Continued growth of TSN, our new Forensic Restoration FRST sub-division and new growth in the food safety market which includes using SteraMist for increasing the storage time of pre- and post-harvest produce. Increasing transportation shelf life by installing SteraMist in semitrucks and ships that are transporting food.
We believe that our existing balance of cash and cash equivalents and amounts expected to be provided by operations will provide us with sufficient financial resources to meet our cash requirements for operations, working capital and capital expenditures over the next twelve months We cannot make any assurances that management’s strategies will be effective or that any additional financing will be completed on a timely basis, on acceptable terms or at all. Our inability to successfully implement our strategies or to complete any other financing may mean that we would have to significantly reduce costs and/or delay projects, which would adversely affect our business, customers and program development, and would adversely impact us.
Until such time, if ever, as we can generate substantial product revenue, we expect to finance our cash needs through a combination of equity or debt financings. Sufficient funds may not be available to us at all or on attractive terms when needed from these sources. To the extent that we raise additional capital through the future sale of equity or debt, the ownership interests of our stockholders will be diluted, and the terms of these securities may include liquidation or other preferences that adversely affect the rights of our existing common stockholders. If we raise additional funds through the issuance of debt securities, these securities could contain covenants that would restrict our operations. We may require additional capital beyond our currently anticipated amounts. If we are unable to obtain additional funding from these or other sources when needed, it may be necessary to significantly reduce our scope of operations and current rate of spending through reductions in staff and delaying, scaling back, or stopping our research and development or sales and marketing activities.
Operating Activities
Cash used in operating activities for the years ended December 31, 2018 and 2017 was approximately $1,767,000 and $2,432,000, respectively. Cash used in operating activities decreased in 2018 approximately $665,000 as compared to the prior year period primarily due to the (reduced loss) incurred in 2018, decrease in our inventory and increase in our accounts payable.
Investing Activities
Cash used in investing activities for the years ended December 31, 2018 and 2017 was approximately $628,000 and $15,000, respectively. Cash used in investing activities increased $613,000 compared to the prior year period primarily due to equipment, furniture and leasehold improvements acquired in connection with our new facility.
Financing Activities
Cash used in financing activities for the year ended December 31, 2018 consisted of the $150,000 paid in connection with the redemption of convertible notes payable with a principal balance of $300,000.
Cash provided by financing activities for the year ended December 31, 2017 consisted of the $6,000,000 in aggregate gross proceeds received from the issuance of the Notes and proceeds from the exercise of warrants of $48,750.Statements.
Off-Balance Sheet Arrangements
None.
Item 7A. QUANTITATIVE
QUANTITATIVE AND QUALITATIVE DISCLOSURES ABOUT MARKET RISK
Not required.
Item 8. FINANCIAL
FINANCIAL STATEMENTS AND SUPPLEMENTARY DATA
The financial statements required by this item are included in Part IV, Item 15 of this Annual Report on Form 10-K, beginning on page F-1, and are incorporated by reference herein.
Item 9. CHANGES
CHANGES IN AND DISAGREEMENTS WITH ACCOUNTANTS ON ACCOUNTING AND FINANCIAL DISCLOSURE
None.
Evaluation of Disclosure Controls and Procedures
Our management, with the participation of our Principal Executive Officer and Principal Financial Officer, conducted an evaluation of the effectiveness of our disclosure controls and procedures (as is defined in Rules 13a-15(e) and 15d-15(e) under the Exchange Act) as of the end of the period covered by this Annual Report on Form 10-K. Our disclosure controls and procedures are intended to ensure that the information we are required to disclose in the reports that we file or submit under the Exchange Act is (i) recorded, processed, summarized and reported within the time periods specified in the SEC’s rules and forms and (ii) accumulated and communicated to our management, including the Principal Executive Officer and Principal Financial Officer, to allow timely decisions regarding required disclosures.
Based on that evaluation, our Principal Executive Officer and Principal Financial Officer have concluded that, as of the end of the period covered by this Annual Report, our disclosure controls and procedures were effective. Our management has concluded that the financial statements included in this Annual Report on Form 10-K present fairly, in all material respects, our financial position, results of operations and cash flows for the periods presented in conformity with generally accepted accounting principles.
Our disclosure controls and procedures are designed to provide reasonable assurance of achieving the desired control objectives. Our management recognizes that any control system, no matter how well designed and operated, is based upon certain judgments and assumptions and cannot provide absolute assurance that its objectives will be met. In addition, the design of disclosure controls and procedures must reflect the fact that there are resource constraints and that management is required to apply judgment in evaluating the benefits of possible controls and procedures relative to their costs. Similarly, an evaluation of controls cannot provide absolute assurance that misstatements due to error or fraud will not occur or that all control issues and instances of fraud, if any, have been detected.
Management’s Annual Report on Internal Control Over Financial Reporting
Management is responsible for establishing and maintaining adequate internal control over our financial reporting (as defined in Rule 13a-15(f) and 15d-15(f) under the Exchange Act). Internal control over financial reporting is a process designed to provide reasonable assurance regarding the reliability of financial reporting and the preparation of financial statements for external purposes in accordance with accounting principles generally accepted in the United States.
Our internal control over financial reporting includes those policies and procedures that (i) pertain to the maintenance of records that, in reasonable detail, accurately and fairly reflect the transactions and dispositions of our assets, (ii) provide reasonable assurance that transactions are recorded as necessary to permit preparation of financial statements in accordance with accounting principles generally accepted in the United States of America, and that our receipts and expenditures are being made only in accordance with authorizations of our management and directors, and (iii) provide reasonable assurance regarding prevention or timely detection of unauthorized acquisition, use or disposition of our assets that could have a material effect on the financial statements. Because of its inherent limitations, internal control over financial reporting may not prevent or detect misstatements. Also, projections of any evaluation of effectiveness to future periods are subject to the risk that controls may become inadequate because of changes in conditions, or that the degree of compliance with the policies or procedures may deteriorate.
Our management, with the participation of our Principal Chief Executive Officer and our Principal Chief Financial Officer, conducted an evaluation of the effectiveness of our internal control over financial reporting based on the framework in Internal Control—Integrated Framework issued by the Committee of Sponsoring Organizations of the Treadway Commission. Based on this evaluation, our Principal Chief Executive Officer along with our Principal Chief Financial Officer concluded that, as of the end of the period covered by this Annual Report on Form 10-K, our internal control over financial reporting was effective. Our internal control over financial reporting was not subject to attestation by our independent registered public accounting firm as we are not an accelerated filer, nor a large accelerated filer.
Changes in Internal Control Over Financial Reporting
During our most recent fiscal quarter, there have been no changes in our internal control over financial reporting that have materially affected or are reasonably likely to materially affect our internal control over financial reporting.
Item 9B. OTHEROTHER INFORMATION
PART III
Item 10. DIRECTORS,
DIRECTORS, EXECUTIVE OFFICERS AND CORPORATE GOVERNANCE
Our directors and executive officers and their ages and positions as of March 15, 201921, 2021 are presented below.
Name | | Age | | Position |
| Halden S. Shane | | 7476 | | Chief Executive Officer and Chairman of the Board |
| Elissa J. Shane | | 3941 | | Chief Operating Officer |
| Nick Jennings | | 4143 | | Chief Financial Officer |
| Harold W. Paul | | 7072 | | Director, Secretary |
| Walter C. Johnsen | | 6870 | | Director |
| Kelly J. Anderson | | 5153 | | Director |
| Lim Boh Soon | | 6365 | | Director |
| | | | |
Halden S. Shane: Dr. Shane has been our Chief Executive Officer and Chairman of the Board since October 15, 2007, when we commenced our current operations. Dr. Shane also served as President and CEO of Tiger Management International, a private management company that deals in business management of private and public companies. Dr. Shane resigned all positions and closed Tiger Management International in 2009. Dr. Shane was founder and CEO of Integrated Healthcare Alliance, Inc. and also founder and General Partner of Doctors Hospital West Covina, California. Prior thereto, Dr. Shane practiced Podiatric Surgery specializing in ankle arthroscopy. Dr. Shane received his Bachelor of Science degree from the University of Miami in 1969, his Bachelor of Medical Science degree from California College of Podiatric Medicine in 1971, and his Doctor of Podiatric Medicine Degree from the California College of Podiatric Medicine in 1973. He is Board Certified by the American Board of Podiatric Surgery, American Board of Orthopedics, and the American Board of Quality Assurance and Review. Dr. Shane brings to our Board experience in in the medical and finance industries.
Elissa J. Shane:Ms. Shane has been our Chief Operating Officer since January 2018. Previously, she served as our Chief Regulatory and Compliance Officer from September 2015 to December 2017 and as our Corporate Secretary in 2016. From January 2014 to September 2015, Ms. Shane served as a paralegal with Levi Lubarsky Feigenbaum & Weiss LLP, where she worked with the firm’s managing partners and staff attorneys and directed all operational aspects of the litigation cycle from inception through appeal. From September 2009 to January 2014, she served as a paralegal with Olshan Frome Wolosky LLP, where she managed all regulatory and compliance issues, litigation procedures and advertising and promotional matters. Ms. Shane received a B.A. in Psychology and Communications with a minor in Economics from the University of Southern California in 2001.
Nick Jennings: Mr. Jennings has been our Chief Financial Officer since October 2014. From July 2014 until his employment by the Company, Mr. Jennings was self-employed and provided consulting, accounting and tax compliance services to private-owned companies. From November 2006 until June 2014, Mr. Jennings was a senior manager at Richardson Kontogouris Emerson LLP, where he worked with various public and private companies providing services in a variety of business areas including tax compliance, tax consulting, general accounting, and business assurance. He is a graduate of Loyola Marymount College with a degree in accounting and is a member of the American Institute of Certified Public Accountants.
Harold W. Paul: Mr. Paul has been one of our directors since June 2009and currently acts as our Corporate Secretary.Secretary. He has been engaged in the private practice of law for more than thirty-five years, primarily as a securities specialist. Mr. Paul has been company counsel to public companies listed on the AMEX, NASDAQ and OTC exchanges. He has served as a director for six public companies in a variety of industries, including technology and financial services. He holds a BA degree from SUNY at Stony Brook and a JD from Brooklyn Law School and is admitted to practice in New York and Connecticut. Mr. Paul brings to our Board experience as a director of public companies and with the United States securities laws.
Walter C. Johnsen: Mr. Johnsen has been one of our directors since January 29, 2016. Since January 1, 2007, Mr. Johnsen has served as Chairman of the Board and Chief Executive Officer of Acme United Corporation, a leading worldwide supplier of innovative branded cutting, measuring and safety products in the school, home, office, hardware & industrial markets. From November 30, 1995 to December 31, 2006, he held the titles of President and Chief Executive Officer at Acme United. Mr. Johnsen previously served as Vice Chairman and a principal of Marshall Products, Inc., a medical supply distributor. Mr. Johnsen holds a Bachelor of Science in Chemical Engineering and a Master of Science in Chemical Engineering from Cornell University, and a Master of Business Administration from Columbia University. The Board concluded that Mr. Johnsen brings to our Board experience withJohnsen’s business and operations.operations experience allows him to serve as one of our directors.
Kelly J. Anderson: Ms. Anderson has been one of our directors since January 29, 2016. Ms. Anderson is the Chief Executive Officer of CXO Executive Solutions, LLC, a provider of executive services. Ms. Anderson is also a board member, including audit committee and compensation committee of Guardion Health Sciences, Inc. and Concierge Technologies, Inc. Between 2015 and July 2020, Ms. Anderson served as a partner in C Suite Financial Partners, a financial consulting services company dedicated to serving private, public, private equity, entrepreneurial, family office and government-owned firms in all industries. Between July 2014 and March 2015, Ms. Anderson was CFO of Mavenlink, a SaaS company. Between October 2012 and January 2014, Ms. Anderson was Chief Accounting Officer of Fisker Automotive. Between April 2010 and February 2012, Ms. Anderson was the President and Chief Financial Officer of T3 Motion, Inc., (“T3”), an electric vehicle technology company. Between March 2008 and April 2010, she served as T3’s Executive Vice President and Chief Financial Officer, and as a director from January 2009 until January 2010. From 2006 until 2008, Ms. Anderson was Vice President at Experian, a leading credit reporting agency. From 2004 until 2006, Ms. Anderson was Chief Accounting Officer for TripleNet Properties and its affiliates. From 1996 to 2004, Ms. Anderson held senior financial positions with The First American Corp., a Fortune 500 title insurance company. Ms. Anderson is an inactive California CPA and a 1989 graduate of the College of Business and Economics at California State University, Fullerton. The Board concluded that Ms. Anderson brings to our BoardAnderson’s experience in finance.finance qualifies her to serve as one of our directors.
Dr. Lim Boh Soon: Dr. Lim has been oneserved as a member of our directorsthe Board since January 2018. Dr. Lim has more than 25 years of experience in the banking and finance industry. For more than the past five years, he has been and continues to be a fellow of the Singapore Institute of Directors and is currently an independent non-executive director on the board of two publicly-listed companiesone publicly listed company on the Singapore Stock Exchange – sinceExchange. Since October 2015, heDr. Lim has been a director of Jumbo Group Limited and sincefrom June 2017 he has beenuntil September 2019, Dr. Lim also served a a director of OUE Commercial REIT Management Pte. Ltd.Ltd, a publicly listed company on the Singapore Stock Exchange. In addition, Dr. Lim has worked in various senior management positions for several regional and multi-national organizations, including UBS Capital Asia Pacific Limited, The NatSteel Group, Rothschild Ventures Asia Limited and The Singapore Technologies Group. Dr. Lim was also a member of the Regional Investment Committee for UBS AG in Asia. Dr. Lim graduated with a First-Class Honors in Mechanical Engineering from The University of Strathclyde in the United Kingdom (formerly The Royal College of Science & Technology) in 1981 and obtained his Doctor of Philosophy in Mechanical Engineering from The University of Strathclyde in the United Kingdom in 1985. We believe that Dr. Lim’s experience as a director of public companies and in the finance industry qualifies him to serve on the Board.
Family Relationships
Ms. Elissa J. Shane, our Chief Operating Officer, is the daughter of Dr. Halden Shane, our Chief Executive Officer and Chairman of the Board.
Board Composition
Our Board currently consists of five members. Our bylaws provide that our directors will hold office until their successors have been duly elected and qualified. Our Board is responsible for the business and affairs of our Company and considers various matters that require its approval. Our executive officers are appointed by our Board and serve at its discretion.
Scientific Advisory Board
In February 2017, we approved and announced the formation of the TOMI Scientific Advisory Board. The Scientific Advisory Board operates under the terms of a written Advisory Board Charter. The role of TOMI’s Scientific Advisory Board will be to:
(1)
constructively challenge and help develop proposals on strategy;
(2)
attend Scientific Advisory Board meetings;
(3)
accept responsibility, publicly and, where necessary, in writing when required to do so under any act, regulation or code of conduct;
(4)
scrutinize the performance of management in meetings, prepare agreed goals and objectives, and monitor the reporting of performance on technological and regulatory trends that will impact our business;
(5)
set forth our strategic goals with respect to scientific research and development and liaise with us to ensure we obtain the necessary resources to meet our objectives, in scientific research and development;
(6)
devote time to developing and refreshing the knowledge of our Company’s technology, products and mission in “Innovating for a Safer World”; and
(7)
uphold the highest standards of integrity and probity, and support us in maintaining the appropriate culture, values and behaviors.
The Scientific Advisory Board consists of the following members:
Miguel A. Grimaldo, MEng: Miguel A. Grimaldo, MEng is an Assistant Professor in the Department of Pathology, Director of Institutional Biocontainment Resources at the University of Texas Medical Branch (“UTMB”) and the Director of the Biocontainment Engineering Division for the Galveston National Laboratory. His responsibilities include the review of all design, construction, commissioning and operation of High and Maximum containment laboratories as well as to ensure regulatory compliance and to conduct ongoing evaluation and recertification on all critical containment features, equipment and operations for Biosafety Level 3 (BSL‐3), Animal Biosafety Level 3 (ABSL-3) and Biosafety Level 4 (BSL-4) laboratory facilities at UTMB. He is also a member of the UTMB Institutional Biosafety Committee. He has served as Committee Member for development of the ANSI Z9.14‐2014 Standard‐ Testing and Performance‐Verification Methodologies for Ventilation Systems for Biosafety Level 3 (BSL‐3) and Animal Biosafety Level 3 (ABSL3) facilities as well as for the 2016 Edition of the National Institute of Health (NIH) ‐ Design Requirements Manual (DRM) for Biomedical Laboratories and Animal Research Facilities. Mr. Grimaldo routinely serves as Biocontainment Advisor for containment laboratories nationally and internationally on design, construction and operations and also routinely contributes to a technical column in the American Biological Safety Association (ABSA) journal, Applied Biosafety, entitled, “Containment Talk”. Mr. Grimaldo obtained his Masters of Engineering from the University of Louisville and Bachelor of Science degrees in Agricultural Engineering and Agricultural Economics from Texas A&M University.
Dr. Helene Paxton, MS, MT(ASCP), PhD, CIC: Dr. Helene Paxton, MS, MT(ASCP), PhD, CIC, is an Infection Preventionist, owner of Bio Guidance, LLC, adjunct biology professor at Rowan University and Director of Infection Prevention at Saint Francis Healthcare. She is Infection Control Certified (CIC), board certified as an International Medical Laboratory Scientist and holds a PhD in Epidemiology. Dr. Paxton has over 40 years of experience in medical devices and infectious disease consulting. Dr. Paxton obtained her PhD from Kennedy Western University and her MS from Bowling Green State University.
Audit Committee
Our Audit Committee was established in June 2009 and currently is comprised of Ms. Anderson, Mr. PaulJohnsen and Dr. Lim. Ms. Anderson serves as chairperson of the Audit Committee. The Company relies on the exemption related to Mr. Paul’sJohnsen’s lack of standing as a financial expert, since a majority of the Audit Committee was comprised of financial experts and does not believe the committee composition materially affects its ability to act independently.independently. The Audit Committee operates under a written charter, which is available at http://investor.tomimist.com/corporate-governance/audit-committee-charter. The purpose of the Audit Committee is to assist the Board in monitoring the integrity of the annual, quarterly and other financial statements of the Company, the independent auditor’s qualifications and independence, the performance of the Company’s independent auditors and the compliance by the Company with legal and regulatory requirements. The Audit Committee also reviews and approves all related-party transactions. Our Board has determined that Ms. Anderson is an “audit committee financial expert” as defined by the regulations promulgated by the SEC.
Code of Ethics
The Board adopted a Code of Ethics in 2008 that applies to, among other persons, Board members, officers (including(including our Chief Executive Officer), contractors, consultants and advisors. Our Code of Ethics, which is available at http://investor.tomimist.com/corporate-governance/code-of-ethics,TOMZ/code_of_ethics/2139, sets forth written standards designed to deter wrongdoing and to promote:
1.
honest and ethical conduct including the ethical handling of actual or apparent conflicts of interest between personal and professional relationships;
2.
full, fair, accurate, timely and understandable disclosure in reports and documents that we file with or submit to the SEC and in other public communications made by us;
3.
compliance with applicable governmental laws, rules and regulations;
4.
the prompt internal reporting of violations of the Code of Ethics to an appropriate person or persons identified in the Code of Ethics; and
5.
accountability for adherence to the Code of Ethics.
Section 16(a) Beneficial Ownership Reporting Compliance
Section 16(a) of the Exchange Act requires our directors and executive officers, and persons who own more than ten percent of our common stock, to file with the SEC initial reports of ownership and reports of changes in ownership of our common stock. Officers, directors and greater than ten percent shareholders are required by SEC regulations to furnish us with copies of all Section 16(a) forms they file.
To our knowledge, based solely on a review of the copies of Section 16(a) reports furnished to us and a review of the shareholders register, during the fiscal year ended December 31, 2018, our officers, directors and greater than ten percent beneficial owners complied with all Section 16(a) filing requirements.
Item 11. EXECUTIVE
Summary Compensation Table
The following table sets forth the total compensation paid to or earned by our named executive officers for the years ended December 31, 20182020 and 2017,2019, respectively:
| Name and Principal Position | | | | | Option/ Warrant Awards ($)(1) | | | | | | | Option/ Warrant Awards ($) (1) | | |
| | | | | |
| Halden S. Shane | 2018 | 360,000 | 40,000(6) | — | 17,932(2) | — | 417,932 | 2020 | 400,833 | — | 2,835,090(2) | — | 3,235,923 |
| Chairman and CEO (2) | 2017 | 360,000 | — | 434,847(3) | — | 794,847 | 2019 | 360,000 | — | 89,654(3) | — | 449,654 |
| | | | | |
| Elissa J. Shane (4) | 2018 | 200,000 | 20,000(6) | — | 36,474 | 9,000(4) | 265,474 | 2020 | 226,083 | 40,000(8) | — | 226,950(4) | 13,500(4) | 506,533 |
| COO | 2017 | — | 2019 | 200,000 | 7,500(8) | — | 23,595(5) | 9,000(5) | 240,095 |
| | | | | |
Nick Jennings (5)(6) | 2018 | 155,000 | 10,000(6) | — | 165,000 | 2020 | 165,225 | 50,000(8) | — | 24,846(6) | — | 240,071 |
| CFO | 2017 | 144,000 | — | 144,000 | 2019 | 155,000 | 5,000(8) | — | 4,483(7) | — | 164,483 |
(1)
The amounts shown in this column represent the aggregate grant date fair value of stock, option and/or warrant award, as applicable, granted during the year computed in accordance with FASB ASC Topic 718. See Note 2 of the notes to our audited consolidated financial statements contained in this Annual Report on Form 10-K for a discussion of valuation assumptions made in determining the grant date fair value of the awards.
(2)
During the year ended December 31, 2018,2020, we issued Dr. Shane five-yearfive and ten-year warrants to purchase an aggregate of 250,000543,750 shares of common stock as executive compensation. The exercise price of the warrantwarrants range was $0.08$1.20-6.95 per share, based on the three-day trailing VWAP on the date of issuance. Utilizing the Black-Scholes pricing model, we determined the fair value of the warrants issued to Dr. Shane was approximately $18,000,$2,835,000, with the following assumptions: volatility, 142%136%-173%; expected dividend yield, 0%; risk free interest rate, 2.95%0.67%-1.64%; and a life of 5-10 years. The grant date fair value of each share of common stock underlying the warrants range was $1.04-6.99. We recognized equity-based compensation to Dr. Shane of approximately $2,835,000 on the warrants during the year ended December 31, 2020 pursuant to an employment agreement. Please refer to Item 11 Employment Agreements for additional details of Dr. Shane’s annual compensation.
(3)
During the year ended December 31, 2019, we issued Dr. Shane five-year warrant to purchase an aggregate of 125,000 shares of common stock as executive compensation. The exercise price of the warrant was $0.80 per share, based on the three-day trailing VWAP on the date of issuance. Utilizing the Black-Scholes pricing model, we determined the fair value of the warrants issued to Dr. Shane was approximately $90,000, with the following assumptions: volatility, 143%; expected dividend yield, 0%; risk free interest rate, 2.58%; and a life of 5 years. The grant date fair value of each share of common stock underlying the warrants was $0.07.$0.72. We recognized equity-based compensation to Dr. Shane of approximately $18,000$90,000 on the warrants during the year ended December 31, 2018.2019 pursuant to an employment agreement. Please refer to Item 11 Employment Agreements for additional details of Dr. Shane’s annual compensation.
(3)(4)
Pursuant to his employment agreement, duringDuring the year ended December 31, 2017,2020, we issued Dr.Ms. Shane five-year warrantsa ten-year warrant to purchase an aggregate of 3,750,0006,250 shares of common stock as executive compensation. The exercise pricesprice of the warrants range from $0.10 to $0.12warrant was $4.00 per share, based on the three day trailing VWAP on the date of issuance .share. Utilizing the Black-Scholes pricing model, we determined the fair value of the warrants issued to Dr.Ms. Shane was approximately $435,000,$25,000, with the following assumptions: volatility, 145%–153%173%; expected dividend yield, 0%; risk free interest rate, 1.90%–2.23%0.68%; and a life of 10 years. The grant date fair value of each share of common stock underlying the warrants was $4.00. During the year ended December 31, 2020, we issued Ms. Shane’s options to purchase an aggregate of 31,250 shares of common stock as executive compensation. The exercise price of the option was $7.06 per share. Utilizing the Black-Scholes pricing model, we determined the fair value of the option issued to Ms. Shane was approximately $202,000, with the following assumptions: volatility, 154%; expected dividend yield, 0%; risk free interest rate, 0.67%; and a life of 5 years. The grant date fair value of each share of common stock underlying the warrants ranged from $0.09–$0.12. Weoptions was $6.47.. In aggregate, we recognized equity-based compensation to Dr.Ms. Shane of approximately $435,000$227,000 on the warrantsoptions during the year ended December 31, 2017.
(4)
In connection with2020. The other compensation in the executionamount of $13,500 represents an auto allowance pursuant to Ms. Shane’s employment agreement. Please refer to Item 11 Employment Agreements for additional details of Ms. Shane’s employment agreement, on January 5, 2018,annual compensation.
(5)
During the year ended December 31, 2019, we issued her an option underaccrued the 2016 Planvalue of Ms. Shane’s options to purchase 100,000an aggregate of 31,250 shares of common stock.stock as executive compensation. The exercise price of the option was $0.12$0.80 and $0.96 per share, based on the closing price of our common stock on the date of issuance.share. Utilizing the Black-Scholes pricing model, we determined the fair value of the option issued to Ms. Shane was approximately $12,000,$24,000, with the following assumptions: volatility, 146%135%; expected dividend yield, 0%; risk free interest rate, 2.27%1.64%; and a life of 5 years. The grant date fair value of each share of common stock underlying the optionoptions was $0.12. In addition, pursuant to her employment agreement, on January 3, 2019, we issued her an option under the 2016 Plan to purchase 250,000 shares of common stock. The exercise price of the option was $0.11 per share, based on the closing price of our common stock on the date of issuance. Utilizing the Black-Scholes pricing model, we determined the fair value of the option issued to Ms. Shane was approximately $25,000, with the following assumptions: volatility, 144%; expected dividend yield, 0%; risk free interest rate, 2.47%;$0.72 and a life of 5 years. The grant date fair value of each share of common stock underlying the option was $0.10. The option was accrued for as of December 31, 2018.$0.80. We recognized total equity-based compensation to Ms. Shane of approximately $37,000$24,000 on the options during the year ended December 31, 2018.2019. The other compensation in the amount of $9,000 represents an auto allowance pursuant to Ms. Shane’s employment agreement. Please refer to Item11Item 11 Employment Agreements for additional details of Ms. Shane’s annual compensation.
(5)(6)
During the year ended December 31, 2020, we issued Mr. Jennings a ten-year warrant to purchase an aggregate of 6,250 shares of common stock as executive compensation. The exercise price of the warrant was $4.00 per share. Utilizing the Black-Scholes pricing model, we determined the fair value of the warrants issued to Mr. Jennings was approximately $25,000, with the following assumptions: volatility, 173%; expected dividend yield, 0%; risk free interest rate, 0.68%; and a life of 10 years. The grant date fair value of each share of common stock underlying the warrants was $4.00. We recognized equity-based compensation to Mr. Jennings of approximately $25,000 on the options during the year ended December 31, 2020. Please refer to Item 11 Employment Agreement for additional details of Mr. Jennings’ annual compensation.
(7)
During the year ended December 31, 2019, we issued Mr. Jennings options to purchase an aggregate of 6,250 shares of common stock as executive compensation. The exercise price of the option was $0.80 per share. Utilizing the Black-Scholes pricing model, we determined the fair value of the option issued to Mr. Jennings was approximately $4,000, with the following assumptions: volatility, 143%; expected dividend yield, 0%; risk free interest rate, 2.58%; and a life of 5 years. The grant date fair value of each share of common stock underlying the options was $0.72. We recognized equity-based compensation to Mr. Jennings of approximately $4,000 on the options during the year ended December 31, 2019. Please refer to Item 11 Employment Agreement for additional details of Mr. Jennings’ annual compensation.
(6)(8)
In December 2018,2019, the compensation committee approved cash bonuses to the CEO, COO and CFO which were paid in 2019.
In May and October 2020, the compensation committee approved cash bonuses to the COO and CFO which were paid in 2020.
Outstanding Equity Awards at 20182020 Fiscal Year-End
The following table sets forth certain information with respect to outstanding options and warrants to purchase common stock previously awarded to our named executive officers as of December 31, 2018.2020.
| | | Option Awards | |
| Name | | Number of Securities Underlying Unexercised Warrants/Options Exercisable (#) | | Number of Securities Underlying Unexercised Warrants/Options Unexercisable (#) | | Equity Incentive Plan Awards: Number of Securities Underlying Unexercised Unearned Warrants (#) | | Warrant Exercise Price ($) | | Warrant Expiration Date | |
| Halden S. Shane | | 3,000,000 (1) | | — | | — | | $0.30 | | 2/11/2019-2/11/2021 | |
| | | 250,000 (2) | | — | | — | | $0.50 | | 3/31/2021 | |
| | | 250,000 (3) | | — | | — | | $0.42 | | 6/30/2021 | |
| | | 250,000 (4) | | — | | — | | $0.32 | | 9/30/2021 | |
| | | 250,000 (5) | | — | | — | | $0.27 | | 12/30/2021 | |
| | | 250,000 (8) | | — | | — | | $0.10 | | 7/17/2022 | |
| | | 3,500,000 (9) | | — | | — | | $0.12 | | 12/22/2022 | |
| | | 250,000(11) | | — | | — | | $0.08 | | 11/19/2023 | |
| | | | | | | | | | | | |
| Elissa J. Shane | | 100,000 (10) | | — | | — | | $0.12 | | 1/5/2023 | |
| Nick Jennings | | 300,000 (6) | | — | | — | | $0.30 | | 10/1/2019-10/1/2021 | |
| | | 100,000 (7) | | — | | — | | $0.55 | | 1/26/2021 | |
| Number of Securities Underlying Unexercised Warrants / Options Exercisable(1)(#) | Number of Securities Underlying Unexercised Warrants / Options Unexercisable (#) | Equity Incentive Plan Awards: Number of Securities Underlying Unexercised Unearned Warrants (#) | | |
| Halden S. Shane | 125,000(2) | — | — | $2.40 | 2/11/2021 |
| 31,250(3) | — | — | $4.00 | 3/31/2021 |
| 31,250(4) | — | — | $3.36 | 6/30/2021 |
| 31,250(5) | — | — | $2.56 | 9/30/2021 |
| 31,250(6) | — | — | $2.16 | 12/30/2021 |
| 31,250(7) | — | — | $0.80 | 7/17/2022 |
| 437,500(8) | — | — | $0.96 | 12/22/2022 |
| 31,250(9) | — | — | $0.64 | 11/19/2023 |
| 125,000(10) | — | — | $0.80 | 1/26/2024 |
| 156,250(11) | — | — | $1.20 | 1/31/2025 |
| 12,500(12) | — | — | $4.00 | 4/24/2030 |
| 375,000(13) | — | — | $6.95 | 10/01/2030 |
| Elissa J. Shane | 12,500(14) | — | — | $0.96 | 1/5/2023 |
| 31,250(15) | — | — | $0.88 | 1/03/2024 |
| 12,500(16) | — | — | $0.96 | 1/03/2025 |
| 18,750(17) | — | — | $0.80 | 1/15/2025 |
| 6,250(18) | — | — | $4.00 | 4/24/2030 |
| 31,250(19) | — | — | $7.06 | 10/1/2025 |
| Nick Jennings | 12,500(20) | — | — | $2.40 | 10/1/2021 |
| 12,500(21) | — | — | $4.40 | 1/26/2021 |
| 6,250(22) | — | — | $0.80 | 1/26/2023 |
| 6,250(23) | — | — | $4.00 | 4/24/2030 |
(1)
Reflects the 1-for-8 reverse stock split of our Common Stock and Series A Preferred Stock effected on September 10, 2020.
(2)
Warrants vested in increments of 1,000,000125,000 on 2/11/February 11, 2014, 2/11/February 11, 2015, and 2/11/February 11, 2016 and have a term of 5 yearsfive years.
(2)(3)
Warrants vested on 3/31/March 31, 2016 and have a term of 5 yearsfive years.
(3)(4)
Warrants vested on 6/30/June 30, 2016 and have a term of 5 yearsfive years.
(4)(5)
Warrants vested on 9/30/September 30, 2016 and have a term of 5 yearsfive years.
(5)(6)
Warrants vested on 12/30/December 30, 2016 and have a term of 5 yearsfive years.
(6)(7)
Warrants vested in incrementson July 17, 2017 and have a term of 100,000five years.
(8)
Warrants vested on 10/1/2014, 10/1/2015December 22, 2017 and 10/1/have a term of five years.
(9)
Warrants vested on November 19, 2018 and have a term of five years.
(10)
Warrants vested on January 26, 2019 and have a term of five years.
(11)
Warrants vested on January 31, 2020 and have a term of five years.
(12)
Warrants vested on April 24, 2020 and have a term of ten years.
(13)
Warrants vested on October 01, 2020 and have a term of ten years.
(14)
Options pursuant to the 2016 Plan vested on January 5, 2018 and have a term of five years.
(15)
Options pursuant to the 2016 Plan vested on January 3, 2019 and have a term of five years.
(16)
Options pursuant to the 2016 Plan vested on January 3, 2020 and have a term of five years.
(17)
Options pursuant to the 2016 Plan vested on January 15, 2020 and have a term of five years.
(18)
Warrants vested on April 24, 2020 and have a term of ten years.
(19)
Options pursuant to the 2016 Plan vested on October 01, 2020 and have a term of five years.
(20)
Warrants vested on October 1, 2016 and have term of five years.
(21)
Warrants vested on January 26, 2016 and have a term of 5 yearsfive years.
(7)(22)
WarrantsOptions pursuant to the 2016 Plan vested on 1/26/2016 and have a term of 5 years
(8)
Warrants vested on 7/17/2017 and have a term of 5 years
(9)
Warrants vested on 12/22/2017 and have a term of 5 years
(10)
Options vested on 1/5/January 26, 2018 and have a term of 5 yearsfive years.
(11)(23)
Warrants vested on 11/19/2018April 24, 2020 and have a term of 5 yearsten years.
Employment Agreements, Termination of Employment and Change-in-Control Arrangements
Except as described below, we currently have no employment agreements with any of our executive officers, nor any compensatory plans or arrangements resulting from the resignation, retirement or any other termination of any of our executive officers, from a change-in-control, or from a change in any executive officer’s responsibilities following a change-in-control.
Employment Agreements
We have entered into employment agreements with each of the named executive officers and generally include the named executive officer’s initial base salary and an indication of equity compensation opportunities.
Halden S. Shane
On January 15, 2016,September 22, 2020, we entered into ana three year employment agreement with Dr. Shane, effective JanuaryOctober 1, 2016.2020. The agreement provides for a base annual salary of $360,000.$500,000. The agreement also provides for the quarterlya signing bonus of 375,000 warrants. Dr. Shane is also entitled to a cash performance bonus and an annual issuance of an option to purchase 250,00031,250 shares ofcommon stockin from the 2016 with an exercise price equal toPlan at the three-day trailing volume weighted average price of ourcommon stock. In the event Dr. Shane is terminated for any reason or becomes disabled or dies, any options he holds at such time will become cashless and will be entitled to piggyback registration and exercise immediately. Dr. Shane is also entitled to performance bonuses, subject to the achievement of certain objectives, including (i) a minimum semi-annual grant of stock options to purchase up to 250,000 shares ofcommon stockand (ii) a cash bonus, determined in the sole discretion of the Board. The agreement also provides that we will reimburse Dr. Shane for certain business and entertainmentthe expenses includingassociated with the use of an automobile.automobile up to $750 a month. The term of the agreement is three years.
In the event Dr. Shane is terminated as CEO as a result of a change in control, Dr. Shane will be entitled to a lump sum payment of two yearsyears’ salary at the time of such termination and will be granted an option to purchase 3,000,000 shares ofcommon stockthat are cashless and, when exercised, will have piggyback registration or demand registration rights, and if applicable, any and all outstanding stock grants will be accelerated and be fully vested.termination.
The Board may terminate Dr. Shane for cause by written notification to Dr. Shane; provided, however, that no termination for cause will be effective unless Dr. Shane has been provided with prior written notice and opportunity for remedial action and fails to remedy within 30 days thereof, in the event of a termination by the Company (i) by reason of willful dishonesty towards, fraud upon, or deliberate injury or attempted injury to, the Company, (ii) by reason of material breach of his employment agreement and (iii) by reason of gross negligence or intentional misconduct with respect to the performance of duties under the agreement. Upon termination for cause, Dr. Shane will be immediately paid an amount equal to his gross salary. The Board may terminate Dr. Shane other than for cause at any time upon giving notice to Dr. Shane. Upon such termination, Dr. Shane will be immediately paid an amount equal to his gross salary.
Elissa J. Shane
On January 5, 2018, in connection with her appointment as our Chief Operating Officer,October 1, 2020, we entered into an employment agreement with Elissa J. Shane, effective JanuaryOctober 1, 2018.2020. Pursuant to her employment agreement, Ms. Shane will receive an annual base salary of at least $200,000,$270,000, subject to annual review and discretionary increase by the Compensation Committee of the Board. Ms. Shane is eligible to receive an annual cash bonus and other annual incentive compensation, and thecompensation. The agreement provides that we will issue Ms. Shane annually an option to purchase at least 250,000 sharesoriginally provided for a grant of common stock pursuant to the 2016 Plan.93,750 warrants. Additionally, in connection with the execution of her employment agreement, on January 5, 2018,October 1, 2020, we issued Ms. Shane an option under the 2016 Plana warrant to purchase 100,00093,750 shares of common stockCommon Stock at an exercise price of $0.12$6.17 per share. These provisions were subsequently amended to provide for the issuance to Ms. Shane of 31,250 options from the 2016 Equity Plan at the closing price of $7.06 on the date of grant in lieu of the warrant grant and the 93,750 warrants were cancelled. Ms. Shane acknowledged that the 31,250 options were in full consideration of the amount she was entitled to under the agreement. Her employment agreement also provides that we will reimburse Ms. Shane for reasonable and necessary business and entertainment expenses that she incurs in performing her duties. During the term of her employment, Ms. Shane will also be entitled to up to four weeks of paid vacation time annually, which will accrue up to six weeks, and to participate in our benefit plans and programs, including but not limited to all group health, life, disability and retirement plans. Ms. Shane is also entitled to the sum of $750$1,000 per month as a vehicle allowance. The initial term of her employment agreement is three years, which may be automatically extended for successive one-year terms, unless either party provides the other with 120 days’ prior written notice of its intent to terminate the agreement.
In the event Ms. Shane is terminated as COO as a result of a change in control, Ms. Shane will be entitled to a lump sum payment of one and a half years’ salary at the time of such termination.
Nick Jennings
On September 2, 2015, we entered into a new employment agreement with Mr. Jennings, which superseded his prior agreement, pursuant to which he continues to serve as our Chief Financial Officer. Mr. Jennings’ annual salary is $132,000, which is reviewed annually. On January 26, 2016, we issued Mr. Jennings a five-year warrant to purchase up to 100,00012,500 shares of common stock at an exercise price of $0.55$4.40 per share. The agreement also provided for the issuance of an additional five-year warrant to purchase 100,00012,500 shares of common stock in 2016, however, this provision was modified to grant a salary increase in lieu of the options. In January 2018,October 2020, Mr. Jennings’ annual salary was increased to $155,000$175,000 per year. Mr. Jennings is also entitled to additional equity compensation based upon superior performance of his responsibilities, as determined by the Board in its sole discretion. The agreement also provides that we will reimburse Mr. Jennings for certain business and entertainment expenses. In the event of a change in control of the Company that results in his termination, Mr. Jennings will be entitled to a lump sum payment of one year’s salary and all equity awards will be accelerated and fully vested. In the event his employment is terminated other than for cause, Mr. Jennings will receive an amount equal to his annual salary as of such termination date after the second employment anniversary.
Director Compensation
Each of our non-employee directors receives cash fees and stock as compensation for their service on the Board and the committees of the Board on which they are a member. The tables below set forth cash and stock compensation earned by each non-employee director during the fiscal year ended December 31, 2018.2020.
| Name | Fees earned or paid in cash ($) | | | | | Fees earned or paid in cash ($) | | | | |
| Harold W. Paul (1) | 40,000 | 7,500 | — | 60,000 | 107,500 | 40,000 | 12,000 | — | 78,000 | 130,000 |
| Walter Johnsen (2) | 40,000 | 7,500 | — | 47,500 | 40,000 | 12,000 | — | 52,000 |
| Kelly Anderson (3) | 45,000 | 7,500 | — | 52,500 | 45,000 | 12,000 | — | 57,000 |
| Lim Boh Soon (4) | 40,000 | 7,500 | — | 47,500 | 40,000 | 12,000 | — | 52,000 |
| Ronald E. Ainsworth (5) | 20,000 | 3,500 | — | 23,500 | |
(1)
Mr. Paul also received $60,000$78,000 in cash compensation in exchange for legal services rendered during 2018.2020. In January 2020, we issued Mr. Paul 12,500 shares of common stock that were valued at $12,000.
(2)
Mr. Johnsen was elected to the Board on January 29, 2016. The term of his agreement as director commenced on February 1, 2016 for up to two years and until a successor is elected, or resignation or removal. Mr. Johnsen was re-elected to the board for a 3-year term at our 2019 annual meeting Our agreement with Mr. Johnsen provides for an annual fee in the amount of $40,000 paid on a quarterly basis and an annual grant of shares of common stock. In February 2018,January 2020, we issued Mr. Johnsen 75,00012,500 shares of common stock that were valued at $7,500. $12,000.
(3)
Ms. Anderson was elected to the Board on January 29, 2016 and serves as the chairperson of our Audit Committee. The term of her agreement as director commenced on February 1, 2016 for up to two years and until a successor is elected, or resignation or removal. Ms. Anderson was re-elected to the board for a 3-year term at our 2019 annual meeting. Our agreement with Ms. Anderson provides for an annual fee in the amount of $45,000 paid on a quarterly basis and an annual grant of shares of common stock. In February 2018,January 2020, we issued Ms. Anderson 75,00012,500 shares of common stock that were valued at $7,500. $12,000.
(4)
Mr. Lim was elected to the Board on January 29, 2018. The term of his agreement as director commenced on February 1, 2018 for up to three years and until a successor is elected, or resignation or removal. Our agreement with Mr. Lim provides for an annual fee in the amount of $40,000 paid on a quarterly basis and an annual grant of shares of common stock. In February 2018,January 2020, we issued Mr. Lim 75,00012,500 shares of common stock that were valued at $7,500.$12,000.
(5)
Mr. Ainsworth was elected to the Board on July 7, 2017. The term of his agreement as director commenced on July 7, 2017 for up to one year and until a successor is elected, or resignation or removal. In July 2018, Mr. Ainsworth was removed from the Board. During 2018, Mr. Ainsworth received cash fees in the amount of $20,000 and was issued 62,500 shares of common stock that were valued at $3,500.
Item 12. SECURITY
SECURITY OWNERSHIP OF CERTAIN BENEFICIAL OWNERS AND MANAGEMENT ANDRELATED STOCKHOLDER MATTERS
Equity Compensation Plan Information
We currently maintain one compensation plan: the 2016 Plan. The 2016 Plan was approved by the Board on January 29, 2016 and received shareholder approval on July 7, 2017. The 2016 Plan authorizesauthorized the issuance of 5,000,000625,000 shares of common stock. On August 25, 2015, the Board terminated the 2008 Plan, which we had maintained previously and which our shareholders had approved. Accordingly, we will issue future awards under the 2016 Plan.
On December 30, 2020, we received shareholder approval to restate and amend the 2016 Equity Incentive Plan to increase the maximum number of shares of common stock authorized from issuance by 1,375,000, from 625,000 shares to 2,000,000.
The following table provides information as of December 31, 20182020 with respect to compensation plans under which our equity securities are authorized for issuance.
| Plan Category | Number of securities to be issued upon exercise of outstanding options, warrants and rights | Weighted-average exercise price of outstanding options, warrants and rights | Number of securities remaining available for future issuance under equity compensation plans(3) | Number of securities to be issued upon exercise of outstanding options, warrants and rights(1) | Weighted-average exercise price of outstanding options, warrants and rights(1) | Number of securities remaining available for future issuance under equity compensation plans(1) |
| Equity compensation plans approved by security holders | 320,000(1) | $0.52 | 4,180,000 | 132,500(2) | $2.72 | 1,659,500(4) |
| Equity compensation plans not approved by security holders | 15,425,000(2) | $0.36 | — | 940,625(3) | $2.96 | — |
| Total | 15,745,000 | $0.36 | — | 1,073,125 | $2.88 | — |
(1) | Prior to August 25, 2015, we granted awards under the 2008 Plan. |
(2) | Represents shares of common stock issuable upon the exercise of warrants issued to executive officers, employees and consultants in exchange for services rendered. |
(3) | On July 7, 2017, the 2016 Plan received shareholder approval, which permits the grant up to 5,000,000 shares of common stock |
(1)
Reflects the 1-for-8 reverse stock split of our Common Stock and Series A Preferred Stock effected on September 10, 2020.
(2)
Prior to August 25, 2015, we granted awards under the 2008 Plan.
(3)
Represents shares of common stock issuable upon the exercise of warrants issued to executive officers, employees and consultants in exchange for services rendered.
(4)
On July 7, 2017, the 2016 Plan received shareholder approval, which permits the grant up to 625,000 shares of common stock. On December 30, 2020, we received shareholder approval to restate and amend the 2016 Equity Incentive Plan to increase the maximum number of shares of common stock authorized from issuance by 1,375,000, from 625,000 shares to 2,000,000.
Security Ownership of Certain Beneficial Owners and Management
The following table sets forth certain information with respect to the beneficial ownership of our common stock and Series A preferred stock (together, “Voting Stock”) as of March 15, 20195, 2021 for:
●
each person (or group of affiliated persons) known by us to be the beneficial owner of more than 5% of our outstanding shares of common stock or Series A preferred stock;
●
each of our directors and nominees for election to the Board;
●
each of the executive officers named in the summary compensation table; and
●
all of our directors and executive officers as a group.
We have determined beneficial ownership in accordance with the rules of the SEC. Except as indicated by the footnotes below, we believe, based on the information furnished to us, that the persons and entities named in the following table have sole voting and investment power with respect to all shares of Voting Stock that they beneficially own, subject to applicable community property laws.
Applicable percentage ownership is based on 124,690,418 16,811,513shares of common stock and 510,00063,750 shares of Series A preferred stock outstanding at March 15, 2019.5, 2021. In computing the number of shares of Voting Stock beneficially owned by a person and the percentage ownership of that person, we deemed to be outstanding all shares of Voting Stock subject to options, warrants or other convertible securities held by that person or entity that are currently exercisable or releasable or that will become exercisable or releasable within 60 days of March 15, 2019.5, 2021. We did not deem these shares outstanding, however, for the purpose of computing the percentage ownership of any other person. Except as otherwise noted, the address of each person or entity in the following table is c/o TOMI Environmental Solutions, Inc., 9454 Wilshire Blvd.8430 Spires Way., Penthouse, Beverly Hills, CA 90212.Suite N, Frederick, MD 21701.
| | Shares Beneficially Owned
| |
| | | | |
| | | | | | % of Total Voting Power(1) |
| Named Executive Officers and Directors: | | | | | |
| Halden S. Shane, CEO and Chairman of the Board | 28,345,048(2) | 21.3% | 510,000 | 100% | 21.6% |
| Elissa J. Shane, Chief Operating Officer | 2,241,310(3) | 1.7% | | | 1.7% |
| Nick Jennings, Chief Financial Officer | 562,145(4) | * | — | — | * |
| Harold W. Paul, Secretary, Director | 1,479,774(5) | 1.1% | — | — | 1.1% |
| Walter Johnsen, Director | 250,000(6) | * | — | — | * |
| Kelly Anderson, Director | 250,000(7) | * | — | — | * |
| Lim Boh Soon, Director | 690,190(8) | * | — | — | * |
| All current directors and executive officers as a group (7 persons) | 33,818,467(9) | 25.4% | 510,000 | 100% | 25.7% |
| | | | | | |
| 5% Beneficial Owners: | | | | | |
| Lau Sok Huy | 17,361,111(10) | 13.9% | — | — | 13.9% |
| Ah Kee Wee | 11,666,669(11) | 9.4% | — | — | 9.4% |
| Shares Beneficially Owned | |
| | | |
| | | | | % of Total Voting Power(1) |
| 5% Shareholders: | | | | | |
Lau Sok Huy(2) | 2,170,139 | 12.9% | — | — | 12.9% |
Ah Kee Wee (3) | 956,099 | 5.7% | — | — | 5.7% |
| Named Executive Officers and Directors: | | | | | |
Halden S. Shane(4) | 3,961,881 | 21.6% | 63,750 | 100.0% | 21.9% |
Elissa J. Shane(5) | 442,664 | 2.4% | — | — | 2.4% |
Nick Jennings(6) | 57,768 | * | — | — | * |
Harold W. Paul(7) | 207,625 | 1.1% | — | — | 1.1% |
Walter Johnsen(8) | 56,250 | * | — | — | * |
Kelly Anderson(9) | 56,250 | * | — | — | * |
Lim Boh Soon(10) | 111,274 | * | — | — | * |
Executive Officers and Directors as a Group (11) | 4,893,712 | 26.7% | — | — | 26.9% |
*
Denotes ownership of less than 1%.
(1) | Percentage of total voting power represents voting power with respect to all shares of our common stock and Series A preferred stock, as a single class. The holders of common stock and Series A preferred stock(1) Percentage of total voting power represents voting power with respect to all shares of our Common Stock and Series A Preferred Stock, as a single class. The holders ofCommon Stockand Series A Preferred Stock are each entitled to one vote per share. |
(2) | Consists of (i) 18,845,048 shares of common stock held of record by Dr. Shane, (ii) 1,500,000 shares of common stock held of record by the Shane Family Trust, (iii) 1,000,000 shares of common stock held of record by Belinha Shane and (iv) 8,000,000 shares of common stock issuable upon the exercise of warrants to purchase common stock held by Dr. Shane that are exercisable within 60 days of March 15, 2019. Dr. Shane is a co-trustee of the Shane Family Trust and may be deemed to share voting and investment power over the securities held by the trust. Belinha Shane is Dr. Shane’s wife. Dr. Shane disclaims ownership of such shares held by his wife, except to the extent of his pecuniary interest.
|
(3) | Consists of (i) 1,891,310 shares of common stock held of record by Ms. Shane and (ii) 350,000 shares of common stock issuable upon the exercise of options to purchase common stock held by Ms. Shane that are exercisable within 60 days of March 15, 2019.
|
(4) | Consists of (i) 112,145 shares of common stock held of record by Mr. Jennings and (ii) 450,000 shares of common stock issuable upon the exercise of warrants and options to purchase common stock held by Mr. Jennings that are exercisable within 60 days of March 15, 2019.
|
(5) | Consists of (i) 1,414,774 shares of common stock held of record by Mr. Paul and (ii) 65,000 shares of common stock issuable upon exercise of stock options that are exercisable within 60 days of March 15, 2019.
|
| |
(6) | Consists of (i) 225,000 shares of common stock held of record by Mr. Johnsen and (ii) 25,000 shares of common stock issuable upon exercise of stock options that are exercisable within 60 days of March 15, 2019.
|
(7) | Consists of (i) 225,000 shares of common stock held of record by Ms. Anderson and (ii) 25,000 shares of common stock issuable upon exercise of stock options that are exercisable within 60 days of March 15, 2019.
|
(8) | Consists of 690,190 shares of common stock held of record by Dr. Lim.
|
(9) | Consists of (i) 24,903,467 shares of common stock, (ii) 8,400,000 shares of common stock issuable upon the exercise of warrants to purchase common stock and (iii) 515,000 shares of common stock issuable upon exercise of stock options that are exercisable within 60 days of March 15, 2019.
|
(10) | Based on Form 3 filed with the SEC by Lau Sok Huy on January 24, 2018.
|
(11) | Based on information reported by Mr. Wee to the Company. Consists of (i) 8,666,669 shares of common stock and (ii) 3,000,000 shares of common stock issuable upon the exercise of warrants to purchase common stock held by Mr. Wee that are exercisable within 60 days of March 15, 2019. |
(2)
Based on Form 3 filed with the SEC by Lau Sok Huy on January 24, 2018.
(3)
Based on information reported by Mr. Wee to the Company. Consists of (i) 956,099 shares of common stock.
(4)
Consists of: (i) 2,355,631 shares of Common Stock held of record by Dr. Shane; (ii) 187,500 shares of Common Stock held of record by the Shane Family Trust; (iii) 125,000 shares of Common Stock held of record by Belinha Shane; and (iv) 1,418,750 shares ofCommon Stockissuable upon the exercise of warrants to purchase Common Stock held by Dr. Shane that are exercisable or will become exercisable within 60 days of March 5, 2021. Dr. Shane is a co-trustee of the Shane Family Trust and may be deemed to share voting and investment power over the securities held by the trust. Belinha Shane is Dr. Shane’s wife. Dr. Shane disclaims ownership of such shares held by his wife, except to the extent of his pecuniary interest.
(5)
Consists of: (i) 236,414 shares of Common Stock held of record by Ms. Shane; and (ii) 206,250 shares ofCommon Stockissuable upon the exercise of warrants and options to purchaseCommon Stockheld by Ms. Shane that are exercisable or will become exercisable within 60 days of March 5, 2021.
(6)
Consists of: (i) 26,519 shares of Common Stock held of record by Mr. Jennings; and (ii) 31,250 shares ofCommon Stockissuable upon the exercise of warrants and options to purchaseCommon Stockheld by Mr. Jennings that are exercisable or will become exercisable within 60 days of March 5, 2021.
(7)
Consists of: (i)202,000 shares ofCommon Stockheld of record by Mr. Paul; and (ii) 5,625 shares of Common Stock issuable upon exercise of stock options that are exercisable or will become exercisable within 60 days ofMarch 5, 2021.
(8)
Consists of: (i)53,125 shares ofCommon Stockheld of record by Mr. Johnsen; and (ii) 3,125 shares of Common Stock issuable upon exercise of stock options that are exercisable or will become exercisable within 60 days ofMarch 5, 2021.
(9)
Consists of: (i)53,125 shares ofCommon Stockheld of record by Ms. Anderson; and (ii) 3,125 shares of Common Stock issuable upon exercise of stock options that are exercisable or will become exercisable within 60 days ofMarch 5, 2021.
(10)
Consists of111,274 shares ofCommon Stockheld of record by Dr. Lim.
(11)
Consists of: (i) 3,350,587 shares of Common Stock; (ii) 1,450,000 shares ofCommon Stockissuable upon the exercise of warrants to purchase Common Stock; and (iii) 218,125 shares ofCommon Stockissuable upon exercise of stock options that are exercisable or will become exercisable within 60 days of March 5, 2021.
Changes in Control
We are unaware of any contract or other arrangement the operation of which may at a subsequent date result in a change in control of our Company.
Item 13. CERTAIN
CERTAIN RELATIONSHIPS AND RELATED TRANSACTIONS, AND DIRECTOR INDEPENDENCE
Transactions with Related Persons
None.
Independence of the Board
Based upon information submitted by Mr. Johnsen, Ms. Anderson, Dr. Lim and Mr. Paul the Board has determined that each of them is “independent” for purposes of OTC Governance Guidelines for directors. Mr.Dr. Shane is not an independent director. No director will be considered “independent” unless the Board affirmatively determines that the director has no direct or indirect material relationship with the Company.
Our Board has three separate standing committees: the Audit Committee, the Compensation Committee and the Nominating and Corporate Governance Committee.
We have made each of our committee charters available on our website at http://investor.tomimist.com/.
Item 14. PRINCIPAL
PRINCIPAL ACCOUNTING FEES AND SERVICES
Accountant Fees
The following table presents the aggregate fees billed for audit and other services provided by our independent registered public accounting firm, Wolinetz, Lafazan & Company, P.C, during the 20182020 and 20172019 fiscal years:
| | For the Fiscal Years Ended December 31, |
| | | |
| Audit Fees(1) | $108,000 | $99,000 |
| Audit-Related Fees(2) | — | — |
| Tax Fees(3) | — | — |
| All Other Fees(4) | — | — |
| Total | $108,000 | $99,000 |
| | For the Fiscal Years Ended December 31, |
| | | |
| Audit Fees (1) | $138,000 | $122,000 |
| Audit-Related Fees (2) | — | — |
| Tax Fees (3) | — | — |
| All Other Fees (4) | — | — |
| Total | $138,000 | $122,000 |
(1) | Audit Fees—Audit fees represent the professional services rendered for the audit of our annual financial statements and the review of our financial statements included in quarterly reports, along with services normally provided by the accounting firm in connection with statutory and regulatory filings or engagements.(1) Audit Fees- Audit fees represent the professional services rendered for the audit of our annual financial statements and the review of our financial statements included in quarterly reports, along with services normally provided by the accounting firm in connection with statutory and regulatory filings or engagements. (2) Audit-Related Fees- Audit-related fees represent professional services rendered for assurance and related services by Wolinetz, Lafazan & Company, P.C. that were reasonably related to the performance of the audit or review of our financial statements that are not reported under audit fees. (3) Tax Fees- Tax fees represent professional services rendered by the accounting firm for tax compliance, tax advice, and tax planning. (4) All Other Fees- All other fees represent fees billed for products and services provided by Wolinetz, Lafazan & Company, P.C other than the services reported for the other categories. |
| |
(2) | Audit-Related Fees—Audit-related fees represent professional services rendered for assurance and related services by Wolinetz, Lafazan & Company, P.C. that were reasonably related to the performance of the audit or review of our financial statements that are not reported under audit fees.
|
| |
(3) | Tax Fees— Tax fees represent professional services rendered by the accounting firm for tax compliance, tax advice, and tax planning.
|
| |
(4) | All Other Fees—All other fees represent fees billed for products and services provided by Wolinetz, Lafazan & Company, P.C other than the services reported for the other categories.
|
Pre-Approval Policies and Procedures of the Audit Committee
Consistent with the rules and regulations promulgated by the Securities and Exchange Commission, the Audit Committee approves the engagement of our independent registered public accounting firm and is also required to pre-approve all audit and non-audit expenses. All of the services described above were approved by the Audit Committee in accordance with its procedure. We do not otherwise rely on pre-approval policies and procedures.
PART IV
Item 15.
EXHIBITSEXHIBITS AND FINANCIAL STATEMENT SCHEDULES
(a) Documents filed as part of this report:
(1) Financial Statements. See Index to Financial Statements and Schedule on page F-1.
(2) Schedules to Financial Statements. All financial statement schedules have been omitted because they are either inapplicable or the information required is provided in our consolidated financial statements and the related notes thereto, included in Part II, Item 8 of this Annual Report on Form 10-K.
(3) The exhibits listed on the accompanying Exhibit Index are filed (or incorporated by reference herein) as part of this Annual Report on Form 10-K.
Pursuant to the requirements of Section 13 or 15(d) of the Securities Exchange Act of 1934, the registrant has duly caused this report to be signed on its behalf by the undersigned, thereunto duly authorized.
| | | |
DATED: April 1, 2019March 30, 2021 | | TOMI ENVIRONMENTAL SOLUTIONS, INC. |
| | | |
| | | /s/ HALDEN S. SHANE |
| | | Halden S Shane Chairman of the Board and Chief Executive Officer (Principal Executive Officer) |
The undersigned directors and officers of TOMI Environmental Solutions, Inc. constitute and appoint Halden S. Shane and Nick Jennings, or either of them, as their true and lawful attorney and agent with power of substitution, to do any and all acts and things in our name and behalf in our capacities as directors and officers and to execute any and all instruments for us and in our names in the capacities indicated below, which said attorney and agent may deem necessary or advisable to enable said corporation to comply with the Securities Exchange Act of 1934, as amended, and any rules, regulations and requirements of the Securities and Exchange Commission, in connection with this Annual Report on Form 10-K, including specifically but without limitation, power and authority to sign for us or any of us in our names in the capacities indicated below, any and all amendments hereto; and we do hereby ratify and confirm all that said attorney and agent shall do or cause to be done by virtue hereof. Pursuant to the requirements of the Securities Exchange Act of 1934, this report has been signed below by the following persons on behalf of the registrant and in the capacities and on the dates indicated.
| | | |
Signature | Title
| Date
|
| | | |
/s/ HALDEN S. SHANE Halden S. Shane | Chairman of the Board and Chief Executive Officer (Principal Executive Officer) | April 1, 2019 |
Halden S. Shane
| | March 30, 2021 |
| | | |
/s/ NICK JENNINGS Nick Jennings | Chief Financial Officer (Principal Financial Officer and Principal Accounting Officer) | April 1, 2019 |
Nick Jennings
| | March 30, 2021 |
| | | |
/s/ HAROLD W. PAUL
Harold W. Paul | Director | April 1, 2019 |
Harold W. Paul
| | March 30, 2021 |
/s/ WALTER C. JOHNSEN
| Director | April 1, 2019 |
Walter C. Johnsen | Director | March 30, 2021 |
/s/ KELLY J. ANDERSON
| Director | April 1, 2019 |
Kelly J. Anderson | Director | March 30, 2021 |
/s/ LIM BOH SOON
| Director | April 1, 2019 |
Lim Boh Soon | Director | March 30, 2021 |
| Exhibit Number | | Description of Exhibit | | Form | | File No. | | Date | | Exhibit | | Filed Herewith |
| | Articles of Restatement of the Registrant, effective October 6, 2009 | | S-1 | | 333-162356 | | 10/6/09 | | 3.1 | | |
| | Articles of Amendment of Articles of Incorporation of the Registrant, effective October 24, 2011 | | 8-K | | 000-09908 | | 10/24/11 | | 3.1(a) | | |
| | Articles of Amendment of Articles of Incorporation of the Registrant, effective September 10, 2020 | | 8-K | | 000-09908 | | 9/14/20 | | 3.1 | | |
| | Amended Bylaws of the Registrant, adopted effective November 2, 2007 | | 10-Q | | 000-09908 | | 5/16/16 | | 3.2 | | |
| | Amendment to Amended Bylaws of the Registrant, adopted effective January 29, 2016 | | 8-K | | 000-09908 | | 2/1/16 | | 3.2 | | |
| 4.1 | | Specimen certificate evidencing shares of common stock of the Registrant | | S-3
| | 333-249850
| | 11/4/20
| | 4.1
| |
|
| 4.2 | | Description of Registrants Securities | | S-3
| | 333-249850
| | 11/4/20
| | | |
|
| 10.1+ | | Amended and Restated 2016 Equity Incentive Plan, as adopted by the Registrant’s stockholders on December 30, 2020 | | DEF 14A | | 001-39574
| | 12/2/20 | | Appendix A
| |
|
| | Offer Letter, dated January 15, 2016, by and between the Registrant and Dr. Halden Shane | | 10-Q | | 000-09908 | | 5/16/16 | | 10.1 | | |
| | Employment Agreement, dated February 8, 2016, by and between the Registrant and Robert Wotczak | | 10-Q | | 000-09908 | | 5/16/16 | | 10.2 | | |
| | Offer Letter, dated September 2, 2015, by and between the Registrant and Nick Jennings | | 10-Q | | 000-09908 | | 5/16/16 | | 10.3 | | |
| | Offer Letter, dated September 2, 2015, by and between the Registrant and Norris Gearhart | | 10-Q | | 000-09908 | | 5/16/16 | | 10.4 | | |
| | Form of Appointment to the Board of Directors as Independent Director of the Registrant | | 10-Q | | 000-09908 | | 5/16/16 | | 10.5 | | |
| | Restated Manufacturing and Development Agreement, dated November 10, 2016, by and between the Registrant and RG Group | | 10-Q | | 000-09908 | | 9/30/16 | | 10.1 | | |
| | Employment Agreement, entered into as of January 5, 2018, by and between the Registrant and Elissa J. Shane, effective as of January 1, 2018 | | 8-K | | 000-09908 | | 1/18/18 | | 10.1 | | |
| | Code of Ethics | | 10-K | | 000-09908 | | 3/31/07 | | 14 | | |
| | Subsidiaries of the Registrant | | | | | | | | | | X |
| | Power of Attorney (included in signature page) | | | | | | | | | | X |
| | Certification of Chief Executive Officer pursuant to Rule 13a-14(a) or Rule 15d-14(a) of the Securities Exchange Act of 1934, as amended, as adopted pursuant to Section 302 of the Sarbanes-Oxley Act of 2002 | | | | | | | | | | X |
| | Certification of Chief Financial Officer pursuant to Rule 13a-14(a) or Rule 15d-14(a) of the Securities Exchange Act of 1934, as amended, as adopted pursuant to Section 302 of the Sarbanes-Oxley Act of 2002 | | | | | | | | | | X |
| | Certifications of Chief Executive Officer and Chief Financial Officer pursuant to 18 U.S.C. Section 1350, as adopted pursuant to Section 906 of the Sarbanes-Oxley Act of 2002 | | | | | | | | | | X |
| 101.INS | | XBRL Instance Document | | | | | | | | | | X |
| 101.SCH | | XBRL Taxonomy Extension Schema | | | | | | | | | | X |
| 101.CAL | | XBRL Taxonomy Extension Calculation Linkbase | | | | | | | | | | X |
| 101.DEF | | XBRL Taxonomy Extension Definition Linkbase | | | | | | | | | | X |
| 101.LAB | | XBRL Taxonomy Extension Label Linkbase | | | | | | | | | | X |
| 101.PRE | | XBRL Taxonomy Extension Presentation Linkbase | | | | | | | | | | X |
| + | Indicates a management contract or compensatory plan. |
| | |
| # | The information in Exhibit 32.1 shall not be deemed “filed” for purposes of Section 18 of the Securities Exchange Act of 1934, as amended, or the Exchange Act, or otherwise subject to the liabilities of that section, nor shall they be deemed incorporated by reference in any filing under the Securities Act of 1933, as amended, or the Exchange Act (including this report), unless the Registrant specifically incorporates the foregoing information into those documents by reference. |
EXHIBIT INDEX
| | | | | | | | | | | | | |
| Exhibit Number | | Description of Exhibit | | Form | | File No. | | Date | | Exhibit | | Filed Herewith |
| | Articles of Restatement of the Registrant, effective October 6, 2009 | | S-1 | | 333-162356 | | 10/6/09 | | 3.1 | | |
| | Articles of Amendment of Articles of Incorporation of the Registrant, effective October 24, 2011 | | 8-K | | 000-09908 | | 10/24/11 | | 3.1(a) | | |
| | Amended Bylaws of the Registrant, adopted effective November 2, 2007 | | 10-Q | | 000-09908 | | 5/16/16 | | 3.2 | | |
| | Amendment to Amended Bylaws of the Registrant, adopted effective January 29, 2016 | | 8-K | | 000-09908 | | 2/1/16 | | 3.2 | | |
| | 2016 Equity Incentive Plan, as adopted by the Registrant’s Board of Directors on January 29, 2016 | | 10-Q | | 000-09908 | | 5/16/16 | | 10.6 | | |
| | Offer Letter, dated January 15, 2016, by and between the Registrant and Dr. Halden Shane | | 10-Q | | 000-09908 | | 5/16/16 | | 10.1 | | |
| | Employment Agreement, dated February 8, 2016, by and between the Registrant and Robert Wotczak | | 10-Q | | 000-09908 | | 5/16/16 | | 10.2 | | |
| | Offer Letter, dated September 2, 2015, by and between the Registrant and Nick Jennings | | 10-Q | | 000-09908 | | 5/16/16 | | 10.3 | | |
| | Offer Letter, dated September 2, 2015, by and between the Registrant and Norris Gearhart | | 10-Q | | 000-09908 | | 5/16/16 | | 10.4 | | |
| | Form of Appointment to the Board of Directors as Independent Director of the Registrant | | 10-Q | | 000-09908 | | 5/16/16 | | 10.5 | | |
| | Restated Manufacturing and Development Agreement, dated November 10, 2016, by and between the Registrant and RG Group | | 10-Q | | 000-09908 | | 9/30/16 | | 10.1 | | |
| | Employment Agreement, entered into as of January 5, 2018, by and between the Registrant and Elissa J. Shane, effective as of January 1, 2018 | | 8-K | | 000-09908 | | 1/18/18 | | 10.1 | | |
| | Code of Ethics | | 10-K | | 000-09908 | | 3/31/07 | | 14 | | |
| | Subsidiaries of the Registrant | | | | | | | | | | X |
| 24.1 | | Power of Attorney (included in signature page) | | | | | | | | | | X |
| | Certification of Chief Executive Officer pursuant to Rule 13a-14(a) or Rule 15d-14(a) of the Securities Exchange Act of 1934, as amended, as adopted pursuant to Section 302 of the Sarbanes-Oxley Act of 2002 | | | | | | | | | | X |
| | Certification of Chief Financial Officer pursuant to Rule 13a-14(a) or Rule 15d-14(a) of the Securities Exchange Act of 1934, as amended, as adopted pursuant to Section 302 of the Sarbanes-Oxley Act of 2002 | | | | | | | | | | X |
| | Certification of Chief Executive Officer pursuant to 18 U.S.C. Section 1350, as adopted pursuant to Section 906 of the Sarbanes-Oxley Act of 2002 | | | | | | | | | | X |
| | Certification of Chief Financial Officer pursuant to 18 U.S.C. Section 1350, as adopted pursuant to Section 906 of the Sarbanes-Oxley Act of 2002 | | | | | | | | | | X |
| 101.INS | | XBRL Instance Document | | | | | | | | | | X |
| 101.SCH | | XBRL Taxonomy Extension Schema | | | | | | | | | | X |
| 101.CAL | | XBRL Taxonomy Extension Calculation Linkbase | | | | | | | | | | X |
| 101.DEF | | XBRL Taxonomy Extension Definition Linkbase | | | | | | | | | | X |
| 101.LAB | | XBRL Taxonomy Extension Label Linkbase | | | | | | | | | | X |
| 101.PRE | | XBRL Taxonomy Extension Presentation Linkbase | | | | | | | | | | X |
+
Indicates a management contract or compensatory plan.
#
The information in Exhibits 32.1 and 32.2 shall not be deemed “filed” for purposes of Section 18 of the Securities Exchange Act of 1934, as amended, or the Exchange Act, or otherwise subject to the liabilities of that section, nor shall they be deemed incorporated by reference in any filing under the Securities Act of 1933, as amended, or the Exchange Act (including this report), unless the Registrant specifically incorporates the foregoing information into those documents by reference.
TOMI ENVIRONMENTAL SOLUTIONS, INC.
INDEX TO CONSOLIDATED FINANCIALFINANCIAL STATEMENTS
| | |
| Page
|
| F-2 |
| F-3
F-4 |
| F-4F-5 |
| F-5F-6 |
| F-6F-7 |
| F-8F-9 |
Report of Independent Registered Public Accounting FirmREPORT OF INDEPENDENT REGISTERED PUBLIC ACCOUNTING FIRM
To the shareholdersShareholders and the boardBoard of directorsDirectors of
TOMI Environmental Solutions, Inc.
Opinion on the Consolidated Financial Statements
We have audited the accompanying consolidated balance sheets of TOMI Environmental Solutions, Inc. and subsidiarySubsidiary (the "Company"“Company”) as of December 31, 20182020 and 2017,2019, and the related consolidated statements of operations, shareholders'shareholders’ equity and cash flows for each of the two years in the period ended December 31, 2018,2020, and the related notes (collectively referred to as the "consolidated“consolidated financial statements"statements”). In our opinion, the consolidated financial statements present fairly, in all material respects, the financial position of the Company as of December 31, 20182020 and 2017,2019, and the results of theirits operations and theirits cash flows for each of the two years in the period ended December 31, 2018,2020, in conformity with accounting principles generally accepted in the United States of America.
Basis for Opinion
These consolidated financial statements are the responsibility of the Company'sCompany’s management. Our responsibility is to express an opinion on the Company's consolidatedCompany’s financial statements based on our audits. We are a public accounting firm registered with the Public Company Accounting Oversight Board (United States) ("PCAOB")(PCAOB) and are required to be independent with respect to the Company in accordance with the U.S. federal securities laws and the applicable rules and regulations of the Securities and Exchange Commission and the PCAOB.
We conducted our audits in accordance with the standards of the PCAOB. Those standards require that we plan and perform the audit to obtain reasonable assurance about whether the consolidated financial statements are free of material misstatement, whether due to error or fraud. The Company is not required to have, nor were we engaged to perform, an audit of its internal control over financial reporting. As part of our audits, we are required to obtain an understanding of internal control over financial reporting, but not for the purpose of expressing an opinion on the effectiveness of the Company’s internal control over financial reporting. Accordingly, we express no such opinion.
Our audits included performing procedures to assess the risks of material misstatement of the consolidated financial statements, whether due to error or fraud, and performing procedures that respond to those risks. Such procedures included examining, on a test basis, evidence regarding the amounts and disclosures in the consolidated financial statements. Our audits also included evaluating the accounting principles used and significant estimates made by management, as well as evaluating the overall presentation of the consolidated financial statements. We believe that our audits provide a reasonable basis for our opinion.
Critical Audit Matters
Critical audit matters are matters arising from the current period audit of the financial statements that were communicated or required to be communicated to the audit committee and that: (1) relate to accounts or disclosures that are material to the financial statements and (2) involved our especially challenging, subjective, or complex judgments. The communication of critical audit matters does not alter in any way our opinion on the consolidated financial statements, taken as a whole, and we are not, by communicating the critical audit matters below, providing separate opinions on the critical audit matters or on the accounts or disclosures to which they relate.
Revenue Recognition — Refer to Note 2 to the financial statements
Critical Audit Matter Description
The Company generates revenue primarily from the manufacture, license, service and sale of its products. The Company’s contracts with customers may include multiple performance obligations. The Company enters into contracts that can include various combinations of products and services, which are primarily distinct and accounted for as separate performance obligations. Management applies significant judgment in identifying and accounting for each performance obligation as a result of evaluating terms and conditions in contracts. The principal considerations for our determination that performing procedures relating to revenue recognition is a critical audit matter include the following:
●
Determination of whether products and services are considered distinct performance obligations that should be accounted for separately versus together.
●
The pattern of delivery (i.e., timing of when revenue is recognized) for each distinct performance obligation.
●
Identification of specific or key contract terms that may impact the timing and amount of revenue recognized.
Given these factors and due to the volume of transactions, the related audit effort in evaluating management’s judgments in determining revenue recognition for these customer agreements was extensive and required a high degree of auditor judgment.
How the Critical Audit Matter Was Addressed in the Audit
Addressing the matter involved performing procedures and evaluating audit evidence in connection with forming our overall opinion on the consolidated financial statements. The primary procedures we performed to address this critical audit matter included the following:
●
Considering the effectiveness of controls relating to the revenue recognition process, including controls over the identification and evaluation of the contractual terms and conditions that impact the identification of performance obligations and determination of revenue recognition.
●
Testing the completeness and accuracy of management’s identification and evaluation of the terms and conditions in contracts with customers by examining customer agreements on a test basis including reviewing and evaluating management’s identification of performance obligations.
WOLINETZ, LAFAZAN & COMPANY, P.C.
We have served as the Company's auditor since 2007.2004.
Rockville Centre, NY
April 1, 2019
TOMI ENVIRONMENTAL SOLUTIONS, INC.
CONSOLIDATED BALANCE SHEET
| ASSETS | | |
| Current Assets: | | |
| Cash and Cash Equivalents | $2,004,938 | $4,550,003 |
| Accounts Receivable - net | 2,145,622 | 1,835,949 |
| Inventories (Note 3) | 2,682,014 | 3,518,884 |
| Deposits | 109,441 | - |
| Prepaid Expenses | 301,797 | 270,419 |
| Total Current Assets | 7,243,812 | 10,175,255 |
| | | |
| Property and Equipment – net (Note 4) | 1,588,591 | 712,822 |
| | | |
| Other Assets: | | |
| Intangible Assets – net (Note 5) | 1,235,816 | 1,548,532 |
| Security Deposits | 11,395 | 4,700 |
| Total Other Assets | 1,247,211 | 1,553,232 |
| Total Assets | $10,079,614 | $12,441,309 |
| | | |
| LIABILITIES AND SHAREHOLDERS’ EQUITY | | |
| | | |
| Current Liabilities: | | |
| Accounts Payable | $1,133,649 | $751,730 |
| Accrued Expenses and Other Current Liabilities (Note 11) | 415,199 | 267,136 |
| Accrued Officers Compensation | 70,000 | - |
| Accrued Interest (Note 6) | 66,667 | 80,000 |
| Customer Deposits | 1,486 | 3,062 |
| Deferred Rent | 13,215 | 781 |
| Total Current Liabilities | 1,700,216 | 1,102,709 |
| | | |
| Long-Term Liabilities: | | |
| Deferred Rent and Tenant Improvement Allowances | 401,734 | - |
| Convertible Notes Payable, net of discount of $17,534 and $55,625 | | |
| at December 31, 2018 and 2017, respectively (Note 6) | 4,982,466 | 5,944,375 |
| Total Long-Term Liabilities | 5,384,200 | 5,944,375 |
| Total Liabilities | 7,084,416 | 7,047,084 |
| | | |
| Commitments and Contingencies | - | - |
| | | |
| Shareholders’ Equity: | | |
| Cumulative Convertible Series A Preferred Stock; | | |
| par value $0.01 per share, 1,000,000 shares authorized; 510,000 shares issued | | |
| and outstanding at December 31, 2018 and December 31, 2017 | 5,100 | 5,100 |
| Cumulative Convertible Series B Preferred Stock; $1,000 stated value; | | |
| 7.5% Cumulative dividend; 4,000 shares authorized; none issued | | |
| and outstanding at December 31, 2018 and December 31, 2017 | - | - |
| Common stock; par value $0.01 per share, 200,000,000 shares authorized; | | |
| 124,290,418 and 122,049,958 shares issued and outstanding | | |
| at December 31, 2018 and December 31, 2017, respectively. | 1,242,904 | 1,220,499 |
| Additional Paid-In Capital | 42,948,705 | 42,139,675 |
| Accumulated Deficit | (41,201,511) | (37,971,049) |
| Total Shareholders’ Equity | 2,995,198 | 5,394,225 |
| Total Liabilities and Shareholders’ Equity | $10,079,614 | $12,441,309 |
The accompanying notes are an integral part of the consolidated financial statements.
TOMI ENVIRONMENTAL SOLUTIONS, INC.
CONSOLIDATED STATEMENT OF OPERATIONS
| | |
| | |
| | | |
| | | |
| Sales, net | $5,584,612 | $4,993,668 |
| Cost of Sales | 2,467,114 | 1,927,773 |
| Gross Profit | 3,117,498 | 3,065,895 |
| | | |
| Operating Expenses: | | |
| Professional Fees | 329,674 | 876,880 |
| Depreciation and Amortization | 634,671 | 607,127 |
| Selling Expenses | 1,360,430 | 1,256,465 |
| Research and Development | 916,003 | 454,089 |
| Equity Compensation Expense (Note 7) | 77,242 | 649,348 |
| Consulting Fees | 140,858 | 210,538 |
| General and Administrative | 2,728,840 | 2,774,916 |
| Other | - | (319,388) |
| Total Operating Expenses | 6,187,718 | 6,509,976 |
| Loss from Operations | (3,070,219) | (3,444,081) |
| | | |
| Other Income (Expense): | | |
| Gain on Redemption of Convertible Note | 150,000 | - |
| Amortization of Debt Discounts | (38,091) | (6,279) |
| Induced Conversion Costs | (57,201) | - |
| Interest Income | 6,928 | 1,800 |
| Interest Expense | (221,878) | (191,256) |
| Total Other Income (Expense) | (160,242) | (195,735) |
| | | |
| Net Loss | $(3,230,462) | $(3,639,815) |
| | | |
| Loss Per Common Share | | |
| Basic and Diluted | $(0.03) | $(0.03) |
| | | |
| | | |
| Basic and Diluted Weighted Average Common Shares Outstanding | 123,574,672 | 121,372,605 |
| | | |
The accompanying notes are an integral part of the consolidated financial statements.
TOMI ENVIRONMENTAL SOLUTIONS, INC.
CONSOLIDATED STATEMENT OF SHAREHOLDERS’ EQUITY
FOR THE YEARS ENDED DECEMBER 31, 2018 AND 2017
| | | | | |
| | | | | | | | |
| | | | | | | | |
| Balance at December 31, 2016 | 510,000 | $5,100 | 120,825,134 | $1,208,252 | $41,367,946 | $(34,331,234) | $8,250,064 |
| | | | | | | | |
| Equity Compensation Expense | | | | | 635,223 | | 635,223 |
| Common stock issued for services provided | | | 249,824 | 2,498 | 35,602 | | 38,100 |
| Warrants exercised | | | 975,000 | 9,750 | 39,000 | | 48,750 |
| Warrants issued as part of debt private placement | | | | | 61,904 | | 61,904 |
| Net Loss for the year ended December 31, 2017 | | | | | | (3,639,814) | (3,639,814) |
| | | | | | | | |
| Balance at December 31, 2017 | 510,000 | 5,100 | 122,049,958 | 1,220,499 | 42,139,675 | (37,971,049) | 5,394,225 |
| | | | | | | | |
| Equity Compensation Expense | | | | | 31,522 | | 31,522 |
| Common Stock Issued for Services Provided | | | 362,500 | 3,625 | 33,875 | | 37,500 |
| Conversion of Notes Payable and Accrued Interest into Common Stock | | | 1,877,960 | 18,780 | 686,432 | | 705,212 |
| Induced Conversion Costs | | | | | 57,201 | | 57,201 |
| Net Loss for the year ended December 31, 2018 | | | | | | (3,230,462) | (3,230,462) |
| Balance at December 31, 2018 | 510,000 | $5,100 | 124,290,418 | $1,242,904 | $42,948,705 | $(41,201,511) | $2,995,198 |
The accompanying notes are an integral part of the consolidated financial statements.March 30, 2021
TOMI ENVIRONMENTAL SOLUTIONS, INC.
CONSOLIDATED BALANCE SHEET | ASSETS | | |
| | | |
| Current Assets: | | |
| Cash and Cash Equivalents | $5,198,842 | $897,223 |
| Accounts Receivable - net | 3,716,701 | 1,494,658 |
| Other Receivables | 198,951 | - |
| Inventories (Note 3) | 3,781,515 | 2,315,214 |
| Vendor Deposits (Note 4) | 388,712 | 141,052 |
| Prepaid Expenses | 421,305 | 187,664 |
| Total Current Assets | 13,706,027 | 5,035,811 |
| | | |
| Property and Equipment – net (Note 5) | 1,298,103 | 1,367,864 |
| | | |
| Other Assets: | | |
| Intangible Assets – net (Note 6) | 722,916 | 939,010 |
| Operating Lease - Right of Use Asset (Note 7) | 631,527 | 674,471 |
| Capitalized Software Development Costs - net (Note 8) | 52,377 | 94,278 |
| Other Assets | 358,935 | 114,033 |
| Total Other Assets | 1,765,755 | 1,821,792 |
| Total Assets | $16,769,885 | $8,225,467 |
| | | |
| LIABILITIES AND SHAREHOLDERS’ EQUITY | | |
| | | |
| Current Liabilities: | | |
| Accounts Payable | $1,501,469 | $713,222 |
| Accrued Expenses and Other Current Liabilities (Note 14) | 501,849 | 450,112 |
| Accrued Interest (Note 10) | - | 66,667 |
| Customer Deposits | 118,880 | - |
| Current Portion of Long-Term Operating Lease | 81,223 | 71,510 |
| Convertible Notes Payable, net of discount of $0 | | |
| at December 31, 2019 (Note 10) | - | 5,000,000 |
| Total Current Liabilities | 2,203,421 | 6,301,511 |
| | | |
| Long-Term Liabilities: | | |
| Loan Payable (Note 16) | 410,700 | - |
| Long-Term Operating Lease, Net of Current Portion (Note 7) | 953,190 | 1,034,413 |
| Total Long-Term Liabilities | 1,363,890 | 1,034,413 |
| Total Liabilities | 3,567,311 | 7,335,924 |
| | | |
| Commitments and Contingencies | - | - |
| | | |
| Shareholders’ Equity: | | |
| Cumulative Convertible Series A Preferred Stock; | | |
| par value $0.01 per share, 1,000,000 shares authorized; 63,750 shares issued | | |
| and outstanding at December 31, 2020 and December 31, 2019 | 638 | 638 |
| Cumulative Convertible Series B Preferred Stock; $1,000 stated value; | | |
| 7.5% Cumulative dividend; 4,000 shares authorized; none issued | | |
| and outstanding at December 31, 2020 and December 31, 2019 | - | - |
| Common stock; par value $0.01 per share, 250,000,000 shares authorized; | | |
| 16,761,513 and 15,587,552 shares issued and outstanding | | |
| at December 31, 2020 and December 31, 2019, respectively. | 167,615 | 155,875 |
| Additional Paid-In Capital | 52,142,399 | 44,232,274 |
| Accumulated Deficit | (39,108,078) | (43,499,244) |
| Total Shareholders’ Equity | 13,202,574 | 889,543 |
| Total Liabilities and Shareholders’ Equity | $16,769,885 | $8,225,467 |
| (1) Share amounts with respect to the common stock and Convertible Series A Preferred Stock have been retroactively restated to reflect the reverse |
| split thereof, which was effected as of the close of business on September 10, 2020. Refer to Note 11—Equity for further information. |
| | | |
| The accompanying notes are an integral part of the consolidated financial statements. |
TOMI ENVIRONMENTAL SOLUTIONS, INC.
CONSOLIDATED STATEMENT OF CASH FLOWSOPERATIONS
| | |
| | |
| | | |
| Cash Flow From Operating Activities: | | |
| Net Loss | $(3,230,462) | $(3,639,814) |
| Adjustments to Reconcile Net Loss to | | |
| Net Cash Used In Operating Activities: | | |
| Depreciation and Amortization | 634,671 | 607,127 |
| Amortization of Debt Discount | 38,091 | 6,279 |
| Equity Compensation Expense | 31,522 | 635,223 |
| Value of Equity Issued for Services | 37,500 | 38,100 |
| Induced Conversion Costs | 57,201 | - |
| Reserve for Bad Debt | (200,000) | 200,000 |
| Inventory Reserve | 100,000 | - |
| Gain on Redemption of Convertible Note | (150,000) | - |
| Changes in Operating Assets and Liabilities: | | |
| Decrease (Increase) in: | | |
| Accounts Receivable | (109,673) | (514,572) |
| Inventory | 629,023 | 204,622 |
| Prepaid Expenses | (88,170) | (165,971) |
| �� Deposits | (109,441) | 147,010 |
| Security Deposits | (6,695) | - |
| Increase (Decrease) in: | | |
| Accounts Payable | 381,919 | 15,851 |
| Accrued Expenses | 148,063 | (11,277) |
| Accrued Interest | (8,122) | 80,000 |
| Accrued Officer Compensation | 70,000 | - |
| Deferred Rent | 9,168 | (7,760) |
| Customer Deposits | (1,576) | (27,058) |
| Net Cash Used in Operating Activities | (1,766,980) | (2,432,241) |
| | | |
| Cash Flow From Investing Activities: | | |
| Purchase of Property and Equipment | (628,085) | (14,829) |
| Net Cash Used in Investing Activities | (628,085) | (14,829) |
| | |
| | |
| | | |
| | | |
| Sales, net | $25,027,637 | $6,347,160 |
| Cost of Sales | 9,985,046 | 2,433,243 |
| Gross Profit | 15,042,591 | 3,913,917 |
| | | |
| Operating Expenses: | | |
| Professional Fees | 681,377 | 363,789 |
| Depreciation and Amortization | 719,760 | 716,165 |
| Selling Expenses | 1,247,444 | 1,654,564 |
| Research and Development | 455,046 | 340,582 |
| Equity Compensation Expense (Note 11) | 3,130,986 | 114,222 |
| Consulting Fees | 327,232 | 126,693 |
| General and Administrative | 3,971,956 | 2,681,146 |
| Total Operating Expenses | 10,533,802 | 5,997,161 |
| Income (loss) from Operations | 4,508,789 | (2,083,244) |
| | | |
| Other Income (Expense): | | |
| Amortization of Debt Discounts | - | (17,534) |
| Interest Income | 2,915 | 3,045 |
| Interest Expense | (43,538) | (200,000) |
| Total Other Income (Expense) | (40,623) | (214,489) |
| | | |
| Income (loss) before income taxes | 4,468,166 | (2,297,733) |
| Provision for Income Taxes (Note 17) | 77,000 | - |
| Net Income (loss) | $4,391,166 | $(2,297,733) |
| | | |
| Net income (loss) Per Common Share | | |
| Basic | $0.27 | $(0.15) |
| Diluted | $0.23 | $(0.15) |
| | | |
| Basic Weighted Average Common Shares Outstanding | 16,512,126 | 15,586,258 |
| Diluted Weighted Average Common Shares Outstanding | 18,757,509 | 15,586,258 |
| (1) Share amounts with respect to the common stock and Convertible Series A Preferred Stock have been retroactively restated to reflect the reverse |
| split thereof, which was effected as of the close of business on September 10, 2020. Refer to Note 11—Equity for further information. |
| | | | | | |
| The accompanying notes are an integral part of the consolidated financial statements. |
TOMI ENVIRONMENTAL SOLUTIONS, INC.
CONSOLIDATED STATEMENT OF SHAREHOLDERS’ EQUITY FOR THE YEARS ENDED DECEMBER 31, 2020 AND 2019(1)
| | | | | | |
| | | | | | | | |
| | | | | | | | |
|
| Balance at December 31, 2018 | 63,750 | $638 | 15,536,302 | $155,363 | $44,040,708 | $(41,201,511) | $2,995,198 |
| | | | | | | | |
| Equity Compensation | | | | | 146,878 | | 146,878 |
| Common Stock Issued for Services Provided | | | 51,250 | 513 | 44,688 | | 45,200 |
| Net Loss for the year ended December 31, 2019 | | | | | | (2,297,733) | (2,297,733) |
| Balance at December 31, 2019 | 63,750 | 638 | 15,587,552 | 155,876 | 44,232,274 | (43,499,244) | 889,543 |
| | | | | | | | |
| Equity Compensation | | | | | 3,158,175 | | 3,158,175 |
| Common Stock Issued for Services Provided | | | 50,500 | 505 | 49,685 | | 50,190 |
| Conversion of Notes Payable into Common Stock | | | 1,041,667 | 10,417 | 4,489,584 | | 4,500,000 |
| Warrants and Options Exercised | | | 79,296 | 793 | 212,707 | | 213,500 |
| Other | | | 2,499 | 25 | (25) | | - |
| Net Income for the year ended December 31, 2020 | | | | | | 4,391,166 | 4,391,166 |
| Balance at December 31, 2020 | 63,750 | $638 | 16,761,514 | $167,614 | $52,142,400 | $(39,108,078) | $13,202,573 |
| (1) Share amounts with respect to the common stock and Convertible Series A Preferred Stock have been retroactively restated to reflect the reverse |
| split thereof, which was effected as of the close of business on September 10, 2020. Refer to Note 11—Equity for further information. |
The accompanying notes are an integral part of the consolidated financial statements. |
TOMI ENVIRONMENTAL SOLUTIONS, INC.
CONSOLIDATED STATEMENT OF CASH FLOWS | | For the Years Ended December 31, |
| | | |
| Cash Flow From Operating Activities: | | |
| Net Income (Loss) | $4,391,166 | $(2,297,733) |
| Adjustments to Reconcile Net Income (Loss) to | | |
| Net Cash Provided by (Used) In Operating Activities: | | |
| Depreciation and Amortization | 719,760 | 716,165 |
| Amortization of Right of Use Asset | 157,315 | 157,315 |
| Amortization of Debt Discount | - | 17,534 |
| Amortization of Software Costs | 41,900 | 31,426 |
| Equity Compensation Expense | 3,130,986 | 114,222 |
| Value of Equity Issued for Services | 50,190 | 45,200 |
| Reserve for Bad Debt | 280,000 | (190,000) |
| Inventory Reserve | (100,000) | - |
| | | |
| Changes in Operating Assets and Liabilities: | | |
| Decrease (Increase) in: | | |
| Accounts Receivable | (2,502,043) | 840,964 |
| Inventory | (1,388,986) | 348,226 |
| Prepaid Expenses | (233,642) | 78,269 |
| Vendor Deposits | (247,660) | (31,611) |
| Other Receivables | (198,951) | - |
| Other Assets | (294,659) | (154,330) |
| Increase (Decrease) in: | | |
| Accounts Payable | 788,247 | (420,427) |
| Accrued Expenses | 78,926 | 67,569 |
| Accrued Interest | (66,667) | - |
| Accrued Officer Compensation | - | (70,000) |
| Customer Deposits | 118,880 | (1,486) |
| Lease Liability | (146,688) | (65,753) |
| | | |
| Net Cash Provided (Used) in Operating Activities | 4,578,076 | (814,451) |
| | | |
| Cash Flow From Investing Activities: | | |
| Capitalized Software Costs | - | (125,704) |
| Capitalized Patent Costs | (111,386) | (21,980) |
| Purchase of Property and Equipment | (289,270) | (145,580) |
| Net Cash (Used) in Investing Activities | (400,655) | (293,264) |
The accompanying notes are an integral part of the consolidated financial statements.
TOMI ENVIRONMENTAL SOLUTIONS, INC.
| TOMI ENVIRONMENTAL SOLUTIONS, INC. |
| CONSOLIDATED STATEMENT OF CASH FLOWS – CONTINUED |
| | |
| | |
| | | |
| Cash Flow From Financing Activities: | | |
| Proceeds from Exercise of Warrants | - | 48,750 |
| Repayment of Principal Balance on Convertible Note | (150,000) | - |
| Proceeds from Convertible Notes | - | 6,000,000 |
| Net Cash Provided (used) by Financing Activities | (150,000) | 6,048,750 |
| Increase (Decrease) In Cash and Cash Equivalents | (2,545,065) | 3,601,679 |
| Cash and Cash Equivalents - Beginning | 4,550,003 | 948,324 |
| Cash and Cash Equivalents – Ending | $2,004,938 | $4,550,003 |
| | | |
| Supplemental Cash Flow Information: | | |
| Cash Paid For Interest | $230,000 | $111,256 |
| Cash Paid for Income Taxes | $800 | $800 |
| Non-Cash Investing and Financing Activities: | | |
| Establishment of discount on convertible debt | $- | $61,904 |
| Transfer of equipment from | | |
| inventory to property and equipment | $107,846 | $323,805 |
| Trademark Costs Reclassified | | |
| to intangible assets, net | $56,792 | $- |
| Establishment of Tenant Improvement Allowance | $405,000 | $- |
| Abandonment of Fully Depreciated | | |
| Property and Equipment | $66,428 | $- |
| Common Stock Issued Upon Conversion of | | |
| Note Payable and Accrued Interest | $705,212 | $- |
| | For the Years Ended December 31, |
| | | |
| Cash Flow From Financing Activities: | | |
Proceeds from Exercise of Warrants and Options
| 213,500 | - |
| Proceeds from Loan Payable | 410,700 | - |
| Repayment of Principal Balance on Convertible Note | (500,000) | - |
Net Cash Provided by Financing Activities: | 124,200 | - |
| Increase (Decrease) In Cash and Cash Equivalents | 4,301,620 | (1,107,715) |
| Cash and Cash Equivalents - Beginning | 897,223 | 2,004,938 |
| Cash and Cash Equivalents – Ending | $5,198,842 | $897,223 |
| | | |
| Supplemental Cash Flow Information: | | |
| Cash Paid For Interest | $107,356 | $200,000 |
| Cash Paid for Income Taxes | $800 | $800 |
| Non-Cash Investing and Financing Activities: | | |
| Accrued Equity Compensation | $27,189 | $32,656 |
| Conversion of Note Payable into Common Stock | $4,500,000 | $- |
| Equipment, net Transferred to and from Inventory | $22,685 | $18,574 |
| Patent and trademark costs reclassified from Other Assets | $49,758 | $51,692 |
The accompanying notes are an integral part of the consolidated financial statements.
TOMI ENVIRONMENTAL SOLUTIONS, INC.
NOTESNOTES TO CONSOLIDATED FINANCIAL STATEMENTS
NOTE 1. DESCRIPTION OF BUSINESS
TOMI Environmental Solutions, Inc., a Florida corporation (“TOMI”, the “Company”, “we”, “our” and “us”) is a global provider of disinfection and decontamination essentials through itsour premier Binary Ionization Technology® (BIT™) platform, under which it manufactures, licenses, serviceswe manufacture, license, service and sells itssell our SteraMist™® brand of products, including SteraMist™SteraMist® BIT™, a hydrogen peroxide-based mist and fog. Our business is organized into five divisions: Healthcare, Life Sciences, TOMI Service Network, Food Safety and Commercial.
Invented under a defense grant in association with the Defense Advanced Research Projects Agency (DARPA) of the U.S. Department of Defense, BIT™ is registered with the U.S. Environmental Protection Agency (“EPA”)(EPA) and uses a low percentage hydrogen peroxide as its only active ingredient to produce a fog composed mostly of a hydroxyl radical (.OH ion), known as ionized Hydrogen Peroxide (“iHP(iHP™”). Represented by the SteraMist™® brand of products, iHP™iHP™ produces a germ-killing aerosol that works like a visual non-caustic gas.
TOMI’sOur products are designed to service a broad spectrum of commercial structures, including, but not limited to, hospitals and medical facilities, bio-safety labs, pharmaceutical facilities, meat and produce processing facilities, universities and research facilities, vivarium labs, all service industries including cruise ships, office buildings, hotel and motel rooms, schools, restaurants, military barracks, police and fire departments, prisons, and athletic facilities. TOMIOur products are also used in single-family homes and multi-unit residences. Additionally, our products have been listed on the EPA’s List N as products that help combat COVID-19 and are actively being used for this purpose.
TOMI’s mission is to help its customers create a healthier world through its product line in its divisions (Healthcare, Life Sciences, TOMI Service Network and Food Safety) and its motto is “innovating for a safer world” for healthcare and life.
NOTE 2. SUMMARY OF SIGNIFICANT ACCOUNTING POLICIES
Principles of Consolidation
The accompanying consolidated financial statements include the accounts of TOMI and its wholly-ownedwholly owned subsidiary, TOMI Environmental Solutions, Inc., a Nevada corporation. All significant intercompany accounts and transactions have been eliminated in consolidation.
Reclassification of Accounts
Certain reclassifications have been made to prior-year comparative financial statements to conform to the current year presentation. These reclassifications had no effect on previously reported results of operations or financial position.
Use of Estimates
The preparation of the consolidated financial statements in conformity with U.S. GAAP requires us to make estimates and assumptions that affect the amounts reported and disclosed in the accompanying consolidated financial statements and the accompanying notes. Actual results could differ materially from these estimates. On an ongoing basis, we evaluate our estimates, including those related to accounts receivable, inventory, fair values of financial instruments, intangible assets, useful lives of intangible assets and property and equipment, fair values of stock-based awards, income taxes, and contingent liabilities, among others. We base our estimates on historical experience and on various other assumptions that are believed to be reasonable, the results of which form the basis for making judgments about the carrying values of our assets and liabilities.
Fair Value Measurements
The authoritative guidance for fair value measurements defines fair value as the exchange price that would be received for an asset or paid to transfer a liability (an exit price) in the principal or the most advantageous market for the asset or liability in an orderly transaction between market participants on the measurement date. Market participants are buyers and sellers in the principal market that are (i) independent, (ii) knowledgeable, (iii) able to transact, and (iv) willing to transact. The guidance describes a fair value hierarchy based on the levels of inputs, of which the first two are considered observable and the last unobservable, that may be used to measure fair value, which are the following:
| Level 1: | Quoted prices in active markets for identical assets or liabilities. |
| |
| Level 2: | Inputs other than Level 1 that are observable, either directly or indirectly, such as quoted prices for similar assets or liabilities; quoted prices in markets that are not active; or other inputs that are observable or corroborated by observable market data orfor substantially the full term of the assets or liabilities. |
| |
| Level 3: | Unobservable inputs that are supported by little or no market activity and that are significant to the value of the assets or liabilities. |
Our financial instruments include cash and cash equivalents, accounts receivable, accounts payable and accrued expenses and convertible debt.expenses. All these items were determined to be Level 1 fair value measurements.
The carrying amounts of cash and cash equivalents, accounts receivable, and accounts payable and accrued expenses approximated fair value because of the short maturity of these instruments. The recorded value of convertible debt approximates its fair value as the terms and rates approximate market rates (See Note 6).
Cash and Cash Equivalents
For purposes of the statement of cash flows, cash and cash equivalents includes cash on hand, held at financial institutions and other liquid investments with original maturities of three months or less. At times, these deposits may be in excess of insured limits.
Accounts Receivable
Our accounts receivable are typically from credit worthy customers or, for certain international customers, are supported by pre-payments. For those customers to whom we extend credit, we perform periodic evaluations of themtheir status and maintain allowances for potential credit losses as deemed necessary. We have a policy of reserving for doubtful accounts based on our best estimate of the amount of potential credit losses in existing accounts receivable. We periodically review our accounts receivable to determine whether an allowance is necessary based on an analysis of past due accounts and other factors that may indicate that the realization of an account may be in doubt. Account balances deemed to be uncollectible are charged to the allowance after all means of collection have been exhausted and the potential for recovery is considered remote. Bad debt expense for the years ended December 31, 20182020 and 20172019 was $96,929$332,027 and $263,882,$32,721, respectively.
At December 31, 20182020 and December 31, 2017,2019, the allowance for doubtful accounts was $300,000$390,000 and $500,000,$110,000, respectively.
As of December 31, 2018, two customers accounted for 37% of accounts receivable. One customer accounted for 13% of net revenues for the year ended December 31, 2018.
As of December 31, 2017, two customers accounted for 24% of accounts receivable. Two customers accounted for 22% of net revenues for the year ended December 31, 2017.
Inventories
Inventories are valued at the lower of cost or market using the first-in, first-out (FIFO) method. Inventories consist primarily of finished goods.goods.
We expense costs to maintain certification to cost of goods sold as incurred.
We review inventory on an ongoing basis, considering factors such as deterioration and obsolescence. We record an allowance for estimated losses when the facts and circumstances indicate that particular inventories willmay not be usable. Our reserve for obsolete inventory was $0 and $100,000 and $0 for the years endedas of December 31, 20182020 and 2017,December 31, 2019, respectively.
Property and Equipment
We account for property and equipment at cost less accumulated depreciation. We compute depreciation using the straight-line method over the estimated useful lives of the assets, generally three to five years. Depreciation for equipment, furniture and fixtures and vehicles commences once placed in service for its intended use. Leasehold improvements are amortized using the straight-line method over the lives of the respective leases or service lives of the improvements, whichever is shorter.
Leases
In February 2016, the FASB issued ASU No. 2016-02 (ASC 842),Leases, to require lessees to recognize all leases, with certain exceptions, on the balance sheet, while recognition on the statement of operations will remain similar to current lease accounting. Subsequently, the FASB issued ASU No. 2018-10,Codification Improvements to Topic 842, Leases, ASU No. 2018-11,Targeted Improvements, ASU No. 2018-20,Narrow-Scope Improvements for Lessors, and ASU 2019-01,Codification Improvements, to clarify and amend the guidance in ASU No. 2016-02. ASC 842 eliminates real estate-specific provisions and modifies certain aspects of lessor accounting. This standard is effective for interim and annual periods beginning after December 15, 2018, with early adoption permitted. We adopted ASC 842 as of January 1, 2019 using the modified retrospective basis with a cumulative effect adjustment as of that date. In addition, we elected the package of practical expedients permitted under the transition guidance within the standard, which allowed us to carry forward the historical determination of contracts as leases, lease classification and not reassess initial direct costs for historical lease arrangements. Accordingly, previously reported financial statements, including footnote disclosures, have not been recast to reflect the application of the standard to all comparative periods presented.
Operating lease assets are included within operating lease right-of-use assets, and the corresponding operating lease liabilities are recorded as current portion of long-term operating lease, and within long-term liabilities as long-term operating lease, net of current portion on our consolidated balance sheet as of December 31, 2020 and December 31, 2019.
We have elected not to present short-term leases on the consolidated balance sheet as these leases have a lease term of 12 months or less at lease inception and do not contain purchase options or renewal terms that we are reasonably certain to exercise. All other lease assets and lease liabilities are recognized based on the present value of lease payments over the lease term at commencement date. Because most of our leases do not provide an implicit rate of return, we used our incremental borrowing rate based on the information available at adoption date in determining the present value of lease payments.
Capitalized Software Development Costs
In accordance with ASC 985-20 regarding the development of software to be sold, leased, or marketed, we expense such costs as they are incurred until technological feasibility has been established, at and after which time those costs are capitalized until the product is available for general release to customers. The periodic expense for the amortization of capitalized software development costs will be included in cost of sales. The periodic expense for the amortization of capitalized software development costs will be included in cost of sales. Amortization expense for the years ended December 31, 2020 and 2019, was $41,900 was $31,426, respectively.
Accounts Payable
As of December 31, 2018, three2020, two vendors accounted for approximately 63%32% of total accounts payable. As of December 31, 2017,2019, one vendor accounted for approximately 45%40% of total accounts payable.
OneFor the year ended December 31, 2020, two vendors accounted for 76% of cost of sales. For the year ended December 31, 2019, one vendor accounted for 70% and 73%72% of cost of sales for the years ended December 31, 2018 and 2017, respectively.sales.
Accrued Warranties
Accrued warranties represent the estimated costs, if any, that will be incurred during the warranty period of our products. We make an estimate ofthe expected costs that willto be incurred by us during the warranty period and charge thatrecord the expense to the consolidated statement of operations at the date of sale. Our manufacturer assumesmanufacturers assume the warranty against product defects for one year from date of sale, which we extend to our customers upon sale of the product. We assume responsibility for product reliability and results. As of December 31, 2018,2020, and 2017,December 31, 2019, our warranty reserve was $68,000 and $30,000, and $5,000, respectively.respectively (See Note 15).
Income Taxes
Deferred income tax assets and liabilities are determined based on differences between the financial statement reporting and tax bases of assets and liabilities and are measured using the enacted tax rates and laws in effect when the differences are expected to reverse. The measurement of deferred income tax assets is reduced, if necessary, by a valuation allowance for any tax benefits that are, on a more likely than not basis, not expected to be realized in accordance with Accounting Standards Codification (“ASC”)(ASC) guidance for income taxes. Net deferred tax benefits have been fully reserved at December 31, 20182020 and 2017.December 31, 2019. The effect on deferred income tax assets and liabilities of a change in tax rates is recognized in the period that such tax rate changes are enacted.
Leases and Tenant Improvement Allowance
For lease agreements that provide for escalating rent payments or free-rent occupancy periods, we recognize rent expense on a straight-line basis over the non-cancelable lease term and option renewal periods where failure to exercise such options would result in an economic penalty in such amount that renewal appears, at the inception of the lease, to be reasonably assured. The lease term commences on the date that the Company takes possession of or controls the physical use of the property. Deferred rent is included in other liabilities on the consolidated balance sheet.
We record landlord allowances and incentives received as deferred rent based on their short-term or long-term nature. These landlord allowances are amortized using the straight-line method over the reasonably assured lease term as a reduction of rent expense. We consider improvements to be a lessor asset if all of the following criteria are met:
●
the lease specifically requires the lessee to make the improvement;
●
the improvement is fairly generic;
●
the improvement increases the fair value of the property to the lessor; and
●
the useful life of the improvement is longer than the lease term.
At December 31, 2018 and 2017 our short term deferred rent was $13,215 and $0, respectively. At December 31, 2018 and 2017, our long term deferred rent and tenant improvement allowances was $401,734 and $0, respectively.
Net LossIncome (Loss) Per Share
Basic net lossincome or (loss) per share is computed by dividing the Company’sour net lossincome or (loss) by the weighted average number of shares of common stock outstanding during the period presented. Diluted lossincome or (loss) per share is based on the treasury stock method and includes the effect from potential issuance of shares of common stock, such as shares issuable pursuant to the exercise of options and warrants and conversions of preferred stock or debentures.
Potentially dilutive securities as of December 31, 20182020 consisted of 9,259,250 shares of common stock from convertible debentures, 26,550,6112,049,133 shares of common stock issuable upon exercise of outstanding warrants, 320,000132,500 shares of common stock issuable upon outstanding options and 510,00063,750 shares of common stock issuable upon conversion of outstanding shares of Preferred A stock (“Convertible Series A Preferred Stock”). Diluted and basic weighted average shares are the same, as potentially dilutive shares are anti-dilutive.
Potentially dilutive securities as of December 31, 20172019 consisted of 11,111,1001,157,406 shares of common stock from convertible debentures, 35,501,4112,155,065 shares of common stock issuable upon exercise of outstanding warrants, 200,00077,500 shares of common stock issuable upon outstanding options and 510,00063,750 shares of common stock issuable upon conversion of outstanding shares of Preferred A stock (“Convertible Series A Preferred Stock”). Diluted and basic weighted average shares are the same, as potentially dilutive shares are anti-dilutive.
Diluted net lossincome or (loss) per share is computed similarly to basic net lossincome or (loss) per share except that the denominator is increased to include the number of additional shares of common stock that would have been outstanding if the potential shares of common stock had been issued and if such additional shares were dilutive. Options, warrants, preferred stock and shares associated with the conversion of debt to purchase approximately 36.62.2 million and 47.33.5 million shares of common stock were outstanding at December 31, 20182020 and 2017,2019, respectively, but were excluded from the computation of diluted net loss per share at December 31, 2019 due to the anti-dilutive effect on net loss per share.
| | For the Year Ended December 31, |
| | | |
| | | |
| Net loss | $(3,230,462) | $(3,639,815) |
| Adjustments for convertible debt - as converted | | |
| Interest on convertible debt | 221,878 | 191,256 |
| Amortization of debt discount on convertible debt | 38,091 | 6,279 |
| Net loss attributable to common shareholders | $(2,970,473) | $(3,442,279) |
| Weighted average number of shares of common stock outstanding: | | |
| Basic and diluted | 123,574,672 | 121,372,605 |
| Net loss attributable to common shareholders per share: | | |
| Basic and diluted | $(0.02) | $(0.03) |
| | | |
| | For the Years Ended December 31, |
| | | |
| Net Income (Loss) | $4,391,166 | $(2,297,733) |
| Adjustments for convertible debt - as converted | | |
| Interest on convertible debt | 40,689 | 200,000 |
| Amortization of debt discount on convertible debt | - | 17,534 |
| Net income (loss) attributable to common shareholders | $4,431,855 | $(2,080,199) |
| Weighted average number of shares of common stock outstanding: | | |
| Basic | 16,512,126 | 15,586,258 |
| Diluted | 18,757,509 | 15,586,258 |
| Net income (loss) attributable to common shareholders per share: | | |
| Basic | $0.27 | $(0.13) |
| Diluted | $0.24 | $(0.13) |
The following provides a reconciliation of the shares used in calculating the per share amounts for the periods presented:
| | For the Years Ended December 31, |
| | | |
| Numerator: | | |
| Net Income (Loss) | $4,391,166 | $(2,297,733) |
| Denominator: | | |
Basic weighted-average shares
| 16,512,126 | 15, 586,258 |
| Effect of dilutive securities | | |
| Warrants | 2,049,133 | - |
| Convertible Debt | - | - |
| Options | 132,500 | - |
| Preferred Stock | 63,750 | - |
| Diluted Weighted Average Shares | 18,757,509 | 15, 586,258 |
| | | |
| Net Income (Loss) Per Common Share: | | |
| Basic | $0.27 | $(0.15) |
| Diluted | $0.23 | $(0.15) |
Note: Warrants, options and preferred stock for the years ended December 31, 2019 are not included in the computation of diluted weighted average shares as such inclusion would be anti-dilutive.
| Income (loss) from Operations Data: | | |
| | | |
| Income (Loss) from Operations | $4,508,789 | $(2,083,244) |
| | | |
| Basic and Diluted Weighted Average Shares | | �� |
| Basic | 16,512,126 | 15, 586,258 |
| Diluted | 18,757,509 | 15, 586,258 |
| Basic and Diluted Income (loss) Per Common Share | | |
| Basic | $0.27 | $(0.13) |
| Diluted | $0.24 | $(0.13) |
Revenue Recognition
We recognize revenue in accordance with Financial Accounting Standards Board (“FASB”)(FASB) Accounting Standards Update (“ASU”)(ASU) No. 2014-09,Revenue from Contracts with Customers (Topic 606),. We recognize revenue when therewe transfer promised goods or services to customers in an amount that reflects the consideration to which we expect to be entitled in exchange for those goods or services. To determine revenue recognition for contracts with customers we perform the following five steps: (i) identify the contract(s) with a customer; (ii) identify the performance obligation(s) in the contract; (iii) determine the transaction price; (iv) allocate the transaction price to the performance obligation(s) in the contract; and (v) recognize revenue when (or as) we satisfy the performance obligation(s). At contract inception, we assess the goods or services promised within each contract, assess whether each promised good or service is persuasive evidencedistinct and identify those that an arrangement exists, titleare performance obligations.
We must use judgment to determine: a) the number of performance obligations based on the determination under step (ii) above and riskwhether those performance obligations are distinct from other performance obligations in the contract; b) the transaction price under step (iii) above; and c) the stand-alone selling price for each performance obligation identified in the contract for the allocation of loss have passed, delivery has occurred, or the services have been rendered, the salestransaction price is fixed or determinable and collection of the related receivable is reasonably assured. in step (iv) above.
Title and risk of loss generally pass to our customers upon shipment. Our Customers include end users as well as dealers and distributors who market and sell our products. Our revenue is not contingent upon resale by the dealer or distributor, and we have no further obligations related to bringing about resale. Shipping and handling costs charged to customers are included in Product Revenues. The associated expenses are treated as fulfillment costs and are included in Cost of Revenues. Revenues are reported net of sales taxes collected from Customers.
Disaggregation of Revenue
The following table presents our revenues disaggregated by revenue source.
Net Revenue
Product and Service Revenue
| | For the year ended December 31, | For the Years Ended December 31, |
| | | | | |
| SteraMist Product | $4,652,000 | $4,097,000 | $22,971,000 | $4,999,000 |
| Service and Training | 933,000 | 897,000 | 2,057,000 | 1,348,000 |
| Total | $5,585,000 | $4,994,000 | $25,028,000 | $6,347,000 |
Revenue by Geographic Region
| | For the year ended December 31, | For the Years Ended December 31, |
| | | | | |
| United States | $4,197,000 | $3,495,000 | $18,367,000 | $5,002,000 |
| International | 1,388,000 | 1,499,000 | 6,661,000 | 1,345,000 |
| Total | $5,585,000 | $4,994,000 | $25,028,000 | $6,347,000 |
Product revenue includes sales from our standard and customized equipment, solution and accessories sold with our equipment. Revenue is recognized upon transfer of control of promised products to customers in an amount that reflects the consideration we expect to receive in exchange for those products or services.products.
Service and training revenue include sales from our high-level decontamination and service engagements, validation of our equipment and technology and customer training. Service revenue is recognized as the agreed upon services are rendered to our customers in an amount that reflects the consideration we expect to receive in exchange for those services.
Costs to Obtain a Contract with a Customer
We apply a practical expedient to expense costs as incurred for costs to obtain a contract with a customer when the amortization period would have been one year or less. We generally expense sales commissions when incurred because the amortization period would have been one year or less. These costs are recorded within sales and marketingselling expenses. These costs include our internal sales force compensation program and certain partner sales incentive programs as we have determined annual compensation is commensurate with annual sales activities.
Contract Balances
As of December 31, 2018,2020, and December 31, 20172019 we did not have any unsatisfied performance obligations for (i) contracts with an original expected length of one year or less and (ii) contracts for which we recognize revenue at the amount to which we have the right to invoice for services performed.
Arrangements with Multiple Performance Obligations
Our contracts with customers may include multiple performance obligations. We enter into contracts that can include various combinations of products and services, which are primarily distinct and accounted for as separate performance obligations.
Significant Judgments
Our contracts with customers for products and services often dictate the terms and conditions of when the control of the promised products or services is transferred to the customer and the amount of consideration to be received in exchange for the products and services.
Equity Compensation Expense
We account for equity compensation expense in accordance with FASB ASC 718, “Compensation—Stock Compensation.” Under the provisions of FASB ASC 718, equity compensation expense cost is estimated at the grant date based on the award’s fair value and is recognized as expense over the requisite service period.value.
On July 7, 2017, our shareholders approved the 2016 Equity Incentive Plan, (the “2016 Plan”).or the 2016 Plan. The 2016 Plan authorizes the grant of stock options, stock appreciation rights, restricted stock, restricted stock units and performance units/shares. Up to 5,000,0002,000,000 shares of common stock are authorized for issuance under the 2016 Plan. Shares issued under the 2016 Plan may be either authorized but unissued shares, treasury shares, or any combination thereof. Provisions in the 2016 Plan permit the reuse or reissuance by the 2016 Plan of shares of common stock for numerous reasons, including, but not limited to, shares of common stock underlying canceled, expired, or forfeited awards of stock-based compensation and stock appreciation rights paid out in the form of cash. Equity compensation expense will typically be awarded in consideration for the future performance of services to us. All recipients of awards under the 2016 Plan are required to enter into award agreements with the Companyus at the time of the award; awards under the 2016 Plan are expressly conditioned upon such agreements. For the year ended December 31, 2017, the Company2020 and 2019, we issued 200,00050,000 and 50,000 shares of common stock, out of the 2016 Plan. In addition, for the year ended December 31, 2018, the Company issued 300,000 shares of common stockrespectively, out of the 2016 Plan.
Concentrations of Credit Risk
Financial instruments that potentially subject us to significant concentrations of credit risk consist principally of cash and cash equivalents. We maintain cash balances at financial institutions which exceed the current Federal Deposit Insurance Corporation limit of $250,000 at times during the year.
Long-Lived Assets Including Acquired Intangible Assets
We assess long-lived assets for potential impairments at the end of each year, or during the year if an event or other circumstance indicates that we may not be able to recover the carrying amount of the asset. In evaluating long-lived assets for impairment, we measure recoverability of these assets by comparing the carrying amounts to the future undiscounted cash flows the assets are expected to generate. If our long-lived assets are considered to be impaired, the impairment to be recognized equals the amount by which the carrying value of the asset exceeds its fair market value. We base the calculations of the estimated fair value of our long-lived assets on the income approach. For the income approach, we use an internally developed discounted cash flow model that includes, among others, the following assumptions: projections of revenues and expenses and related cash flows based on assumed long-term growth rates and demand trends; expected future investments to grow new units; and estimated discount rates. We base these assumptions on our historical data and experience, industry projections, micro and macro general economic condition projections, and our expectations. We had no long-lived asset impairment charges for the years ended December 31, 20182020 and 2017.2019.
Advertising and Promotional Expenses
We expense advertising costs in the period in which they are incurred. Advertising and promotional expenses included in selling expenses for the years ended December 31, 20182020 and 2017,2019 were approximately $204,000$276,000 and $66,000,$144,000, respectively.
Research and Development Expenses
We expense research and development expenses in the period in which they are incurred. For the years ended December 31, 20182020 and 2017,2019, research and development expenses were approximately $916,000$455,000 and $454,000,$341,000, respectively.
Shipping and Handling Costs
We include shipping and handling costs relating to the delivery of products directly from vendors to the Company in cost of sales. Other shipping and handling costs, including third-party delivery costs relating to the delivery of products to customers, are classified as a general and administrative expense.Shipping and handling costs included in general and administrative expense were approximately $206,000 and $119,000 for the years ended December 31, 2018 and 2017, respectively.
Business Segments
We currently have one reportable business segment due to the fact that we derive our revenue primarily from one product. A breakdown of revenue is presented in “Revenue Recognition” in Note 2 above.
Recent Accounting Pronouncements
In May 2014, the FASB issued Accounting Standards Update (“ASU”) No. 2014-09, Revenue from Contracts with Customers, to replace the existing revenue recognition criteria for contracts with customers. In August 2015,2018, the FASB issued ASU No. 2015-14, Deferral of2018-15, “Intangibles-Goodwill and Other-Internal-Use Software (Topic 350): Customer’s Accounting for Implementation Costs Incurred in a Cloud Computing Arrangement That is a Service Contract.” This new guidance aligns the Effective Date,requirements for capitalizing implementation costs incurred in a hosting arrangement that is a service contract with the requirements for capitalizing implementation costs incurred to defer thedevelop or obtain internal-use software. This new guidance is effective date of ASU No. 2014-09 to interim and annual periodson a prospective or retrospective basis beginning after December 15, 2017. We adopted ASUs No. 2014-09 and 2015-14 on January 1, 2018 on a modified retrospective basis, which did not impact our beginning accumulated deficit and additional paid-in capital.
In February 2016, the FASB issued ASU No. 2016-02, Leases, to require lessees to recognize all leases, with limited exceptions, on the balance sheet, while recognition on the statement of operations will remain similar to current lease accounting. The ASU also eliminates real estate-specific provisions and modifies certain aspects of lessor accounting. Subsequently, the FASB issued ASU No. 2018-10, Codification Improvements to Topic 842, ASU No. 2018-11, Targeted Improvements, and ASU No. 2018-20, Narrow-Scope Improvements for Lessors, to clarify and amend the guidance in ASU No. 2016-02. The ASUs are effective for interim and annual periods beginning after December 15, 2018,2020, with early adoption permitted. We willelected to adopt the ASUs on January 1, 2019this guidance early, in 2020 on a modified retrospective basis through a cumulative adjustment to our beginning accumulated deficit balance. Prior comparative periods willprospective basis. The new guidance did not be restated under this method, and we will adopt all available practical expedients, as applicable. Upon adoption, our consolidated balance sheet will include an overall increase in assets of approximately $800,000 and an increase in liabilities of approximately $800,000. The ASUs are not expected to have a material impact on our beginning accumulated deficit, consolidated statement of operations or the consolidated statement of cash flows.
In March 2016, the FASB issued ASU No. 2016-09, Improvements to Employee Share-Based Payment Accounting, to simplify the accounting for the income tax effects from share-based compensation, the accounting for forfeitures and the accounting for statutory income tax withholding, among others. In particular, ASU No. 2016-09 requires all income tax effects from share-based compensation to be recognized in the consolidated statement of operations when the awards vest or are settled, permits accounting for forfeitures as they occur, and permits a higher level of statutory income tax withholding without triggering liability accounting. Adoption of ASU No. 2016-09 is modified retrospective, retrospective and prospective, depending on the specific provision being adopted. We adopted ASU No. 2016-09 on January 1, 2017, which did not impact our beginning accumulated deficit and additional paid-in capital.
In January 2017, the FASB issued ASU No. 2017-04, Simplifying the Test for Goodwill Impairment, to simplify the test for goodwill impairment by removing Step 2. An entity will, therefore, perform the goodwill impairment test by comparing the fair value of a reporting unit with its carrying amount, recognizing an impairment charge for the amount by which the carrying amount exceeds the fair value, not to exceed the total amount of goodwill allocated to the reporting unit. An entity still has the option to perform a qualitative assessment to determine if the quantitative impairment test is necessary. ASU No. 2017-04 is effective for interim and annual periods beginning after December 15, 2019, with early adoption permitted for interim or annual goodwill impairment tests performed on testing dates after January 1, 2017. Adoption of ASU No. 2017-04 is prospective.
In May 2017, the FASB issued ASU No. 2017-09, Scope of Modification Accounting, to provide guidance on which changes to the terms or conditions of a share-based payment award require an entity to apply modification accounting. ASU No. 2017-09 is effective for interim and annual periods beginning after December 15, 2017, with early adoption permitted. Adoption of ASU No. 2017-09 is prospective. We adopted ASU No. 2017-09 on January 1, 2018, which did not impact our consolidated financial statements upon adoption.Consolidated Financial Statements.
NOTE 3. INVENTORIES
| Inventories consist of the following at: | |
| | | |
| | | |
| Finished goods | $2,782,014 | $3,518,884 |
| Inventory Reserve | (100,000) | - |
| | $2,682,014 | $3,518,884 |
| | | |
| Finished goods | $3,404,025 | $2,364,786 |
| Raw Materials | 377,490 | 50,428 |
| Inventory Reserve | - | (100,000) |
| | $3,781,515 | $2,315,214 |
NOTE 4. VENDOR DEPOSITS
On December 31, 2020 and December 31, 2019, we maintained vendor deposits of $388,712 and $141,052, respectively, for open purchase orders for inventory.
NOTE 4.5. PROPERTY AND EQUIPMENT
Property and equipment consist of the following at:
| | | |
| | | | | |
| Furniture and fixtures | $277,976 | $91,216 | $357,236 |
| Equipment | 1,300,139 | 1,192,293 | 1,580,743 | 1,355,014 |
| Vehicles | 60,703 | 56,410 | 60,703 |
| Computer and software | 143,579 | 113,319 | 203,704 | 166,598 |
| Leasehold improvements | 355,898 | 15,554 | 386,120 | 362,898 |
| Tenant Improvement Allowance | 405,000 | - | 405,000 |
| | 2,543,295 | 1,468,792 | 2,993,507 | 2,707,449 |
| Less: Accumulated depreciation | 954,704 | 755,969 | 1,695,404 | 1,339,585 |
| | $1,588,591 | $712,822 | $1,298,103 | $1,367,864 |
For the years ended December 31, 20182020 and 2017,2019, depreciation was $265,163$342,523 and $237,619,$345,687, respectively. For the years ended December 31, 2020 and 2019, amortization of tenant improvement allowance was $39,194 and was recorded as lease expense and included within general and administrative expense on the consolidated statement of operations.
NOTE 5.6. INTANGIBLE ASSETS
Intangible assets consist of patents and trademarks related to our Binary Ionization Technology. We amortize the patents over the estimated remaining lives of the related patents. The trademarks have an indefinite life. Amortization expense was $369,508$377,237 and $369,508$370,478 for the years ended December 31, 20182020 and 2017,2019, respectively.
Definite life intangible assets consist of the following:
| | | | |
| | | | |
| Intellectual Property and Patents | $2,848,300 | $3,000,012 | $2,906,507 |
| Less: Accumulated Amortization | 2,109,276 | 1,739,768 | 2,856,991 | 2,479,754 |
| Intangible Assets, net | $739,024 | $1,108,532 | $143,021 | $426,753 |
Indefinite life intangible assets consist of the following:
| Trademarks | $496,792 | $440,000 | 579,895 | 512,257 |
| | | |
| Total Intangible Assets, net | $1,235,816 | $1,548,532 | $722,916 | $939,010 |
Approximate future amortization is as follows:
Year Ended:
| |
| |
| December 31, 2021 | $10,000 |
| December 31, 2022 | 10,000 |
| December 31, 2023 | 10,000 |
| December 31, 2024 | 10,000 |
| December 31, 2025 | 10,000 |
Thereafter
| 93,000 |
| $143,000 |
NOTE 7. LEASES
In April 2018, we entered into a 10-year lease agreement for a new 9,000-square-foot facility that contains office, warehouse, lab and research and development space in Frederick, Maryland. The lease agreement was scheduled to commence on December 1, 2018 or when the property was ready for occupancy. The agreement provided for annual rent of $143,460, an escalation clause that increases the rent 3% year over year, a landlord tenant improvement allowance of $405,000 and additional landlord work as discussed in the lease agreement. We took occupancy of the property on December 17, 2018 and the lease was amended in March 2019 to provide for a 4-month rent holiday and a commencement date of April 1, 2019. Lease expense for operating lease payments is recognized on a straight-line basis over the next five yearslease term.
The balances for our operating lease where we are the lessee are presented as follows within our consolidated balance sheet:
| Operating leases: | | |
| Assets: | | |
| Operating lease right-of-use asset | $631,527 | $674,471 |
Liabilities: | | |
| Current Portion of Long-Term Operating Lease | $81,223 | $71,510 |
| Long-Term Operating Lease, Net of Current Portion | 953,190 | 1,034,413 |
| | $1,034,413 | $1,105,923 |
The components of lease expense are as follows within our consolidated statement of operations:
| | For the Year Ended December 31, 2020 | For the Year Ended December 31, 2019 |
| | | |
| Operating lease expense | $157,315 | $157,315 |
Other information related to leases where we are the lessee is as follows:
| Twelve Month Period Ending December 31, | |
| | |
| 2019 | $370,000 |
| 2020 | 369,000 |
| 2021 | - |
| 2022 | - |
| 2023 | - |
| | $739,000 |
| | | | |
| Weighted-average remaining lease term: | | | |
| Operating leases | 8.25 years | | 9.25 years |
| | | | |
| Discount rate: | | | |
| Operating leases | 7.00% | | 7.00% |
Supplemental cash flow information related to leases where we are the lessee is as follows:
| | For the Year Ended December 31, 2020 | For the Year Ended December 31, 2019 |
| Cash paid for amounts included in the measurement of lease liabilities: | $146,688 | $65,753 |
As of December 31, 2020, the maturities of our operating lease liability are as follows:
| Year Ended: | |
| December 31, 2021 | $151,088 |
| December 31, 2022 | 155,621 |
| December 31, 2023 | 160,290 |
| December 31, 2024 | 165,098 |
| December 31, 2025 | 170,051 |
| Thereafter | 575,131 |
| Total minimum lease payments | 1,377,280 |
| Less: Interest | 342,867 |
| Present value of lease obligations | 1,034,413 |
| Less: Current portion | 81,223 |
| Long-term portion of lease obligations | $953,190 |
NOTE 8. CAPITALIZED SOFTWARE DEVELOPMENT COSTS
In accordance with ASC 985-20 we capitalized certain software development costs associated with updating our continuing line of product offerings. Capitalized software development costs consist of the following at:
| | | |
| Capitalized Software Development Costs | $125,704 | $125,704 |
| Less: Accumulated Amortization | (73,327) | (31,426) |
| | $52,377 | $94,278 |
Amortization expense for the years ended December 31, 2020 and 2019 was $41,900 and $31,426, respectively.
NOTE 9.CLOUD COMPUTING SERVICE CONTRACT
In May 2020 we entered into a cloud computing service contract. The contract provides for annual payments in the amount of $30,409 and has a term of 5 years. The annual contract payments are capitalized as a prepaid expense and amortized over a twelve-month period. Amortization expense for the year ended December 31, 2020 was $17,745.
We have incurred implementation costs of $68,330 in connection with the cloud computing service contract which have been capitalized in prepaid expenses as of December 31, 2020. In accordance withASU No. 2018-15,such implementation costs will be amortized once the cloud-based service contract is placed in service.
NOTE 6.10. CONVERTIBLE DEBT
In March and May 2017, the Companywe closed a private placement transaction in which itwe issued to certain accredited investors unregistered senior callable convertible promissory notes, (the “Notes”)or the Notes, and three-year warrants to purchase an aggregate of 999,998125,000 shares of common stock at an exercise price of $0.69$5.52 per share in exchange for aggregate gross proceeds of $6,000,000. The Notes bear interest at a rate of 4% per annum. $5,300,000 in principal was originally scheduled to mature on August 31, 2018 and $700,000 in principal was originally scheduled to mature on November 8, 2018, unless earlier redeemed, repurchased or converted. The Notes are convertible at the option of the holder into common stock at a conversion price of $0.54$4.32 per share. Subsequent to September 1, 2017, we may redeem the Notes that are scheduled to mature on August 31, 2018 at any time prior to maturity at a price equal to 100% of the outstanding principal amount of the Notes to be redeemed, plus accrued and unpaid interest as of the redemption date. Prior to November 8, 2018, we may redeem the Notes that are scheduled to mature on such date at any time prior to maturity at a price equal to 100% of the outstanding principal amount of the Notes to be redeemed, plus accrued and unpaid interest as of the redemption date. Interest on the Notes is payable semi-annually in cash on February 28 and August 31 of each year, beginning on August 31, 2017. Interest expense related to the Notes for the yearyears ended December 31, 20182020 and 20172019 was $221,878$40,689 and $191,256,$200,000, respectively.
The warrants were valued at $62,559 using the Black-Scholes pricing model with the following assumptions: expected volatility: 104.06% –111.54%; expected dividend: $0; expected term: 3 years; and risk-free rate: 1.49%–1.59%. The CompanyWe recorded the warrants’ relative fair value of $61,904 as an increase to additional paid-in capital and a discount against the related Notes.
The debt discount is beingwas amortized over the life of the Notes using the effective interest method. Amortization expense for the years ended December 31, 20182020 and 2017,2019, was $38,091$0 and $6,279,$17,534, respectively.
In February and March 2018, we extended the maturity date of the Notes—we extended the maturity datesdate to April 1, 2019 for $5,300,000 of principal on the Notes to April 1, 2019 and $700,000 in principal of the Notes to June 8, 2019. for the remaining $700,000 Note. No additional consideration was paid or accrued by the Company.us. The stated rate of the Notes was unchanged, and the estimated fair value of the new debt approximates its carrying amount (principal plus accrued interest at the date of the modification). We determined that the modification of these Notes is not a substantial modification in accordance with ASC 470-50, “Modifications and Extinguishments”.Extinguishments.”
In May 2018, we offered a noteholder the option to convert its Note at a reduced conversion price of $0.46.$3.68. The noteholder accepted and converted at such price. Pursuant to the terms of the conversion offer, an aggregate of $700,000 of principal and $5,212 of accrued interest outstanding under the Note were converted into 1,877,960234,745 shares of common stock. The CompanyWe recognized an induced conversion cost of $57,201 related to the conversion.
In December 2018, a noteholder redeemed a note with a principal balance of $300,000 in exchange for $150,000 in cash. We recognized a gain on redemption of convertible note income in the amount of $150,000 as a result of the transaction.
On March 30, 2019, the two remaining note holdersnoteholders agreed to extend the maturity dates of their aggregate ofnotes totaling $5,000,000 in notes to April 3, 2020. See Note 14-Subsequent Events.As part of the extensions, we agreed that if we do not make payment on or before the new maturity dates, after five (5) days written notice, the holders will have the right, but not the obligation, to convert the notes into our common shares at a conversion price of $0.88 per share or a total of 5,681,818 shares. All other provisions of the notes remain unchanged. We determined that the modification of these Notes is not a substantial modification in accordance with ASC 470-50, “Modifications and Extinguishments.”
In March 2020, convertible notes with a principal balance of $4,500,000 were converted into 1,041,667 shares of our common stock at a conversion price of $4.32 per share and the remaining outstanding balance of $500,000 was repaid in the form of cash. With respect to the 125,000 warrants issued as part of the convertible note transaction, 100,000 warrants expired in March 2020. In March 2020, 10,417, warrants were exercised, and 14,583 warrants expired in May 2020.
Convertible notes consist of the following at:
| | | |
| Convertible notes | $5,000,000 | $6,000,000 |
| Initial discount | (53,873) | (61,904) |
| Accumulated amortization | 36,339 | 6,279 |
| Convertible notes, net | $4,982,466 | $5,944,375 |
| | |
| | |
| Convertible notes | $- | $5,000,000 |
| Initial discount | - | (53,873) |
| Accumulated amortization | - | 53,873 |
| Convertible notes, net | $- | $5,000,000 |
NOTE 7.11. SHAREHOLDERS’ EQUITY
Our Board of Directors (the “Board”) may, without further action by our shareholders, from time to time, direct the issuance of any authorized but unissued or unreserved shares of preferred stock in series and at the time of issuance, determine the rights, preferences and limitations of each series. The holders of such preferred stock may be entitled to receive a preference payment in the event of any liquidation, dissolution or winding-up of the Companyby us before any payment is made to the holders of our common stock. Furthermore, the Board could issue preferred stock with voting and other rights that could adversely affect the voting power of the holders of our common stock.
Reverse Stock Split
On September 9, 2020, the Board approved a reverse stock split of our common stock and our Convertible Series A Preferred Stock, in each case, at a ratio of 1-for-8 and without any change to the respective par value thereof (the “Reverse Stock Split”), and, on September 10, 2020, we filed an Articles of Amendment to our Articles of Incorporation with the Department of State of the State of Florida to effect the Reverse Stock Split. The Reverse Stock Split became effective as of 5:00 p.m., Eastern time, on September 10, 2020 (the “Effective Time”). All per-share and share amounts have been retroactively restated in this Annual Report on Form 10-K for all periods presented to reflect the reverse stock split.
Convertible Series A Preferred Stock
Our authorized Convertible Series A Preferred Stock, $0.01 par value, consists of 1,000,000 shares. At December 31, 20182020 and 2017,2019, there were 510,00063,750 shares issued and outstanding. The Convertible Series A Preferred Stock is convertible at the rate of one share of common stock for one share of Convertible Series A Preferred Stock.
Convertible Series B Preferred Stock
Our authorized Convertible Series B Preferred Stock, $1,000 stated value, 7.5% cumulative dividend, consists of 4,000 shares. At December 31, 20182020 and 2017,2019, there were no shares issued and outstanding, respectively. Each share of Convertible Series B Preferred Stock may be converted (at the holder’s election) into two hundred shares of our common stock.
Common Stock
In November 2019, we amended our Restated Articles of Incorporation, increasing the number of authorized shares of our Common Stock from 200,000,000 to 250,000,000.
During the year ended December 31, 2017, the Company2019, we issued 249,82450,000 shares of common stock valued at $38,100 for professional services rendered,$44,000 to members of which the Company issued 200,000 shares that were valued at $32,000 and issued to our Board (See(see Note 9)13).
In August 2017, warrants to purchase 375,000 and 600,000During the year ended December 31, 2019, we issued 1,250 shares of common stock were exercised, which resulted in gross proceedsvalued at $1,200 to the Company of $18,750 and $30,000, respectively.a consultant.
During the year ended December 31, 2018,2020, we issued 362,50050,000 shares of common stock valued at $33,500$48,000 to members of our Board (see Note 9)13).
In May 2018, During the year ended December 31, 2020, we issued 1,877,960 500 shares of common stock valued at $2,190 to a consultant.
In March 2020, 1,041,667 shares of common stock were issued in connection with the conversion of $705,212 of principal and accrued interest outstanding under a Noteconvertible notes payable aggregating $4,500,000 (see Note 6)10).
In March 2020, 10,417 shares of common stock were issued in connection with the exercise of warrants for which we received proceeds of $57,500.
In May 2020, 2,500 shares of common stock were issued in connection with the exercise of options for which we received proceeds of $1,000.
In June 2020, 26,940 shares of common stock were issued in connection with the exercise of warrants for which we received proceeds of $62,500.
In July 2020, 26,940 shares of common stock were issued in connection with the exercise of warrants for which we received proceeds of $62,500.
In October 2020, 12,500 shares of common stock were issued to our CFO in connection with the exercise of warrants for which we received proceeds of $30,000.
Stock Options
In January 2018,2019, pursuant to an employment agreement, we issued options to purchase an aggregate of 100,00031,250 shares of common stock to our Chief Operating Officer, valued at $11,780.$24,694. The options have an exercise price of $0.12$0.88 per share and expire in January 2023.2024. The options were valued using the Black-Scholes model using the following assumptions: volatility: 146%144%; dividend yield: 0%; zero coupon rate: 2.27%2.47%; and a life of 5 years. The value of the options was expensed in the fourth quarter of 2018 and included in accrued expenses at December 31, 2018.
In January 2018,2019, we issued options to purchase an aggregate of 20,0006,250 shares of common stock to our Scientific Advisory Board members,Chief Financial Officer, valued at $1,810 in total.$4,483. The options have an exercise price of $0.10$0.80 per share and expire in January 2028.2024. The options were valued using the Black-Scholes model using the following assumptions: volatility: 147%143%; dividend yield: 0%; zero coupon rate: 2.41%2.58%; and a life of 105 years.
The following table summarizes stock options outstanding as of December 31, 2018 and 2017:
| | | |
| | | Weighted Average Exercise Price | | Weighted Average Exercise Price |
| Outstanding, beginning of period | 200,000 | $0.76 | 200,000 | $0.76 |
| Granted | 120,000 | $0.12 | — | — |
| Exercised | — | — | — | — |
| Outstanding, end of period | 320,000 | $0.52 | 200,000 | $0.76 |
Options outstanding and exercisable by price range as of December 31, 2018 were as follows:
| | |
| | Remaining Contractual Life in Years | | Weighted Average Exercise Price |
| | | | |
$0.05 | 20,000 | 2.02 | 20,000 | $0.05 |
$0.10 | 20,000 | 9.08 | 20,000 | $0.10 |
$0.12 | 100,000 | 4.02 | 100,000 | $0.12 |
$0.27 | 40,000 | 6.01 | 40,000 | $0.27 |
$0.55 | 100,000 | 7.10 | 100,000 | $0.55 |
$2.10 | 40,000 | 1.01 | 40,000 | $2.10 |
| 320,000 | 5.05 | 320,000 | $0.52 |
Stock Warrants
In March and May of 2017, in connection with the issuance of the Notes,January 2020, we issued three-year warrantstwo options to purchase up to an aggregate of 999,99831,250 shares of common stock to our Chief Operating Officer at an exercise price of $0.69$0.80 and $0.96 per share (see Note 6).
On June 30, 2017, we issued warrantspursuant to purchase up to 15,000 sharesher employment agreement with us. The options were valued at a total of common stock at an exercise price of $0.10 per share to the members of the Scientific Advisory Board with$23,595 and have a term of five years, which vested upon issuance. The Company5 years. We utilized the Black-Scholes method to fair value the warrantsoptions received by the members of the Scientific Advisory Board at $1,400COO with the following assumptions: volatility, 150%135%; expected dividend yield, 0%; risk free interest rate, 1.83%1.64%; and a life of 5 years. The grant date fair value of each share underlying the warrant was $0.09.
During the first and second quarter of 2017, we recognized approximately $23,000 in equity compensation expense for the vested and unvested portion of a warrant issued to a former employee pursuant to his agreement with the Company. In September 2017, the employee resigned from his position with the Company and the unvested portion of his warrant was terminated. For the year ended December 31, 2017, we reversed the equity compensation expense for the accrued but unvested portion of his warrant of $22,000.
In June 2017, we modified the terms of outstanding warrants to purchase 4,000,000 shares of common stock. Pursuant to a settlement agreement, the term of the warrants was increased by 2 years and the exercise price was modified to $0.12 per share (decrease of $0.03 per share). Pursuant to ASC 718, the modified terms of the warrants resulted in approximately $196,000 in incremental equity compensation expense for the year ended December 31, 2017. We utilized the Black-Scholes method to fair value the warrants under the original and modified terms with the following range of assumptions: volatility, 81%-97%; expected dividend yield, 0%; risk free interest rate, 1.28%; and a life of 0.33 - 2.33 years, respectively. The grant date fair value of each share of common stock underlying the warrantoptions was $0.01$0.72 and $0.06, respectively.$0.80. The value of the stock option was included in accrued expenses at December 31, 2019.
In July 2017October 2020, we issued a warrantoptions to purchase 250,000an aggregate of 31,250 shares of common stock to the CEOour Chief Operating Officer at an exercise price of $0.10$7.06 per share pursuant to hisher employment agreement with the Company.us. The warrant wasoptions were valued at approximately $23,000a total of $202,104 and hashave a term of 5 years. We utilized the Black-Scholes method to fair value the warrantoptions received by the CEOCOO with the following assumptions: volatility, 153%154%; expected dividend yield, 0%; risk free interest rate, 1.90%0.67%; and a life of 5 years. The grant date fair value of each share of common stock underlying the options was $6.47.
The following table summarizes stock options outstanding as of December 31, 2020 and 2019:
| | | |
| | | Weighted Average Exercise Price | | Weighted Average Exercise Price |
| Outstanding, beginning of period | 77,500 | $2.56 | 40,000 | $4.16 |
| Granted | 62,500 | 3.96 | 37,500 | 0.88 |
| Exercised | (2,500) | 0.40 | - | - |
| Expired | (5,000) | 16.80 | - | - |
| Outstanding, end of period | 132,500 | $ 2.72 | 77,500 | $2.56 |
Options outstanding and exercisable by price range as of December 31, 2020 were as follows:
| | |
| | Remaining Contractual Life in Years | | Weighted Average Exercise Price |
$0.80 | 27,500 | 4.10 | 27,500 | $0.80 |
$0.88 | 31,250 | 3.01 | 31,250 | $0.88 |
$0.96 | 25,000 | 3.02 | 25,000 | $0.96 |
$2.16 | 5,000 | 4.01 | 5,000 | $2.16 |
$4.40 | 12,500 | 5.10 | 12,500 | $4.40 |
$7.06 | 31,250 | 4.75 | 31,250 | $7.06 |
| | | | |
| 132,500 | 3.89 | 132,500 | $2.72 |
Stock Warrants
In January 2019 we issued a warrant to purchase 125,000 shares of common stock to our Chief Executive Officer at an exercise price of $0.80 per share pursuant to an employment agreement. The warrant was valued at $89,654 and has a term of 5 years. We utilized the Black-Scholes model to fair value the warrant received by our Chief Executive Officer with the following assumptions: volatility, 143%; expected dividend yield, 0%; risk free interest rate, 2.58%; and a life of 5 years. The grant date fair value of each share of common stock underlying the warrant was $0.09.$0.72.
In October 2017,January 2019 we issued warrantsa warrant to purchase up to 10,00031,250 shares of common stock to an employee at an exercise price of $0.17$0.96 per share to the members of the Scientific Advisory Board withshare. The warrant was valued at $21,931 and has a term of five years, which vested upon issuance. The Company3 years. We utilized the Black-Scholes methodmodel to fair value the warrantswarrant received by the members of the Scientific Advisory Board at approximately $1,500employee with the following assumptions: volatility, 147%148%; expected dividend yield, 0%; risk free interest rate, 1.98%2.55%; and a life of 53 years. The grant date fair value of each share of common stock underlying the warrant was $0.15.$0.72. The value of the warrants was expensed in the fourth quarter of 2018 and included in accrued expenses at December 31, 2018.
In December 2017April 2019 we issued a warrant to purchase 3,500,0006,250 shares of common stock to the CEOan employee at an exercise price of $0.12$1.12 per share pursuant to his employment agreement with the Company.share. The warrant was valued at approximately $412,000$6,116 and has a term of 5 years. We utilized the Black-Scholes methodmodel to fair value the warrant received by the CEOemployee with the following assumptions: volatility, 145%134%; expected dividend yield, 0%; risk free interest rate, 2.23%2.32%; and a life of 5 years. The grant date fair value of each share of common stock underlying the warrant was $0.12.$0.96.
In November 2018January 2020 we issued a warrant to purchase 250,000156,250 shares of common stock to the CEOour Chief Executive Officer at an exercise price of $0.08$1.20 per share pursuant to hisan employment agreement with the Company.agreement. The warrant was valued at approximately $18,000$164,201 and has a term of 5 years. We utilized the Black-Scholes methodmodel to fair value the warrant received by the CEOour Chief Executive Officer with the following assumptions: volatility, 142%136%; expected dividend yield, 0%; risk free interest rate, 2.95%1.64%; and a life of 5 years. The grant date fair value of each share of common stock underlying the warrant was $0.07.$1.04.
In January 2020 we issued a warrant to purchase 5,208 shares of common stock to an employee at an exercise price of $0.96 per share. The warrant was valued at $3,594 and has a term of 5 years. We utilized the Black-Scholes model to fair value the warrant received by the employee with the following assumptions: volatility, 135%; expected dividend yield, 0%; risk free interest rate, 1.58%; and a life of 5 years. The grant date fair value of each share of common stock underlying the warrant was $0.72. The value of the warrants was expensed in the fourth quarter of 2019 and included in accrued expenses at December 31, 2019.
In February 2020 we issued a warrant to purchase 18,750 shares of common stock to an employee at an exercise price of $1.20 per share. The warrant was valued at $18,571 and has a term of 3 years. We utilized the Black-Scholes model to fair value the warrant received by the employee with the following assumptions: volatility, 155%; expected dividend yield, 0%; risk free interest rate, 1.64%; and a life of 3 years. The grant date fair value of each share of common stock underlying the warrant was $0.96.
In April 2020 we issued a warrant to purchase 12,500 shares of common stock to our Chief Executive Officer at an exercise price of $4.00 per share pursuant to an employment agreement. The warrant was valued at $49,693 and has a term of 10 years. We utilized the Black-Scholes model to fair value the warrant received by our Chief Executive Officer with the following assumptions: volatility, 173%; expected dividend yield, 0%; risk free interest rate, 0.68%; and a life of 10 years. The grant date fair value of each share of common stock underlying the warrant was $4.00.
In April 2020 we issued a warrant to purchase 6,250 shares of common stock to our Chief Operating Officer at an exercise price of $4.00 per share pursuant to an employment agreement. The warrant was valued at $24,846 and has a term of 10 years. We utilized the Black-Scholes model to fair value the warrant received by our Chief Operating Officer with the following assumptions: volatility, 173%; expected dividend yield, 0%; risk free interest rate, 0.68%; and a life of 10 years. The grant date fair value of each share of common stock underlying the warrant was $4.00.
In April 2020 we issued a warrant to purchase 6,250 shares of common stock to our Chief Financial Officer at an exercise price of $4.00 per share pursuant to an employment agreement. The warrant was valued at $24,846 and has a term of 10 years. We utilized the Black-Scholes model to fair value the warrant received by our Chief Financial Officer with the following assumptions: volatility, 173%; expected dividend yield, 0%; risk free interest rate, 0.68%; and a life of 10 years. The grant date fair value of each share of common stock underlying the warrant was $4.00.
In April 2020 we issued a warrant to purchase 3,750 shares of common stock to a consultant at an exercise price of $4.00 per share. The warrant was valued at $14,908 and has a term of 10 years. We utilized the Black-Scholes model to fair value the warrant received by the consultant with the following assumptions: volatility, 173%; expected dividend yield, 0%; risk free interest rate, 0.68%; and a life of 10 years. The grant date fair value of each share of common stock underlying the warrant was $4.00.
In August 2020 we issued a warrant to purchase 893 shares of common stock to a consultant at an exercise price of $8.40 per share. The warrant was valued at $6,372 and has a term of 3 years. We utilized the Black-Scholes model to fair value the warrant received by the consultant with the following assumptions: volatility, 166%; expected dividend yield, 0%; risk free interest rate, 0.13%; and a life of 3 years. The grant date fair value of each share of common stock underlying the warrant was $7.13.
In August 2020 we issued a warrant to purchase 595 shares of common stock to a consultant at an exercise price of $8.40 per share. The warrant was valued at $4,249 and has a term of 3 years. We utilized the Black-Scholes model to fair value the warrant received by the consultant with the following assumptions: volatility, 166%; expected dividend yield, 0%; risk free interest rate, 0.13%; and a life of 3 years. The grant date fair value of each share of common stock underlying the warrant was $7.14.
In October 2020 we issued a warrant to purchase 375,000 shares of common stock to our Chief Executive Officer at an exercise price of $6.95 per share pursuant to an employment agreement. The warrant was valued at $2,621,196 and has a term of 10 years. We utilized the Black-Scholes model to fair value the warrant received by our Chief Executive Officer with the following assumptions: volatility, 162%; expected dividend yield, 0%; risk free interest rate, 0.67%; and a life of 10 years. The grant date fair value of each share of common stock underlying the warrant was $6.99.
The following table summarizes the outstanding common stock warrants as of December 31, 20182020 and 2017:2019:
| | | | | |
| | | Weighted Average Exercise Price | | Weighted Average Exercise Price | | Weighted Average Exercise Price | | Weighted Average Exercise Price |
| Outstanding, beginning of period | 35,501,411 | $0.33 | 37,076,413 | $0.31 | 2,155,065 | $3.12 | 3,318,826 | $2.72 |
| Granted | 250,000 | 0.08 | 4,774,998 | 0.24 | 585,447 | 4.97 | 162,500 | 0.88 |
| Exercised | - | (975,000) | 0.05 | (76,796) | (2.77) | - |
| Expired | (9,200,800) | (0.30) | (5,375,000) | 0.13 | (614,583) | (6.40) | (1,326,261) | (1.84) |
| Outstanding, end of period | 26,550,611 | $0.34 | 35,501,411 | $0.33 | 2,049,133 | $2.55 | 2,155,065 | $3.12 |
Warrants outstanding and exercisable by price range as of December 31, 20182020 were as follows:
| | |
| | Average Weighted Remaining Contractual Life in Years | | Weighted Average Exercise Price |
$0.08 | 250,000 | 4.89 | 250,000 | $0.08 |
$0.10 | 265,000 | 3.53 | 265,000 | $0.10 |
$0.12 | 3,500,000 | 3.98 | 3,500,000 | $0.12 |
$0.12 | 4,000,000 | 0.79 | 4,000,000 | $0.12 |
$0.17 | 10,000 | 3.82 | 10,000 | $0.17 |
$0.27 | 250,000 | 3.00 | 250,000 | $0.27 |
$0.29 | 10,125,613 | 1.80 | 10,125,613 | $0.29 |
$0.30 | 3,300,000 | 1.17 | 3,300,000 | $0.30 |
$0.32 | 250,000 | 2.75 | 250,000 | $0.32 |
$0.42 | 250,000 | 2.50 | 250,000 | $0.42 |
$0.50 | 250,000 | 2.25 | 250,000 | $0.50 |
$0.55 | 100,000 | 2.08 | 100,000 | $0.55 |
$0.69 | 999,998 | 1.22 | 999,998 | $0.69 |
$1.00 | 3,000,000 | 1.34 | 3,000,000 | $1.00 |
| 26,550,611 | 2.24 | 26,550,611 | $0.34 |
| | | | |
| | |
| | Average Weighted Remaining Contractual Life in Years | | Weighted Average Exercise Price |
$0.64 | 31,250 | 2.90 | 31,250 | $0.64 |
$0.80 | 158,125 | 2.76 | 158,125 | $0.80 |
$0.96 | 473,958 | 1.94 | 473,958 | $0.96 |
$1.12 | 6,250 | 3.30 | 6,250 | $1.12 |
$1.20 | 175,000 | 3.88 | 175,000 | $1.20 |
$1.36 | 1,250 | 1.82 | 1,250 | $1.36 |
$2.16 | 31,250 | 1.00 | 31,250 | $2.16 |
$2.32 | 523,061 | 1.16 | 523,061 | $2.32 |
$2.40 | 137,500 | 0.14 | 137,500 | $2.40 |
$2.56 | 31,250 | 0.75 | 31,250 | $2.56 |
$3.36 | 31,250 | 0.50 | 31,250 | $3,36 |
$4.00 | 60,000 | 4.60 | 60,000 | $4.00 |
$4.40 | 12,500 | 0.09 | 12,500 | $4.40 |
$6.95 | 375,000 | 9.75 | 375,000 | $6.95 |
$8.40 | 1,488 | 2.63 | 1,488 | $8.40 |
| 2,049,133 | 3.31 | 2,049,133 | $2.55 |
There were no unvested warrants outstanding as of December 31, 2018.2020.
NOTE 8.12. COMMITMENTS AND CONTINGENCIES
Lease CommitmentsLegal Contingencies
In September 2014, we entered into a lease agreement for office and warehouse space in Frederick, Maryland. As part of the lease agreement, we received a rent holiday in the first 5 months of the lease. The lease also provides for an escalation clause pursuant to which the Company was subject to an annual rent increase of 3%, year over year. The term of the lease expired on January 31, 2018 and was extended on a month-to-month basis through the occupancy date of our new lease.
In April 2018, we entered into a 10-year lease agreement for a new 9,000-square-foot facility that contains office, warehouse, lab and research and development space in Frederick, Maryland. The lease agreement was scheduled to commence on December 1, 2018 or when the property was ready for occupancy. The agreement provided for annual rent of $143,460, an escalation clause that increases the rent 3% year over year, a landlord tenant improvement allowance of $405,000 and additional landlord work as discussed in the lease agreement. We took occupancy of the property on December 17, 2018 and the lease was amended in March 2019 to provide for a 4-month rent holiday and a commencement date of April 1, 2019.
Approximate minimum annual rents under the lease are as follows:
Twelve Month Period Ending December 31, | |
| 2019 | $102,000 |
| 2020 | 147,000 |
| 2021 | 151,000 |
| 2022 | 156,000 |
| 2023 | 160,000 |
| Thereafter | 923,000 |
| | $1,639,000 |
Legal Contingencies
We may become a party to litigation in the normal course of business. In the opinion of management, there are no legal matters involving us that would have a material adverse effect upon our financial condition, results of operations or cash flows. In addition, from time to time, we may have to file claims against parties that infringe on our intellectual property.
Product Liability
As of December 31, 2018,2020 and 2017,2019, there were no claims against us for product liability.
SARS CoV-2 coronavirus
On March 11, 2020 the World Health Organization declared the SARS CoV-2 coronavirus a global pandemic and recommended containment and mitigation measures worldwide. We have been identified as an essential disinfectant and decontamination vendor by various agencies and countries. Our operations being essential have been materially affected by the coronavirus outbreak to date. As demand for our product and services increases, the uncertain nature of its spread globally may or may not impact our business operations resulting from quarantines of employees, customers and suppliers as well as potential travel restrictions in areas affected or may be affected in the future.
NOTE 9.13. CONTRACTS AND AGREEMENTS
Executive Agreements
Halden S. Shane
On September 22, 2020, we entered intoa three year employment agreement with Dr. Shane, effective October 1, 2020. The agreement provides for a base annual salary of $500,000. The agreement also provides for a signing bonus of 375,000 warrants. Dr. Shane is also entitled to a cash performance bonus and an annual issuance of an option to purchase 31,250 shares of common stock from the 2016 Plan at the discretion of the Board. The agreement also provides that we will reimburse Dr. Shane for the expenses associated with the use of an automobile up to $750 a month. The term of the agreement is three years.
In the event Dr. Shane is terminated as CEO as a result of a change in control, Dr. Shane will be entitled to a lump sum payment of two years’ salary at the time of such termination.
The Board may terminate Dr. Shane for cause by written notification to Dr. Shane; provided, however, that no termination for cause will be effective unless Dr. Shane has been provided with prior written notice and opportunity for remedial action and fails to remedy within 30 days thereof, in the event of a termination by the Company (i) by reason of willful dishonesty towards, fraud upon, or deliberate injury or attemptedinjury to, the Company, (ii) by reason of material breach of his employment agreement and (iii) by reason of gross negligence or intentional misconduct with respect to the performance of duties under the agreement. Upon termination for cause, Dr. Shane will be immediately paid an amount equal to his gross salary. The Board may terminate Dr. Shane other than for cause at any time upon giving notice to Dr. Shane. Upon such termination, Dr. Shane will be immediately paid an amount equal to his gross salary.
Elissa J. Shane
On October 1, 2020, we entered into an employment agreement with Elissa J. Shane, effective October 1, 2020. Pursuant to her employment agreement, Ms. Shane will receive an annual base salary of at least $270,000, subject to annual review and discretionary increase by the Compensation Committee of the Board. Ms. Shane is eligible to receive an annual cash bonus and other annual incentive compensation. The agreement originally provided for a grant of 93,750 warrants. Additionally, in connection with the execution of her employment agreement, on October 1, 2020, we issued Ms. Shane a warrant to purchase 93,750 shares of Common Stock at an exercise price of $6.17 per share. These provisions were subsequently amended to provide for the issuance to Ms. Shane of 31,250 options from the 2016 Equity Plan at the closing price of $7.06 on the date of grant in lieu of the warrant grant and the 93,750 warrants were cancelled. Ms. Shane acknowledged that the 31,250 options were in full consideration of the amount she was entitled to under the agreement. Her employment agreement also provides that we will reimburse Ms. Shane for reasonable and necessary business and entertainment expenses that she incurs in performing her duties. During the term of her employment, Ms. Shane will also be entitled to up to four weeks of paid vacation time annually, which will accrue up to six weeks, and to participate in our benefit plans and programs, including but not limited to all group health, life, disability and retirement plans. Ms. Shane is also entitled to the sum of $1,000 per month as a vehicle allowance. The initial term of her employment agreement is three years, which may be automatically extended for successive one-year terms, unless either party provides the other with 120 days’ prior written notice of its intent to terminate the agreement.
In the event Ms. Shane is terminated as COO as a result of a change in control, Ms. Shane will be entitled to a lump sum payment of one and a half years’ salary at the time of such termination.
Agreements with Directors
In December 2017, we increased the annual board fee to directorsthe members of our Board to $40,000, to be paid in cash on a quarterly basis, with the exception of the audit committee chairperson, whose annual fee we increased to $45,000, also to be paid in cash on a quarterly basis. The board feeDirector compensation also includes the annual issuance of 75,000 shares ofour common stock on an annual basis. stock.
For the year ended December 31, 2018,2019, we issued an aggregate of 362,50050,000 shares of common stock that were valued at $33,500$44,000 to members of our Board.
In January 2018, Dr. Lim Boh Soon was elected to our Board. His term is for three years or until his successor is elected, or he resigns or is removed. His director agreement provides forFor the year ended December 31, 2020, we issued an annual cash board feeaggregate of $40,000 and annual issuance of50,000 shares of common stock that were valued at $48,000 to members of our Board.
Manufacturing Agreement
In June 2020 we entered into a manufacturing agreement with Planet Innovation Products, Pty Ltd (“PI”). The agreement does not provide for any minimum purchase commitments and is for a term of three years. The agreement also provides for a warranty against product defects.
Cloud Computing Service Contract
In May 2020 we entered into an agreement for a cloud computing service contract. The contract provides for annual payments in the amount of $30,409 and has a term of 5 years.Approximate minimum payments under the contract are as indicated above.follows
Year Ended: | |
| |
| December 31, 2021 | $18,000 |
| December 31, 2022 | 30,000 |
| December 31, 2023 | 30,000 |
| December 31, 2024 | 30,000 |
| 15,000 |
| $123,000 |
Other Agreements
In June 2015, we launched the TOMI Service Network (“TSN”). The TSN is a national service network composed of existing full-service restoration industry specialists that have entered initially into licensing agreements with us to become Primary Service Providers (“PSPs”). The licensing agreements grantoriginally granted protected territories to PSPs to perform services using our SteraMist™® platform of products and also provide for potential job referrals to PSPs whereby we are entitled to referral fees. Additionally, the agreement provides for commissions due to PSPs for equipment and solution sales they facilitate to other service providers in their respective territories. As part of these agreements, we are obligated to provide to the PSPs various training, ongoing support and facilitate a referral network call center. As of December 31, 2018,2020, we had entered into 87 licensing agreementshave approximately 180 network companies in connection with the launch of the TSN. The licensing agreements contain fixed price minimum equipment and solution orders based on the population of the territories granted pursuant to the licensing agreements. The nature and terms of our TSN agreements may represent multiple deliverable arrangements. Each of the deliverables in these arrangements typically represent a separate unit of accounting. As of January 1, 2020, there is no exclusivity in our TSN network.
NOTE 10. INCOME TAXES
The Company’s income tax expense consisted of:
| | |
| | | |
| | | |
| Current: | | |
| United States | $- | $- |
| Foreign | - | - |
| | - | - |
| Deferred: | | |
| United States | - | - |
| Foreign | - | - |
| | - | - |
| Total | $- | $- |
The Company’s net income (loss) before income tax consisted of:
| |
| | | |
| | | |
| | | |
| United States | $(3,230,462) | $(3,639,814) |
| Foreign | - | - |
| Total | $(3,230,462) | $(3,639,814) |
Our income tax expense differed from the amounts computed by applying the United States statutory corporate income tax rate for the following reasons:
On December 22, 2017, the 2017 Tax Cuts and Jobs Act (“Tax Act”) was enacted into law making significant changes to the Internal Revenue Code. Changes include, but are not limited to, a federal corporate tax rate decrease from 35% to 21% for tax years beginning after December 31, 2017, the transition of U.S. international taxation from a worldwide tax system to a territorial system and a one-time transition tax on the mandatory deemed repatriation of foreign earnings. We are required to recognize the effect of the tax law changes in the period of enactment, such as re-measuring our U.S. deferred tax assets and liabilities as well as reassessing the net realizability of our deferred tax assets and liabilities. The Tax Act did not give rise to any material impact on the consolidated balance sheets and consolidated statements of operations due to our historical worldwide loss position and the full valuation allowance on our net U.S. deferred tax assets.
In December 2017, the Securities and Exchange Commission staff issued Staff Accounting Bulletin No. 118, Income Tax Accounting Implications of the Tax Cuts and Jobs Act (“SAB 118”), which allows us to record provisional amounts during a measurement period not to extend beyond one year from the enactment date. As such, in accordance with SAB 118, we completed our analysis during the fourth quarter of 2018 considering current legislation and guidance resulting in no material adjustments from the provisional amounts recorded during the prior year.
The reconciliation of taxes at the federal and state statutory rate to our provision for income taxes for the years ended December 31, 2018 and 2017 was as follows:
| | |
| | | |
| | | |
| | | |
| Loss before income tax | $(3,230,462) | $(3,639,814) |
| US statutory corporate income tax rate (federal and state) | 28.00% | 39.45% |
| Income tax expense computed at US statutory corporate income tax rate | | |
| Income tax expense computed at US statutory corporate income tax rate | (904,529) | (1,435,907) |
| Reconciling items: | | |
| Effect of U.S. tax law change (1) | - | 1,793,212 |
| Change in valuation allowance on deferred tax assets | 741,982 | (675,889) |
| Provision to prior year tax return | 113,068 | 69,767 |
| Incentive stock options and warrants | 21,628 | 256,168 |
| Amortized debt discount | 1,758 | 2,477 |
| Meals and Entertainment | 4,134 | 5,825 |
| Induced Conversion Costs | 16,016 | - |
| Other | 5,943 | (15,653) |
| Income tax expense | $- | $- |
(1)
Due to the Tax Act, our U.S. deferred tax assets and liabilities as of December 31, 2017 were re-measured from 39.45% to 28%. The change in tax rate resulted in a decrease to our gross U.S. deferred tax assets which is offset by a corresponding decrease to our valuation allowance.
Components of our deferred income tax assets (liabilities) are as follows:
| | | |
| Deferred tax assets: | | |
| | | |
| Reserve for Bad Debt | $84,000 | $140,000 |
| Inventory Reserve | 28,000 | - |
| Inventory Capitalization | - | 94,000 |
| Accrued Expenses | 52,000 | 31,000 |
| Deferred Rent | 4,000 | - |
| Warranty Reserve | 8,000 | - |
| Property and Equipment | - | 21,000 |
| Intangible Assets | 362,000 | 208,000 |
| Net operating losses | 4,718,000 | 3,724,000 |
| Valuation Allowance | (4,959,000) | (4,218,000) |
| Deferred Tax Assets | $297,000 | $- |
| | | |
| Deferred tax liabilities: | | |
| Property Plant and Equipment | $(297,000) | $- |
| | $(297,000) | - |
| | | |
| Net Deferred Tax Assets and Liabilities | $- | $- |
Deferred income tax assets and liabilities are determined based on differences between the financial statement reporting and tax bases of assets and liabilities and are measured using the enacted tax rates and laws in effect when the differences are expected to reverse. The measurement of deferred income tax assets is reduced, if necessary, by a valuation allowance for any tax benefits, which are, on a more likely than not basis, not expected to be realized; in accordance with ASC guidance for income taxes. As of December 31, 2018, we recorded a valuation allowance of $4,959,000 for the portion of the deferred tax assets that we do not expect to be realized. The valuation allowance on our net deferred taxes increased by $741,000 during the year ended December 31, 2018, primarily due to U.S. deferred tax assets incurred in the current year that cannot be realized. The 2017 additional U.S. deferred tax assets are net of re-measurement from 35% to 21% as a result of the Tax act. Management believes that based on the available information, it is more likely than not that the U.S. deferred tax assets will not be realized, such that a valuation allowance is required against U.S. deferred tax assets. The effect on deferred income tax assets and liabilities of a change in tax rates is recognized in the period that such tax rate changes are enacted.
For income tax purposes in the United States, we had available federal net operating loss carryforwards ("NOL") as of December 31, 2018 and 2017 of approximately $17,544,000 and $13,898,000 respectively to reduce future federal taxable income. For income tax purposes in the United States, we had available state NOL carryforwards as of December 31, 2018 and 2017 of approximately $14,773,000 and $11,506,000 respectively to reduce future state taxable income. If any of the NOL's are not utilized, they will expire at various dates through 2038. There may be certain limitations as to the future annual use of the NOLs due to certain changes in our ownership.
We record uncertain tax positions in accordance with ASC 740 on the basis of a two-step process whereby (1) we determine whether it is more likely than not that the tax positions will be sustained on the basis of the technical merits of the position and (2) for those tax positions that meet the more-likely-than-not recognition threshold, we recognize the largest amount of tax benefit that is more than 50 percent likely to be realized upon ultimate settlement with the related tax authority. As of December 31, 2018, and 2017, the management of the Company determined there were no reportable uncertain tax positions.
NOTE 11.14. ACCRUED EXPENSES AND OTHER CURRENT LIABILITIES
Accrued expenses and other current liabilities consisted of the following at:
| | | |
| Commissions | $151,709 | $112,102 |
| Payroll and related costs | 84,000 | 167,689 |
| Director fees | 41,250 | 41,250 |
| Sales Tax Payable | 9,784 | 21,814 |
| Income Taxes Payable (Note 17) | 77,000 | - |
| Accrued warranty (Note 15) | 68,000 | 30,000 |
| Other accrued expenses | 70,106 | 77,257 |
| Total | $501,849 | $450,112 |
| | | |
| Commissions | $136,631 | $115,506 |
| Payroll and related costs | 144,359 | 43,484 |
| Director fees | 41,250 | 27,750 |
| Accrued warranty | 30,000 | 5,000 |
| Other accrued expenses | 62,959 | 75,396 |
| Total | $415,199 | $267,136 |
NOTE 12.15. ACCRUED WARRANTY
Our manufacturer assumesmanufacturers assume the warranty against product defects for one year from thedate of sale, to customers, which we extend to our customers upon sale of the product. We assume responsibility for product reliability and results. The warranty is generally limited to a refund of the original purchase price of the product or a replacement part. We estimate warranty costs based on historical warranty claim experience.
The following table presents warranty reserve activities at:
| | | |
| Beginning accrued warranty costs | $30,000 | $30,000 |
| Provision for warranty expense | 101,041 | 2,609 |
| Settlement of warranty claims | (63,041) | (2,609) |
| Ending accrued warranty costs | $68,000 | $30,000 |
| | | |
| Beginning accrued warranty costs | $5,000 | $- |
| Provision for warranty expense | 47,454 | 10,731 |
| Settlement of warranty claims | (22,454) | (5,731) |
| Ending accrued warranty costs | $30,000 | $5,000 |
On April 21, 2020, we received $410,700 in loan funding from the Paycheck Protection Program (the "PPP") established pursuant to the recently enacted Coronavirus Aid, Relief, and Economic Security Act of 2020 (the "CARES Act") and administered by the U.S. Small Business Administration ("SBA"). The unsecured loan (the "PPP Loan") is evidenced by a promissory note of the Company, dated April 21, 2020 (the "Note") in the principal amount of $410,700 with City National Bank (the "Bank"), the lender. Interest expense for the year ended December 31, 2020 was $2,849.
Under the terms of the Note and the PPP Loan, interest accrues on the outstanding principal at the rate of 1.0% per annum. The term of the Note is two years, though it may be payable sooner in connection with an event of default under the Note.
NOTE 17. INCOME TAXES
The Company’s income tax expense consisted of:
| | For the Year Ended |
| | | |
| | | |
| Current: | | |
| Federal | $- | $- |
| State | 77,000 | - |
| Foreign | - | - |
| | 77,000 | - |
| Deferred: | | |
| Federal | - | - |
| State | - | - |
| Foreign | - | - |
| | - | - |
| Total | $77,000 | $- |
The Company’s net income (loss) before income tax consisted of:
| | |
| | | |
| | | |
| | | |
| United States | $4,468,166 | $(2,297,733) |
| Foreign | - | - |
| Total | $4,468,166 | $(2,297,733) |
Our income tax expense differed from the amounts computed by applying the United States statutory corporate income tax rate for the following reasons:
On December 22, 2017, the 2017 Tax Cuts and Jobs Act (“Tax Act”) was enacted into law making significant changes to the Internal Revenue Code. Changes include, but are not limited to, a federal corporate tax rate decrease from 35% to 21% for tax years beginning after December 31, 2017, the transition of U.S. international taxation from a worldwide tax system to a territorial system and a one-time transition tax on the mandatory deemed repatriation of foreign earnings. We are required to recognize the effect of the tax law changes in the period of enactment, such as re-measuring our U.S. deferred tax assets and liabilities as well as reassessing the net realizability of our deferred tax assets and liabilities. The Tax Act did not give rise to any material impact on the consolidated balance sheets and consolidated statements of operations due to our historical loss position and the full valuation allowance on our net U.S. deferred tax assets.
In December 2017, the Securities and Exchange Commission staff issued Staff Accounting Bulletin No. 118, Income Tax Accounting Implications of the Tax Cuts and Jobs Act (“SAB 118”), which allows us to record provisional amounts during a measurement period not to extend beyond one year from the enactment date. As such, in accordance with SAB 118, we completed our analysis during the fourth quarter of 2018 considering current legislation and guidance resulting in no material adjustments from the provisional amounts recorded during the prior year.
The reconciliation of taxes at the federal and state statutory rate to our provision for income taxes for the years ended December 31, 2020 and 2019 was as follows:
| | |
| | | |
| | | |
| | | |
| Income (Loss) before income tax | $4,468,166 | $(2,297,733) |
| US statutory corporate income tax rate | 28.00% | 28.00% |
| Income tax expense computed at US statutory corporate income tax rate | | |
| Income tax expense computed at US statutory corporate income tax rate | 1,251,086 | (643,365) |
| Reconciling items: | | |
| Change in valuation allowance on deferred tax assets | (2,050,485) | 620,817 |
| Provision to prior year tax return | - | 6,991 |
| Incentive stock options and warrants | 876,676 | 31,982 |
| Amortized debt discount | - | 4,910 |
| Meals and Entertainment | 1,300 | 2,005 |
| Other | (1,577) | (23,340) |
| Income tax expense | $77,000 | $- |
Components of our deferred income tax assets (liabilities) are as follows:
| | | |
| | | |
| Deferred tax assets: | | |
| | | |
| Reserve for Bad Debt | $109,000 | $31,000 |
| Inventory Reserve | - | 28,000 |
| Accrued Vacation | 82,000 | 92,000 |
| Warranty Reserve | 19,000 | 8,000 |
| Intangible Assets | 412,000 | 381,000 |
| Operating lease right-of-use liabilities | 290,000 | 310,000 |
| Net operating losses | 3,100,000 | 5,223,000 |
| Valuation Allowance | (3,530,000) | (5,580,000) |
| 482,000 | 493,000 |
| | | |
| Deferred tax liabilities: | | |
| Operating lease right-of-use assets | (290,000) | (302,000) |
| Property and Equipment | (192,000) | (191,000) |
| | (482,000) | (493,000) |
| | | |
| Net Deferred Tax Assets and Liabilities | $- | $- |
Deferred income tax assets and liabilities are determined based on differences between the financial statement reporting and tax bases of assets and liabilities and are measured using the enacted tax rates and laws in effect when the differences are expected to reverse. The measurement of deferred income tax assets is reduced, if necessary, by a valuation allowance for any tax benefits, which are, on a more likely than not basis, not expected to be realized; in accordance with ASC guidance for income taxes. As of December 31,2020, we recorded a valuation allowance of $3,530,000 for the portion of the deferred tax assets that we do not expect to be realized.The valuation allowance on our net deferred taxes decreased by $2,050,000 during the year ended December 31, 2020, primarily due to the utilization of deferred tax assets. Management believes that based on the available information, it is more likely than not that the U.S. deferred tax assets will not be realized, such that a valuation allowance is required against U.S. deferred tax assets. The effect on deferred income tax assets and liabilities of a change in tax rates is recognized in the period that such tax rate changes are enacted.
For income tax purposes in the United States, we had available federal net operating loss carryforwards (“NOL”) as of December 31, 2020 and 2019 of approximately $11,465,000 and $9,596,000 respectively to reduce future federal taxable income.For income tax purposes in the United States, we had available state NOL carryforwards as of December 31, 2020 and 2019 of approximately $9,663,000 and $16,463,000 respectively to reduce future state taxable income.If any of the NOL’s generated prior to 2018 are not utilized, they will expire at various dates through 2037. NOL’s generated after 2017 carry forward indefinitely. There may be certain limitations as to the future annual use of the NOLs due to certain changes in our ownership.
We record uncertain tax positions in accordance with ASC 740 on the basis of a two-step process whereby (1) we determine whether it is more likely than not that the tax positions will be sustained on the basis of the technical merits of the position and (2) for those tax positions that meet the more-likely-than-not recognition threshold, we recognize the largest amount of tax benefit that is more than 50 percent likely to be realized upon ultimate settlement with the related tax authority. As of December 31, 2020, and 2019, the management of the Company determined there were no reportable uncertain tax positions.
NOTE 13.18. CUSTOMER CONCENTRATION
The Company had certain customers whose revenue individually represented 10% or more of the Company’s total revenue, or whose accounts receivable balances individually represented 10% or more of the Company’s accounts receivable.
As of December 31, 2018, two2020, three customers accounted for 36% of accounts receivable.
As of December 31, 2019, three customers accounted for 37% of accounts receivable. One customer accounted for 13% of net revenues for
For the yearyears ended December 31, 2018. 2020 and 2019, we had no customers who represented 10% or more of revenue.
As of December 31, 2017, two customers accounted for 24% of accounts receivable. Two customers accounted for 22% of net revenues for the year ended December 31, 2017.
NOTE 14.19. SUBSEQUENT EVENTS
In January of 2019, TOMI entered into an exclusive co-marketing and supply agreement with Arkema Inc. to further develop a market for our fogging/misting technology within the Food Safety industry. The agreement provides that the parties will develop the market for TOMI’s Fogging Technology using the TOMI SteraMist Technology for food safety applications. Arkema Inc. will manufacture and supply the food grade hydrogen peroxide for use in an EPA-registered solution. Together, the companies will address the need in the industry for a non-bleach, quick and effective food safety process and bring it to Arkema’s global food clients who currently use its hydrogen peroxide for organic-certified products.
In January 2019 we issued a warrant to purchase 1,000,000 shares of common stock to the CEO at an exercise price of $0.10 per share pursuant to his employment agreement with the Company. The warrant was valued at approximately $90,000 and has a term of 5 years. We utilized the Black-Scholes method to fair value the warrant received by the CEO with the following assumptions: volatility, 143%; expected dividend yield, 0%; risk free interest rate, 2.58%; and a life of 5 years. The grant date fair value of each share of common stock underlying the warrant was $0.09.
In January 2019 we issued an option to purchase 250,000 shares of common stock to the COO at an exercise price of $0.11 per share pursuant to her employment agreement with the Company. The option was valued at approximately $25,000, has a term of 5 years. We utilized the Black-Scholes method to fair value the option received by the COO with the following assumptions: volatility, 144%; expected dividend yield, 0%; risk free interest rate, 2.47%; and a life of 5 years. The grant date fair value of each share of common stock underlying the option was $0.10. The value of this stock option was included in accrued expenses at December 31, 2018.
In January 2019 we issued an option to purchase 50,000 shares of common stock to the CFO at an exercise price of $0.10 per share. The option was valued at approximately $4,000 and has a term of 5 years. We utilized the Black-Scholes method to fair value the option received by the CFO with the following assumptions: volatility, 143%; expected dividend yield, 0%; risk free interest rate, 2.58%; and a life of 5 years. The grant date fair value of each share of common stock underlying the option was $0.09.
Pursuant to ourthe agreement with our Board of Directors, in January 2019,2021, we issued an aggregate of 400,00050,000 shares of common stock valued at approximately $44,000.$211,000. The agreements with our Board provide for the annual issuance of shares of our common stock.
On March 30, 2019, the two remaining note holdersFebruary 11, 2021, we agreed to extendamend (the "Warrant Amendment") the maturity dateswarrant to purchase 125,000 shares of their notes totaling $5,000,000TOMI common stock, par value $0.01 (the "Common Stock"), issued by TOMI to April 3, 2020. As partDr. Halden S. Shane, TOMI's Chief Executive Officer and a director on TOMI's board of directors, on February 11, 2014 (the "Warrant"), to provide TOMI an option to repurchase the Warrant from Dr. Shane at a negotiated price. In connection with the Warrant Amendment, TOMI repurchased the warrant from Dr. Shane (the "Repurchase") for an aggregate cash consideration of $314,500, representing a 15% discount of the extensions, the Company agreed that if it does not make payment on or before the new maturity dates, after five (5) days written notice, the holders will have the right, but not the obligation, to convert the notes into common sharesnet exercise cash value of the Company at a conversionWarrant, which was calculated using the closing price of $0.11 per share orthe Common Stock on the Nasdaq on February 11, 2021. On the same date, the Warrant Amendment and the Repurchase was considered, approved and adopted by a totaldisinterested majority of 45,454,545 shares. All other provisionsTOMI's board of the notes remain unchanged.directors.